UNIVERSITY OF SOUTHERN QUEENSLAND - …eprints.usq.edu.au/23452/1/Yanto_2012_whole.pdf ·...
322
UNIVERSITY OF SOUTHERN QUEENSLAND TOWARDS INTERNATIONAL COMPETENCE OF INDONESIAN ACCOUNTING UNDERGRADUATES: A SYSTEMS APPROACH TO IDENTIFY INTER- CORRELATES BETWEEN CONSTRUCTS OF THE EDUCATION PROCESS A Dissertation submitted by Heri Yanto BA Hons (IKIP Semarang) MBA (Troy University) For the award of Doctor of Philosophy 2012
Transcript of UNIVERSITY OF SOUTHERN QUEENSLAND - …eprints.usq.edu.au/23452/1/Yanto_2012_whole.pdf ·...
UNIVERSITY OF SOUTHERN QUEENSLAND
TOWARDS INTERNATIONAL COMPETENCE OF INDONESIAN ACCOUNTING UNDERGRADUATES: A
SYSTEMS APPROACH TO IDENTIFY INTER-CORRELATES BETWEEN CONSTRUCTS OF THE
EDUCATION PROCESS
A Dissertation submitted by
Heri Yanto
BA Hons (IKIP Semarang) MBA (Troy University)
For the award of
Doctor of Philosophy
2012
ii
SUMMARY
Increasing capital influx from foreign direct investment and international
financing assistance requires Indonesian accountants to follow international
standards of practices. Therefore, the Indonesian Institute of Accountants have
been converging Indonesian Accounting Standards with IFRS. International
standards of accounting practice also require Indonesian universities to harmonise
competencies of their accounting graduates with international education
competencies. This harmonisation equips accounting graduates with competencies
to compete in a global market, to support multi-national investors, and to
implement new accounting standards.
Building International Competency of Accounting Graduates (ICAG)
needs a comprehensive approach. Input-Process-Output approach from System
Theory and Input-Environment-Output model are employed as underpinning
theories. The study identifies relationships among educational constructs (Inputs,
Processes/Environment, and Outputs). Inputs are students’ and lecturers’
characteristics (Psychological, Academic, and Demographic), Comfort of Class
Size, and Learning Facilities. Student Engagement, ICAG-Teaching Contents, and
Student-Faculty Engagement are employed to measure Processes/Environment,
while ICAG and Grade Point Average (GPA) are used for educational outputs.
Moreover, the study measures ICAG based on American Institute of Certified
Public Accountants (AICPA) core competencies.
The population of the study is final-year accounting students and
accounting lecturers at state universities in Indonesia. The study also recruits
alumni of accounting programs working in various sectors. Eight state universities
were randomly selected based on accounting program accreditation levels and
locations. Questionnaires were employed to collect quantitative data from students
and lecturers, whilst focus group discussion collected qualitative data from
accounting graduates alumni. Four hundred and eleven students and 188 lecturers
completed surveys and 20 alumni participated in focus group discussion.
Descriptive, Correlation, Regression, Structural Equation Modelling, Path, Non-
parametric, and Qualitative analyses were employed to analyse data.
iii
Students reported that Student Motivation, Previous Academic
Achievements, Comfort of Class Size, and Learning Facilities affect Student
Engagement. In turn, Student Engagement also influences ICAG and GPA.
Lecturers reported that Learning Facilities affect Lecturer Job Satisfaction and
Lecturer Job Satisfaction, in turn; influences ICAG-Teaching Contents and
Student-Faculty Engagement. ICAG-Teaching Contents correlates with ICAG and
Student Engagement. Alumni perceived AICPA core competencies are in line
with competencies required by the Indonesian business context. They contended
that most competencies are developed in the work places. Input-Process-Output
and Input-Environment-Output frameworks are applicable for developing ICAG
and GPA in Higher Education. Supporting theories (Expectancy Theory,
Herzberg’s Motivation Theory, and Involvement Theory) are supported by the
study. To improve ICAG and GPA, a university should pay more attention to
Lecturer Job Satisfaction, Student Motivation, Student Previous Achievements,
Learning Facilities, Comfort of Class Size, ICAG-Teaching Contents, and Student
Engagement. Alumni suggested that Lecturers should bring more real-world
accounting to classrooms.
Collecting competency data using questionnaire, the exclusion of
Working-Integrated Learning from Student Engagement questionnaire, the
exclusion of private universities and other types of higher education institutions,
and the use of non-parametric analysis to correlate lecturers’ and students’ data
are some main limitations of the study.
Government should use the Student Engagement Survey for improvement
and benchmarking purposes. Further research is required to identify the impact of
Working-Integrated Learning on ICAG, to design specific Student Engagement
for accounting students, to measure students’ competencies using other
assessment techniques, to correlate lecturers’ characteristics with ICAG and GPA
using Hierarchal Linear Modelling analysis, and to find the impact of Comfort of
Class Size, Entrance Tests, and Lecturers’ Academic Characteristics on ICAG and
GPA. Future studies should also include more alumni from various industries and
universities.
iv
CERTIFICATION OF DISSERTATION
I certify that the ideas, results, analyses, and conclusions reported in this
dissertation are entirely my own effort, except where otherwise acknowledged. I
also certify that the work is original and has not been previously submitted for any
other award, except where otherwise acknowledged.
Heri Yanto _____________________________ _________________ Candidate Date
ENDORSEMENT Associate Professor Joseph M. Mula _____________________________ _________________ Principal Supervisor Date Professor Marie H. Kavanagh _____________________________ _________________ Associate Supervisor Date
v
ACKNOWLEDGEMENT
This dissertation would not have been completed without support from many
people to whom I am greatly indebted. Therefore, I would like to express my
sincere gratitude to:
• My Principal Supervisor, Associate Professor Joseph M. Mula and Associate
Supervisor, Professor Marie H. Kavanagh who provide unfailing support,
encouragement, and guidance during my academic journey at the University of
Southern Queensland.
• Ms. Ali Radloff, Senior Research Officer at Australian Council for Education
Research, who provided permission to use the Student Engagement
questionnaires. Special thanks also go to Dr Megan Kek from the Learning and
Teaching Support Centre, University of Southern Queensland for support.
• Professor Gloria McVay from Winona State University, Minnesota, Professor
Shane P. Desselle, RPh, PhD, FAPhA from University of Oklahoma Health
Science Center, and Dr Chun-Fang Chiang from Chinese Culture University
Taipei who provided permission to use their valid and reliable questionnaires.
• Directorate of Higher Education (DIKTI), Ministry of National Education
(Kemendiknas) of the Republic of Indonesia for providing my scholarship.
• Deans of Economic Faculty at eight state universities in Indonesia who
facilitated data collection. Lecturers at Accounting Departments and Students
who completed questionnaires and Alumni who participated in Focus Group
Discussion.
• I would like to acknowledge my wife Umi Zubaidah, my son Diqqie, and my
daughter Izzy for unfailing support and prayers.
Finally, I dedicate this dissertation to my father Timan Notowihardjo who passed
away in 2004 and my mother Suwarni who always prays for my success.
vi
TABLE OF CONTENTS
SUMMARY ............................................................................................................ ii ACKNOWLEDGEMENT ...................................................................................... v
TABLE OF CONTENTS ....................................................................................... vi LIST OF FIGURES ............................................................................................. viii LIST OF TABLES ................................................................................................. ix
LIST OF PUBLICATIONS ................................................................................... xi LIST OF ACRONYMS ........................................................................................ xii DEFINITION OF TERMS ................................................................................... xiii CHAPTER 1: INTRODUCTION ........................................................................... 1
1.1 Background .............................................................................................. 1
1.2 Research Objective ................................................................................... 4
1.3 Research Questions .................................................................................. 5
1.4 Brief Overview of Methodology .............................................................. 7
1.5 Expected Contributions of the Study ........................................................ 9
1.6 Scope and Delimitation .......................................................................... 11
1.7 Structure of Dissertation ......................................................................... 13
CHAPTER 2: LITERATURE REVIEW .............................................................. 15
2.1 Introduction ................................................................................................. 15
2.2 Accounting Education Context in Indonesia............................................... 17
2.3 Underpinning Theories................................................................................ 21
2.4 Education Input ........................................................................................... 29
2.5 Education Process ....................................................................................... 54
2.6 Education Output ........................................................................................ 79
2.7 Gap in the literature ..................................................................................... 88
2.8 Conclusion .................................................................................................. 90
CHAPTER 3: RESEARCH DESIGN ................................................................... 91
3.1 Introduction ................................................................................................. 91
3.2 Research Questions ..................................................................................... 91
3.3 Conceptual Model ....................................................................................... 98
3.4 Hypotheses ................................................................................................ 102
3.5 Conclusion ................................................................................................ 112
vii
CHAPTER 4: RESEARCH METHODOLOGY ................................................ 113
4.1 Introduction ............................................................................................... 113
4.2 Population ................................................................................................. 113
4.3 Sample Selection ....................................................................................... 117
4.4 Data Collection Method ............................................................................ 119
4.5 Instrument Measurement ........................................................................... 120
4.6 Instrument Validity and Reliability ........................................................... 124
4.7 Data Triangulation .................................................................................... 127
4.8 Ethical Consideration ................................................................................ 129
4.9 Data Analysis ............................................................................................ 131
4.10 Conclusion .............................................................................................. 138
CHAPTER 5: ANALYSES AND FINDINGS ................................................... 140
5.1 Introduction ............................................................................................... 140
5.2 Sample Used in Empirical Test ................................................................. 141
5.3 Descriptive Statistics of Student Data ....................................................... 142
5.4 Correlation Analyses for Student Data ..................................................... 146
5.5 Structural Equation Modelling Analyses for Student Data ....................... 167
5.6 Descriptive Statistics of Lecturer Data ..................................................... 182
5.7 Correlation Analyses of Lecturer Data ..................................................... 189
5.8 Structural Equation Modelling (SEM) Analyses of Lecturer Data ......... 205
5.9 Lecturer and Student Data Correlations .................................................... 210
5.10 Qualitative Analysis for Triangulating ICAG ......................................... 211
5.11 Hypotheses Testing Summary ................................................................ 235
5.12 Conclusion .............................................................................................. 242
CHAPTER 6: DISCUSSION AND CONCLUSIONS ....................................... 243
6.1 Introduction ............................................................................................... 243
6.2 Discussions ................................................................................................ 243
6.3 Conclusions ............................................................................................... 279
6.4 Theoretical Implications............................................................................ 283
6.5 Practical Implications ................................................................................ 284
6.6 Limitations ................................................................................................ 286
6.7 Directions of Future Research ................................................................... 288
LIST OF REFERENCES .................................................................................... 291
APPENDICES .................................................................................................... 307
viii
LIST OF FIGURES Figure 2.1: Input-Transformation-Output Processes............................................. 23 Figure 2.2: Education Technical System .............................................................. 25 Figure 2.3: I-E-O Model ....................................................................................... 27 Figure 2.4: Bridging the Gap between Acquired and Required Skills .................. 29 Figure 3.1: Conceptual Model Based on Students’ Perceptions ........................... 99 Figure 3.2: Conceptual Model Based on Lecturer Perceptions........................... 101 Figure 3.3: Overall Conceptual Model and Hypotheses ..................................... 111 Figure 4.1: Model for Testing Mediating Effect ................................................. 134 Figure 5.1: Student Motivation-Student Engagement-ICAG Sub-Model 1 ....... 151 Figure 5.2: Student Motivation-Student-Engagement-GPA Sub-Model 2 ......... 152 Figure 5.3: Previous Achievement-Student Engagement-ICAG Sub-Model 3 .. 155 Figure 5.4: Previous Achievement-Student Engagement-GPA Sub-Model 4 .... 156 Figure 5.5: NEM-Student Engagement-GPA Sub-Model 5 ............................... 158 Figure 5.6: Comfort of Class Size-Student Engagement-ICAG Sub-Model 6 ... 165 Figure 5.7: Learning Facilities-Student Engagement-ICAG Sub-Model 7 ........ 166 Figure 5.8: Learning Facilities-Student Engagement-GPA Sub-Model 8 .......... 167 Figure 5.9: Input-Student Engagement-ICAG SEM Model 1 ............................ 171 Figure 5.10: Input-Student Engagement-ICAG Path Model 2............................ 174 Figure 5.11: Input-Student Engagement-GPA SEM Model 3 ............................ 176 Figure 5.12: Input-Student Engagement-GPA Path Model 4 ............................. 179 Figure 5.13: LJS-ICAG-Teaching Content-SFE Sub-Model 9 ........................... 194 Figure 5.14: LF-ICAG-Teaching Content-SFE Sub-Model 10 .......................... 203 Figure 5.15: Lecturer Model SEM 5 ................................................................... 207 Figure 5.16: Lecturer Model Path 6 .................................................................... 210 Figure 5.17: Rank of Functional Competency .................................................... 217 Figure 5.18: Functional Competency Based on Lecturers' and Students' Perceptions ...................................................................................... 218 Figure 5.19: Rank of Personal Competency ....................................................... 225 Figure 5.20: Personal Competency Based on Lecturers' and Students' Perceptions ...................................................................................... 226 Figure 5.21: Rank of Broad-business Perspective Competency ......................... 232 Figure 5.22: Broad-business Perspective Competency Based on Lecturers' and Students' Perceptions ................................................................ 233 Figure 5.23: Hypotheses Summary on Developing ICAG.................................. 238 Figure 5.24: Hypotheses Summary on Developing GPA ................................... 239 Figure 5.25: Hypotheses Summary on Developing ICAG based on Lecturer Perception ......................................................................... 240 Figure 5.26: Hypotheses Summary on Developing GPA based on Lecturer Perception ......................................................................... 242 Figure 6.1: Revised Model with ICAG Output ................................................... 277 Figure 6.2: Revised Model with GPA Output ..................................................... 278
ix
LIST OF TABLES
Table 2.1: Comparison of Dimensions for Measuring Transforming Process in Higher Education ............................................................................. 68 Table 2.2: Relationship between Student Engagement and Faculty Expectation and Behaviour .................................................................. 78 Table 2.3: Expected Skills/competencies of professional Managers .................... 82 Table 2.4: Number of indicators of AICPA core competencies ........................... 85 Table 2.5: Comparison of Grading Systems in Selected Universities .................. 87 Table 4.1: Accreditation Level and Number of Accounting Students ................ 114 Table 4.2: Accreditation Level by Location ....................................................... 115 Table 4.3: Distribution of Sample by University ................................................ 117 Table 4.4: Sources of Measures .......................................................................... 123 Table 4.5: Validity and Reliability of ICAG Questions ...................................... 126 Table 4.6: Validity and Reliability of Learning Facilities and Comfort of Class Size Questions .......................................................................... 127 Table 4.7: Summary of Goodness of Fit Index ................................................... 138 Table 5.1: Sample Distribution ........................................................................... 141 Table 5.2: Descriptive Statistics of Student Data................................................ 142 Table 5.3: Correlation between Student Motivation and Student Engagement .. 147 Table 5.4: Correlation between Student Motivation and ICAG ......................... 148 Table 5.5: Correlation between Student Engagement and ICAG ....................... 149 Table 5.6: Correlations between Student Engagement, Motivation, and GPA ... 152 Table 5.7: Correlation between Student Engagement, ICAG, and GPA ............ 154 Table 5.8: Correlation between NEM, Student Engagement, ICAG, and GPA . 157 Table 5.9: Correlation between Other Academic Characteristics and Student Engagement, ICAG, and GPA .............................................. 159 Table 5.10: Correlation between Age, Student Engagement, ICAG, and GPA .. 161 Table 5.11: Correlation between Age and Other Student Characteristics .......... 162 Table 5.12: Correlation between Gender and Student Engagement and Learning Outputs .............................................................................. 162 Table 5.13: Correlation between Gender and Other Student Characteristics ..... 163 Table 5.14: Correlation between Comfort of Class Size and Student Engagement and Learning Outputs .................................................. 164 Table 5.15: Correlation between Learning Facilities and Student Engagement and Learning Outputs .................................................. 166 Table 5.16: Input-Student Engagement-ICAG Goodness of Fit ......................... 170 Table 5.17: Regression Weight and Estimates for Input-SE-ICAG Model ........ 172 Table 5.18: Regression Weight and Estimates for Input-SE-ICAG Using Path Analysis .................................................................................... 173 Table 5.19: Input-Student Engagement-ICAG Goodness of Fit ......................... 174 Table 5.20: Regression Weight and Estimates for Input-Student Engagement-GPA Model Using Single Composite Indicator ......... 177 Table 5.21: Input-Student Engagement-GPA Goodness of Fit Using Single Composite Indicator .............................................................. 177
x
Table 5.22: Regression Weight and Estimates for Input-Student Engagement-GPA Using Path Analysis ........................................... 179 Table 5.23: Input-Student Engagement-GPA Goodness Fit Using Path Analysis .................................................................................... 180 Table 5.24: Descriptive Statistics of Lecturer Data ............................................ 183 Table 5.25: Correlation between Lecturer Job Satisfaction Factors and ICAG-Teaching Content .................................................................. 190 Table 5.26: Correlation between ICAG-Teaching Content and Student-Faculty Engagement ........................................................... 191 Table 5.27: Correlation between Lecturer Job Satisfaction and Student-Faculty Engagement ........................................................... 193 Table 5.28: Correlation between Lecturer Academic Characteristics and ICAG-Teaching Content .................................................................. 195 Table 5.29: Correlation between Lecturer Academic Characteristics and Student-Faculty Engagement ........................................................... 196 Table 5.30: Correlation among Lecturer Academic Characteristic Variables .... 197 Table 5.31: Correlation between Age and Student-Faculty Engagement, and ICAG-Teaching Content ........................................................... 198 Table 5.32: Correlation between Gender and Student-Faculty Engagement, and ICAG-Teaching Content ................................... 199 Table 5.33: Correlation between Age, Gender, and Lecturer Academic Characteristic.................................................................................... 200 Table 5.34: Correlation between Learning Facilities and Student-Faculty Engagement, and ICAG-Teaching Content ..................................... 202 Table 5.35: Correlation between Learning Facilities and Lecturer Job Satisfaction ....................................................................................... 204 Table 5.36: Correlation between Comfort of Class Size and Student- Faculty Engagement and ICAG-Teaching Content ......................... 205 Table 5.37: Regression Weight and Estimate for Model Using Single Composite Indicator ......................................................................... 208 Table 5.38: Goodness Fit of Lecturer Model Using Single Composite Indicator ........................................................................................... 208 Table 5.39: Regression Weight and Estimate for Lecturer Model Using Path Analysis ......................................................................... 209 Table 5.40: Goodness Fit for Lecturer Model Using Path Analysis ................... 209 Table 5.41: Kendall's Tau Correlation ................................................................ 211 Table 5.42: FGD Participant’s Profile ................................................................ 212 Table 5.43: Summary of Hypotheses .................................................................. 235
xi
LIST OF PUBLICATIONS
Yanto, H, Mula, J.M & Kavanagh, M.H (2010) A conceptual model for building international competencies of accounting graduates of Indonesian universities. Presented at the 2010 Accounting & Finance Association of Australia and New Zealand Conference (AFAANZ 2010), 4-6 July 2010, Christchurch, New Zealand.
Yanto, H, Mula, J.M & Kavanagh, M.H (2011) Does student engagement matter in building students’ accounting competencies: Evidence from Indonesian universities, Submitted to the Accounting Education: An International Journal. Yanto, H, Mula, J.M, Kavanagh, M.H. (2011) Developing student’s accounting competencies using Astin’s I-E-O model: An identification of key educational inputs based on Indonesian student perspectives (Refereed Paper), the RMIT Accounting Educators' Conference, 2011.
xii
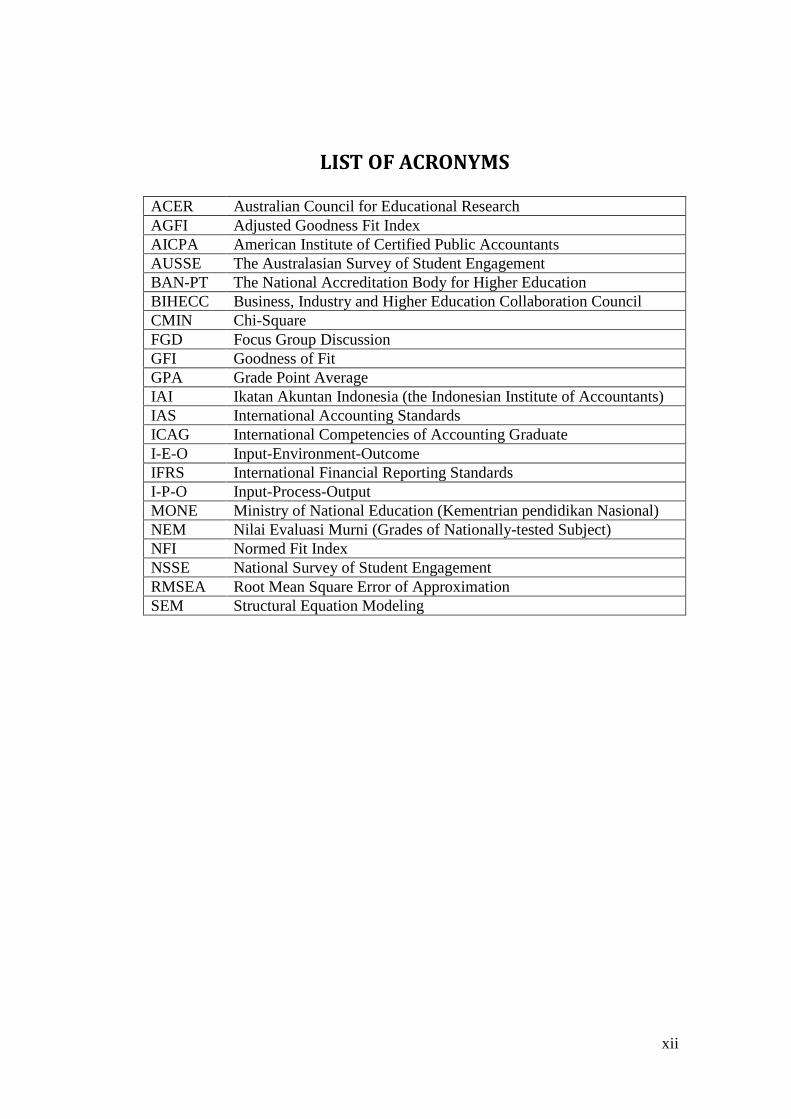
LIST OF ACRONYMS ACER Australian Council for Educational Research AGFI Adjusted Goodness Fit Index AICPA American Institute of Certified Public Accountants AUSSE The Australasian Survey of Student Engagement BAN-PT The National Accreditation Body for Higher Education BIHECC Business, Industry and Higher Education Collaboration Council CMIN Chi-Square FGD Focus Group Discussion GFI Goodness of Fit GPA Grade Point Average IAI Ikatan Akuntan Indonesia (the Indonesian Institute of Accountants) IAS International Accounting Standards ICAG International Competencies of Accounting Graduate I-E-O Input-Environment-Outcome IFRS International Financial Reporting Standards I-P-O Input-Process-Output MONE Ministry of National Education (Kementrian pendidikan Nasional) NEM Nilai Evaluasi Murni (Grades of Nationally-tested Subject) NFI Normed Fit Index NSSE National Survey of Student Engagement RMSEA Root Mean Square Error of Approximation SEM Structural Equation Modeling
xiii
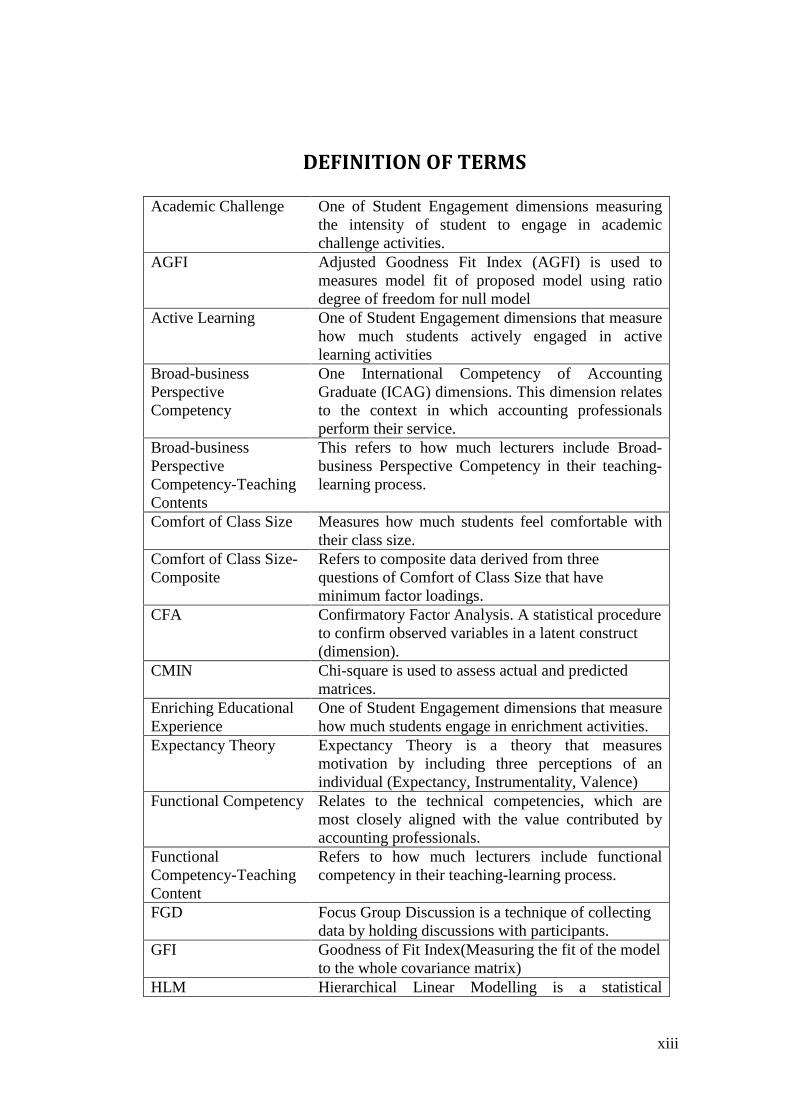
DEFINITION OF TERMS Academic Challenge One of Student Engagement dimensions measuring
the intensity of student to engage in academic challenge activities.
AGFI Adjusted Goodness Fit Index (AGFI) is used to measures model fit of proposed model using ratio degree of freedom for null model
Active Learning One of Student Engagement dimensions that measure how much students actively engaged in active learning activities
Broad-business Perspective Competency
One International Competency of Accounting Graduate (ICAG) dimensions. This dimension relates to the context in which accounting professionals perform their service.
Broad-business Perspective Competency-Teaching Contents
This refers to how much lecturers include Broad-business Perspective Competency in their teaching-learning process.
Comfort of Class Size Measures how much students feel comfortable with their class size.
Comfort of Class Size-Composite
Refers to composite data derived from three questions of Comfort of Class Size that have minimum factor loadings.
CFA Confirmatory Factor Analysis. A statistical procedure to confirm observed variables in a latent construct (dimension).
CMIN Chi-square is used to assess actual and predicted matrices.
Enriching Educational Experience
One of Student Engagement dimensions that measure how much students engage in enrichment activities.
Expectancy Theory Expectancy Theory is a theory that measures motivation by including three perceptions of an individual (Expectancy, Instrumentality, Valence)
Functional Competency Relates to the technical competencies, which are most closely aligned with the value contributed by accounting professionals.
Functional Competency-Teaching Content
Refers to how much lecturers include functional competency in their teaching-learning process.
FGD Focus Group Discussion is a technique of collecting data by holding discussions with participants.
GFI Goodness of Fit Index(Measuring the fit of the model to the whole covariance matrix)
HLM Hierarchical Linear Modelling is a statistical
xiv
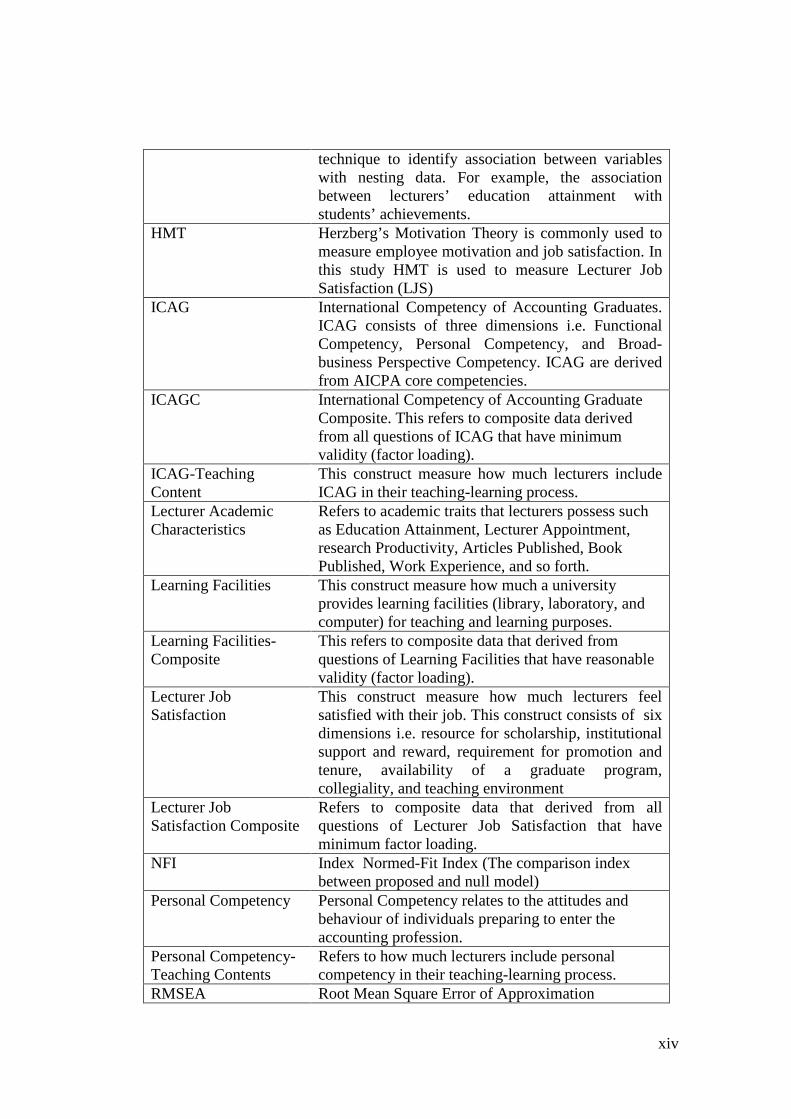
technique to identify association between variables with nesting data. For example, the association between lecturers’ education attainment with students’ achievements.
HMT Herzberg’s Motivation Theory is commonly used to measure employee motivation and job satisfaction. In this study HMT is used to measure Lecturer Job Satisfaction (LJS)
ICAG International Competency of Accounting Graduates. ICAG consists of three dimensions i.e. Functional Competency, Personal Competency, and Broad-business Perspective Competency. ICAG are derived from AICPA core competencies.
ICAGC International Competency of Accounting Graduate Composite. This refers to composite data derived from all questions of ICAG that have minimum validity (factor loading).
ICAG-Teaching Content
This construct measure how much lecturers include ICAG in their teaching-learning process.
Lecturer Academic Characteristics
Refers to academic traits that lecturers possess such as Education Attainment, Lecturer Appointment, research Productivity, Articles Published, Book Published, Work Experience, and so forth.
Learning Facilities This construct measure how much a university provides learning facilities (library, laboratory, and computer) for teaching and learning purposes.
Learning Facilities-Composite
This refers to composite data that derived from questions of Learning Facilities that have reasonable validity (factor loading).
Lecturer Job Satisfaction
This construct measure how much lecturers feel satisfied with their job. This construct consists of six dimensions i.e. resource for scholarship, institutional support and reward, requirement for promotion and tenure, availability of a graduate program, collegiality, and teaching environment
Lecturer Job Satisfaction Composite
Refers to composite data that derived from all questions of Lecturer Job Satisfaction that have minimum factor loading.
NFI Index Normed-Fit Index (The comparison index between proposed and null model)
Personal Competency Personal Competency relates to the attitudes and behaviour of individuals preparing to enter the accounting profession.
Personal Competency-Teaching Contents
Refers to how much lecturers include personal competency in their teaching-learning process.
RMSEA Root Mean Square Error of Approximation
xv
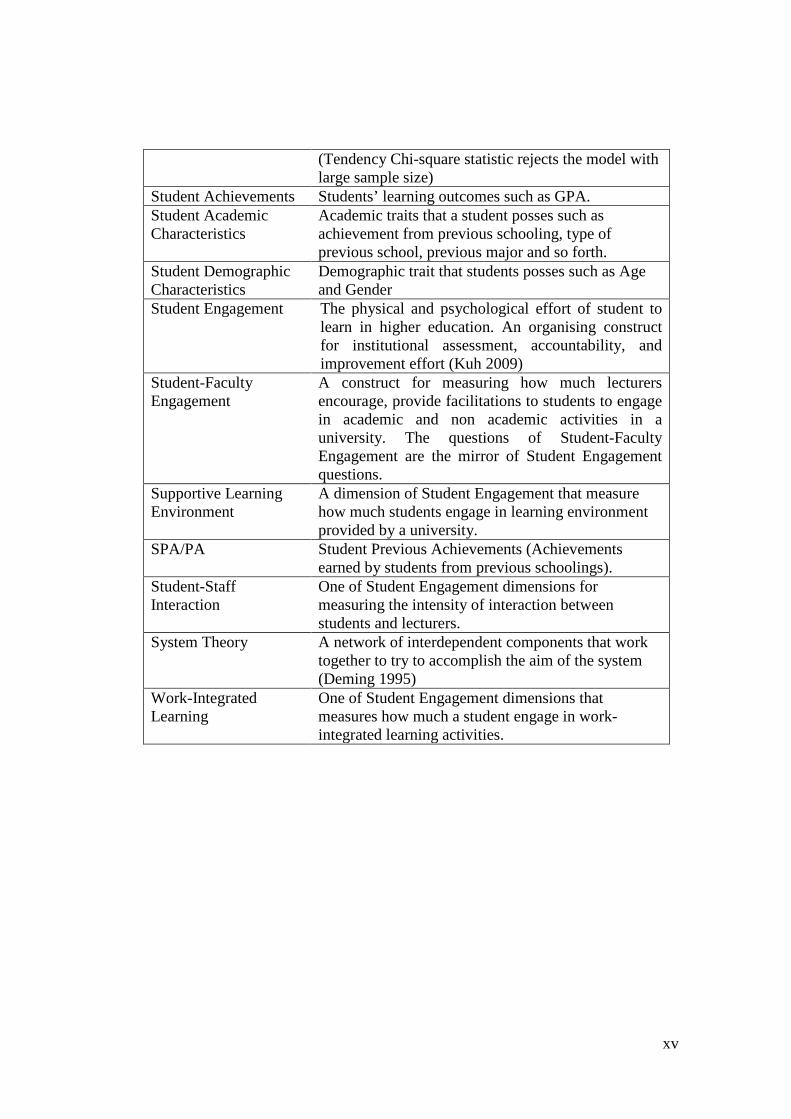
(Tendency Chi-square statistic rejects the model with large sample size)
Student Achievements Students’ learning outcomes such as GPA. Student Academic Characteristics
Academic traits that a student posses such as achievement from previous schooling, type of previous school, previous major and so forth.
Student Demographic Characteristics
Demographic trait that students posses such as Age and Gender
Student Engagement The physical and psychological effort of student to learn in higher education. An organising construct for institutional assessment, accountability, and improvement effort (Kuh 2009)
Student-Faculty Engagement
A construct for measuring how much lecturers encourage, provide facilitations to students to engage in academic and non academic activities in a university. The questions of Student-Faculty Engagement are the mirror of Student Engagement questions.
Supportive Learning Environment
A dimension of Student Engagement that measure how much students engage in learning environment provided by a university.
SPA/PA Student Previous Achievements (Achievements earned by students from previous schoolings).
Student-Staff Interaction
One of Student Engagement dimensions for measuring the intensity of interaction between students and lecturers.
System Theory A network of interdependent components that work together to try to accomplish the aim of the system (Deming 1995)
Work-Integrated Learning
One of Student Engagement dimensions that measures how much a student engage in work-integrated learning activities.
1
CHAPTER 1: INTRODUCTION 1.1 Background 1.5 Expected Contribution of the Study 1.2 Research Objective 1.6 Scope and Delimitation 1.3 Research Questions 1.7 Structure of Dissertation 1.4 Brief Overview of Methodology
1.1 Background
The biggest change in business environments is economic globalisation impacting
almost all countries around the globe, including Indonesia. Economic globalisation
enables movement of labour, technologies, capital, goods, and services across a
country’s boundaries (Krueger 2002). Globalisation also makes distances and
boundaries meaningless (Mohamed & Lashine 2003). In fact, movements of capital
run much faster than that of labour, technologies, and other resources. International
investment is becoming a more interesting business, since it could allow superior
investment performance (Davis 2005). Moreover, governments try to provide
alluring facilities to investors to invest their money in their country (BKPM 2006),
since foreign investment also provides advantages to a local economy by boosting
economy growth (Choong et al. 2010). For instance, foreign direct investment in
Indonesia was US$ 706 million in 1990, but jumped to US$ 10.8 billion by 2009
(BKPM 2009). This figure tends to increase every year. Similarly, in terms of
financial assistance, Indonesia is one among a number of ASEAN countries
receiving financial assistance from major financing institutions, which requires
Indonesian accountants to follow international standards of practice (Yapa 2004).
To harmonise with international standards of practice, the Indonesian
Institute of Accountants (IAI) have been converging Indonesian Accounting
2
Standards (SAK) with International Financial Reporting Standards (IFRS) that is
expected to be fully implemented by 2012 (Halim 2010). This also means that all
business entities operating in Indonesia have to follow international accounting
standards. As contended by Needles (2010), the adoption of IFRS will have a great
impact on business and accounting education. Despite some challenges, the adoption
of IFRS provides businesses with some advantages i.e. better access to global capital
markets, easier global comparability, easy cross border listing, better quality of
financial reporting and elimination of multiple reporting (Jain 2011). To ensure
accounting graduates have sufficient IFRS understanding and competencies,
universities should adjust their accounting curriculum, teaching-learning process, and
so forth to the IFRS context (Mintz 2009). Therefore, the implementation of
convergence to IFRS requires progressive participation from many parties such as
governments, regulators, public accountants, researchers, and other stakeholders
(Nishikawa 2011). Owing to the implementation of IFRS, it is anticipated that
accounting practices in Indonesia will change significantly.
The above background shows evidence that business environments as well as
financial reporting standards have changed. On the other hand, Indonesia is facing
impediments to implement financial reporting standards, due to some of the
structural issues in society such as inadequate regulatory and enforcement
mechanisms, and cronyism (Perera & Baydoun 2007). Likewise, the country has
been experiencing difficulty in improving quality of accounting education for a long
time. As indicated by Griffin (1996), there is pressure to accelerate accounting
education and training in Indonesia. Recent findings (Mula 2007) contended that
Indonesia has encountered difficulty in harmonising accounting practices with the
3
west. Moreover, he also concluded that international harmonisation of accounting
practices is critical to economic and social development as it is needed to attract
foreign direct investment. Therefore, accounting education in Indonesia has to adapt
to changes in business environments as well as international accounting standards.
Developing human resources through accounting education is one strategy to
mitigate such issues. More specifically, in order to build human resources with an
understanding of IFRS, a review needs to be undertaken of the education provided to
students and educators at universities (Needles 2010). Therefore, it is posited that
higher education may contribute significantly to harmonising accounting practices in
Indonesia with international standards.
In view of the above, harmonising Indonesian accounting education with
international standards seems to be inevitable. The main purpose of this
harmonisation is to equip Indonesian graduates1 with the required competencies that
they are able to compete in a global labour market (Mohamed & Lashine 2003), to
attract and support multi-national investors (Mula 2007), and to implement new
accounting standards. Therefore, universities should be able to build a bridge to
connect their graduates’ skills and competencies with global market requirements
and expectations (Mohamed & Lashine 2003). Nevertheless, strengthening
internationalisation is one of the significant challenges faced Indonesian state
universities (Irianto 2007). As previously mentioned, Indonesia has been
experiencing difficulties in harmonising accounting practices with the west.
Improvements in competencies of accounting graduates harmonised to international
1 Throughout this Dissertation, a term of accounting graduates refers to final year undergraduate accounting students in Indonesian universities.
4
standards through accounting education at a university level are critical (Mula 2007;
Needles 2010).
The role of accounting education in harmonising accounting practices is
substantial. As contended by Nearon (2002), the education system may be a good
place to start trying to understanding the failure of accounting practices. Moreover,
academics in universities are among the main players to bring about innovations in
accounting instruction, despite some barriers to reform the teaching of accounting
(Howieson 2003).
Unfortunately, the number of research studies into graduate competencies,
particularly in Indonesian universities is still limited. Most existing research has been
limited in scope and not employed a more comprehensive perspective. Research into
International Competencies of Accounting Graduates (ICAG) is also new to
Indonesia. Moreover, most accounting competency research conducted by
universities in Indonesia was mainly on auditor competencies (Christiawan 2002;
Esya 2008) and skills/competencies required by Master’s graduates (Irianto 2010).
1.2 Research Objective
Building accounting competencies in a university could be viewed from a broader
theoretical perspective, since there are many interdependent factors affecting
students’ accounting competencies. The factors include students, teachers, learning
facilities, teaching-learning process, curricula, funding, and so forth (Mizikaci 2006;
Nearon 2002). More simply, these factors could fall into three classifications i.e.
inputs, processes, and outputs (Mizikaci 2006). Likewise, Nearon (2002) also
5
proposed the input-process-output (I-P-O) approach to improving accounting
education.
In view of the above, the objective of this study is to build a holistic model
comprising of input, process, and output constructs for developing students’
accounting competencies in the context of Indonesian universities. In addition,
accounting competencies in this study are International Competency of Accounting
Graduates (ICAG)2 using AICPA core competencies (Mula 2007; Wolcot, S. K.
2006). The study measures competencies using self-assessment technique
(questionnaire). In this case, competencies are students’ self-perception of the
competencies they gained during their university education. Besides employing
ICAG as outputs, the study also uses Student Achievements in terms of Grade Point
Average (GPA) as a proxy of outputs from a university.
The study identifies some educational inputs, employs proxies of process3 or
environment4 at a university, and uses ICAG and Student Achievements as
educational outputs. By examining relationships among three educational constructs
namely inputs5, processes, and outputs, the study will build models for developing
ICAG and GPA in Indonesian universities.
1.3 Research Questions
Based on System Theory, inputs affect processes and processes, in turn, affect
outputs (Mizikaci 2006). In comparison, the Input-Environment-Outcome (I-E-O)
2 These competencies are based on AICPA core competencies consisting of functional, personal, and broad-business perspective competencies. 3 System Theory recommended by Bertalanffy (1968) consists of three elements i.e. Input, Process, and Output. 4 I-E-O model developed by Astin (1993) comprises three constructs Input, Environment, and Output. 5 Educational inputs are input transformed resources and input transforming resources.
6
model (Astin 1993a) contends that inputs affect environments and environments, in
turn, affect outputs. Moreover, the I-E-O model contends that the impact of
environment on outputs cannot be understood without considering the effects of
inputs on outputs. The study will build a conceptual model consisting of inputs,
processes/environments, and outputs. Moreover, the study also employs System
Theory and I-E-O model as underpinning theories. Based on these theories, the study
identifies the following relationships: (1) relationships between inputs and
processes/environment; (2) relationships between processes/environments and
outputs; and (3) relationships between inputs and outputs. Based on the above, the
study formulates a main research question:
Are there any relationships among educational inputs, processes/environments, and educational outputs in terms of International Competency of Accounting Graduate (ICAG) and Student Achievements? In addition, the study also formulates research questions (RQ) and research sub-
questions (RSQ). Chapter 3 (Research Design) discusses more detailed formulations
of RSQ. Based on the main research question, study formulates the following
research questions.
RQ1: What educational inputs have significant relationships with educational
processes? RQ2: What are the educational inputs that have association with educational outputs
in terms of ICAG and Student Achievements? RQ3: Is there any significant association between educational processes and
educational outputs in terms of ICAG and Student Achievements? RQ4: What is the model for improving ICAG using the input-process-output
approach in the Indonesian University context?
7
RQ5: What is the model for improving Student Achievements (GPA) using input-process-output approach in the Indonesian University context?
In addition, since there are many types of educational inputs, the study will correlate
identified-inputs with processes and outputs. Consequently, some research sub-
questions will be developed. More detailed research sub-questions are discussed in
Chapter 3, Research Design.
As previously mentioned, the study employs International Competency of
Accounting Graduates (ICAG) based on the American Institute of Certified Public
Accountants (AICPA) core competencies. Some academics and education
institutions have already established accounting competency frameworks that are
applicable in certain countries. AICPA core competency framework developed in the
American business setting may or may not be applicable in the Indonesian business
environment. Therefore the study undertakes triangulation with alumni who have
substantial work experience to assess the applicability of AICPA core competency
framework in the Indonesian business settings. In line with this, the study formulates
the following research question:
RQ6: Based on alumni perceptions, to what extent are AICPA core competencies
applicable in the Indonesian business context? 1.4 Brief Overview of Methodology
The study uses a quantitative method to measure, collect, and analyse variables. In
addition, the study also uses a qualitative approach to enrich the quantitative analyses
as well as for triangulating data from ICAG. Focus Group Discussions (FGD) were
8
undertaken to collect qualitative data from alumni of accounting programs who have
significant experience working in their sectors.
The population of this study is all final-year accounting students as well as
accounting lecturers at 37 state universities in Indonesia. The study uses two-stage
sampling. The first stage involves choosing universities randomly by considering
accreditation levels6 of programs and location i.e. Java7 and non-Java universities.
The second stage involves choosing students randomly from sampled universities—
included in the first stage--to become participants. In addition, the study also collects
data from lecturers at sampled universities. Since the study employs input-process-
output, the recruitment of final-year students to be respondents is most appropriate.
Final-year students still clearly remember details of inputs and processes, because
they are still in the process stage. They do not have to recall long-term data in
completing the survey. At the same time a final-year student would graduate from an
accounting program in less than a year.
The study used two types of questionnaires i.e. Questionnaire for Students
(QS) and Questionnaire for Lecturers (QL). QS consists of questions relating to
inputs, transforming processes, and outputs based on student perceptions. QL, on the
other hand, comprises questions about inputs and transforming processes based on
lecturer perceptions. Moreover, the study also employed Focus Group Discussions
(FGD) by inviting alumni of accounting programs as participants. FGD guide was
used to ensure the process of discussion generated usable qualitative data.
6 There are three levels of program accreditation granted by National Accreditation Body for Higher Education (BAN-PT) in Indonesia, A: Very Good; B: Good, and C: Fair 7 Java is one of main islands in Indonesia; its population makes up 60% of overall Indonesian population.
9
Newly-developed items in questionnaires are tested to non-sample students and
analysed using item analysis (corrected item-total correlation) and Cronbach alpha
for validity and reliability respectively. Factor loading analysis was also undertaken
to select valid questions for Structural Equation Modelling (SEM) analysis purpose.
Descriptive Statistics, Correlation, Regression, SEM type Confirmatory Factor
Analysis (CFA) with single indicator, Path analysis, non-parametric analysis, and
qualitative analysis (constant comparison) were employed to analyse data obtained
from respondents through questionnaires and focus group discussions.
1.5 Expected Contributions of the Study
System Theory has been broadly adopted by other disciplines such as Education,
Information System, Physics, and Mathematics (Bertalanffy 1968), but research
relating to the adoption of System Theory to accounting education appears to be
limited. The research is expected to provide evidence about the applicability of
System Theory to accounting education. In relation to building accounting
competencies or improving student achievements as educational outputs, current
literature on accounting education mainly focuses on relationships of certain inputs
and outputs or correlating processes and outputs, without involving all three
constructs of the educational system (inputs, processes, and outputs) in holistic
model.
Since System Theory was not exclusively designed for the education sector,
the study also utilises Input-Environment-Outcome (I-E-O) model (Astin 1993a).
The research attempts to combine the above theories and applies them to accounting
education. Therefore, the study expects to provide evidence about the possibility of
10
using the above theories in one model. In other words, the study provides
information about the compatibility of System Theory and I-E-O models.
Besides employing System Theory and I-E-O as underpinning theories, the
study also uses Expectancy Theory, Herzberg’s Motivation Theory (HMT) and
Involvement Theory as supporting theories. Expectancy Theory is intended to
measure Student Motivation, HMT is to gauge lecturer motivation and job
satisfaction (Lecturer Job Satisfaction), and Involvement Theory is used as the
theoretical foundation for measuring Student Engagement and Student-Faculty
Engagement. Henceforth, the study could contribute some findings about the efficacy
of these supporting theories in influencing competencies of accounting graduates.
In addition, the study expects to build a model for developing competencies
of accounting graduates within a broader perspective by employing System Theory
and the I-E-O model. These theories have similar constructs (inputs,
processes/environments, and outputs); therefore, the study attempts to identify
relationships among educational constructs resulting in International Competency of
Accounting Graduate (ICAG) and Student Achievements.
More practically, the research may provide detailed information about the
extent of Indonesian students’ competencies based on international standards of
accounting competencies. The information could also be used as a benchmark by
accounting programs in Indonesian universities. The study builds a conceptual model
to test the relationships among variables in the educational system. The tested model
may contribute meaningful evidence about key variables that Indonesian universities
should consider in their attempt to meet globalisation pressures.
11
The accounting profession also may benefit from the study. The study will
provide detailed information about the extent of ICAG among accounting graduates
of Indonesian universities, from which institutions can formulate necessary strategies
to provide education programs for graduates entering the accounting profession. In
other words, institutions training graduates for the accounting profession are
provided with important information about variables they should consider in order
providing better professional education programs for accounting graduates.
More importantly, the study provides information for the Indonesian Ministry
of National Education particularly the Directorate of Higher Education (DHE). First,
the extent of ICAG could be useful information for the DHE for decision making
relating to accounting education in the higher education sector. Second, the
information about Student Engagement and Student-Faculty Engagement is valuable
in order to gauge the extent engagement in sampled universities. This Information
could be useful for decision making, since until now Indonesia has not yet
implemented a national survey on Student Engagement in Higher Education
Institutions for development and benchmarking purposes. Lastly, the study may also
benefit DHE in terms of Lecturer Job Satisfaction and Lecturer Academic
Characteristics. DHE might need this information in designing policies to enhance
lecturer performance in Indonesian universities.
1.6 Scope and Delimitation
The study investigates state universities in Indonesia that have an accounting
program. Private and religious universities are not covered by this study. The study
uses indicators of ICAG released by the American Institute of Certified Public
12
Accountants (AICPA) (Foster, Bolt-Lee & Colson 2002; Mula 2007; Wolcot, S. K.
2006). Final-year students as respondents were asked to self-assess how much they
learned the international competencies of accounting at their universities. Likewise,
lecturers were also asked to self-assess how much they include accounting
competencies, based on AICPA core competencies, in their teaching and learning
processes (ICAG-Teaching Content8). This form of data collection could be affected
by negative or apathetic attitudes (Kavanagh & Drennan 2008), but self-assessment
of competencies is still considered effective (Hansson 2001).
Even though the study employs System Theory and I-E-O model as
underpinning theories, the study includes important inputs to educational systems. In
relation to funding, some research found that there were three kinds of correlation
between school funding and student achievement i.e. positive correlation (Barrow &
Rouse 2005; Ellinger & Wright 1995), weak correlation (Tow 2006), inconsistent
correlation (Cook 2001; Klick 2000; Neymotin 2008). Because of these inconsistent
findings between schools’ funding and student achievements, the study sets aside the
funding variable.
Since accounting curricula are developed based on ministerial decree
(Depdiknas 2000), there is a tendency that curricula implemented by universities has
some similarities. Moreover, Hamzah (2009) contended that accounting curricula in
some universities were adopted and replicated from reputable universities. However,
the study collected data on ICAG-Teaching Content from lecturers to assess the
inclusion of AICPA core competencies in the teaching-learning processes.
8 International Competency of Accounting Graduate-Teaching Content refers to the extent of AICPA core competencies included by lecturers in their teaching and learning processes.
13
1.7 Structure of Dissertation
The dissertation consists of six basic chapters that have been broadly accepted i.e.
Introduction, Literature Review, Research Design, Research Methodology, Analysis
and Result, and Discussions and Conclusions. Chapter 1 outlines the background of
the study, research objectives and research questions, contributions of expected
study, and scope and delimitation.
Chapter 2 deals with the literature review relating to the theoretical
discussions that provide the research background and to inform the research
problems. The literature review starts with underpinning theories (System Theory
and I-E-O model) followed by discussion of supporting theories (Expectancy Theory
and Herzberg’s Motivation Theory) and previous findings to support variables
included in the model. This Chapter also discusses theories for gauging educational
processes (Involvement Theory and Student Engagement). The discussion ends by
identifying gaps in the literature.
The Research Design is presented in Chapter 3. This Chapter begins with the
main research questions presented in Chapter 1 followed by more detailed research
questions. In addition, this Chapter also presents two conceptual models i.e. a model
based on student and lecturer perceptions. Lastly, this chapter ends with development
of detailed hypotheses.
Research Methodology employed by the study is discussed in Chapter 4. This
Chapter starts with population size determination and the method of sampling (two-
stage sampling). Questionnaire administration consisting of some issues such as
instrument measurement, validity, reliability, and data collection method are
14
discussed in this Chapter. Besides discussing statistical test requirements and
analysis techniques, this Chapter also discusses data triangulation and qualitative
analysis.
Since the study collects data from students, lecturers, and alumni, Chapter 5
presents analyses of data collected from three types of participants. Descriptive,
Parametric, Non-parametric Statistics are employed to reach results. More
specifically, Correlations, Regressions, Structural Equation Modelling (SEM) with
single indicator, and Path Analysis are employed to analyse quantitative data.
Likewise, the results of the qualitative analysis are also presented in this Chapter.
Lastly, this Chapter ends with the summary of hypothesis tests.
Discussion and Conclusion are presented in Chapter 6. This Chapter presents
discussion on data analysis and its interpretation to answer research questions.
Results are discussed by comparing and corresponding the empirical findings
(presented in Chapter 4) with theories and previous findings (presented in Chapter 2).
This Chapter also presents conclusions drawn based on the six main research
questions presented in Chapter 1 (Introduction). This Chapter also discusses
theoretical and practical implications, limitations, and directions for future research.
15
CHAPTER 2: LITERATURE REVIEW 2.1 Introduction 2.5 Education Process 2.2 Accounting Education Context in Indonesia 2.6 Education Output 2.3 Underpinning Theory 2.7 Gap in Literature 2.4 Education Input 2.8 Conclusion
2.1 Introduction
Competency is becoming more popular in 21st century replacing previous education
paradigms that emphasized content (Azemikhah 2006). Since then, competency-
based education and training-based education are broadly implemented at all
education levels including higher education. In line with this paradigm change,
accounting education in universities also moved to accounting-based education to
ensure that graduates will meet stakeholders’ requirements. Moreover, professional
organisations such as AICPA have established minimum competencies university
graduates require to enter the accounting profession (Bolt-Lee & Foster 2003; Mula
2007; Wolcot, Susan K. 2006).
As business becomes more complicated and competitive, employers also
become more demanding for graduates with competencies or skills. Kavanagh and
Drennan (2008) find that employers are expecting graduates entering the profession
to have as the top ten skills (1) Analytical skills/problems solving, (2) Business
awareness/’real life’ experience, (3) Basic accounting skills, (4) Ethics/fraud
awareness/ professionalism, (5) Communication: oral/face to face, (6)
Communication: written, (7) Interdisciplinary: able to work across/knowledge of
other disciplines, (8) Teamwork/cooperation/participation, (9) Interpersonal/
16
facilitation skills, and (10) Continuous learning/keeping up to date/refresh basic
skills. Likewise, Irianto (2010) identifies 20 skills/competencies required by
employers in the Indonesian company context. In addition, he contends the five most
important competencies i.e. Leadership skills, Interpersonal skills, Problem-solving
skills, Creativity and ability to think outside the box, and Decision making.
Building accounting competencies in higher education to meet the
expectation of the profession, organisations, and employers needs a long timeframe,
since there are many constructs that should be taken into account. Based on System
Theory originally developed by Bertalanffy (1968) and operationalised by Deming
(1995), an educational system has three main elements i.e. input, process, and output.
System Theory contends that Input affects process and process, in turn, affects
output. Similarly, Input-Environment-Output (I-E-O) developed by (Astin 1993a),
based on higher education research, also has three elements i.e. input, environment,
and output. The I-E-O model has the same model structure as System Theory, but I-
E-O draws a direct relationship between input and output. In addition, the theory uses
the environment as a term rather than process as employed by System Theory. With
respect to the components, both System Theory and the I-E-O model have almost the
same framework. Since the two theories have some similarities, the study employs
both theories as underpinning theories. Before discussing these theories, it is
important to understand the context in which they will be applied i.e. accounting
education in Indonesia.
17
2.2 Accounting Education Context in Indonesia
Education development in Indonesia has a long history from the era of Dutch
colonisation moving through what are called Old Order, New Order, and
Reformation eras. Not surprisingly, each era had its own problems that were faced by
students, parents, government, and other education stakeholders. Under Dutch
colonial rule, the biggest problem was access to education for indigenous students.
Native people had no equal access to education, since education was designed for
aristocratic people (Dutch). Soenarta (2005) explained that during this era there were
only three higher education institutions established and all of them were located in
Java. In addition, students of these noble institutions were dominated by Dutch
nationals.
During the Old Order era, access to the education became a little better. There
were five higher education institutions located in Java. Moreover, to increase access
to education, the government built a university in every province without adequate
preparation. This resulted in the quality of graduates from these new universities
being relatively low compared to previously-established universities. In general, the
quality of higher education was growing; political practice, on the other hand, was
also blooming rapidly inside universities. Sudaryono (2008) contended that political
conflicts among students and academics became very common in university life.
Thus, the attention of students and academics was not focussed on the process of
education.
Under the Suharto administration (New Order), there was a considerable leap
improvement in education as a result due to increased access to education for all
citizens. In terms of quantity, there was significant improvement. Unfortunately, a
18
quantitative increase in places available was not matched by enhanced quality.
During this period the number of public and private universities jumped very sharply,
but quality was still the main issue. Another main problem was having a standardised
tests for elementary, junior high, and high schools graduates. As mentioned by
Nugroho (2008), the implementation of these high-stake tests was that students,
teachers, schools, and other stakeholders paid too much attention to the results of
education instead of process.
Government policies on education in the Reformation era changed
significantly, since the responsibility for education is now with central and district
government authorities. Decentralisation, budgets, and standardisation are among the
important education issues during this era. In relation to Higher Education,
management of state universities shifted from pure-state-university management into
more autonomous state-university management with opportunities and challenges
(Irianto 2007). Government policies are focused on enhancing quality of education at
all levels. For example, the government has already launched many programs for
improving education quality such as providing scholarships and certification for
teachers. On the other hand, high-stake-final examinations for elementary, junior
secondary, and high schools are still implemented in spite of many criticism about
their negative impacts.
As a developing country, Indonesia has undergone accounting reformation
before and after Soeharto’s administration. Compared to socialist developing
countries such as China and Vietnam, the accounting reformation in Indonesia has
gone further and tends to continue by adopting more western accounting regulations,
particularly IASs (Rosser 1999). Even though accounting reforms outside the
19
classrooms is occurring very quickly, accounting education improvements inside the
classrooms seem to be slower. This phenomenon was found by Griffin (1996) that
Indonesia has received approximately US$16 million from the World Bank to
develop accounting education and training, but there is pressure to accelerate
‘teaching the teacher’. In the reformation era, after Soeharto’s regime, the same
problem was still faced by accounting education in Indonesia as contended by Mula
(2007) that Indonesia has encountered difficulty in harmonising accounting practices
with the west.
Accounting is taught in High Schools particularly for students majoring in
Social Studies. The number of hours for studying accounting in High School is
however limited, since hours have to be shared with Economics. In addition,
accounting is also taught in Vocational Schools of Economics but the number of
hours is diverse among majors. Generally, there are three majors in the Vocational
School of Economics, Accounting, Marketing, and Secretarial. Students majoring in
Accounting have to study accounting from first year until graduation. In contrast,
students majoring in marketing and secretarial studies have to study accounting in
their first year only. Vocational schools can add more majors based on the school’s
resources and the demands of graduates.
Higher Education in Indonesia comprises 37 state and approximately 222
private universities that offer undergraduate accounting programs (DIKTI 2009). For
the purpose of quality assurance, the Ministry of National Education established a
National Accreditation Body for Higher Education (BAN-PT) to assess the quality of
all study programs in both state and private universities. In total there are 46 state
20
universities, but nine universities have yet to offer an accounting program (BAN-PT
2009).
Degrees offered by Indonesian Universities are D3 (Vocational), S1
(BA/B.Com), S2 (Master’s), S3 (PhD). A D3 degree is a three-year vocational
education program after high school graduation; S1 degree is a four-year program
after high school graduation; S2 degree is a two-year program after S1 graduation,
and S3 is at least three-year of education after S2 graduation. The Directorate of
Higher Education (DIKTI) issues a permission letter to a university permitting it to
offer a certain study program upon completion of requirements.
In relation to lecturers’ qualifications, there are three kinds of lecturers i.e.
lecturers with Undergraduate, Master’s, and/or Doctorate degrees. DIKTI have
already issued a regulation that all Indonesian university lecturers have to have at
least a Master’s degree (S2) by 2015. This Office also provides opportunities to all
university lecturers to continue their study both in their country and overseas.
Generally, all state university lecturers are government officials (public
servants) whose salaries are paid by the central government based on public servant
ranks, lecturer certifications, and appointments—assistant, lecturer, senior lecturer,
and professor. In addition, almost all lecturers tend to stay in the same university
from the beginning of their career until retirement, even staying in the university
from which they took their undergraduate degrees. There are three main roles that
Indonesian lecturers should perform i.e. teaching, research, and community service
(DIKTI 2010).
Given the parochial nature of academics, internationalisation of accounting
education and graduates in Indonesian universities has encountered difficulties. As
21
contended by Irianto (2007), internationalisation is a significant challenge for state
universities in Indonesia. On the other hand, internationalisation of business and the
influx of foreign capital, dictate a set of competencies that are recognised globally.
To what extent competencies in existing accounting programs meet international
standards is the focus of this study. To address this focus it is necessary to have a
clearer understanding of how systems of education apply to Indonesia by drawing on
models and theories of systems and education.
2.3 Underpinning Theories
As previously mentioned, the study employs two underpinning theories (System
Theory and I-E-O Model) to build International Competency of Accounting
Graduates (ICAG). The study adopts a research framework consisting of three
constructs i.e. input, process/environment, and output. In addition, the study also uses
other related theories i.e. Expectancy Theory to measure student motivation,
Herzberg’s Motivation Theory (HMT) to gauge lecturer motivation based on
Lecturer Job Satisfaction, and Involvement Theory to measure processes/
environment in a university.
2.3.1 System Theory System Theory was originally developed by a biologist, Ludwig von Bertallanfy in
the 1920s, and then the theory was broadly applied to other disciplines such as
education and computer science (Bertalanffy 1968). A system is a network of
interdependent components that work together to try to accomplish the aim of the
system (Deming 1995). Moreover, he also hypothesised that System Theory is
22
applicable in the education sector. Therefore, some academia contended the
application of System Theory into education as a social system.
Cromwell and Scileppi (1995) suggested idea that education could be viewed
as a social system. More practically, the implementation of System Theory into
colleges or schools is considered as a social-technical system (Johnson 1984;
Mizikaci 2006). In view of this, Kessel et al. (1971) propositioned that university can
be studied usefully as an open system model. College as a social system composed of
interdependent parts which work in more or less complementary way towards more
or less compatible goals (Pervin 1967). As a comparison, Bowen (2007) explained
that schools exists to achieve objectives through the collective efforts of individuals
and groups in the system.
System Theory has two types of inputs namely input transformed resources
and input transforming resources. Inputs are materials and or non-materials from
outside (environment) that go into the system’s boundary while outputs are the result
of the system that go to outside (environment) the system’s boundary. Process is the
transformation of inputs into outputs that takes place inside the system’s boundary.
The internal process can be visible (white box) and invisible (black box) (Heylighen
1998). Moreover, Barnett (1995) considered the process of education in higher
education is a black box of the institutional space, since there are many intentional
and unintentional happenings that change students in various ways. Nevertheless,
some higher education researchers tried to provide potential explanation of the black
box by using many tools such as approach to learning (Biggs, Kember & Leung
2001) and student engagement (Astin 1999; AUSSE 2010b; Kuh 2009). For a clearer
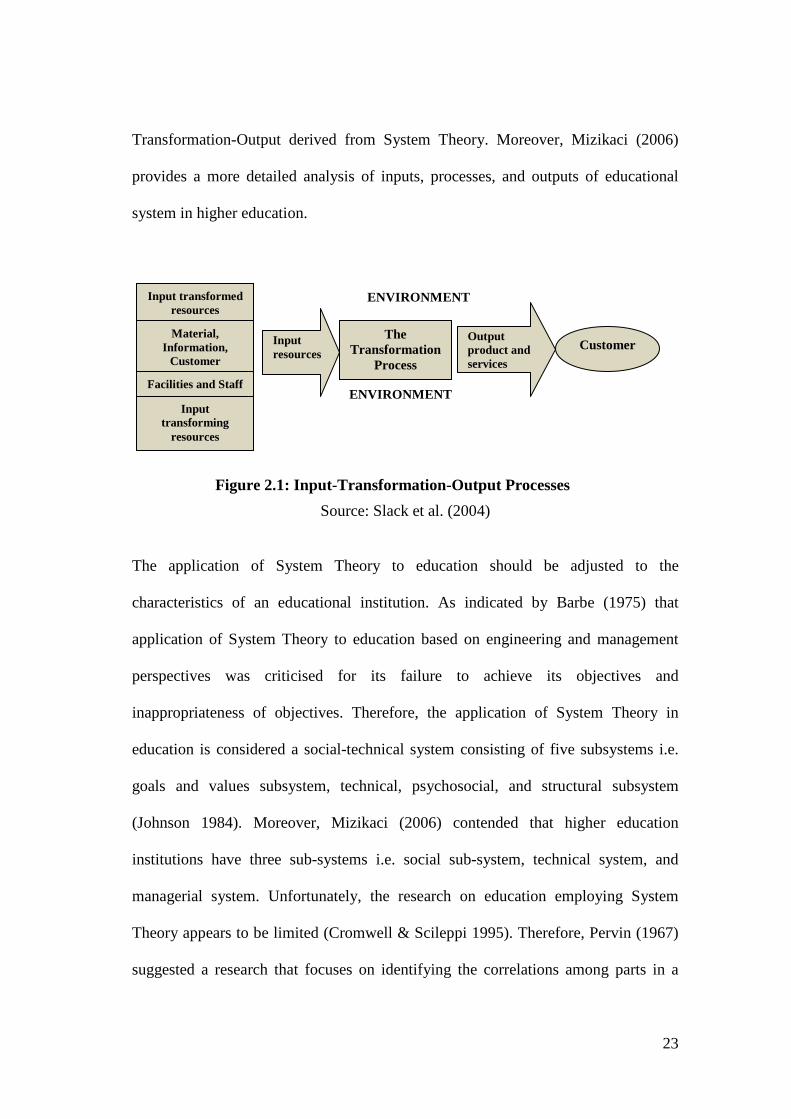
picture, Slack, Chambers, and Johnston (2004) developed a model called Input-
23
Transformation-Output derived from System Theory. Moreover, Mizikaci (2006)
provides a more detailed analysis of inputs, processes, and outputs of educational
system in higher education.
Source: Slack et al. (2004)
The application of System Theory to education should be adjusted to the
characteristics of an educational institution. As indicated by Barbe (1975) that
application of System Theory to education based on engineering and management
perspectives was criticised for its failure to achieve its objectives and
inappropriateness of objectives. Therefore, the application of System Theory in
education is considered a social-technical system consisting of five subsystems i.e.
goals and values subsystem, technical, psychosocial, and structural subsystem
(Johnson 1984). Moreover, Mizikaci (2006) contended that higher education
institutions have three sub-systems i.e. social sub-system, technical system, and
managerial system. Unfortunately, the research on education employing System
Theory appears to be limited (Cromwell & Scileppi 1995). Therefore, Pervin (1967)
suggested a research that focuses on identifying the correlations among parts in a
Figure 2.1: Input-Transformation-Output Processes
Input transformed resources
Material, Information,
Customer
Facilities and Staff
Input transforming
resources
Input resources
The Transformation
Process Customer
Output product and services
ENVIRONMENT
ENVIRONMENT
24
college system and the relations of various degrees of integration among the parts
with achievement of education goals. Accordingly, this study employs System
Theory as one of underpinning theories to explain correlations among constructs of
the educational system.
Like other systems, a college or school as a social system has three
components i.e. input, process, and output (Becket & Brookes 2006; Bushnell 1990;
Heylighen 1998; Nearon 2002). The application of the Input-Process-Output
framework to the education sector has been widely accepted especially in assessing
the quality of education. Almost all researchers agree upon employing this
framework in implementing Total Quality Management (TQM) in higher education
institutions (Barnett 1995; Becket & Brookes 2006; Chua 2004; Lewis & Smith
1994; Madaus, Airasian & Kellaghan 1980; Mizikaci 2006; Owlia & Aspinwall
1996).
Identically, a university as a social-technical system also consists of the same
components. As Lewis and Smith cited in Mizikaci (2006) contended that technical
system includes transformation processes as the “interaction” among inputs,
resources, and outputs. A university, as a social system, has many kinds of inputs,
but the most important inputs are students and teachers. As Owlia and Aspinwall
(1996) contended that in the case of higher education, groups of students and
lecturers participate a great deal in the process, but other groups deal mainly with the
final product of the system. Moreover, Mizikaci (2006) listed student characteristics,
lecturer characteristics, financial resources, facilities, and curriculum as inputs of a
higher education system. Likewise, Nearon (2002) almost arrived at the same list.
25
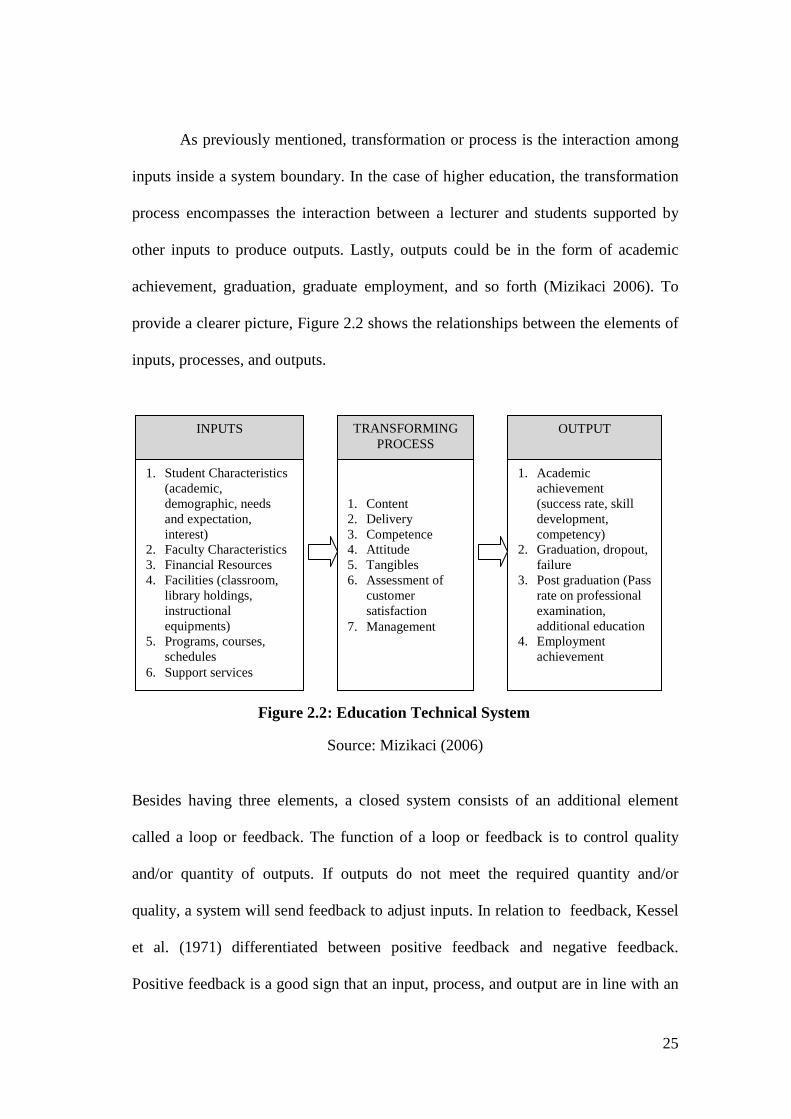
As previously mentioned, transformation or process is the interaction among
inputs inside a system boundary. In the case of higher education, the transformation
process encompasses the interaction between a lecturer and students supported by
other inputs to produce outputs. Lastly, outputs could be in the form of academic
achievement, graduation, graduate employment, and so forth (Mizikaci 2006). To
provide a clearer picture, Figure 2.2 shows the relationships between the elements of
inputs, processes, and outputs.
Source: Mizikaci (2006)
Besides having three elements, a closed system consists of an additional element
called a loop or feedback. The function of a loop or feedback is to control quality
and/or quantity of outputs. If outputs do not meet the required quantity and/or
quality, a system will send feedback to adjust inputs. In relation to feedback, Kessel
et al. (1971) differentiated between positive feedback and negative feedback.
Positive feedback is a good sign that an input, process, and output are in line with an
Figure 2.2: Education Technical System
1. Student Characteristics (academic, demographic, needs and expectation, interest)
2. Faculty Characteristics 3. Financial Resources 4. Facilities (classroom,
library holdings, instructional equipments)
5. Programs, courses, schedules
6. Support services
1. Content 2. Delivery 3. Competence 4. Attitude 5. Tangibles 6. Assessment of
customer satisfaction
7. Management
1. Academic achievement (success rate, skill development, competency)
2. Graduation, dropout, failure
3. Post graduation (Pass rate on professional examination, additional education
4. Employment achievement
INPUTS TRANSFORMING PROCESS
OUTPUT
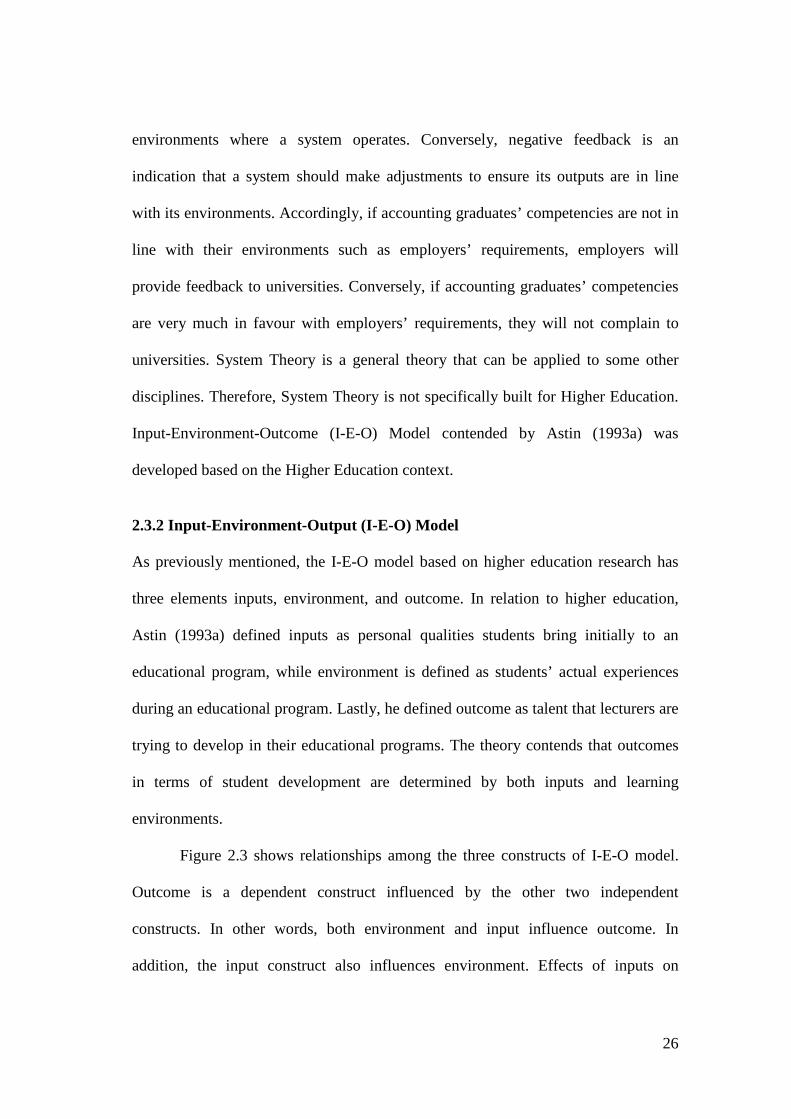
26
environments where a system operates. Conversely, negative feedback is an
indication that a system should make adjustments to ensure its outputs are in line
with its environments. Accordingly, if accounting graduates’ competencies are not in
line with their environments such as employers’ requirements, employers will
provide feedback to universities. Conversely, if accounting graduates’ competencies
are very much in favour with employers’ requirements, they will not complain to
universities. System Theory is a general theory that can be applied to some other
disciplines. Therefore, System Theory is not specifically built for Higher Education.
Input-Environment-Outcome (I-E-O) Model contended by Astin (1993a) was
developed based on the Higher Education context.
2.3.2 Input-Environment-Output (I-E-O) Model As previously mentioned, the I-E-O model based on higher education research has
three elements inputs, environment, and outcome. In relation to higher education,
Astin (1993a) defined inputs as personal qualities students bring initially to an
educational program, while environment is defined as students’ actual experiences
during an educational program. Lastly, he defined outcome as talent that lecturers are
trying to develop in their educational programs. The theory contends that outcomes
in terms of student development are determined by both inputs and learning
environments.
Figure 2.3 shows relationships among the three constructs of I-E-O model.
Outcome is a dependent construct influenced by the other two independent
constructs. In other words, both environment and input influence outcome. In
addition, the input construct also influences environment. Effects of inputs on
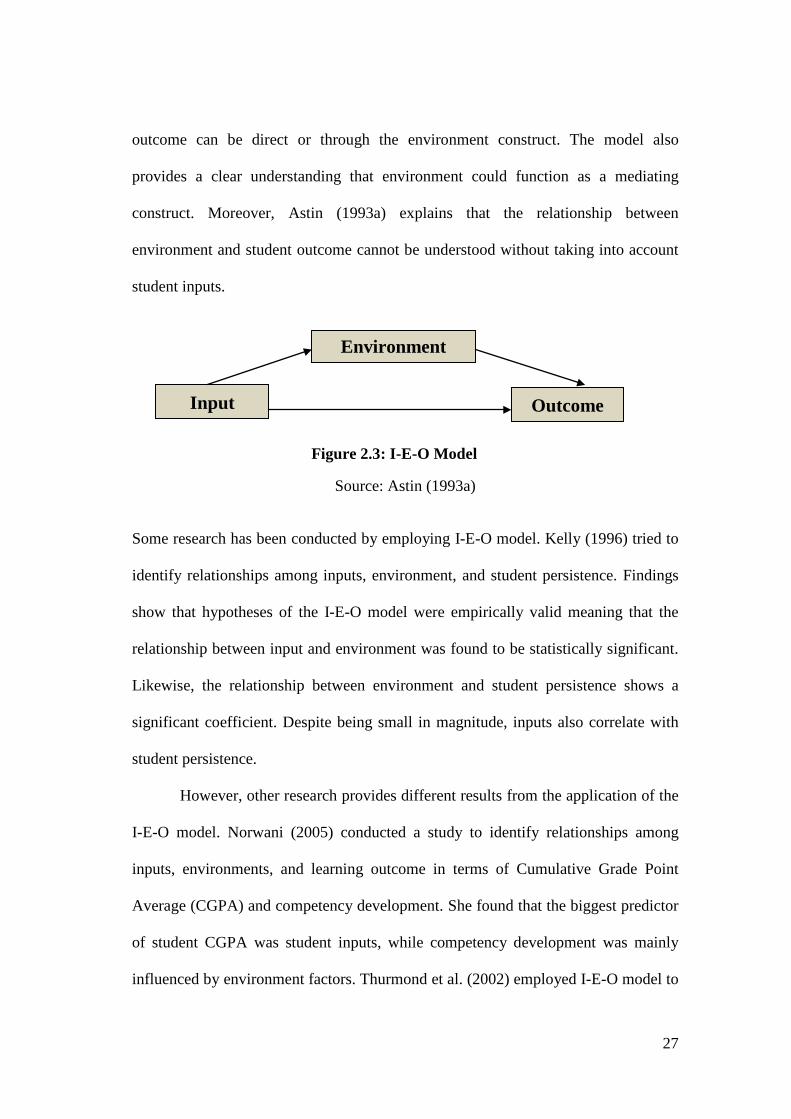
27
outcome can be direct or through the environment construct. The model also
provides a clear understanding that environment could function as a mediating
construct. Moreover, Astin (1993a) explains that the relationship between
environment and student outcome cannot be understood without taking into account
student inputs.
Source: Astin (1993a)
Some research has been conducted by employing I-E-O model. Kelly (1996) tried to
identify relationships among inputs, environment, and student persistence. Findings
show that hypotheses of the I-E-O model were empirically valid meaning that the
relationship between input and environment was found to be statistically significant.
Likewise, the relationship between environment and student persistence shows a
significant coefficient. Despite being small in magnitude, inputs also correlate with
student persistence.
However, other research provides different results from the application of the
I-E-O model. Norwani (2005) conducted a study to identify relationships among
inputs, environments, and learning outcome in terms of Cumulative Grade Point
Average (CGPA) and competency development. She found that the biggest predictor
of student CGPA was student inputs, while competency development was mainly
influenced by environment factors. Thurmond et al. (2002) employed I-E-O model to
Figure 2.3: I-E-O Model
Environment
Input Outcome
28
scrutinise relationships among student satisfaction, web-based environments, and
student characteristics. The results show that student satisfaction was influenced by
web-based environment. Unfortunately, they could not provide enough evidence
about the correlation between student characteristics and student satisfaction; thus
the influence of student characteristics on web-based environment is also
insignificant. It seems that the research does not have enough evidence about the
relationship between inputs and environments.
In summary, inputs and environment have significant correlation (Kelly
1996); environment correlates significantly with output (Kelly 1996; Thurmond,
Wambach & Connors 2002); and inputs were the biggest predictor of output
(Norwani 2005). Therefore, the study employs the I-E-O model together with System
Theory as underpinning theories.
In relation to System Theory and I-E-O model, Mohamed and Lashine (2003)
provide a general framework how to bridge graduates’ skills with global market
requirements and expectations. Based on Figure 2.4, the flow of education process
starts with a High School education and finishes with graduates from universities
who master skills and competencies required and expected by a global market.
Building international competencies of accounting graduates needs to employ a more
comprehensive and integrated approach by including a number of inputs, processes,
and outputs. In addition, Mohamed and Lashine (2003) provide a list of skills to meet
global markets (Figure 2.4). These skills are in line with core competencies of
accounting graduates established by AICPA.
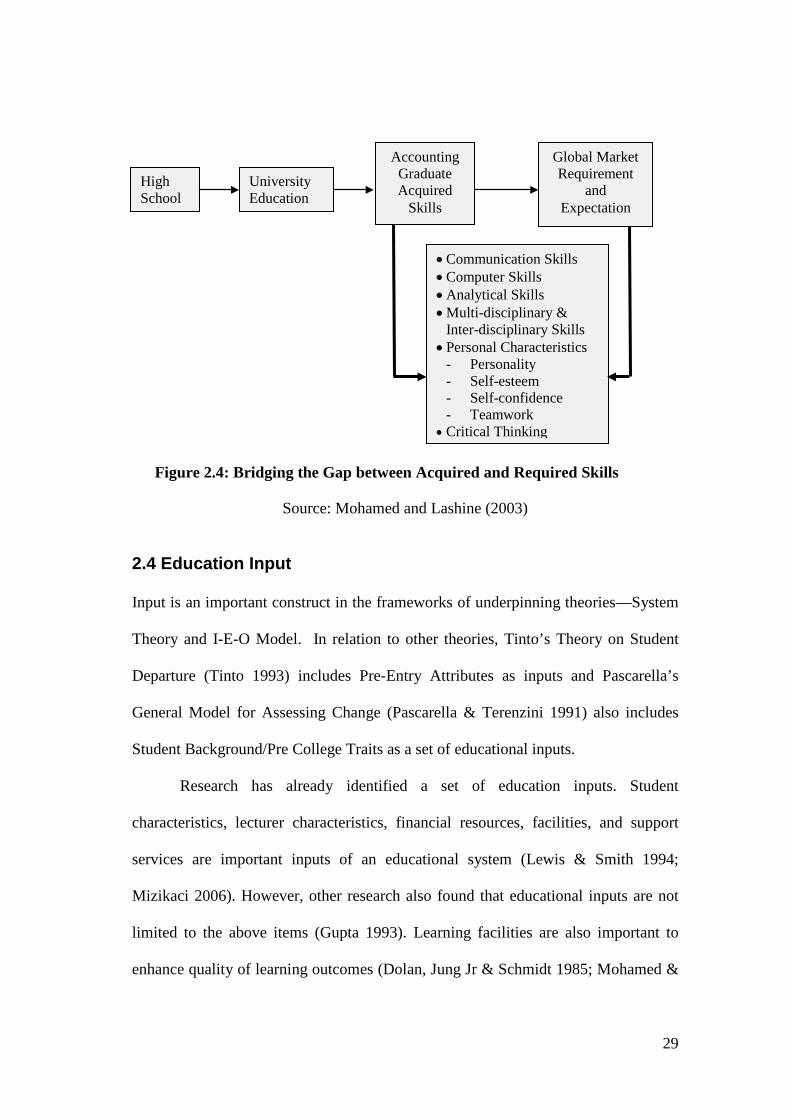
29
Source: Mohamed and Lashine (2003)
2.4 Education Input
Input is an important construct in the frameworks of underpinning theories—System
Theory and I-E-O Model. In relation to other theories, Tinto’s Theory on Student
Departure (Tinto 1993) includes Pre-Entry Attributes as inputs and Pascarella’s
General Model for Assessing Change (Pascarella & Terenzini 1991) also includes
Student Background/Pre College Traits as a set of educational inputs.
Research has already identified a set of education inputs. Student
characteristics, lecturer characteristics, financial resources, facilities, and support
services are important inputs of an educational system (Lewis & Smith 1994;
Mizikaci 2006). However, other research also found that educational inputs are not
limited to the above items (Gupta 1993). Learning facilities are also important to
enhance quality of learning outcomes (Dolan, Jung Jr & Schmidt 1985; Mohamed &
Figure 2.4: Bridging the Gap between Acquired and Required Skills
High School
University Education
Accounting Graduate Acquired
Skills
Global Market Requirement
and Expectation
• Communication Skills • Computer Skills • Analytical Skills • Multi-disciplinary &
Inter-disciplinary Skills • Personal Characteristics
- Personality - Self-esteem - Self-confidence - Teamwork
• Critical Thinking
30
Lashine 2003). Likewise, Nearon (2002) arrived at a shorter list of inputs of an
accounting educational system i.e. accounting professors, students, subject matter,
and funding. In line with the above, the study includes students’ characteristics,
lecturers’ characteristics, teaching contents, class size, and learning facilities as
inputs of accounting education in universities. There are other educational inputs not
included in the study. It doesn’t mean other inputs are not important to education, but
those inputs may be important to attain other education output (Madaus, Airasian &
Kellaghan 1980).
Curricula consisting of subject matter are an important input into the
educational system. The Ministry of National Education (MONE) has already
enacted a decree number 232/U/2000, Guidelines for Developing Higher Education
Curricula and Assessing Student Learning Outcomes. In developing accounting
curricula, a university should include national core content that account for 40% to
80% (Depdiknas 2000). Nonetheless, accounting curricula used by Indonesian
universities are similar, since the curricula are adapted and adopted from the
curricula developed by reputable universities (Hamzah 2009). Therefore, the study
uses the perception of lecturers on competency teaching content to deal with
accounting curricula.
Even though funding is a salient input in an educational system, it has
inconsistent correlations with student achievements. Some research has found that
there are three correlation findings between school funding and student achievements
i.e. positive correlation (Barrow & Rouse 2005; Ellinger & Wright 1995), weak
correlation (Tow 2006), inconsistent correlation (Cook 2001; Klick 2000; Neymotin
31
2008). The following section discusses in more detail educational inputs that have
potential correlation with both processes and outputs.
2.4.1 Student Characteristics As the most important input, a student will be transformed into an output through the
transforming process in a university. A student has certain characteristics, the quality
of which can affect processes and outputs (achievements). In this case, Hattie (2003)
propositioned that student characteristics account for about 50% of the variance in
achievements. Lewis and Smith (1994) included student characteristics as inputs of
the educational system. Astin (1971) identified twelve students characteristics that
cover academic, psychological, demographic, and socio-economic characteristics.
Likewise, Mizikaci (2006) arrived at shorter list of student characteristics i.e.
academic, demographic, need and expectation, and interest. Mizikaci’s lists on
students’ characteristics fall into three dimensions i.e. psychological, academic, and
demographic. This study, therefore, employs students’ motivation, students’ previous
academic achievements, and students’ demographic characteristics as proxies of
psychological, academic, and demographic dimensions respectively.
Psychological Dimension
As Mizikaci (2006) contended that interest, need, and expectation are some student
characteristics. To deal with this dimension, this study employs Expectancy Theory
to measure student motivation. As Vroom cited in Geiger and Cooper (1996)
explained, motivation to act is a combination of the perceived attractiveness of future
outcomes and the likelihood that one’s action will lead to these outcomes.
Furthermore, Expectancy Theory also contends that motivational force for a
32
behaviour, action, or task is a function of three distinct perceptions i.e. expectancy,
instrumentality, and valence (Chiang et al. 2008).
In consonance with the above definition, Expectancy Theory is a process
motivation that requires three perceptions of an individual. Moreover, Chiang et al.
(2008) defined the three individual perceptions as follows: expectancy as perception
of an individual that his or her efforts will result in good performance.
Instrumentality is a perception of an individual that good performance will provide
her or him with expected outcomes or rewards. Lastly, valence is an individual’s
perception about expected outcome or rewards. In other words, motivation force
based on Expectancy Theory is a function of expectancy, instrumentality, and
valence. The following equation depicts the formula of motivation force.
Motivation Force = Expectancy x Instrumentality x Valence (Chiang & Jang 2008;
Chiang et al. 2008)
Since its inception, Expectancy Theory has been broadly used to measure
motivation of employees (Chiang & Jang 2008; Chiang et al. 2008) and students
(Campbell, Baronina & Reider 2003; Geiger & Cooper 1995; Geiger & Cooper
1996; Geiger et al. 1998; Harrel, Caldwell & Doty 1985; Tyagi 1985; Yining &
Hoshower 1998). In the context of the study, a student will put more effort into
improving his or her performance in terms of competencies or achievements. Good
competencies or achievements, in turn, will lead to desired outcome or rewards e.g. a
good job that can satisfy his or her personal goal.
Expectancy Theory has two related models i.e. valence model and force
model. Expectancy Theory is effective in predicting academic performance (Geiger
& Cooper 1996). Likewise, Harrel, Caldwell and Doty (1985) concluded that the
33
force model of Expectancy Theory is a very useful conceptual framework for
understanding students’ motivation to strive for academic success. Lastly, Yining
and Hoshower (1998) also used Expectancy Theory to assess student motivation to
participate in teaching evaluation and they arrived at the same results.
In relation to motivation and student engagement, there are two main points
of view about these concepts. Some academics believe that motivation and student
engagement are the same concept, but others contended that the concepts were
different in nature. To understand the difference between the two concepts, the
following definitions may be useful. Russel et al. (cited in Ainley 2004) defined
motivation as energy and direction, the reason for behaviour; why we do what we do.
Student engagement, on the other hand, describes energy in action; the connection
between person and activity.
The relationship between motivation and student engagement is causal,
meaning that motivation will influence student engagement. Students’ motivation
and effort coupled with learning climate impact engagement (Heller et al. 2010).
More specifically, Walker et al. (2006) contended that an important outcome of
increased motivation is cognitive engagement in learning task. Moreover, students
lacking in motivation and connectedness, have a higher potential to deteriorate into
despondency and disengagement from the university community (Krause 2005).
Based on the aforementioned definitions of student motivation and student
engagement as well as based on previous research results, the study uses student
motivation and student engagement as different concepts.
To deal with student motivation, the study uses Expectancy Theory by
adapting the works of Chiang and Jang (2008) who have already developed concise
34
questionnaires with good reliability and validity. The questionnaire consists of five
factors i.e. expectancy, extrinsic instrumentality, intrinsic instrumentality, extrinsic
valence, and intrinsic valence. Overall, these factors, except extrinsic instrumentality,
have very significant influence on work motivation of hotel employees. Adaptations
have been made to ensure all questionnaire items fit into students’ context.
In summary, motivation has an important role in determining both student
engagement and student achievements. Consequently, Expectancy Theory may be
useful in predicting student engagement, students’ accounting competencies as well
as student achievements.
Academic Dimension
In addition to the psychological dimension, this study also includes an academic
dimension as an input of the system. To enter an accounting educational system, a
student must meet academic requirements that are in line with accounting education
to ensure the process will run as planned and outputs also meet required quality as
well as quantity. To deal with academic dimension, the study uses previous academic
achievements as proxies of academic performance of students prior to entering
accounting education in a university. Previous academic achievements are
achievements earned by students from previous schoolings.
Research to identify the correlation between high school grades and college
Grade Point Average (GPA) has been conducted by Astin (1971). By employing
2,439 male and 2,445 female students, he found that the correlation between high
school grades and freshmen students’ GPA are 0.519 and 0.498 for male and female
students respectively. Moreover, he also concluded that high school grades are
35
becoming stronger predictors of students’ achievements (Astin 1993a). Therefore,
previous grades were predictors of academic performance (Credé & Kuncel 2008).
The above findings are still very general, since the sample used in the
research was students from all majors. Some research has been conducted to find the
relation between previous academic achievements with students’ performance in
accounting major. Duff (2004) found that previous academic achievement was the
strongest predictor of accounting students’ performance. Likewise, Rohde and
Kavanagh (1996) arrive at more specific result that first year tertiary accounting
results obtained by a student who studied accounting previously was between one
and two grades higher than that of a student who did not study accounting at high
school. Another finding shows that there was a significant but not particularly strong
relationship between high school achievements (as measured by TER or Tertiary
Entrance Rank) and academic achievements (Dickson & Fleet 2000). Lastly,
Agronow (2008) identified that pre-college academic/demographic characteristics
have correlation with student GPA 0.508. It means that these variables contribute
26% of student achievements.
The above findings discuss the influence of previous academic achievements
on student achievements. To see the influence of previous academic achievements on
student engagement, this study considers the following propositions. The first
proposition was contended by Alvermann (2001) that the level of student
engagement is the mediating factor through which classroom instruction influences
student outcomes. The second proposition was proposed by researchers from
University of Victoria, Canada that student engagement can be a good proxy for
overall educational quality (UVic 2006). These propositions imply that previous
36
academic achievements could influence student engagement. Research conducted at
the University of California, Berkeley arrived at more specific results that
demography/pre-college academic success correlates significantly with academic
engagement (Agronow 2008). Therefore, previous academic achievements may
correlate significantly with student achievements and student engagement.
Demographic Dimension
Student demographic characteristics and their influence on students’ achievements
have been scrutinised for a long time, even though their influence was relatively
small. In general, race, student’s religious preference, parents’ income, and parents’
education correlate with student achievements, but the correlation coefficients were
small (Astin 1971). More current findings also show that student demography
characteristics correlate with student achievements, but the coefficient was minimal.
Likewise, AUSSE (2010a) reported that sex has direct positive effect on average
overall grades. The report also emphasises that female students tend to have higher
grades than male students. In view of this, Strayhorn (2008) found a different effect
of age and sex on personal/social gains as learning outcomes. Sex correlates
positively with learning outcomes, female students tend to have higher outcomes
than their counterparts, while age correlates negatively with learning outcomes.
In summary, demographic dimensions in term of gender correlates with
student achievements. On the other hand, age may correlate negatively with student
achievements. Therefore, age and gender may correlate with student achievements as
well as students’ accounting competencies. The following are discussions about the
relationship between demographic characteristics and student engagement.
37
In an Australian university setting, there is different engagement between
male students and female students. Male students tend to be more engaged in
academic challenge and interaction with staff. Female students, on the other hand,
were reported to be more engaged in work integrated learning (AUSSE 2010a).
Different pictures of student engagement based on gender were drawn from the
American university setting. Female students are more likely to be more engaged in
academic challenge activities than their counterparts. The differences of engagement
in active and collaborative learning, student-faculty interaction, experience in
diversity, and supportive campus environment between male and female students are
trivial in magnitude (Kinzie et al. 2007).
The relationship between age and student engagement are positive and
significant, meaning that older students tend to be more engaged in academic-
purposeful activities. Age is positively correlated with faculty-student interaction and
active learning respectively, but age is negatively correlated with peer interaction
(Strayhorn 2008). This study, therefore, includes age and gender as predictors of
student engagement, student achievements, and student accounting competencies.
2.4.2 Lecturer Characteristics Another very important input to an education system, in addition to student inputs, is
lecturer input (Mizikaci 2006; Nearon 2002), since lecturers impact on students’
achievements considerably (Hoffmann & Oreopoulos 2009a). The influence of
lecturers on students’ achievements makes up 30 percent of the variance (Hattie
2003). Albeit a smaller influence compared to elementary and secondary school
38
teachers’, lecturers still significantly influence student achievements (Hoffmann &
Oreopoulos 2009a).
Based on System Theory and I-E-O model, there is a mediating or
intervening construct between lecturers’ characteristics and student achievements.
Therefore, the study employs student-faculty engagement and student engagement
for mediating constructs and as proxies for education processes in a university.
Student engagement in academic and non-academic activities is committed by
students in a university. Student-faculty engagement, on the other hand, is the
activities of faculty members or lecturers in joining activities with students,
providing facilitation, and encouraging students to be involved in academic and non
academic activities in a university. Therefore, the indicators for gauging student
engagement and student-faculty engagement are exactly the same.
The questions of student-faculty engagement are the mirror of student
engagement questions (Kuh, Nelson Laird & Umbach 2004). This also implies that
both engagements require active roles from two parties, students and lecturers.
Moreover, the roles of lecturers are critical to make students engage in academic and
non-academic activities. Basically, students tend not to interact with faculty because
they are not aware of the potential benefits of engaging faculty (Cotten & Wilson
2006). Therefore, faculty members and other related parties have to provide
progressive and sustained assistance to ensure that students stay enrolled and
graduate from college (Rendon 2002).
Since each faculty member has their own constraints, she or he would have
different intensity in participating in activities with students and providing
progressive and sustained assistance to students. In other words, the extent to which
39
lecturers engage physically, cognitively and emotionally, in the roles they perform
will vary (Hermsen & Rosser 2008). The study identifies some variables that
correlate with lecturers’ performance in carrying out student-faculty engagement.
Unfortunately, most of research in this area focused mainly on student engagement
while research on student-faculty engagement appears to be limited.
Besides employing student-faculty engagement as a proxy for processes in a
university, the study also includes accounting-competency teaching contents as a
proxy of curricula. Accounting-competency teaching contents measures how much
lecturers include international competency of accounting in their teaching-learning
processes. Curricula consists of subject matters (Toombs & Tierney 1993) and
instruction (Frey 1998). In this case, accounting-competency teaching contents cover
curricula and its implementation in teaching-learning processes. Previous studies
found that students gain accounting competencies during teaching-learning process
(Azemikhah 2006; Bonner 1999; Jayaprakash 2005; Tigelaar et al. 2004; Weil,
Oyelere & Rainsbury 2004; Wu 2008). Therefore, the study includes accounting-
competency teaching contents as a part of transforming process in a university.
Section 2.4.3 provides further discussion about accounting-competency teaching
contents.
As has been noted, student characteristics fall into three dimensions i.e.
academic, demographic, and psychological (Mizikaci 2006). In addition, Knowles
(1999) classified lecturer characteristics into two dimensions i.e. lecturer knowledge
and motivation. In other words, the classification falls into academic and
psychological dimensions. The study, therefore, uses the same dimensions that apply
to student characteristics. Since demographic dimension in term of lecturer gender
40
plays a minor role in determining student achievement (Hoffmann & Oreopoulos
2009b), the main focus of the study is psychological and academic dimensions. The
data about demographic dimensions such as age and gender are collected to support
other dimensions. Therefore, lecturers’ characteristics fall into three dimensions
namely psychological, academic, and demography.
Owing to limited research that identifies predictors of student-faculty
engagement and accounting-competency teaching contents, the study uses student-
faculty engagement and accounting-competency teaching contents as lecturers’ job
performance (lecturer performance in carrying out student-faculty engagement). In
this case, student-faculty engagement is the intention of the lecturer to perform
student-faculty engagement physically, cognitively, as well as emotionally. In
addition, accounting-competency teaching contents measures how much lecturers
include students accounting competencies (ICAG). Therefore, student-faculty
engagement and competency teaching content are parts of lecturer’s job
performance.
Psychological Dimension
To deal with the psychological dimension, the study employs lecturers’ job
satisfaction and motivation measured by Herzberg’s Motivation Theory (HMT)9. In
business and industrial entities, HMT is commonly used to measure employee
motivation and job satisfaction. The correlation between job satisfaction and job
performance among industrial workers is positively significant (Zhang & Zheng
2009), even though this correlation is subject to criticism (Bowling 2007). In
9 Herzberg’s Motivation Theory (HMT) is commonly used to measure employee motivation and job satisfaction.
41
addition, HMT was developed more than 50 years ago, but the theory still has power
to gauge job satisfaction (Bassett-Jones & Lloyd 2005). Herzberg’s Motivation
Theory comes with two dimensions namely motivation and hygiene. This theory
posits that hygiene issues (company policy, salary, working condition, and
interpersonal relation) cannot motivate employees, but they can minimise
dissatisfaction, if handled properly. On the other hand, motivators (achievement,
recognition, the work itself, responsibility and advancement) lead to individual’s
satisfaction (Syptak, Marsland & Ulmer 1999).
Herzberg’s Motivation Theory is not only measuring motivation and job
satisfaction of employees in industrial and commercial organisations, but also
measuring the same psychological inventories of employees in educational
institutions such as teachers or faculty members (Ololube 2006; Sudiro 2008; Woods
& Weasmer 2004). In relation to teacher motivation, Knowles (1999) identified that
teacher motivation impacts on students’ motivation and grades. In the area of
education, some academics show that job satisfaction is significantly-correlated with
job performance. In view of this issue, job satisfaction reduces attrition, enhances
collegiality, improves job performance, and has impact on student outcomes (Woods
& Weasmer 2004). Moreover, job satisfaction of lecturers influences work
engagement (Hermsen & Rosser 2008). Similarly, by recruiting lecturers from
certain universities in Indonesia as samples, Riduwan (2006) found that motivation is
very important predictor of lecturers’ performance.
Research to identify the effect of job satisfaction and its influence on teaching
performance was conducted in the River State of Nigeria. The finding shows that a
teacher’s job satisfaction seems to have a greater impact on teaching performance
42
Ololube (2006). By recruiting lecturers from three Indonesian state universities as
samples, Sudiro (2008) arrived at more specific results that job satisfaction
correlates significantly with job performance. Moreover, he also found that job
performance correlates with lecturers’ career. Conklin and Desselle (2007)
contended that lecturers’ job satisfaction may be an important mediator or
organisational commitment and certain aspect of productivity. These findings also
imply that the proposition about the correlation between lecturers’ job satisfaction
and their job performance is fully applicable to the context of Indonesian
universities.
In summary, lecturers’ job satisfaction may impact student-faculty
engagement and accounting-competency teaching contents. To measure lecturers’
job satisfaction, this study uses items and factors developed by Conklin and Desselle
(2007) based on Herzberg’s Motivation Theory. The questionnaire consists of six
factors namely resource for scholarship, institutional support and reward,
requirements for promotion and tenure, availability of a graduate program,
collegiality, and teaching environment. The items have been validated in measuring
pharmacy faculty work satisfaction. In addition, some items were adapted to ensure
they are in line with the Indonesian university context.
Academic Dimension
Besides considering the psychological dimension, this study also includes an
academic dimension as a characteristic of lecturers. Even though, this dimension
consists of many factors, the study includes the most important factors in the
Indonesian university context. The study classifies factors into education attainment,
43
teaching experience, research productivity, lecturer appointment, article publication,
and lecturer certification.
As has been noted, the study analogises student-faculty engagement and
accounting-competency teaching contents as lecturer performance indicators. A
handful of research on the effect of education attainment on lecturers’ performance
has been conducted in Indonesian universities, since there are three classifications of
university lecturers based on their education attainment i.e. Undergraduate, Master’s,
and Doctorate. Education attainment of lecturers does not significantly influence
their teaching performance (Verceles & Rivera 2010). Nevertheless, other research
found that the effect of education attainment on lecturers’ performance is positive
and significant (Riduwan 2006). Likewise, Yusuf (2006) conducted research in a
different university and the results are very similar, education attainment has a direct
and significant influence on lecturers’ performances. Generally, lecturers improve
their pedagogical skills and subject matter mastery through teaching experience,
training, and formal education. Lecturers’ pedagogical skills and subject matter
mastery impacts on students’ motivation and grades (Knowles 1999) as well as
lecturers’ performance in the teaching and learning processes (Yusuf 2006).
Therefore, lecturers’ education attainment may affect student-faculty engagement
and accounting-competency teaching contents.
In term of teaching experience, De Paola (2009) contended that the effect of
lecturers’ experience and research productivity on students’ achievement is
significant. For lecturers from a social science course, research productivity in term
of number of publications also correlates with student rating of instructor
effectiveness (Centra 1983). Like education attainment, teaching experience also
44
leads to improvement of pedagogical and subject matter skills as well as knowledge.
In turn, lecturers’ skills and knowledge affect students’ achievement and motivation
(Knowles 1999) as well as lecturers’ performance in classes (Yusuf 2006).
Experience also provides opportunities to teachers to become more effective
lecturers by developing best practice in teaching and learning processes.
Nevertheless, research conducted in elementary school found the correlation between
teachers’ experience and student achievement are weak (Buddin & Zamarro 2009).
Effective teachers consciously work to become fully engaged in the learning
processes and improve their teaching skills over time (Kennedy 1998). In line with
this, Kuh (2004) also found that faculty members who implement effective
educational practices will encourage students to be more engaged in productive
learning activities. Moreover, Wang et al. (2006) found that the relationship between
teacher experience and teaching effectiveness is non-linear. Even though, there are
manifold findings about the effect of experience on teaching effectiveness, this study
concludes that teaching experience correlates significantly with student-faculty
engagement and accounting-competency teaching contents.
The Ministry of National Education (MONE) of Indonesia has been
implementing certification to enhance teachers’ quality on all education levels
including higher education. A certified teacher is a teacher who has already met
requirements as a professional teacher. Since this program is quite new, the research
on this issue in the Indonesian context is still very limited. However, some research
has been conducted in some countries. Teacher licensure test scores and advanced
degrees had no impact on student achievement (Buddin & Zamarro 2009). On the
other hand, certification provides a positive signal of a teacher’s contribution to
45
student achievements in a few isolated cases (Harris & Sass 2009). Likewise, Bond
et al. as cited by Wang et al. (2006) contended that the impact of teacher certification
is positive indicated by the difference of teaching performance between certified and
non-certified teachers. In view of the above, the impact of teacher certification on
student achievements and teachers’ performance is inconsistent. In addition, the
above findings are focused on elementary and high school teachers. The impact of
certification on lecturers’ performance in term of student-faculty engagement and
accounting-competency teaching contents on university level may provide different
pictures.
In relation to other lecturers’ academic characteristics, Hoffmann and
Oreopoulos (2009a) contended that instructor traits, such as rank, faculty status, and
salary have virtually no effect on student outcomes. On the other hand, student
evaluation of teaching based lecturers rank is minimally different (Kogan,
Schoenfeld-Tacher & Hellyer 2010). Based on the above, the study concludes that
lecturers’ rank may correlate with student-faculty engagement and accounting-
competency teaching contents.
Academic dimension is one lecturer characteristic that becomes an input of
the transforming process. As previously mentioned, the study employs student
engagement and student-faculty engagement to measure transforming process in a
university. Additionally, student-faculty engagement questions are developed based
on student-engagement items and factors. Student-faculty engagement is self-
reported engagement of lecturers. In other words, this engagement will be measured
based on the faculty members’ or lecturers’ perspectives. The roles of faculty
members in improving student engagement are very critical. By employing
46
Hierarchical Linear Analysis (HLM)10 Umbah and Wawrzynski (2005) reported that
faculty members played a very important role in student learning and engagement
both in and out the classroom. Therefore, academic dimension in terms of lecturers’
education attainment, working experience, research productivity, and certification
may correlate with student-faculty engagement.
Demographic Dimension
As has been discussed earlier, the influence of lecturers’ demographic characteristics
on student achievements is minimal (Hoffmann & Oreopoulos 2009b), the study
includes gender and age. Moreover, Dee (2007) concluded that the gender
interactions between teacher and students have significant effect on educational
outcome.
Generally speaking, lecturer age is associated with lecturer experience and
seniority. Older lecturers could have more ability to teach their subject matter, since
they have been teaching the subject matter longer than younger lecturers. In general,
there is correlation between the age of university lecturers and their teaching
performance (Kinney & Smith 1992). In addition, they also revealed that teaching
performance of faculty members in social science tends to decline between the early
forties and the mid-sixties. On the other hand, a senior gerontologist argued strongly
that the correlation between age and job performance is zero meaning that there is no
relationship between those variables (Kemper 2010). In summary, the correlations
between lecturers’ age and gender and student-faculty engagement may be
significant. 10 Hierarchical Linear Modelling is a statistical technique to identify association between variables with nesting data such as the association between lecturers’ education attainment with students’ achievements.
47
Some research has been conducted to identify the impact of lecturers’ gender
on their teaching performance. Despite culturally-conditioned gender stereotypes,
students perceive female lecturers as warmer and more potent individuals (Bennett
1982). On the other hand, Verceles and Rivera (2010) found that gender does not
impact on lecturers’ teaching performance. Likewise, Buck (1989) also found that
students’ perception of teachers’ competencies was not affected by the teacher
gender. Therefore, age and gender may significantly correlate with student-faculty
engagement and accounting-competency teaching contents.
2.4.3 Accounting-competency Teaching Contents Subject matter is an important input to the educational system (Nearon 2002). In this
case, subject matters are considered as curricula. Toombs and Tierney (1993) define
curricula as a set of courses offered to students. In other words, curricula are defined
in a narrow perspective. In comparison, in a broader perspective curricula are not
merely a list of courses but comprises six components i.e. purpose, goals, objectives,
needs focusing, curriculum alignment, and instruction (Frey 1998). In considering
accounting competencies, curricula must accommodate the requirements demanded
by industries, professional bodies, and the demand for greater flexibility (Faux &
Woodley 2009). Moreover, Faux and Woodley also contended that curricula should
adopt a teaching approach that provides enhanced accounting education and job-
ready students. Based on the Double Heuristic Model (DHM) the teaching-learning
process for building competencies should use mental reflection, physical action, and
the use of skills (Azemikhah 2006).
48
There are many approaches to teaching accounting competencies in higher
education. The combination of cooperative learning, contextual learning, and e-
portfolio learning seems to have been successfully implemented to build students’
competencies in accounting (Wu 2008). More generally, Jayaprakash (2005)
suggested the integration of content learnt with real world experience. Moreover, he
mentioned some example of teaching tools such as interactive case studies,
simulations and games, and group work. The research findings by Weil, Oyelere and
Rainsbury (2004) also found that Professional Accounting School candidates
perceive case studies as being useful for developing competencies specified by the
program. Nonetheless, an accounting lecturer needs to carefully employ multiple
teaching methods to achieve learning objectives of a given accounting course, since
the objectives are likely to encompass the full range and types of objectives (Bonner
1999).
In view of the above, Tigelaar et al. (2004) validated a framework for
teaching competencies in higher education suggests three domains i.e. person as
lecturer, expert on content knowledge, facilitator of learning processes. Moreover, in
the last domain, a lecturer functions as developer, counsellor, evaluator, organiser,
and scholar/lifelong learner.
The above discussion implies that there are two bases for improving students’
competencies i.e. curricula and the implementation of teaching and learning in
classrooms. Accounting curricula developed by Indonesian universities have to
follow Ministerial Decree number 232/U/2000 on Guidelines for Developing Higher
Education Curricula and Assessing Student Learning Outcomes. The decree clearly
mentions that curricula of program study have to include a national core content that
49
accounts for 40% to 80% (Depdiknas 2000). Therefore, at least 40% of the
accounting curriculum adopted by Indonesian universities is similar. Moreover,
Hamzah (2009) reiterated that accounting curricula used by Indonesian universities
are adopted and replicated from other reputable universities. In addition, he also
contends that accounting curricula tend to be static. This implies that type and
number of subject matter taught in accounting programs have similarities.
Nevertheless, the implementation of accounting curricula in accounting teaching and
learning by university and lecturer could be different. Therefore, the study uses
perceived accounting-competency teaching contents, International Competency of
Accounting Graduates-Teaching Contents (ICAG-Teaching Contents), as a proxy of
curricula. As previously mentioned by Mizikaci (2006) content and delivery are
considered processes. On the other hand, Nearon (2002) considered subject matter as
an input. Therefore, the study concludes that based on lecturer perceptions, ICAG-
Teaching Content may lie between educational inputs and transforming process. In
addition, student engagement (student perception) and student-faculty engagement
(lecturer perception) are also intended to measure transforming process. Section 2.5.2
and 2.5.3 discuss more detailed about these engagements.
2.4.4 Learning Facilities Learning facilities are also considered important inputs, since they enhance the
quality of learning processes. By employing appropriate learning facilities, the
process of teaching and learning becomes more productive (Boyce cited in Herring
III & Bryans 2001). Therefore, universities have to provide adequate learning
facilities for both lecturers and students to ensure outputs of teaching-learning
50
processes meet required competencies. In line with this, Dolan, Jung, and Schmidt
(1985) contended that academic support in the forms of libraries, laboratories, and
computers enhance the quality of students and teachers. Moreover, they also
conclude that these academic support facilities could be major drivers of educational
processes. Hypothetically, the function of learning facilities is very critical in
enhancing teaching-learning processes in higher education. Good education facilities
may not guarantee good outputs from an education system, but poor facilities
certainly affect the quality of output from an education system (Mohamed & Lashine
2003). More specifically, learning facilities may have a positive impact on student
engagement, student-faculty engagement, and accounting-competency teaching
contents or ICAG-Teaching Content.
A library is a very important resource for the teaching-learning process on all
education levels. Teachers, students, administrators, counsellors, and other parties
use the library as a resource for information to support their work. Moreover, the
salient role of a library is providing information to its users, a library also has other
important roles in an education setting, i.e. practical, cultural, social, and intellectual
roles (Marchionini & Maurer 1995). More specifically, a library also provides useful
academic experience to students. There is a correlation between the library
experience of undergraduate students with the selection of educationally purposeful
activities (Kuh & Gonyea 2003). Moreover, they also contended that use of the
library could increase student engagement in academic challenge that needs high-
order thinking.
Internet and computers change the behaviour of students and lecturers both
inside and outside classrooms. These technologies buttress educational processes.
51
The presence of internet and computer technologies in higher education is
compulsory. The role of computer technology in accounting education is critical, as
computer technology enhances the accounting learning processes. More importantly,
the use of technology also improves student achievement and engagement (Chen,
Lambert & Guidry 2010). Boyce cited in Herring III and Bryans (2001) identified
four advantages of computer technology for assisting teaching and learning in
accounting i.e. more efficient and productive learning, more expansion of topic and
subject, more effective learning, and more contribution to students’ skills. Likewise,
Khan (2009) arrived at the same conclusion that computers help students in
enhancing their learning and interaction with both fellow students and instructors.
Besides enhancing the teaching and learning process, the use of the internet and
computer technologies could improve students’ skills that are required by working
environments. More pointedly, Mohamed & Lashine (2003) found that the use of
technology for teaching accounting becomes necessary, since accountants should
master the use of computer technology.
Most accounting programs in Indonesian universities have special rooms for
an accounting laboratory. Students learn and develop their accounting skills in this
accounting laboratory. Internet and computer technology not only change the
educational process in a university, but also change the form of the accounting
laboratory. A traditional laboratory consists of manuals and documents for practicing
accounting process manually. More current accounting laboratory may consist of
computers and software for simulating accounting processes, therefore most of
accounting laboratory is merged with computer laboratory.
52
By using computer laboratory and standard-practice sets, students can
simulate accounting with accounting software such as MYOB. The objective of
simulation is to bridge students’ competencies with real-world environments.
Accounting-practice sets are still intensively used by Indonesian universities, even
though these practice sets are subject to criticism due to relatively sterile in nature
and some issues about the “black market” of the best solution (Knechel 1989). The
impact of accounting simulation on student competencies is very important to build
students’ attitude and perception (Jack, Smith & Clay. Jr 1986), to improve students’
critical thinking (Springer & Borthick 2004), and to sharpen students’ ability to find
creative solutions to managerial problems (Wynder 2004).
As previously mentioned, learning facilities in terms of internet and computer
technology could make the teaching-learning processes easier and more productive.
Therefore, this technology could lead to greater engagement for both students and
teachers (Chen, Lambert & Guidry 2010; Heiberger & Harper 2008).
Besides the above learning facilities, class size is also important in
determining the quality of teaching and learning. Logically, small classes enable
lecturers and students to interact and the lecturer could provide necessary facilitation
to every individual student. In other words, small classes allow productive interaction
between lecturers and students and among students themselves. Big classes, in
contrast, limit student ability to interact with lecturers and other students. Therefore,
class size has an effect on student engagement and student-faculty engagement.
Cotten and Wilson (2006) emphasised that educational institutions have to provide
physical space ... such as smaller class size ... to create substantive engagement
between student and teachers.
53
In relation to class size and student achievements, almost all academics are in
favour of the proposition that class size correlates negatively with students’
achievements. In smaller classes, all types of students can learn better than in larger
classes (Konstantopoulos 2007). Therefore, in small classes students scored
significantly higher on their final exams than did students in large classes (Murdoch
& Guy 2002). Class size correlates negatively with students’ grades (Johnson 2010;
Kokkelenberg, Dillon & Christy 2008). Other research found that class size had a
negative logarithmic relationship to grades (Dillon & Kokkelenberg 2002). In
addition, according to the visibility principle, students in smaller classes will highly
engage in learning (Finn, Pannozzo & Achilles 2003). This study uses Comfort of
Class Size as a proxy of class size. In view of this, if a student feels comfortable with
the class size, he or she is more likely to have more engagement and greater
achievements. Therefore, the study concludes that Comfort of Class Size correlates
positively with student engagement and student achievements.
Most lecturers perceive that larger classes require more effort to handle than
smaller classes. Finn et al. (2003) propositioned that smaller classes affect the
teachers’ morale and enjoyment of teaching, which in turn affects students’
engagement. Nevertheless, some teaching techniques commonly used in smaller
classes are considered useful in very large classes to engage students (Exeter et al.
2010). In view of the above, Comfort of Class Size is beneficial for both students and
lecturers and is included in this study.
54
2.5 Education Process
Education process is the interaction of inputs inside a system’s boundary to
transform inputs (students) into outputs (graduates). Even though Deming (1995)
contends that System Theory could be applied to the education sector, the theory
does not mention any proxy for measuring an education process. There are some
potential proxies to measure the process such as approach to learning developed by
Biggs et al. (2001), Involvement Theory developed by Astin (1987, 1999), and the
Seven Principles for Good Practice in Undergraduate Education (Chickering &
Gamson 1987, 1999).
In relation to approach to learning, Biggs et al. (2001) developed 20 questions
to measure students’ approach to learning. Approach to learning is classified into
four subscales i.e. Deep Motive, Deep Strategy, Surface Motive, and Surface
Strategy. The scope of this approach is very specific and only includes the
psychological aspect.
Student involvement or student engagement, on the other hand, includes both
physical and psychological aspects. Student involvement refers to the amount of
physical and psychological energy that the student devotes to the academic
experience (Astin 1987, 1999). In comparison, Chickering and Gamson (1987, 1999)
proposed seven principles for good practices in undergraduate education. The
principles are in line with student engagement developed by the National Survey of
Student Engagement (NSSE). In relation to student engagement, Kuh (2009)
emphasised that student engagement represents constructs such as quality of effort
and involvement in productive learning activities. Student involvement or student
engagement is the physical and psychological efforts of learning in higher education.
55
Moreover, student engagement is an organising construct for institutional
assessment, accountability, and improvement efforts (Kuh 2009). Therefore, student
involvement or student engagement could be an accurate proxy to measure education
process in higher education. For more detailed discussions, the following section
discusses about Involvement Theory.
2.5.1 Involvement Theory Student involvement is a very simple theory that every administrator, researcher,
lecturer, parent, student, and ordinary people can understand. Students learn by
becoming involved (Astin 1987, 1999). The theory provides more practical definition
about student involvement, the amount of physical and psychological energy that the
student devotes to the academic experience (Astin 1987, 1999). The theory also
implies that a student with high involvement will have more contact or more
commitment to university experience or university environment. In contrast, a
student with low involvement will tend to have low contact or low commitment with
university experience or the environment.
Student involvement in a university’s academic and non-academic
experiences can be both quantitative and qualitative. In term of quantitative, student
involvement can be measured by how much time a student spends to gain experience
in the university. On the other hand, the qualitative involvement can be measured
using the intensity or the immersion of a student in a university’s academic and non-
academic experience. In other words, the quality and quantity of student engagement
in academic and non-academic activities in a university determines the quality of
university outputs, in this case university graduates. Therefore, student development
56
is closely related to students’ involvement with their friends, academics, and
academic programs (Astinas cited in Norwani 2005).
In relation to student motivation, Involvement Theory contends that student
motivation could play an important role in determining student involvement (Astin
1999). It also implies that there is a positive correlation between student motivation
and student involvement. The fundamental difference between student motivation
and student involvement is that student involvement emphasises what the individual
does, how she or he behaves (Astin 1999). In other words, student involvement is not
merely how students think and feel but also what students act or respond to the
academic and non-academic experience in a university.
The Involvement Theory includes five basic postulates. Astin (1987, 1999)
explained briefly about the postulates as follows: (1) involvement refers to the
investment of physical and psychological energy in various “objects”; (2) regardless
of its object, involvement occurs along a continuum; (3) involvement has both
quantitative and qualitative features; (4) the amount of student learning and personal
development associated with any educational program is directly proportional to the
quality and quantity of student involvement in that program; (5) the effectiveness of
any educational policy or practice is directly related to the capacity of that policy or
practice to increase student involvement.
There are many degrees of student involvement from very general to very
specific. General involvement might include engagement in academic and non-
academic activities in a university. An example of narrower student involvement
would be to engage in a cost accounting course. Student involvement in completing
an assignment on advanced accounting is also one of example of very specific
57
student involvement. The scope of involvement depends on the “object” in which the
student engages.
Every student has a different degree of involvement in a certain “object”. For
example, student A has more involvement in cost accounting course than does
student B. Conversely, student B tends to have more involvement in advanced
accounting course than does student A. Furthermore, Astin (1987, p. 136) explained
that different students manifest different degrees of involvement in a given object,
and the same student manifest different degrees of involvement in different objects at
different times.
Involvement can be measured both quantitatively and qualitatively. The time
that a student spends on study every day is one example of quantitative involvement.
A student could study four hours a day, but she or he only opens the books and
yawns. It means that this student is not studying intensively. This student spends high
number of hours studying, but the quality of involvement is relatively low.
Therefore, involvement also uses qualitative features to measure intensity of student
involvement. Ideally, involvement should be both quantitative and qualitative. The
constraint for ideal involvement is students’ time, since students have other
commitments other than academic or non-academic activities in their universities.
The last two postulates relate to the university administrators’ responsibility.
The roles of university administrators are very critical, since they have to provide
educational programs enabling students to learn and develop through student
involvement. The availability of good learning programs is not enough, because
administrators also should provide policies to ensure all students engage in programs.
In other words, administrators have to provide good programs for students and
58
strongly encourage them to participate in those programs actively. Designing policies
and programs that attract student are other arduous issues faced by administrators.
Friedlander and MacDougall (1992) found that the challenge faced by community
colleges is to design policies and practices that will encourage students to invest their
time and effort in desired learning activities.
Enhancing student involvement is beneficial for both universities and
students, since student involvement could improve student learning and curb student
drop-out rate. Astin (1987, 1999) explained that students joining social fraternities or
sororities or participating in extracurricular activities are less likely to drop out.
Student involvement leads to student development and student retention. Likewise,
Friedlander and MacDougall (1992) also concluded that there is a strong relationship
between student involvement and achievement, persistence, and satisfaction.
Relating to student involvement, Astin (1987, 1999) also found six interesting
results on the effect of specific student involvement. First, students living on campus
or dormitory have more advantages than students living off campus. Moreover, Astin
(1987, 1999) contended that on campus students obtained more interest in art,
liberalism, and interpersonal self-esteem, since they have more opportunities to have
contacts with faculty members, participate in university activities, and have more
contact with peers. Other research findings show that residential hall community has
a different effect on male and female achievement. A same-sex building influence
male student achievement, while a quiet house environment influences female
achievement (Yongyi et al. 2004). Unfortunately, living on campus also has a
negative effect on students’ behaviour, students tend to be less religious and more
hedonistic (Astin 1987, 1999).
59
Second, students who participate in honours programs also have more
interpersonal self-esteem, intellectual self esteem, artistic interest and more
satisfaction with the quality of the science program, closeness to the faculty
members, and quality of instruction (Astin 1987, 1999). Moreover, Astin also
contended that students participating in this program tend to be dissatisfied with their
friendships.
Research using a longitudinal model shows different results about the effect
of extracurricular activities on academic achievement. Hunt (2005) found that
participation in extracurricular activities did not improve grades and educational
expectations. He also found a more interesting conclusion that getting better grades
may lead to students participating in more extracurricular activities. In other words,
the involvement of students in extracurricular activities is not the predictor of student
achievements, but grades or student achievements would affect student participation
in extracurricular activities. Likewise, Baker (2008) contended that the amount of
time that minority students spend participating in an extracurricular activity did not
significantly affect academic performance.
Third, in relation to academic involvement, students participating in academic
activities tend to be more satisfied with college life. Moreover, in terms of
personality, these students tend to be less interested in liberalism, hedonism, arts,
religious activities, business, and tend to be isolated with their peers (Astin 1987,
1999). Other research findings also show similar result that students’ active
involvement in learning positively influences their academic achievement (Ullah &
Wilson 2007).
60
Fourth, effective student interaction with faculty members has a very positive
impact on student satisfaction in all aspects. Current research has also found that
students’ relationship with faculty members influence their academic achievements
(Ullah & Wilson 2007). In spite of difficulties in designing attractive and productive
policies and programs (Friedlander & MacDougall 1992) university administrators
should make decisions that encourage faculty members and students to interact with
each other. In relation to the Indonesian context, policy makers at state universities
are transforming their mindset and work culture, due to more autonomy for state
universities (Irianto 2007). The interaction between students and faculty members
should not only take place inside classrooms but also outside classrooms. Sandeen
(2003) shares his experience as a dean. He had very good engagement with all
students in both formal and informal situations. The effect of his engagement on
student life on campus and after graduation was positive.
Fifth, the effects of student involvement in athletic activities are similar to the
effects of academic involvement. As Astin (1987, 1999) concluded, students who
participate actively in athletic activities tend to be less interested in politics, arts,
religious, and business. Moreover, he also found other positive effects of athletic
involvement i.e. student satisfaction on the institution’s academic reputation,
academic environment, student friendship, and institutional administration. Even
though, students are satisfied with their friendship, athletic involvement tends to
isolate students from their peers. In relation to the effect of athletic involvement on
student achievement, Baker (2008) found that involvement in athletic organisations
did not affect academic performance among minority students.
61
Sixth, students who actively participated in student government tend to be
more interested in politics, hedonism, arts, and status, but they tend to be more
satisfied with their friendships, because in fact the students have to interact with
other students in the organisation of student government (Astin 1987, 1999). Current
findings provide very interesting information that political organisations are
positively related to academic performance among Black males, Latinas and Latinos
(Baker 2008). Moreover, she also found that political organisation involvement did
not affect students’ achievement among Black female students.
The above findings are research conclusions based on an American university
setting that in some respects have different situation from the context of Indonesian
universities. However, campus life in Indonesian universities is almost similar to
campus life in western universities. All Indonesian universities and colleges have
student organisations such as a student union, fraternities, and sororities. However,
the structure of student organisations varies from one university to another.
For a clearer picture about the context of student organisations and student
residence, the following are an example of student government and student
organisations in a particular university. Semarang State University
(http://simawa.unnes.ac.id) has student government with the following bodies.
University level: University Student Congress (KKMU), University Students’
Representative Council (DPMU), Student Consultative Assembly (MPM KM),
Senator of University Students, University Student Executive Board (BEMU), and
Student Activity Units (UKM). UKM consists of six groups of activities i.e.
Academic, Religious and Welfare, Hobbies and Interests, Technology, Sports, and
Community Service. Each unit has many sub-groups of student activities. On the
62
faculty level, there are three bodies i.e. Faculty Student Congress (KMF), Faculty
Students’ Representative Council (DPMF), and Faculty Student Executive Board
(BEMF). Lastly, on department level there are two bodies i.e. Student Family (KMJ)
and student association (HIMA).
As previously discussed, students living on campus have more advantage
than students living off campus. Most Indonesian students stay in rumah pondokan
(lodging house) and rumah kos (boarding house) located next to the university
campus. These types of housing are owned and managed by the community living
around the university. Pontoh and Ardjo (2007) also reported that the student
housings were dominated by pondokan and rumah kos. Students living in pondokan
and rumah kos are considered as living on campus, since the distance between these
housings and campus is not far by either walking or riding a motorcycle.
Organisations and residence of Indonesian students are not so different from
American university students’; therefore Involvement Theory may be applicable in
the context of Indonesian universities.
The relationships between Involvement Theory and other higher-education
theories-- the Subject-matter Theory (SMT), the Resource Theory, and Rendon’s
Validation Theory—are complementary. The subject matter theory posits that
learning outcomes depend on students’ exposure to subject matter. The words
“exposure” and “involvement” almost have the same meaning. Online Merriam
Webster Dictionary (http://www.merriam-webster.com/) lists the closest meaning of
“exposures” as “the condition of being present to view or made known”. In contrast,
the dictionary also shows the meaning of involvement as “to engage as participant, to
oblige to take part”. A little difference is that “exposure” implies less active students
63
than “involvement”. In view of this, Astin (1987, 1999) presumed that the weakness
of subject-matter theory is putting students on a passive role in the learning process.
Resource Theory implies that a university should provide complete resources
to make sure students can study properly by optimising their capacity to utilise
resources provided. If these resources are adequately available in a university,
students can learn and develop. Moreover, Astin (1987, 1999) concluded that
Resource Theory has two limitations i.e. high quality of human resources are very
limited in nature and the theory tends to pay more attention to the accumulation of
resources than utilise available resources optimally. Resource Theory views the
process of learning and development as a “black box” meaning that teaching learning
occurs automatically when all necessary resources are adequately available in a
university. Therefore, Involvement Theory could be an appropriate link between
resources and development or learning outcomes. Student involvement could be an
intervening or mediating variable between inputs (resources) and outputs.
Involvement Theory could be clearer explanations about the “black box”.
Validation Theory developed by Rendon (2002) posits that institutional
agents not students, are expected to take the first step to promote involvement and to
affirm students as knowers and valuable members of the college learning
community. According to this theory, Involvement Theory is not completely
applicable for students coming from lower class backgrounds or non-traditional
students, since non-traditional students do not have enough information about
university or college life. Therefore, university administrators, faculty members, and
counsellors should take initial action to reach and encourage new students to engage
in academic and non-academic activities.
64
Certainly, Involvement Theory also suggests administrators, faculty
members, counsellors, and personnel workers pay more attention to the passive,
reticent, or unprepared students (Astin 1987). In relation to this issue, Involvement
Theory has not yet developed more detailed actions and strategies that
administrators, faculty members, counsellor should do to activate uninvolved
students. Validation Theory provides some examples to analyse both academic and
interpersonal validation inside classrooms. Involvement Theory, on the other hand,
does not mention any strategy that should be taken to involve passive students in the
process of teaching and learning.
Involvement Theory is in line with I-E-O model contended by Astin (1993a).
The task of university administrators is to provide the necessary environment for
students to learn and develop. In addition, university management should also
provide some policies to ensure students will engage in a university’s environments
properly.
Once Involvement Theory was declared, many scholars tried to design more
accurate proxies to measure student involvement. One of the proxies that has broadly
used by universities is student engagement. In relation to student involvement and
student engagement, some scholars contended that there is no difference in nature.
Astin (1987) contended that involvement is an active term. Moreover, he also listed
verbs for involvement such as attach oneself to, commit oneself to, engage in, and so
forth. Likewise, Delvin et al. (2007) also defined engagement as students’
involvement with activities and conditions likely to generate high-quality learning. In
addition, concise definition was contended by ERS (1998), student engagement
means active involvement in, and commitment to learning process. Lastly,
65
Solomonides (2009) from the Learning and Teaching Centre, Macquarie University
also explained that student engagement can be thought of as the involvement of
students with their study, university and the activities that support learning. The
above definitions substantiate that student involvement and student engagement is
the same concept.
2.5.2 Student Engagement The previous section describes Involvement Theory that becomes one of theoretical
foundations for student engagement questionnaires. In addition, the aforementioned
section also describes the similarity of student involvement and student engagement.
Student involvement was developed by Astin (1987, 1999) while student engagement
was developed by Indiana University Center for Postsecondary Research and
Planning. Through the work of the National Survey on Student Engagement (NSSE),
student engagement questionnaires have been broadly used to measure the education
processes in higher education and successfully implemented in some countries such
as AUSSE (Australia) and NSSE (USA). Some Canadian and New Zealand
universities also used the questionnaire for improving teaching and learning as well
as for benchmarking with other universities in neighbouring countries.
Like student involvement, student engagement also has many levels starting
from the micro level of student engagement, e.g. reading task engagement, student
course engagement, and engagement in undergraduate education. For example,
Handelsman et al. (2005) have developed a questionnaire for measuring student
course engagement with a very short version, consisting of 23 questions. This study
uses student engagement in undergraduate education as a proxy for the transforming
66
process (teaching-learning process) in a university. Since the process of teaching and
learning includes lecturers and students, consequently there are two types of
engagement, engagement based on students’ perspective and student-faculty
engagement reported by lecturers.
In relation to student engagement, Chickering and Gamson (1999) proposed
more practical approaches, seven principles for good practice in undergraduate
education. These principles are students-faculty contact, cooperation among students,
active learning, prompt feedback, time on task, high expectation, and respect for
diverse talent and way of learning. These principles have been implemented
successfully in two courses at management/MIS Department, University of west
Florida. Page and Mukherejee (2000) concluded that the implementation of the seven
principles reduced student apathy towards academics, increased of student curiosity
about contents, improving cooperation among students, strengthening student
involvement among weaker students, improving attentiveness, and increasing student
performance.
Even though some academics and research institutions used different factors
for measuring student engagement, basically they use the same factors as in the
seven principles. NSSE employs five factors of student engagement namely level of
academic challenge, active and collaborative learning, student-faculty interaction,
enriching educational experience, and supportive campus environment (Kuh 2009).
Items of NSSE questionnaires have been widely tested in American Higher
Education with good performances (Kuh 2006).
In relation to the performance of NSEE questionnaires, LaNasa et al. (2009)
analysed the validity and reliability of NSEE questionnaire. They reported that the
67
original questionnaires have lower validity and reliability by showing factor loadings
ranging from 0.11 to 0.95 and Cronbach alpha reliability of scale range from 0.590 to
0.787 in each latent variable. To improve questionnaire performance LaNasa et al.
(2009) grouped questionnaire items into eight factors i.e. learning strategies,
academic integration, institutional emphasis, co-curricular activity, diverse
interaction, effort, overall relationship, and workload. The performance of the
questionnaire improved after being grouped by factor loadings ranging from 0.4 to
0.9 and reliability of scale ranges from 0.527 to 0.888. These results imply that lower
factor loadings and reliability of the scale was due to item grouping.
The Australasian Survey of Student Engagement (AUSSE) is an organisation
run by Australian Council for Educational Research (ACER). The objectives of this
organisation are to help stimulate evidence-focused conversations about student
engagement in university study and provide institutions with information that they
can use to monitor and enhance the quality of education they provide to their
students (http://ausse.acer.edu.au). This organisation adapted student engagement
and student-faculty engagement questionnaires developed by NSSE to ensure
questionnaires are in line with Australian university context. Therefore, the number
of factors in AUSSE questionnaire is also different. AUSSE (2010b) employs more
factors in their questionnaire i.e. academic challenge, active learning, student and
staff interactions, enriching educational experience, supportive learning environment,
and work integrated learning.
As previously discussed, there are some proxies for measuring teaching and
learning processes or transforming processes in a university i.e. seven principles for
good practice in undergraduate education (Chickering & Gamson 1987, 1999) and
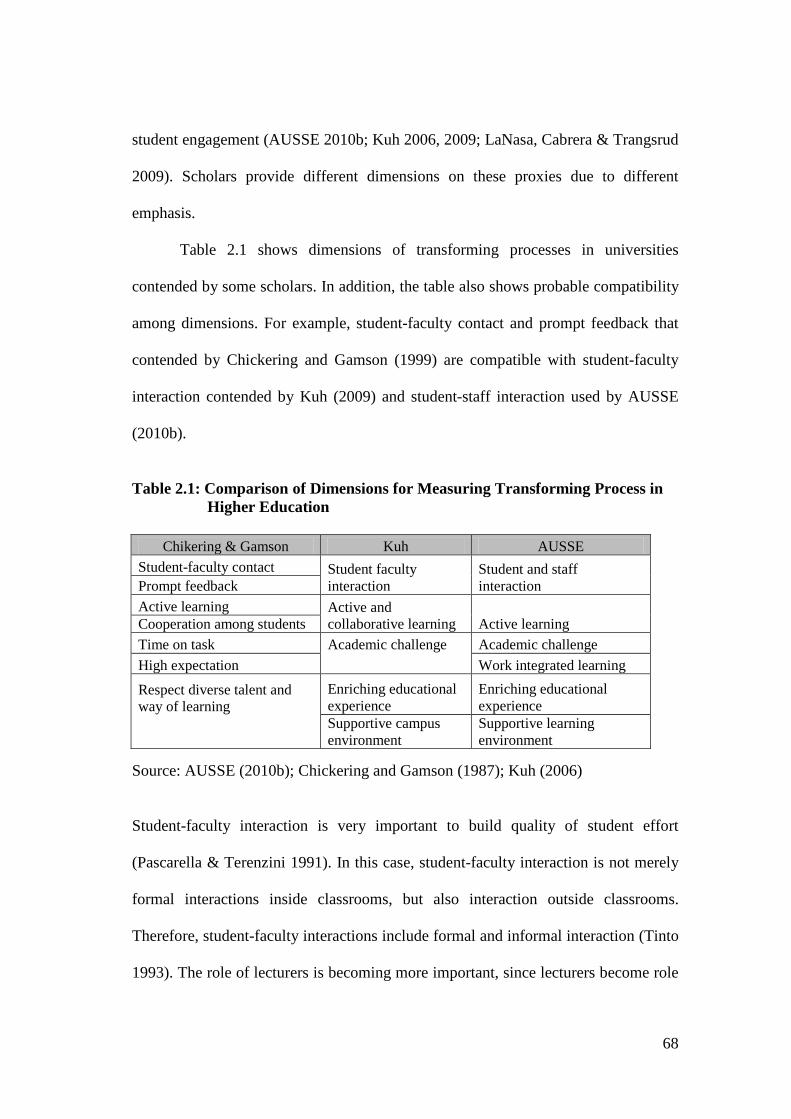
68
student engagement (AUSSE 2010b; Kuh 2006, 2009; LaNasa, Cabrera & Trangsrud
2009). Scholars provide different dimensions on these proxies due to different
emphasis.
Table 2.1 shows dimensions of transforming processes in universities
contended by some scholars. In addition, the table also shows probable compatibility
among dimensions. For example, student-faculty contact and prompt feedback that
contended by Chickering and Gamson (1999) are compatible with student-faculty
interaction contended by Kuh (2009) and student-staff interaction used by AUSSE
(2010b).
Table 2.1: Comparison of Dimensions for Measuring Transforming Process in
Higher Education
Chikering & Gamson Kuh AUSSE Student-faculty contact Student faculty
interaction Student and staff interaction Prompt feedback
Active learning Active and collaborative learning Active learning Cooperation among students
Time on task Academic challenge Academic challenge High expectation
Work integrated learning
Respect diverse talent and way of learning
Enriching educational experience
Enriching educational experience
Supportive campus environment
Supportive learning environment
Source: AUSSE (2010b); Chickering and Gamson (1987); Kuh (2006)
Student-faculty interaction is very important to build quality of student effort
(Pascarella & Terenzini 1991). In this case, student-faculty interaction is not merely
formal interactions inside classrooms, but also interaction outside classrooms.
Therefore, student-faculty interactions include formal and informal interaction (Tinto
1993). The role of lecturers is becoming more important, since lecturers become role
69
models, mentors, and guides for continuous, life-long learning (Kuh 2009). Likewise,
Chickering and Gamson (1987) also contended that student-faculty contact is very
important, since it can help students improve their motivation and involvement. They
also contended that faculty members have important roles in enhancing students’
intellectual commitment and encouraging them to think about their own values and
future plans.
Some scholars have conducted research to find the influence of student-
faculty contact on students’ achievements or development. Interaction with agents of
socialisation such as faculty impacts on student learning and cognitive development
(Tinto 1993). More specifically, teacher behaviours significantly predict students’
mid-term test and students’ perceptions of scholastic competence (Woodside, Wong
& Wiest 1999). Relationships between students and faculty are not only associated
with student academic outcome, but also related to psychological outcome
(Komarraju, Musulkin & Bhattacharya 2010). The above findings show that faculty
contact with their students has positive impacts on students’ outcomes. In relation to
prompt feedback, Chickering and Gamson (1987, 1999) posited that students need
appropriate and frequent feedback from lecturers to ensure they can assess their
knowledge and competence. Feedback also plays very important roles in the process
of teaching and learning, since feedback could function as a tool for motivating and
evaluating students (Kartal 2010).
Learning is not merely listening and watching a lecture, but learning should
also include more active involvement of students both psychologically and
physically. Academic challenge and high expectation relate to student learning and
collegiate quality (Kuh 2009). In view of this, academic and social integration
70
influence outcomes in term of departure decision (Pascarella & Terenzini 1991). In
addition, Chickering and Gamson (1987) also concluded that students must talk
about what they learn, write about it, relate it to past experience, and apply it into
their daily lives. They also emphasise that active learning is a meaningful process. It
means that students should understand what they are learning both practically and
theoretically. Therefore, students learn more when they are intensely involved in
their education and asked to think about what they are learning in different settings
(Kuh 2009).
Cooperative learning is one of the teaching strategies that has been widely
implemented in western countries. The strategy consists of creating small groups of
students to learn together and help each other in solving problems to achieve learning
objectives. By using cooperative learning, students could learn to solve problems by
asking or by providing some help to other members of the group. Learning is
enhanced when it is more like a team effort (Chickering & Gamson 1987) and
students are collaborating with others in solving problems or mastering difficult
material that they will encounter in daily life (Kuh 2009).
Some research has been conducted to understand the influence of cooperative
learning on student achievements, even though, the results were quite diverse. Tsay
and Brady (2010) found significant and positive correlation between involvement in
cooperative learning with academic performance. Moreover, cooperative learning
enhances students’ interpersonal and communication skills among undergraduate
student majoring in accounting (Ballantine & McCourt Larres 2009). They also
revealed that cooperative learning benefits students in two respects i.e. immediate
academic context and students’ long term career development. On the other hand,
71
Krause and Stark (2010) found that students in the individual conditions showed
greater progress than those in cooperative condition. These diverse findings could be
caused by the nature of cooperative learning that it would not provide automatic
results unless students know how to help each other (Chan 2010).
Academic challenge and high expectation relate to student learning and
collegiate quality (Kuh 2009). Students will be motivated, if they get appropriate
academic challenges or academic expectation from university’s academic
environments. Moreover, Chickering and Gamson (1987, 1999) hypothesised that
expecting students to perform well becomes self-fulfilling prophecy when teacher
and institutions hold high expectations of themselves and make extra efforts. In
summary, high expectation and academic challenge could motivate students to put
more efforts to ensure they will be able to fulfil expectation and challenge. In relation
to time on task, Astin (1987, 1999) explained that students have limited time to be
involved in university’s activities. Universities should use students’ time optimally,
since learning could be determined by the time and energy that students spend in
university activities. Therefore, students needs help in learning effective time
management (Chickering & Gamson 1987).
Every student brings his own talent, motivation, and other uniqueness to learn
in a university. Students need the opportunity to show their talents and learn in ways
that work for them (Chickering & Gamson 1987). A university should provide
facilitation to all types of students to ensure they can achieve their goals. Supportive
campus environment leads to students’ satisfaction, commitment, success by
cultivating positive working and social relations among different groups on campus
(Kuh 2009). The impacts of university environment on student achievements and
72
development are significant. Students who participate in a certain organisation tend
to gain more achievements or development than students who do not participate
(Astin 1987, 1999).
In view of the above, all dimensions of student engagement have been briefly
discussed. The influence of each dimension on student achievements and
development is quite obvious. Owing to limited research providing a clear picture
about the impact of a particular dimension on student achievements and
development, the study concluded that dimensions of student engagement—
academic challenge, active and collaborative learning, student-faculty interaction,
enriching educational experiences, and supportive campus environment--has a strong
theoretical foundation. The following reviews discuss the roles of student
engagement as a proxy for transforming processes in a university.
The effectiveness of student engagement in predicting students’ learning
outcomes is quite obvious. By citing some research results, Harper and Quaye (2008)
arrived at a conclusion that educationally purposeful engagement produces gains,
benefits, and outcomes. In addition, they also identified nine student outcomes
resulting from student engagement such as cognitive and intellectual skill, practical
competence skill, moral and ethical development, grade point average, and so forth.
The above findings are in line with the proposition that student engagement is
considered as an important predictor of student achievements (Handelsman et al.
2005). Likewise, Institutional Planning and Analysis, University of Victoria, Canada
(2006) arrived at the same results that student engagement is a crucial predictor of
student learning and success. This institution also concluded that student engagement
can be a good proxy for overall educational quality.
73
In view of the above, the following findings show the extent of student
engagement impacting on outputs or outcomes. The influence of student engagement
on student achievements varies among universities. Carini, Kuh, and Klein (2006)
concluded that many measures of student engagement have positive correlation with
desirable learning as critical thinking and Grade Point Average (GPA), even though
correlations were quite weak. Using bi-variates correlation, they found that student
engagement measures—academic challenge, active and collaborative learning,
student-faculty interaction, enriching educational experience, and supportive campus
climate—have positive and significant correlation with students’ GPA, although the
correlation coefficients ranges from 0.06 to 0.13 (at least with p<0.05). In addition,
the study also shows that by employing partial correlation all student engagement
measures have significant correlations with GPA, except the measure of enriching
educational experience. Likewise, the correlation between student engagement
measures with other standard test i.e. RAND test and Graduate Record Examination
(GRE) also tend to be weak, and some measures have insignificant correlations.
More current research conducted by Gordon, Ludlum, and Hoey (2008)
found that the National Survey of Student Engagement (NSSE) benchmarks have
minimal explanatory power on freshmen retention, GPA, pursuit of graduate
education, and employment outcome upon graduation. On the other hand, Kuh et al.
(2008) concluded that student engagement in purposeful activities correlates
positively with student grades between the first and second year of college.
In relation to the above findings, low correlation between student engagement
and learning outcomes could be engendered by at least two factors. First, the NSSE
questionnaire did not fully capture many meanings of academic challenge, therefore
74
they proposed changes to some questions (Payne et al. 2005). Learning technology
also plays an important role in strengthening student engagement (Chen, Lambert &
Guidry 2010; Heiberger & Harper 2008). Therefore, a questionnaire measuring
student engagement should be tailored to the development of this learning
technology. Second, the student engagement questionnaire should be regrouped to
gain higher factor loadings and reliability of the scales (LaNasa, Cabrera &
Trangsrud 2009).
By employing academic engagement as a proxy for teaching and learning at
University of California, Berkeley, Agronow (2008) found that correlation between
academic engagement and student achievements was 0.298. In other words,
academic engagement determined student GPA by 8.9%. Coefficient of
determination almost doubled when he put students’ critical thinking and
communication as dependent variables, and the influence of academic engagement to
dependent variables was approximately 17%. Other findings also show a different
view on the effectiveness of student engagement in predicting learning outcomes.
Strayhorn (2008) found that student engagement in educationally purposefully
activities correlates positively with student’s personal/social learning. He also found
that peer interactions, faculty-student interactions, and active learning experiences
contribute 24% to personal and social learning outcomes. Chen, Lambert and Guidry
(2010) provide a different perspective about student engagement and technological
intervention. They correlated the use of learning technology and student engagement
in the same model to predict learning outcomes among online learners. They found
that the relationships between the use of learning technology and student engagement
with learning outcomes were positive and significant.
75
The theory of validation contended by Rendon (2002) may corroborate the
above findings. According to this theory, student engagement or student involvement
cannot be fully applicable to students from lower middle class, since this type of
student tends to be passive. Therefore, the theory suggests that faculty members,
administrators, and counsellors should take initiative action to involve them in
academic activities.
Despite its shortcomings, student engagement is still worthwhile as a
construct for measuring the process of teaching and learning in a university. This
construct still has enough power to predict educational output such as student
achievements and student skills. Therefore, student engagement, a proxy for the
accounting learning process, has correlation with international competency of
accounting graduates and student achievements in Indonesian universities.
This study employs student engagement and student-faculty engagement to
measure transforming processes or teaching-learning processes in Indonesian
universities. These questionnaires were adapted from Australasian Survey of Student
Engagement (AUSSE) (2010b). Originally, this questionnaire was adapted by
AUSSE from questionnaires developed by NSSE (2009). The study needs to adapt
these questionnaires to ensure all items of the questionnaire correspond with the
context of Indonesian university. The questionnaire dimensions of student
engagement as well as student-faculty engagement used by this study are academic
challenge, student-faculty interaction, active and collaborative learning, experiences
with diversity, and supportive campus environment. Chapter 4, Research
Methodology, provides more detailed descriptions about the questionnaires.
76
2.5.3 Student-Faculty Engagement As previously mentioned, students and teachers are very important inputs in the
education process at a university, since the interactions between these two inputs
triggers transforming processes or teaching and learning processes. Hattie (2003)
contended that the influence of a teacher on students’ achievements is enormous. He
estimated 30% of the variance on student achievement could be explained by the role
of the teacher. In this case, student-faculty engagement is the roles of lecturers to
make students maintain time on task and improve their intellectual attachment in the
process of learning. For a clearer picture, Kennedy (1998) defines lecturer
engagement as a parallel process in which the lecturer is consciously aware of his or
her role in the learning process. In addition, she also explains that the engaged
lecturer will be aware of, and responding to student experiences in the classroom. In
terms of lecturer engagement, the followings research describes the influence of
teachers on student engagement or student learning.
By employing multi-level analysis and using NSSE data sets to understand
the roles of lecturer on student learning and engagement, Umbah and Wawrzynski
(2005) found that lecturer behaviours and attitude affect students. They also surmised
that lecturers play the most dominant role in student learning. It is quite clear that
student engagement has a positive influence on student achievements and
development. By utilising I-E-O model developed by Astin (1993a) as an
underpinning theory and employing items from the College Student Experience
Questionnaire (CSEQ) as a proxy for environment, Strayhorn (2008) found that
faculty-student interaction was positively-correlated with students’ personal/social
learning (0.36 with p<0.01). Other findings provide a different picture. Kuh and
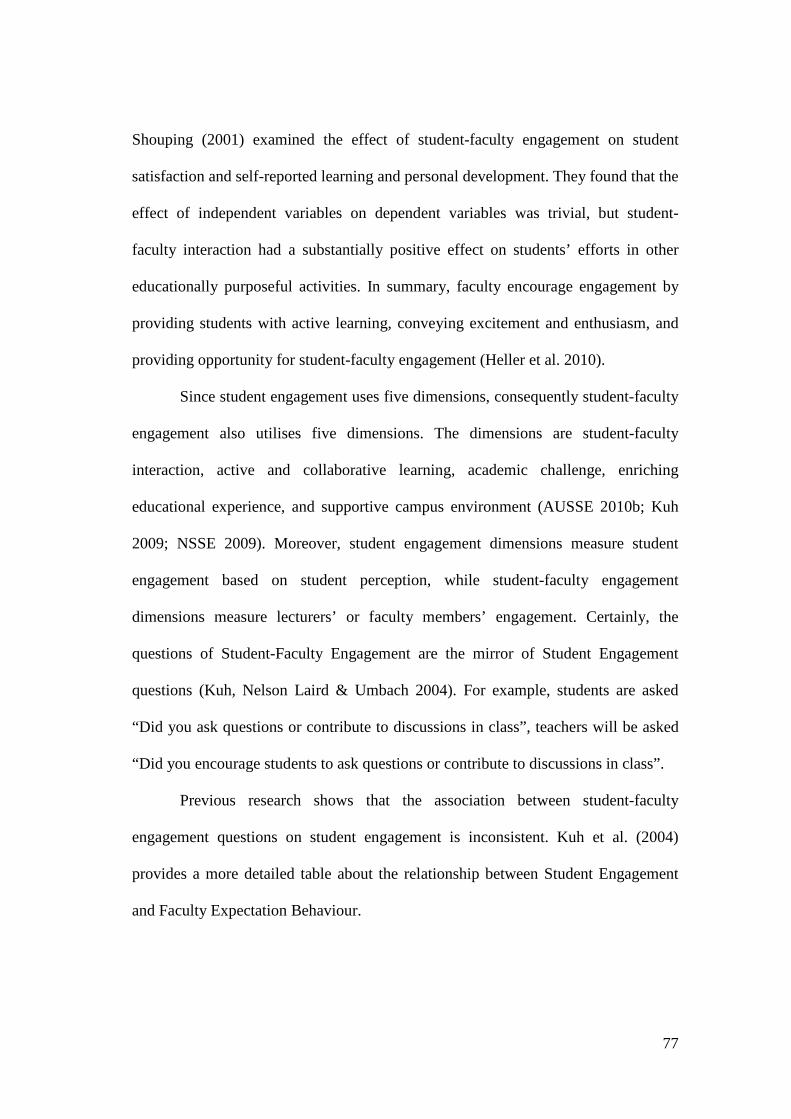
77
Shouping (2001) examined the effect of student-faculty engagement on student
satisfaction and self-reported learning and personal development. They found that the
effect of independent variables on dependent variables was trivial, but student-
faculty interaction had a substantially positive effect on students’ efforts in other
educationally purposeful activities. In summary, faculty encourage engagement by
providing students with active learning, conveying excitement and enthusiasm, and
providing opportunity for student-faculty engagement (Heller et al. 2010).
Since student engagement uses five dimensions, consequently student-faculty
engagement also utilises five dimensions. The dimensions are student-faculty
interaction, active and collaborative learning, academic challenge, enriching
educational experience, and supportive campus environment (AUSSE 2010b; Kuh
2009; NSSE 2009). Moreover, student engagement dimensions measure student
engagement based on student perception, while student-faculty engagement
dimensions measure lecturers’ or faculty members’ engagement. Certainly, the
questions of Student-Faculty Engagement are the mirror of Student Engagement
questions (Kuh, Nelson Laird & Umbach 2004). For example, students are asked
“Did you ask questions or contribute to discussions in class”, teachers will be asked
“Did you encourage students to ask questions or contribute to discussions in class”.
Previous research shows that the association between student-faculty
engagement questions on student engagement is inconsistent. Kuh et al. (2004)
provides a more detailed table about the relationship between Student Engagement
and Faculty Expectation Behaviour.
78
Table 2.2: Relationship between Student Engagement and Faculty Expectation and Behaviour
At campuses Where Faculty Score Highly on
Student Scores tend to Be Higher On Academic Challenge
Active and Collaborative Learning
Diversity Experience
Student-Faculty Interaction
Emphasis on Academic Challenge
√
√
√
Active and Collaborative Practices
√
√
√
√
Emphasis on Diversity Experiences
√
√
√
Emphasis on Higher-Order Thinking
√
√
√
Importance of Enriching Educational Experience
√
√
√
Source: Kuh et al. (2004) Table 2.2 shows clear information that the relationship between student-faculty
engagement and student engagement. At campuses where faculty score high on
emphasis on active and collaborative practices, students scores tend to be higher on
academic challenge, active and collaborative learning, diversity experience, and
student-faculty interaction. The table also shows that at campuses where faculty
score highly on the dimension of importance enriching educational experience has no
correlation with students’ diversity experience. Likewise, student-faculty interaction
has no correlation with students’ perception of academic challenge, diversity
experiences, and higher order thinking.
Student-faculty engagement (lecturer perception) positively correlated with
student engagement (student perception). The information presented by the above
table is in line with current empirical findings (Kuh & Shouping 2001; Strayhorn
2008; Umbach & Wawrzynski 2005). Therefore, the study uses student-faculty
79
engagement as a proxy for transforming processes or teaching and learning processes
in universities based on lecturers’ perspectives.
2.6 Education Output
Based on both System Theory and I-E-O model, the ultimate objective of university
education is outputs or outcomes. In comparison, Tinto’s model of Institutional
Departure (Tinto 1993) and Pascarella’s general model for assessing change
(Pascarella & Terenzini 1991) also end up with learning outcome as ultimate
objectives. There are various kinds of education outputs. In general, outputs of
education could be classified into three main domains i.e. knowledge, affective, and
psychomotor (Bloom cited in Isaacs 1996).
In relation to accounting competencies as educational outputs, there are many
standards of accounting graduate competencies. These standards are minimum
competencies that should be achieved by accounting graduates. Some organisations
such as Business, Industry and Higher Education Collaboration Council (BIHECC)
and American Institute of Certified Public Accountants (AICPA) have already
established skills and competencies of accounting graduates. Likewise, some
academic research has been conducted to uncover accounting competencies required
by accounting graduates in work places i.e. technical and non-technical skills
(Hancock et al. 2009a). In fact, there are many other more specific learning outcomes
that have been studied such as employment (Gordon, Ludlum & Hoey 2008), GPA
and critical thinking (Carini, Kuh & Klein 2006), personal/social learning,
communication and social skills (Hardern 1995; Strayhorn 2008).
80
The study focuses on two education outputs i.e. International Competencies
of Accounting Graduates (ICAG) based on AICPA core competencies and student
achievements in terms of Grade Point Average (GPA). The following section
discusses more detail about these outputs.
2.6.1 International Competencies of Accounting Graduates (ICAG) As has been noted, there are many types of university education outputs. Individual
traits, characteristics, and attributes gained by students during their presence in the
education process at their universities are examples of education output. Besides
equipping students with general knowledge, universities should also equip their
graduates with skills and knowledge that are in line with the demands of employers
to ensure graduates can work harmoniously in the real world. Competency is one of
common terms for describing traits, characteristics, and attributes of graduates. To
provide a clearer picture about competency, Johns (1995) defined competency as a
relational notion--the way in which individual attributes (knowledge, skills, attitudes)
are drawn on in performing tasks in particular work contexts. The definition clearly
implies that competencies also consist of cognitive, affective, and psychomotor
domains as contended by Bloom.
In relation to accounting graduate competencies, some academics and
organisations have already established standards. To ensure accounting graduates’
competencies are in line with employers’ expectation, Kavanagh and Drennan (2008)
enlisted graduates’ skills for entering the profession i.e. analytical/problem solving
skills, a level of business awareness, oral communication skills, ethical awareness
and professional skills, teamwork, written communication and an understanding of
81
the interdisciplinary nature of business. In relation to generic competencies, Harden
(1995) also suggested that education institutions should pay more attention to the
importance of developing personal, communications, and social skills in their
students. Lastly, to ensure accounting graduates meet global market requirements
and expectations, Mohamed and Lashine (2003) conceptualised seven areas of
accounting competencies that graduates have to possess i.e. communication skills,
computer skills, analytical skills, multi-disciplinary and inter-disciplinary skills,
knowledge of global issues, personal characteristics, and critical thinking. It is quite
clear that some items contended by academics are complementary or congruent.
Some developed countries have already established skills and competencies
of accounting graduates. The Accounting Education Change Commission (AECC)
requires that accounting education should provide students with the requisite set of
skills that future employers seek, including strong communication, quantitative
analysis, interpersonal, and intellectual skills (Reinstein & Bayou 1997). Likewise,
an Australian-base organisation, Business, Industry and Higher Education
Collaboration Council (BIHECC) (2007) also established a set of business
employability skills consisting of eight skills, namely communication skills,
teamwork skills, problem solving skills, self-management skills, planning and
organising skills, technology skills, life-long learning skills, and initiative and
enterprise skills. Current findings show that accounting graduates should master not
only accounting but also non-technical skills such as communication, teamwork,
problem solving and so forth (Hancock et al. 2009a). Moreover, they also found that
graduates working in small companies need more technical than non-technical skills
(Hancock et al. 2009a).
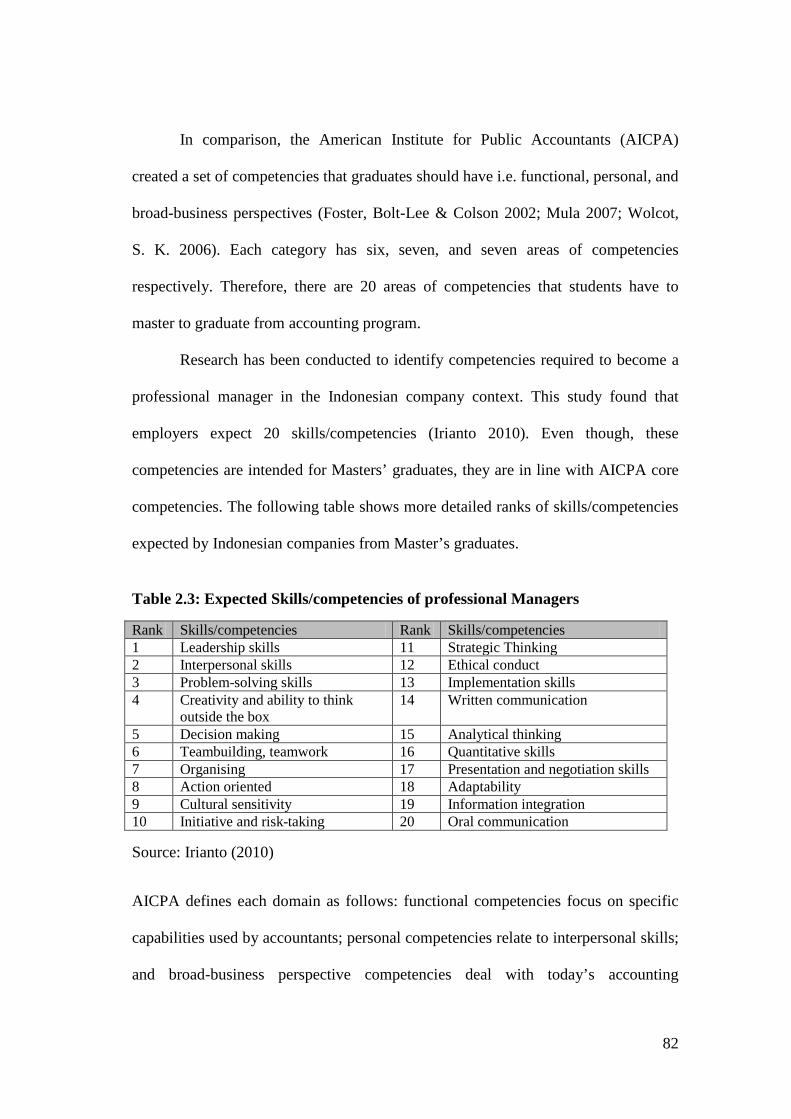
82
In comparison, the American Institute for Public Accountants (AICPA)
created a set of competencies that graduates should have i.e. functional, personal, and
broad-business perspectives (Foster, Bolt-Lee & Colson 2002; Mula 2007; Wolcot,
S. K. 2006). Each category has six, seven, and seven areas of competencies
respectively. Therefore, there are 20 areas of competencies that students have to
master to graduate from accounting program.
Research has been conducted to identify competencies required to become a
professional manager in the Indonesian company context. This study found that
employers expect 20 skills/competencies (Irianto 2010). Even though, these
competencies are intended for Masters’ graduates, they are in line with AICPA core
competencies. The following table shows more detailed ranks of skills/competencies
expected by Indonesian companies from Master’s graduates.
Table 2.3: Expected Skills/competencies of professional Managers
Rank Skills/competencies Rank Skills/competencies 1 Leadership skills 11 Strategic Thinking 2 Interpersonal skills 12 Ethical conduct 3 Problem-solving skills 13 Implementation skills 4 Creativity and ability to think
outside the box 14 Written communication
5 Decision making 15 Analytical thinking 6 Teambuilding, teamwork 16 Quantitative skills 7 Organising 17 Presentation and negotiation skills 8 Action oriented 18 Adaptability 9 Cultural sensitivity 19 Information integration 10 Initiative and risk-taking 20 Oral communication Source: Irianto (2010) AICPA defines each domain as follows: functional competencies focus on specific
capabilities used by accountants; personal competencies relate to interpersonal skills;
and broad-business perspective competencies deal with today’s accounting
83
environment (Bolt-Lee & Foster 2003). Some accounting competencies required by
the work places have been identified (Azemikhah 2006; Bonner 1999; Jayaprakash
2005; Tigelaar et al. 2004; Weil, Oyelere & Rainsbury 2004; Wu 2008).
Nevertheless, students and employers report that many important non-technical and
professional skills and attributes are not developed sufficiently in university
accounting education (Hancock et al. 2009a; Kavanagh & Drennan 2008).
Since AICPA core competencies have been broadly used to measure
accounting graduate competencies (Beard 2007; DeLaune 2004; McVay, Murphy &
Yoon 2008; Mula 2007), this study employs this three-dimension competency as
learning outputs of accounting programs in Indonesian universities. In addition, clear
indicators of each dimension have been identified making the process of designing
questionnaires more straightforward. In line with this, the study uses competency
indicators developed by Wolcot (2006) based on AICPA three-dimensions
competency. Since the indicators were developed based on the setting of American
universities, this study also take advantages of AICPA core competencies indicators
used by Mula (2007) to ensure that all indicators are applicable in the setting of
Indonesian universities.
AICPA core competencies do not focus on capability to do jobs in a certain
area, but it also requires deeper competencies, meta-competency. Brown and
McCartney (1995) define meta competency as the higher-order skills and abilities
upon which competence is based and which have to do with being able to learn,
adapt, anticipate and create. In addition, skills could be classified into two categories
i.e. soft skills and hard skills (Burns 1997). Soft skills are people’s abilities to relate
each other, while hard skills are technical and administrative procedures related to an
84
organisation’s core business (Coates 2006). Soft skills or non-technical skills play
important roles in workplaces of the future (Hancock et al. 2009a; Marsh 2012).
Some academics and institutions have already enlisted some points of soft
skills. BIHECC (2007) enlisted some soft skills such as communication skills,
teamwork skills, problem solving skills, and so forth. Moreover, Hancock (2009a)
found communication, teamwork, problem solving are important non-technical skills
in work places. Marsh (2012) enlisted the following soft skills i.e. understanding and
managing diversity, emotional intelligence, strong team skills, personal
responsibility, personal productivity, and handling difficult situation. In Indonesian
business context, soft skills are also becoming more important. Irianto (2010)
enlisted some important soft skills such as leadership, interpersonal, problem solving,
decision making, ethical conduct skills and so forth.
AICPA core competency indicators, Wolcot (2006) identified 166 indicators,
whilst Mula (2007) employed 120 indicators that are in line with the context of
Indonesian universities. Table 2.4 shows more detailed information about the number
of competency indicators in each area.
Research has identified clear lists of graduates’ accounting competencies.
Employers, however, still perceive that there are some competency gaps between
graduates’ accounting competencies with employers’ expectation (Hancock et al.
2009a; Irianto 2010; Kavanagh & Drennan 2008). Even though, lecturers embed
accounting competencies into courses by employing various techniques and
strategies such as Contextual Teaching and Learning (CTL) (Jayaprakash 2005),
Case studies (Weil, Oyelere & Rainsbury 2004), multiple teaching techniques
(Bonner 1999), the use of classroom configuration and technological tools (McVay,
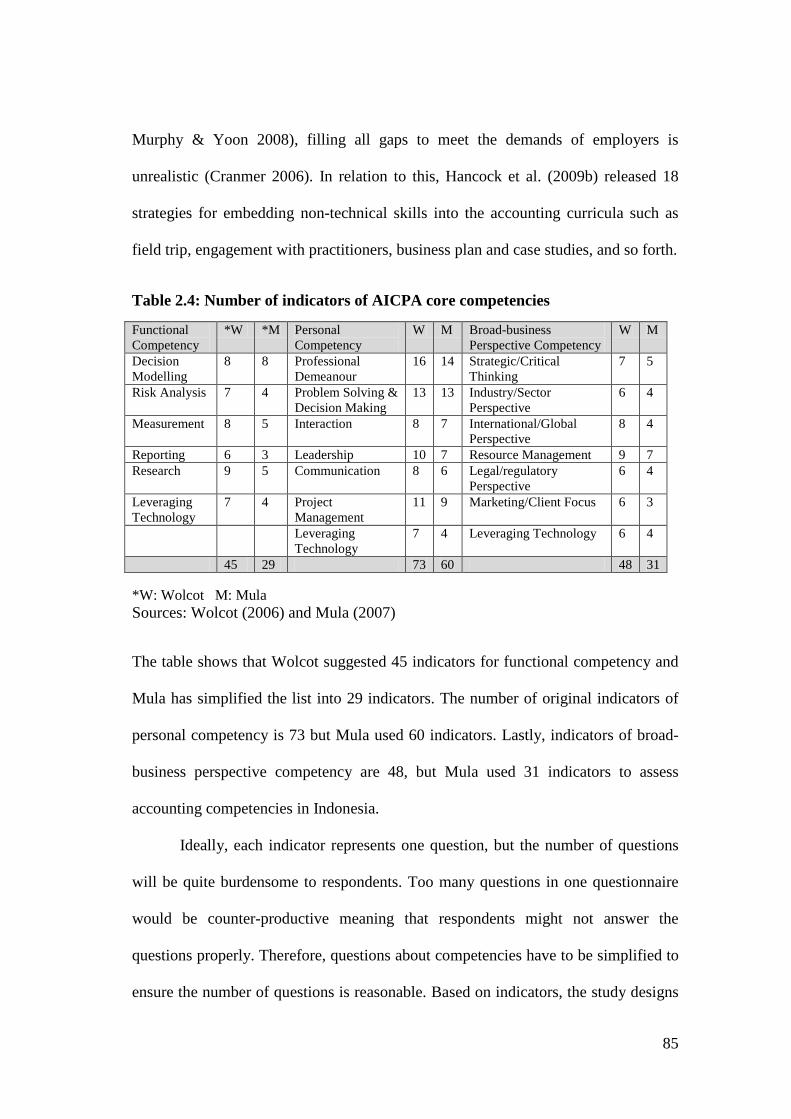
85
Murphy & Yoon 2008), filling all gaps to meet the demands of employers is
unrealistic (Cranmer 2006). In relation to this, Hancock et al. (2009b) released 18
strategies for embedding non-technical skills into the accounting curricula such as
field trip, engagement with practitioners, business plan and case studies, and so forth.
Table 2.4: Number of indicators of AICPA core competencies Functional Competency
*W *M Personal Competency
W M Broad-business Perspective Competency
W M
Decision Modelling
8 8 Professional Demeanour
16 14 Strategic/Critical Thinking
7 5
Risk Analysis 7 4 Problem Solving & Decision Making
13 13 Industry/Sector Perspective
6 4
Measurement 8 5 Interaction 8 7 International/Global Perspective
8 4
Reporting 6 3 Leadership 10 7 Resource Management 9 7 Research 9 5 Communication 8 6 Legal/regulatory
Perspective 6 4
Leveraging Technology
7 4 Project Management
11 9 Marketing/Client Focus 6 3
Leveraging Technology
7 4 Leveraging Technology 6 4
45 29 73 60 48 31 *W: Wolcot M: Mula Sources: Wolcot (2006) and Mula (2007) The table shows that Wolcot suggested 45 indicators for functional competency and
Mula has simplified the list into 29 indicators. The number of original indicators of
personal competency is 73 but Mula used 60 indicators. Lastly, indicators of broad-
business perspective competency are 48, but Mula used 31 indicators to assess
accounting competencies in Indonesia.
Ideally, each indicator represents one question, but the number of questions
will be quite burdensome to respondents. Too many questions in one questionnaire
would be counter-productive meaning that respondents might not answer the
questions properly. Therefore, questions about competencies have to be simplified to
ensure the number of questions is reasonable. Based on indicators, the study designs
86
the questionnaire to collect students’ competencies in three dimensions with 20
areas. Therefore, the study designs 20 questions based on the areas of competencies.
The techniques used to design these questions are discussed in Chapter 4. The
following section discusses student achievements as one of the education outputs. In
this case, the study employs Grade Point Average (GPA) as a proxy for students’
achievements gained while attending university education.
2.6.2 Student Achievement Learning process outputs of a university can be student achievements in terms of
numerical index. Test, assignment, and other standardised techniques of assessment
are employed to measure student achievements. In this respect, the study also
employs students’ GPA as a proxy of student achievements. All Indonesian
universities grade their students using numbers ranging from 0.00 to 100 which is
then translated into the letters A, B, C, D, and E. In addition, they employ four-scale
GPA as the Ministry of National Education enacted a decree No 232/U/2000 on
“Guidelines for the Developing Higher Education Curricula and Assessing Student
Learning Outcomes”. The decree clearly mentions in chapter 5, verse number 12,
point 3 that assessment results have to be presented in letters A, B, C, D, and E with
value of 4, 3, 2, 1, and 0 respectively.
Despite the above ministerial decree, some universities have their own
academic regulations in this regard. For example, Brawijaya University and Sam
Ratulangi University have their rules to interpret grades. These universities use
grading system ranging from A, B+, B, C+, C, D+, D, and E with the value of 4.0,
3.5, 3.0, 2.5, 2.0, 1.5, 1.0, and 0.0 respectively. University of Riau, in contrast,
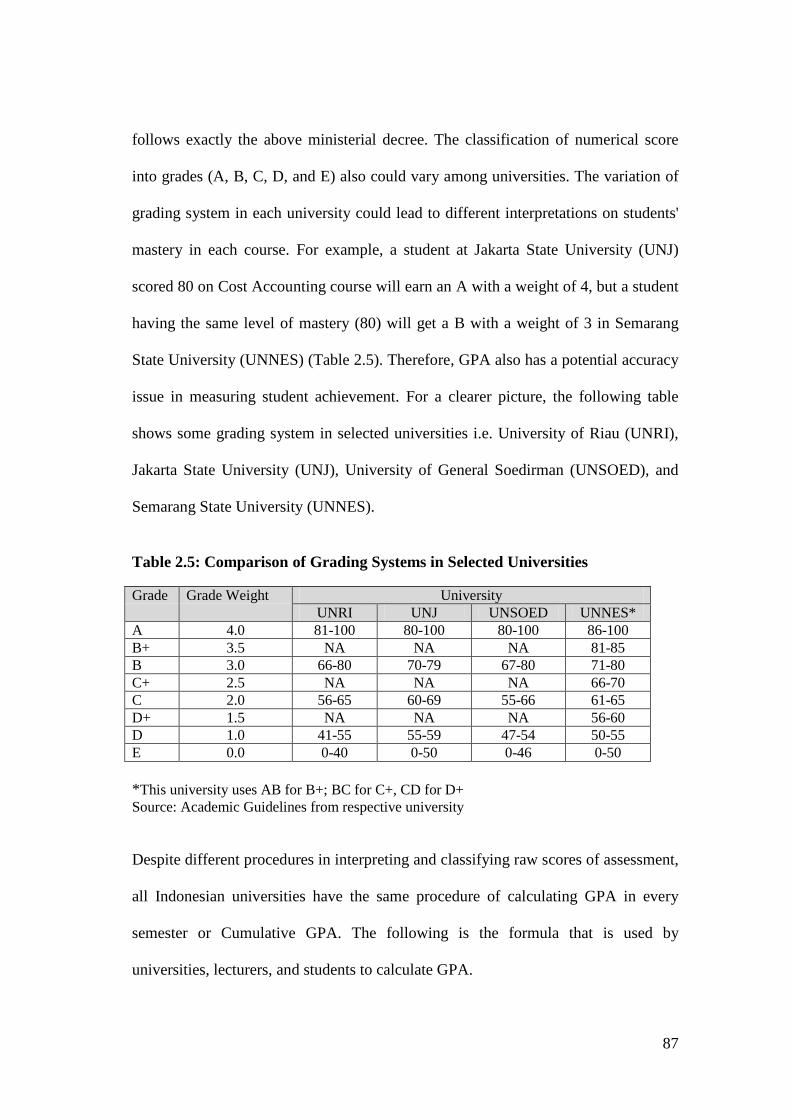
87
follows exactly the above ministerial decree. The classification of numerical score
into grades (A, B, C, D, and E) also could vary among universities. The variation of
grading system in each university could lead to different interpretations on students'
mastery in each course. For example, a student at Jakarta State University (UNJ)
scored 80 on Cost Accounting course will earn an A with a weight of 4, but a student
having the same level of mastery (80) will get a B with a weight of 3 in Semarang
State University (UNNES) (Table 2.5). Therefore, GPA also has a potential accuracy
issue in measuring student achievement. For a clearer picture, the following table
shows some grading system in selected universities i.e. University of Riau (UNRI),
Jakarta State University (UNJ), University of General Soedirman (UNSOED), and
Semarang State University (UNNES).
Table 2.5: Comparison of Grading Systems in Selected Universities Grade Grade Weight University
UNRI UNJ UNSOED UNNES* A 4.0 81-100 80-100 80-100 86-100 B+ 3.5 NA NA NA 81-85 B 3.0 66-80 70-79 67-80 71-80 C+ 2.5 NA NA NA 66-70 C 2.0 56-65 60-69 55-66 61-65 D+ 1.5 NA NA NA 56-60 D 1.0 41-55 55-59 47-54 50-55 E 0.0 0-40 0-50 0-46 0-50 *This university uses AB for B+; BC for C+, CD for D+ Source: Academic Guidelines from respective university Despite different procedures in interpreting and classifying raw scores of assessment,
all Indonesian universities have the same procedure of calculating GPA in every
semester or Cumulative GPA. The following is the formula that is used by
universities, lecturers, and students to calculate GPA.
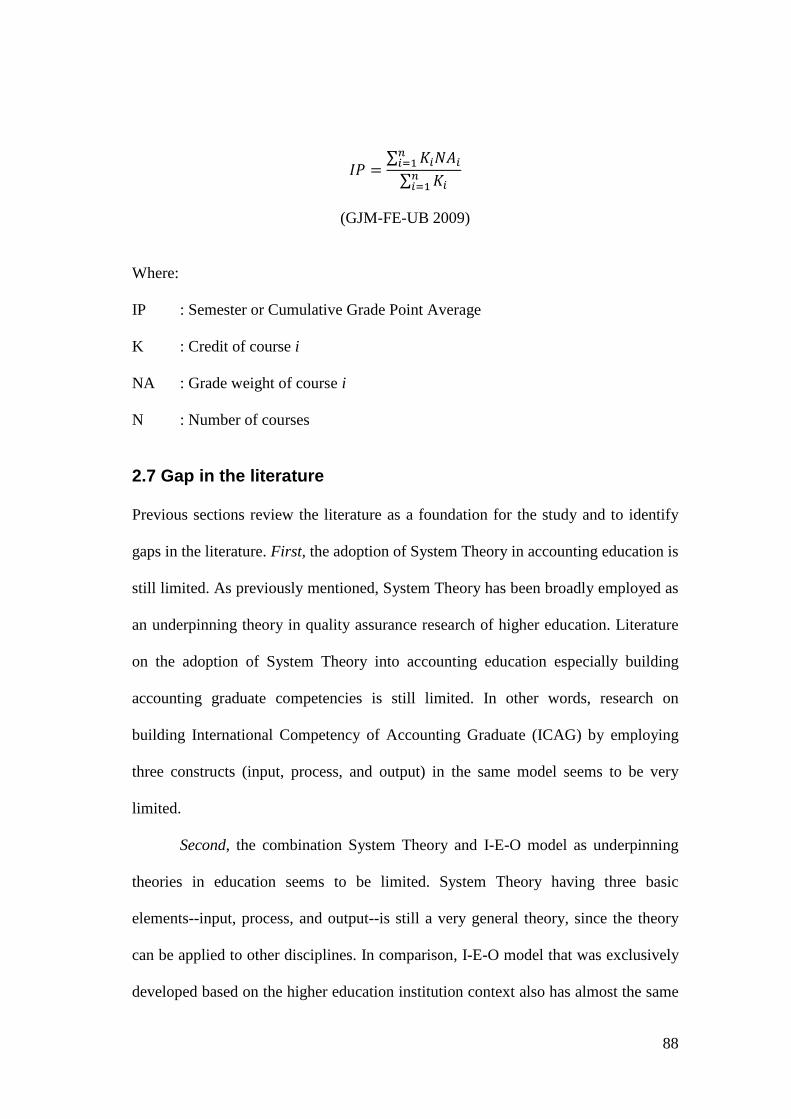
88
𝐼𝑃 =∑ 𝐾𝑖𝑁𝐴𝑖𝑛𝑖=1∑ 𝐾𝑖𝑛𝑖=1
(GJM-FE-UB 2009)
Where: IP : Semester or Cumulative Grade Point Average
K : Credit of course i
NA : Grade weight of course i
N : Number of courses
2.7 Gap in the literature
Previous sections review the literature as a foundation for the study and to identify
gaps in the literature. First, the adoption of System Theory in accounting education is
still limited. As previously mentioned, System Theory has been broadly employed as
an underpinning theory in quality assurance research of higher education. Literature
on the adoption of System Theory into accounting education especially building
accounting graduate competencies is still limited. In other words, research on
building International Competency of Accounting Graduate (ICAG) by employing
three constructs (input, process, and output) in the same model seems to be very
limited.
Second, the combination System Theory and I-E-O model as underpinning
theories in education seems to be limited. System Theory having three basic
elements--input, process, and output--is still a very general theory, since the theory
can be applied to other disciplines. In comparison, I-E-O model that was exclusively
developed based on the higher education institution context also has almost the same
89
elements i.e. input, environment, and output. Literature discussing the combination
between System Theory and I-E-O model in accounting education seems to be very
limited. More specifically, research on building International Competency of
Accounting Graduates (ICAG) that includes inputs (lecturer’s characteristics,
student’s characteristics, accounting competency-teaching contents, comfort of class
size, and learning facilities) and processes (student engagement and student-faculty
engagement) in Indonesian universities appears to be non-existent.
Third, the use of Expectancy Theory to measure student motivation,
Herzberg’s Motivation Theory to measure teacher motivation and job satisfaction, as
well as Involvement Theory to measure the transforming process in a university (in
terms of student engagement and student-faculty engagement) has only been
undertaken to a limited students in the Indonesian university context.
Fourth, research relating to International Competency of Accounting
Graduates (ICAG) in Indonesian universities is still limited, since the attention of
most academics is focused on student achievements measured by Grade Point
Average (GPA) rather than competencies required by employers. The study also
attempts to discover the impact of student engagement and student-faculty
engagement on students’ accounting competencies. More specifically, the utilisation
of the student engagement and student-faculty engagement survey to gauge the
transforming process for assessment and benchmarking purposes within Indonesian
universities seem to be non-existent.
90
2.8 Conclusion
This chapter discusses relevant literature to develop hypotheses in order to answer
the research questions described in Chapter 1. Briefly, the study classifies the
literature into four cohorts. First, this chapter discusses underpinning theories
employed by this study. The study combines System Theory and I-E-O model
consisting of three constructs i.e. inputs, process/environment, and outputs. Second,
this chapter discusses inputs that consist of teacher characteristics, student
characteristics, accounting-competency teaching contents, comfort of class size, and
learning facilities. Third, the discussion on the transforming process that measured
by student engagement and student-faculty engagement. The discussion on student
engagement and student-faculty engagement begins with Involvement Theory, the
theoretical foundation for student engagement. Fourth, the study discusses
educational outputs in terms International Competency of Accounting Graduate
(ICAG) measured by AICPA core competencies and student achievements (SA) in
term of cumulative GPA.
91
CHAPTER 3: RESEARCH DESIGN 3.1 Introduction 3.4 Hypothesis 3.2 Research Question 3.6 Conclusion 3.3 Conceptual Model
3.1 Introduction
Based on the gaps in the literature, the study develops a research design consisting of
three main sections i.e. research questions, conceptual model, and hypotheses. As
previously mentioned in Chapter 1, the study developed six research questions
relating to (1) relationships between inputs and processes/environments; (2)
relationships between inputs and outputs; (3) relationships between
processes/environments and outputs; (4) model for improving International
Competency of Accounting Graduates (ICAG); (5) model for improving Grade Point
Average (GPA); and (6) alumni perceptions on AICPA core competencies. Based on
these main research questions, this Chapter develops more detailed research sub-
questions and builds models for testing. Besides developing a more comprehensive
model, the study also split the model into two sub-models based on student and
lecturer perceptions. The last section of this chapter discusses the hypotheses
developed to test models.
3.2 Research Questions As mentioned earlier in both Chapter 1 and 2, the study employs two underpinning
theories i.e. System Theory and I-E-O model. These theories contend that there are
three constructs in an educational system that should be taken into account i.e.
inputs, processes/environments, and outputs. Both theories also treat
92
processes/environments as mediating or intervening constructs. In this regard, the I-
E-O model uses the term of environment as mediating construct rather than a process
term. Relationships among constructs can be direct11 and indirect12 causal
relationships (de Vaus 2002). Therefore, research questions relate to relationships
between the three constructs. Process/environment as a transforming process is
measured by Student Engagement based on student perception, whilst ICAG-
Teaching Content and Student-Faculty Engagement are lecturer perceptions. The
research design formulates more detailed Research Sub-Questions to answer the
main questions as presented in Chapter 1.
RQ1: What educational inputs have significant relationships with educational
processes? Students as inputs to an educational system will go through a process to become
outputs. To ensure the educational process produces required outputs, students
should have certain characteristics. In this regard, students characteristics could be
classified into psychological (Credé & Kuncel 2008), previous academic
performance (Duff 2004), and demographic (AUSSE 2010a; Strayhorn 2008)
characteristics. In relation to psychological characteristic the study employs Student
Motivation measured by Expectancy Theory (Geiger & Cooper 1995; Geiger &
Cooper 1996). These measures of inputs lead to the following research sub-
questions:
11 The relationships between inputs and outputs are direct causal relationships without any mediating or intervening constructs. 12 The relationships between inputs and outputs are indirect causal relationships by involving processes/environments as mediating/intervening constructs.
93
RSQ1.1: Does Student Motivation measured by Expectancy Theory have an association with Student Engagement?
RSQ1.2: Do Student Previous Achievements have associations with Student
Engagement? RSQ1.3: Do Student Demographic Characteristics have an association with Student
Engagement? Another important input to the educational system is learning facilities. Good
education facilities may not guarantee good outputs from the education system, but
poor facilities certainly affect the quality of outputs (Mohamed & Lashine 2003).
Learning facilities are in the form of libraries, laboratories, computers (Dolan, Jung
Jr & Schmidt 1985) as well as class size (Dillon & Kokkelenberg 2002;
Konstantopoulos 2007; Murdoch & Guy 2002). Class size will be measured by
Comfort of Class Size. These measures lead to the following question:
RQ1.4: Do Learning Facilities and Comfort of Class Size based on student
perceptions have an or any association with Student Engagement? A lecturer is another important input into an educational system (Mizikaci 2006;
Nearon 2002). A lecturer also has the same characteristics i.e. psychological
(Ololube 2006; Sudiro 2008; Woods & Weasmer 2004), academic (De Paola 2009;
Knowles 1999; Wang, Smith & Steve Oliver 2006; Yusuf 2006), and demography
characteristics (Hoffmann & Oreopoulos 2009b, 2009a; Kemper 2010; Kinney &
Smith 1992).
In relation to psychological characteristics, the study employs Lecturer Job
Satisfaction (Conklin & Desselle 2007) to measure lecturer motivation. In addition,
academic dimensions can be in terms of teaching experience and research
productivity (De Paola 2009), lecturer licensure (Harris & Sass 2009; Wang, Smith
94
& Steve Oliver 2006), and lecturer education attainment (Riduwan 2006; Yusuf
2006). Lastly, demographic characteristics can consist of lecturers’ age (Kemper
2010; Kinney & Smith 1992) and gender (Bennett 1982; Buck & Tiene 1989;
Verceles & Rivera 2010). Transforming processes or environment based on lecturer
perception are ICAG-Teaching Content and Student-Faculty Engagement. These
findings lead to the following research sub-questions:
RSQ1.5: Does Lecturer Job Satisfaction have an association with ICAG-Teaching
Contents, Student-Faculty Engagement? RSQ1.6: Do Lecturer Teaching Experiences, Education Attainments, Research
Productivity, and Licensure have an association with ICAG-Teaching Content and Student-Faculty Engagement?
RSQ1.7: Does Lecturers’ Age have an association with ICAG-Teaching Content and
Student-Faculty Engagement? RSQ1.8: Does Lecturers’ Gender have an association with ICAG-Teaching Content
and Student-Faculty Engagement? RSQ1.9: Do Learning Facilities and Comfort of Class Size based on lecturer
perceptions have an association with Student-Faculty Engagement and ICAG-Teaching Content?
Based on I-E-O model contended by Astin (1993a), the influence of environment
cannot be understood without considering the impact of inputs on outputs. As
previously mentioned, the study uses Student Engagement, ICAG-Teaching Content,
and Student-Faculty Engagement as proxies of transforming processes. In addition,
the study also employs ICAG and Student Achievements as outputs. Therefore,
relationships between transforming processes (Student Engagement, Student-Faculty
Engagement, and ICAG-Teaching Content) and outputs (ICAG and Student
95
Achievements) should consider relationships between educational inputs and
educational outputs. This leads to the following research question:
RQ2: What are the educational inputs that have an association with educational
outputs in term of ICAG and Student Achievements? As mentioned earlier, students as inputs have at least three characteristics i.e.
psychological (Credé & Kuncel 2008), academic (Duff 2004) and demographic
(Strayhorn 2008). Psychological characteristics are measured by Student Motivation;
academic characteristics are gauged by Student Previous Achievements; whilst
demographic characteristics are Student Age and Gender. To answer research
question, the following research sub-questions are asked:
RQ2.1: Does Student Motivation measured by Expectancy Theory have an
association with International Competencies of Accounting Graduates (ICAG) and Student Achievements?
RQ2.2: Do Student Previous Achievements have an association with ICAG and
Student Achievements? RQ2.3: Do Student Demographic Characteristics in terms of Age and Gender have
association with ICAG and Student Achievements? RQ2.4: Do Learning Facilities and Comfort of Class Size based on student
perceptions have an association with ICAG and Student Achievements?
Lecturers as inputs also have the same characteristics i.e. psychological, academic,
and demographic characteristics. Lecturer Job Satisfaction is intended to measure
psychological characteristics while Working Experience, Education Attainment,
Licensure, and Research Productivity are proxies for lecturer academic
characteristics. Lastly, the study uses Lecturer Age for demographic characteristics.
To add additional answers to research question 2, the following research sub-
questions are posed:
96
RQ2.5: Does Lecturer Job Satisfaction have an association with ICAG, and Student
Achievements? RQ2.6: Do Lecturer Working Experiences, Education Attainments, Research
Productivity, and Licensure have an association with ICAG, and Student Achievements?
RQ2.7: Does Lecturers’ Age have an association with ICAG, and Student
Achievements? Based on System Theory framework, contents and delivery are classified as a
transforming process (Mizikaci 2006). Nevertheless, Nearon (2002) puts subject
matter as an input. This study includes ICAG-Teaching Content as a part of the
transforming process. Both System Theory and I-E-O model contend that process or
environment influence outputs (Astin 1993a; Slack, Chambers & Johnston 2004).
Therefore, the study formulates the following research question:
RQ3: Are there any significant associations between educational processes and
educational outputs in terms of ICAG and Student Achievements?
As previously mentioned, the study employs Student Engagement as a proxy for the
transforming process or environment to produce educational outputs. ICAG and
Student Achievements as outputs could be influenced by Student Engagement.
Moreover, some academics from Victoria University, Canada (UVic 2006),
explained that Student Engagement can be a proxy for overall educational quality.
Strayhorn (2008) also found that Student Engagement affects personal and social
learning. These lead to the following sub-question:
RSQ3.1: Does Student Engagement have an association with ICAG and Student
Achievements? ICAG-Teaching Content and Student-Faculty Engagement are parts of the
transforming processes based on lecturer perception. System Theory and I-E-O
97
indicate that transforming process to have correlations with outputs, in this case
ICAG and Student Achievements. This leads to the following research sub-question:
RSQ3.2: Do ICAG-Teaching Content and Student-Faculty Engagement have an association with ICAG and Student Achievements?
The questions on Student-Faculty Engagement are mirrors of student engagement
questions (Kuh, Nelson Laird & Umbach 2004). Moreover, a previous study found
that Student-Faculty Engagement and Student Engagement are associated (Umbach
& Wawrzynski 2005). Therefore, there might be a correlation between Student
Engagement and Student-Faculty Engagement. In view of this, the study formulated
the following sub-question:
RSQ3.3: Does Student-Faculty Engagement have an association with Student
Engagement?
In relation to other research questions (RQ4, RQ5, and RQ6), the design does not
formulate research sub-question.
RQ4: What is the model for improving ICAG using input-process-output approach
in the Indonesian University context? RQ5: What is the model for improving Grade Point Average (GPA) using input-
process-output approach in the Indonesian University context? RQ6: Based on alumni perceptions, to what extent are AICPA core competencies
applicable in the Indonesian business context? The above RQs and RSQs (RQ1-RQ5) are questioning if there are relationships
among inputs, processes, and outputs. In addition, RQ6 is questioning alumni
perception about the applicability of AICPA core competencies in the Indonesian
business context. Literature review (Chapter 2) provides theoretical answers on the
aforementioned RQs and RSQs.
98
3.3 Conceptual Model To answer the RQs and RSQs, the study develops conceptual models to test
relationships among constructs. There are two conceptual models i.e. conceptual
models based on (1) student and (2) lecturer perceptions. Once both models are
identified, the study establishes a combined model that includes both models.
There are three constructs of educational system i.e. inputs, processes, and
outputs (Figure 3.1). Based on System Theory, inputs influence processes or
transforming processes. In turn, processes determine outputs. In this case, the
transforming process is a mediating construct. As a comparison, I-E-O model
contends that inputs influence both outputs and environments in the meantime
environments also influence outputs. More simply, this model considers direct and
indirect causal relationships among inputs, processes, and outputs.
A model based on student perceptions includes Student Motivation
(Campbell, Baronina & Reider 2003; Geiger & Cooper 1995; Geiger & Cooper
1996; Geiger et al. 1998; Harrel, Caldwell & Doty 1985; Yining & Hoshower 1998),
Student Previous Achievements (Agronow 2008; Astin 1993a; Credé & Kuncel
2008; Dickson & Fleet 2000; Duff 2004; Kavanagh & Drennan 2008), Student
Demographic Characteristics (Astin 1971; AUSSE 2010a; Duff 2004; Kinzie et al.
2007; Strayhorn 2008), Comfort of Class Size (Cotten & Wilson 2006; Johnson
2010; Kokkelenberg, Dillon & Christy 2008; Konstantopoulos 2007; Murdoch &
Guy 2002), and Learning Facilities (Chen, Lambert & Guidry 2010; Dolan, Jung Jr
& Schmidt 1985; Khan 2009; Kuh & Gonyea 2003; Marchionini & Maurer 1995;
Mohamed & Lashine 2003). These inputs have postulated direct causal relationships
with outputs in terms of ICAG and Student Achievements (Astin 1993a, 1999).
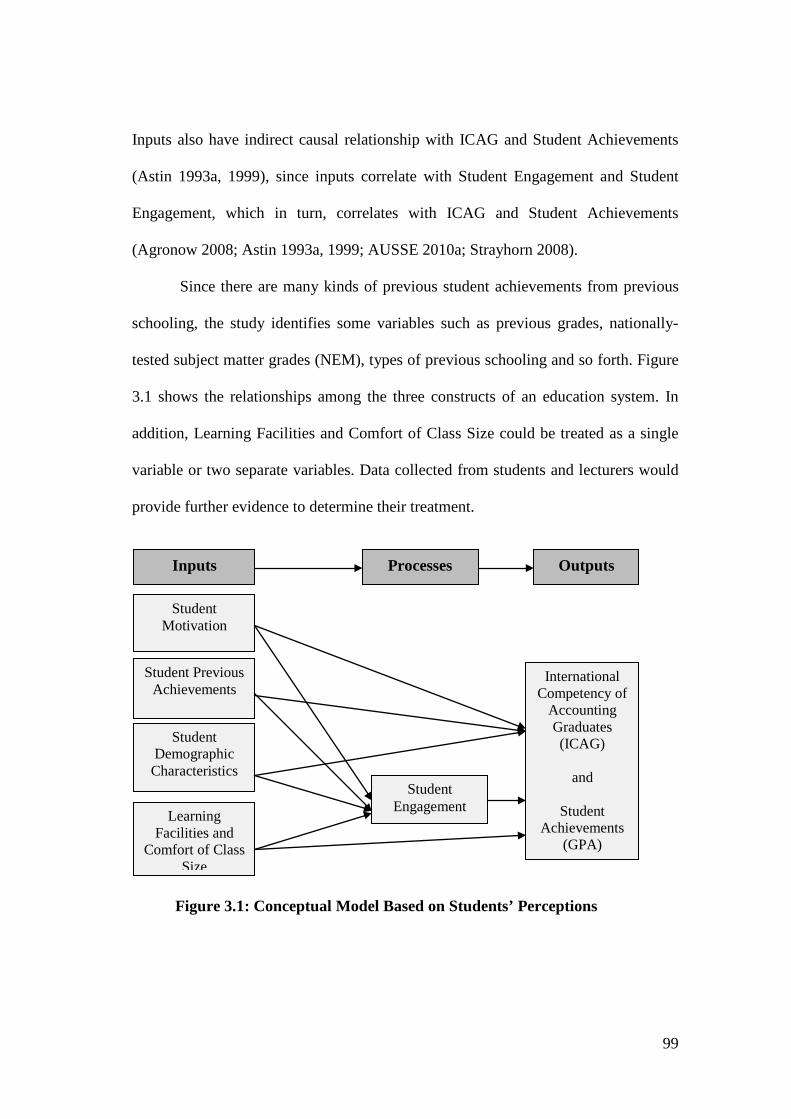
99
Inputs also have indirect causal relationship with ICAG and Student Achievements
(Astin 1993a, 1999), since inputs correlate with Student Engagement and Student
Engagement, which in turn, correlates with ICAG and Student Achievements
(Agronow 2008; Astin 1993a, 1999; AUSSE 2010a; Strayhorn 2008).
Since there are many kinds of previous student achievements from previous
schooling, the study identifies some variables such as previous grades, nationally-
tested subject matter grades (NEM), types of previous schooling and so forth. Figure
3.1 shows the relationships among the three constructs of an education system. In
addition, Learning Facilities and Comfort of Class Size could be treated as a single
variable or two separate variables. Data collected from students and lecturers would
provide further evidence to determine their treatment.
Figure 3.1: Conceptual Model Based on Students’ Perceptions
Student Motivation
Learning Facilities and
Comfort of Class Size
Student Previous Achievements
Student Demographic
Characteristics Student
Engagement
International Competency of
Accounting Graduates (ICAG)
and
Student
Achievements (GPA)
Inputs Processes Outputs
100
The second model (Figure 3.2) was built based on lecturer perceptions. The inputs
are Lecturer Job Satisfaction (Bassett-Jones & Lloyd 2005; Knowles 1999;
Ololube 2006; Riduwan 2006; Sudiro 2008; Syptak, Marsland & Ulmer 1999;
Woods & Weasmer 2004; Zhang & Zheng 2009), Lecturer Academic
Characteristics (Buddin & Zamarro 2009; De Paola 2009; Harris & Sass 2009;
Kennedy 1998; Knowles 1999; Riduwan 2006; Wang, Smith & Steve Oliver 2006;
Yusuf 2006), and Lecturer Demographic Characteristics (Bennett 1982; Buck &
Tiene 1989; Hoffmann & Oreopoulos 2009b; Kemper 2010; Kinney & Smith 1992;
Verceles & Rivera 2010). Based on I-E-O model, these inputs are posited to have
direct causal relationships with ICAG and Student Achievements (Astin 1993b,
1999). Likewise, these inputs are also expected to have indirect causal relationships
with outputs in terms of ICAG and Student Achievements (Astin 1993b, 1999) and
their correlations are mediated by ICAG-Teaching Contents and Student-Faculty
Engagement. The model based on lecturer perceptions consists of two main elements
i.e. inputs (Lecturer Job Satisfaction, Lecturer Academic Characteristics, and
Lecturer Demographic Characteristics) and processes (ICAG-Teaching Content and
Student-Faculty Engagement). These inputs and processes are derived from the
model based on lecturers’ perception; whilst outputs are ICAG and Student
Achievements are from the model based on the students’ perception.
Outputs in terms of ICAG and Student Achievements used in this model are
collected from students, whilst and inputs and processes are based on lecturer
perception. Despite some weaknesses of correlating lecturer variables with student
variables, the study attempts to identify associations between inputs and process
constructs based on lecturers’ perceptions with process and outputs based on
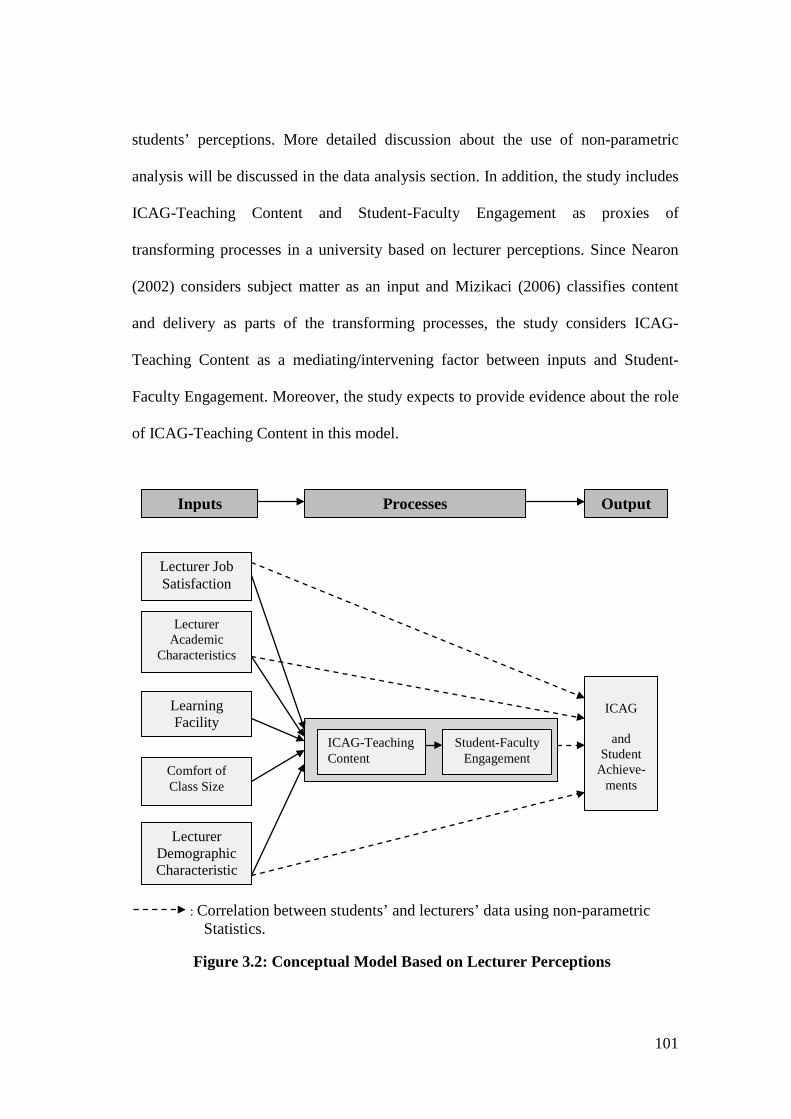
101
students’ perceptions. More detailed discussion about the use of non-parametric
analysis will be discussed in the data analysis section. In addition, the study includes
ICAG-Teaching Content and Student-Faculty Engagement as proxies of
transforming processes in a university based on lecturer perceptions. Since Nearon
(2002) considers subject matter as an input and Mizikaci (2006) classifies content
and delivery as parts of the transforming processes, the study considers ICAG-
Teaching Content as a mediating/intervening factor between inputs and Student-
Faculty Engagement. Moreover, the study expects to provide evidence about the role
of ICAG-Teaching Content in this model.
: Correlation between students’ and lecturers’ data using non-parametric Statistics. Figure 3.2: Conceptual Model Based on Lecturer Perceptions
Output
ICAG-Teaching Content
Student-Faculty Engagement
Lecturer Job Satisfaction
Learning Facility
Lecturer Academic
Characteristics
Lecturer Demographic Characteristic
Inputs Processes
ICAG
and
Student Achieve-
ments Comfort of Class Size
102
3.4 Hypotheses Based on the previous Literature Review (Chapter 2), the study develops hypotheses
to validate models based on students’ and lecturers’ perception. In general, the study
classifies hypotheses into three i.e. hypotheses on relationships between inputs and
processes; inputs and outputs; and relationships between processes and outputs.
Based on System Theory and I-E-O model, inputs are important components
(Astin 1993a; Slack, Chambers & Johnston 2004). Tinto’s Theory of Student
Departure (Tinto 1993) also contends that pre-entry attributes are also critical
components in his model. Likewise, Pascarella’s General Model for Assessing
Change (Pascarella & Terenzini 1991) includes student background/pre-college traits
and structural/organisational characteristics of institutions as important exogenous
variables13 in their model. In view of this, Mizikaci (2006) listed six educational
inputs in higher education i.e. student characteristics, lecturer characteristics,
financial resources, facilities, support services, as well as program, course, and
schedule.
Student characteristics could be classified into three dimensions i.e.
psychological, academic, and demographic characteristics (Mizikaci 2006).
Psychological characteristic in term of Student Motivation was found to be an
effective predictor of Student Engagement (Heller et al. 2010; Krause 2005; Walker,
Greene & Mansell 2006). Therefore, this leads to the following hypothesis:
H1.1: Student Motivation measured by Expectancy Theory correlates with Student
Engagement.
13 A variable without being influenced by other variable(s), but affects other variable(s) in the model.
103
The study includes Student Previous Achievements in the model, since Student
Previous Achievements correlates with Student Engagement. Previous finding shows
that pre-college academic success also correlates with academic engagement
(Agronow 2008). This leads to the following hypothesis:
H1.2: Student Previous Achievements correlate with Student Engagement. Student Age correlates positively with Student-Faculty Interaction and active
learning, but correlates negatively with peer interaction (Strayhorn 2008). The
correlation between Student Gender and Student Engagement is more elusive. In an
Australian setting female students are more engaged than their male counterparts
(AUSSE 2010a). In contrast, there is only a small different between male and female
students in an American university (Kinzie et al. 2007). Inconsistent correlation
between Age and Student Engagement as well as correlation between Student
Gender and Student Engagement lead to the following hypothesis:
H1.3: Student Demographic Characteristics in terms of Age and Gender correlate
with Student Engagement. Learning Facilities in form of libraries, laboratories, and computers have been shown
to enhance the quality of students (Dolan, Jung Jr & Schmidt 1985). Moreover, there
is a correlation between library experience of undergraduates students and the
selection of educationally purposeful activities (Kuh & Gonyea 2003) and provides a
useful academic experience for students (Marchionini & Maurer 1995). Additionally,
the use of technology leads to more engagement for both students and teachers
(Chen, Lambert & Guidry 2010; Heiberger & Harper 2008). Lastly, Class size has an
104
indirect correlation to student engagement (Cotten & Wilson 2006). Therefore, the
study formulates the following hypothesis:
H1.4: Learning Facilities and Comfort of Class Size based on student perceptions
correlate with Student Engagement. Lecturers are important inputs in educational system (Mizikaci 2006; Nearon 2002),
since their roles in influencing students’ achievements are critical (Hattie 2003;
Hoffmann & Oreopoulos 2009a). The study employs ICAG-Teaching Content and
Student-Faculty Engagement as proxies of transforming processes in accounting
education. ICAG-Teaching Content measures lecturers’ perceptions on how much
they include ICAG in their teaching-learning processes. Owing to limited research on
the effect of lecturers’ characteristics on ICAG-Teaching Content and Student-
Faculty Engagement, the study views ICAG-Teaching Content and Student Faculty
Engagement as lecturers’ performance.
Lecturer characteristics are classified into knowledge, motivation (Knowles
1999), and demographic characteristics (Hoffmann & Oreopoulos 2009b). Therefore,
the study classifies lecturer characteristics into three dimensions i.e. psychological,
academic, and demographic. Lecturer motivation is an important predictor in
determining lecturers’ performance (Riduwan 2006). Likewise, job satisfaction also
impacts positively on lecturer performance (Sudiro 2008; Woods & Weasmer 2004).
The study employs Herzberg’s Motivation Theory (HMT) to measure motivation
based on Lecturer Job Satisfaction. Therefore, the study formulates the following
hypothesis:
105
H1.5: Lecturer Job Satisfaction correlates with ICAG-Teaching Contents, Student-Faculty Engagement.
Lecturer Academic Characteristics are also considered important, because these
characteristics could be reflections of teachers’ competencies, skills, and knowledge.
Lecturers’ education attainment correlates significantly with lecturer performance
(Riduwan 2006; Yusuf 2006). Higher education attainment leads to better mastery of
pedagogical and subject matter (Knowles 1999). Likewise, licensure also impacts on
teaching performance (Wang, Smith & Steve Oliver 2006). In addition, as teaching
experience and research productivity influence student achievement (De Paola 2009),
the study assumes that teaching experience and research productivity also correlate
with teaching performance. Likewise, previous findings show that research
productivity also correlates with lecturer teaching effectiveness based on student
perceptions (Centra 1983). H1.6: Lecturer Teaching Experiences, Education Attainments, Research
Productivity, and Licensure correlate with ICAG-Teaching Content and Student-Faculty Engagement.
Lecturer Age and teaching performance correlate positively (Kinney & Smith 1992).
On the other hand, the relationships between Lecturer’s Age and job performance is
zero (Kemper 2010). Since the relationship between Lecturer’s Age and teaching
performance is inconsistent, the study formulates the following hypothesis.
H1.7: Lecturer’s Age correlates with ICAG-Teaching Content and Student-Faculty
Engagement.
106
Lecturer gender is another demographic characteristic. Previous studies found that
lecturer gender does not affect teaching performance (Buck & Tiene 1989; Verceles
& Rivera 2010). On the other hand, students perceive female lectures as warmer and
more potent individual (Bennett 1982). The study formulates the following
hypothesis:
H1.8: Lecturers’ Gender correlates with ICAG-Teaching Content and Student-
Faculty Engagement. Academic support in the forms of libraries, laboratories, and computers enhance the
quality of students and teachers (Dolan, Jung Jr & Schmidt 1985). Moreover, the use
of computer technology also benefits both students and lecturers (Chen, Lambert &
Guidry 2010; Herring III & Bryans 2001; Khan 2009; Mohamed & Lashine 2003).
The use of libraries by both students and lecturers provides positive impacts (Kuh &
Gonyea 2003; Marchionini & Maurer 1995). Moreover, the use of computer
technology also benefits both students and lecturers (Chen, Lambert & Guidry 2010;
Herring III & Bryans 2001; Khan 2009; Mohamed & Lashine 2003).
In relation to Comfort of Class Size, university should provide smaller class
size to create engagement between students and lecturers (Cotten & Wilson 2006).
Likewise, smaller classes affect teachers’ morale and enjoyment of teaching (Finn,
Pannozzo & Achilles 2003). Therefore, Comfort of Class Size may improve Student-
Faculty Engagement and ICAG-Teaching Content. These measures lead to the
following hypothesis:
H1.9: Learning Facilities and Comfort of Class Size based lecturer perceptions
correlate with Student-Faculty Engagement and ICAG-Teaching Content.
107
The study employs Expectancy Theory to measure Student Motivation. Previous
studies show that Student Motivation is effective in affecting Student Achievements
(Geiger & Cooper 1995; Geiger & Cooper 1996). More specifically, Expectancy
Theory is a useful conceptual framework for understanding Student Motivation to
strive for academic success (Harrel, Caldwell & Doty 1985). Therefore, the study
formulates the following hypothesis:
H2.1: Student Motivation measured by Expectancy Theory correlates with
International Competencies of Accounting Graduates (ICAG) and Student Achievements.
To enter the accounting education system in a university, a student has to meet
academic requirements. Previous academic achievements are considered as important
predictors in influencing student performance (Astin 1971, 1993a). More current
research also shows that pre-college achievements correlate closely with students’
achievements (Agronow 2008; Credé & Kuncel 2008; Duff 2004; Rohde &
Kavanagh 1996).
H2.2: Students’ Previous Achievements correlate with ICAG and Student
Achievements. Student demographic dimensions slightly correlated with students’ achievements
(Astin 1971; Duff 2004). More specifically, gender has a positive relationship with
student achievements (AUSSE 2010a; Strayhorn 2008). On the other hand, age
correlates negatively with personal/social gains (Strayhorn 2008). Therefore, the
study proposes the following hypothesis:
108
H2.3: Student Demographic Characteristics in terms of Age and Gender correlate with ICAG and Student Achievements.
Learning facilities in the form of library (Kuh & Gonyea 2003; Marchionini &
Maurer 1995), computer (Chen, Lambert & Guidry 2010; Herring III & Bryans
2001), and laboratory (Jack, Smith & Clay. Jr 1986) have positive impacts on student
achievements. Likewise, class size also influences student achievements (Johnson
2010; Kokkelenberg, Dillon & Christy 2008). Therefore, the study formulates the
following hypothesis:
H2.4: Learning Facilities and Comfort of Class Size based on student perceptions
correlate with ICAG and Student Achievements. In relation to lecturer motivation, previous studies found that lecturer motivation
impacts on student achievements (Knowles 1999). More generally, lecturer
motivation influence student outcomes (Ololube 2006; Woods & Weasmer 2004).
Therefore, the study employs Lecturer Job Satisfaction for measuring lecturer
motivation. In view of the above, the study formulates the following hypothesis:
H2.5: Lecturer Job Satisfaction correlates with ICAG and Student Achievements.
A lecturer’s mastery of pedagogical skills and subject matter affect student
motivation and grades (Knowles 1999). Teaching experience and research
productivity impact student achievements (De Paola 2009). On the other hand, the
correlations between teacher experience and student achievements are weak (Buddin
& Zamarro 2009), and correlation between teacher experience and teaching
effectiveness is non-linear (Wang, Smith & Steve Oliver 2006) while teacher
109
certification provides positive signals to student achievements (Harris & Sass 2009).
Based on the above findings, the study proposes the following hypothesis:
H2.6: Lecturer Working Experiences, Education Attainments, Research Productivity,
and Licensure correlate with ICAG, and Student Achievements. The influence of teacher demographic characteristics on student achievement is
minimal (Hoffmann & Oreopoulos 2009b). This lead to the following hypothesis:
H2.7: Lecturers’ Age correlate with ICAG, and Student Achievements Student Engagement is a transforming process based on student perceptions.
Previous findings show that the correlation between Student Engagement and
Student Achievements is significant (Agronow 2008; Carini, Kuh & Klein 2006;
Handelsman et al. 2005; Kuh et al. 2008; Strayhorn 2008; UVic 2006). Therefore,
the study proposes the following hypothesis:
H3.1: Student Engagement correlates with ICAG and Student Achievements. As previously mentioned, transforming processes based on lecturers’ perceptions are
measured by ICAG-Teaching Content and Student-Faculty Engagement, while
transforming processes based on students’ perceptions is measured by Student
Engagement. There is a positive relationship between Student Engagement and
Student-faculty Engagement (Heller et al. 2010; Kuh, Nelson Laird & Umbach 2004;
Kuh & Shouping 2001; Strayhorn 2008; Umbach & Wawrzynski 2005). Moreover,
the questions of Student-Faculty Engagement are the mirrors of Student Engagement
questions (Kuh, Nelson Laird & Umbach 2004). Moreover, ICAG-Teaching Content
and ICAG have the same questions on AICPA core competencies. ICAG- Teaching
110
Content measures how much ICAG teaching content is included by lecturers, whilst
ICAG gauges the extent of AICPA core competencies students earned from a
university education. Therefore, the study proposes the following hypothesis:
H3.2: ICAG- Teaching Content correlates with ICAG, Student-Faculty
Engagement, and Student Engagement. Student-Faculty Engagement is a proxy for the transforming process based on
lecturer perceptions, whilst Student Engagement is the transforming process based on
student perceptions (AUSSE 2010b). Moreover, questions of Student-Faculty
Engagement are the mirrors of Student Engagement questions (Kuh, Nelson Laird &
Umbach 2004). In view of the above, the study formulates the following hypothesis:
H3.3: Student-Faculty Engagement correlates with Student Engagement. To provide a more comprehensive model that consists of all the proposed
hypotheses, the study developed a combined model (student and lecturer models).
Figure 3.3 shows that all educational inputs (Lecturer Characteristics, Student
Characteristics, Learning Facilities, and Comfort of Class Size) are posited to
associate with educational processes. More specifically, Lecturer Characteristics,
Learning Facilities, and Comfort of Class Size based on lecturer perspectives are
expected to correlate with ICAG-Teaching Content and Student-Faculty Engagement
(H1.5-H1.8 and H1.9). At the same time, Lecturer Characteristics are also expected
to correlate with educational outputs in terms of ICAG and Student Achievements
(H2.5-H2.7). Likewise, Student Characteristics, Learning Facilities, and Comfort of
Class Size based on student perceptions are associated with Student Engagement
(H1.1-H1.3). In addition, Students Characteristics, Learning Facilities, and Comfort
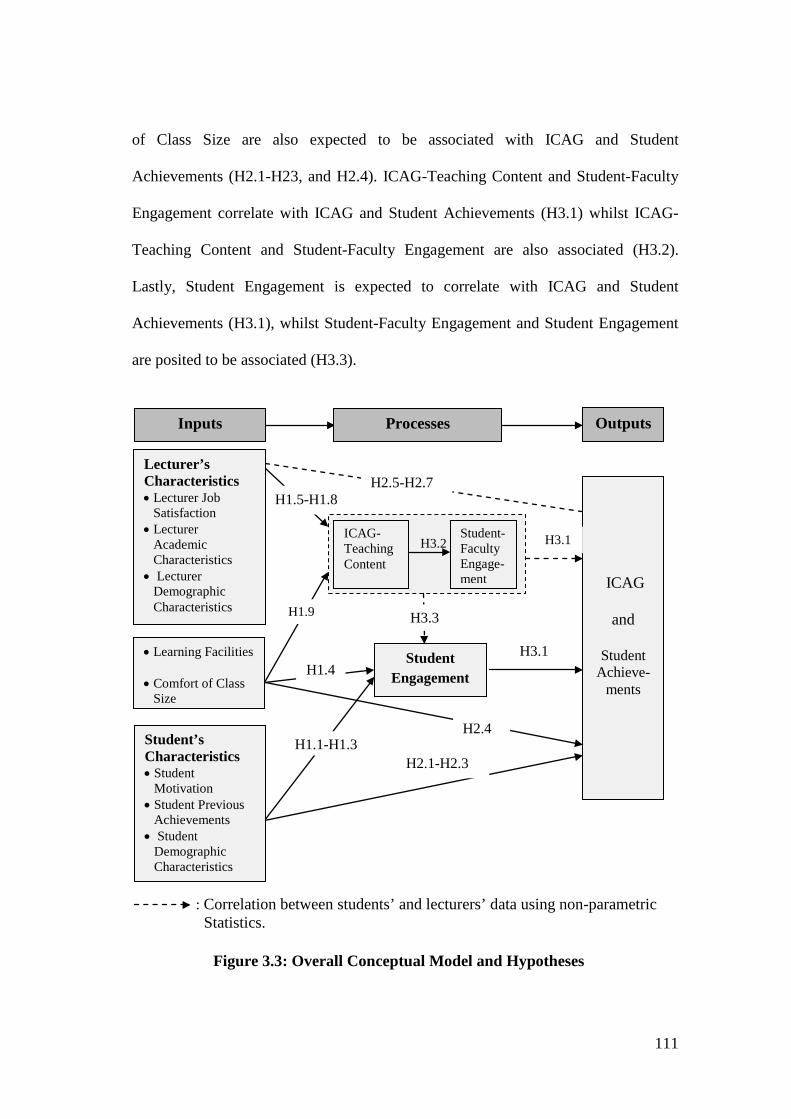
111
of Class Size are also expected to be associated with ICAG and Student
Achievements (H2.1-H23, and H2.4). ICAG-Teaching Content and Student-Faculty
Engagement correlate with ICAG and Student Achievements (H3.1) whilst ICAG-
Teaching Content and Student-Faculty Engagement are also associated (H3.2).
Lastly, Student Engagement is expected to correlate with ICAG and Student
Achievements (H3.1), whilst Student-Faculty Engagement and Student Engagement
are posited to be associated (H3.3).
: Correlation between students’ and lecturers’ data using non-parametric Statistics. Figure 3.3: Overall Conceptual Model and Hypotheses
H2.1-H2.3 H1.1-H1.3
H1.4
H1.9
H2.5-H2.7 H1.5-H1.8
H2.4
Outputs
Lecturer’s Characteristics • Lecturer Job
Satisfaction • Lecturer
Academic Characteristics
• Lecturer Demographic Characteristics
Processes Inputs
ICAG
and
Student Achieve-
ments
Student Engagement
• Learning Facilities
• Comfort of Class Size
H3.1
Student’s Characteristics • Student
Motivation • Student Previous
Achievements • Student
Demographic Characteristics
H3.2
ICAG-Teaching Content
Student-Faculty Engage-ment
H3.1
H3.3
112
As previously mentioned, the study uses ICAG based on AICPA core competencies
(Bolt-Lee & Foster 2003; Mula 2007; Wolcot, S. K. 2006). Many accounting
competency frameworks have been established by both institutions and academics
(AICPA 2006; BIHECC 2007; Hancock et al. 2009a; Kavanagh & Drennan 2008;
Mohamed & Lashine 2003; Wolcot, S. K. 2006). Nevertheless, almost all accounting
frameworks seem to be complementary of each other. Previous studies conducted in
Indonesia show that accounting competencies of Master’s students (Irianto 2010) are
in line with international competency standards. In line with this, the study
formulates the following proposition:
Based on alumni’s perception AICPA core competencies is applicable to work place in the Indonesian business setting.
3.5 Conclusion Based on the gaps from the literature, the study develops research questions followed
by conceptual models that will be tested empirically. As has been noted, the study
develops models based students’ and lecturers’ perceptions. Hypotheses are
formulated to answer research questions theoretically. The study also formulates a
proposition relating to AICPA core competencies in the Indonesian business setting.
Finally, the study develops an overall conceptual model combining the two models
by including all hypotheses proposed by the study. To answer research questions and
test hypotheses and proposition, the Research Methodology employed by the study is
discussed in the next chapter.
113
CHAPTER 4: RESEARCH METHODOLOGY
4.1 Introduction 4.6 Instrument Validity and Reliability 4.2 Population 4.7 Data Triangulation 4.3 Sample Selection 4.8 Ethical Consideration 4.4 Data Collection Method 4.9 Data Analysis 4.5 Instrument Measurement 4.10 Conclusion
4.1 Introduction Research questions and hypotheses are developed in the previous chapter. This
Chapter discusses research procedures adopted and consists of nine sections. The
first section discusses the population frame of the study followed by the method of
selecting universities, students, lecturers, and alumni as research participants. Survey
and Focus Group Discussions (FGD) as data collection methods are also presented in
this Chapter. The following sections discuss instrumentation consisting of
instrument’s measurements as well as instrument validity and reliability. Finally, this
Chapter ends with sections about data triangulation, ethical consideration, and data
analysis.
4.2 Population The study employs two units of analysis i.e. students and lecturers at state
universities in Indonesia. There are 46 state universities in Indonesia spreading from
eastern to western areas. The number does not include colleges, religious
universities, as well as private universities operating throughout Indonesia. Out of 46
state universities, 37 universities offer accounting programs. Data on universities was
downloaded from the database provided by Directorate of Higher Education (DIKTI)
(2009). The National Accreditation Body for Higher Education (BAN-PT)
established by Ministry of National Education accredits the quality of study
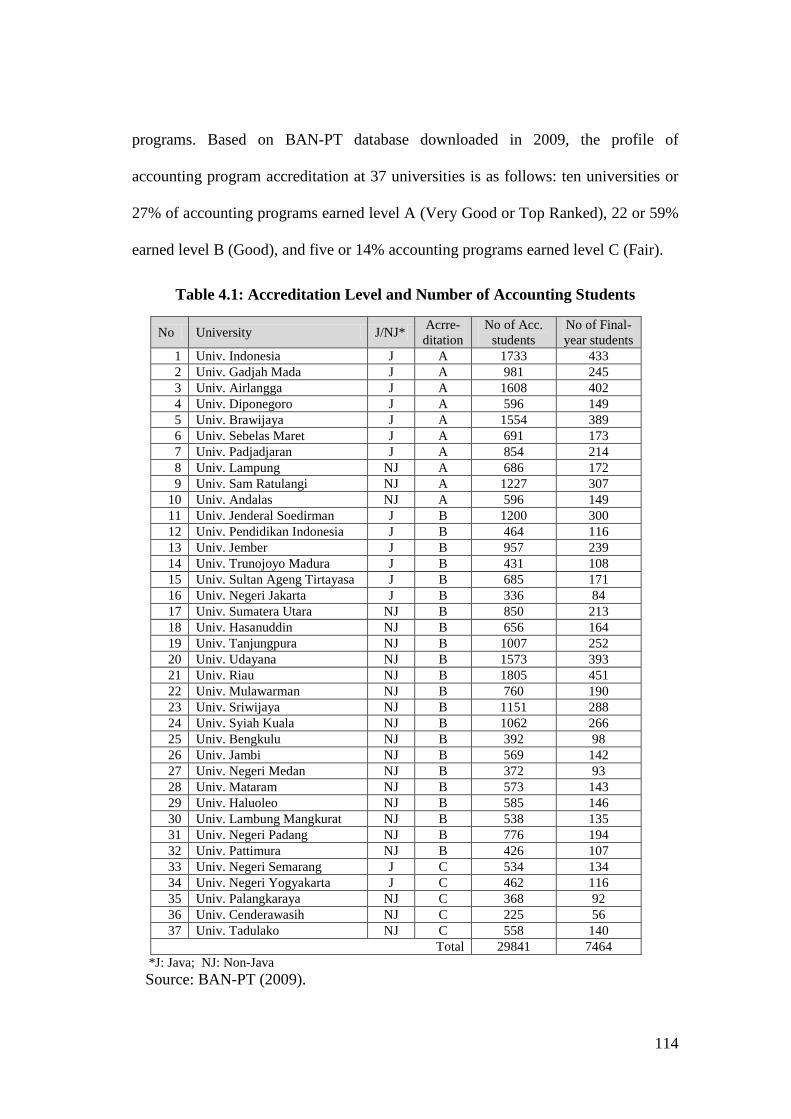
114
programs. Based on BAN-PT database downloaded in 2009, the profile of
accounting program accreditation at 37 universities is as follows: ten universities or
27% of accounting programs earned level A (Very Good or Top Ranked), 22 or 59%
earned level B (Good), and five or 14% accounting programs earned level C (Fair).
Table 4.1: Accreditation Level and Number of Accounting Students
No University J/NJ* Acrre- ditation
No of Acc. students
No of Final-year students
1 Univ. Indonesia J A 1733 433 2 Univ. Gadjah Mada J A 981 245 3 Univ. Airlangga J A 1608 402 4 Univ. Diponegoro J A 596 149 5 Univ. Brawijaya J A 1554 389 6 Univ. Sebelas Maret J A 691 173 7 Univ. Padjadjaran J A 854 214 8 Univ. Lampung NJ A 686 172 9 Univ. Sam Ratulangi NJ A 1227 307
10 Univ. Andalas NJ A 596 149 11 Univ. Jenderal Soedirman J B 1200 300 12 Univ. Pendidikan Indonesia J B 464 116 13 Univ. Jember J B 957 239 14 Univ. Trunojoyo Madura J B 431 108 15 Univ. Sultan Ageng Tirtayasa J B 685 171 16 Univ. Negeri Jakarta J B 336 84 17 Univ. Sumatera Utara NJ B 850 213 18 Univ. Hasanuddin NJ B 656 164 19 Univ. Tanjungpura NJ B 1007 252 20 Univ. Udayana NJ B 1573 393 21 Univ. Riau NJ B 1805 451 22 Univ. Mulawarman NJ B 760 190 23 Univ. Sriwijaya NJ B 1151 288 24 Univ. Syiah Kuala NJ B 1062 266 25 Univ. Bengkulu NJ B 392 98 26 Univ. Jambi NJ B 569 142 27 Univ. Negeri Medan NJ B 372 93 28 Univ. Mataram NJ B 573 143 29 Univ. Haluoleo NJ B 585 146 30 Univ. Lambung Mangkurat NJ B 538 135 31 Univ. Negeri Padang NJ B 776 194 32 Univ. Pattimura NJ B 426 107 33 Univ. Negeri Semarang J C 534 134 34 Univ. Negeri Yogyakarta J C 462 116 35 Univ. Palangkaraya NJ C 368 92 36 Univ. Cenderawasih NJ C 225 56 37 Univ. Tadulako NJ C 558 140
Total 29841 7464 *J: Java; NJ: Non-Java Source: BAN-PT (2009).
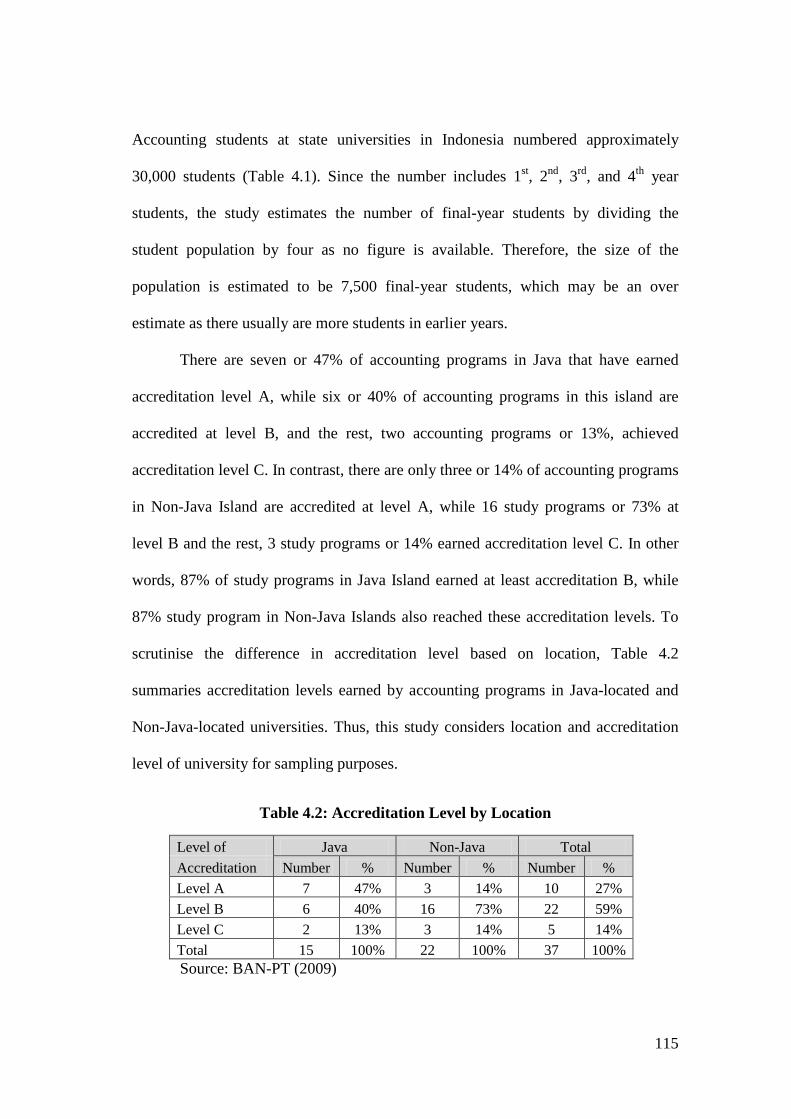
115
Accounting students at state universities in Indonesia numbered approximately
30,000 students (Table 4.1). Since the number includes 1st, 2nd, 3rd, and 4th year
students, the study estimates the number of final-year students by dividing the
student population by four as no figure is available. Therefore, the size of the
population is estimated to be 7,500 final-year students, which may be an over
estimate as there usually are more students in earlier years.
There are seven or 47% of accounting programs in Java that have earned
accreditation level A, while six or 40% of accounting programs in this island are
accredited at level B, and the rest, two accounting programs or 13%, achieved
accreditation level C. In contrast, there are only three or 14% of accounting programs
in Non-Java Island are accredited at level A, while 16 study programs or 73% at
level B and the rest, 3 study programs or 14% earned accreditation level C. In other
words, 87% of study programs in Java Island earned at least accreditation B, while
87% study program in Non-Java Islands also reached these accreditation levels. To
scrutinise the difference in accreditation level based on location, Table 4.2
summaries accreditation levels earned by accounting programs in Java-located and
Non-Java-located universities. Thus, this study considers location and accreditation
level of university for sampling purposes.
Table 4.2: Accreditation Level by Location
Level of Java Non-Java Total Accreditation Number % Number % Number % Level A 7 47% 3 14% 10 27% Level B 6 40% 16 73% 22 59% Level C 2 13% 3 14% 5 14% Total 15 100% 22 100% 37 100% Source: BAN-PT (2009)
116
In relation to sample size determination, there are at least three strategies i.e. using a
sample size of a similar study, published tables, and using formulas (Israel 1992).
Since the study also employs Structural Equation Modelling (SEM), sample size has
always been of major concern, because small samples are more likely to yield
unreliable results (Chou & Bentler 1996, p. 47). The sample size required to use
SEM should be at least 200 respondents unless the population from which a sample
is drawn is itself small or restricted in size (Barrett 2007). Moreover, Chou and
Bentler (1996) suggest that a sample size of 200 was considered reasonable. Israel
(1992) suggests a table for sample size around 400 for a population size of 7,000 and
precision (e) of 5%. The study uses a sample size around 400. Eight state universities
or approximately 20% of state universities are selected randomly by considering the
proportion of accreditation level of accounting program and location. Table 4.3
shows randomly-selected universities.
Lecturers in selected universities are the other respondents in this study.
DIKTI’s (2009) database shows that the number of lecturers in sample frame
universities is approximately 211 lecturers. Based on Israel (1992) the appropriate
number for the sample is 134 lecturers. If the study collects data from 134 lecturers
out of 211 lecturers, the percentage is approximately 64%. Since the study also uses
SEM analysis, the study collects data from at least 158 lecturers at sampled
universities to make sure results will be more reliable (Chou & Bentler 1996). Table
4.3 shows distributions of samples of both students and lecturers.
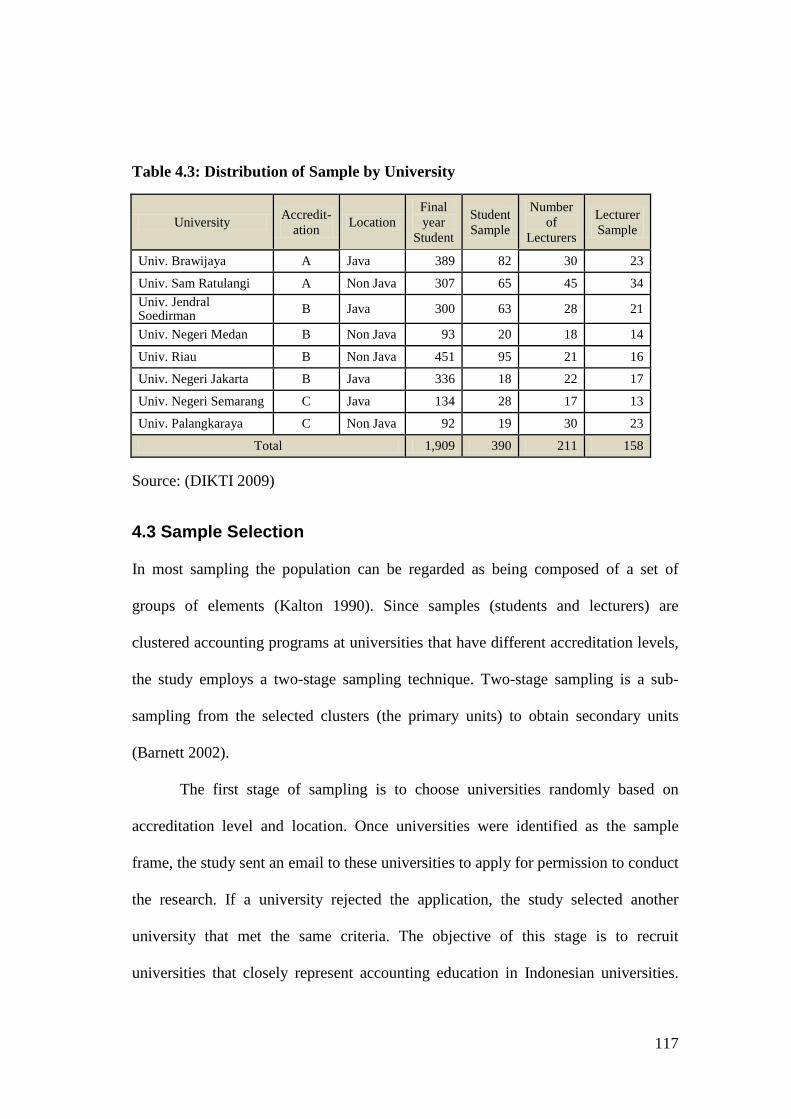
117
Table 4.3: Distribution of Sample by University
University Accredit- ation Location
Final year
Student
Student Sample
Number of
Lecturers
Lecturer Sample
Univ. Brawijaya A Java 389 82 30 23
Univ. Sam Ratulangi A Non Java 307 65 45 34 Univ. Jendral Soedirman B Java 300 63 28 21
Univ. Negeri Medan B Non Java 93 20 18 14
Univ. Riau B Non Java 451 95 21 16
Univ. Negeri Jakarta B Java 336 18 22 17
Univ. Negeri Semarang C Java 134 28 17 13
Univ. Palangkaraya C Non Java 92 19 30 23
Total 1,909 390 211 158 Source: (DIKTI 2009)
4.3 Sample Selection In most sampling the population can be regarded as being composed of a set of
groups of elements (Kalton 1990). Since samples (students and lecturers) are
clustered accounting programs at universities that have different accreditation levels,
the study employs a two-stage sampling technique. Two-stage sampling is a sub-
sampling from the selected clusters (the primary units) to obtain secondary units
(Barnett 2002).
The first stage of sampling is to choose universities randomly based on
accreditation level and location. Once universities were identified as the sample
frame, the study sent an email to these universities to apply for permission to conduct
the research. If a university rejected the application, the study selected another
university that met the same criteria. The objective of this stage is to recruit
universities that closely represent accounting education in Indonesian universities.
118
Eight state universities provided approval for collecting data from their students and
lecturers. These eight universities represent well the accreditation levels of
accounting program as well as locations.
The second stage of sampling is to select students and lecturers at universities
that have been randomly selected in the first stage. The study recruited students in all
classes of final-year accounting programs. Moreover, the recruitment of lecturers
was conducted with the assistance of the head or secretary of accounting department
in each university.
As previously mentioned, the study also employs a qualitative approach to
triangulating data on ICAG. The study uses Focus Group Discussion (FGD) with
alumni of accounting program to see the applicability of AICPA core competencies
in their working places. FGD was employed to collect qualitative data from alumni
of accounting program. This qualitative data relates to output stage of System Theory
(I-P-O) and Input-Environment-Output (I-E-O) model. The study did not limit the
number of participants for FGD. The study ceased collecting data after reaching
saturation responses by FGD participants. However, the study considered industry
sectors where alumni work i.e. service, manufacturing, Non-government
Organisation (NGO), banking, and trading sectors, as a criterion for inclusion in
FGD.
In relation to the process of recruiting universities, students, lecturers, and
alumni as respondents, the study has to follow ethical procedures and conduct to
ensure participants’ rights and welfare. For more detailed information about these
issues, the ethical consideration section (4.8) describes the process of recruiting
participants.
119
4.4 Data Collection Method This study employs two types of questionnaire for collecting data from both lecturers
and students. In addition, the study also uses Focus Group Discussions (FGD) with
the alumni of accounting programs to triangulate data of ICAG collected from final-
year accounting students. The first questionnaire collected data from final-year
accounting students (QS) and the second questionnaire from accounting lecturers
(QL). The first questionnaire is designed to collect data on International Competency
of Accounting Graduates (ICAG), Student Engagement, Student Motivation
measured by Expectancy Theory, Comfort of Class Size, and Learning Facilities
based on students’ perceptions. These data are collected using a five-point Likert-
type scale. Moreover, the questionnaire also collects data on demographic
characteristics, students’ previous achievements during high schools, and Grade
Point Average (GPA).
The second questionnaire (QL) was devised to collect data from accounting
lecturers who have experience teaching students completing QS. In addition, QL
collects data on Student-Faculty Engagement, Motivation measured by Lecturer Job
Satisfaction, Comfort of Class Size, and Learning Facilities based on lecturers’
perceptions. In addition, the questionnaire also collects data on demographic and
academic characteristics. Appendix A1, A2, A3, and Appendix A4 provide actual
questionnaires (QS and QS) both in English and Indonesian languages. In relation to
FGD, Section 4.7 (Data Triangulation) discusses in more detail FGD data collection,
process, and questions used.
120
4.5 Instrument Measurement Since the study employs two QS and QL instruments, therefore the study also
describes measures used in both questionnaires. Student Engagement and Student-
Faculty Engagement have the same measures, since the questions for Student-Faculty
Engagement are the mirror of Student Engagement questions (Kuh, Nelson Laird &
Umbach 2004). Likewise, measures for ICAG based on AICPA core competencies
(Mula 2007; Wolcot, S. K. 2006) are the same in both QS and QL. Data on ICAG
(based on student perceptions) gauge what levels of competencies students learnt
from their university education. Thus, ICAG-Teaching Content (based on lecturer
perception) and ICAG (based on student perception) have the same measures. Lastly,
students and lecturers answer the same questions of Comfort of Class Size and
Learning Facilities.
As has been previously mentioned, the study uses indicators developed by
AICPA to measure ICAG/ICAG-Teaching Content. This construct consists of three
dimensions namely functional competencies, personal competencies, and broad-
business-perspective competencies (Bolt-Lee & Foster 2003; Foster, Bolt-Lee &
Colson 2002; Mula 2007; Wolcot, S. K. 2006). Moreover, functional competency
covers six competency areas (or questions), personal competencies consists of seven
competency areas, and broad-business perspective competency encompasses seven
competency areas (Mula 2007; Wolcot, S. K. 2006). The study adapted some
questions from the work of McVay (2008) and the rests of ICAG/ICAG-Teaching
Content questions were developed by the study.
As previously discussed in section 2.6.1, each area of competency consists of
more specific competency indicators. For example, Decision Modelling competency
121
consists of eight indicators (Mula 2007; Wolcot, S. K. 2006). Ideally, the study
should design each questions for each indicators. Nevertheless, this technique makes
the number of questions increase significantly. The study designs ICAG and ICAG-
Teaching Content questions based on the area of competencies (20 areas) by
providing key indicators in each question. This technique was successfully employed
by McVay et al. (2008) to design competency questionnaires. In addition, this
technique was also employed by Louisiana State University to measure personal
competency of accounting students (DeLaune 2004). In conclusion, the study takes
merits from the above works in developing questionnaire to measure AICPA core
competencies.
The questions used to measure Student Engagement are adopted from
AUSSE questionnaire (AUSSE 2010b) developed based on NSSE (2009)
questionnaire. AUSSE questions consist of six dimensions, but in some respects not
all dimensions are applicable in the context of Indonesian universities. Therefore, the
study employs five dimensions i.e. Student-Faculty Interaction, Active and
Collaborative Learning, Academic Challenge, Enriching Educational Experience,
and Supportive Learning Environment (Kinzie et al. 2007; Kuh 2006, 2009).
The study adapts questions for Student Motivation measured by Expectancy
Theory. This construct consists of six dimensions i.e. expectancy, extrinsic
instrumentality, intrinsic instrumentality, extrinsic valence, and intrinsic valence
(Chiang & Jang 2008; Chiang et al. 2008). The original scales were used to measure
motivation for hotel employees. Therefore the study makes some adaptations to
questions to ensure they are applicable to gauge student motivation.
122
Questions on Learning Facilities are developed based on some previous
findings. Academic support consists of libraries, laboratories, and computers (Dolan,
Jung Jr & Schmidt 1985). Class size is another type of learning facility, since it can
significantly impact Student Engagement (Chen, Lambert & Guidry 2010; Heiberger
& Harper 2008) and student achievements (Johnson 2010; Kokkelenberg, Dillon &
Christy 2008; Murdoch & Guy 2002). Therefore, the measures of Learning Facilities
are libraries, laboratories, and computers. Since the study collects data on class size
based on students’ and lecturers’ perceptions, it is not an exact number of students in
every class. Therefore, the study employs Comfort of Class Size to gauge how
comfortable students feel about class size.
In relation to observed variables, the study uses cumulative GPA as a proxy
for student achievements. In addition, the study also measures gender and age (Duff
2004; Strayhorn 2008) as demographic characteristics and average grades and
national grade average earned at high schools (Astin 1971; Credé & Kuncel 2008;
Duff 2004) as proxies for Student Previous Achievements. Moreover, the study also
collects additional data on academic characteristics i.e. previous school attended
(High School and Vocational High School) and previous majors (students’ majors
when they were in High School or Vocational High Schools). Data on previous
major will be grouped into two groups (Natural Sciences and Social Studies). These
observed variables are collected using a questionnaire for students (QS).
Questionnaire for lecturers (QL) has five similar latent constructs and only
one latent construct (Lecturers’ Job Satisfaction), which is different from QS
instrument. Student-Faculty Engagement, Comfort of Class Size, and Learning
Facilities are the same measures in both QS and QL. In relation to Lecturers’ Job
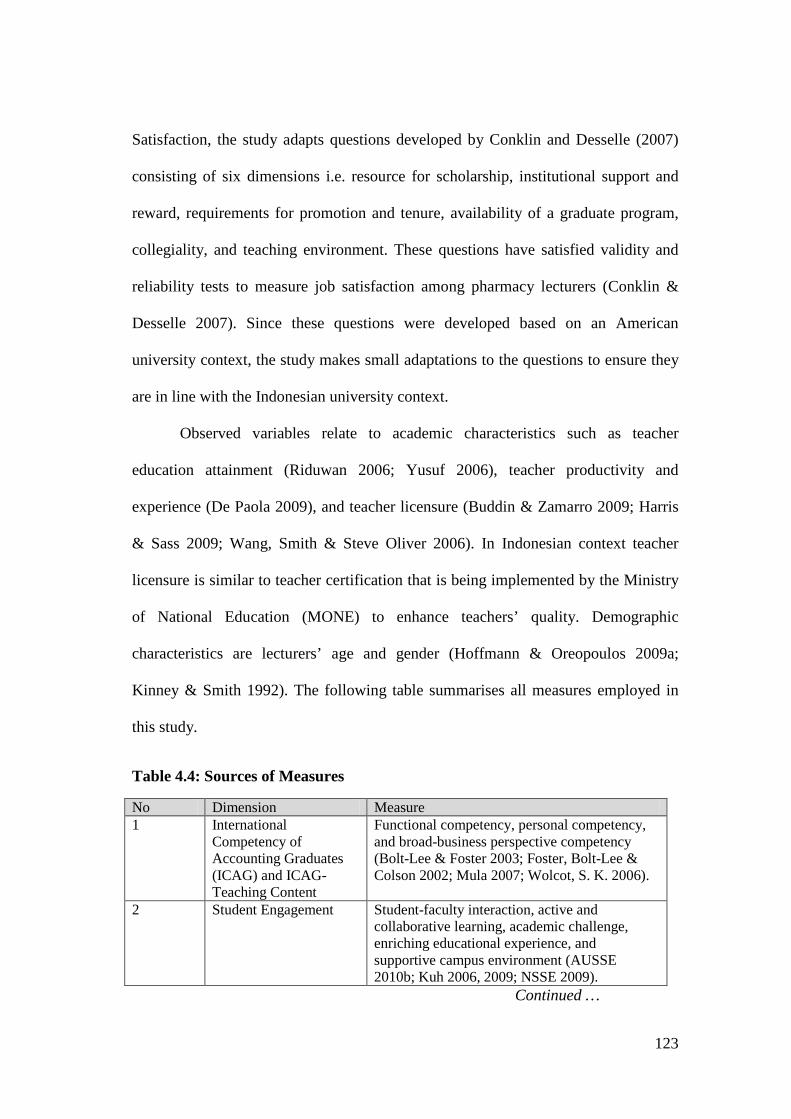
123
Satisfaction, the study adapts questions developed by Conklin and Desselle (2007)
consisting of six dimensions i.e. resource for scholarship, institutional support and
reward, requirements for promotion and tenure, availability of a graduate program,
collegiality, and teaching environment. These questions have satisfied validity and
reliability tests to measure job satisfaction among pharmacy lecturers (Conklin &
Desselle 2007). Since these questions were developed based on an American
university context, the study makes small adaptations to the questions to ensure they
are in line with the Indonesian university context.
Observed variables relate to academic characteristics such as teacher
education attainment (Riduwan 2006; Yusuf 2006), teacher productivity and
experience (De Paola 2009), and teacher licensure (Buddin & Zamarro 2009; Harris
& Sass 2009; Wang, Smith & Steve Oliver 2006). In Indonesian context teacher
licensure is similar to teacher certification that is being implemented by the Ministry
of National Education (MONE) to enhance teachers’ quality. Demographic
characteristics are lecturers’ age and gender (Hoffmann & Oreopoulos 2009a;
Kinney & Smith 1992). The following table summarises all measures employed in
this study.
Table 4.4: Sources of Measures
No Dimension Measure 1 International
Competency of Accounting Graduates (ICAG) and ICAG-Teaching Content
Functional competency, personal competency, and broad-business perspective competency (Bolt-Lee & Foster 2003; Foster, Bolt-Lee & Colson 2002; Mula 2007; Wolcot, S. K. 2006).
2 Student Engagement Student-faculty interaction, active and collaborative learning, academic challenge, enriching educational experience, and supportive campus environment (AUSSE 2010b; Kuh 2006, 2009; NSSE 2009).
Continued …
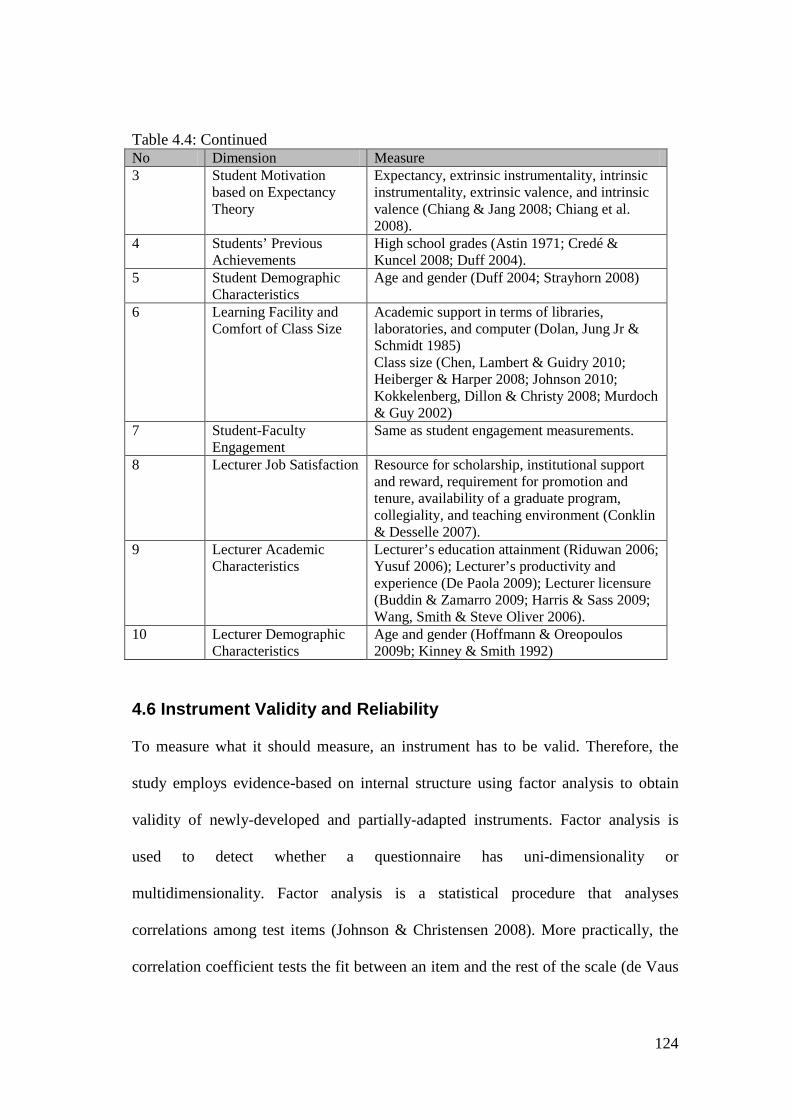
124
Table 4.4: Continued No Dimension Measure 3 Student Motivation
based on Expectancy Theory
Expectancy, extrinsic instrumentality, intrinsic instrumentality, extrinsic valence, and intrinsic valence (Chiang & Jang 2008; Chiang et al. 2008).
4 Students’ Previous Achievements
High school grades (Astin 1971; Credé & Kuncel 2008; Duff 2004).
5 Student Demographic Characteristics
Age and gender (Duff 2004; Strayhorn 2008)
6 Learning Facility and Comfort of Class Size
Academic support in terms of libraries, laboratories, and computer (Dolan, Jung Jr & Schmidt 1985) Class size (Chen, Lambert & Guidry 2010; Heiberger & Harper 2008; Johnson 2010; Kokkelenberg, Dillon & Christy 2008; Murdoch & Guy 2002)
7 Student-Faculty Engagement
Same as student engagement measurements.
8 Lecturer Job Satisfaction Resource for scholarship, institutional support and reward, requirement for promotion and tenure, availability of a graduate program, collegiality, and teaching environment (Conklin & Desselle 2007).
9 Lecturer Academic Characteristics
Lecturer’s education attainment (Riduwan 2006; Yusuf 2006); Lecturer’s productivity and experience (De Paola 2009); Lecturer licensure (Buddin & Zamarro 2009; Harris & Sass 2009; Wang, Smith & Steve Oliver 2006).
10 Lecturer Demographic Characteristics
Age and gender (Hoffmann & Oreopoulos 2009b; Kinney & Smith 1992)
4.6 Instrument Validity and Reliability To measure what it should measure, an instrument has to be valid. Therefore, the
study employs evidence-based on internal structure using factor analysis to obtain
validity of newly-developed and partially-adapted instruments. Factor analysis is
used to detect whether a questionnaire has uni-dimensionality or
multidimensionality. Factor analysis is a statistical procedure that analyses
correlations among test items (Johnson & Christensen 2008). More practically, the
correlation coefficient tests the fit between an item and the rest of the scale (de Vaus
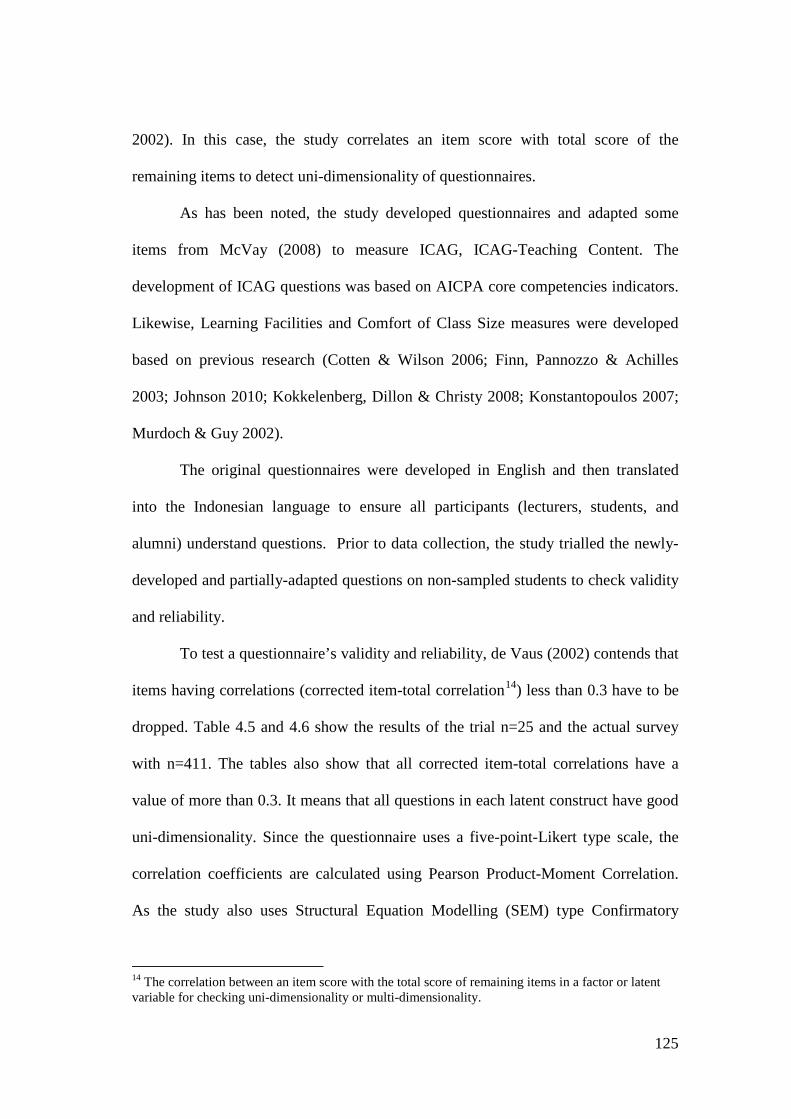
125
2002). In this case, the study correlates an item score with total score of the
remaining items to detect uni-dimensionality of questionnaires.
As has been noted, the study developed questionnaires and adapted some
items from McVay (2008) to measure ICAG, ICAG-Teaching Content. The
development of ICAG questions was based on AICPA core competencies indicators.
Likewise, Learning Facilities and Comfort of Class Size measures were developed
based on previous research (Cotten & Wilson 2006; Finn, Pannozzo & Achilles
2003; Johnson 2010; Kokkelenberg, Dillon & Christy 2008; Konstantopoulos 2007;
Murdoch & Guy 2002).
The original questionnaires were developed in English and then translated
into the Indonesian language to ensure all participants (lecturers, students, and
alumni) understand questions. Prior to data collection, the study trialled the newly-
developed and partially-adapted questions on non-sampled students to check validity
and reliability.
To test a questionnaire’s validity and reliability, de Vaus (2002) contends that
items having correlations (corrected item-total correlation14) less than 0.3 have to be
dropped. Table 4.5 and 4.6 show the results of the trial n=25 and the actual survey
with n=411. The tables also show that all corrected item-total correlations have a
value of more than 0.3. It means that all questions in each latent construct have good
uni-dimensionality. Since the questionnaire uses a five-point-Likert type scale, the
correlation coefficients are calculated using Pearson Product-Moment Correlation.
As the study also uses Structural Equation Modelling (SEM) type Confirmatory
14 The correlation between an item score with the total score of remaining items in a factor or latent variable for checking uni-dimensionality or multi-dimensionality.
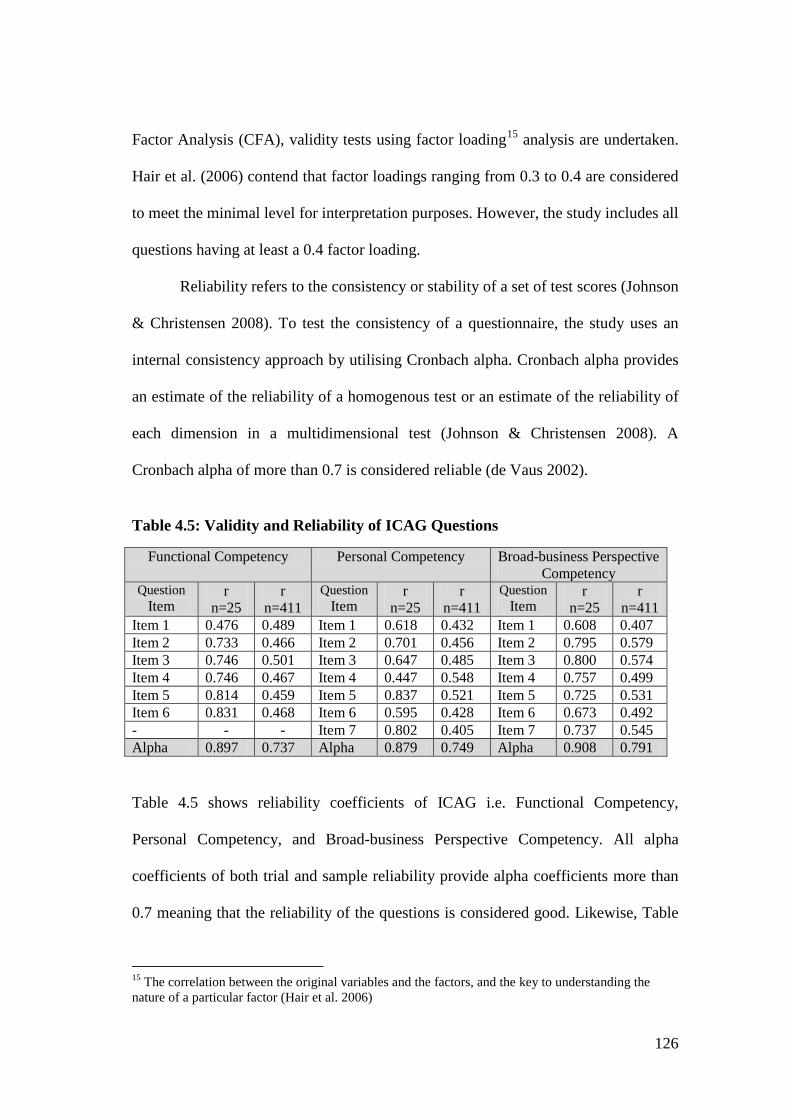
126
Factor Analysis (CFA), validity tests using factor loading15 analysis are undertaken.
Hair et al. (2006) contend that factor loadings ranging from 0.3 to 0.4 are considered
to meet the minimal level for interpretation purposes. However, the study includes all
questions having at least a 0.4 factor loading.
Reliability refers to the consistency or stability of a set of test scores (Johnson
& Christensen 2008). To test the consistency of a questionnaire, the study uses an
internal consistency approach by utilising Cronbach alpha. Cronbach alpha provides
an estimate of the reliability of a homogenous test or an estimate of the reliability of
each dimension in a multidimensional test (Johnson & Christensen 2008). A
Cronbach alpha of more than 0.7 is considered reliable (de Vaus 2002).
Table 4.5: Validity and Reliability of ICAG Questions
Functional Competency Personal Competency Broad-business Perspective Competency
Question Item
r n=25
r n=411
Question Item
r n=25
r n=411
Question Item
r n=25
r n=411
Item 1 0.476 0.489 Item 1 0.618 0.432 Item 1 0.608 0.407 Item 2 0.733 0.466 Item 2 0.701 0.456 Item 2 0.795 0.579 Item 3 0.746 0.501 Item 3 0.647 0.485 Item 3 0.800 0.574 Item 4 0.746 0.467 Item 4 0.447 0.548 Item 4 0.757 0.499 Item 5 0.814 0.459 Item 5 0.837 0.521 Item 5 0.725 0.531 Item 6 0.831 0.468 Item 6 0.595 0.428 Item 6 0.673 0.492 - - - Item 7 0.802 0.405 Item 7 0.737 0.545 Alpha 0.897 0.737 Alpha 0.879 0.749 Alpha 0.908 0.791
Table 4.5 shows reliability coefficients of ICAG i.e. Functional Competency,
Personal Competency, and Broad-business Perspective Competency. All alpha
coefficients of both trial and sample reliability provide alpha coefficients more than
0.7 meaning that the reliability of the questions is considered good. Likewise, Table
15 The correlation between the original variables and the factors, and the key to understanding the nature of a particular factor (Hair et al. 2006)
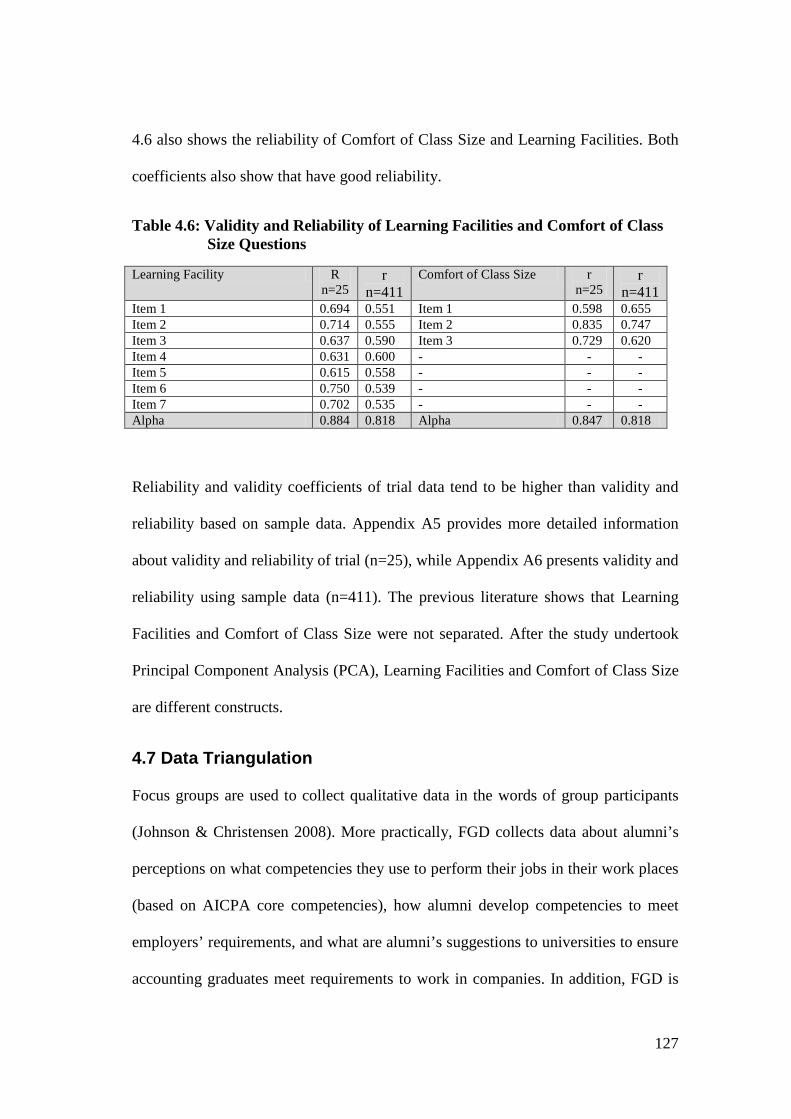
127
4.6 also shows the reliability of Comfort of Class Size and Learning Facilities. Both
coefficients also show that have good reliability.
Table 4.6: Validity and Reliability of Learning Facilities and Comfort of Class
Size Questions
Learning Facility R n=25
r n=411
Comfort of Class Size r n=25
r n=411
Item 1 0.694 0.551 Item 1 0.598 0.655 Item 2 0.714 0.555 Item 2 0.835 0.747 Item 3 0.637 0.590 Item 3 0.729 0.620 Item 4 0.631 0.600 - - - Item 5 0.615 0.558 - - - Item 6 0.750 0.539 - - - Item 7 0.702 0.535 - - - Alpha 0.884 0.818 Alpha 0.847 0.818
Reliability and validity coefficients of trial data tend to be higher than validity and
reliability based on sample data. Appendix A5 provides more detailed information
about validity and reliability of trial (n=25), while Appendix A6 presents validity and
reliability using sample data (n=411). The previous literature shows that Learning
Facilities and Comfort of Class Size were not separated. After the study undertook
Principal Component Analysis (PCA), Learning Facilities and Comfort of Class Size
are different constructs.
4.7 Data Triangulation Focus groups are used to collect qualitative data in the words of group participants
(Johnson & Christensen 2008). More practically, FGD collects data about alumni’s
perceptions on what competencies they use to perform their jobs in their work places
(based on AICPA core competencies), how alumni develop competencies to meet
employers’ requirements, and what are alumni’s suggestions to universities to ensure
accounting graduates meet requirements to work in companies. In addition, FGD is
128
also used to triangulate ICAG data collected from students using questionnaires.
Triangulation means cross-checking information and conclusions through the use of
multiple procedures or sources (Johnson & Christensen 2008). In this case the study
employs triangulation of method meaning that the study uses qualitative and
quantitative styles of research and data (Neuman 2000). The participants of FGDs are
accounting alumni from various universities who have significant experience
working in some sectors such as banking, NGO, trading, service, and industry.
To ensure a FGD will achieve its objectives, the study uses a FGD guide
consisting of three main parts i.e. the explanation about the purpose of FGD,
introduction of participants and facilitators, and main discussion. Main discussion
consists of three themes, functional competency, personal competency, and broad-
business perspective competency. Discussion on each theme comprises eight
activities i.e. (1) delivering definition of competency and asking key competencies
that participants need to complete their jobs; (2) encouraging participants to explain
more about competencies they have already identified to perform their jobs; (3)
asking on how participants gained their competencies; (4) discussing problems of
improving competencies; (5) asking about the extent of students’ competencies right
after their graduation; (6) discussing connections between competencies participants
gained from university education and competencies they use at work places; and (7)
encouraging participants to provide suggestions to universities to ensure graduates
will have sufficient competencies; and (8) asking participants to rank AICPA core
competency areas based on the importance for working. The discussion takes
approximately 1.5 to 2 hours. The process of FGD with alumni will be electronically
129
recoded with permission from participants. For detailed information about FGD
guides refer to Appendix A7 and A8.
4.8 Ethical Consideration To ensure research does not violate other parties’ rights, the study strictly complies
with research ethics imposed. In addition, adherence to research ethics also impacts
on the quality of research. Zikmund et al. (2010) contends that research works best
when all parties (researcher, client, and subject) act ethically. More pointedly, each
party has an obligation to be fulfilled to other parties, but at the same time each party
also has rights which must be received from other parties. The following discusses
two main issues relating to ethical consideration i.e. informed consent and plain
language.
Informed consent is agreement to participate in a study after being informed
of its purpose, procedure, risks, benefits, alternative procedures, and limits of
confidentiality (Johnson & Christensen 2008). In relation to this issue, the study
obtained four levels of informed consent i.e. informed consent from Deans of
Economics Faculties at sampled universities, as well as informed consent from
lecturers, students, and alumni. Prior to data collection from accounting departments
in sampled universities, emails were sent to the Deans of Economics Faculties for
approval to conduct research in their faculties. Deans, in this case, have full rights to
accept or reject an application for research in their institutions.
Likewise, before a person can participate in a research study, the researcher
must give the prospective participant a description of all the features of the study that
might reasonably influence his or her willingness to participate (Johnson &
130
Christensen 2008). Therefore, before deciding to participate in the survey, students
and lecturers receive a participant information sheet. In addition, a brief verbal
explanation about the research is given to participants. Since the study uses an
anonymous survey for participants, the submission of a completed survey is an
agreement to participate in the study. Moreover, the study also provided small token
(a plastic folder, two pens, and a pencil) to all survey participants (students and
lecturers).
In relation to FGD participants, the study recruited alumni by calling them to
participate in a FGD. Before an alumnus made a decision, a verbal explanation about
the study was briefly given. A FGD participant has rights to participate in and
withdraw from a FGD. If alumni agree to participate in a FGD, they are asked to sign
a consent form. Moreover, all FGD participants also receive a list of questions, and
participant information sheet. Since, FGD takes place between 1.5 to 2 hours, food
and drink are also available. A transportation fee is also provided, because alumni are
coming from areas far from venues of FGD. Lastly, all respondents (lecturers,
students, and alumni) are supplied with email address and telephone number of
Ethics and Research Integrity Officer for contact if this study violates their rights or
welfare.
Plain language is used to explain the study briefly to ensure all participants
(lecturers, students, and alumni) understand the study. Besides providing each
participant with an information sheet in Indonesian language, an orally explanation is
provided to improve participants’ understanding of the study. Prior to using a
translated-information sheet, some Indonesian students are asked to read it to ensure
the language and information are properly presented.
131
4.9 Data Analysis
Since data are collected from three sources—students, lecturers, and alumni—the
study analyses these data separately. There are three types of analyses i.e.
descriptive, interpretive, and qualitative. Descriptive and interpretive statistics are
employed to analyse quantitative data, while qualitative analysis is on data collected
from FGDs. In relation to interpretive or inferential analysis, the study employs three
statistical techniques i.e. correlation, regression, Structural Equation Modelling
(SEM) with single indicators, Path analysis, and non-parametric analysis.
Correlation is intended to find separate associations among variables of input
with other variables of process, as well as variables of output. Regression analyses
are used to test relationships among input, process/environment, and output. SEM
with single composite indicator and Path analysis are used to identify relationships
among inputs, processes, and outputs simultaneously. Lastly, non-parametric
analysis is employed to correlate aggregate data based on student and lecturer
perceptions.
4.9.1 Descriptive
Descriptive analyses are intended to analyse nominal, ordinal, and interval data16.
Descriptive statistics are those that summarise patterns in responses from cases in a
sample (de Vaus 2002). More specifically, some data are presented in the form of
tables to scrutinise tendency of a certain set of data. Likewise, charts or graphs are
also used to provide clearer visual depictions on a certain data set. Lastly, descriptive
16 Nominal data is obtained from category classification e.g. female and male. Ordinal data is collected from order magnitude classification e.g. small, medium, large, and extra large. Interval data is data representing the exact value or quantity of an object being measured e.g. GPA.
132
statistics such as mean and standard deviation are also utilised to provide snapshots
that point to more interpretive analysis.
4.9.2 Interpretive As suggested by Astin (1993a), to identify relationships among inputs, environments,
and outputs, the study employs correlation and regression analyses. However, to
identify relationships between inputs, processes, and outputs simultaneously, the
study employs SEM and Path analysis.
Correlation
The study employs Pearson’s Product Moment correlation to identify the degree to
which two variables (X and Y variable) are associated and considers the correlation
as a linear relationship17. In addition, a conceptual model developed by the study
focuses on building relationships between variables within the three educational
constructs. Correlation matrices18 are used to identify patterns of relationships
between variables.
Regression As previously mentioned, the study employs I-E-O model proposed by Astin (1993a)
where inputs affect environment (Student Engagement) and outputs and environment
influencing output. Therefore, the study uses regression to validate the model by
regressing an input on environment and output. At the same time the study also
17 The decrease or increase of variable X will be followed by decrease or increase of variable Y in a consistent way. 18 A matrix that consists of correlation coefficients to show relationships among variables are analysed.
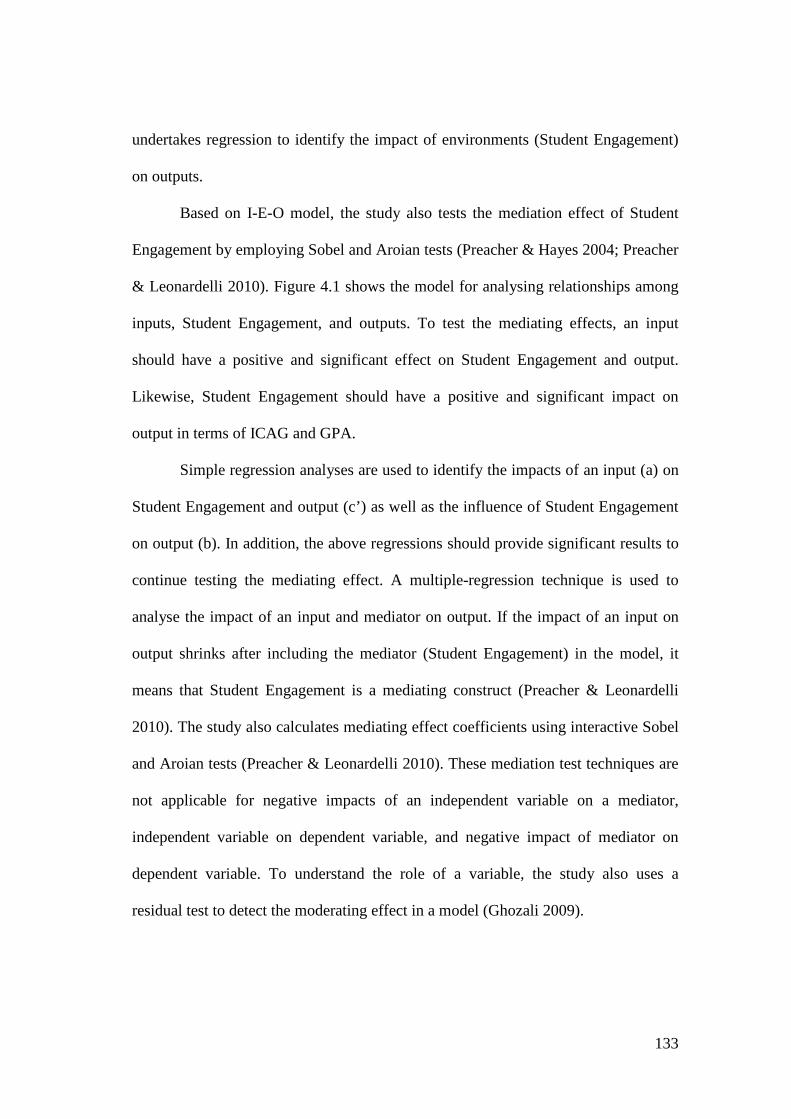
133
undertakes regression to identify the impact of environments (Student Engagement)
on outputs.
Based on I-E-O model, the study also tests the mediation effect of Student
Engagement by employing Sobel and Aroian tests (Preacher & Hayes 2004; Preacher
& Leonardelli 2010). Figure 4.1 shows the model for analysing relationships among
inputs, Student Engagement, and outputs. To test the mediating effects, an input
should have a positive and significant effect on Student Engagement and output.
Likewise, Student Engagement should have a positive and significant impact on
output in terms of ICAG and GPA.
Simple regression analyses are used to identify the impacts of an input (a) on
Student Engagement and output (c’) as well as the influence of Student Engagement
on output (b). In addition, the above regressions should provide significant results to
continue testing the mediating effect. A multiple-regression technique is used to
analyse the impact of an input and mediator on output. If the impact of an input on
output shrinks after including the mediator (Student Engagement) in the model, it
means that Student Engagement is a mediating construct (Preacher & Leonardelli
2010). The study also calculates mediating effect coefficients using interactive Sobel
and Aroian tests (Preacher & Leonardelli 2010). These mediation test techniques are
not applicable for negative impacts of an independent variable on a mediator,
independent variable on dependent variable, and negative impact of mediator on
dependent variable. To understand the role of a variable, the study also uses a
residual test to detect the moderating effect in a model (Ghozali 2009).
134
Source: Preacher and Leonardelli (2010)
In undertaking a multiple-regression technique, the study also considers some
classical assumption tests i.e. Multicollinearity, Homoscedasticity, and Normality.
Multicolliniearity is substantial correlations among independent variables or
predictors (Tacq 1997). This multicolliniearity can be detected using a Variance
Inflation Factor (VIF) in a regression model. A value of VIF less than 10 is
acceptable (Ghozali 2009; Nadiri & Tümer 2010). Homoscedasticity refers to
dispersions of the dependent variable within cells must not differ significantly (Tacq
1997). The study uses a Scatter plot technique to detect homoscedasticity; the scatter
plot should not have certain pattern (Ghozali 2009). Lastly, the study uses a P-P Plot
technique for detecting Normality (Ghozali 2009).
Non-parametric
Some data from lecturers and students should be correlated such as Student
Engagement and Student-Faculty Engagement based on student and lecturer
perceptions respectively. Even though, the questionnaires for both have the same
indicators, correlation between these two engagements could not be tested using
common parametric analysis. Data aggregation of students and lecturers based on
university level will provide data for non-parametric analysis. King as cited in
c’
b a
Independent Variable
Mediator
Dependent Variable
Figure 4.1: Model for Testing Mediating Effect
135
(Umbach & Wawrzynski 2005) contends that this analysis has a flaw, since
individual differences, teachers’ and students’ perspectives on engagement, are
masked. The number of universities in this study does not meet the requirement for
employing parametric multi-level analysis such as Hierarchical Linear Modelling
(HLM), since the number of groups, in this case universities, should be at least 30
groups (Porter 2005). Therefore, the associations between aggregate lecturers’ and
students’ data such as Student Engagement and Student-Faculty Engagement will be
analysed using non-parametric analysis19.
In relation to this, the study employs The Kendall rank order correlation (T or
Kendall’s τ). The analysis is undertaken to provide more information about the
correlation between aggregate lecturers’ and students’ data, since the number of N
does not meet requirement for undertaking parametric analysis. Siegel and Castellan
Jr. (1988) contended that τ gives a measure of the degree of association or
correlation between the two sets of ranks.
Based on Figure 3.2 and 3.3 (conceptual model based on lecturers’ and
students’ perceptions and comprehensive model), non-parametric analysis is
undertaken to provide some rough snapshots of relationships between a certain set of
data based on lecturers’ and students’ perceptions. Referring to Figure 3.2,
Conceptual Model Based on Lecturers’ Perception, the study uses non-parametric
analysis to correlate two variables connected by dashed-lines.
19 Non-parametric are techniques of analyses that do not need the assumption of a normal probability distribution.
136
Structural Equation Modelling Conceptual models consisting of many variables and correlations are tested by using
Structural Equation Modelling (SEM)20. The SEM approach is a comprehensive and
flexible approach to research design and data analysis (Hoyle 1996). Moreover,
Confirmatory Factor Analysis (CFA) is employed to analyse relationships, since the
study identifies relationships among variables within constructs of inputs, processes,
and outputs.
The study develops two types of models i.e. student and lecturer models. The
study uses Input-Process-Output approach with some latent variables. Owing to the
large number of indicators, the study employs a single-composite-indicator
technique.21 The procedures of calculating single-composite indicator are as follows:
(1) calculating composite reliability; (2) calculating factor loading for composite
indicator; (3) calculating variance error for composite indicator; and (4) assigning
loading factor composite into the model (Ghozali 2007; Rowe 2002).
To check the fit of the model being tested, SEM analysis provides a
technique, Goodness of Fit, by calculating some indices i.e. Chi Square Statistic,
Root Mean Square Error of Approximation (RMSEA), Goodness of Fit Index (GFI),
Adjusted Goodness Fit Index (AGFI), Normed-Fit Index (NFI), and Data Normality
Test (Byrne 2001; Ghozali 2007; Mulaik et al. 1989). Chi Square is used to assess
actual and predicted matrices (Hoe 2008). An insignificant value of Chi Square is
one indicator that the model has a good fit (Ghozali 2007), because actual and
predicted matrices are not statistically different. To obtain an insignificant Chi 20 SEM is a statistical method combining factor analysis and simultaneous equation modelling (Ghozali 2007). 21 One latent variable will be represented by single indicator to avoid an intricate and crowded model of analysis.
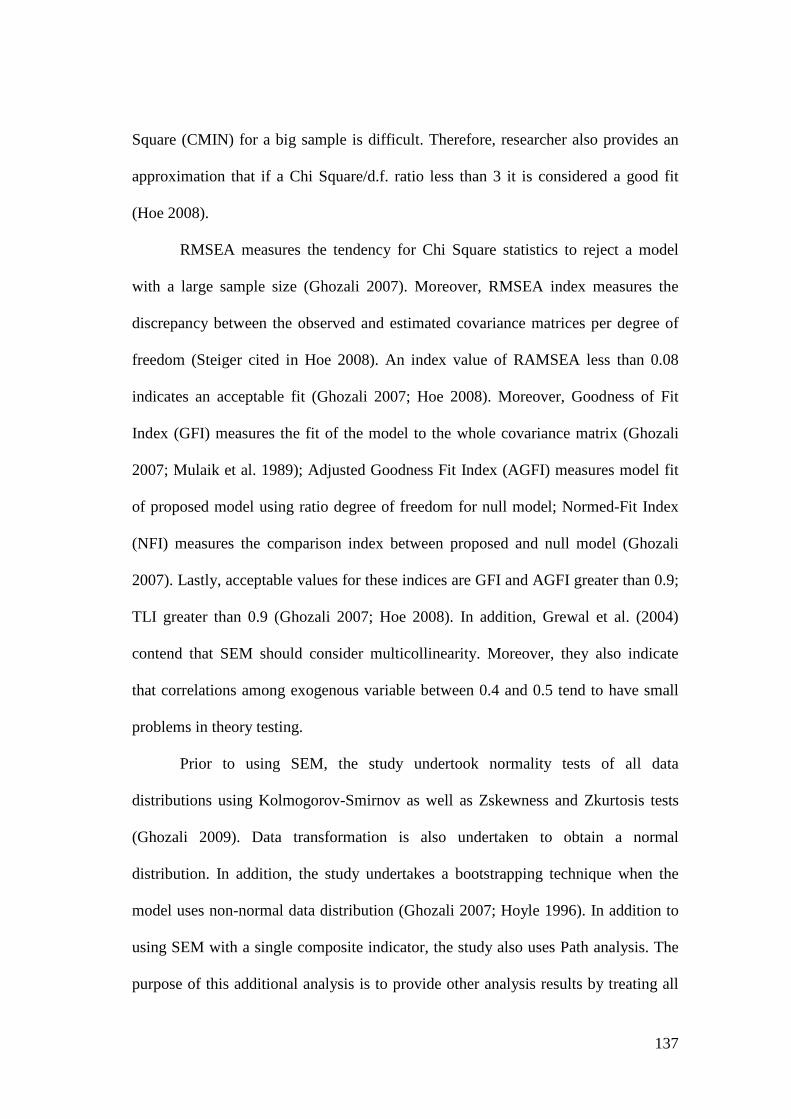
137
Square (CMIN) for a big sample is difficult. Therefore, researcher also provides an
approximation that if a Chi Square/d.f. ratio less than 3 it is considered a good fit
(Hoe 2008).
RMSEA measures the tendency for Chi Square statistics to reject a model
with a large sample size (Ghozali 2007). Moreover, RMSEA index measures the
discrepancy between the observed and estimated covariance matrices per degree of
freedom (Steiger cited in Hoe 2008). An index value of RAMSEA less than 0.08
indicates an acceptable fit (Ghozali 2007; Hoe 2008). Moreover, Goodness of Fit
Index (GFI) measures the fit of the model to the whole covariance matrix (Ghozali
2007; Mulaik et al. 1989); Adjusted Goodness Fit Index (AGFI) measures model fit
of proposed model using ratio degree of freedom for null model; Normed-Fit Index
(NFI) measures the comparison index between proposed and null model (Ghozali
2007). Lastly, acceptable values for these indices are GFI and AGFI greater than 0.9;
TLI greater than 0.9 (Ghozali 2007; Hoe 2008). In addition, Grewal et al. (2004)
contend that SEM should consider multicollinearity. Moreover, they also indicate
that correlations among exogenous variable between 0.4 and 0.5 tend to have small
problems in theory testing.
Prior to using SEM, the study undertook normality tests of all data
distributions using Kolmogorov-Smirnov as well as Zskewness and Zkurtosis tests
(Ghozali 2009). Data transformation is also undertaken to obtain a normal
distribution. In addition, the study undertakes a bootstrapping technique when the
model uses non-normal data distribution (Ghozali 2007; Hoyle 1996). In addition to
using SEM with a single composite indicator, the study also uses Path analysis. The
purpose of this additional analysis is to provide other analysis results by treating all
138
latent variables as observed variables; the scores of all indicators within latent
variables are summed. All SEM and Path analyses use the same goodness fit indices.
Table 4.7 provides a summary of indices.
Table 4.7: Summary of Goodness of Fit Index
No Goodness of Fit Meaning Standard 1 Chi Square/CMIN Assessing actual and predicted matrices Insignificant 2 GFI Measuring the fit of the model to the whole
covariance matrix >0.90
3 AGFI Measures model fit of proposed model using ratio degree of freedom for null model
>0.90
4 RMSEA Tendency Chi-square statistic rejects the model with large sample size
< 0.08
5 NFI The comparison index between proposed and null model
>0.90
6 Multicolliniearity Measuring correlation among exogenous variables
0.4 to 0.5
Source: Ghozali (2007), Hoe (2008), and Grewal et al. (2004), Mulaik et al. (1989) 4.9.3 Qualitative Analysis As previously mentioned, the study also uses FGD for collecting data from
accounting alumni. To analyse qualitative data, the study employs a Constant
Comparison/Grounded Theory method. Strauss (1987) contends that the procedures
of Constant Comparison analysis are as follows: (1) Transcribing the process of
FGD; (2) Coding the transcription using selective coding technique; (3) Grouping the
data based on AICPA core competencies (finding consistencies and differences); and
(4) Making memos on the comparison as well as making memos on new-emerging
categories.
4.10 Conclusion
Firstly, the chapter discusses the population, all final-year accounting students at
state universities in Indonesia. Two-stage sampling is employed to select universities
139
based on accreditation level and location as well as to select students and lecturers at
selected universities. Surveys are used for collecting data from students and lecturers
while focus groups are employed to collect qualitative data from alumni for
triangulating data of accounting competencies. Instruments are developed by the
study and adapted from previous research. Instrument validity using Corrected Item-
Total Correlation analysis, and instrument reliability analysed using Cronbach alpha
are also discussed.
Second, ethical consideration consisting of informed consent and plain
language are discussed in this chapter to ascertain if the study complies with ethics
and research integrity, and protecting participants’ rights and welfare. Finally, data
analyses consisting of descriptive, correlation, regression, non-parametric, SEM,
Path Analysis as well as qualitative analyses are discussed separately. The results of
analysis and discussions are presented in the following chapter.
140
CHAPTER 5: ANALYSES AND FINDINGS
5.1 Introduction 5.7 Correlation Analysis for Lecturer Data 5.2 Sample Used in Empirical Test 5.8 Structural Equation Modelling Analysis
for Lecturer Data 5.3 Descriptive Statistics of Student Data 5.9 Lecturer and Student Data Correlation 5.4 Correlation Analyses for Student Data 5.10 Qualitative Analysis for Triangulating
ICAG 5.5 Structural Equation Modelling Analysis for Student Data
5.11 Hypothesis Testing Summary
5.6 Descriptive Statistics for Lecturer Data 5.12 Conclusion
5.1 Introduction Quantitative and qualitative analyses and findings are presented in this chapter. Four
quantitative analysis techniques i.e. descriptive, correlation, regression, non-
parametric, and structural equation modelling are undertaken to provide descriptions,
and to test hypotheses as well as to establish models of relationships among three
constructs of education. In order to maintain anonymity, the study does not identify
the names of respondents (students, lecturers, alumni) and universities. The study
will assign U-1 to U-8 to refer to universities’ names.
This chapter begins with a profile of respondents from eight universities both
students and lecturers. A profile of alumni as participants of Focus Group Discussion
(FGD) will be presented for qualitative analysis for triangulating ICAG (Section
5.10). Descriptions of student and lecturer respondents are mainly focused on
proportions based on institutions, locations, accreditation, and respondents’
demographic characteristics.
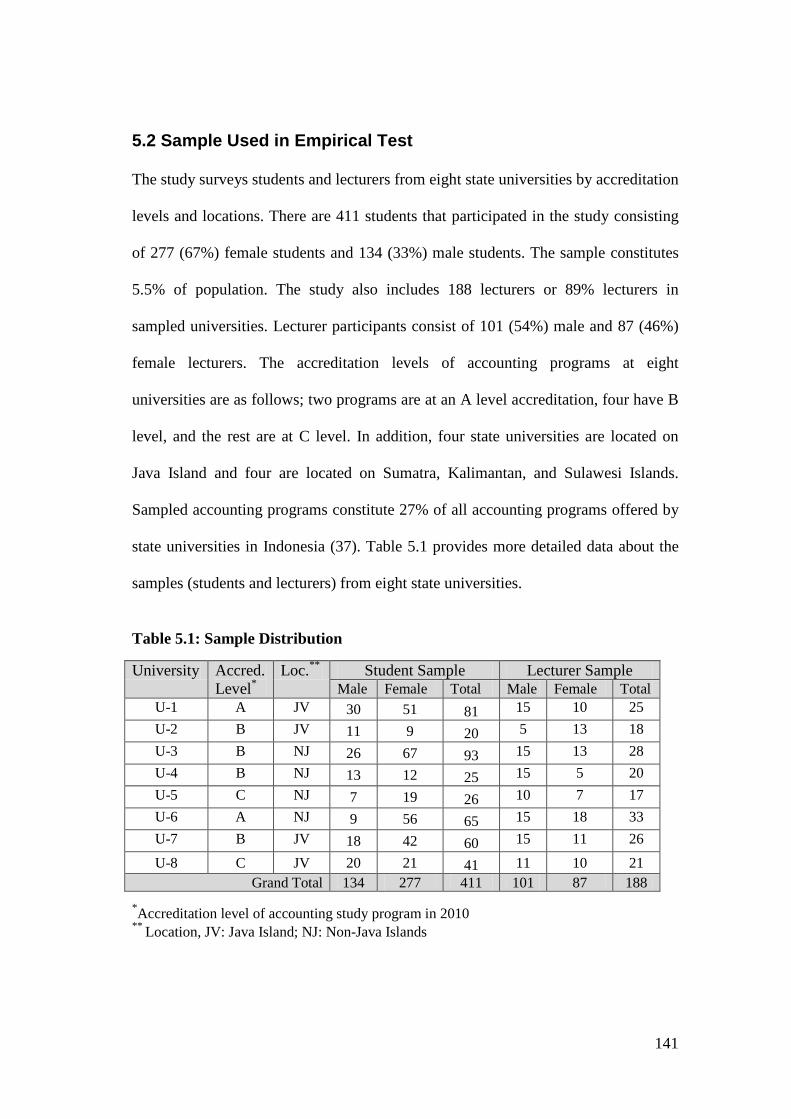
141
5.2 Sample Used in Empirical Test The study surveys students and lecturers from eight state universities by accreditation
levels and locations. There are 411 students that participated in the study consisting
of 277 (67%) female students and 134 (33%) male students. The sample constitutes
5.5% of population. The study also includes 188 lecturers or 89% lecturers in
sampled universities. Lecturer participants consist of 101 (54%) male and 87 (46%)
female lecturers. The accreditation levels of accounting programs at eight
universities are as follows; two programs are at an A level accreditation, four have B
level, and the rest are at C level. In addition, four state universities are located on
Java Island and four are located on Sumatra, Kalimantan, and Sulawesi Islands.
Sampled accounting programs constitute 27% of all accounting programs offered by
state universities in Indonesia (37). Table 5.1 provides more detailed data about the
samples (students and lecturers) from eight state universities.
Table 5.1: Sample Distribution
University Accred. Level*
Loc.** Student Sample Lecturer Sample Male Female Total Male Female Total
U-1 A JV 30 51 81 15 10 25 U-2 B JV 11 9 20 5 13 18 U-3 B NJ 26 67 93 15 13 28 U-4 B NJ 13 12 25 15 5 20 U-5 C NJ 7 19 26 10 7 17 U-6 A NJ 9 56 65 15 18 33 U-7 B JV 18 42 60 15 11 26 U-8 C JV 20 21 41 11 10 21
Grand Total 134 277 411 101 87 188
*Accreditation level of accounting study program in 2010 ** Location, JV: Java Island; NJ: Non-Java Islands
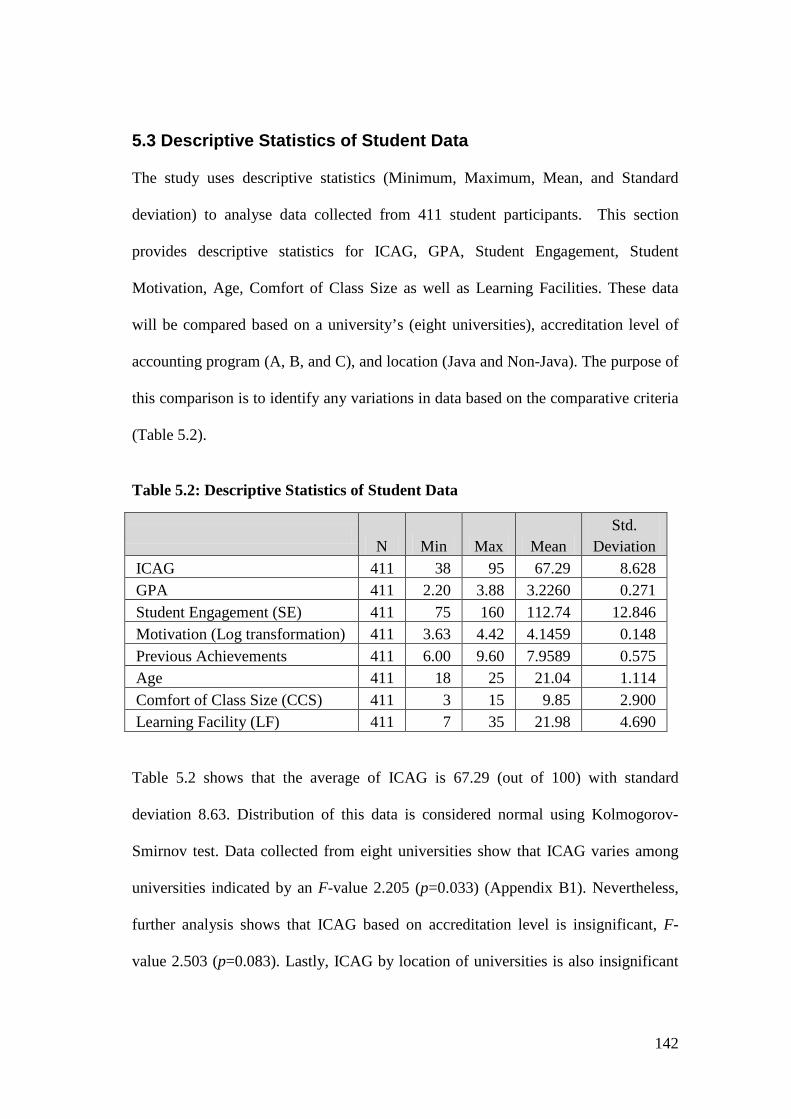
142
5.3 Descriptive Statistics of Student Data The study uses descriptive statistics (Minimum, Maximum, Mean, and Standard
deviation) to analyse data collected from 411 student participants. This section
provides descriptive statistics for ICAG, GPA, Student Engagement, Student
Motivation, Age, Comfort of Class Size as well as Learning Facilities. These data
will be compared based on a university’s (eight universities), accreditation level of
accounting program (A, B, and C), and location (Java and Non-Java). The purpose of
this comparison is to identify any variations in data based on the comparative criteria
(Table 5.2).
Table 5.2: Descriptive Statistics of Student Data
N Min Max Mean
Std. Deviation
ICAG 411 38 95 67.29 8.628 GPA 411 2.20 3.88 3.2260 0.271 Student Engagement (SE) 411 75 160 112.74 12.846 Motivation (Log transformation) 411 3.63 4.42 4.1459 0.148 Previous Achievements 411 6.00 9.60 7.9589 0.575 Age 411 18 25 21.04 1.114 Comfort of Class Size (CCS) 411 3 15 9.85 2.900 Learning Facility (LF) 411 7 35 21.98 4.690 Table 5.2 shows that the average of ICAG is 67.29 (out of 100) with standard
deviation 8.63. Distribution of this data is considered normal using Kolmogorov-
Smirnov test. Data collected from eight universities show that ICAG varies among
universities indicated by an F-value 2.205 (p=0.033) (Appendix B1). Nevertheless,
further analysis shows that ICAG based on accreditation level is insignificant, F-
value 2.503 (p=0.083). Lastly, ICAG by location of universities is also insignificant
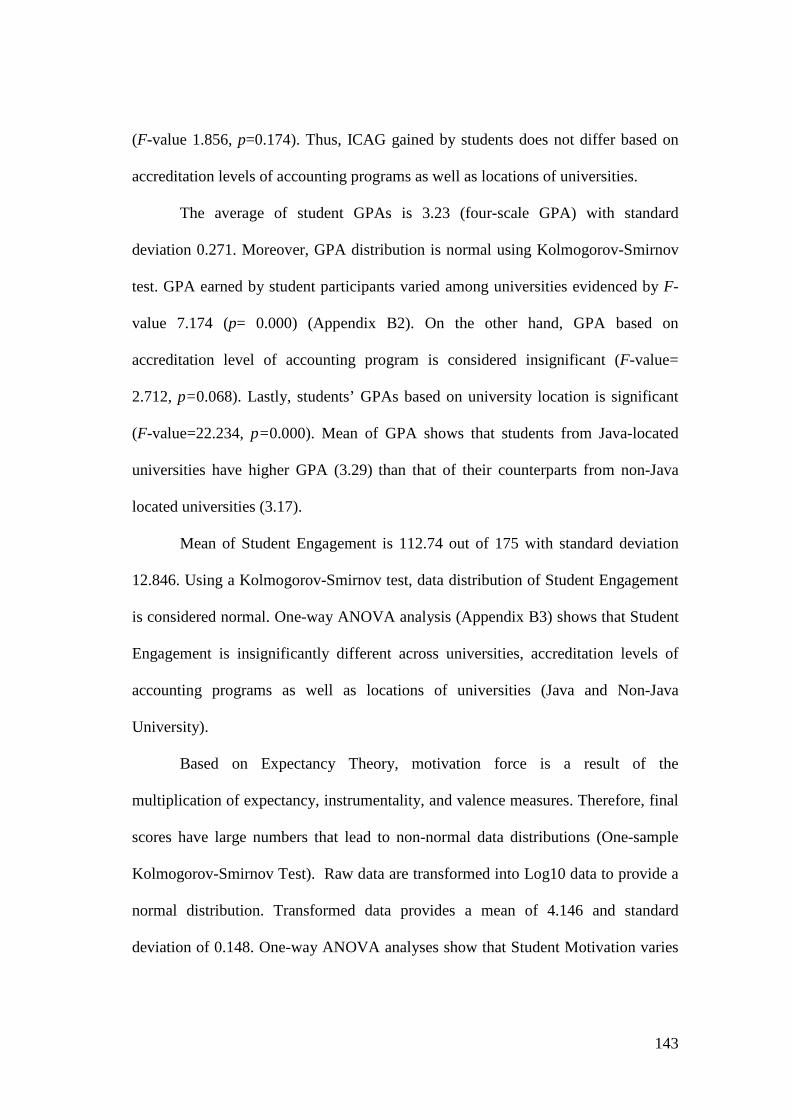
143
(F-value 1.856, p=0.174). Thus, ICAG gained by students does not differ based on
accreditation levels of accounting programs as well as locations of universities.
The average of student GPAs is 3.23 (four-scale GPA) with standard
deviation 0.271. Moreover, GPA distribution is normal using Kolmogorov-Smirnov
test. GPA earned by student participants varied among universities evidenced by F-
value 7.174 (p= 0.000) (Appendix B2). On the other hand, GPA based on
accreditation level of accounting program is considered insignificant (F-value=
2.712, p=0.068). Lastly, students’ GPAs based on university location is significant
(F-value=22.234, p=0.000). Mean of GPA shows that students from Java-located
universities have higher GPA (3.29) than that of their counterparts from non-Java
located universities (3.17).
Mean of Student Engagement is 112.74 out of 175 with standard deviation
12.846. Using a Kolmogorov-Smirnov test, data distribution of Student Engagement
is considered normal. One-way ANOVA analysis (Appendix B3) shows that Student
Engagement is insignificantly different across universities, accreditation levels of
accounting programs as well as locations of universities (Java and Non-Java
University).
Based on Expectancy Theory, motivation force is a result of the
multiplication of expectancy, instrumentality, and valence measures. Therefore, final
scores have large numbers that lead to non-normal data distributions (One-sample
Kolmogorov-Smirnov Test). Raw data are transformed into Log10 data to provide a
normal distribution. Transformed data provides a mean of 4.146 and standard
deviation of 0.148. One-way ANOVA analyses show that Student Motivation varies
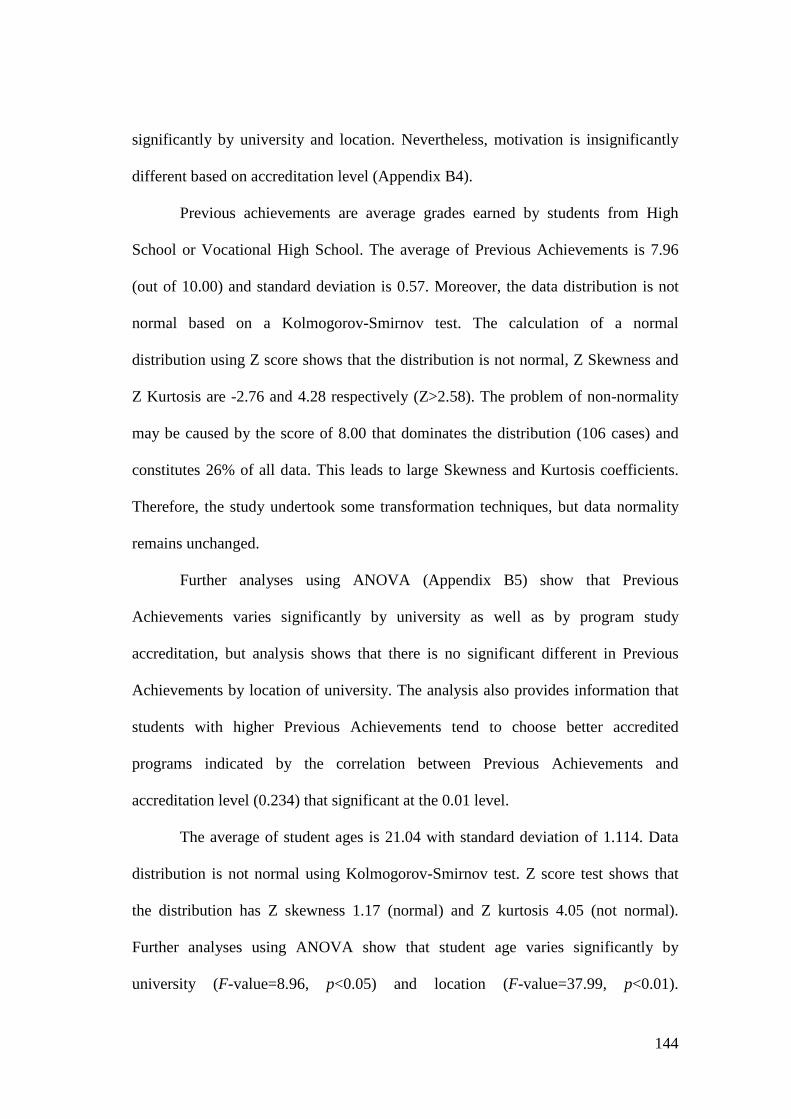
144
significantly by university and location. Nevertheless, motivation is insignificantly
different based on accreditation level (Appendix B4).
Previous achievements are average grades earned by students from High
School or Vocational High School. The average of Previous Achievements is 7.96
(out of 10.00) and standard deviation is 0.57. Moreover, the data distribution is not
normal based on a Kolmogorov-Smirnov test. The calculation of a normal
distribution using Z score shows that the distribution is not normal, Z Skewness and
Z Kurtosis are -2.76 and 4.28 respectively (Z>2.58). The problem of non-normality
may be caused by the score of 8.00 that dominates the distribution (106 cases) and
constitutes 26% of all data. This leads to large Skewness and Kurtosis coefficients.
Therefore, the study undertook some transformation techniques, but data normality
remains unchanged.
Further analyses using ANOVA (Appendix B5) show that Previous
Achievements varies significantly by university as well as by program study
accreditation, but analysis shows that there is no significant different in Previous
Achievements by location of university. The analysis also provides information that
students with higher Previous Achievements tend to choose better accredited
programs indicated by the correlation between Previous Achievements and
accreditation level (0.234) that significant at the 0.01 level.
The average of student ages is 21.04 with standard deviation of 1.114. Data
distribution is not normal using Kolmogorov-Smirnov test. Z score test shows that
the distribution has Z skewness 1.17 (normal) and Z kurtosis 4.05 (not normal).
Further analyses using ANOVA show that student age varies significantly by
university (F-value=8.96, p<0.05) and location (F-value=37.99, p<0.01).
145
Conversely, student age is insignificantly different by accreditation level of program.
The analysis also shows that Java located universities tend to have older students
(21.37) than Non-Java located universities (20.72). Appendix B6 provides more
detailed information on tests.
Comfort of Class Size has a mean of 9.85 (out of 15) or 66% and standard
deviation 2.90. Normality test using Kolmogorov-Smirnov test shows that the
distribution of this data is not normal. However, Z score test of Skewness and
Kurtosis coefficients provide results that Z skewness is normal with Z score of -
0.397 (Z<2.58) while Z kurtosis is not normal with Z score of -3.186 (Z>2.58).
ANOVA analyses show that Comfort of Class Size is significantly different among
sampled universities and locations. The analysis also shows that Non-Java located
universities tend to have better Comfort of Class Size than that of Java-located
universities. Lastly, Comfort of Class Size does not vary significantly by
accreditation level of program (Appendix B7).
Learning Facilities have a mean of 21.98 (out of 35) or 63% and standard
deviation 4.69. By employing Kolmogorov-Smirnov test, the distribution of this data
is not normal, but Z score analysis for Skewness and Kurtosis coefficients provides
results that Z Skewness is normal (-1.00, Z<2.58) and Z kurtosis is also normal (0.81,
Z<2.58). Learning Facilities vary significantly by university, by accreditation, as well
as by location of university. Analyses also provide information that higher accredited
programs tend to score higher on Learning Facilities. Likewise, Java-located
universities also score higher on Learning Facilities than Non-Java located
universities (Appendix B8).
146
5.4 Correlation Analyses for Student Data The study explores the associations among inputs, processes, and outputs. The study
keeps the presentation of analyses and results simple by adopting the following steps:
(1) Correlation between an input and process; (2) Correlation between an input and
output; (3) Correlation between process and output; (4) Regression analyses to
identify further relationships between an input, process, and output; (5) Mediation
test using regression, Sobel, and Aroian tests.
5.4.1 Student Motivation and Student Engagement Motivation is a psychological input to educational processes in higher education. The
study uses Expectancy Theory consisting of three dimensions i.e. Expectancy,
Instrumentality, and Valence. Moreover, education processes are measured by
Student Engagement comprising of five dimensions i.e. Academic Challenge, Active
Learning, Student-staff Interaction, Enriching Educational Experience, and
Supportive Learning Environment.
Table 5.3 shows selected correlation coefficients that Expectancy dimensions
are significantly correlated with almost all dimensions of Student Engagement. The
correlation between Expectancy and Enriching Educational Experience is
insignificant, while the correlation between Expectancy and the rest of the
dimensions are significant at the 0.01 level. Likewise, Instrumentality is also
correlated with Student Engagement dimensions, except Enriching Educational
Experience. The last factor of Expectancy Theory, Valence, is significantly
correlated with all Student Engagement dimensions at the 0.01 level, except
Enriching Educational Experience that has significance at the 0.05 level. Correlations
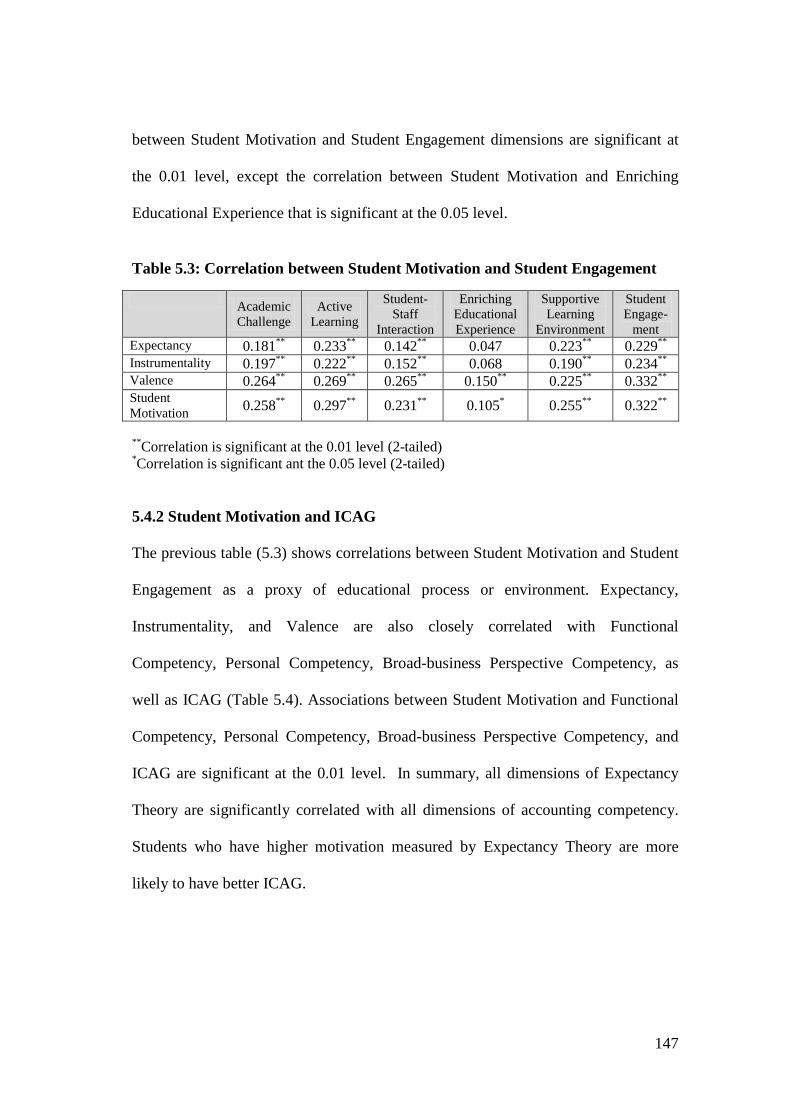
147
between Student Motivation and Student Engagement dimensions are significant at
the 0.01 level, except the correlation between Student Motivation and Enriching
Educational Experience that is significant at the 0.05 level.
Table 5.3: Correlation between Student Motivation and Student Engagement
Academic Challenge
Active Learning
Student-Staff
Interaction
Enriching Educational Experience
Supportive Learning
Environment
Student Engage-
ment Expectancy 0.181** 0.233** 0.142** 0.047 0.223** 0.229** Instrumentality 0.197** 0.222** 0.152** 0.068 0.190** 0.234** Valence 0.264** 0.269** 0.265** 0.150** 0.225** 0.332** Student Motivation 0.258** 0.297** 0.231** 0.105* 0.255** 0.322**
**Correlation is significant at the 0.01 level (2-tailed) *Correlation is significant ant the 0.05 level (2-tailed) 5.4.2 Student Motivation and ICAG The previous table (5.3) shows correlations between Student Motivation and Student
Engagement as a proxy of educational process or environment. Expectancy,
Instrumentality, and Valence are also closely correlated with Functional
Competency, Personal Competency, Broad-business Perspective Competency, as
well as ICAG (Table 5.4). Associations between Student Motivation and Functional
Competency, Personal Competency, Broad-business Perspective Competency, and
ICAG are significant at the 0.01 level. In summary, all dimensions of Expectancy
Theory are significantly correlated with all dimensions of accounting competency.
Students who have higher motivation measured by Expectancy Theory are more
likely to have better ICAG.
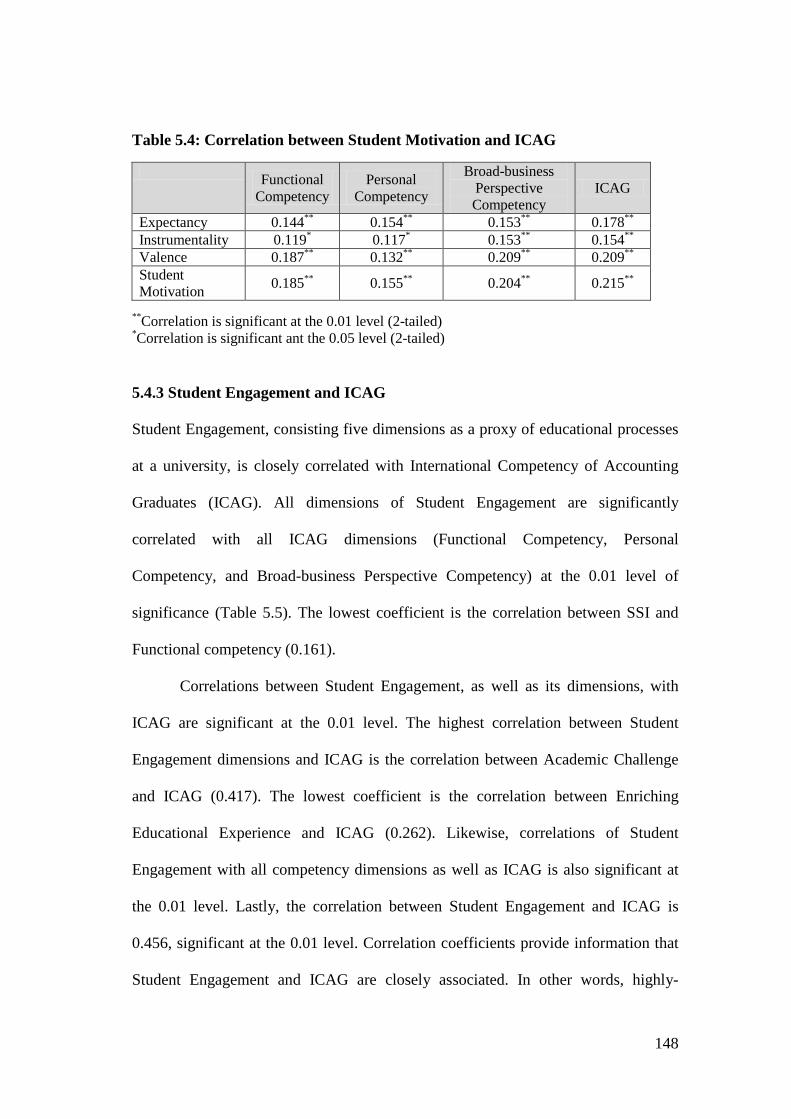
148
Table 5.4: Correlation between Student Motivation and ICAG
Functional Competency
Personal Competency
Broad-business Perspective Competency
ICAG
Expectancy 0.144** 0.154** 0.153** 0.178** Instrumentality 0.119* 0.117* 0.153** 0.154** Valence 0.187** 0.132** 0.209** 0.209** Student Motivation 0.185** 0.155** 0.204** 0.215**
**Correlation is significant at the 0.01 level (2-tailed) *Correlation is significant ant the 0.05 level (2-tailed) 5.4.3 Student Engagement and ICAG Student Engagement, consisting five dimensions as a proxy of educational processes
at a university, is closely correlated with International Competency of Accounting
Graduates (ICAG). All dimensions of Student Engagement are significantly
correlated with all ICAG dimensions (Functional Competency, Personal
Competency, and Broad-business Perspective Competency) at the 0.01 level of
significance (Table 5.5). The lowest coefficient is the correlation between SSI and
Functional competency (0.161).
Correlations between Student Engagement, as well as its dimensions, with
ICAG are significant at the 0.01 level. The highest correlation between Student
Engagement dimensions and ICAG is the correlation between Academic Challenge
and ICAG (0.417). The lowest coefficient is the correlation between Enriching
Educational Experience and ICAG (0.262). Likewise, correlations of Student
Engagement with all competency dimensions as well as ICAG is also significant at
the 0.01 level. Lastly, the correlation between Student Engagement and ICAG is
0.456, significant at the 0.01 level. Correlation coefficients provide information that
Student Engagement and ICAG are closely associated. In other words, highly-
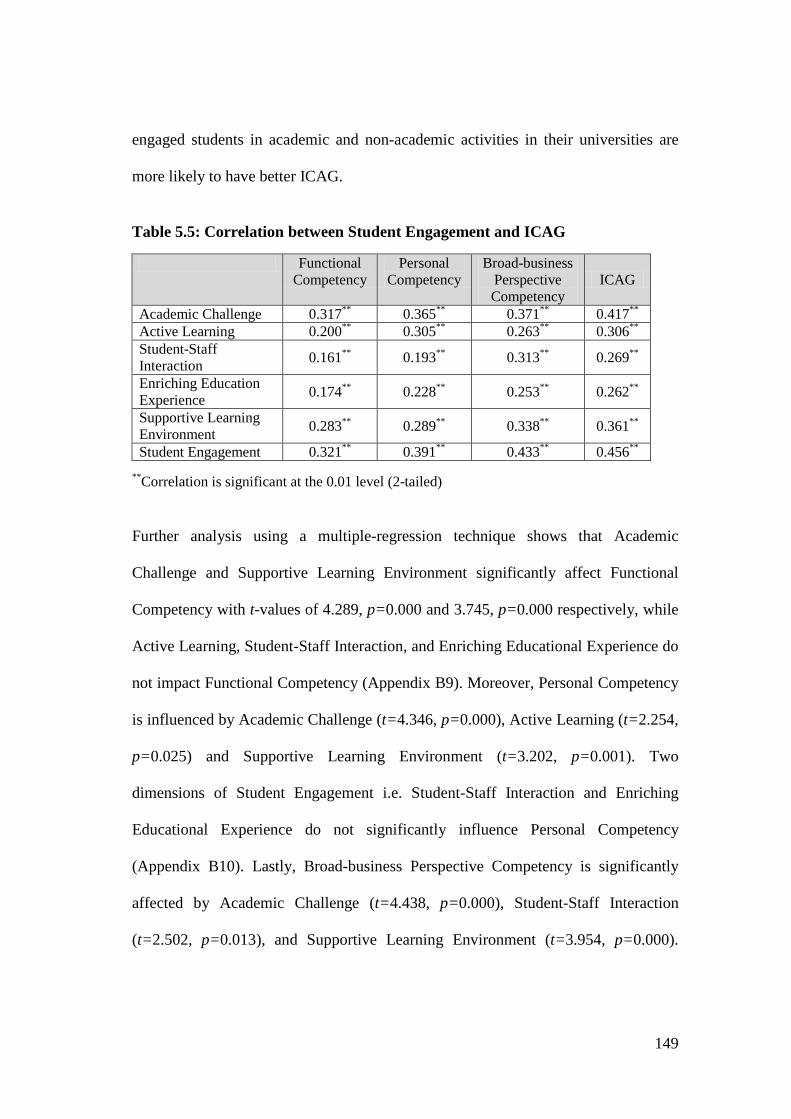
149
engaged students in academic and non-academic activities in their universities are
more likely to have better ICAG.
Table 5.5: Correlation between Student Engagement and ICAG
Functional Competency
Personal Competency
Broad-business Perspective Competency
ICAG
Academic Challenge 0.317** 0.365** 0.371** 0.417** Active Learning 0.200** 0.305** 0.263** 0.306** Student-Staff Interaction 0.161** 0.193** 0.313** 0.269**
Enriching Education Experience 0.174** 0.228** 0.253** 0.262**
Supportive Learning Environment 0.283** 0.289** 0.338** 0.361**
Student Engagement 0.321** 0.391** 0.433** 0.456**
**Correlation is significant at the 0.01 level (2-tailed) Further analysis using a multiple-regression technique shows that Academic
Challenge and Supportive Learning Environment significantly affect Functional
Competency with t-values of 4.289, p=0.000 and 3.745, p=0.000 respectively, while
Active Learning, Student-Staff Interaction, and Enriching Educational Experience do
not impact Functional Competency (Appendix B9). Moreover, Personal Competency
is influenced by Academic Challenge (t=4.346, p=0.000), Active Learning (t=2.254,
p=0.025) and Supportive Learning Environment (t=3.202, p=0.001). Two
dimensions of Student Engagement i.e. Student-Staff Interaction and Enriching
Educational Experience do not significantly influence Personal Competency
(Appendix B10). Lastly, Broad-business Perspective Competency is significantly
affected by Academic Challenge (t=4.438, p=0.000), Student-Staff Interaction
(t=2.502, p=0.013), and Supportive Learning Environment (t=3.954, p=0.000).
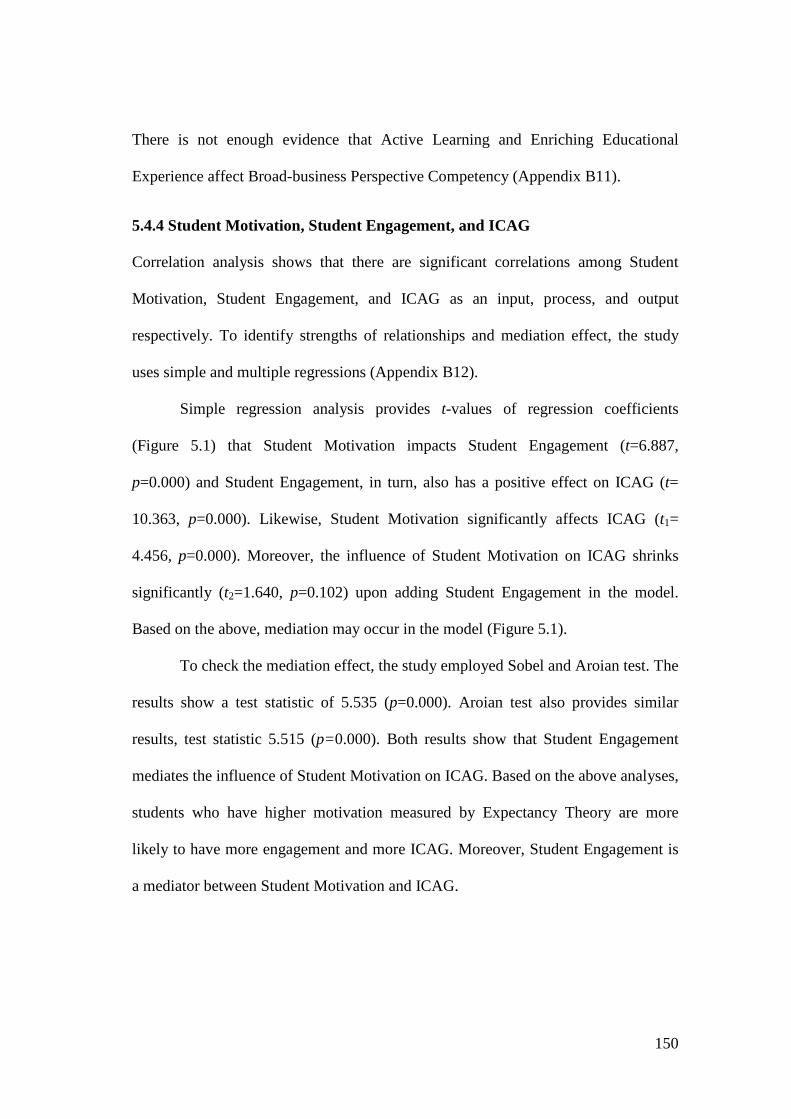
150
There is not enough evidence that Active Learning and Enriching Educational
Experience affect Broad-business Perspective Competency (Appendix B11).
5.4.4 Student Motivation, Student Engagement, and ICAG Correlation analysis shows that there are significant correlations among Student
Motivation, Student Engagement, and ICAG as an input, process, and output
respectively. To identify strengths of relationships and mediation effect, the study
uses simple and multiple regressions (Appendix B12).
Simple regression analysis provides t-values of regression coefficients
(Figure 5.1) that Student Motivation impacts Student Engagement (t=6.887,
p=0.000) and Student Engagement, in turn, also has a positive effect on ICAG (t=
10.363, p=0.000). Likewise, Student Motivation significantly affects ICAG (t1=
4.456, p=0.000). Moreover, the influence of Student Motivation on ICAG shrinks
significantly (t2=1.640, p=0.102) upon adding Student Engagement in the model.
Based on the above, mediation may occur in the model (Figure 5.1).
To check the mediation effect, the study employed Sobel and Aroian test. The
results show a test statistic of 5.535 (p=0.000). Aroian test also provides similar
results, test statistic 5.515 (p=0.000). Both results show that Student Engagement
mediates the influence of Student Motivation on ICAG. Based on the above analyses,
students who have higher motivation measured by Expectancy Theory are more
likely to have more engagement and more ICAG. Moreover, Student Engagement is
a mediator between Student Motivation and ICAG.
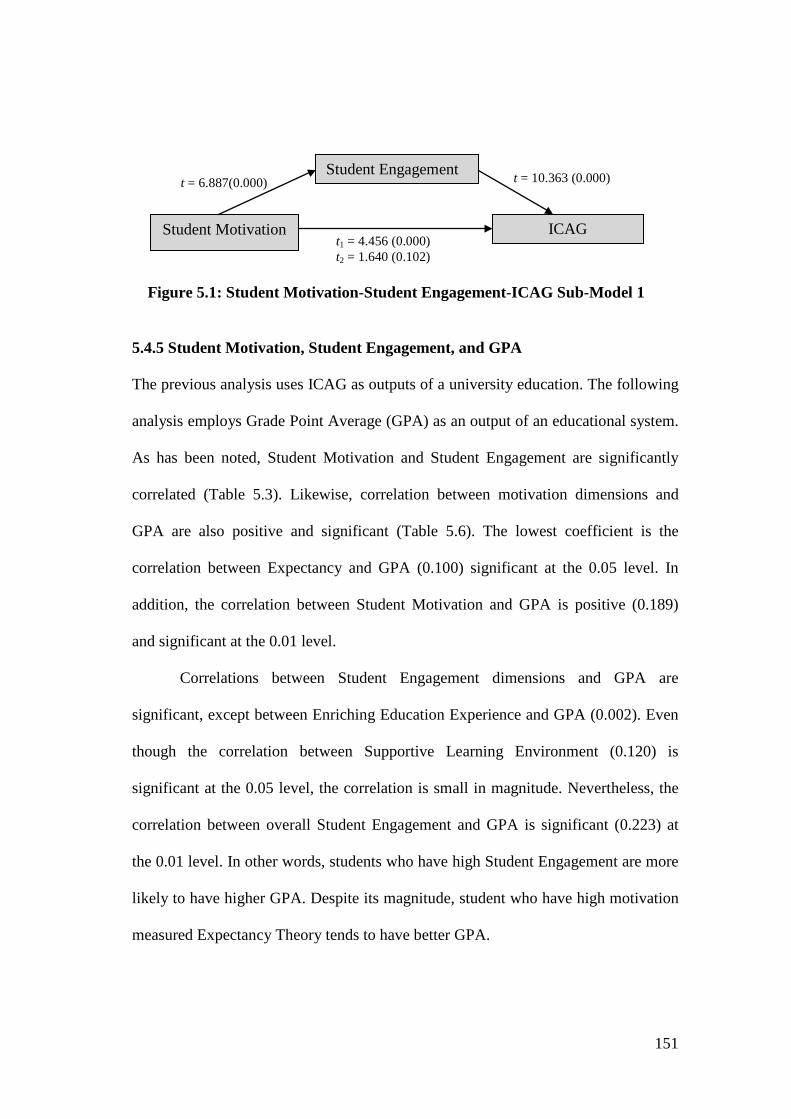
151
5.4.5 Student Motivation, Student Engagement, and GPA The previous analysis uses ICAG as outputs of a university education. The following
analysis employs Grade Point Average (GPA) as an output of an educational system.
As has been noted, Student Motivation and Student Engagement are significantly
correlated (Table 5.3). Likewise, correlation between motivation dimensions and
GPA are also positive and significant (Table 5.6). The lowest coefficient is the
correlation between Expectancy and GPA (0.100) significant at the 0.05 level. In
addition, the correlation between Student Motivation and GPA is positive (0.189)
and significant at the 0.01 level.
Correlations between Student Engagement dimensions and GPA are
significant, except between Enriching Education Experience and GPA (0.002). Even
though the correlation between Supportive Learning Environment (0.120) is
significant at the 0.05 level, the correlation is small in magnitude. Nevertheless, the
correlation between overall Student Engagement and GPA is significant (0.223) at
the 0.01 level. In other words, students who have high Student Engagement are more
likely to have higher GPA. Despite its magnitude, student who have high motivation
measured Expectancy Theory tends to have better GPA.
Figure 5.1: Student Motivation-Student Engagement-ICAG Sub-Model 1
t1 = 4.456 (0.000) t2 = 1.640 (0.102)
t = 6.887(0.000) t = 10.363 (0.000)
Student Motivation
Student Engagement
ICAG
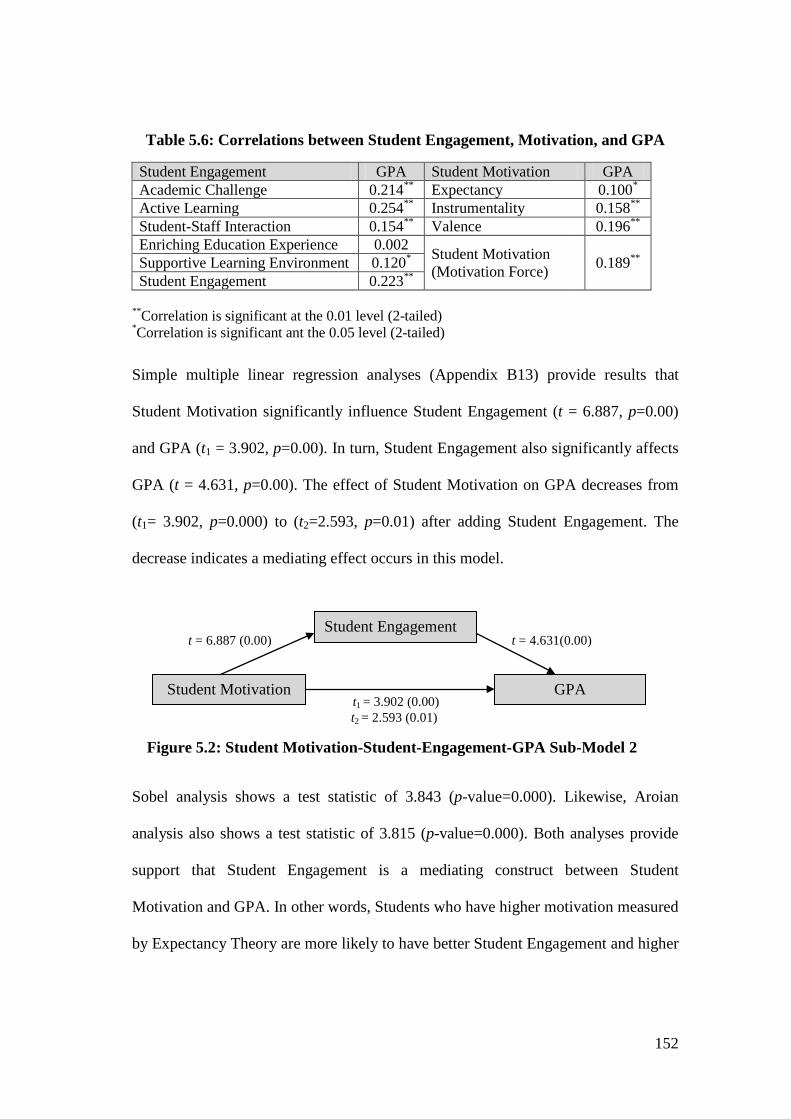
152
Table 5.6: Correlations between Student Engagement, Motivation, and GPA
Student Engagement GPA Student Motivation GPA Academic Challenge 0.214** Expectancy 0.100* Active Learning 0.254** Instrumentality 0.158** Student-Staff Interaction 0.154** Valence 0.196** Enriching Education Experience 0.002 Student Motivation
(Motivation Force)
0.189** Supportive Learning Environment 0.120*
Student Engagement 0.223**
**Correlation is significant at the 0.01 level (2-tailed) *Correlation is significant ant the 0.05 level (2-tailed) Simple multiple linear regression analyses (Appendix B13) provide results that
Student Motivation significantly influence Student Engagement (t = 6.887, p=0.00)
and GPA (t1 = 3.902, p=0.00). In turn, Student Engagement also significantly affects
GPA (t = 4.631, p=0.00). The effect of Student Motivation on GPA decreases from
(t1= 3.902, p=0.000) to (t2=2.593, p=0.01) after adding Student Engagement. The
decrease indicates a mediating effect occurs in this model.
Sobel analysis shows a test statistic of 3.843 (p-value=0.000). Likewise, Aroian
analysis also shows a test statistic of 3.815 (p-value=0.000). Both analyses provide
support that Student Engagement is a mediating construct between Student
Motivation and GPA. In other words, Students who have higher motivation measured
by Expectancy Theory are more likely to have better Student Engagement and higher
Figure 5.2: Student Motivation-Student-Engagement-GPA Sub-Model 2
t1 = 3.902 (0.00) t2 = 2.593 (0.01)
t = 6.887 (0.00) t = 4.631(0.00)
Student Motivation
Student Engagement
GPA
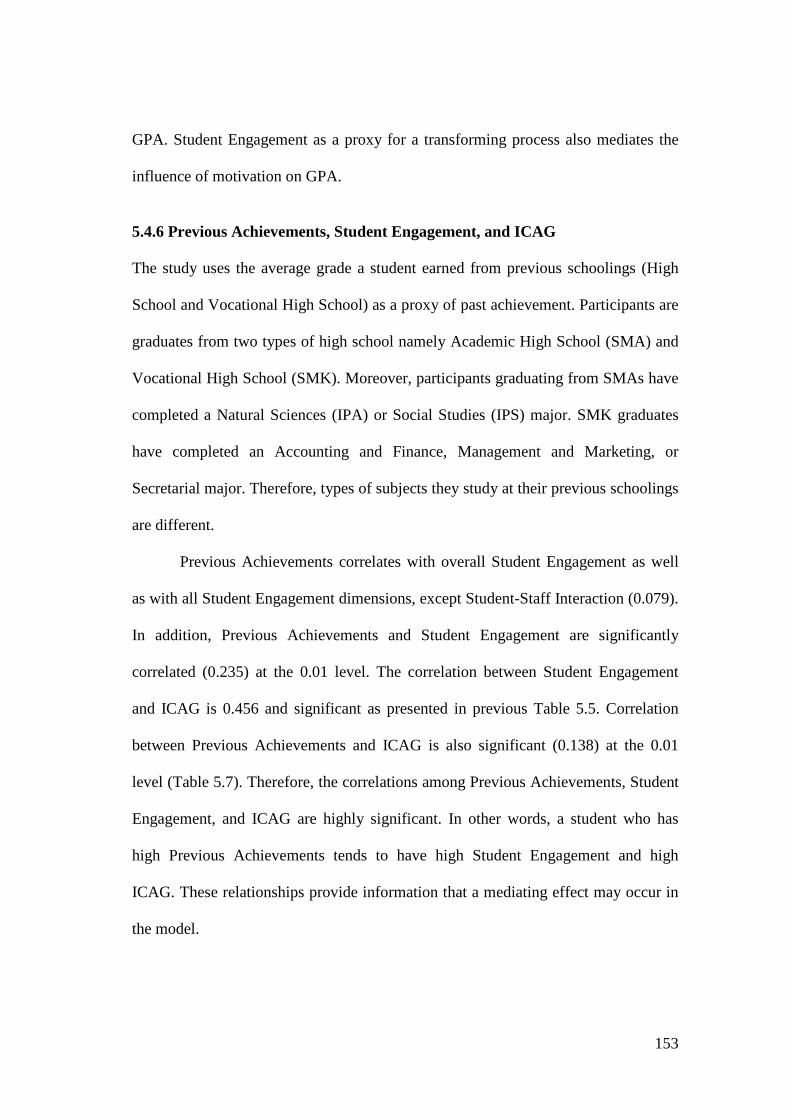
153
GPA. Student Engagement as a proxy for a transforming process also mediates the
influence of motivation on GPA.
5.4.6 Previous Achievements, Student Engagement, and ICAG The study uses the average grade a student earned from previous schoolings (High
School and Vocational High School) as a proxy of past achievement. Participants are
graduates from two types of high school namely Academic High School (SMA) and
Vocational High School (SMK). Moreover, participants graduating from SMAs have
completed a Natural Sciences (IPA) or Social Studies (IPS) major. SMK graduates
have completed an Accounting and Finance, Management and Marketing, or
Secretarial major. Therefore, types of subjects they study at their previous schoolings
are different.
Previous Achievements correlates with overall Student Engagement as well
as with all Student Engagement dimensions, except Student-Staff Interaction (0.079).
In addition, Previous Achievements and Student Engagement are significantly
correlated (0.235) at the 0.01 level. The correlation between Student Engagement
and ICAG is 0.456 and significant as presented in previous Table 5.5. Correlation
between Previous Achievements and ICAG is also significant (0.138) at the 0.01
level (Table 5.7). Therefore, the correlations among Previous Achievements, Student
Engagement, and ICAG are highly significant. In other words, a student who has
high Previous Achievements tends to have high Student Engagement and high
ICAG. These relationships provide information that a mediating effect may occur in
the model.
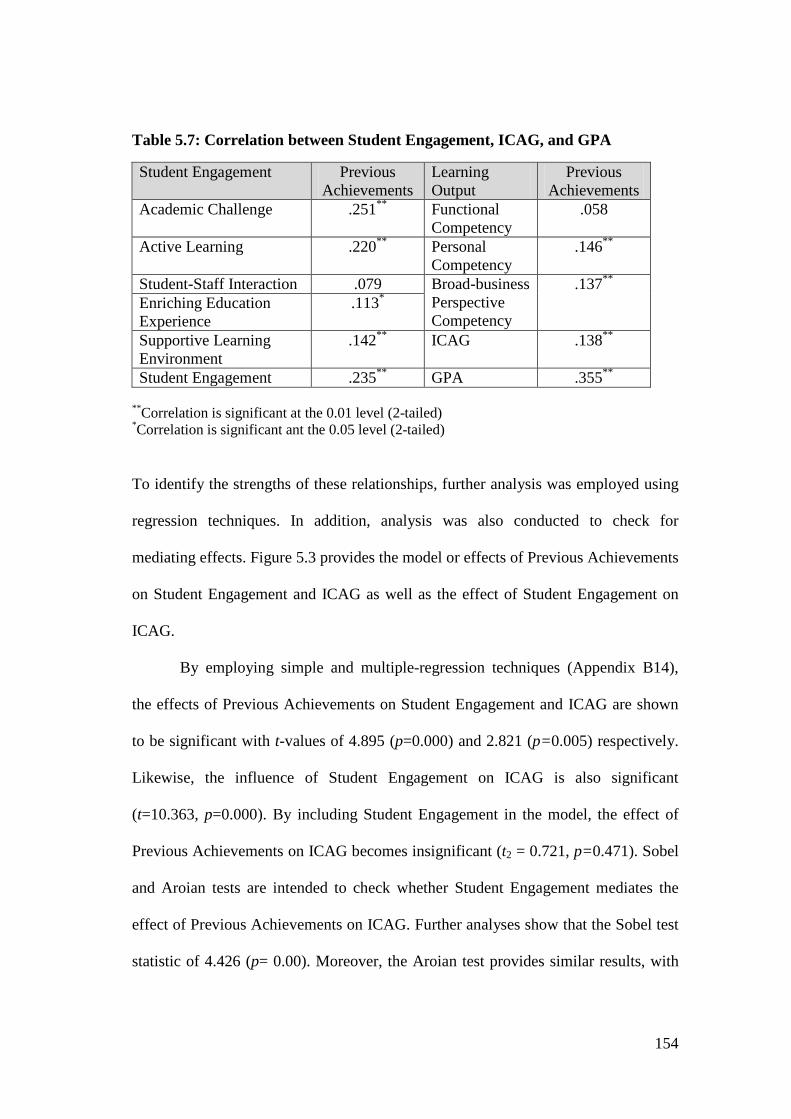
154
Table 5.7: Correlation between Student Engagement, ICAG, and GPA
Student Engagement Previous Achievements
Learning Output
Previous Achievements
Academic Challenge .251** Functional Competency
.058
Active Learning .220** Personal Competency
.146**
Student-Staff Interaction .079 Broad-business Perspective Competency
.137** Enriching Education Experience
.113*
Supportive Learning Environment
.142** ICAG .138**
Student Engagement .235** GPA .355**
**Correlation is significant at the 0.01 level (2-tailed) *Correlation is significant ant the 0.05 level (2-tailed) To identify the strengths of these relationships, further analysis was employed using
regression techniques. In addition, analysis was also conducted to check for
mediating effects. Figure 5.3 provides the model or effects of Previous Achievements
on Student Engagement and ICAG as well as the effect of Student Engagement on
ICAG.
By employing simple and multiple-regression techniques (Appendix B14),
the effects of Previous Achievements on Student Engagement and ICAG are shown
to be significant with t-values of 4.895 (p=0.000) and 2.821 (p=0.005) respectively.
Likewise, the influence of Student Engagement on ICAG is also significant
(t=10.363, p=0.000). By including Student Engagement in the model, the effect of
Previous Achievements on ICAG becomes insignificant (t2 = 0.721, p=0.471). Sobel
and Aroian tests are intended to check whether Student Engagement mediates the
effect of Previous Achievements on ICAG. Further analyses show that the Sobel test
statistic of 4.426 (p= 0.00). Moreover, the Aroian test provides similar results, with
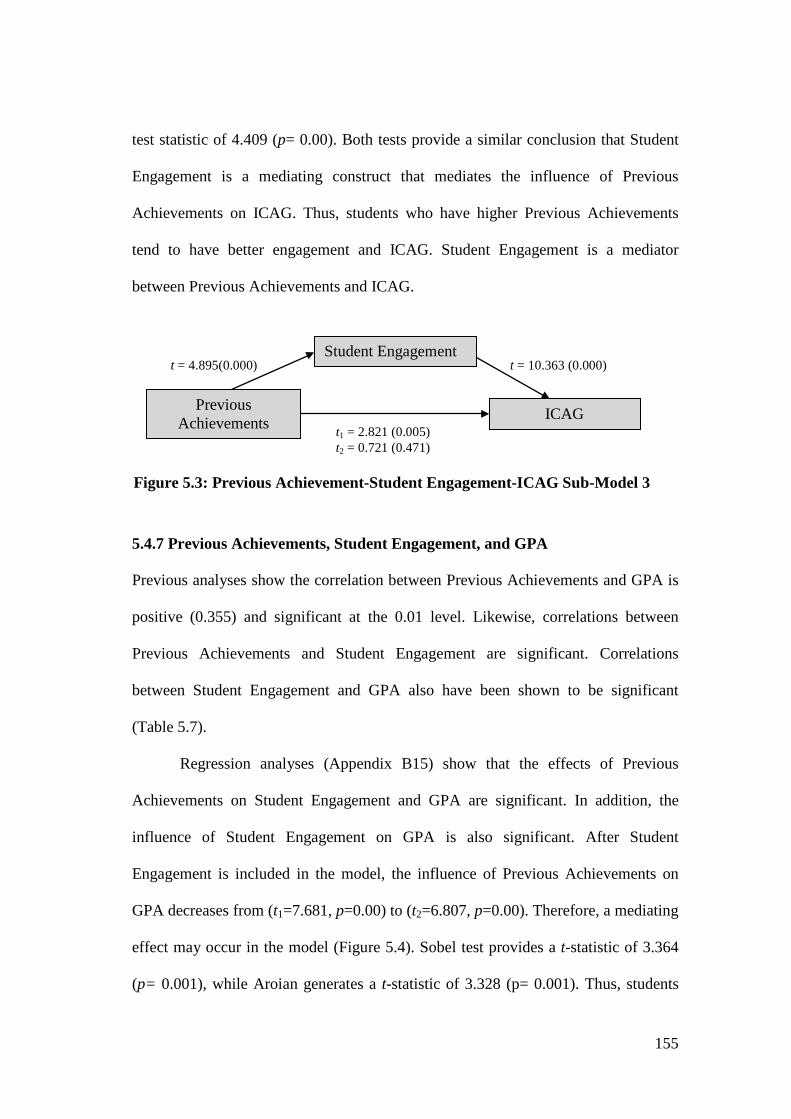
155
test statistic of 4.409 (p= 0.00). Both tests provide a similar conclusion that Student
Engagement is a mediating construct that mediates the influence of Previous
Achievements on ICAG. Thus, students who have higher Previous Achievements
tend to have better engagement and ICAG. Student Engagement is a mediator
between Previous Achievements and ICAG.
5.4.7 Previous Achievements, Student Engagement, and GPA Previous analyses show the correlation between Previous Achievements and GPA is
positive (0.355) and significant at the 0.01 level. Likewise, correlations between
Previous Achievements and Student Engagement are significant. Correlations
between Student Engagement and GPA also have been shown to be significant
(Table 5.7).
Regression analyses (Appendix B15) show that the effects of Previous
Achievements on Student Engagement and GPA are significant. In addition, the
influence of Student Engagement on GPA is also significant. After Student
Engagement is included in the model, the influence of Previous Achievements on
GPA decreases from (t1=7.681, p=0.00) to (t2=6.807, p=0.00). Therefore, a mediating
effect may occur in the model (Figure 5.4). Sobel test provides a t-statistic of 3.364
(p= 0.001), while Aroian generates a t-statistic of 3.328 (p= 0.001). Thus, students
Figure 5.3: Previous Achievement-Student Engagement-ICAG Sub-Model 3
t1 = 2.821 (0.005) t2 = 0.721 (0.471)
t = 4.895(0.000) t = 10.363 (0.000)
Previous Achievements
Student Engagement
ICAG
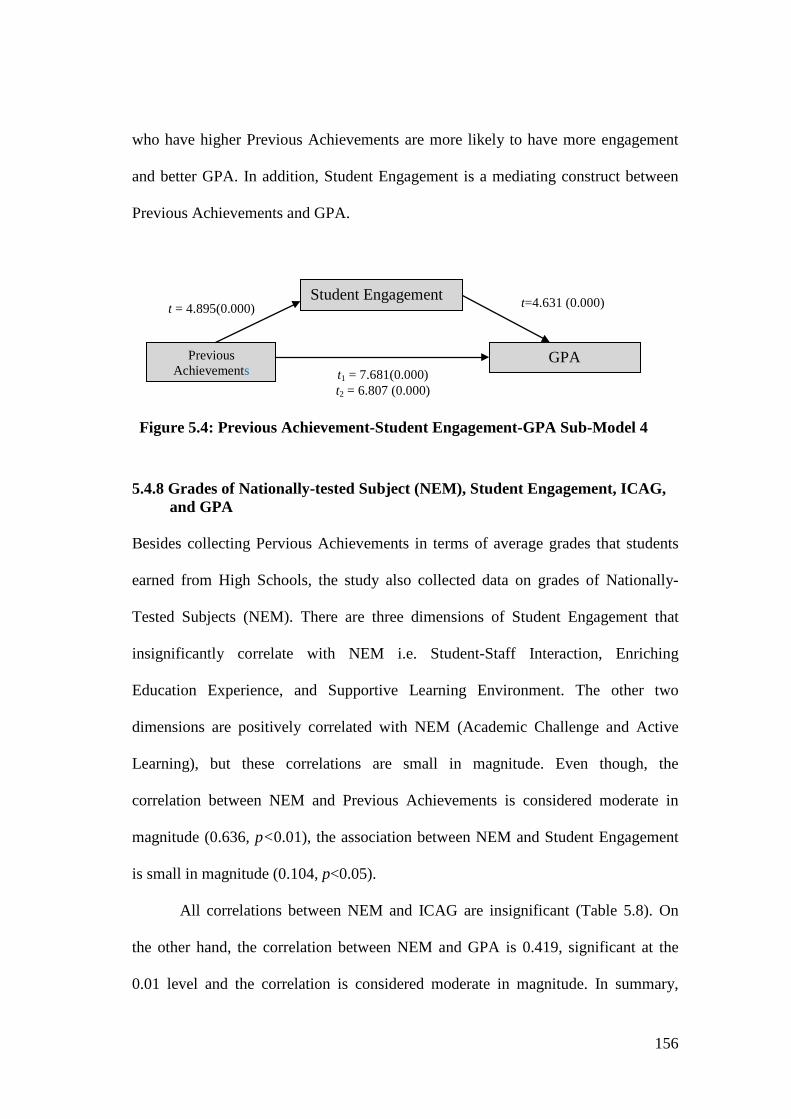
156
who have higher Previous Achievements are more likely to have more engagement
and better GPA. In addition, Student Engagement is a mediating construct between
Previous Achievements and GPA.
5.4.8 Grades of Nationally-tested Subject (NEM), Student Engagement, ICAG,
and GPA Besides collecting Pervious Achievements in terms of average grades that students
earned from High Schools, the study also collected data on grades of Nationally-
Tested Subjects (NEM). There are three dimensions of Student Engagement that
insignificantly correlate with NEM i.e. Student-Staff Interaction, Enriching
Education Experience, and Supportive Learning Environment. The other two
dimensions are positively correlated with NEM (Academic Challenge and Active
Learning), but these correlations are small in magnitude. Even though, the
correlation between NEM and Previous Achievements is considered moderate in
magnitude (0.636, p<0.01), the association between NEM and Student Engagement
is small in magnitude (0.104, p<0.05).
All correlations between NEM and ICAG are insignificant (Table 5.8). On
the other hand, the correlation between NEM and GPA is 0.419, significant at the
0.01 level and the correlation is considered moderate in magnitude. In summary,
t = 4.895(0.000) t=4.631 (0.000)
Previous Achievements
Student Engagement
GPA t1 = 7.681(0.000) t2 = 6.807 (0.000)
Figure 5.4: Previous Achievement-Student Engagement-GPA Sub-Model 4
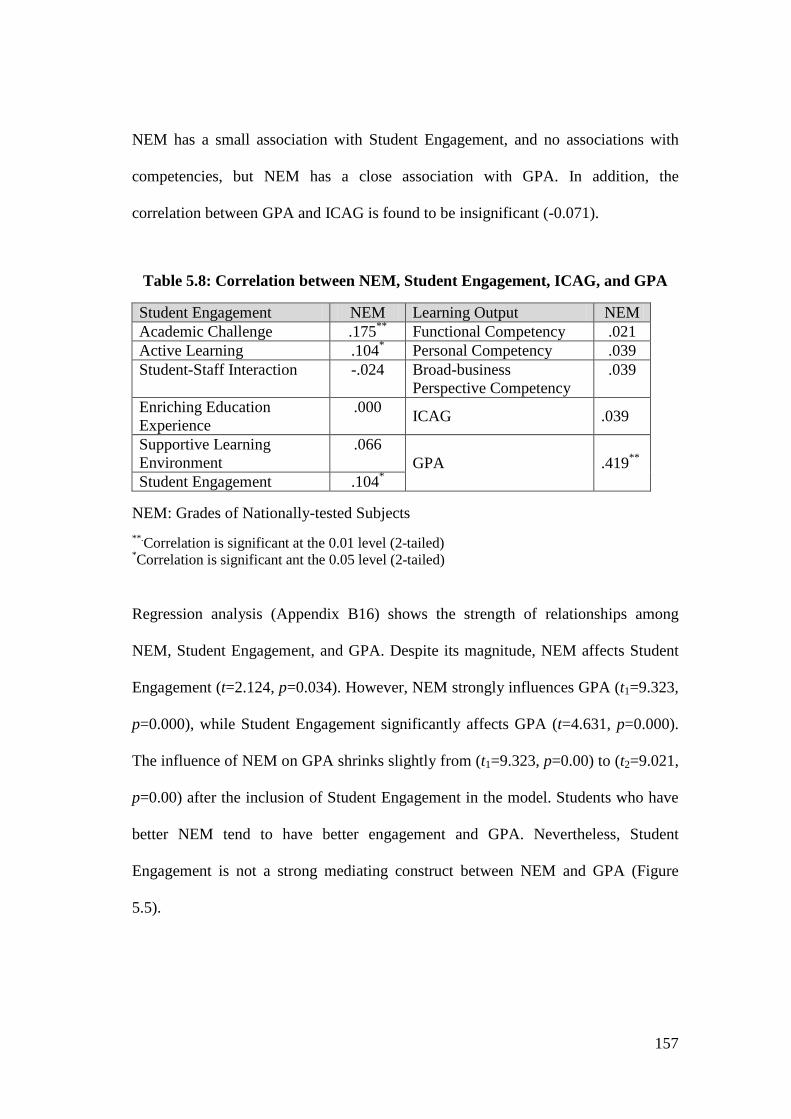
157
NEM has a small association with Student Engagement, and no associations with
competencies, but NEM has a close association with GPA. In addition, the
correlation between GPA and ICAG is found to be insignificant (-0.071).
Table 5.8: Correlation between NEM, Student Engagement, ICAG, and GPA
Student Engagement NEM Learning Output NEM Academic Challenge .175** Functional Competency .021 Active Learning .104* Personal Competency .039 Student-Staff Interaction -.024 Broad-business
Perspective Competency .039
Enriching Education Experience
.000 ICAG .039
Supportive Learning Environment
.066 GPA .419**
Student Engagement .104* NEM: Grades of Nationally-tested Subjects
**.Correlation is significant at the 0.01 level (2-tailed) *Correlation is significant ant the 0.05 level (2-tailed) Regression analysis (Appendix B16) shows the strength of relationships among
NEM, Student Engagement, and GPA. Despite its magnitude, NEM affects Student
Engagement (t=2.124, p=0.034). However, NEM strongly influences GPA (t1=9.323,
p=0.000), while Student Engagement significantly affects GPA (t=4.631, p=0.000).
The influence of NEM on GPA shrinks slightly from (t1=9.323, p=0.00) to (t2=9.021,
p=0.00) after the inclusion of Student Engagement in the model. Students who have
better NEM tend to have better engagement and GPA. Nevertheless, Student
Engagement is not a strong mediating construct between NEM and GPA (Figure
5.5).
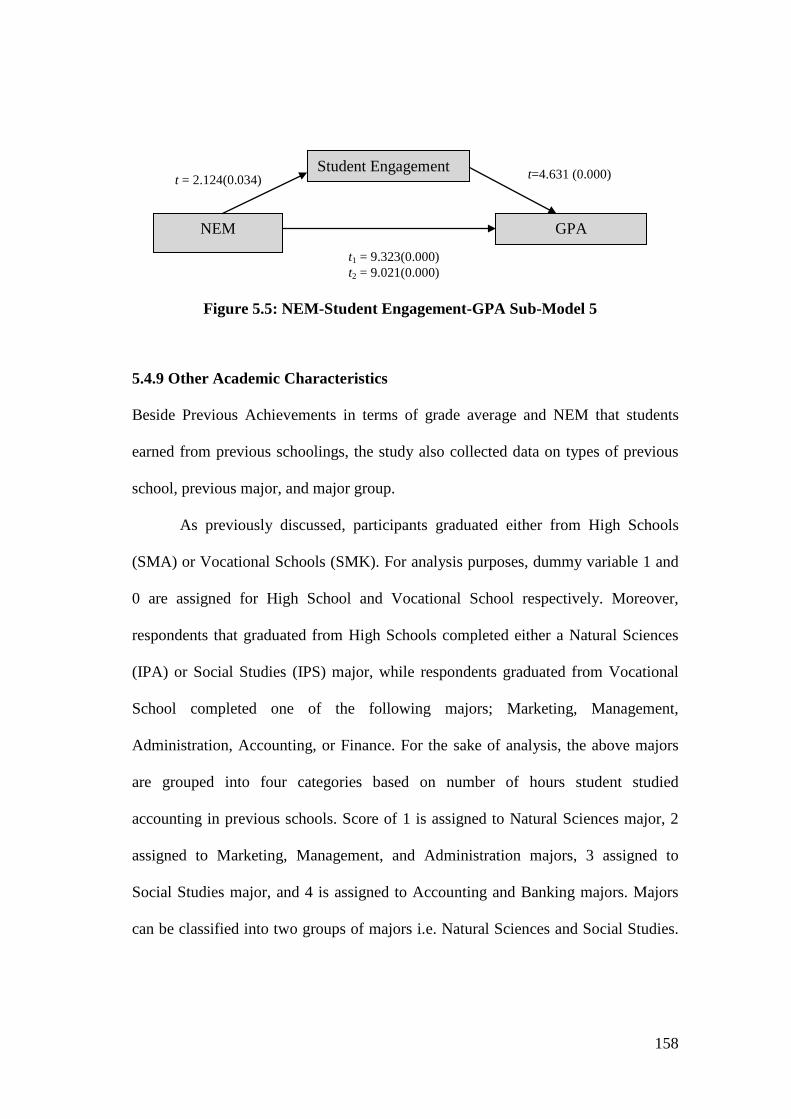
158
5.4.9 Other Academic Characteristics Beside Previous Achievements in terms of grade average and NEM that students
earned from previous schoolings, the study also collected data on types of previous
school, previous major, and major group.
As previously discussed, participants graduated either from High Schools
(SMA) or Vocational Schools (SMK). For analysis purposes, dummy variable 1 and
0 are assigned for High School and Vocational School respectively. Moreover,
respondents that graduated from High Schools completed either a Natural Sciences
(IPA) or Social Studies (IPS) major, while respondents graduated from Vocational
School completed one of the following majors; Marketing, Management,
Administration, Accounting, or Finance. For the sake of analysis, the above majors
are grouped into four categories based on number of hours student studied
accounting in previous schools. Score of 1 is assigned to Natural Sciences major, 2
assigned to Marketing, Management, and Administration majors, 3 assigned to
Social Studies major, and 4 is assigned to Accounting and Banking majors. Majors
can be classified into two groups of majors i.e. Natural Sciences and Social Studies.
t = 2.124(0.034) t=4.631 (0.000)
NEM
Student Engagement
GPA
t1 = 9.323(0.000) t2 = 9.021(0.000)
Figure 5.5: NEM-Student Engagement-GPA Sub-Model 5
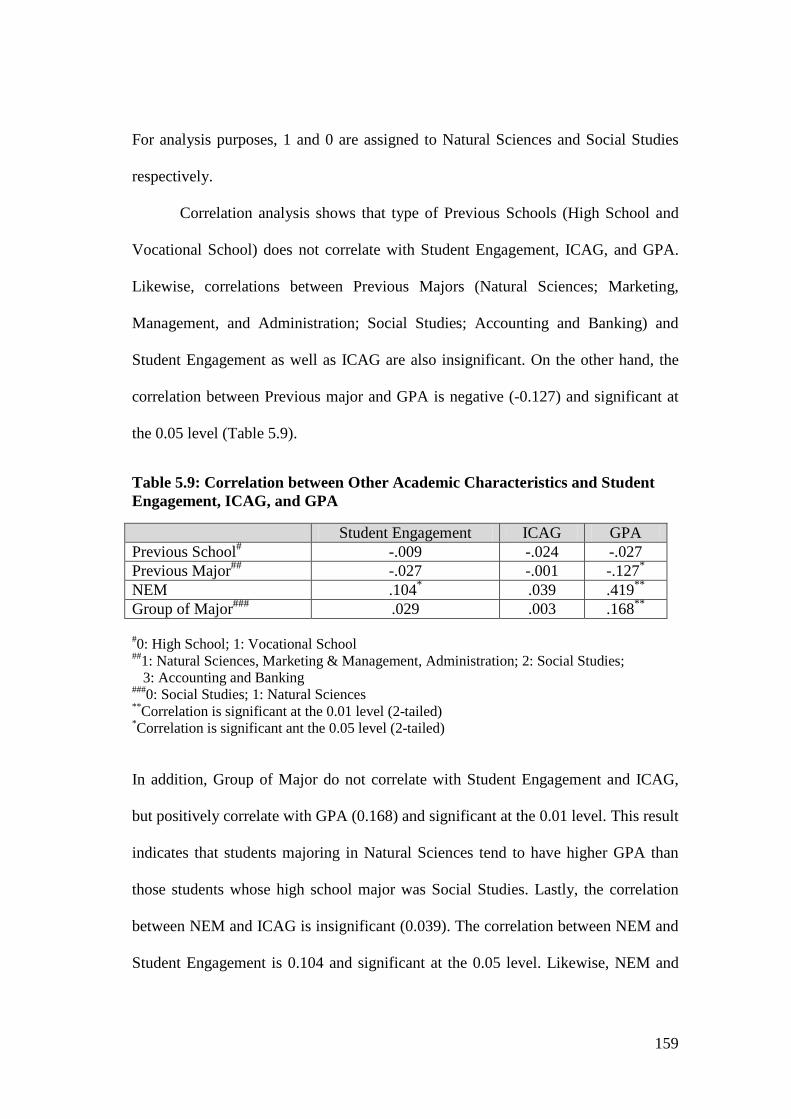
159
For analysis purposes, 1 and 0 are assigned to Natural Sciences and Social Studies
respectively.
Correlation analysis shows that type of Previous Schools (High School and
Vocational School) does not correlate with Student Engagement, ICAG, and GPA.
Likewise, correlations between Previous Majors (Natural Sciences; Marketing,
Management, and Administration; Social Studies; Accounting and Banking) and
Student Engagement as well as ICAG are also insignificant. On the other hand, the
correlation between Previous major and GPA is negative (-0.127) and significant at
the 0.05 level (Table 5.9).
Table 5.9: Correlation between Other Academic Characteristics and Student Engagement, ICAG, and GPA
Student Engagement ICAG GPA Previous School# -.009 -.024 -.027 Previous Major## -.027 -.001 -.127* NEM .104* .039 .419** Group of Major### .029 .003 .168**
#0: High School; 1: Vocational School ##1: Natural Sciences, Marketing & Management, Administration; 2: Social Studies; 3: Accounting and Banking ###0: Social Studies; 1: Natural Sciences **Correlation is significant at the 0.01 level (2-tailed) *Correlation is significant ant the 0.05 level (2-tailed) In addition, Group of Major do not correlate with Student Engagement and ICAG,
but positively correlate with GPA (0.168) and significant at the 0.01 level. This result
indicates that students majoring in Natural Sciences tend to have higher GPA than
those students whose high school major was Social Studies. Lastly, the correlation
between NEM and ICAG is insignificant (0.039). The correlation between NEM and
Student Engagement is 0.104 and significant at the 0.05 level. Likewise, NEM and
160
GPA are closely associated (0.419) and significant at the 0.01 level (Table 5.9). In
other words, a student having higher NEM from previous schooling is more likely to
have a higher GPA at university. Previous Achievements is a strong predictor for
Student Engagement and ICAG, while NEM is more appropriate predictor for GPA.
5.4.10 Age, Student Engagement, ICAG, and GPA Age and gender are two demographic characteristics that are discussed in this
section. The study correlates these two demographic characteristics with Student
Engagement, ICAG as well as GPA. If all correlations between demographic
characteristics and Student Engagement, ICAG or GPA are found to be positively
significant, the study will further analysis to identify mediating effects.
Age and Student Engagement are negatively correlated, -0.149 and
significant at the 0.01 level. This could mean that older students tend to have lower
engagement, possibly because they have more life experiences. Table 5.10 shows
that Age also negatively correlates with Academic Challenge and Active Learning.
In addition, Age is also negatively correlated with Student-Staff Interaction,
Enriching Education Experience, and Supportive Learning Environment, but
coefficients are not significant.
Relationships between Age and dimensions of ICAG are not significant.
However, the correlation between Age and the other learning output (GPA), is also
negative and significant (-0.104) at the 0.05 level. This may also means that older
students are more likely to have lower GPA than younger students.
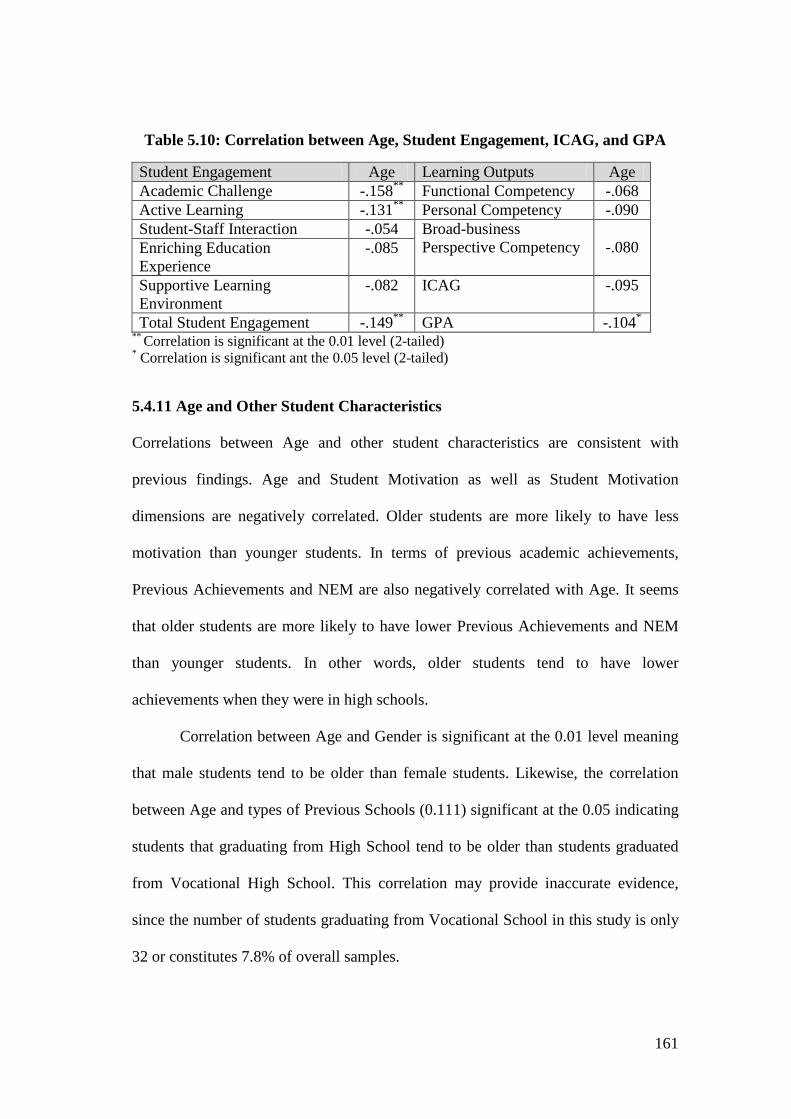
161
Table 5.10: Correlation between Age, Student Engagement, ICAG, and GPA
Student Engagement Age Learning Outputs Age Academic Challenge -.158** Functional Competency -.068 Active Learning -.131** Personal Competency -.090 Student-Staff Interaction -.054 Broad-business
Perspective Competency
-.080 Enriching Education Experience
-.085
Supportive Learning Environment
-.082 ICAG -.095
Total Student Engagement -.149** GPA -.104* ** Correlation is significant at the 0.01 level (2-tailed) * Correlation is significant ant the 0.05 level (2-tailed) 5.4.11 Age and Other Student Characteristics Correlations between Age and other student characteristics are consistent with
previous findings. Age and Student Motivation as well as Student Motivation
dimensions are negatively correlated. Older students are more likely to have less
motivation than younger students. In terms of previous academic achievements,
Previous Achievements and NEM are also negatively correlated with Age. It seems
that older students are more likely to have lower Previous Achievements and NEM
than younger students. In other words, older students tend to have lower
achievements when they were in high schools.
Correlation between Age and Gender is significant at the 0.01 level meaning
that male students tend to be older than female students. Likewise, the correlation
between Age and types of Previous Schools (0.111) significant at the 0.05 indicating
students that graduating from High School tend to be older than students graduated
from Vocational High School. This correlation may provide inaccurate evidence,
since the number of students graduating from Vocational School in this study is only
32 or constitutes 7.8% of overall samples.
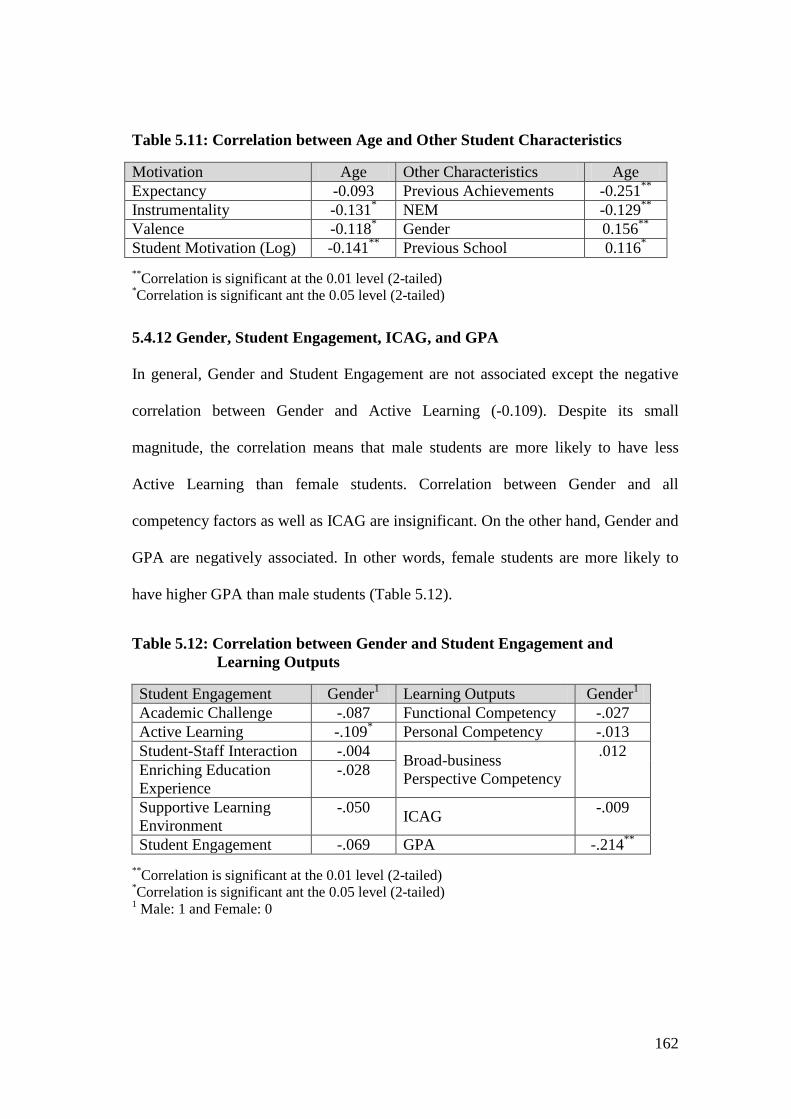
162
Table 5.11: Correlation between Age and Other Student Characteristics
Motivation Age Other Characteristics Age Expectancy -0.093 Previous Achievements -0.251** Instrumentality -0.131* NEM -0.129** Valence -0.118* Gender 0.156** Student Motivation (Log) -0.141** Previous School 0.116*
**Correlation is significant at the 0.01 level (2-tailed) *Correlation is significant ant the 0.05 level (2-tailed) 5.4.12 Gender, Student Engagement, ICAG, and GPA In general, Gender and Student Engagement are not associated except the negative
correlation between Gender and Active Learning (-0.109). Despite its small
magnitude, the correlation means that male students are more likely to have less
Active Learning than female students. Correlation between Gender and all
competency factors as well as ICAG are insignificant. On the other hand, Gender and
GPA are negatively associated. In other words, female students are more likely to
have higher GPA than male students (Table 5.12).
Table 5.12: Correlation between Gender and Student Engagement and
Learning Outputs
Student Engagement Gender1 Learning Outputs Gender1 Academic Challenge -.087 Functional Competency -.027 Active Learning -.109* Personal Competency -.013 Student-Staff Interaction -.004 Broad-business
Perspective Competency
.012 Enriching Education Experience
-.028
Supportive Learning Environment
-.050 ICAG -.009
Student Engagement -.069 GPA -.214**
**Correlation is significant at the 0.01 level (2-tailed) *Correlation is significant ant the 0.05 level (2-tailed) 1 Male: 1 and Female: 0
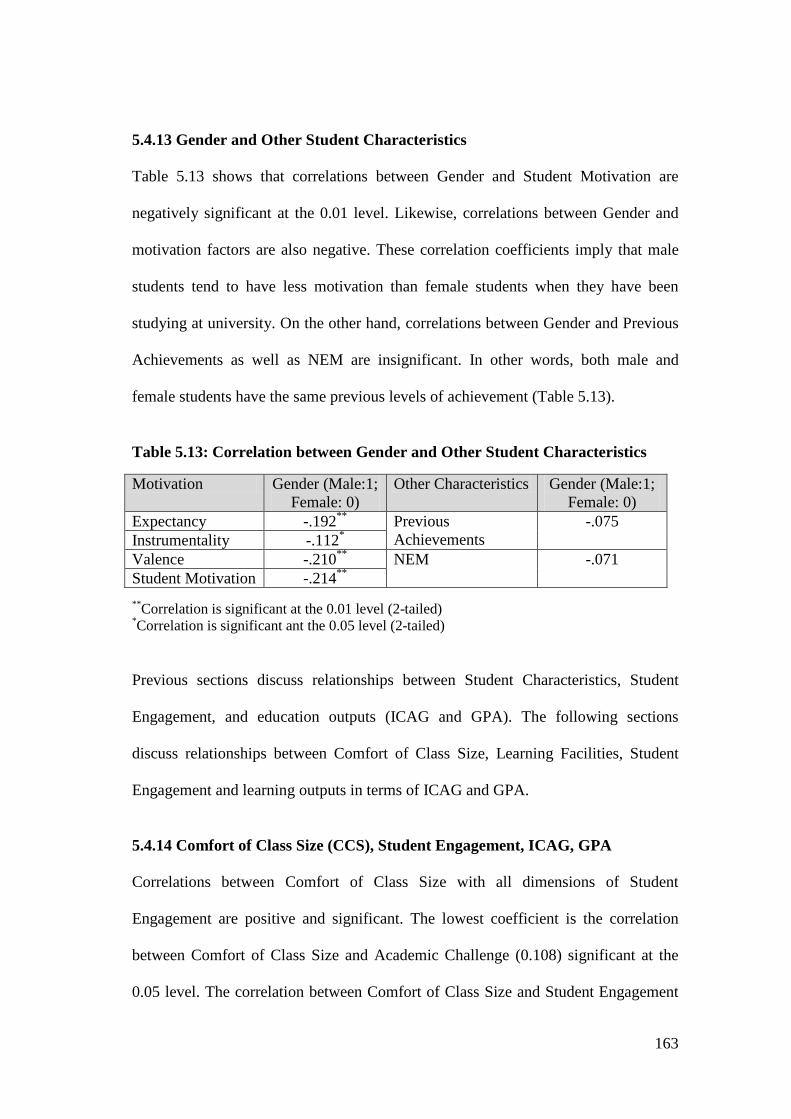
163
5.4.13 Gender and Other Student Characteristics Table 5.13 shows that correlations between Gender and Student Motivation are
negatively significant at the 0.01 level. Likewise, correlations between Gender and
motivation factors are also negative. These correlation coefficients imply that male
students tend to have less motivation than female students when they have been
studying at university. On the other hand, correlations between Gender and Previous
Achievements as well as NEM are insignificant. In other words, both male and
female students have the same previous levels of achievement (Table 5.13).
Table 5.13: Correlation between Gender and Other Student Characteristics
Motivation Gender (Male:1; Female: 0)
Other Characteristics Gender (Male:1; Female: 0)
Expectancy -.192** Previous Achievements
-.075 Instrumentality -.112* Valence -.210** NEM -.071 Student Motivation -.214**
**Correlation is significant at the 0.01 level (2-tailed) *Correlation is significant ant the 0.05 level (2-tailed) Previous sections discuss relationships between Student Characteristics, Student
Engagement, and education outputs (ICAG and GPA). The following sections
discuss relationships between Comfort of Class Size, Learning Facilities, Student
Engagement and learning outputs in terms of ICAG and GPA.
5.4.14 Comfort of Class Size (CCS), Student Engagement, ICAG, GPA Correlations between Comfort of Class Size with all dimensions of Student
Engagement are positive and significant. The lowest coefficient is the correlation
between Comfort of Class Size and Academic Challenge (0.108) significant at the
0.05 level. The correlation between Comfort of Class Size and Student Engagement
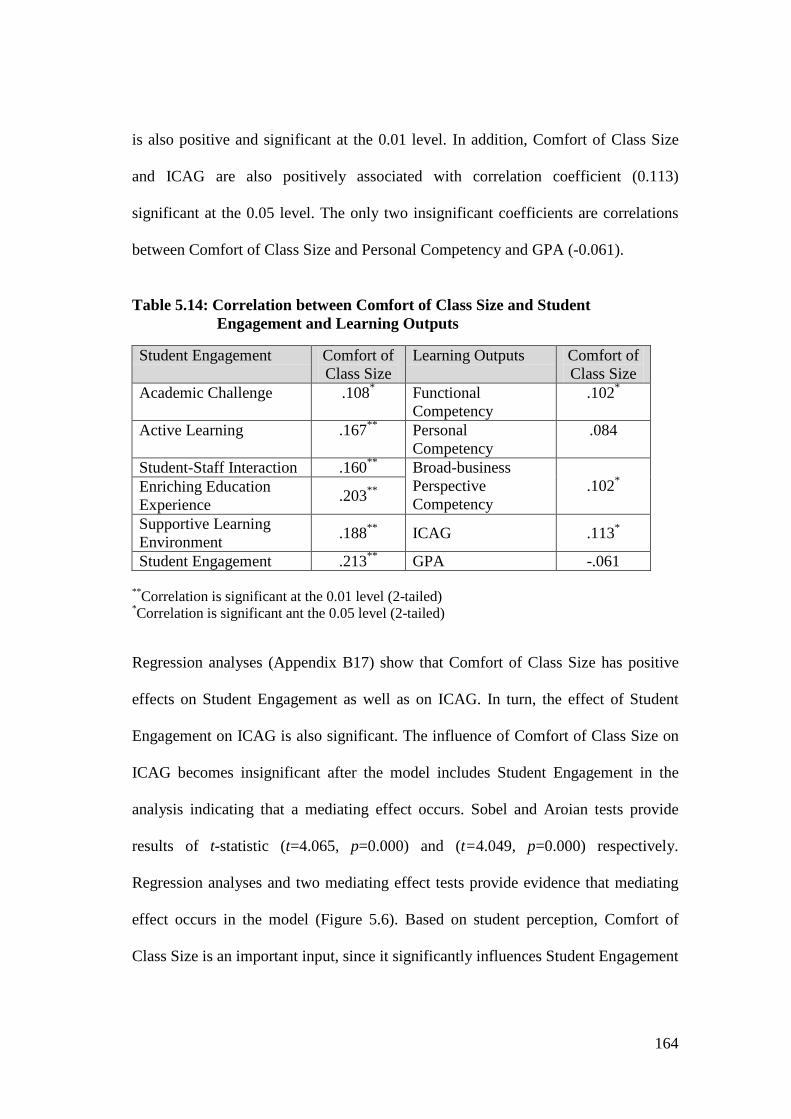
164
is also positive and significant at the 0.01 level. In addition, Comfort of Class Size
and ICAG are also positively associated with correlation coefficient (0.113)
significant at the 0.05 level. The only two insignificant coefficients are correlations
between Comfort of Class Size and Personal Competency and GPA (-0.061).
Table 5.14: Correlation between Comfort of Class Size and Student
Engagement and Learning Outputs
Student Engagement Comfort of Class Size
Learning Outputs Comfort of Class Size
Academic Challenge .108* Functional Competency
.102*
Active Learning .167** Personal Competency
.084
Student-Staff Interaction .160** Broad-business Perspective Competency
.102* Enriching Education
Experience .203**
Supportive Learning Environment .188** ICAG .113*
Student Engagement .213** GPA -.061
**Correlation is significant at the 0.01 level (2-tailed) *Correlation is significant ant the 0.05 level (2-tailed)
Regression analyses (Appendix B17) show that Comfort of Class Size has positive
effects on Student Engagement as well as on ICAG. In turn, the effect of Student
Engagement on ICAG is also significant. The influence of Comfort of Class Size on
ICAG becomes insignificant after the model includes Student Engagement in the
analysis indicating that a mediating effect occurs. Sobel and Aroian tests provide
results of t-statistic (t=4.065, p=0.000) and (t=4.049, p=0.000) respectively.
Regression analyses and two mediating effect tests provide evidence that mediating
effect occurs in the model (Figure 5.6). Based on student perception, Comfort of
Class Size is an important input, since it significantly influences Student Engagement
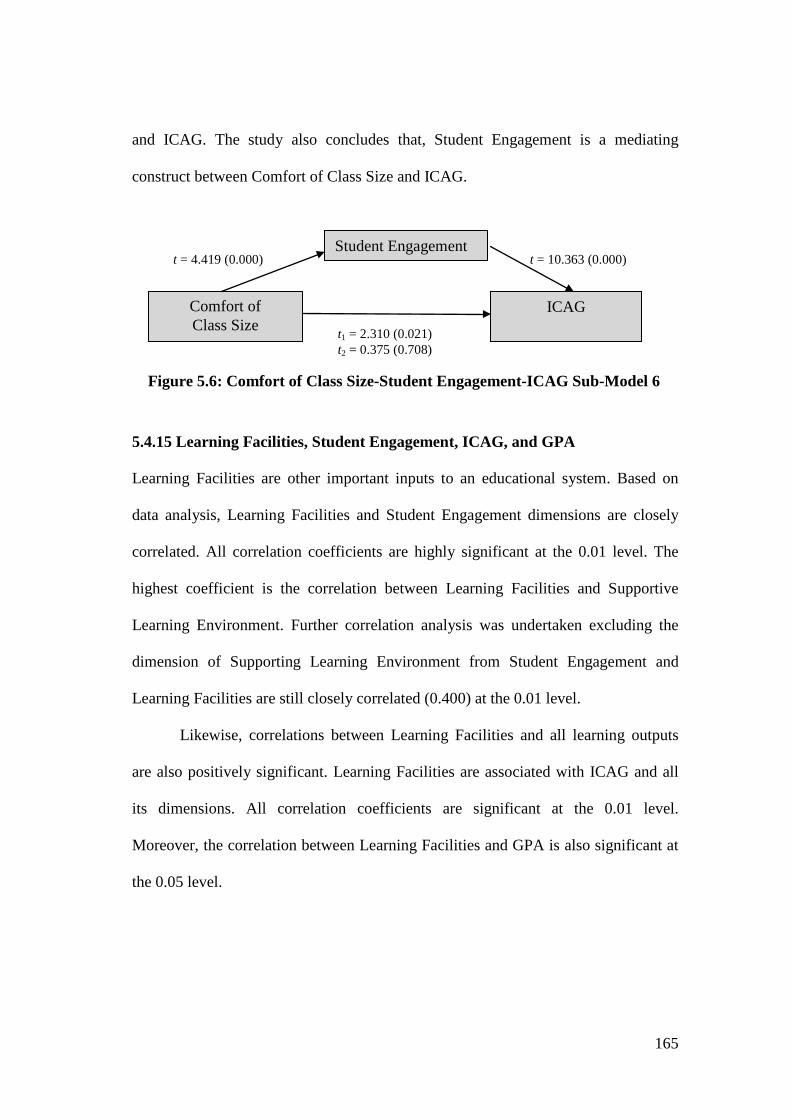
165
and ICAG. The study also concludes that, Student Engagement is a mediating
construct between Comfort of Class Size and ICAG.
5.4.15 Learning Facilities, Student Engagement, ICAG, and GPA Learning Facilities are other important inputs to an educational system. Based on
data analysis, Learning Facilities and Student Engagement dimensions are closely
correlated. All correlation coefficients are highly significant at the 0.01 level. The
highest coefficient is the correlation between Learning Facilities and Supportive
Learning Environment. Further correlation analysis was undertaken excluding the
dimension of Supporting Learning Environment from Student Engagement and
Learning Facilities are still closely correlated (0.400) at the 0.01 level.
Likewise, correlations between Learning Facilities and all learning outputs
are also positively significant. Learning Facilities are associated with ICAG and all
its dimensions. All correlation coefficients are significant at the 0.01 level.
Moreover, the correlation between Learning Facilities and GPA is also significant at
the 0.05 level.
Figure 5.6: Comfort of Class Size-Student Engagement-ICAG Sub-Model 6
t = 4.419 (0.000) t = 10.363 (0.000)
Comfort of Class Size
Student Engagement
ICAG t1 = 2.310 (0.021) t2 = 0.375 (0.708)
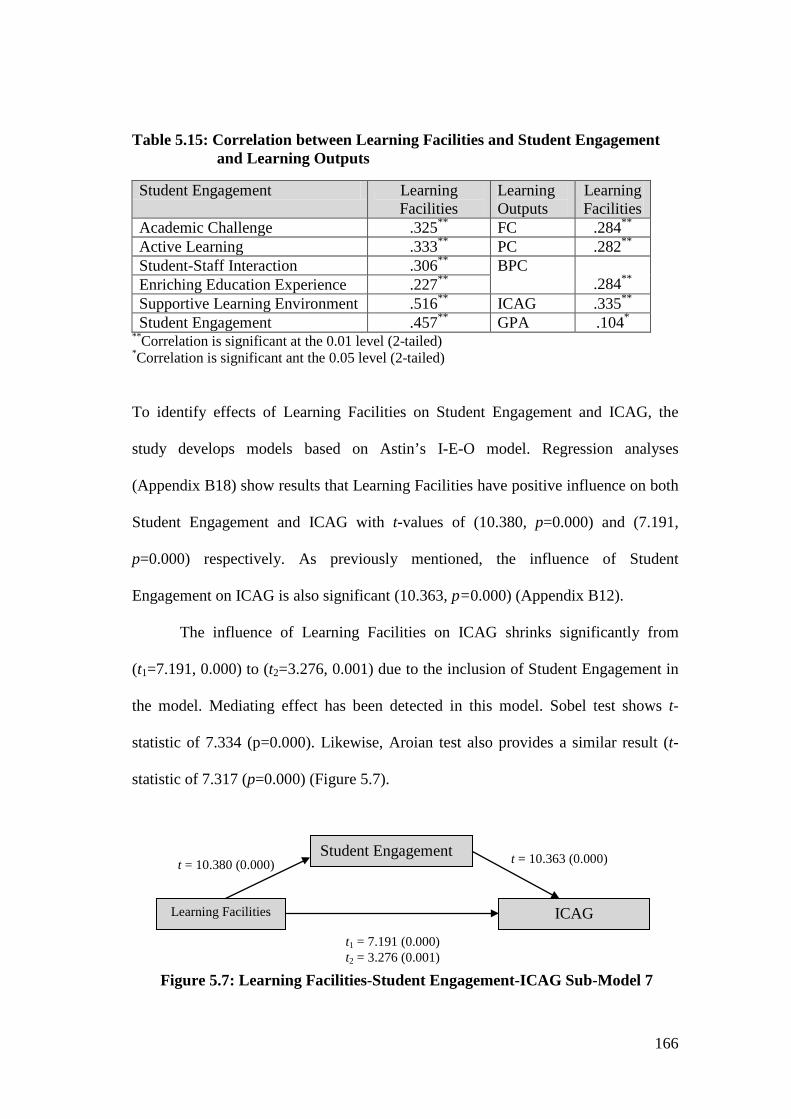
166
Table 5.15: Correlation between Learning Facilities and Student Engagement and Learning Outputs
Student Engagement Learning Facilities
Learning Outputs
Learning Facilities
Academic Challenge .325** FC .284** Active Learning .333** PC .282** Student-Staff Interaction .306** BPC
.284** Enriching Education Experience .227** Supportive Learning Environment .516** ICAG .335** Student Engagement .457** GPA .104*
**Correlation is significant at the 0.01 level (2-tailed) *Correlation is significant ant the 0.05 level (2-tailed)
To identify effects of Learning Facilities on Student Engagement and ICAG, the
study develops models based on Astin’s I-E-O model. Regression analyses
(Appendix B18) show results that Learning Facilities have positive influence on both
Student Engagement and ICAG with t-values of (10.380, p=0.000) and (7.191,
p=0.000) respectively. As previously mentioned, the influence of Student
Engagement on ICAG is also significant (10.363, p=0.000) (Appendix B12).
The influence of Learning Facilities on ICAG shrinks significantly from
(t1=7.191, 0.000) to (t2=3.276, 0.001) due to the inclusion of Student Engagement in
the model. Mediating effect has been detected in this model. Sobel test shows t-
statistic of 7.334 (p=0.000). Likewise, Aroian test also provides a similar result (t-
statistic of 7.317 (p=0.000) (Figure 5.7).
t = 10.363 (0.000) t = 10.380 (0.000)
Learning Facilities
Student Engagement
ICAG
t1 = 7.191 (0.000) t2 = 3.276 (0.001)
Figure 5.7: Learning Facilities-Student Engagement-ICAG Sub-Model 7
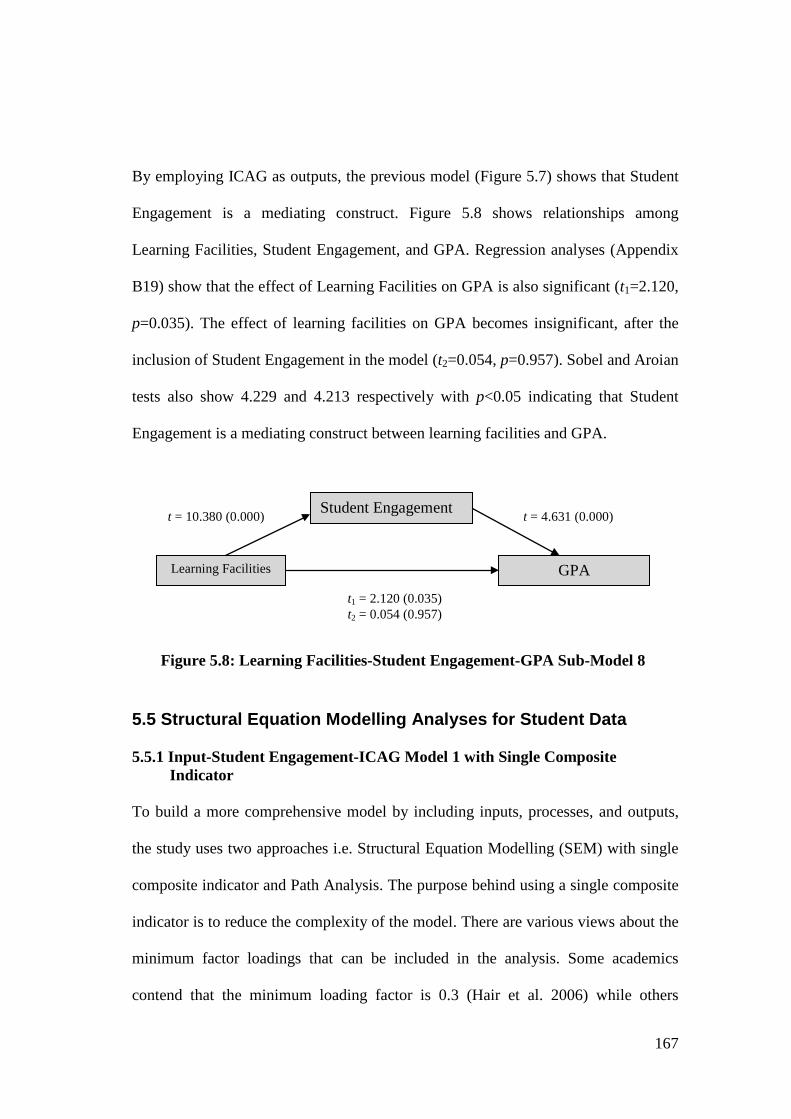
167
By employing ICAG as outputs, the previous model (Figure 5.7) shows that Student
Engagement is a mediating construct. Figure 5.8 shows relationships among
Learning Facilities, Student Engagement, and GPA. Regression analyses (Appendix
B19) show that the effect of Learning Facilities on GPA is also significant (t1=2.120,
p=0.035). The effect of learning facilities on GPA becomes insignificant, after the
inclusion of Student Engagement in the model (t2=0.054, p=0.957). Sobel and Aroian
tests also show 4.229 and 4.213 respectively with p<0.05 indicating that Student
Engagement is a mediating construct between learning facilities and GPA.
5.5 Structural Equation Modelling Analyses for Student Data 5.5.1 Input-Student Engagement-ICAG Model 1 with Single Composite
Indicator To build a more comprehensive model by including inputs, processes, and outputs,
the study uses two approaches i.e. Structural Equation Modelling (SEM) with single
composite indicator and Path Analysis. The purpose behind using a single composite
indicator is to reduce the complexity of the model. There are various views about the
minimum factor loadings that can be included in the analysis. Some academics
contend that the minimum loading factor is 0.3 (Hair et al. 2006) while others
t = 4.631 (0.000) t = 10.380 (0.000)
Learning Facilities
Student Engagement
GPA
t1 = 2.120 (0.035) t2 = 0.054 (0.957)
Figure 5.8: Learning Facilities-Student Engagement-GPA Sub-Model 8
168
determine 0.4 (Carraher et al. 1998) or even 0.7 (Saadé & Kira 2009). The study uses
factor loading at least 0.4 for Comfort of Class Size, Learning Facilities, Student
Engagement, and ICAG. However, the study includes some questions having factor
loading of more than 0.35, since the study employs a large sample (n=411).
The lowest factor loading for ICAG is 0.434 while the highest loading factor
is 0.624. Originally, Student Engagement consisted of 35 questions, but 23 questions
have reasonable factor loadings. Moreover, the study includes two questions that
have factor loadings 0.370 and 0.359, since these questions are considered important.
Comfort of Class Size consists of three questions and all of them have factor loading
more than 0.4. All questions of Learning Facilities are considered valid, since they
have at least 0.556 factor loadings. Lastly, all questions for Student Motivation are
considered valid, but three questions have factor loading of 0.368, 0.389, and 0.365.
These three questions are included in the analysis.
As previously mentioned, the study uses SEM with single composite
indicator; the study calculates composite indicators for ICAG, Student Engagement,
Comfort of Class Size, and Learning Facilities. Student Motivation is the exception,
since Student Motivation is the multiplication of Expectancy, Instrumentality, and
Valence. Therefore, this is treated as an observed construct. Since Student
Motivation is the result of multiplication, the scores become large. The study
transforms Student Motivation data into log data to get a normal distribution (see
previous section 5.3). Factor loadings, measurement errors, and factor score weights
are used to calculate a composite indicator. For more detailed information, Appendix
(Appendix B20) provides all coefficients for calculating a composite indicator. The
169
calculations of composite indicator for ICAG, Student Engagement, Comfort of
Class Size, and Learning Facilities are presented in Appendix B21, B22, and B23.
The study develops Preliminary Model 1 by including all inputs (Student
Motivation, Learning Facilities, Comfort of Class Size, Previous Achievements, and
Age), processes (Student Engagement), and outputs (ICAG) (Appendix B24). Even
though, previous analyses (correlations and regressions) show Comfort of Class Size
has a significant effect on Student Engagement and ICAG (Table 5.14 and Figure
5.6), Structural Equation Modelling (SEM) employing a single indicator technique
shows that the effect of Comfort of Class Size on Student Engagement is minimal.
Standardised regression weight of Comfort of Class Size on Student Engagement is
insignificant (0.076). Likewise, the effect of Age on Student Engagement and ICAG
is also insignificant. Standardised regression weights of Age on Student Engagement
and ICAG are -0.32 (p=0.490) and -0.036 (p=436) respectively, even though
Goodness of Fit of the preliminary model shows a good fit.
The study assesses the Goodness of Fit by employing some indices. Chi-
square (CMIN) is used to assess actual and predicted matrices. The CMIN coefficient
obtained is 1.022 (p=0.600) meaning that the Chi-square is insignificant. In other
words, actual and predicted matrices are not statistically different. Likewise, RMSEA
that measures tendency of Chi-square statistic rejects the model with large sample
size is found to be fit. Other Goodness of Fit tests (GFI, AGFI, and NFI) also show
that the model has a good fit (Table 5.16).
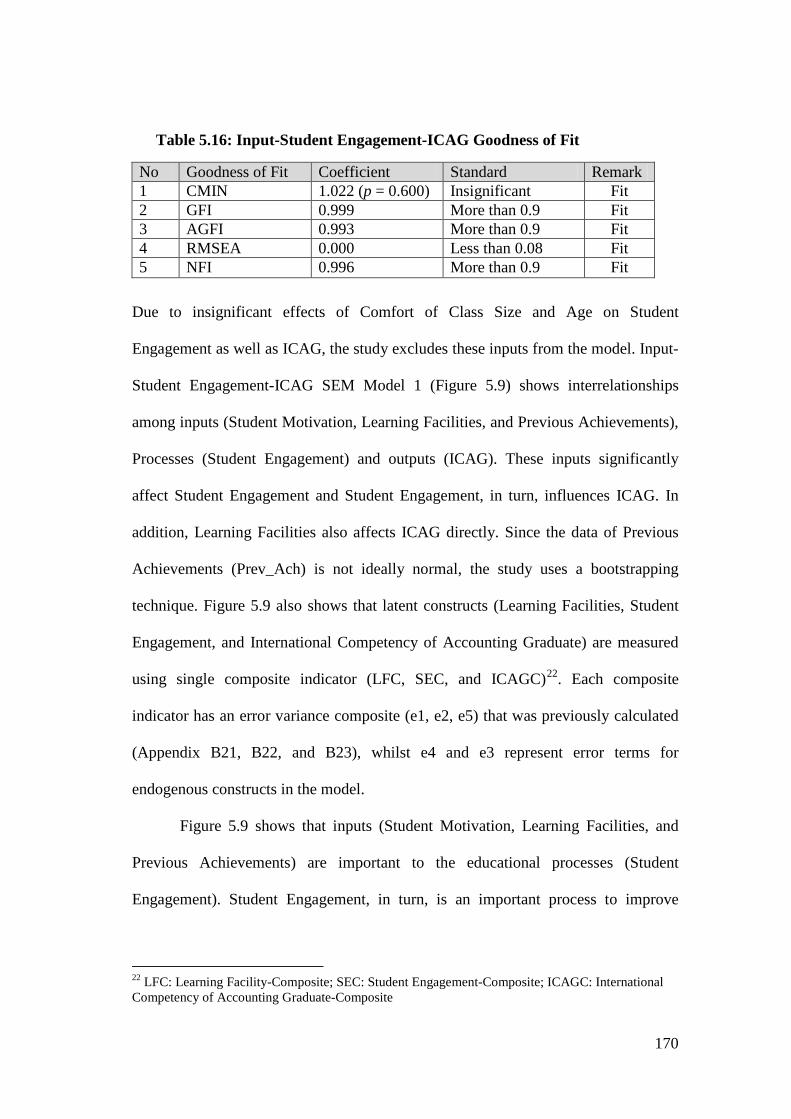
170
Table 5.16: Input-Student Engagement-ICAG Goodness of Fit
No Goodness of Fit Coefficient Standard Remark 1 CMIN 1.022 (p = 0.600) Insignificant Fit 2 GFI 0.999 More than 0.9 Fit 3 AGFI 0.993 More than 0.9 Fit 4 RMSEA 0.000 Less than 0.08 Fit 5 NFI 0.996 More than 0.9 Fit
Due to insignificant effects of Comfort of Class Size and Age on Student
Engagement as well as ICAG, the study excludes these inputs from the model. Input-
Student Engagement-ICAG SEM Model 1 (Figure 5.9) shows interrelationships
among inputs (Student Motivation, Learning Facilities, and Previous Achievements),
Processes (Student Engagement) and outputs (ICAG). These inputs significantly
affect Student Engagement and Student Engagement, in turn, influences ICAG. In
addition, Learning Facilities also affects ICAG directly. Since the data of Previous
Achievements (Prev_Ach) is not ideally normal, the study uses a bootstrapping
technique. Figure 5.9 also shows that latent constructs (Learning Facilities, Student
Engagement, and International Competency of Accounting Graduate) are measured
using single composite indicator (LFC, SEC, and ICAGC)22. Each composite
indicator has an error variance composite (e1, e2, e5) that was previously calculated
(Appendix B21, B22, and B23), whilst e4 and e3 represent error terms for
endogenous constructs in the model.
Figure 5.9 shows that inputs (Student Motivation, Learning Facilities, and
Previous Achievements) are important to the educational processes (Student
Engagement). Student Engagement, in turn, is an important process to improve
22 LFC: Learning Facility-Composite; SEC: Student Engagement-Composite; ICAGC: International Competency of Accounting Graduate-Composite
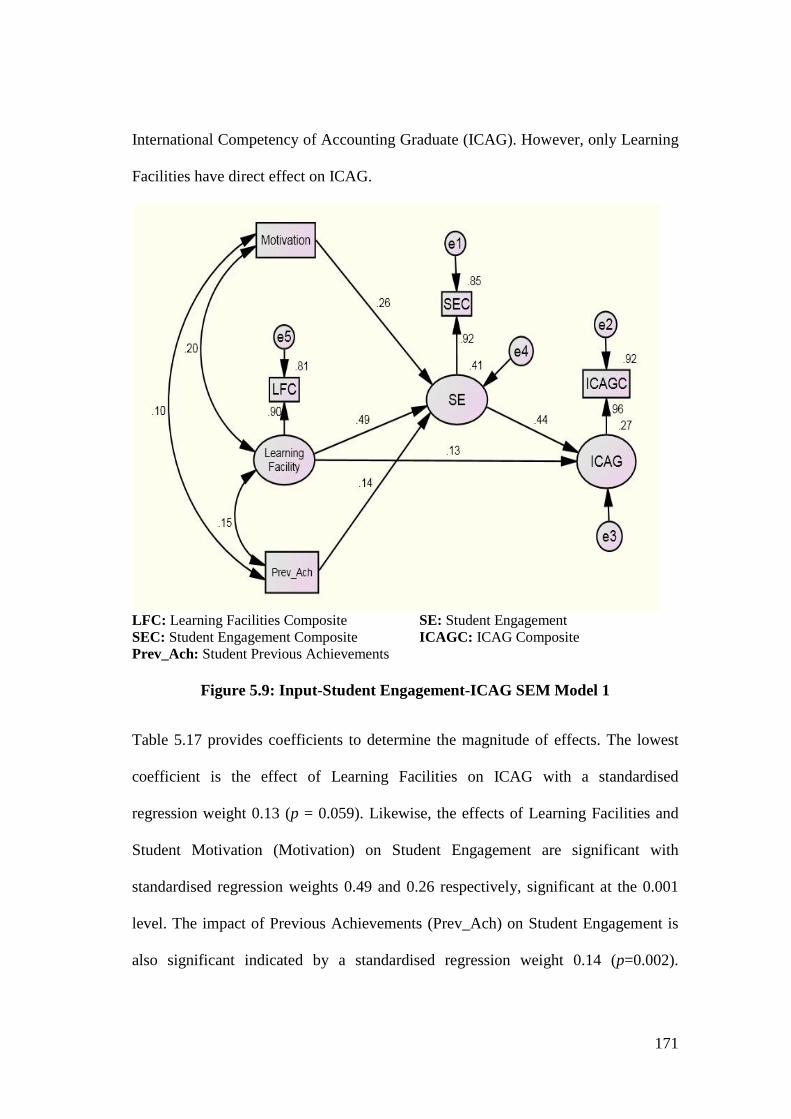
171
International Competency of Accounting Graduate (ICAG). However, only Learning
Facilities have direct effect on ICAG.
LFC: Learning Facilities Composite SE: Student Engagement SEC: Student Engagement Composite ICAGC: ICAG Composite Prev_Ach: Student Previous Achievements
Figure 5.9: Input-Student Engagement-ICAG SEM Model 1
Table 5.17 provides coefficients to determine the magnitude of effects. The lowest
coefficient is the effect of Learning Facilities on ICAG with a standardised
regression weight 0.13 (p = 0.059). Likewise, the effects of Learning Facilities and
Student Motivation (Motivation) on Student Engagement are significant with
standardised regression weights 0.49 and 0.26 respectively, significant at the 0.001
level. The impact of Previous Achievements (Prev_Ach) on Student Engagement is
also significant indicated by a standardised regression weight 0.14 (p=0.002).
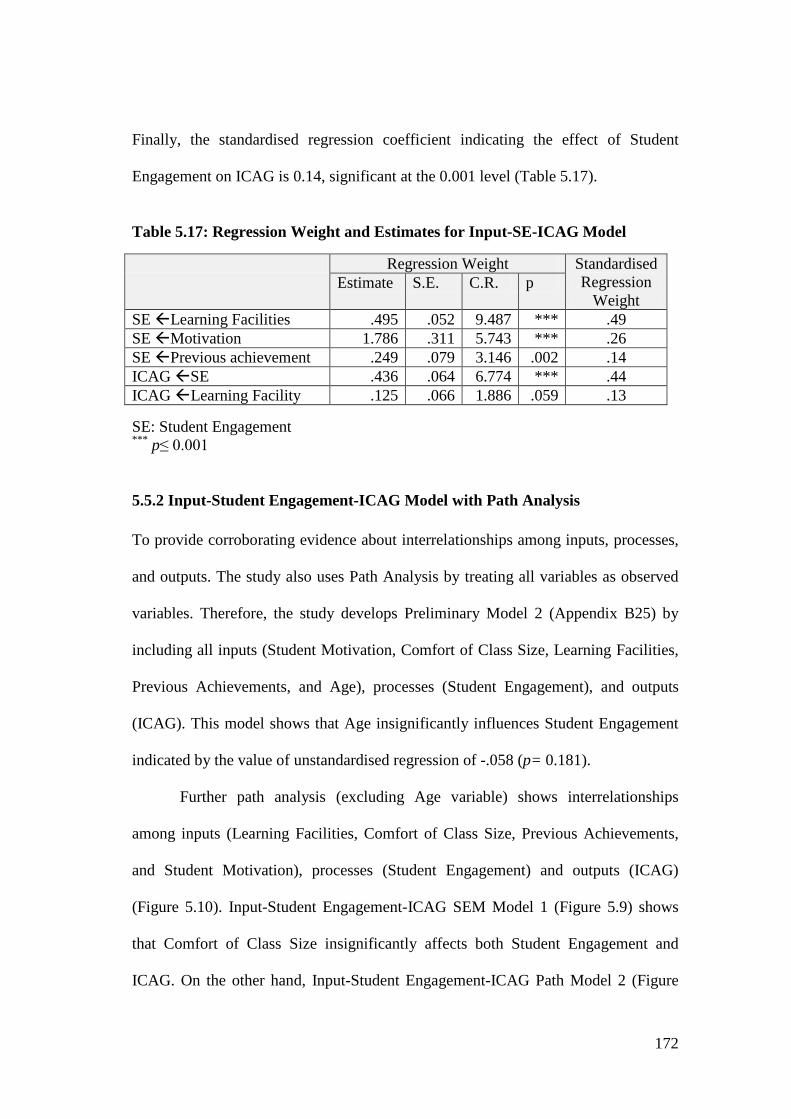
172
Finally, the standardised regression coefficient indicating the effect of Student
Engagement on ICAG is 0.14, significant at the 0.001 level (Table 5.17).
Table 5.17: Regression Weight and Estimates for Input-SE-ICAG Model
Regression Weight Standardised Regression
Weight Estimate S.E. C.R. p
SE Learning Facilities .495 .052 9.487 *** .49 SE Motivation 1.786 .311 5.743 *** .26 SE Previous achievement .249 .079 3.146 .002 .14 ICAG SE .436 .064 6.774 *** .44 ICAG Learning Facility .125 .066 1.886 .059 .13 SE: Student Engagement *** p≤ 0.001 5.5.2 Input-Student Engagement-ICAG Model with Path Analysis To provide corroborating evidence about interrelationships among inputs, processes,
and outputs. The study also uses Path Analysis by treating all variables as observed
variables. Therefore, the study develops Preliminary Model 2 (Appendix B25) by
including all inputs (Student Motivation, Comfort of Class Size, Learning Facilities,
Previous Achievements, and Age), processes (Student Engagement), and outputs
(ICAG). This model shows that Age insignificantly influences Student Engagement
indicated by the value of unstandardised regression of -.058 (p= 0.181).
Further path analysis (excluding Age variable) shows interrelationships
among inputs (Learning Facilities, Comfort of Class Size, Previous Achievements,
and Student Motivation), processes (Student Engagement) and outputs (ICAG)
(Figure 5.10). Input-Student Engagement-ICAG SEM Model 1 (Figure 5.9) shows
that Comfort of Class Size insignificantly affects both Student Engagement and
ICAG. On the other hand, Input-Student Engagement-ICAG Path Model 2 (Figure
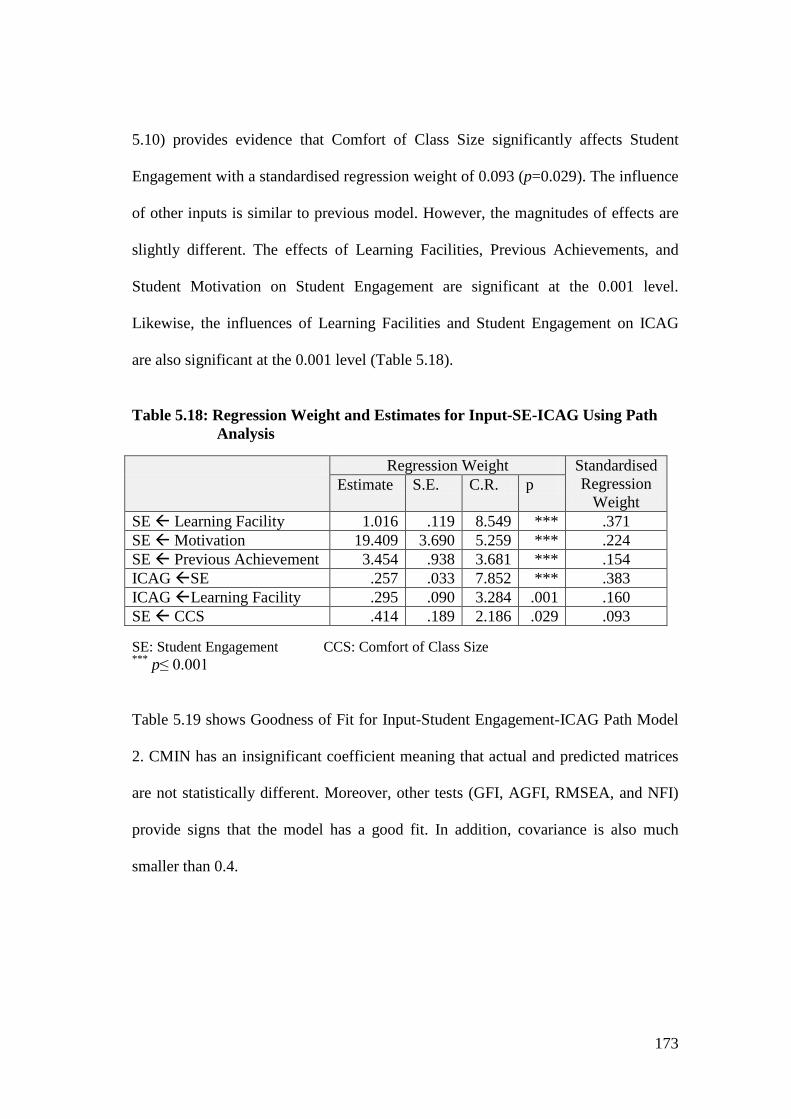
173
5.10) provides evidence that Comfort of Class Size significantly affects Student
Engagement with a standardised regression weight of 0.093 (p=0.029). The influence
of other inputs is similar to previous model. However, the magnitudes of effects are
slightly different. The effects of Learning Facilities, Previous Achievements, and
Student Motivation on Student Engagement are significant at the 0.001 level.
Likewise, the influences of Learning Facilities and Student Engagement on ICAG
are also significant at the 0.001 level (Table 5.18).
Table 5.18: Regression Weight and Estimates for Input-SE-ICAG Using Path
Analysis
Regression Weight Standardised Regression
Weight Estimate S.E. C.R. p
SE Learning Facility 1.016 .119 8.549 *** .371 SE Motivation 19.409 3.690 5.259 *** .224 SE Previous Achievement 3.454 .938 3.681 *** .154 ICAG SE .257 .033 7.852 *** .383 ICAG Learning Facility .295 .090 3.284 .001 .160 SE CCS .414 .189 2.186 .029 .093 SE: Student Engagement CCS: Comfort of Class Size *** p≤ 0.001 Table 5.19 shows Goodness of Fit for Input-Student Engagement-ICAG Path Model
2. CMIN has an insignificant coefficient meaning that actual and predicted matrices
are not statistically different. Moreover, other tests (GFI, AGFI, RMSEA, and NFI)
provide signs that the model has a good fit. In addition, covariance is also much
smaller than 0.4.
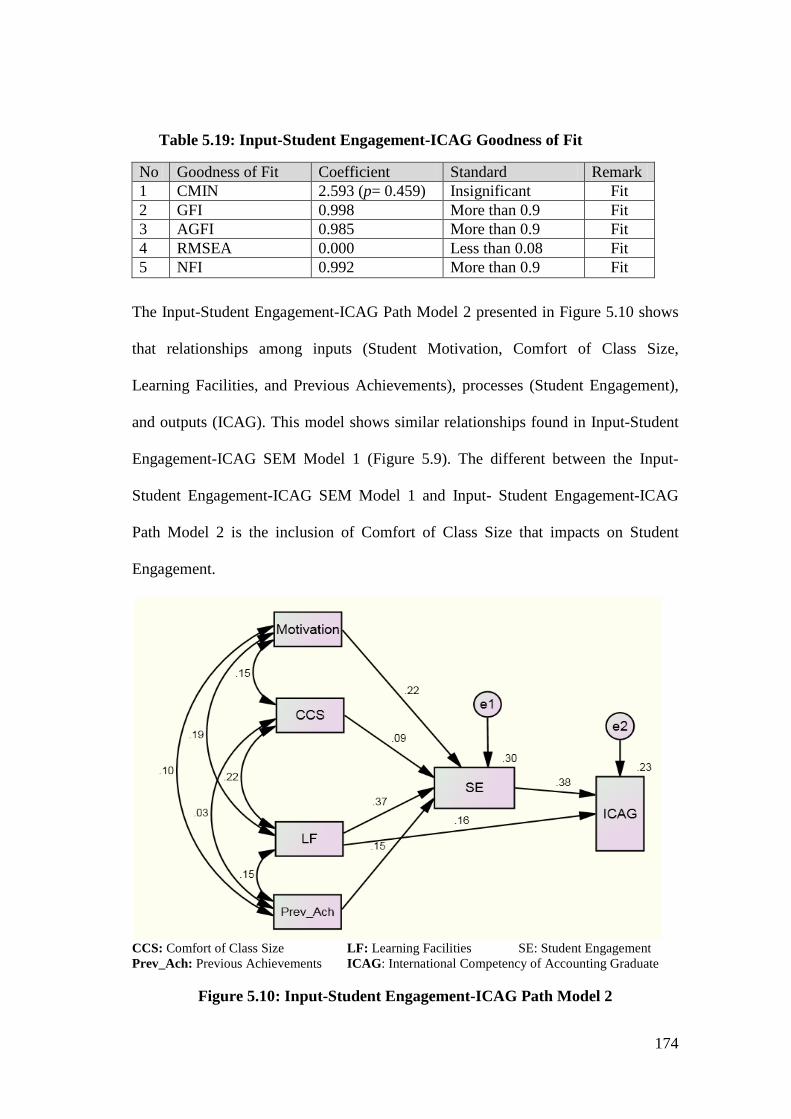
174
Table 5.19: Input-Student Engagement-ICAG Goodness of Fit
No Goodness of Fit Coefficient Standard Remark 1 CMIN 2.593 (p= 0.459) Insignificant Fit 2 GFI 0.998 More than 0.9 Fit 3 AGFI 0.985 More than 0.9 Fit 4 RMSEA 0.000 Less than 0.08 Fit 5 NFI 0.992 More than 0.9 Fit
The Input-Student Engagement-ICAG Path Model 2 presented in Figure 5.10 shows
that relationships among inputs (Student Motivation, Comfort of Class Size,
Learning Facilities, and Previous Achievements), processes (Student Engagement),
and outputs (ICAG). This model shows similar relationships found in Input-Student
Engagement-ICAG SEM Model 1 (Figure 5.9). The different between the Input-
Student Engagement-ICAG SEM Model 1 and Input- Student Engagement-ICAG
Path Model 2 is the inclusion of Comfort of Class Size that impacts on Student
Engagement.
CCS: Comfort of Class Size LF: Learning Facilities SE: Student Engagement Prev_Ach: Previous Achievements ICAG: International Competency of Accounting Graduate
Figure 5.10: Input-Student Engagement-ICAG Path Model 2
175
5.5.3 Input-Student Engagement-GPA Model with Single Composite Indicator A common output of education processes in higher education is student
achievements measured by Grade Point Average (GPA). Therefore, the study not
only builds an Input-Process-ICAG model, but also builds Input-Process-GPA
model. This model is intended to identify interrelationships among inputs (Student
Motivation, Comfort of Class Size, Learning Facilities, and Previous Achievements),
processes (Student Engagement), and output (GPA). The study develops Preliminary
Model 3 using SEM (Appendix B26) by including all educational inputs (Student
Motivation, Comfort of Class Size, Learning Facilities, Previous Achievements, and
Age). The model shows that Age insignificantly influences both Student Engagement
and GPA. Regression estimates show the influence of Age on Student Engagement
indicated by a standardised regression of -0.040 (p=0.383) and the effect of Age on
Student Engagement is -0.009 (p=0.856). This Preliminary Model 3 is considered fit
by using some goodness of fit tests namely CMIN, GFI, AGFI, RMSEA, and NFI.
Owing to insignificant effects of Age on Student Engagement and GPA, the
study excludes this variable from the model. Input-Student Engagement-GPA SEM
Model 3 (Figure 5.11) shows interrelationships among inputs, processes, and output.
In addition, the model only shows significant regression estimates (p<0.05).
Student Motivation (Motivation) has a positive effect on both Student
Engagement and GPA. Standardised regression weights of this construct are 0.259
(p=0.001) and 0.135 (p=0.006) for the influence of motivation on Student
Engagement and GPA respectively. Likewise, Previous Achievements gained by
students from High School or Vocational School, also have a positive impacts on
both Student Engagement and GPA with standardised regression weight of 0.140
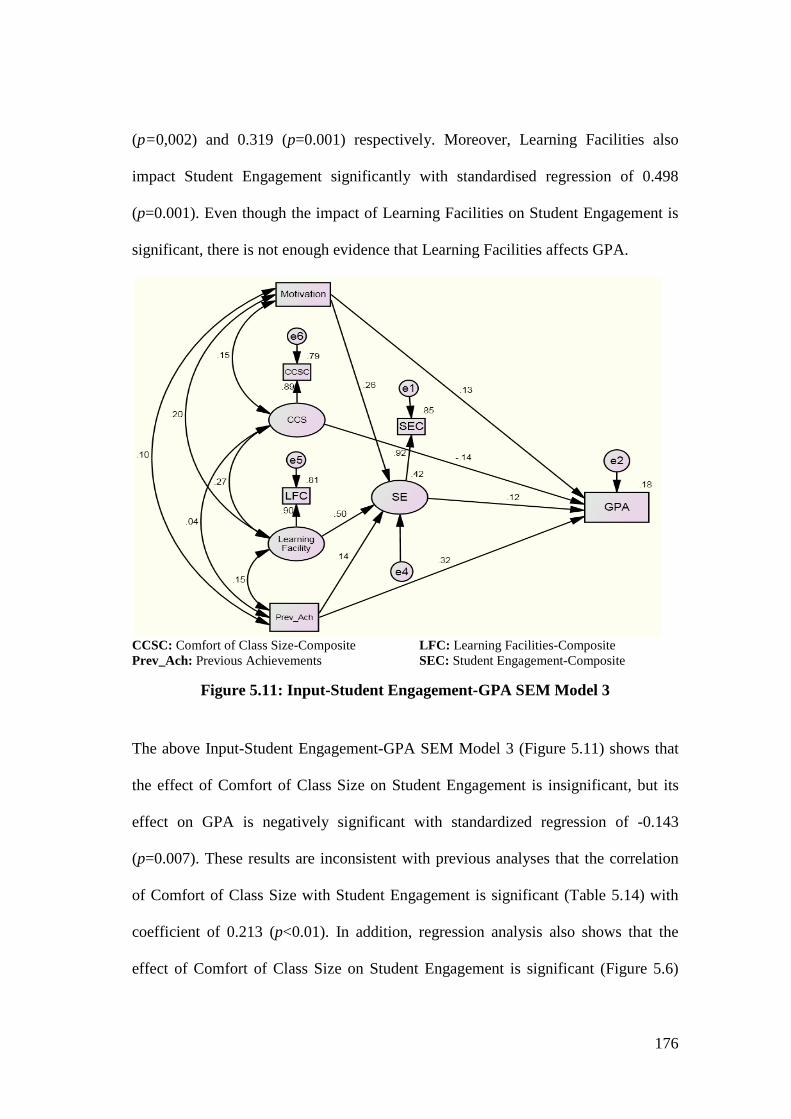
176
(p=0,002) and 0.319 (p=0.001) respectively. Moreover, Learning Facilities also
impact Student Engagement significantly with standardised regression of 0.498
(p=0.001). Even though the impact of Learning Facilities on Student Engagement is
significant, there is not enough evidence that Learning Facilities affects GPA.
CCSC: Comfort of Class Size-Composite LFC: Learning Facilities-Composite Prev_Ach: Previous Achievements SEC: Student Engagement-Composite
Figure 5.11: Input-Student Engagement-GPA SEM Model 3
The above Input-Student Engagement-GPA SEM Model 3 (Figure 5.11) shows that
the effect of Comfort of Class Size on Student Engagement is insignificant, but its
effect on GPA is negatively significant with standardized regression of -0.143
(p=0.007). These results are inconsistent with previous analyses that the correlation
of Comfort of Class Size with Student Engagement is significant (Table 5.14) with
coefficient of 0.213 (p<0.01). In addition, regression analysis also shows that the
effect of Comfort of Class Size on Student Engagement is significant (Figure 5.6)
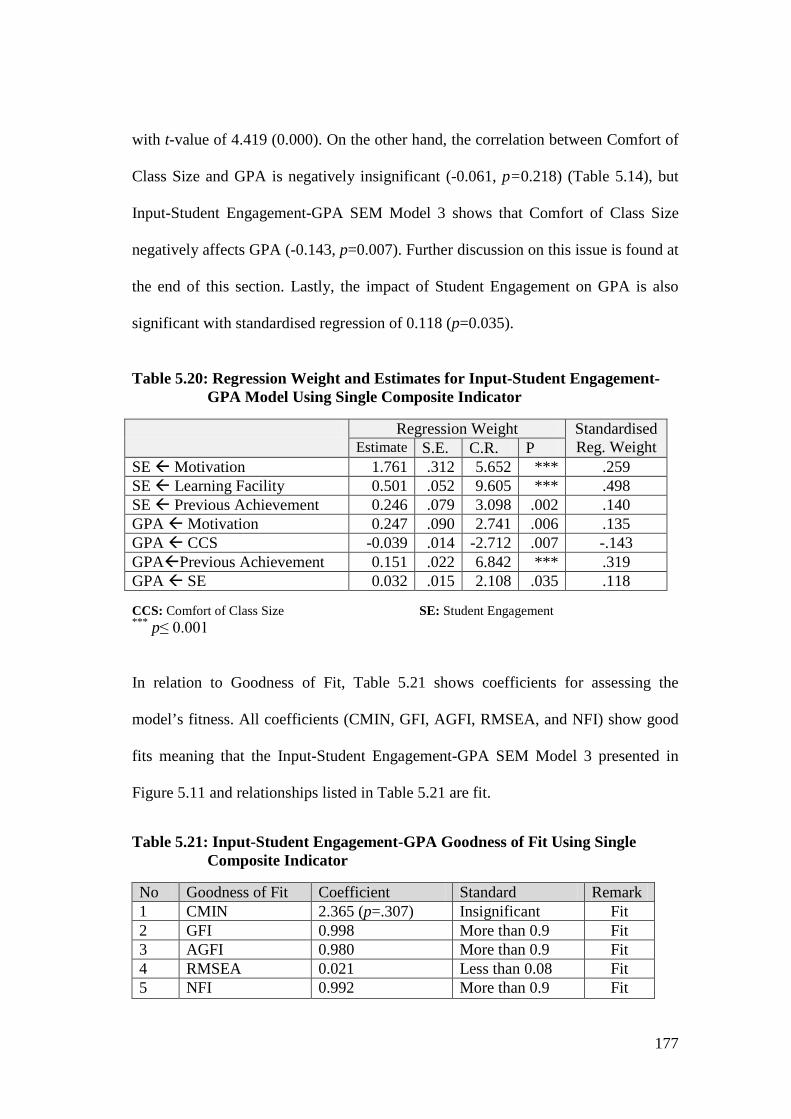
177
with t-value of 4.419 (0.000). On the other hand, the correlation between Comfort of
Class Size and GPA is negatively insignificant (-0.061, p=0.218) (Table 5.14), but
Input-Student Engagement-GPA SEM Model 3 shows that Comfort of Class Size
negatively affects GPA (-0.143, p=0.007). Further discussion on this issue is found at
the end of this section. Lastly, the impact of Student Engagement on GPA is also
significant with standardised regression of 0.118 (p=0.035).
Table 5.20: Regression Weight and Estimates for Input-Student Engagement-
GPA Model Using Single Composite Indicator
Regression Weight Standardised Reg. Weight Estimate S.E. C.R. P
SE Motivation 1.761 .312 5.652 *** .259 SE Learning Facility 0.501 .052 9.605 *** .498 SE Previous Achievement 0.246 .079 3.098 .002 .140 GPA Motivation 0.247 .090 2.741 .006 .135 GPA CCS -0.039 .014 -2.712 .007 -.143 GPAPrevious Achievement 0.151 .022 6.842 *** .319 GPA SE 0.032 .015 2.108 .035 .118
CCS: Comfort of Class Size SE: Student Engagement *** p≤ 0.001
In relation to Goodness of Fit, Table 5.21 shows coefficients for assessing the
model’s fitness. All coefficients (CMIN, GFI, AGFI, RMSEA, and NFI) show good
fits meaning that the Input-Student Engagement-GPA SEM Model 3 presented in
Figure 5.11 and relationships listed in Table 5.21 are fit.
Table 5.21: Input-Student Engagement-GPA Goodness of Fit Using Single
Composite Indicator
No Goodness of Fit Coefficient Standard Remark 1 CMIN 2.365 (p=.307) Insignificant Fit 2 GFI 0.998 More than 0.9 Fit 3 AGFI 0.980 More than 0.9 Fit 4 RMSEA 0.021 Less than 0.08 Fit 5 NFI 0.992 More than 0.9 Fit
178
5.5.4 Input-Student Engagement-GPA Model with Path Analysis The study develops Preliminary Model 4 (Appendix B27) by including all inputs
(Student Motivation, Comfort of Class Size, Learning Facilities, Previous
Achievements, and Age), processes (Student Engagement), and outputs (GPA).
Using Path analysis, Age variable does not affect both Student Engagement and
GPA. Therefore, the study excluded this variable from the model. The model built
using Path analysis shows almost similar results with the model built based on SEM
with single composite indicator. The most salient difference is the effect of Comfort
of Class Size on Student Engagement. Input-Student Engagement-GPA SEM Model
3 (Figure 5.11) shows that Comfort of Class Size insignificantly affects Student
Engagement, but Input-Student Engagement-GPA Path Model 4 (Figure 5.12) shows
that Comfort of Class Size has significant influence on Student Engagement, even
though its standardised regression is small in magnitude (0.093, p=0.026).
Despite its magnitude, other standardized regression weights also change.
The negative influence of Comfort of Class Size on GPA is slightly higher in Input-
Student Engagement-GPA SEM Model 3 (-0.14, p=0.007) than the standardized
regression weight of Comfort of Class Size on GPA in Input-Student Engagement-
GPA Path Model 4 (-0.12, p=0.014). Motivation and Previous Achievements have
enough power to influence both Student Engagement and ICAG. Lastly, Learning
Facilities have a positive effect on Student Engagement but an insignificant impact
on GPA.
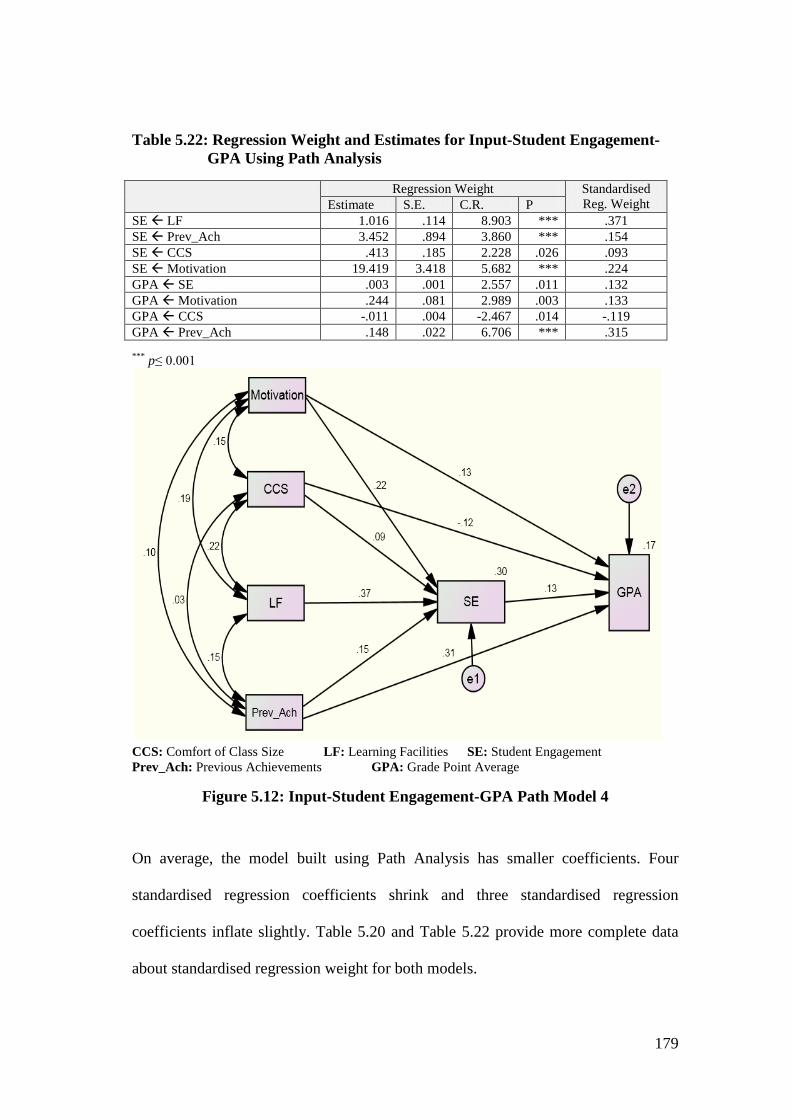
179
Table 5.22: Regression Weight and Estimates for Input-Student Engagement-GPA Using Path Analysis
Regression Weight Standardised Reg. Weight Estimate S.E. C.R. P
SE LF 1.016 .114 8.903 *** .371 SE Prev_Ach 3.452 .894 3.860 *** .154 SE CCS .413 .185 2.228 .026 .093 SE Motivation 19.419 3.418 5.682 *** .224 GPA SE .003 .001 2.557 .011 .132 GPA Motivation .244 .081 2.989 .003 .133 GPA CCS -.011 .004 -2.467 .014 -.119 GPA Prev_Ach .148 .022 6.706 *** .315
*** p≤ 0.001
CCS: Comfort of Class Size LF: Learning Facilities SE: Student Engagement Prev_Ach: Previous Achievements GPA: Grade Point Average
Figure 5.12: Input-Student Engagement-GPA Path Model 4
On average, the model built using Path Analysis has smaller coefficients. Four
standardised regression coefficients shrink and three standardised regression
coefficients inflate slightly. Table 5.20 and Table 5.22 provide more complete data
about standardised regression weight for both models.
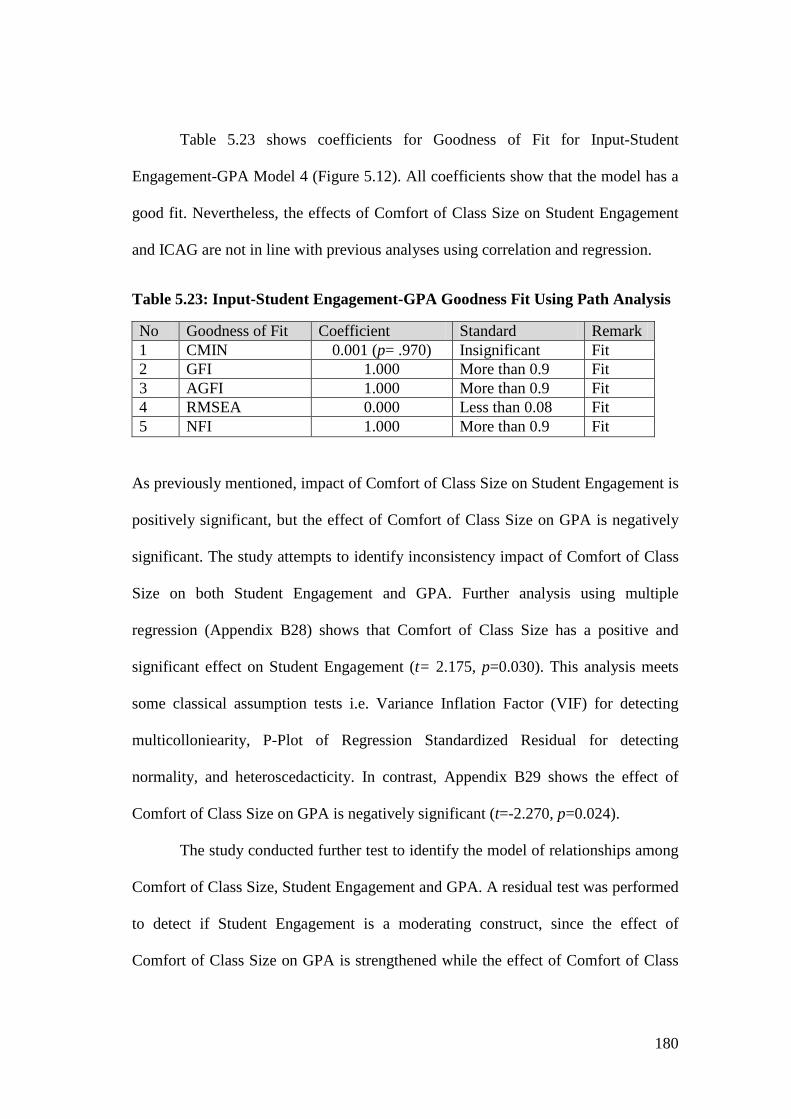
180
Table 5.23 shows coefficients for Goodness of Fit for Input-Student
Engagement-GPA Model 4 (Figure 5.12). All coefficients show that the model has a
good fit. Nevertheless, the effects of Comfort of Class Size on Student Engagement
and ICAG are not in line with previous analyses using correlation and regression.
Table 5.23: Input-Student Engagement-GPA Goodness Fit Using Path Analysis
No Goodness of Fit Coefficient Standard Remark 1 CMIN 0.001 (p= .970) Insignificant Fit 2 GFI 1.000 More than 0.9 Fit 3 AGFI 1.000 More than 0.9 Fit 4 RMSEA 0.000 Less than 0.08 Fit 5 NFI 1.000 More than 0.9 Fit
As previously mentioned, impact of Comfort of Class Size on Student Engagement is
positively significant, but the effect of Comfort of Class Size on GPA is negatively
significant. The study attempts to identify inconsistency impact of Comfort of Class
Size on both Student Engagement and GPA. Further analysis using multiple
regression (Appendix B28) shows that Comfort of Class Size has a positive and
significant effect on Student Engagement (t= 2.175, p=0.030). This analysis meets
some classical assumption tests i.e. Variance Inflation Factor (VIF) for detecting
multicolloniearity, P-Plot of Regression Standardized Residual for detecting
normality, and heteroscedacticity. In contrast, Appendix B29 shows the effect of
Comfort of Class Size on GPA is negatively significant (t=-2.270, p=0.024).
The study conducted further test to identify the model of relationships among
Comfort of Class Size, Student Engagement and GPA. A residual test was performed
to detect if Student Engagement is a moderating construct, since the effect of
Comfort of Class Size on GPA is strengthened while the effect of Comfort of Class
181
Size on Student Engagement is weaker. The result of this analysis (Appendix B30)
shows that the role of Student Engagement in this model is not moderating, indicated
by the insignificant effect of the absolute residual (ABS_RES1)23 obtained from the
regression of Comfort of Class Size on Student Engagement (t=-0.475, p=0.635).
Stepwise regression analysis (Appendix B31) shows that the influence of
Comfort of Class Size on GPA strengthens as the regression includes more
predictors. Finally, Regression Model 4 shows that Comfort of Class Size negatively
affects GPA (t=-2.568, p= 0.011) with standardized beta coefficient of -0.119.
Likewise, hierarchical regression was also undertaken to identify the effect of
Comfort of Class Size on GPA by adding an incremental predictor based on the
correlation strength among predictors (Appendix B32). The initial regression
(Regression 1) shows that the impact of Comfort of Class Size on GPA is
insignificant (t=-1.233, p=.218). Previous Achievements having the lowest
correlation with Comfort of Class Size (0.034) was included in the model as an
additional predictor. The result (Regression 2) shows that the t-value of Comfort of
Class Size strengthened from (-1.233, p=0.218) to (-1.579, p= 0.115). Regression 3 is
a multiple regression with three predictors (Comfort of Class Size, Previous
Achievements, and Motivation) and it shows that the t-value of Comfort of Class
Size strengthens from (-1.579, p= 0.115) to (-2.115, p=0.035). Lastly, additional
predictor of Learning Facilities (Regression 4) on the model also shows that the
negative influence of Comfort of Class Size on GPA becomes larger.
The last model (Regression 5), including five predictors, shows that all
predictors have effects on GPA. Comfort of Class Size, in this case, affects GPA
23 Absolute residual of regression for detecting moderating effect
182
indicated by a t-statistic of (-2.535, p=0.012). Moreover, all Variance Inflation
Factors (VIF) are less than 5 which is the maximum coefficient for multicollonerity.
Inconsistent impacts of Comfort of Class Size on Student Engagement and GPA
could be caused either by slight multicollonearity (Appendix B29) or GPA
measurement errors.
Student Motivation, Comfort of Class Size, Learning Facilities, and Previous
Achievements are important inputs for an educational process measured by Student
Engagement. In turn, Student Engagement also significantly affects ICAG and GPA
as educational outputs. Demographic Characteristics do not provide enough
influence on Student Engagement and educational outputs. Other Academic
Characteristics (NEM, Types of Previous Schooling, and Previous Major) do not
have enough strength to affect Student Engagement, ICAG, and GPA.
5.6 Descriptive Statistics of Lecturer Data Previous sections discuss models for improving ICAG and GPA based on student
perceptions. This section discusses roles of lecturers in improving ICAG and GPA in
Indonesian universities. To provide an overview, this section begins with descriptive
statistics of selected data. Mean, minimum, maximum, standard deviation, normal
distribution and data variation based on university, accreditation level of accounting
programs as well as based on universities’ locations are discussed. The discussion
focuses on some main data such as ICAG-Teaching Content, Lecturer Job
Satisfaction, Student-Faculty Engagement, and so forth.
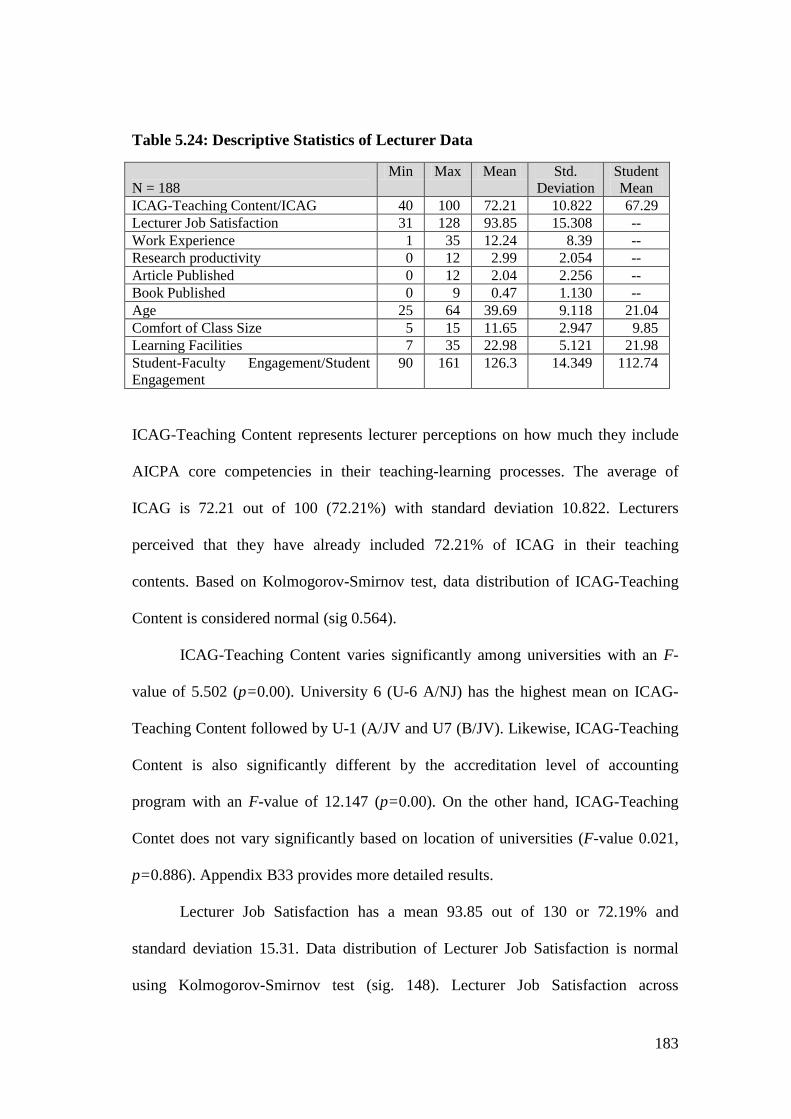
183
Table 5.24: Descriptive Statistics of Lecturer Data
N = 188
Min Max Mean Std. Deviation
Student Mean
ICAG-Teaching Content/ICAG 40 100 72.21 10.822 67.29 Lecturer Job Satisfaction 31 128 93.85 15.308 -- Work Experience 1 35 12.24 8.39 -- Research productivity 0 12 2.99 2.054 -- Article Published 0 12 2.04 2.256 -- Book Published 0 9 0.47 1.130 -- Age 25 64 39.69 9.118 21.04 Comfort of Class Size 5 15 11.65 2.947 9.85 Learning Facilities 7 35 22.98 5.121 21.98 Student-Faculty Engagement/Student Engagement
90 161 126.3 14.349 112.74
ICAG-Teaching Content represents lecturer perceptions on how much they include
AICPA core competencies in their teaching-learning processes. The average of
ICAG is 72.21 out of 100 (72.21%) with standard deviation 10.822. Lecturers
perceived that they have already included 72.21% of ICAG in their teaching
contents. Based on Kolmogorov-Smirnov test, data distribution of ICAG-Teaching
Content is considered normal (sig 0.564).
ICAG-Teaching Content varies significantly among universities with an F-
value of 5.502 (p=0.00). University 6 (U-6 A/NJ) has the highest mean on ICAG-
Teaching Content followed by U-1 (A/JV and U7 (B/JV). Likewise, ICAG-Teaching
Content is also significantly different by the accreditation level of accounting
program with an F-value of 12.147 (p=0.00). On the other hand, ICAG-Teaching
Contet does not vary significantly based on location of universities (F-value 0.021,
p=0.886). Appendix B33 provides more detailed results.
Lecturer Job Satisfaction has a mean 93.85 out of 130 or 72.19% and
standard deviation 15.31. Data distribution of Lecturer Job Satisfaction is normal
using Kolmogorov-Smirnov test (sig. 148). Lecturer Job Satisfaction across
184
universities is significantly different (F-value=5.807, p=0.00). U-6 has the highest
score of Lecturer Job Satisfaction followed by U-1 and U-3 (B/NJ). Likewise,
Lecturer Job Satisfaction also varies significantly by accreditation level of
accounting program (F-value=14.475, p=0.00). Moreover, Means of Lecturer Job
Satisfaction are 102.24, 90.34, and 89.53 for lecturers from A, B, and C accreditation
level respectively. Analyses show that a higher accreditation level tends to have a
higher score of Lecturer Job Satisfaction. Nevertheless, Lecturer Job Satisfaction
based on location of universities is insignificant (F-value=2.561, p=0.111).
Appendix B34 provides more detailed results.
Lecturer Academic Characteristics consists of Lecturer Work Experience,
Education Attainment, Appointment, Certification, Research Productivity, Article
Publication, and Book Publication. Lecturer Work Experience is significantly
different across universities (F-value=2.430, p=0.021). Lecturers from U-7 have the
longest work experience (17 years), followed by U-3 (14 years), and U-1 (13 years).
Likewise, Lecturer Working Experience is also significantly different by
accreditation level (F-value=3.389, p=0.036). Lecturers from B-level accreditation
have the longest experience (13.4 years), followed by A level (12.3 years), and C-
level (9.3 years). Nevertheless, Lecturer Work Experience is not significantly
different by location (F-value=0.591, p=0.443). Appendix B35 provides more
detailed results.
The profiles of Lecturer Education Attainment are as follows; (1) 17 lecturers
(9%) hold S1/BA; (2) 152 lecturers (81%) graduated with S2/Master’s; and (3) 19
lecturers (10%) have completed S3/Dr degree. Lecturer Education Attainment varies
significantly across universities. Lecturers from U-7 have the highest education
185
attainment followed by U-1 and U-3. Likewise, Lecturer Education Attainment also
varies significantly by accreditation level. Lecturers from B-level accounting
programs have the highest education attainment followed by A-level and C-level.
However, Lecturer Education Attainment does not vary by location (Appendix B36).
In relation to Lecturer Current’s Appointment, 64 lecturers (34%) are
Assistants; 75 lecturers (40%) are Lecturers; 47 lecturers (25%) are Senior Lecturers;
2 lecturers (1%) are Professors. Appendix B37 shows that there is insignificant
difference of lecturer appointment by university (F-value=1.911, p=0.070) and
accreditation level (F-value=1.442, p=0.239). However, on average lecturers from
Non-Java universities have higher appointments than their counterparts from Java
universities (F-value=6.597, p=0.011).
By the end of 2010, 57 accounting lecturers from sampled universities have
been certified (30%) and the rest 131 (70%) have yet to be certified. Appendix B38
shows that lecturer certification or licensure does not vary significantly by university
(F-value=1.607, p=0.136), accreditation level (F-value= 1.216, p=0.299), and
location (F-value= 1.853, p=0.175). In other words, lecturer certification is evenly
distributed among lecturers by university, accreditation level, and location.
Lecturer Research Productivity significantly varies across universities (F-
value =2.066, p=0.049). During the last three years, lecturers from U-7 (B/JV) have
the highest research productivity (3.58 research) followed by lecturers from U-2
(B/JV) (3.56 research), and lecturers from U-6 (A/JV) (3.52 research). Nevertheless,
research productivity does not vary by accreditation level (F-value=1.089, p=0.339)
and location (F-value=0.664, p=0.416). Appendix B39 provides more detailed
results.
186
Lecturer Articles Published significantly varies across universities (F-
value=2.261, p=0.036). In the last three years, lecturers from U-4 (B/NJ) have the
highest publications (3.3 articles) followed by U-7 (2.58 articles) and U-3 (2.57
articles). Likewise, Lecturer Articles Published also varies by accreditation level (F-
value=4.420, p=0.013). In the last three years, lecturers teaching B-level programs
have the highest article publication (2.52 articles) followed by C-level (1.76 articles)
and A-level (1.47 articles). Nonetheless, Lecturer Article Published does not vary
significantly by location (F-value=0.688, p=0.408). Appendix B40 provides more
detailed results.
Lecturer Books Published varies significantly across universities (F-value=
2.198, p=0.036). In the last three years, lecturers from U-4 (B/NJ) have the highest
average publication (1 book) followed by lecturers from U-2 (0.89 book) and
lecturers from U-5 (0.76 book). Moreover, Lecturer Books Published does not vary
significantly by accreditation level (F-value=2.777, p=0.065) and location (F-
value=0.847, p=0.359). Appendix B41 provides more detailed results.
The average of lecturers’ Age was 39.69 with a standard deviation of 9.12.
The youngest lecturer was 25 years old, while the oldest lecturer was 64 years old.
Lecturer’s Age varies significantly across universities (F-value= 3.133, p=0.004).
Lecturers from U-7 have the highest average of age (45 years) followed by lecturers
from U-3 (41.5 years) and lecturers from U-1 (40.28 years). Likewise, Lecturers’
Age based on accreditation level is also significantly different (F-value= 5.649,
p=0.004). Lecturers from B-level accreditation programs have the highest average
age (41.21 years), followed by A-level (40.05 years) and C-level (35.47 years).
187
Lastly, Lecturers’ Age based on location is insignificantly different (F-value=0.404,
p=0.526). Appendix B42 provides more detailed results.
To deal with class size, the study collected data of lecturers’ perceptions on
Comfort of Class Size. The average perception of Comfort of Class Size is 11.65 out
of 15 or 78% with standard deviation 2.95. Comfort of Class Size varies significantly
among sampled universities (F-value=2.98, p=0.006). Lecturers from U-3 have the
highest perceptions on Comfort of Class Size (13.25) followed by U-4 (12.35) and
U-5 (12.24). Additionally, Java-located universities tend to have lower score on
Comfort of Class Size than Non-Java located universities (F-value=7.37, p=0.007).
Nevertheless, Comfort of Class Size does not vary significantly based on accounting
accreditation level (F-value=0.872, p=0.420). Appendix B43 provides more
information about the analysis of this variable.
The average for Learning Facilities is 22.98 out of 35 or (66%) with standard
deviation of 5.121. The highest score is 35, while the lowest score is 7. Lecturers
reported that Learning Facilities vary significantly by both university (F-
value=8.026, p=0.000) and accreditation level (F-value=17.804, p=0.000). U-6 has
the highest score of Learning Facilities (26.09) followed by U-1 (25.40) and U-7
(23.54). Means of Learning Facilities are 25.79, 22.36, and 20.18 for A, B, and C
accreditation levels respectively. A university with the higher accreditation level is
more likely to have a higher score in Learning Facilities (based on lecturers’
perceptions). However, Learning Facilities based on location is not significantly
different (F-value=2.292, p=0.132). Data distribution of Learning Facilities is
normal using Kolmogorov-Smirnov test (sig. 617). Appendix B44 provides more
detailed information.
188
Lastly, Student-Faculty Engagement has an average score of 126.3 out of 175
(72%) with a standard deviation of 14.35. Moreover, Student-Faculty Engagement
varies significantly by university (F-value=3.10, p=0.004). U-6 has the highest score
(134 or 77%), followed by U-8 (129.32 or 74%) and U-1 (127.32 or 73%). Based on
program accreditation level, Student-Faculty Engagement also varies significantly
(F-value=5.21, p=0.006). Study programs with an A level accreditation have the
highest Student-Faculty Engagement, followed by study programs with C level and
B level. Post-hoc analysis using Tukey HSD shows that Student-Faculty Engagement
from study programs with C level accreditation is insignificantly different from those
at B level. Nevertheless, Student-Faculty Engagement from programs with A level is
significantly different from those programs with B level. Lastly, Student-Faculty
Engagement based on the location of a university is insignificantly different
(Appendix B45). Data distribution of Student-Faculty Engagement is considered
normal using Kolmogorov-Smirnov test (sig. 0.664).
This section describes data using descriptive and ANOVA analyses to
provide clearer pictures of data variations based on sampled universities,
accreditation levels of accounting program as well as based on locations of
universities. Lecturers’ perceptions on ICAG-Teaching Content, Lecturer Job
Satisfaction, Student-Faculty Engagement, Comfort of Class Size, and Learning
Facilities are considered moderate. Master’s graduate and Lecturer appointment
dominate lecturers’ education attainment and appointment. The average of a lecturer
working experience is 12 years and only 30% of lecturers have been certified. Each
lecturer conducts one research project every year and publishes two articles in three
189
years. Book publications are relatively low among accounting lecturers in sampled
universities.
All data listed in Table 5.24 significantly varies among universities and
accreditation levels (except data of Research Productivity, Book Published, and
Comfort of Class Size). Lecturers’ Current Appointment and Comfort of Class Size
are significantly different by location of universities. The following section discusses
relationships between lecturers’ characteristics, ICAG-Teaching Content, and
Student-Faculty Engagement.
Interestingly, for all comparable measures, students have lower mean level of
perception than lecturers’ (Table 5.24). This could be driven by a lower level of
knowledge about such things. Students perceive Learning Facilities, Comfort of
Class Size, Student Engagement, and ICAG lower than lecturers. Presentations of
results are based on lecturers’ characteristics namely Lecturers Job Satisfaction,
Lecturer Academic Characteristics, Comfort of Class Size, and Learning Facilities.
5.7 Correlation Analyses of Lecturer Data 5.7.1 Lecturer Job Satisfaction and ICAG-Teaching Content Correlation analyses, to identify associations between Lecturer Job Satisfaction
factors and ICAG-Teaching Content i.e. Functional Competency, Personal
Competency, and Broad-business Perspective Competency provide results that
Lecturer Job Satisfaction and ICAG-Teaching Content (based on lecturers’
perceptions) are closely related. All correlation coefficients are significant at the 0.01
level. The relationship between Collegiality and ICAG-Teaching Content is
considered the lowest correlation (0.435), while the highest correlation is the
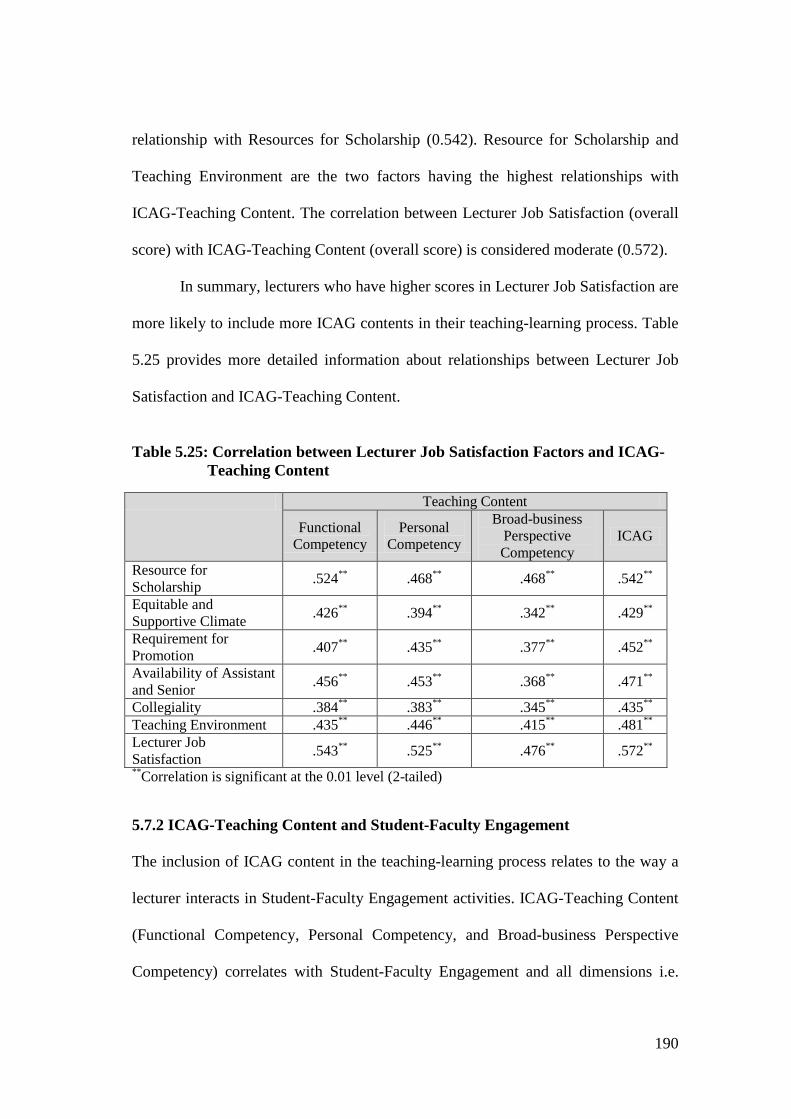
190
relationship with Resources for Scholarship (0.542). Resource for Scholarship and
Teaching Environment are the two factors having the highest relationships with
ICAG-Teaching Content. The correlation between Lecturer Job Satisfaction (overall
score) with ICAG-Teaching Content (overall score) is considered moderate (0.572).
In summary, lecturers who have higher scores in Lecturer Job Satisfaction are
more likely to include more ICAG contents in their teaching-learning process. Table
5.25 provides more detailed information about relationships between Lecturer Job
Satisfaction and ICAG-Teaching Content.
Table 5.25: Correlation between Lecturer Job Satisfaction Factors and ICAG-
Teaching Content
Teaching Content
Functional Competency
Personal Competency
Broad-business Perspective Competency
ICAG
Resource for Scholarship .524** .468** .468** .542**
Equitable and Supportive Climate .426** .394** .342** .429**
Requirement for Promotion .407** .435** .377** .452**
Availability of Assistant and Senior .456** .453** .368** .471**
Collegiality .384** .383** .345** .435** Teaching Environment .435** .446** .415** .481** Lecturer Job Satisfaction .543** .525** .476** .572** **Correlation is significant at the 0.01 level (2-tailed) 5.7.2 ICAG-Teaching Content and Student-Faculty Engagement The inclusion of ICAG content in the teaching-learning process relates to the way a
lecturer interacts in Student-Faculty Engagement activities. ICAG-Teaching Content
(Functional Competency, Personal Competency, and Broad-business Perspective
Competency) correlates with Student-Faculty Engagement and all dimensions i.e.
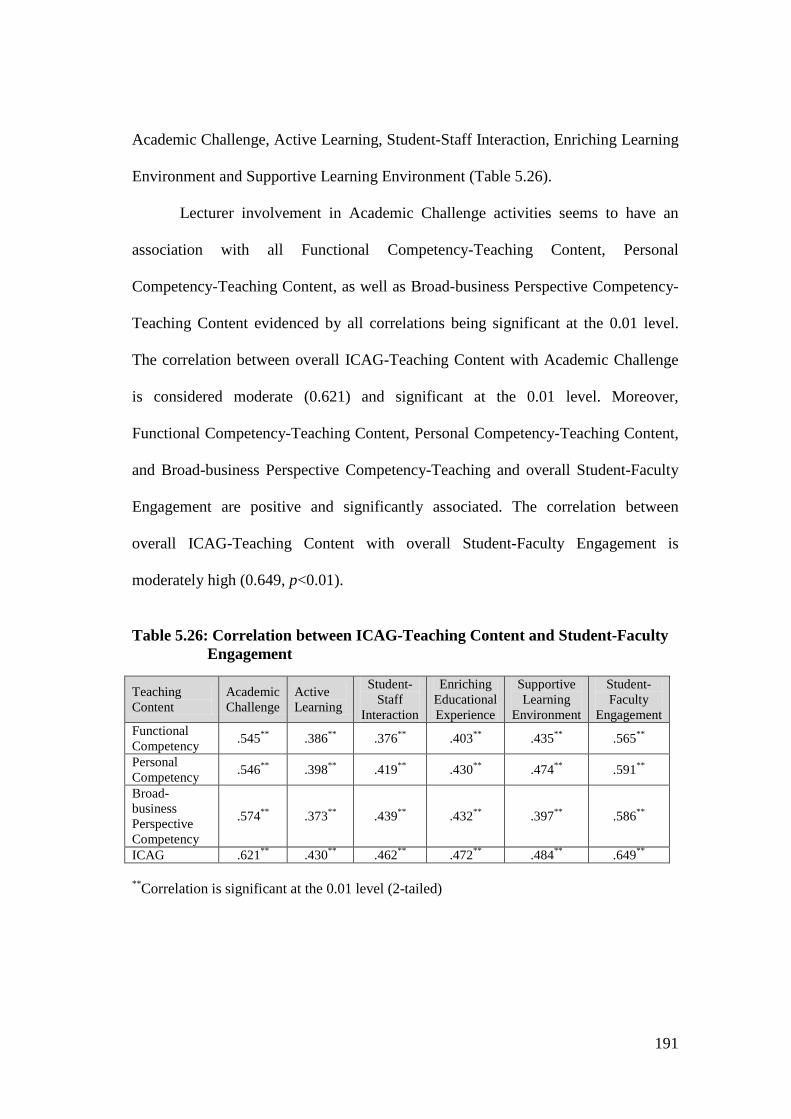
191
Academic Challenge, Active Learning, Student-Staff Interaction, Enriching Learning
Environment and Supportive Learning Environment (Table 5.26).
Lecturer involvement in Academic Challenge activities seems to have an
association with all Functional Competency-Teaching Content, Personal
Competency-Teaching Content, as well as Broad-business Perspective Competency-
Teaching Content evidenced by all correlations being significant at the 0.01 level.
The correlation between overall ICAG-Teaching Content with Academic Challenge
is considered moderate (0.621) and significant at the 0.01 level. Moreover,
Functional Competency-Teaching Content, Personal Competency-Teaching Content,
and Broad-business Perspective Competency-Teaching and overall Student-Faculty
Engagement are positive and significantly associated. The correlation between
overall ICAG-Teaching Content with overall Student-Faculty Engagement is
moderately high (0.649, p<0.01).
Table 5.26: Correlation between ICAG-Teaching Content and Student-Faculty
Engagement
Teaching Content
Academic Challenge
Active Learning
Student-Staff
Interaction
Enriching Educational Experience
Supportive Learning
Environment
Student-Faculty
Engagement Functional Competency .545** .386** .376** .403** .435** .565**
Personal Competency .546** .398** .419** .430** .474** .591**
Broad-business Perspective Competency
.574** .373** .439** .432** .397** .586**
ICAG .621** .430** .462** .472** .484** .649**
**Correlation is significant at the 0.01 level (2-tailed)
192
5.7.3 Lecturer Job Satisfaction and Student-Faculty Engagement As previously discussed, Lecturer Job Satisfaction and ICAG-Teaching Content is
closely associated. This section discusses the relationships between Lecturer Job
Satisfaction factors and Student-Faculty Engagement dimensions. Table 5.27 shows
that all Lecturer Job Satisfaction factors and Student-Faculty Engagement
dimensions are also associated. The relationship between Resources for Scholarship
and Supportive Learning Environment is the highest correlation 0.613 significant at
the 0.01 level. It appears that the more a lecturer feels satisfied with Resource for
Scholarships she or he is more likely to encourage students to participate in
Supportive Learning Environment activities.
Overall Lecturer Job Satisfaction correlates significantly with all dimensions
of Student-Faculty Engagement. The correlation between Lecturer Job Satisfaction
and Supportive Learning Environment is the strongest (0.580). In summary,
correlation between Lecturer Job Satisfaction and Student-Faculty Engagement is
positive and significant. It appears that Lecturer Job Satisfaction is an important
input, since it has a close association with both ICAG-Teaching Content (Table 5.25)
and Student-Faculty Engagement (Table 5.27). In addition, correlation coefficients in
these two tables are significant at the 0.01 level.
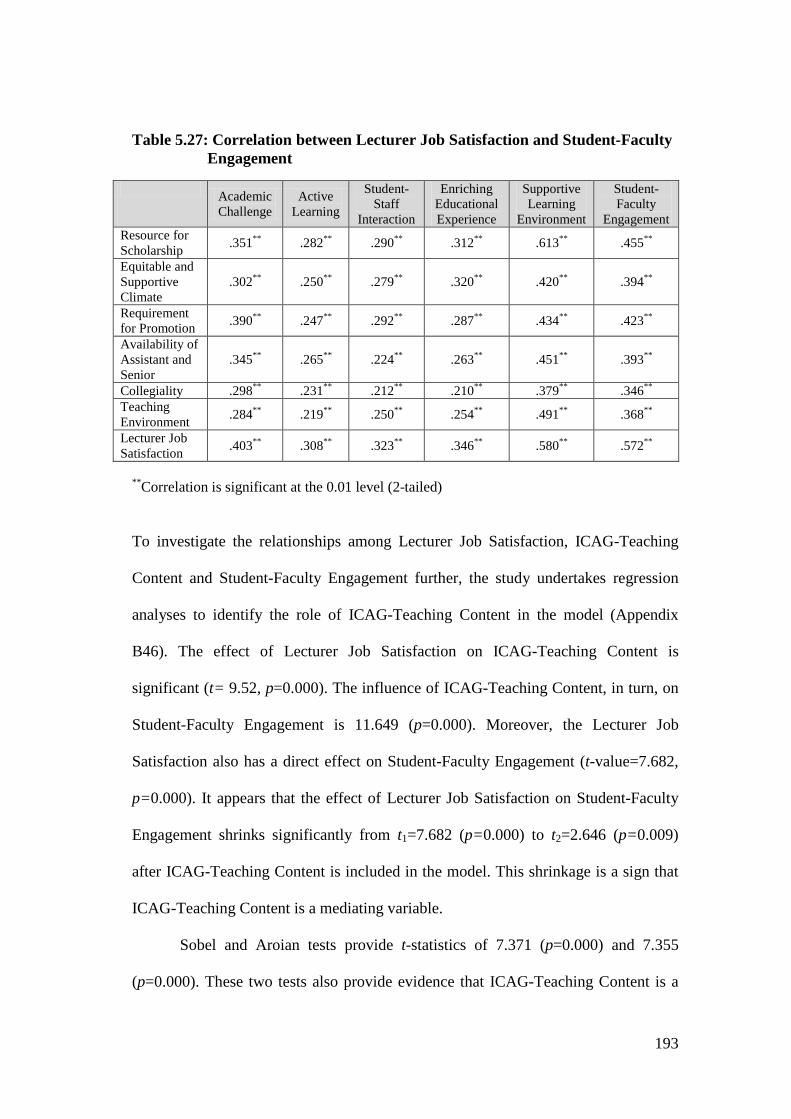
193
Table 5.27: Correlation between Lecturer Job Satisfaction and Student-Faculty Engagement
Academic Challenge
Active Learning
Student-Staff
Interaction
Enriching Educational Experience
Supportive Learning
Environment
Student-Faculty
Engagement Resource for Scholarship .351** .282** .290** .312** .613** .455**
Equitable and Supportive Climate
.302** .250** .279** .320** .420** .394**
Requirement for Promotion .390** .247** .292** .287** .434** .423**
Availability of Assistant and Senior
.345** .265** .224** .263** .451** .393**
Collegiality .298** .231** .212** .210** .379** .346** Teaching Environment .284** .219** .250** .254** .491** .368**
Lecturer Job Satisfaction .403** .308** .323** .346** .580** .572**
**Correlation is significant at the 0.01 level (2-tailed)
To investigate the relationships among Lecturer Job Satisfaction, ICAG-Teaching
Content and Student-Faculty Engagement further, the study undertakes regression
analyses to identify the role of ICAG-Teaching Content in the model (Appendix
B46). The effect of Lecturer Job Satisfaction on ICAG-Teaching Content is
significant (t= 9.52, p=0.000). The influence of ICAG-Teaching Content, in turn, on
Student-Faculty Engagement is 11.649 (p=0.000). Moreover, the Lecturer Job
Satisfaction also has a direct effect on Student-Faculty Engagement (t-value=7.682,
p=0.000). It appears that the effect of Lecturer Job Satisfaction on Student-Faculty
Engagement shrinks significantly from t1=7.682 (p=0.000) to t2=2.646 (p=0.009)
after ICAG-Teaching Content is included in the model. This shrinkage is a sign that
ICAG-Teaching Content is a mediating variable.
Sobel and Aroian tests provide t-statistics of 7.371 (p=0.000) and 7.355
(p=0.000). These two tests also provide evidence that ICAG-Teaching Content is a
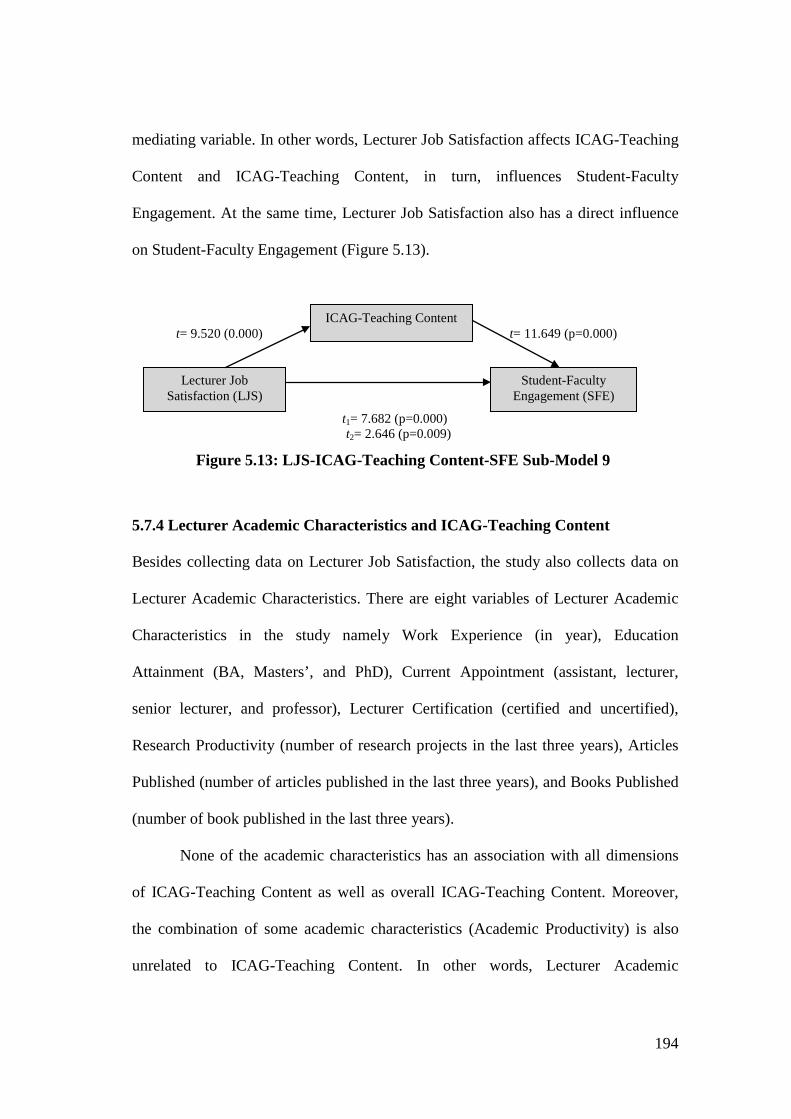
194
mediating variable. In other words, Lecturer Job Satisfaction affects ICAG-Teaching
Content and ICAG-Teaching Content, in turn, influences Student-Faculty
Engagement. At the same time, Lecturer Job Satisfaction also has a direct influence
on Student-Faculty Engagement (Figure 5.13).
5.7.4 Lecturer Academic Characteristics and ICAG-Teaching Content Besides collecting data on Lecturer Job Satisfaction, the study also collects data on
Lecturer Academic Characteristics. There are eight variables of Lecturer Academic
Characteristics in the study namely Work Experience (in year), Education
Attainment (BA, Masters’, and PhD), Current Appointment (assistant, lecturer,
senior lecturer, and professor), Lecturer Certification (certified and uncertified),
Research Productivity (number of research projects in the last three years), Articles
Published (number of articles published in the last three years), and Books Published
(number of book published in the last three years).
None of the academic characteristics has an association with all dimensions
of ICAG-Teaching Content as well as overall ICAG-Teaching Content. Moreover,
the combination of some academic characteristics (Academic Productivity) is also
unrelated to ICAG-Teaching Content. In other words, Lecturer Academic
Figure 5.13: LJS-ICAG-Teaching Content-SFE Sub-Model 9
t1= 7.682 (p=0.000) t2= 2.646 (p=0.009)
t= 9.520 (0.000) t= 11.649 (p=0.000)
Lecturer Job Satisfaction (LJS)
ICAG-Teaching Content
Student-Faculty Engagement (SFE)
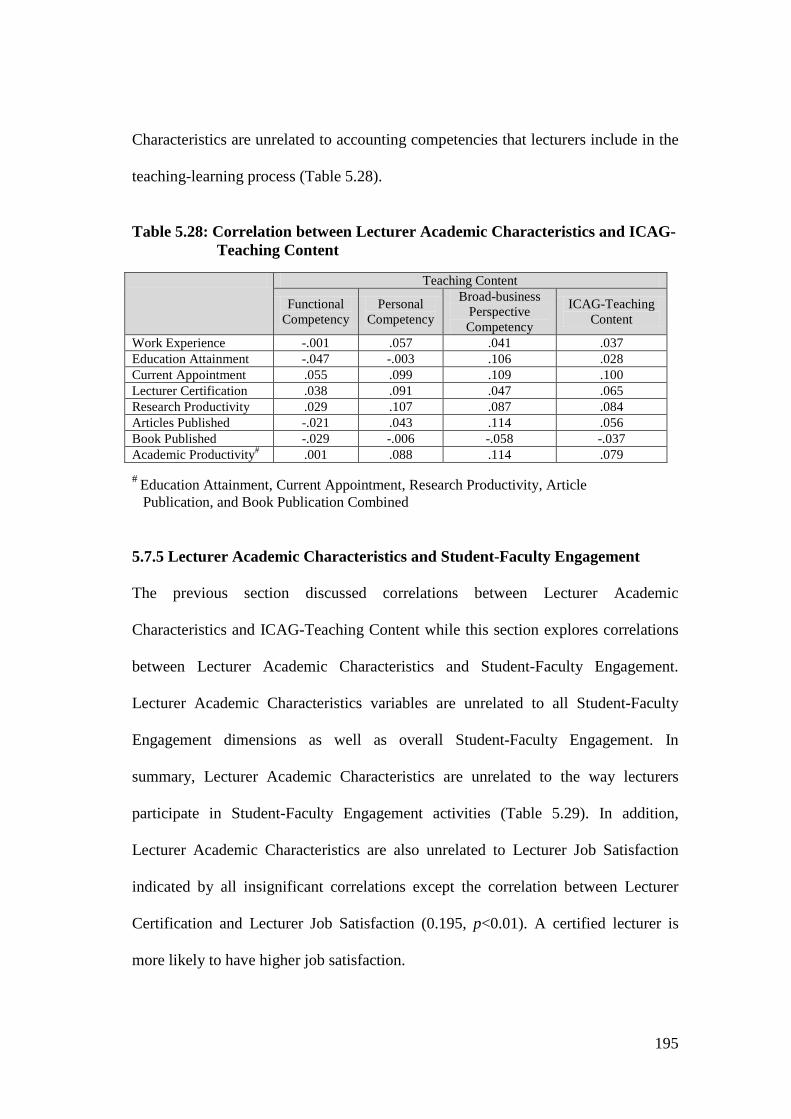
195
Characteristics are unrelated to accounting competencies that lecturers include in the
teaching-learning process (Table 5.28).
Table 5.28: Correlation between Lecturer Academic Characteristics and ICAG-
Teaching Content
Teaching Content
Functional Competency
Personal Competency
Broad-business Perspective Competency
ICAG-Teaching Content
Work Experience -.001 .057 .041 .037 Education Attainment -.047 -.003 .106 .028 Current Appointment .055 .099 .109 .100 Lecturer Certification .038 .091 .047 .065 Research Productivity .029 .107 .087 .084 Articles Published -.021 .043 .114 .056 Book Published -.029 -.006 -.058 -.037 Academic Productivity# .001 .088 .114 .079
# Education Attainment, Current Appointment, Research Productivity, Article Publication, and Book Publication Combined 5.7.5 Lecturer Academic Characteristics and Student-Faculty Engagement The previous section discussed correlations between Lecturer Academic
Characteristics and ICAG-Teaching Content while this section explores correlations
between Lecturer Academic Characteristics and Student-Faculty Engagement.
Lecturer Academic Characteristics variables are unrelated to all Student-Faculty
Engagement dimensions as well as overall Student-Faculty Engagement. In
summary, Lecturer Academic Characteristics are unrelated to the way lecturers
participate in Student-Faculty Engagement activities (Table 5.29). In addition,
Lecturer Academic Characteristics are also unrelated to Lecturer Job Satisfaction
indicated by all insignificant correlations except the correlation between Lecturer
Certification and Lecturer Job Satisfaction (0.195, p<0.01). A certified lecturer is
more likely to have higher job satisfaction.
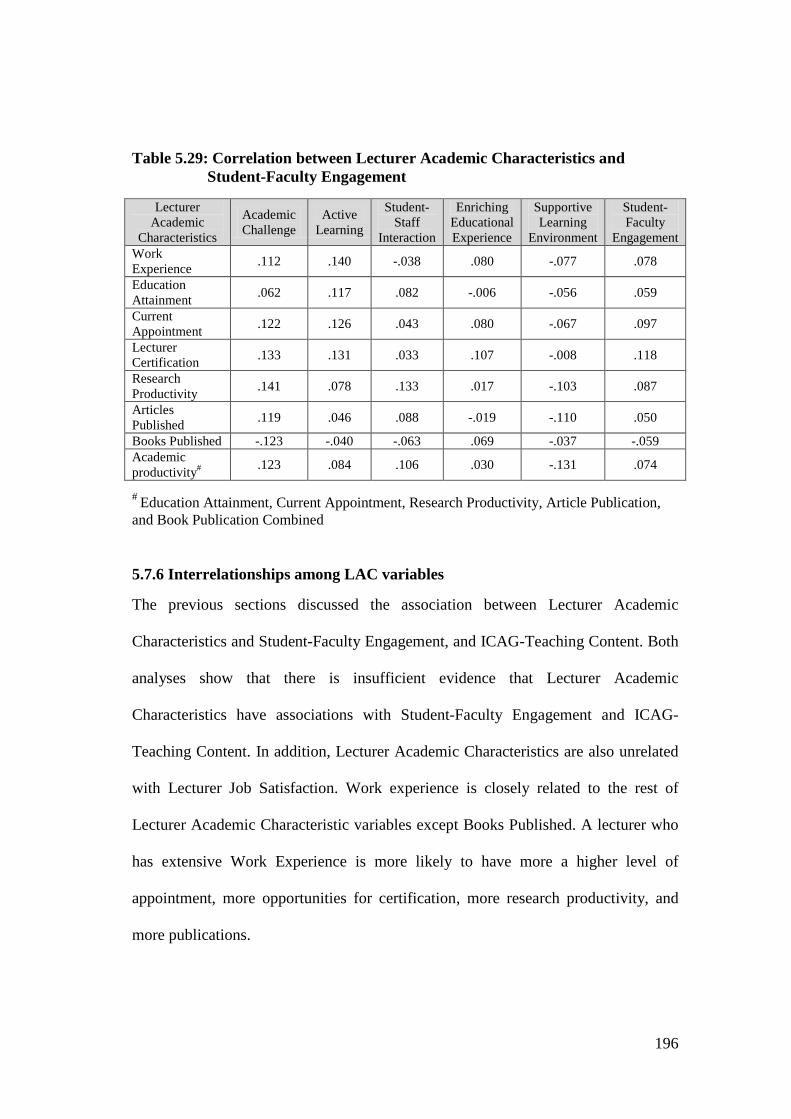
196
Table 5.29: Correlation between Lecturer Academic Characteristics and
Student-Faculty Engagement
Lecturer Academic
Characteristics
Academic Challenge
Active Learning
Student-Staff
Interaction
Enriching Educational Experience
Supportive Learning
Environment
Student-Faculty
Engagement Work Experience .112 .140 -.038 .080 -.077 .078
Education Attainment .062 .117 .082 -.006 -.056 .059
Current Appointment .122 .126 .043 .080 -.067 .097
Lecturer Certification .133 .131 .033 .107 -.008 .118
Research Productivity .141 .078 .133 .017 -.103 .087
Articles Published .119 .046 .088 -.019 -.110 .050
Books Published -.123 -.040 -.063 .069 -.037 -.059 Academic productivity# .123 .084 .106 .030 -.131 .074
# Education Attainment, Current Appointment, Research Productivity, Article Publication, and Book Publication Combined 5.7.6 Interrelationships among LAC variables The previous sections discussed the association between Lecturer Academic
Characteristics and Student-Faculty Engagement, and ICAG-Teaching Content. Both
analyses show that there is insufficient evidence that Lecturer Academic
Characteristics have associations with Student-Faculty Engagement and ICAG-
Teaching Content. In addition, Lecturer Academic Characteristics are also unrelated
with Lecturer Job Satisfaction. Work experience is closely related to the rest of
Lecturer Academic Characteristic variables except Books Published. A lecturer who
has extensive Work Experience is more likely to have more a higher level of
appointment, more opportunities for certification, more research productivity, and
more publications.
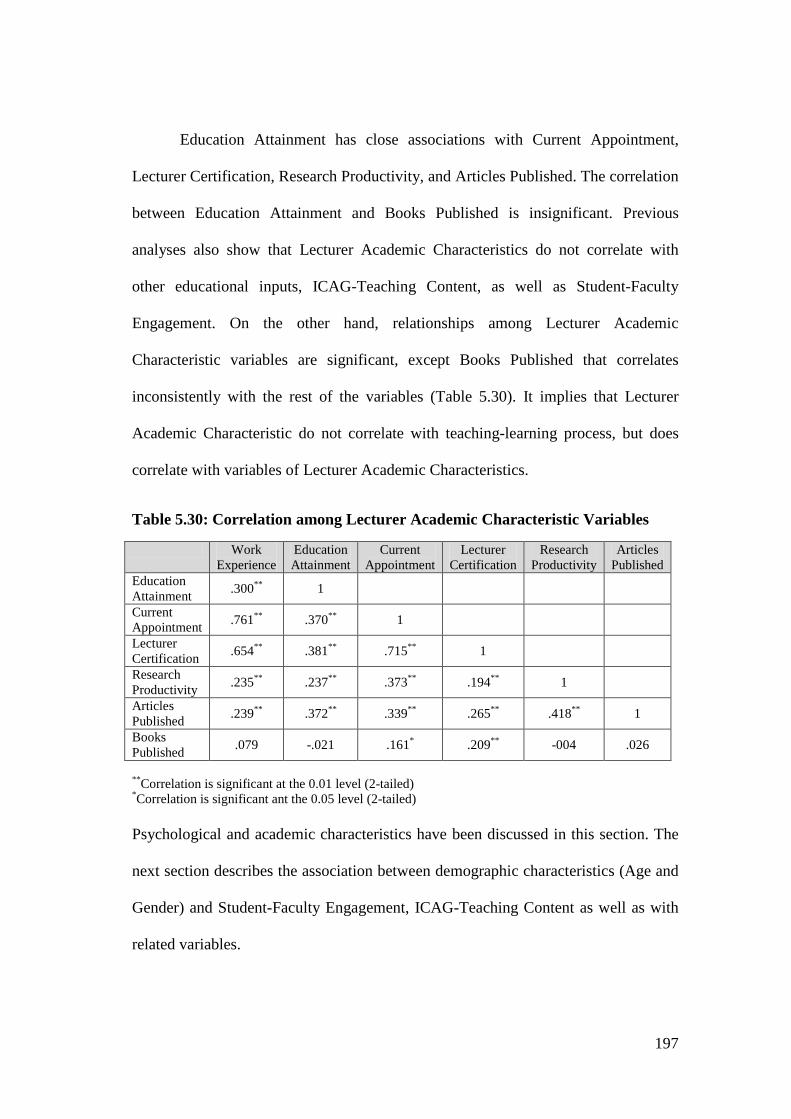
197
Education Attainment has close associations with Current Appointment,
Lecturer Certification, Research Productivity, and Articles Published. The correlation
between Education Attainment and Books Published is insignificant. Previous
analyses also show that Lecturer Academic Characteristics do not correlate with
other educational inputs, ICAG-Teaching Content, as well as Student-Faculty
Engagement. On the other hand, relationships among Lecturer Academic
Characteristic variables are significant, except Books Published that correlates
inconsistently with the rest of the variables (Table 5.30). It implies that Lecturer
Academic Characteristic do not correlate with teaching-learning process, but does
correlate with variables of Lecturer Academic Characteristics.
Table 5.30: Correlation among Lecturer Academic Characteristic Variables
Work Experience
Education Attainment
Current Appointment
Lecturer Certification
Research Productivity
Articles Published
Education Attainment .300** 1
Current Appointment .761** .370** 1
Lecturer Certification .654** .381** .715** 1
Research Productivity .235** .237** .373** .194** 1
Articles Published .239** .372** .339** .265** .418** 1
Books Published .079 -.021 .161* .209** -004 .026
**Correlation is significant at the 0.01 level (2-tailed) *Correlation is significant ant the 0.05 level (2-tailed) Psychological and academic characteristics have been discussed in this section. The
next section describes the association between demographic characteristics (Age and
Gender) and Student-Faculty Engagement, ICAG-Teaching Content as well as with
related variables.
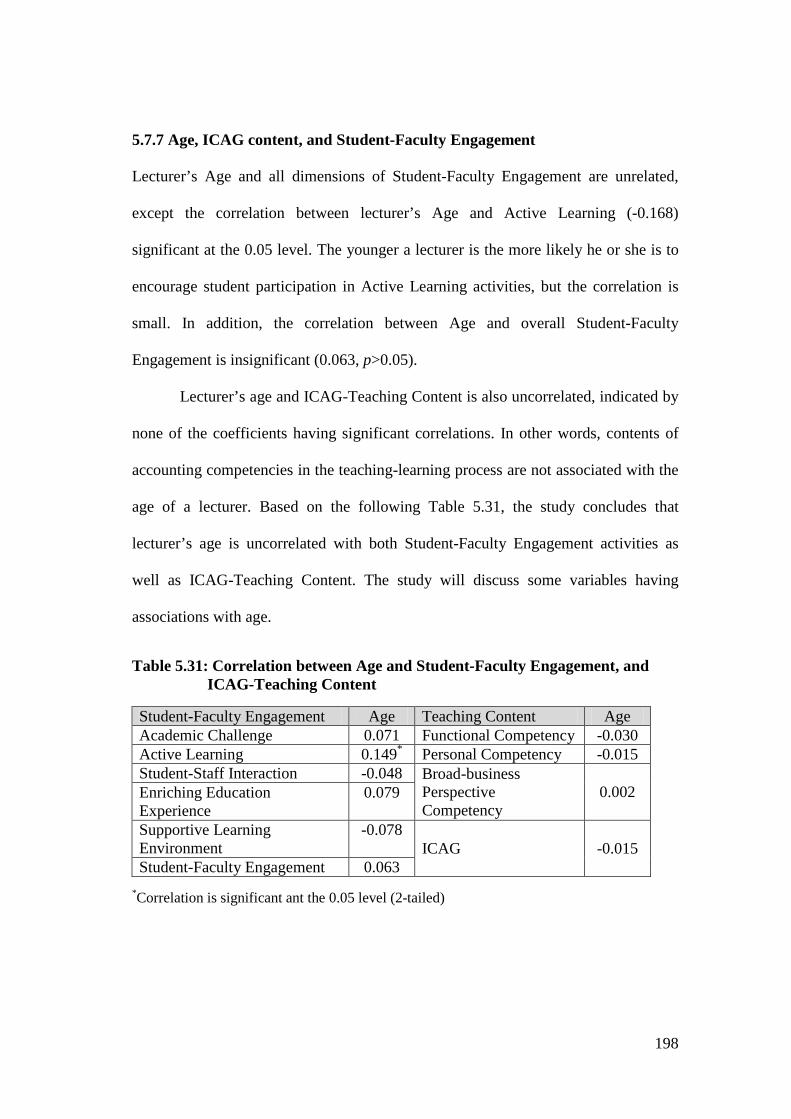
198
5.7.7 Age, ICAG content, and Student-Faculty Engagement Lecturer’s Age and all dimensions of Student-Faculty Engagement are unrelated,
except the correlation between lecturer’s Age and Active Learning (-0.168)
significant at the 0.05 level. The younger a lecturer is the more likely he or she is to
encourage student participation in Active Learning activities, but the correlation is
small. In addition, the correlation between Age and overall Student-Faculty
Engagement is insignificant (0.063, p>0.05).
Lecturer’s age and ICAG-Teaching Content is also uncorrelated, indicated by
none of the coefficients having significant correlations. In other words, contents of
accounting competencies in the teaching-learning process are not associated with the
age of a lecturer. Based on the following Table 5.31, the study concludes that
lecturer’s age is uncorrelated with both Student-Faculty Engagement activities as
well as ICAG-Teaching Content. The study will discuss some variables having
associations with age.
Table 5.31: Correlation between Age and Student-Faculty Engagement, and
ICAG-Teaching Content
Student-Faculty Engagement Age Teaching Content Age Academic Challenge 0.071 Functional Competency -0.030 Active Learning 0.149* Personal Competency -0.015 Student-Staff Interaction -0.048 Broad-business
Perspective Competency
0.002 Enriching Education Experience
0.079
Supportive Learning Environment
-0.078 ICAG -0.015
Student-Faculty Engagement 0.063
*Correlation is significant ant the 0.05 level (2-tailed)
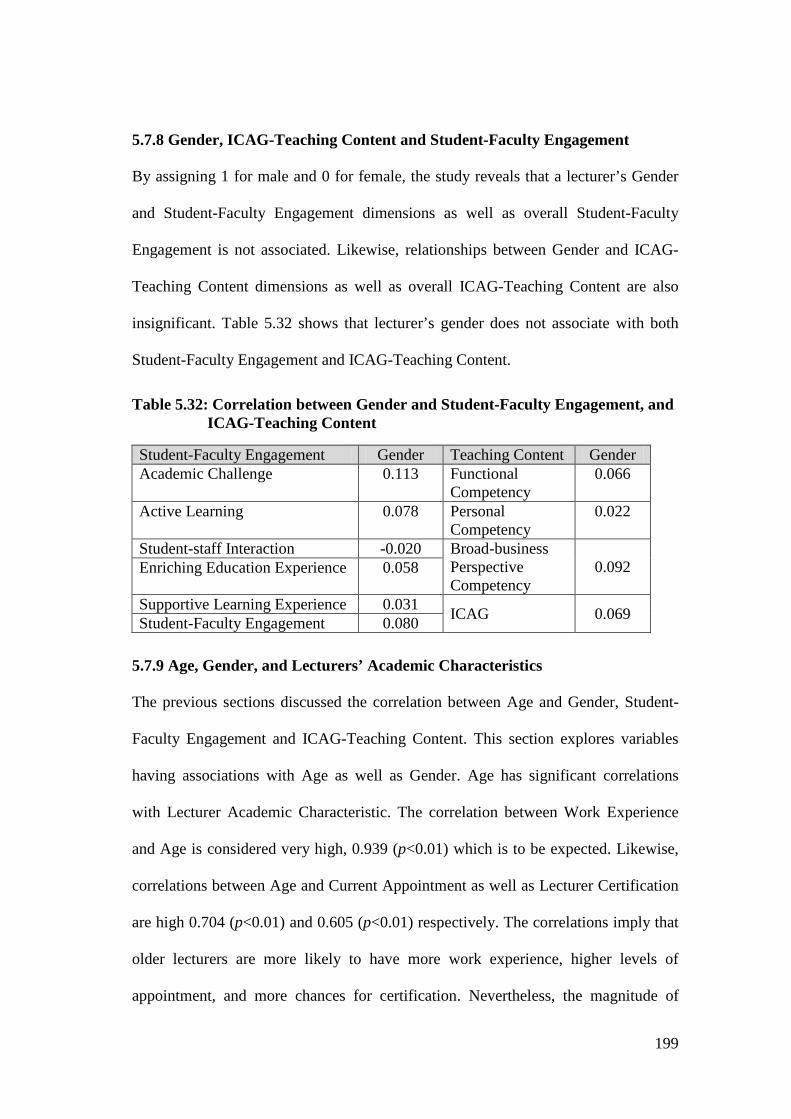
199
5.7.8 Gender, ICAG-Teaching Content and Student-Faculty Engagement By assigning 1 for male and 0 for female, the study reveals that a lecturer’s Gender
and Student-Faculty Engagement dimensions as well as overall Student-Faculty
Engagement is not associated. Likewise, relationships between Gender and ICAG-
Teaching Content dimensions as well as overall ICAG-Teaching Content are also
insignificant. Table 5.32 shows that lecturer’s gender does not associate with both
Student-Faculty Engagement and ICAG-Teaching Content.
Table 5.32: Correlation between Gender and Student-Faculty Engagement, and ICAG-Teaching Content
Student-Faculty Engagement Gender Teaching Content Gender Academic Challenge 0.113 Functional
Competency 0.066
Active Learning 0.078 Personal Competency
0.022
Student-staff Interaction -0.020 Broad-business Perspective Competency
0.092 Enriching Education Experience 0.058
Supportive Learning Experience 0.031 ICAG 0.069 Student-Faculty Engagement 0.080
5.7.9 Age, Gender, and Lecturers’ Academic Characteristics The previous sections discussed the correlation between Age and Gender, Student-
Faculty Engagement and ICAG-Teaching Content. This section explores variables
having associations with Age as well as Gender. Age has significant correlations
with Lecturer Academic Characteristic. The correlation between Work Experience
and Age is considered very high, 0.939 (p<0.01) which is to be expected. Likewise,
correlations between Age and Current Appointment as well as Lecturer Certification
are high 0.704 (p<0.01) and 0.605 (p<0.01) respectively. The correlations imply that
older lecturers are more likely to have more work experience, higher levels of
appointment, and more chances for certification. Nevertheless, the magnitude of
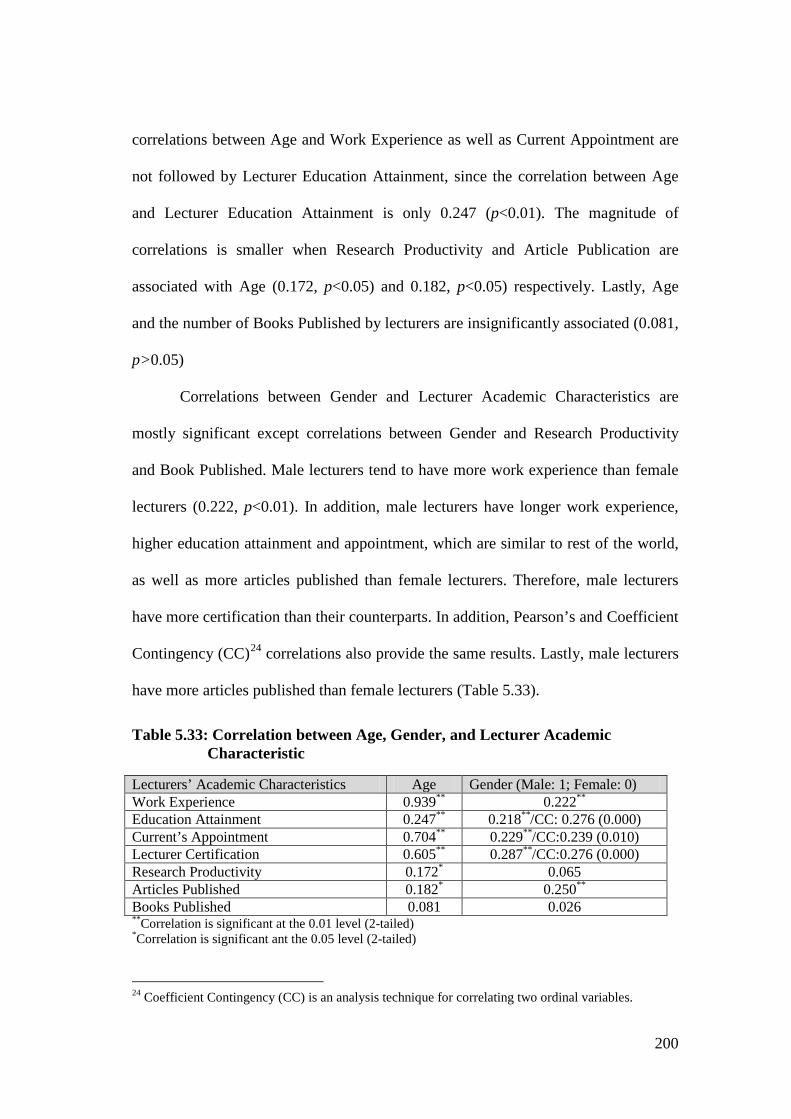
200
correlations between Age and Work Experience as well as Current Appointment are
not followed by Lecturer Education Attainment, since the correlation between Age
and Lecturer Education Attainment is only 0.247 (p<0.01). The magnitude of
correlations is smaller when Research Productivity and Article Publication are
associated with Age (0.172, p<0.05) and 0.182, p<0.05) respectively. Lastly, Age
and the number of Books Published by lecturers are insignificantly associated (0.081,
p>0.05)
Correlations between Gender and Lecturer Academic Characteristics are
mostly significant except correlations between Gender and Research Productivity
and Book Published. Male lecturers tend to have more work experience than female
lecturers (0.222, p<0.01). In addition, male lecturers have longer work experience,
higher education attainment and appointment, which are similar to rest of the world,
as well as more articles published than female lecturers. Therefore, male lecturers
have more certification than their counterparts. In addition, Pearson’s and Coefficient
Contingency (CC)24 correlations also provide the same results. Lastly, male lecturers
have more articles published than female lecturers (Table 5.33).
Table 5.33: Correlation between Age, Gender, and Lecturer Academic Characteristic
Lecturers’ Academic Characteristics Age Gender (Male: 1; Female: 0) Work Experience 0.939** 0.222** Education Attainment 0.247** 0.218**/CC: 0.276 (0.000) Current’s Appointment 0.704** 0.229**/CC:0.239 (0.010) Lecturer Certification 0.605** 0.287**/CC:0.276 (0.000) Research Productivity 0.172* 0.065 Articles Published 0.182* 0.250** Books Published 0.081 0.026 **Correlation is significant at the 0.01 level (2-tailed) *Correlation is significant ant the 0.05 level (2-tailed) 24 Coefficient Contingency (CC) is an analysis technique for correlating two ordinal variables.
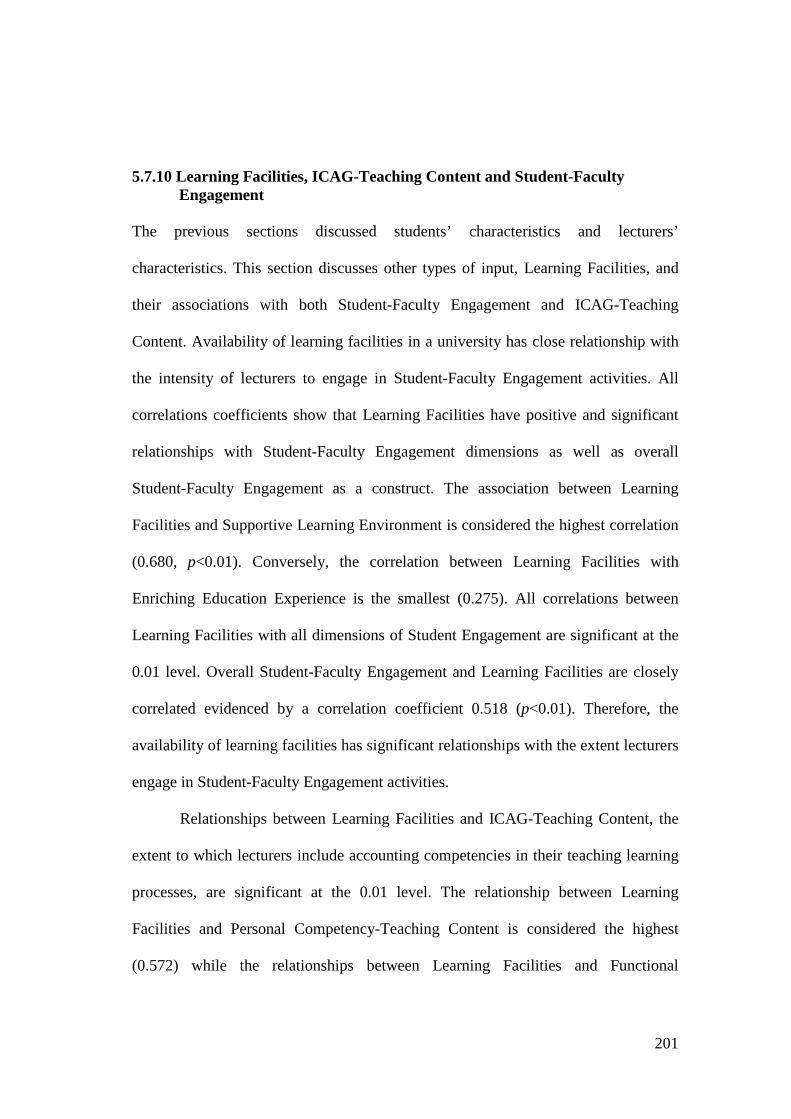
201
5.7.10 Learning Facilities, ICAG-Teaching Content and Student-Faculty
Engagement The previous sections discussed students’ characteristics and lecturers’
characteristics. This section discusses other types of input, Learning Facilities, and
their associations with both Student-Faculty Engagement and ICAG-Teaching
Content. Availability of learning facilities in a university has close relationship with
the intensity of lecturers to engage in Student-Faculty Engagement activities. All
correlations coefficients show that Learning Facilities have positive and significant
relationships with Student-Faculty Engagement dimensions as well as overall
Student-Faculty Engagement as a construct. The association between Learning
Facilities and Supportive Learning Environment is considered the highest correlation
(0.680, p<0.01). Conversely, the correlation between Learning Facilities with
Enriching Education Experience is the smallest (0.275). All correlations between
Learning Facilities with all dimensions of Student Engagement are significant at the
0.01 level. Overall Student-Faculty Engagement and Learning Facilities are closely
correlated evidenced by a correlation coefficient 0.518 (p<0.01). Therefore, the
availability of learning facilities has significant relationships with the extent lecturers
engage in Student-Faculty Engagement activities.
Relationships between Learning Facilities and ICAG-Teaching Content, the
extent to which lecturers include accounting competencies in their teaching learning
processes, are significant at the 0.01 level. The relationship between Learning
Facilities and Personal Competency-Teaching Content is considered the highest
(0.572) while the relationships between Learning Facilities and Functional
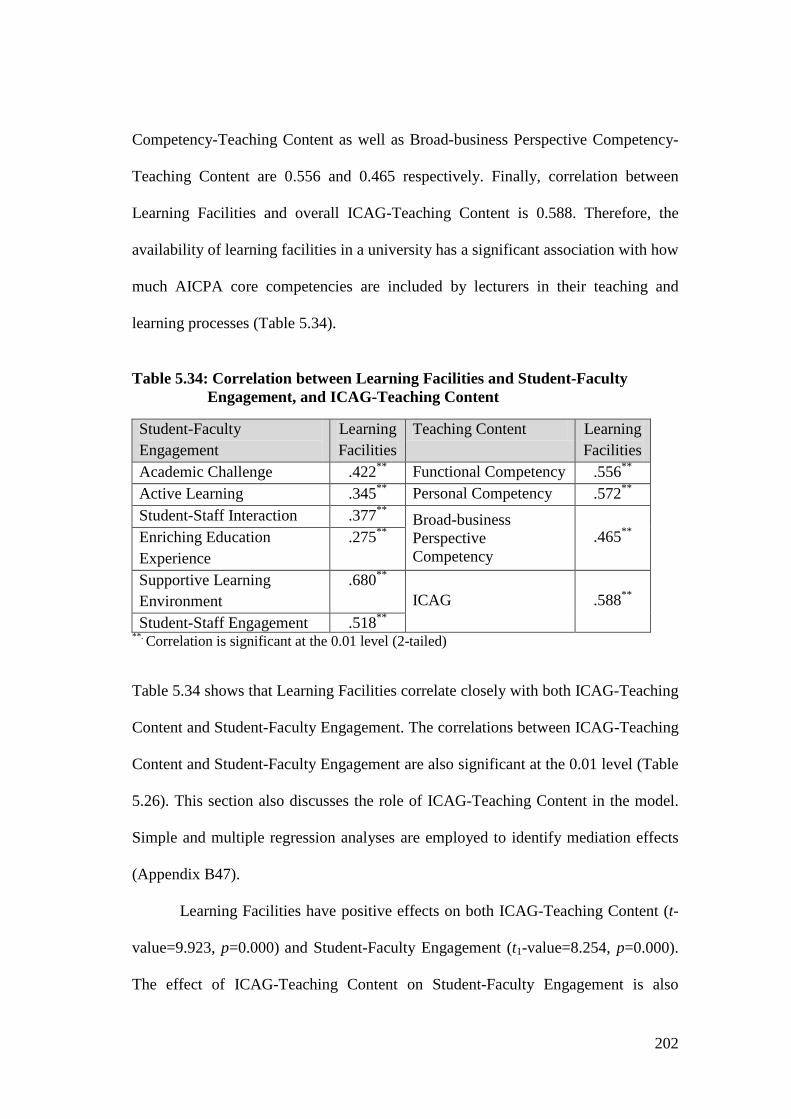
202
Competency-Teaching Content as well as Broad-business Perspective Competency-
Teaching Content are 0.556 and 0.465 respectively. Finally, correlation between
Learning Facilities and overall ICAG-Teaching Content is 0.588. Therefore, the
availability of learning facilities in a university has a significant association with how
much AICPA core competencies are included by lecturers in their teaching and
learning processes (Table 5.34).
Table 5.34: Correlation between Learning Facilities and Student-Faculty
Engagement, and ICAG-Teaching Content
Student-Faculty Engagement
Learning Facilities
Teaching Content Learning Facilities
Academic Challenge .422** Functional Competency .556** Active Learning .345** Personal Competency .572** Student-Staff Interaction .377** Broad-business
Perspective Competency
.465** Enriching Education Experience
.275**
Supportive Learning Environment
.680** ICAG .588**
Student-Staff Engagement .518** **. Correlation is significant at the 0.01 level (2-tailed) Table 5.34 shows that Learning Facilities correlate closely with both ICAG-Teaching
Content and Student-Faculty Engagement. The correlations between ICAG-Teaching
Content and Student-Faculty Engagement are also significant at the 0.01 level (Table
5.26). This section also discusses the role of ICAG-Teaching Content in the model.
Simple and multiple regression analyses are employed to identify mediation effects
(Appendix B47).
Learning Facilities have positive effects on both ICAG-Teaching Content (t-
value=9.923, p=0.000) and Student-Faculty Engagement (t1-value=8.254, p=0.000).
The effect of ICAG-Teaching Content on Student-Faculty Engagement is also
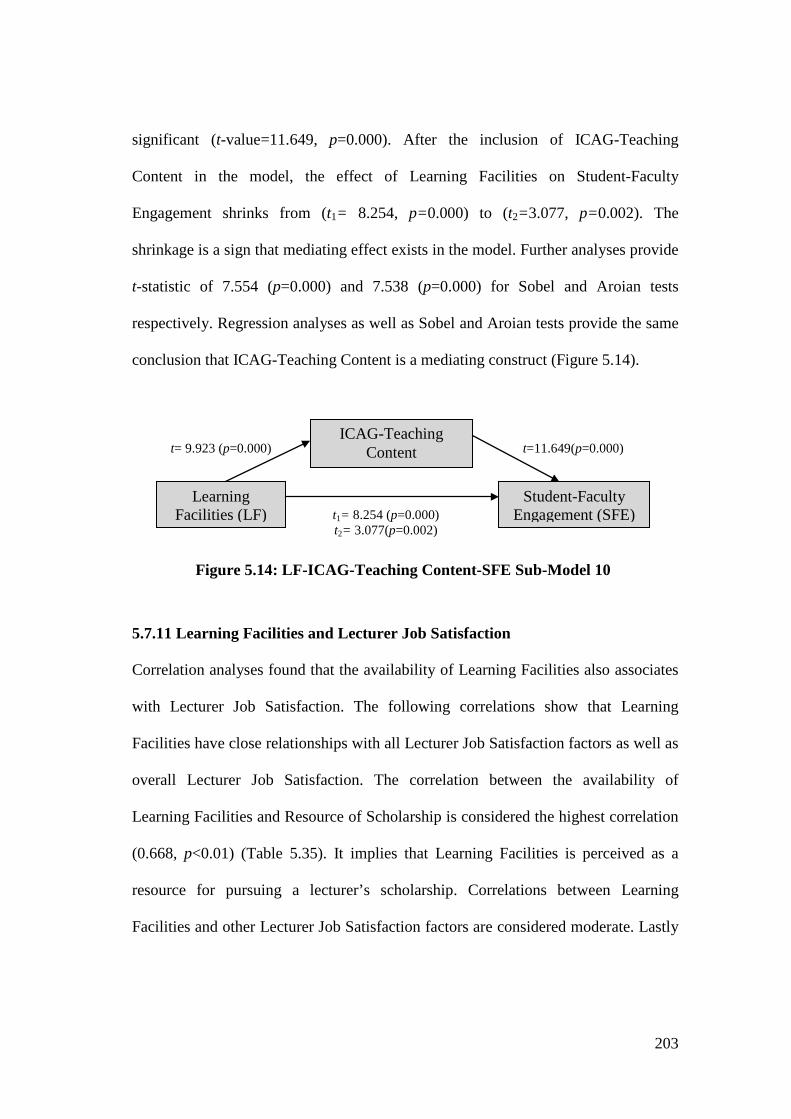
203
significant (t-value=11.649, p=0.000). After the inclusion of ICAG-Teaching
Content in the model, the effect of Learning Facilities on Student-Faculty
Engagement shrinks from (t1= 8.254, p=0.000) to (t2=3.077, p=0.002). The
shrinkage is a sign that mediating effect exists in the model. Further analyses provide
t-statistic of 7.554 (p=0.000) and 7.538 (p=0.000) for Sobel and Aroian tests
respectively. Regression analyses as well as Sobel and Aroian tests provide the same
conclusion that ICAG-Teaching Content is a mediating construct (Figure 5.14).
5.7.11 Learning Facilities and Lecturer Job Satisfaction Correlation analyses found that the availability of Learning Facilities also associates
with Lecturer Job Satisfaction. The following correlations show that Learning
Facilities have close relationships with all Lecturer Job Satisfaction factors as well as
overall Lecturer Job Satisfaction. The correlation between the availability of
Learning Facilities and Resource of Scholarship is considered the highest correlation
(0.668, p<0.01) (Table 5.35). It implies that Learning Facilities is perceived as a
resource for pursuing a lecturer’s scholarship. Correlations between Learning
Facilities and other Lecturer Job Satisfaction factors are considered moderate. Lastly
Figure 5.14: LF-ICAG-Teaching Content-SFE Sub-Model 10
t=11.649(p=0.000)
t1= 8.254 (p=0.000) t2= 3.077(p=0.002)
t= 9.923 (p=0.000)
Learning Facilities (LF)
ICAG-Teaching Content
Student-Faculty Engagement (SFE)
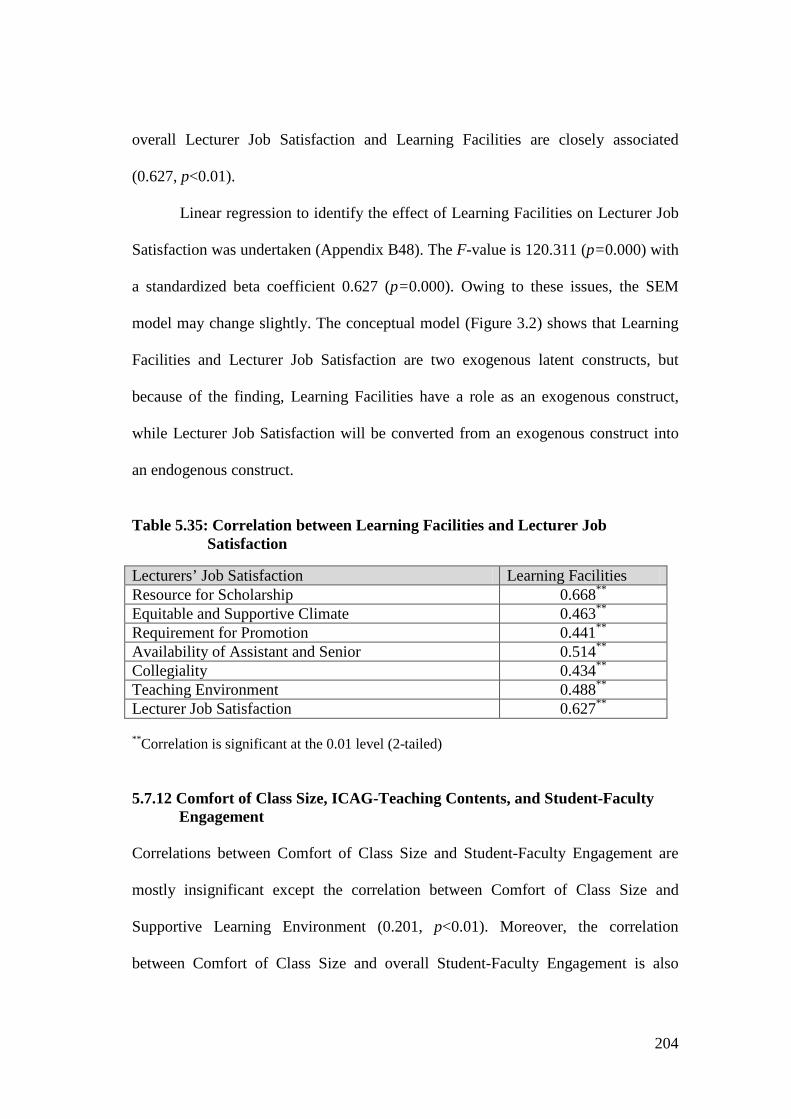
204
overall Lecturer Job Satisfaction and Learning Facilities are closely associated
(0.627, p<0.01).
Linear regression to identify the effect of Learning Facilities on Lecturer Job
Satisfaction was undertaken (Appendix B48). The F-value is 120.311 (p=0.000) with
a standardized beta coefficient 0.627 (p=0.000). Owing to these issues, the SEM
model may change slightly. The conceptual model (Figure 3.2) shows that Learning
Facilities and Lecturer Job Satisfaction are two exogenous latent constructs, but
because of the finding, Learning Facilities have a role as an exogenous construct,
while Lecturer Job Satisfaction will be converted from an exogenous construct into
an endogenous construct.
Table 5.35: Correlation between Learning Facilities and Lecturer Job
Satisfaction
Lecturers’ Job Satisfaction Learning Facilities Resource for Scholarship 0.668** Equitable and Supportive Climate 0.463** Requirement for Promotion 0.441** Availability of Assistant and Senior 0.514** Collegiality 0.434** Teaching Environment 0.488** Lecturer Job Satisfaction 0.627**
**Correlation is significant at the 0.01 level (2-tailed) 5.7.12 Comfort of Class Size, ICAG-Teaching Contents, and Student-Faculty
Engagement Correlations between Comfort of Class Size and Student-Faculty Engagement are
mostly insignificant except the correlation between Comfort of Class Size and
Supportive Learning Environment (0.201, p<0.01). Moreover, the correlation
between Comfort of Class Size and overall Student-Faculty Engagement is also
205
insignificant. Therefore, based on the analysis, Comfort of Class Size does not relate
to the extent lecturers are involved in Student-Faculty Engagement activities (Table
5.36).
Table 5.36: Correlation between Comfort of Class Size and Student-Faculty
Engagement and ICAG-Teaching Content
Student-Faculty Engagement Comfort of Class Size
Teaching Content Comfort of Class Size
Academic Challenge .099 Functional Competency
.081
Active Learning .022 Personal Competency .090 Student-Staff Interaction .014 Broad-business
Perspective Competency
-.007 Enriching Education Experience .036
Supportive Learning Environment .201** ICAG .057 Student-Staff Engagement .091
**Correlation is significant at the 0.01 level (2-tailed)
Likewise, all correlations between Comfort of Class Size and ICAG-Teaching
Content are also insignificant. Correlation coefficients imply that Comfort of Class
Size does not associate with how much competency lecturers include in their
teaching-learning processes (Table 5.36).
5.8 Structural Equation Modelling (SEM) Analyses of Lecturer Data
5.8.1. Lecturer Model Using SEM with Single Composite Indicator Based on the previous sections, there are two lecturers’ characteristics i.e. Lecturer
Job Satisfaction and Learning Facilities, which have significant effects on both
ICAG-Teaching Content and Student-Faculty Engagement. None of the academic
characteristics as well as demographic characteristics has significant effect on ICAG-
Teaching Content and Student-Faculty Engagement. Therefore, the model only
206
includes Lecturer Job Satisfaction and Learning Facilities as education inputs based
on lecturers’ perceptions. Moreover, the study develops the model using two
techniques, Structural Equation Modelling (SEM) using single composite indicator
and Path Analysis.
Since the study employs SEM with single composite indicator, Loading
Factor Composite and Error Variance Composite have to be calculated and assigned
to Variance Error Parameter and Regression Weight Parameter in each respective
latent variable. Appendix B49, B50, B51, B52, and B53 provide more detailed
information about the process of calculating Loading Factor Composite and Error
Variance Composite. In addition, the study only includes indicators that have at least
0.4 factor loading.
Previously-proposed models treats Learning Facilities and Lecturer Job
Satisfaction (Figure 3.2) as exogenous construct that affect both ICAG-Teaching
Content and Student-Faculty Engagement. This model tends to have very high
covariance between Learning Facilities and Lecturer Job Satisfaction that
significantly affects the influence of these constructs on both ICAG-Teaching
Content and Student-Faculty Engagement. The analysis provides results that
Learning Facilities have a significant effect on Lecturer Job Satisfaction. Based on
the literature review (Chapter 2), Learning Facilities are considered important
predictors that affects Lecturer Job Satisfaction, since two of dimensions of Lecturer
Job Satisfaction are Equitable and Supporting Climate and Teaching Environment
(Conklin & Desselle 2007). In addition, the correlation between Learning Facilities
and Lecturer Job Satisfaction is more than 0.4. This correlation may cause
multicolliniearity (Grewal, Cote & Baumgartner 2004). More specifically,
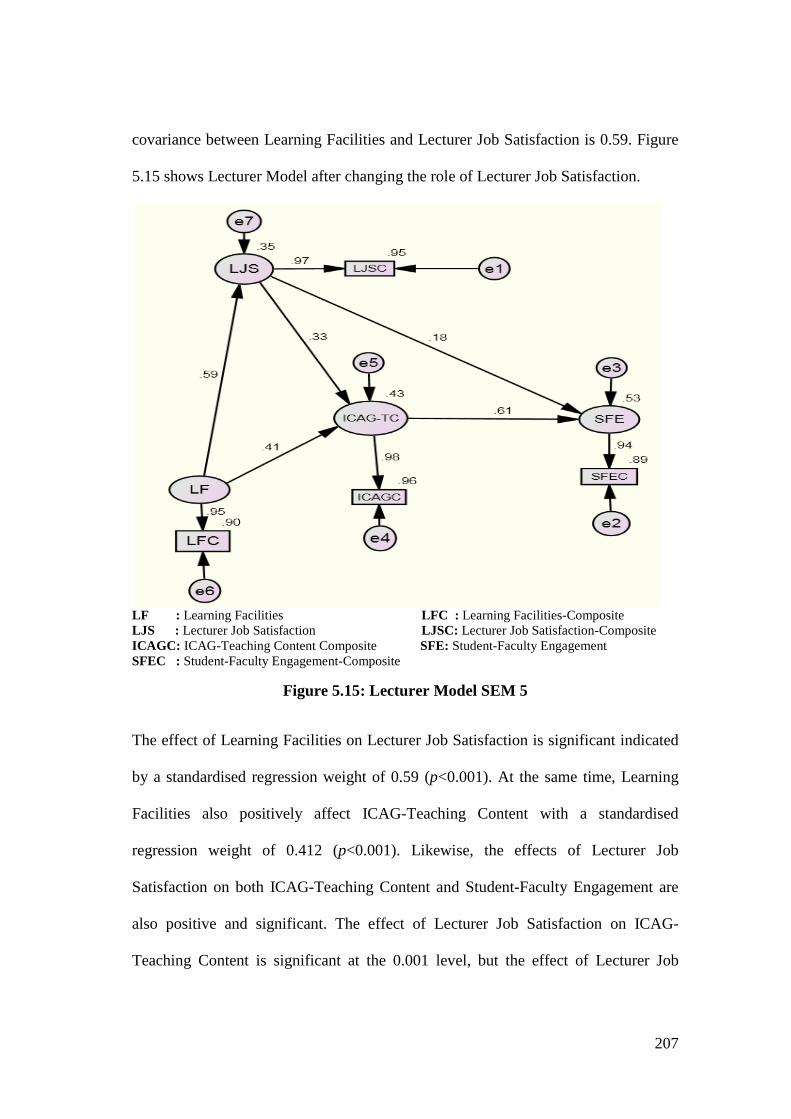
207
covariance between Learning Facilities and Lecturer Job Satisfaction is 0.59. Figure
5.15 shows Lecturer Model after changing the role of Lecturer Job Satisfaction.
LF : Learning Facilities LFC : Learning Facilities-Composite LJS : Lecturer Job Satisfaction LJSC: Lecturer Job Satisfaction-Composite ICAGC: ICAG-Teaching Content Composite SFE: Student-Faculty Engagement SFEC : Student-Faculty Engagement-Composite
Figure 5.15: Lecturer Model SEM 5
The effect of Learning Facilities on Lecturer Job Satisfaction is significant indicated
by a standardised regression weight of 0.59 (p<0.001). At the same time, Learning
Facilities also positively affect ICAG-Teaching Content with a standardised
regression weight of 0.412 (p<0.001). Likewise, the effects of Lecturer Job
Satisfaction on both ICAG-Teaching Content and Student-Faculty Engagement are
also positive and significant. The effect of Lecturer Job Satisfaction on ICAG-
Teaching Content is significant at the 0.001 level, but the effect of Lecturer Job
208
Satisfaction on Student-Faculty Engagement is only significant at the 0.014 level.
Lastly, the influence of ICAG-Teaching Content on Student-Faculty Engagement is
also significant at the 0.001 level (Figure 5.15).
Table 5.37: Regression Weight and Estimate for Model Using Single Composite
Indicator
Regression Weight Standardised Regression Weight Estimate S.E. C.R. P
LJS LF .539 .061 8.851 *** 0.590 ICAG-TC LF .392 .075 5.214 *** 0.412 ICAG-TC LJS .338 .080 4.222 *** 0.325 SFE ICAG-TC .604 .073 8.309 *** 0.607 SFE LJS .186 .076 2.451 .014 0.180 LJS: Lecturer Job Satisfaction LF: Learning Facilities SFE: Student-Faculty Engagement ICAG-TC: ICAG-Teaching Content Some tests are undertaken to judge the Goodness of Fit of the model. Table 5.38
shows that Lecturer Model SEM 5 (Figure 5.15) can be considered as having a good
fit. CMIN, GFI, AGFI, NFI, and RMSEA coefficients show that the model has a
good fit. Nevertheless, the study analyses the model using Path Analysis to provide a
comparison.
Table 5.38: Goodness Fit of Lecturer Model Using Single Composite Indicator
No Goodness of Fit Coefficient Standard Remark 1 CMIN 1.61 (p=.205) Insignificant Fit 2 GFI 0.996 More than 0.9 Fit 3 AGFI 0.957 More than 0.9 Fit 4 RMSEA 0.057 Less than 0.08 Fit 5 NFI 0.994 More than 0.9 Fit
5.7.2 Lecturer Model Using path Analysis The models developed based on Path Analysis and SEM using single composite
indicator are quite similar. Magnitude effects of construct are the main difference
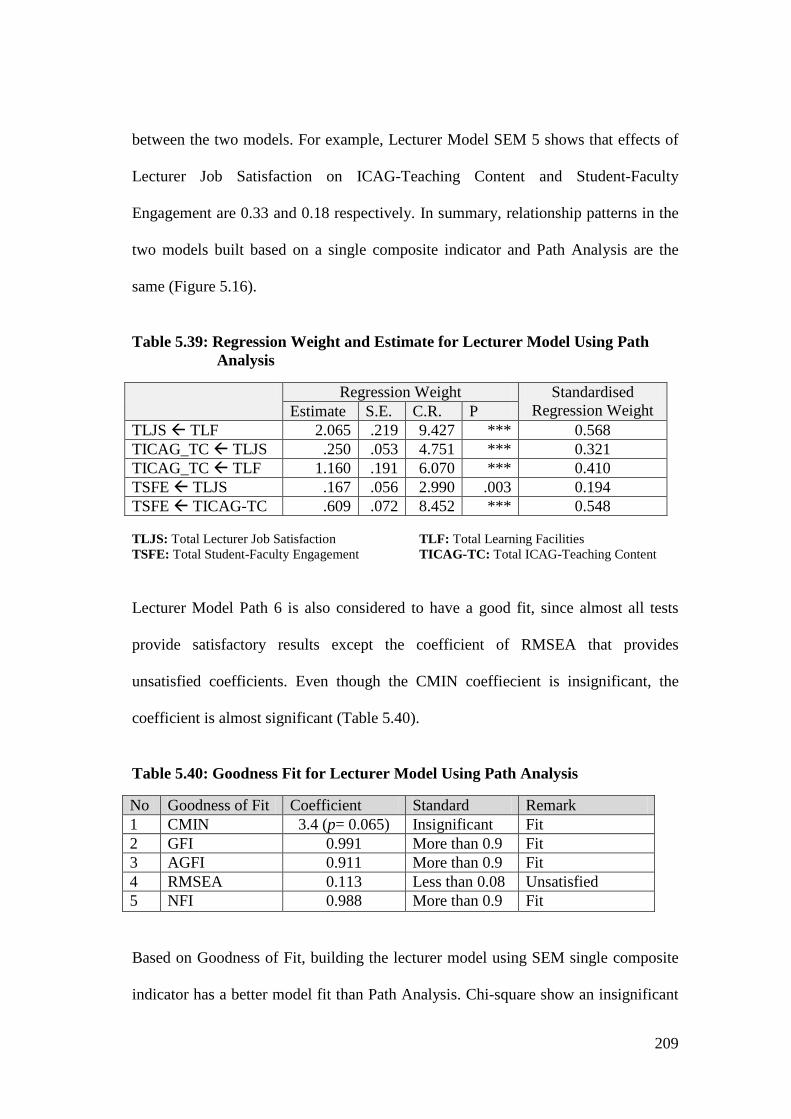
209
between the two models. For example, Lecturer Model SEM 5 shows that effects of
Lecturer Job Satisfaction on ICAG-Teaching Content and Student-Faculty
Engagement are 0.33 and 0.18 respectively. In summary, relationship patterns in the
two models built based on a single composite indicator and Path Analysis are the
same (Figure 5.16).
Table 5.39: Regression Weight and Estimate for Lecturer Model Using Path
Analysis
Regression Weight Standardised Regression Weight Estimate S.E. C.R. P
TLJS TLF 2.065 .219 9.427 *** 0.568 TICAG_TC TLJS .250 .053 4.751 *** 0.321 TICAG_TC TLF 1.160 .191 6.070 *** 0.410 TSFE TLJS .167 .056 2.990 .003 0.194 TSFE TICAG-TC .609 .072 8.452 *** 0.548 TLJS: Total Lecturer Job Satisfaction TLF: Total Learning Facilities TSFE: Total Student-Faculty Engagement TICAG-TC: Total ICAG-Teaching Content Lecturer Model Path 6 is also considered to have a good fit, since almost all tests
provide satisfactory results except the coefficient of RMSEA that provides
unsatisfied coefficients. Even though the CMIN coeffiecient is insignificant, the
coefficient is almost significant (Table 5.40).
Table 5.40: Goodness Fit for Lecturer Model Using Path Analysis
No Goodness of Fit Coefficient Standard Remark 1 CMIN 3.4 (p= 0.065) Insignificant Fit 2 GFI 0.991 More than 0.9 Fit 3 AGFI 0.911 More than 0.9 Fit 4 RMSEA 0.113 Less than 0.08 Unsatisfied 5 NFI 0.988 More than 0.9 Fit
Based on Goodness of Fit, building the lecturer model using SEM single composite
indicator has a better model fit than Path Analysis. Chi-square show an insignificant
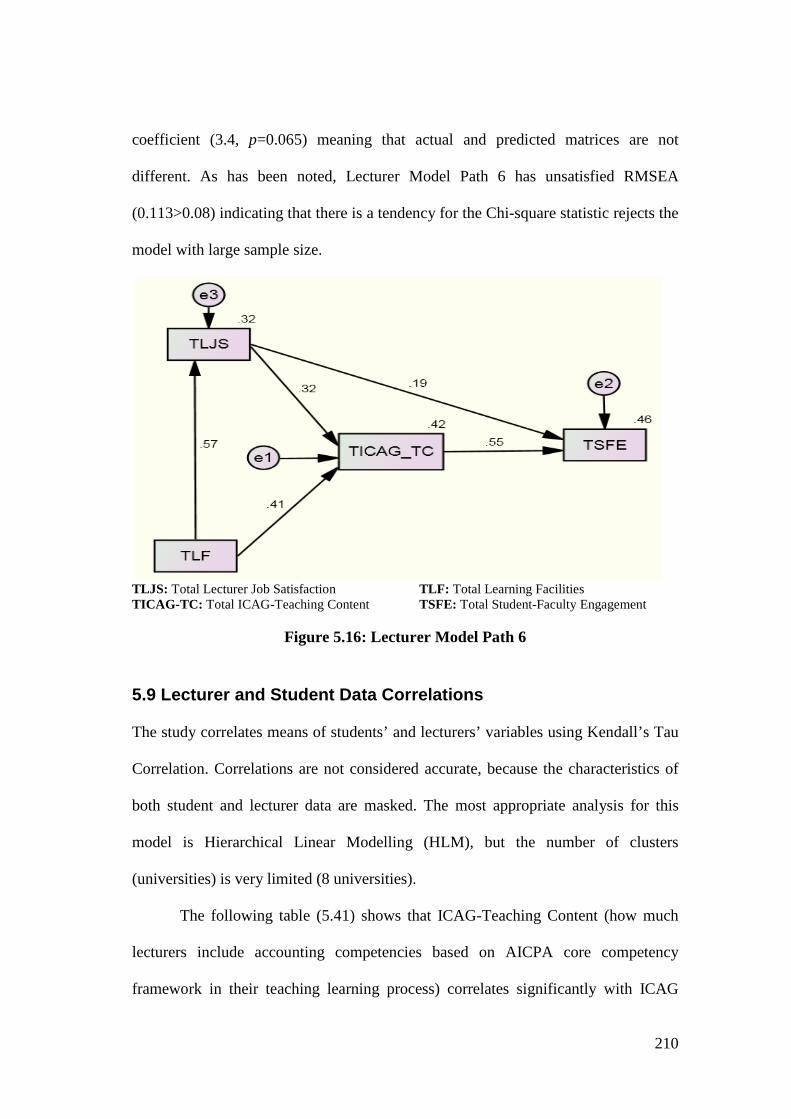
210
coefficient (3.4, p=0.065) meaning that actual and predicted matrices are not
different. As has been noted, Lecturer Model Path 6 has unsatisfied RMSEA
(0.113>0.08) indicating that there is a tendency for the Chi-square statistic rejects the
model with large sample size.
TLJS: Total Lecturer Job Satisfaction TLF: Total Learning Facilities TICAG-TC: Total ICAG-Teaching Content TSFE: Total Student-Faculty Engagement
Figure 5.16: Lecturer Model Path 6
5.9 Lecturer and Student Data Correlations The study correlates means of students’ and lecturers’ variables using Kendall’s Tau
Correlation. Correlations are not considered accurate, because the characteristics of
both student and lecturer data are masked. The most appropriate analysis for this
model is Hierarchical Linear Modelling (HLM), but the number of clusters
(universities) is very limited (8 universities).
The following table (5.41) shows that ICAG-Teaching Content (how much
lecturers include accounting competencies based on AICPA core competency
framework in their teaching learning process) correlates significantly with ICAG
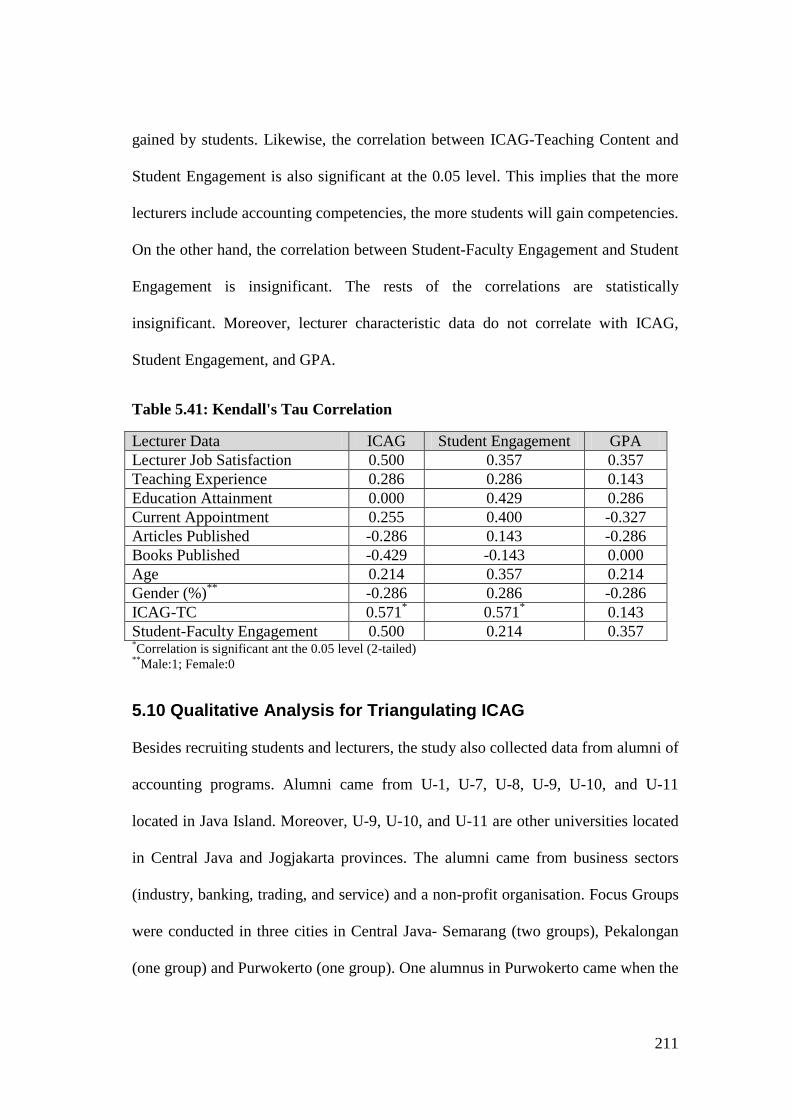
211
gained by students. Likewise, the correlation between ICAG-Teaching Content and
Student Engagement is also significant at the 0.05 level. This implies that the more
lecturers include accounting competencies, the more students will gain competencies.
On the other hand, the correlation between Student-Faculty Engagement and Student
Engagement is insignificant. The rests of the correlations are statistically
insignificant. Moreover, lecturer characteristic data do not correlate with ICAG,
Student Engagement, and GPA.
Table 5.41: Kendall's Tau Correlation
Lecturer Data ICAG Student Engagement GPA Lecturer Job Satisfaction 0.500 0.357 0.357 Teaching Experience 0.286 0.286 0.143 Education Attainment 0.000 0.429 0.286 Current Appointment 0.255 0.400 -0.327 Articles Published -0.286 0.143 -0.286 Books Published -0.429 -0.143 0.000 Age 0.214 0.357 0.214 Gender (%)** -0.286 0.286 -0.286 ICAG-TC 0.571* 0.571* 0.143 Student-Faculty Engagement 0.500 0.214 0.357 *Correlation is significant ant the 0.05 level (2-tailed) **Male:1; Female:0
5.10 Qualitative Analysis for Triangulating ICAG Besides recruiting students and lecturers, the study also collected data from alumni of
accounting programs. Alumni came from U-1, U-7, U-8, U-9, U-10, and U-11
located in Java Island. Moreover, U-9, U-10, and U-11 are other universities located
in Central Java and Jogjakarta provinces. The alumni came from business sectors
(industry, banking, trading, and service) and a non-profit organisation. Focus Groups
were conducted in three cities in Central Java- Semarang (two groups), Pekalongan
(one group) and Purwokerto (one group). One alumnus in Purwokerto came when the
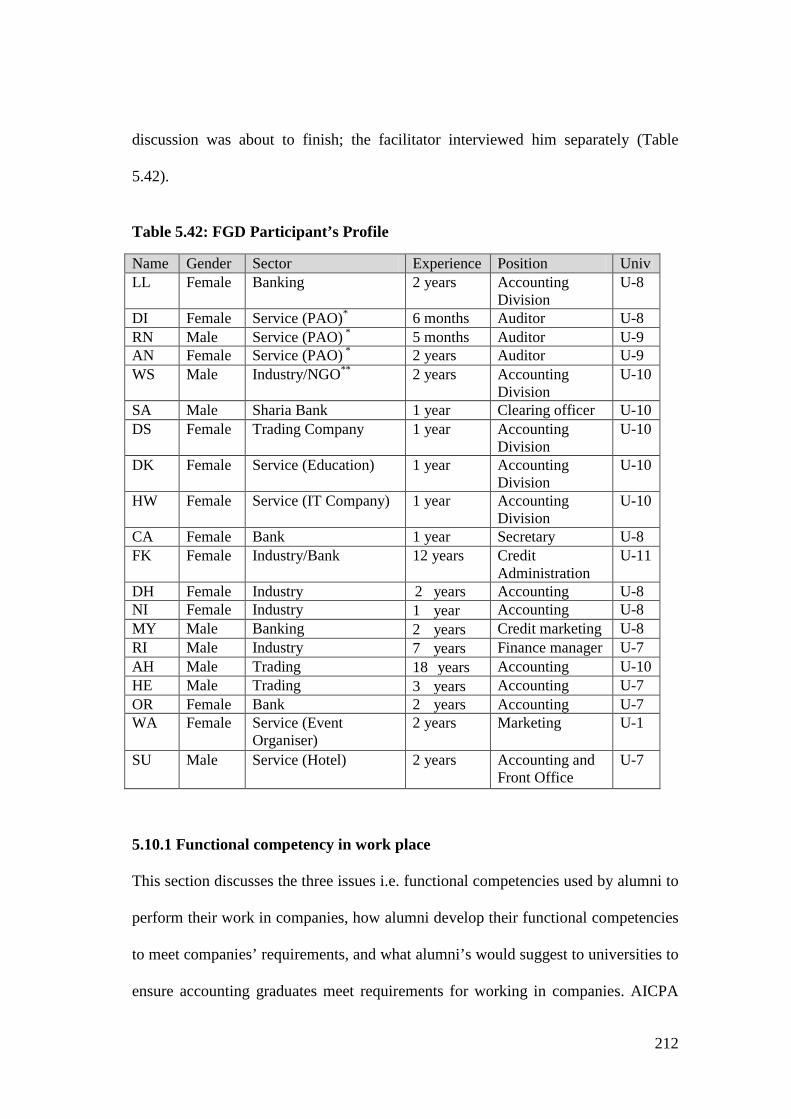
212
discussion was about to finish; the facilitator interviewed him separately (Table
5.42).
Table 5.42: FGD Participant’s Profile
Name Gender Sector Experience Position Univ LL Female Banking 2 years Accounting
Division U-8
DI Female Service (PAO)* 6 months Auditor U-8 RN Male Service (PAO) * 5 months Auditor U-9 AN Female Service (PAO) * 2 years Auditor U-9 WS Male Industry/NGO** 2 years Accounting
Division U-10
SA Male Sharia Bank 1 year Clearing officer U-10 DS Female Trading Company 1 year Accounting
Division U-10
DK Female Service (Education) 1 year Accounting Division
U-10
HW Female Service (IT Company) 1 year Accounting Division
U-10
CA Female Bank 1 year Secretary U-8 FK Female Industry/Bank 12 years Credit
Administration U-11
DH Female Industry 2 years Accounting U-8 NI Female Industry 1 year Accounting U-8 MY Male Banking 2 years Credit marketing U-8 RI Male Industry 7 years Finance manager U-7 AH Male Trading 18 years Accounting U-10 HE Male Trading 3 years Accounting U-7 OR Female Bank 2 years Accounting U-7 WA Female Service (Event
Organiser) 2 years Marketing U-1
SU Male Service (Hotel) 2 years Accounting and Front Office
U-7
5.10.1 Functional competency in work place This section discusses the three issues i.e. functional competencies used by alumni to
perform their work in companies, how alumni develop their functional competencies
to meet companies’ requirements, and what alumni’s would suggest to universities to
ensure accounting graduates meet requirements for working in companies. AICPA
213
defines functional competencies as specific capabilities used by accountants (Bolt-
Lee & Foster 2003). Functional competencies used by alumni to perform works in
their companies are as follow.
Decision Modelling Alumni working in the banking sector use simple decision modelling to calculate
working-capital turnover, cash flow mutation, and to establish pro-forma financial
statements. This information is pivotal to evaluate business soundness of a
prospective customer that leads to credit granting decisions. This competency is
closely related to other competencies such as leveraging technology and risk
analysis. In comparison, alumni working in the industry sector use decision
modelling to calculate cost of goods sold as an input of preparing income statements.
To perform this competency, alumni need other related competencies such as
leveraging technology, measurement, and reporting competencies. In addition, a
spreadsheet is the most frequently used software to perform decision modelling, thus
a highly needed competency.
Risk Analysis
Competency in risk analysis is found to be important, since alumni use this
competency. First, alumni working in the banking sector are required to be able to
identify risks by analysing financial statements for making credit and loan decisions.
In addition, alumni working in a Public Accountant Office need to analyse clients’
financial statements to provide some improvement suggestions. Therefore, this
competency is closely related to the reporting competency. Second, alumni working
in Public Accountant Office are also required to audit clients’ financial statements;
214
therefore they have to be aware of any potential audit risks. Likewise, for those who
work in the industry sector, risk analysis is also considered important, since some of
them perform an internal audit. Third, alumni should be acquainted with budgeting,
since some of them undertake the task of evaluating proposed budget. Nevertheless,
this competency is not explicitly mentioned in AICPA core competencies. Therefore,
competencies in analysing financial statements, performing audits, and evaluating
proposed budget are three competencies required by alumni to mitigate risks.
Measurement
Alumni are required to perform simple measurement in the process of journalising
transactions. However, alumni working in a bank and marketing divisions, are
required to have measurement competency, since they should measure the amount of
sales and prepare pro-forma financial statements. MY, an alumnus working in the
banking sector, said that to measure the amount of sales he should analyse client’
cheque accounts to determine the amount of sales on cash, while information of cost
of goods sold is measured based on interview information. As previously mentioned,
MY should prepare pro-forma financial statements, therefore cost of goods sold is
important information. In summary, competency in measurement is considered
important for alumni working in banking and industry sectors.
Reporting
Competency in preparing financial statements including cash flow reports is
important for alumni working in any sector. Moreover, alumni also need competency
for making special reports such as a bank clearance report, credit status report, and
financial report for a special company such as hotel and hospital. Alumni working in
215
a branch office of a reputable company do not have to prepare financial statements,
since financial statements are prepared by head office. On the other hand, alumni
working in small or medium sized companies sometimes should prepare complete
financial statements. FK who has significant experience working in a manufacturing
company stated that she used all accounting knowledge such as recording daily
transaction, conducting treasury activities, calculating merchandise inventory, and
preparing income statements and balance sheets.
Research
Research competency is considered important. Some tasks are closely related to
research activities especially for alumni working in the banking sector and Public
Accountant Office. Some important research activities include assessing and
analysing data, determining client or potential customer performance, and preparing
reports. Alumni working in credit marketing should have additional research
competency, in depth research to understand characteristics of a potential debtor.
Leveraging Technology
Mastering computer technology is very important to perform daily work in any
sector. LL who works in a finance company stated “anyway I am working using a
computer. I cannot imagine working without any computer, since it’s almost
impossible for me to work with a typewriter. Nowadays, almost all jobs can be
completed by using a computer.” Most of alumni use spreadsheets and word
processing software. Alumni working in more well-established companies are
required to use more sophisticated software such as LAN (Loan Approval System).
216
In addition, alumni are also required to have a good understanding of information
systems.
Accounting System
Accounting system competency is not explicitly mentioned in AICPA core
competencies. This competency is important, since not all alumni work in well-
established companies that have good accounting systems. Some alumni may work
in a new company or in a small/medium sized company lacking an appropriate
accounting system. DS who works in small sized company said “my work is not
mainly on accounting matters such as journalising and tracing transaction evidences,
but also designing accounting systems for merchandise.” In addition, this
competency is considered useful for alumni to improve the existing accounting
systems or to design new systems.
Summary
The above functional competencies are important for alumni to perform daily jobs in
companies. However, not all competencies have the same importance. Alumni
ranked Leveraging Technology as the most important competency to perform tasks
in their companies, followed by Risk Analysis and Measurement. Scores of all
competency indicators are not so different, meaning that all competencies are
considered important. Even though, reporting competency is important for alumni
working in any sector, but they rank it as the least important competency in daily
work. Figure 5.17 provides a snapshot of the ranks of Functional Competencies
based on alumni perceptions.
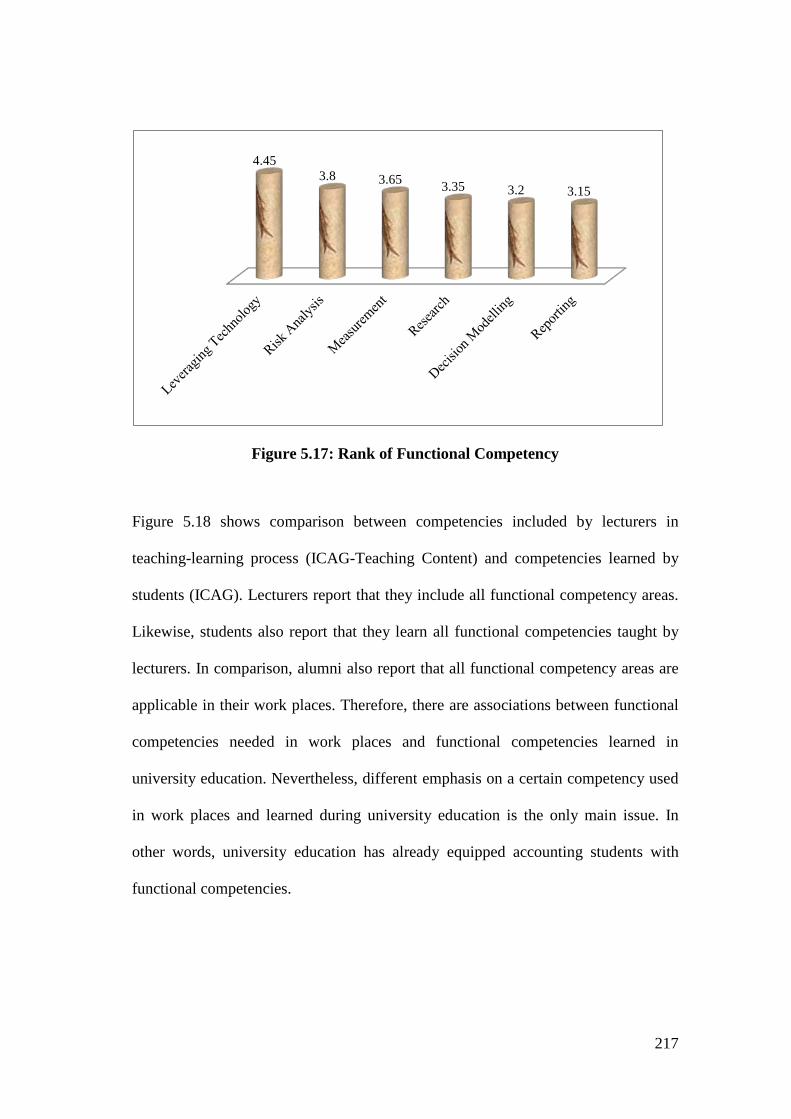
217
Figure 5.17: Rank of Functional Competency
Figure 5.18 shows comparison between competencies included by lecturers in
teaching-learning process (ICAG-Teaching Content) and competencies learned by
students (ICAG). Lecturers report that they include all functional competency areas.
Likewise, students also report that they learn all functional competencies taught by
lecturers. In comparison, alumni also report that all functional competency areas are
applicable in their work places. Therefore, there are associations between functional
competencies needed in work places and functional competencies learned in
university education. Nevertheless, different emphasis on a certain competency used
in work places and learned during university education is the only main issue. In
other words, university education has already equipped accounting students with
functional competencies.
4.45 3.8 3.65 3.35 3.2 3.15
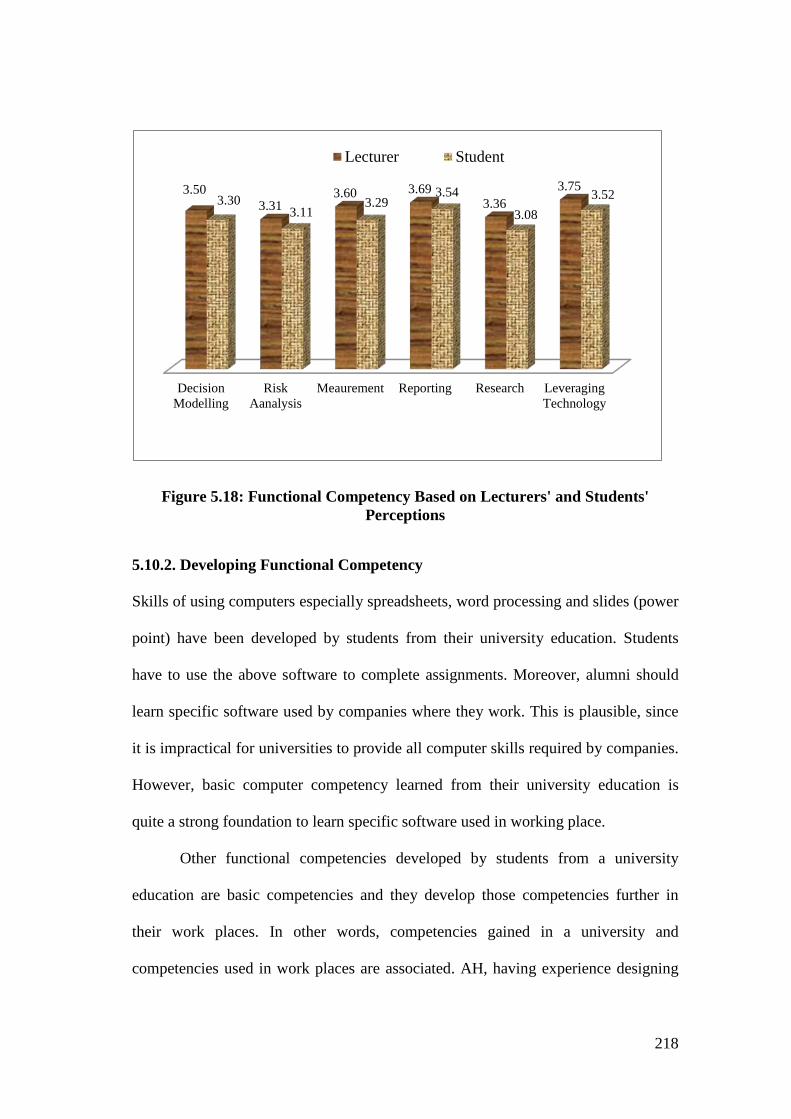
218
Figure 5.18: Functional Competency Based on Lecturers' and Students' Perceptions
5.10.2. Developing Functional Competency Skills of using computers especially spreadsheets, word processing and slides (power
point) have been developed by students from their university education. Students
have to use the above software to complete assignments. Moreover, alumni should
learn specific software used by companies where they work. This is plausible, since
it is impractical for universities to provide all computer skills required by companies.
However, basic computer competency learned from their university education is
quite a strong foundation to learn specific software used in working place.
Other functional competencies developed by students from a university
education are basic competencies and they develop those competencies further in
their work places. In other words, competencies gained in a university and
competencies used in work places are associated. AH, having experience designing
DecisionModelling
RiskAanalysis
Meaurement Reporting Research LeveragingTechnology
3.50 3.31
3.60 3.69 3.36
3.75 3.30
3.11 3.29
3.54
3.08 3.52
Lecturer Student
219
computerised accounting system for more than 20 companies, said “I can design
accounting system for companies, because I have accounting systems knowledge I
learned from university education”. Likewise, HE also contended “in university
education I learned how to prepare financial statements and it’s useful in working
place. If I had not studied how to prepare financial statements at university, I would
have been like High School or Secondary School graduates who do not understand
financial statements”.
Alumni’s competencies improved significantly after they worked for some
time in their companies. Alumni continue developing their competencies to meet
competency requirements in their work places. They developed functional
competencies, because they felt that functional competencies gained from university
education were limited for working in their companies. WA stated "competencies
gained from university education and competencies used in a work place are much
different”. Some knowledge was not taught in university". In addition, alumni are
required to master specific competencies to complete their daily work. In relation to
this, MY said “the ability to absorb information from a prospective debtor and
convert information into more meaningful numbers was not gained from university
education”. There are gaps between competencies alumni learned at universities with
competencies that alumni need for work. Alumni contended that most university
lectures focused on theories, but the work place demands more practical skills.
Even though there are some gaps between competencies gained from
university education and competencies used in work places, alumni are able to fill
gaps by learning from experience, colleagues, super ordinates, and other formal
education such as training and seminars. Nevertheless, alumni working in new or not
220
well-established companies tend to have more problems, since they have to design or
improve companies’ accounting systems.
5.10.3 Suggestions to Universities
To improve graduates’ functional competencies, alumni provide the following
suggestions.
• Universities that have not yet offered an internship course(s) to students
should include internship course(s) in their curricula to ensure all students are
familiar with a work environment. Universities having offered internship
course(s) should consider extending the length of internships by replacing
Community Service Course (KKN). Moreover, universities should provide a
course that covers various current issues in accounting.
• Universities should improve teaching-learning processes of accounting course
by balancing theory and practice. More specifically, alumni recommended
that universities should provide more computer and auditing practices.
Alumni also suggested universities develop closer cooperation with
companies so their students will not have difficulties to practice and improve
their accounting competencies as well as undertake internships.
• Field Trip (KKL) management should be improved to make sure KKL will
provide more learning impacts on students.
• Universities should increase credits of Accounting Information System (AIS)
or Accounting System course.
Functional Competency developed by AICPA is applicable in work places in the
Indonesian business setting. University education has provided a strong competency
221
foundation for their graduates despite competency gaps between competencies
developed in a university and competencies required by a work place. Alumni
suggest that universities should bring more real-world experience into the teaching
and learning of accounting.
5.10.4 Personal Competency in Work Places
This section discusses alumni perception on Personal Competency. The discussion
also consists of three parts i.e. personal competencies needed by alumni to work in
companies, how alumni develop their personal competencies to ensure they can work
harmoniously and productively in their companies, and alumni’s suggestions to
universities on how to improve graduates personal competencies. AICPA defines
personal competencies as interpersonal skills (Bolt-Lee & Foster 2003). Alumni
reported on some personal competencies and then the study grouped them into
categories based on AICPA Personal Competency framework.
Professional Demeanour
In order to work properly in a company, AICPA framework contains 16 demeanour
characteristic, whilst alumni propose 21. However, characteristics proposed by
alumni could fall into four categories. Working demeanour, alumni should be able to
work hard, persevering, thorough, and concentrate to catch the deadline. Personal
attitude, alumni are required to be honest, responsible, firm, disciplined, friendly, and
independent. Professional integrity, alumni are required to have firm loyalty to the
company and adhere to professional codes of ethics. Professional learner, alumni
should be able to become resilient lifelong learners to improve their competencies
and keep mentally ready in any situation with aplomb. Before working in Bank BBB,
222
CA had experience working in Hotel CCC as GRO (General Reception Officer). In
this position she had to learn communication, marketing, and hospitality skills. After
her contract in this hotel finished, she worked in a telecommunication company
(TTT) as a marketer. She resigned from TTT and started working at Bank BBB as a
teller, customer service officer, and secretary. CA’s experience is an example of how
alumni should always improve their competencies and adjust themselves to changing
work environments.
Problem Solving and Decision Making
Alumni are required to have problem solving and decision making competencies,
since they may encounter problems and decision making dilemmas in daily work.
They solve problems by synthesising problems, studying theories, discussing with
colleagues, and consulting with peers and superordinates. In addition, alumni should
make appropriate decisions based on their level of authority. OR, who has working
experience in a reputable bank said “I have to make daily reports and I have to make
necessary decisions based on my authority”. Despite its scopes, alumni have to solve
daily work-related problems and make decisions accurately.
Interaction
Alumni reported that there are four types interactions in their companies i.e.
interaction with superordinates, subordinates, colleagues, and interaction with
clients. Therefore competency in interaction is important for alumni to work
effectively. Alumni’s capabilities to work in a team, adjust to new work
environments, and commit to implement agreements among team members, are also
important for achieving intended goals and for solving problems. In addition,
223
alumni’s capabilities to interact well with their colleagues by accepting colleagues’
suggestions and opinions, understanding other people’s characteristics, and
willingness to apologise and to forgive. Alumni working in Public Accountant Office
and financing company should have additional skills, working with client. Alumni
working in Public Accountant Office reported that they have to be able to build
comfortable communications with clients, since comfortable interactions are
preconditions for effective working relationships. AN who has more than two years
experience working in Public Accountant Office said “If I have comfortable
communication with a client, certainly I will get the data from client very easily”.
Leadership
Leadership is also needed by all alumni to work in various sectors. Leadership is not
only useful for alumni who have significant work experience and have high
positions, but leadership is also useful for alumni to take the lead in team work. In
relation to leadership competency, alumni provide at least three indicators. First,
alumni should have motivation to improve a company’s system and willing to invite
and prepare colleagues to change. Second, alumni should be able to mobilize other
people and run the company. Lastly, alumni should have an openness attitude.
Communication
Communication competency is important for alumni to work in any company, since
alumni are required to communicate harmoniously with super ordinates, sub
ordinates, colleagues, clients, as well as customers. Alumni working in Public
Accountant Office collect data by having comfortable communications with clients.
Alumni working in the Marketing Division of a bank use more intensive

224
communications to survey and interview potential clients. Communications between
marketer and potential client should be conducted carefully by considering character
of interviewee, time, place, and techniques. As contended by MY “communication is
very important in surveying a potential client. It needs the right place, time, and
techniques. For example, a potential client will answer any question frankly, when he
or she is driving a car.”
Having good competency in communication is not enough for alumni, since
their work environments also demand more communication competencies i.e.
negotiation competency, English or other foreign language proficiency,
communication psychology, communication competency for public relations and
marketing purposes.
Project Management An alumnus working in an Information Technology (IT) company needs project
management competency to deal with project administration from initial stage of
project until client’s payment. Nevertheless, the application of this competency is not
so intensive, since only certain companies require project management. HW who
works at an IT company said “my company has many government clients and my job
is to administer projects from beginning until clients’ funds disbursements.”
Leveraging Technology Leveraging technology to improve personal competency is limited to using
technology for email or internal information exchange and assessing information. HE
who works at a trading company uses technology to assess new regulation on
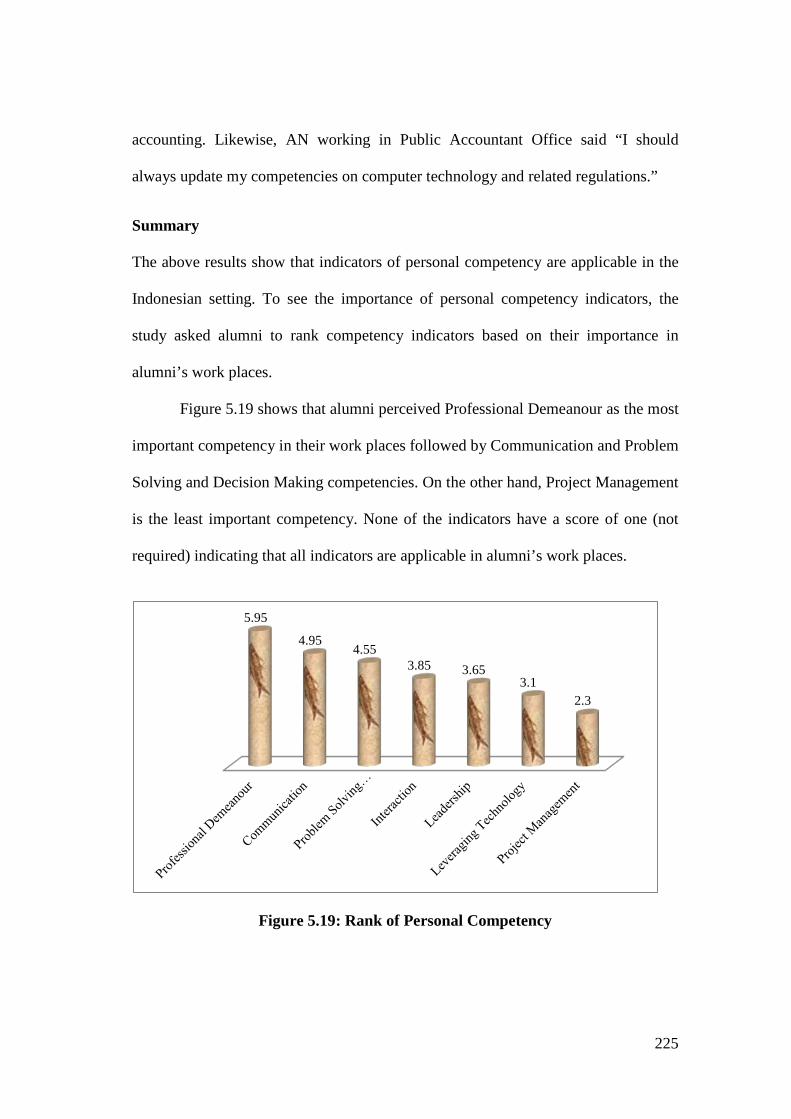
225
accounting. Likewise, AN working in Public Accountant Office said “I should
always update my competencies on computer technology and related regulations.”
Summary
The above results show that indicators of personal competency are applicable in the
Indonesian setting. To see the importance of personal competency indicators, the
study asked alumni to rank competency indicators based on their importance in
alumni’s work places.
Figure 5.19 shows that alumni perceived Professional Demeanour as the most
important competency in their work places followed by Communication and Problem
Solving and Decision Making competencies. On the other hand, Project Management
is the least important competency. None of the indicators have a score of one (not
required) indicating that all indicators are applicable in alumni’s work places.
Figure 5.19: Rank of Personal Competency
5.95
4.95 4.55
3.85 3.65 3.1
2.3
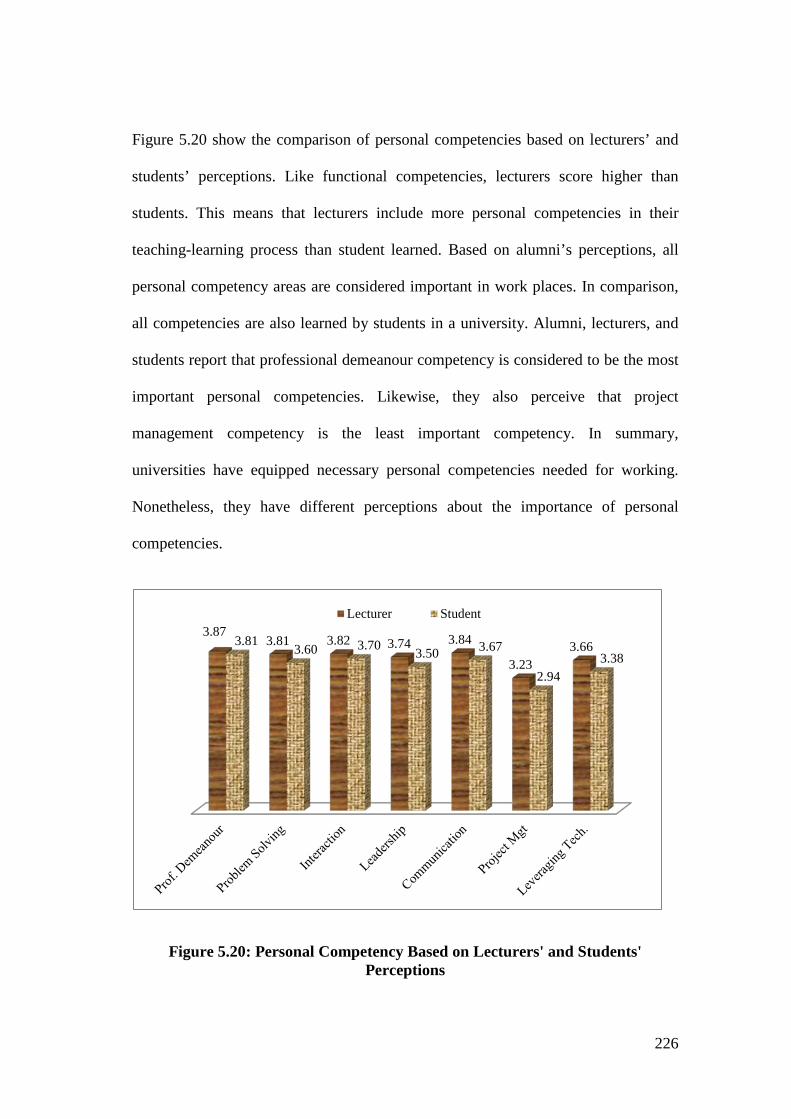
226
Figure 5.20 show the comparison of personal competencies based on lecturers’ and
students’ perceptions. Like functional competencies, lecturers score higher than
students. This means that lecturers include more personal competencies in their
teaching-learning process than student learned. Based on alumni’s perceptions, all
personal competency areas are considered important in work places. In comparison,
all competencies are also learned by students in a university. Alumni, lecturers, and
students report that professional demeanour competency is considered to be the most
important personal competencies. Likewise, they also perceive that project
management competency is the least important competency. In summary,
universities have equipped necessary personal competencies needed for working.
Nonetheless, they have different perceptions about the importance of personal
competencies.
Figure 5.20: Personal Competency Based on Lecturers' and Students' Perceptions
3.87 3.81 3.82 3.74 3.84
3.23 3.66 3.81 3.60 3.70 3.50 3.67
2.94 3.38
Lecturer Student
227
5.10.5 Developing Personal Competency Alumni reported that they gained basic personal competencies from their university
education. They contended that university education equipped alumni with some
personal competencies i.e. communication, cooperation (leadership), honesty, hard
work, group work, problem solving, and information technology. While attending
university education, alumni developed personal competencies through academic
activities (lectures and assignments) and non-academic activities (campus
organisation activities). Alumni also perceived that Personal Competencies gained
from universities have a close association with competencies used in their work
places, even though there are some gaps. However, alumni are able to manage these
gaps.
There are some obstacles facing alumni to develop their Personal
Competencies. First, alumni working in Public Accountant Office sometimes have
dilemmas to interact with their clients. Becoming friendly with clients would create
problems, because alumni would have difficulties to maintain independence and
objectivity. On the other hand, working with unfriendly clients also creates different
problems, such as difficulties with data collection for audit purposes. Likewise, HE
said “interactions with colleagues sometimes create problems, since every person
brings his/her own ego into the company. Something true is not considered true,
because it is determined by seniority and other factors.” Second, alumni have
difficulty with both spoken and written English. WH who has significant experience
working in the Batik industry said “My English proficiency is limited so I have
difficulty to offer products to foreign buyers”.
228
5.10.6 Suggestions to Universities to Develop Personal Competency To improve personal competency of accounting graduates, alumni provide several
suggestions. (1) Universities should develop some campus activities, personality
development training, and seminars. Moreover, universities should encourage
students to actively participate in activities. (2) Universities need to develop
personality courses in two ways i.e. offering a personality course and embedding
personality contents into existing courses. (3) Universities should improve the
teaching of business communication (Indonesian and English language) as well as
encourage students to learn how to work in order to gain more confidence.
Alumni reported that AICPA Personal Competency indicators are in line with
work requirements in the Indonesian business setting. There are some gaps between
personal competencies alumni gained from university education with personal
competencies they used in the work places. Alumni suggest universities encourage
their students to participate in activities conducted by students or university
organisations. Providing a personality course is another plausible suggestion to
improve a student’s personality.
5.10.7 Broad-business Perspective Competency in the Work Place The last dimension of AICPA core competency is Broad-business Perspective
Competency. This competency deals with today’s accounting environment (Bolt-Lee
& Foster 2003) that measured by seven indicators (Mula 2007; Wolcot, S. K. 2006).
This section begins with discussions about alumni’s perception on the use of BPC in
their work places followed by the way alumni develop their BPC and alumni’s
suggestions on how to improve university’s BPC of graduates. Alumni reported BPC
229
and then the study grouped into categories based on AICPA Broad-business
Perspective Competency.
Strategic/Critical Thinking
Alumni reported that their capabilities of thinking critically are very important to
cope with daily work activities. Alumni use this competency to make improvisation
of problem solving encountered in a work place, since the scope of a job is more
complicated than what alumni learnt from their university education. RN who works
in a Public Accountant Office contends “the scope of work is different from and
wider than theories; therefore I have to make improvisations”. In addition, alumni are
also required to analogise complicated problems in a company and be acquainted
with sectors their companies are engaged in.
Strategic thinking is also considered important for alumni working in a Public
Accountant Office. They have to identify weaknesses and strengths of clients’
accounting. AN said “I don’t make a formal SWOT25 analysis, but when I am doing
observations in the client’s company, certainly I can identify what I should do.”
Moreover, alumni working in the banking sector should have strategic/critical
thinking competency when they analyse a potential client for extending credit.
Industry/Sector Perspective
Industry/sector Perspective competency is important for alumni who work in any
industry or sector. More specifically, alumni have to have good knowledge of the
industry or sector their companies deal with. The knowledge is not limited to
25 SWOT Analysis is a technique for identifying strategies by using Strengths, Weaknesses, Opportunities, and Threats.
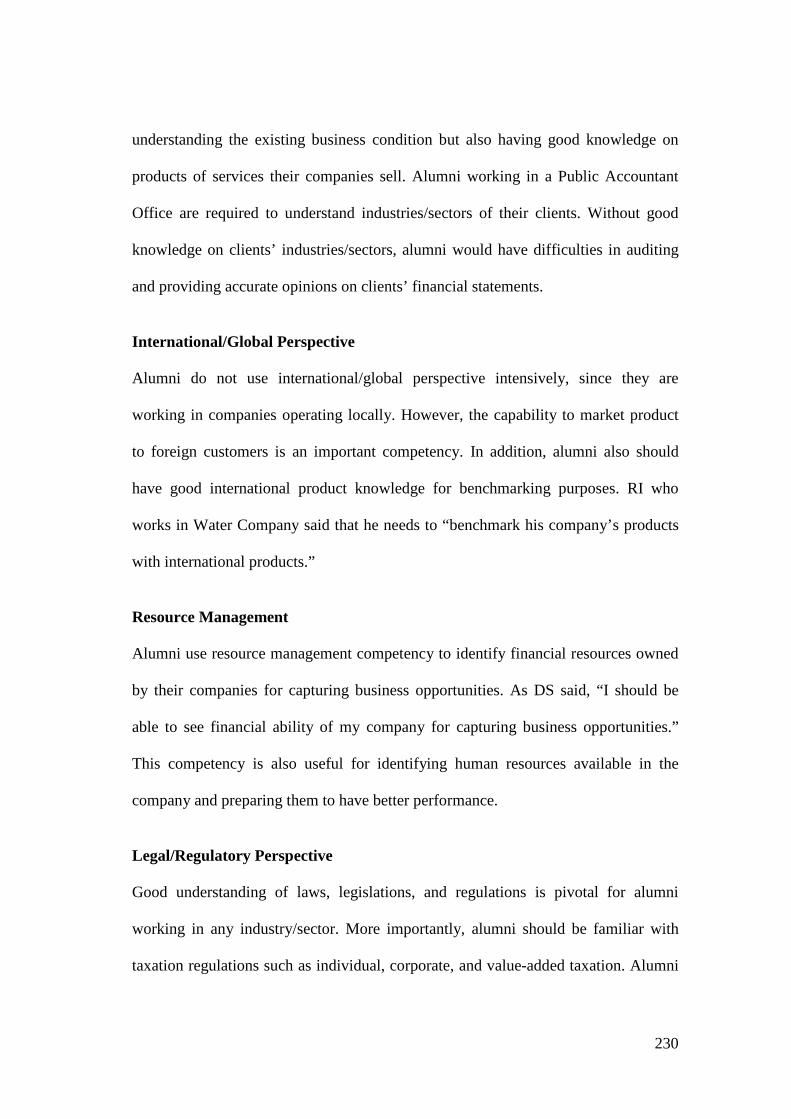
230
understanding the existing business condition but also having good knowledge on
products of services their companies sell. Alumni working in a Public Accountant
Office are required to understand industries/sectors of their clients. Without good
knowledge on clients’ industries/sectors, alumni would have difficulties in auditing
and providing accurate opinions on clients’ financial statements.
International/Global Perspective
Alumni do not use international/global perspective intensively, since they are
working in companies operating locally. However, the capability to market product
to foreign customers is an important competency. In addition, alumni also should
have good international product knowledge for benchmarking purposes. RI who
works in Water Company said that he needs to “benchmark his company’s products
with international products.”
Resource Management
Alumni use resource management competency to identify financial resources owned
by their companies for capturing business opportunities. As DS said, “I should be
able to see financial ability of my company for capturing business opportunities.”
This competency is also useful for identifying human resources available in the
company and preparing them to have better performance.
Legal/Regulatory Perspective
Good understanding of laws, legislations, and regulations is pivotal for alumni
working in any industry/sector. More importantly, alumni should be familiar with
taxation regulations such as individual, corporate, and value-added taxation. Alumni
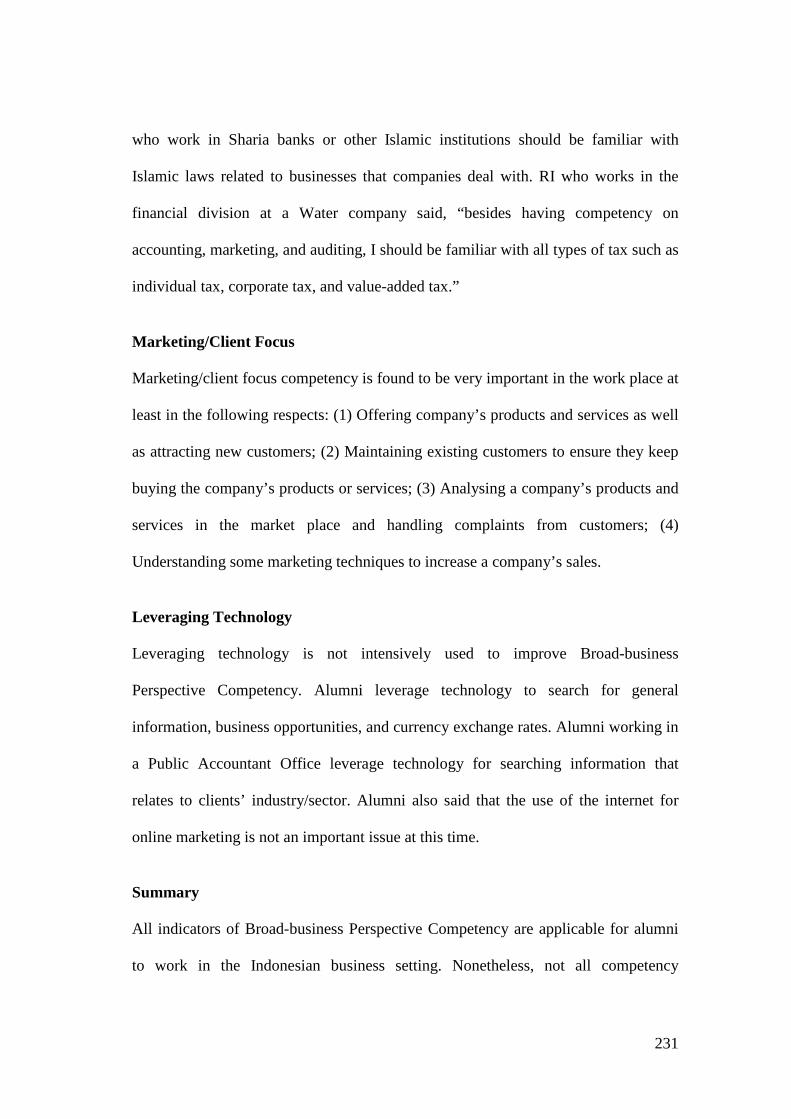
231
who work in Sharia banks or other Islamic institutions should be familiar with
Islamic laws related to businesses that companies deal with. RI who works in the
financial division at a Water company said, “besides having competency on
accounting, marketing, and auditing, I should be familiar with all types of tax such as
individual tax, corporate tax, and value-added tax.”
Marketing/Client Focus
Marketing/client focus competency is found to be very important in the work place at
least in the following respects: (1) Offering company’s products and services as well
as attracting new customers; (2) Maintaining existing customers to ensure they keep
buying the company’s products or services; (3) Analysing a company’s products and
services in the market place and handling complaints from customers; (4)
Understanding some marketing techniques to increase a company’s sales.
Leveraging Technology
Leveraging technology is not intensively used to improve Broad-business
Perspective Competency. Alumni leverage technology to search for general
information, business opportunities, and currency exchange rates. Alumni working in
a Public Accountant Office leverage technology for searching information that
relates to clients’ industry/sector. Alumni also said that the use of the internet for
online marketing is not an important issue at this time.
Summary
All indicators of Broad-business Perspective Competency are applicable for alumni
to work in the Indonesian business setting. Nonetheless, not all competency
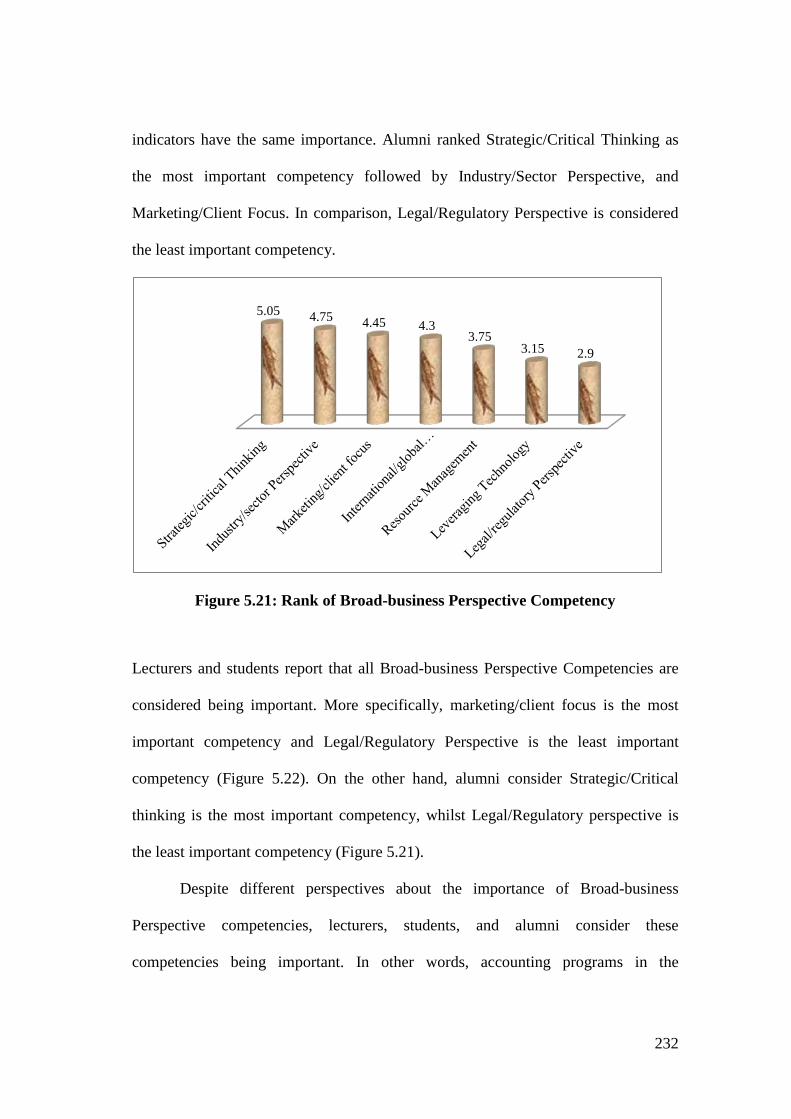
232
indicators have the same importance. Alumni ranked Strategic/Critical Thinking as
the most important competency followed by Industry/Sector Perspective, and
Marketing/Client Focus. In comparison, Legal/Regulatory Perspective is considered
the least important competency.
Figure 5.21: Rank of Broad-business Perspective Competency
Lecturers and students report that all Broad-business Perspective Competencies are
considered being important. More specifically, marketing/client focus is the most
important competency and Legal/Regulatory Perspective is the least important
competency (Figure 5.22). On the other hand, alumni consider Strategic/Critical
thinking is the most important competency, whilst Legal/Regulatory perspective is
the least important competency (Figure 5.21).
Despite different perspectives about the importance of Broad-business
Perspective competencies, lecturers, students, and alumni consider these
competencies being important. In other words, accounting programs in the
5.05 4.75 4.45 4.3 3.75
3.15 2.9
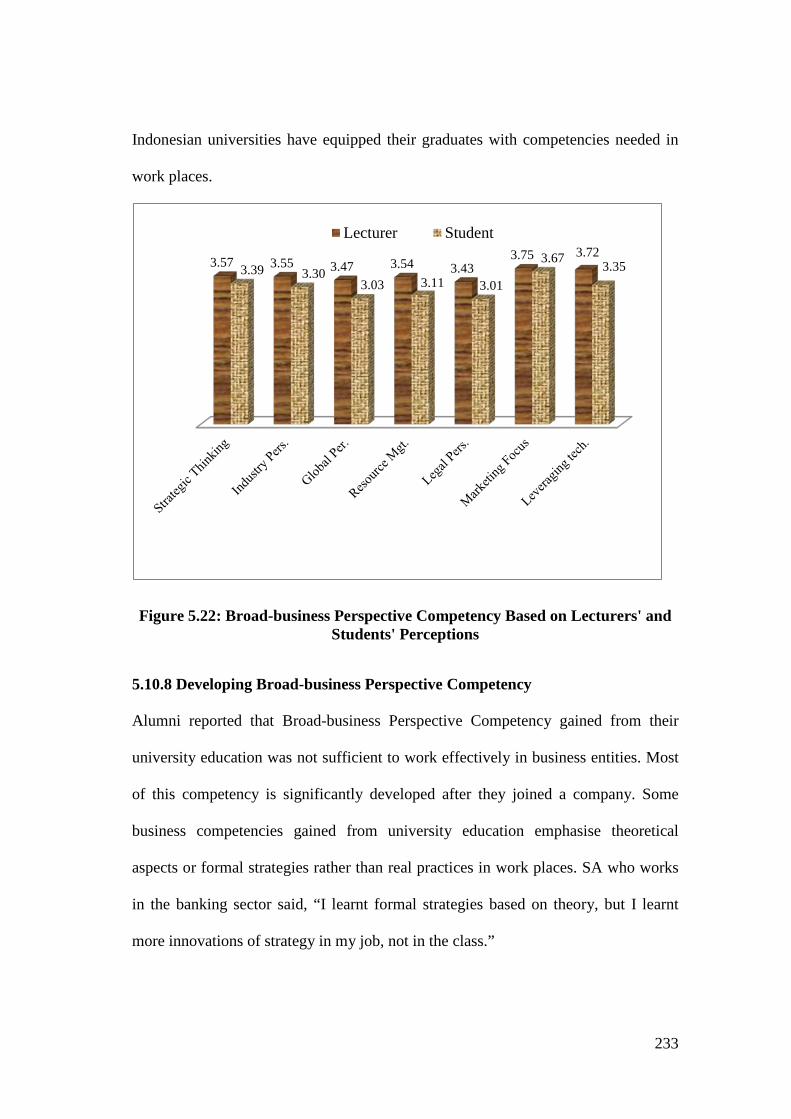
233
Indonesian universities have equipped their graduates with competencies needed in
work places.
Figure 5.22: Broad-business Perspective Competency Based on Lecturers' and Students' Perceptions
5.10.8 Developing Broad-business Perspective Competency Alumni reported that Broad-business Perspective Competency gained from their
university education was not sufficient to work effectively in business entities. Most
of this competency is significantly developed after they joined a company. Some
business competencies gained from university education emphasise theoretical
aspects or formal strategies rather than real practices in work places. SA who works
in the banking sector said, “I learnt formal strategies based on theory, but I learnt
more innovations of strategy in my job, not in the class.”
3.57 3.55 3.47 3.54 3.43 3.75 3.72
3.39 3.30 3.03 3.11 3.01
3.67 3.35
Lecturer Student
234
The main problem encountered by alumni relating to Broad-business
Perspective Competency is insufficient business knowledge and practices. Most
alumni said that the real-world business is much more complicated than the theory
they learnt in classrooms. HE said, “I feel that this competency [Broad-business
Perspective Competency] is less studied at the university. There were some business
courses, but the lecture mainly emphasized theoretical aspect. Real work is not like
theory, since there are many cases that were not studied in the theory [class].”
Alumni working in a Public Accountant Office also have difficulties especially when
they audit different kinds of companies. They have to understand clients’
industries/sectors thoroughly. Despite gaps between competencies students gained
from their university education and competencies demanded by work places, alumni
are still able to cope with gaps and adjust themselves to work requirements.
5.10.9 Suggestions to universities for improving Broad-business Perspective
Competency To improve Broad-business Perspective Competency, alumni provide many
suggestions. There are at least three categories of suggestions as follows: (1)
Universities should provide more time for students to undertake internships to ensure
they can learn real businesses practices; (2) Courses should be based on practice by
providing more case studies, laboratory work, and more lecturers from professionals;
(3) Universities should organise more seminars, workshops, and training relating to
entrepreneurship and business.
Broad-business Perspective Competency based on AICPA core competencies
are applicable in work places of the Indonesian company setting. Despite gaps
identified in Broad-business Perspective Competency, alumni are able to cope with
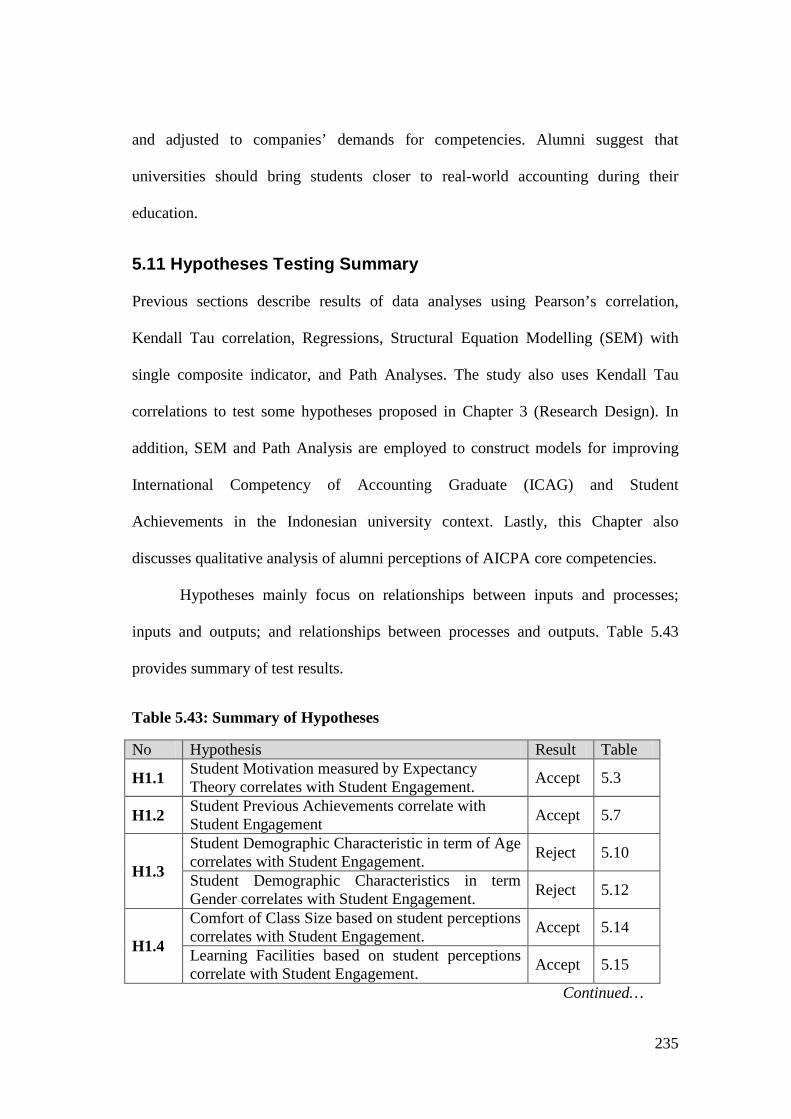
235
and adjusted to companies’ demands for competencies. Alumni suggest that
universities should bring students closer to real-world accounting during their
education.
5.11 Hypotheses Testing Summary Previous sections describe results of data analyses using Pearson’s correlation,
Kendall Tau correlation, Regressions, Structural Equation Modelling (SEM) with
single composite indicator, and Path Analyses. The study also uses Kendall Tau
correlations to test some hypotheses proposed in Chapter 3 (Research Design). In
addition, SEM and Path Analysis are employed to construct models for improving
International Competency of Accounting Graduate (ICAG) and Student
Achievements in the Indonesian university context. Lastly, this Chapter also
discusses qualitative analysis of alumni perceptions of AICPA core competencies.
Hypotheses mainly focus on relationships between inputs and processes;
inputs and outputs; and relationships between processes and outputs. Table 5.43
provides summary of test results.
Table 5.43: Summary of Hypotheses
No Hypothesis Result Table
H1.1 Student Motivation measured by Expectancy Theory correlates with Student Engagement. Accept 5.3
H1.2 Student Previous Achievements correlate with Student Engagement Accept 5.7
H1.3
Student Demographic Characteristic in term of Age correlates with Student Engagement. Reject 5.10
Student Demographic Characteristics in term Gender correlates with Student Engagement. Reject 5.12
H1.4
Comfort of Class Size based on student perceptions correlates with Student Engagement. Accept 5.14
Learning Facilities based on student perceptions correlate with Student Engagement. Accept 5.15
Continued…
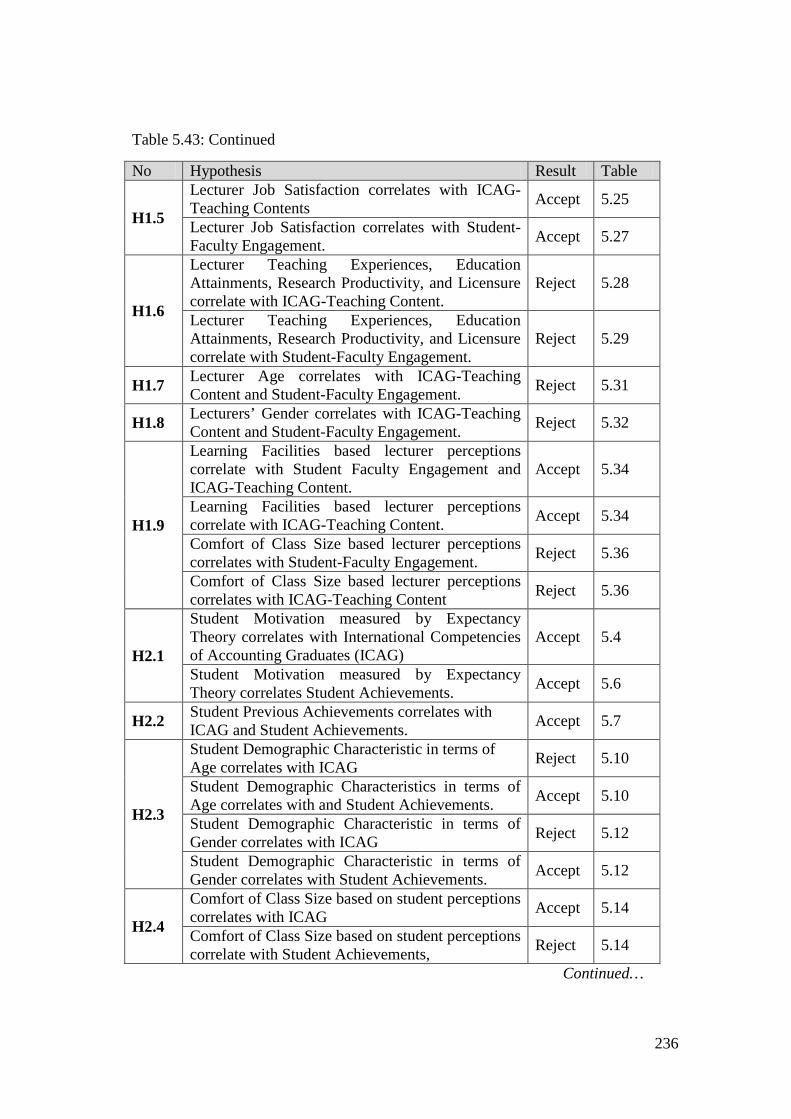
236
Table 5.43: Continued
No Hypothesis Result Table
H1.5
Lecturer Job Satisfaction correlates with ICAG-Teaching Contents Accept 5.25
Lecturer Job Satisfaction correlates with Student-Faculty Engagement. Accept 5.27
H1.6
Lecturer Teaching Experiences, Education Attainments, Research Productivity, and Licensure correlate with ICAG-Teaching Content.
Reject 5.28
Lecturer Teaching Experiences, Education Attainments, Research Productivity, and Licensure correlate with Student-Faculty Engagement.
Reject 5.29
H1.7 Lecturer Age correlates with ICAG-Teaching Content and Student-Faculty Engagement. Reject 5.31
H1.8 Lecturers’ Gender correlates with ICAG-Teaching Content and Student-Faculty Engagement. Reject 5.32
H1.9
Learning Facilities based lecturer perceptions correlate with Student Faculty Engagement and ICAG-Teaching Content.
Accept 5.34
Learning Facilities based lecturer perceptions correlate with ICAG-Teaching Content. Accept 5.34
Comfort of Class Size based lecturer perceptions correlates with Student-Faculty Engagement. Reject 5.36
Comfort of Class Size based lecturer perceptions correlates with ICAG-Teaching Content Reject 5.36
H2.1
Student Motivation measured by Expectancy Theory correlates with International Competencies of Accounting Graduates (ICAG)
Accept 5.4
Student Motivation measured by Expectancy Theory correlates Student Achievements. Accept 5.6
H2.2 Student Previous Achievements correlates with ICAG and Student Achievements. Accept 5.7
H2.3
Student Demographic Characteristic in terms of Age correlates with ICAG Reject 5.10
Student Demographic Characteristics in terms of Age correlates with and Student Achievements. Accept 5.10
Student Demographic Characteristic in terms of Gender correlates with ICAG Reject 5.12
Student Demographic Characteristic in terms of Gender correlates with Student Achievements. Accept 5.12
H2.4
Comfort of Class Size based on student perceptions correlates with ICAG Accept 5.14
Comfort of Class Size based on student perceptions correlate with Student Achievements, Reject 5.14
Continued…
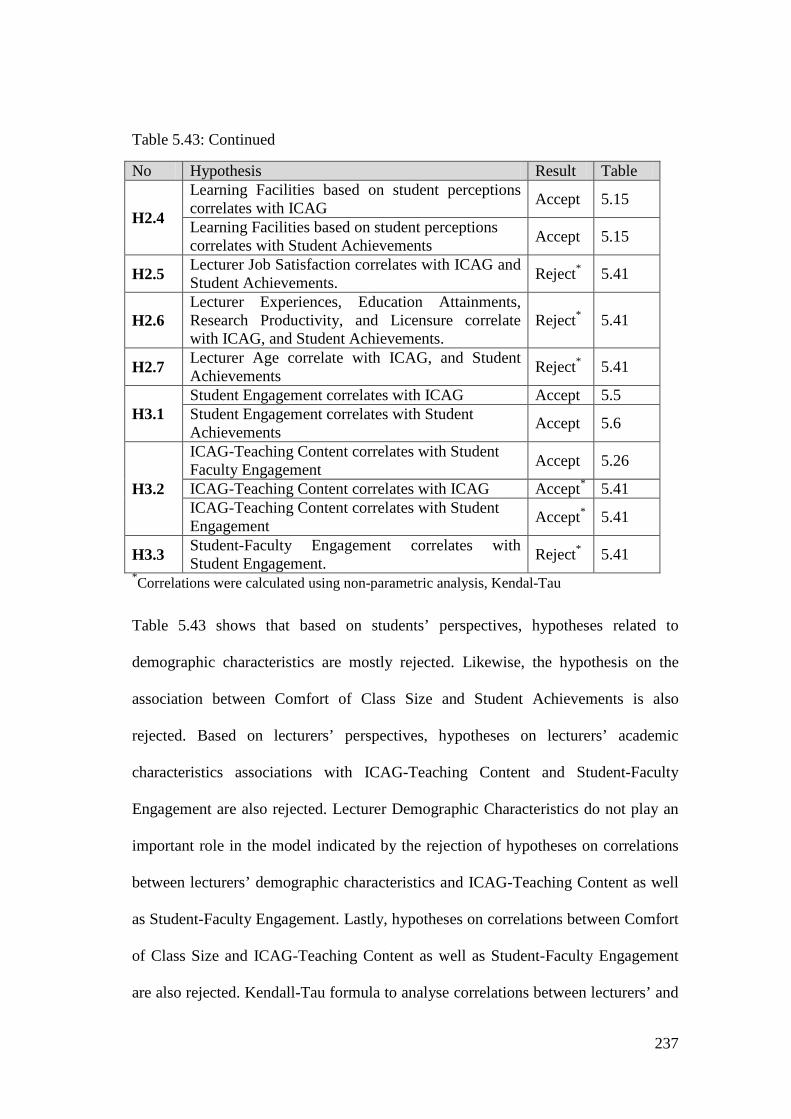
237
Table 5.43: Continued
No Hypothesis Result Table
H2.4
Learning Facilities based on student perceptions correlates with ICAG Accept 5.15
Learning Facilities based on student perceptions correlates with Student Achievements Accept 5.15
H2.5 Lecturer Job Satisfaction correlates with ICAG and Student Achievements. Reject* 5.41
H2.6 Lecturer Experiences, Education Attainments, Research Productivity, and Licensure correlate with ICAG, and Student Achievements.
Reject* 5.41
H2.7 Lecturer Age correlate with ICAG, and Student Achievements Reject* 5.41
H3.1 Student Engagement correlates with ICAG Accept 5.5 Student Engagement correlates with Student Achievements Accept 5.6
H3.2
ICAG-Teaching Content correlates with Student Faculty Engagement Accept 5.26
ICAG-Teaching Content correlates with ICAG Accept* 5.41 ICAG-Teaching Content correlates with Student Engagement Accept* 5.41
H3.3 Student-Faculty Engagement correlates with Student Engagement. Reject* 5.41
*Correlations were calculated using non-parametric analysis, Kendal-Tau Table 5.43 shows that based on students’ perspectives, hypotheses related to
demographic characteristics are mostly rejected. Likewise, the hypothesis on the
association between Comfort of Class Size and Student Achievements is also
rejected. Based on lecturers’ perspectives, hypotheses on lecturers’ academic
characteristics associations with ICAG-Teaching Content and Student-Faculty
Engagement are also rejected. Lecturer Demographic Characteristics do not play an
important role in the model indicated by the rejection of hypotheses on correlations
between lecturers’ demographic characteristics and ICAG-Teaching Content as well
as Student-Faculty Engagement. Lastly, hypotheses on correlations between Comfort
of Class Size and ICAG-Teaching Content as well as Student-Faculty Engagement
are also rejected. Kendall-Tau formula to analyse correlations between lecturers’ and
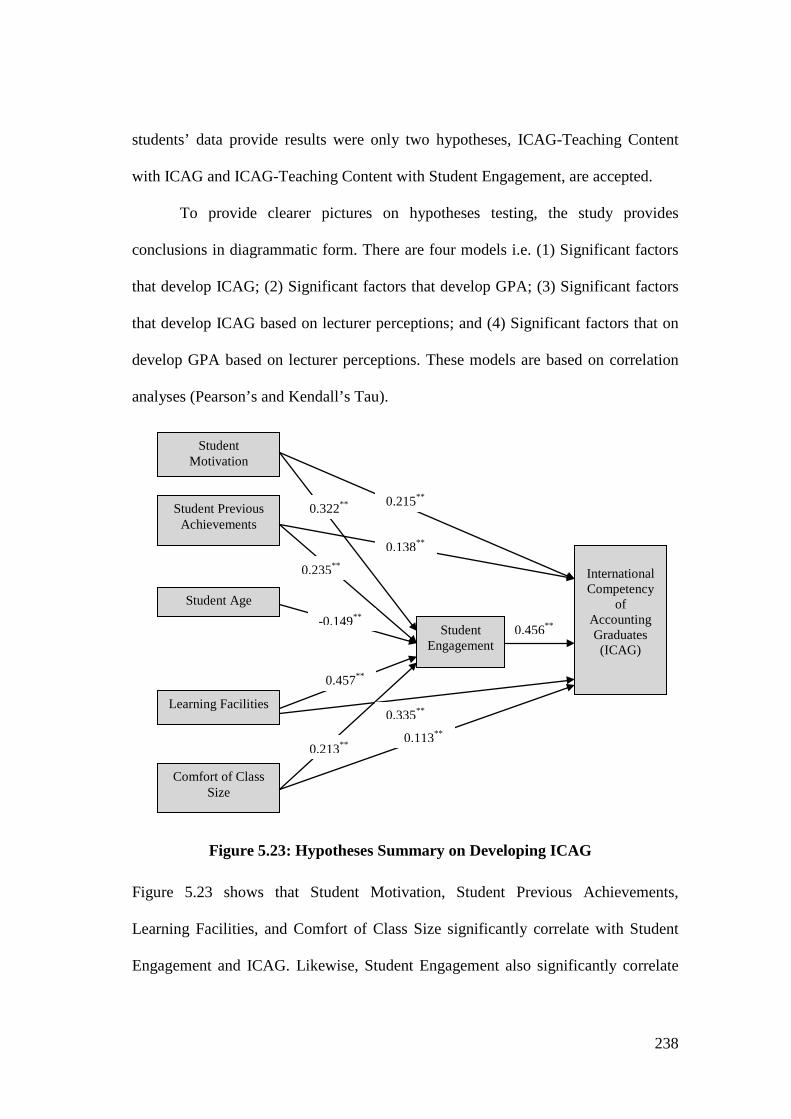
238
students’ data provide results were only two hypotheses, ICAG-Teaching Content
with ICAG and ICAG-Teaching Content with Student Engagement, are accepted.
To provide clearer pictures on hypotheses testing, the study provides
conclusions in diagrammatic form. There are four models i.e. (1) Significant factors
that develop ICAG; (2) Significant factors that develop GPA; (3) Significant factors
that develop ICAG based on lecturer perceptions; and (4) Significant factors that on
develop GPA based on lecturer perceptions. These models are based on correlation
analyses (Pearson’s and Kendall’s Tau).
Figure 5.23 shows that Student Motivation, Student Previous Achievements,
Learning Facilities, and Comfort of Class Size significantly correlate with Student
Engagement and ICAG. Likewise, Student Engagement also significantly correlate
0.456**
Student Motivation
Learning Facilities
Student Previous Achievements
Student Age
Student Engagement
International Competency
of Accounting Graduates (ICAG)
Comfort of Class Size
0.322** 0.215**
-0.149**
0.138**
0.235**
0.213** 0.113**
0.457**
0.335**
Figure 5.23: Hypotheses Summary on Developing ICAG
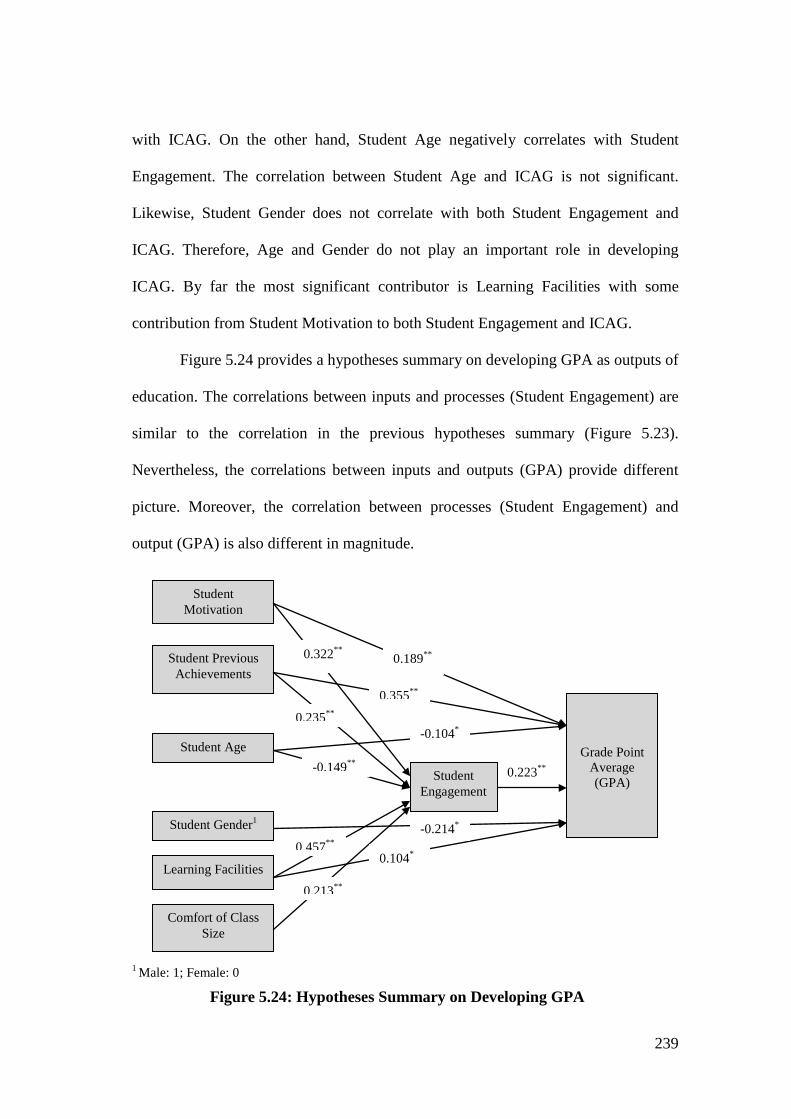
239
with ICAG. On the other hand, Student Age negatively correlates with Student
Engagement. The correlation between Student Age and ICAG is not significant.
Likewise, Student Gender does not correlate with both Student Engagement and
ICAG. Therefore, Age and Gender do not play an important role in developing
ICAG. By far the most significant contributor is Learning Facilities with some
contribution from Student Motivation to both Student Engagement and ICAG.
Figure 5.24 provides a hypotheses summary on developing GPA as outputs of
education. The correlations between inputs and processes (Student Engagement) are
similar to the correlation in the previous hypotheses summary (Figure 5.23).
Nevertheless, the correlations between inputs and outputs (GPA) provide different
picture. Moreover, the correlation between processes (Student Engagement) and
output (GPA) is also different in magnitude.
1 Male: 1; Female: 0
Figure 5.24: Hypotheses Summary on Developing GPA
0.223**
Student Motivation
Learning Facilities
Student Previous Achievements
Student Age
Student Engagement
Grade Point Average (GPA)
Comfort of Class Size
Student Gender1
0.322** 0.189**
-0.214*
-0.149**
-0.104*
0.355**
0.235**
0.213**
0.457**
0.104*
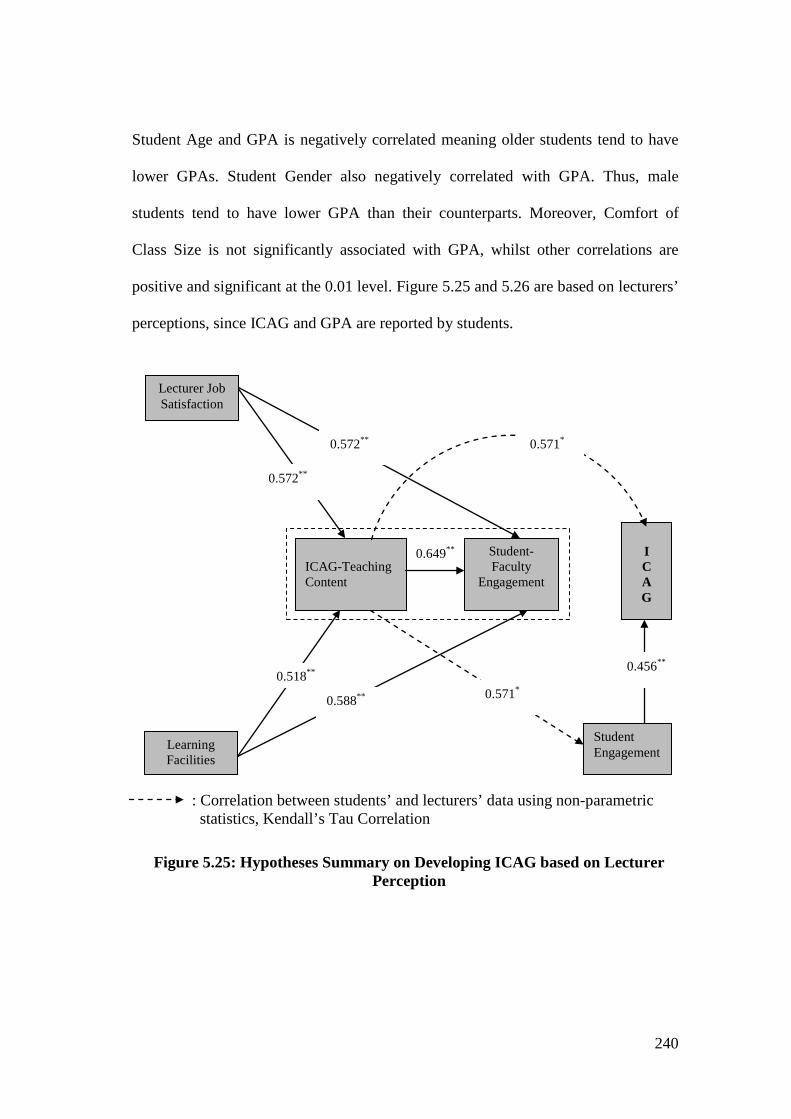
240
Student Age and GPA is negatively correlated meaning older students tend to have
lower GPAs. Student Gender also negatively correlated with GPA. Thus, male
students tend to have lower GPA than their counterparts. Moreover, Comfort of
Class Size is not significantly associated with GPA, whilst other correlations are
positive and significant at the 0.01 level. Figure 5.25 and 5.26 are based on lecturers’
perceptions, since ICAG and GPA are reported by students.
: Correlation between students’ and lecturers’ data using non-parametric
statistics, Kendall’s Tau Correlation
Figure 5.25: Hypotheses Summary on Developing ICAG based on Lecturer Perception
0.649** ICAG-Teaching Content
Student-Faculty
Engagement
Lecturer Job Satisfaction
Learning Facilities
I C A G
0.572**
0.572**
0.588**
0.518**
0.571*
Student Engagement
0.571*
0.456**
241
Figure 5.25 shows that two inputs (Lecturer Job Satisfaction and Learning Facilities)
correlate significantly with processes (ICAG-Teaching Content and Student-Faculty
Engagement). ICAG-Teaching Content (lecturer perception) correlates significantly
with ICAG and Student Engagement (student perception). Student Engagement, in
turn, significantly correlates with ICAG.
Lecturer Job Satisfaction and Learning Facilities (lecturer perception)
significantly correlate with both ICAG-Teaching Content and Student-Faculty
Engagement. These inputs do not correlate with ICAG (student perception).
Likewise, Lecturer Academic Characteristics and Lecturer Demographic
Characteristics are not associated with ICAG-Teaching Content, Student-Faculty
Engagement, and ICAG. Nevertheless, ICAG-Teaching Content significantly
correlates with both Student Engagement and ICAG.
Figure 5.26 shows that the correlations between inputs and processes are
similar to the correlations between inputs and processes in Figure 5.25. Lecturers’
characteristics (psychological, academic, and demographic) do not correlate with
GPAs. Nevertheless, ICAG-Teaching Content significantly correlates with Student
Engagement (student perception). Student Engagement, in turn, correlates
significantly with GPAs.
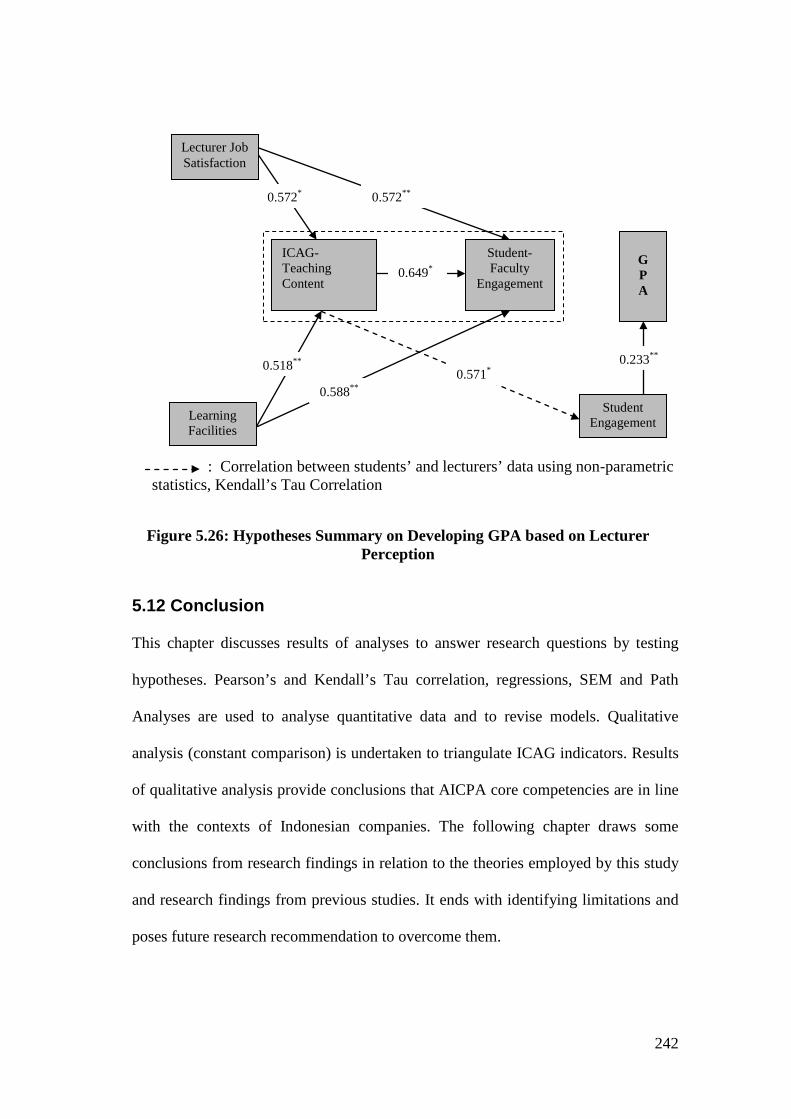
242
: Correlation between students’ and lecturers’ data using non-parametric statistics, Kendall’s Tau Correlation
5.12 Conclusion This chapter discusses results of analyses to answer research questions by testing
hypotheses. Pearson’s and Kendall’s Tau correlation, regressions, SEM and Path
Analyses are used to analyse quantitative data and to revise models. Qualitative
analysis (constant comparison) is undertaken to triangulate ICAG indicators. Results
of qualitative analysis provide conclusions that AICPA core competencies are in line
with the contexts of Indonesian companies. The following chapter draws some
conclusions from research findings in relation to the theories employed by this study
and research findings from previous studies. It ends with identifying limitations and
poses future research recommendation to overcome them.
Figure 5.26: Hypotheses Summary on Developing GPA based on Lecturer Perception
ICAG-Teaching Content
Student-Faculty
Engagement
Lecturer Job Satisfaction
Learning Facilities
G P A
0.572** 0.572*
0.588**
0.518**
0.649*
Student Engagement
0.571* 0.233**
243
CHAPTER 6: DISCUSSION AND CONCLUSIONS 6.1 Introduction 6.5 Practical Implications 6.2 Discussions 6.6 Limitations 6.3 Conclusions 6.7 Direction of Future Research 6.4 Theoretical Implications
6.1 Introduction Besides conducting quantitative analyses of data collected from students and
lecturers, the study also conduct qualitative analysis or data collected from Focus
Group Discussions (FGD). This Chapter discusses both quantitative and qualitative
results presented in Chapter 5 (Analysis and Findings). This chapter begins with
discussions of findings followed by conclusions, theoretical and practical
implications, limitations, and directions of future research.
6.2 Discussions As previously mentioned in Chapter 2, the study employs System Theory and Input-
Environment-Outcome (I-E-O) model as underpinning theories. This section
discusses relationships among all elements of theories i.e. Inputs, Processes/
environment, and Outputs. In addition, this section also discusses qualitative analysis
that emphasises in the applicability of AICPA core competencies in the Indonesian
business context. Therefore, this discussion comprises of six parts: (1) relationships
between educational inputs and educational processes; (2) relationships between
educational inputs and educational outputs; (3) relationships between educational
processes and educational outputs; (4) System Theory and I-E-O model in
accounting education; (5) AICPA core competencies based on alumni’s perception;
and (6) the revised empirical model. Moreover, the discussion of AICPA core
244
competencies based on alumni’s perception is discussed based on qualitative analysis
to triangulate the applicability of AICPA core competencies in the work places.
6.2.1 Educational Inputs and Educational Processes This section summaries some significant relationships between educational inputs
and educational processes measured by Student Engagement and Student-Faculty
Engagement. As previously mentioned, the study identifies some inputs for
educational system i.e. student characteristics (psychological, academic and
demographic characteristics), lecturer characteristics (psychological, academic and
demographic characteristic), International Competency of Accounting Graduate-
Teaching Contents (ICAG-Teaching Content), Comfort of Class Size, and Learning
Facilities.
Student Characteristics Correlation analyses provide results that psychological characteristic in term of
Student Motivation measured by Expectancy Theory correlates significantly with
Student Engagement. Likewise, simple regression also provides results that Student
Motivation significantly affects Student Engagement. In addition, Structural
Equation Modelling (SEM) using single composite indicator and Path Analysis also
provides similar results. These findings are in line with the proposition that interests,
need, and expectation are one input to an educational system (Mizikaci 2006).
Correlation and regression results show moderate coefficients meaning that Student
Motivation measured by Expectancy Theory and Student Engagement are different
concepts. These findings support previous results that Student Motivation impacts on
245
Student Engagement (Heller et al. 2010; Krause 2005; Walker, Greene & Mansell
2006).
Even though the Expectancy Theory questionnaire was originally developed
for measuring employee motivation (Chiang & Jang 2008; Chiang et al. 2008), the
instrument has been shown to be applicable for measuring Student Motivation by
adapting some items. In addition, Expectancy Theory is also employed to measure
Student Motivation to pursue student achievements (Campbell, Baronina & Reider
2003; Geiger & Cooper 1995; Geiger & Cooper 1996; Geiger et al. 1998; Harrel,
Caldwell & Doty 1985; Tsay & Brady 2010), but the study provides an additional
perspective that Expectancy Theory is also useful for measuring Student Motivation
to participate in Student Engagement activities.
The second student characteristic is Previous Achievements that student
earned from previous schoolings. Previous Achievements, measured by average
grades, has a significant correlation with Student Engagement. Regression analysis
also provides results that Previous Achievements affect Student Engagement. In
addition, SEM and Path Analyses also show that Previous Achievements has a
positive and significant contribution to Student Engagement. These findings support
a previous study that pre-college academic success correlates significantly with
Academic Achievements (Agronow 2008). In addition, the study finds that Previous
Achievements in terms of average grades is considered a useful proxy, since
nationally-tested grades (NEM) from previous schoolings has a smaller correlation
with Student Engagement. Likewise, other academic characteristics i.e. type of
previous school, previous major, and group of major, do not associate with Student
Engagement.
246
Age as a students’ demographic characteristic is found to negatively correlate
with Student Engagement. Moreover, regression analysis also provides evidence that
Age has a negative effect on Student Engagement. Regression analysis also provides
the same result. This finding is somewhat different from a previous study. Strayhorn
(2008) found that Age has positive correlations with two dimensions of Student
Engagement i.e. Student-Faculty Interaction and Active Learning. On the other hand,
SEM and Path Analyses do not provide evidence that Age has an effect on Student
Engagement. As a comparison, Age also negatively correlates with Student
Motivation, Previous Achievements, and grades of nationally-tested subjects (NEM).
Simply put, older students are more likely to have lower motivation and lower
previous achievements. This phenomenon could be caused by a condition that
regular accounting students tend to have the same age. This is supported by the facts
that 82% of accounting students have age of 20 to 22 years old making the Kurtosis
coefficient quite high. Negative correlation of Age and Student Engagement and
other input variables may be caused by the condition that younger students may meet
more qualifications as accounting students than older students. In addition, the
study’s samples contained mainly regular26 students making ages of students
homogenous, since the more mature students are not admitted into regular
accounting classes.
In relation to Gender, the study finds that a student’s gender does not
correlate with Student Engagement. Nevertheless, female students tend to have
26 Some universities admit two types of accounting students i.e. regular and non-regular. Regular students are students admitted from fresh High School graduates to become full-time students. These students come to the class in regular working hours or days. Non-regular students are admitted not only from fresh High School graduates, but also students who have already graduated long time before and have jobs. These students come to the class after working hours or during weekend.
247
higher engagement in Active Learning. These findings are somewhat different from
previous findings in the Australian university context (AUSSE 2010a) as well as in
American universities (Kinzie et al. 2007) where Gender has a small correlation with
Student Engagement. The different result may be caused by the proportion of student
by gender in the sample 67% female students and 33% male students.
In summary, Student Motivation and Previous Achievements are two
important inputs for educational system. Despite its correlation magnitude, Age and
Gender does not provide enough power to affect Student Engagement indicated by
insignificant unstandardised estimate in both SEM and Path analyses.
Lecturer Characteristics The study includes a psychological input to measure lecturer motivation by
employing Herzberg’s Motivation Theory to measure Lecturer Job Satisfaction. The
analysis shows that Lecturer Job Satisfaction correlates significantly with Student-
Faculty Engagement. Likewise, regression, SEM, and Path Analysis also provide the
same results. These results are in line with a previous study that Lecturer Job
Satisfaction influence work engagement (Hermsen & Rosser 2008). Even though,
Herzberg’s Motivation Theory was initially employed to measure job satisfaction
among industrial workers (Zhang & Zheng 2009), this study has shown that the
theory is also applicable for measuring job satisfaction of lecturers. Therefore, these
results are in line with previous findings that job satisfaction is applicable to measure
lecturers’ motivation (Ololube 2006; Sudiro 2008; Woods & Weasmer 2004). One
previous study reveals that Lecturer Job Satisfaction enhances collegiality and job
performance (Woods & Weasmer 2004). The finding provides an additional
248
perspective that Lecturer Job Satisfaction also impacts Student-Faculty Engagement,
since previous studies on the relation between Lecturer Job Satisfaction and Student-
Faculty Engagement in developing countries seems to be limited.
The questionnaire for measuring Lecturer Job Satisfaction was initially
developed to measure job satisfaction of a pharmacy faculty in an American
university setting (Conklin & Desselle 2007). The study finds that the adopted and
adapted questionnaire is applicable for measuring job satisfaction among accounting
lecturers in an Indonesian university setting indicated by high factor loadings and
reliabilities of questions. In addition, the dimensions of Lecturer Job Satisfaction also
correlate significantly with all Student-Faculty Engagement dimensions. However,
the study made small adaptations to Lecturer Job Satisfaction questionnaires to
ensure all items are in line with the Indonesian university context. Conceptual model
shows that the association between Lecturer Job Satisfaction and Student-Faculty
Engagement are directly correlated (without any mediating). Nevertheless, empirical
findings show that ICAG-Teaching Content is a mediator between Lecturer Job
Satisfaction and Student-Faculty Engagement. Separate section discusses more
details about this matter.
The study employs Lecturer Academic Characteristics as inputs to an
educational system. The study identifies eight academic characteristics i.e. Work
Experience, Education Attainment, Current Appointment, Lecturer Certification,
Research Productivity, Articles Published, Books Published, and Academic
Productivity. The last characteristic is a combination of Education Attainment,
Current Appointment, Research Productivity, Articles Published, and Books
Published. The study found that none of the above academic characteristics has a
249
significant correlation with Student-Faculty Engagement. These findings are
inconsistent with previous studies that lecturer education attainment have positive
and significant influence on lecturers’ performance in Indonesian universities
(Riduwan 2006; Yusuf 2006). Nevertheless, an insignificant correlation between
lecturer education attainment and Student-Faculty Engagement support previous
study that education attainment does not affect teaching performance of a lecturer
(Verceles & Rivera 2010).
Previous findings show that the impact of licensure or certification on lecturer
performance is significant (Harris & Sass 2009; Wang, Smith & Steve Oliver 2006).
This study shows a different result that Lecturer Certification does not correlate with
Student-Faculty Engagement. Likewise, Current Appointment is also insignificantly
associated with Student-Faculty Engagement. These findings are quite similar to
previous findings that lecturer rank minimally correlates with teaching performance
based on students’ evaluations (Kogan, Schoenfeld-Tacher & Hellyer 2010).
Insignificant correlation between Lecturer Academic Characteristics and
Student-Faculty Engagement may be caused by three factors. First, the correlation
between teaching experience and teaching effectiveness is non-linear (Wang, Smith
& Steve Oliver 2006). This means that over a number of years of teaching
experience, teaching performance declines. This proposition is supported by Kinney
and Smith (1992) who found teaching performance tends to decline when lecturers’
ages reach early forties and the mid-sixties.
Second, insignificant correlation between Lecturer Academic Characteristics
and Student-Faculty Engagement may be caused by lecturers’ perceptions that their
academic characteristics are intended to improve their academic performance rather
250
improve their teaching performance. In other words, lecturers may have perceptions
that teaching and other academic activities are two separate and uncorrelated
activities. This conjecture is supported by findings that almost all correlations among
Lecturer Academic Characteristics variables are positively significant. For example,
correlations of work experience with the rest of Lecturer Academic Characteristics
variables are significant, except Book Published. Likewise, correlations between
Education Attainment and the rest of Lecturer Academic Characteristics variables are
also positively significant, except Book published.
Third, insignificant correlation between Research Productivity and Student-
Faculty Engagement is different from previous findings that Research Productivity
impacts student achievement (De Paola 2009). Topics researched by lecturer may be
the reason behind this insignificant correlation. Most research conducted by lecturers
may focus on theory of accounting that does not aim to improve the teaching and
learning of accounting in universities. Research on accounting education and
classroom action research may provide different impacts on improving teaching-
learning processes of accounting at a university.
Age as a demographic characteristic does not correlate with Student-Faculty
Engagement. Despite a small magnitude, Age correlates with Active Learning. This
finding is different from previous finding that Age of lecturer has an association with
teaching performance (Kinney & Smith 1992). On the other hand, another finding
shows that Age does not correlate with job performance (Kemper 2010). Since Age
is not associated with Student-Faculty Engagement, this variable is not included in
SEM and Path Analyses to revise models.
251
The study reveals that Gender and Student-Faculty Engagement are not
associated. In other words, female and male lecturers have the same Student-Faculty
Engagement. Previous research concludes that gender interactions between teachers
and students impact student outcomes (Dee 2007). This study’s finding is in line with
previous studies that Gender does not impact a lecturer’s performance (Buck &
Tiene 1989; Verceles & Rivera 2010). Nevertheless, the proportion of male (54%)
and female (46%) lecturers may cause this insignificant correlation between gender
and Student-Faculty Engagement.
In summary, Lecturer Job Satisfaction is the only lecturer characteristic that
has a significant association with Student-Faculty Engagement. Academic and
demographic characteristics do not correlate with Student-Faculty Engagement.
Therefore, only Lecturer Job Satisfaction is included in the revised model.
ICAG-Teaching Content ICAG-Teaching Content measures how much lecturers include ICAG in their
teaching-learning process. The study found that ICAG-Teaching Content and
Student-Faculty Engagement are closely associated. ICAG-Teaching Content, as a
proxy for curricula or subject matter, correlates with Student-Faculty Engagement as
a process. This finding is in line with the proposition contended by Nearon (2002)
that subject matter is an important input to an educational system. In this case,
ICAG-Teaching Content is considered as a set of courses (Toombs & Tierney 1993).
However, competency contents are not only contained in courses offered, but also
contained in the process of teaching and learning, since curricula also comprise
252
instruction element (Frey 1998). Moreover, Mizikaci (2006) classified content and
delivery as transforming process.
Previous studies find that lecturers should use many strategies to build
student accounting competency such as using of case studies (Weil, Oyelere &
Rainsbury 2004), integrating content learnt with real world (Jayaprakash 2005),
using multiple teaching methods (Bonner 1999), and using mental reflection,
physical action, and skills (Azemikhah 2006). In addition, Tigelaar et al. (2004)
validate framework for teaching competencies that emphasise a lecturer’s
characteristics. The above findings show that competency contents are not only listed
in curricula, but also contained in the process of teaching and learning. On the other
hand, development of accounting curricula has to follow government regulations
(Depdiknas 2000) and previous research finds that accounting curricula used by
universities are mostly similar (Hamzah 2009). Based on the above findings, ICAG-
Teaching Content is more likely depend on lecturers’ efforts; therefore this construct
is classified as a transforming process rather than an input. In other words, ICAG-
Teaching Content could function as a mediating variable between lecturer
characteristics as inputs and Student-Faculty Engagement.
The study finds that correlations between Lecturer Job Satisfaction and
ICAG-Teaching Content are significant with moderate correlation coefficient.
Regression analysis also shows that Lecturer Job Satisfaction impacts ICAG-
Teaching Content. Sobel and Aroian tests (Preacher & Hayes 2004; Preacher &
Leonardelli 2010) also show that ICAG-Teaching Content is a mediator between
Lecturer Job Satisfaction and Student-Faculty Engagement. Nevertheless,
correlations between Lecturers’ Academic Characteristics and ICAG-Teaching
253
Content are statistically insignificant. Likewise, demographic characteristics (Age
and Gender) and ICAG-Teaching Content are also insignificantly correlated.
Comfort of Class Size The study collects the data on Comfort of Class Size based on student and lecturer
perceptions. The study finds that based on students’ perceptions, Comfort of Class
Size correlates positively with Student Engagement. Regression analysis also finds
that Comfort of Class Size impacts Student Engagement significantly. These findings
are in line with the proposition contended by Cotten and Wilson (2006) that a smaller
class size creates substantive engagement between students and teacher. SEM
analysis using single composite indicator show that Comfort of Class Size does not
significantly affect Student Engagement. On the other hand, Path Analysis shows a
different picture that Comfort of Class Size significantly affects Student
Engagement. The use of single composite indicator for both Comfort of Class Size
and Student Engagement may cause these different results.
Based on lecturers’ perceptions, Comfort of Class Size does not correlate
with both Student-Faculty Engagement and ICAG-Teaching Content. This
insignificant correlation may be caused by the condition that the class size in
Indonesian universities is considered reasonable. Another possible reason is that
lecturers do not take class size into account, since they still can employ teaching
methods that are commonly used in small classes (Exeter et al. 2010).
Learning Facilities Based on students’ perceptions, Learning Facilities and dimensions of Student
Engagement as well as overall Student Engagement are closely correlated.
254
Regression analysis also finds that Learning Facilities impact Student Engagement
significantly. This result supports previous finding that academic support facilities
could be major drivers of educational processes (Dolan, Jung Jr & Schmidt 1985).
More specifically, this finding also supports propositions that a library could increase
student engagement (Kuh & Gonyea 2003) and internet access and computers
improve student engagement (Chen, Lambert & Guidry 2010; Heiberger & Harper
2008; Khan 2009). SEM and Path Analyses provide results that Learning Facilities is
an important input to an educational system based on students’ perceptions.
Learning Facilities based on lecturers’ perspectives closely correlates with
Student-Faculty Engagement. Regression analysis also shows that Learning Facilities
has a significant impact on Comfort of Class Size. This finding also support previous
studies, that Learning Facilities enhance quality of students and lecturers (Dolan,
Jung Jr & Schmidt 1985), the use of appropriate learning facilities improves the
productivity of teaching and learning (Boyce cited in Herring III & Bryans 2001), the
use of technology as a learning facility leads to more intensive engagement for both
lecturers and students (Chen, Lambert & Guidry 2010; Heiberger & Harper 2008).
Based on SEM and Path Analysis, Learning Facilities significantly impacts Student-
Faculty Engagement. Therefore, Learning Facilities are important inputs based on
students’ and lecturers’ perspectives.
The study finds that correlations between Learning Facilities with ICAG-
Teaching Content are significant and considered moderate in magnitude. Further
analysis using simple regression also shows that Learning Facilities significantly
impact ICAG-Teaching Content. SEM and Path Analysis also reveal that Learning
Facilities significantly affect ICAG-Teaching Content. In other words, lecturers take
255
into account of the availability of learning facilities in including accounting
competencies in their teaching and learning process. This is plausible since teaching
accounting competencies should use mental reflection, physical action, and use of
skills (Azemikhah 2006), integrate teaching contents with real world experience by
using simulation case studies, and group work (Jayaprakash 2005), as well as employ
multiple teaching methods (Bonner 1999).
The conceptual model (Figure 3.2) shows that Lecturer Job Satisfaction and
Learning Facilities are exogenous constructs. Therefore, the study draws a
covariance line between these constructs. Analyses show that correlations between
Learning Facilities and Lecturer Job Satisfaction are positive and considered
moderate. However, Grewal et al. (2004) contended that the correlation is
substantial.
In view of the above findings, Lecturer Job Satisfaction developed by
Conklin and Desselle (2007) comprises six dimensions i.e. Resource for Scholarship,
Institutional Support and Reward, Requirements for Promotion and Tenure,
Availability of a Graduate Program, Collegiality, and Teaching Environment is fully
applicable to the Indonesian context. On the other hand, learning facility items are
designed to collect data on the availability of facilities for teaching and research
activities. Teaching environment and learning facilities are closely correlated.
Therefore, the availability of Learning Facilities may significantly affect Lecturer
Job Satisfaction.
Further analysis using SEM and Path Analysis show that Learning Facilities
significantly impacts Lecturer Job Satisfaction, while Lecturer Job Satisfaction is not
exogenous, but endogenous that influenced by Learning Facilities. On the other
256
hand, Learning Facilities remains an exogenous construct. Therefore, the study
modifies the conceptual model by treating Lecturer Job Satisfaction as an
endogenous.
6.2.2 Educational inputs and educational outputs The previous section describes relationships between inputs and Student Engagement
as a proxy for process or environment. This section presents relationships between
inputs and ICAG and GPA as proxies for outputs. As previously mentioned, this
study employs System Theory and Input-Environment-Outcome (I-E-O) model as
underpinning theories. I-E-O model contends that relationship between environment
and student outcomes cannot be understood without taking into account student
inputs (Astin 1993a).
Student Characteristics Correlations between Student Motivation measured by Expectancy Theory and
accounting competency (ICAG) are significantly related. Regression analysis also
provides the same result that Expectancy Theory impacts ICAG. Likewise,
correlations between Student Motivation and GPA are also positively associated.
Regression analysis provides the same result, Student Motivation affects GPA. The
above findings are in line with previous studies (Geiger & Cooper 1996; Harrel,
Caldwell & Doty 1985; Yining & Hoshower 1998).
SEM and Path Analysis provide different results, that Student Motivation
does not affect ICAG. However, Student Motivation significantly impact students’
GPAs. Insignificant influence of Expectancy Theory on ICAG may be caused by
slight multicolliniearity. Even though, correlations between Student Motivation and
257
other exogenous constructs are considered small or less than 0.4 (Grewal, Cote &
Baumgartner 2004), but these correlation may affect the influence of Student
Motivation on ICAG. This reason is quite plausible, since correlation as well
regression analyses provide results that Expectancy Theory has a positive impact on
ICAG.
Previous Achievements, measured by grades average from previous
schoolings, correlate significantly with ICAG. Regression analysis also provides
results that Previous Achievements influence ICAG. Correlation and regression
analyses provide results that Previous Achievements have a significant relationship
with GPA of current studies. Likewise, SEM and Path Analysis found that Previous
Achievements significantly impact both ICAG and GPA. The above results support
previous studies (Astin 1971, 1993a; Credé & Kuncel 2008; Dickson & Fleet 2000;
Duff 2004). Grades average of previous studies is a predictor of Student
Engagement, ICAG, and GPA. On the other hand, grades of Nationally-tested
Subject Matters (NEM) significantly correlate with GPA, but insignificantly
correlate with ICAG.
Students’ exposure to accounting in previous school education does not
correlate with GPA. This finding is different from previous study that students who
studied accounting previously tend to have higher GPAs in the first year (Rohde &
Kavanagh 1996). Conversely, students who graduated from a Natural Sciences major
group, but do not have any accounting exposure during their high school attendance,
tend to have higher GPA than students from Social Studies group, who have
accounting exposure in high school. For students who graduated from Natural
Sciences major, the first year could be adaptation period for them to study
258
accounting making students graduating from Social Studies group (who have
accounting exposures in high schools) have better GPA. In the following years,
students graduated from Sciences major tend to be more superior academically.
Stronger mathematical background may cause students from Natural Sciences to
have higher overall GPAs.
Age as a demographic characteristic does not correlate with ICAG. On the
other hand, this variable correlates negatively with GPA, even though the correlation
is small in magnitude. This result is in line with previous findings (Astin 1971; Duff
2004) that gender has a small association with student achievements. More
specifically, Strayhorn (2008) also found that Age correlates negatively with learning
outcomes.
Gender correlates negatively with GPA, but insignificantly correlates with
ICAG. The study found that female students tend to have higher GPAs than their
counterparts. This finding supports previous results that female students are more
likely to have higher GPAs than male students (AUSSE 2010a; Strayhorn 2008).
Self-perceived competencies to measure ICAG may cause an insignificant
correlation between Gender and ICAG. Self-assessment on ICAG could be affected
by negative or apathetic attitudes (Kavanagh & Drennan 2008). Notwithstanding,
this self-assessment of competencies is still considered effective (Hansson 2001).
Teacher Characteristics The study correlates some lecturers’ with students’ variables by using means of each
variable. Analysing data using non-parametric statistics is considered having flaws
(King cited in Umbach & Wawrzynski 2005), since data are masked. Lecturer Job
259
Satisfaction, Lecturer Academic Characteristics, and Student-Faculty Engagement do
not correlate significantly with ICAG, Student Engagement, and GPA. Despite
analysis flaw, these findings support previous studies conducted by Hoffmann and
Oreopoulos (2009a) that commonly observed lecturer traits, such as rank, status, and
salary, virtually have no effect on student achievements. Analysis technique and
number of group (university) may cause insignificant correlation. To correlate
nesting data (lecturers’ and students’ data) the study should use Hierarchical Linear
Modelling (HLM) with at least 30 groups (Porter 2005). Nevertheless, ICAG-
Teaching Content correlates significantly with ICAG and Student Engagement.
Comfort of Class Size The study uses student perception about Comfort of Class Size, instead of the
number of students in every class. The correlation between Comfort of Class Size
and ICAG is inconsistent. Despite its magnitude, the correlation between Comfort of
Class Size with ICAG is positive and significant. On the other hand, SEM and Path
Analysis provide result that Comfort of Class Size does not affect ICAG. Moreover,
the correlation between Comfort of Class Size and GPA is insignificant. Nonetheless,
SEM and Path Analysis provide a result that Comfort of Class Size negatively
impacts GPA.
Correlation between Comfort of Class Size and ICAG are in line with
previous research results that class size correlates with student achievements
(Johnson 2010; Kokkelenberg, Dillon & Christy 2008; Konstantopoulos 2007;
Murdoch & Guy 2002). Moreover, the following possibilities may cause inconsistent
relationships between Comfort of Class Size and GPA. The first possibility is model
260
error, indicated by the shrinking impact of Comfort of Class Size on Student
Engagement and at the same time negative influence of Comfort of Class Size on
GPA is strengthening, every time the study adds one more exogenous variable. The
second possible reason is that class size in higher education has a negative
logarithmic relationship with student achievements (Dillon & Kokkelenberg 2002).
Lastly, universities included in this study have different grading system making GPA
earned by students not nationally-standardised.
Learning Facilities Based on student perceptions, Learning Facilities correlate significantly with ICAG
and GPA. Regression analysis also finds that Learning Facilities have a significant
impact on both ICAG and GPA. Nonetheless, the influence of Learning Facilities on
GPA is smaller than the impact of Learning Facilities on ICAG. Moreover, SEM and
Path Analyses also provide similar results. These findings support previous studies
that learning facilities improve the productivity of teaching and learning (Boyce cited
in Herring III & Bryans 2001). Learning facilities also improve students’
achievements (Chen, Lambert & Guidry 2010; Mohamed & Lashine 2003), critical
thinking (Springer & Borthick 2004), creativity to find managerial solutions (Wynder
2004), and improves students’ attitudes as well as perceptions (Jack, Smith & Clay.
Jr 1986). The finding is also in line with a previous study that good learning facilities
may not guarantee good outputs from an education system, but poor facilities
certainly affect the quality of outputs from an education system (Mohamed &
Lashine 2003). In summary, Learning Facilities are important inputs to improve the
quality of outputs in terms of ICAG and GPA.
261
The impacts of Learning Facilities on Student Engagement and Student-
Faculty Engagement, as proxies for educational process have been discussed in this
section. The following section discusses about relationships between Student
Engagement and ICAG, as well as GPA.
6.2.3 Educational Processes and Educational Outputs As previously mentioned, the study uses Student Engagement as a proxy for
educational processes in universities. In relation to underpinning theories, System
Theory uses the term “transforming process” (Slack, Chambers & Johnston 2004)
while Input-Environment-Outcome (I-E-O) model uses “environments” (Astin
1993a). The following sections discuss relationships between Student Engagement
and educational outputs in terms of ICAG and GPA. Briefly, Student Engagement
has a positive impact on educational outputs in terms of ICAG and GPA.
These findings support some theories i.e. students learn by becoming
involved (Astin 1987, 1999), academic and social integration influence outcomes
(Pascarella & Terenzini 1991), students’ interactions with agents of socialisation
impact student learning and interaction (Tinto 1993), and seven principles for good
practice in undergraduate education (Chickering & Gamson 1987, 1999). In addition,
findings are also in line with a previous study that Student Engagement is a
mediating construct that influences student outcomes (Alvermann 2001) and Student
Engagement can be a good proxy for overall education quality (UVic 2006).
As previously discussed in Chapter 2, the study employs Student Engagement
comprising of five dimensions i.e. Academic Challenge, Active Learning, Student-
Staff Interaction, Enriching Educational Experience, Supportive Learning
262
Environment (AUSSE 2010b; Kuh 2006). Likewise, the study also uses ICAG with
three groups of competencies i.e. Functional, Personal, and Broad-business
Perspective Competencies (Mula 2007; Wolcot, S. K. 2006). Academic Challenge
correlates significantly with Functional Competency, Personal Competency, and
Broad-business Perspective Competency. Likewise, Regression analysis also
provides the same results that Academic Challenge significantly impacts all ICAG
dimensions. In addition, correlation and regression analyses provide results that
Academic Challenge positively influences GPA. These findings show that academic
challenge relates to student learning (Kuh 2009), since students will be motivated if
they get appropriate academic challenges (Chickering & Gamson 1987, 1999). In
addition, Academic Challenge is an important dimension, since it impacts ICAG as
well as GPA.
Active Learning significantly correlates with all ICAG dimensions. On the
other hand, regression analyses provide different results that Active Learning impacts
only Personal Competency. In addition, correlation and regression analysis concludes
that Active Learning positively influences GPA. These findings are in line with the
proposition that students should learn actively by talking, writing, relating to past
experience, and applying to their daily lives what they have already learnt
(Chickering & Gamson 1987, 1999).
Insignificant influence of Active Learning on Functional Competency and
Broad-business Perspective Competency may be caused by some factors. First, some
measures of Active Learning also relate to cooperative learning. Significant impacts
of Active Learning on Personal Competency are very much in line with previous
finding that cooperative learning influence accounting students’ interpersonal and
263
communication skills (Ballantine & McCourt Larres 2009). In other words, Active
Learning is suitable for enhancing Personal Competency, but Active Learning may
have limited use for building Functional Competency and Broad-business
Perspective Competency. Second, cooperative learning may not provide automatic
results unless students know how to help each other (Chan 2010). Lastly, regression
models have Variance Inflation Factor (VIF) less than 2; this slight multicolliniearity
may lessen the influence of Active Learning on Functional Competency and Broad-
business Perspective Competency, since Active Learning correlates significantly
with Academic Challenge and Student-Staff Interaction.
Correlation analysis shows that all Students-Staff Interaction measures
correlate with all ICAG dimensions. Nevertheless, regression analysis provides
results that Student-Staff Interaction only significantly impacts Broad-business
Perspective Competency. The influence of Student-Staff Interaction on GPA is also
insignificant. It is found that Student-Staff Interaction is an important dimension for
building Broad-business Perspective Competency. This finding support previous
research that relationships between students and lecturers relate to psychological
outcomes (Komarraju, Musulkin & Bhattacharya 2010). Interaction with agents of
socialisation such as faculty, impacts student learning and cognitive development
(Tinto 1993), since teacher behaviour affects students’ scholastic competencies
(Woodside, Wong & Wiest 1999). Insignificant effect of Student-Staff Interaction on
GPA is different from the result of a previous study that the interaction between
students and lecturers is more likely to affect students’ academic achievements
(Ullah & Wilson 2007). Nevertheless, students may not know the benefits of
interacting with lecturers (Cotten & Wilson 2006).
264
Insignificant influence of Student-Staff Interaction on Functional
Competency and Personal Competency may be caused by a number of reasons. First,
correlations between Student-Staff Interaction and Functional Competency as well as
Personal Competency are small in magnitude. The effects of Student-Staff
Interaction on Personal Competency, Broad-business Perspective Competency, and
GPA weaken due to slight multicollinearity, since the correlation between Student-
Staff Interaction and Active Learning is considered moderate despite very low
Variance Inflation Factor (VIF) coefficient. Second, insignificant effects of Student-
Staff Interaction on Personal Competency, Broad-business Perspective Competency,
and GPA may be caused by the condition that students are not aware of benefits to
engage with lecturers (Astin 1987, 1999; Cotten & Wilson 2006). A previous study
also reveals that interactions between students and teacher influence student
achievements (Ullah & Wilson 2007). Therefore, lecturers should take more
initiatives to involve students in student engagement activities (Rendon 2002).
Moreover, lecturers’, counsellors’, and personnel workers’ attention should be given
to passive, reticent, or unprepared students (Astin 1987). Third, student to lecturer
ratio in sampled universities is still considered high, one lecturer to 40 students
(DIKTI 2009), making productive interaction between students and lecturers
difficult. At the same time, lecturers also should conduct research, perform
community service, and fulfill non-academic activities (DIKTI 2010). Therefore,
lecturers may have limited time to interact intensively with all students.
Despite their small magnitude, correlations between Enriching Education
Experience with all dimensions of ICAG are positively significant. Nevertheless,
regression analyses show that Enriching Education Experience does not significantly
265
affect Functional Competency, Personal Competency, and Broad-business
Perspective Competency. Small correlations may cause an insignificant impact of
Enriching Education Experience on ICAG dimensions. Moreover, Variance Inflation
Factor (VIF) and correlations between Enriching Education Experience with other
Student Engagement dimensions are considered small. Correlation analysis also
shows that Enriching Education Experience does not correlate with GPA. On the
other hand, multiple regression analysis provides a different picture; Enriching
Education Experience negatively impacts GPA. The more students engage in
Enriching Education Experience activities, the lower their GPA. These findings are
somewhat in line with previous studies about insignificant impacts of extracurricular
activities on student achievement (Baker 2008; Hunt 2005).
The above findings (small correlations of Enriching Education Experience
with ICAG dimensions and negative impact of this dimension on GPA) do not mean
that Enriching Education Experience is not an important dimension in university
education. Enriching Education Experience may be important to improve other
university outcomes such as employment (Gordon, Ludlum & Hoey 2008), critical
thinking (Carini, Kuh & Klein 2006), personal/social learning, communication and
social skills (Hardern 1995; Strayhorn 2008). Moreover, students participating in a
certain extracurricular activities are more likely to have both negative and positive
learning outcomes (Astin 1987, 1999).
Supportive Learning Environment correlates significantly with all ICAG
dimensions (Functional Competency, Personal Competency, and Broad-business
Perspective Competency). Likewise, regression analyses provide the same results
that Supportive Learning Environment significantly influences all dimensions of
266
ICAG. These findings are in line with a proposition that a supportive learning
environment leads to students’ satisfaction, commitment, and success (Kuh 2009). In
other words, this dimension is considered important, since it can affect all ICAG
dimensions.
Even though, the correlation between Supportive Learning Environment and
GPA is significant, its magnitude is considerably minimal. This finding supports a
previous study that the relationship between Supportive Learning Environment and
GPA is significant (Carini, Kuh & Klein 2006). Nonetheless, regression analysis
does not provide enough evidence that Supportive Learning Environment
significantly impact GPA. This finding is different from a previous study that
Supportive Learning Environment influences average overall grades in Australian
universities (AUSSE 2010a). The insignificant result may not be caused by the
regression model, since Variance Inflation Factor (VIF), Normal P-P Plot, and
Homoscedasticity show a good fit. Different grading systems employed by sampled
universities may cause the insignificant influence of Supportive Learning
Environment on GPA.
6.2.4 System Theory and I-E-O Model in Accounting Education The study employs System Theory (Bertalanffy 1968) applied to education sector
(Cromwell & Scileppi 1995; Deming 1995; Johnson 1984; Mizikaci 2006) consisting
of three elements i.e. input, process, and output (Becket & Brookes 2006; Bushnell
1990; Heylighen 1998; Nearon 2002). Moreover, the study also employs I-E-O
model posed by Astin (1993a) consisting three elements i.e. Input, Environment, and
Output (I-E-O).
267
Previous sections discuss relationships among inputs, processes/
environments, and outputs. The discussions are distributed over three parts i.e.
relationships between inputs and processes/environments, relationships between
inputs and outputs, and relationships between processes/environment and outputs. In
relation to this, the study uses Input-Process-Output (I-P-O) terms.
This section discusses relationships among inputs, processes/environment,
and output at the same time based on Input-Process-Output (I-P-O) (Slack, Chambers
& Johnston 2004) and Input-Environment-Outcome (I-E-O) (Astin 1993a)
frameworks. Regression analyses show that educational inputs i.e. Student
Motivation, Previous Achievements, Age, Comfort of Class Size, and Learning
Facilities influence Student Engagement. Student Engagement, in turn, also
significantly affects ICAG. Likewise, these inputs also significantly influence output
(ICAG). In turn, Student Engagement also significantly affects ICAG. In addition,
mediation tests using Sobel and Aroian tests (Preacher & Hayes 2004; Preacher &
Leonardelli 2010) show that Student Engagement is a mediating construct between
the above inputs and ICAG. These findings support a previous study conducted by
Kelly (1996) on the use of I-E-O model. The study provides evidences that System
Theory (Bertalanffy 1968; Slack, Chambers & Johnston 2004) and the I-E-O model
(Astin 1993a) are applicable to building ICAG in the Indonesian university setting.
The study also analyses relationships among inputs, Student Engagement, and
output (GPA). Regression analyses show that Student Motivation, Previous
Achievements, Age, and Learning Facilities significantly impact Student
Engagement. The above inputs also affect educational output in term of GPA.
Student Engagement, in turn, influences GPA. Nevertheless, the impact of Age on
268
Student Engagement and GPA are negative. In this case, Sobel and Aroian tests are
inappropriate for testing mediation effects (Preacher & Hayes 2004; Preacher &
Leonardelli 2010). These findings show that relationships between aforementioned
inputs (Student Motivation, Previous Achievements, Age, and Learning Facilities)
and Student Engagement and GPA are in line with System Theory (Bertalanffy 1968;
Slack, Chambers & Johnston 2004) and I-E-O model (Astin 1993a). The study does
not have enough evidence to support relationships between Comfort of Class Size
and Student Engagement, as well as GPA being in line with System Theory and I-E-
O model. Nevertheless, the study concludes that, System Theory and I-E-O model
are applicable for improving student achievements measured by GPA.
Previous discussions are based on regression analyses to identify the impacts
of certain inputs on processes and outputs. To find a fit model that describe
influences of some inputs on Student Engagement and outputs (ICAG and GPA)
simultaneously, the study employs SEM using single composite indicator and Path
Analysis. SEM shows that three inputs Student Motivation, Learning Facilities, and
Previous Achievements impact Student Engagement. In turn, Student Engagement
also significantly impacts ICAG. Nevertheless, only Learning Facilities directly
influences ICAG. Other inputs i.e. Student Motivation and Previous Achievement do
not directly affect ICAG. In comparison, Path Analysis provides almost similar
results. In this model Comfort of Class Size significantly influences Student
Engagement. The above results are partially in line with I-E-O model (Astin 1993a),
since the model shows only Learning Facilities have a direct impact on ICAG, while
other inputs significantly influences ICAG. Previous studies using the I-E-O
framework (Norwani 2005; Thurmond, Wambach & Connors 2002) found that three
269
relationships i.e. input and environment, input and outputs, and environment and
output were not all significantly established. This study shows that System Theory
(Input-Process-Output) framework (Bertalanffy 1968; Slack, Chambers & Johnston
2004) is more conformable to building accounting competency. This finding supports
previous studies on the use of the ST framework (Mizikaci 2006; Nearon 2002;
Owlia & Aspinwall 1996).
SEM using single composite indicator analysis is also used to identify
relationships among inputs, processes, and outputs (GPA). The analysis shows that
Student Motivation, Learning Facilities, and Previous Achievements influence
Student Engagement. At the same time, Student Motivation and Previous
Achievements also impact GPA. Lastly, Student Engagement significantly affects
GPA. Comfort of Class Size does not affect Student Engagement, but it negatively
influences GPA. In comparison, Path Analysis shows that Student Motivation,
Comfort of Class Size, Learning Facilities, and Previous Achievements impact
Student Engagement. At the same time, Student Motivation, Comfort of Class Size,
and Previous Achievements also influence GPA. Student Engagement significantly
influences GPA. In addition, Learning Facilities do not impact GPA. Despite
insignificant correlation between Comfort of Class Size and GPA, Path Analysis
shows that the impact of Comfort of Class Size on GPA is negative and significant.
Based on the above results, System Theory (Bertalanffy 1968; Mizikaci 2006;
Nearon 2002) is considered to be an applicable framework for improving a student’s
GPA. In comparison, I-E-O model (Astin 1993a) is partially applicable, since only
Student Motivation and Previous Achievements have direct effects on GPA.
270
In summary, based on student perceptions, System Theory is more useful to
improve students’ accounting competency (ICAG) and students’ achievements
(GPA), than the I-E-O model. The reason is that I-E-O requires significant
relationships between input and output. When this study uses correlation and
regression to identify relationships among a certain input, and output, I-E-O model is
suitable. On the other hand, when this study uses SEM or Path Analysis to identify
relationships among many inputs, processes/environment, and outputs
simultaneously, the power of I-E-O model wanes and System Theory becomes more
appropriate.
The above discussion of System Theory and I-E-O model in accounting
education focuses on student perspectives. The application of System Theory and I-
E-O model based on lecturer perspectives are quite different. Based on regression
analyses, Learning Facilities and Lecturer Job Satisfaction are important inputs, since
they have significant impact on Student-Faculty Engagement. In addition, the study
found the role of ICAG-Teaching Content in the model based on lecturer perspective.
SEM and Path analyses show that Learning Facilities impact Lecturer Job
Satisfaction and ICAG-Teaching Content. At the same time, Lecturer Job
Satisfaction and ICAG-Teaching Content influence Student-Faculty Engagement.
These findings are in line with a previous study that Lecturer Job Satisfaction is a
mediator (Conklin & Desselle 2007).
ICAG-Teaching Content is considered a process or environment element,
rather than an input, since the inclusion of accounting competencies is in the process
of teaching and learning by using mental reflection, physical action, and skills
(Azemikhah 2006), cooperative learning, contextual learning, and e-portfolio
271
learning (Wu 2008), interactive case studies, simulations and games, group work
(Jayaprakash 2005), and multiple teaching methods (Bonner 1999). In other words,
competency contents are embedded in courses (Hancock et al. 2009b). The study
finds that ICAG-Teaching Content is impacted by both Learning Facilities and
Lecturer Job Satisfaction. ICAG-Teaching Content, in turn, influences Student-
Faculty Engagement. In other words, ICAG-Teaching Content is considered a
mediator. Mediating-effect tests also provide results that ICAG-Teaching Content
mediates Learning Facilities and Lecturer Job Satisfaction with Student-Faculty
Engagement.
6.2.5 AICPA Core Competencies Based on Alumni’s Perceptions As has been noted, the purpose of using a qualitative approach by employing Focus
Group Discussion (FGD) is mainly to triangulate the applicability of AICPA core
competencies in work places based on alumni perceptions. This section discusses
three dimensions of AICPA core competencies i.e. Functional Competency, Personal
Competency, and Broad-business Perspective Competency.
Functional Competencies consisting of six indicators i.e. Decision Modelling,
Risk Analysis, Measurement, Reporting, Research, and Leveraging Technology
(Mula 2007; Wolcot, S. K. 2006), are closely related to working requirements at
alumni’s companies. These qualitative and quantitative findings are closely related.
Based on lecturers’ and students’ perceptions, accounting programs have already
equipped students with these competencies. Nevertheless, alumni who work in small
and medium sized or new companies need an additional competency, accounting
272
system. Previous study also shows that alumni who work in small companies need
more technical competencies (Hancock et al. 2009a).
Competencies required by alumni to work in an Indonesian company setting
are in line with Australian employers’ expectation on graduate competencies
(Kavanagh & Drennan 2008), seven competencies that graduates should posses
(Mohamed & Lashine 2003), business employability skills (BIHECC 2007),
technical and non-technical competencies (Hancock et al. 2009a), and competencies
of management professionals in Indonesia (Irianto 2010). However, alumni
perceived that most functional competencies are developed significantly on the job.
This phenomenon was also found by previous studies that university accounting
programmes are not developing ‘essential’ non-technical and professional skills and
attributes (Irianto 2010; Kavanagh & Drennan 2008).
Bringing accounting education closer to a real-world environment such as
more use of an internship course, balancing theories and practices, and implementing
better field trip management are suggested by alumni to improve graduates’
functional competency. Basically these findings support previous studies that
accounting education should integrate content learnt with real-world experience
(Jayaprakash 2005) and the teaching-learning process should employ mental
reflection, physical action, and skills (Azemikhah 2006).
Alumni consider personal competencies are important, indicated by all
personal competency indicators being rated as applicable in alumni’s work places.
This qualitative conclusion is supported by quantitative data based on lecturers’ and
students’ perceptions. Both students and lecturers report that accounting programs
have already equipped accounting students with necessary personal competencies.
273
These findings are in line with personal competencies identified by previous studies
(Hardern 1995; Kavanagh & Drennan 2008; Mohamed & Lashine 2003).
Universities could do more to cultivate student personal competencies by
embedding personal competency contents in relevant subjects, providing exclusive
personal subjects, and providing extracurricular activities for students. Even though,
extracurricular activities do not affect students’ academic performances (Baker 2008;
Hunt 2005), extracurricular activity is considered feasible, since activities would not
infringe on formal curricula. Despite difficulties to design attractive and productive
policies and programs (Friedlander & MacDougall 1992), a university should
provide extracurricular activities for developing students’ personal competencies.
This strategy is plausible, since every extracurricular activity would affects students’
personalities (Astin 1987, 1999). Previous studies on graduates’ competencies
arrived at a similar conclusion that communication competency is critical in work
places (BIHECC 2007; Kavanagh & Drennan 2008; Mohamed & Lashine 2003;
Mula 2007; Wolcot, S. K. 2006).
Alumni consider Broad-business Perspective Competency, consisting of
seven competency areas (Mula 2007; Wolcot, S. K. 2006) as important in their work
places. Despite the condition that alumni need more business perspective
competencies from universities, quantitative data based on students’ and lecturers’
perceptions show that accounting students have been equipped with these
competencies.
Critical thinking, knowledge of global issues, and computer skills suggested
by Mohamed and Lashine (2003) are similar to some indicators of Broad-business
Perspective Competency. Moreover, other similar indicators of Broad-business
274
Perspective Competency are also identified by previous studies. Kavanagh and
Drennan (2008) suggest an understanding of the interdisciplinary nature of business
competency, while BIHECC (2007) suggest initiative and enterprise skills as well as
technology skills.
Alumni suggestion to provide more time for internships to ensure student
learn more about real business is in line with the proposition that students should
learn content that is closely related to real world experiences (Jayaprakash 2005) and
contextual learning (Wu 2008). Likewise, teaching-learning processes should
provide more case studies, laboratory work, and more lectures from professionals is
supported by previous finding that lecturers should use more case studies and
simulation (Weil, Oyelere & Rainsbury 2004), laboratory work (Jack, Smith & Clay.
Jr 1986; Springer & Borthick 2004; Wynder 2004). Lastly, universities should invite
lectures from professionals or practitioners. This strategy is one element of
Contextual Teaching and Learning (CTL) suggested by Wu (2008).
In summary, AICPA core competencies are in line with competencies
required by alumni to perform their work. On the other hand, lecturers and students
report that accounting programs have already equipped students with AICPA core
competencies. Nonetheless, alumni contend that competencies they gained from
university education are limited. In other words, there are gaps between
competencies students gained at a university and competencies they need to perform
work in their companies. These gaps may be mundane, since previous studies also
found the same phenomenon (Irianto 2010; Kavanagh & Drennan 2008), since
developing all competencies in a university is unrealistic (Cranmer 2006). Most
275
importantly, alumni are able to adjust to new working environments meaning that
alumni have enough core competencies for their jobs.
6.2.6 Empirical Models
Results and discussions provide evidences to revise the conceptual model for
building students’ accounting competencies. Since, the study uses some analyses
(Correlation, Regression, Non-parametric, SEM, and Path Analyses) SEM and Path
analysis are employed to revise the model, as these analyses include all data (inputs,
processes, and outputs) simultaneously. The previous hypotheses testing methods
analysed using Pearson’s and Kendall’s Tau correlations. These revised models are
based on Figure 5.9, 5.10, 5.15, and 5.16 for developing ICAG and Figure 5.11, 5.12,
5.15, and 5.16 for developing GPA. Two models are developed, since the study
employs two types of output i.e. ICAG and GPA. In addition the models are
combinations of student and lecturer models. Based on Input, Processes/
Environment, Output (I-E-O) framework, there are five inputs i.e. Student
Motivation, Previous Achievements, Comfort of Class Size, Learning Facilities, and
Lecturer Job Satisfaction that influence processes/environment.
Based on student perspectives, Student Engagement is a proxy for
processes/environments; therefore Student Engagement influences ICAG. In
comparison, based on lecturers’ perspectives, ICAG-Teaching Content and Student-
Faculty Engagement are proxies for processes/environments. Non-parametric
analysis provides results that ICAG-Teaching Content (based on lecturer perception)
significantly correlates with both Student Engagement and ICAG (based on student
perception) (Figure 6.1)
276
Compared to the conceptual model presented in Chapter 3 (Research Design),
the empirical model for developing ICAG is slightly difference. The main
differences are: (1) the exclusion of Lecturer Academic Characteristics; (2) Lecturer
Demographic Characteristics; (3) Student Demographic Characteristics; and (4) the
conversion of Lecturer Job Satisfaction from an exogenous construct to an
endogenous construct.
Based on lecturers’ perceptions, Lecturer Academic Characteristics and
Lecturer Demographic Characteristics do not influence ICAG-Teaching Content,
Student-Faculty Engagement, and ICAG. Therefore, these factors are excluded from
the revised model. In addition, SEM and Path Analysis provide evidence that
Lecturer Job Satisfaction is not an exogenous construct, but an endogenous construct
that significantly is affected by Learning Facilities. At the same time, Lecturer Job
Satisfaction impacts on both ICAG-Teaching Content and Student-Faculty
Engagement. Moreover, Student Demographic Characteristics (as inputs) also do not
affect Student Engagement and ICAG. Therefore, these factors are excluded from the
model. Non-parametric analysis provides results that ICAG-Teaching Content (based
on lecturer perception) significantly correlates with both Student Engagement and
ICAG (based on student perception) (Figure 6.1)
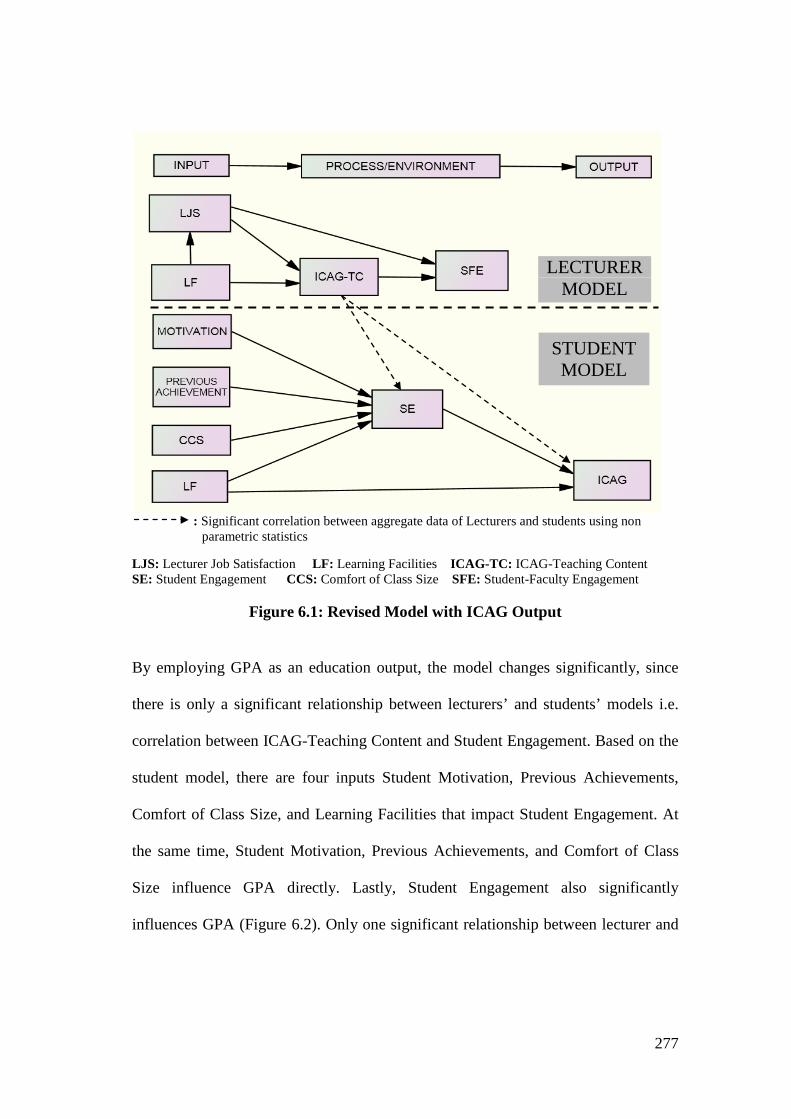
277
: Significant correlation between aggregate data of Lecturers and students using non parametric statistics LJS: Lecturer Job Satisfaction LF: Learning Facilities ICAG-TC: ICAG-Teaching Content SE: Student Engagement CCS: Comfort of Class Size SFE: Student-Faculty Engagement
Figure 6.1: Revised Model with ICAG Output
By employing GPA as an education output, the model changes significantly, since
there is only a significant relationship between lecturers’ and students’ models i.e.
correlation between ICAG-Teaching Content and Student Engagement. Based on the
student model, there are four inputs Student Motivation, Previous Achievements,
Comfort of Class Size, and Learning Facilities that impact Student Engagement. At
the same time, Student Motivation, Previous Achievements, and Comfort of Class
Size influence GPA directly. Lastly, Student Engagement also significantly
influences GPA (Figure 6.2). Only one significant relationship between lecturer and
LECTURER MODEL
STUDENT MODEL
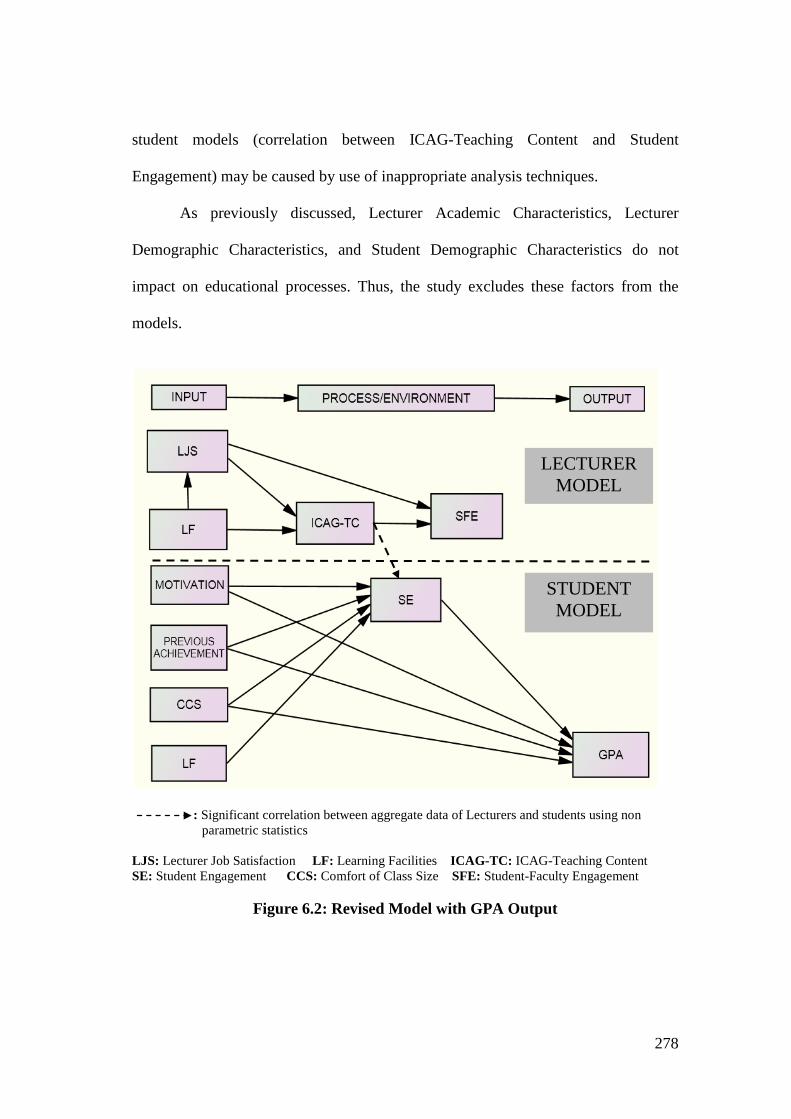
278
student models (correlation between ICAG-Teaching Content and Student
Engagement) may be caused by use of inappropriate analysis techniques.
As previously discussed, Lecturer Academic Characteristics, Lecturer
Demographic Characteristics, and Student Demographic Characteristics do not
impact on educational processes. Thus, the study excludes these factors from the
models.
: Significant correlation between aggregate data of Lecturers and students using non parametric statistics LJS: Lecturer Job Satisfaction LF: Learning Facilities ICAG-TC: ICAG-Teaching Content SE: Student Engagement CCS: Comfort of Class Size SFE: Student-Faculty Engagement
Figure 6.2: Revised Model with GPA Output
LECTURER MODEL
STUDENT MODEL
279
6.3 Conclusions The objective of this study is to build models comprising of input, process, and
output constructs for developing students’ accounting competencies and GPA in the
context of Indonesian universities. To achieve the above research objective, the study
proposes six main research questions as presented in Chapter 1 (Introduction). The
research questions are as follow; (1) What educational inputs have significant
relationships with educational processes? (2) What educational inputs have
significant relationships with educational outputs in terms of ICAG and Student
Achievements? (3) Is there any significant relationships between educational
processes and educational outputs in terms of ICAG and Student Achievements? (4)
What is the model for improving ICAG using input-process-output approach in the
Indonesian University context? (5) What is the model for improving Student
Achievements (GPA) using input-process-output approach in the Indonesian
University context? And (6) Based on alumni perceptions, to what extent are AICPA
core competencies applicable in the Indonesian business context? Responses to these
questions based on empirical findings are as follows;
Research Question 1
(1) Based on students’ perceptions, Student Motivation measured by Expectancy
Theory, Previous Achievements in term of average grades earned from previous
schoolings, Comfort of Class Size, and Learning Facilities as educational inputs,
positively correlate with Student Engagement as a proxy for educational
processes.
280
(2) Student Demographic Characteristics in term of student Age negatively
correlates with Student Engagement. Older students are more likely to have
lower Student Engagement. The study finds that student Gender does not
correlate with Student Engagement.
(3) Lecturer Job Satisfaction as an educational input significantly correlates with
how much lecturers include AICPA core competencies in their teaching and
learning processes (ICAG-Teaching Content) and Student-Faculty Engagement
as proxies for educational process based on lecturers’ perceptions. Learning
Facilities as educational inputs significantly correlate with ICAG-Teaching
Content and Student-Faculty Engagement. At the same time Learning Facilities
also correlate with Lecturer Job Satisfaction.
Research Question 2
(4) Based on students’ perceptions, Student Motivation, Student Previous
Achievements, Comfort of Class Size, and Learning Facilities as educational
inputs significantly correlate with ICAG as an educational output. Student Age
and student Gender do not correlate with ICAG.
(5) Student Motivation, Student Previous Achievements, and Learning Facilities as
educational inputs correlate with Student Achievements in term of GPA.
Comfort of Class Size does not correlate with GPA. Student Age and Gender
negatively correlates with GPA. Older students are more likely to have lower
GPA than younger students. Female students tend to have higher GPA than their
counterparts.
281
(6) ICAG-Teaching Content, measuring how much lecturers include AICPA core
competencies in their teaching and learning, correlates significantly with ICAG
gained by students as well as Student Engagement.
Research Question 3
(7) Overall Student Engagement as a proxy for educational processes correlates
significantly with overall ICAG. All dimensions of Student Engagement
(Academic Challenge, Active Learning, Student-Staff Interaction, Enriching
Education Experience, and Supportive Learning Environment) correlate
significantly with all ICAG dimensions (Functional, Personal, and Broad-
business Perspective Competency). Student Engagement is found to be an
important proxy for measuring educational processes in Indonesian university
context.
(8) Overall Student Engagement significantly correlates with GPA. All Student
Engagement dimensions except Enriching Education Experience correlate with
GPA.
Research Question 4
(9) Using separate simple and multiple regression techniques for each input, results
show that the I-E-O model is still capable of predicting educational output in
terms of ICAG. Student Motivation, Previous Achievements, Comfort of Class
Size, and Learning Facilities as educational inputs individually influence Student
Engagement and ICAG. At the same time Student Engagement significantly
influences ICAG. The study also concludes that Student Engagement is a
powerful mediator between the above educational inputs and ICAG.
282
(10) SEM single composite indicator and Path Analysis are employed to build a
model for improving ICAG in Indonesian universities. Based on the Input-
Process-Output approach developed by System Theory the study concludes that
Student Motivation, Student Previous Achievements, Comfort of Class Size, and
Learning Facilities are important inputs that affect Student Engagement. In turn,
Student Engagement significantly affects ICAG.
Research Question 5
(11) When the study uses GPA as an educational output, I-E-O model is also
applicable. Student Motivation, Student Previous Achievements, Grades of
Nationally-tested Subject Matters (NEM), Age, and Learning Facilities
significantly affect Student Engagement and GPA. In turn, Student Engagement
also significantly impacts GPA. Student Engagement is a strong mediator
between the aforementioned educational inputs and GPA.
(12) By employing the Input-Process-Output approach from System Theory, the
study finds that Student Motivation, Student Previous Achievements, and
Learning Facilities are important educational inputs that affect Student
Engagement. In turn, Student Engagement impacts GPA. Due to the model and
or GPA measurement errors Comfort of Class Size negatively influences GPA.
Research Question 6
(13) Despite insufficient competency development in university education, alumni
perceive that AICPA core competencies consisting of Functional, Personal, and
Broad-business Perspective Competencies are in line with working requirements
in an Indonesian business setting.
283
6.4 Theoretical Implications The study employs two underpinning theories as research frameworks, System
Theory (ST) and I-E-O model. Input-Process-Output from System Theory is more
applicable when the study employs simultaneous analysis for validating a model by
including many educational inputs at the same time. In comparison, the I-E-O
framework works well when simultaneous analysis includes strong inputs. Moreover,
the I-E-O model is applicable when the study identifies relationships of a certain
input with, environment, and output. In other words, System Theory and I-E-O
model could be employed simultaneously to identify relationships among inputs,
processes/environment, and outputs.
Using student engagement as a proxy for educational processes in a
university, the study supports the application of Involvement Theory, where students
learn by being involved in academic and non-academic activities conducted in a
university. More specifically, students having more involvement in Academic
Challenge, Active Learning, Student-Staff Interaction, Enriching Education
Experience, and Supporting Learning Environment are more likely to have higher
ICAG and GPA.
Even though Expectancy Theory questionnaires were designed to measure
employees’ motivation in a hotel company (Chiang & Jang 2008; Chiang et al.
2008), the study finds that Expectancy Theory and questionnaires are applicable for
gauging students’ motivations at university level. Student Motivation measured by
Expectancy Theory is a strong predictor for Student Engagement, ICAG, and GPA.
Herzberg’s Motivation Theory (HMT) is applicable to measure Lecturer Job
Satisfaction. This construct is a strong predictor of ICAG-Teaching Content and
284
Student-Faculty Engagement in an Indonesian universities context. Lecturers having
higher Lecturer Job Satisfaction are more likely to include more ICAG-Teaching
Content and have better Student-Faculty Engagement. In addition, multidimensional
scales for measuring work satisfaction among pharmacy faculty members (Conklin
& Desselle 2007) are applicable to measuring Lecturer Job Satisfaction among
accounting lecturers in the Indonesian university context.
6.5 Practical Implications Accounting education in Higher Education plays an important role in harmonising
Indonesian accounting practices with the west. To improve students’ accounting
competencies in terms of ICAG based on AICPA core competencies, universities and
other policy makers should pay more attention to the educational inputs Student
Motivation, Student Previous Achievements, Learning Facilities, Comfort of Class
Size, and Lecturer Job Satisfaction. To improve International Competency of
Accounting Graduates (ICAG), universities should improve Student Engagement and
encourage lecturers to include more AICPA core competencies in their teaching-
learning processes (ICAG-Teaching Content).
Lecturers could improve ICAG-Teaching Content by including more real-
world practices and experiences into classrooms by employing more case studies,
cooperative learning, contextual teaching and learning. In addition, extending
internship periods and providing more field trip activities for students, are also
plausible strategies to enhance ICAG. Finally, improving Lecturer Job Satisfaction
and Learning Facilities lead to the improvement of ICAG-Teaching Content in an
Indonesian university context.
285
To improve student achievement in term of GPA, a university should pay
attention to Student Motivation, Comfort of Class Size, Learning Facilities, and
Student Previous Achievements. Likewise, improving Student Engagement is a good
strategy to improve Student Achievements. Even though, Student-Faculty
Engagement does not correlate with Student Engagement due to a statistical analysis
flaw, Student-Faculty Engagement is considered an important proxy for educational
processes based on lecturers' perceptions, since Student-Faculty Engagement is the
mirror of Student Engagement (Kuh, Nelson Laird & Umbach 2004). The role of
Lecturer Job Satisfaction is pivotal to improving ICAG as well as GPA; therefore
providing more attention to Lecturer Job Satisfaction could lead to positive impacts
on ICAG and GPA.
Student Engagement is considered effective for measuring educational
processes in a university, since Student Engagement significantly affects ICAG and
GPA as educational outputs. Directorate of Higher Education (DIKTI) working with
all Indonesian universities should consider implementing a student engagement
surveys for benchmarking and for improvement purposes. By implementing the
survey, a university could develop a benchmark with other universities in Indonesia
as well as with other universities that have implemented the Student Engagement
survey in developed countries. Moreover, data gathered from student engagement
surveys could be used widely for research and development purposes by higher
education institutions.
286
6.6 Limitations The study classifies limitations into three categories i.e. study design/theories, data
collection, and data analysis. Student Engagement used by the study is a general
student engagement survey. As has been noted, the study employs five dimensions of
Student Engagement i.e. Academic Challenge, Active Learning, Student-staff
Interaction, Enriching Education Experience, and Supportive Learning Environment
(Kinzie et al. 2007; Kuh 2006). Work-integrated Learning, an additional dimension
used by AUSSE (2010b), was not included in the study. The influence of Student
Engagement on educational outputs in terms of ICAG and GPA could be different by
the inclusion of Work-integrated Learning.
Even though, the study includes eight state universities based on study
program accreditation and location, private universities and other types of higher
education institutions having accounting programs, were not included. Research
results may provide different conclusions by the inclusion of these universities in the
study.
Collecting data on students’ competencies using a questionnaire has
drawbacks. Response rate questionnaires may be affected by negative or apathetic
attitudes (Kavanagh & Drennan 2008). Nonetheless, self-assessment on competency
is considered valid (Hansson 2001). In addition, questionnaires used to assess
students’ accounting competencies are also statistically valid and reliable; care must
be taken while interpreting competency data collected using self-assessment
questionnaires. Likewise, collecting data of class size by using comfort of class size
based on students’ perceptions may provide inaccurate results.
287
Final-year students become participants in this study. In fact they have not
graduated yet from universities. Most students still have one or two semesters to
graduate. Therefore, data collected from student participants may not provide
complete information. Nevertheless, assessing data from alumni who have graduated
long time could be misleading, since alumni should response to questions when they
were attending university education.
Grades earned by students from previous schoolings i.e. High School (SMA)
or Vocational High School (SMK) are not the only measures used by students to gain
admission into Indonesian universities. The Ministry of National Education (MONE)
provides Indonesian universities with two types of procedures to screen student
enrolment i.e. Nationally-administered Admission Test and University-administered
Admission Test. Even though, Previous Achievements significantly impact Student
Engagement and outputs in terms of ICAG and GPA, grades from admission tests are
not included in the study.
The study employs Focus Group Discussion (FGD) by inviting 20 alumni to
participate. Even though, participants are working in service, trading, banking, and
manufacturing companies, participants may not be representative of all business
sectors. In addition, FGD participants also graduate from a particular university.
Therefore, their perceptions may not reflect alumni who graduated from other
universities.
The study employs non-parametric analysis to identify correlations between
lecturers’ and students’ data, averages of lecturers’ and students’ data in each
university. This analysis has a salient flaw, since students’ and lecturers’ data are
masked. In fact, students’ data are nesting data that should be analysed using
288
Hierarchical Linear Modelling or HLM (Umbach & Wawrzynski 2005).
Nevertheless, to analyse this type of data, HLM requires at least 30 groups
(universities) (Porter 2005). Interpreting of these results from these correlations must
be undertaken cautiously, since correlations between lecturers’ and students’ data
may be inaccurate.
6.7 Directions of Future Research The study uses five dimensions of student engagement i.e. Academic Challenge,
Active Learning, Student-staff Interaction, Enriching Education Experience, and
Supportive Learning Environment (Kinzie et al. 2007; Kuh 2006), while Work-
integrated Learning (AUSSE 2010b) was not studied. Student Engagement
significantly impacts educational outputs in terms of ICAG and GPA in an
Indonesian university context. Future studies should pay attention to the impact of
Work-integrated Learning on both ICAG and GPA.
Student Engagement as used in the study was interpreted for students in
general, meaning that Student Engagement is not specifically designed for
accounting students at university level. Some research has been conducted to design
a narrower Student Engagement instrument such as student course engagement
(Handelsman et al. 2005). Therefore, a narrower scoped Student Engagement
questionnaire is required to measure the transforming or learning processes in
accounting education. Student Engagement in accounting courses will provide more
focus and a more accurate view of Student Engagement for predicting learning
outcomes from accounting programs.
289
The study collects data of ICAG using questionnaires (self-assessed),
responses on questionnaires may be affected by negative attitudes toward surveys
(Kavanagh & Drennan 2008). Therefore, future research should employ different
data collection techniques such as tests, observation and rating scales, as well as
interviews. Future research should focus on self-assessment efficacy in measuring
students’ accounting competencies by comparing competency data collected using
some techniques such as test, observation, and interviews.
The study recruited final year students, 7th semester out of 8 semesters. In
fact, students have yet to graduate from their universities. Future study should focus
on fresh graduates from accounting program as respondents. The recruitment of
alumni who have significant working experience as respondents could be misleading,
since they graduated some time ago, which could make recall of data when they were
attending university such as Student Engagement and Motivation, difficult and
inaccurate.
Some academic performance indicators from High School were analysed,
such as previous grades, grades of nationally-tested subjects (NEM), type of previous
schools, and major, yet only previous grades have significant impacts on Student
Engagement, ICAG, and GPA. As previously mentioned, universities use two types
of test to admit students, but the study does not include the results of both admission
tests as inputs. Future studies should focus on the influence of the admission-test
scores on Student Engagement and outputs in term of ICAG and GPA.
Future research should also investigate the applicability of AICPA core
competency framework in the work places by recruiting alumni from other
universities as well as more sectors in the Indonesian business context. To provide
290
more complete pictures, future research could include employers to evaluate the
applicability of this competency framework to their companies.
Identifying relationships between lecturers’ and students’ data by correlating
averages of lecturers’ and students’ responses has a salient weakness. Future research
should employ Hierarchical Linear Modelling (HLM) to identify correlations. In
addition, future research should add some more universities (state and private) to
ensure the research can apply HLM and provide a clearer picture of relationships
between lecturers’ characteristics with student engagement as well as students’
learning outcomes in an Indonesian universities context. Moreover, including more
universities (state and private universities as well as other higher institutions that
have accounting programs) could provide more complete pictures on building ICAG.
Based on students’ perceptions, the study finds that Comfort of Class Size
correlates inconsistently with Student Engagement, ICAG, and GPA. Further studies
should be undertaken to identify the roles of Comfort of Class Size in influencing
Student Engagement, ICAG, and GPA in an Indonesian university context. A future
studies also should pay attention to the behaviour of Comfort of Class Size or real
class size in affecting ICAG, GPA, ICAG-Teaching Content and Student-Faculty
Engagement.
Even though the study employs eight variables for measuring Lecturer
Academic Characteristics, none of them has significant relationships with ICAG-
Teaching Content, Student-Faculty Engagement, and students’ learning outcomes.
Further research is required to identify the impact of Lecturer Academic
Characteristics on educational processes and outputs. So far, only variables within
construct of Lecturer Academic Characteristics have significant correlations.
291
LIST OF REFERENCES
Agronow, SJ 2008, 'Demographic, pre-college and engagement variables that effect uc gpa and student learning outcomes as assessed by ucues.', in SERU Research Symposium on the University of California-Berkeley campus: proceedings of theSERU Research Symposium on the University of California-Berkeley campus University of California, <http://cshe.berkeley.edu/events/serusymposium2007/docs/SERU.Agronow%20Demographics.pdf>. AICPA 2006, Core competency framework & educational competency assessment web site, viewed 1 April 2011, <http://www.aicpa.org/InterestAreas/AccountingEducation/Resources/ CurriculumDevelopment/CoreCompetencyFrameworkandEducationalCompetencyAssessmentWebSite/Pages/default.aspx>. Ainley, M 2004, 'What do we know about student motivation and engagement?', in The annual meeting of the Australian Association for research in Education: proceedings of theThe annual meeting of the Australian Association for research in Education Melbourne, <http://www.aare.edu.au/04pap/ain04760.pdf>. Alvermann, D 2001, 'Effective literacy instruction for adolescents', in National Reading Conference: proceedings of theNational Reading Conference National Reading Conference, Chicago, IL, pp. 1-33, <http://www.nrconline.org/publications/alverwhite2.pdf>. Astin, AW 1971, Predicting academic performance in college, The Free Press, New York. Astin, AW 1987, Achieving educational excellence, Jossey-Bass Publishers, San Fransisco. Astin, AW 1993a, Assessment for excellence: The phylosophy and practice of assessment and evaluation in higher education, ORIX PRESS, New York. Astin, AW 1993b, What matter in college?, Jossy-Bass Publishers, San Fransisco. Astin, AW 1999, 'Student involvement: A development theory for higher education', Journal of College Student development, vol. 40, no. 5, pp. 518-29. AUSSE 2010a, Doing more for learning: Enhancing engagement and outcomes, Australian Council for Education Research (ACER), http://ausse.acer.edu.au/images/ docs/AUSSE_2009_Student_Engagement_Report.pdf>. AUSSE 2010b, The australasian survey of student engagement., viewed 8 March 2010, <http://ausse.acer.edu.au/>. Azemikhah, H 2006, The 21st century, the competency era and competency theory, viewed 16 October 2009, <http://www.avetra.org.au/ABSTRACTS2006/PA%200058.pdf>. Baker, C 2008, 'Under-represented college students and extracurricular involvement: The effects of various student organizations on academic performance', Social Psychology of Education, vol. 11, no. 3, pp. 273-98.
292
Ballantine, J & McCourt Larres, P 2009, 'Accounting undergraduates' perceptions of cooperative learning as a model for enhancing their interpersonal and communication skills to interface successfully with professional accountancy education and training', Accounting Education: an International Journal, vol. 18, no. 4/5, pp. 387-402. BAN-PT 2009, Akreditasi program studi akuntansi, viewed 15 November 2009, <http://ban-pt.depdiknas.go.id/index.php?lang=in>. Barbe, RH 1975, 'Systems theory and education's goals', in Society of general System Research: proceedings of theSociety of general System Research New York City. Barnett, R 1995, Improving higher education: Total quality care, SRHE and Open University Press, Buckingham. Barnett, V 2002, Sample survey; principles & methods, Arnold, London. Barrett, P 2007, 'Structural equation modelling: Adjudging model fit', Personality and Individual Differences, vol. 42, pp. 815-24. Barrow, L & Rouse, CE 2005, Casuality, casuality, casuality: The view of educational input and output from economics, viewed 16 October 2009, <www.chicagofed.org/publications/workingpapers/wp2005_15.pdf>. Bassett-Jones, N & Lloyd, GC 2005, 'Does herzberg's motivation theory have staying power?', Journal of Management Development, vol. 24, pp. 929-43. Beard, DF 2007, 'Assessment of internship experiences and accounting core competencies', Accounting Education: an International Journal, vol. 16, no. 2, pp. 207-20. Becket, N & Brookes, M 2006, 'Evaluating quality management in university department', Quality Assurance in Education, vol. 14, no. 2, pp. 123-42. Bennett, SK 1982, 'Student perception of and expectation for male and female instructors: Evidence relating to the question of gender bias in teaching evaluation', Journal of Educational Psychology, vol. 74, no. 2, pp. 170-9. Bertalanffy, Lv 1968, General system theory: Foundation, development, applications, George Braziller, New York. Biggs, J, Kember, D & Leung, DYP 2001, 'The revised two-factor study process questionnaire: R-spq-2f', British Journal of Education psychology, vol. 71, pp. 133-49. BIHECC 2007, Graduate employbility skill., Business, Industry, abd Higher Education Collaboration Council, viewed 11 January 2010, <http://www.dest.gov.au/ NR/rdonlyres/E58EFDBE-BA83-430E-A541-2E91BCB59DF1/20214/Graduate EmployabilitySkillsFINALREPORT1.pdf>. BKPM 2006, Invest in indonesia, Indonesia Investment Coordinating Board, viewed 6 June 2010, <http://bekas.bkpm.go.id/en/invest_in_indonesia>.
293
BKPM 2009, Statistic of direct investment realization, 1990 - december 31 2009, Indonesia Investment Coordinating Board, viewed 19 January 2010, <http://www5.bkpm.go.id/file_uploaded/public/Direct%20Investment%20Realization,%201990-2009.pdf>. Bolt-Lee, C & Foster, SD 2003, 'The core competency framework: A new element in the continuing call for accounting education change in the united states', Accounting Education, vol. 12, pp. 33-47. Bonner, SE 1999, 'Choosing teaching methods based on learning objectives: An integrative framework', Issues in Accounting Education, vol. 14, pp. 11-39. Bowen, GL 2007, Social organization and schools: A general system theory perspective, Pearson Education, Inc., Boston. Bowling, NA 2007, 'Is the job satisfaction-job performance relationship spurious? A meta-analytic examination', Journal of Vocational Behavior, vol. 71, no. 2, pp. 167-85. Brown, RB & McCartney, S 1995, 'Competence is not enough: Meta-competence and accounting education', Accounting Education, vol. 4, no. 1, pp. 43-53. Buck, S & Tiene, D 1989, 'The impact of physical attractiveness, gender, and teaching philosophy on teacher evaluations', Journal of Educational Research, vol. 82, no. 3, pp. 172-7. Buddin, R & Zamarro, G 2009, 'Teacher qualifications and student achievement in urban elementary schools', Journal of Urban Economics, vol. 66, pp. 103-15. Burns, PM 1997, 'Hard-skills, soft-skills: Undervaluing hospitality’s ‘service with a smile’', Progress in Tourism and Hospitality Research, vol. 3, pp. 239-48. Bushnell, DS 1990, 'Input, process, output: A model for evaluating training', Training & Development Journal, vol. 44, no. 3, p. 41. Byrne, BM 2001, Structural equation modeling with amos: Basic concept, applications, and programming, Lawrence Erlbaum Associates Publishers, New Jersey. Campbell, SV, Baronina, T & Reider, BP 2003, 'Using expectancy theory to assess group-level differences in student motivation: A replication in the russian far east', Issues in Accounting Education, vol. 18, no. 2, p. 125. Carini, R, Kuh, G & Klein, S 2006, 'Student engagement and student learning: Testing the linkages', Research in Higher Education, vol. 47, no. 1, pp. 1-32. Carraher, SM, Mendoza, JL, Buckley, MR, Schoenfeldt, LF & Carraher, CE 1998, 'Validation of an instrument to measure service-orientation', Journal of Quality Management, vol. 3, no. 2, pp. 211-24. Centra, JA 1983, 'Research productivity and teaching effectiveness', Research in Higher Education, vol. 18, no. 2, pp. 379-89.
294
Chan, PKW 2010, 'Enhancing cooperative learning: Human factors', New Horizons in Education, vol. 58, no. 2, pp. 136-9. Chen, P-SD, Lambert, AD & Guidry, KR 2010, 'Engaging online learners: The impact of web-based learning technology on college student engagement', Computers & Education, vol. 54, no. 4, pp. 1222-32. Chiang, C-F & Jang, SS 2008, 'An expectancy theory model for hotel employee motivation', International Journal of Hospitality Management, vol. 27, pp. 313-22. Chiang, C-F, Jang, SS, Canter, D & Prince, B 2008, 'An expectancy theory model for hotel employee motivation: Examining the moderating role of communication satisfaction', International Journal of Hospitality & Tourism Administration, vol. 9, no. 4, pp. 327-51. Chickering, AW & Gamson, ZF 1987, Seven principles for good practice in undergraduate education., viewed 10 February 2010, <http://honolulu.hawaii.edu/intranet/committees/ FacDevCom/guidebk/teachtip/7princip.htm>. Chickering, AW & Gamson, ZF 1999, 'Development and adaptations of the seven principles for good practice in undergraduate education', New Directions for Teaching & Learning, no. 80, p. 75. Choong, C-K, Baharumshah, AZ, Yusop, Z & Habibullah, MS 2010, 'Private capital flows, stock market and economic growth in developed and developing countries: A comparative analysis', Japan and the World Economy, vol. 22, no. 2, pp. 107-17. Chou, C-P & Bentler, PM 1996, 'Estimate and test in structural equation modeling', in RH Hoyle (ed.), Structural equation modeling: Concepts, issues, and applications, Sage Publications, London, pp. 37-54. Christiawan, YJ 2002, 'Competence and independence of public accountants: A reflection on empirical study', Jurnal Akuntansi dan keuangan, vol. 4, no. 2, pp. 79-92,<puslit.petra.ac.id/journals/pdf.php?PublishedID=AKU02040201>. Chua, C 2004, 'Perception of quality in higher education', in the Australian University Quality Forum 2004: proceedings of thethe Australian University Quality Forum 2004 AUQA Occasional Publication, <http://www.auqa.edu.au/auqf/pastfora/ 2004/program/papers/Chua.pdfhttp://www.auqa.edu.au/auqf/pastfora/2004/program/papers/Chua.pdfhttp://www.auqa.edu.au/auqf/pastfora/2004/program/papers/Chua.pdf>. Coates, DE 2006, People skills training: Are you getting a return on your investment?, viewed 25 April 2012, <http://www.praxisconsulting.org/PeopleSkills.pdf>. Conklin, MH & Desselle, SP 2007, 'Development of a multidimensional scale to measure work satisfaction among pharmacy faculty members', American Journal of Pharmaceutical Education, vol. 71, no. 4, pp. 1-9. Cook, S 2001, 'Money and student performance in rhode island elementary schools', Brown University, Providence, Rhode Island.
295
Cotten, S & Wilson, B 2006, 'Student–faculty interactions: Dynamics and determinants', Higher Education, vol. 51, no. 4, pp. 487-519. Cranmer, S 2006, 'Enhancing graduate employability: Best intentions and mixed outcomes', Studies in Higher Education, vol. 31, no. 2, pp. 169-84. Credé, M & Kuncel, N 2008, 'Study habits, skills, and attitudes: The third pillar supporting collegiate academic performance', Perspective on Psychological Science, vol. 3, no. 6, pp. 425-53. Cromwell, RR & Scileppi, J 1995, 'A systems approach to education', EDRS, pp. 1-28. Davis, EP 2005, 'Pension fund management and international investment -- a global perspective', Pensions: An International Journal, vol. 10, no. 3, pp. 235-61. De Paola, M 2009, 'Does teacher quality affect student performance? Evidence from an italian university', Bulletin of Economic Research, vol. 61, pp. 353-77. de Vaus, DA 2002, Surveys in social research, Fifth edn, Allen & Unwin, Crows Nest NSW. Dee, TS 2007, 'Teachers and the gender gaps in student achievement', Journal of Human Resources, vol. 42, no. 3, pp. 528-54. DeLaune, LD 2004, 'An investigation of the 150-hour requirement in developing personal competencies in accounting education', Louisiana State University and Agricultural and Mechanical College. Delvin, M, Coates, H & Kinzie, J 2007, Using ausse data for enhancement., viewed 2 January 2011, <http://www.acer.edu.au/documents/AUSSE_UsingDataFor Enhancement.pdf>. Deming, WE 1995, The new economics for industry, government, education, 2nd edn, Massachusetts Institute of Technology Centere for Advances Engineering Study, Cambridge. Depdiknas, Ministrial decree no 232/u/2000 on guidelines for developing higher education curricula and assessing student learning outcomes, 2000, MONE, Jakarta. Dickson, J & Fleet, A 2000, Success of failure in core university unit: What makes the difference?, viewed 20 December 2009, <http://www.informaworld.com/ smpp/content~db=all~content=a758483810>. DIKTI 2009, Study program evaluation based on self evaluation (epsbed), viewed 9 November 2009, <http://evaluasi.dikti.go.id/epsbed/>. DIKTI, The guidelines for lecturer working loads and evaluation of three duties of higher education, 2010, MONE, Jakarta, <http://fkip.unai.edu/wp-content/uploads/pedoman-beban-kerja-dosen-evaluasi.pdf>. Dillon, M & Kokkelenberg, EC 2002, The effect of class size on student achievement in higher education: Appliying an earning function., viewed 15 December 2009, <http://buoir.binghamton.edu/papers/Class_Size_md2002.pdf>.
296
Dolan, RC, Jung Jr, CR & Schmidt, RM 1985, 'Evaluating educational inputs in undergraduate education', Review of Economics & Statistics, vol. 67, no. 3, pp. 514-20. Duff, A 2004, 'Understanding academic performance and progression of first-year accounting and business economics undergraduates: The role of approaches to learning and prior academic achievement', Accounting Education, vol. 13, pp. 409-30. Ellinger, K & Wright, DE 1995, 'Brain for the bucks? School revenue and student achievement in oklahoma', Social Science Journal, vol. 32, no. 3, pp. 299-308. ERS 1998, Enhancing student engagement in learning, VA: ERS Informed Educator, Arlington. Esya, FP 2008, 'The influence of auditors' competencies and knowledge of accounting information system on custom auditors' performance in the area of jakarta.', Universitas Sumatra Utara, Medan. Exeter, DJ, Ameratunga, S, Ratima, M, Morton, S, Dickson, M, Hsu, D & Jackson, R 2010, 'Student engagement in very large classes: The teachers' perspective', Studies in Higher Education, vol. 35, no. 7, pp. 761-75. Faux, J & Woodley, C 2009, 'Contextualising professional knowledge and skills: Integrating the postgraduate accounting curriculum', in Curriculum: a national conversation: proceedings of theCurriculum: a national conversation The Australian Curriculum Studies Association, Canberra, <http://www.acsa.edu.au/pages/images/Revamped% 20FAUX%20%20WOODLEY%2024%20JULY2.pdf>. Finn, JD, Pannozzo, GM & Achilles, CM 2003, 'The "why's" of class size: Student behavior in small classes', Review of Educational Research, vol. 73, no. 3, pp. 321-68. Foster, S, Bolt-Lee, C & Colson, RH 2002, 'New competencies for accounting students', CPA Journal, vol. 72, no. 1, pp. 68-73. Frey, KB 1998, Developing a model curriculum in surgical technology., viewed 16 October 2009, <www.ast.org/pdf/CurrPlan_Dev_Model.pdf>. Friedlander, J & MacDougall, P 1992, 'Achieving student success through student involvement', Community College Review, vol. 20, no. 1, pp. 20-8. Geiger, MA & Cooper, EA 1995, 'Predicting academic performance: The impact of expectancy and needs theory', Journal of Experimental Education, vol. 63, no. 3, pp. 251-66. Geiger, MA & Cooper, EA 1996, 'Cross-cultural comparison using expectancy theory to assess student motivation', Issues in Accounting Education, vol. 11, no. 1, pp. 114-29. Geiger, MA, Cooper, EA, Hussain, I, O'Connell, BT, Power, j, Raghunandan, K, Rama, DV & Sanchez, G 1998, 'Cross-cultural comparisons using expectancy theory to assess student motivation: An international replication', Issues in Accounting Education, vol. 13, no. 1, pp. 139-56.
297
Ghozali, I 2007, Structural equation modelling: Concepts and applications with amos, Badan Penerbit Universitas Diponegoro, Semarang. Ghozali, I 2009, Applied multivariate analysis using spss, Badan penerbit Univeritas Diponegoro, Semarang. GJM-FE-UB 2009, Academic regulation of economic faculty, brawijaya university, Faculty of Economic, Brawijaya University, Malang, <http://www.fe.unibraw.ac.id/dokumen/ fakultas/PeraturanAkademikFEUB.pdf>. Gordon, J, Ludlum, J & Hoey, J 2008, 'Validating nsse against student outcomes: Are they related?', Research in Higher Education, vol. 49, no. 1, pp. 19-39. Grewal, R, Cote, JA & Baumgartner, H 2004, 'Multicollinearity and measurement error in structural equation models: Implications for theory testing', Marketing Science, vol. 23, no. 4, pp. 519-29. Griffin, J 1996, 'An old career takes on new importance', Asian Business Review, no. May, pp. 57-9. Gupta, S 1993, 'Quality improvement in teaching', Exploration in Teaching & Learning, vol. 3, no. 3, pp. 4-5. Hair, JF, Black, WC, Babin, BJ, Anderson, RE & Tatham, RL 2006, Multivariate data analysis, Pearson Education, Inc., Upper Saddle River, New Jersey. Halim, L 2010, Ifrs implementation: Prepared or scared?, Solution Architec SAP Indonesia, viewed 26 July 2010, <http://www.sap.com/indonesia/about/events/worldtour10/pdf/ CFOofficeTrack/03_IFRSImplementation-PreparedOrScared_LindawatiHalim.pdf>. Hamzah, A 2009, 'Models of curriculum development and teaching learning strategy of accounting in higher education based on critical sociology, creativity, and mentality', AUDI Jurnal Akuntansi dan Bisnis, vol. 4, no. 1, pp. 29-36. Hancock, P, Howieson, B, Kavanagh, M, Kent, J, Tempone, I & Segal, N 2009a, Accounting for the future: More than numbers, Australian Learning & Teaching Council, http://www.altc.edu.au/project-accounting-future-more-uwa-2007>. Hancock, P, Howieson, B, Kavanagh, M, Kent, J, Tempone, I & Segal, N 2009b, Strategies for embedding non-technical skills into the accounting curricula, Australian Learning & Teaching Council, http://www.altc.edu.au/project-accounting-future-more-uwa-2007>. Handelsman, MM, Briggs, WL, Sullivan, N & Towler, A 2005, 'A measure of college student course engagement', Journal of Educational Research, vol. 98, no. 3, pp. 184-91. Hansson, B 2001, 'Competency models: Are self-perceptions accurate enough?', Journal of European Industrial Training, vol. 25, no. 9, pp. 428-41. Hardern, G 1995, 'The development of standards of competence in accounting', Accounting Education, vol. 4, pp. 17-27.
298
Harper, SR & Quaye, SJ (eds) 2008, Student engagement in higher education: Theoretical perspectives and practical approaches for diverse population, Routledge, New York. Harrel, A, Caldwell, C & Doty, E 1985, 'Within-person expectancy theory predictions of accounting students' motivation to achieve academic succes', The Accounting Review, vol. 60, no. 4, pp. 724-35. Harris, DN & Sass, TR 2009, 'The effects of nbpts-certified teachers on student achievement', Journal of Policy Analysis & Management, vol. 28, no. 1, pp. 55-80. Hattie, J 2003, 'Teachers make a difference what is the research evidence?', in the Research Conference of the Australian Council for Educational Research: proceedings of thethe Research Conference of the Australian Council for Educational Research Melbourne, VIC, <http://acer.edu.au/documents/RC2003_hattie_teachersmakeADifference.pdf>. Heiberger, G & Harper, R 2008, 'Have you facebooked astin lately? Using technology to increase student involvement', New Directionfor Student Services, vol. 124, no. Winter 2008, pp. 19-35. Heller, RS, Beil, C, Kim, DAM & Haerum, B 2010, 'Student and faculty perceptions of engagement in engineering', Journal of Engineering Education, vol. 99, no. 3, pp. 253-61. Hermsen, J & Rosser, V 2008, 'Examining work engagement and job satisfaction of staff members in higher education', CUPA-HR Journal, vol. 59, no. 2, pp. 10-8. Herring III, HC & Bryans, BJ 2001, 'Curriculum development research: A literature guide', Accounting Education, vol. 10, pp. 315-23,<10.1080/09639280210122348>. Heylighen, F 1998, Basic concepts of the system theory., Principia Cybernetica, viewed 3 December 2009, <http://pespmc1.vub.ac.be/sysappr.html>. Hoe, SL 2008, 'Issue and procedures in adopting structural equation modeling technique', Journal of Applied Quantitative Method, vol. 3, no. 1, pp. 76-83. Hoffmann, F & Oreopoulos, P 2009a, 'Professor qualities and student achievement', Review of Economics & Statistics, vol. 91, pp. 83-92. Hoffmann, F & Oreopoulos, P 2009b, 'A professor like me', Journal of Human Resources, vol. 44, pp. 479-94. Howieson, B 2003, 'Accounting practice in the new millennium: Is accounting education ready to meet the challenge?', The British Accounting Review, vol. 35, no. 2, pp. 69-103. Hoyle, RH 1996, 'The structural equation modeling approach: Basic concepts and fundamental issues', in RH Hoyle (ed.), The structural equation modeling: Consepts, issues, and applications, Sage Publication, London. Hunt, HD 2005, 'The effect of extracurricular activities in the educational process: Influence on academic outcomes?', Sociological Spectrum, vol. 25, pp. 417-45.
299
Irianto, G 2007, 'Transforming state university into autonomous state university in indonesia: Opportunities and challenges (the case of brawijaya university)', in The Association of South East Asian Institutions of Higher Education (ASAIHL): proceedings of theThe Association of South East Asian Institutions of Higher Education (ASAIHL) Curtin University of Technology, Perth Western Australia, pp. 92-101, <http://asaihl.curtin.edu.au/local/docs/ASAIHLProceedingsPart2.pdf#page=92>. Irianto, G 2010, A survey on competencies of management professionals: Expectations, observed, and implication, ABEST 21 - FE-University of Brawijaya, Malang,<http://www.abest21.org/jpn/FE-UB_Final%20Report_10.4.29.pdf>. Isaacs, G 1996, Bloom's taxonomy of educational objectives., Teaching and Educational development Institute, The University of Queensland, viewed 11 January 2011, <http://www.tedi.uq.edu.au/downloads/bloom.pdf>. Israel, GD 1992, Determining sample size., viewed 16 November 2009, <http://edis.ifas.ufl.edu/pdffiles/PD/PD00600.pdf>. Jack, LK, Smith, G & Clay. Jr, RJ 1986, 'Impact of a simulation of audit practice', Issues in Accounting Education, vol. 1, no. 2, pp. 309-20. Jain, P 2011, 'Ifrs implementation in india: Opportunities and challenges', World Journal of Social Sciences, vol. 1, no. 1, pp. 125-36. Jayaprakash, JCM 2005, Strategies in teaching accounting in higher education, The Reflective Practitioner, viewed 20 December 2009, <http://lsn.curtin.edu.au/ tlf/tlf2005/refereed/jayaprakashj.html>. Johns, A 1995, 'Competency standards for professional accountants in australia and new zealand', Accounting Education, vol. 4, no. 1, pp. 37-42. Johnson, B & Christensen, L 2008, Educational research: Quantitative, qualitative, and mixed approach, Sage Publications, Los Angeles. Johnson, I 2010, 'Class size and student performance at a public research university: A cross-classified model', Research in Higher Education, vol. 51, no. 8, pp. 701-23. Johnson, WL 1984, 'Using a systems approach in education', Education, vol. 105, no. 2, pp. 135-8. Kalton, G 1990, Introduction to survey sampling, Sage Publication Inc, Newbury Park. Kartal, E 2010, 'Feedback processes in multimedia language learning software', US-China Education Review, vol. 7, no. 4, pp. 53-65. Kavanagh, MH & Drennan, L 2008, 'What skills and attributes does accounting graduates need? Evidence from student perception and employer expectation', Accounting and Finance, vol. 48, pp. 279-300.
300
Kelly, LJ 1996, Implementing astin's i-e-o model in the study of student retention: A multivariate time dependent approach, viewed 20 December 2009, <http://www.eric.ed.gov/ERICDocs/data/ericdocs2sql/content_storage_01/0000019b/80/14/9f/f4.pdf>. Kemper, S 2010, 'Older professors: Fewer, and better, than you think', Chronicle of Higher Education, vol. 57, no. 13, pp. A88-A. Kennedy, CA 1998, Turning the table: Engaging teachers in the learning process., viewed 18 January 2011, <http://bearcenter.berkeley.edu/publications/paper2.htm>. Kessel, V, Mink, OG & National Lab. for Higher Education, DNC 1971, The application of open systems theory and organization development to higher education: A position. Khan, MB 2009, 'Effects of information technology usage on student learning - an empirical study in the united states', International Journal of Management, vol. 26, pp. 354-64. Kinney, DP & Smith, SP 1992, 'Age and teaching performance', Journal of Higher Education, vol. 63, no. 3, pp. 282-302. Kinzie, J, Gonyea, R, Kuh, GD, Umbah, P, Blaich, C & Korkmaz, A 2007, The relationship between gender and student engagement in college, viewed 10 February 2010, <http://www.womenscolleges.org/files/pdfs/Gender-and-Student-Engagement-in-College.pdf>. Klick, J 2000, 'Do dollar make a difference? The relationship between expenditure and test scores in pensilvania's public schools', American Economist, vol. 44, pp. 81-92. Knechel, WR 1989, 'Using a business simulation game as a substitute for a practice set', Issues in Accounting Education, vol. 4, no. 2, pp. 411-24. Knowles, K 1999, Effects of teacher knowledge and motivation on students., AERA Grants Program, viewed 18 January 2011, <http://www.aera.net/grantsprogram/abstract_list/ Abstracts/Abs-DG-00032898.html>. Kogan, LR, Schoenfeld-Tacher, R & Hellyer, PW 2010, 'Student evaluations of teaching: Perceptions of faculty based on gender, position, and rank', Teaching in Higher Education, vol. 15, no. 6, pp. 623-36. Kokkelenberg, EC, Dillon, M & Christy, SM 2008, 'The effects of class size on student grades at a public university', Economics of Education Review, vol. 27, no. 2, pp. 221-33. Komarraju, M, Musulkin, S & Bhattacharya, G 2010, 'Role of student-faculty interactions in developing college students' academic self-concept, motivation, and achievement', Journal of College Student development, vol. 51, no. 3, pp. 332-42. Konstantopoulos, S 2007, Do small classes reduce the achievement gap between low and high achievers? Evidence from project star, viewed 12 December 2009, <http://ftp.iza.org/dp2904.pdf>.
301
Krause, MJ 2005, 'Bridging the gap between professors and practitioners', The CPA Journal, vol. 75, no. 11, pp. 68-9. Krause, U-M & Stark, R 2010, 'Reflection in example- and problem-based learning: Effects of reflection prompts, feedback and cooperative learning', Evaluation & Research in Education, vol. 23, no. 4, pp. 255-72. Krueger, AO 2002, Opening remarks on globalization in historical perspective., viewed 10 October 2009, <http://imf.org/external/np/speeches/2002/081202.htm>. Kuh, GD 2006, The national survey of student engagement: Conceptual framework and overview of psychometric properties, viewed 10 February 2010, <http://nsse.iub.edu/2004_annual_report/pdf/2004_Conceptual_Framework.pdf>. Kuh, GD 2009, 'The national survey of student engagement: Conceptual and empirical foundations', New Directions for Institutional Research, vol. 2009, no. 141, pp. 5-20. Kuh, GD & Shouping, H 2001, 'The effects of student-faculty interaction in the 1990s', Review of Higher Education, vol. 24, no. 3, pp. 309-32. Kuh, GD & Gonyea, RM 2003, 'The role of the academic library in promoting student engagement in learning', College & Research Libraries, vol. 64, no. 4, pp. 256-82. Kuh, GD, Nelson Laird, TF & Umbach, PD 2004, 'Aligning faculty activities & student behavior', Liberal Education, vol. 90, no. 4, pp. 24-31. Kuh, GD, Cruce, TM, Shoup, R, Kinzie, J & Gonyea, RM 2008, 'Unmasking the effects of student engagement on first-year college grades and persistence', The Journal of Higher Education, vol. 79, no. 5, pp. 541-63. LaNasa, S, Cabrera, A & Trangsrud, H 2009, 'The construct validity of student engagement: A confirmatory factor analysis approach', Research in Higher Education, vol. 50, no. 4, pp. 315-32. Lewis, RG & Smith, DH 1994, Total quality in higher education, St. Lucie Press, Delray Beach, Florida. Madaus, GF, Airasian, PW & Kellaghan, T 1980, School effectiveness: A reassessment of the evidence, McGraw-Hill Book Company, New York. Marchionini, G & Maurer, H 1995, 'The roles of digital libraries in teaching and learning', Communications of the ACM, vol. 38, no. 4, pp. 67-75. Marsh, G 2012, 'Soft skills and the future', Training Journal, pp. 39-41. McVay, GJ, Murphy, PR & Yoon, SW 2008, 'Good practices in accounting education: Classroom configuration and technological tools for enhancing the learning environment', Accounting Education: an International Journal, vol. 17, pp. 41-63. Mintz, SM 2009, 'The impact of ifrs on accounting professionals and accounting education', Today's CPA, vol. November/December, pp. 24-7.
302
Mizikaci, F 2006, 'A system approach to program evaluation model for quality in higher education', Quality Assurance in Education, vol. 14, no. 1, pp. 37-53. Mohamed, EKA & Lashine, SH 2003, 'Accounting knowledge and skills and the challenges of a global business environment', Managerial Finance, vol. 29, no. 7, pp. 3-16. Mula, JM 2007, 'Can competency skills for accounting students be internationally-harmonised? An indonesian application', in Acconting and Finance Association of Australia and New Zealand (AFAANZ) Conference, Sydney: proceedings of theAcconting and Finance Association of Australia and New Zealand (AFAANZ) Conference, Sydney. Mulaik, SA, James, LR, Van Alstine, J, Bennett, N, Lind, S & Stilwell, CD 1989, 'Evaluation of goodness-of-fit indices for structural equation models', Psychological Bulletin, vol. 105, no. 3, pp. 430-45. Murdoch, B & Guy, PW 2002, 'Active learning in small and large classes', Accounting Education, vol. 11, pp. 271-82. Nadiri, H & Tümer, M 2010, 'Influence of ethnocentrism on consumers' intention to buy domestically produced goods: An empirical study in north cyprus', Journal of Business Economics and Management, vol. 11, no. 3, pp. 444-61. Nearon, BH 2002, 'A radical proposal accounting education', CPA Journal, vol. 72, no. 10, pp. 28-33. Needles, BE 2010, 'Accounting education: The impact of globalization', Accounting Education: an International Journal, vol. 19, no. 6, pp. 601-5. Neuman, LW 2000, Social research methods: Qualitative and quantitative approaches, 4th edn, Allyn and Bacon, Boston. Neymotin, F 2008, The relationship between school funding and student achievement in kansas public schools, School of Business Kansas University, http://www.business.ku.edu/ _FileLibrary/PageFile/1041/TR08-1205--EducationSpending_Neymotin.pdf>. Nishikawa, I 2011, A vision paper of the asian-oceanian standard-setter group (aossg), AOSSG, 26 July 2011, <http://www.aossg.org/docs/About_Us/Vision_Paper.pdf>. Norwani, NM 2005, 'Learning outcomes at higher learning institutions: Do institutional environments matter?', in Forum of the Australasian Association for Institutional Research: proceedings of theForum of the Australasian Association for Institutional Research pp. 43-52. NSSE 2009, Nsse survey instruments., viewed 20 March, <http://nsse.iub.edu/ html/survey_instruments_2009.cfm>. Nugroho, BW 2008, 'The impact of nationally-standardised tests on students, teachers, and schools', Basis Magazine, vol. July-August.
303
Ololube, NP 2006, Teachers job satisfaction and motivation for school effectiveness: An assessment, viewed 12 October 2009, <http://www.usca.edu/essays/vol182006/ololube.pdf>. Owlia, MS & Aspinwall, EM 1996, 'A framework for the dimensions of quality in higher education', Quality Assurance in Education, vol. 4, no. 2, pp. 12-20. Page, D & Mukherjee, A 2000, 'Improving undergraduate student involvement in management science and business writing courses using the seven principles in action', Education, vol. 120, no. 3, pp. 547-58. Pascarella, ET & Terenzini, PT 1991, How college affect students: Findings and insights from twenty years of research, Jossey-Bass Publisher, San Fransisco. Payne, SL, Kleine, KLM, Purcell, J & Carter, GR 2005, 'Evaluating academic challenge beyond the nsse', Innovative Higher Education, vol. 30, no. 2, pp. 129-46. Perera, H & Baydoun, N 2007, 'Convergence with international financial reporting standards: The case of indonesia', Advances in International Accounting, vol. 20, pp. 201-24. Pervin, LA 1967, 'The college as a social system a fresh look at three critical problems in higher education', Journal of Higher Education, vol. 38, no. 6, pp. 317-22. Pontoh, NK & Ardjo, MAT 2007, Perception and preference of in-migrant students on rusunawa as a residence alternative in the city of bandung, SAPPK-ITB, Bandung. Porter, SR 2005, Introduction to multilevel modeling, viewed 10 February 2010, <www.airweb.org/institutedata-display.asp?id=44>. Preacher, KJ & Hayes, AF 2004, 'Spss and sas procedures for estimating indirect effects in simple mediation models', Behavior Research Methods, Instruments, & Computers, vol. 36, no. 4, pp. 717-31. Preacher, KJ & Leonardelli, GJ 2010, Calculation for the sobel test: An interactive calculation tool for mediation tests, viewed 31 October 2011, <http://quantpsy.org/sobel/sobel.htm>. Reinstein, A & Bayou, ME 1997, 'Critical thinking in accounting education: Processes, skills, and applications', Managerial Auditing Journal, vol. 12, no. 7, pp. 336-42. Rendon, LI 2002, 'Community college puente : A validating model of education', Educational Policy, vol. 16, no. 4, pp. 642-67. Riduwan 2006, 'Kontribution of professional competencies and work motivation on lecturers' performance: A study at jendral ahmad yani university cimahi municipality', Universitas Pendidikan Indonesia, Bandung. Rohde, FH & Kavanagh, M 1996, 'Performance in first year university accounting: Quantifying the advantage of secondary school accounting', Accounting & Finance, vol. 36, pp. 275-85.
304
Rosser, A 1999, The political economy of accounting reform in developing countries: The case of indonesia., Murdoch University, viewed July 12 2010, <http://wwwarc.murdoch.edu.au/wp/wp93.pdf>. Rowe, K 2002, 'The measurement of latent and composite variables from multiple items or indicators: Application in performance indicator systems', in Royal Melbourne Institute of Technology Statistics Seminar Series: proceedings of theRoyal Melbourne Institute of Technology Statistics Seminar Series Melbourne, <http://www.ncac.gov.au/ report_documents/composite_variables.pdf>. Saadé, RG & Kira, D 2009, 'Computer anxiety in e-learning: The effect of computer self-efficacy', Journal of Information Technology Education, vol. 8, pp. 177-91. Sandeen, A 2003, Enhancing student engagement on campus, University Press of America, New York. Siegel, S & Castellan Jr., NJ 1988, Nonparametric statistics for the behavioral sciences, McGraw-Hill, Inc, New York. Slack, N, Chambers, S & Johnston, R 2004, Operations management, 4th edn, Prentice Hall, London. Soenarta, N 2005, Education cost in indonesia: A comparison between dutch colony and republic of indonesia periods, viewed 20 March 2010, <<http://www.duniaesai.com/pendidikan/didik14.html>>. Solomonides, I 2009, Student engagement principles., Learning and Teaching Center, viewed 1 January 2011, <http://www.mq.edu.au/ltc/pdfs/Engagement_Principles.pdf>. Springer, CW & Borthick, AF 2004, 'Business simulation to stage critical thinking in introductory accounting: Rationale, design, and implementation', Issues in Accounting Education, vol. 19, pp. 277-303. Strauss, AL 1987, Qualitative analysis for social scientist, Cambridge University Press, New York. Strayhorn, TL 2008, 'How college students' engagement affects personal and social learning outcomes', Journal of College & Character, vol. 10, no. 2, pp. 1-16. Sudaryono, Y 2008, A reflection of indonesian education quality, viewed 30 March 2010, <<http://enewsletterdisdik.wordpress.com/2008/05/01/kualitas-pendidikan-indonesia-suatu-refleksi/>>. Sudiro, A 2008, 'The reciprocal influence of job satisfaction with family satisfation and job commitment and their impact on job achievement and lecturers' career', Jurnal Manajemen dan Kewiraushaan, vol. 10, no. 1, pp. 38-49. Syptak, JM, Marsland, DW & Ulmer, D 1999, Job satisfaction: Putting theory into practice., viewed 13 November 2009, <http://www.aafp.org/fpm/991000fm/26.html>.
305
Tacq, J 1997, Multivariate analysis techniques in social science research, Sage Publication, London. Thurmond, VA, Wambach, K & Connors, HR 2002, 'Evaluation of student satisfaction: Determining the impact of a web-based environment by controlling for student characteristics', American Journal of Distance Education, vol. 16, no. 3, pp. 169-89. Tigelaar, DEH, Dolmans, DHJM, Wolfhagen, IHAP & Van Der Vleuten, CPM 2004, 'The development and validation of a framework for teaching competencies in higher education', Higher Education, no. 48, pp. 253-68. Tinto, V 1993, Leaving college, rethinking the causes and cures of student attrition, The University of Chicago Press, Chicago. Toombs, WE & Tierney, WG 1993, 'Curriculum definitions and reference points', Journal of Curriculum & Supervision, vol. 8, no. 3, pp. 175-95. Tow, C 2006, 'The effect of school funding on student academic achievement: A study of california school district.', University of California, Berkeley. Tsay, M & Brady, M 2010, 'A case study of cooperative learning and communication pedagogy: Does working in teams make a difference?', Journal of the Scholarship of Teaching & Learning, vol. 10, pp. 78-89. Tyagi, PK 1985, 'Diagnosing learning motivation of marketing students: An approach based on expectancy theory', Journal of Marketing Education, vol. 7, no. 2, pp. 28-34. Ullah, H & Wilson, MA 2007, 'Students' academic success and its association to student involvement with learning and relationship with faculty and peers', College Student Journal, vol. 41, no. 4, pp. 1192-202. Umbach, PD & Wawrzynski, MR 2005, 'Faculty do matter: The role of college faculty in student learning and engagement', Research in Higher Education, vol. 46, no. 2, pp. 153-84. UVic 2006, University of victoria 2006 national survey of student engagement., viewed 10 February 2010, <http://www.inst.uvic.ca/surveys/2006NSSE_Analysis.pdf>. Verceles, PB & Rivera, NC 2010, 'Faculty teaching performance profile of dmmmsu- college of education', E-International Scientific Research Journal, vol. 2, no. 1, pp. 70-5. Walker, CO, Greene, BA & Mansell, RA 2006, 'Identification with academics, intrinsic/extrinsic motivation, and self-efficacy as predictors of cognitive engagement', Learning & Individual Differences, vol. 16, no. 1, pp. 1-12. Wang, J, Smith, TW & Steve Oliver, J 2006, 'An empirical examination of gender stereotype from the result of national board certification', Teacher Education & Practice, vol. 19, no. 3, pp. 365-79. Weil, S, Oyelere, P & Rainsbury, E 2004, 'The usefulness of case studies in developing core competencies in a professional accounting programme: A new zealand study', Accounting Education, vol. 13, pp. 139-69.
306
Wolcot, SK 2006, Overview of assessment methods for the classroom., viewed 6 April, <http://www.wolcottlynch.com/Downloadable_Files/ClassroomAssessmentOverview_060717.pdf>. Woods, AM & Weasmer, J 2004, 'Maintaining job satisfaction: Engaging professionals as active participants', Clearing House, vol. 77, no. 3, pp. 118-21. Woodside, BM, Wong, EH & Wiest, DJ 1999, 'The effect of student-faculty interaction on college students' academic achievement and self concept', Education, vol. 119, no. 4, pp. 730-3. Wu, AJ 2008, 'Integrating the aicpa core competencies into classroom teaching', CPA Journal, vol. 78, no. 8, pp. 64-7. Wynder, M 2004, 'Facilitating creativity in management accounting: A computerized business simulation', Accounting Education, vol. 13, no. 2, pp. 231-50. Yapa, P 2004, Asean federation of accountants (afa) regional harmonization accounting, viewed 10 January 2011, <http://www.smu.edu.sg/events/apira/2004/Final%20Papers/1087-Yapa.pdf>. Yining, C & Hoshower, LB 1998, 'Assessing student motivation to participate in teaching evaluations: An application to expectancy theory', Issues in Accounting Education, vol. 13, pp. 531-49. Yongyi, W, Arboleda, A, Shelley Ii, MC & Whalen, DF 2004, 'The influence of residence hall community on academic success of male and female undergraduate students', Journal of College & University Student Housing, vol. 33, no. 1, pp. 16-22. Yusuf, AR 2006, 'The influence human recource develompement on lecturers' knowledge, skills, attitude, and performance in the area of teaching and education at the university of haluoleo kendari, south-east sulawesi.', Universitas Airlangga, Surabaya. Zhang, J & Zheng, W 2009, 'How does satisfaction translate into performance? An examination of commitment and cultural values', Human Resource Development Quarterly, vol. 20, no. 3, pp. 331-51. Zikmund, WG, Babin, BJ, Carr, JC & Griffin, M 2010, Business research methods, Eight edn, South-Western Cengage Learning, Mason.

307
APPENDICES