University of South Florida Feasibility, Sustainability...
40
Page | 61 University of South Florida Feasibility, Sustainability and Economic Analysis of Solar Assisted Biomass Conversion (Final Report) PI: B. Joseph Co-PI: Q. Zhang Students: Matt W etherington ( BSChE), M aria P inilla (MS, C ivil a nd E nvironmental E ngineering), Chita Yang (PhD in Chem. Engg.) Description: The main d eterrent f or co mmercialization of b iomass co nversion p rocesses i s the co st of conversion; particularly the need to sacrifice as much as 30% of the energy content in the biomass for the thermo ch emical co nversion st ep. W e w ant t o research a nd d evelop t he co ncept t o u se solar thermal energy from concentrating units to provide energy for the biomass gasification step. We also propose to evaluate the sustainability of such a process. Overall Ob jective: The o verall o bjective i s t o co nduct a t heoretical an alysis o f so lar ass isted t hermo chemical conversion o f b iomass f rom t he p oint o f view o f en ergy ef ficiency, eco nomic f easibility, environmental impact, and long term sustainability of renewable energy production. Budget: $45,238 Universities: USF Executive Summary The overall objective is to conduct a theoretical analysis of thermo chemical conversion of biomass with and without solar energy from the point of view of energy efficiency, economic feasibility, environmental impact, and long term sustainability of renewable energy production. We c ompleted p rocess d esign an d e conomic a nalysis o f the t hermochemical conversion o f b iomass to liquids w ith a nd w ithout solar e nergy. It w as f ound that t he c apital c ost o f t he s olar e nergy c ollection system is a significant factor in the economics of the process. The cost of solar thermal systems will have to be reduced before solar assisted biomass gasification can become feasible. Based o n economic an alysis, the g oal o f L CA h as been s hifted t o compare d ifferent feedstocks an d processes b ecause so lar a ssisted b iomass co nversion i s not economically f easible. I n t his s tudy, a comparative L CA h as b een d eveloped to ev aluate the en vironmental i mpacts associated w ith d ifferent energy products via different routes across the whole life of algal and lignocellulosic bioenergy. Results were compared per energy basis, the production of 1 million BTU of energy products. It was found that cultivated algae biomass feedstock has much higher environmental impacts compared with lignocellulosic biomass f eedstock f rom f orestation a nd a griculture byproducts. I t w as a lso concluded t hat thermochemical g asification an d F TS p rocess sh owed h igher e fficiency w hen converting b iomass t o bioenergy.
Transcript of University of South Florida Feasibility, Sustainability...

Page | 61
University of South Florida Feasibility, Sustainability and Economic Analysis of Solar Assisted Biomass
Conversion (Final Report)
PI: B. Joseph Co-PI: Q. Zhang Students: Matt W etherington ( BSChE), M aria P inilla (MS, C ivil a nd E nvironmental E ngineering), Chita Yang (PhD in Chem. Engg.) Description: The main deterrent for commercialization of b iomass conversion p rocesses i s the cost of conversion; particularly the need to sacrifice as much as 30% of the energy content in the biomass for the thermo ch emical co nversion st ep. W e w ant t o research a nd d evelop t he co ncept t o u se solar thermal energy from concentrating units to provide energy for the biomass gasification step. We also propose to evaluate the sustainability of such a process. Overall Ob jective: The o verall o bjective i s t o co nduct a t heoretical an alysis o f so lar ass isted t hermo chemical conversion o f b iomass f rom t he p oint o f view o f en ergy ef ficiency, eco nomic f easibility, environmental impact, and long term sustainability of renewable energy production. Budget: $45,238 Universities: USF
Executive Summary The overall objective is to conduct a theoretical analysis of thermo chemical conversion of biomass with and without solar energy from the point of view of energy efficiency, economic feasibility, environmental impact, and long term sustainability of renewable energy production. We c ompleted p rocess d esign an d e conomic a nalysis o f the t hermochemical conversion o f b iomass to liquids with a nd without solar e nergy. It was f ound that t he c apital c ost o f t he s olar e nergy c ollection system is a significant factor in the economics of the process. The cost of solar thermal systems will have to be reduced before solar assisted biomass gasification can become feasible. Based o n economic an alysis, the g oal o f L CA h as been s hifted t o compare d ifferent feedstocks an d processes b ecause so lar a ssisted b iomass co nversion i s not economically f easible. I n t his s tudy, a comparative L CA h as b een d eveloped to ev aluate the en vironmental i mpacts associated w ith d ifferent energy products via different routes across the whole life of algal and lignocellulosic bioenergy. Results were compared per energy basis, the production of 1 million BTU of energy products. It was found that cultivated algae biomass feedstock has much higher environmental impacts compared with lignocellulosic biomass f eedstock f rom f orestation a nd a griculture byproducts. I t w as a lso concluded t hat thermochemical g asification an d F TS p rocess sh owed h igher e fficiency w hen converting b iomass t o bioenergy.

Page | 62
University of South Florida Power Generation Expansion Portfolio Planning to Satisfy Florida's Growing
Electricity Demands (Final Report)
PI: Tapas K. Das Co-PIs: Ralph Fehr Students: Patricio Rocha (Ph.D. graduated August 2011), Felipe Feijoo (Ph.D.) Description: The o bjectives o f the p roposed r esearch a re to 1) d evelop a comprehensive g eneration technology ba sed por tfolio opt imization ( GTPO) model a nd i ts s olution a lgorithm, a nd 2) de velop educational resources to enhance training of scientific workforce for the state of Florida. The research will directly address three major challenges: fulfillment of the growing power demand, meeting the emissions targets, and supply of technology workforce. The potential economic impact of the proposed research on the State of Florida is expected to be very high, since an energy-secure environment is a basic necessity to support the current trend of explosive growth both in industry and human resources. Budget: $ 71,906 Universities: USF External Collaborators: Argonne National Laboratory (not funded by this project) EXECUTIVE SUMMARY
The first phase of the project was focused on the generation capacity expansion aspect of the electricity networks. We begin the executive summary by providing the title and the abstract of that study. A detailed report on the Phase I is provided as a separate document. Phase II of the project focused on the cap-and-trade policy designs for carbon emissions reduction. In the rest of the executive summary, we provide details of our findings from this phase. Phase I: Title: Impact of CO2 Cap-and-Trade Programs on Restructured Power Markets with G eneration Capacity Investments
P. Rocha PJM Interconnection
Norristown, PA, USA 19403 T. K. Das
University of South Florida, Tampa, Florida, USA 33613
V. Nanduri University of Wisconsin-Milwaukee, Milwaukee, Wisconsin, USA 53201
A. Botterud Center for Energy, Environmental, and Economic Systems Analysis,
Argonne National Laboratory, Argonne, Illinois, USA 60439

Page | 63
Abstract
A cap -and-trade program i s t he m ost w idely d iscussed p olicy a imed at ac hieving C O2 em issions reductions. Since power plants in the U.S. and other industrialized nations are responsible for a sizable portion of CO2 emissions, the implementation of a CO2 cap-and-trade program will have a s ignificant impact on the power generation sector. Assessing this impact is a challenging task, especially in restructured e lectricity markets. C ap-and-trade p rograms co nsider m ultiple design p arameters an d attributes as well as the creation of a new market for CO2 allowances, all of which will affect the capacity investment d ecisions o f g enerators an d t he b ids that g enerators su bmit t o t he d ay-ahead an d r eal-time electricity markets. In this paper, we develop a g ame theoretic model driven methodology to assess the impact o f C O2 cap -and-trade p rograms i n r estructured el ectricity markets. T he m ethodology i s implemented on a sam ple power network created from the electricity market data of northern Illinois in the U.S. The network is assumed to operate under a CO2 cap-and-trade program similar to the Regional Greenhouse G as I nitiative ( RGGI). T he i mpact o f c ap-and-trade pol icy on t he e quilibrium g eneration expansion plan and the electricity market operation is examined via variations in prices, CO2 emissions, demand, and evolution of technology mix in the generation portfolio over a planning horizon. Phase II: Title: Pareto Optimal Designs for CO2 Cap-and-Trade Policies in Deregulated Electricity Networks
Felipe A. Feijoo and Tapas K. Das Department of Industrial and Management System Engineering
University of South Florida, 4202 E. Fowler Avenue, Tampa, FL 33620
Abstract Economic studies have shown that CO2 emission reduction programs are likely to have adverse effects on the electricity network performance (e.g., rise in LMPs). Among the CO2 emission reduction programs, cap-and-trade (C&T) is the most widely used strategy. Current research on C&T policies can be categorized i nto models for a llowance a llocation (no-cost a llocation b ased o n emissions history o r v ia auction) a nd empirical e conomic s tudies for e xamining i mpact on n etwork pe rformance. This pa per presents a mathematical-statistical approach to develop Pareto-optimal designs for CO2 C&T policies by examining t he combined impact o f policy design parameters (initial allowance cap, cap r eduction rate, violation penalty) on various measures of network performance. Measures that are considered are social welfare an d the co rresponding sy stem marginal co st o r p rice ( MP), C O2 emissions, a nd e lectricity production level. The model has two l ayers: t op l ayer i nvolves design of op timal cap-and-trade policy parameters over a planning horizon, and the bottom layer involves finding equilibrium bidding strategies of the competing generators while maximizing social welfare via DC-OPF. In the bottom layer, for each competing g enerator, w e f ormulate a b i-level m athematical m odel, w here the upper l evel f ocuses o n maximizing generator profit through bi ds t o ISO i n bot h allowance a nd e lectricity markets. The l ower level focuses on social welfare maximization while meeting the network and policy co nstraints. We reformulate each bi-level problem as a mathematical problem with equilibrium constraints (MPEC). The equilibrium bidding behavior among the competing generators is obtained by solving the set of MPECs as an e quilibrium pr oblem w ith e quilibrium c onstraints ( EPEC). F or t he t op layer, w e us e a s tatistical (designed experiment) approach to examine the impact of individual C&T policy parameters on network performance (obtained from the bottom layer). This yields regression models linking policy parameters to each network performance measure. Finally, a multi-objective optimization approach is used to develop the Pareto optimal cap-and-trade designs.

Page | 64
University of South Florida Solar Photovoltaic Manufacturing Facility to Enable a Significant Manufacturing
Enterprise within the State and Provide Clean Renewable Energy (Progress Report)
PI: Don L. Morel Co-PI: Chris Ferekides, Lee Stefanakos Students: K. J ayadevan ( MS), S . B endapudi ( MS 5/ 11), R . A nders ( PhD), Y . W ang ( PhD), Manikandan Sampathkumar (MS) Description: The primary goal of this project is to enable the establishment and success of local solar photovoltaic manufacturing companies to produce clean energy products for use within the state a nd be yond a nd t o g enerate j obs a nd t he s killed w orkforce n eeded f or t hem. T hin f ilm technologies have shown record e fficiencies of 20%, and present t remendous oppor tunities for new Florida s tart-up c ompanies. U SF, UCF, and U F a re c ollaborating t o de velop a pi lot l ine facility f or th in f ilm s olar te chnologies, w hich will s erve a s a te st b ed f or ma king o ngoing improvements i n pr oductivity a nd p erformance of s olar m odules, de velop a dvanced manufacturing pr otocols, a nd he lp t rain a s killed w orkforce t o e nsure t he s uccess of ne w companies. Budget: $1.6M Universities: USF, UCF, UF External Collaborators: Mustang Solar, a Division of Mustang Vacuum Systems Summary of Annual Progress Over t he p ast y ear p rogress h as continued t o be m ade on t he t wo main t ask a reas of t he project, de velopment of t he T hin-Film P ilot L ine de position s ystem a nd de velopment a nd advancement of laboratory scale processes for CIGS related materials and devices. As a result of the ch anging l andscape r elated t o C IGS m anufacture t he P ilot Line S ystem w as m odified t o focus on the key elements currently controlling commercialization of the technology. Simulation tools t hat a ddress c ost f actors a s w ell a s t echnology w ere de veloped a nd utilized t o guide t he redirection of t he de sign. It w as de termined t hat de position r ates of 2 0 Å/s an d ab ove w ere needed t o hi t t he t argeted c ost f actors for c apital e quipment ut ilization. T he de sign o f t he deposition machine and the process recipes will allow attainment of these rates. The key factor for machine and process design on the technology side is the arrival rate and sequence of the CIGS constituents. Simulation tools have been developed and utilized that allow de termination a nd c ontrol of t hese s pecies. T he de position t ool s et ut ilizes t wo pa ir of metal deposition sources and several Se sources distributed over the deposition zones. The two-dimensional deposition profile of the components are individually simulated and then combined to s imulate th e o verall tw o-dimensional p rofile. Imbedded in th e s imulations is th e a bility to control t he e volution of t he m etal r atios a cross t he de position zone. A nd, s imulation of the Se/metal profiles within a t argeted range completes the capture of the entire deposition process. The insights provided from these simulations have guided the design of the deposition system. It will be versatile enough to enable access to a large range of deposition space that contains the
Page | 65
optimum p arameters f or p erformance an d co st control. T he m achine c omponents ha ve b een delivered, and it is currently being assembled. Based upon C IGS laboratory scale experimentation that has been underway two process recipes h ave be en c hosen t o i mplement i n t he P ilot M achine. T he i nitial c onfiguration of t he machine will be directed toward determining which of these has the most potential for success. On a l onger t imeframe w e h ave also b een d eveloping C uZnSnSe(CZTS) as a s ustainable substitute for CIGS. With increasing production volume the availability of In may drive up its cost. CZTS uses earth abundant materials and has demonstrated efficiency in the 10% range. We have be en d eveloping t he m aterial, a nd w ith ne w i nsights ga ined from us e of R aman spectroscopy have made s ignificant p rogress in improving material quality. Initial results f rom devices made with the upgraded material are also promising.
3.0 Thin Film Pilot Line
As progress is being made in the manufacture of CIGS solar panels new challenges and opportunities are emerging for ongoing growth of the technology. Champion large area module efficiencies of 16% are being reported, and average production efficiencies are catching up. So it is clear that performance parameters for large scale applications can be met. What remains is to demonstrate that costs are competitive and have a pathway to remaining so. The key to cost is throughput and materials utilization. These translate to fast deposition rates and management of In a nd G a ut ilization. F rom t he be ginning of our r esearch e ndeavors a t U SF w e ha ve a lways pursued de position technologies th at w ould b e able to p ass c ommercialization mu ster w hile avoiding t hose t hat a llowed f ast pa thways t o hi gh e fficiency, but ha d no c hance a t commercialization. There has been a s eries of companies that failed by trying to commercialize the easy high efficiency technologies. With this backdrop we have designed our new deposition system to a ccommodate th e c ommercialization d rivers. T he s ystem w ill in corporate to ols to evaluate deposition approaches that have not been reported in the literature. Our objective is to demonstrate that one of these surpasses commercialized technologies in performance and cost.
0
0.05
0.1
0.15
0.2
0.25
0.3
0.35
0.4
10 15 20 25 30
Abso
rber
Dep
ositi
on C
ost $
/W
Deposition Rate Å/s
1 set,5000 A
1 set,4000 A
1 set,3000 A
2 sets,4000 A
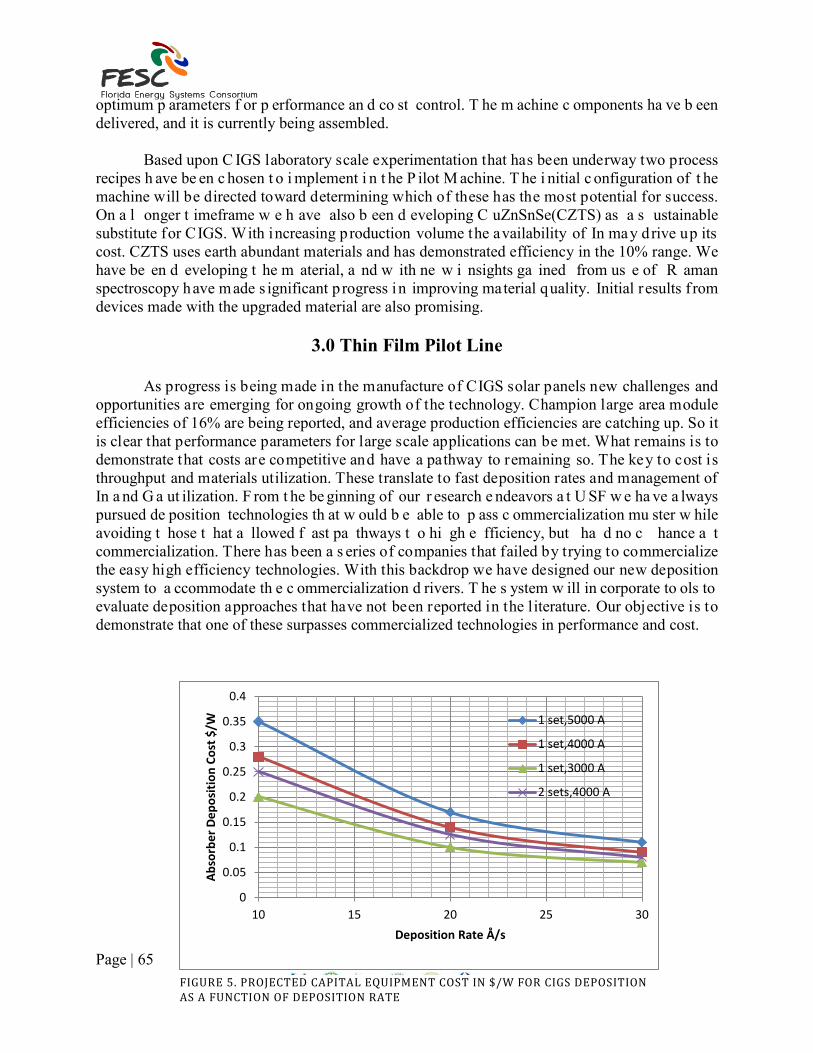
FIGURE 5. PROJECTED CAPITAL EQUIPMENT COST IN $/W FOR CIGS DEPOSITION AS A FUNCTION OF DEPOSITION RATE

Page | 66
Cost Simulation Throughout t he pr oject w e ha ve de veloped a nd us ed s imulation t ools t o g uide our technology development. Of particular importance to the design of the deposition system is the projected capital cost/Watt for the deposition tool. The drivers for this cost factor are the capital cost of the equipment, the throughput, the efficiency and the yield. There are also variations for series and parallel target configurations that have various cost t radeoffs. An example of results for a few of these configurations is shown in Fig. 1. T his component for the cost of a finished module should be about 20%, which for a selling price of $0.60/W should be around $0.12/W. As can be seen in t he f igure, t his t hreshold can be reached for deposition rates of 20 Å/s and higher. At t his poi nt i t i s ne cessary t o br ing a nother t echnical f actor i nto t he cost di scussion. Deposition r ates of 20 Å/s c an be a ttained b y both s puttering a nd t hermal e vaporation of t he source m aterials. W hile t hermal e vaporation i s t he t echnology t hat ha s been us ed t o pr ogress efficiencies t o t he 20% l evel, i t h as not p roven t o be a s uccessful t echnique f or large a rea manufacturing. S puttering i s c onsidered t he t echnology of c hoice f or l arge area m anufacture because of its ability to deposit uniformly and reproducibly over large areas. Ideally one would like then to just sputter from a CIGS target or maybe a combination of CuSe, In2 Se3 and Ga2 Se2 targets. These approaches have not worked l argely because of loss of Se, but even i f they did, sputter rates of 20 Å/s and higher are not realistic for “ceramic” targets. Thus sputtering of metals is what must be pursued, and that is what we, and others, are working at. Depositing Cu, In and Ga at these rates is not the problem, it is rather how to selenize the metal layers. This is where innovations are needed to enable the emergence of this t echnology and what i s guiding our efforts and the design of our deposition tool.

Page | 67
Deposition Simulation The p rocess r ecipes t hat we will be d eveloping are b ased upon sputtering o f t he m etal components. W e w ill p ursue a c ouple of di fferent a pproaches t o S e d elivery and de termine which is most effective. The deposition system will be in a roll-to-roll configuration and will be able to h andle “plastic” as w ell a s s tainless s teel coils. T he w idth o f th e s ubstrate w ill b e 4 ”. Champion efficiency cells are made in deposition systems on small substrates onto which all four components, Cu, In, Ga and Se
Series1
Series6
Series…
0.00
0.20
0.40
0.60
.80
00
1 3 5 7 9 11 13 15 17 19 21 23 25 27 29 31 33 35 37
Film
Thi
ckne
sse
Distance in inches
Target is located at 20".
FIGURE 6. THICKNESS PROFILE OF A SPUTTERED FILM ON THE WEB.
0%
20%
40%
60%
80%
100%
-20 -10 0 10 20
% o
f Tot
al T
hick
ness
Position
FIGURE 3. CUMULATIVE THICKNESS AS A FUNCTION OF WEB POSITION.
0.00
0.50
1.00
1.50
2.00
2.50
0 10 20 30 40 50 60 70 80 90 100
Met
al R
atio
Position
Cu/(In+Ga)
Ga/(In+Ga)
FIGURE 4. METAL RATIO PROFILES FROM FOUR SPUTTERING SOURCES.

Page | 68
are delivered to the substrate s imultaneously and carefully controlled. This is not possible in a manufacturing scale system based upon sputtering. In these systems the components are delivered to a moving s ubstrate b y m ultiple s puttering s ources. Consequently th ere are t ime o ffsets in th e a rrival of the constituents. Given the complex phase space of C IGS a nd t he pot ential f or f ormation of unfavorable pha ses i t i s i mportant t o unde rstand the f ormation chemistry and t o d esign t he deposition tools to be able to access the region of deposition s pace t hat pr oduces hi gh qua lity, single-phase CIGS. Throughout the years we have explored a nd s tudied m any regions of t his ph ase space a nd ha ve de signed t he de position t ool t o access r egions t hat w e know t o be vi able. T o effectively u se t his u nderstanding w e h ave developed de position s imulation t ools t o g uide design of the deposition tools. Figure 1 s hows the instantaneous thickness profile, or equivalently the flux, of the deposition along the web for a sputter target located a t 20”. Fig. 3 s hows the resulting thickness increase as the web moves over the sputtering s ource. T here i s a c orresponding pr ofile f or a s econd s putter s ource a djacent t o t he first one . It ha s t he s ame pr ofile, but of fset f rom t he f irst s ource. T hus the i nstantaneous composition a t a ny l ocation on t he w eb c an be determined. F urther, t he c omposition c an be changed by adjusting the separation distance between the sources, the sputter gun angle and the deposition rates. Fig. 4 is an example of the emergence of the metal ratio profile as a function of position for four sputtering sources resulting in t argeted ratios of 0.9 f or Cu/(In + Ga) and 0.4 for Ga/(In + Ga). In a ddition t o c ontrolling th e me tal fluxes it is imp ortant to a ttain th e p roper delivery profile for Se. It is necessary to have an overpressure of Se to achieve full selenization of the films. A simulation result for one of the two pairs of sputter sources used for the Fig. 4 simulation is shown in Fig. 5. The targeted ratio of Se/metal is 3 – 5. The red(top) curve in the figure is this ratio and indicates that the desired range is achieved. The underlying curves are the contributions from the individual sources.
0
1
2
3
4
5
6
7
0 5 10 15 20
Flu
x R
atio
s
Location(in)
FIGURE 5. FLUX RATIOS FOR TWO SPUTTER SOURCES AND SE SOURCES.
Page | 69
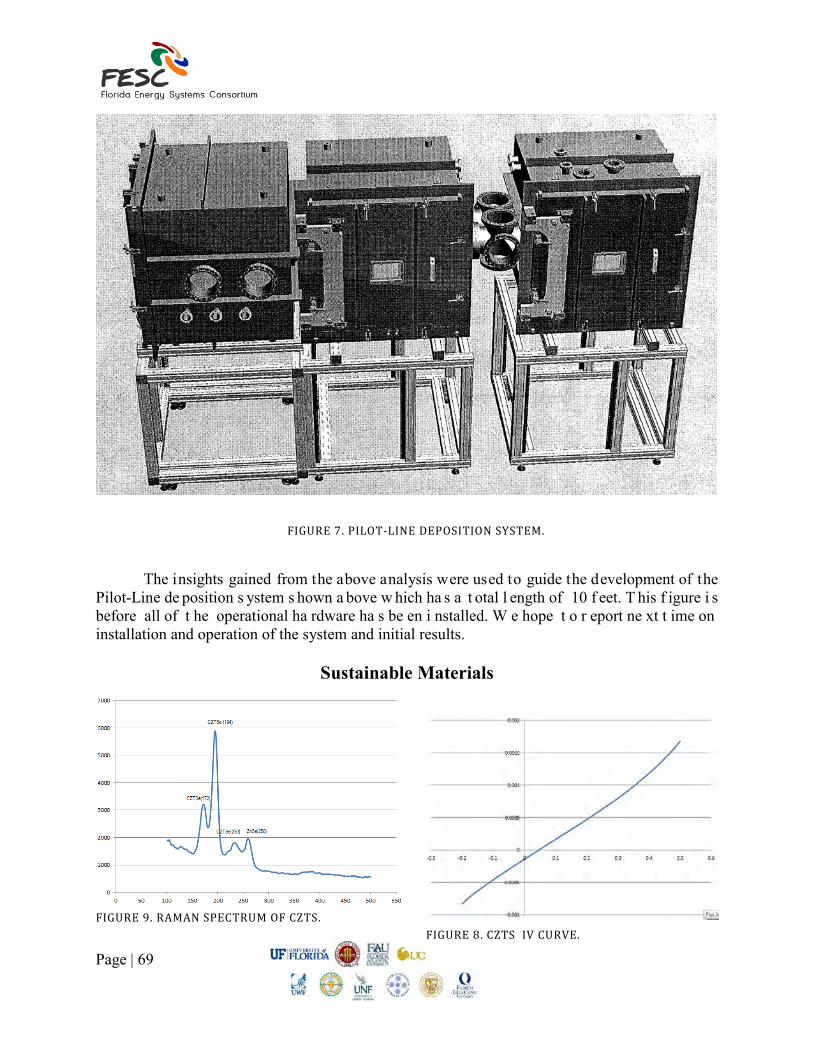
FIGURE 7. PILOT-LINE DEPOSITION SYSTEM.
The insights gained from the above analysis were used to guide the development of the Pilot-Line de position s ystem s hown a bove w hich ha s a t otal l ength of 10 f eet. T his f igure i s before all of t he operational ha rdware ha s be en i nstalled. W e hope t o r eport ne xt t ime on installation and operation of the system and initial results.
Sustainable Materials
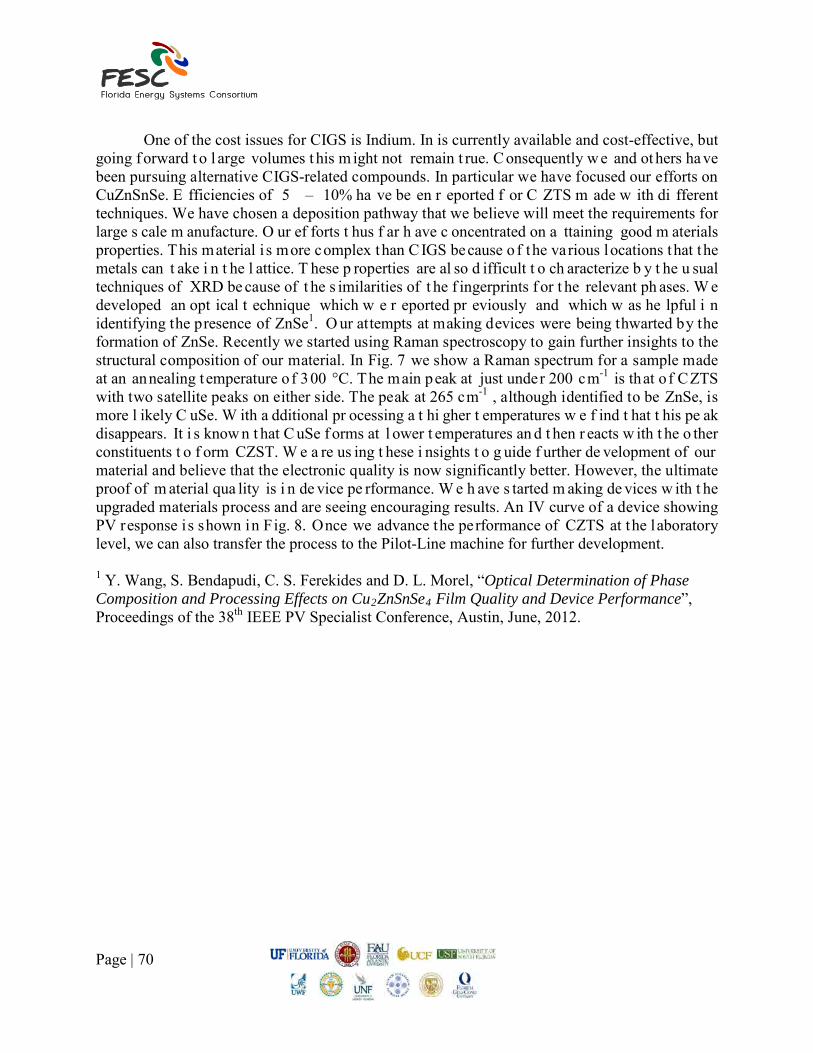
FIGURE 9. RAMAN SPECTRUM OF CZTS. FIGURE 8. CZTS IV CURVE.
Page | 70
One of the cost issues for CIGS is Indium. In is currently available and cost-effective, but
going f orward t o l arge volumes t his m ight not remain t rue. C onsequently w e and ot hers ha ve been pursuing alternative CIGS-related compounds. In particular we have focused our efforts on CuZnSnSe. E fficiencies of 5 – 10% ha ve be en r eported f or C ZTS m ade w ith di fferent techniques. We have chosen a deposition pathway that we believe will meet the requirements for large s cale m anufacture. O ur ef forts t hus f ar h ave c oncentrated on a ttaining good m aterials properties. This material i s more complex than CIGS because o f the various locations that the metals can t ake i n t he l attice. T hese p roperties are al so d ifficult t o ch aracterize b y t he u sual techniques of XRD be cause of t he s imilarities of t he f ingerprints f or t he relevant ph ases. W e developed an opt ical t echnique which w e r eported pr eviously and which w as he lpful i n identifying the presence of ZnSe1. O ur attempts at making devices were being thwarted by the formation of ZnSe. Recently we started using Raman spectroscopy to gain further insights to the structural composition of our material. In Fig. 7 we show a Raman spectrum for a sample made at an annealing t emperature o f 300 °C. The main peak at just under 200 cm-1 is that of CZTS with two satellite peaks on either side. The peak at 265 cm-1 , although identified to be ZnSe, is more l ikely C uSe. W ith a dditional pr ocessing a t hi gher t emperatures w e f ind t hat t his pe ak disappears. It i s know n t hat C uSe f orms at l ower t emperatures an d t hen r eacts w ith t he o ther constituents t o f orm CZST. W e a re us ing t hese i nsights t o g uide f urther de velopment of our material and believe that the electronic quality is now significantly better. However, the ultimate proof of m aterial qua lity is i n de vice pe rformance. W e h ave s tarted m aking de vices w ith t he upgraded materials process and are seeing encouraging results. An IV curve of a device showing PV response is shown in Fig. 8. Once we advance the performance of CZTS at the laboratory level, we can also transfer the process to the Pilot-Line machine for further development.
1 Y. Wang, S. Bendapudi, C. S. Ferekides and D. L. Morel, “Optical Determination of Phase Composition and Processing Effects on Cu2ZnSnSe4 Film Quality and Device Performance”, Proceedings of the 38th IEEE PV Specialist Conference, Austin, June, 2012.
Page | 71
University of South Florida
Sustainable Algal Biofuel Production (Final Report)
PI: Sarina J. Ergas Co-PI: Qiong Zhang, James R. Mihelcic, John Wolan (deceased) Students: Angela C hapman, P hD S econdary E d. i n pr ogress; M atthew G aston, M S E nvironmental Engineering i n pr ogess; B enjamin G illie, B S C hemical E ngineering; T rina H alfhide, P hD E ngineering Science i n progress; M ehregan Jal alizadeh, MS E nvironmental E ngineering; R uben Jean, B S Environmental E ngineering ( UF) i n progress; E unyoung L ee, P hD E nvironmental E ngineering i n progress; Maria Pinilla, MS Environmental Engineering; John Trimmer, MS Environmental Engineering in progress; Innocent Udom, PhD Chemical Engineering in progress; Sarah Watson, MS Envirionmental Engineering in progress. Description: Microalgae a re p roductive at u tilizing CO2 and c an g enerate bi omass f or pr oduction o f biodiesel, methane, or other fuels as well as valuable co-products (e.g. animal feeds, polymers). Algal biofuel production can be more profitable and sustainable when combined with wastewater treatment and CO2 utilization from electric power generation facilities. A number of research gaps exist for full scale algal bi ofuel pr oduction including: 1) i mprovement of a lgal g rowth and nu trient upt ake r ates, 2) integration of systems w ith w aste g as, w astewater, and w ater reclamation sy stems, 3 ) i mproved g as transfer and mixing, 4) improved algal harvesting and dewatering and 5) life cycle assessment (LCA) and economic analysis. In addition, little attention has been given to the potential use of algal biofuel systems to treat wastewater and produce heating and cooking fuels in developing countries. The overall objective of t his pr oject i s t o de velop a n i nterdisciplinary m ulti-investigator r esearch program t hat i ntegrates microalgal biofuel production with wastewater treatment and carbon recycling. An algal biofuels lab will be es tablished a t t he U SF B otanical G ardens, w hich w ill h ouse several b ench-scale a lgal p hoto-bioreactors. Initial experiments will focus on optimizing CO2 uptake from combustion gases, wastewater nutrient removal and production of algal biomass under varying operating conditions. Both oil rich algal species a nd a lgae t hat g row w ell o n w astewater w ill b e i nvestigated. L CA m ethods w ill b e u sed to provide insight into the environmental impacts of the process under varying conditions and enable system evaluation b ased on both technical performance a nd life cycle i mpacts. This pr oject is designed to develop P I ex pertise an d collaborations a nd train g raduate students in a n ew field of r esearch t hat i s critical in establishing Florida as center of algal biofuels production. Future research directions include: 1) i ntegration o f a lgal bi ofuel pr oduction w ith do mestic, a gricultural a nd industrial w astewater, 2) sustainable aquaculture system development, 3) production of jet fuel from algae cake, 4) application of algal b iofuels t echnology in de veloping c ountries, 5) de velopment of integrated L CA-economic assessment tools to assist in algal biofuel system decision making. Budget: $50,000 Project Time Period: 2/1/2010-6/30/2012 Universities: USF External Collaborators: Mote Marine Laboratories

Page | 72
Updated Executive Summary:
Algae can be used to produce a range of fuels (biodiesel, biogas, liquid hydrocarbon fuels) while mitigating CO2 and nutrients. However, critical research gaps remain for the development of full-scale sustainable photosynthetic microalgal biorefineries. The overall goal of this project is to transform microalgal bioenergy production from the status quo to an economically and environmentally sustainable state through improvements and optimization across the life cycle of microalgal cultivation and harvesting stages. Specific objectives were to:
1. increase the productivity of algae and their intracellular storage products through bioprospecting
and phototrophic culture development, 2. reduce w ater a nd material i nput through i ntegration of m unicipal a nd a quaculture w astewater
treatment with algal cultivation, 3. improve nutrient, CO2, and light delivery though improvements in gas transfer and mixing, 4. reduce dow nstream pr ocessing a nd e nergy c osts t hrough i mprovements i n ha rvesting
technologies, 5. apply sy stem l evel modeling an d l ife cy cle a ssessment t o o ptimize e nergy pr oduction w hile
assuring environmental and economic sustainability; and 6. integrate students from a disadvantaged high school into the project as authentic researchers.
Wild algae were harvested from secondary clarifiers of wastewater treatment facilities and tested for algal growth and nutrient uptake rates on:
1. municipal wastewater from the Glendale (Lakeland FL) treatment facilities, 2. sludge centrate from the Howard F. Curren Wastewater Treatment Facility in Tampa, 3. sludge centrate from pilot-scale anaerobic digesters treating swine wastes at USF, 4. aquaculture wastewater from Mote Aquaculture Park (Sarasota FL).
An algal biofuels laboratory was established at the USF Botanical Gardens. The lab was used to
conduct pilot-scale photobioreactor studies of algal growth on municipal sludge centrate over a two year period. Algae collected from the reactors were used in harvesting studies to determine the effectiveness, costs and life cycle environmental impacts of different harvesting technologies. Additional modeling studies were used to investigate the feasibility of integrating algal biofuel production with recirculating aquaculture systems. High school students were included as authentic researchers through a collaboration with a biotechnology and marine science teachers at a Middleton HS, a STEM magnet school in Tampa that serves a historically African American and economically disadvantaged neighborhood. Our current work is focused on culturing algae on anaerobically digested animal manure and aquaculture wastewater, anaerobic co-digestion of algae and life cycle assessment studies.

Page | 73
University of South Florida Development of a Highly Efficient Photocatalyst for CO2 Reduction with H2O by
Hybrid Construction of Transparent, Conductive Composite (TCC) and nano-Sized MOX/INVO4/AL2O3 Particles
PI: Norma Alcantar, John Wolan (deceased) Description: Our r esearch f ocused on t hree t echnologies t o pr oduce f ilms a ble t o r espond t o e xternal stimuli. W e us ed c onductivity a s the intrinsic p roperty t hat w as a prime pa rameter t o consider w hen performance was measured. We also were interested on the fundamental s tructure that would make our conducting films and materials to enhance their performance. Project Time Period: 2/1/2009-6/30/2011 Universities: Department of Chemical and Biomedical Engineering, USF External Collaborators: Mote Marine Labotatories Executive Summary This project’s goal was to prepare transparent conductive composites (TCCs) in which organic and inorganic materials were used to produce and characterize a complex material with smart capabilities. Our research had a direct impact in battery production, conducting films and catalysis. Goals and Objectives
1) Determine protocols for synthesis of conductive composites 2) Determine performance 3) Characterize their structure 4) Measure efficiency
Research Description Our research focused on three technologies to produce films able to respond to external stimuli. We used conductivity as the intrinsic property that was a prime parameter to consider when performance was measured. We also were interested on the fundamental structure that would make our conducting films and materials to enhance their performance. The following is a description of the main accomplishments of this research.
a) Conductive polymer complexes were prepared by doping optically transparent polymers with bis(ethylenedioxy)-tetrathiafulvalene (BEDO-TTF) and then exposing such films to iodine (anion donator) to form a conducting crystalline surface with the potential for sensing. Our research determine that once polymeric films are doped and exposed to an anion donator, their surface structure is affected by undergoing changes from amorphous to crystalline accommodations as shown in the following Figure.
Figure 1. Phase contrast AFM scans: Bare PC (A), BEDO/PC (B), BEDO/PC/1mg/ml-2min exposure to Iodine (C), BEDO/PC/8mg/ml-4min Iodine (D), BEDO/PC/4.3mg/ml-10min Iodine (E). The scan size of A & B is 0.5x0.5µm. The scan size of C, D & E is 5x5µm, scale bar depicts 1µm. High resolution scans for A & B are shown intentionally to discern structure differences due to dye-doping as compare to C, D & E.
Page | 74
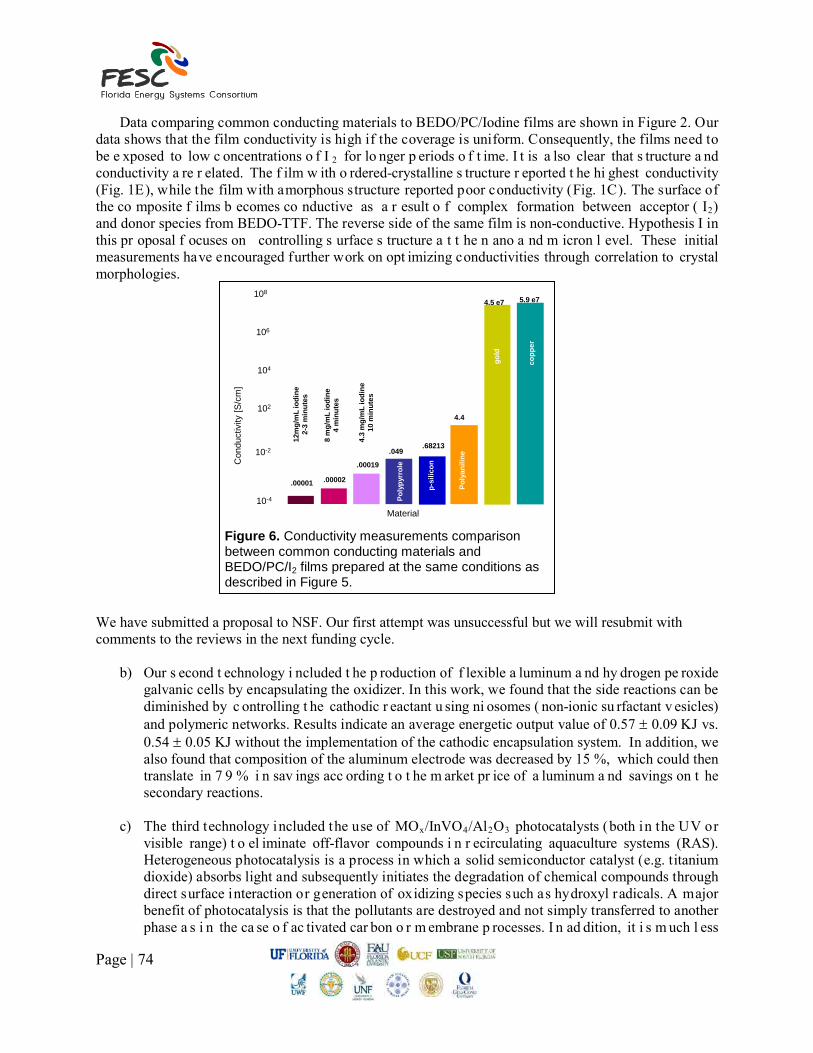
Data comparing common conducting materials to BEDO/PC/Iodine films are shown in Figure 2. Our
data shows that the film conductivity is high if the coverage is uniform. Consequently, the films need to be e xposed to low c oncentrations o f I 2 for lo nger p eriods o f t ime. I t is a lso clear that s tructure a nd conductivity a re r elated. The f ilm w ith o rdered-crystalline s tructure r eported t he hi ghest conductivity (Fig. 1E), while the film with amorphous structure reported poor conductivity (Fig. 1C). The surface of the co mposite f ilms b ecomes co nductive as a r esult o f complex formation between acceptor ( I2) and donor species from BEDO-TTF. The reverse side of the same film is non-conductive. Hypothesis I in this pr oposal f ocuses on controlling s urface s tructure a t t he n ano a nd m icron l evel. These initial measurements have encouraged further work on opt imizing conductivities through correlation to crystal morphologies.
We have submitted a proposal to NSF. Our first attempt was unsuccessful but we will resubmit with comments to the reviews in the next funding cycle.
b) Our s econd t echnology i ncluded t he p roduction of f lexible a luminum a nd hy drogen pe roxide galvanic cells by encapsulating the oxidizer. In this work, we found that the side reactions can be diminished by c ontrolling t he cathodic r eactant u sing ni osomes ( non-ionic su rfactant v esicles) and polymeric networks. Results indicate an average energetic output value of 0.57 ± 0.09 KJ vs. 0.54 ± 0.05 KJ without the implementation of the cathodic encapsulation system. In addition, we also found that composition of the aluminum electrode was decreased by 15 %, which could then translate in 7 9 % i n sav ings acc ording t o t he m arket pr ice of a luminum a nd savings on t he secondary reactions.
c) The third technology included the use of MOx/InVO4/Al2O3 photocatalysts (both in the UV or
visible range) t o el iminate off-flavor compounds i n r ecirculating aquaculture systems (RAS). Heterogeneous photocatalysis is a process in which a solid semiconductor catalyst (e.g. titanium dioxide) absorbs light and subsequently initiates the degradation of chemical compounds through direct surface interaction or generation of oxidizing species such as hydroxyl radicals. A major benefit of photocatalysis is that the pollutants are destroyed and not simply transferred to another phase a s i n the ca se o f ac tivated car bon o r m embrane p rocesses. I n ad dition, it i s m uch l ess
p-si
licon
Poly
pyrr
ole
Poly
anili
ne
gold
copp
er
12m
g/m
L io
dine
2-3
min
utes
8 m
g/m
L io
dine
4 m
inut
es
4.3
mg/
mL
iodi
ne
10
min
utes
4.5 e7
4.4
.68213.049
.00019
.00002.00001
Con
duct
ivity
[S/c
m]
Material10-4
102
108
106
104
5.9 e7
10-2
Figure 6. Conductivity measurements comparison between common conducting materials and BEDO/PC/I2 films prepared at the same conditions as described in Figure 5.

Page | 75
expensive t han us ing oz one, w hich r equires on site g eneration a nd t he s etup of e xpensive equipment.
Concluding Remarks Our project has made a significant impact in current research areas of national interests. It has branched out into multidisciplinary applications and it has implications in biosensing, environmental science, water purification, and fundamental research involving novel battery systems. Patents 8,034,302 Transparent conducting composites (TTCs) for creating chemically active surfaces
Publications Novel Encapsulation of Oxidizer Applied to Galvanic Cells: Aluminum / H2O2 Galvanic Cell as a Case Study by Marlyn Colon to obtain her Masters of Science Degree in Chemical Engineering, University of South Florida (2011). http://scholarcommons.usf.edu/cgi/viewcontent.cgi?article=5213&context=etd Characterization of conductive polycarbonate films by Selma Hokenek to obtain her Masters of Science Degree in Chemical Engineering. University of South Florida, (2009) Other publications are in the process of being sent out for review. http://scholarcommons.usf.edu/cgi/viewcontent.cgi?article=3015&context=etd Other publications are in the process of being submitted.

Page | 76
University of South Florida
Development of a Smart Window for Green Buildings in Florida (Final Report)
PI: Dr. Sarath Witanachchi Students: Mr. Mark Merlak, Ph.D. student Description: The microwave plasma system was used to grow nanophosphors of La2O3:Bi and CaS:Eu. The sy stem w as modified t o acco mmodate ch emical v apor d eposition ( CVD) of Z nO a nd ZnS. Z nO coatings w here g rown by i ntroducing Z inc a cetylacetonate (Zn(acac)2) v apor as p recursor n ear t he substrate. Vapor was generated by heating granules of Zn(acac)2 in a container to 160oC and pushing the vapor with gas that contained a mixture of Ar and oxygen. Imethilzinc and H2S were used for the growth of ZnS films. Microwave p lasma p rocess al lows co ntrol o f n anophosphor p article s izes b y controlling t he pr ecursor concentration. We ha ve de monstrated t he a bility t o d eposit La2O3:Bi n anophosphors in s ingle c rystal form w ith s izes f rom 5nm t o 100 nm b y changing t he s tarting c oncentration. T ransmission E lectron Microscopy (TEM) showed the hexagonal crystals and clear lattice planes with d=3.34Å that corresponds to (100) orientation. BTO layer required for the device structure was sputter deposited at low temperature. Radiant f lux em itted b y d evices f abricated w ith the co nventional E L structures and d evices w ith the proposed structures were measured by t he i ntegrated sphere technique. Measured values confirmed the enhancement in emission resulting from the proposed structure. The observed upward trend confirms the viability o f the c oncept and the po tential of E L de vices fabricated u nder op timum c onditions t o r each desired outputs of 1300-1500 μW (13-15 W/m2). Executive Summary: This project is aimed at developing a smart window concept that has the potential to convert part of the solar radiation falling on windows during daytime to electricity, and to use this harnessed energy to power a phosphor-based, highly efficient white-light LED source to illuminate the building at night. This project pursues two different technologies: (1) use of quantum dot based solar cells to harvest solar energy, and (2) d evelop an el ectroluminescent light s ource ba sed on na nophosphors t o p rovide illumination f or buildings. T he pr oject brings together t wo unique na noparticle growth techniques de veloped a t t he Laboratory for Advanced Material Science and Technology (LAMSAT) at USF to fabricate a prototype device that would demonstrate the possibility of s ignificant energy savings. Research acomplishements related to solar device was presented in last annual report. This report focuses on research developments in the solid state lighting device.
Page | 77
FESC Phase 2 Technology Commercialization Projects
High Efficiency Black Polymer Solar Cells (Progress Report)
PI: Dr. Franky So External Collaborators: John Reynolds, Georgia Tech Industry Partner: Sestar Technologies, LLC Students: Cephas Small and Song Chen Description: The ob jective of t he p roposed p roject is t o s ynthesize br oadly a bsorbing, bl ack c olored (PBLACK) p olymers w ith esp ecially h igh ch arge m obilities an d to f abricate the h ighest p erformance polymer so lar c ells p ossible. S pecifically, w e w ill s ynthesize pol ymers w ith a bsorption ba nd ranging from 400 n m to beyond 1 µm with carrier mobilities higher than 10-4 cm2/Vs. P olymer-fullerene (both PC60BM a nd P C70BM a long w ith more r ecently de veloped de rivatives) bl end m orphology w ill be optimized using different solvent/heat treatments as well as additives to the blends. The final device will be enhanced using anode and cathode interlayers to enhance carrier extraction to the electrodes. With the ability t o s ynthesize br oadly a bsorbing po lymers, c ontrol the dono r-acceptor phase m orphology a nd engineer the device structure, it is expected that the power conversion efficiency of polymer solar cells can reach 10% at the end of the two-year program. Summary of Progress Polymer bul k heterojunction s olar c ells ba sed on l ow ba ndgap pol ymer:fullerene bl ends a re promising for next generation low-cost photovoltaics. While these solution-processed solar cells are compatible with large-scale roll-to-roll processing, active layers used for typical laboratory-scale devices are too thin to ensure high manufacturing yields. Furthermore, due to the l imited light a bsorption a nd o ptical in terference w ithin th e th in a ctive la yer, th e e xternal quantum efficiencies (EQEs) of bulk heterojunction polymer solar cells are severely limited. In order to produce polymer solar cells with high yields, efficient solar cells with a thick active layer must be de monstrated. In t his w ork, t he pe rformance of t hick-film s olar c ells e mploying th e lo w-bandgap pol ymer poly(dithienogermole-thienopyrrolodione) ( PDTG-TPD) w as de monstrated. Power conversion efficiencies over 8.0% were obtained for devices with an active layer thickness of 200 nm , illustrating the potential of this polymer for large-scale manufacturing. Although an average EQE > 65% was obtained for devices with active layer thicknesses > 200 nm, the cell performance could not be maintained due to a reduction in fill factor. By comparing our results for P DTG-TPD s olar c ells w ith s imilar P3HT-based de vices, w e i nvestigated t he l oss mechanisms associated with the limited device performance observed for thick-film low-bandgap polymer solar cells.

Page | 78
1. Funds leveraged / New Partnerships Created
New collaborations Partner name Title or short description of the collaboration Funding, if applicable
Proposals Title Dipole Engineering for polymer solar cells
Agency DOE Basic Energy Science
Reference Number
PI, Co-investigators and collaborators Franky So (UF) John Reynolds (Georgia Tech)
Funding requested $840,000
Project time frame (1 year, 2 years, etc.) 3 years
Date submitted November, 2012
Grants Awarded Title Agency Reference
Number PI, Co-investigators and collaborators
Period of Performance
Funding awarded
2013 Annual Report
High efficiency polymer solar cells with thick films and prototypical structure for printing Based on t he d emonstration of hi gh e fficiency polymer s olar c ells based on a l ow ba ndgap donor-acceptor c opolymer w ith alternating di thienogermole-thienopyrrolodione ( DTG-TPD) repeat units last year, we further present high efficiency inverted polymer solar cell with thicker active layers that will potentially facilitate the p roduction yield of roll-to-roll pr inting process. One key factor for improving the large-scale R2R processing compatibility of polymer solar cells is the active layer thickness required to ensure high manufacturing yields in PV modules. Most high e fficiency l aboratory-scale devices demonstrated have an active l ayer w ith a t hickness of about 100 nm which is too thin for R2R processing to ensure a pinhole-free film. Obtaining high efficiency devices with active la yers th icker than 200 nm is c ritical for commercialization. To achieve h igh ef ficiency with an act ive l ayer t hickness l arger t han 2 00nm, w e f abricated t he device containing a bot tom transparent ox ide electrode, a ZnO-PVP composite layer with UV-ozone t reatment, a pho to-active l ayer c omposed of P DTG-TPD a nd fullerene, a l ayer of molybdenum oxide and a top electrode—silver. In addition, the efficiency loss mechanism in the thick de vices w as s tudied i n de pth b y t he m easurement of f ield d ependent e xternal qua ntum efficiency s pectra a nd p hotoconductivity analysis. T he w ork i s done in collaboration w ith D r. John Reynolds at Georgia Institute of Technology. Figure 1 shows t he photocurrent d ensity–voltage ( J−V) ch aracteristics and t he c orresponding external q uantum ef ficiency (EQE) s pectra for i nverted P DTG-TPD:PC71BM s olar c ells w ith 105 nm, 204 nm, and 258 nm-thick active layers. Figure 1 a shows that the short-circuit current density ( Jsc ) increases with increasing active layer thickness due to enhanced light absorption, with the highest Jsc of 16.1 mA cm− 2 obtained for the device with an active layer thickness of 258 nm. The integrated current density from the EQE spectra, shown in Figure 1 b, i s consistent with the measured Jsc with 5% deviation. The difference in the EQE spectra i s due to opt ical interference effects between the incident light and light reflected from the Ag back electrode. For devices w ith t hickness L ≥ 200 nm , t he interference effects no l onger affect t he phot ocurrent density o f t he device an d t he act ive l ayer ab sorbs most of t he incident light be low 700 nm , resulting in EQEs above 70% from 400 nm to 700 nm.

Page | 79
FIGURE 10 (A) CURRENT DENSITY VERSUS VOLTAGE CHARACTERISTICS FOR PDTG-TPD:PC 71 BM SOLAR
CELLS WITH 105 NM, 204 NM, AND 258 NM-THICK ACTIVE LAYER. (B) CORRESPONDING EXTERNAL QUANTUM EFFICIENCY (EQE) SPECTRA FOR THE DEVICES.
Table 1 summarizes the average solar cell p arameters for t he PDTG-TPD:PC71BM d evices w ith an active layer thickness varying from 90 nm to 409 nm . The reduction in FF obs erved f or PDTG-TPD s olar cells w ith in creasing a ctive la yer thickness i s the ma jor f actor limiting the device performance. A power conversion efficiency (PCE) of 7.9% i s obt ained for t he d evice with a 105 nm t hick a ctive l ayer, which i s c onsistent w ith our previous report. The efficiency remains constant for devices with L ≤ 204 nm, with an average PCE of 8.2% being obtained for devices with an active layer thickness of 204 nm . Above 200 nm, the FF reduction becomes significant, dropping from 69% in 105 nm film to 42% in 409 nm
film. To de termine t he r oot c ause f or t he reduction i n F F obs erved in th ick-film PDTG-TPD:PC71BM s olar cel ls, t he E QE spectra for t he t hin-film a nd th ick-film devices w ere m easured unde r different values o f i nternal el ectric f ield. Figure 2 shows t he field-dependent E QE s pectra f or devices with 105 nm, 204 nm, 258 nm, and 409 nm-thick active layers, respectively. By measuring the EQE as a function of internal electric f ield ( E), a pproximated as E = (Voc−V)/L , t he effect of s eries r esistance can b e eliminated. For the d evice w ith a n active layer thickness ≤ 204 nm , increasing the applied fi eld from 20 kV cm− 1 to 70 kV
TABLE 1 AVERAGED SOLAR CELL PERFORMANCE FOR PDTG-TPD:PC 71 BM DEVICES WITH VARIOUS ACTIVE LAYER THICKNESS UNDER INITIAL AM 1 5G SOLAR ILLUMINATION
FIGURE 11 FIELD-DEPENDENT EQE SPECTRA FOR PDTG-TPD:PC 71 BM SOLAR CELLS WITH (A) 105 NM, (B) 204 NM, (C) 258 NM AND (D) 409 NM-THICK ACTIVE LAYER. THE EQE SPECTRA WERE MEASURED AT INTERNAL

Page | 80
cm–1 leads t o a uniform en hancement i n E QE acr oss t he en tire s pectral range. T he i ncreased applied f ield en hances t he ex traction of p hotogenerated charges eq ually ac ross t he E QE spectrum. Interestingly, for devices with L > 204 nm, a stronger field dependent enhancement in EQE is observed in the spectral range from 500 to 750 nm when the applied field is increased from 20 kV cm− 1 to 70 kV cm− 1. This wavelength range corresponds to the absorption spectrum for a pristine PDTG-TPD film. For devices with a thick active layer, the build-up of charges in PDTG-TPD:PC71BM will h inder charge collection and contribute t o t he FF reduction in t hick solar cells. To s tudy the role s pace-charge a ccumulation pl ays i n P DTGTPD: PC71BM s olar c ells w ith a thick a ctive la yer, w e e mployed the SCL phot ocurrent m odel t o c onfirm th at th e e lectrostatic space-charge l imit w as r eached i n o ur t hick d evices. W e co mpared the re sults fo r P DTG-TPD:PC71BM solar cells with similar devices based on P 3HT:PC61BM, since P3HT solar cells provide a mo del s ystem for s tudying s pace-charge effects. T he effective phot ocurrent Jph, normalized t o the s aturation phot ocurrent Jsat = qGmaxL, w as pl otted on a doubl e l ogarithmic scale against the effective voltage across the device, given by Veff =V0–V. Here, V0 is defined as the voltage where Jph = 0 and is slightly larger than Voc. This “corrected” photocurrent analysis is a widely used tool for analyzing recombination loss processes in organic solar cells. Figure 3a shows t he r esults for t he P DTG-TPD:PC71BM solar cells w ith 105 nm , 258 nm and 409 nm -thick active layer. For the device with a 105 nm thick active layer, two different voltage regimes can be observed. For Veff < 0.30 V, Jph steadily increases with voltage due to the competition between diffusion and drift for photo-generated carrier transport at low field. For Veff > 0.30 V, the photocurrent saturates with increasing voltage. In this saturation regime, the internal field is strong enough to efficiently extract photogenerated carriers and the high field is responsible for the dissociation of e-h pairs. The voltage corresponding to the short circuit condition falls within the s aturation regime, i ndicating that th e h igh Jsc and FF obt ained for t his de vice i s due t o efficient charge co llection b y t he i nternal e lectric f ield. F or t he device with a 105 nm a ctive layer, space charge effects were not observed based on the data shown in Figure 3a. As the active layer t hickness for P DTG-TPD c ells i ncreased a bove 200 nm , a s quare-root e ffective vol tage dependence on Jph is observed. This Jph ∝ V 1/2 corresponds to the onset of space-charge limited photocurrent in thick PDTG-TPD cells assuming a Jph ∝ G¾ dependence is also observed. The solid lines in Figure 3a correspond to Jph ∝ V 1/2. For the 409 nm -thick device, the Jph ∝ V ½ regime extends to the short circuit condition, which correlates well with the reduction in Jsc and FF obs erved i n t his de vice. These r esults a re i n c ontrast w ith t hose f ound i n Figure 3 b for P3HT:PC61BM.

Page | 81
Figure 12 Effective photocurrent density ( J ph ) normalized by J sat = qG max L as a function of effective voltage (Veff) under 100 mW cm− 2 illumination for (a) PDTG-TPD:PC71BM cells with 105 nm, 258 nm, and 409 nm-thick active layer,
and (b) P3HT:PC 61 BM cells with 100 nm, 200 nm, and 453 nm-thick active layer. Dashed lines highlight the value of Veff corresponding the short-circuit condition ( Veff = V0 ). The solid lines correspond to Jph ∝ V 1/2 fits of the
photocurrent in the SCL regime for PDTG-TPD solar cells.
FIGURE 13 LIGHT INTENSITY DEPENDENT STUDY FOR PDTG-TPD:PC 71 BM SOLAR CELLS WITH THIN AND THICK ACTIVE LAYER. J PH − V EFF CURVES FOR THE (A) 105 NM-THICK AND (B) 409 NM-THICK DEVICES UNDER VARIOUS LIGHT INTENSITIES (FROM 11.4 TO 100 MW CM− 2 ). (C) EFFECTIVE PHOTOCURRENT DENSITY ( J PH ), SATURATION VOLTAGE (VSAT ), AND (D) FILL FACTOR AS A FUNCTION OF INCIDENT
LIGHT INTENSITY FOR THE SAME DEVICES. THE J PH − P 0 CURVES WERE MEASURED AT V EFF = 0.4 V.
The dependence of Jph and FF on incident light intensity ( P0 ) was plotted for the 105 nm and 409 nm-thick PDTG-TPD:PC71BM solar cells (see Figure 4). Neutral density filters were used to control the incident light intensity, which was varied from 11.4 to 100 mW cm− 2. The Jph − P0 data for the thin and thick PDTG-TPD:PC71BM devices, shown in Figure 4c, was extracted from

Page | 82
the Jph − Veff curves shown in Figures 4a and b. For the solar cell with a 105 nm -thick active layer, Jph showed a linear dependence on light intensity with the slope of the linear fit tothe data equal to 1.09. In contrast, a slope of 0.77 is observed for the 409 nm-thick PDTG-TPD solar cell. The ∼ 3/4 power dependence of J ph on t he incident light intensity confirms the occurrence of SCL phot ocurrent i n P DTG-TPD:PC71BM so lar cells a t l ow bi as. T he de pendence o f t he saturation voltage (Vsat) on incident light intensity provides further evidence, in which a slope of 0.50 i s e xtracted f rom t he Vsat − P0 data. To f orm a m ore cl ear physical pi cture, t he l ight-intensity d ependence of the FF was a lso analyzed a nd pl otted i n F igure 4d. T he F F remained relatively constant with incident light intensity for the 105 nm-thick solar cell, which is expected since t he d evice i s n ot space-charge limite d a t P0 = 100 m W c m − 2 and t he t hickness i s sufficiently t hin t o e nsure e fficient ch arge ex traction. F or t he 409 nm -thick P DTG-TPD s olar cell, a 2 4% enhancement in FF was observed as the incident light intensity was decreased from 100 mW cm− 2 to 11.4 mW cm− 2. By lowering P0 and, consequently, reducing the generation rate of charge carriers in the thick PDTG-TPD:PC 71 BM active layer, space-charge buildup was reduced. As a result, enhanced charge carrier co llection and FF was observed in the solar cell. Despite this enhancement, the FF of the 409 nm-thick device at low light intensity does not reach the va lue obt ained i n t he 105 nm de vice. T his result i ndicates t hat t he r educed phot ocurrent observed for thick-film devices could not be completely recovered despite lowering the incident light in tensity. There is s till s ome d egree o f limite d c harge collection o ccurring in th ick-film PDTG-TPD:PC71BM solar cells. To c onclude, the lo ss mechanism in th ick-film P DTGTPD:PC71BM solar cel ls h ave b een investigated. For polymer solar cells with an active layer thickness up to 200 nm, efficiencies in excess of 8.0% were obtained for devices under AM 1.5G illumination at 100 mW cm − 2 . For L > 200 nm , t he S CL photocurrent r egime is r eached, le ading to limite d c harge co llection efficiency i n t he d evices d ue t o s pace-charge accu mulation. The ons et of s pace-charge accumulation a lso coincides with r eductions i n F F and h ence pow er c onversion e fficiency i n thick devices. These results indicate that although high efficiencies can be obtained in solar cells with lo w-bandgap c onjugated donor-acceptor polymers, t he hi gh de nsity of phot ogenerated charge carriers could severely limit the performance of solar cells with a thick active layer.

Page | 83
Florida Advanced Technological Education Center (FLATE) Education - Technician Based Workforce
(Progress Report) PI: Marilyn Barger Description: FLATE ( Florida A dvanced T echnological E ducation C enter) w ill pa rtner w ith F ESC t o develop statewide curriculum frameworks for technical A.S./A.A.S. degree programs supporting existing and ne w energy business sectors. FLATE will develop and have processed through the F LDOE the industry-validated s tudent competencies o f t he f rameworks. F LATE w ill a lso d evelop n ew co urses required f or e ach ne w pr ogram of s tudy. Additionally F LATE will help s tate and c ommunity c olleges implement the new frameworks in their institutions. T o support the new curriculum, FLATE will work closely w ith the F ESC P ublic O utreach a nd Industry P artnership pr ograms t o pr ovide pr ofessional development opportunities for teachers and faculty to upgrade and update their knowledge base. Budget: $300,000. Universities: FLATE/Hillsborough Community College FLATE Ex ternal Collaborators: Brevard C ommunity C ollege; T allahassee C ommunity College; Daytona State College; Central Florida Community College; Polk State College; Florida State College at Jacksonville; Valencia Community College; Palm Beach State College; S chool District Hillsborough County; Florida Department of Education – Division of Adult and Career Education; West Side Technical School; U SF C ollege o f Engineering; Mad ison A rea T echnical C ollege A TE p roject f or A lternative Energy cer tifications; M ilwaukee A rea Technical C ollege E nergy C onservation a nd A dvanced Manufacturing C enter ( ECAM); F lorida E nergy Workforce C onsortium ( FEWC); TECO; P rogress Energy; ISTEC ( Ibero Science a nd Technology Education C onsortium), U surbil GLBHI (Spain); TKNIKA - Innovation Institute for Vocational Training (Spain); Center for Energy workforce Consortium (CEWD); UF Industrial Assessment Center; CREATE NSF Center for A lternative E nergy; E ST2 NSF ATE Grant project; DOE’s Office of Energy Efficiency & Renewable Energy; Gulf Coast State College; Palm Beach State College; University of South Florida’s College of Engineering; University of Miami; University of Alabama; Rutgers University; Energy Reduction Solution, SMC Corporation of America, Energy C onservation G roup; F lorida S olar E nergy Consortium; Tampa B ay Regional B usiness P lan Energy Efficiency and Conservation Sub-Committee. Progress Summary The development o f t he p rocess for the Florida State College System to r espond to FESC’s l ong t erm strategy t o b ring en ergy r elated t echnologies o ut o f t he F lorida U niversity S ystem i s w ell u nderway. Activities this year included identifying the current status of credit and non-credit energy related courses within the State College System. In addition, online curriculum related to Alternative Energy Systems has been developed. FLATE has the college contacts and process in place to respond to any FESC and/or regional eco nomic d evelopment au thority r equest to p rovide ass istance t o a d esignated S tate C ollege because o f a t echnician workforce development need as i dentified o r t riggered by a new or expanding energy related company’s operations in the State. Since O ctober 1, 2 012 F LATE a chieved sev eral milestones. Together w ith t he N ational S cience Foundation-funded Energy Systems Technology Technicians (EST²) project team, FLATE has developed

Page | 84
a ne w I ndustrial E nergy Efficiency s pecialization f or t he E ngineering T echnology ( ET) D egree a nd associated College Credit Certificate. Engineering Technicians are widespread in a variety of occupational areas, including electronics, applied technologies, manufacturing, and c omposites f abrication, to name a few. The new Industrial Energy Efficiency specialization track and college credit certificate (CCC) for the AS/AAS degree in Engineering Technology, comes at a time when green job sectors such as energy efficiency, are flourishing. Interest in reducing operating costs through energy efficiency maximization is growing significantly, both in Florida and throughout the nation. Collaboration with industry subject matter experts has allowed us to tailor the energy efficiency specialization curriculum and match training directly to industry needs. Industry partners have indicated a need for energy efficiency measures to help their bottom line, and as a result t he ne w specialization/CCC is d esigned t o help incumbent t echnicians i n m anufacturing or industrial occupations find ways to save money through efficiency in their industrial setting, or prepare students to become energy managers or auditors. Upon completion of the program, students will be armed with the knowledge and skills necessary to implement energy efficiency strategies in industrial processes and systems, and as a result impact the bottom line. It will help the student prepare to become a S EP-Superior Energy Performance Certified Systems Practitioner and a CEM Certified Energy Manager. The program will also help train workers who will assist a company i n achieving the ISO 50001 s tandards related t o e nergy management, as w ell as I SO 1 4001:2004 t o a ssure a co mpany’s st akeholders t hat measures are being taken to improve their environmental impact. The E ST2 team (comprising i ndividuals f rom B revard C ommunity C ollege, F lorida S tate C ollege a t Jacksonville, Tallahassee Community C ollege a nd H illsborough C ommunity College), submitted t he framework to the Florida Department of Education at the beginning of 2013 and colleges will be able to implement it in the 2013-2014 academic year. Program Title: Industrial Energy Efficiency Specialist (CCC) Career Cluster: Manufacturing CCC CIP Number TBD Program Type College Credit Certificate (CCC) Program Length 21 Credit Hours (Primary), 24 Credit Hours (Secondary) This c ertificate p rogram i s p art of the E ngineering T echnology A S/AAS d egree p rogram (1615000001/0615000001). FLATE a nd FESC c oordinated a s econd h ighly s uccessful energy w orkshop (the last one was he ld in September 2 011 i n G ainesville), f or h igh sch ool an d co llege ed ucators, as w ell as industry p artners, hosted by the Florida Solar Energy Center (FSEC) in Cocoa, FL on January 25, 2013. Forty a ttendees attended a wide variety of presentations, went on a tour of the amazing FSEC facilities and participated in a P rofessional D evelopment ac tivity f ocused o n solar e nergy ap plications. F eedback r eceived w as overwhelmingly positive. FLATE and FESC coordinated an Advisory Working Group Meeting in Orlando, FL on February 28, to develop a curriculum plan for the Industrial Energy Efficiency Technician (IEET) Specialization. Sixteen members f rom academia and industry worked on t he following focus s tatement for the workshop, “An industrial energy efficiency technician implements energy efficiency strategies in industrial processes and systems in order to improve an organization's bottom line and reduce environmental impacts."
Page | 85
As a r esult o f t he m eeting, a co mprehensive l ist o f I EET R esources was compiled an d c lasses w ere identified as well as their associated learning outcomes. Finally, FLATE regularly updates / presents information about energy curriculum and training issues at the statewide Florida Engineering Technology Forum that meets twice per year at various colleges across the st ate. Many of t hese s chools a re l ooking t o a dd “ energy” c urriculum a nd/or p rograms a nd a re requesting guidance on what industry is asking for across the state and what and how other colleges are implementing credit p rograms. The g oal o f t hese a ctivities i s to k eep co lleges w orking t ogether an d sharing c urriculum r ather t han de velop i ndependent p rograms not p roperly a ligned t o s tatewide frameworks. The ET Forum most recently met April 4 - 5 in Clearwater at St. Petersburg College. Activities for the 2012-2013 year are listed below.
• Presented at the Florida Association of Science Teachers Conference in October, 2012 with Mark Dick ( Tallahassee Community College), “E nergy Camps t hat ar e E nergizing”, h ighlighting t he Teacher Energy Workshops and Energy Summer Camps for students offered over the summer by all EST 2 partners.
• Attended t he F lorida E nergy W orkforce C onsortium M eeting i n N ovember 2012 a nd M arch 2013.
• Presented “ Industrial E nergy E fficiency Competencies f or A ssociate D egree P rograms”, at t he Interstate Renewable Energy Council (IREC) Clean Energy Workshop in Albany, NY, November, 2012.
• Attended the Manufacturers Association of Florida Summit in December 2012 and surveyed 40 manufacturers ab out t he n eed for energy ef ficiency t rained technicians. The o verwhelming majority of manufacturing members who completed the survey strongly supported the new IEET CCC since manufacturers need solutions to their high cost associated with energy consumption. A focus group meeting was held in Orlando, in February 2013 w ith industry, university faculty, tech center faculty and st ate college personnel/faculty. T he focus group meeting was a scal ed down, Designing a Curriculum (DACUM) that produced potential courses and course content for the proposed IEET program. The course creation validated the IEET program framework content that went to the FL Department of Education for approval at the beginning of this year, and will be implemented in the 2013-2014 academic year.
• Coordinated a second Community College Energy workshop for 40 attendees at the Florida Solar Energy Center (FSEC) in Cocoa, January 25, 2013.
• Was i nstrumental i n t he selection o f H illsborough C ommunity C ollege a s a w inner of t he (Sustainability Education and Economic Development) Green Genome Award which recognizes exemplary co mmunity co lleges n ationwide t hat h ave t aken a st rategic leadership r ole i n sustainability and green economic and workforce development.
• Attended a nd w as pa rt o f a n E nergy E fficiency a nd C onservation P anel a t 2013 B eyond Sustainability 37 th Annual Conference a t Hillsborough Community College, P lant Ybor City in February.
• Participated in, “An Energy Literate Citizenry from K-to-Gray: A Webcast on the Department of Energy’s Energy Literacy Initiative”, in March.
• FLATE hosted the Engineering Technology (ET) Forum in St. Petersburg on in April. (Energy Efficiency Specialization was presented).
• Planning i s unde rway t o host a third s ummer e nergy pr ogram f or un der-represented m iddle school students, to be held July 8 – 11 at HCC’s SouthShore Campus in Ruskin, FL in conjunction with the EST2 grant partners (BCC, TCC and FSCJ).

Page | 86
Funds l everaged/new p artnerships c reated: FLATE h as l everaged i ts NSF an d FESC r esources to h elp Brevard Co mmunity C ollege t o a pply f or a nd b e a warded a v ery c ompetitive N SF g rant, $ 500,000, implement t wo en ergy r elated sp ecialization w ithin t he A .S. E ngineering T echnology D egree. In addition, F LATE w as a ble t o s ecure a $ 1 00,000 a ward f rom N SF t o d evelop a faculty/student interchange t hat w ill allow F lorida t o b enefit from t he w ell ad vanced en ergy r elated technology educations practices at technology colleges in Spain.

Page | 87
FESC OUTREACH PROGRAM Educational Outreach Programs
(Final Report) PI: Dr. Pierce Jones, Director, Program for Resource Efficient Communities (PREC) Outreach Team Members: • Dr. Kathleen C. Ruppert • Hal S. Knowles III • Nicholas Taylor • Dr. Barbra Larson • Craig Miller • Ms. M. Jennison Kipp Searcy
Executive Summary The goal of the program is to develop educational outreach programs and materials designed to deliver practical, applicable information and knowledge on energy-related topics to the general public as well as targeted t o specific audiences su ch a s builders, p lanners, engineers, a rchitects, sm all b usinesses, local governments, and utilities through the Cooperative Extension Service and others. By focusing educational programming on climate a nd e fficient u se of energy a nd w ater, the p rogram a ims t o pr ovide t he knowledge needed by bui lding and energy professionals, l ocal governments, and t he general public, to significantly reduce greenhouse gas emissions in Florida.
Sustainable FloridiansSM Program
The outreach team developed the Sustainable FloridiansSM Program during the reporting period. The program details and progress are given below. Sustainable F loridiansSM is a s tatewide e ducational p rogram t hat w as pi loted in 2010 a nd 2011 t o t each Floridians how t o i mprove their e conomic, environmental a nd s ocial sustainability and t hat of t he communities in w hich t hey r eside. The p rogram w as d eveloped at the U niversity o f F lorida’s (UF) Department of Family, Y outh and Community Sciences in collaboration with the UF/IFAS Program for Resource Efficient Communities, the UF Office of Sustainability and UF/Extension Faculty in seven counties. The program’s curriculum is both educational and action-oriented, and is directed at citizens who enroll in the class through a County Extension Office participating in the program. Goals and Objectives: The Sustainable FloridiansSM course encourages individuals and communities to become more resilient at the local community level. Beyond the objective of developing an educated citizenry, the goals include: • Increasing participants’ knowledge about sustainability issues at the global, state and local levels, • Providing information that identifies Florida-specific actions for conserving energy and water, • Motivating participants to implement conservation and efficiency actions that save resources and money,
and

Page | 88
• Creating opportunities for community level leadership in sustainability education in a variety of settings from offices to community and neighborhood organizations
Participants meet w ith the p rogram f acilitator for s ix t o seven weekly sessi ons. T he c lasses include topics such as Why Should I Care?; Principles of Sustainability; Energy; Water; Transportation and Land Use; Food Systems; C onsumerism; C ommunity L eadership, etc. T he co urse i s v ery p articipatory an d a variety of teaching m ethodologies are us ed including weekly handouts, m ulti-media presentations, s upplemental readings and a textbook that allow participants to examine the material individually and then collectively. The course engages participants in group discussion, group and individual reflection, and personal action. One example of a successful program is Pinellas County. Pinellas County Extension offered the program as part of the pilot initiative and continues to offer it as part of its sustainability curriculum. Pinellas County, one of 35 c oastal counties in Florida, borders Tampa Bay and the Gulf of Mexico, has a population of 916,000 residents, and is considered the 6th most densely populated county in the state. Sustainability is a critical issue for a 97% “built-out” county with 25 different local governments. Although a challenge, balancing resource use with human and economic needs is critical to a successful and thriving l ocal economy. Achieving this goal i s possible with a motivated, engaged and educated citizenry. S ince the s tart of the p rogram, P inellas trained 66 p articipants who have donated over 1,800 volunteer hours, a value of $33,588 ( using $18.66 pe r hour as provided by Extension). In L eon C ounty, g raduates a re s erving a s f acilitators for l ocal E coTeams, w hich ar e d iscussion circles organized within neighborhoods, faith organizations and other groups, under the sponsorship of Sustainable Tallahassee, a partnership umbrella NGO. In addition, all participants are encouraged to track their monthly energy, water and vehicle miles travelled, and use consumption logs to develop a personal sustainability plan. The Sustainable FloridiansSM program has proven instrumental in filling the need for sustainability education within th e c ommunity-at-large. T he p articipatory co urse s tructure al lows t rainees t o ex plore a r ange o f educational material that will encourage sustainable practices and improve the economic, environmental and social conditions of their communities. The C ounty E xtension of fices are w ell p ositioned t o p rovide ed ucation at the local l evel an d p ossess the necessary infrastructure to support sustainability education at the community level. The Sustainable FloridiansSM program is now active in four counties…Leon, Osceola, Pinellas, and Sarasota. Marion County had an active program but the coordinator recently moved to take a position in Mississippi. Several other counties are contemplating beginning the program in the near future. While some counties train the participants to fulfill volunteer roles, other counties see the program as solely an educational program that they believe will have a ripple effect of educating others. The program, up unt il recently, ha d no statewide c oordination following c ompletion o f t he p ilot pr ogram. Now, with the assistance of UF’s Office of Sustainability, UF’s Program for Resource Efficient Communities through t he F lorida C ooperative E xtension S ervice is w orking w ith c ounty E xtension faculty t o d evelop curriculum r eview t eams, an ad visory co mmittee, and al l o f t he ac tions and a ctivities n eeded to o perate a statewide program. While in the midst of updating existing modules, along with creating new materials and determining efficiencies of scale, the program is continuing to gain statewide interest as indicated by the 16 counties represented at a recent in-service training.

P A P E R
A Critique of Alternative Power Generationfor Florida by Mechanical and Solar Means
A U T H O R SRobert H. WeisbergYonggang LiuClifford R. MerzCollege of Marine Science,University of South FloridaJyotika I. VirmaniFlorida Institute of Oceanography
Lianyuan ZhengCollege of Marine Science,University of South Florida
12 Marine Technology Society Journa
A B S T R A C T
l
Using observations of surface winds, solar radiation, ocean currents and wavescollected by the University of South Florida, Coastal Ocean Monitoring and Predic-tion System (COMPS), augmented by other data and numerical model simulations,we address the potential for electrical power generation for Florida by harnessingthe natural energy sources of wind and solar, along with ocean currents and waves.We begin by identifying what nature offers. For wind and solar, we use specificationsfrom existing, commercially available devices to convert nature’s bounty to power-generation estimates. In the absence of mature, commercially available devices forocean currents and waves, we draw upon physical principles to arrive at power-generation estimates for these potential sources. On the basis of what nature offersand what machinery may be capable of producing, we then make reasonable extra-polations onwhat these estimationsmaymean in a practical sense for supplying energyto society. Power generation from these naturally occurring, alternative energy sources,particularly wind and solar,may provide ameans for supplementing power generationby conventional fuels but does not provide a replacement for conventional fuels.Keywords: alternative power generation, ocean observations, windmills, watermills,waves, solar
seem to be relatively good for Florida, asubtropical peninsula, which is nearly
Introduction
When compared with other locales,the potential for electrical power gener-ation by alternative energy sources may
surrounded by water and bathed insunlight. Herein, we critically assessthis potential using observations ofwinds, incoming short-wave radiation,ocean currents and waves, supple-mented by other data and model simu-lations. The Ocean Circulation Groupat the College of Marine Science, Uni-versity of South Florida (OCG-CMS-USF), through the CMS CoastalOcean Monitoring and PredictionSystem (COMPS), began collectingsuch serial observations on the WestFlorida Continental Shelf (WFS) in1998. We analyze these data to deter-mine the energy fluxes (energy per unitarea per unit time) that are availablethrough natural processes, then trans-form these energy fluxes into practicalpower-generation time series based oneither commercial literature or physi-cally reasonable assumptions, and
then compare the results with con-sumptive metrics. The purpose is todemystify the concept of alternativepower generation by mechanical andsolar means and to place realistic ex-pectations on what may be achievablefor the state of Florida under typical,natural conditions. While our work isspecific to Florida (and primarily westcentral Florida), the findings, withsome modifications, are expected toalso apply elsewhere.
The article is organized as follows.Each of the subsequent four sectionsdeals with power-generation poten-tial by winds, ocean currents, oceanwaves, and incident solar radiation, re-spectively. For each medium, we useeither WFS observations collected bythe COMPS program, or model simu-lations, along with specifications fromcommercially advertised devices, or
reasonable assumptions, for convertingthe natural energy fluxes to power gen-eration. Given nature’s bounty andhow much of this may be convertedto electrical power, the Discussion sec-tion then presents these findings rela-tive to consumptive metrics, such asthe requirement for powering a house-hold and the economics of doing this.Not included, however, are any discus-sions on other complicating matterssuch as electrical transmission, storage,or daily to seasonal variations in peakor base loads that must be accommo-dated on a utility scale. Conclusionsfollow in the last section.
WindThe Data
An offshore array of WFS COMPSmoorings (Figure 1) was initiated in
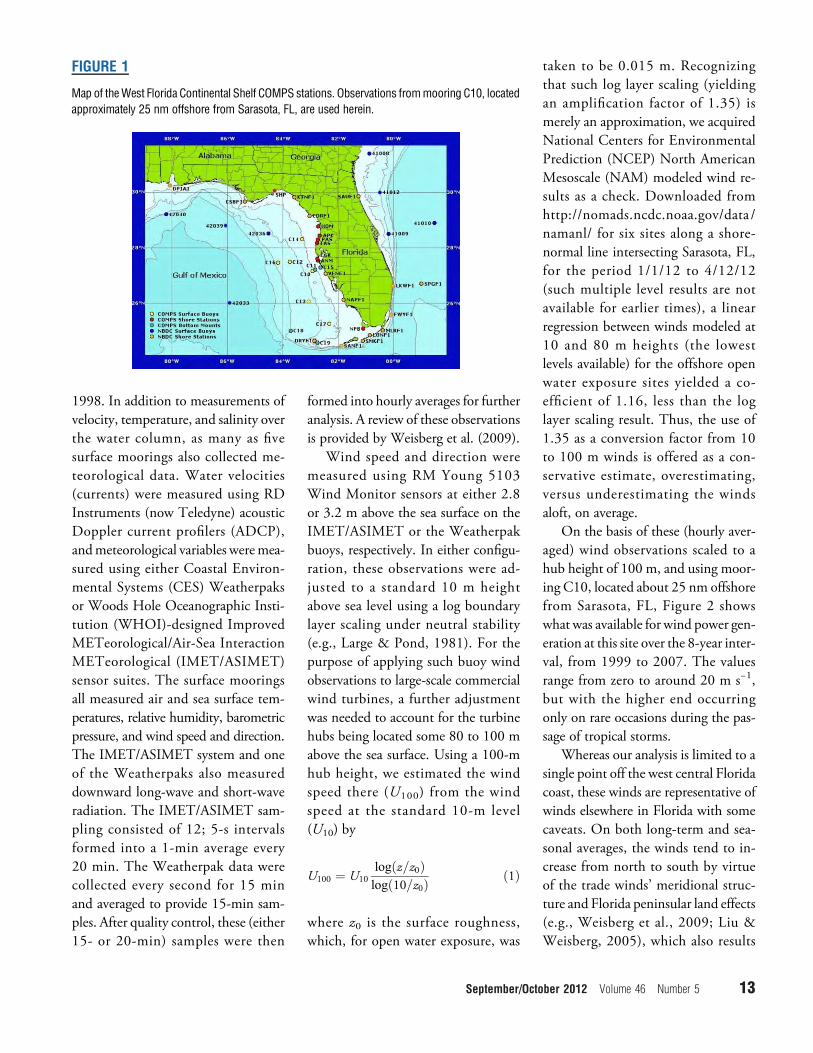
1998. In addition to measurements ofvelocity, temperature, and salinity overthe water column, as many as fivesurface moorings also collected me-teorological data. Water velocities(currents) were measured using RDInstruments (now Teledyne) acousticDoppler current profilers (ADCP),andmeteorological variables weremea-sured using either Coastal Environ-mental Systems (CES) Weatherpaksor Woods Hole Oceanographic Insti-tution (WHOI)-designed ImprovedMETeorological/Air-Sea InteractionMETeorological (IMET/ASIMET)sensor suites. The surface mooringsall measured air and sea surface tem-peratures, relative humidity, barometricpressure, and wind speed and direction.The IMET/ASIMET system and oneof the Weatherpaks also measureddownward long-wave and short-waveradiation. The IMET/ASIMET sam-pling consisted of 12; 5-s intervalsformed into a 1-min average every20 min. The Weatherpak data werecollected every second for 15 minand averaged to provide 15-min sam-ples. After quality control, these (either15- or 20-min) samples were then
formed into hourly averages for furtheranalysis. A review of these observationsis provided by Weisberg et al. (2009).
Wind speed and direction weremeasured using RM Young 5103Wind Monitor sensors at either 2.8or 3.2 m above the sea surface on theIMET/ASIMET or the Weatherpakbuoys, respectively. In either configu-ration, these observations were ad-justed to a standard 10 m heightabove sea level using a log boundarylayer scaling under neutral stability(e.g., Large & Pond, 1981). For thepurpose of applying such buoy windobservations to large-scale commercialwind turbines, a further adjustmentwas needed to account for the turbinehubs being located some 80 to 100 mabove the sea surface. Using a 100-mhub height, we estimated the windspeed there (U100) from the windspeed at the standard 10-m level(U10) by
U100 ¼ U10log z=z0ð Þlog 10=z0ð Þ ð1Þ
where z0 is the surface roughness,which, for open water exposure, was
September/Octo
taken to be 0.015 m. Recognizingthat such log layer scaling (yieldingan amplification factor of 1.35) ismerely an approximation, we acquiredNational Centers for EnvironmentalPrediction (NCEP) North AmericanMesoscale (NAM) modeled wind re-sults as a check. Downloaded fromhttp://nomads.ncdc.noaa.gov/data /namanl/ for six sites along a shore-normal line intersecting Sarasota, FL,for the period 1/1/12 to 4/12/12(such multiple level results are notavailable for earlier times), a linearregression between winds modeled at10 and 80 m heights (the lowestlevels available) for the offshore openwater exposure sites yielded a co-efficient of 1.16, less than the loglayer scaling result. Thus, the use of1.35 as a conversion factor from 10to 100 m winds is offered as a con-servative estimate, overestimating,versus underestimating the windsaloft, on average.
On the basis of these (hourly aver-aged) wind observations scaled to ahub height of 100 m, and using moor-ing C10, located about 25 nm offshorefrom Sarasota, FL, Figure 2 showswhat was available for wind power gen-eration at this site over the 8-year inter-val, from 1999 to 2007. The valuesrange from zero to around 20 m s−1,but with the higher end occurringonly on rare occasions during the pas-sage of tropical storms.
Whereas our analysis is limited to asingle point off the west central Floridacoast, these winds are representative ofwinds elsewhere in Florida with somecaveats. On both long-term and sea-sonal averages, the winds tend to in-crease from north to south by virtueof the trade winds’ meridional struc-ture and Florida peninsular land effects(e.g., Weisberg et al., 2009; Liu &Weisberg, 2005), which also results
FIGURE 1
Map of theWest Florida Continental Shelf COMPS stations. Observations frommooring C10, locatedapproximately 25 nm offshore from Sarasota, FL, are used herein.
ber 2012 Volume 46 Number 5 13

in the trade winds being a little stron-ger on the east coast. For synoptic scaleweather events, the entire state ofFlorida is similarly affected. On thediurnal time scale, the east coast seabreeze tends to be more regular thanthat on the west coast.
Converting Wind Speedto Electrical Power-Generation Potential
Commercially available wind tur-bines are discussed with respect to theirnameplate-rated power-generationcapacity. This can be misleadingbecause the actual power output de-pends on wind speed. As a representa-tive example we consider a GeneralElectric (GE) 3.6 MWOffshore SeriesWind Turbine, with specificationsthat are available in a brochure, whichmay be downloaded from the manu-
14 Marine Technology Society Journa
facturer’s Internet site. From thewind load-power curve, we see thatthe turbine does not begin to produceelectrical power until the wind speedexceeds 3.5 m s−1 (the cut-in windspeed). Power generation then in-creases with increasing wind speed,reaching the nameplate-rated capacity(3.6 MW) at a wind speed of 14 m s−1
(the rated wind speed), and the deviceceases power generation and shutsdown when the wind speed exceeds27 m s−1 (the cut-out wind speed).The lower and upper horizontal lineson Figure 2 represent the cut-in andthe nameplate-rated capacities for theGE 3.6 MW turbine, respectively.From 8 years of WFS data, we seethat the winds at 100-m hub heightfail to drive the turbine some 20% ofthe time and that rarely do the windsreach the nameplate rated capacity.
l
To determine what the power out-put may be when the turbine is run-ning, we fitted a polynomial to thepower curve provided by the brochure,and we used this to convert wind speedto power output for speeds betweenthe cut-in and rated capacity values.For wind speeds between 14 and27 m s−1, the output was held constantat 3.6MW (Figure 3). The results, fur-ther averaged to provide daily values,are shown in Figure 4, from whichseveral points are clear. First, thenameplate-rated capacity is rarelyachieved. Second there are many days(excluding the larger interval data gaps)when the cut-in speed of 3.5 m s−1 isnot exceeded, and hence no power isgenerated. Third, when looking atthe climatological monthly meantime series (the lowest panel) obtainedby averaging all Januarys, all Februarys,etc., we see that minimum and maxi-mum power generation occurs in sum-mer and fall months, respectively. Themonthly mean minimum is about0.6MW, themonthlymeanmaximumis about 1.8 MW, and the grand aver-age across all years and months is about1 MW. The minimum in summermonths is troublesome for Florida be-cause that is when the demand for airconditioning is the largest.
Ocean CurrentsThe Physics
Unlike windmills, where commer-cial maturity provides known power-generation potential, watermills drivenby ocean currents remain in develop-ment. Estimating the potential forpower generation by ocean currents re-quires that we begin from first princi-ples. Available power, P, for potentialextraction from ocean currents is thekinetic energy flux, 1
2 ρV3, times the
area, A, of the device used for extracting
FIGURE 2
Hourly averagedwinds scaled to 100-mhub height using C10 observations from 1999 (top) through2007 (bottom). The lower and upper red lines indicate the turbine cut-in value of 3.5 m s−1 and therated power-generation wind speed of 14 m s−1, respectively.
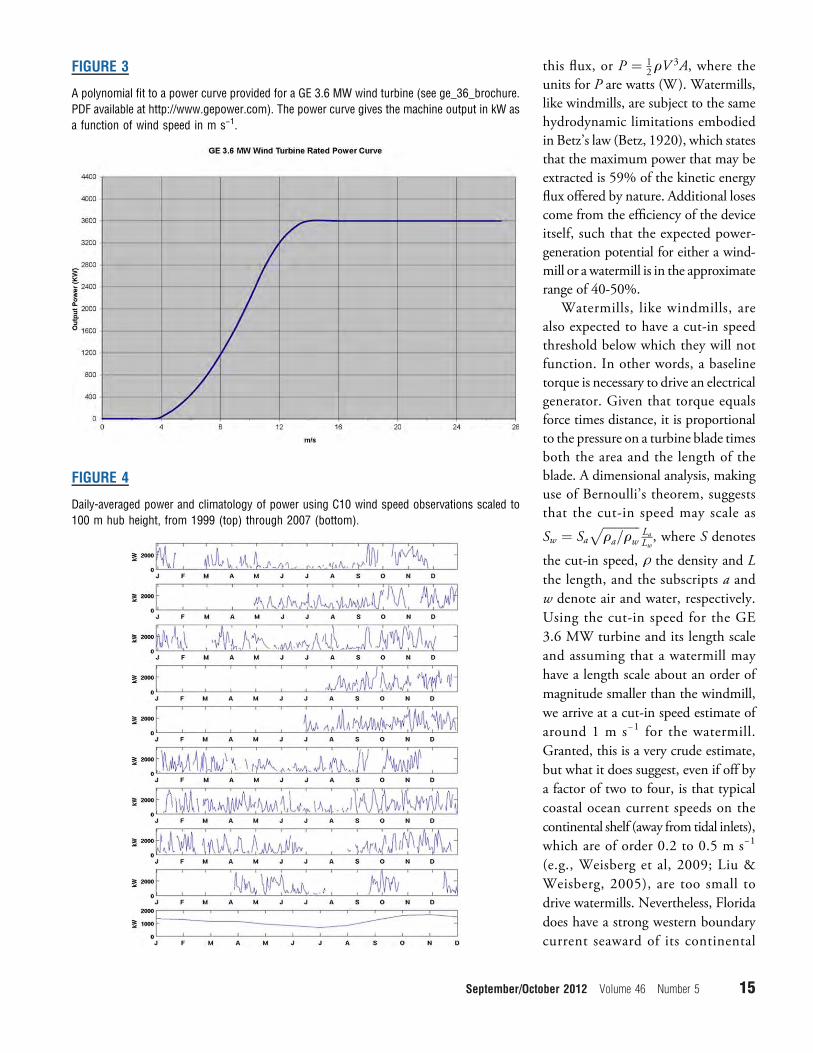
September
.
/Octo
this flux, or P ¼ 12 ρV
3A, where theunits for P are watts (W). Watermills,like windmills, are subject to the samehydrodynamic limitations embodiedin Betz’s law (Betz, 1920), which statesthat the maximum power that may beextracted is 59% of the kinetic energyflux offered by nature. Additional losescome from the efficiency of the deviceitself, such that the expected power-generation potential for either a wind-mill or a watermill is in the approximaterange of 40-50%.
Watermills, like windmills, arealso expected to have a cut-in speedthreshold below which they will notfunction. In other words, a baselinetorque is necessary to drive an electricalgenerator. Given that torque equalsforce times distance, it is proportionalto the pressure on a turbine blade timesboth the area and the length of theblade. A dimensional analysis, makinguse of Bernoulli’s theorem, suggeststhat the cut-in speed may scale as
Sw ¼ Saffiffiffiffiffiffiffiffiffiffiffiffiρa=ρw
pLaLw, where S denotes
the cut-in speed, ρ the density and Lthe length, and the subscripts a andw denote air and water, respectively.Using the cut-in speed for the GE3.6 MW turbine and its length scaleand assuming that a watermill mayhave a length scale about an order ofmagnitude smaller than the windmill,we arrive at a cut-in speed estimate ofaround 1 m s−1 for the watermill.Granted, this is a very crude estimate,but what it does suggest, even if off bya factor of two to four, is that typicalcoastal ocean current speeds on thecontinental shelf (away from tidal inlets),which are of order 0.2 to 0.5 m s−1
(e.g., Weisberg et al, 2009; Liu &Weisberg, 2005), are too small todrive watermills. Nevertheless, Floridadoes have a strong western boundarycurrent seaward of its continental
FIGURE 4
Daily-averaged power and climatology of power using C10 wind speed observations scaled to100 m hub height, from 1999 (top) through 2007 (bottom).
FIGURE 3
A polynomial fit to a power curve provided for a GE 3.6 MW wind turbine (see ge_36_brochurePDF available at http://www.gepower.com). The power curve gives the machine output in kW asa function of wind speed in m s−1.
ber 2012 Volume 46 Number 5 15

shelf, for which we can examine thepotential utility of power generationby watermills. For the west coast ofFlorida this western boundary currentis the Gulf of Mexico Loop Current,which feeds into the Gulf Stream onthe east coast of Florida. Being thatthe Gulf Stream is tightly constrainedto flow between Florida and theBahamas, this is the most practicalplace for considering power genera-tion by watermills.
Application to the Gulf StreamThe Gulf Stream, as it flows
through the channel between Floridaand the Bahamas, is highly baroclinic,with maximum speeds generally lo-cated at the surface toward the westernside of the channel (see Figure 5, afterLeaman et al., 1987). Speeds near thesurface, and approximately within abaroclinic Rossby radius of deforma-tion from the Florida side, are as highas 2 m s−1 (4 kts), diminishing rapidlywith depth to about 1 m s−1 at 300 mdepth and then to less than 0.5 m s−1
below 500 m depth. The total volumeflux through the Florida Straits haslong been recognized to be around30 × 106 m3 s−1 (or Sverdrups) (e.g.,
16 Marine Technology Society Journa
Stommel, 1965; Niiler & Richardson,1973; Leaman et al., 1987).
For our purposes, we use velocitytime series simulated by a numericalcirculation model to estimate thepower-generation potential for theGulf Stream. The model chosen isthe global Hybrid Coordinate OceanModel (HYCOM) run by the U.S.Navy Research Laboratory and theHYCOM consortium (e.g., Chassignetet al., 2007, 2009). Figures 6 and 7show volume and kinetic energy trans-ports, respectively, for transects at thelatitudes of Miami, FL, and PalmBeach, FL. In each of these figures, thetransports were calculated over three dif-ferent depth intervals, 0 to 50 m, 50 to
l
300 m, and 300 m to the bottom,plus the total transports across the en-tire cross sections. The first of these fig-ures provides a check on the HYCOMsimulation. From it, we see that thetotal transports properly represent theobservations towithin reasonable boundson natural variability and measurementerror. This provides justification forusing these model simulation resultsto discuss the kinetic energy flux andhow these integrate to provide esti-mates on power-generation potential.
Two practical considerations cometo play. First, with sea state undernortherly winds being very large attimes across the Florida Straits, itwould be difficult, if not impossible,
FIGURE 6
Gulf Stream volume transport across two sections between Florida and the Bahamas at the latitudesof Miami, FL, and Palm Beach, FL, calculated for the calendar year 2008 using a Global HYCOMsimulation. Transports are shown for three different depth intervals, plus the total transport acrossthe entire cross sections. The dashed lines on the bottom panel provide the year-long averages.(Color versions of figures available online at: http://www.ingentaconnect.com/content/mts/mtsj/2012/00000046/00000005.)
FIGURE 5
A Gulf Stream cross section for the northcomponent of velocity sampled at 27°N(from Leaman et al., 1987).
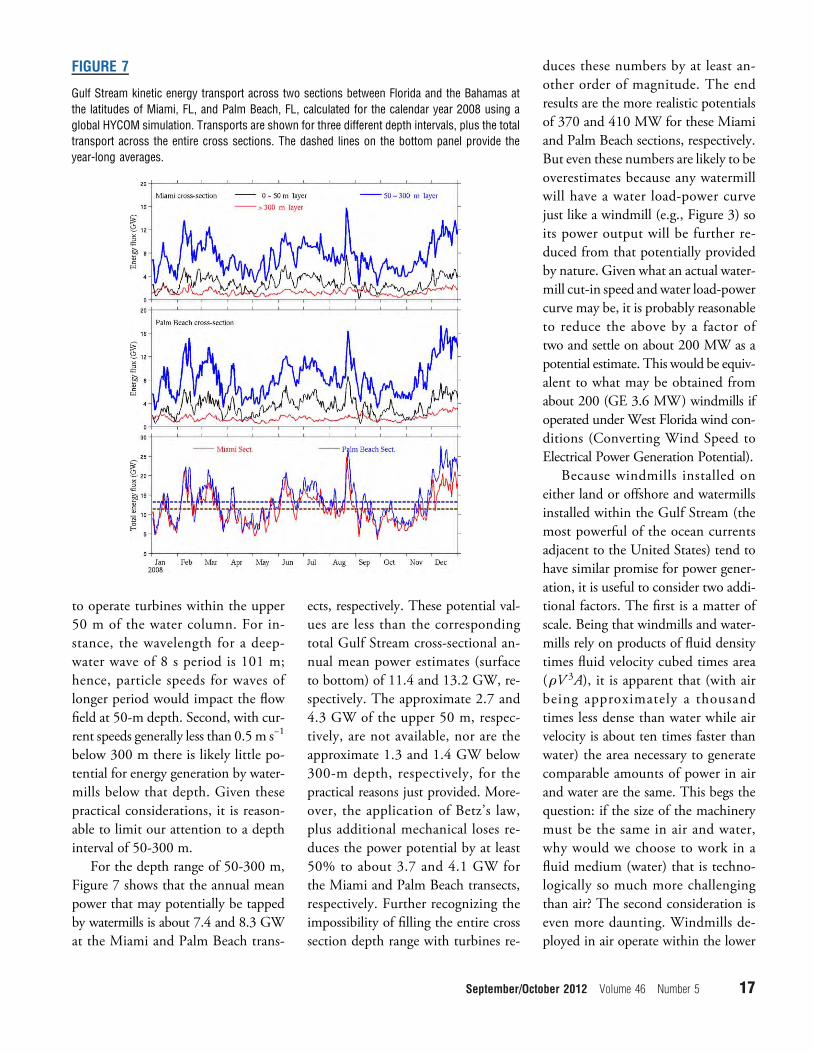
to operate turbines within the upper50 m of the water column. For in-stance, the wavelength for a deep-water wave of 8 s period is 101 m;hence, particle speeds for waves oflonger period would impact the flowfield at 50-m depth. Second, with cur-rent speeds generally less than 0.5 m s−1
below 300 m there is likely little po-tential for energy generation by water-mills below that depth. Given thesepractical considerations, it is reason-able to limit our attention to a depthinterval of 50-300 m.
For the depth range of 50-300 m,Figure 7 shows that the annual meanpower that may potentially be tappedby watermills is about 7.4 and 8.3 GWat the Miami and Palm Beach trans-
ects, respectively. These potential val-ues are less than the correspondingtotal Gulf Stream cross-sectional an-nual mean power estimates (surfaceto bottom) of 11.4 and 13.2 GW, re-spectively. The approximate 2.7 and4.3 GW of the upper 50 m, respec-tively, are not available, nor are theapproximate 1.3 and 1.4 GW below300-m depth, respectively, for thepractical reasons just provided. More-over, the application of Betz’s law,plus additional mechanical loses re-duces the power potential by at least50% to about 3.7 and 4.1 GW forthe Miami and Palm Beach transects,respectively. Further recognizing theimpossibility of filling the entire crosssection depth range with turbines re-
September/Octo
duces these numbers by at least an-other order of magnitude. The endresults are the more realistic potentialsof 370 and 410 MW for these Miamiand Palm Beach sections, respectively.But even these numbers are likely to beoverestimates because any watermillwill have a water load-power curvejust like a windmill (e.g., Figure 3) soits power output will be further re-duced from that potentially providedby nature. Given what an actual water-mill cut-in speed and water load-powercurve may be, it is probably reasonableto reduce the above by a factor oftwo and settle on about 200 MW as apotential estimate. This would be equiv-alent to what may be obtained fromabout 200 (GE 3.6 MW) windmills ifoperated under West Florida wind con-ditions (Converting Wind Speed toElectrical Power Generation Potential).
Because windmills installed oneither land or offshore and watermillsinstalled within the Gulf Stream (themost powerful of the ocean currentsadjacent to the United States) tend tohave similar promise for power gener-ation, it is useful to consider two addi-tional factors. The first is a matter ofscale. Being that windmills and water-mills rely on products of fluid densitytimes fluid velocity cubed times area(ρV 3A), it is apparent that (with airbeing approximately a thousandtimes less dense than water while airvelocity is about ten times faster thanwater) the area necessary to generatecomparable amounts of power in airand water are the same. This begs thequestion: if the size of the machinerymust be the same in air and water,why would we choose to work in afluid medium (water) that is techno-logically so much more challengingthan air? The second consideration iseven more daunting. Windmills de-ployed in air operate within the lower
FIGURE 7
Gulf Stream kinetic energy transport across two sections between Florida and the Bahamas atthe latitudes of Miami, FL, and Palm Beach, FL, calculated for the calendar year 2008 using aglobal HYCOM simulation. Transports are shown for three different depth intervals, plus the totaltransport across the entire cross sections. The dashed lines on the bottom panel provide theyear-long averages.
ber 2012 Volume 46 Number 5 17

100 m of the atmosphere or in thelower part of the frictional boundarylayer, which is driven by and continu-ally replenished by the geostrophic in-terior that extends to the tropopause,some 10 km aloft. Watermills, in con-trast, operating across a major portionof the water column, are in the geo-strophic interior itself and hence, un-like windmills, have no natural meansfor replenishing the energy that theymay extract. It is for this reason thatwindmill farms may have closelyspaced units with additional windmillseven distributed downwind from oneanother. Watermills, in contrast, can-not share this deployment strategy.Once power is removed from a crosssection, it cannot be readily replen-ished. For these two reasons, even inthe swiftest of currents, like the GulfStream, the notion of power genera-tion by watermills tapping the kineticenergy flux seems very limited whencompared with what may be achievedby windmills.
Ocean WavesThe Physics
Waves, like currents, also possessan energy flux that may be tapped bymechanical devices. The availablepower, PW, for potential extractionfrom ocean gravity waves is the totalmechanical energy flux per unitwave crest width, 12 ρga
2CG , times thecrest width length, L, of the deviceused for extracting this flux, orPW ¼ 1
2 ρga2CGL, where g is the accel-
eration of gravity, a is the wave ampli-tude, CG is the group velocity, and theunits for PW are watts. An alternativeexpression for PW, based on significantwave height and application of thedeep water dispersion relation, isPW ¼ 1
2H2s TL, where T is the wave
period and significant wave height Hs
18 Marine Technology Society Journa
is defined as the average of the highestthird of the waves.
Application to the WFSSeveral point measurements of
surface gravity waves are available forthe WFS, either from COMPS obser-vations or a NOAA NWS weatherbuoy. As it is more instructive to lookat the entire field of waves and how thisvaries throughout the year, we opted tobase our estimates on numericalmodel simulations, of which thereare several. The longest of these is
l
from the NOAA application of theWaveWatch III model, e.g., Tolman(1991, 1999, 2010). Figure 8 showsa monthly mean wave energy fluxper unit crest width climatology for theWFS with contour units of kW m−1
calculated from an 8-year analysis ofWaveWatch III model results inclusiveof 1999 to 2007. A robust annual cycleis seen with minimum wave energy insummer andmaximumwave energy inwinter, similar to that of the significantwave height measured at NDBC Buoy42036 (Liu et al., 2010). This finding
FIGURE 8
Monthly mean surface gravity wave energy flux per unit crest width calculated for the WFS usingthe WaveWatch III reanalysis from 1999 to 2007. The contour units are kW m−1, and each ofthe monthly climatologies is calculated by averaging all similar months, i.e., all Januarys, allFebruarys, etc.

is consistent with the prevailing winddirections for the WFS varying fromsoutheasterly in summer to north-easterly in winter (e.g., Liu &Weisberg,2005).With low wave energy, theWFSis not very promising for alternativepower generation by tapping the energyflux of surface gravity waves, except per-haps for running low power instrumentsin situ.
The east coast of Florida does havea larger wave climate, especially northof the Bahamas where the entire fetchof the north Atlantic comes to play.But even there the energy flux per unitcrest width remains small comparedwith other higher energy coastlinesworldwide (Figure 9), where tens toeven a hundred kWm−1 are potentiallyavailable. As with electrical generationpotential using ocean currents, thequestion becomes one of feasibility.Is there enough energy potentiallyavailable to justify the costs for extrac-tion and can the technical challengesbe met?
The commercial literature andcommercial advocate group studies(e.g., McGowen et al., 2005) suggestthat wave energy extraction is econom-ically feasible for regions with energyflux per unit crest width greater than
15 kW m−1. Two examples of devicesunder development are (1) a largesnake-like set of linked cylinders thatextract wave energy via undulationsacross a large linked cylinder length(e.g., 180 m for the 4-m diameterPelamis WavePower device; http://www.pelamiswave.com) and (2) a4-m diameter buoy that tracks thevertical motion associated with wavepropagation past a fixed point (e.g.,Ocean Power Technologies, Inc.,http://www.oceanpowertechnologies.com). The first of these uses the lengthof the device to extract a major portionof the wave energy flux past the 4-mdiameter cross section; the second ofthese is more limited in the percent-age of the flux that can be extracted.Without questioning any of thedetails (see the industry brochures), itis clear that for either of these devicesthe total flux that may potentially betapped is whatever passes the 4-mdevice width. So in either case, thequestion becomes: can some frac-tion of 15 kW m−1 times 4 m pro-vide an economically feasible sourceof power (assuming that 15 kW m−1,as promoted, is a viable level)? Atbest, assuming complete extractionwith no loses (itself impossible),
September/Octo
devices such as these can garner atmost 60 kW.
SolarThe Observations
Two of the COMPS buoys carrieddownward short-wave radiation sen-sors. Here we will use the most com-plete of these from mooring C10,located approximately 25 nm offshorefrom Sarasota, FL, where an EppleyPSP sensor was mounted as part ofthe IMET/ASIMET suite of air-sea in-teraction sensors. The veracity of thesemeasurements for our purposes herefollows from previous studies thatutilized these data to diagnose the netsurface heat flux and the associated var-iations on water column temperature(e.g., Virmani & Weisberg, 2003,2005). Figure 10 provides these hourlysampled, solar insolation data thatwere collected approximately 2.5 mabove the sea surface for the 8-year in-terval, from 1999 to 2007. On anhourly basis, we see that the daily max-imum insolation varies from as high as1,000Wm−2 in spring and summer toas low as 500Wm−2 in fall and winter.Averaging diurnally to account for thefact that there is no incoming short-wave radiation at night, we findhighest daily mean values rangingfrom about 300 W m−2 in summerto 150 W m−2 in winter.
Equivalent Energy GenerationPotential Using Solar Panels
As with our analysis of wind energygeneration, which recognized thematurity of the industry and hence al-lowed for us to choose a vendor withestablished product specifications, wedo the same here for solar power.The example used is a Siemens SP75solar panel. The method employed todetermine the output of such a solar
FIGURE 9
Global wave energy flux per unit crest width (after McGowen et al., 2005).
ber 2012 Volume 46 Number 5 19

panel is to calculate the equivalentnumber of hours for which suchpanel would capture insolation at a1,000 W m−2 level. Thus, we com-puted an annual mean, hourly insola-tion curve for 2001 (the year for whichour data are most complete) and inte-grated the area under that curve to ar-rive at an equivalent area (insolation ×t ime) a t an inso la t ion leve l o f1,000 W m−2 (Figure 11). Given thatthe Siemens SP75 solar panel is ratedto output 75 W at an insolation of1,000 W m−2, we then determinedthe daily mean output for the deviceto be 404W h (based on the equivalentsolar production day of 5.39 h). Divid-ing by 24 h gives 16.8W as the averageoutput for this annually averaged day,and dividing by the area of the solarpanel (0.63 m2) gives 26.7 W m−2
as the daily averaged power output
20 Marine Technology Society Journa
F
Tbb
l
per unit area under WFS daily aver-aged insolation for this particularsolar panel.
This technique (just demonstratedfor an annually averaged diurnal cycle)was applied on a daily basis to convertobserved incoming short-wave radia-tion to solar panel output normalizedto a square meter. The results werethen averaged diurnally to providedaily averaged power generation timeseries for the entire 8 years of record.Figure 12 shows the daily results,along with a climatological monthlymean time series (the bottom panel)obtained by averaging all of the Januarys,all of the Februarys, etc.
The daily averages range fromessentially zero on strongly overcastdays to 40 W m−2 on clear summerdays. When averaged over the monthwe see a minimum in winter ofabout 20 W m−2 and a maximumin spring of about 38 W m−2. The
FIGURE 10
Hourly sampled time series of incoming short-wave radiation measured 2.5 m above mean sealevel at mooring C10 located approximately 25 nm offshore from Sarasota, FL. Shown are8 years of observations spanning 1999 (top) through 2007 (bottom).
IGURE 11
he 2001 annually averaged daily insolation curve observed at C10 (blue) with equivalent num-er of hours at 1,000 W m−2 (black), where the areas under either of these distributions (blue orlack) are the same.

average across the entire year is about25 W m−2.
DiscussionElectrical power generation by
windmills, solar panels, watermills(ocean current turbines), and wave de-vices have been topics of discussion forseveral decades. Wind and solar appli-cations are mature, and commercialdevices may be purchased and operated.Currents and waves applications havenot reached a similar level of maturity.Devices exist and some have under-gone field tests, but none are commer-cially viable yet. That in itself speaks tothe relative utility of these concepts.The application of over a decade ofcoastal ocean observations from theWFS (augmented by model simula-tions) supports this viewpoint that al-ternative power generation from windand solar sources appears to be more
promising than that from ocean cur-rents and waves.
Further appreciation of this findingfollows from a few simple economicsconsiderations. We begin with theknown cost for powering a modesthome. As an example, consider a2,000 feet2 Florida apartment thatconsumes about 1.7 kW of electricalpower on annual average at a cost ofabout $140 per month or $1,680 peryear. If we were to transition from con-ventional fuels to wind power by de-ploying a machine equivalent to a GE3.6 MW turbine, we would average1 MW of production, sufficient (onannual average) to power 588 suchhomes. The present cost for poweringthese homes based on conventionalfuels and rounded is $1,000,000. Acost effectiveness transition to windpower would therefore require thatthe combined amortization, mainte-nance, energy storage, transmission
September/Octo
and distribution, salaries, general andadministrative costs, plus shareholderprofits be about $1,000,000 per yearfor such a windmill. Whereas the spe-cific costs for turbine purchase and in-stallation are not readily available,anecdotal, nonrefereed literature sug-gests that these range between $1.2and $2.6 million per MW of name-plate capacity. Thus, depending onthe amortization of these capitalcosts, wind power may be approachingcost effectiveness. Support for thiscomes from an Associated Press articlesuggesting that the electrical deliverycost for a wind farm proposed offshoreof Cape Cod, MA, will be roughlytwice that by conventional fuels. Sowhile the costs for electrical power gen-eration by wind is higher than by con-ventional fuels, wind power generationmay be economically feasible in the fu-ture, consistent with the fact that thewind power industry is indeed a ma-ture one.
As with wind, it is difficult to findstraightforward information on solarpanel costs. Systems installation costs areestimated at about $1,000 m−2, andwith an annually averaged solar panelpower production of 26.7 W m−2 byobserved Florida insolation, the costper watt would be about $38. Thus, thesolar panel cost for a modest 1.7 kWhouse would be about $64,000, some38 times the present annual cost ofelectricity by conventional fuels. Thisof course does not include any consid-erations of metering or storage strategiesor properly sizing a system to actuallymeet user needs. While the above esti-mate may not be out of the realm ofwhatmay be reasonable based on amorti-zation costs, any individual home ownerwould be hard pressed to justify suchinvestment without a major subsidy.
The economics take a rapid turn forthe worse when considering either
FIGURE 12
1999 through 2007 time series of daily average solar panel output based on observed insolationfrom C10 and climatology.
ber 2012 Volume 46 Number 5 21
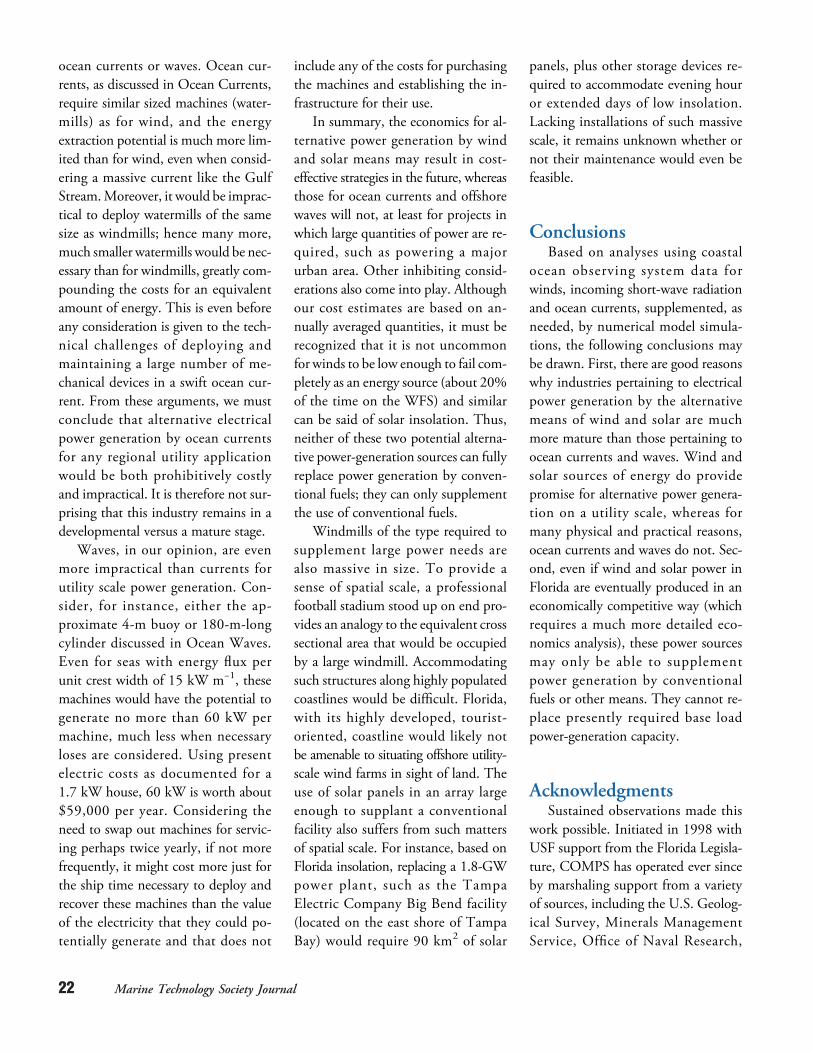
ocean currents or waves. Ocean cur-rents, as discussed in Ocean Currents,require similar sized machines (water-mills) as for wind, and the energyextraction potential is much more lim-ited than for wind, even when consid-ering a massive current like the GulfStream.Moreover, it would be imprac-tical to deploy watermills of the samesize as windmills; hence many more,much smaller watermills would be nec-essary than for windmills, greatly com-pounding the costs for an equivalentamount of energy. This is even beforeany consideration is given to the tech-nical challenges of deploying andmaintaining a large number of me-chanical devices in a swift ocean cur-rent. From these arguments, we mustconclude that alternative electricalpower generation by ocean currentsfor any regional utility applicationwould be both prohibitively costlyand impractical. It is therefore not sur-prising that this industry remains in adevelopmental versus a mature stage.
Waves, in our opinion, are evenmore impractical than currents forutility scale power generation. Con-sider, for instance, either the ap-proximate 4-m buoy or 180-m-longcylinder discussed in Ocean Waves.Even for seas with energy flux perunit crest width of 15 kW m−1, thesemachines would have the potential togenerate no more than 60 kW permachine, much less when necessaryloses are considered. Using presentelectric costs as documented for a1.7 kW house, 60 kW is worth about$59,000 per year. Considering theneed to swap out machines for servic-ing perhaps twice yearly, if not morefrequently, it might cost more just forthe ship time necessary to deploy andrecover these machines than the valueof the electricity that they could po-tentially generate and that does not
22 Marine Technology Society Journa
include any of the costs for purchasingthe machines and establishing the in-frastructure for their use.
In summary, the economics for al-ternative power generation by windand solar means may result in cost-effective strategies in the future, whereasthose for ocean currents and offshorewaves will not, at least for projects inwhich large quantities of power are re-quired, such as powering a majorurban area. Other inhibiting consid-erations also come into play. Althoughour cost estimates are based on an-nually averaged quantities, it must berecognized that it is not uncommonfor winds to be low enough to fail com-pletely as an energy source (about 20%of the time on the WFS) and similarcan be said of solar insolation. Thus,neither of these two potential alterna-tive power-generation sources can fullyreplace power generation by conven-tional fuels; they can only supplementthe use of conventional fuels.
Windmills of the type required tosupplement large power needs arealso massive in size. To provide asense of spatial scale, a professionalfootball stadium stood up on end pro-vides an analogy to the equivalent crosssectional area that would be occupiedby a large windmill. Accommodatingsuch structures along highly populatedcoastlines would be difficult. Florida,with its highly developed, tourist-oriented, coastline would likely notbe amenable to situating offshore utility-scale wind farms in sight of land. Theuse of solar panels in an array largeenough to supplant a conventionalfacility also suffers from such mattersof spatial scale. For instance, based onFlorida insolation, replacing a 1.8-GWpower plant, such as the TampaElectric Company Big Bend facility(located on the east shore of TampaBay) would require 90 km2 of solar
l
panels, plus other storage devices re-quired to accommodate evening houror extended days of low insolation.Lacking installations of such massivescale, it remains unknown whether ornot their maintenance would even befeasible.
ConclusionsBased on analyses using coastal
ocean observing system data forwinds, incoming short-wave radiationand ocean currents, supplemented, asneeded, by numerical model simula-tions, the following conclusions maybe drawn. First, there are good reasonswhy industries pertaining to electricalpower generation by the alternativemeans of wind and solar are muchmore mature than those pertaining toocean currents and waves. Wind andsolar sources of energy do providepromise for alternative power genera-tion on a utility scale, whereas formany physical and practical reasons,ocean currents and waves do not. Sec-ond, even if wind and solar power inFlorida are eventually produced in aneconomically competitive way (whichrequires a much more detailed eco-nomics analysis), these power sourcesmay only be able to supplementpower generation by conventionalfuels or other means. They cannot re-place presently required base loadpower-generation capacity.
AcknowledgmentsSustained observations made this
work possible. Initiated in 1998 withUSF support from the Florida Legisla-ture, COMPS has operated ever sinceby marshaling support from a varietyof sources, including the U.S. Geolog-ical Survey, Minerals ManagementService, Office of Naval Research,

National Oceanic and AtmosphericAdministration, the Florida Depart-ment of Community Affairs and theFlorida Wildlife Commission, recentsupport (in addition to USF) beingthrough the Office of Naval Researchgrants N00014-05-1-0483 andN00014-10-1-0785, NOAA ECOHABgrant NA06NOS4780246, NOAAIOOS grant NA07NOS4730409,and NSF grant OCE-0741705. Specificto this application is also a grant fromthe Florida Energy Systems Consor-tium (FESC). Data collection successis owed to COMPS staff, with seagoingoperations by J. Law and (formerly)R. Cole, data analysis, managementand quality assurance by J. Donovan,D. Mayer and P. Smith, and engineer-ing assistance through the CMSCenterfor Ocean Technology, in particularR. Russell. Prof. S. Shin assisted withthe NAM boundary layer winds.
Corresponding Author:Robert H. WeisbergCollege of Marine Science,University of South Florida140 7th Ave. S., St. Petersburg,FL 33701Email: [email protected]
ReferencesBetz, A. 1920. Das Maximum der theoretisch
möglichen Ausnutzung des Windes durch
Windmotoren, Zeitschrift für das gesamte
Turbinenwesen. 20. September 1920.
Chassignet, E.P., Hurlburt, H.E., Smedstad,
O.M., Halliwell, G.R., Hogan, P.J., Wallcraft,
A.J.,… Bleck, R. 2007. The HYCOM (HYbrid
Coordinate Ocean Model) data assimilative sys-
tem. J Marine Syst. 65:60-83. http://dx.doi.org/
10.1016/j.jmarsys.2005.09.016.
Chassignet, E.P., Hurlburt, H.E., Metzger, E.J.,
Smedstad, O.M., Cummings, J., Halliwell,
G.R., … Wilkin, J. 2009. U.S. GODAE:
Global ocean prediction with the HYbrid
Coordinate Ocean Model (HYCOM). Ocean-
ography. 22:48-59. http://dx.doi.org/10.5670/
oceanog.2009.39.
Large, W.G., & Pond, S. 1981. Open ocean
momentum flux measurements in moderate to
strong winds. J Phys Oceanogr. 11:324-36.
http://dx.doi.org/10.1175/1520-0485(1981)
011<0324:OOMFMI>2.0.CO;2.
Leaman, K.D., Molinari, R., & Vertes, P.
1987. Structure and variability of the Florida
vurrent at 27N: April 1982–July 1984. J Phys
Oceanogr. 17:565-83. http://dx.doi.org/
10.1175/1520-0485(1987)017<0565:
SAVOTF>2.0.CO;2.
Liu, Y., & Weisberg, R.H. 2005. Patterns
of ocean current variability on the West
Florida Shelf using the self-organizing map.
J Geophys Res. 110:C06003. http://dx.doi.org/
10.1029/2004JC002786.
Liu, Y., Weisberg, R.H., Merz, C.R.,
Lichtenwalner, S., & Kirkpatrick, G.J. 2010.
HF radar performance in a low energy envi-
ronment: CODAR SeaSonde experience on
the West Florida Shelf. J Atmos Oceanic
Technol. 27(10):1689-710. http://dx.doi.org/
10.1175/2010JTECHO720.1.
McGowen, C., Bedard, R., & Lenssen, N.
2005. Ocean tidal and wave energy, renewable
energy technical; assessment guide-TAG-RE,
EPRI, Palo Alto, CA, 2005, 1010489.
Niiler, P.P., & Richardson, W.S. 1973.
Seasonal variability of the Florida current.
J Mar Res. 31:144-67.
Stommel, H.M. 1965. The Gulf Stream:
a physical and dynamical description.
Berkeley, CA: University of California Press.
248 pp.
Tolman, H.L. 1991. A third-generation
model for wind waves on slowly varying,
unsteady and inhomogeneous depths and
currents. J Phys Oceanogr. 21:782-97.
Tolman, H.L. 1999. User manual and system
documentation of WAVEWATCH-III ver-
sion 1.18. NOAA / NWS / NCEP / OMB
Technical Note 166. 110 pp. http://dx.doi.org/
September/Octo
10.1175/1520-0485(1991)021<0782:
ATGMFW>2.0.CO;2.
Tolman, H.L. 2010. WAVEWATCH III (R)
development best practices Ver. 0.1. NOAA /
NWS / NCEP / MMAB Technical Note 286,
19 pp.
Virmani, J.I., & Weisberg, R.H. 2003. Fea-
tures of the observed annual ocean-atmosphere
flux variability on the West Florida Shelf.
J Climate. 16:734-45. http://dx.doi.org/
10.1175/1520-0442(2003)016<0734:
FOTOAO>2.0.CO;2.
Virmani, J.I., & Weisberg, R.H. 2005.
Relative humidity over the West Florida
Continental Shelf. Mon Weather Rev.
133:1671-86. http://dx.doi.org/10.1175/
MWR2944.1.
Weisberg, R.H., He, R., Liu, Y., & Virmani,
J.I. 2005. West Florida shelf circulation on
synoptic, seasonal, and inter-annual time
scales. In Circulation in the Gulf of Mexico,
W. Sturges and A. Lugo-Fernandez, eds.,
AGU monograph series. Geophysical
Monograph. 161:325-47.
Weisberg, R.H., Barth, A., Alvera-Azcárate, A.,
& Zheng, L. 2009. A coordinated coastal
ocean observing and modeling system for
the West Florida Shelf. Harmful Algae.
8:585-98. http://dx.doi.org/10.1016/
j.hal.2008.11.003.
ber 2012 Volume 46 Number 5 23