University of San Diego Burnham-Moores Center for Real...
26
University of San Diego Burnham-Moores Center for Real Estate 20 th Annual Real Estate Conference February 19, 2016
Transcript of University of San Diego Burnham-Moores Center for Real...

University of San Diego Burnham-Moores Center for Real Estate 20th Annual Real Estate Conference
February 19, 2016

This presentation may contain forward‐looking statements within the meaning of the federal securities laws, which are based oncurrent expectations, forecasts and assumptions that involve risks and uncertainties that could cause actual outcomes and results todiffer materially. Forward‐looking statements relate to expectations, beliefs, projections, future plans and strategies, anticipatedevents or trends and similar expressions concerning matters that are not historical facts. In some cases, you can identify forward‐looking statements by the use of forward‐looking terminology such as “may,” “will,” “should,” “expects,” “intends,” “plans,”“anticipates,” “believes,” “estimates,” “predicts,” or “potential” or the negative of these words and phrases or similar words orphrases which are predictions of or indicate future events or trends and which do not relate solely to historical matters. Whileforward‐looking statements reflect American Assets Trust, Inc.’s (the “Company”) good faith beliefs, assumptions and expectations,they are not guarantees of future performance. For a further discussion of these and other factors that could cause the Company’sfuture results to differ materially from any forward‐looking statements, see the section entitled “Risk Factors” in the Company’sannual report on Form 10‐K and other risks described in documents subsequently filed by the Company from time to time with theSecurities and Exchange Commission. The Company disclaims any obligation to publicly update or revise any forward‐lookingstatement to reflect changes in underlying assumptions or factors, of new information, data or methods, future events or otherchanges.
Information on analysts, their coverage and their reports are furnished by the Company for your convenience. The reports have notbeen prepared by the Company, and the Company does not adopt or endorse the contents hereof, which constitute the work productsolely of the report's authors. The Company disclaims any representation, either express or implied, that any information in analystreports is accurate or that any statements therein coincide with the Company’s views. Further, the Company disclaims any obligationto refer to / furnish any other analyst coverage, reports or updates, whether or not by the same authors and whether or not thecontents thereof are consistent with the information and views expressed in such reports.
2
Forward-Looking Statements

3
Core ValuesConsistently increasing shareholder value and dividend growth.We believe we will accomplish this through our high quality Retail, Office, Multifamily, and Mixed‐Use portfolio that will generate strong, consistent and predictable FFO per share and
dividend growth on a relative basis, through:
Elite Level Same Store NOI Growth
Accretive Acquisitions
Accretive Development / Redevelopment Pipeline
Prudent Balance Sheet Management

an Francisco
Monterey
San Diego
Note: Shaded markets represent AAT’s core markets as of 9/30/2015.(1) As of 12/31/2015. Reflects completion of multifamily units at Hassalo on Eighth in Portland.
Portland
High-Barrier-to-Entry Markets
4
American Assets Trust is focused on acquiring Accretive Premier Infill West Coast Assets.
MarketRetailSF
OfficeSF
MixedUseSF
TotalSF
MFUnits(1)
HotelUnits
San Diego 1,196 706 ‐ 1,901 922 ‐
San Francisco Bay Area 710 516 ‐ 1,227 ‐ ‐
Portland ‐ 943 ‐ 943 657 ‐
Oahu 549 ‐ 97 646 ‐ 369
San Antonio 590 ‐ ‐ 590 ‐ ‐
Seattle ‐ 495 ‐ 495 ‐ ‐
Total 3,045 2,660 97 5,802 1,579 369
Portfolio Square Footage (SF in Thousands)

Retail41%
Office37%
Multifamily6%
Mixed‐Use16%
Source: As reported in AAT’s 3Q‐2015 SEC Supplemental filing.(1) 3Q‐2015 Cash NOI as of 9/30/2015.
Portfolio Breakdown
5
Target NOI Allocation is approximately 35% for Office. Balance of NOI allocated to Retail, Multifamily and Mixed‐Use.
Geographic Diversification (1) Asset Class Mix (1)

The Landmark, San Francisco, CAThe Landmark @ One Market - San Francisco, CA
6
The Landmark @ One Market
Total SF: 419,371Percentage Leased as of 9/30/2015: 100%

City Center, Bellevue, WATorrey Reserve Campus – San Diego, CA
7
Total SF: 493,435Percentage Leased as of 9/30/2015: 91.2%

City Center, Bellevue, WATorrey Reserve Campus – San Diego, CA
8

City Center, Bellevue, WATorrey Reserve Campus – San Diego, CA
9
Building 1418,788 SF
Our portfolio has numerous opportunities to create future shareholder value. These opportunities could be subject to government approvals, lender consents, tenant consents, market conditions, availability of debt and/or financing. Ultimately some of these opportunities may not come to fruition.

Torrey Point Development – San Diego, CA
10Our portfolio has numerous opportunities to create future shareholder value. These opportunities could be subject to government approvals, lender consents, tenant consents, market conditions, availability of debt and/or financing. Ultimately some of these opportunities may not come to fruition.

Torrey Point Development – San Diego, CA
11Our portfolio has numerous opportunities to create future shareholder value. These opportunities could be subject to government approvals, lender consents, tenant consents, market conditions, availability of debt and/or financing. Ultimately some of these opportunities may not come to fruition.
Total SF: Approximately 88,000Completion: 2017 (Estimated)

City Center, Bellevue, WA
12
Carmel Mountain Plaza - San Diego, CA
Total SF: 528,416Percentage Leased as of 9/30/2015: 99.3%

City Center, Bellevue, WA
13
Carmel Mountain Plaza - San Diego, CA
Before
After
City Center, Bellevue, WA
14
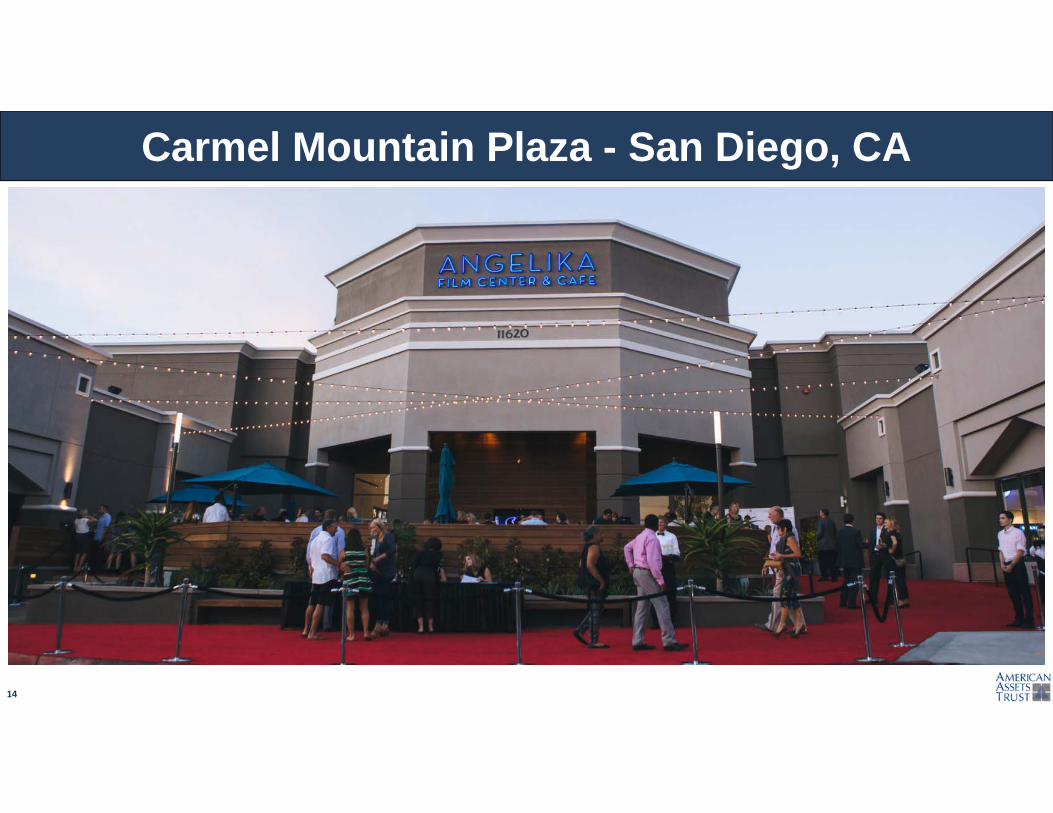
Carmel Mountain Plaza - San Diego, CA

City Center, Bellevue, WAAlamo Quarry Market - San Antonio, TXTotal SF: 589,501Percentage Leased as of 9/30/2015: 98.5%
15

Lloyd District Redevelopment – Portland, OR
16Our portfolio has numerous opportunities to create future shareholder value. These opportunities could be subject to government approvals, lender consents, tenant consents, market conditions, availability of debt and/or financing. Ultimately some of these opportunities may not come to fruition.

Lloyd District Redevelopment – Hassalo On Eighth
17Our portfolio has numerous opportunities to create future shareholder value. These opportunities could be subject to government approvals, lender consents, tenant consents, market conditions, availability of debt and/or financing. Ultimately some of these opportunities may not come to fruition.
Aster21 Floors337 Units Velomor
6 Floors177 Units
Elwood5 Floors143 Units
Oregon Square
Lloyd 700
Lloyd Center Tower

Lloyd District Redevelopment – Hassalo On Eighth
18Our portfolio has numerous opportunities to create future shareholder value. These opportunities could be subject to government approvals, lender consents, tenant consents, market conditions, availability of debt and/or financing. Ultimately some of these opportunities may not come to fruition.

Lloyd District Redevelopment – Hassalo On Eighth
19Our portfolio has numerous opportunities to create future shareholder value. These opportunities could be subject to government approvals, lender consents, tenant consents, market conditions, availability of debt and/or financing. Ultimately some of these opportunities may not come to fruition.

20
City Center - Bellevue, WA
Total SF: 494,781Percentage Leased as of 9/30/2015: 98.1%

21
Waikiki Beach Walk Embassy Suites - Honolulu, HI
Units: 369Average Occupancy as of 9/30/2015: 91.8%
Waikiki Beach Walk Embassy Suites
Waikiki Beach Walk Retail

Waikiki Beach Walk Retail - Honolulu, HI
22
Total Retail SF: 96,707Percentage Leased as of 9/30/2015: 100.0% #1 Roy’s in chain #2 Ruth’s Chris in chain #2 Yard House in chain 2014 tenant sales at $1,089/SF, an increase of 9.8% over 2013

Retail Occupancy as of 9/30/2015 Annualized Base Rent per Leased Square Foot as of 9/30/2015(1)
98.4%
96.0% 95.6% 95.6% 95.5% 95.5% 95.1%
70%
75%
80%
85%
90%
95%
100%
AAT REG EQY KIM DDR FRT WRI
Note: All figures as of September 30, 2015 for occupancy and annualized base rent per leased square foot data. Source: Most recent SEC filings.(1) Annualized base rent is calculated by multiplying base rental payments (defined as cash base rents (before abatements)) for the month ended September 30, 2015. In the case of triple net or modified gross leases, annualized base rent does not
include tenant reimbursements for real estate taxes, insurance, common area or other operating expenses. AAT data includes Waikiki Beach Walk Retail numbers.(2) Retail comparable companies include Federal Realty, Regency Centers, Kimco Realty, Equity One, Weingarten Realty and DDR Corp.
AAT Comparable Company (2) Average: $18.15
Operating Metrics Comparison - Retail
23
AAT Comparable Company (2) Average: 95.6%
$27.25$26.01
$19.17 $18.48
$16.70
$14.31 $14.23
$2
$6
$10
$14
$18
$22
$26
$30
AAT FRT REG EQY WRI KIM DDR

Retail Occupancy as of 9/30/2015 Annualized Base Rent per Leased Square Foot as of 9/30/2015(1)
Note: All figures as of September 30, 2015 for occupancy and annualized base rent per leased square foot data. Source: Most recent SEC filings.(1) Annualized base rent is calculated by multiplying base rental payments (defined as cash base rents (before abatements)) for the month ended September 30, 2015. In the case of triple net or modified gross leases, annualized base rent does not
include tenant reimbursements for real estate taxes, insurance, common area or other operating expenses. AAT data includes Waikiki Beach Walk Retail numbers. AAT data includes Waikiki Beach Walk Retail numbers. (2) Other comparable companies include Kimco Realty, Equity One, Weingarten Realty and DDR Corp.
Historical Retail Comparison
24
AAT FRT REG Other Comps' Avg. (2)
88%
90%
92%
94%
96%
98%
100%
2006 2007 2008 2009 2010 2011 2012 2013 2014 1Q15 2Q15 3Q15$8
$12
$16
$20
$24
$28
2006 2007 2008 2009 2010 2011 2012 2013 2014 1Q15 2Q15 3Q15

$22.78
$29.50
$34.00
$40.75
$45.00
Jan‐2011 Dec‐2012 Dec‐2013 Dec‐2014 Dec‐2015
Net Asset Value (NAV) Per Share
Net Asset Value (NAV) Per Share Growth Since IPO
25 Source: Green Street Advisors
Since its IPO in 1Q‐2011, American Assets Trust has significantly increased its Net Asset Value through disciplined accretive acquisitions, increased occupancy, and
strong Same Store NOI Growth.
NAV CAGR: 14%

A History of SuccessA Future of Opportunity