UNIVERSITY OF QUEBEC AT CHICOUTIMI …constellation.uqac.ca/4068/1/Zhao_uqac_0862N_10258.pdf ·...
130
UNIVERSITY OF QUEBEC AT CHICOUTIMI DISSERTATION PRESENTED TO THE UNIVERSITY OF QUEBEC AT CHICOUTIMI IN PARTIAL FULFILLMENT OF THE REQUIREMENT FOR THE DEGREE OF MASTER IN ENGINEERING BY QINFU ZHAO STUDY ON THE RHEOFORMABILITY OF SEMISOLID 7075 WROUGHT ALUMINUM ALLOY USING SEED PROCESS APRIL 2016
Transcript of UNIVERSITY OF QUEBEC AT CHICOUTIMI …constellation.uqac.ca/4068/1/Zhao_uqac_0862N_10258.pdf ·...
UNIVERSITY OF QUEBEC AT CHICOUTIMI
DISSERTATION PRESENTED TO THE
UNIVERSITY OF QUEBEC AT CHICOUTIMI
IN PARTIAL FULFILLMENT OF THE REQUIREMENT FOR THE
DEGREE OF MASTER IN ENGINEERING
BY
QINFU ZHAO
STUDY ON THE RHEOFORMABILITY OF SEMISOLID 7075
WROUGHT ALUMINUM ALLOY USING SEED PROCESS
APRIL 2016
UNIVERSITE DU QUEBEC A CHICOUTIMI
THÈSE PRÉSENTÉ À
L'UNIVERSITÉ DU QUÉBEC À CHICOUTIMI
COMME EXIGENCE PARTIELLE
DU MAÎTRISER EN INGÉNIERIE
PAR
QINFU ZHAO
ÉTUDE PAR PROCÉDÉ SEED DE LA RHÉOFORMABILITÉ DE
L’ALLIAGE D’ALUMINIUM SEMI-SOLIDE 7075 POUR CORROYAGE
AVRIL 2016

I
ABSTRACT
Semisolid metal forming is becoming more and more attractive in the foundry industry
due to its low cost and easy operation to produce high quality near-net-shape components. Over
the past years, semisolid forming technique is mainly applied on the casting aluminum alloys due
to their superior castability because of low melting temperature and viscosity. In semisolid
forming field, thixoforming has been majorly used which involves of reheating the billet into
semisolid state followed by casting process. Rheocasting is a more economic semisolid
processing compared to thixoforming, which the semisolid billet is produced directly from liquid
phase. The SEED process is one of reliable rheocasting techniques to produce high quality
semisolid billets. To produce high quality semisolid billets, their unique rheological properties
have been the most important issue need to be fully investigated.
The aim of present project is to produce high quality semisolid AA7075 billets by SEED
process and analyze their rheological properties under various process conditions. The effect of
the SEED processing parameters and grain refiners on the semisolid microstructure and
rheoformability were investigated. The deformation and rheological behavior of the semisolid
billets of AA7075 base and its grain-refined alloys were studied using parallel-plate viscometer.
In the first part, the evolution of liquid fraction to temperature of semisolid AA7075 alloy
was investigated using Differential Scanning Calorimetry (DSC). It was found that the liquidus
and solidus temperature of AA7075 alloy were 631℃ and 490℃ respectively. And the
corresponding temperatures of solid fraction of 40% and 60% were 622℃ and 610℃, which was
recognized as the temperature window for semisolid forming of this alloy.

II
In the second part, the semisolid slurries were rheocasted using SEED technology and the
effect of the SEED process parameters like swirling frequency and demolding temperature on
evolution of microstructure was studied. It was found that the swirling frequency has a strong
influence on the mean grain size and morphology of primary α-Al particles. With increasing
swirling frequency, the mean size of α-Al particles first decreased significantly and then kept
constant or increased slightly, due to the fragment and aggregation of solid particles.
Microstructures also revealed that the α-Al particles tend to transform from dendrite-like to
rosette-like to globular-like morphology due to the stirring movement.
In the third part, the effects of TiB2 and Zr on the microstructure of semisolid AA7075
alloy were investigated. The microstructure observation and the intermetallic phase identification
were carried out by optical microscopy equipped with Clemex analyzer and scanning electron
microscopy (SEM). The mean size of primary α-Al particles decreases from more than 110 μm
to less than 90 μm and the morphology changes from dendritic-like to globular-like with the
addition of TiB2. With the addition of Zr or Zr + TiB2, the mean size and morphology of primary
α-Al particles didn't show significant modification. Furthermore, the addition of TiB2 shows
significant refinement on three intermetallic phases (Mg(Zn,Cu,Al)2, Fe-rich Al(Fe,Mn)Si and
Mg2Si. All the intermetallic phases become finer in size and more uniform distribution among
the grains.
Finally, the rheological behavior and microstructure of deformed semisolid billets of
AA7075 base and grain-refined alloys were investigated using parallel-plate viscometer. Images
analysis shows that liquid segregates from center to edge of the billet during compression and
with increasing temperature the liquid segregation becomes more significant. The apparent
viscosity of two alloys decreases with the increasing shear rate, indicating shear thinning

III
behavior. Shear rate jump phenomenon (first increase and then decrease) occurred at lower solid
fraction, reaching a maximum shear rate value. The whole compression processing is divided
into two parts: shear rate increasing part and shear rate decreasing part. For higher solid fraction,
the shear rate decreases continuously and slowly. The attainable maximum shear rate value
increases with the decreasing solid fraction. During the shear rate decreasing part, at any given
shear rate the viscosity increases with the increasing solid fraction. The comparison of the
viscosity of two alloys indicated that the TiB2-refined AA7075 alloy has lower viscosity (shear
rate decreasing part) due to small grain size and globular grain shape. In addition, the grain
refinement significantly expands the solid fraction range of good rheoformability from 42%-48%
for the base alloy to 42%-55% for the refined alloy.

IV
RESUMÉ
La formation des matériaux métalliques à l’état semi-solide attire de plus en plus
l’industrie dû à ses coûts peu élevés et à la facilité avec laquelle il permet de produire des
composants aux formes très nettes de qualité supérieure. Depuis les dernières décennies, la
technique de mise en forme du métal semi-solide s’applique principalement à la fonderie
d’alliages d’aluminium, grâce à sa bonne coulabilité causée par ses basses températures de fusion
et de viscosité. Le thixoformage, qui implique de chauffer des lopins jusqu’à l’état semi-solide
avant de procéder à la fonte, était majoritairement utilisé. Cette technique est cependant plus
couteuse que le rhéomoulage, procédé par lequel le lopin est produit en premier lieu en phase
liquide. Le procédé SEED est l’un des plus fiable pour produire des lopins de la meilleure qualité
qui soit. Afin de produire des lopins semi-solides d’une telle qualité, leurs propriétés
rhéologiques uniques ont été sujet aux plus profondes investigations.
Le présent projet a pour objectif de produire des lopins semi-solides AA7075 de haute
qualité par le procédé SEED et d’analyser leurs propriétés rhéoligiques sous plusieurs conditions.
Pour ce faire, les effets des paramètres de traitement et des affineurs de grain sur la
microstructure et la rhéoformabilité ont été investigués. La déformation et le comportement
rhéologique des lopins de base AA7075 et des alliages raffinés ont été étudiés en utilisant un
viscosimètre à plaques parallèles.
Dans la première partie, l’évolution de la fraction de liquide selon la température de
l’alliage AA7075 semi-solide a été examinée à l’aide d’un Calorimètre Différentielle à Balayage
(DSC). Il a été démontré que le liquidus et le solidus de l’alliage AA7075 étaient respectivement

V
de 631°C et de 500°C. Les températures correspondantes de la fraction de solide de 40% et de
60% étaient de 622°C et 610°C, ce qui correspond à la fenêtre de température pour former un
alliage semi-solide.
Dans un second lieu, les lopins semi-solides ont été rhéomoulés en utilisant la
technologie SEED et l’effet des paramètres du procédé SEED, comme la fréquence de
tourbillonnement et la température de démoulage sur l’évolution de la microstrucrure, ont été é
tudiées. Il a été montré que la fréquence de tourbillonnement a une forte influence sur la taille
moyenne des grains et la morphologie des particules primaires α-Al. En augmentant de façon
continue la fréquence de tourbillonement, la taille moyenne des grains des particules α-Al a
d’abord diminué de façon significative, pour ensuite rester constante ou augmenter légèrement
en raison de la fragmentation et de l’aggrégation des particules solides. Les microstructures ont
également révélé que les particules ont tendance à passer de la forme en dentrite vers une forne
en rosette, puis vers une forme plus sphérique à cause de la vibration.
Dans la troisième partie, les effets de TiB2 et du Zr sur la microstructure de l’alliage
AA7075 semi-solide ont été étudiés. L’examen de la microstructure et l’identification des phases
intermétalliques ont été réalisées par microscope optique, au moyen du microscope électronique
à balayage Clemex (SEM) . La taille moyenne des particules primaires de α-Al diminue de plus
de 110 um à moins de 90 um et, avec l’addition de TiB2, leur morphologie passe de dendritique à
globulaire. Avec l’ajout de Zr ou Zr + TiB2, la taille moyenne et la morphologie des particules α-
Al primaire n'a pas montré de modification significative. De plus, l'ajout de TiB2 engendre un
raffinement significatif sur trois phases intermétalliques (Mg(Zn,Cu,Al)2, Al(Fe,Mn)Si riche en

VI
fer et Mg2Si. Toutes les phases intermétalliques obtiennent une taille plus fine et une distribution
plus uniforme parmi les grains.
Enfin, le comportement rhéologique et la microstructure des lopins déformés semi-
solides de la base AA7075 et les alliages à grains raffinés ont été étudiés à l'aide de plaques
parallèles viscosimètres. L’analyse des images montre que les liquides migrent du centre vers le
bord du lopin lors de la compression et, avec l'augmentation de la température, ce mouvement
devient plus important. La viscosité de deux alliages diminue avec l’augmentation de la vitesse
de cisaillement, ce qui indique un comportement de fluidification par cisaillement. Le taux de
cisaillement subit une grande variation (augmente d’abord puis diminue ensuite) lorsque la
fraction solide est plus basse, atteignant ainsi son maximum. La compression se compose donc
de deux étapes : la partie où le taux de cisaillement croît, et celle où il décroît. Lorsque la
fraction solide est plus haute, le taux de cisaillement diminue de façon continuelle et lente. Le
plafond du taux de cisaillement augmente à mesure que diminue la fraction solide. Lorsque la
vitesse de cisaillement décroît, la viscosité augmente avec la fraction solide. La comparaison de
la viscosité des deux alliages a indiqué que l’alliage raffiné AA7075 TiB2 a une viscosité plus
faible (partie décroissante du taux de cisaillement) en raison de la petite taille des grains et de sa
forme globulaire. De plus, le raffinement du grain étend de façon significative la plage de
fraction solide permettant une bonne rhéoformabilité, soit de 42%-48% pour l’alliage de base à
42%-55% pour l’alliage raffiné.

VII
谨以此文献给我最挚爱的父母及姐姐

VIII
ACKNOWLEDGEMENT
Firstly, I would like to acknowledge the financial support from Natural Sciences and
Engineering Research Council of Canada (NSERC), Rio Tinto Aluminum and Université du
Québec a Chicoutimi (UQAC).
Secondly, it is a great pleasure to express my deepest gratitude to my supervisor, Prof.
X.-Grant Chen for his helpful guidance and unconditional support from the initial to the final
stage of this project.
I would like to express my great appreciation to Dr. Amir Bolouri for his prompt
inspirations, timely suggestions and meticulous care with kindness and enthusiasm to accomplish
this project. His rich background knowledge, diligent research attitude, skilled experimental
operation inspired me deeply.
I would also like to deliver my thanks to Prof. Zhan Zhang for his help and suggestions
on this project. Meantime, I am extremely grateful to Mr. Pier-Luc Privé and other technicians of
CURAL for their assistance and special advice on the lab experiments. Besides, it is my pleasure
to send my thanks to all my colleagues for their valuable suggestions and assistance in the lab
work and daily life.
Most importantly, I would like to take this opportunity to express my special thanks to
my family members, especially my parents and sisters in China. Their irreplaceable love and
encouragement has always been the greatest source of power in all my life. Without the support

IX
from these most important persons of my whole life, everything would be impossible. I love you
all, my family.
Lastly, please allow me once again to extend my sincere gratitude to all the people who
have offered tremendous help and enthusiastic support to me.
X
TABLE OF CONTENTS
ABSTRACT .................................................................................................................................... I
RESUMÉ ..................................................................................................................................... IV
ACKNOWLEDGEMENT ....................................................................................................... VIII
TABLE OF CONTENTS ............................................................................................................ X
LIST OF FIGURES ................................................................................................................. XIII
LIST OF TABLES ................................................................................................................... XVI
CHAPTER 1 .................................................................................................................................. 1
INTRODUCTION......................................................................................................................... 1
1.1 Background ..................................................................................................................... 1
1.2 Objectives ......................................................................................................................... 2
CHAPTER 2 .................................................................................................................................. 4
LITERATURE REVIEW ............................................................................................................ 4
2.1 Semisolid Metal Processing ............................................................................................ 4
2.1.1 Characteristic of semisolid processing ............................................................... 4
2.1.2 Mechanism of microstructure evolution in semisolid processing .................... 6
2.1.3 Technologies for semisolid metal processing ..................................................... 7
2.2 SEED Processing of Aluminum Alloys ....................................................................... 10
2.2.1 Process description............................................................................................. 10
2.2.1.1 Initial designed SEED process .................................................................. 10
2.2.1.2 Development of SEED process ................................................................. 12
2.2.2 Process parameters ............................................................................................ 13
2.2.2.1 The influence of pouring temperature on microstructure ......................... 13
2.2.2.2 The temperature of the semisolid metal .................................................... 15
2.2.2.3 The swirling intensity ............................................................................... 17
2.2.3 Application on casting and wrought aluminum alloys ................................... 18

XI
2.3 Characteristics of Semisolid Microstructures ............................................................ 20
2.3.1 Solid fraction ...................................................................................................... 20
2.3.2 Grain size ............................................................................................................ 21
2.3.3 The shape factor ................................................................................................. 22
2.4 Rheology of Semisolid Alloys ....................................................................................... 23
2.4.1 Introduction ........................................................................................................ 23
2.4.2 Measurement of the steady-state rheological behavior .................................. 25
2.4.3 Measurement of the transient rheological behavior ....................................... 27
CHAPTER 3 ................................................................................................................................ 33
EXPERIMENTAL PROCEDURES ......................................................................................... 33
3.1 Alloys Preparation and Composition .......................................................................... 33
3.2 Semisolid Billets Fabrication by SEED Processing.................................................... 34
3.3 Characterization of Microstructures .......................................................................... 36
3.3.1 OM observation and image analysis ................................................................ 36
3.3.2 SEM observation and elemental analysis ........................................................ 38
3.4 Rheology Test ................................................................................................................ 39
3.4.1 Parallel-plate compression viscometer ............................................................. 39
3.4.2 Calculation of viscosity and shear rate ............................................................ 41
CHAPTER 4 ................................................................................................................................ 45
RESULTS AND DISCUSSION ................................................................................................. 45
4.1 DSC Analysis and Liquid Fraction ............................................................................. 45
4.2 Effect of SEED Processing Parameters on the Microstructure of Semisolid 7075
Alloys .................................................................................................................................... 48
4.2.1 SEED processed unrefined AA7075 base alloy ............................................... 49
4.2.2 SEED processed TiB2 refined AA7075 alloy .................................................... 52
4.3 Effect of Grain Refiners on SEED Processed Microstructures of AA7075 Alloys . 55
4.3.1 Effect of grain refiner on primary α-Al grains ............................................... 56

XII
4.3.2 Effect of grain refiner on intermetallic phases ................................................ 64
4.4 Rheoformability and Microstructure of Semisolid AA7075 Alloys ......................... 72
4.4.1 Rheoformability and microstructure of semisolid AA7075 base alloy ......... 72
4.4.1.1 Microstructure of deformed semisolid AA7075 base alloy ...................... 72
4.4.1.2 Height reduction curves ............................................................................ 75
4.4.1.3 Shear rate to time curves ........................................................................... 78
4.4.1.4 Rheology comparison ............................................................................... 80
4.4.2 Rheoformability and microstructure of TiB2 modified semisolid AA7075
alloy .............................................................................................................................. 86
4.4.2.1 Microstructure of deformed semisolid AA7075 alloy modified by TiB2 . 86
4.4.2.2 Height reduction curves ............................................................................ 90
4.4.2.3 Shear rate to time curves ........................................................................... 92
4.4.2.4 Rheology comparison ............................................................................... 93
4.4.3 Discussion............................................................................................................ 98
4.4.3.1 Quantitative characterization and comparison of deformed microstructures
of two alloys .......................................................................................................... 98
4.4.3.2 Comparison of apparent viscosity of two alloys ..................................... 101
4.4.3.3 Comparison with literatures .................................................................... 105
CHAPTER 5 .............................................................................................................................. 108
CONCLUSIONS AND RECOMMENDATIONS .................................................................. 108
5.1 Conclusions .................................................................................................................. 108
5.2 Recommendations for Future Work ......................................................................... 111

XIII
LIST OF FIGURES
Figure Title Page
2.1 Semi-solid self-supported (a) and easy to cut (b) 5
2.2 Difference between semisolid casting and conventional die casting 6
2.3 Schematic of two kinds of semi-solid technologies (In rheocasting, A refers to
continuous cooling and stirring and B illustrates isothermal stirring)
8
2.4 Schematic of the SEED process and HPDC press 10
2.5 Schematic of the developed SEED process 12
2.6 Various morphologies of primary α-Al particles at different pouring
temperatures for semisolid Al-Si 356 alloy in SEED process
14
2.7 Temperatures measured at the center and the wall during SEED processing with
(a) and without insulation (b)
16
2.8 Microstructure of semisolid AA7075 wrought alloy at different swirling
frequency: (a) dendrite, low rpm; (b) rosette, medium rpm; (c) globular, high
rpm.
18
2.9 Schematic of complex structure and cross section, (a) 3D structure (b) 2D 23
2.10 Viscosity versus shear rate curves for a variety of types of rheological 25
2.11 Schematic of Searle-type rotational viscometer 26
2.12 Typical signal response to rapid compression of a semisolid alloy slug 28
3.1 The schematic procedure of SEED processing 35
3.2 The SEED machine designed by Alcan applied in this project. 35
3.3 Area of samples sectioned for observations for
(a) as-cast and (b) deformed billets
36
3.4 Schematic of string length and string width. 37
3.5 Nikon Eclipse SE600 optical microscopy coupled with Clemex image analyzer
used in present project.
38
3.6 (a) Schematic and (b) actual view of parallel plate compression viscometer 39
3.7 (a) The height reduction-time and (b) instantaneous compression velocity-time
calculated from the displacement date
42
4.1 (a) DSC and (b) liquid fraction versus temperature of AA7075 alloy obtained
from heat flow vs temperature data recorded during cooling from the molten
state.
46
4.2 Optical micrographs of SEED processed semisolid billets AA7075 base alloy
under different processing conditions
49
4.3 Effect of SEED processing parameters on (a) Mean grain size and (b) Grain
aspect ratio of AA7075 base alloy
51
4.4 Optical micrographs of SEED processed semisolid billets of AA7075 alloy 53

XIV
modified with 0.03% TiB2 under different processing conditions
4.5 Effect of SEED processing parameters on (a) Mean grain size and (b) Grain
aspect ratio of 0.03% TiB2 modified AA7075 alloy
54
4.6 Optical micrographs of SEED processed AA7075 semisolid billets with various
grain refiners at 616℃ and 180 rpm
56
4.7 Mean size of primary α-Al particles in AA7075 alloys (Processing temperature:
616℃)
57
4.8 Aspect ratio of primary α-Al particles in AA7075 alloys (Processing
temperature: 616℃)
57
4.9 Optical micrographs of SEED processed semisolid billets of AA7075 alloy
modified with 0.06%TiB2 under different processing conditions
58
4.10 Effect of SEED processing parameters on (a) Mean grain size and (b) Grain
aspect ratio of 0.06wt%TiB2 modified AA7075 alloy
59
4.11 Optical micrographs of SEED processed semisolid billets of AA7075 alloy
modified with 0.06wt% Zr under different processing conditions
60
4.12 Effect of SEED processing parameters on (a) Mean grain size and (b) Grain
aspect ratio of 0.06wt%Zr refined AA7075 alloy
61
4.13 Optical micrographs of SEED processed semisolid billets of AA7075 alloy
modified with 0.06wt% Zr + 0.06wt% TiB2 under different processing
conditions
62
4.14 Effect of SEED processing parameters on (a) Mean grain size and (b) Grain
aspect ratio of 0.06wt%TiB2 + 0.06wt%Zr refined AA7075 alloy
63
4.15 (a) Optical micrograph and SEM micrographs:
(b) Mg(Zn,Cu,Al)2, (c) Mg2Si, (d) Al(Fe,Mn)Si of AA7075 alloy
65
4.16 Optical micrographs showing effect of Ti on the intermetallic phases of
(a), (b) AA7075 base alloy; (c), (d) 0.03wt%Ti; (e), (f) 0.06wt%Ti
67
4.17 (a) The string length and (b) width of three types of intermetallic
in AA7075 base alloy and alloys modified with TiB2
69
4.18 (a) The area percentage and (b) particle density of three types of intermetallic of
AA7075 base alloy and alloys modified with TiB2.
70
4.19 Microstructure of deformed semisolid billets of AA7075 base alloy from the
edge to the center, compressed at different temperatures (solid fractions): (a)
622℃ 0.42 fs, (b) 620℃ 0.45 fs, (c) 618℃ 0.48 fs, (d) 616℃ 0.50 fs, (e) 614℃
0.53 fs, (f) 612℃ 0.55 fs.
74
4.20 Measured liquid fractions of deformed samples from edge to center at various
compression temperatures.
75
4.21 Height reduction-time curves at different temperatures (℃) of AA7075 base
alloy
76
4.22 Physical images of compressed billets by parallel plate viscometer at different 77

XV
temperatures of AA7075 base alloy
4.23 Shear rate-time curves at different temperatures (℃) of AA7075 base alloy 78
4.24 Typical rheology curves used to analysis: (a) Instantaneous viscosity and shear
rate as a function of time; (b) Viscosity as a function of shear rate.
82
4.25 Typical rheology curves used to analysis: (a) Instantaneous viscosity and shear
rate as a function of time; (b) Viscosity as a function of shear rate. Condition:
AA7075 base alloy at 618℃ (0.48 fs)
83
4.26 Calculated viscosities as function of shear rate of AA7075 base alloy at various
fractions solid.
84
4.27 Microstructure of deformed semisolid billets of TiB2 modified AA7075 alloy
from the edge to the center, compressed at different temperatures (solid
fractions): (a) 622℃ 0.42 fs, (b) 620℃ 0.45 fs, (c) 618℃ 0.48 fs, (d) 616℃
0.50 fs, (e) 614℃ 0.53 fs, (f) 612℃
87
4.28 Measured liquid fractions of deformed samples from edge to center at various
compression temperatures.
89
4.29 Height reduction-time curves at different temperatures (℃) of TiB2 modified
semisolid AA7075 alloy
90
4.30 Actual view of compressed billets by parallel plate viscometer at different
temperatures of TiB2 modified AA7075 alloy
91
4.31 Shear rate-time curves at different temperatures (℃) of TiB2 modified AA7075
alloy
92
4.32 Calculated viscosities as function of shear rate of TiB2 modified AA7075 alloy
at various fractions solid from 0.57 to 0.42.
94
4.33 Typical rheology curves of viscosity as a function of shear rate of refined alloy
at the fraction solid of 0.45.
95
4.34 Parameters k and m in power law equation to various solid fractions 97
4.35 Spherical diameter of the deformed billets of two alloys under various
temperatures
99
4.36 Aspect ratio of the deformed microstructures of two alloys under various
temperatures
100
4.37 Plotted viscosity to shear rate curves of base AA7075 and TiB2 refined AA7075
alloys with various solid fractions of (a) 0.42, (b) 0.45, (c) 0.48 and (d) 0.50,
corresponding to compression temperatures of 622, 620, 618℃ and 616℃
respectively.
103
4.38 Comparison of the relationship between viscosity and shear rate for AA7075
alloy at solid fraction of 0.45 from this work and Zoqui et al.
105

XVI
LIST OF TABLES
3.1 Chemical composition of AA7075 used in the experiment (wt. %) 34
4.1 Designed additions of grain refiners for AA7075 alloy (wt. %) 55
4.2 SEM-EDX analysis results of AA7075 semisolid sample processed by SEED
(at. %)
65
4.3 Parameters obtained from fitted power law equations of relationship between
viscosity and shear rate under various temperature conditions
96
4.4 Rheology test experiments discussed in present work 102

1
CHAPTER 1
INTRODUCTION
1.1 Background
Semisolid forming of metals is an attractive technology that offers a great chance to
manufacture net-shaped metal components in only one forming operation. In addition, elevated
mechanical properties can be achieved because of the unique globular microstructure and flow
behaviour within the die. In order to successfully perform semisolid forming process, it is
required to establish a critical control on all process parameters, particularly feedstock
preparation and forming process. The interrelation between parameters of each process step and
the material microstructure and flow behaviour is highly nonlinear. This causes a major
challenge for scientific understanding and economic mass production.
Semisolid metal (SSM) processing is based on the thixotropic behavior of alloys with a
non-dendritic microstructure in the semisolid state. If the microstructure consists of spheroids of
solid (globular grains) in a liquid matrix, its viscosity is time and shear rate dependent; if it is
sheared it flows and if it is allowed to stand it thickens again. This behavior leads to laminar
rather than turbulent die fill and avoid defects such as porosity and improves mechanical
properties. The improved mechanical integrity allows components to have smaller cross-sections
and the replacement of steel with aluminum for safety critical components such as suspension
components for cars.

2
In comparison with cast aluminum alloys, wrought aluminum alloys have superior
mechanical properties, thereby offering a wider application. There has been a strong demand to
produce to near-net-shape components with aluminum 7xxx series alloys, which are mainly
machined from the wrought state involving considerable waste. Semisolid forming can be a
potential alternative near-net-shaping technology. The approach in this project is to first produce
a starting material of 7075 alloy which is treated such that the microstructure consists of globular
grains in a matrix of liquid phase. The Swirled Equilibrium Enthalpy Device (SEED) is a novel
SSM process that will be undertaken for preparing the feedstock material. The SEED processing
is a cost-effective feedstock preparation method due to its capability of using all the possible
material sources (primary, secondary and particular process scrap).
A major problem for semisolid forming has been the lack of fundamental understanding
of the rheological behavior and the flow of alloys in the semisolid state that impairs our ability to
simulate, optimize the processing and improve the repeatability. In order to achieve a deep
understanding of rheological behavior of wrought aluminum alloys, a fundamental study would
be performed to develop a share rate-viscosity relationship in the semisolid state of the wrought
aluminum 7xxx alloys by parallel plate rapid compression viscometer.
1.2 Objectives
The general objective of the present project is to study the microstructure evolution and
rheoformability of 7075 wrought aluminum alloy produced by SEED processing. In reality, in
semisolid forming, the semisolid billets will undergo a sudden increase in shear rate as it enters
the die. This process takes place in less than one second. This transient process is the key point
that researchers concern. The present project aims to characterize the microstructure evolution in

3
semisolid state and find out how shear rate and viscosity change with time and their
mathematical relation during the rheology test process. More specifically, the objectives of the
present research can be categorized into three parts.
Part I – SEED processing
1) The effect of the SEED processing parameters on the microstructures of the 7075
wrought aluminum alloy will be investigated.
2) The optimum processing temperature and stirring frequency (processing conditions)
will be obtained and high quality 7075 wrought aluminum alloy semisolid billets will
be prepared through SEED processing.
Part II – Grain refinement
1) The influence of TiB2 addition on the microstructures of semisolid AA7075 alloy
produced by SEED process will be studied.
2) The influence of Zr addition and the combined addition of Zr and Ti on the
microstructure of the studied base alloy will be compared.
Part III – Rheology analysis
1) The rheological behavior of SEED processed 7075 wrought aluminum alloy will be
thoroughly investigated by rapid parallel-plate compression test.
2) A share rate-viscosity relationship (an equation) will be developed mathematically to
describe the rheological behaviour of the AA7075 semisolid alloys for modeling of
die filling in the semisolid forming.

4
CHAPTER 2
LITERATURE REVIEW
2.1 Semisolid Metal Processing
Semisolid metal (SSM) processing is one of the most important and promising processing
in current industry. SSM processing is first proposed by Flemings and his co-workers at MIT in
the early 1970s[1].
2.1.1 Characteristic of semisolid processing
This processing is mainly based on the unique intermediate state between solid and liquid
state, which is termed semisolid state. This state contains both solid phase and liquid phase, in
which non-dendritic (or spheroidal) solid particles are dispersed in the liquid matrix. The unique
microstructures gives semisolid billets distinctive rheological properties : in the steady state, the
semisolid billet exhibits pseudoplastic behaviour, while in the transient state it shows thixotropic
behaviour[2, 3]. The semisolid billets produced by rheocasting process can stand as a solid on its
own weight; while under the application of shear force, it can be easily sliced and will flow like a
liquid due to the instant viscosity drop. Fig. 2.1 shows the rheological behaviors[4].

5
Semisolid casting involved in SSM processing is quite different from the conventional
die casting. For semisolid formed components, the microstructures consist of fine globular grains
in a matrix of solidified liquid phase. This is distinct from a dendritic microstructure, which is
typical for conventional casting. In semisolid forming process, by controlling the injection
process gas entrapment can be avoid during die filling process. In other words, flow of semisolid
slurries is laminar flow rather than turbulent flow. While in conventional die casting gas
entrapment can occur due to turbulent flow of liquid alloys. Fig. 2.2 shows the difference
between semisolid casting and conventional die casting[1]. Compared to the conventional die
casting, the advantages of semisolid casting can be summarized as the following:
More energy efficient due to less heat content of the billets than that of the
superheated liquid melt in conventional die casting
Fig. 2.1 Semi-solid self-supported (a) and easy to cut (b)

6
Finer and much uniform microstructures, leading to enhanced mechanical properties
Smooth filling of the die, avoiding gas entrapment and shrinkage porosity
Less thermal shock to the die, resulting in longer die life[5]
2.1.2 Mechanism of microstructure evolution in semisolid processing
Dendritic microstructure is a typical microstructure in conventional casting processing,
while finer globular grains in liquid matrix is a dominant microstructure in SSM processing.
Therefore, since the SSM processing occurred, a number of researchers were dedicated to find
out the conversion mechanisms from dendritic to globular morphology. Mechanisms for the
transformation of dendrites to non-dendritic spherical morphology is vital important in semi-
solid processing, leading to comprehensive understanding of SSM processing.
Fig. 2.2 Difference between semisolid casting and conventional die casting

7
The dominant mechanisms include dendrite arm fragmentation, dendrite arm root
remelting and growth control mechanisms. However, the most accurate mechanism for the
transformation of dendrites to the spherical morphology is still not identified[6].
All the mechanisms mentioned above involve the disintegration of dendritic structure
during solidification to form the globular structure. With more research in the SSM processing
field, it is believed that globularization can be achieved either by mechanical fragmentation of
dendritic structure or by creating multiple nucleations to obtain spherical primary phase particles
directly. Compared to the mechanical fragmentation mechanism, generating multiple nucleations
shortens the processing time and obtains better globular morphology, making it much preferred.
2.1.3 Technologies for semisolid metal processing
It is generally believed that the SSM processing refers to the whole forming process of
commercial components production from the preparation of the semisolid billets to the final
forming processing (e.g. forging). Technologies for SSM processing, which specially refers to
the processing of the preparation of semisolid billets used for the subsequent forming process,
can be generally classified into two basic routes based on the starting material status (Fig. 2.3)[7]:
Rheo-routes

8
Thixo-routes
In rheo-routes technology, the semisolid billet is prepared from the liquid phase and
then directly transfers into a die or mold for subsequent shaping. The process of preparing the
non-dendritic semisolid billet is achieved by controlled solidification under specific conditions,
which is termed rheocasting.
In the rheo-routes, or rather rheocasting process, the target is to get non-dendritic
microstructure during the solidification process. To produce this kind of non-dendritic billets,
several techniques are available, including Mechanical stirring[8], Electromagnetic stirring[9],
[10, 11], SEED process[12], semisolid rheocasting (SSR)[13, 14], twin screw rheomolding
Fig. 2.3 Schematic of two kinds of semi-solid technologies (In rheocasting, A
refers to continuous cooling and stirring and B illustrates isothermal stirring)

9
process[15], new rheocasting process (NRC)[16], ultrasonic treatment[17], forced convection
rheoforming (FCR)[18], recrystallization and partial remelting (RAP)[19] and so on.
Thixo-route is another technique of SSM processing which classically involves three
stages. The first stage is to prepare the billet with non-dendritic or equiaxed structure or having
the potential to transform to the spherical morphology in the subsequence processing. The
second step is to reheat the billet to the temperature between the solidus and liquidus to get the
semisolid structure. The final stage is to transfer the semisolid billet to the shaping die. If the
component shaping is performed in a closed die, it is referred to as thixocasting; while if the
shaping is achieved in an open die, it is called thixoforming[2].
Among the three stages in thixo-routes process, the second step is the most important
process because the semi-solid microstructure is controlled during the reheating process. The
required semisolid microstructure is fine and spherical solid particles uniformly dispersed in a
liquid matrix of low melting point. To achieve this microstructure, several important parameters
during the reheating process should be controlled accurately. The reheating temperature controls
the solid fraction, which has a great impact on the viscosity of the billet. A uniform temperature
distribution throughout the billet is important to obtain homogeneous solid particles distribution
and good rheological characteristic. Furthermore, the reheating time should be properly
performed. Now days, with continually study on thixoforming technology, some other processes
applied in thixo-routes were developed, like innovative two-stage reheating process which has
been developed to improve the thixotropic behavior of semisolid aluminum alloys[20, 21].
The main advantage of the thixo-routes process is that the forming is free from handling
the superheated liquid metal and this process can be highly automated like forging. The

10
disadvantage of thixo-routes is that it is hard to obtain fully homogeneous billets and there may
be metal loss during the reheating process. Compared to the rheo-routes techniques, thixo-routes
contains three steps, which is less economical than the rheo-routes which only consists of a
simple step from liquid to the feedstock directly.
2.2 SEED Processing of Aluminum Alloys
The SEED process is a recently developed rheocasting technology for semisolid metal
processing by Doutre et al[12]. The SEED process is an economical and reliable process with
simple operation for the preparation of feedstock for semisolid metal processing, which is
suitable for a wide range of aluminum alloys.
2.2.1 Process description
2.2.1.1 Initial designed SEED process
The SEED process is schematically shown in Fig. 2.4[22]. The initial designed SEED
process can be divided into three stages[23].
Fig. 2.4 Schematic of the SEED process and HPDC press

11
First, the master aluminum alloys are melted in a crucible heated by the electricity
furnace to obtain the designed composition. The melt aluminum of the designed composition is
transferred to the preheated mold which is fixed on the SEED machine before each experiment at
a certain pouring temperature. During each pouring operation, the mold should be tilted to make
sure that there is no turbulence in the melt aluminum. Then the mold with the platform is swirled
at a chosen frequency ranging from 100~200rpm with an eccentricity of the order of 12mm[23].
During the swirling process, a thermocouple is plug into the melt aluminum at the center and the
edge of the mold to monitor the instant temperature. When the temperature reaches the target
temperature, a semisolid billets with a certain fraction solid is produced. The first stage ends. The
swirling motion during this stage, similar to the stirring motion in the Mechanical or the
Electromagnetic stirring technique, helps to ensure that the primary solid phases are distributed
uniformly throughout the whole semisolid billet.
In the second stage, the swirling motion is stopped. The valve at the bottom of the mold
is opened after a few seconds pause, and the excess eutectic liquid will be drained out from the
mold. The drainage is allowed to continue until the solid particles aggregate at the bottom of the
mold stopping the liquid running out. This process usually takes 30~45 seconds from the original
experience.
The third stage involves in the demolding process. After the drainage of the excess
eutectic liquid, the semisolid billet is ready to demold either to the subsequence forming process
directly or to quench as thixocasting billet. In this stage the semisolid billet behaves thixotropic
or pseudoplastic property similar to a room temperature butter, which can be self-supporting and
can be easily cut.

12
2.2.1.2 Development of SEED process
With further investigation and research in the SEED process, Pascal Cote al et al[24]
optimized the process parameters and the comprehensive techniques involved in the SEED
process, proposing the non-drained SEED version. This simplified SEED process has been
proved adaptable with works on AA6061 wrought alloys and high strength 206 cast alloys [22,
25, 26]. The bypass of the drainage step leads to a significant simplification of the process and
eliminates the work of sweeping the drain cakes. Pascal Cote and his teammates’ work shows
that there is no distinct difference in the microstructure, mechanical properties of the semisolid
billets produced by drain or non-drain mode[24].
In the work of the semisolid processing of hypereutectic A390 alloys using SEED
process, M. Tebib et al[4] introduced further improvement for the SEED process(Fig. 2.5[4]). In
their works, they made two significant modification of the SEED process. Firstly, during the
Fig. 2.5 Schematic of the developed SEED process

13
swirling process, isothermal holding using insulation is introduced, reducing the heat lose at the
wall of the mold. Secondly, solid alloy is added during swirling process. The addition of solid
alloy during swirling allows high extraction of latent heat at the center of the billet, leading to a
decrease of the temperature gradient within the whole billet.
2.2.2 Process parameters
In the SEED process, there are several crucial process parameters that have significant
influence on the productivity of the billets and the microstructure and physical properties of the
final products. These process parameters include the pouring temperature, the processing time,
the temperature of the semisolid metal, the cooling rate of the melt and the swirling intensity.
2.2.2.1 The influence of pouring temperature on microstructure
The pouring temperature in the solidification process indicates the extent of the superheat
of the melt. It directly affects the nucleation and the growth of the primary phase, leading to
great influence on the final morphology of the primary phase. In the rheo-routes semisolid
process, the morphology of the primary phase must be strictly controlled since the semisolid
billet will be used to rheoforming directly. While in the thixo-routes, the primary phase
morphology of the semisolid billet can be improved by the subsequent reheating process.
Therefore, the controlled pouring temperature turns to be much more important in this kind of
rheo-route technique, the SEED processing.
Typically, amongst all kinds of SSM processing, lower pouring temperature is regarded
as the most economic alternative to produce semisolid billets. Because it not only promotes the
formation of globular grains but also reduces casting defects and decreases the heat consumption.

14
During the SEED process, the temperature of the center and the edge of the liquid would
be monitored through the thermocouple. It is noticeable that the temperature between the center
and the edge is different, which indicate that there are two different cooling regimes for them.
According to the work of Omid Lashkari et al[27], different pouring temperatures result in
various cooling regimes of the melt, leading to various morphologies of primary α-Al
particles(Fig. 2.6[27]).
Fig. 2.6 Various morphologies of primary α-Al particles at different pouring temperatures for
semisolid Al-Si 356 alloy in SEED process

15
At the low pouring temperature, the edge area of the melt is highly undercooled,
pronouncing a much larger number of nuclei than that at high pouring temperature. The
temperature near the mold wall is much lower and is not sufficient enough to remelt the existing
nuclei even with the heat flow from the center of the melt. Furthermore, lower pouring
temperature establishing larger temperature gap between the center and the edge at the beginning
of the solidification, encourages faster heat flow from the center towards the mold. Therefore, a
uniform temperature distribution throughout the bulk liquid is occurred in a much shorter time at
a lower pouring temperature. The rate of heat flow reduces rapidly and the growth rate of the
nucleation is also reduced. To summarize, large number of nuclei and low growth rate at the low
pouring temperature promote the globular primary α-Al morphology corporately.
2.2.2.2 The temperature of the semisolid metal
During the whole SEED process, the temperature of the melt will be monitored, both at
the center and the edge of the mold. Fig. 2.7 shows the temperature profiles during the
production of semisolid billets of 7075 wrought aluminum through SEED processing in two
modes: with and without insulation. In this test, the mold was preheated to about 200℃ and the
pouring temperature was fixed at 750℃. In the SEED processing without insulation (Fig. 2.7
(b)), the temperature gradient between center and wall during the initial stage of cooling is very
large because of the temperature difference between the mold and the melt liquid. As cooling
down the temperature of the wall increases a bit, then decreases slowly with the center part,
resulting in a temperature gradient of 6℃~10℃ in the final stage.
Fig. 2.7 (b) shows the temperature profile using the SEED processing with insulation
recorded in present project. In the initial cooling stage the temperature gradient between center

16
and wall is much smaller than that without insulation. It is noticeable that the temperature
gradient almost disappeared as the temperature went down, resulting in less than 2℃ difference
in the final stage. Consequently, the temperature of the whole semisolid billet becomes much
more uniform which is benefit for the formation of globular structure.
Temperature is an important process parameter in SEED processing as well as other
semisolid processes. Typically, it is believed that higher temperature results in lower solid
fraction, better deformability and more easily filling the die. Semisolid billets perform better
deformation behavior, which attributes to both the high liquid fraction and primary Al particles.
In the semisolid casting field, the viscosity is the most important parameter to characterize the
590
600
610
620
630
0 50 100 150 200 250 300
Tem
pe
ratu
re/℃
Time/s (a)
center
wall
590
600
610
620
630
0 50 100 150
Tem
pe
ratu
re/℃
Time/s (b)
center
wall
Fig. 2.7 Temperatures measured at the center and the wall during
SEED processing with (a) and without insulation (b)

17
rheological behavior of the semisolid billet. It is believed that the temperature with the solid
fraction has a strong influence on the viscosity. An inverse relationship for viscosity and
temperature was carried out to qualify this influence[28], shown in Eq. (2-1). This equation is
only valid for the system that there is no phase change due to the temperature variation, for
example, in polymeric materials.
𝜂 = 𝜂0exp(∆𝐸
𝑅𝑇) (2-1)
2.2.2.3 The swirling intensity
In the production of semisolid billets, shear force is applied at different shear rate to
promote the formation of semisolid microstructure. Application of shear force is the crucial
operation to semisolid techniques, for instance, mechanical stirring, magneto hydrodynamic
(MHD) stirring, ultrasonic vibration or swirling of the melt in SEED process.
Shear force is another important factor that has great effect on the viscosity of the
semisolid billets. It causes laminar or turbulent flow within the melt during the solidification.
The driving force for the mechanical fraction of dendrite arms comes from the applied shear
force. And it is also the main dynamic for fine distribution of globular particles in liquid matrix.
To figure out the relationship between shear force and viscosity, the term of “apparent viscosity”
is proposed. In the steady state, the apparent viscosity decreases with the increasing of the shear
force at the same solid fraction.
Shear rate is a correlative parameter that varies with shear force. In Newtonian fluids, the
shear rate varies linearly with shear force while in non-Newtonian fluids it varies non-linearly

18
with shear force. Shear rate also affects the viscosity where the increasing of shear rate decreases
the viscosity.
In SEED process, swirling is the agitation mean to offer shear force. Swirling operation
can alleviate the temperature gradient between the semisolid billets, leading to thermal
homogeneity. Swirling also provides assistance in the fraction of dendrite arms, resulting in the
globular microstructure. The SEED equipment in the lab can offer different swirling frequency
(ranging 100rpm ~ 250rpm) to apply variation shear force. Fig. 2.8 shows the microstructure
difference at different swirling intensity of semisolid 7075 alloy used in present experiment.
2.2.3 Application on casting and wrought aluminum alloys
In recent years, the SEED process has attracted many attentions in semisolid field. A
team of scientists, engineers, technicians and research students are still working on the
optimizing and fully development of this promising semisolid process to popularize its
application. Till now, a large number of experiments have been conducted on common foundry
alloys as A356, A390 and A206, as well as on wrought alloys as AA6061. And relevant
literatures have been published.
( ( (
Fig. 2.8 Microstructure of semisolid AA7075 wrought alloy at different swirling frequency:
(a) dendrite, low rpm; (b) rosette, medium rpm; (c) globular, high rpm.
19
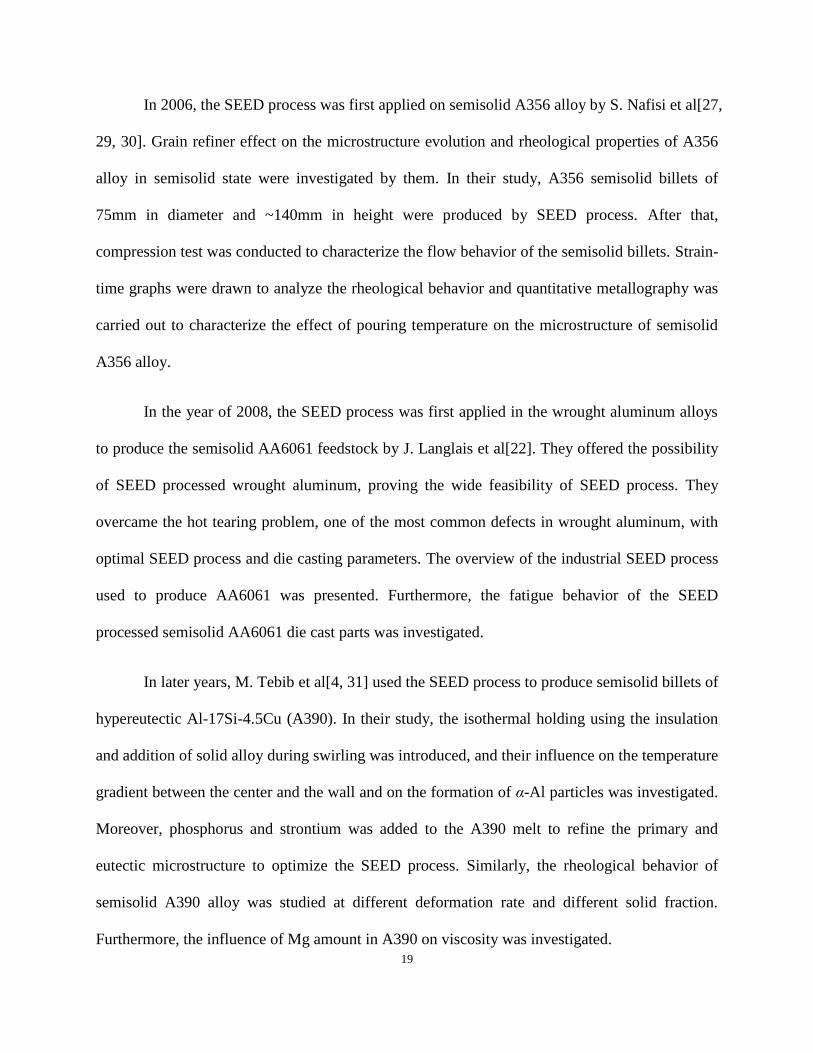
In 2006, the SEED process was first applied on semisolid A356 alloy by S. Nafisi et al[27,
29, 30]. Grain refiner effect on the microstructure evolution and rheological properties of A356
alloy in semisolid state were investigated by them. In their study, A356 semisolid billets of
75mm in diameter and ~140mm in height were produced by SEED process. After that,
compression test was conducted to characterize the flow behavior of the semisolid billets. Strain-
time graphs were drawn to analyze the rheological behavior and quantitative metallography was
carried out to characterize the effect of pouring temperature on the microstructure of semisolid
A356 alloy.
In the year of 2008, the SEED process was first applied in the wrought aluminum alloys
to produce the semisolid AA6061 feedstock by J. Langlais et al[22]. They offered the possibility
of SEED processed wrought aluminum, proving the wide feasibility of SEED process. They
overcame the hot tearing problem, one of the most common defects in wrought aluminum, with
optimal SEED process and die casting parameters. The overview of the industrial SEED process
used to produce AA6061 was presented. Furthermore, the fatigue behavior of the SEED
processed semisolid AA6061 die cast parts was investigated.
In later years, M. Tebib et al[4, 31] used the SEED process to produce semisolid billets of
hypereutectic Al-17Si-4.5Cu (A390). In their study, the isothermal holding using the insulation
and addition of solid alloy during swirling was introduced, and their influence on the temperature
gradient between the center and the wall and on the formation of α-Al particles was investigated.
Moreover, phosphorus and strontium was added to the A390 melt to refine the primary and
eutectic microstructure to optimize the SEED process. Similarly, the rheological behavior of
semisolid A390 alloy was studied at different deformation rate and different solid fraction.
Furthermore, the influence of Mg amount in A390 on viscosity was investigated.

20
2.3 Characteristics of Semisolid Microstructures
In industry production, the common goal in SSM processing is to obtain an ideal
microstructure of the semisolid slurry to facilitate the subsequent component shaping process. It
is generally believed that the ideal microstructure for a semisolid billet should be a specified
solid fraction of fine and globular solid particles uniformly dispersed in the liquid matrix. Such a
structure can ensure the required rheological behavior for shaping.
For a given composition of a semisolid alloy, the characterization of its microstructure
involves quantifying the solid fraction, the grain size and shape, and the distribution of the solid
particles[30]. The typical method to quantify these characteristics is metallography of the
immediately quenched samples from the semisolid temperature. Those microstructure parameters
above have strong influence on the viscosity of the semisolid alloy, which would further affect
the flow behavior and rheological behavior of the semisolid alloy.
2.3.1 Solid fraction
Among all the parameters that have effect on the rheological behavior of semisolid billet,
the solid fraction is the most important one. For a given alloy, the solid fraction is only
determined by the semisolid temperature. Generally, the lower temperature gives the greater
amount of solid fraction, resulting in higher viscosity. Then the mold filling would be difficult.
To measure the solid fraction, several methods are proposed in the open literatures.
Among them, the quantitative metallography, thermal analysis and the application of
thermodynamic data are the most common used[32]. All these three methods give the
approximate measurement and each of them has unique advantages.

21
Quantitative metallography is the most common used method in solid fraction
measurement. In this method, the sample is quenched rapidly at the semisolid temperature to
preserve the semisolid structure. After quenching, a two-dimensional image from the polished
surface is analysed to determine the solid fraction or the liquid fraction. The cooling rate of the
quench medium (usually cold water) has a great effect on the accuracy of the results.
The other method is the thermal analysis method. This technique can be divided into two
routes: differential scanning calorimetry (DSC) and cooling curve analysis (CCA). In
comparison of these two routes, the DSC route is more accurate than the CCA for many
materials, especially for alloys. DSC measures the heat absorbed or released in the phase
transition process. The difference in the amount of heat required to maintain the temperature of
the test sample and the reference is measured as a function of temperature. This amount of heat is
proportional to the solid fraction.
In the third technique, the Gibbs free energy of individual phases is molded as a function
of composition, temperature or pressure, and the results are collected in a thermodynamic
database. Therefore the solid fraction is calculated by the lever rule and models.
2.3.2 Grain size
Grain size has a strongly influence on the physical properties of the materials. In natural
solidification process, the grains tend to form dendritic structures. In industry production, the
casting conditions must be controlled to promote the formation of equiaxed structure, which is
more favorable to satisfy the property requirement. For semisolid alloys, the much finer, globular
dispersed solid particles are preferred.

22
According to the solidification principles, there are two mechanisms to control the grain
size and its distribution: nucleation and growth mechanisms. Nucleation controls the size of the
grains and the growth determines the grain distribution. The degree of undercooling controls the
nucleation process and the growth of the grain is affected by the temperature gradient in the
liquid.
Based on the two mechanisms above, there are several methods to control the grain size,
achieving finer grains.
Rapid cooling during solidification
Agitation of the melt in SSM processing
Addition of a grain refiner
2.3.3 The shape factor
The ideal microstructure in semisolid alloys should be finer and globular solid particles.
So it is necessary to describe the sphericity of the solid particles quantitatively. The shape factor
F is introduced. The most common used method is to analysis the two dimensional sections
obtain from the complex three dimensional structure (Fig. 2.9[1]). The perimeter P and the area
A of the object present on the section are measured, and the shape factor is calculated through
the following expression:

23
F =4𝜋𝐴
𝑃2 (2-2)
In this expression, F=1 refers to a perfectly spherical morphology; F → 0 means a
complex shape. This equation only adequate for well dispersed non-dendrite particles. dmin dmax
ARP2
2.4 Rheology of Semisolid Alloys
2.4.1 Introduction
Semisolid alloy contains both solid phase and liquid phase, in which non-dendritic (or
spheroidal) solid particles are dispersed in the liquid matrix. This unique microstructure gives
semisolid billets distinctive properties depending on the applied force. In the absence of the
external force, the semisolid material can stand by itself like room temperature butter; when the
external force is applied, the semisolid material flows like a liquid that can fill the die. To better
Fig. 2.9 Schematic of complex structure and cross section, (a) 3D structure (b) 2D section

24
study this flow behavior, the term of “rheology” is subjected. Rheology is a physic science that
deals with deformation and flow of material simultaneously. The relationship between rheology
and mechanical properties of the materials is closely related to the materials' viscosity within
semisolid state (or mushy state).
To understand rheology, Newtonian fluid and non-Newtonian fluid must be introduced.
The Newtonian fluid is defined as that the shear stress of the fluid arising from its flow is linearly
proportional to its shear rate. The ratio of shear stress and shear rate is termed as its viscosity.
That means, for the Newtonian fluid, the viscosity is constant at a given temperature,
independent of shear stress and shear rate. Any other fluid that doesn’t obey the Newtonian
relationship is clarified as non-Newtonian fluid. Newtonian fluid is regarded as an ideal model
that account for viscosity, while non-Newtonian fluid is much more common in real life.
Rheology generally accounts for the behavior of non-Newtonian fluids, termed as “thixotropic
behavior”.
In non-Newtonian fluids, they can be clarified into two catalogues: shear thinning and
shear thickening fluid. When the viscosity decrease with the increasing of shear rate, the fluid is
called shear thinning fluid. For instant, ketchup is a common shear thinning fluid since its
viscosity reduces by shaking, like mechanical agitation in industry. Compared to shear thinning
fluid, shear thickening fluid is that the viscosity increases with the increasing of shear rate (Fig.
2.10[1]). Semisolid metal processing involves the shaping of the metal components in the
semisolid state by injection of the billets into a die[33]. For this to be possible, the semisolid
state must have shear thinning thixotropic behavior, because a lower viscosity causes better
movement of material through the die.

25
Viscosity is the most important parameter to characterize the rheological behavior of the
semisolid alloy. It is dependent on the process parameters and metallurgical characteristic of the
alloy including pouring temperature, applied shear rate, the fraction solid, solid particle size and
its distribution respectively[34]. The experimental characterization of a material’s rheological
behavior or experimental determination for a material’s viscosity is known as rheometry or
viscometry. Understanding the effect of thixotropy property on the flow behavior and the
structural evolution of these semisolid materials during flow is significant to the industry[35].
Therefore many techniques for measuring the viscosity were proposed by researchers: rotational
viscometry[36, 37], drop-forge viscometry[38], parallel plate compression viscometry[39,
40],extrusion methods[41-43] and indentation tests[44].
2.4.2 Measurement of the steady-state rheological behavior
For non-Newtonian fluid, apparent viscosity is usually measured to characterize the
rheological behavior. In real test, the requirements for absolute viscometry are rather difficult to
Shear
Shear
Newtonian
Shear rate
Vis
cosi
ty (
Pa s
)
Fig. 2.10 Viscosity versus shear rate curves for a variety of types of rheological behavior

26
achieve, because the test condition must be assumed that there must be laminar flow, the material
must be uniform and there is no physical or chemical changes during testing. In fact, it is
impossible to achieve this condition for thixotropic materials. Therefore, to investigate semisolid
alloys’ rheological behavior, apparent viscosity is applied. Among all types of viscometers,
rotational viscometer is regarded as the most common method to measure the apparent viscosity.
The rotational viscometer consists of two concentric cylinders (the inner rotor and the
outer crucible) with the test material in the annular space between them, termed as coaxial
cylinder rotational viscometer. Either the inner rotor or the outer crucible is rotated, leading to
the material being sheared. The torque date on the cylinders can be carried out to calculate the
viscosity. The sample can be sheared with a given shear stress and the shear rate is measured, or
it can be sheared at a selected shear rate and the shear stress is measured.
Fig. 2.11 Schematic of Searle-type rotational viscometer

27
There are two types of coaxial cylinder rotational viscometers: Searle-type and Couette-
type. With the Searle-type rheometer, the inner rotor is rotated, shearing the material and the
outer cylinder is static. During the rotation, a torque is produced because of the resistance of the
material to the rotation movement, which can be monitored by torque sensors (Fig. 2.11[45]).
Then the output of the torque sensor can be used to calculate the viscosity of the test material.
This type of rotational viscometer cannot be applied on the low-viscosity material, because high
shear rate can cause turbulent flow within the fluid.
To the contrary, in the Couette-type, the inner rotor is kept static and the outer cylinder
rotates at a certain speed. The torque produced in the material is determined by the exact
counteracting torque required to keep the inner rotor motionless. Compared to the Searle-type,
turbulent flow is less common in Couette-type viscometer. However, the rotated outer cylinder
makes accurate temperature control much difficult. Hence, Searle-type viscometer is much more
welcome in practical measurement.
From the previous research, it is generally believed that the apparent viscosity at the
steady state is influenced by solid fraction and the shearing rate. The viscosity increases with an
increasing solid fraction. The increasing is slight at the early stage, while it becomes dramatic at
high solid fraction. The viscosity decreases with an increase in shear rate. With the increasing
shear rate, the morphology becomes more globular and the liquid trapped in the solid particles is
reducing, leading to a smaller solid fraction, resulting in decreasing viscosity.
2.4.3 Measurement of the transient rheological behavior
In steady state, the semisolid material experiences a certain shear rate for a period time.
But in the real industry, the die filling process finishes quickly, actually less than one second.

28
The slurry for die filling undergoes a sudden increase in shear rate as it enters the die. In that
second, the shear rate of the slurry increases dramatically, from rest to 100 s-1
or more. This
process is regarded as unsteady state or transient state. Rheological behavior in transient state is
totally different to that in steady state. Therefore, it is much more meaningful to measure the
rheological behavior in transient state for the modeling of die filling and die design in real
industry.
Rheological behavior in transient state can be measured by rotational viscometer only for
lower solid fraction (less than 0.45). For higher solid fraction, rapid compression viscometer or
drop-forge viscometer is more suitable.
Some experiments of rapid compression viscometry have been carried out for Sn-15%Pb
semisolid alloy by Laxmanan and Flemings[39]. In their work, the billet was compressed
between two parallel plates under a selected load, and the load and the displacement was
Fig. 2.12 Typical signal response to rapid compression of a semisolid alloy slug

29
measured as the raw date to calculate the viscosity. An analytical formula was used to derive the
relationship between viscosity and shear rate through the load and displacement measured under
appropriate assumptions. Fig. 2.12 shows a typical example of the load signal obtained during
the rapid compression test from P. Kapranos et al[33]. There is a peak load in the load-
displacement curve because of the breaking down of the skeletal structure in semisolid slurry.
The height of the minimum load is associated with the temperature of the slurry.
Another viscometer to measure the rheological behavior at transient state is drop-forge
viscometer, produced by Yurko and Flemings[38].

30
1. David H. Kirkwood, M.S., Plato Kapranos, Helen V. Atkinson and Kenneth P. Young,
Semi-solid Processing of Alloys, ed. J.P. Robert Hull, R. M. Osgood and Hans Warlimont
Vol. 124. 2010: Springer Series in Materials Science.
2. Fan, Z., Semisolid metal processing. International Materials Reviews, 2002. 47(2): p. 49-
85.
3. Zoqui, E.J., Alloys for Semisolid Processing. Comprehensive Materials Processing, 2014.
5: p. 163-190.
4. Tebib, M., et al., Semi-solid processing of hypereutectic A390 alloys using novel
rheoforming process. Transactions of Nonferrous Metals Society of China, 2010. 20(9):
p. 1743-1748.
5. Salleh, M.S., et al., An Overview of Semisolid Processing of Aluminium Alloys. Isrn
Materials Science, 2013. 2013(5).
6. Atkinson, H.V., Semisolid processing of metallic meterials Materials Science and
Technology 2010. 26(12): p. 1401-1413.
7. Ghomashchi, S.N.a.R., Semi-solid Metal Processing Routes: An Overview Canadian
Metallurgical Quarterly 2005. 44(3): p. 289-304.
8. M.C.Flemings, R.M.a., Die Casting of Partially Solidified Alloys. AFS Transactions
1972. 80: p. 173-182.
9. Chung, I.-G., A. Bolouri, and C.-g. Kang, A study on semisolid processing of A356
aluminum alloy through vacuum-assisted electromagnetic stirring. The International
Journal of Advanced Manufacturing Technology, 2011. 58(1-4): p. 237-245.
10. K.P.Young, C.P.K.a.F.C., Fine Grained Metal Composition U.S. Patent, Editor.
November 15, 1983.
11. K.P.Young, D.E.T., H.P.Cheskis and W.G.Watson Process and Apparatus for
Continuous Slurry Casting U.S. Patent, Editor. November 13,1984.
12. D. Doutre, G.H., and P. Wales, Semi-solid Concentration Processing of Metallic Alloys.
U.S. Patent August 2002. 6(428): p. 636 B2.
13. R. Martinez, A.F., J.A. Yurko and M.C. Flemings Efficient Formation of Structures
Suitable for Semi-Solid Forming Transactions of the 21th International Die Casting
Congress, 2001: p. 47-54.
14. J.A. Yurko, R.A.M.a.M.C.F., Commercial Development of the Semi-Solid Rheocasting
(SSR) Transactions of the International Die Casting Congress 2003: p. 379-384.
15. Ji, S., Z. Fan, and M.J. Bevis, Semi-solid processing of engineering alloys by a twin-
screw rheomoulding process. Materials Science and Engineering: A, 2001. 299(1–2): p.
210-217.
16. Adachi, M., Sasaki, H., Harada, Y., Methods and Apprratus for Shaping
SemiSolidMetlas, in European Patent EP 0 745 684 Al, U. Industries, Editor. Dec. 4,
1996.
17. Abramov, V., et al., Solidification of aluminium alloys under ultrasonic irradiation using
water-cooled resonator. Materials Letters, 1998. 37(1–2): p. 27-34.
18. Zhou, B., et al., Preparation of semisolid aluminum alloy slurry by forced convection
mixing and its microstructure evolution. Zhongguo Youse Jinshu Xuebao/chinese Journal
of Nonferrous Metals, 2014. 24(1): p. 61-68.
19. Jiang, J., H.V. Atkinson, and Y. Wang, Microstructure and Mechanical Properties of
7005 Aluminum Alloy Components Formed by Thixoforming. Journal of Materials
Science & Technology, 2016.

31
20. Wang, J.J., et al., An Innovative Two-Stage Reheating Process for Wrought Aluminum
Alloy During Thixoforming. Metallurgical & Materials Transactions A, 2015. 46(9): p.
4191-4201.
21. J. J. Wang, Z.M.Z., A.B. Phillion Alloy development and reheating process exploration
of Al-Si casting alloys with globular grains for thixoforming Journal of Materials
Research 2016. 31(16): p. 2482-2492.
22. Joseph Langlais, N.A., Alain Lemieux, X.G.Chen and Laurent Bucher, The Semi-Solid
Forming of an Improved AA6061 Wrought Aluminum Alloy Composition Solid State
Phenomena, 2008. 141-143: p. 511-516.
23. D. Doutre, J.L., S. Roy, The SEED Process for Semi-Solid Forming in The 8th
International Conference on Solid Processing of Alloys and Composites. 2004: Limassol
Cyprus p. 397-408.
24. Pascal Coté, M.-È.L., X. Grant Chen, New Developments with the SEED Technology.
Solid State Phenomena, 2013. 193-193: p. 373-378.
25. Lemieux, A., et al., Effect of Si, Cu and Fe on mechanical properties of cast semi-solid
206 alloys. Transactions of Nonferrous Metals Society of China, 2010. 20(9): p. 1555-
1560.
26. A. Lemieux, J.L.a.X.G.C., Reduction of Hot Tearing of Cast Semi-Solid 206 Alloys in
The 12th International Conference on Semi-Solid Processing of Alloys and Composites
October 2012: Cape Town, South Africa.
27. Lashkari, O., S. Nafisi, and R. Ghomashchi, Microstructural characterization of rheo-
cast billets prepared by variant pouring temperatures. Materials Science and
Engineering: A, 2006. 441(1-2): p. 49-59.
28. Lashkari, O. and R. Ghomashchi, The implication of rheology in semi-solid metal
processes: An overview. Journal of Materials Processing Technology, 2007. 182(1-3): p.
229-240.
29. Nafisi, S., et al., Microstructure and rheological behavior of grain refined and modified
semi-solid A356 Al–Si slurries. Acta Materialia, 2006. 54(13): p. 3503-3511.
30. Lashkari, O. and R. Ghomashchi, Deformation behavior of semi-solid A356 Al–Si alloy at
low shear rates: Effect of fraction solid. Materials Science and Engineering: A, 2008.
486(1-2): p. 333-340.
31. Tebib, M., F. Ajersch, and X.G. Chen, Rheological Properties and Microstructure of
Hypereutectic Semi-Solid Al-Si-Mg Alloys Using Rheocasting Route. Solid State
Phenomena, 2012. 192-193: p. 323-328.
32. Nafisi, S., D. Emadi, and R. Ghomashchi, Semi solid metal processing: The fraction solid
dilemma. Materials Science and Engineering: A, 2009. 507(1–2): p. 87-92.
33. Kapranos, P., et al., Investigation into the rapid compression of semi-solid alloy slugs.
Journal of Materials Processing Technology, 2001. 111(1–3): p. 31-36.
34. Lashkari, O. and R. Ghomashchi, Deformation behavior of semi-solid A356 Al–Si alloy at
low shear rates: Effect of fraction solid. Materials Science and Engineering: A, 2008.
486(1–2): p. 333-340.
35. Andreas N. Alexandrou, G.C.F., Georgios C. Georgiou Squeeze flow of semi-solid
slurries Joural of Non-Newtonian Fluid Mechanics 2013. 193: p. 103-115.
36. Ichikawa, K., Kinoshita, Y., Rheocasting Techniques Applied to Intermetallic TiAl Alloys
and Composites. Material Science and Engineering, 1997. A239: p. 493-502.

32
37. Martin, L.M., Brown,S.B., FavierJD., Suery,M., Shear Deformation of High Solid
Fraction (>0.60) Semi-Solid Sn-Pb under Various Structures. Material Science and
Engineering, 1995. A202: p. 112-122.
38. J.A. Yurko, a.M.C.F., Rheology and Microstructure of Semi-Solid Aluminum Alloys
Compressed in the Drop-Forge Viscometry Metallurgical and Materials Transactions A,
2002. 33A: p. 2737-2746.
39. Laxmanan V, F.M., Deformation of semi-solid Sn–15%Pb alloy. Metal Trans A, 1980.
11A: p. 1927-37.
40. Lashkari, O. and R. Ghomashchi, A new machine to characterize microstructural
evolution of semi-solid metal billets through viscometery. Materials & Design, 2007.
28(4): p. 1321-1325.
41. Draper O, B.S., Dolman G, Smalley K, Griffiths A, A comparison of paste rheology and
extrudate strength with respect to binder formulation and forming technique. J Mater
Proc Tech 1999. 141-6: p. 92-93.
42. Turenne S, L.N., Laplante S, Ajersch F, Mechanical behavior of Aluminum matrix
composite during extrusion in the semisolid state. Metal Mater Trans A, 1993. 30A: p.
1137-46.
43. Ferrante M, d.F.E., Rheology and microstructural development of Al-4wt% Cu alloy in
semi-solid state. Mater Sci Eng A, 1999. A271: p. 172-80.
44. Ferrante M, d.F.E., Bonilha M, Sinka V, Rheological properties and microstructural
evolution of semi-solid aluminum alloys inoculated with mischmetal and with titanium, in
5th International conference on semisolid processing of alloys and composites. 1998. p.
35-42.
45. Atkinson, H.V., 5.08 – Rheology of Semisolid Metallic Alloys. Comprehensive Materials
Processing, 2014: p. 149-162.

33
CHAPTER 3
EXPERIMENTAL PROCEDURES
3.1 Alloys Preparation and Composition
The main alloys used in this project are 7075 wrought aluminum base alloy and its grain
refiner modified alloy. The AA7075 base alloy was prepared using 99.99% pure aluminum
ingots mixed with various master alloys such as 100%Zr, 100%Mg, 50%Cu-Al, 50%Si-Al,
25%Mn-Al and 25%Fe-Al. All the master alloys were carefully weight measured and heated to
the liquid state at around 750℃ in a 30kg capacity crucible using an electrical resistance furnace.
Degassing was conducted 30mins before pouring. Degassing process was carried out inside the
melt using a graphite lance of 1 inch diameter by the Argon gas following the rate of 0.14m3/h
for 10 minutes. For the grain refiner modified AA7075 alloy, the grain refiners were added to the
melt in the form of their master alloys of 5%Ti1%B-Al and 10%Zr-Al in rod shape.
The chemical composition was determined by Alcan using optical emission
spectrographic analysis on the casted disks of 56mm in diameter and 10mm in thick. Based on
the standard procedure, 6-8 ablations were performed on the machined surface of the disk
samples and the average results were presented, shown in Table 3.1.

34
Table 3.1 Chemical composition of AA7075 used in the experiment (wt. %)
Alloy # Zn Mg Cu Fe Si Mn Ti Zr Al
1 5.77 3.14 1.62 0.38 0.38 0.28 0 0 Bal.
2 5.70 2.88 1.58 0.41 0.44 0.30 0.04 0 Bal.
3 5.75 2.76 1.75 0.43 0.58 0.30 0.06 0 Bal.
4 5.50 3.07 1.67 0.35 0.45 0.32 0 0.06 Bal.
5 5.61 2.80 1.63 0.36 0.48 0.31 0.06 0.06 Bal.
3.2 Semisolid Billets Fabrication by SEED Processing
For the fabrication of the semisolid billets, a standard SEED processing will be employed.
Fig. 3.1 shows a schematic of SEED processing and Fig. 3.2 presents the SEED machine in the
lab, patented by Alcan[2]. Generally, after degassing of the superheated molten metal with
Argon gas for 20-30 min, about 1.0kg melt is poured into a preheated coated steel mold of 90
mm diameter and 250 mm high. The mold is held on the SEED machine. As per requirement of
each test, the mold should be tilted to a certain angle to reduce turbulence flow during pouring.
Two K-type thermocouples are installed at the mold center and near the wall to monitor the
temperatures distribution within the bulk liquid during solidification. After that, the mold was
rotated by SEED machine at different frequencies. Stirring and air cooling of molten metal are
simultaneously preformed. In order to study the effect of rotating (stirring) frequency on the
microstructures of semisolid billets, stirring frequencies of 120, 180 and 210 rpm will be applied
according to the experiments requirements and machine capacity. The SEED processing and
solidification continue until the bulk temperature at the center of the billets reaches the

35
predetermined temperatures. Subsequently, the prepared semisolid billet will be demolded and
immediately water quenched or transferred to the viscometer for rapid compression test. The
target temperatures will be defined according to the solid fraction-temperature curve obtained by
DSC analysis of 7075 wrought aluminum alloy. For semisolid forming, a solid fraction range of
30-70% is suggested according to literature[3].
Fig. 3.1 The schematic procedure of SEED processing (by Pascal Côté etc[1].)
Fig. 3.2 The SEED machine designed by Alcan applied in this project.

36
3.3 Characterization of Microstructures
3.3.1 OM observation and image analysis
For as-cast billets fabricated by SEED process, the billet was cold water quenched once
the process ends and was properly cut for microstructure study. The middle area of each billet
was examined to represent the microstructure of as-cast billet, as shown in Fig. 3.3 (a). Fig. 3.3
(b) illustrates the typical areas of deformed billets studied during metallographic procedure. The
cut specimens were carbon powder mounted, sandpaper grounded and polished down to 0.5
micron diamond suspension. If necessary, some of the polished samples were chemically etched
by Keller etchant for 20 seconds.
As-cast
(a)
Center Middle Edge
Deformed
(b)
Fig. 3.3 Area of samples sectioned for observations for
(a) as-cast and (b) deformed billets

37
Nikon Eclipse SE600 optical microscopy (Fig. 3.5) was used to observe the
microstructures of the prepared samples. Magnifications from 50X to 200X were used
accordingly. The Clemex image analyzer coupled with the OM was applied to carry out the
quantitative characterization through different parameters as following;
Aspect ratio: ratio of length over width of the measured particle.
Mean grain size: average spherical diameter of primary α-Al particles based on the
estimated size of an object as if it was a sphere.
String length: length of a thin curved object, measured along its medial axis. String length
is approximated by:
Stringlength =𝑃𝑒𝑟𝑖𝑚𝑒𝑡𝑒𝑟 + √𝑃𝑒𝑟𝑖𝑚𝑒𝑡𝑒𝑟2 − (16 × 𝐴𝑟𝑒𝑎)
4
String width: width of a thin curved object, measured across its medial axis. The object is
assumed to have a constant width. String width is approximated by:
Stringwidth =𝑃𝑒𝑟𝑖𝑚𝑒𝑡𝑒𝑟 − √𝑃𝑒𝑟𝑖𝑚𝑒𝑡𝑒𝑟2 − (16 × 𝐴𝑟𝑒𝑎)
4
Area percentage: percent of area occupied by object particles relative to the whole area.
Fig. 3.4 Schematic of string length and string width.

38
Particle density: number of object particles per unit area.
For quantitative image analysis of the microstructure of as-cast or deformed billets, a
sufficient number of randomly selected fields were automatically analyzed. For characterization
of α-Al particles in the SEED specimens, 45 fields with the total area of 50mm2 were examined
per specimen (Mag. x50); and for intermetallic particles, 100 fields with the total area of 10mm2
were measured (Mag. x200).
3.3.2 SEM observation and elemental analysis
A scanning electron microscope (SEM, JSM-6480LV) equipped with energy-dispersive
X-ray spectroscopic (EDS) facility was also used to examine the morphological features and
elemental analysis of the intermetallic phases appeared in AA7075 alloys.
Fig. 3.5 Nikon Eclipse SE600 optical microscopy coupled with Clemex image
analyzer used in present project.

39
3.4 Rheology Test
3.4.1 Parallel-plate compression viscometer
For these series of tests, the semisolid feedstock will be prepared as described in section
3.2. The optimum processing conditions will be used. When the temperature of the center of the
billets reaches the predetermined value, the billet will be demolded and quickly transferred to a
parallel plate compression viscometer. Subsequently, the semisolid billets will be rapidly
compressed under an isothermal condition.
(a)
Fig. 3.6 (a) Schematic and (b) actual view of parallel plate compression viscometer
(b)
Furnace
Dead weight

40
Fig. 3.6 shows the schematic and the real view of the parallel plate compression
viscometer[4]. The parallel-plate compression viscometer consists of a lower and upper plate,
with frame rod between them tracking the motion of upper plate. A furnace with heat resistant
windows is installed on the press bed to ensure the billet isothermal during the compression test.
Both of the plates are made of refractory material with graphite and boron nitride coating to
prevent it from sticking to the billet. The lower plate rests on the floor of the furnace and the
20cm length square upper plate is connected with the track rod which is suspended outside of the
furnace. Dead weight is added to the upper plate to offer the force on the fluid during
compression. During the test, the upper plate drops down to the lower plate driven by gravity of
the dead weight.
The rapid compression will be conducted under a constant force condition (desired dead
weight). The motion of dead weight-rod-upper plate is controlled by a pneumatical system. This
system enables that the upper plate can either be moved manually at low speed to determine the
height of test billet or be dropped from a known height to compress the sample. The resulting
displacement is monitored by a displacement transducer (0-255mm) of ±0.1-0.2% precision at
full stroke. 1000 data points per second will be captured during the test. The maximum height of
the upper plate is 25.0cm and the maximum velocity of the plate when it firstly contacts the billet
can be 0.30m/s approximately. Therefore, this test machine can produce rheological data over a
range of shear rate between 0 and 6.5s-1
.
During a typical test, the furnace is first set at a desired temperature. Then, the billet is
rheocasted by SEED processing under desired processing parameters. Once the billet reaches the
desired semisolid temperature, it is demolded to the center position of the lower plate in the
viscometer furnace. Firstly, manually move down the upper plate to find out the estimated height

41
of the sample; then, move up the upper plate to the initial position (highest position, 25.0 cm).
After that, release the upper plate and let it drop freely to compress the billet. After compression,
the billet is removed to the cold water quenching. The process is repeatable. The semisolid billet
containing different levels of solid fractions will be rapidly compressed under certain dead
weight.
3.4.2 Calculation of viscosity and shear rate
In this parallel plate compression viscometer, the semisolid alloy is compressed under a
constant load between two plates and the viscosity was calculated from the displacement-time
curve obtained during the compression test. To analyze the rheological behavior of the semisolid
alloy, Stephan equation model was applied.
In this model, some assumptions are considered. It is assumed that the flow is only
happened in radial direction, the liquid phase in the semisolid billet is incompressible, and the
entire billet is compressed between the two plates. Then, the viscosity of the billets under
compression test can be calculated from the final Stefan equation [5-7]:
𝐹 = −3𝜇𝑉2
2𝜋ℎ5(𝑑ℎ
𝑑𝑡)[3 − 1]
Where 𝐹 = the applied force on the billet,
𝜇 = the calculated viscosity,
𝑉 = the volume of the billet,
ℎ = the instantaneous height of the billet,
𝑡 = time.

42
In conventional viscometers, the compress velocity is usually manually controlled. It is
usually kept a low and constant speed resulting in a low and near constant shear rate (less than
1s-1
) to study the rheological behavior in the steady state. In this kind of test, the operation
normally takes a long duration and the produced rheological data has limited guidance to the real
industry commercial forming operations. Because in traditional die forming, the slurry would
undergo a sudden increase in shear rate from rest and this shear rate change takes place in less
than one second. This short state is termed of transient state relative to steady state. And till now,
the rheological analysis on the transient state is limited. In present project, the rheological date is
mainly focus on the transient state.
In the parallel-plate compression viscometer, the dead weight is considered as the applied
force on the slurry and it is constant. However, the compression velocity varies with time and it
can be calculated from the displacement date by derivatives to time, which is termed as dh/dt
(Fig. 3.7 (b)).
0
0,2
0,4
0,6
0,8
1
1,2
0 0,2 0,4 0,6 0,8 1 1,2
He
igh
t re
du
ctio
n
Time, s
Height reduction-time
-0,3
-0,25
-0,2
-0,15
-0,1
-0,05
0
0 0,2 0,4 0,6 0,8 1 1,2
dh
/dt
Time, s
dh/dt-time
0.856 sec 0.856 sec
(
a)
(
b) Fig. 3.7 (a) The height reduction-time and (b) instantaneous compression velocity-
time calculated from the displacement date

43
After a series of calculation, the viscosity as a function of time can be obtained from Eq.
[3-1], where the viscosity is an average and instantaneous value.
Assuming that the volume of the billet does not change during compression test, the
average shear rate can be obtained by integrating throughout the volume[5]:
γ = −𝑅
2ℎ2𝑑ℎ
𝑑𝑡[3 − 2]
Where 𝑅 = the instantaneous radius of the billet,
γ = the average shear rate.
Therefore, a relationship between viscosity and shear rate would be established
fundamentally and the rheoformability of the semisolid AA7075 alloy would be assessed and
characterized.
44
1. Pascal Coté, M.-È.L., X. Grant Chen, New Developments with the SEED Technology.
Solid State Phenomena, 2013. 193-193: p. 373-378.
2. D. Doutre, G.H., and P. Wales, Semi-Solid Concentration Processing of Metallic Alloys
U.S. Patent, Editor. August 6, 2002.
3. David H. Kirkwood, M.S., Plato Kapranos, Helen V. Atkinson and Kenneth P. Young,
Semi-solid Processing of Alloys, ed. J.P. Robert Hull, R. M. Osgood and Hans Warlimont
Vol. 124. 2010: Springer Series in Materials Science.
4. Lashkari, O. and R. Ghomashchi, Deformation behavior of semi-solid A356 Al–Si alloy at
low shear rates: Effect of fraction solid. Materials Science and Engineering: A, 2008.
486(1-2): p. 333-340.
5. J.A. Yurko, a.M.C.F., Rheology and Microstructure of Semi-Solid Aluminum Alloys
Compressed in the Drop-Forge Viscometry Metallurgical and Materials Transactions A,
2002. 33A: p. 2737-2746.
6. Laxmanan, V. and M.C. Flemings, Deformation of semi-solid Sn-15 Pct Pb alloy.
Metallurgical Transactions A, 1980. 11(12): p. 1927-1937.
7. Liu, T.Y., et al., Rapid compression of aluminum alloys and its relationship to
thixoformability. Metallurgical and Materials Transactions A, 2003. 34(7): p. 1545-1554.

45
CHAPTER 4
RESULTS AND DISCUSSION
4.1 DSC Analysis and Liquid Fraction
To a large extent, liquid fraction controls the rheoformability and the evolution of
microstructure of semisolid billets. Thus, this parameter is significant important and priori for the
whole semisolid metal processing. Therefore, it is critical to firstly investigate the evolution of
liquid fraction to temperature to determine the working temperatures (semisolid temperature
window) to be employed in this study. For this to be possible, a Differential Scanning
Calorimetry (DSC) was used.
During the DSC test, the critical prepared sample was heated to 700℃ at the rate of 10 ℃
per minite and cooled to room temperature at the same rate. The heat flow and the temperature
were both monitered to obtain heating or cooling curves. Then, the liquid fraction to temperature
was intergrated from the heat flow vs temperature data recorded from the solidification curve of
semisolid AA7075 alloy with the guidance of Birol’s study[1].

46
Fig. 4.1 shows the DSC curve and the curve of liquid fraction vs. temperature obtained
from DSC solidification curve of AA7075 base alloy. It is found that the liquidus and solidus
temperature of the alloy are 631℃ and 490℃ respectively. Thus, the solidification temperature
range, which is difined as the temperature range between the solidus and liquidus of an alloy, is
about 141℃ , which is in the range of 10 to 150℃ suggested by Patel et al[2] for good
processability of semisolid forming. From Fig. 4.1 (b), it is discovered that the temperature
sensitivity, which can be defined as the slope of liquid fraction versus temperature curve,
increases with the increasing temperature. Hence, when the temperature is relative high, a slight
fluctuation in temperature would induce a large difference in the liquid fraction, which requies
careful control of the temperature during semisolid metal processing of AA7075 alloy.
-2
0
2
4
6
8
10
12
14
16
18
20
480 530 580 630 680
No
rma
lize
d H
eat
Flo
w E
nd
o u
p (
W/g
)
Temperature (℃)
0
10
20
30
40
50
60
70
80
90
100
480 520 560 600 640
liq
uid
fra
ctio
n, %
Temperature, ℃
Fig. 4.1 (a) DSC and (b) liquid fraction versus temperature of AA7075 alloy obtained from
heat flow vs temperature data recorded during cooling from the molten state.
(a) (b)

47
It is suggested that the liquid fraction should be in the range of 35% and 65% ideally.
Then, from the obtained curve of liquid fraction to temperature, the semisolid temperature of
AA7075 alloy should be set between 610 and 625℃, which has been the guidence temperature in
the following experiments.

48
4.2 Effect of SEED Processing Parameters on the Microstructure of
Semisolid 7075 Alloys
The SEED processing is regarded as a novel and simplified rheocasting technique for the
preparation of billets for the semisolid forming processing, which is patented by Alcan[3]. In the
SEED process, there are several crucial process parameters that have significant influence on the
microstructure of the final products. These process parameters include the pouring temperature,
the processing time, the demolding temperature of the semisolid billets, the cooling rate of the
melt and the swirling frequency. The effect of the SEED processing parameters, mainly
demolding temperature and swirling frequency, on the microstructure of unrefined 7075 base
alloy and its TiB2 refined alloy were both investigated in order to identify the optimal processing
conditions for high quality 7075 semisolid billets.
During the SEED processing, the crucible was preheated at 200℃ approximately, and the
pouring temperature was fixed at 750℃ constantly. All the billets were immediately cold water
quenched to the room temperature after the SEED processing. All the samples were mounted and
polished down to 0.5 micron diamond suspension, then etched by the common used Keller
etchant. Microstructures were examined by the optical microscope (Nikon Eclipse ME600).
Quantitative analysis was carried out by a Clemex image analyser.

49
4.2.1 SEED processed unrefined AA7075 base alloy
The optical micrographs in Figure 4.2 show the microstructure variations for the 7075
base alloy under different SEED processing conditions. From the optical micrographs, it is clear
to identify that microstructures of the billets fabricated by the SEED processing mainly consist of
Tem
per
atu
re/℃
6
20
6
16 6
12
Frequency /rpm
120 180 210
Fig. 4.2 Optical micrographs of SEED processed semisolid billets AA7075 base alloy
under different processing conditions

50
primary α-Al particles, surrounded by a small amount of eutectic liquid. The bright particles are
primary α-Al and the dark phase is the eutectic phase. From the micrographs, it is clear shown
that the string frequency has a strong influence on the morphology of the grains. With the
increasing of the string frequency from 120 rpm to 210 rpm for each demolding temperature, the
amount of dendrite grains becomes smaller and the number of grains in rosette-like or globular
shape becomes larger. Besides, with the increasing string motion the grain size tend to become
smaller. This is mainly because that the string movement causes the fragment of the dendrite
arms and those broken arms grow up as new grains. This indicates that from the lower swirling
frequency to the higher, it is shown great tendency to the transformation of the α-Al grains from
large dendrite structure to the finer rosette-like or fairly globular gains. This grain transformation
significantly reduces the resistance of melt flow during the die filling processing. Fig. 4.2 also
shows that with the increasing of the demolding temperatures, the grain size tend to be smaller
because to reach a lower demolding temperature longer processing time is needed and grains
grow up larger.
In order to further highlight the inter-relationship between microstructures and SEED
processing parameters, quantitative metallography was carried out by Clemex image analysis
system. Mean grain size and grain’s aspect ratio of SEED processed 7075 base alloy were
measured. To guarantee the accuracy of the data, at least 800 grains were measured.

51
Fig. 4.3 (a) shows the mean grain size of the primary α-Al particles. It was found that the
average primary α-Al particle size decreased from 125.61μm at 120 rpm frequency to 111.25μm
at 180 rpm for the semisolid billet demolded at 616 ℃, which the stirring movement gave rise to
the fragmentation of large dendrite arms, resulting in smaller grain size. However, by further
increase to the maximum frequency that the SEED equipment could offer, 210 rpm, the mean
grain size stayed constant or increased slightly. It might be explained from that with further
increase of swirling, the grains’ fragmentation no longer occurred, and individual grains even
tend to attach each other, resulting in slightly larger grain size. Comparing the mean grain size at
various demolding temperatures at certain frequency, it can be seen that the average α-Al
particles size marginally increased with lower demolding temperature. To reach lower demolding
100
110
120
130
140
100 120 140 160 180 200 220
Pri
mar
y α
-Al p
arti
cle
siz
e /μ
m
Frequency/rpm
612℃, 0.55 fs
616℃, 0.50 fs
620℃, 0.45 fs
1,6
1,65
1,7
1,75
1,8
1,85
1,9
100 120 140 160 180 200 220
Asp
ect
rat
io
Frequency/rpm
612℃, 0.55 fs
616℃, 0.50 fs
620℃, 0.45 fs
(a) (b)
Note: an error of ±10% must be considered for graphs.
Fig. 4.3 Effect of SEED processing parameters on (a) Mean grain size and (b) Grain aspect ratio of
AA7075 base alloy

52
temperature, longer processing time was required, which gave grains longer growing time,
leading to slightly larger grain size.
Fig. 4.3 (b) shows the aspect ratio of primary α-Al particles. For the billet demolded at
620℃, by increasing the frequency from 120 to 180 rpm the aspect ratio significantly decreased
from 1.84 to 1.7, respectively, indicating improved globularity. However, with additional
increase to 210 rpm, it kept constant or slightly increased. On the contrary, lower demolding
temperature produced higher aspect ratio, which can also be related to long processing time or
long grown time.
4.2.2 SEED processed TiB2 refined AA7075 alloy
According to the results above, the minimum grain size of the SEED processed AA7075
base alloy proofed to be 107μm at 180 rpm swirling frequency and 620 ℃ demolding
temperature. Meanwhile, the minimum aspect ratio is 1.64 at 180 rpm swirling frequency and
612℃ demolding temperature. In order to obtain much more finer and globular grains for
semisolid AA7075 alloy, typical grain refiner TiB2 was applied. And the effect of SEED
processing parameters on microstructure of this refined alloy was also investigated.
Fig. 4.4 shows the optical micrographs of SEED processed semisolid billets of AA7075
alloy modified with 0.03% TiB2 under different processing conditions. From the optical
micrographs, it is clear to recognize that the grains are considerably finer than AA7075 base
alloy. Dendrite structures disappeared even at very low swirling frequency. Instead, the primary
α-Al particles show a small amount of rosette-like and a large proportion of fine globular grains.

53
Generally, with the increasing of string frequency the grain size has a slight decreasing and the
morphology of grains tends to be more globular.
In the same way, the mean grain size and the aspect ratio of this SEED processed alloy
was quantitively characterized by Clemex analyzer same as for AA7075 base alloy as shown in
Fig. 4.5. From Fig. 4.5 (a), it is found that for a given temperature, the change of the mean α-Al
particle size for this refined alloy with the increasing frequency follows almost similar trend as
Tem
per
atu
re/℃
6
20
6
16 612
Frequency /rpm
120 180 210
Fig. 4.4 Optical micrographs of SEED processed semisolid billets of AA7075 alloy modified with
0.03% TiB2 under different processing conditions

54
unrefined base alloy. At the 180 rpm frequency and 620℃ temperature, the mean grain size
reaches the minimum value of 94μm. In the meantime, higher demolding temperature results in
smaller grain size at a fixed frequency, which due to shorter grown up time for grains.
However, considering the billets SEED processed at 616 ℃ and various swirling
frequencies, the maximum and minimum grain size of the modified AA7075 alloy are 100μm
and 95μm respectively. It can be recognized that the SEED processing frequency triggers 6.0%
reduction in mean grain size, which is more than two times smaller than that of AA7075 base
alloy of 12.9%. Consequently, the effect of SEED processing parameters on the microstructure
of 0.03%Ti grain refiner modified AA7075 alloy is much slighter than that on base alloy.
90
95
100
105
110
115
100 120 140 160 180 200 220Pri
mar
y α
-Al p
arti
cle
siz
e /μ
m
Frequency/rpm
612℃, 0.55 fs
616℃, 0.50 fs
620℃, 0.45 fs
1,55
1,56
1,57
1,58
1,59
1,6
1,61
1,62
100 150 200 250
Asp
ect
rat
io
Frequency/rpm
612℃, 0.55 fs
616℃, 0.50 fs
620℃, 0.45 fs
(a) (b)
Fig. 4.5 Effect of SEED processing parameters on (a) Mean grain size and (b) Grain aspect ratio of
0.03wt%TiB2 modified AA7075 alloy
Note: an error of ±10% must be considered for graphs.

55
Fig. 4.5 (b) gives the aspect ratio of 0.03%Ti modified AA7075 alloy. Similar tendency
is found compared to aspect ratio for AA7075 base alloy. For a given temperature, the aspect
ratio decrease with the increasing frequency from 120 rpm to 180 rpm, due to the swirling
movement, but with further increase in frequency, the aspect ratio keeps constant or increases
slightly. At meantime, the aspect ratio decreases with the increasing demolding temperature.
4.3 Effect of Grain Refiners on SEED Processed Microstructures of
AA7075 Alloys
In order to optimize the microstructure of SEED processed AA7075 alloy, two kinds of
typical grain refiner were added to the base alloy. Firstly, two percentages of TiB2 (0.03%Ti and
0.06%Ti) were designed for the base alloy. Secondly, 0.1%Zr was added to the base alloy. After
that, the AA7075 alloy with the combination of 0.1%Zr and 0.06%Ti was designed. The
additions of grain refiner are summarized in Table 4.1. All of the alloys were SEED processed
into the semisolid state following the same processing conditions as described before.
Table 4.1 Designed additions of grain refiners for AA7075 alloy (wt%)
Alloy# 1 2 3 4 5
TiB2 0 0.03 0.06 0 0.06
Zr 0 0 0 0.06 0.06

56
4.3.1 Effect of grain refiner on primary α-Al grains
Figure 4.6 shows the morphologies of SEED processed AA7075 alloy under the optimum
swirling frequency obtained from section 4.2, which is 180 rpm, and the same demolding
temperature 616 ℃.
With the increasing amount of TiB2, the grains transfer from dendrite to rosette-like to
globular particles (Fig. 4.6 (1), (2) and (3)). Meanwhile, there is an evident decrease in grain size
with the increasing percentage of TiB2. The AA7075 base alloy with addition of 0.06wt%Zr is
mainly composed of the dendrite grains, shown in Fig. 4.6 (4), which is similar to the AA 7075
base alloy. When the same amount of Zr was added to the AA7075 alloy with 0.06wt%Ti, the
gains transform into fine globular particles, which is slightly larger than that of AA7075 alloy
with only 0.06wt%Ti (Fig. 4.6 (5)).
1 2 3
4
Fig. 4.6 Optical micrographs of SEED processed AA7075 semisolid billets with
various grain refiners at 616℃ and 180 rpm
5 1. 7075 base alloy
2. 7075 base+0.03wt%Ti
3. 7075 base+0.06wt%Ti
4. 7075 base+0.06wt%Zr
5. 7075 base+0.06wt%Ti
+0.06wt%Zr

57
The mean grain size and the aspect ratio of primary α-Al particles of five categories of
AA7075 alloys were measured with image analysis (Clemex) and presented in the histograms of
Fig. 4.7 and Fig. 4.8. It can be seen from Fig.4.7 that as the percentage of TiB2 increases, the
grain size of primary α-Al shows a significantly decrease. And meanwhile the aspect ratio also
decreases significantly, showing excellent grain refinement and morphology improvement, as
Fig. 4.7 Mean size of primary α-Al particles in AA7075 alloys (Processing temperature: 616℃)
60
70
80
90
100
110
120
130
base alloy 0.03Ti 0.06Ti 0.06Zr 0.06Zr+0.06Ti
Pri
mar
y α
-Al p
arti
cle
siz
e /μ
m
120rpm
180rpm
210rpm
1,4
1,5
1,6
1,7
1,8
base alloy 0.03Ti 0.06Ti 0.06Zr 0.06Zr+0.06Ti
Asp
ect
rat
io
120rpm
180rpm
210rpm
Fig. 4.8 Aspect ratio of primary α-Al particles in AA7075 alloys (Processing temperature: 616℃)

58
shown in Fig.4.8. Comparing base alloy with 0.06Zr, it can be seen that the Zr doesn’t spur
obvious refinement for the grain size, and the morphology of the primary α-Al deteriorates
significantly.
AA7075 alloy with 0.06wt% TiB2
Furthermore, when the Zr is combined with Ti, the grain size of primary α-Al increases
from 85μm in only 0.06Ti alloy to more than 100μm. And relatively the aspect ratio also
Tem
per
atu
re/℃
6
20
616
6
12
Frequency /rpm
120 180 210
Fig. 4.9 Optical micrographs of SEED processed semisolid billets of AA7075 alloy modified with
0.06%TiB2 under different processing conditions

59
increases almost 10%. The results indicated that the TiB2 has positive refinement on primary α-
Al grains of AA7075 alloy and higher amount of TiB2 promote the transformation from large
dendrite or rosette to finer spherical one. However, the Zr presents negative effect on
microstructure of AA7075 alloy, especially combined with TiB2.
All these grain-refined AA7075 alloys were SEED processed under various swirling
frequencies and demolding temperatures, as described as section 4.2. And all the microstructures
were optically observed and quantitively characterized
Fig. 4.9 shows the optical micrographs of SEED processed semisolid billets of AA7075
alloy modified with 0.06%TiB2 under different processing conditions. It is clear to notice that
this SEED processed alloy mainly consists of fine globular primary α-Al grains surrounded by
eutectic liquid phase. With the refinement of 0.06%TiB2, it is hard to find large rosette-like
morphology. The grains are further finer and more globular compared to 0.03%TiB2 AA7075
84
86
88
90
100 120 140 160 180 200 220
Pri
mar
y α
-Al p
arti
cle
siz
e /μ
m
Frequency/rpm
612℃, 0.55 fs
616℃, 0.50 fs
620℃, 0.45 fs
1,52
1,53
1,54
1,55
1,56
1,57
1,58
100 120 140 160 180 200 220
Asp
ect
rat
io
Frequency/rpm
612℃, 0.55 fs
616℃, 0.50 fs
620℃, 0.45 fs
Note: an error of ±10% must be considered for graphs.
Fig. 4.10 Effect of SEED processing parameters on (a) Mean grain size and (b) Grain aspect ratio of
0.06wt%TiB2 modified AA7075 alloy
(a) (b)

60
alloy. Likewise, there is no considerable difference on the morphology of the Sudoku
micrographs. Therefore, it is confirmed again that SEED processing parameters no longer have
strong effect on the microstructures of TiB2 refined AA7075 alloy.
AA7075 alloy with 0.06wt% Zr
From the quantitative characterization shown in Fig. 4.10, it can be seen that the mean
grain size changes from 89μm at 120 rpm frequency to 85μm at 180 rpm then up to 86μm at 210
Tem
per
atu
re/℃
6
20
6
16
612
Frequency /rpm
120 180 210
Fig. 4.11 Optical micrographs of SEED processed semisolid billets of AA7075 alloy modified with
0.06wt% Zr under different processing conditions
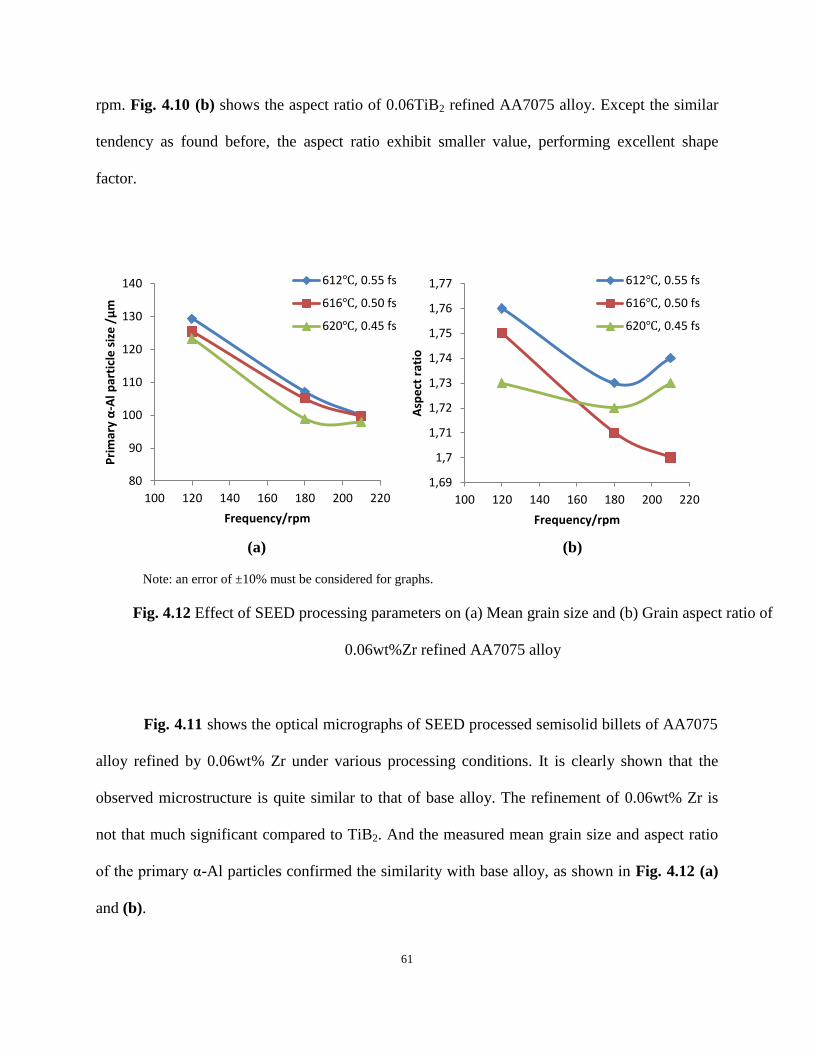
61
rpm. Fig. 4.10 (b) shows the aspect ratio of 0.06TiB2 refined AA7075 alloy. Except the similar
tendency as found before, the aspect ratio exhibit smaller value, performing excellent shape
factor.
Fig. 4.11 shows the optical micrographs of SEED processed semisolid billets of AA7075
alloy refined by 0.06wt% Zr under various processing conditions. It is clearly shown that the
observed microstructure is quite similar to that of base alloy. The refinement of 0.06wt% Zr is
not that much significant compared to TiB2. And the measured mean grain size and aspect ratio
of the primary α-Al particles confirmed the similarity with base alloy, as shown in Fig. 4.12 (a)
and (b).
80
90
100
110
120
130
140
100 120 140 160 180 200 220
Pri
mar
y α
-Al p
arti
cle
siz
e /μ
m
Frequency/rpm
612℃, 0.55 fs
616℃, 0.50 fs
620℃, 0.45 fs
1,69
1,7
1,71
1,72
1,73
1,74
1,75
1,76
1,77
100 120 140 160 180 200 220
Asp
ect
rat
io
Frequency/rpm
612℃, 0.55 fs
616℃, 0.50 fs
620℃, 0.45 fs
(a) (b)
Note: an error of ±10% must be considered for graphs.
Fig. 4.12 Effect of SEED processing parameters on (a) Mean grain size and (b) Grain aspect ratio of
0.06wt%Zr refined AA7075 alloy

62
AA7075 alloy with 0.06wt%TiB2 + 0.06wt% Zr T
emp
eratu
re/℃
6
20
6
16
612
Frequency /rpm
120 180 210
Fig. 4.13 Optical micrographs of SEED processed semisolid billets of AA7075 alloy modified with
0.06wt% Zr +0.06wt% TiB2 under different processing conditions

63
Fig. 4.13 and Fig. 4.14 give the observed microstructure and image analysis results of the
0.06wt%TiB2 + 0.06wt%Zr refined AA7075 alloy under various SEED processing conditions.
Results show that the addition of 0.06wt% Zr didn’t cause obvious change on the microstructure
from the 0.06wt%TiB2 refined alloy. Comparing the mean grain size and aspect ratio from
0.06wt%TiB2 refined alloy and 0.06wt%TiB2 + 0.06wt%Zr combined refined alloy (Fig. 4.14
and Fig. 4.10), it is interesting to find that the addition of 0.06wt%Zr increased the grain size and
aspect ratio slightly, showing a negative refinement.
80
90
100
110
120
100 120 140 160 180 200 220
Pri
mar
y α
-Al p
arti
cle
siz
e /μ
m
Frequency/rpm
612℃, 0.55 fs
616℃, 0.50 fs
620℃, 0.45 fs
1,58
1,6
1,62
1,64
1,66
1,68
1,7
100 120 140 160 180 200 220
Asp
ect
rat
io
Frequency/rpm
612℃, 0.55 fs
616℃, 0.50 fs
620℃, 0.45 fs
(a) (b)
Note: an error of ±10% must be considered for
graphs. Fig. 4.14 Effect of SEED processing parameters on (a) Mean grain size and (b) Grain aspect ratio of
0.06wt%TiB2 + 0.06wt%Zr refined AA7075 alloy

64
4.3.2 Effect of grain refiner on intermetallic phases
It is found that the typical microstructure of as-cast AA7075 alloy are mainly composed
of primary α-Al grains and three kinds of intermetallic phases along the grain boundary (shown
in Fig. 4.15 (a)). According to the SEM-EDX analysis (Table 4.2) and literatures[4-7], these
three kinds of intermetallic phase are identified as bright quaternary Mg(Zn,Cu,Al)2 phase, grey
iron rich phase Al(Fe,Mn)Si and black Mg2Si phase (Fig. 4.15).
It is noted that Zn, Mg and Cu are the main alloying elements in AA7075 alloy.
Therefore, among three intermetallic particles, the quaternary Mg(Zn,Cu,Al)2 phase has the
highest volume fraction of 4% approximately. It is generally believed that this kind of quaternary
phase is mainly derived from the binary Zn2Mg phase, in which the Zn was substituted by Cu
and Al simultaneously[4]. Under high magnification observation (Fig. 4.15 (b)), it can be seen
that the Mg(Zn,Cu,Al)2 is network-like, eutectic structure with primary α-Al. When it is
observed under relative low magnification, the whole eutectic structure attached along the grain
boundary looks like string. Mg2Si phase exhibits two morphologies at the grain boundary. When
Mg2Si is generated at the triple boundary area among three grains, it presents triangle network
morphology (Fig. 4. 15 (b)); when at the boundary of two adjacent grains, Mg2Si is found to be
string-like blocky particle or linear shape network structure. The iron rich phase Al(Fe,Mn)Si
almost has the equal volume fraction with Mg2Si, which is mostly found to be Chinese script
blocky morphology along the grain boundary. It is noted that the Al(Fe,Mn)Si phase is derived
from the typical δ-AlFeSi phase which is quite common in Al-Si alloy. During the formation of δ
phase in the solidification process, part of the Fe atoms were substituted by Mn atoms, leading to
coexistence of Fe and Mn in δ phase[7].

65
Table 4.2 SEM-EDX analysis results of AA7075 semisolid sample processed by SEED (at.%)
Element Al Zn Mg Cu Fe Si Mn
Mg(Zn,Cu,Al)2 55.11 18.77 16.59 9.52 0.00 0.00 0.00
Al(Fe,Mn)Si 77.88 0.00 0.00 0.00 14.45 4.11 3.56
Mg2Si 25.26 0.00 41.95 0.00 0.00 32.79 0.00
α-Al 93.47 3.76 2.77 0.00 0.00 0.00 0.00
a b
c d
Fig. 4.15 (a) Optical micrograph and SEM micrographs:
(b) Mg(Zn,Cu,Al)2, (c) Mg2Si, (d) Al(Fe,Mn)Si of AA7075 alloy
Mg2Si
Al(Fe,Mn)Si
Mg(Zn,Cu,Al)2
α-Al
Mg(Zn,Cu,Al)2
Mg2Si
Al(Fe,Mn)Si

66
To some extent, size and shape of the grains can be controlled by the grain refiner
through heterogeneous grain nucleation, as results proved in present project. Simultaneously, the
grain refiner can also modify the size, shape and distribution of the intermetallic phases at the
grain boundary.
Figure 4.16 shows the optical micrographs of semisolid alloys corresponding to the (a, b)
7075 base alloy, (c, d) 0.03wt%Ti addition and (e, f) 0.06wt%Ti addition. The microstructure of
the SEED processed semisolid AA7075 alloys shown in Fig. 4.16 consist of dendrite primary α-
Al particles, surrounded by three types of intermetallic structures. The black particles circled in
green line are Mg2S; the gray particles fenced in blue line are iron rich Al(Fe,Mn)Si; the bright
string-like phase enclosed in red line is Mg(Zn,Cu,Al)2.
As shown in Figure 4.16 (a) and (b), the Mg(Zn,Cu,Al)2 phase in the base alloy exhibits
a coarse string-like morphology. However, after adding 0.03wt% Ti, the Mg(Zn,Cu,Al)2 string
phase becomes shorter and narrower as shown in Fig. 4.16 (c) and (d). But the refinement and
the modification with the addition of 0.06wt% Ti is not much more obvious than that with
0.03wt% Ti addition as shown in Fig. 4.16 (e) and (f). After comparing all images in Fig. 4.16, it
is interesting to find out that, with addition of 0.06wt% Ti to the AA7075 alloy, the
Mg(Zn,Cu,Al)2 string phase become very fine, indicating that addition of 0.06wt% Ti has
effective refinement on this intermetallic phase.

67
Fig. 4.16 Optical micrographs showing effect of Ti on the intermetallic phases of
(a), (b) AA7075 base alloy; (c), (d) 0.03wt%Ti; (e), (f) 0.06wt%Ti
a b
c d
e f

68
Figure 4.16 also shows the effect of TiB2 on the formation of Mg2S and Al(Fe,Mn)Si
intermetallic phases in AA7075 semisolid alloy. These two eutectic phases have the similar
volume fraction of around 1.00%. As shown in the picture, the Mg2S phase in the unmodified
AA7075 alloy displays an aggregate grille-like morphology. Meanwhile, the iron rich phase has
a complicated Chinese script-like structure as indicated in Fig. 4.16. However, with the Ti
addition these two phases are both well refined, resulting in smaller size “grilles” and “Chinese
scripts”. At the same time, their distributions become more uniform, surrounding the primary α-
Al grains.
From the optical micrographs, it is shown that accompanied with the refined primary α-
Al grains, the addition of TiB2 leads to substantial difference in the size, morphology and
distribution of three types of intermetallic phases. To quantitatively characterize to effect of Ti
on these intermetallic phases, the string length, string width, area percentage and particle density
of three types of intermetallic were quantitively characterized by Clemex analyzer (Fig. 4.17 and
Fig. 4.18).
Figure 4.17 illustrates the string size of Mg(Zn,Cu,Al)2 phase as a function of addition of
Ti. The string length decreases from 47.1 (base alloy) to 22.3 (0.03Ti) and 14.0μm (0.06Ti), as
shown of the red bar in Fig. 4.17 (a). The string width decreases from 0.96 (base alloy) to 0.80
(0.03Ti) and 0.69μm (0.06Ti). The sharp decrease of the string length and width of
Mg(Zn,Cu,Al)2 phase obvious reveal the refinement of this intermetallic phase through Ti
addition. Results in Fig. 4.17 also indicates that the string length and width of Mg2Si and
Al(Fe,Mn)Si intermetallic compounds both decrease with the increasing addition of Ti.

69
Fig. 4.17 (a) The string length and (b) width of three types of intermetallic
in AA7075 base alloy and alloys modified with TiB2.
0,00
10,00
20,00
30,00
40,00
50,00
7075-base 7075-0.03Ti 7075-0.06Ti
Stri
ng
len
gth
/μm
String length
Mg(Zn,Cu,Al)2
Mg2Si
Al(Fe,Mn)Si
0,40
0,60
0,80
1,00
1,20
7075-base 7075-0.03Ti 7075-0.06Ti
Stri
ng
wid
th/μ
m
String width
Mg(Zn,Cu,Al)2
Mg2Si
Al(Fe,Mn)Si
(a)
(b)

70
Fig. 4.18 (a) The area percentage and (b) particle density of three types of intermetallic
of AA7075 base alloy and alloys modified with TiB2.
Fig. 4.18 shows the area percentage and the particle density of this string-like phase in
the base alloy and in the Ti-containing alloys. The area percentage of the Mg(Zn,Cu,Al)2 phase
shows a slight decrease with the increasing amount of Ti, while the area percent of Mg2Si and
Al(Fe,Mn)Si particles almost keep constant (Fig. 4.18(a)). The particle density results indicates
0,00
1,00
2,00
3,00
4,00
5,00
7075-base 7075-0.03Ti 7075-0.06Ti
Are
a p
erc
en
tage
/%
Area percentage
Mg(Zn,Cu,Al)2
Mg2Si
Al(Fe,Mn)Si
0
500
1000
1500
2000
2500
3000
7075-base 7075-0.03Ti 7075-0.06Ti
Par
ticl
e d
en
sity
/N
Particle density
Mg(Zn,Cu,Al)2
Mg2Si phase
Al(Fe,Mn)Si phase
(a)
(b)

71
that the density of Mg(Zn,Cu,Al)2 phase particles increases significantly with the addition of Ti
because of their size reduction in the refinement processing.; meanwhile, the densities of Mg2Si
and Al(Fe,Mn)Si particles also increase by the increasing addition of Ti (Fig. 4.18(b)).

72
4.4 Rheoformability and Microstructure of Semisolid AA7075 Alloys
4.4.1 Rheoformability and microstructure of semisolid AA7075 base alloy
4.4.1.1 Microstructure of deformed semisolid AA7075 base alloy
Figure 4.19 shows the microstructures of the deformed billets of the base AA7075 alloy
at different compression temperatures, as well as various solid fractions. Micrographs of the
zones at the center, middle and edge of the deformed billets are exhibited. It can be seen that the
microstructure of the deformed billet of base alloy is mainly made up of two phases, the dark
phase and the bright phase. The bright phase consists of the primary α-Al particles preferentially
solidified in dendrite-like or rosette-like grains, evenly distributed in the liquid matrix. The dark
phase is regarded as the liquid phase, constituted by several eutectic phases discussed in chapter
4.3.2. As shown in Fig. 4.19, with the implementation of compression test, it was found that the
liquid phase is forced to the exterior portion of the deformed billet, leaving the solid α-Al
particles segregated to the center part. It was also found that the liquid segregation phenomenon
looks much more obvious with lower solid fraction. This can be explained by the lower
resistance for the liquid to flow long distance at lower solid fraction. Identically, this liquid
segregation phenomenon was also observed by other researchers in semisolid field [8-10].

73
Edge Middle Center
(a) 622℃ (0.42 fs)
(b) 620℃ (0.45 fs)
(c) 618℃ (0.48 fs)

74
Edge Middle Center
(d) 616℃ (0.50 fs)
(e) 614℃ (0.53 fs)
(f) 612℃ (0.55 fs)
Fig. 4.19 Microstructure of deformed semisolid billets of AA7075 base alloy from the edge
to the center, compressed at different temperatures (solid fractions): (a) 622℃ 0.42 fs, (b)
620℃ 0.45 fs, (c) 618℃ 0.48 fs, (d) 616℃ 0.50 fs, (e) 614℃ 0.53 fs, (f) 612℃ 0.55 fs.

75
Figure 4.20 illustrates the measured liquid fraction of the quick water quenched
deformed billets right after compression test. Results show that the volume fraction of the liquid
phase at the edge part of the specimens improved due to the liquid segregation from the center to
the edge of the deformed billets. At higher compression temperature, the liquid segregation
phenomenon becomes more significant than that at lower temperature.
4.4.1.2 Height reduction curves
During the parallel plate compression test on the AA7075 base alloy, the displacement to
time curve will be obtained. This curve records the instantaneous height of semisolid sample
according to time, which has been converted into height reduction, h/h0, for analysis, where h0
and h are the initial and instantaneous heights of the billet during compression test, respectively.
15
20
25
30
35
40
Edge Midlle Center
Liq
uid
fra
ctio
n, %
Position
622℃
620℃
618℃
616℃
614℃
612℃
Fig. 4.20 Measured liquid fractions of deformed samples from edge to center at various
compression temperatures.

76
Fig. 4.21 shows the influence of different semisolid temperature, as well as various solid
fractions, on the height reduction-time curves of the unrefined AA7075 base alloy. Results show
that the height reduction rate decreases with the increasing semisolid temperature, which means
the resistance to deformation increases with the increasing solid fraction. For AA7075 base alloy,
the billets with solid fraction lower than 0.45 have the similar deformation behaviors, which the
solid particles can roll and move easily under a given constant pressure. However, the billets
with an increasing solid fraction higher than 0.45 can’t be compressed quickly and completely.
This is mostly because there are more opportunities for collisions between solid particles at a
higher solid fraction.
0
0,2
0,4
0,6
0,8
1
1,2
0 1 2 3 4 5 6
h/h
0
Time, s
622℃, 0.42 fs
620℃, 0.45 fs
618℃, 0.48 fs
616℃, 0.50 fs
Fig. 4.21 Height reduction-time curves at different temperatures (℃) of AA7075 base alloy

77
Fig. 4.22 gives the real images of the deformed semisolid billets of AA7075 base alloy. It
can be clearly seen that at 620℃ and 622℃, the deformation of the semisolid billets is quite
sufficient and complete. At 618℃, the resistance to deformation starts to increase slightly, but
the grains still can move great distances, resulting in insufficient and incomplete deformation.
When the demolding temperature is lower than 616℃ (solid fraction is higher than 0.50), the
billets preform great resistance to the deformation, mainly because there is not enough “liquid
space” for the solid particles to move and roll, they are contacting each other and cannot move
large distance in the melt. When the solid fraction reaches 0.55 (612℃), the semisolid billet
ceases the compression because a solid network of particles in the center of the billet has formed
and this network can support the weight of the dead weight applied in parallel-plate viscometer.
Obviously, semisolid billets of base alloy under 618℃ show poor rheoformability and die filling
capability. Meanwhile, the final heights of these deformed billets are equivalent or even larger
than their radius, making them unsuitable for the rheological analysis model introduced above.
612℃
614℃
616℃
618℃
620℃
622℃
Fig. 4.22 Physical images of compressed billets by parallel plate viscometer at different
temperatures of AA7075 base alloy

78
4.4.1.3 Shear rate to time curves
It is commonly admitted that shear rate has an influence on the flow behavior of the
semisolid alloys. Once the semisolid billets is under shear, the agglomeration and the de-
agglomeration phenomena of the suspended particles and the flow of the liquid matrix occur on
the micro level, while deformation happens on the macro level. The apparent viscosity of the
slurry strongly depends on the agglomeration and de-agglomeration phenomena under shear.
Therefore, to predict the viscosity of the semisolid billet, the evolution of the shear rate of slurry
under a fixed dead weight is analyzed.
0
0,5
1
1,5
2
2,5
3
3,5
4
0 0,5 1 1,5 2 2,5 3 3,5
She
ar r
ate
, 1/s
Time, s
622℃, 0.42 fs
620℃, 0.45 fs
618℃, 0.48 fs
616℃, 0.50 fs
Fig. 4.23 Shear rate-time curves at different temperatures (℃) of AA7075 base alloy
(0.25s, 3.34s-1
)
(0.38s, 1.61s-1
)
(1.46s, 0.32s-1
)

79
Fig. 4.23 shows the corresponding evolution of shear rate to time at four different solid
fractions of 0.50, 0.48, 0.45, 0.42. Results show that at a particular solid fraction, the shear rate
firstly increases with time and then it decrease to steady state condition. When the semisolid
billet is at static condition, a network among solid particles tends to be formed to make billet
self-support. Under shear, the bridge network can easily break down, and solid particles start
moving and rolling, resulting in increasing shear rate. As the deformation continuing,
agglomeration of the solid particles leads to a decreasing shear rate.
Comparing the shear rate curves of different solid fractions, it can be seen that the shear
rate jump occurs at various time and the peak value of the shear rate differs significantly. Fig.
4.23 shows that the lower the solid fraction, the sooner the shear rate jump occurs, the higher the
peak value of the shear rate. This can be explained by the particle interactions. At lower solid
fraction, solid particles are easier to move large distance in the melt. However, as the solid
fraction increases, there is great possibility to form a thick skeleton wall at the edge of the
semisolid billet. Once the upper plate drops down, the outer skeleton first reduces the movement
of plate, resulting in first decreasing of shear rate. After the crack of this skeleton, the shear rate
starts to increases first and then decrease (shear rate-time curve at fraction solid of 0.48 in Fig.
4.23). It is interesting to note that with further increasing of solid fraction to 0.50 (616℃), the
“shear rate jump” phenomenon disappears. It is slightly decreasing in a very low range (10-1
to 0)
and this processing usually last a long time. This is mainly because of the formation of solid
network at the center of the billets besides the skeleton, both causing resistance to deformation.

80
4.4.1.4 Rheology comparison
The rheology test was conducted under a certain dead weight on the rheocast semisolid
billets fabricated in previous section. Two alloys were tested under different temperatures (solid
fractions of the alloy). In this section, the AA7075 base alloy was compressed. The initial upper
plate height was set at 25.0cm constantly and the dead weight was 20.0kg. The solid fraction
varied between 0.50 and 0.42.
After the calculation of viscosity and shear rate from the recorded displacement-time data,
a typical curve of viscosity and shear rate as a function of time at the solid fraction of 0.45 is
plotted in Fig. 4.24 (a). The rapid compression of the billet is conducted in less than 1 second.
Fig. 4.24 (a) shows that the shear rate rapidly increases then decreases, with the maximum shear
rate of 1.64 s-1
obtained at 0.34 second. Accordingly, the viscosity first drops rapidly and then
increases during decreasing shear rate section. This inverse revelation between viscosity and
shear rate characterizes the shear thinning behavior, which is found by many researchers [11-14].
Plotting the viscosity data as a function of shear rate from Fig. 4.24 (a), the relationship of
viscosity and shear rate is characterized in Fig. 4.24 (b). It is found out that due to the various
shear rate changings, the curve of viscosity-shear rate presents two sections: increasing shear rate
section and decreasing shear rate section. It is found that the rate of change of viscosity is greater
during the increasing shear rate section, which indicates the kinetic of disagglomeration is more
rapid than that of agglomeration in the semisolid slurry[8].
Fig. 4.25 gives the rheological curves at the relative high solid fraction (0.48) of AA7075
base alloy. At solid fraction of 0.48, the shear rate first decreased before 0.3 second (marked Part
O in Fig. 4.25) and then followed the increasing and decreasing period as described in Fig. 4.24.
81
Accordingly, the viscosity during Part O increased rapidly. This can be explained from the crash
of the outer solidified skeleton. During the rheocasting process, the outer side of the billet
solidified quickly because of large temperature gradient at the edge of the billet, forming a thin
solid skeleton. With the falling down of the upper plate, the skeleton ceased the quick movement
of the plate and crashed suddenly, resulting in shear rate decreasing. The plotted viscosity as a
function of shear rate is shown in Fig. 4.25 (b). It is found that the viscosity-shear rate curve
presents three parts as predicted.

82
0
0,2
0,4
0,6
0,8
1
1,2
1,4
1,6
1,8
0,E+00
4,E+04
8,E+04
1,E+05
2,E+05
2,E+05
0 0,2 0,4 0,6 0,8 1
She
ar r
ate
, s-1
Vis
cosi
ty,
Pa.
s
Time, s
Shear rate
Viscsotiy
Part I Part II
Maximum
shear rate
1000
10000
100000
1000000
0,01 0,1 1 10
Vis
cosi
ty,
Pa.
s
Shear rate, s-1
Increaing
shear rate
Decreasing
shear rate Maximum
shear rate
Fig. 4.24 Typical rheology curves used to analysis: (a) Instantaneous viscosity and
shear rate as a function of time; (b) Viscosity as a function of shear rate.
(a)
(b)

83
0
0,05
0,1
0,15
0,2
0,25
0,3
0,35
0,4
0,E+00
1,E+05
2,E+05
3,E+05
4,E+05
5,E+05
6,E+05
7,E+05
0 0,5 1 1,5 2 2,5 3 3,5
She
ar r
ate
, s-1
Vis
cosi
ty,
Pa.
s
Time, s
Part I Part II
Maximum
shear rate Part O
Shear rate
Viscosity
10000
100000
1000000
0,01 0,1 1
Vis
cosi
ty,
Pa.
s
Shear rate, s-1
Part I:
Increasing
shear rate
Part II:
Decreasing
shear rate
Part O:
Crash of outer
solid skeleton
Maximum
shear rate
Fig. 4.25 Typical rheology curves used to analysis: (a) Instantaneous viscosity and
shear rate as a function of time; (b) Viscosity as a function of shear rate. Condition:
AA7075 base alloy at 618℃ (0.48 fs)
(a)
(b)

84
For a semisolid billet at an ideal solid fraction, the solid grains distribute uniformly in the
liquid phase, with thin “bridges” between particles and particles, forming a solid network make
the billet self-support. Once the compression happens, the bridges break up easily, grains can
move large distance freely through the liquid space in a short time, resulting in the increasing
shear rate part. As the compression continues, liquid phase segregates from the center to the edge
of the billets, which narrows the liquid zone between grains in the central part of the billet. At
this point the solid particles cannot move a large distance anymore because they are contacting
each other, making deformation harder and slower. But grains still can rearrange over a short
distance by rolling or sliding, resulting in the decreasing shear rate part.
1,E+03
1,E+04
1,E+05
1,E+06
1,E+07
1,E+08
1,E-04 1,E-03 1,E-02 1,E-01 1,E+00 1,E+01
Vis
cosi
ty,
Pa.
s
Shear rate, s-1
622℃, 0.42 fs
620℃, 0.45 fs
618℃, 0.48 fs
616℃, 0.50 fs
Fig. 4.26 Calculated viscosities as function of shear rate of AA7075 base alloy at
various fractions solid.

85
Fig. 4.26 shows the calculated viscosity vs shear rate at various solid fractions from 0.50
to 0.42 during the parallel-plate compression viscometer experiment. Comparing the increasing
shear rate section of solid fraction of 0.48, 0.45 and 0.42, it is found that the maximum shear rate
increases significantly with the increasing of solid fraction due to the reduction of liquid space
for free movement of solid particles. Accordingly, the viscosity at the maximum shear rate point
drops dramatically, over one order of magnitude from 0.48 fs to 0.42 fs. It is interesting to note
that with the solid fraction of 0.50, the increasing shear rate section is missing. This indicates
that for AA7075 base alloy tested under current viscometer, when the solid fraction is higher
than 0.50 there is no shear rate jump behavior happening during compression. The deformation
directly turns into quasi steady state. That means billet with 0.48 solid fraction is the maximum
solid fraction that can be rapidly compressed for base alloy under current experiments, which can
be proved from the actual view of the compressed billets in Fig. 4.22. Comparing all the
decreasing shear rate parts, it is found that at any given shear rate, the corresponding viscosity
increases with the increasing solid fraction. It can be explained that billets at higher solid fraction
has larger and more irregular grains. Besides, the liquid phase as the lubricant for grains sliding
and rolling reduces with increasing solid fraction. Both explanations above will lift the resistance
of deformation, resulting in increasing viscosity.

86
4.4.2 Rheoformability and microstructure of TiB2 modified semisolid AA7075 alloy
4.4.2.1 Microstructure of deformed semisolid AA7075 alloy modified by TiB2
Edge Middle Center
(a) 622℃ (0.42 fs)
(b) 620℃ (0.45 fs)
(c) 618℃ (0.48 fs)

87
Edge Middle Center
(d) 616℃ (0.50 fs)
(e) 614℃ (0.53 fs)
(f) 612℃ (0.55 fs)
Fig. 4.27 Microstructure of deformed semisolid billets of TiB2 modified AA7075 alloy from
the edge to the center, compressed at different temperatures (solid fractions): (a) 622℃ 0.42
fs, (b) 620℃ 0.45 fs, (c) 618℃ 0.48 fs, (d) 616℃ 0.50 fs, (e) 614℃ 0.53 fs, (f) 612℃ 0.55
fs.

88
Figure 4.27 presents the microstructure of the compressed billets from TiB2 refined
AA7075 alloy. In these optical micrographs, the bright particles are preferentially solidified
primary α-Al grains, surrounded by the dark eutectic liquid phase. It can be seen that most of the
α-Al grains developed into much finer globular particles next to each other due to the effective
grain refinement of TiB2. Micrographs obtained from three different positions of the deformed
billets show that the liquid segregation phenomenon also occurred during compression test. As
the compression was carried out on the semisolid billets, the solid particles (primary α-Al)
aggregate at the center of the billet, while the unsolidified eutectic liquid was forced toward the
edge of the billet due to the applied shear force. A close observation of the microstructure of the
edge part of the billet, it is found that some of the segregated liquid phase latterly solidified to
granule particles attached on adjacent primary particles. This secondary solidification may
happen during the compression or quench process due to temperature drop.

89
Figure 4.28 quantitatively characterizes the liquid segregation phenomenon occurred
during compression. Volume fraction of the liquid phase at edge, middle and center of the water
quenched deformed billets was measured by image analysis system. Results illustrates that the
liquid fraction at the edge part is higher than that at the middle, and then higher than center. And
billets at higher compression temperature indicate more distinct segregation.
15
20
25
30
35
40
Edge Midlle Center
Liq
uid
fra
ctio
n, %
Position
622℃
620℃
618℃
616℃
614℃
612℃
Fig. 4.28 Measured liquid fractions of deformed samples from edge to center at various
compression temperatures.

90
4.4.2.2 Height reduction curves
Fig. 4.29 shows the effect of demolding temperatures (solid fractions) on the height
reduction to time curves of TiB2 modified AA7075 alloy in semisolid state. In general, the
height reduction rate increases with the decreasing solid fraction, because there are more
collisions between the solid particles at high solid fraction, enhancing the resistance to
deformation. To be specific, these height reduction-time curves can be generally divided into
three categories, 610 ℃, 612 ℃ and 614 to 622 ℃, similar to 618, 620 and 622℃ for base alloy
respectively. At 610 ℃ (0.57 fs), the height of the semisolid billet reduces slowly, and the final
h/h0 is up to 0.4, showing great resistance to deformation because of high solid fraction. When
the billet is compressed at 612 ℃ temperature (0.55 fs), the deformation becomes easier and
faster, and the final height reduction value reaches to 0.3. The billets compressed between the
0
0,2
0,4
0,6
0,8
1
1,2
0 0,5 1 1,5 2 2,5 3
H/H
0
Time, s
610℃, 0.57 fs
612℃, 0.55 fs
614℃, 0.53 fs
618℃, 0.48 fs
622℃, 0.42 fs
Fig. 4.29 Height reduction-time curves at different temperatures (℃) of TiB2 modified
semisolid AA7075 alloy

91
temperature of 614 and 622 ℃ (solid fraction between 0.53 and 0.42) show complete
deformation behavior, contributing much wider semisolid processing window compared to
AA7075 base alloy, because of much smaller grain size.
Fig. 4.30 shows the pictures of deformed billets of TiB2 modified AA7075 alloy. It can
be seen that this grain refined alloy presents extreme better rheoformability than that of AA7075
base alloy. It is generally believed that the solid fraction, the grain size and morphology are three
main factors that affect the rheoformability of a semisolid alloy. Lower solid fraction, smaller
grain size and more globular morphology lead to excellent rheoformability. At 610℃(0.57 fs),
the billet of grain refined AA7075 alloy could be compressed to a certain extent, presenting huge
potential of deformation. With comparison, the billet of base alloy at 610 ℃ cannot be
compressed at all. Starting from 612℃ (0.55 fs), all the semisolid billets of the grain refined
alloy can be compressed completely, which starts from 620℃ (0.45 fs) for base alloy. This can
be explained in terms of effective grain refinement of TiB2. With addition of 0.03wt% TiB2, the
grains become smaller and globular, which can easily move large distance in the melt even
610℃
612℃
614℃
618℃
620℃
622℃
Fig. 4.30 Actual view of compressed billets by parallel plate viscometer at different
temperatures of TiB2 modified AA7075 alloy

92
though at high solid fraction. However, large and dendrite-like or rosette-like particles are
unable to move long distance even though at low solid fraction because particles are tend to
contact with each other.
4.4.2.3 Shear rate to time curves
The shear rate evolution during compression test of TiB2 modified semisolid AA7075
alloy was calculated and plotted into Fig. 4.31. Similar to base alloy, a positive peak appeared on
the shear rate to time curve at each particular semisolid temperature, as well as solid fraction.
The shear rate first increases to a maximum value then decreases to near zero in a short time
period, featuring classic transient state behavior in rheology analysis. The shear rate jump up and
down processing can be explained by the de-agglomeration and agglomeration happened in
micro view.
0
1
2
3
4
5
6
7
0 0,5 1 1,5 2 2,5 3
She
ar r
ate
, s
Time, s
610℃, 0.57 fs
612℃, 0.55 fs
614℃, 0.53 fs
618℃, 0.48 fs
622℃, 0.42 fs
1.50s, 0.44s-1
0.35s, 2.09s-1
0.31s, 4.18s-1
0.28s, 6.18s-1
0.25s, 6.44s-1
Fig. 4.31 Shear rate-time curves at different temperatures (℃) of TiB2 modified AA7075 alloy

93
Comparing five shear rate-time curves in Fig. 4.31, it can be found out that the solid
fraction has significant influence on the evolution of shear rate. Results show that shear rate of
the compressed semisolid billet with lower solid fraction has higher maximum value and spends
less time reaching its peek value. This is because of the particle mobility in the liquid melt. At
lower solid fraction, the solid particles possess more “liquid space” moving a large distance.
However, as the solid fraction increases, the solid particles are more likely to collide with each
other, making them difficult to move and slide easily and quickly, leading to poor
rheoformability. One point need to be mentioned is that, most of the shear rate jump processing
(from rest to near rest) finish in one second except that at 610 and 612℃ temperature.
4.4.2.4 Rheology comparison
Besides rheological analysis of base alloy, the alloy refined with 0.03wt% TiB2 was also
chosen to conduct the compression test. As usual, the typical curves of viscosity and shear rate as
a function of time and the viscosity vs shear rate curve at the solid fraction of 0.45 was plotted. It
is found that curves from TiB2 refined 7075 alloy were quite similar with that from base alloy,
shown in Fig. 4.24 in last section. The shear rate experienced rapid increasing and decreasing
process within 0.6 second. The correspond viscosity first dropped rapidly and then recovers
during the decreasing shear rate section. This inverse change between viscosity and shear rate is
evident that the fluid also behaves in shear thinning manner. The maximum shear rate obtained
in the experiment reaches 5.16 s-1
compared with 1.64 s-1
obtained for base alloy in the same test
conditions.

94
Due to the smaller and more regular α-Al grains in refined alloy, its packing solid
fraction (𝑓𝑠𝑝𝑘
) is much higher than that of base alloy, resulting in a much wider solid fraction
range that suitable for semisolid casting. The packing solid fraction proposed by A.K. Dahle et
al[15] is a maximum solid fraction that grains are unable to move large distance by any
deformation mechanisms. This index is dependent on the temperature, grain size and shape and
the alloy composition. Therefore, in present experiments the refined alloy shows effective
deformation among the solid fraction range of 0.57 to 0.42. And their calculated viscosities as
function of shear rate were plotted in Fig. 4.32. Results show that all the viscosity-shear rate
curves present increasing-shear rate and decreasing-shear rate portions. As expected, the
viscosity increases with the increasing of solid fraction in each portion. During the increasing
shear rate portion, the obtained maximum shear rate increases with the decreasing of the solid
fraction. In the shear rate decreasing section, at a given shear rate the calculated average
1,E+02
1,E+03
1,E+04
1,E+05
1,E+06
0,001 0,01 0,1 1 10
Vis
cosi
ty,
Pa.
s
Shear rate, s-1
622℃, 0.42 fs
618℃, 0.48 fs
614℃, 0.53 fs
612℃, 0.55 fs
610℃, 0.57 fs
Fig. 4.32 Calculated viscosities as function of shear rate of TiB2 modified AA7075
alloy at various fractions solid from 0.57 to 0.42.

95
viscosity increases with the increasing solid fraction. In detail, at the higher solid fraction range
(more than 0.53), from solid fraction 0.53 to 0.55 and 0.55 to 0.57 the increasing of the viscosity
is much more significant. While for the low solid fraction billets (from 0.53 to 0.42), the
viscosity to shear rate curves tend to overlap together with the decreasing of fraction solid. It is
found that those curves at low solid fraction can be well fitted into a power law equation
𝜇 = 𝑘 ∙ 𝛾−𝑚 at two periods (increasing-shear rate and decreasing-shear rate), as shown in Fig.
4.33, where 𝑘 is the constant associated with solid fraction, 𝑚 is the power index dependent on
the alloy type.
100
1000
10000
100000
0,01 0,1 1 10
Vis
cosi
ty,
Pa.
s
Shear rate, s-1
Increasing
shear rate
Decreasing
shear rate
𝜇 = 𝑘 ∙ 𝛾−𝑚
Fig. 4.33 Typical rheology curves of viscosity as a function of shear rate of refined
alloy at the fraction solid of 0.45.

96
There are two types of parameters in the simulated power law equation of refined
semisolid AA7075 alloys, which have been summarized into Table 4-3. In the table, 𝑘1 and 𝑚1
are extracted from the power law equation for the increasing-shear rate section; while, 𝑘2 and 𝑚2
are for the decreasing-shear rate section. It is believed that constant k is related to the solid
fraction of the semisolid alloy and the index m is related to the alloy type. To have a deep
understanding of these two parameters, they are plotted into curves according to the liquid
fraction, as shown in Fig. 4.34.
Table 4-3 Parameters obtained from fitted power law equations of relationship between viscosity
and shear rate under various temperature conditions
Temperature/℃ Solid fraction K1 M1 K2 M2
614 0.53 20888 2.056 1383.5 0.821
616 0.50 24573 2.095 1160.0 0.860
618 0.48 26526 2.080 1119.1 0.868
620 0.45 26742 2.057 1074.0 0.819
622 0.42 29695 2.128 723.5 0.831

97
From Fig. 4.34 (a), it can be seen that both 𝑘1 and 𝑘2 vary significant with the solid
fraction, that 𝑘1 increases continuously from 20888 to 29695 with the decreasing solid fraction
from 0.53 to 0.42; while 𝑘2 keeps decreasing from 1384 to 724 with the same reducing range of
solid fraction.
Fig. 4.34 (b) presents the power index 𝑚 to variation solid fraction. It is found that both
𝑚1 and 𝑚2 keep near constant to various solid fraction, evidencing its independence to solid
fraction. For a certain semisolid alloy, it is generally believed that the power index 𝑚 is a
constant value independent of solid fraction. Results show that, in the increasing-shear rate
section, the average 𝑚1 value is 2.08; and in the decreasing-shear rate section, the average 𝑚2
value is near 0.84.
500
700
900
1100
1300
1500
15000
19000
23000
27000
31000
0,4 0,43 0,46 0,49 0,52 0,55
k2
k1
Solid fraction
k1
k2
0
0,5
1
1,5
2
2,5
0,4 0,43 0,46 0,49 0,52 0,55
m
Solid fraction
m1
m2
Fig. 4.34 Parameters k and m in power law equation to various solid fractions
(a) (b)
Avera
ge=2.08
Averag
e=0.84

98
4.4.3 Discussion
4.4.3.1 Quantitative characterization and comparison of deformed microstructures of two
alloys
It is widely admitted that the fraction solid and the microstructure are the two main
critical factors that have an important influence on rheological behavior of a semisolid alloy. As
described before, two alloys, base and TiB2 refined alloys, show significant difference on their
rheoformability during compression. Results showed that base alloy only indicated good
rheoformability at 622 and 620℃ (0.42 and 0.45 fs), and deformation started to become
incomplete from 618℃ (0.48 fs), and temperatures below 616℃ (0.50 fs), the deformation
turned out to be impossible in present experimental conditions. However, with TiB2 refiner, the
alloy exhibited excellent rheoformability among the temperature range of 622 to 614℃ (0.42 to
0.53 fs), and compressions of the billets at 612 and 610℃ (0.55 and 0.57 fs) started to be
incomplete but still possible. It is believed that the grain refiner TiB2 has no effect on the
thermodynamic behavior of AA7075 alloy, which means base AA7075 and refined AA7075
have the same solid fraction under same compression temperature. Therefore, the considerable
difference on their rheoformability was somehow because of the difference on their deformed
microstructure.

99
Figure 4.35 presents the measured spherical diameter of the deformed microstructures of
the two alloys. The size of the solid primary α-Al particles has a great effect on rheological
behavior of the alloy in semisolid state. It is clearly shown in Fig. 4.35 that the spherical
diameter increased slightly with the decreasing compression temperature for both alloys, which
is harmful to the rheoformability. This can be explained that during solidification more time
needed to reach a lower temperature, giving grains more opportunity to grow larger. Furthermore,
with the addition of 0.03wt% TiB2, the spherical diameter of deformed grains decreases notably,
resulting in excellent rheoformability of this grain refined AA7075 alloy. Additionally, at low
temperatures (614 and 612℃), the grain refinement is much obvious, which gives reason that
60
70
80
90
100
110
120
130
612 614 618 622
Sph
eri
cal d
iam
ete
r, μ
m
Temperature, ℃
AA7075 base
AA7075 refined
Fig. 4.35 Spherical diameter of the deformed billets of two alloys under various
temperatures

100
rheoformability difference of two alloys becomes larger at low temperature. Compared with the
previous work about the as cast microstructure of these two alloys in chapter 4.2, it is found that
the grain size after deformation is slightly larger than that of as cast billets. This is mainly
because the solid particles tend to attach each other and stick together during deformation under
the applied shear force.
Apart from the grain size, the morphology of deformed microstructure of two alloys is
also characterized by aspect ratio, shown in Fig. 4.36. The shape of the grains also has a
remarkable impact on the rheological behavior of a semisolid alloy. Under same circumstance,
the globular grains are definitely easier to travel a long distance by sliding or rolling than the
grains in dendrite or rosette form. It is evidently shown in Fig. 4.36 that the aspect ratio of
1,5
1,55
1,6
1,65
1,7
1,75
612 614 618 622
Asp
ect
rat
io
Temperature, ℃
AA7075 base
AA7075 refined
Fig. 4.36 Aspect ratio of the deformed microstructures of two alloys under various temperatures

101
deformed grains in TiB2 modified alloy is smaller than that in base alloy, proving good
globularity after grain refinement. Consequently, this good globularity leads to the reduction of
apparent viscosity, resulting in excellent rheoformability through a wide temperature range.
Besides, the aspect ratio of the deformed grains decreases with the decreasing compression
temperature due to the long-term string during stock preparation by SEED processing, which
agrees with the previous results in section 4.2.
4.4.3.2 Comparison of apparent viscosity of two alloys
The addition of grain refiner TiB2 has modified the microstructure of the alloy, leading to
an important influence on the rheological behavior of the semisolid AA7075 alloys. Through the
rheology test experiments, the most critical difference between two alloys is the compressible
solid fraction range. For the base alloy, the billet only can be successfully compressed at a
narrow solid fraction range of 0.48 to 0.42; while for the refined alloy, the range expends to 0.55
to 0.42. And all the test experiments are summarized in Table 4-4.

102
Table 4-4 Rheology test experiments discussed in present work
Test Alloy Temperature/℃ Predicted
solid fraction
Maximum
shear
rate/s-1
Final billet
height/(h/h0)
Duration of
compression
1 AA7075
Base 616 0.50 0.10 0.62 67s
2 AA7075
Base 618 0.48 0.33 0.34 4.5s
3 AA7075
Base 5 620 0.45 1.64 0.30 0.98s
4 AA7075
Base 622 0.42 3.29 0.23 0.82s
5 AA7075
Refined 610 0.57 0.45 0.37 5.0s
6 AA7075
Refined 612 0.55 1.19 0.31 2.0s
7 AA7075
Refined 614 0.53 3.78 0.20 1.6s
8 AA7075
Refined 616 0.50 5.13 0.19 1.2s
9 AA7075
Refined 618 0.48 5.39 0.19 0.88s
10 AA7075
Refined 620 0.45 5.48 0.20 0.80s
11 AA7075
Refined 622 0.42 6.64 0.19 0.70s

103
Figure 4.37 compares the viscosity evolution of these two alloys, unrefined and refined
AA7075 at different compression temperatures corresponding to different solid fractions. Curves
1,E+02
1,E+03
1,E+04
1,E+05
1,E+06
0,01 0,1 1 10
Vis
cosi
ty,
Pa.
s
Shear rate, s-1
AA7075 base
AA7075 refined
1,E+02
1,E+03
1,E+04
1,E+05
1,E+06
0,01 0,1 1 10
Vis
cosi
ty,
Pa.
s
Shear rate, s-1
AA7075 base
AA7075 refined
1,E+02
1,E+03
1,E+04
1,E+05
1,E+06
0,01 0,1 1 10
Vis
cosi
ty,
Pa.
s
Shear rate, s-1
AA7075 base
AA7075 refined
1,E+02
1,E+03
1,E+04
1,E+05
1,E+06
1,E+07
1,E+08
0,0001 0,001 0,01 0,1 1 10
Vis
cosi
ty,
Pa.
s
Shear rate, s-1
AA7075 base
AA7075 refined
Fig. 4.37 Plotted viscosity to shear rate curves of base AA7075 and TiB2 refined AA7075
alloys with various solid fractions of (a) 0.42, (b) 0.45, (c) 0.48 and (d) 0.50, corresponding to
compression temperatures of 622, 620, 618℃and 616℃ respectively.
(c) 618℃, 0.48 fs
(a) 622℃, 0.42 fs (b) 620℃, 0.45 fs
(d) 616℃, 0.50 fs
104
in Fig. 4.37 show a reclining greater than symbol (>) shape curve. It is interesting to note that
most part of the reclining “> shape” curve from base alloy is “encircled” by the curve from
refined alloy. That indicates that at the same solid fraction condition, the obtained maximum
shear rate of refined alloy is always larger than that of base alloy due to the effective refinement
to the size of solid grains. And the higher of the solid fraction, the larger of the difference of
maximum shear rate between two alloys. In the increasing shear rate part, the viscosities of two
alloys are quite similar at the same given shear rate at solid fraction of 0.42 and 0.45, as shown in
Fig. 4.37 (a) and (b). This similarity tells that the viscosity is not only solid fraction and grain
size and morphology dependent. At a certain solid fraction range (relatively low), the viscosity
tends to keep similar for various solid fraction, and independent to the microstructures, only
showing the nature of the alloy. In the decreasing shear rate part, at a given shear rate, the
viscosity of refined alloy is significantly smaller than that of refined alloy at any solid fraction.
This indicated that smaller and more globular grains are easier to roll and slide over each other,
resulting in lower viscosity. This is mainly because that with the grain refinement, the interfacial
area between solid particles and liquid phase increases significantly. As a result, there is more
liquid appearing between solid particles, which acts as the lubricant, reducing the friction
between solid particles. Furthermore, it is found from Fig. 4.37 (d) that at the solid fraction of
0.50, the missing of the increasing shear rate part on the viscosity-shear rate curve of the base
alloy indicates that it cannot be rapidly compressed any more. However, at the same solid
fraction of 0.50, the refined alloy still shows similar viscosity and shear rate relationship as in
low solid fraction. Consequently, the grain refinement significantly extends the solid fraction
range of rapid compression for AA7075 alloy.

105
4.4.3.3 Comparison with literatures
Fig. 4.38 compared the apparent viscosities as a function of shear rate of both unrefined
and TiB2 refined AA7075 alloys in present work with that studied by Zoqui et al[16] using
Inconel 718 parallel plates viscometer which is quite similar to the viscometer used in present
work. In Zoqui’s test, the samples are 15mm in height and 20mm in diameter. And the
compression velocity is controlled constant at 10mm/s, while the compression force is controlled
constant in present work. From Fig. 4.38 is can be seen that there is only one shear rate period on
the curve of viscosity-shear rate by Zoqui, which is similar to the decreasing-shear rate period in
present work. It is found that the viscosity found by Zoqui is quite larger than the viscosity
1,E+02
1,E+03
1,E+04
1,E+05
1,E+06
1,E+07
1,E+08
0,01 0,1 1 10
Vis
cosi
ty,
Pa.
s
Shear rate, s-1
AA7075 by Zoqui et al.
AA7075 base
AA7075 refined
Fig. 4.38 Comparison of the relationship between viscosity and shear rate for AA7075 alloy at
solid fraction of 0.45 from this work and Zoqui et al.

106
during decreasing-shear rate period of both alloys in this work. The large difference in viscosity
observed between this work and Zoqui is mainly due to the low shear rate applied in Zoqui’s test.
Due to the low constant compression velocity in Zoqui’s work, 10mm/s, the maximum shear rate
is 3.5s-1
. Another reason may be the larger size and more irregular morphology of grains in the
alloy used by Zoqui. This difference of viscosities makes good agreement that the viscosity is not
only dependent on the temperature (solid fraction), but also dependent on the applied shear rate
as well as the size and morphology of the grain of semisolid alloys. On the other hand, it can be
seen from Fig. 4.38 that the viscosity-shear rate curve found by Zoqui can also be well fitted into
the power law equation described before.

107
1. Birol, Y., Solid fraction analysis with DSC in semi-solid metal processing. Journal of
Alloys and Compounds, 2009. 486(1–2): p. 173-177.
2. Patel, J.B., et al., Rheo-processing of an alloy specifically designed for semi-solid metal
processing based on the Al–Mg–Si system. Materials Science and Engineering: A, 2008.
476(1–2): p. 341-349.
3. D. Doutre, G.H., and P. Wales, Semi-solid Concentration Processing of Metallic Alloys.
U.S. Patent August 2002. 6(428): p. 636 B2.
4. Xie, F., et al., A study of microstructure and microsegregation of aluminum 7050 alloy.
Materials Science and Engineering: A, 2003. 355(1–2): p. 144-153.
5. Birol, Y., Heat treatment of twin-belt cast EN AW 7075 alloy. Materials Characterization,
2012. 63: p. 1-8.
6. Lemieux, A., et al., Effect of Si, Cu and Fe on mechanical properties of cast semi-solid
206 alloys. Transactions of Nonferrous Metals Society of China, 2010. 20(9): p. 1555-
1560.
7. Zhong, G., et al., Effects of ultrasonic vibration on the iron-containing intermetallic
compounds of high silicon aluminum alloy with 2% Fe. Journal of Alloys and
Compounds, 2010. 492(1–2): p. 482-487.
8. Yurko, J.A. and M.C. Flemings, Rheology and microstructure of semi-solid aluminum
alloys compressed in the drop-forge viscometer. Metallurgical and Materials Transactions
A. 33(8): p. 2737-2746.
9. Birol, Y., Thermomechanical processing of an aluminium casting alloy for thixoforming.
Journal of Alloys and Compounds, 2009. 479(1–2): p. 113-120.
10. Khosravani, A., et al., Liquid segregation behavior of semi-solid AZ91 alloy during back
extrusion test. Journal of Alloys and Compounds, 2009. 477(1–2): p. 822-827.
11. Fukui, Y., D. Nara, and N. Kumazawa, Evaluation of the Deformation Behavior of a
Semi-solid Hypereutectic Al-Si Alloy Compressed in a Drop-Forge Viscometer.
Metallurgical and Materials Transactions A, 2015. 46(5): p. 1908-1916.
12. Brabazon, D., D.J. Browne, and A.J. Carr, Experimental investigation of the transient
and steady state rheological behaviour of Al–Si alloys in the mushy state. Materials
Science and Engineering: A, 2003. 356(1–2): p. 69-80.
13. Zoqui, E.J. and M.A. Naldi, Evaluation of the thixoformability of the A332 Alloy (Al–
9.5 wt%Si–2.5 wt%Cu). Journal of Materials Science, 2011. 46(23): p. 7558-7566.
14. Blanco, A., et al., Rheological characterization of A201 aluminum alloy. Transactions of
Nonferrous Metals Society of China, 2010. 20(9): p. 1638-1642.
15. Dahle, A.K. and D.H. StJohn, Rheological behaviour of the mushy zone and its effect on
the formation of casting defects during solidification. Acta Materialia, 1998. 47(1): p. 31-
41.
16. Zoqui, E.J. and L.V. Torres, EValuation of the thixoformability of AA7004 and AA7075
alloys. Materials Research, 2010. 13: p. 305-318.

108
CHAPTER 5
CONCLUSIONS AND RECOMMENDATIONS
5.1 Conclusions
Results and discussions of present work are made up of four parts. The first part (4.1)
deals with the DSC analysis and the evolution of liquid fraction to temperature. Therefore, the
semisolid temperature window of AA7075 alloy was determined. The second part (4.2)
investigates the effect of SEED processing parameters on the microstructure of semisolid
AA7075 alloy. Both base alloy and 0.03wt% TiB2 refined alloy were studied in this part. The
third part (4.3) involves the TiB2 and Zr refinement and modification effect on the SEED
processed microstructures of AA7075 alloys. In the fourth part (4.4) the rheoformability and
microstructure of base alloy and 0.03wt% TiB2 refined alloy were investigated. The main
conclusions are drawn as below.
Part 1 DSC Analysis and Liquid Fraction
1. The liquidus and solidus temperature of AA7075 alloy are 631℃ and 490℃
respectively. The solidification temperature range is 141℃.
2. The semisolid temperature for AA7075 alloy is between 610 ℃ and 625℃. Under
610 ℃, the billets will be over solidified, resulting in poor deformation behavior;

109
while over 625℃, the billet consists of a great amount of liquid, losing self-support
ability.
Part 2 Effect of SEED Processing Parameters on the Microstructure of Semisolid
7075 Alloys
3. The SEED processing parameters have strong influence on the morphology of 7075
wrought aluminum alloy. And the optimum swirling frequency of SEED processing is
proved to be 180 rpm.
4. For base alloy, with the variation of the swirling speed, the average reduction of the
grain size and aspect ratio reach 12.9% and 6.2% respectively, the obtained minimum
grain size and aspect ratio are 106.65μm and 1.64 respectively.
5. For 0.03wt% TiB2 refined alloy, the average reduction of the grain size and aspect
ratio under various SEED processing frequencies are 6.0% and 1.0%, and the
obtained minimum grain size and aspect ratio are 93.86μm and 1.56 respectively.
6. SEED processing parameters have a strong influence on the microstructure of
AA7075 base alloy, but a slight influence on that of 0.03wt% TiB2 refined alloy.
Part 3 Effect of Grain Refiners on SEED Processed Microstructures of AA7075
Alloys
7. TiB2 shows great refinement and modification effect on the microstructure of
semisolid AA7075 alloy, both the primary α-Al particles and the intermetallic phases.
However, Zr didn’t show effective refinement on the microstructure.

110
8. TiB2 promotes the transformation of α-Al particles from large dendrite or rosette to
finer spherical ones. The addition of 0.06wt% TiB2 triggers 23.7% and 6.7%
reduction in grain size and aspect ratio of α-Al particles respectively at the optimum
SEED processing conditions compared to base alloy. The obtained minimum grain
size and aspect ratio are 84.5μm and 1.54 respectively.
9. With the addition of Zr to base alloy, the grain size decreases from about 110μm to
104μm, but the aspect ratio increases from 1.68 to 1.72. With the combination of TiB2
and Zr, both the grain size and aspect ratio of α-Al particles increase.
10. The morphology and size of three intermetallic phases were effectively modified by
the addition of TiB2. The 4.0% volume fraction of string like Mg(Zn,Cu,Al)2 becomes
much shorter and narrower, the 1.0% volume fraction of grille-like Mg2S phase and
the Chinese script-like Al(Fe,Mn)Si both turn into smaller size of grills and Chinese-
scripts.
Part 4 Rheoformability and Microstructure of Semisolid AA7075 Alloys
11. Characterization of microstructure of deformed billets indicates that the liquid
segregation from the center to the edge of the billet of both alloys happened during
the compression, and the higher of the compression temperature (higher liquid
fraction), the more significant of the liquid segregation phenomenon.
12. In the typical compression test using parallel-plate viscometer, the shear rate has a
maximum peak value, resulting in two parts of the viscosity-shear rate curve:
increasing shear rate part and decreasing shear rate part. In each part, the viscosity
decreases with increasing shear rate, indicating a shear thinning behavior.

111
Furthermore, the viscosity of both alloys increases with increasing solid fraction in
both increasing-shear rate part and decreasing-shear rate part.
13. The relationship between viscosity and shear rate in each part of the refined alloy can
be well fitted into a power law equation 𝜇 = 𝑘 ∙ 𝛾−𝑚 , showing a guidance for
simulation. In the increasing-shear rate part, the constant 𝑘1 increase with decreasing
solid fraction, and the power index𝑚 is about 2.08. In the decreasing-shear rate part,
the constant 𝑘2 decreases with decreasing solid fraction, and the power index is about
0.84.
14. The viscosity and shear rate relationship between base and refined AA7075 alloys
were compared. It indicates that the refined alloy can obtain a higher maximum shear
rate at the same solid fraction compared with base alloy. During the decreasing-shear
rate part, the viscosity of refined alloy is smaller than that of base alloy at any given
shear rate.
15. Grain refiner TiB2 reduces the grain size and modified the morphology of the grains
more globular, making grains either move larger distance easily or roll and slide over
each other easily. The refinement significantly expands the solid fraction range of
good rheoformability from 42%-48% for the base alloy to 42%-55% for the refined
alloy.
5.2 Recommendations for Future Work
1. The effect of the SEED processing parameters on microstructure is mainly focus on
these two parameters: swirling frequency and demolding temperature. The effect of

112
other parameters like the pouring temperature and holding time could be further
investigated to produce the semisolid AA7075 alloy with superior quality structure
and excellent rheoformability.
2. Study the effect of SEED processing and grain refinement on the mechanical
properties of the semisolid AA7075 alloy after high pressure die casting.
3. The minimum grain size for AA7075 alloy is 84.5μm obtained by the addition of
0.06wt% TiB2, and it is interesting to find out other grain refiners adding to the
AA7075 alloy to obtain much finer and globular α-Al particles to further lift the
rheoformability.
4. Investigation of the deformation behavior of the semisolid AA7075 alloy under
various ram speed and dead weight of the plate using parallel-plate viscometer.