Oxford Living Grammar with answers. Intermediate (student's book)

University of Oxford Intermediate Social Statistics: Lecture One
University of OxfordIntermediate Social Statistics: Lecture One
Raymond M. Duch
Nuffield College Oxfordwww.raymondduch.com
@RayDuch
January 17, 2012

University of Oxford Intermediate Social Statistics: Lecture One
Course Requirements
I Eight Lectures
I Five Classes
I Three Homework Exercises (40 percent of mark)
I Final Exam (60 percent of mark)
University of Oxford Intermediate Social Statistics: Lecture One
Course Requirements
I Eight Lectures
I Five Classes
I Three Homework Exercises (40 percent of mark)
I Final Exam (60 percent of mark)

University of Oxford Intermediate Social Statistics: Lecture One
Course Requirements
I Eight Lectures
I Five Classes
I Three Homework Exercises (40 percent of mark)
I Final Exam (60 percent of mark)

University of Oxford Intermediate Social Statistics: Lecture One
Course Requirements
I Eight Lectures
I Five Classes
I Three Homework Exercises (40 percent of mark)
I Final Exam (60 percent of mark)

University of Oxford Intermediate Social Statistics: Lecture One
Course Requirements
I Eight Lectures
I Five Classes
I Three Homework Exercises (40 percent of mark)
I Final Exam (60 percent of mark)

University of Oxford Intermediate Social Statistics: Lecture One
Course Requirements
I Eight Lectures
I Five Classes
I Three Homework Exercises (40 percent of mark)
I Final Exam (60 percent of mark)

University of Oxford Intermediate Social Statistics: Lecture One
Main Texts for the Course
I Kelstedt and Whitten The Fundamentals of PoliticalScience Research (2009)
I Long, J. Scott Regression Models for Categorical andLimited Dependent Variables (1977)
I Long, J. Scott Regression Models for CategoricalDependent Variables Using Stata (2006)
I Stata Corp. Stata Manual

University of Oxford Intermediate Social Statistics: Lecture One
Organisation of the Lectures
I Research Design and Measurement
I Binary logit and probit
I Binary Logit and Probit Models: Extensions andApplications
I Ordered Logit/Probit
I Multinomial logit/probit
I Duration Models
I Introduction to Time Series
I Introduction to Maximum Likelihood Estimation (MLE)
University of Oxford Intermediate Social Statistics: Lecture One
Organisation of the LecturesI Research Design and Measurement
I Binary logit and probit
I Binary Logit and Probit Models: Extensions andApplications
I Ordered Logit/Probit
I Multinomial logit/probit
I Duration Models
I Introduction to Time Series
I Introduction to Maximum Likelihood Estimation (MLE)

University of Oxford Intermediate Social Statistics: Lecture One
Readings for the LecturesEach lecture will have a core reading from the social scienceliterature:
I Overview: Philip Shively The Craft of Political Research(2009)
I Kelstedt and Whitten The Fundamentals of PoliticalScience Research (2009)
I Experiment no pre-measurement: Erikson and Stoker,“Caught in the Draft” APSR (2011)
I Experiment with pre-measurement: Gerber et al “SocialPressure and Voter Turnout” APSR (2008)

University of Oxford Intermediate Social Statistics: Lecture One
Today’s Lecture: Overview
I Theory
I Hypotheses and measurement
I Causality

University of Oxford Intermediate Social Statistics: Lecture One
Today’s Lecture: Overview
I Theory
I Hypotheses and measurement
I Causality

University of Oxford Intermediate Social Statistics: Lecture One
Today’s Lecture: Overview
I Theory
I Hypotheses and measurement
I Causality
University of Oxford Intermediate Social Statistics: Lecture One
Variables and causal explanations
What are the components of a causal explanation (orcausal theory)?
I What is a variable? (Hint: The opposite is a constant.)
I At least two components, an independent variable and adependent variable.
I The independent variable is the presumed cause, and thedependent variable is the presumed effect or outcome.
I A theory is a tentative conjecture about the causes ofsome phenomenon of interest.
I A hypothesis is a theory-based statement about arelationship that we expect to observe.

University of Oxford Intermediate Social Statistics: Lecture One
Variables and causal explanations
The relationship between a theory and a hypothesis
Independent variable(concept)
Independent variable(measured)
Dependent variable(concept)
Dependent variable(measured)
(Operationalization) (Operationalization)
Causal theory
Hypothesis

University of Oxford Intermediate Social Statistics: Lecture One
Rules of the road for social science research
Rules of the road for social science research
I Make your theories causal
I Don’t let data alone drive your theories
I Consider only empirical evidence
I Avoid normative statements
I Pursue both generality and parsimony

University of Oxford Intermediate Social Statistics: Lecture One
How to get struck by lightning
Where do theories come from?
I Identify interesting variation in a dependent variable
I From the specific to the general
I Learning from previous research
I The role of deductive reasoning (or “formal theory”)

University of Oxford Intermediate Social Statistics: Lecture One
Identifying interesting variation in a dependent variable
Focus on a dependent (not independent) variable
I The focus of some research is on a particular independentvariable, not dependent variable.
I Interesting variation occurs along one (or both!) of thefollowing dimensions: Time and Space
I Time-series: variation of a single unit (like a person or acountry) over time.
I Cross-section: variation across multiple units (like peopleor countries) at a single point in time.
I Example from my research – the Economic Vote

University of Oxford Intermediate Social Statistics: Lecture One
Identifying interesting variation in a dependent variable
University of Oxford Intermediate Social Statistics: Lecture One
The problem of measurement
Measurement problems in the social sciences
I Economics: Dollars, people
I Political Science: ???
I Psychology: Depression, anxiety, prejudice
University of Oxford Intermediate Social Statistics: Lecture One
The problem of measurement
Measurement problems in the social sciences
I Economics: Dollars, people
I Political Science: ???
I Psychology: Depression, anxiety, prejudice

University of Oxford Intermediate Social Statistics: Lecture One
The problem of measurement
Measurement problems in the social sciences
I Economics: Dollars, people
I Political Science: ???
I Psychology: Depression, anxiety, prejudice

University of Oxford Intermediate Social Statistics: Lecture One
The problem of measurement
Measurement problems in the social sciences
I Economics: Dollars, people
I Political Science: ???
I Psychology: Depression, anxiety, prejudice
University of Oxford Intermediate Social Statistics: Lecture One
Issues in measuring concepts of interest
The three issues of measurement
I Conceptual clarity
I Reliability
I Validity
University of Oxford Intermediate Social Statistics: Lecture One
Issues in measuring concepts of interest
The three issues of measurement
I Conceptual clarity
I Reliability
I Validity

University of Oxford Intermediate Social Statistics: Lecture One
Issues in measuring concepts of interest
The three issues of measurement
I Conceptual clarity
I Reliability
I Validity

University of Oxford Intermediate Social Statistics: Lecture One
Issues in measuring concepts of interest
The three issues of measurement
I Conceptual clarity
I Reliability
I Validity

University of Oxford Intermediate Social Statistics: Lecture One
Issues in measuring concepts of interest
Conceptual clarity
I What is the exact nature of the concept we’re trying tomeasure?
I Example: How should a survey question measure“income”?
I “What is your income?”
I ‘What is the total amount of income earned in the mostrecently completed tax year by you and any other adults inyour household, including all sources of income?”
I Example: How should a study measure “poverty”?
I Calorie consumption

University of Oxford Intermediate Social Statistics: Lecture One
Issues in measuring concepts of interest
Reliability
I An operational measure of a concept is said to be reliableto the extent that it is repeatable or consistent
I applying the same measurement rules to the same case orobservation will produce identical results
I The bathroom scale

University of Oxford Intermediate Social Statistics: Lecture One
Issues in measuring concepts of interest
Validity
I A valid measure accurately represents the concept that itis supposed to measure, while an invalid measuremeasures something other than what was originallyintended.
I Example: Measuring prejudice – IAT
I Face validity
I Content validity
I Construct validity

University of Oxford Intermediate Social Statistics: Lecture One
Examples of measurement problems
Measuring democracy
I At the conceptual level, what does it mean to say thatCountry A is “more democratic” than Country B?
I Robert Dahl: “contestation” and “participation.”
I The best-known is the Polity IV measure: annual scoresranging from -10 (strongly autocratic) to +10 (stronglydemocratic) for every country on earth from 1800 - 2004.

University of Oxford Intermediate Social Statistics: Lecture One
Examples of measurement problems
Measuring democracy, part 2
I The Polity IV measure of democracy has four components:
I Regulation of executive recruitment
I Competitiveness of executive recruitment
I Openness of executive recruitment
I Constraints on chief executive
University of Oxford Intermediate Social Statistics: Lecture One
Examples of measurement problems
Measuring democracy, part 3
I Example of expert coding scale for “regulation of executiverecruitment,”:
I +3 = regular competition between recognised groups
I +2 = transitional competition
I +1 = factional or restricted patterns of competition
I 0 = no competition
I Countries that have regular elections between groups thatare more than ethnic rivals will have higher scores.

University of Oxford Intermediate Social Statistics: Lecture One
Creating and Validating Measures
Cronbach’s Alpha: Measure of Scale Reliability
Measure of internal consistency - how closely related a set ofitems are as a group
is a function of the number of test item (N ), the averagecovariance among the items (c̄), and the average variance of allitems (v̄)
α =N ∗ c̄
v̄ + (N − 1) ∗ c̄(1)

University of Oxford Intermediate Social Statistics: Lecture One
Creating and Validating Measures
Some Stata Code
clearcd "/Users/raymondduch/Dropbox/IS_2011/Data_sets/"
use "/Users/raymondduch/Dropbox/IS_2011/Data_sets/ESS_measurement_class1.dta"keep cntry trstprl trstlgl trstplc trstplt trstprt trstep trstun weight
****TRUST IN THE POLITICAL SYSEM
*two factor example
global trust trstprl trstlgl trstplc trstplt trstprt trstep trstundes $trust // 0-10 scale
pwcorr $trust [aw=weight], sig
alpha $trust , item

University of Oxford Intermediate Social Statistics: Lecture One
Creating and Validating Measures
Reliability of Trust in Political System Scale
. ****TRUST IN THE POLITICAL SYSEM
. *two factor example
.
. global trust trstprl trstlgl trstplc trstplt trstprt trstep trstun
. des $trust // 0-10 scale
storage display valuevariable name type format label variable label-----------------------------------------------------------------------------------------------------------------------------------------------------------------------------------------------------------trstprl byte %8.0g LABC Trust in country’s parliamenttrstlgl byte %8.0g LABC Trust in the legal systemtrstplc byte %8.0g LABC Trust in the policetrstplt byte %8.0g LABC Trust in politicianstrstprt byte %8.0g LABC Trust in political partiestrstep byte %8.0g LABC Trust in the European Parliamenttrstun byte %8.0g LABC Trust in the United Nations

University of Oxford Intermediate Social Statistics: Lecture One
Creating and Validating Measures
Item Correlations.. pwcorr $trust [aw=weight], sig
| trstprl trstlgl trstplc trstplt trstprt trstep trstun-------------+---------------------------------------------------------------
trstprl | 1.0000||
trstlgl | 0.6667 1.0000| 0.0000|
trstplc | 0.5463 0.7039 1.0000| 0.0000 0.0000|
trstplt | 0.6628 0.5449 0.4744 1.0000| 0.0000 0.0000 0.0000|
trstprt | 0.6299 0.5195 0.4343 0.8498 1.0000| 0.0000 0.0000 0.0000 0.0000|
trstep | 0.4695 0.4055 0.3289 0.5217 0.5344 1.0000| 0.0000 0.0000 0.0000 0.0000 0.0000|
trstun | 0.4133 0.3960 0.3767 0.4795 0.4809 0.7513 1.0000| 0.0000 0.0000 0.0000 0.0000 0.0000 0.0000|
University of Oxford Intermediate Social Statistics: Lecture One
Creating and Validating Measures
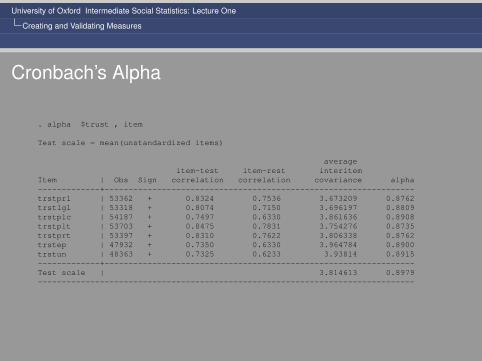
Cronbach’s Alpha
. alpha $trust , item
Test scale = mean(unstandardized items)
averageitem-test item-rest interitem
Item | Obs Sign correlation correlation covariance alpha-------------+-----------------------------------------------------------------trstprl | 53362 + 0.8324 0.7536 3.673209 0.8762trstlgl | 53318 + 0.8074 0.7150 3.696197 0.8809trstplc | 54187 + 0.7497 0.6330 3.861636 0.8908trstplt | 53703 + 0.8475 0.7831 3.754276 0.8735trstprt | 53397 + 0.8310 0.7622 3.806338 0.8762trstep | 47932 + 0.7350 0.6330 3.964784 0.8900trstun | 48363 + 0.7325 0.6233 3.93814 0.8915-------------+-----------------------------------------------------------------Test scale | 3.814613 0.8979-------------------------------------------------------------------------------

University of Oxford Intermediate Social Statistics: Lecture One
Creating and Validating Measures
Factor Analysis: Why?
I Measurement: Confirmatory Factor Analysis
I Example: Left-Right Political Attitudes (based on policystatements)
I Compression of Information: Exploratory Factor Analysis
I Example: Voting Patterns in Legislatures

University of Oxford Intermediate Social Statistics: Lecture One
Creating and Validating Measures
Factor Analysis
Estimate underlying latent variables – or scales
Determine the dimensionality of these underlying latentvariables
Recover measures of these underlying latent variables

University of Oxford Intermediate Social Statistics: Lecture One
Creating and Validating Measures
Factor Analysis
Estimate underlying latent variables – or scales
Determine the dimensionality of these underlying latentvariables
Recover measures of these underlying latent variables

University of Oxford Intermediate Social Statistics: Lecture One
Creating and Validating Measures
Factor Analysis
Estimate underlying latent variables – or scales
Determine the dimensionality of these underlying latentvariables
Recover measures of these underlying latent variables

University of Oxford Intermediate Social Statistics: Lecture One
Creating and Validating Measures

University of Oxford Intermediate Social Statistics: Lecture One
Creating and Validating Measures

University of Oxford Intermediate Social Statistics: Lecture One
Creating and Validating Measures
Factor Loadings on the Unobserved Factors
Consider a survey with i respondents who answer j surveyquestions
Factor analysis posits that xij is a combination of p unobservedfactors, each written using the Greek letter ξ
xij = λj1ξi1 + λj2ξi2 + ...+ λjpξip + δij (2)
λ are factor loadings
δij is measurement error

University of Oxford Intermediate Social Statistics: Lecture One
Creating and Validating Measures
Factor Scores
I Often it is important to estimate the value of the latentvariable for each observation in the data (individual forexample)
I The predicted value of the latent variable is the “factorscore”
I Factor scores can be predicted by the conditional means ofthe latent variable, given the observed variables

University of Oxford Intermediate Social Statistics: Lecture One
Creating and Validating Measures
Some More Stata Code
clearcd "/Users/raymondduch/Dropbox/IS_2011/Data_sets/"
use "/Users/raymondduch/Dropbox/IS_2011/Data_sets/ESS_measurement_class1.dta"
factor $trust [aw=weight], pcfrotate // varimax to produce orthogonal factorspredict trust1 trust2pwcorr trust1 trust2 [aw=weight], sig // no correlation
*trust in EP and UN have much higher scores on factor 2

University of Oxford Intermediate Social Statistics: Lecture One
Creating and Validating Measures
Factor Analysis of Trust in Political System Items
. factor $trust [aw=weight], pcf(sum of wgt is 4.6914e+04)(obs=45155)
Factor analysis/correlation Number of obs = 45155Method: principal-component factors Retained factors = 2Rotation: (unrotated) Number of params = 13
--------------------------------------------------------------------------Factor | Eigenvalue Difference Proportion Cumulative
-------------+------------------------------------------------------------Factor1 | 4.24868 3.24066 0.6070 0.6070Factor2 | 1.00803 0.28532 0.1440 0.7510Factor3 | 0.72270 0.34281 0.1032 0.8542Factor4 | 0.37989 0.11811 0.0543 0.9085Factor5 | 0.26178 0.02687 0.0374 0.9459Factor6 | 0.23491 0.09090 0.0336 0.9794Factor7 | 0.14401 . 0.0206 1.0000
--------------------------------------------------------------------------LR test: independent vs. saturated: chi2(21) = 2.1e+05 Prob>chi2 = 0.0000

University of Oxford Intermediate Social Statistics: Lecture One
Creating and Validating Measures
Factor Loadings
Factor loadings (pattern matrix) and unique variances
-------------------------------------------------Variable | Factor1 Factor2 | Uniqueness
-------------+--------------------+--------------trstprl | 0.8182 -0.2303 | 0.2776trstlgl | 0.7828 -0.4055 | 0.2228trstplc | 0.7112 -0.4431 | 0.2979trstplt | 0.8516 -0.0036 | 0.2748trstprt | 0.8350 0.0480 | 0.3005trstep | 0.7323 0.5475 | 0.1639trstun | 0.7085 0.5406 | 0.2058
-------------------------------------------------

University of Oxford Intermediate Social Statistics: Lecture One
Creating and Validating Measures
Factor Scores
. predict trust1 trust2(regression scoring assumed)
Scoring coefficients (method = regression; based on varimax rotated factors)
----------------------------------Variable | Factor1 Factor2
-------------+--------------------trstprl | 0.29475 -0.04882trstlgl | 0.40122 -0.18648trstplc | 0.41261 -0.22581trstplt | 0.15483 0.12735trstprt | 0.11863 0.16375trstep | -0.22131 0.52508trstun | -0.22114 0.51622
----------------------------------

University of Oxford Intermediate Social Statistics: Lecture One
Causality
The focus on causality
I Recall that the goal of political science (and all science) isto evaluate causal theories.
I Bear in mind that establishing causal relationshipsbetween variables is not at all akin to hunting for DNAevidence like some episode from a television crime drama.
I Social reality does not lend itself to such simple,cut-and-dried answers.
I Is there a “best practice” for trying to establish whether Xcauses Y ?

University of Oxford Intermediate Social Statistics: Lecture One
Causality
The four causal hurdles
I Is there a credible causal mechanism that connects X toY ?
I Is there covariation between X and Y ?
I Could Y cause X?
I Is there some confounding variable Z that is related toboth X and Y , and makes the observed associationbetween X and Y spurious?

University of Oxford Intermediate Social Statistics: Lecture One
Causality
But what if we don’t cross that fourth hurdle?
I Damning critique: you “failed to control for” somepotentially important cause of the dependent variable.
I So long as a credible case can be made that someuncontrolled-for Z might be related to both X and Y , wecannot conclude with full confidence that X indeed causesY
I Since the main goal of science is to establish whethercausal connections between variables exist, then failing tocontrol for other causes of Y is a potentially seriousproblem.
I Statistical analysis should not be disconnected from issuesof theory (model) and research design.

University of Oxford Intermediate Social Statistics: Lecture One
Causality
But what if we don’t cross that fourth hurdle?I Damning critique: you “failed to control for” some
potentially important cause of the dependent variable.
I So long as a credible case can be made that someuncontrolled-for Z might be related to both X and Y , wecannot conclude with full confidence that X indeed causesY
I Since the main goal of science is to establish whethercausal connections between variables exist, then failing tocontrol for other causes of Y is a potentially seriousproblem.
I Statistical analysis should not be disconnected from issuesof theory (model) and research design.

University of Oxford Intermediate Social Statistics: Lecture One
Causality
Properly addressing the fourth hurdle
I Your model should specifically incorporate counterfactuals
I Your research design should explicitly addresscounterfactual explanations for variation in dependentvariable
I Lets explore three generic strategies

University of Oxford Intermediate Social Statistics: Lecture One
Causality
The Natural Experiment
I measure the dependent variable (Y ) for a specificpopulation before it is exposed to the independent variable(X)
I wait until some among the population have been exposedto the independent variable (X)
I measure the dependent variable (Y ) again
I if between measurings the group that was exposed (calledthe test group) has changed relative to the control group,ascribe this to the effect of the independent variable (X) onthe dependent variable (Y )

University of Oxford Intermediate Social Statistics: Lecture One
Causality
The Natural Experiment without Pre-measurement
I measure the dependent variable (Y ) for subjects, some ofwhom have been exposed to the independent variable (thetest group) and some of whom have not (the control group)
I if the dependent variable differs between the groups,ascribe this to the effect of the independent variable
University of Oxford Intermediate Social Statistics: Lecture One
Causality
The True Experiment
I assign at random some subjects to the test group andsome to the control group
I measure the dependent variable for both groups
I administer the independent variable to the test group
I measure the dependent variable again for both groups
I if test group change is different than control group changeascribe this difference to the independent variable (X)

University of Oxford Intermediate Social Statistics: Lecture One
Causality
Table: Some Research Designs
Type Graphic RepresentationObservation with no control group Test group: M * M
Natural experiment no pre-measurement Test group: * M
Control: M
Natural experiment Test group: * M
Control: M
True experiment Test group: R M * M
Control: RM M