University of Malayastudentsrepo.um.edu.my/10061/8/afiq.pdf · neural network-based muscle torque...
97
NEURAL NETWORK-BASED MUSCLE TORQUE PREDICTION USING MECHANOMYOGRAPHY DURING ELECTRICALLY-EVOKED KNEE EXTENSION AND STANDING IN SPINAL CORD INJURED PATIENTS MUHAMMAD AFIQ BIN DZULKIFLI FACULTY OF ENGINEERING UNIVERSITY OF MALAYA KUALA LUMPUR 2019 University of Malaya
Transcript of University of Malayastudentsrepo.um.edu.my/10061/8/afiq.pdf · neural network-based muscle torque...

NEURAL NETWORK-BASED MUSCLE TORQUE
PREDICTION USING MECHANOMYOGRAPHY DURING
ELECTRICALLY-EVOKED KNEE EXTENSION AND
STANDING IN SPINAL CORD INJURED PATIENTS
MUHAMMAD AFIQ BIN DZULKIFLI
FACULTY OF ENGINEERING
UNIVERSITY OF MALAYA KUALA LUMPUR
2019
Univers
ity of
Mala
ya

NEURAL NETWORK-BASED MUSCLE TORQUE
PREDICTION USING MECHANOMYOGRAPHY
DURING ELECTRICALLY-EVOKED KNEE EXTENSION
AND STANDING IN SPINAL CORD INJURED PATIENTS
MUHAMMAD AFIQ BIN DZULKIFLI
DISSERTATION SUBMITTED IN FULFILMENT OF
THE REQUIREMENTS FOR THE DEGREE OF MASTER
OF ENGINEERING SCIENCE
FACULTY OF ENGINEERING
UNIVERSITY OF MALAYA
KUALA LUMPUR
2019
Univers
ity of
Mala
ya

ii
UNIVERSITY OF MALAYA
ORIGINAL LITERARY WORK DECLARATION
Name of Candidate: Muhammad Afiq Bin Dzulkifli
Matric No: KGA150083
Name of Degree: Master of Engineering Science
Title of Dissertation: Neural Network-Based Muscle Torque Prediction Using
Mechanomyography During Electrically-Evoked Knee Extension and Standing in
Spinal Cord Injured Patients
Field of Study: Biomedical Engineering
I do solemnly and sincerely declare that:
(1) I am the sole author/writer of this Work;
(2) This Work is original;
(3) Any use of any work in which copyright exists was done by way of fair dealing
and for permitted purposes and any excerpt or extract from, or reference to or
reproduction of any copyright work has been disclosed expressly and
sufficiently and the title of the Work and its authorship have been
acknowledged in this Work;
(4) I do not have any actual knowledge nor do I ought reasonably to know that the
making of this work constitutes an infringement of any copyright work;
(5) I hereby assign all and every rights in the copyright to this Work to the
University of Malaya (“UM”), who henceforth shall be owner of the copyright
in this Work and that any reproduction or use in any form or by any means
whatsoever is prohibited without the written consent of UM having been first
had and obtained;
(6) I am fully aware that if in the course of making this Work I have infringed any
copyright whether intentionally or otherwise, I may be subject to legal action
or any other action as may be determined by UM.
Candidate’s Signature Date:
Subscribed and solemnly declared before,
Witness’s Signature Date:
Name:
Designation:
Univers
ity of
Mala
ya
iii
NEURAL NETWORK-BASED MUSCLE TORQUE PREDICTION USING
MECHANOMYOGRAPHY DURING ELECTRICALLY-EVOKED KNEE
EXTENSION AND STANDING IN SPINAL CORD INJURED PATIENTS
ABSTRACT
This study sought to design and deploy a torque monitoring system using an artificial
neural network (ANN) with mechanomyography (MMG) for situations where torque
cannot be independently quantified. The MMG signals from the quadriceps were
used to derive muscle torques during prolonged functional electrical stimulation (FES)
assisted isometric knee extension contractions and during standing in spinal cord injured
(SCI) individuals. Three individuals with motor-complete SCI performed FES-evoked
isometric quadriceps contractions on a Biodex dynamometer at 30⁰ knee angle and
100mA stimulation current until the torque declined to a minimum required for ANN
model development. Two ANN models were developed based on two different inputs;
RMS and RMS-ZC. The performance of the ANN was evaluated by comparing its
predicted torque against the actual torque derived from the dynamometer. MMG data
from 5 other individuals with SCI who performed FES-evoked standing to fatigue
(i.e. until the knee angle reached 30⁰ flexion), were used to test the RMS and RMS-ZC
ANN. RMS and RMS-ZC obtained from the FES standing experiments were then
provided as inputs to the developed ANN models to determine the predicted torque during
the FES-evoked standing. The average correlation between the knee extension predicted
torque and the actual torque outputs were 0.87±0.11 for RMS and 0.84± 0.13 for RMS-
ZC. The average accuracies for predicting 50% torque drop for both models were 79±14%
for RMS and 86±11% for RMS-ZC. The two models revealed significant trends in torque
decrease, both suggesting a critical point at 50% torque drop where there were significant
changes observed in RMS and ZC trends. Based on these findings, it can be concluded
Univers
ity of
Mala
ya

iv
that both RMS and RMS-ZC models performed similarly well in predicting knee
extension torque in this population. However, interference was observed in the ZC
values towards the end of the knee buckling. The developed ANN model could be used
to predict muscle torque in real-time thereby providing possibly safer automated FES
control of standing in persons with motor-complete SCI.
Keywords: functional electrical stimulation, mechanomyography, neural network,
spinal cord injuries, torque prediction
Univers
ity of
Mala
ya
v
RAMALAN TORK OTOT BERDASARKAN RANGKAIAN NEURAL
MENGGUNAKAN MEKANOMYOGRAFI SEMASA MENGUCUPAN
EXTENSI LUTUT DAN BERDIRI ANTARA PESAKIT TUNJANG SARAF
ABSTRAK
Penyelidikan ini adalah untuk mereka dan mengunakan sistem pengawasan tork yang
berfungsi dengan rangkaian saraf tiruan (ANN) dengan mekanomyografi (MMG) dalam
situasi di mana tork tidak dapat diukur secara bebas. Isyarat MMG dari quadriceps telah
digunakan untuk memperoleh tork otot semasa kuncupan extensi lutut isometri dibantu
oleh stimulasi electrikal fungsian (FES) di kalangan individu yang mengalami kecederaan
tunjang saraf (SCI). Tiga individu dengan kecederaan motor penuh kecederaan tunjang
saraf telah melakukan kuncupan quadriceps isometri di atas dinamoter Biodex pada sudut
lutut 30⁰ dan simulasi arus 100 mA sehingga tork menurun ke kadar minima yang
diperlukan untuk membangunkan model ANN. Dua model ANN telah dibangunkan
berdasarkan dua input berbeza; RMS dan RMS-ZC. Keberkesanan ANN telah dilakukan
dengan cara membandingkan tork yang diramalkan dengan tork sebenar dari
dinamometer. Data MMG dari lima individu lain dengan kecederaan tunjang saraf yang
melakukan aktiviti berdiri sehingga letih dengan bantuan FES ( sehingga sudut lutut
melepasi 30⁰), telah digunakan untuk menguji model RMS dan RMS-ZC ANN. RMS dan
RMS-ZC yang diperoleh dari ujikaji berdiri dengan FES telah digunakan sebagai input
untuk model ANN yang telah dibangunkan untuk mengenalpasti ramalan tork semasa
aktiviti berdiri dengan bantuan FES. Purata korelasi antara ramalan tork extensi lutut
dengan pengeluaran tork sebenar adalah model 0.87±0.11 untuk RMS dan 0.84± 0.13
untuk model RMS-ZC. Kedua-dua model menunjukkan haluan bermakna semasa
penurunan tork, kedua-dua model mencadangkan penurunan tork 50% dari maksima
sebagai titik kritikal di mana perubahan ketara dapat dilihat dicorak RMS dan ZC.
Berdasarkan penemuan ini, kedua-dua model RMS dan model RMS-ZC dapat
Univers
ity of
Mala
ya

vi
disimpulkan untuk meramalkan tork dari extensi lutut dengan perlaksaan yang sama.
Namun, gangguan dapat dilihat dari data ZC di penghujung semasa lengkokan lutut.
Model ANN yang dibangunkan dapat digunakan untuk meramalkan tork otot semasa,
mungkin akan dapat memberikan kawalan FES automatik yang lebih selamat semasa
aktiviti berdiri dengan individu kecederaan tunjang saraf.
Kata kunci: simulasi elektrik gunaan, mekanomyografi, rangkaian neural, kecederaan
saraf tunjang, ramalan tork
Univers
ity of
Mala
ya

vii
ACKNOWLEDGEMENTS
A very special appreciation to my supervisor, Dr. Nur Azah Hamzaid for without her
unwavering support and guidance, the completion of the thesis would not be possible. I
would like to thank the Department of Biomedical Engineering University Malaya for
assisting my study by providing facilities and the opportunity to complete my study and
dissertation.
Special thanks to Prof. Glen M Davis, Prof. Nazirah Hasnan and Dr. Morufu Ibitoye
for their opinions, knowledge, support, and guidance throughout my study.
I also would like to express gratitude to my fellow colleagues and research teammates
especially to Miss Nurul Salwani, Mrs. Puteri Nur Farhana, Mr. Faiz, Mr. Naeem, Miss
Fatin, Miss Musfirah, Miss Yanthi, Miss Jena, Miss Mira, Mr Yong, Miss Afiqah and the
physiotherapists team that assisted me during my data collection, Mr Hakim, Mr Hazim,
and Mr. Syuaib as well as the test subjects. Not to forget, my family members, Mr.
Dzulkifli Abdul Latif, Madam Zalina Zakaria, Mr. Danial, Miss Sabrina, Miss Adriana
and Miss Adila as well as my friends especially Miss Priscilla, Miss Shannon, Miss
Fatimah, Mr. Nicholas and Mr. Benson for their huge support for me to finish this study.
Thank you all.
This project was supported by the Ministry of Higher Education, Malaysia through
HIR Grant no. UM.C/HIR/MOHE/ENG/39 and the University of Malaya research grant
UMRG Grant no. RP035A-15HTM.
Univers
ity of
Mala
ya

viii
TABLE OF CONTENTS
Abstract ............................................................................................................................ iii
Abstrak .............................................................................................................................. v
Acknowledgements ......................................................................................................... vii
Table of Contents ........................................................................................................... viii
List of Figures ................................................................................................................. xii
List of Tables.................................................................................................................. xiii
List of Symbols and Abbreviations ................................................................................ xiv
List of Appendices .......................................................................................................... xv
CHAPTER 1: INTRODUCTION .................................................................................. 1
1.1 Background Study ................................................................................................... 1
1.2 The Motivation of The Study .................................................................................. 6
1.3 Problem Statements ................................................................................................. 6
1.4 Objectives of the study ............................................................................................ 8
1.5 Hypotheses of the study ........................................................................................... 8
1.6 Aim of the study ...................................................................................................... 8
1.7 Scope of study.......................................................................................................... 9
1.8 Organization of the Thesis ..................................................................................... 10
CHAPTER 2: LITERATURE REVIEW .................................................................... 11
2.1 Functional Electrical Stimulation .......................................................................... 11
2.1.1 FES waveform .......................................................................................... 11
2.2 Muscle Fatigue....................................................................................................... 13
2.3 Mechanomyogram ................................................................................................. 15
2.3.1 Muscle sound ............................................................................................ 15
Univers
ity of
Mala
ya

ix
2.3.2 Properties of MMG .................................................................................. 16
2.3.3 Applications of MMG .............................................................................. 16
2.3.4 MMG Parameters ..................................................................................... 19
2.4 Experimental Setup Considerations ....................................................................... 23
2.4.1 Sensors placement .................................................................................... 23
2.4.2 Training settings ....................................................................................... 25
2.5 Signal Processing ................................................................................................... 26
2.6 MMG muscle fatigue monitoring system .............................................................. 27
2.6.1 Support Vector Regression (SVR) ........................................................... 28
2.6.2 Continuous Wavelet Transform algorithm (CWT) .................................. 31
2.6.3 Fuzzy Logic .............................................................................................. 32
2.6.4 Artificial Neural Network ........................................................................ 34
2.7 Summary ................................................................................................................ 37
CHAPTER 3: METHODOLOGY ............................................................................... 39
3.1 Participants ............................................................................................................ 40
3.2 Medical Ethics ....................................................................................................... 40
3.3 Phase 1: Knee Extension Training data collection ................................................ 40
3.3.1 Equipment & Materials ............................................................................ 41
3.3.2 FES evoked muscle contractions and knee torque measurement ............. 41
3.3.3 Data Collection Procedure ........................................................................ 42
3.3.4 MMG acquisition and processing ............................................................. 43
3.4 Phase 2: Neural Network development ................................................................. 45
3.4.1 Training data processing and neural network development ..................... 45
3.4.2 Neural network accuracy test ................................................................... 47
Univers
ity of
Mala
ya

x
3.5 Phase 3: testing the neural network model during a standing experiment with FES
48
3.5.1 Standing protocol ..................................................................................... 48
3.5.2 Equipment and Materials .......................................................................... 48
3.5.3 Experimental Procedure ........................................................................... 49
3.5.4 Data Processing ........................................................................................ 49
3.6 Summary ................................................................................................................ 51
CHAPTER 4: RESULTS .............................................................................................. 52
4.1 MMG Data Processing .......................................................................................... 52
4.2 Neural Network Training ....................................................................................... 54
4.3 Model Output of Torque ........................................................................................ 56
4.4 Torque and predicted torque from isometric contraction testing ........................... 56
4.5 Testing the ANN model in FES standing protocol to predict torque .................... 57
4.6 ANN Torque Monitoring in Standing Protocol. .................................................... 58
4.7 Summary ................................................................................................................ 61
CHAPTER 5: DISCUSSION ....................................................................................... 62
5.1 MMG relationship to torque and fatigue ............................................................... 62
5.1.1 MMG-RMS to fatigue .............................................................................. 62
5.1.2 MMG-ZC to fatigue ................................................................................. 63
5.2 Test for hypotheses ................................................................................................ 63
5.2.1 Initial Predicted torque against final predicted torque ............................. 63
5.2.2 Changes to MMG-RMS and RMS-ZC Signals at Lower Torque Output 64
5.2.3 Gradient Pattern of Predicted Torque ....................................................... 64
5.3 ANN Models in Predicting Torque ....................................................................... 65
Univers
ity of
Mala
ya

xi
5.4 Limitation to Study ................................................................................................ 67
5.5 Summary ................................................................................................................ 68
CHAPTER 6: CONCLUSION ..................................................................................... 69
6.1 Recommendations for future work ........................................................................ 70
References ....................................................................................................................... 71
List of Publications and Papers Presented ...................................................................... 80
Appendix ......................................................................................................................... 82
Univers
ity of
Mala
ya
xii
LIST OF FIGURES
Figure 2.1 Stimulation waveform pattern (A is DC, B is AC and C is pulse-shaped
stimulation) (Agnello, 2011) ........................................................................................... 12
Figure 2.2 Pulse shape stimulation waveforms (Agnello, 2011) .................................... 13
Figure 2.3 Experimental setup schematic (Ibitoye, Hamzaid, & Abdul Wahab, 2016) . 24
Figure 2.4 Flowchart of obtaining Optimal SVR Parameters (Ibitoye et al., 2016) ....... 30
Figure 2.5 Components of event detection (Staude & Wolf, 1999) ............................... 31
Figure 2.6 Fuzzy Logic Classification for Goniometer (Al-Mulla & Sepulveda, 2010) 33
Figure 2.7 Schematics of the feed-forward neural network (Sibanda & Pretorius, 2012)
......................................................................................................................................... 36
Figure 3.1 FES electrodes and MMG sensor placement on the quadriceps muscle ....... 42
Figure 3.2 Standing Experiment (A) at the beginning of the experiment the legs were
straight due to FES stimulation. (B) The knee approaching 30º flexion. ....................... 49
Figure 4.1 Raw MMG Data for Subject 1 Day 1 Left Trial 1 ......................................... 52
Figure 4.2 Normalized MMG-RMS and Normalized MMG-ZC against time used to be as
training data for ANN development from Subject 4 Session 1, Left leg trial 1. ............. 53
Figure 4.3 Training Results for ANN traning Model 1 (RMS)....................................... 54
Figure 4.4 Training Results for ANN traning Model 2 (RMS + ZC) ............................. 55
Figure 4.5 Normalized torque measurement from Biodex dynamometer and the predicted
torque from two ANN models from Subject 4 Session 1, Left leg trial 1....................... 56
Figure 4.6 Normalized predicted torque for a standing protocol for Subject 5 Trial 1 ... 58
Figure 5.1 Biomechanics of Standing. Left: non-fatigued, quiet standing motion. Small
knee extension moment. Right: fatigued, 30º knee angle bend. Large knee flexion moment
due to gravity................................................................................................................... 66
Figure 5.2 Graph of MMG RMS against Knee Bend Angle during FES Standing in SCI
subject 4 (Mohd Rasid, 2017) ......................................................................................... 67
Univers
ity of
Mala
ya
xiii
LIST OF TABLES
Table 2.1 Summary of Parameters and the relationship with increasing muscle fatigue.
......................................................................................................................................... 22
Table 2.2 Optimal Parameters for SVM Regression Model (Ibitoye et al., 2016) ......... 29
Table 2.3 Fuzzy Logic Rules (Al-Mulla & Sepulveda, 2010) ........................................ 34
Table 3.1 Subject distribution for ANN design and standing procedure ........................ 40
Table 4.1 Average correlation (R) and accuracy test for two type of ANN models to
predict torque during FES isometric knee extension ...................................................... 57
Table 4.2 T-test significance values for time to reach 30%,50% and 70% of MMG-RMS
drop compared to the time to 30-degree knee buckle. .................................................... 57
Table 4.3 Summary of the t-test done for time to reach a critical point (RMS and RMS-
ZC) and the predicted torque at a critical point (RMS and RMS-ZC) ............................ 59
Table 4.4 Summary of t-test statistical analysis for standing protocol from devised
hypotheses ....................................................................................................................... 60
Univers
ity of
Mala
ya

xiv
LIST OF SYMBOLS AND ABBREVIATIONS
ANN : Artificial Neural Network
ARV : Average rectified value
CWT : Continuous Wavelet Transform
EMG : Electromyography
FES : Functional Electrical Stimulation
FFT : Fast Fourier Transform
ISNCSCI : International Standards for Neurological Classification for Spinal Cord Injury
MC : Maximum Contraction
MF : Mean Frequency
MLP : Multilayer Perceptron
MMG : Mechanomyography
MPF : Mean Power Frequency
PTP : Peak to peak
RMS : Root mean square
SCI : Spinal Cord Injured
SLP : Single layer Perceptron
SNR : Signal to Noise Ration
SVR : Support Vector Regression
ZC : Zero Crossing
Univers
ity of
Mala
ya

xv
LIST OF APPENDICES
Appendix A: Consent Form (Malay) .............................................................................. 82
Appendix B: Consent Form (English)............................................................................. 83
Appendix C: Matlab Coding (Zero Crossing) ................................................................. 84
Appendix D: Matlab Coding (Model 1) .......................................................................... 85
Appendix E: Matlab Coding (Model 2) .......................................................................... 87
Appendix F: Ethics approval of the study ....................................................................... 89
Univers
ity of
Mala
ya

1
CHAPTER 1: INTRODUCTION
This chapter introduced the main idea of the study in general. There were 8 sections in
this chapter. The first chapter focused on the contextual information of the study. Sections
2 and 3 discussed the motivation and the problem statement of this study respectively.
Section 4 discussed the objectives that needed to be achieved. Section 5 introduced the
hypothesis of the study. Section 6 highlighted the aims of the study while section 7
reviews the scope in this study. The organization of the section, in general, was discussed
in section 8.
1.1 Background Study
Spinal cord injury (SCI) happened when an injury happened to the spinal cord most
commonly because of accident. SCI causes the communication between the brain and the
body to be disturbed (Kirshblum et al., 2011). Results from SCI can be temporary or
permanent loss of the ability to perform physical or sensate functions depending on how
bad the damage to the spine (Furlan, Noonan, Singh, & Fehlings, 2011) due to disruption
to the message transmission from the brain to the designated body part (Kirshblum et al.,
2011). The spinal cord injury can be differentiated as complete and incomplete based on
the movement and sensation occurs and the area of injury or the area below the injury
(Kirshblum et al., 2011). The effects of the spinal cord injury may include loss of
mobility, loss of sensation, poor bowel control, spasms, or intense pain (Kirshblum et al.,
2011).
The levels of injury can be assigned according to the severity of the injury towards the
body function. International Standards for Neurological Classification of Spinal Cord
Injury (ISNCSCI) grading is used to define the seriousness of the injury (Kirshblum et
al., 2011). Grade A is the level where there is a complete disability of motor and sensory
function, Grade B is an incomplete sensation from the area of injury and below, Grade C
Univers
ity of
Mala
ya
2
is there is the ability for muscle movement, but it is restricted and most of the muscle
below the injury area is unable to move against gravity. Grade D is where most of the
muscle below the injury area are able to move against gravity while Grade E is the normal
muscle movement for a healthy individual (Kirshblum et al., 2011).
It is common for individuals to experience medical complications after SCI and this
can cause disturbance to the individual’s health and the process of rehabilitation. The
common complications that can happen are pressure ulcers, bladder infections, autonomic
dysreflexia and respiratory infections (Haisma et al., 2007). These complications may
cause negative impacts not limited to the individual’s health, but also on the social
interactions, employability and general quality of life. Such complications may also cause
death for some sections of SCI patients (Soden et al., 2000).
Individuals with SCI require a rehabilitation method to facilitate daily tasks.
Functional Electrical Stimulation (FES) has been widely utilized in rehabilitation
engineering as an artificial muscle activation in order to restore muscle function lost due
to spinal cord injury (Ahmad et al., 2012). FES designed for a spinal impaired individual
in their daily task (Sedel, Nizard, & Meunier, 1995). This is done by electrically
stimulating the muscle to provide artificial contraction (Hamid & Hayek, 2008). The
intensity of the stimulation must be regulated to prevent extreme muscle fatigue that will
lead to muscle failure.
Application of FES had been seen through the history where the first version of FES
was used with a live electric ray to deliver electric current in form of pain treatment
approximately 2000 years ago. In recent years, there are two types of stimulation devices
which are the implanted and non-implanted devices usually used in clinical setting.
Cardiac peacemaker is one of the examples of the implanted device where the device is
Univers
ity of
Mala
ya

3
implanted in the chest or belly to provide electrical stimulation to the cardiac muscle to
control of the heart rhythms (Nielsen, Gerdes, & Varma, 2015).
FES is commonly used because of its therapeutic effect on the SCI individuals by
training the injured muscles in order to regain partially or fully its lost function (Hamid
& Hayek, 2008). FES is used commonly in spinal cord injury individuals to restore the
muscle function. Electrical stimulation can be applied through a surface or implanted
electrode to provide contraction stimulation to the paralyzed muscle provided fibre
depolarization is achieved (Ferrarin & Pedotti, 2000).
The method of monitoring muscle fatigue that was being investigated in this thesis was
mechanomyogram (MMG). MMG is a measurement of the mechanical activity of
contraction muscles by detecting the muscular sound (Islam, Sundaraj, Ahmad, &
Ahamed, 2013). The origin of the muscle sound used to distinguish the physiological
aspect of the muscle could be trace to 1665 by Grimaldi who has then signified the sound
as the motion of the animal spirit (Grimaldi, 1665).
The MMG principle is to record the mechanical changes of muscle during a
contraction (Weir, Ayers, Lacefield, & Walsh, 2000). MMG has been considered as the
mechanical counterpart to the muscle activity of the electromyography (EMG) (Beck et
al., 2004). MMG also provides information such as forces the muscle produced, the
stiffness and the fluid pressure (Barry, Geiringer, & Ball, 1985). MMG signal during
specific activities such as walking, standing up and reaching is captured to monitor the
muscle fatigue (Laufer, Ries, Leininger, & Alon, 2001). The MMG sensors were placed
on the skin surface of the muscle involved in the activity.
Univers
ity of
Mala
ya

4
There are three main physiological events that reflected from the signal which are the
gross lateral movement of the contracting muscle during the start of the contraction, a
smaller resulting vibrations at the resonance frequency of the muscle and the changes of
the shape of the active muscle fibre (Orizio, Gobbo, Diemont, Esposito, & Veicsteinas,
2003). Muscle sound from previous work usually implicated its properties such as the
muscle vibration, muscle acceleration, and the dimension change to evaluate the muscle
contractions and its conditions.
The system used to predict the onset of fatigue is the Artificial Neural Network (ANN)
which is a system that is built from a huge number of connected neurons. Neurons are the
processing elements that are able to process data and to represent knowledge. Through
training, the ANN can detect patterns and with the developed models the ANN can make
decisions regarding any new type of pattern the ANN has not seen without any human
interaction.
A definition of ANN explained by Haykin (Haykin, 1998), ANN is a colossal parallel
group of simple processing units that accept information from its surrounding with the
processing of learning and the information is stored within its connections. ANN
definitions highlight the processing elements and the learning algorithms (Eberhart,
2007). Learning can be explained as changing the synaptic weight to obtain information
at more effective accuracy (Eberhart, 2007). ANN was also able to change its very own
topology (Haykin, 1998).
Processing elements were conceived from the idea, neurons in the animal nervous
system. The neuron obtains stimulus and converts the knowledge into synaptic weights,
adding them and finally, produced a single output response. ANN can be defined into 3
basic elements which are the synaptic weight, summing function which combines the
input according to the weight in respective connections, and activation function which
Univers
ity of
Mala
ya

5
produce the output (Haykin, 1998). The ANN was adopted from the four structures of the
biological neuron shape albeit in the minimal structure, which is made out of dendrites,
synapse, cell body, and axon.
ANN are distributed, adaptive and usually nonlinear learning machines made from
various processing elements and each processing elements connects either from other
processing elements or to itself. The topology is used to define the connection in the
system. Weights are the parameters that can be adjusted to control the signal in each
elements’ connections. The processing elements gather all the signal from the elements
to generate an output that is non-linear to the function of the sum. The output from the
processing elements could be in three situations; a system output, the signal is sent to
different processing elements or the signal is sent back to itself.
In the ANN, the prediction and function approximation are comparable. Usually, the
input data will generate a single output. The use of ANN in prediction requires the training
of the network to determine the output of the future values of the output of a variable
given from the past observation of the data.
ANN tackles highly non-linear functions and does not require any understanding of
the nature of the relationships of the functions (Sibanda & Pretorius, 2012). This is the
benefits of the ANN over regression analysis. Linear regression does not work if the
relationship between the variables is non-linear. Non-linear regression can be used
provided the relationship of the nonlinearity is found and the non-linear elements are
consistent through the measurement. However, highly non-linear relationships exist in
the everyday world and traditional regression does not bode well due to the presence of
scattering data or noise. Hence, it is why ANN offers an important outlook on these
relationships.
Univers
ity of
Mala
ya
6
1.2 The Motivation of The Study
Researchers described the importance of muscle fatigue detection in order to prevent
muscle injury. This situation is more critical for the SCI individuals as their muscle are
usually weaker due to inactivity of the muscle (Al-mulla, Sepulveda, & Colley, 2011).
There was a need for an automated system that will remind the user that the muscle was
about to reach fatigue state (Al-mulla et al., 2011). This resulted in improving the training
and avoid injury due to strain. Researchers have not been able to measure muscle
performance during activities such as standing because there is no adequate tool to
directly quantify knee and hip extensor torques during the stance.
With the use of MMG, the muscle activity can be quantified over time and thus its
performance could be assessed. The monitoring and characterizing muscle fatigue bring
significant information regarding the human and computer interactions, sports injuries
and performance, ergonomics and prosthetics. An automatic system that able to forecast
and distinguish muscle fatigue when it happens is very useful commonly in situations
related to SCI rehabilitation where fatigue has heightened the injury risk while an
individual with spinal injury would not be able to sense the muscle fatigue. The automatic
system guides the individuals during training and serves as an indicator to when the
fatigue sets and to maintain a favorable fatigue state, hence, encourage improvement to
the muscle while evading redundant strain to the muscle to minimize injury.
1.3 Problem Statements
The application of FES is for SCI individuals with a neuromuscular disability to
execute daily activities. By electrically stimulating the muscle, the muscle undergoes
contraction and the force is generated. However, the force would decrease as the muscle
fatigues and muscle performance would decline (Tarata, 2009).
Univers
ity of
Mala
ya

7
Muscle stimulated by the FES will contract due to the introduction of electrical current
to the muscle. However, muscle stimulated tends to get fatigue quickly due to the reversed
recruitment order of the stimulated motor neurons which limits certain applications in
FES (Rabischong & Guiraud, 1993). Muscle fatigue is known as the disability to sustain
or provide the intended muscle strength (Enoka & Duchateau, 2008). This may lead to
performance drop in individuals. Muscle fatigue can occasionally aid muscle growth seen
in bodybuilders. However, most of the time localised muscle fatigue is harmful by causing
serious injury at the high level of muscle fatigue. Therefore, muscle fatigue detection is
the main topic for this research and literatures were found based on detection of muscle
fatigue.
Due to lack of research regarding muscle fatigue monitoring in SCI during FES;
especially during a quiet standing contraction, it is important that such model is developed
to integrate along with FES in view to optimize the training efficiency while minimizing
the risk of injury to the individual during FES standing. In order to monitor muscle
fatigue, there are many types of parameters that can be used to describe the neuromuscular
fatigue such as the torque output and the muscle characteristic such as the contraction
strength and the frequency of the contraction. However, the usefulness of the parameters
in regard to ANN model has yet to been tested during FES evoked standing training.
Therefore, in this study, the aim was to design an artificial neural network (ANN) that
could predict the torque exerted around the knee joint by the quadriceps muscle by taking
inputs from certain MMG parameters, namely the root mean square (RMS) and zero
crossings (ZC). The models were designed to predict the knee torque during FES
isometric knee extension. Second, we sought to apply the ANN models to multiple
sessions of FES standing challenges. This was done to determine the accuracy and
Univers
ity of
Mala
ya

8
reliability of the ANN models based on RMS and RMS-ZC inputs to predict the knee
torque produced by the quadriceps in FES isometric knee extension and standing.
1.4 Objectives of the study
There are three objectives that need to be met during the course of the study which are:
a) Design a neural network system model based on MMG sensor predicting the knee
torque produced during FES isometric contraction and quiet standing.
b) Identify the correlation and accuracy for prediction between predicted torque
output and the actual torque output in ANN models.
c) Compare the ANN model’s performance to estimate a selected point of torque.
1.5 Hypotheses of the study
In order to test the effectiveness of the ANN models to predict muscle fatigue, three
hypotheses were introduced. The hypotheses were (i) the initial torque predicted would
be higher than the final torque predicted, (ii) the predicted torque output pattern would be
reduced throughout the stimulation and (iii) the pattern of RMS and ZC before and after
the 50% torque drop point would not be the same.
1.6 Aim of the study
In this study, the main aim of the research was to develop an automated system to serve
as the muscle fatigue monitoring based on the generated torque during an FES isometric
contraction in individuals with spinal cord injury. With the use of MMG, the muscle
activity can be quantified over time and its performance assessed. Therefore, the aim of
the study was to design an ANN that could predict the torque exerted around the knee
joint by the quadriceps muscle by taking inputs from certain MMG parameters, namely
the RMS and ZC. The models were designed to predict the knee torque during FES
isometric knee extension. ANN models were then used to apply in multiple sessions of
Univers
ity of
Mala
ya
9
FES standing challenges. This was done to determine the accuracy and reliability of the
ANN models based on RMS and RMS-ZC inputs to predict the knee torque produced by
the quadriceps in FES isometric knee extension and standing. Finally, this study aimed to
compare the ANN model’s performance to determine the input(s) that best predicted the
performance of isometric knee extension and standing. In other words, the ANN’s
accuracy to predict knee torque produced by the quadriceps was tested during FES
isometric knee extension and the developed model was then deployed in an FES standing
activity. It was hypothesized that the knee extension torque could be modelled through
MMG-derived RMS and ZC, which would enable the prediction of torque in activities
where torque cannot be physically measured, such as upright stance.
1.7 Scope of study
The study aimed to design an ANN model to estimate torque during FES evoked
contraction during seated and standing. The ANN model accepts inputs from MMG
depending on the ANN model used and the output would be the knee joint torque. The
ANN model will benefit the SCI individuals and physiotherapist as the monitoring system
will enable the FES evoked contraction training to have optimal benefits with little to no
risk of injury. This study focused only on the quadriceps muscle of the SCI subjects and
the activities involved in this study were FES evoked standing and FES seated contraction
on a dynamometer. The implementation of the model in a FES device or MMG sensor is
not within the scope of this study.
Univers
ity of
Mala
ya

10
1.8 Organization of the Thesis
This thesis consisted of six chapters that covered the data collection to training and
testing the ANN model to predict torque in SCI individuals. The overview of the contents
of each chapter in the thesis are as listed:
Chapter 1: This chapter introduced the problem faced by SCI individuals during
rehabilitation training and the needs for a monitoring system for muscle fatigue. This
chapter also introduced to the background studies related to this study as well as the scope
of the study and the study objectives.
Chapter 2: This chapter reviewed the past researches and experiment done about SCI,
MMG, and FES. Hence, this chapter contained information that related to this study
which ensured a better understanding of the topic subject.
Chapter 3: This chapter detailed the methodology used to achieve the study’s
objective.
Chapter 4: This chapter showed the test results from the testing of the ANN models in
both FES evoked seated and standing contraction.
Chapter 5: This chapter discussed the impact of the test results from the experiment
and the effectiveness of the ANN model to estimate torque.
Chapter 6: This chapter discussed the conclusion and the future work that can be done
following this study.
Univers
ity of
Mala
ya

11
CHAPTER 2: LITERATURE REVIEW
This chapter included the critical studies based on the past researches related to the
study. There were six sections in this chapter. The first section discussed the FES and the
parameters related to the FES and how the changes to the parameters affected the muscle
contraction. The second section defined the muscle fatigue that occurred during the
training. The third section discussed the related information regarding
mechanomyography (MMG) and its parameters. The fourth section was on the planning
of the study experimental setup based on the past studies. The fifth section discussed the
techniques and parameters used to process the data obtained from the experimental phase
and finally, the sixth section discussed the systems used to predict the knee torque during
FES training.
2.1 Functional Electrical Stimulation
The main field of this research was regarding the improvement that can be made in the
field of rehabilitation. FES is commonly used because of its therapeutic effect on the SCI
individuals by training the injured muscles in order to regain partially or fully its lost
function (Hamid & Hayek, 2008). FES activated the nerves by utilizing electrical
currents. The principle behind FES was that electrical stimulation excites the motor nerve
attached to the muscle to contract.
2.1.1 FES waveform
The FES is supplied in different types of waveform to provide excitation to the neurons
(Popovic, Keller, Pappas, Dietz, & Morari, 2001).
Univers
ity of
Mala
ya

12
The waveforms can be distinguished into direct current (DC), alternating current (AC)
and pulse-shaped current (C). Figure 2.1 shows the different type of stimulation used in
the FES devices.
Figure 2.1 Stimulation waveform pattern (A is DC, B is AC and C is pulse-
shaped stimulation) (Agnello, 2011)
DC waveforms are known to treat neuralgia and improve circulation as well as
electrolysis and tool for a process of transfer of ions through the skin also known as
iontophoresis (Agnello, 2011). However, DC waveforms do not provide the necessity to
generate muscle contractions but provide muscle twitches related to the beginning and
end of the DC waveform. AC waveforms are known as a constantly changing direction
of the current flow. This includes shapes like square, triangle, trapezoidal and sinusoidal.
AC waveforms lack the electrical silence between phases similar to DC waveforms and
both are not used for therapeutic stimulation (Masdar, Ibrahim, & Jamil, 2012).
Stimulus waveforms are generally available in two types of shape which are
monophasic and biphasic. Monophasic pulses like DC moves the current in a single
direction. This type of pulses might cause electrode deterioration and tissue damage on
the skin when applied on the skin over a long period of time (Masdar et al., 2012). This
Univers
ity of
Mala
ya

13
is due to the changes in ionic distribution and tissue breakdowns and burns due to the
polarization. The monophasic waveforms are still being used in short-term FES
stimulation despite the shortcomings. Biphasic waveforms can reduce the unequal ion
transfers and biphasic waveforms are available in two types (symmetrical and
asymmetrical). Monophasic and biphasic (symmetrical and asymmetrical) are shown in
Figure 2.2.
Figure 2.2 Pulse shape stimulation waveforms (Agnello, 2011)
Single direction of the current is able to depolarize excitable tissue and the opposite
direction of the current in lower current amplitude but in longer duration may able to
lower the neural excitation. Overall, a biphasic waveform is best used for the longer
duration of FES.
2.2 Muscle Fatigue
SCI individuals with neuromuscular disability utilize FES to execute daily activities
such as walking, cycling, and standing up as well as muscle strengthening and
cardiovascular reconditioning, endurance, improving range-of-motion (ROM) and gait
control, enhancing limb function, wound healing, improving blood flow and sensory
awareness and reduce pain and osteoporosis (Petrofsky, 2004). By stimulating the
muscle, the muscle will contract and generates force. However, the force will decrease
when the muscle fatigue and thus, muscle performance will decline (Tarata, 2009).
Univers
ity of
Mala
ya

14
Muscle contraction was stimulated with the introduction of electrical current to the
muscle. However, muscle stimulated tended to get fatigued quickly due to the reversed
recruitment order of the artificially stimulated motor neurons which limits certain
applications in FES (Rabischong & Guiraud, 1993).
Muscle fatigue is known as the disability to sustain or provide the intended muscle
strength (Enoka & Duchateau, 2008). This may lead to a drop in performance in the
individuals. Fatigue is a general symptom that occurs in many people and it is related to
health conditions. Such a condition can be said as feeling tired that is overwhelming while
performing voluntary tasks (Gruet et al., 2013). Muscle fatigue can last several hours, and
it reduces the ability of the muscle to contract and to produce force.
Fatigued muscle has less ability to absorb energy than non-fatigued muscle prior to the
muscle are stretched to a high degree of risk to injury (Mair, Seaber, Glisson, & Garrett,
1996). Often time, fatigue is related to the muscle not able to reach the set level of
maximum contraction (MC) (Merletti & Parker, 2004).
When muscle activated to lift a load, the muscle contracts and shortens (Faulkner,
Larkin, Claflin, & Brooks, 2007). Isometric contractions required the muscle activation,
but the length of the muscle does not change. Contrary to eccentric contraction where the
muscle will lengthen when active. An eccentric contraction occurs when the individual is
performing an action such as walking.
Muscle fatigue occured when the muscle is exposed to a strong muscle activity and
differences of muscle characteristic between individual are significant and that there is no
exact way to define a precise muscle fatigue threshold (Robert, 2006) because of the
difficulty to isolate the different mechanism of fatigue. Muscle fatigue is related to the
muscle not be able to reach a set level of MC force which the muscle is unable to maintain
Univers
ity of
Mala
ya
15
its current task (Barry & Enoka, 2007). Researchers defined that the individual may still
be able to sustain the activity after the onset of muscle fatigue but the definition of muscle
fatigue is an engineering perspective where fatigue occurs over time and it is constantly
developing as the muscle physiological factors change before finally unable to produce
any more force (Barry & Enoka, 2007). This can be used as the basis for determining the
muscle fatigue threshold where a certain percentage from the MC during an experiment
can be used to determine that the muscle has fatigue. Another parameter that can be used
to indicate muscle fatigue is the joint angle (Barry et al., 1985; Guo, Zheng, Huang, &
Chen, 2008).
There are two stages of muscle fatigue which are fatigue and non-fatigue where fatigue
relates to the fatigue during a muscle contraction while non-fatigue is the status of the
muscle during contraction prior the fatigue sets (Al-mulla et al., 2011). The first stage of
fatigue which is non-fatigue, the muscle that is well rested is able to produce the highest
force and when the muscle starts to fatigue, a new muscle fiber recruitment happens (Al-
mulla et al., 2011; Al-Mulla, Sepulveda, Colley, & Al-Mulla, 2009). However, there is a
third type of fatigue which is transition-to-fatigue (M R Al-Mulla et al., 2009). The
transition-to-fatigue is an attempt to predict the occurrence of fatigue during an exercise.
This recruitment period is known as Transition-to-Fatigue where an increase in motor
unit action potential firing rate. The Transition-to-fatigue continues until the actual
fatigue occurs. Resting period is also important to ensure that the muscle is well rested.
2.3 Mechanomyogram
2.3.1 Muscle sound
Muscle sound has been used to investigate the muscle condition since 1665 by
Grimaldi. He alluded to the sound as the motion of animal spirits. Wollaston, in 1810,
reported quantitatively the frequency of muscle sound in the range of 14 to 35 Hz. Oster
Univers
ity of
Mala
ya

16
and Jaffe studied the time and frequency domains analysis characteristics of the muscle
sound during evoked and voluntary contraction (Oster & Jaffe, 1980).
The frequency of the muscle sound was quantitively described to be between 14Hz to
35Hz, Wollaston described the frequency based on the use of analogy (Wollaston, 1810).
Time and frequency domain analysis of the muscle sound during evoked and voluntary
contraction was characterized by Oster and Jaffe who described that the muscle sound’s
dominant frequency is within the 25Hz with a variation of 2.5Hz plus or minus (Oster &
Jaffe, 1980).
2.3.2 Properties of MMG
MMG is a measurement of the mechanical activity of contraction muscles by detecting
the muscular sound (Islam et al., 2013). The muscle sound is related to the essential
property of the muscle contraction with the help of a stethoscope and microphone where
the sound is known as a form of MMG. The MMG was identified as the supportive
mechanical signal to the more established electromyogram (EMG) in researching muscle
activities (M. Stokes & Blythe, 2001). The amplitude of the MMG is related to the force
produced by the muscle, a small change of force can also be reflected in the MMG
amplitude (Beck, 2010). Hence, small changes during muscle fatigue can be reflected
through the MMG amplitude (Beck, 2010).
2.3.3 Applications of MMG
MMG is used in research of sensor development, signal processing, characterization
of muscle activity, development of prosthesis or switch control, diagnosis of a
neuromuscular disorder and medical rehabilitation tool (Islam et al., 2013). MMG has
advantages over EMG which are MMG is easy to implement and does not contain power
line interference as well as having the highest signal to noise ratio (SNR)(Islam et al.,
2013). Moreover, MMG indicates the force production of the muscle which is an
Univers
ity of
Mala
ya

17
important factor to access muscle fatigue while EMG reflects the electrical activity of the
muscle (Beck, 2010). MMG is used as a development tool in order to find the
abnormalities from the designated baseline. MMG is useful in detection for muscle
fatigue during sustain contraction (Jensen, Jorgensen, & Sjogaard, 1994). Even though
MMG has been commonly used in research on muscle fatigue during isometric
contractions, the usability of MMG for postural control after fatigue made it significant
in various fields such as occupational therapy and ergonomics while using the wireless
technology can give a new area for real-time clinical examinations during daily activities
(Beck, 2010).
The method of combining MMG and EMG is especially used to estimate
noninvasively the physiology of the muscle during a contraction and the fatigue
occurrence (Esposito, Orizio, & Veicsteinas, 1998).
The production of sensitive, light, cheap sensors and advanced signal analysis method,
obtaining low-frequency vibration of due to the muscle activities in the form of MMG
had made the MMG more feasible. The signal has been found out to be able to be seen
on the skin surface during changes to the shape and size of the active muscle fibre. The
changes to the muscle fibre caused a pressure wave resulting from voluntary or evoked
contraction and the signals due to the pressure waves were demonstrated to contain a high
number of information of the neuromuscular parameters that cause contraction. This
behavior made the MMG a reliable muscle function assessment (Claudio Orizio et al.,
2003).
Current EMG used as the signal to investigate and observe skeletal muscle activities
has not been successfully providing satisfactory information when it comes to the
mechanical index of muscle contraction (Sasidhar, Panda, & Xu, 2013). Hence, this lack
of information limited to the understanding of the neural control of the muscle function
Univers
ity of
Mala
ya

18
(Farina, Merletti, & Enoka, 2013). The EMG signal also is not able to suitably quantify
the muscle function during an electrically evoked muscle contraction (Braz, Russold, &
Davis, 2009). Thus, there is a need for a sensor that is sensitive to the muscle mechanical
activities and does not react to electrical noise. MMG fulfilled both criteria. MMG has
advantages over EMG which MMG is easy to implement and does not contain power line
interference, hence it is able to work in conjunction with FES whereby EMG has not able
to, in process of examining neuromuscular properties (Malek & Coburn, 2012).
Moreover, because of the propagating characteristics through the muscle tissue, the MMG
sensor does not need to be placed at a precise or specific location (Alves & Chau, 2008).
MMG also does not incline to the changes of the skin impedance from sweating, this is
because MMG is a mechanical signal (Xie, Zheng, & Guo, 2009).
The MMG signal can be utilized to determine muscle fibre typing (Herda et al., 2010),
assess muscle force (Sarlabous, Torres, Fiz, Morera, & Jané, 2013), investigating muscle
fatigue (Hendrix et al., 2010), determine the resonance frequency of the muscle (D. T.
Barry & Cole, 1990) and to assess properties during a muscle contraction (Gorelick &
Brown, 2007). An observation had been done on the mechanical landscape of the muscle
fibre activities that cause contraction which can be better differentiated and characterized
with the signal response that is fundamentally mechanical (Gerdle, Karlsson, Day, &
Djupsjöbacka, 1999).
The amplitude of the MMG is related to the force produced by the muscle, a small
change of force can also be reflected in the MMG amplitude (Beck, 2010). Hence, small
changes during muscle fatigue can be reflected in MMG amplitude (Beck, 2010). MMG
is used in research of sensor development, signal processing, characterization of muscle
activity, development of prosthesis or switch control, diagnosis of a neuromuscular
disorder and medical rehabilitation tool (Islam et al., 2013).
Univers
ity of
Mala
ya
19
2.3.4 MMG Parameters
MMG indicates the force production of the muscle which is an important factor to
access muscle fatigue while EMG reflects the electrical activity of the muscle (Beck,
2010). MMG is used as a development tool to find the abnormalities from the designated
baseline. Two features of MMG are the RMS which is the magnitude of the muscle
contraction and Mean Frequency (MF) which is the frequency of muscle contraction
(Yang, Kumar, & Arjunan, 2009). The two indications can be used to study the muscle
fatigue based on the experiment.
RMS is correlated to load as increasing MC will increase the RMS value of the MMG
(Akataki, Mita, Watakabe, & Itoh, 2003). RMS value represents the motor activation (J
P Weir et al., 2000). RMS is an important parameter to monitor muscle fatigue due to its
correlation to the force of contraction of the muscle (Barry, Geiringer, & Ball, 1985).
Variance, on the other hand, represents the magnitude of the muscle contraction (Tanaka,
Okuyama, & Saito, 2011). The decreasing value of variance indicates that the muscle is
fatigue. Both RMS and variance are in the time domain (Tanaka et al., 2011). The other
domain of the signal is frequency domain which is known as spectrum. Mean Power
Frequency (MPF) is the common parameter that has been used to represent muscle
conditions. Decreasing MPF indicates the muscle is fatigue (M. Tarata, Spaepen, & Puers,
2001). The usage of MMG had gained traction due to the resistance to electrical noises
and it is flexible in its sensing technology. Literature review emphasises the robustness
of the MMG signal that is typically underrated. Besides a few remote studies with
differences seen such as in Herda and Cooper who established that the MMG amplitude
to force relationship failed to differentiate the voluntary activation capacity among
individuals (Herda & Cooper, 2013).
Univers
ity of
Mala
ya

20
The data obtained from the MMG signal can be in either time or frequency domain
and each domain will be represented by the time or domain respectively. In the time
domain, the amplitude is identified as the voltage values and the amplitude can be
retrieved as peak to peak (PTP), RMS and average rectified values (ARV). The amplitude
is importantly known as the variables in motor unit recruitment during a contraction
process (Orizio, Gobbo, Diemont, Esposito, & Veicsteinas, 2003).
Two features of MMG are the RMS which is the magnitude of the muscle contraction
and MF which is the frequency of muscle contraction (Yang et al., 2009). The two
indications can be used to study the muscle fatigue based on the experiment.
Power spectra of MMG signals can be obtained from the signal through the fast Fourier
transform (FFT) or by using discrete Fourier transform (DFT) algorithm in order to obtain
the frequency domain of the same signal. MPF and mean power frequency (MDF) are the
most widely used variables that are obtained from the frequency domain (Madeleine &
Arendt-Nielsen, 2016). Mean Power Frequency (MPF) is the common parameter that has
been used to represent muscle conditions. Decreasing MPF indicates the muscle is fatigue
(M. Tarata et al., 2001).
In isometric contractions, an increased in MMG amplitude can be seen when force
production is low which was around 10% to 40% of the MC and during the high level of
muscle force which is around 50% to 80% MC, there was no change in MMG amplitude
(Perry et al., 2016). The same observation was reported by another research group
(Rodriguez-Falces & Place, 2013).
In addition to that, at a higher level of muscle force resulted to decrease in MMG
amplitude (Claudio Orizio et al., 2003). A linear relationship was reported between the
contraction muscle and the RMS amplitude of the MMG (Oster & Jaffe, 1980) and it was
Univers
ity of
Mala
ya
21
proven by the correlation of amplitude of MMG signal and motor unit activation during
a voluntary contraction as well as FES contraction (Beck, 2010).
There was a linear relationship with the MMG amplitude and knee torque during an
incremental evoked contraction on the first dorsal interosseous muscle reported that in a
healthy subject, and the muscle fibre type was proposed as the reason for the pattern and
as a conclusion the MMG-torque was dependent on muscle fiber and structure (Petitjean,
Maton, & Fourment, 1998) (Stokes & Dalton, 1991; Yoshitake & Moritani, 1999). Firing
rate of the active motor units of the muscle during the FES contraction was related to the
frequency domain of the MMG (Orizio et al., 2003). Hence, both time and frequency
domain of the MMG signal can be investigated in order to access muscle control strategy
which is related to the muscle force production during a FES contraction (Orizio, 1993).
Torque output produced by the muscle during a FES contraction was affected by three
factors which were a degree of muscle unit recruitment, the firing rates (Petitjean et al.,
1998) and the contractile properties of the muscle unit (Yoshitake, Shinohara, Ue, &
Moritani, 2002).
Besides the RMS and MF stated above, another parameter that can be obtained by the
time domain of the MMG data is the Area to Amplitude ratio (RAA) (MT Tarata, 2009).
The parameter was computed from the time domain as the average of ratios of the area to
amplitude over a considered time period (MT Tarata, 2009). The RAA was calculated
between the consecutive transversals of the isoelectric line known as phases (MT Tarata,
2009). RAA is said to be more efficient computationally compared to FFT or wavelet
technique (MT Tarata, 2009). However, this parameter of computation has not been
supported by other researchers.
Univers
ity of
Mala
ya

22
From the reviewed literatures, the changes following parameters can be observed in
order to monitor the muscle fatigue during a contraction. The summary for the parameters
from MMG can be found in Table 2.1.
Table 2.1 Summary of Parameters and the relationship with increasing muscle
fatigue.
Parameters Definition Relationship with muscle
fatigue
RMS The amplitude of
muscle activation (Weir
et al., 2000).
Decreased with increasing
fatigue (Barry, Geiringer, &
Ball, 1985).
PTP Amplitude in motor unit
recruitment during
contraction (Claudio
Orizio et al., 2003).
Decreased PTP shows
fatiguing muscle (Perry et
al., 2016).
Variance Magnitude of muscle
contraction (Tanaka et
al., 2011).
Decreased value means the
muscle is fatigued (Tanaka
et al., 2011).
MPF/MDF Represent the muscle
condition (Madeleine &
Arendt-Nielsen, 2016).
Decreased with increasing
fatigue (M. Tarata et al.,
2001).
Univers
ity of
Mala
ya

23
2.4 Experimental Setup Considerations
Past researches revealed the effectiveness of the method and its significance for the
investigated research in order to design a test protocol that will be able to achieve the
research’s objectives. This includeed the experimental setup, the techniques used to
investigate the MMG parameters that were related to muscle fatigue.
An experiment for muscle fatigue required the subject to perform a set of activities
corresponding to the selected limb with the sensor attached to the skin to pick up the
changes occurs in the signal due to the movement (Al-mulla et al., 2011). The signal will
then be recorded and processed. This suggested setup will be the foundation of the
experiment for the research where instead of contraction that was generated by the
subject, the contraction will then be provided by the FES device (Al-mulla et al., 2011).
Researches used the sensor EMG during an experiment procedure along with the
goniometer signal that later is used to compare with the reading of the EMG (Al-Mulla et
al., 2009). The readings were then divided into three states of muscle which are Non-
Fatigue, Transition-to-Fatigue, and Fatigue. The fuzzy classifier was used to determine
the state of muscle and the identification of Transition-to-Fatigue is important for
detecting and predicting muscle fatigue (Al-Mulla et al., 2009).
2.4.1 Sensors placement
Placement of electrode and sensors were important for this experiment as such to
minimize cross movement of the signal between the nearby muscle in order to achieve a
reliable and stable contraction and signal (Stoykov, Lowery, & Kuiken, 2005). The best
placement for sensors was when the signal amplitude was the highest and had a bigger
standard deviation of signal noise (Gerdle et al., 1999).
Univers
ity of
Mala
ya

24
The accelerometer was used in order to monitor the surface oscillations of the tibialis
anterior muscle in order to investigate the MMG changes prior and post-fatigue (Orizio,
1993). It was found that MMG is suitable for recording muscle changes while studying
the effect of muscle fatigue (Orizio, 1993).
The setup from Figure 2.3 can be used as the experimental set up for the research and
can be modified to observe a knee torque from the dynamometer and amplitude from the
MMG with one set of constant current and knee angle during an isometric FES
contraction.
Figure 2.3 Experimental setup schematic (Ibitoye, Hamzaid, & Abdul Wahab,
2016)
In the stimulation protocol, the FES electrode was placed 8cm distal to the targeted
area over the muscle belly near the location of the motor points (Botter et al., 2011). The
position of the electrode should be slightly adjusted in order to achieve maximum
response and this can be done by palpating the muscle response and force production and
that the electrode was recommended to be placed 5cm proximal to the patella (Levin,
Mizrahi, & Isakov, 2000). A 10-minute recovery period between trials was able to
Univers
ity of
Mala
ya

25
minimize the risk of cumulative muscle fatigue (Thomas, Griffin, Godfrey, Ribot-Ciscar,
& Butler, 2003).
During the simulation, the torque measurement from the dynamometer and the MMG
signal recording attached directly to the muscle belly for obtaining the maximum muscle
surface oscillation were simultaneously run from the beginning (Olusola et al., 2016). The
purpose of the two measurements was recorded together that was in order to obtain the
parameters with respect to time. Which then the author was able to observe the torque
and MMG simultaneously at a specific time. The author also used the stimulation pulse
width of 400µs and frequency of 30Hz. The foundation of the protocol by the author can
be replicated such as the FES stimulator setting and the position of the muscle up until
the dynamometer isometric contraction (Olusola et al., 2016).
2.4.2 Training settings
MMG signal obtained from the muscle activity during a dynamic activity is similar to
those in isometric contractions. However during dynamic contraction factors such as
changes in production of torque, muscle length and tissue thickness may affect the
amplitude and frequency can cause difficulty in understanding the motor control
strategies and thus fewer studies of muscle fatigue during dynamic contractions for the
use of MMG (Beck et al., 2005).
Isokinetic dynamometers had been commonly used in muscle force assessment during
a research as they were able to obtain the torque through the limb motion with good
reliability (Sisto & Dyson-Hudson, 2007). The disadvantage with the dynamometers is
that it was not mobile and expensive therefore the dynamometers are not suitable for
home usage.
Univers
ity of
Mala
ya

26
The subject was seated on a calibrated isokinetic dynamometer using restraining straps
over the thigh, pelvis, and trunk in order to minimize unnecessary movement and to make
sure that the contraction is recorded on the target muscle based on Brown and Weir’s
suggestions(Brown & Weir, 2001) . The stimulation should be done carefully to ensure
the knee extensor’s moment does not exceed the range for the required torque in order for
the individual to stand (Brown & Weir, 2001). This was as a safety precaution to avoid
risking a bone damage in the subject. The maximum torque production should not exceed
more than 75Nm as it is an average value for torque generated around the knee for FES
assisted standing (Gerrits et al., 2005) and the current amplitude of the FES should be in
the range of 100 to 120 mA (Kagaya et al., 1995).
2.5 Signal Processing
The raw data were obtained at a sampling rate of 1 kHz and it is digitally band-pass
filtered from 20 to 200Hz in order to remove the artifacts related to the body movement
(Goldenberg, Yack, Cerny, & Burton, 1991). Peak torque can be obtained from the
dynamometer for each contraction at the selected intensity of the stimulation. As for the
MMG signal, the author extracted the MMG-RMS, PTP value and MMG frequency such
as the peak frequency.
The data obtained were quantified by using the correlation coefficient (r) and standard
error of measurement (SEM%) (Joseph P Weir, 2005) which was the percentage of the
mean values. This was to investigate the consistency of the parameters. The meaning for
the correlation coefficient is as follows: > 0.90 – very high reliability, 0.70 to 0.89 – high
reliability, 0.50 to 0.69 0 moderate reliability (Sundmacher, Gotz, & Vogt, 2014).
The authors also conducted a polynomial regression analysis to test the correlation
between the MMG-RMS versus FES torque, FES torque against the intensity of the
stimulation and MMG-PTP against the stimulation intensity. The observation of the
Univers
ity of
Mala
ya

27
model of best fit for the said relationships was also being investigated by using the
polynomial regression (Beck et al., 2004). The highest coefficient of determination (R2)
was used in order to conclude the reliability of fit of the selected regression model. The
following method can be used in order to investigate the correlation between the
relationship of MMG-RMS against knee angle which is obtained by the accelerometer.
The results obtained from research conducted by the author showed that at different
angles the correlation coefficient ranges from moderately to very high reliability which
is from 0.65 to 0.97. The SEM% has a value of 10.1 to 31.6% of the relative mean values.
The amplitude produced by subjects in research done showed that at higher current
intensity, the amplitude is higher but at both intensities, the frequency of the muscle
contraction remains the same.
2.6 MMG muscle fatigue monitoring system
The magnitude of muscle force or the torque generated around the joint during a FES
contraction has been used in healthy individuals (Brocherie, Babault, Cometti,
Maffiuletti, & Chatard, 2005). As a method to further enhance the FES technology in
therapeutic and functions, the user should be able to monitor the muscle force or torque
in real time (Braz et al., 2009). With the ability to monitor muscle force in real time, the
FES system will be able to self-adjust the characteristic of the stimulation based on the
level of muscle fatigue and to control the level of muscle force needed to be produced in
order to execute an activity.
The author used the MMG signal due to its characteristic to quantify the mechanical
equivalent of the EMG output during a muscle contraction (Orizio, 1993). MMG signal
had been able to detect muscle fatigue in able-bodied subjects (Gobbo, Ce, Diemont,
Esposito, & Orizio, 2006) and hence supported the idea that the MMG signal may be used
Univers
ity of
Mala
ya
28
to estimate the torque in the joint during FES contraction (Ibitoye, Hamzaid, Zuniga, &
Abdul Wahab, 2014).
A computational technique was proposed to quantify the MMG signal and then
compared the accuracy of the model through a contraction. An artificial network model
for elbow flexion estimation based on the force generated by the MMG during an
isometric voluntary contraction achieved the accuracy of 0.892 and 0.883 in another
research in respect of cross-correlation (Youn & Kim, 2010).
The model was subject dependent, and the authors suggested that support vector
regression is used. Simulation of the knee torque was designed via Support Vector
Regression (SVR) (Youn & Kim, 2010). This was because of the good generalization in
the corresponding field. The input of the SVR will be MMG amplitude, level of the
electrical stimulation and knee angle.
2.6.1 Support Vector Regression (SVR)
One study validated the performance of the SVR model by using a dynamometer
available commercially and calibrated and used to record the knee torques during an
isometric contraction supported by the FES contraction. The authors used eight able-
bodied male volunteers. The subject preparation was done based on the recommended
setup for voluntary isometric knee torque measurement (Brown & Weir, 2001). The
dynamometer seat must be adjusted to align the lateral femoral condyle to the axle of the
dynamometer (Bickel, Slade, VanHiel, Warren, & Dudley, 2004). The author obtained
the RMS and PTP amplitudes during the contraction form 2s epoch of the 4s MMG as
well as the torque recording at a different level of contraction.
Univers
ity of
Mala
ya

29
Choosing the right parameter for the model is vital for the accuracy of the SVR model.
High variety of different possible combination of the SVR parameters caused difficulty
to obtain the most optimal SVR parameter (Cherkassky & Ma, 2004). The author used a
hybrid optimization search technique which has been recommended (Yıldız, 2009). The
technique approach can be described by first noting several SVR parameters such as
regularization factor C (bound on the Lagrangian multiplier), λ (conditioning parameter
for quadratic programming methods), ε (epsilon) and η (kernel option) and the related
kernel functions. The computational method was repeated for all SVR kernel function
with increasing parameter’s values.
The author then proposed the optimal parameters for the Support Vector Regression
model which is detailed in Table 2.2. The flowchart in Figure 2.4 summarized the method
used by the author in order to obtain the optimal SVR parameters.
Table 2.2 Optimal Parameters for SVM Regression Model (Ibitoye et al., 2016)
C 879
λ 2-15
ε 0.1205
Kernel option 54
Kernel Gaussian (RBF)
The author used MATLAB software with SVR coding for the computational work.
Training and testing of the model require the data to be partitioned into 2 subsets which
are training and testing subsets with the subset ratio of 7:3 (Shamshirband et al., 2014)
(Akande, Owolabi, & Olatunji, 2015). The Gaussian kernel function is also used as it is
Univers
ity of
Mala
ya

30
considered an optimal parameter that able to measure performance and hence applied the
data to the SVR kernel function for building an efficient knee torque estimation model.
In order to measure the SVR estimation accuracy, the author calculated the coefficient
during the training and testing with the root mean square errors (RMSE). The coefficient
of determination estimated from the research was 94% in training and 89% in testing
cases while the RMSE was 9.48 and 12.95 respectively (Ibitoye et al., 2016).
Figure 2.4 Flowchart of obtaining Optimal SVR Parameters (Ibitoye et al.,
2016)
.
Univers
ity of
Mala
ya

31
The knee torque estimation obtained from the SVR modeling was parallel with the
experimental data performed by an isokinetic dynamometer. These findings are able to
be used in a closed-loop FES system for a series of functional task utilizing MMG as a
source for a feedback signal as well as SVR algorithm for joint torque estimation.
2.6.2 Continuous Wavelet Transform algorithm (CWT)
The journal reviewed the continuous wavelet transform (CWT) algorithm to detect the
muscle activity through the usage of MMG signals. The similarities and differences
between the CWT coefficients of the MMG and specific thresholds from the baseline
signal were identified from the baseline signal in order to estimate the timing of the
muscle activity.
The author was investigating the muscle activity of the upper limb while this research
is focusing more on the lower limb and the muscle fatigue. However, the CWT algorithm
could be investigated in this research in order to identify the algorithm for muscle fatigue
detection.
There were two tasks for event detection form biomedical signals which are online
detection algorithm and offline analysis to identify the exact timing of the event (Staude
& Wolf, 1999). Common detection involved three components which were signal
conditioning, event detection, and post-processing c. This is shown in Figure 2.5.
Figure 2.5 Components of event detection (Staude & Wolf, 1999)
Univers
ity of
Mala
ya

32
Signal conditioning removed the motion artifact and electromagnetic interference by
band-pass filtering (Staude & Wolf, 1999). The detection unit was used to identify the
event of interest and alert at the time instants when the event is observed. Offline post-
processor tested for the chances for a more accurate estimation of the detection time with
methods such as the duration of the changed state, rising amplitude or pattern observed
by the neural networks or fuzzy rules (Staude & Wolf, 1999).
The author tested the hypothesis that CWT analysis was able to estimate the timing of
muscle activity based on the MMG signals by introducing a multi-scale, multi-threshold
CWT- based test function and the author compared the CWT method with the existing
event-detection test functions. The analysis included test functions that compute the
signal’s rectified amplitude (Dietz, Colombo, & Müller, 2004), RMS and maximum CWT
coefficients.
The proposed multiple-threshold CWT was where the CWT coefficient at each scale
is compared to a specific threshold from the baseline signal and the event detection unit
monitor the sample for any coefficients that is more than the threshold.
2.6.3 Fuzzy Logic
EMG activity in biceps muscle from ten subjects during an isometric contraction until
fatigue was investigated and the author classified the fatigue into three classes of fatigue
used in the prediction and detection of fatigue (Al-Mulla & Sepulveda, 2010). During the
experiment, the subject was attached with sensor electrodes which were EMG electrodes
and goniometer in order to measure the elbow angle during the experiment.
The fuzzy logic was classified and labeled into three classes in order to verify the
output of muscle state. In Figure 2.6, the reading of the goniometer is superimposed into
the fuzzy logic in order to verify the outcome.
Univers
ity of
Mala
ya

33
This input for the fuzzy logic can be adopted for knee extension to detect the muscle
fatigue based on the knee angle input. The rules for the fuzzy logic were made based on
the elbow angle and the elbow angular oscillation in order to monitor the level of muscle
fatigue.
Figure 2.6 Fuzzy Logic Classification for Goniometer (Al-Mulla & Sepulveda,
2010)
The author used elbow angle and angular oscillation while the research is using knee
angle and torque produced by the quadriceps muscle (Al-Mulla & Sepulveda, 2010).
Univers
ity of
Mala
ya

34
This can be used as the base fuzzy logic rules for the research. The rules are stated in
Table 2.3.
Table 2.3 Fuzzy Logic Rules (Al-Mulla & Sepulveda, 2010)
Rules Input 1 (elbow
angle)
Input 2 (angular
oscillation)
Decision
1 Non-Fatigue Low Non-Fatigue
2 Non-Fatigue High Transition-to-
fatigue
3 Transition-to-
fatigue
Low Transition-to-
fatigue
4 Transition-to-
fatigue
High Transition-to-
fatigue
5 Fatigue Low Fatigue
6 Fatigue High Fatigue
2.6.4 Artificial Neural Network
Based on the various characterization above, a thorough definition of ANN had been
made (Guresen & Kayakutlu, 2011). ANN is a system which contains at least one of start
node or start element, one end node or end element and at least one processing element.
Every node must be the processing elements except for the start and end nodes. The state
variable ni must be related to node i respectively. The learning algorithm was used to
form the model to the desired output based on the provided input. Each start node must
be connected to at least one node.
Univers
ity of
Mala
ya

35
ANN as a system can be explained with three graphical representations (Haykin,
1998); a block diagram to describe the network functionality, a signal-flow graph which
describes the signal flow between the elements in the network and the architectural graph
to describe the general layout of the system. As for the mathematical definition of the
ANN, the following can be used to explain the elements in the network.
A state variable ni is related to each of the node i, a real number of weight wik which
is related to the link from i to k. The bias vi can be found at each node i. The transfer
function fi[nk,wik,vi,(i≠k)] is known for each node I that determines what is the state of
the node as this function is made out of its bias, weights of the incoming signal and the
state of the responding nodes.
There are many types of neural networks, one of the types is feed-forward neural
networks. This is the earliest and the simplest form of ANN. The information in this
system moves in a single direction which is forward. The direction beginning from the
start node to the hidden node and finally, to do the output nodes. There is an absence of
cycles or loop throughout the network. Single layer perceptron (SLP) and multi-layer
perceptron (MLP) are the examples of feed-forward neural networks.
Univers
ity of
Mala
ya
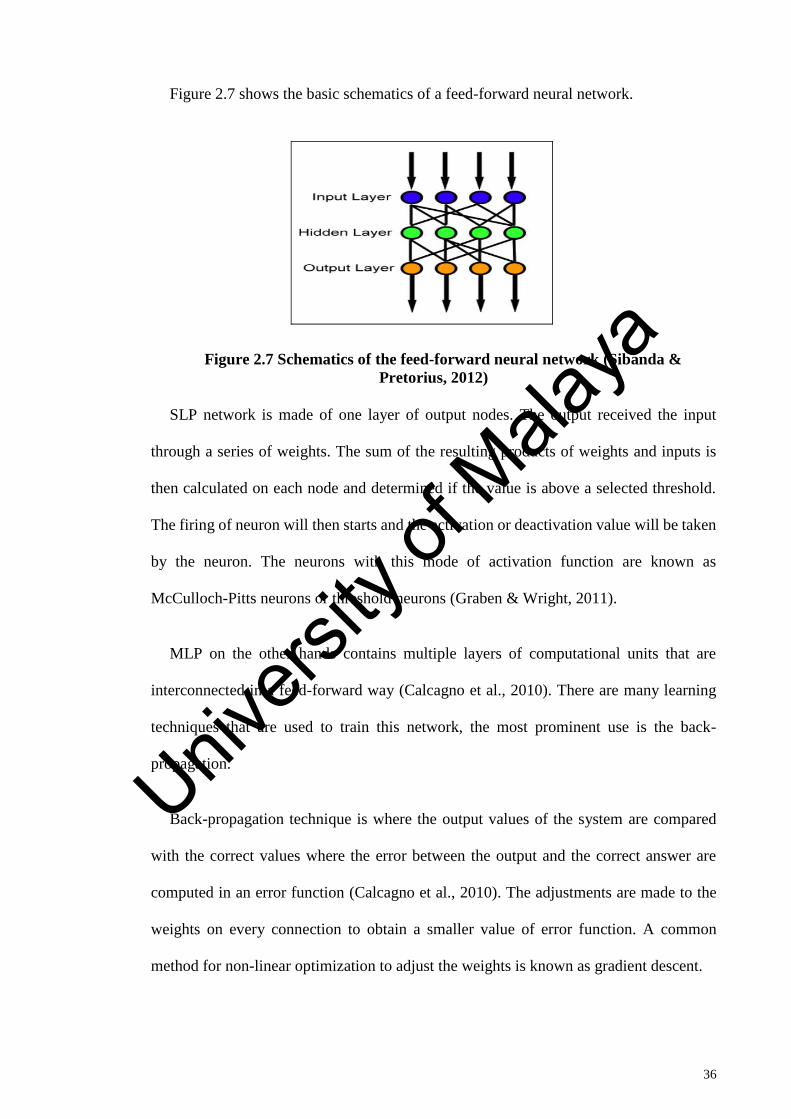
36
Figure 2.7 shows the basic schematics of a feed-forward neural network.
Figure 2.7 Schematics of the feed-forward neural network (Sibanda &
Pretorius, 2012)
SLP network is made of one layer of output nodes. The output received the input
through a series of weights. The sum of the resulting products of weights and inputs is
then calculated on each node and determined if the value is above a selected threshold.
The firing of neuron will then starts and the activation or deactivation value will be taken
by the neuron. The neurons with this mode of activation function are known as
McCulloch-Pitts neurons or threshold neurons (Graben & Wright, 2011).
MLP on the other hands contains multiple layers of computational units that are
interconnected in a feed-forward way (Calcagno et al., 2010). There are many learning
techniques that are used to train this network, the most prominent use is the back-
propagation.
Back-propagation technique is where the output values of the system are compared
with the correct values where the error between the output and the correct answer are
computed in an error function (Calcagno et al., 2010). The adjustments are made to the
weights on every connection to obtain a smaller value of error function. A common
method for non-linear optimization to adjust the weights is known as gradient descent.
Univers
ity of
Mala
ya

37
Neural network training was done when a running a series of information from the
input layer to the output layer with a hidden layer in between the two layers. An
information passed from a neuron will go through transfer functions. Transfer functions
are usually found in form of log function, sigmoid function or a scale function.
The sigmoid function is commonly utilized as a transfer function (Calcagno et al.,
2010). The reason being the sigmoid transfer function introduces non-linearity to the
network’s calculations as well as it is a simple derivative function (Calcagno et al., 2010).
A weight is assigned every time a value is moved from one layer to the other layer.
Summation of all the inputs is done by the neurons on the hidden layer. The values are
then modified by the transfer function. The values are passed to the output layer with its
transfer function and weights. As values move from the input to the output, the weight
connecting the nodes are adjusted with the back-propagation algorithm during the
learning period so that the resulting outputs will be the closely match to the predicted
outputs.
The neural network has been known to perform various tasks. These tasks include
prediction, function approximation, or pattern classification. The prediction tasks the
neural network to predict the future trend in a time series from the past conditions.
Function approximation is a method to model the relationship between variables while
pattern classification is organizing data into its own discrete classes.
2.7 Summary
The literature review discussed extensively the usage of FES in helping patients
suffering from SCI to partial or fully regain their motion and as a method of rehabilitation.
Past researches also showed the potential risk of injury that can occur should the muscle
Univers
ity of
Mala
ya

38
gets too fatigued. Muscle fatigue could have a beneficial effect but at a higher level of
fatigue, the risk of injury is great and not ideal for SCI.
The application of MMG to monitor torque production and muscle fatigue has been
studied in the past. The MMG could be in form of an accelerometer or a microphone used
to record the muscle sound. MMG is useful to quantify the force production.
There are 2 domains that can be extracted from MMG; the time domain and frequency
domain. Each domain has their own parameter. These parameters for example; RMS and
Mean Average Amplitude for time domain and Mean power frequency for frequency
domain.
In order to design the experimental procedure that can achieve the objectives set, past
studies were reviewed in order to help with the placement of sensors, type of data
collections, method of data processing and also the type of torque monitoring system that
is currently on use.
There are not many studies that used ANN to detect muscle fatigue and there are no
studies on ANN that detect torque during a standing experiment with FES. We can
conclude that the time domain will be used due to the simple processing method such as
RMS and also frequency domain mostly records the frequency of the FES pulse, not the
muscle contraction. ANN was chosen as the monitoring system due to lack of previous
studies and the simple MLP can be trained without the need for a high number of training
data.
Univers
ity of
Mala
ya

39
CHAPTER 3: METHODOLOGY
The aim of this study was to first design an artificial neural network (ANN) that could
be used to predict the torque exerted by the quadriceps muscle by taking inputs from the
MMG parameters, namely the RMS and ZC. The models had been designed to predict
the knee torque during FES isometric knee extension. The next step was to apply the ANN
models to FES standing activity. Second, we aimed to determine the accuracy and
reliability of the ANN models based on RMS and RMS-ZC as inputs in predicting the
knee torque produced by the quadriceps in FES isometric knee extension and FES
standing. Finally, this study aimed to compare the ANN model’s performance to
determine the input that best fit into the ANN model for isometric knee extension and
standing. In other words, the ANN accuracy to predict torque produced by the quadriceps
was tested during FES isometric knee extension and the developed model was tested in
FES standing activity. It was hypothesized that the knee extension torque could be
modeled through MMG-derived RMS and ZC, which would enable the prediction of
torque in activities where torque cannot be physically measured, such as upright stance.
This chapter discussed the participants, medical ethics, equipment, experimental setup,
and the processing method used in view to achieving the objectives set in the introduction
chapter of the study.
The methodology was divided into three components, the first being data collection
where the SCI study participants performed electrical stimulation-evoked isometric knee
extension to obtain their muscle MMG signal parameters and torque. The second part was
ANN model development and signal processing of the captured MMG data signal
obtained from the first phase to prepare the signal as input for the ANN model. The third
phase was the utilization of the ANN model in an actual FES-evoked standing experiment
performed by the SCI participants.
Univers
ity of
Mala
ya

40
3.1 Participants
The subjects for this experiment were five individuals with SCI (ISNCSCI A and B)
who were trained FES users and non-sensate due to the sensory deficit of their injury. The
subjects were briefed about the research protocol before providing their informed consent
to participate. Table 3.1 describes the subjects that were used to obtain the data set for
training data, testing data and standing data sets.
Table 3.1 Subject distribution for ANN design and standing procedure
Subject ANN Design Standing Procedure
1 / /
2 / /
3 /
4 /
5 / /
3.2 Medical Ethics
The data collection for the first phase of the experiment was approved by the
University of Malaya Medical Centre Medical Research Ethics Committee (Ethics
Number: 1003.14 (1)) and the standing experiment had been approved by the University
of Malaya Medical Centre Medical Research Ethics Committee (MECID.NO: 20164-
2366).
3.3 Phase 1: Knee Extension Training data collection
This experiment was conducted to obtain the mechanical signal and torque during an
isometric FES contraction of the quadriceps muscle in three SCI individuals. The torque
data were recorded with a dynamometer (System 4; Biodex Medical System, Shirley, NY,
Univers
ity of
Mala
ya

41
USA) and the MMG data were recorded on MMG sensor (Sonostics BPS-II VMG
transducer, sensitivity 30V/g). The subjects were asked to complete the isometric knee
extension protocol for two sessions with 48 hours between each session of data collection.
The experiment was conducted at the Department of Rehabilitation Medicine, University
Malaya Medical Centre.
The data obtained from the experiment were then used as the foundation to design a
neural network system in MATLAB toolbox to predict torques. The neural networks were
tested on with the MMG data obtained during the FES standing contraction without torque
data in Phase 3. The next phase of the experiment involved training the system and
validating the system.
3.3.1 Equipment & Materials
The validation of the ANN model was done by comparison with isometric knee torque
data obtained from the commercially available dynamometer (System 4; Biodex Medical
System, Shirley, NY, USA). The test protocol set on the dynamometer was Isometric knee
extension and 900 seconds of recovery between each trial. Three trials were conducted
for each for the left leg and right leg. The isometric contraction angle was set at 30⁰ from
the straight leg position.
3.3.2 FES evoked muscle contractions and knee torque measurement
The subjects were familiar with the FES activity and therefore no familiarization
session was done prior to data collection. The FES stimulation of square-wave pulses was
provided at 30 Hz and 200µs pulse duration with the stimulation current of 100mA. The
stimulation was provided by a commercial neurostimulator (RehaStimTM, Hasomed
GmbH, Magdeburg, Germany). Electrodes used in this experiment were 9 x 15 cm2 self-
adhesive electrodes.
Univers
ity of
Mala
ya
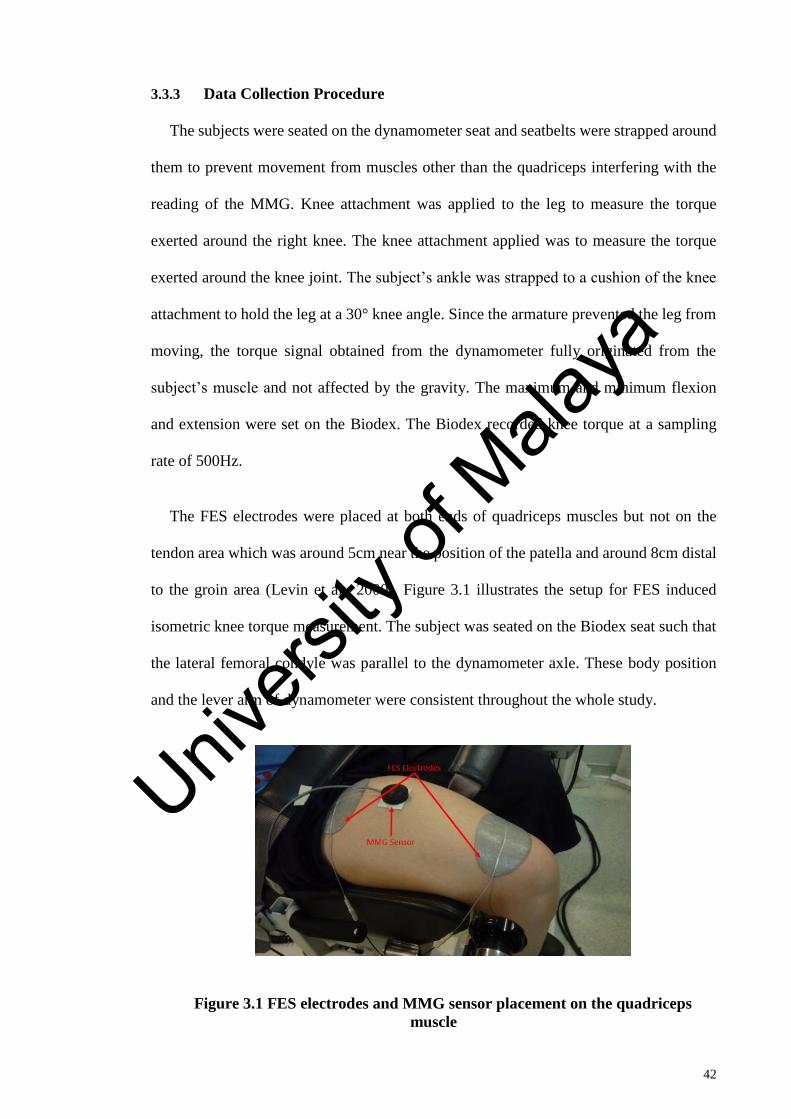
42
3.3.3 Data Collection Procedure
The subjects were seated on the dynamometer seat and seatbelts were strapped around
them to prevent movement from muscles other than the quadriceps interfering with the
reading of the MMG. Knee attachment was applied to the leg to measure the torque
exerted around the right knee. The knee attachment applied was to measure the torque
exerted around the knee joint. The subject’s ankle was strapped to a cushion of the knee
attachment to hold the leg at a 30° knee angle. Since the armature prevented the leg from
moving, the torque signal obtained from the dynamometer fully originated from the
subject’s muscle and not affected by the gravity. The maximum and minimum flexion
and extension were set on the Biodex. The Biodex recorded knee torque at a sampling
rate of 500Hz.
The FES electrodes were placed at both ends of quadriceps muscles but not on the
tendon area which was around 5cm near the position of the patella and around 8cm distal
to the groin area (Levin et al., 2000). Figure 3.1 illustrates the setup for FES induced
isometric knee torque measurement. The subject was seated on the Biodex seat such that
the lateral femoral condyle was parallel to the dynamometer axle. These body position
and the lever arm of dynamometer were consistent throughout the whole study.
Figure 3.1 FES electrodes and MMG sensor placement on the quadriceps
muscle
Univers
ity of
Mala
ya
43
Once the dynamometer setting was set, the dynamometer guided the knee attachment
to 30⁰ knee flexion. The MMG was started first while the dynamometer torque recording
and FES stimulation were started simultaneously after. The recording of the
dynamometer, MMG, and the simulation was stopped once the torque reading reached
well below 50% of the maximum torque and the recovery period began. The same
procedure was repeated on the other leg once the third trial had ended with the same
settings for dynamometer and Rehamed as well as the recovery period. The subject then
repeated the same procedure after 48 hours. To ensure high day-day reproducibility of the
protocol, the same researchers and physiotherapists were involved in the experiment for
all subjects.
3.3.4 MMG acquisition and processing
Muscle mechanical signals were recorded with the accelerometer sensor. The MMG
sensor was placed right on the muscle belly and held onto the muscle belly with a double-
sided tape (3M 157 Center St. Paul, MN, USA). Acqknowledge v4.3 data acquisition and
analysis software (MP150, BIOPAC Systems, Santa Barbara, CA, Inc) were used to
collect the data at 1k Hz frequency. The signal was then filtered with a bandpass filter
(20Hz lower cutoff frequency and 200Hz higher cutoff frequency).
The dataset processed from the MMG signal could be in the time or the frequency
domain. In the time domain, the amplitude is identified as the voltage values and the
amplitude was retrieved as RMS. The amplitude is importantly known as the variables in
motor unit recruitment during a contraction process (Orizio, Gobbo, Diemont, Esposito,
& Veicsteinas, 2003).
The RMS was the magnitude of the measurement obtained by the MMG and the data
was in the time domain. Both parameters (RMS and torque) were then scaled to values in
the range of 0 to 1 to simplify the data for preprocessing step for the ANN. The MMG-
Univers
ity of
Mala
ya
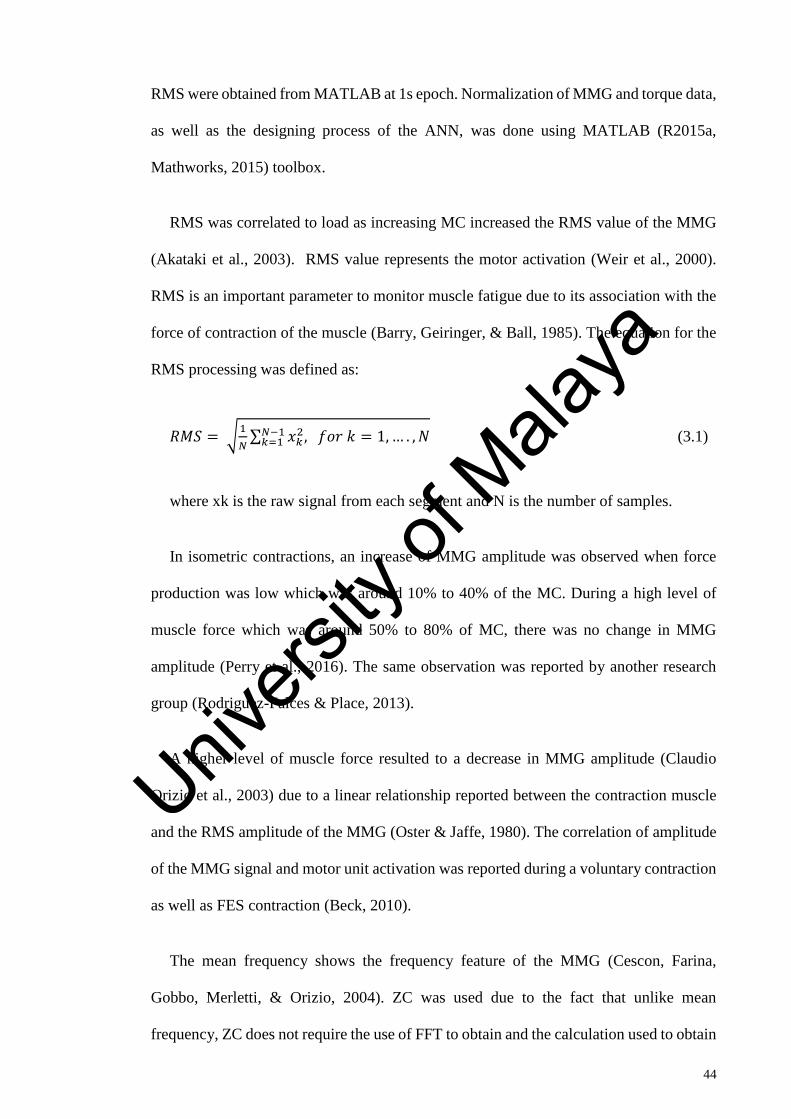
44
RMS were obtained from MATLAB at 1s epoch. Normalization of MMG and torque data,
as well as the designing process of the ANN, was done using MATLAB (R2015a,
Mathworks, 2015) toolbox.
RMS was correlated to load as increasing MC increased the RMS value of the MMG
(Akataki et al., 2003). RMS value represents the motor activation (Weir et al., 2000).
RMS is an important parameter to monitor muscle fatigue due to its association with the
force of contraction of the muscle (Barry, Geiringer, & Ball, 1985). The equation for the
RMS processing was defined as:
𝑅𝑀𝑆 = √1
𝑁∑ 𝑥𝑘
2, 𝑓𝑜𝑟 𝑘 = 1, … . , 𝑁𝑁−1𝑘=1 (3.1)
where xk is the raw signal from each segment and N is the number of samples.
In isometric contractions, an increase of MMG amplitude was observed when force
production was low which was around 10% to 40% of the MC. During a high level of
muscle force which was around 50% to 80% of MC, there was no change in MMG
amplitude (Perry et al., 2016). The same observation was reported by another research
group (Rodriguez-Falces & Place, 2013).
A higher level of muscle force resulted to a decrease in MMG amplitude (Claudio
Orizio et al., 2003) due to a linear relationship reported between the contraction muscle
and the RMS amplitude of the MMG (Oster & Jaffe, 1980). The correlation of amplitude
of the MMG signal and motor unit activation was reported during a voluntary contraction
as well as FES contraction (Beck, 2010).
The mean frequency shows the frequency feature of the MMG (Cescon, Farina,
Gobbo, Merletti, & Orizio, 2004). ZC was used due to the fact that unlike mean
frequency, ZC does not require the use of FFT to obtain and the calculation used to obtain
Univers
ity of
Mala
ya
45
ZC is a simple one (Hagg, 1991). ZC has been defined as the number of times that the
MMG signal passed through the horizontal amplitude axis (Zecca, Micera, Carrozza, &
Dario, 2002). The equation (3.2) for ZC was as follows:
𝑍𝐶 = ∑ 𝑠𝑔𝑛(−𝑥𝑘𝑥𝑘+1), 𝑓𝑜𝑟 𝑘 = 1, … 𝑁 𝑠𝑔𝑛(𝑥) = {1 𝑖𝑓 𝑥 > 0
0 𝑜𝑡ℎ𝑒𝑟𝑤𝑖𝑠𝑒𝑁𝑘=1 (3.2)
where xk was the raw signals of the of the segment and N was the number of samples.
Both MMG-RMS and ZC were taken at the sample rate of N = 1000. While the torque
data from the Biodex were averaged to get the mean torque for every 500 torque samples.
This was done to obtain the reading of torque, MMG-RMS, and ZC for every second
during the stimulated contraction for synchronization.
3.4 Phase 2: Neural Network development
3.4.1 Training data processing and neural network development
The Neural Network system was designed using MATLAB 2015 using the Neural
Network fitting toolbox. The ANN system takes MMG inputs to predict the onset of
muscle fatigue. Two types of ANN models were developed based on the two types of data
sets used to train the model, the first was normalized MMG-RMS only and the second
type was normalized MMG-RMS together with normalized MMG-ZC. RMS and RMS-
ZC were used as the input for the neural network training and the normalized torque was
used for the target data for the desired output of the network. The ANN is trained by
feeding the RMS and RMS-ZC signals along with the desired signal data, torque output
from the Biodex to the models. The samples obtained from the first session of the 3
subjects were used as training samples. A software G-power was used to determine the
suitability of the number of subjects used. Using a priori correlation test with a minimum
number of 0.90 correlation of probability which means if the experiment is repeated on
similar number of subjects and subject’s status, the results will have 90% probability of
Univers
ity of
Mala
ya

46
giving similar outcome, the minimum probability of the number of subjects to give false
positive and false negative which were 0.05 and 0.20 respectively, and 0.80 effect size
which is to determine if the selected number of subjects are suitable to emulate small or
large number of sample. Effect size of 0.8 is the minimum size to represent a large effect
on the population (Cohen, 1988). Based on above requirement, at least 6 to 8 samples
were minimally required statistically thus this study employed 18 training data and 12
testing samples of various sample size to test the accuracy of the neural network system.
The testing samples were obtained from the second session of the experiment for two of
the subjects. The samples were arranged in a matrix row.
A feed-forward network with sigmoid hidden neurons and linear output neurons was
used for the development of the ANN. The sigmoid transfer function was utilized as a
transfer function due to the transfer function introduced non-linearity to the network’s
calculations as well as it is a simple derivative function (Calcagno et al., 2010). The type
of ANN model developed was the MLP which contained multiple layers of computational
units that were interconnected in a feed-forward manner. The three layers used were the
input layer, hidden layer, and the output layer with a single input layer and output layer.
ANN model training technique involved the output values of the system to be compared
with the correct values thus producing the error between the output and the correct answer
are computed in an error function (Calcagno et al., 2010). The data set that was used for
training and testing the ANN had 516 samples. The percentage of data set was 70%
training samples, 15% validations samples and 15% testing samples. These were the
default settings for the ANN. The number of hidden neurons was set to 10 so that the
output of the ANN models would produce the correlation that is above 0.8.
Univers
ity of
Mala
ya

47
The network was trained with the Levenberg-Marquardt algorithm (Levenberg, 1944):
𝑤 = 𝑤 + ∆𝑤 (3.3)
∆𝑤 = [𝐽𝑇𝐽 + 𝜇𝐼]−1𝐽𝑇𝑒 (3.4)
𝑒 = 𝑅 − 𝑧 (3.5)
where w is the weight vectors, Δw is the differences between the weight vectors, J is
Jacobian matrix that included the first derivatives of the network errors according to the
weight, µ was a scale parameter, I is the identity matrix, R is the vector of measured
torque, z is the vector of predicted torque, and e is a vector of the network errors. Post
neural training, the network was deployed with the MATLAB compiler and Builder tools
to generate a MATLAB function.
3.4.2 Neural network accuracy test
In order to quantify the performance of the two ANN models, a correlation between
the predicted torque output and actual torque output as well as the accuracy of the model
were identified. To achieve the objective, the network was tested with all the normalized
RMS and RMS-ZC from the second session of the 3 subjects. The output torque was then
compared with the actual torque obtained from the Biodex with the ‘fitlm’ function on
MATLAB to obtain the correlation coefficient (r). A critical point of 50% torque drop
was chosen in order to test the accuracy of the ANN model by comparing the time for the
actual torque in each test data samples to reach 50% torque drop and the time for predicted
torque (RMS and RMS-ZC) to reach 50% drop to determine the reliability of the models
to detect a specific torque value. The accuracy was obtained from the equation (3.6).
(1 − |𝑝𝑟𝑒𝑑𝑖𝑐𝑡𝑒𝑑 𝑡𝑜𝑟𝑞𝑢𝑒 𝑡𝑖𝑚𝑒 − 𝑎𝑐𝑡𝑢𝑎𝑙 𝑡𝑜𝑟𝑞𝑢𝑒 𝑡𝑖𝑚𝑒|
𝑎𝑐𝑡𝑢𝑎𝑙 𝑡𝑜𝑟𝑞𝑢𝑒 𝑡𝑖𝑚𝑒) × 100 % (3.6)
Univers
ity of
Mala
ya
48
3.5 Phase 3: testing the neural network model during a standing experiment
with FES
3.5.1 Standing protocol
A standing protocol was executed in order to validate the effectiveness of the ANN
model to predict the onset of muscle fatigue by predicting knee torque during an FES
standing stance in SCI subject. Five individuals with SCI (ISNCSCI A and B) participated
in this component of the study. This protocol has been developed by Ibitoye to measure
different stimulation frequency effects during a prolonged FES standing (Ibitoye, 2016).
All 5 subjects had been familiarized with the FES training and were able to undergo the
stimulation as intended in the protocol.
3.5.2 Equipment and Materials
The FES stimulator that was used in the standing experiment was a commercially
available neurostimulator (RehaStimTM, Hasomed GmbH, Magdeburg, Germany). The
stimulation was channeled to the targeted muscle by 9 x 15 cm2 size surface adhesive
electrodes (RehaStimTM, Hasomed GmbH, Magdeburg, Germany). This protocol was
adapted from the procedure reported by Braz and colleagues, in their study (Braz et al.,
2015). A harness (Biodex Offset Unweighing System) was used to support the subject’s
body and prevent the subject from tumbling. In order to ensure that the harness did not
influence the subject’s weight, researchers ensured that both subject’s feet were flat on
the ground and not hanging above the ground. The muscle mechanical signal during the
standing protocol was recorded with the same MMG accelerometer used in the knee
extension experiments. Data acquisition and signal processing were done digitally
through Acqknowledge v4.3 software (MP150, BIOPAC Systems, Santa Barbara, CA,
Inc).
Univers
ity of
Mala
ya

49
3.5.3 Experimental Procedure
FES standing was achieved by continuous stimulation of both left and right quadriceps
muscle and also the glute muscle. The quadriceps muscles were stimulated in order to
achieve stabilization in the knee extension and glutei was stimulated for hip extension
and upright posture stabilization. The subject was stimulated at quadriceps (80mA) and
glutei (64mA) at 200µs pulse width. The frequency of the stimulation was 35Hz on the
one trial and 20Hz on the other trial. During the stimulation, the changes in the knee bend
were observed with a goniometer. The stimulation and MMG recorded was then stopped
when the knee reached 30º flexion and the subject was then given a 30-min recovery
period between the two trials. The MMG signals obtained from the standing protocol was
processed similarly to the signal processing in isometric knee extension.
Figure 3.2 Standing Experiment (A) at the beginning of the experiment the legs
were straight due to FES stimulation. (B) The knee approaching 30º flexion.
3.5.4 Data Processing
The MMG signal data was bandpass filtered (20Hz to 200Hz) and the data was then
processed to obtain the normalized RMS and ZC. The time taken for the RMS to drop to
70%, 50% and 30% of the maximum RMS is taken for t-test comparison with the time
Univers
ity of
Mala
ya

50
taken for the knee bend to reach 30º. This was to determine if the RMS alone was sensitive
enough to the changes in torque to maintain the knee angle above the 30º mark. The RMS
and RMS-ZC data set were then used as inputs for the ANN models respectively to obtain
the predicted torque.
A point where changes in the gradient of the predicted output had been selected as a
critical point from both sets of predicted torque to determine the consistency between
both models to predict the critical point at a similar time and predicted torque value. The
time taken to the critical point was normalized in the range of 0% to 100% stimulation
time for all subjects because the overall experiment time differs for each trial and the
torque value at the critical point from each standing subject were used in t-test to
determine its significance and in order to determine the effectiveness of the ANN to
predict knee torque and to compare between the two types of input, few hypotheses had
been established to determine the behavior of ANN in standing protocol was similar to
isometric knee extension.
The hypotheses were (i) the initial torque predicted would be higher than the final
torque predicted, (ii) the predicted torque output pattern would be reduced throughout the
stimulation and (iii) the pattern of RMS and ZC before and after the 50% torque drop
point would not be the same. To confirm the hypotheses, t-test was used to identify the P
values of the following pairs; Initial and Final predicted torque, the gradient of MMG-
RMS and MMG-ZC before and after the point where the ANN models predicted a 50%
torque drop where there should be a noticeable change to the gradient of MMG-RMS and
MMG-ZC once the predicted torque from each model had reached a 50% torque drop
from the maximum, and the gradient of the predicted torque. The statistical analysis was
done on PSPP (1.0.1, GNU operating system, 2017).
Univers
ity of
Mala
ya

51
3.6 Summary
The methodology involved 5 SCI (ISNCSCI of A and B), the first phase involved 3
SCI subjects and the third phases used all 5 subjects. The data collections sessions were
done in UMMC under the supervision of physiotherapists.
The experiment was divided into 3 phases. All data collection sessions involved
applying FES to the subject’s quadriceps muscle. The first one was to obtain the training
data necessary to develop a model to predict knee torque by accessing MMG inputs. The
data collection procedure involves applying FES on the subject while seated on the
Biodex to record the torque revolves around the knee joint.
The second part was to train the model by using the data obtained from the first page
where the raw MMG data were processed into MMG-RMS and MMG-ZC. These two
parameters were used as input for the training model and the torque data obtained from
the same session were used as the target data.
The third part of the experiment was the utilization of the ANN model to predict the
torque and muscle ability to maintain the standing pose in the FES-evoked standing
protocol in SCI subjects. In order to determine the accuracy and the efficiency of the ANN
in predicting the knee torque, 3 hypotheses were introduced. The torque output from the
2 ANN models was tested based on the hypotheses.
Univ
ersity
of M
alaya

52
CHAPTER 4: RESULTS
The results chapter showed data collected throughout the experiment and the results
of the test conducted to interpret the data. The first part of the results section presents the
normalized MMG-RMS, normalized MMG-ZC, and comparison between the predicted
muscle torque output from the ANN and the actual torque output from the dynamometer.
The comparison was done in terms of the correlation and the accuracy of the ANN output
with 2 types of input (RMS and RMS-ZC). The second part of the result section presents
the normalized MMG-RMS, normalized MMG-ZC, the ANN training results and the t-
test results of the hypotheses to determine the effectiveness of the ANN to predict the
knee torque during a standing contraction
4.1 MMG Data Processing
Figure 4.1 shows the raw MMG data obtained from the knee extension training
exercise.
Figure 4.1 Raw MMG Data for Subject 1 Day 1 Left Trial 1
Univers
ity of
Mala
ya

53
MMG recorded a short time but a significant spike of MMG amplitude (Up to 8 Vmg
unit) at the start of the contraction. The MMG unit then began to stabilize itself to the
range of ±2 VMG units. The MMG value then started a steady decline until it reached a
value close to 0.
The raw MMG data were processed into MMG-RMS and MMG-ZC and then
normalized. The processed MMG dataset is presented in Figure 4.2 while Figure 4.3
illustrates the predicted output torque produced by the neural network model and the
actual output torque measured by the dynamometer during the data collection part of the
research where Model 1 is the ANN model that used RMS as input and Model 2 used
RMS-ZC as input. Due to the normalization, the maximum point in the graph was 1 and
the minimum point was 0.
Figure 4.2 Normalized MMG-RMS and Normalized MMG-ZC against time
used to be as training data for ANN development from Subject 4 Session 1, Left leg
trial 1.
Figure 4.2 shows RMS gradually decreased from the maximum as the stimulation
continues and ZC shows a dramatic increase in the frequency of muscle contraction after
a certain period towards the end of the session. The gradient of the RMS decrease differed
from the start and towards the end of the contraction. The normalized MMG-RMS had a
Univers
ity of
Mala
ya

54
steady decline from the maximum until it reached the value of around 0.2 normalized
MMG-RMS which it was then stabilized around that value. In contrast, RMS ZC exhibits
a steady value until the 29th-second mark where it rised at a significant value and then
dropping around the 38th-second mark.
4.2 Neural Network Training
The two figures below are the results from the training of ANN. Figure 4.3 shows the
accuracy training for the Model 1 (RMS). The target data was the actual torque obtained
from the Biodex and the output is the value predicted by the ANN model.
Figure 4.3 Training Results for ANN traning Model 1 (RMS)
Univers
ity of
Mala
ya

55
The correlation results from the model 1 training yielded 0.82, 0.83 and 0.85 for
Training, Validation and Testing Data sets respectively. Overall the correlation between
the output data sets and the target data set for Model 1 training was 0.82.
Figure 4.4 shows the training results for Model 2 (RMS + ZC). The correlation
between the target data set and output were 0.85 for training, 0.89 for validation and 0.84
for testing. Overall, the correlation was 0.85.
Figure 4.4 Training Results for ANN traning Model 2 (RMS + ZC)
Univers
ity of
Mala
ya

56
4.3 Model Output of Torque
From the Figure 4.5, the torques from ANN Model 1 and Model 2 are presented on a
graph with the actual torque collected from the Biodex.
Figure 4.5 Normalized torque measurement from Biodex dynamometer and the
predicted torque from two ANN models from Subject 4 Session 1, Left leg trial 1
All three graphs exhibit a decline from the maximum although the actual torque has
the smoothest decline among all the 3 parameters.
4.4 Torque and predicted torque from isometric contraction testing
The accuracy of the ANN model to predict the measurement of torque was first tested
on isometric knee extension prior to the standing experiment.
Univers
ity of
Mala
ya

57
The correlation and the accuracy of the ANN model to predict the torque in both
subject 1 and 2 have been tabulated in Table 4.1 which shows the mean accuracy and
correlation between the two types of inputs.
Table 4.1 Average correlation (R) and accuracy test for two type of ANN models
to predict torque during FES isometric knee extension
ANN model input
Model 1: RMS Model 2: RMS-ZC
R 0.87 ± 0.11 0.84 ± 0.13
Accuracy (%) 79 ± 14 86 ± 11
4.5 Testing the ANN model in FES standing protocol to predict torque
A series of 2-tailed t-test was performed to determine whether the time taken for
MMG-RMS to drop to a certain level was significantly different than the time taken for
the knee angle to reach 30º at the end of stimulation. The results from the t-test are
presented in Table 4.2.
Table 4.2 T-test significance values for time to reach 30%,50% and 70% of
MMG-RMS drop compared to the time to 30-degree knee buckle.
MMG-RMS % P-value
30% MMG-RMS drop vs 30º knee angle 0.01
50% MMG-RMS drop vs 30º knee angle 0.01
70% MMG-RMS drop vs 30º knee angle 0.02
Univers
ity of
Mala
ya

58
Figure 4.6 shows the predicted torque, which was the output from the ANN model,
where model 1 was based on RMS as input and model 2 was from the RMS-ZC input.
4.6 ANN Torque Monitoring in Standing Protocol.
Figure 4.6 shows the torque output from Model 1 and Model 2 in a Trial 1 for subject
5. Both torque outputs from the 2 models initially showed a decline for the first 10
seconds.
Figure 4.6 Normalized predicted torque for a standing protocol for Subject 5
Trial 1
However, after 10s-mark, model 1 exhibited a steeper decline than the model 2 which
was more stable compared. At the end of the data collection, there was an opposite
response from the 2 models recorded. Model 1 shows an increase of torque while model
2 shows a decline in torque.
Univers
ity of
Mala
ya
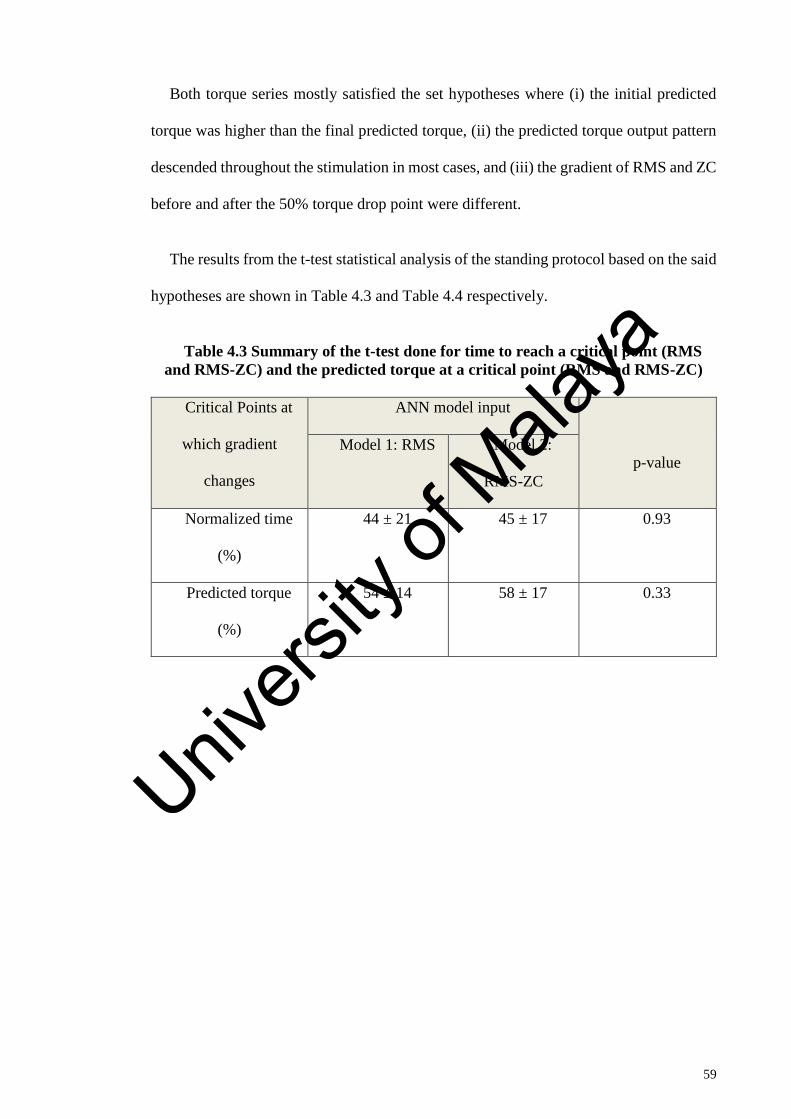
59
Both torque series mostly satisfied the set hypotheses where (i) the initial predicted
torque was higher than the final predicted torque, (ii) the predicted torque output pattern
descended throughout the stimulation in most cases, and (iii) the gradient of RMS and ZC
before and after the 50% torque drop point were different.
The results from the t-test statistical analysis of the standing protocol based on the said
hypotheses are shown in Table 4.3 and Table 4.4 respectively.
Table 4.3 Summary of the t-test done for time to reach a critical point (RMS
and RMS-ZC) and the predicted torque at a critical point (RMS and RMS-ZC)
Critical Points at
which gradient
changes
ANN model input
p-value Model 1: RMS Model 2:
RMS-ZC
Normalized time
(%)
44 ± 21 45 ± 17 0.93
Predicted torque
(%)
54 ± 14 58 ± 17 0.33
Univers
ity of
Mala
ya
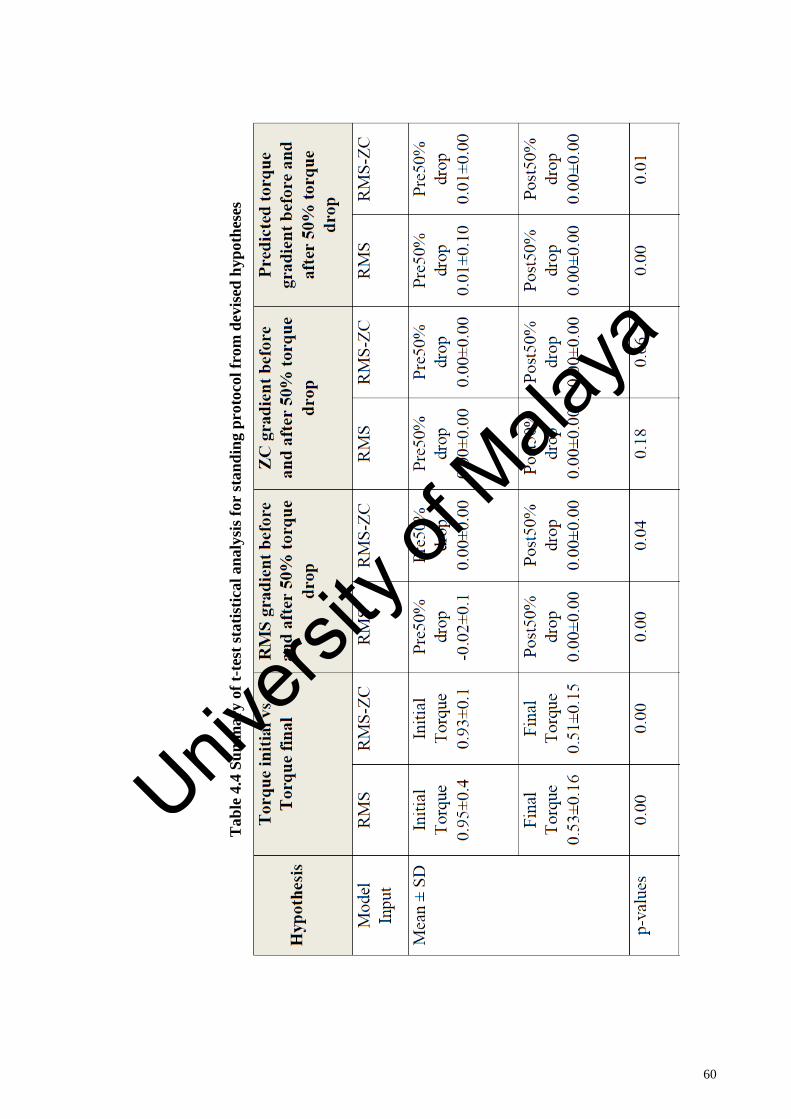
60
Tab
le 4
.4 S
um
ma
ry o
f t-
test
sta
tist
ical
an
aly
sis
for
stan
din
g p
roto
col
fro
m d
evis
ed h
yp
oth
eses
Univers
ity of
Mala
ya

61
4.7 Summary
In summary, the MMG showed a depreciation in values as the time goes on. There was
a short burst of high amplitude MMG at the instance where the experiment started. This
value was not taken into consideration in this study. MMG-RMS and MMG-ZC showed
changes to the signal at lower values of torque. MMG-RMS decreased at a steady rate
and finally settled while RMS ZC started at a steady rate and experienced a significant
increase in the value.
The ANN training results showed that the ANN models were able to predict the knee
torque output at a satisfactory performance with 0.82 and 0.85 correlation with the actual
torque for Model 1 and Model 2 respectively. Model 1 and Model 2 possessed a similar
trend to the actual torque output from the Biodex where the values of the 3 graphs
decrease. This, however, the two models’ torque output was not showing a smooth decline
as the actual torque.
There were high correlations of the torque outputs from the two models respectively
and the actual torque output. Model 1 has a correlation of 0.87 ± 0.11 while Model 2 has
0.84 ± 0.13. However, Model 2 has a higher accuracy% of 86 ± 11 compared to 79 ± 14
in Model 1. There was no significant difference between the time taken for the MMG-
RMS to record a significant drop and the time where the knee drop reaches 30º knee drop.
In standing procedure, the torque output from the 2 models was discussed and the
differences are explained.
Univers
ity of
Mala
ya

62
CHAPTER 5: DISCUSSION
This chapter critically discussed the results obtained from the procedure. There were
4 sections in this chapter. The first part discussed the relationship of the MMG to the
torque and fatigue. The second section discussed the test results of the hypotheses, the
third section discussed the performance of the two ANN models in estimating the torque
and finally, the fourth section discussed the limitation of the study.
5.1 MMG relationship to torque and fatigue
5.1.1 MMG-RMS to fatigue
The MMG amplitude was a recognizable way to see the relation between MMG and
net torque as the decrease of the net torque correlated to the decrease of MMG (Gobbo et
al., 2006). The relationship of MMG to the strength of muscle contraction has been
established by researchers such as Kimura and Beck (Beck et al., 2005; Kimura et al.,
2004). They discovered that with involuntary and electrically evoked contraction, the
level of force generated possesses a linear relationship to the RMS amplitude of the
MMG. The findings from Kimura and Beck supported the results from the first phase of
the experiment where at lower torque level recorded by the Biodex in Figure 4.3 (Torque
< 50N.m), the MMG-RMS in Figure 4.2 also recorded a decrease.
In Table 4.2, there were highly significant differences (P < 0.01) between 30% and
50% RMS drop to the 30° knee bend during the standing protocol, a 70% drop, however,
has a slightly higher chance (P > 0.02) to have the similar timing with the knee buckle of
30°. High significant differences show that at any point where the MMG-RMS dropped
by 30% and 50%, there was a low confidence level that this occurs during the knee buckle.
70% RMS drop shows a higher confidence that it occurs at the same time the knee
buckles.
Univers
ity of
Mala
ya

63
5.1.2 MMG-ZC to fatigue
The increase of MMG-ZC at lower torque values indicates that the muscle contracts at
a higher frequency. This can be seen in Figure 4.2. This observation occurred due to the
size principle where the muscle recruitment started from small, slow motor unit towards
increasingly larger and faster motor unit (Henneman, Somjen, & Carpenter, 1965). This
pattern also supported the finding from Feiereisen (1997) that the pattern of muscle
recruitment from small, slow motor unit to bigger and faster motor unit occurs during
FES muscle contraction (Feiereisen, Duchateau, & Hainaut, 1997). The increased
frequency of the contraction was used as the point where fatigued started to occur which
was due to the larger motor units that has a bigger diameter axon and are more prone to
fatigue (Bickel, Slade, & Dudley, 2004). This was the point that was used as the endpoint
for the point where the muscle was no longer able to maintain its current strength,
position, or stance, as the muscle fiber reached the end of its endurance limit.
5.2 Test for hypotheses
5.2.1 Initial Predicted torque against final predicted torque
Individually, for the first hypothesis in the standing protocol that was the initially
predicted torque was significantly different than the final predicted torque, both RMS
input and RMS-ZC input revealed that they are significantly different (P<0.01). The
difference shows that at 30° knee bend, there was a distinguishable difference between
the mean torque output of all the sessions. The torque at the 30° knee bend was
significantly lower than during the initial torque on average for all subjects. The
difference is due to the rapid muscle fatigue leads to decrease of RMS and an increased
frequency of muscle contraction based on the finding in isometric knee extension (Barry
et al., 1985).
Univers
ity of
Mala
ya

64
5.2.2 Changes to MMG-RMS and RMS-ZC Signals at Lower Torque Output
The second hypothesis that the ANN predicted at 50% quadriceps torque or lower,
there was a significant change towards the pattern of RMS where the RMS decreases at
the steeper slope and ended up plateauing (gradient is near 0). However, t-test for
prediction for both RMS input and RMS-ZC input for the gradient of ZC before and after
the predicted 50% torque drop shows that there was no strong significant difference, the
P-value for Model 1 was 0.18 and the P-value for Model 2 was 0.66. Compared to
isometric knee extension protocol, the standing protocol did not stabilize the legs, and
this caused the legs to move and this movement possibly caused the changes in amplitude
in the ZC value.
RMS input showed better reliability in predicting muscle fatigue compared to RMS-
ZC input due to less disturbance to RMS when there was a leg movement. However, ZC
input was able to provide a frequency domain of the muscle contraction as an increased
number of contraction indicated the recruitment of fast twitch muscle fiber which was
less endurance to fatigue compared to slow twitch fiber (Karlsson, Sjodin, Jacobs, &
Kaiser, 1981). ZC together with RMS a better model can be developed that combines
both temporal and spectral domain of the muscle signal.
5.2.3 Gradient Pattern of Predicted Torque
The fourth hypothesis was that the gradient of predicted torque for both models of
ANN is decreasing throughout the experiment. The RMS input showed a slightly more
significant difference compared to RMS-ZC input. Although from Table 4.1 both models
showed the same consistency in predicting the torque generally, ANN model performance
were different during the fatigued period of the standing experiment where Model 1 had
an increased in torque and vice versa in Model 2.
Univers
ity of
Mala
ya

65
5.3 ANN Models in Predicting Torque
From Table 4.3, the t-test results of P=0.93 indicated no significant difference between
the time taken for the predicted torque output pattern to reach the point where there are
significant changes to the pattern of the actual torque obtained from the Biodex
dynamometer. The value of the predicted torque at the critical time from both models
were not significantly different from the value of the torque obtained from the
dynamometer with a p-value of 0.33. This indicated that in general both models
performed with a consistent level of prediction.
From table 4.4, the ANN models produced torque output during a seated isometric
contraction that is almost similar in term of correlation and accuracy, both RMS input and
RMS-ZC input has high correlation (R > 0.80) while RMS input has a slightly higher
correlation of 0.87±0.11 compared to RMS-ZC of 0.84±0.13. Higher accuracy from
RMS-ZC input was due to an increase of ZC value past ~50% of maximum torque. This
was because of the transformation of fatigue resistant slow twitch muscle fiber to less
fatigue resistant fast twitch muscle fiber (Bickel, Slade, Van Hiel, et al., 2004; Karlsson
et al., 1981). This suggests that ANN is a feasible strategy to predict torque without the
need of dynamometer.
RMS input showed better reliability in predicting muscle fatigue compared to RMS-
ZC input due to less disturbance to RMS when there is a leg movement. However, ZC
input was able to provide a frequency domain of the muscle contraction as an increased
number of contraction indicated the recruitment of fast twitch muscle fiber which was
less endurance to fatigue compared to slow twitch fiber (Karlsson et al., 1981). ZC
together with RMS a better model can be developed that combines both temporal and
spectral domain of the muscle signal.
Univers
ity of
Mala
ya
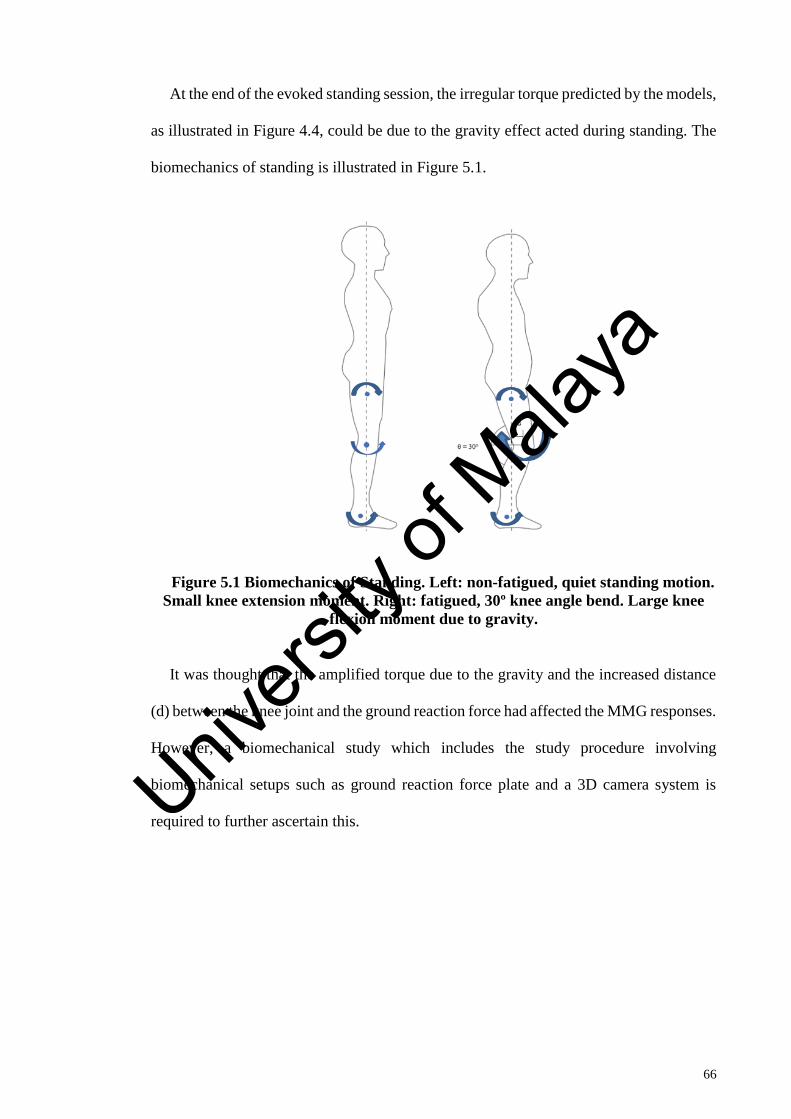
66
At the end of the evoked standing session, the irregular torque predicted by the models,
as illustrated in Figure 4.4, could be due to the gravity effect acted during standing. The
biomechanics of standing is illustrated in Figure 5.1.
Figure 5.1 Biomechanics of Standing. Left: non-fatigued, quiet standing motion.
Small knee extension moment. Right: fatigued, 30º knee angle bend. Large knee
flexion moment due to gravity.
It was thought that the amplified torque due to the gravity and the increased distance
(d) between the knee joint and the ground reaction force had affected the MMG responses.
However, a biomechanical study which includes the study procedure involving
biomechanical setups such as ground reaction force plate and a 3D camera system is
required to further ascertain this.
Univers
ity of
Mala
ya
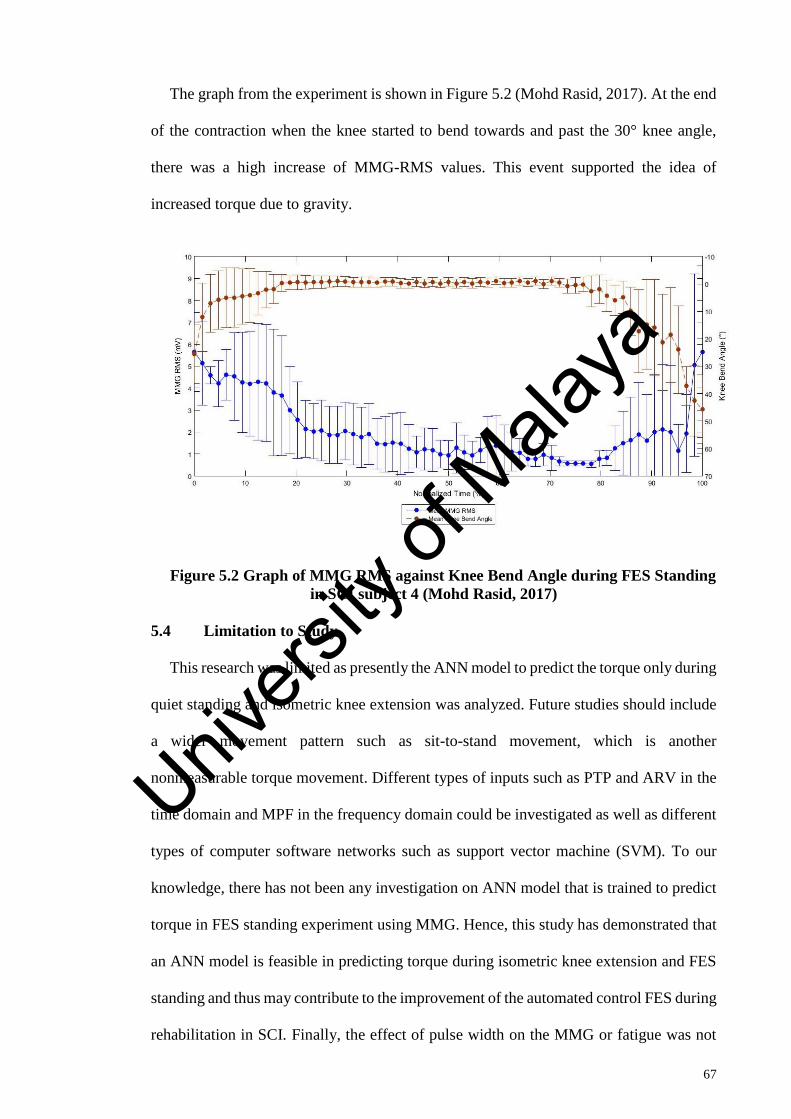
67
The graph from the experiment is shown in Figure 5.2 (Mohd Rasid, 2017). At the end
of the contraction when the knee started to bend towards and past the 30° knee angle,
there was a high increase of MMG-RMS values. This event supported the idea of
increased torque due to gravity.
Figure 5.2 Graph of MMG RMS against Knee Bend Angle during FES Standing
in SCI subject 4 (Mohd Rasid, 2017)
5.4 Limitation to Study
This research was limited as presently the ANN model to predict the torque only during
quiet standing and isometric knee extension was analyzed. Future studies should include
a wider movement pattern such as sit-to-stand movement, which is another
nonmeasurable torque movement. Different types of inputs such as PTP and ARV in the
time domain and MPF in the frequency domain could be investigated as well as different
types of computer software networks such as support vector machine (SVM). To our
knowledge, there has not been any investigation on ANN model that is trained to predict
torque in FES standing experiment using MMG. Hence, this study has demonstrated that
an ANN model is feasible in predicting torque during isometric knee extension and FES
standing and thus may contribute to the improvement of the automated control FES during
rehabilitation in SCI. Finally, the effect of pulse width on the MMG or fatigue was not
Univers
ity of
Mala
ya

68
studied in this research, however, other literature suggested that the pulse width has no
significant effect on the muscle fatigue but it affects the maximum muscle force
production (Jailani & Tokhi, 2012).
5.5 Summary
This study sought to investigate the practicality of using ANN models to predict the
knee extension torque during isometric contraction and standing stance using RMS and
RMS-ZC as inputs to the ANN. The testing on isometric knee extension revealed that the
ANN model used to predict knee torque from the MMG muscle signal of the quadriceps
muscle was reliable. RMS-ZC input ANN model showed a higher accuracy compared to
RMS input ANN model which shows that in isometric knee extension, RMS-ZC was
more suitable than RMS as input to the ANN model. This also suggests that ANN is a
feasible strategy to predict torque without the need of dynamometer.
The transformation explains the ZC graph where the increase in the number of
contraction leads to the decrease of torque recorded by the dynamometer. However,
model 2 has a higher accuracy compared to model 1 (79±14% for model 1 compared to
86±11% for model 2). This result reflected increased ZC value due to the higher
frequency of contraction due to the torque drop of 50% and recruitment of faster, more
fatigable motor unit.
Univers
ity of
Mala
ya

69
CHAPTER 6: CONCLUSION
As for the conclusion, FES is a valuable rehabilitation training method to help SCI
patients partially or fully recover from the injury. FES helped rehabilitation process by
facilitating blood flow and prevent muscle atrophy. However, there is a need for a
monitoring system for SCI training with FES. This is vital to maximize the effectiveness
of the training while minimizing the risk of injury to the patient. There are many methods
to monitor muscle performance during FES training from monitoring joint angle and
torque to using sensors such as EMG and MMG.
However, in FES evoked standing stance, measuring the torque generated around the
knee joint is not practical due to lack of suitable attachment of the Biodex dynamometer
that enabled such feat. Hence, MMG was used with ANN to enable prediction of the
muscle fatigue. To develop the ANN for monitoring knee torque, the ANN must first be
trained with known desired output in order to map the input of the MMG to the unknown
knee torque.
MMG data from the data collection procedure must first be processed before training
and 2 parameters of the MMG was extracted which were RMS and ZC. RMS shows the
muscle strength based on its amplitude while ZC presents the frequency of the muscle
vibration.
Testing of both data showed a high accuracy and reliability on monitoring knee torque
in standing stance FES contraction. However, while Model 1 showed a better reliability
in predicting torque due to the less disturbance from movement artifact, Model 2 reflects
the frequency domain of the muscle as well leading to a more critical representative of
the torque and the muscle fatigue.
Univers
ity of
Mala
ya

70
The limitations of the study were acknowledged. More actions such as sit to stand,
cycling can be trained with similar ANN model. This is to enable a wider range of motion
where the usage of ANN to predict muscle fatigue can be used. Different parameters of
MMG can be used and the performance of such a model can be compared to the one from
this study.
Overall, the results of the study show that ANN can be useful in the field of
rehabilitation where the muscle performance can be assessed when the commercially
available equipment was not suitable to be used. In addition, the study could be used as a
basis for an online FES model that can identify and predict the knee torque. This would
enable a better control for FES that will significantly increase the effectiveness of the FES
training.
6.1 Recommendations for future work
As for the recommendations for the future work of this study, there are 3 potential
areas that can be explored to further improve the research. First, more subjects can be
recruited in order to have a higher number of training data to enable higher more
generalized results on the population of SCI. Second, a prediction based on knee angle
and MMG would have a better effect on determining muscle fatigue in FES evoked
standing stance and third, the integration of the ANN model with FES to enable control
and safety to the patients during FES training such as gradually lower down the current
intensity when the muscle is approaching fatigue to have a longer duration of the
contraction.
Univers
ity of
Mala
ya
71
REFERENCES
Agnello, D. (2011). New-Generation Fully Programmable Controller For Functional
Electrical Stimulation Applications. University of Toronto.
Ahmad, M. K. I., Ibrahim, B. S. K. K., Rahman, K. A. A., Masdar, A., Nasir, N. H. M.,
& Mahadi Abdul Jamil, M. (2012). Knee joint impedance hybrid modeling and
control of functional electrical stimulation (FES)-cycling for paraplegic: Free
swinging trajectory. Biomedical Engineering and Sciences (IECBES), 2012 IEEE
EMBS Conference On.
Akande, K. O., Owolabi, T. O., & Olatunji, S. O. (2015). Investigating the effect of
correlation-based feature selection on the performance of support vector machines
in reservoir characterization. Journal of Natural Gas Science and Engineering, 22,
515–522.
Akataki, K., Mita, K., Watakabe, M., & Itoh, K. (2003). Mechanomyographic responses
during voluntary ramp contractions of the human first dorsal interosseous muscle.
European Journal of Applied Physiology, 89(6), 520–525.
Al-Mulla, M. R., & Sepulveda, F. (2010). Novel feature modelling the prediction and
detection of semg muscle fatigue towards an automated wearable system. Sensors,
10(5), 4838–4854.
Al-mulla, M. R., Sepulveda, F., & Colley, M. (2011). A Review of Non-Invasive
Techniques to Detect and Predict Localised Muscle Fatigue. Sensors, 11, 3545–
3594.
Al-Mulla, M. R., Sepulveda, F., & Colley, M. (2009). Statistical Class Separation Using
sEMG Features Towards Automated Muscle Fatigue Detection and Prediction.
Image and Signal Processing, 2009. CISP ’09. 2nd International Congress On.
Alves, N., & Chau, T. (2008). Stationarity distributions of mechanomyogram signals
from isometric contractions of extrinsic hand muscles during functional grasping.
Journal of Electromyography and Kinesiology, 18(3), 509–515.
Barry, B. K., & Enoka, R. M. (2007). The neurobiology of muscle fatigue: 15 years later.
Integrative and Comparative Biology, 47(4), 465–473.
Barry, D. T., & Cole, N. M. (1990). Muscle sounds are emitted at the resonant frequencies
of skeletal muscle. IEEE Transactions on Biomedical Engineering, 37(5), 525–531.
Barry, D. T., Geiringer, S. R., & Ball, R. D. (1985). Acoustic myography: a noninvasive
monitor of motor unit fatigue. Muscle & Nerve, 8(3), 189–194.
Beck, T. W. (2010). Surface MMG responses to muscle fatigue. Applications of
Mechanomyography for Examining Muscle Function, 661(2), 37–51.
Beck, T. W., Housh, T. J., Cramer, J. T., Weir, J. P., Johnson, G. O., Coburn, J. W., …
Mielke, M. (2005). Mechanomyographic amplitude and frequency responses during
dynamic muscle actions: a comprehensive review. Biomedical Engineering Online,
Univers
ity of
Mala
ya

72
4, 67.
Beck, T. W., Housh, T. J., Johnson, G. O., Weir, J. P., Cramer, J. T., Coburn, J. W., &
Malek, M. H. (2004). Mechanomyographic amplitude and mean power frequency
versus torque relationships during isokinetic and isometric muscle actions of the
biceps brachii. Journal of Electromyography and Kinesiology : Official Journal of
the International Society of Electrophysiological Kinesiology, 14(5), 555–564.
Bickel, C. S., Slade, J. M., & Dudley, G. A. (2004). Long-term spinal cord injury
increases susceptibility to isometric contraction-induced muscle injury. European
Journal of Applied Physiology, 91(2–3), 308–313.
Bickel, C. S., Slade, J. M., VanHiel, L. R., Warren, G. L., & Dudley, G. A. (2004).
Variable-frequency-train stimulation of skeletal muscle after spinal cord injury.
Journal of Rehabilitation Research and Development, 41(1), 33–40.
Botter, A., Oprandi, G., Lanfranco, F., Allasia, S., Maffiuletti, N. A., & Minetto, M. A.
(2011). Atlas of the muscle motor points for the lower limb: implications for
electrical stimulation procedures and electrode positioning. European Journal of
Applied Physiology, 111(10), 2461–2471.
Braz, G. P., Russold, M., & Davis, G. M. (2009). Functional electrical stimulation control
of standing and stepping after spinal cord injury: A review of technical
characteristics. Neuromodulation: Technology at the Neural Interface, 12(3), 180–
190.
Braz, G. P., Russold, M. F., Fornusek, C., Hamzaid, N. A., Smith, R. M., & Davis, G. M.
(2015). Cardiorespiratory and Muscle Metabolic Responses During Conventional
Versus Motion Sensor-Assisted Strategies for Functional Electrical Stimulation
Standing After Spinal Cord Injury. Artificial Organs, 39(10), 855–862.
Brocherie, F., Babault, N., Cometti, G., Maffiuletti, N., & Chatard, J.-C. (2005).
Electrostimulation training effects on the physical performance of ice hockey
players. Medicine and Science in Sports and Exercise, 37(3), 455–460.
Brown, L. E., & Weir, J. P. (2001). ASEP Procedures Recommendation I: Accurate
Assessment of Muscular Strength And Power. Journal of Exercise Physiolog, 4(3),
1–21.
Calcagno, G., Staiano, A., Fortunato, G., Brescia-Morra, V., Salvatore, E., Liguori, R.,
… Sacchetti, L. (2010). A multilayer perceptron neural network-based approach for
the identification of responsiveness to interferon therapy in multiple sclerosis
patients. Information Sciences, 180(21), 4153–4163.
Cescon, C., Farina, D., Gobbo, M., Merletti, R., & Orizio, C. (2004). Effect of
accelerometer location on mechanomyogram variables during voluntary, constant-
force contractions in three human muscles. Medical & Biological Engineering &
Computing, 42(1), 121–127.
Cherkassky, V., & Ma, Y. (2004). Practical selection of SVM parameters and noise
estimation for SVM regression. Neural Networks : The Official Journal of the
International Neural Network Society, 17(1), 113–126.
Univers
ity of
Mala
ya

73
Cohen, J. (1988). Statistical power analysis for the behavioral sciences. 1988, Hillsdale,
NJ: L. Lawrence Earlbaum Associates, 2.
Dietz, V., Colombo, G., & Müller, R. (2004). Single joint perturbation during gait:
neuronal control of movement trajectory. Experimental Brain Research, 158(3),
308–316.
Eberhart, R. C. (2007). Computational Intelligence: Concepts to Implementations. San
Francisco, CA, USA: Morgan Kaufmann Publishers Inc.
Enoka, R. M., & Duchateau, J. (2008, January). Muscle fatigue: what, why and how it
influences muscle function. The Journal of Physiology.
Esposito, F., Orizio, C., & Veicsteinas, A. (1998). Electromyogram and
mechanomyogram changes in fresh and fatigued muscle during sustained
contraction in men. European Journal of Applied Physiology and Occupational
Physiology, 78(6), 494–501.
Farina, D., Merletti, R., & Enoka, R. M. (2013). The extraction of neural strategies from
the surface EMG Neural Control of Movement The extraction of neural strategies
from the surface EMG. Journal of Applied Physiology (Bethesda, Md. : 1985), 96(4),
1486–1495.
Faulkner, J. A., Larkin, L. M., Claflin, D. R., & Brooks, S. V. (2007). Age-related changes
in the structure and function of skeletal muscles. Clinical and Experimental
Pharmacology & Physiology, 34(11), 1091–1096.
Feiereisen, P., Duchateau, J., & Hainaut, K. (1997). Motor unit recruitment order during
voluntary and electrically induced contractions in the tibialis anterior. Experimental
Brain Research, 114(1), 117–123.
Ferrarin, M., & Pedotti, A. (2000). The relationship between electrical stimulus and joint
torque: a dynamic model. IEEE Transactions on Rehabilitation Engineering : A
Publication of the IEEE Engineering in Medicine and Biology Society, 8(3), 342–
352.
Furlan, J. C., Noonan, V., Singh, A., & Fehlings, M. G. (2011). Assessment of impairment
in patients with acute traumatic spinal cord injury: a systematic review of the
literature. Journal of Neurotrauma, 28(8), 1445–1477.
Gerdle, B., Karlsson, S., Day, S., & Djupsjöbacka, M. (1999). Acquisition, Processing
and Analysis of the Surface Electromyogram. In U. Windhorst & H. Johansson
(Eds.), Modern Techniques in Neuroscience Research (pp. 705–755). Berlin,
Heidelberg: Springer Berlin Heidelberg.
Gerrits, K. H., Maganaris, C. N., Reeves, N. D., Sargeant, A. J., Jones, D. A., & de Haan,
A. (2005). Influence of knee joint angle on muscle properties of paralyzed and
nonparalyzed human knee extensors. Muscle & Nerve, 32(1), 73–80.
Gobbo, M., Ce, E., Diemont, B., Esposito, F., & Orizio, C. (2006). Torque and surface
mechanomyogram parallel reduction during fatiguing stimulation in human muscles.
European Journal of Applied Physiology, 97(1), 9–15.
Univers
ity of
Mala
ya

74
Goldenberg, M. S., Yack, H. J., Cerny, F. J., & Burton, H. W. (1991). Acoustic
myography as an indicator of force during sustained contractions of a small hand
muscle. Journal of Applied Physiology (Bethesda, Md. : 1985), 70(1), 87–91.
Gorelick, M. L., & Brown, J. M. M. (2007). Mechanomyographic assessment of
contractile properties within seven segments of the human deltoid muscle. European
Journal of Applied Physiology, 100(1), 35–44.
Graben, P. beim, & Wright, J. (2011). From McCulloch-Pitts Neurons Toward Biology.
Bulletin of Mathematical Biology, 73(2), 261–265.
Grimaldi, F. (1665). Physicomathesis de Lumine. Bologna, Italy.
Gruet, M., Temesi, J., Rupp, T., Levy, P., Millet, G. Y., & Verges, S. (2013). Stimulation
of the motor cortex and corticospinal tract to assess human muscle fatigue.
Neuroscience, 231, 384–399.
Guo, J., Zheng, Y., Huang, Q., & Chen, X. (2008). Dynamic monitoring of forearm
muscles using one-dimensional sonomyography system. J. Rehabil. Res. Develop.,
45(1), 187–195.
Guresen, E., & Kayakutlu, G. (2011). Procedia Computer Definition of artificial neural
networks with comparison to other networks. Procedia Computer Science, 3, 426–
433.
Hagg, G. M. (1991). Comparison of different estimators of electromyographic spectral
shifts during work when applied on short test contractions. Medical & Biological
Engineering & Computing, 29(5), 511–516.
Haisma, J. A., van der Woude, L. H., Stam, H. J., Bergen, M. P., Sluis, T. A., Post, M.
W., & Bussmann, J. B. (2007). Complications following spinal cord injury:
occurrence and risk factors in a longitudinal study during and after inpatient
rehabilitation. Journal of Rehabilitation Medicine, 39(5), 393–398.
Hamid, S., & Hayek, R. (2008). Role of electrical stimulation for rehabilitation and
regeneration after spinal cord injury: an overview. European Spine Journal : Official
Publication of the European Spine Society, the European Spinal Deformity Society,
and the European Section of the Cervical Spine Research Society, 17(9), 1256–1269.
Haykin, S. (1998). Neural Networks: A Comprehensive Foundation (2nd ed.). Upper
Saddle River, NJ, USA: Prentice Hall PTR.
Hendrix, C. R., Housh, T. J., Zuniga, J. M., Camic, C. L., Mielke, M., Johnson, G. O., &
Schmidt, R. J. (2010). A mechanomyographic frequency-based fatigue threshold
test. Journal of Neuroscience Methods, 187(1), 1–7.
Henneman, E., Somjen, G., & Carpenter, D. O. (1965). Functional Significance Of Cell
Size In Spinal Motoneurons. Journal of Neurophysiology, 28, 560–580.
Herda, T. J., & Cooper, M. A. (2013). Electromyographic, but not mechanomyographic
amplitude–force relationships, distinguished differences in voluntary activation
capabilities between individuals. Journal of Electromyography and Kinesiology,
Univers
ity of
Mala
ya
75
23(2), 356–361.
Herda, T. J., Housh, T. J., Fry, A. C., Weir, J. P., Schilling, B. K., Ryan, E. D., & Cramer,
J. T. (2010). A noninvasive, log-transform method for fiber type discrimination
using mechanomyography. Journal of Electromyography and Kinesiology, 20(5),
787–794.
Ibitoye, M. O. (2016). Experimental investigation of mechanomyography as a proxy of
electrically-evoked muscle torque for NMES feedback applications in persons with
spinal cord injury. University of Malaya.
Ibitoye, M. O., Hamzaid, N. A., & Abdul Wahab, A. K. (2016). Estimation of
Electrically-Evoked Knee Torque from Mechanomyography Using Support Vector
Regression. Sensors, 16, 1–18.
Ibitoye, M. O., Hamzaid, N. A., Zuniga, J. M., & Abdul Wahab, A. K. (2014).
Mechanomyography and muscle function assessment: a review of current state and
prospects. Clinical Biomechanics (Bristol, Avon), 29(6), 691–704.
Islam, M. A., Sundaraj, K., Ahmad, R. B., & Ahamed, N. U. (2013). Mechanomyogram
for Muscle Function Assessment: A Review. PLoS ONE, 8(3), e58902. Retrieved
from http://dx.doi.org/10.1371%2Fjournal.pone.0058902
Jailani, R., & Tokhi, M. O. (2012). The effect of functional electrical stimulation (FES)
on paraplegic muscle fatigue. In 2012 IEEE 8th International Colloquium on Signal
Processing and its Applications (pp. 500–504).
Jensen, B. R., Jorgensen, K., & Sjogaard, G. (1994). The effect of prolonged isometric
contractions on muscle fluid balance. European Journal of Applied Physiology and
Occupational Physiology, 69(5), 439–444.
Kagaya, H., Shimada, Y., Ebata, K., Sato, M., Sato, K., Yukawa, T., & Obinata, G.
(1995). Restoration and analysis of standing-up in complete paraplegia utilizing
functional electrical stimulation. Archives of Physical Medicine and Rehabilitation,
76(9), 876–881.
Karlsson, J., Sjodin, B., Jacobs, I., & Kaiser, P. (1981). Relevance of muscle fibre type
to fatigue in short intense and prolonged exercise in man. Ciba Foundation
Symposium, 82, 59–74.
Kimura, T., Hamada, T., Watanabe, T., Maeda, A., Oya, T., & Moritani, T. (2004).
Mechanomyographic responses in human biceps brachii and soleus during sustained
isometric contraction. European Journal of Applied Physiology, 92(4–5), 533–539.
Kirshblum, S. C., Burns, S. P., Biering-Sorensen, F., Donovan, W., Graves, D. E., Jha,
A., … Waring, W. (2011). International standards for neurological classification of
spinal cord injury (Revised 2011). J Spinal Cord Med, 34(6), 535–546.
Laufer, Y., Ries, J. D., Leininger, P. M., & Alon, G. (2001). Quadriceps femoris muscle
torques and fatigue generated by neuromuscular electrical stimulation with three
different waveforms. Physical Therapy, 81(7), 1307–1316.
Univers
ity of
Mala
ya

76
Levenberg, K. (1944). A Method For The Solution Of Certain Non-Linear Problems In
Least Squares. Quarterly of Applied Mathematics, 2(2), 164–168. Retrieved from
http://www.jstor.org/stable/43633451
Levin, O., Mizrahi, J., & Isakov, E. (2000). Transcutaneous FES of the paralyzed
quadriceps: is knee torque affected by unintended activation of the hamstrings?
Journal of Electromyography and Kinesiology : Official Journal of the International
Society of Electrophysiological Kinesiology, 10(1), 47–58.
Madeleine, P., & Arendt-Nielsen, L. (2016). Experimental muscle pain increases
mechanomyographic signal activity during sub-maximal isometric contractions.
Journal of Electromyography and Kinesiology, 15(1), 27–36.
Mair, S. D., Seaber, A. V, Glisson, R. R., & Garrett, W. E. J. (1996). The role of fatigue
in susceptibility to acute muscle strain injury. The American Journal of Sports
Medicine, 24(2), 137–143.
Malek, M. H., & Coburn, J. W. (2012). The utility of electromyography and
mechanomyography for assessing neuromuscular function: a noninvasive approach.
Physical Medicine and Rehabilitation Clinics of North America, 23(1), 23–32, ix.
Masdar, A., Ibrahim, B. S. K. K., & Jamil, M. M. A. (2012). Development of wireless-
based low-cost current controlled stimulator for patients with spinal cord injuries.
2012 IEEE-EMBS Conference on Biomedical Engineering and Sciences.
Merletti, R., & Parker, P. J. (2004). Electromyography: Physiology, Engineering, and
Non-Invasive Applications. New York, NY, USA: Wiley-IEEE Press.
Mohd Rasid, F. K. (2017). Knee Angle and MMG Relationships During Fes-Evoked
Muscle Standing Contractions to Fatigue In People With Spinal Cord Injury.
University Malaya.
Nielsen, J. C., Gerdes, J. C., & Varma, N. (2015). Infected cardiac-implantable electronic
devices: prevention, diagnosis, and treatment. European Heart Journal, 36(37),
2484–2490. Retrieved from http://dx.doi.org/10.1093/eurheartj/ehv060
Olusola, M., Azah, N., Hasnan, N., Khairi, A., Wahab, A., Islam, A., … Davis, G. M.
(2016). Torque and mechanomyogram relationships during electrically-evoked
isometric quadriceps contractions in persons with spinal cord injury. Medical
Engineering and Physics, 0, 1–9.
Orizio, C. (1993). Muscle sound: bases for the introduction of a mechanomyographic
signal in muscle studies. Critical Reviews in Biomedical Engineering, 21(3), 201–
243.
Orizio, C., Gobbo, M., Diemont, B., Esposito, F., & Veicsteinas, A. (2003). The surface
mechanomyogram as a tool to describe the influence of fatigue on biceps brachii
motor unit activation strategy. Historical basis and novel evidence. European
Journal of Applied Physiology, 90(3), 326–336.
Oster, G., & Jaffe, J. S. (1980). Low frequency sounds from sustained contraction of
human skeletal muscle. Biophysical Journal, 30(1), 119–127.
Univers
ity of
Mala
ya

77
Perry, S. R., Housh, T. J., Weir, J. P., Johnson, G. O., Bull, A. J., & Ebersole, K. T. (2016).
Mean power frequency and amplitude of the mechanomyographic and
electromyographic signals during incremental cycle ergometry. Journal of
Electromyography and Kinesiology, 11(4), 299–305.
Petitjean, M., Maton, B., & Fourment, A. (1998). Summation of elementary
phonomyograms during isometric twitches in humans. European Journal of Applied
Physiology and Occupational Physiology, 77(6), 527–535.
Petrofsky, J. S. (2004). Electrical Stimulation: Neurophysiological Basis and Application.
Basic And Applied Myology, 14(4), 205–213.
Popovic, M. R., Keller, T., Pappas, I. P., Dietz, V., & Morari, M. (2001). Surface-
stimulation technology for grasping and walking neuroprosthesis. IEEE Engineering
in Medicine and Biology Magazine : The Quarterly Magazine of the Engineering in
Medicine & Biology Society, 20(1), 82–93.
Rabischong, E., & Guiraud, D. (1993). Determination of fatigue in the electrically
stimulated quadriceps muscle and relative effect of ischaemia. Journal of
Biomedical Engineering, 15(6), 443–450.
Rodriguez-Falces, J., & Place, N. (2013). Recruitment order of quadriceps motor units:
femoral nerve vs. direct quadriceps stimulation. European Journal of Applied
Physiology, 113(12), 3069–3077.
Sarlabous, L., Torres, A., Fiz, J. A., Morera, J., & Jané, R. (2013). Index for estimation
of muscle force from mechanomyography based on the Lempel–Ziv algorithm.
Journal of Electromyography and Kinesiology, 23(3), 548–557.
Sasidhar, S., Panda, S. K., & Xu, J. (2013). A wavelet feature based mechanomyography
classification system for a wearable rehabilitation system for the elderly. Lecture
Notes in Computer Science (Including Subseries Lecture Notes in Artificial
Intelligence and Lecture Notes in Bioinformatics), 7910 LNCS, 45–52.
Sedel, L., Nizard, R., & Meunier, a. (1995). Orthopedic biomaterials. Bulletin de
l’Academie Nationale de Medecine, 179(3), 497-505; discussion 505-506.
Shamshirband, S., Petković, D., Amini, A., Anuar, N. B., Nikolić, V., Ćojbašić, Ž., …
Gani, A. (2014). Support vector regression methodology for wind turbine reaction
torque prediction with power-split hydrostatic continuous variable transmission.
Energy, 67, 623–630.
Sibanda, W., & Pretorius, P. (2012). Artificial Neural Networks-A Review of
Applications of Neural Networks in the Modeling of HIV Epidemic. International
Journal of Computer Applications, 44(April), 975–8887.
Sisto, S. A., & Dyson-Hudson, T. (2007). Dynamometry testing in spinal cord injury.
Journal of Rehabilitation Research and Development, 44(1), 123–136.
Soden, R. J., Walsh, J., Middleton, J. W., Craven, M. L., Rutkowski, S. B., & Yeo, J. D.
(2000). Causes of death after spinal cord injury. Spinal Cord, 38(10), 604–610.
Univers
ity of
Mala
ya

78
Staude, G., & Wolf, W. (1999). Objective motor response onset detection in surface
myoelectric signals. Medical Engineering & Physics, 21(6), 449–467.
Stokes, M., & Blythe, G. (2001). Muscle sounds in physiology, sports science and clinical
investigation: applications and history of mechanomyography. Medical Intelligence
Oxford.
Stokes, M. J., & Dalton, P. A. (1991). Acoustic myographic activity increases linearly up
to maximal voluntary isometric force in the human quadriceps muscle. Journal of
the Neurological Sciences, 101(2), 163–167.
Stoykov, N. S., Lowery, M. M., & Kuiken, T. A. (2005). A finite-element analysis of the
effect of muscle insulation and shielding on the surface EMG signal. IEEE
Transactions on Bio-Medical Engineering, 52(1), 117–121.
Sundmacher, L., Gotz, N., & Vogt, V. (2014). [Statistical methods for research on
regional health-care services]. Bundesgesundheitsblatt, Gesundheitsforschung,
Gesundheitsschutz, 57(2), 174–179.
Tanaka, M., Okuyama, T., & Saito, K. (2011). Study on evaluation of muscle conditions
using a mechanomyogram sensor. Systems, Man, and Cybernetics (SMC), 2011
IEEE International Conference On.
Tarata, M. (2009). The Electromyogram and Mechanomyogram in Monitoring
Neuromuscular Fatigue: Techniques, Results, Potential Use within the Dynamic
Effort. MEASUREMENT, Proceedings of the 7th International Conference, (Mvc),
67–77.
Tarata, M., Spaepen, a., & Puers, R. (2001). The accelerometer MMG measurement
approach, in monitoring the muscular fatigue. Measur Sci Rev, 1(1), 47–50.
Thomas, C. K., Griffin, L., Godfrey, S., Ribot-Ciscar, E., & Butler, J. E. (2003). Fatigue
of paralyzed and control thenar muscles induced by variable or constant frequency
stimulation. Journal of Neurophysiology, 89(4), 2055–2064.
Weir, J. P. (2005). Quantifying test-retest reliability using the intraclass correlation
coefficient and the SEM. Journal of Strength and Conditioning Research / National
Strength & Conditioning Association, 19(1), 231–240.
Weir, J. P., Ayers, K. M., Lacefield, J. F., & Walsh, K. L. (2000). Mechanomyographic
and electromyographic responses during fatigue in humans: influence of muscle
length. European Journal of Applied Physiology, 81(4), 352–359.
Wollaston, W. H. (1810). On the Duration of Muscular Action. Phil. Trans. R. Soc. Lond.
B Biol. Sci., (January), 1–15.
Xie, H.-B., Zheng, Y.-P., & Guo, J.-Y. (2009). Classification of the mechanomyogram
signal using a wavelet packet transform and singular value decomposition for
multifunction prosthesis control. Physiological Measurement, 30(5), 441–457.
Yang, Z. F., Kumar, D. K., & Arjunan, S. P. (2009). Mechanomyogram for identifying
muscle activity and fatigue. Conference Proceedings : ... Annual International
Univers
ity of
Mala
ya
79
Conference of the IEEE Engineering in Medicine and Biology Society. IEEE
Engineering in Medicine and Biology Society. Conference, 2009(Mvc), 408–411.
Yıldız, A. R. (2009). A novel hybrid immune algorithm for global optimization in design
and manufacturing. Robotics and Computer-Integrated Manufacturing, 25(2), 261–
270.
Yoshitake, Y., & Moritani, T. (1999). The muscle sound properties of different muscle
fiber types during voluntary and electrically induced contractions. Journal of
Electromyography and Kinesiology : Official Journal of the International Society of
Electrophysiological Kinesiology, 9(3), 209–217.
Yoshitake, Y., Shinohara, M., Ue, H., & Moritani, T. (2002). Characteristics of surface
mechanomyogram are dependent on development of fusion of motor units in
humans. Journal of Applied Physiology (Bethesda, Md. : 1985), 93(5), 1744–1752.
Youn, W., & Kim, J. (2010). Estimation of elbow flexion force during isometric muscle
contraction from mechanomyography and electromyography. Medical & Biological
Engineering & Computing, 48(11), 1149–1157.
Zecca, M., Micera, S., Carrozza, M. C., & Dario, P. (2002). Control of multifunctional
prosthetic hands by processing the electromyographic signal. Critical Reviews in
Biomedical Engineering, 30(4–6), 459–485.
Univers
ity of
Mala
ya

80
LIST OF PUBLICATIONS AND PAPERS PRESENTED
• Dzulkifli, M.A., Hamzaid, N.A., Davis, G.M., Hasnan, N. (2018). Neural
Network-Based Muscle Torque Estimation Using Mechanomyography during
Electrically-Evoked Knee Extension and Standing in Spinal Cord Injury. Frontiers
in Neurorobotics (Published)
Univers
ity of
Mala
ya

81
• Mohamad Saadon, N.S., Hamzaid, N.A., Hasnan, N. Dzulkifli, M.A., Davis,
G.M. (2018). Electrically Evoked Wrist Extensor Muscle Fatigue throughout
Repetitive Motion as Measured by Mechanomyography and Near-Infrared
Spectroscopy. Biomedical Engineering / Biomedizinische Technik (BMT)
(Published).
Proceedings
• Dzulkifli, M.A., Ibitoye, M.O., Hasnan, N., Davis, G.M., Hamzaid, N.A. Muscle
Fatigue Monitoring using Mechanomyography in FES-Evoked Contractions
and Standing among Individuals with Spinal Cord Injury, Rehabweek London
2017.
• Mohamad Saadon, N.S., Hamzaid, N.A., Hasnan, N. Dzulkifli, M.A., Gan,
K.B., Teoh, M., and Davis, G.M. (2018). Muscle Oxygen Saturation Correlates
with Muscle Mechanomyography during Prolonged Electrical Stimulation-
Evoked Wrist Extension Exercise. The 10th International Conference on
Robotics, Vision, Signal Processing & Power Applications (ROVISP2018), 14th
August-15th August 2018, Penang. (In Press)
Univers
ity of
Mala
ya