UNIVERSITY OF MISSOURI-COLUMBIA - CLINICAL PSYCHOLOGY …
14
Page 1 of 14 UNIVERSITY OF MISSOURI-COLUMBIA - CLINICAL PSYCHOLOGY PROGRAM STUDENT ADMISSIONS, OUTCOMES, AND OTHER DATA Updated September 10, 2021 These data are intended to provide interested students and others with information that will help them make informed decisions about the clinical psychology doctoral program at University of Missouri. We present data required by our accrediting bodies (APA Commission on Accreditation a, Psychological Clinical Science Accreditation System b ), recommended by the Council of University Directors of Clinical Psychology (CUDCP, and additional information that we think describes our students’ qualifications and accomplishments. The following sections include information required by APA: I. II. Program Disclosures – regarding compliance with institutional affiliation or purpose Time to Degree Completion - for students in last 10 yrs III. Program Costs – tuition, fees, and other costs for the current academic year; we also include expanded data to reflect waivers/subsidies, international student fees, & final costs to students IV. Internship Placement - in accredited and other internships over last 10 yrs; we also include a list of recent internship sites V. Attrition- attrition and enrollment status of students over past 10 yrs VI. Licensure Status - of graduates 2 to 10 years post-graduation Other information about our program VII. Admissions Data – information on applicants and incoming class VIII. Current Student Data – presentations, publications, grants, honors and accomplishments IX. Graduate Data – job placement, professional activities For additional information about our program, please view our website https://psychology.missouri.edu/ or contact the department’s graduate program office at [email protected]. a Office of Program Consultation and Accreditation, American Psychological Association 750 1st Street, NE, Washington, DC 20002, Phone: (202) 336-5979, E-mail: [email protected], www.apa.org/ed/accreditation. b Psychological Clinical Science Accreditation System, Richard M. McFall, Executive Director, 1101 East Tenth Street, IU Psychology Building, Bloomington, IN 47405-7007, Phone#: 812-856-2570, Email: [email protected], www.pcsas.org.
Transcript of UNIVERSITY OF MISSOURI-COLUMBIA - CLINICAL PSYCHOLOGY …

Page 1 of 14
UNIVERSITY OF MISSOURI-COLUMBIA - CLINICAL
PSYCHOLOGY PROGRAM
STUDENT ADMISSIONS, OUTCOMES, AND OTHER DATA
Updated September 10, 2021
These data are intended to provide interested students and others with
information that will help them make informed decisions about the clinical
psychology doctoral program at University of Missouri. We present data
required by our accrediting bodies (APA Commission on Accreditationa,
Psychological Clinical Science Accreditation Systemb), recommended by
the Council of University Directors of Clinical Psychology (CUDCP, and
additional information that we think describes our students’ qualifications
and accomplishments.
The following sections include information required by APA:
I. II.
Program Disclosures – regarding compliance with institutional affiliation or purpose Time to Degree Completion - for students in last 10 yrs
III.
Program Costs – tuition, fees, and other costs for the current academic year; we also include expanded data to reflect waivers/subsidies, international student fees, & final costs to students
IV. Internship Placement - in accredited and other internships over last 10 yrs; we also include a list of recent internship sites
V. Attrition- attrition and enrollment status of students over past 10 yrs VI. Licensure Status - of graduates 2 to 10 years post-graduation
Other information about our program VII. Admissions Data – information on applicants and incoming class VIII. Current Student Data – presentations, publications, grants, honors and accomplishments
IX. Graduate Data – job placement, professional activities
For additional information about our program, please view our website
https://psychology.missouri.edu/ or contact the department’s graduate
program office at [email protected].
a Office of Program Consultation and Accreditation, American Psychological Association
750 1st Street, NE, Washington, DC 20002, Phone: (202) 336-5979, E-mail:
www.apa.org/ed/accreditation.
b Psychological Clinical Science Accreditation System, Richard M. McFall, Executive
Director, 1101 East Tenth Street, IU Psychology Building, Bloomington, IN 47405-7007,
Phone#: 812-856-2570, Email: [email protected], www.pcsas.org.

Page 2 of 14
I. Program Disclosures
Does the program or institution require students, trainees, and/or staff (faculty) to comply with specific policies or practices related to the institution’s affiliation or purpose? Such policies or practices may include, but are not limited to, admissions, hiring, retention policies, and/or requirements for completion that express mission and values?
_____ Yes
X No
If yes, provide website link (or content from brochure) where this specific information is presented:

Page 3 of 14
II. Time to Degree Completion
Time to Completion for all students entering the program
Outcome
Year in which Degrees were Conferred
2011-
2012
2012-
2013
2013-
2014
2014-
2015
2015-
2016
2016-
2017
2017-
2018
2018-
2019
2019-
2020
2020-
2021 Total
Total number of students with
doctoral degree conferred on
transcript
3 6 3 3 7 3 5
3
5
6 44
Mean number of years to
complete the program 7.3 7.5 7.3 7.3 7.3 7 7.6
7.7 7 7
7.29
Median number of years to
complete the program 7 7.5 7 7 7 7 8
7 7 7 7
Time to Degree Ranges N % N % N % N % N % N % N % N % N % N %
Students in less than 5 years 0 0 0 0 0 0 0 0 0 0 0 0 0 0 0 0 0 0 0 0 0
Students in 5 years 0 0 0 0 0 0 0 0 0 0 0 0 0 0 0 0 0 0 0 0 0
Students in 6 years 0 0 1 17 1 33 0 0 3 43 0 0 1 20 0 0 1 20 2 9 20
Students in 7 years 2 67 2 33 1 33 2 67 2 29 3 100 1 20 2 67 3 60 2 20 45
Students in more than 7 years 1 33 3 50 1 33 1 33 2 29 0 0 3 60 1 33 1 20
2 15 34
Also, please describe or provide a link to program admissions policies that allow students to enter with credit for prior graduate work, and the expected implications for time to completion. Please indicate NA if not applicable:
Department and program policies that allow students to waive department/program requirements are outlined in the Department and Clinical Area Handbooks (available here: https://psychology.missouri.edu/grad/handbooks-and-forms). In the CLINICAL PROGRAM, a clinical student who has done graduate clinical coursework elsewhere may waive up to 2 required clinical courses. If the student has had qualifying graduate coursework elsewhere, in addition to the 2 required clinical courses that are waived, the student may substitute a different clinical course. The particular course that would be substituted would be approved by the Director of Clinical Training. In both of the above instances, authorization to waive a course or to substitute a course will follow the same procedures as those laid down by the department (i.e., an evaluation by the person who normally teaches that course and a written statement indicating that the student's expertise and competence in the area warrants a waiver or a course substitution). This policy does not pertain to Practicum, which will be reviewed separately. It also does not pertain to clinical electives, where there is flexibility to take a variety of courses.

Page 4 of 14
At the DEPARTMENT LEVEL, Students who enter the doctoral program and present evidence in the form of an official graduate transcript that they have received the grade of A or B on relevant and substantive graduate courses elsewhere may test out of one of the three distribution courses (i.e., Class A, Distribution Requirements) based on an appropriate examination. The examination may consist of a written exam, an oral exam, or examination of the content and quality of the target course. Approval or disapproval of the target course is entirely up to the appointed faculty member. This same procedure may be used to "test out" of the first two required statistics courses. In extraordinary and rare cases, a student may be allowed to test out of the third required statistics course.
Note. In addition to completing requirements for PhD in clinical psychology, several students have extended their time in the graduate program in
order to complete a dual clinical-developmental PhD, statistics minor, Teaching of Psychology Practicum, or multi-year NRSA research fellowships.
Several students have also taken leaves of absence in order to pursue additional degree programs or devote time to personal, family, or medical issues.
Occasionally, students enter with a master’s degree (e.g., in general psychology, psychopathology) from another institution; although these students
may have a few requirements waived, they are not granted advanced standing. Thus, MA/MS students are not presented separately here.

Page 5 of 14
III. Program Costs
Basic Cost Data – 2021-22
Program Costs
Description 2018-2019 1st-year Cohort Cost
Tuition for full-time students (in-state) $0
Tuition for full-time students (out-of-state) $0
Tuition per credit hour for part-time students (if applicable enter
amount; if not applicable enter "NA") NA
University/institution fees or costs $3,372.70
Additional estimated fees or costs to students (e.g. books, travel, etc.) $750
Notes. Tuition costs listed at $0 because department covers these costs for students with assistantships (all students in
good standing in Years 1-5 are awarded assistantships and tuition coverage. University fees are estimated for domestic
students based on 14 credit hour enrollment during fall and spring semesters and 3 credit hour enrollment during
summer; costs vary for international students and with credit hours. Additional costs are estimated to include books,
reprint costs, and any required program travel. Program costs are presented in detail below.
Expanded Cost Data – 2021-22 Tuition, fees, and waivers
Tuition
Cost Waiver/subsidy* Final Student Cost*
Resident $414.60/credit hr $414.60/credit hr $0
Non-Resident $1135.20/credit hr (414.60
tuition + 720.60 non-resident
fee)
$1135.20/credit hr $0
*Tuition costs are covered for all students with halftime (.50 FTE) graduate assistantships (GA) or fellowships (F).
Halftime assistantships are guaranteed for all department students in good standing in Years 1-5, almost always available
for Year 6 students in good standing, and frequently available for students in good standing beyond Year 6. During the
internship year, students who have not yet defended their dissertation are required to enroll in 2 credit hours per semester
and 1 credit hour during summer (non-resident fee of $720.60/credit is waived); tuition is not waived because waiver is
only available as part of a graduate assistantship. Students who have defended their dissertation are not required to enroll.

Page 6 of 14
Fees
Cost Waiver/subsidy* Final Student Cost*
Student Insurance*
Domestic Students; self only
(optional)
$4,124/yr $4,124/yr w/ .50FTE $0
International Students
(mandatory)
$2,227/yr $2,227/yr w/ .5FTE $0
Mandatory Fees**
Arts and Science Course Fees $63.30/credit hr $43.30/credit hr
Student Health Center Fee $102/sem $194.38/yr
Student Activity Fee $208.80/sem $399.70/yr
Recreational Facility Fee $161.90/sem $308.46/yr
Informational Tech Fee $15/credit hr $14.35/credit hr
Mandatory International
Student Services Fee
$125/sem $250/yr
*Student insurance plans are optional for domestic students and mandatory for international students.
Insurance plan costs are subsidized for all students with assistantships or fellowships (as noted above,
assistantships are guaranteed for all students in good standing in Years 1-5, typically available for students in
good standing in Year 6, and often available for students in good standing beyond Year 6). Spouse/dependent
coverage, if desired, is paid by the student. For coverage details, see
https://gradstudies.missouri.edu/funding/student-medical-insurance/.
**Mandatory fees are listed for academic year (i.e., excluding summer) except for insurance fees which are
calculated for 12-month coverage. Most mandatory fees based on full-time study and are subject to change. For
students with less than full-time study (e.g., students on internship), these fees can be waived or reduced based
on hours enrolled. Additional fees may be assessed if student enrolls for summer credits.

Page 7 of 14
IV. Internship Placement
Internship Placement – Table 1
Outcome
Year Applied for Internship
2011-
2012
2012-
2013
2013-
2014
2014-
2015
2015-
2016
2016-
2017
2017-
2018
2018-
2019
2019-
2020
2020-
2021
N % N % N % N % N % N % N % N % N % N %
Students who obtained
APA/CPA-accredited
internships
5 83 5 100 2 100 8 100 3 100 5 100 2 67
5
100
5
100 7 100
Students who obtained
APPIC member internships
that were not APA/CPA-
accredited (if applicable)
0 0 0 0 0 0 0 0 0 0 0 0 0 0
0
0
0
0 0 0
Students who obtained other
membership organization
internships (e.g. CAPIC) that
were not APA/CPA-
accredited (if applicable)
0 0 0 0 0 0 0 0 0 0 0 0 0 0
0
0
0
0 0 0
Students who obtained
internships conforming to
CDSPP guidelines that were
not APA/CPA-accredited (if
applicable)
0 0 0 0 0 0 0 0 0 0 0 0 0 0
0
0
0
0 0 0
Students who obtained other
internships that were not
APA/CPA-accredited (if
applicable)
1 17 0 0 0 0 0 0 0 33 0 0 1 33
0
0
0
0 0 0
Students who obtained any
internship 6 100 5 100 2 100 8 100 3 100 5 100 3 100 5 100 5 100 7 100
Students who sought or
applied for internships
including those who
withdrew from the
application process
6 - 5 - 2 - 8 - 3 - 5 - 3 -
5
-
5
- 7 -
*This includes students that withdrew from the internship application process

Page 8 of 14
Internship Placement – Table 2
Outcome
Year Applied for Internship
2011-
2012
2012-
2013
2013-
2014
2014-
2015 2015-2016
2016-
2017
2017-
2018
2018-
2019
2019-
2020
2020-
2021
N % N % N % N % N % N % N % N % N % N %
Students who sought or
applied for internships
including those who
withdrew from the
application process
6 - 5 - 2 - 8 - 3 - 5 - 3 -
5
-
5
- 7 -
Students who obtained paid
internships 6 100 5 100 2 100 8 100 3 100 5 100 3 100 5 100 5 100 7 100
Students who obtained half-
time internships* (if
applicable)
0 0 0 0 0 0 0 0 0 0 0 0 0 0
0
0
0
0 0 0
* Cell should only include students who applied for internship and are included in applied cell count from “Internship Placement – Table 1"
Recent Internship Sites
• Counseling centers - Iowa State, Penn State, Bowling Green State, South Carolina
• Universities/U med centers – Boston VA/BU School of Medicine*, Brown U Med School Consortium*, UC-San Diego Consortium/VA, Children’s Hospital of
Michigan, Emory University, Harvard/McLean, UCLA-Semel Institute*, IL-Chicago*, U of Kansas Med School, U of Missouri Health Science Consortium, U of
Miss Med Ctr/VA Jackson, U of New Mexico HSC, U of Oklahoma Health Sciences Center, Oregon Health and Science U, Rochester Institute of Technology
Health Science, Charleston Consortium/Medical U of S. Carolina*, Stony Brook U, SUNY-Upstate Medical University, U Wisconsin School of Medicine *, U
Pittsburgh/Western Psychiatric Institute & Clinic*, Vanderbilt University/VA Nashville, Yale Psychiatry
• VA System (in addition to those listed above) - Danville IL; Ann Arbor, MI; Puget Sound, WA; Maryland-Baltimore*; Minneapolis*; Palo Alto*; Connecticut;
San Francisco; St. Louis; Charleston/Med U of SC*
• Community clinics – Center for Anxiety (NY), Wellspan Philhaven CBT, Heart of America Great Lakes Consortium; Tulsa Center for Child Psychology
*Association for Psychological Clinical Science –affiliated internships

Page 9 of 14
V. Attrition
Attrition
Variable
Year of First Enrollment
2011-
2012
2012-
2013
2013-
2014
2014-
2015
2015-
2016
2016-
2017
2017-
2018
2018-
2019
2019-
2020
2020-
2021
N % N % N % N % N % N % N % N % N %
Students for whom this is the
year of first enrollment (i.e.
new students)
3 - 5 - 7 - 4 - 4 - 8 - 3 -
6
-
5
-
5
-
Students whose doctoral
degrees were conferred on
their transcripts
1 33 4 80 3 43 1 25 0 0 0 0 0 0
0
0
0
0
0
0
Students still enrolled in
program 0 0 0 0 3 43 2 50 4 200 7 100 3 100
6
100
5
100
5
100
Students no longer enrolled
for any reason other than
conferral of doctoral degree
2 67 1 20 1 14 1 25 0 0 1 0 0 0
0
0
0
0
0
0
Note. Students who leave the program report a variety of reasons, including career interest shifts, relocation of
faculty mentor, transfer to another program in department, or personal/family reasons, or were deceased. Many
students earn an MA prior to departure.

Page 10 of 14
VI. Licensure
Licensure
Outcome 2011 to 2021
The total number of program graduates (doctoral degrees
conferred on transcript) between 2 and 10 years ago 37
The number of these graduates (between 2 and 10 years ago) who
became licensed psychologists in the past 10 years 27
Licensure percentage 73%
Note. Graduates included here are from years 2011 to 2019. Of our graduates who are not
licensed, most are in academic or research positions for which licensure is not required or
relevant. Several others are currently working toward licensure.
Page 11 of 14
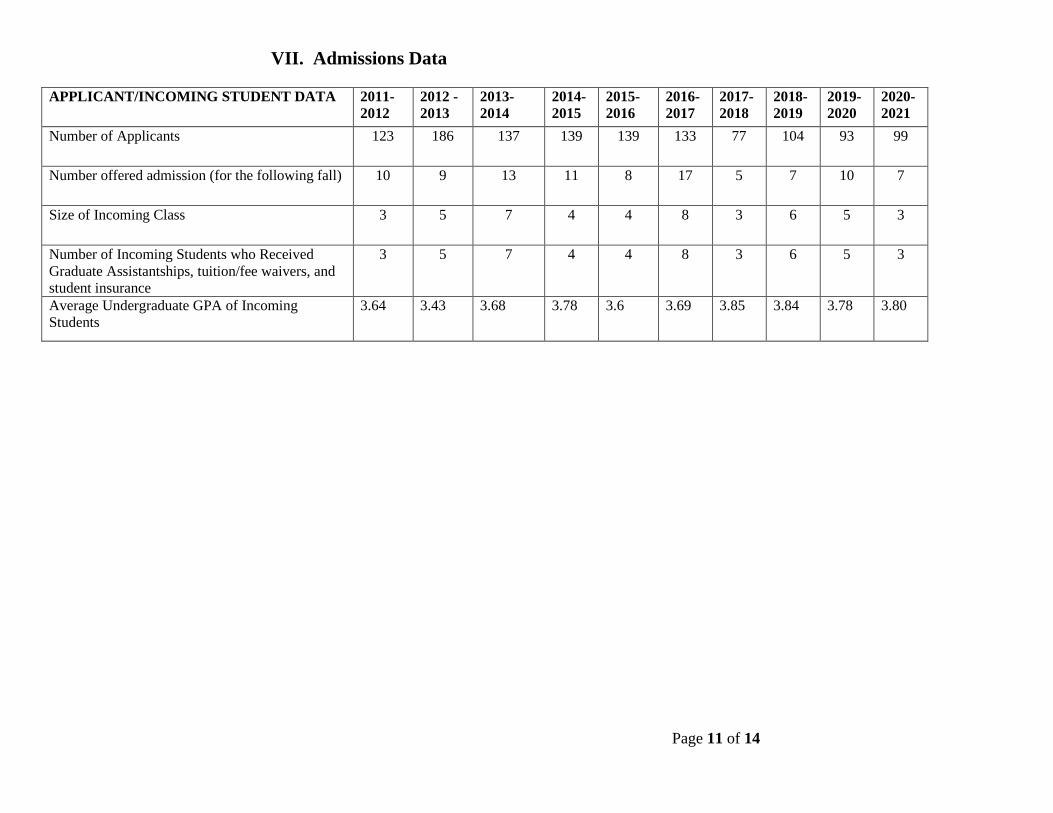
VII. Admissions Data
APPLICANT/INCOMING STUDENT DATA
2011-
2012
2012 -
2013
2013-
2014
2014-
2015
2015-
2016
2016-
2017
2017-
2018
2018-
2019
2019-
2020
2020-
2021
Number of Applicants 123 186 137 139 139 133 77 104 93 99
Number offered admission (for the following fall) 10 9 13 11 8 17 5 7 10 7
Size of Incoming Class 3 5
7 4 4 8 3 6 5 3
Number of Incoming Students who Received
Graduate Assistantships, tuition/fee waivers, and
student insurance
3 5 7 4 4 8 3 6 5 3
Average Undergraduate GPA of Incoming
Students
3.64 3.43 3.68 3.78 3.6 3.69 3.85 3.84 3.78 3.80

Page 12 of 14
VIII. Current Student Data
Presentations and Publications CURRENT STUDENT DATA 2011-
2012
2012-
2013
2013-
2014
2014-
2015
2015-
2016
2016-
2017
2017-
2018
2018-
2019
2019-
2020
2020-
2021
% of students with conference
presentations/posters during the
year
89%
(M=3 per
student)
85%
(M=2.4
per
student)
77%
(M=1.57
per
student)
89%
(M=2.2
per
student)
81%
(M=1.8
per
student)
84%
(M=3.5
per
student
presenter)
100%
(M=3.7
per
student
presenter)
94%
(M = 3.3
per
student
presenter)
97%
(M = 3.4
per
student
presenter)
90%
(M = 2.8
per
student
presenter)
% of students with professional
publications during the year
76%
(M=2.3
per
student)
72%
(M=2.2
per
student)
63%
(M=1.34
per
student)
61%
(M=1.25
per
student)
75%
(M=2.1
per
student)
81%
(M=2.5
per
student
author)
84%
(M=2.2
per
student
author)
70%
(M=2.2
per
student
author)
70%
(M=2.2
per
student
author)
83%
(M=3.1
per
student
author)
Grants, Honors, and Accomplishments Over the past several years, our students have received a variety of awards and honors, including:
• numerous NRSA predoctoral fellowships (~36% of advanced students have applied; ~68% funding success!)
• numerous national research and scholarship awards
o American Psychological Foundation F. J. McGuigan Dissertation Award
o APA Dissertation Research Award
o APA Ethics Committee/APAGS Graduate Student Ethics Prize
o Research Society on Alcoholism Student Merit Award
o Research Society on Alcoholism Student Merit Award
o Society for the Science of Clinical Psychology Student Poster Award
• numerous campus research and teaching awards:
o MU Graduate School Fellowships (multi-year)
o MU Life Sciences Fellowships (multi-year)
o MU Outstanding Master’s Thesis Award
o MU Robert S. Daniel Teaching Fellowship
o MU Superior Graduate Student Achievement Award
o MU Dept of Psychological Sciences Graduate Student Excellence Award
o MU Dept of Psychological Sciences Outstanding Master’s Thesis Award

Page 13 of 14
IX. Graduate Data –Career Paths and Activities
Graduates’ Current and Recent Jobs (2000-2021 graduates) Postdoctoral
Research
Fellowship
Appointments
• Boston VA
• Brown Medical School
• Duke University
• Penn State U Counseling Center
• University of California-San Francisco
• University of Michigan
• University of Oregon - Health and Sciences University
• Seattle VA
• Stony Brook University
• Western Psychiatric Institute and Clinic, University of Pittsburgh
• Yale University
Tenure Track
Faculty Positions –
departments of
Psychology,
Psychiatry, Public
Health, etc.
• Arizona State University
• Case Western Reserve University
• Colgate University
• Eastern Illinois University
• John Jay College of Criminal Justice
• Medical University of South Carolina
• Miami University of Ohio
• Pontificia Universidad (Chile)
• Rhodes College
• Saint Louis University
• Suffolk University
• SUNY-Geneseo
• Syracuse University
• Texas Tech University
• University of Arkansas
• U. of California, Santa Cruz
• University of Colorado
• University of Hawaii, Manoa
• University of Maine
• University of Memphis
• University of Michigan
• University of Mississippi Medical Center
• University of Missouri-St. Louis
• University of Oklahoma Health Sciences Center
• University of Oregon Health Science University
• University of New Brunswick
• University of North Texas
• University of Pittsburgh
• University of Utah
• Western Michigan University
• Yale University
Non-Tenure Track
Faculty and
Research Positions –
in departments of
psychology,
psychiatry, public
health,
• Adjunct Assistant Professor, Boise State University
• Clinical Assistant Professor, University of Florida Counseling and Wellness Center
• Clinical Assistant Professor, University of Missouri Thompson Center for Autism and
Neurodevelopmental Disorders
• Clinical Assistant Professor. Clinical Associate Professor, University of Missouri
Psychological Services Clinic
• Clinical Assistant Professor, Pennsylvania State University Psychological Clinic

Page 14 of 14
epidemiology,
family and
community
medicine, etc.
• Clinical Assistant Professor, Yale University
• Research Assistant Professor, University of Missouri-St. Louis/Missouri Institute of
Mental Health
• Research Scientist, Centers for Disease Control
• Research Scientist, Oregon Social Learning Center
• Statistical Consultant, Varia Statistical Consulting
• Visiting Assistant Professor, University of Miami School of Medicine
Clinical and other
positions • Assistant Training Director/Senior Staff Psychologist, University of Wyoming
Counseling Center
• Clinical Director, MST Partnerships
• Co-Director Clinical Internships, University of Rochester School of Medicine
• Criminal Justice Planning Manager, Jefferson County, CO
• Health Psychologist, University of Missouri TA Atkins Wellness Program
• Medical Content Specialist
• Neuropsychologist, National Rehabilitation Hospital, Washington DC
• Psychologist, private practice, community mental health center
• VA Staff Psychologist -- VA Eastern Kansas Medical Center, Jackson MS
Graduates’ Professional Activities Every year, our program surveys alumni about their professional activities. The vast majority of our
graduates function as effective clinical scientists, participating actively in producing, disseminating, and
applying clinical science research. Data below are from our 2011-2019 surveys of alumni (beginning
2015, graduates surveyed 2 years and 5 years after graduation).
Research and Practice:
• 86% had publications and 94% had professional presentations since graduating
o 2 years out: median publications = 4-6, presentations = 4-6+
o 5 years out: mediation publications = 15-20, presentations = 20+
• 63% had submitted/received grants (PI or Co-I, mostly research, some training/service)
o 2 years out: 52% submitted/received grants
o 5 years out: 78% submitted/received grants
• 87% review for journals
• 84% were licensed
Distribution of job placements:
• ~86% were in academic, research, medical center, and VA positions involving research
and/or supervision/teaching (jobs or post-doctoral fellowships)
• remainder were in public sector patient education or program development/evaluation
positions, or more rarely in clinical practice
Distribution of graduates’ job activities:
• 83% engage in research 15/19, 15/17
• 92% engage in teaching/supervision 17/19, 16/17
• 58% engage in clinical practice 11/19, 10/17
Average time spent in each activity:
• 40% of time in research and research consultation
• 9% of time in teaching and clinical supervision
• 12.5% of time in clinical practice (assessment, intervention, consultation)
• rest of time in consultation, administration/leadership