UNIVERSITY OF KWAZULU-NATAL Determination of Brand Loyalty ...
118
i UNIVERSITY OF KWAZULU-NATAL Determination of Brand Loyalty Amongst South African Petrol Consumers By Wandile T. Shongwe 203518093 A dissertation submitted in partial fulfilment of the requirements for the degree of Master of Business Administration Graduate School of Business & Leadership College of Law and Management Studies Supervisor: Alec Bozas 2012
Transcript of UNIVERSITY OF KWAZULU-NATAL Determination of Brand Loyalty ...

i
UNIVERSITY OF KWAZULU-NATAL
Determination of Brand Loyalty Amongst South
African Petrol Consumers
By
Wandile T. Shongwe
203518093
A dissertation submitted in partial fulfilment of the requirements for the
degree of
Master of Business Administration
Graduate School of Business & Leadership
College of Law and Management Studies
Supervisor: Alec Bozas
2012
DECLARATION
I .. h/A.~I!. {~.If.. T.H:f.'.11().8/H./5,. e+/ .. . $.HP.ti.~ .01. #..declare that
(i) The research reported in this dissertation/thesis, except where otherwise
indicated, is my original research.
(ii) This dissertation/thesis has not been submitted for any degree or
examination at any other university.
(iii) This dissertation/thesis does not contain other persons' data, pictures,
graphs or other information, unless specifically acknowledged as being
sourced from other persons.
(iv) This dissertation/thesis does not contain other persons' writing, unless
specifically acknowledged as being sourced from other researchers.
Where other written sources have been quoted, then:
a) their words have been re-written but the general information
attributed to them has been referenced:
b) where their exact words have been used, their writing has
been placed inside quotation marks, and referenced.
~v) This dissertation/thesis does not contain text, graphics or tables copied
and pasted from the Internet, unless specifically acknowledged, and the
source being detailed in the dissertation/thesis and in the References
sections.
Signature:
ii

iii
Acknowledgements
I would like to take this opportunity to thank the following people who have greatly
assisted me to deliver this document:
♦ The Lord Almighty God, who has given me strength to get this far.
♦ My Supervisor, Alec Bozas. Your dedication, patience and expert guidance
has been an inspiration throughout this journey.
♦ The support of my family and encouragement. I would like to extend my
gratitude to my wife Onneile for her positive spirit and believing in me. My
daughter Reabetswe and my son Melusi for your patience and
understanding.
♦ The participants who took part in this study and petrol station owners, for it
would not have been possible without you.
♦ My parents Mr W.D. Shongwe and Mrs J.T. Shongwe for the seed of
education that you sowed in me.
♦ Mrs Wendy Clarke from the Graduate School of Business. You are a star;
you were forever willing to help unconditionally.

iv
Abstract
More and more South Africans buy cars on a daily basis. They therefore join a
group of existing petrol consumers. The aim of this research was to establish the
existence of brand loyalty amongst South African petrol consumers. The approach
of the research was based on two measurements used in the definition of brand
loyalty. There is no one definition of brand loyalty as indicated from existing
literature. A number of the definitions refer to behavioural and attitudinal elements
of loyalty. This study was largely conducted on this basis of loyalty.
A total of eighty conveniently selected participants were interviewed in Pretoria
and Johannesburg. Data collected using structured questionnaires was then
analysed statistically.
Findings of the research revealed that South African consumers are not strongly
loyal to their chosen petrol brands. Several factors contributed to these results,
such as the non existence of marketing strategies to create brand awareness.
Recommendations to improve brand loyalty were provided along the lines of
loyalty programmes as well as service excellence.

v
Table of Contents
Description Page Title Page ............................................................................................................. i
Declaration .......................................................................................................... ii
Acknowledgements ............................................................................................ iii
Abstract .............................................................................................................. iv
Table of Contents ................................................................................................ v
List of Figures ................................................................................................... viii
List of Tables ...................................................................................................... ix
CHAPTER ONE ................................................................................................. 1
Introduction ...................................................................................................... 1
1.1 Introduction ............................................................................................... 1
1.2 Motivation for the Study ............................................................................ 1
1.3 Focus of the Study .................................................................................... 2
1.4 Problem Statement ................................................................................... 3
1.5 Research Questions ................................................................................. 3
1.6 Objectives ................................................................................................. 3
1.7 Limitations of the Study ............................................................................ 3
1.8 Research Methodology ............................................................................. 4
1.9 Summary of Chapters ............................................................................... 4
1.10 Summary .................................................................................................. 5
CHAPTER TWO ................................................................................................. 6
Literature Review ............................................................................................. 6
2.1 Introduction ............................................................................................... 6
2.2 Brands and Branding ................................................................................ 6
2.2.1 Brands as a Logo ............................................................................... 7
2.2.2 Brand as a Legal Statement ............................................................... 7
2.2.3 Brand as a Relationship ..................................................................... 7
2.2.4 Brand as a Risk Reducer ................................................................... 8
2.2.5 Brand as a Company ......................................................................... 9
2.2.6 Brand as an Image in Consumers’ Minds .......................................... 9

vi
2.2.7 Brand as a Value System................................................................. 10
2.3 Brand Loyalty.......................................................................................... 10
2.3.1 Brand Switching ............................................................................... 14
2.3.2 Behavioural Loyalty .......................................................................... 14
2.3.3 Attitudinal Loyalty ............................................................................. 15
2.4 The South African Petroleum Industry .................................................... 16
2.4.1 Background ...................................................................................... 16
2.5 Regulation of Petrol ................................................................................ 19
2.5.1 Regulatory Framework ..................................................................... 19
2.5.2 Price of Petrol .................................................................................. 22
2.6 Marketing Strategies ............................................................................... 22
2.6.1 Service Quality Strategy................................................................... 23
2.6.2 Promotion ......................................................................................... 28
2.7 Summary ................................................................................................ 31
CHAPTER THREE ........................................................................................... 32
Research Methodology .................................................................................. 32
3.1 Introduction ............................................................................................. 32
3.2 Aim and Objectives of the Study............................................................. 32
3.3 Sample Technique and Data Collection Strategy ................................... 33
3.3.1 Sample Population and Size ............................................................ 33
3.3.2 Sample Technique ........................................................................... 33
3.3.3 Data Collection Strategy .................................................................. 34
3.4 Research Design and Methods .............................................................. 34
3.4.1 Description and Purpose .................................................................. 34
3.4.2 Construction of the Instrument ......................................................... 36
3.4.3 Recruitment of Study Participants .................................................... 37
3.4.4 Pretesting and Validation ................................................................. 38
3.4.5 Administration of the Questionnaire ................................................. 39

vii
3.4.6 Analysis of the Data ......................................................................... 39
3.5 Summary ................................................................................................ 40
CHAPTER FOUR ............................................................................................. 41
Presentation of Results ................................................................................. 41
4.1 Introduction ............................................................................................. 41
4.2 Demographic Frequency Analysis .......................................................... 42
4.3 Brand Loyalty Frequency Analysis ......................................................... 43
4.4 Effect of Marketing Strategies Frequency Analysis ................................ 49
4.5 Comparison Statistics Results ................................................................ 59
4.6 Summary ................................................................................................ 72
CHAPTER FIVE ............................................................................................... 73
Discussion ...................................................................................................... 73
5.1 Introduction ............................................................................................. 73
5.2 Analysis and Interpretation of Results .................................................... 73
5.2 Summary ................................................................................................ 86
CHAPTER SIX ................................................................................................. 87
Conclusions and Recommendations ........................................................... 87
6.1 Introduction ............................................................................................. 87
6.2 Discussion of Findings in Relation to Aims and Objectives .................... 87
6.2.1 Brand Loyalty ................................................................................... 87
6.2.2 Marketing Strategies ........................................................................ 87
6.3 Suggestions ............................................................................................ 88
6.3.1 Brand Loyalty ................................................................................... 88
6.4 Recommendations for Future Research ................................................. 89
6.5 Summary ................................................................................................ 89
BIBLIOGRAPHY .............................................................................................. 90
APPENDICES ................................................................................................ 102
Appendix 1 Questionnaire .............................................................................. 102
Appendix 2 Ethical Clearance ....................................................................... 107
viii
List of Figures
No. Description Page
Figure 2.1 A Conceptual Framework of Customer Loyalty .................................... 14
Figure 2.2 SA Crude Oil Imports ........................................................................... 17
Figure 2.3 Four Service Characteristics ................................................................ 25
Figure 4.1 Gender of Respondents ....................................................................... 42
Figure 4.2 Age of Respondents ............................................................................. 42
Figure 4.3 Existence of Preferred Petrol Brand ..................................................... 43
Figure 4.4 Repeat Purchase of Brand ................................................................... 45
Figure 4.5 Brand Commitment .............................................................................. 46
Figure 4.6 Resistance to Purchase Other Brands ................................................. 47
Figure 4.7 Likeliness of Recommending Preferred Brand ..................................... 48
Figure 4.8 Effect of Advertising on Petrol Brand Purchase ................................... 49
Figure 4.9 Beneficial Aspect of Promotions on Brand Loyalty ............................... 51
Figure 4.10 Brand Loyalty as a Result of Loyalty Programmes ............................. 52
Figure 4.11 Repeat Purchase as a Result of Good Service .................................. 53
Figure 4.12 Service Excellence Rendered at Preferred Petrol Stations ................ 54
Figure 4.13 Importance of Cleanliness at Petrol Stations ...................................... 55
Figure 4.14 Quality of Petrol as a Factor in Purchase Decision ............................ 56
Figure 4.15 Customer Satisfaction Survey as Means of Service Improvement ..... 57
Figure 4.16 Owner of Vehicle Being Driven........................................................... 58

ix
List of Tables No. Description Page
Table 4.1 Petrol Brand Most Preferred .................................................................. 44
Table 4.2 Reasons to Purchase at Petrol Stations ................................................ 50
Table 4.3 Contingency Table Displaying the Relationship Between Repeat
Purchase and Age ................................................................................................. 59
Table 4.4 Chi-Square Test Results for Repeat Purchase and Age Crosstabulation
.............................................................................................................................. 60
Table 4.5 Contingency Table Showing the Relationship Between Repeat Purchase
of Brand and Gender ............................................................................................. 60
Table 4.6 Chi-Square Test Results for Repeat Purchase of Brand and Gender
Crosstabulation ..................................................................................................... 61
Table 4.7 Contingency Table Showing the Relationship Between Brand
Commitment and Age ............................................................................................ 62
Table 4.8 Chi-Square Test Results for Brand Commitment and Age
Crosstabulation ..................................................................................................... 63
Table 4.9 Contingency Table Displaying the Relationship Between Brand
Commitment and Gender ...................................................................................... 63
Table 4.10 Chi-Square Test Results for Brand Commitment and Gender
Crosstabulation ..................................................................................................... 64
Table 4.11 Contingency Table Showing the Relationship Between Resistance to
Purchase Other Brands and Age ........................................................................... 65
Table 4.12 Chi-Square Test Results for Resistance to Purchase Other Brands and
Age Crosstabulation .............................................................................................. 65
Table 4.13 Contingency Table Showing the Relationship Between Resistance to
Purchase Other Brands and Gender ..................................................................... 66
Table 4.14 Chi-Square Test Results for Resistance to Purchase Other Brands and
Gender Crosstabulation ........................................................................................ 66
Table 4.15 Contingency Table Showing the Relationship Between
Recommendation of Preferred Brand and Age...................................................... 67
Table 4.16 Chi-Square Test Results for Recommendation of Preferred Brand and
Age Crosstabulation .............................................................................................. 68

x
Table 4.17 Contingency Table Showing the Relationship Between
Recommendation of Preferred Brand and Gender ................................................ 68
Table 4.18 Chi-square Tests for Recommendation of Preferred Brand and Gender
Crosstabulation ..................................................................................................... 69
Table 4.19 Contingency Table Showing the Relationship Between Quality of Petrol
and Gender ........................................................................................................... 69
Table 4.20 Chi-square Test Results for Importance of Quality of Petrol and Gender
Crosstabulation ..................................................................................................... 70
Table 4.21 Contingency Table Showing the Relationship Between Cleanliness in
Petrol Stations and Gender ................................................................................... 70
Table 4.22 Chi-square Test Results for Cleanliness in Petrol Stations and Gender
Crosstabulation ..................................................................................................... 71
Table 4.23 Contingency Table Showing the Relationship Between the Name of
Petrol Brand Preferred and Gender ....................................................................... 71
Table 4.24 Chi-square Test Results for Name of Petrol Brand Preferred and
Gender Crosstabulation ........................................................................................ 72

1
CHAPTER ONE
Introduction
1.1 Introduction
A brand according to the American Marketing Association dictionary is a name,
term, design, symbol, or any other feature that identifies one seller's goods or
service as distinct from those of other sellers (American Marketing Association,
1995). Many definitions of brand loyalty are based on customer behaviour, making
reference to repeat buying. It occurs because the consumer perceives that the
brand renders the exact product features, image and, or level of quality at the right
price. Kahn & Meyer (1989) prefer the definition that states that a brand is a
deliberate prior tendency to purchase often stemming from past positive
experiences with its use.
The study was undertaken to determine whether there is brand loyalty amongst
South African petrol consumers or not. It then established the existence or non
existence of loyalty and the reasons for such, when it comes to petroleum brands
such as BP, Caltex, Shell, Engen, Total and Sasol.
This chapter introduces the motivation for the study by justifying the need to carry
out the research. It further discusses the focus of the study and the problem
statement. For the study to be conducted appropriately a number of research
questions had to be formulated. Objectives that needed to be achieved are clearly
laid out below. Limitations of the study are also stated. Lastly, the layout of the
chapters is introduced.
1.2 Motivation for the Study
There seems to be no research that has tested brand loyalty within the South
African petroleum industry. What sparked the interest to undertake this study is
that from an observational point of view South Africans seem to have no
preferences in petrol brands.

2
This study sought to detect what customers want when purchasing petrol. A key
line being to determine if the purchase behaviour of petrol is being influenced by
marketing strategies or is it a matter of repeat purchasing based on proximity or on
a particular brand? Alternatively is petrol bought at sites that house customer
specific convenience stores such as a Woolworths? The completed research
affords a greater understanding as to which factors contribute to petrol purchase
behaviour.
Petrol retailers on the other hand will gain an understanding as to whether
purchase is driven by fuel brand recognition or related brands on site, hence
resulting in loyalty. The research considered whether loyalty to the fuel brand does
exist and if so what factors cause people to decide on where to purchase fuel. It
was thought that if it was found that brand loyalty is weak, strengthening tactics in
elevating brand loyalty would be considered. Where brand loyalty is insignificant,
or does not exist then the petrol station owners will have to concentrate on other
features such as differentiated service or other forms of improvements. The
findings of the research add to in-depth knowledge of petrol consumer behaviour
within the industry and they could be utilised by Oil Companies in future studies.
An additional benefit of this research is that government might learn from it, as to
how government regulations impact on petrol brand loyalty if indeed regulations
are a contributing factor. If found to be one of the factors, the research creates an
awareness of what the effects are for retailers that do not practice branding of
products or services. The research explains the importance of brand loyalty in
relation to market share and realised profits.
1.3 Focus of the Study
The focus of the study was limited to the brand loyalty of retail consumers when
purchasing petrol. The study did not dwell on the quality of the different brands
under study and worked on the assumption that all petrol in the SA market is
similar.

3
1.4 Problem Statement
There is a perception that South African petrol consumers are not brand loyal
hence this research was conducted to determine whether that is the case or not.
There is currently no information that explains the consumer behaviour in the
purchasing of petrol in the South African Petroleum Industry.
1.5 Research Questions
The four questions to be answered by this research are as follows:
1. Do consumers consider a brand when purchasing petrol?
2. What roles do marketing strategies of Oil Companies play in relation to
consumer brand loyalty?
3. What are the inhibiting factors experienced by petrol retailers in attaining
brand loyalty?
4. Do existing customer retention strategies work?
1.6 Objectives
The overall primary objective of the study under consideration is to determine
whether there is brand loyalty amongst South African petrol consumers.
The Objectives of the Research are to:
• Determine if petrol consumers in South Africa consider a particular petrol
brand when filling up with petrol or if they are influenced by factors such as
proximity or a relationship with service stations.
• Determine the role played by Oil Company marketing strategies in attaining
brand loyalty to their brand of petrol such as house customer specific
convenience stores.
• Establish if there are any inhibiting factors in attaining brand loyalty
experienced by the retailers.
• Establish if existing Oil Company customer retention strategies work or not.
1.7 Limitations of the Study
Limitations of the study are:
• Respondents will be sampled on a convenience basis due to time
constraint.

4
• The sample size will not be too large due to time constraint in getting
questionnaires completed as time spent by consumers at the petrol station
will be dependent on the amount of fuel being poured.
1.8 Research Methodology
The research focused on the six major petrol brands found in South Africa namely
BP, Caltex, Shell, Engen, Total and Sasol. Convenience sampling was used.
Samples were selected from petrol stations between Johannesburg and Pretoria.
The research was quantitative in nature. Questions highlighting brand loyalty,
marketing strategies and factors which inhibit the attainment of brand loyalty were
included in the structured questionnaire. Participants were notified that
participation was voluntary. Interviews were conducted guided by the self
administered questionnaire. Data was collected and statistically analysed to
determine the results of the study.
1.9 Summary of Chapters
The layout of the dissertation is in the following format:
Chapter 1: Introduction and Background to the Study
This chapter includes the background to the study, problem statement, research
questions, objectives and motivation.
Chapter 2: Literature Review
The chapter covers the theoretical aspect with regard to Brand Loyalty, Marketing
Strategies, Petrol Brands and related issues.
Chapter 3: Research Methodology
This chapter describes the research methodology used leading up to a
questionnaire that renders reliable and valid results. It also contains a discussion
on the fieldwork
5
Chapter 4: Research Results
Chapter 4 is a presentation of the findings of the study and analysis of the results
as per findings from data collection.
Chapter 5: Conclusions and Recommendations
This chapter contains the conclusion of the study and makes recommendations to
address the brand loyalty issue. Suggestions for future research are made.
1.10 Summary
The chapter introduced the background to the research. It then discussed the
motivation, focus, problem statement, research questions and objectives of the
study. The methodology utilised to obtain results was briefly outlined. Limitations of
the study were stated. The next chapter will discuss Literature relevant to
Branding, Brand Loyalty, Marketing Strategies and a background overview of the
South African Petroleum Industry.
6
CHAPTER TWO
2 Literature Review
2.1 Introduction
This chapter reviews the literature with an aim of establishing answers to the
research questions posed in chapter one. The review has been structured in such
a way that it addresses the principles of branding and loyalty. It delves into loyalty
patterns and the effect loyalty has on consumers. Another aspect that relates to
the research is the structure of the South African petroleum industry and
consequences thereof in terms of branding and loyalty of petrol consumers. This
includes theory on legislation and considers the fuel industry in other countries.
Service Quality and how it facilitates customer retention is also discussed. This
expands to marketing strategies utilised to promote brands with an intention of
gaining loyalty and in turn increasing sales.
2.2 Brands and Branding
The American Marketing Association defines a brand as a name, term, design,
symbol, or any other feature that identifies one seller's goods or service as distinct
from those of other sellers (American Marketing Association,1995). From literature
review there has been several definitions and analysis of this definition. Kapferer
(2008) suggests that there is no one definition of a brand. He mentions that there
are disagreements between experts and as a result there are different definitions
of a brand. The difficulty comes in during measurement of the brand in terms of the
limited indicators that must be used to evaluate brand equity. Furthermore there is
a major difference between two paradigms to be considered. One is customer
based and concentrates on the relationship that the customer has with the brand
i.e. total indifference to attachment, loyalty and willingness to purchase and
repurchase based on beliefs of superiority and emotions. The other is associated
with producing measures in monetary terms. Authors de Chernatony & Riley
(1998) have unpacked and categorised the definition into some of the themes
below.

7
2.2.1 Brands as a Logo
This emanates from the traditional definition discussed above. Many authors such
as Watkins, 1986; Aaker, 1991; Dibb, Simkin, Pride & Ferrell, 1994; Kotler,
Armstrong, Saunders, & Wong 1996; strictly adhere to this definition. Shell, BP
and the other petrol companies have distinct logos which can be identified from a
distance. Other authors add variants on the theme of the brand's visual features as
differentiating devices. Crainer (1995) argues that the trouble with older definitions
of brands is that they dwell on the physical product.
Koch (1994) alternatively defines a brand as "a visual design and /or name that is
given to a product or service by an organisation in order to differentiate it from
competing products and which assures consumers that the product will be of high
and consistent quality”.
2.2.2 Brand as a Legal Statement
De Chernatony & Riley (1998) suggest that the Oxford dictionary defines a brand
as “A particular sort or class of goods, as indicated by the trade- marks on them".
This is more a definition relating to a brand as a legal statement. They further
explain that branding represents an investment hence as a result firms seek legal
ownership of the brand, as protection against imitators. Keller (2003) argues that
brands provide a number of valuable functions to firms such as legal protection for
unique features and aspects of a product. A brand can retain intellectual property
rights, providing legal title to the brand owner. This therefore protects the brand
name through registered trademarks, manufacturing processes protected through
patent and packaging is protected through copyrights and designs.
2.2.3 Brand as a Relationship
Hill, McGrath and Sandeep (1998) have defined branding as “creating a mutually
acknowledged relationship between the supplier and buyer that transcends
isolated transactions or specific individuals”. This signifies a “relationship" as
opposed to a product. This is confirmed by de Chernatony & Riley (1998) that
having a respected personality is required prior for a relationship between

8
consumers and brands. They further write that if brands are personified then
consumers would not just perceive them, but would have relationships with them
as well. The relationship results in Customer based Brand Equity. Brand Equity is
defined differently by different authors. Keller (2003) defines it as “the differential
effect that brand knowledge has on consumer response to the marketing of the
brand”. However Aaker (1996) on the other hand defines it as “a set of assets (and
liabilities) linked to a brand’s name and symbol that adds to (or subtracts from) the
value provided by a product or service to a firm and/ or that firm’s customers”. This
implies that customers will show preference of one petrol brand over another even
when identical. The extent to which customers are prepared to pay more for one
particular brand over another is a measure of Brand Equity. Pearson (1996) further
adds that the quality of the relationship gives a company a competitive advantage.
The frequent association with the brand may result in the likelihood of a customer
buying the brand.
2.2.4 Brand as a Risk Reducer
Kapferer (2008) attest to the fact that financial analysts prefer companies with
strong brands simply because they are less risky. He mentions that the certainty,
the guarantee and the removal of the risk are inclusive in the price. Stock
exchange listed companies like Sasol have to actually manage the vast
recognition of their products. The corporate brand is a means to strengthen
recognition. According to de Chernatony & McDonald (1998) a number of
marketers believe that purchasing should be regarded as a process whereby
buyers try to reduce the risk of a purchase decision. There is always uncertainty
whenever a customer is faced with competing brands and they do not want to
appear as if they are wasting money or whether they will be comfortable with the
purchase. Marketing of the brand should be such that the end consumer feels
minimal risk when purchasing it. If this is not done then buyers will try and
minimise risk by always buying the same brand, researching for more information
or settling for the smallest size. Nowadays customers will endeavour to buy the
most reputable brand according to de Chernatony & McDonald (1998).

9
2.2.5 Brand as a Company
Brands extend beyond products and services. Companies are nowadays viewed
as brands according to Keller (2003). Kay (2006) writes that corporate brands can
be managed like product brands. He however differentiates between building a
strong brand versus a product or service brand. Corporate brands in most cases
have little impact on consumers and may not affect demand for product or service
offerings. Corporate communication branding messages directed at shareholders,
employees and other stakeholders are not likely to create a strong brand in which
brand meaning and brand community are cultivated. However when companies
develop meaning through distinctive brand associations, customers will then tend
to recognise the brands. One way of doing this is through social responsibility
programs. In this manner customers will identify with corporate value connections
and this then result in strong corporate brands.
2.2.6 Brand as an Image in Consumers’ Minds
Kotler (1988) defines brand image as the set of beliefs held about a particular
brand. These sentiments are echoed by Srivastava & Kamdar (2009) by stating
that brand image refers to consumer perceptions and encompasses a set of
beliefs that consumers have about the brand. Looking from a consumer’s
perspective, the brand provides a visible representation of differences between
products. Consumer behaviour literature site exposure, attention and perception
as initial steps that lead to brand image stimulus as discussed by Hoyer &
MacInnis (1997). Before any marketing stimulus can affect a consumer, they must
be exposed to it. Through exposure consumers can physically be exposed to
stimuli such as advertisement, packaging, brand names or brand attributes. As the
consumer allocates part of his cognitive resources, attention is developed which
may be selective and divided. Perception then occurs when stimuli is registered by
any of the five senses namely vision, hearing, taste, smell and touch. Keller (2003)
also agrees with this notion in the sense that a positive brand image is created by
marketing programs that link strong, favourable and unique associations to the
brand in memory. He further states that such programs will ensure that brand
strength association is increased. The more deeply a person thinks about product
10
information and relates to the existing brand knowledge, the stronger the brand
associations. According to Sonnier & Ainsle (2011) brand image associations are
key building elements in customer based brand equity frameworks.
2.2.7 Brand as a Value System
There are a number of reasons why branding is carried out by different companies.
Some of the advantages of branding according to Crainer (1995) are:
i) Increasing customer loyalty and enhance market share.
ii) Differentiation i.e. being different from competitor’s products or services,
which may otherwise be identical.
iii) Pricing that reassures quality associated with the brand and therefore
leverage on premium price.
iv) Invent or transform markets
v) Creating new identities by branding unbranded products and services and
as a result develop new commercial possibilities, partnerships and
networks.
Kotler (2003) further states that a brand identifies the seller or maker and is a
complex symbol that conveys six levels of meaning. These are listed as Attributes,
Benefits, Values, Culture, Personality and User.
2.3 Brand Loyalty
Aaker (1992) suggests that brand loyalty leads to brand equity which in turn leads
to business profitability. This therefore gives a company a competitive advantage
and reduces marketing costs in introduction of new customers. Loyal customers
are less likely to switch and this can manifest in high return on investment.
Reichheld (1996) also posits that there are various advantages of customer loyalty
such as a continuous stream of profits, reduction of marketing costs, growth of per-
customer revenue, decrease in operating costs and increase in referral. Hallowell
(1969) suggests that many organisations have been trying to increase their
customers’ loyalty through retention programs and relationship marketing
strategies. This has been observed in a number of South African petrol stations
where car wash vouchers are supplied to motorists who fill petrol over a stipulated
11
amount. In some cases a point system is utilised to entitle a customer for a car
wash. Researchers like Rothschild & Gaidis (1981) as well as Kahn & Louie (1990)
have proposed and discovered empirically that if consumers have been satisfied
with promoted brands, their satisfaction is reinforcing and leads to an increased
probability of them choosing the same brands even after the promotion is over. In
the case of petrol stations, such promotions are found inside the convenience
stores located within the petrol station premises.
The question that one needs to ask is whether satisfaction leads to loyalty.
According to Waddell (1995) and Oliver (1999) there is an asymmetric relationship
between loyalty and satisfaction. Other authors like Baldinger & Rubinson (1996)
have confirmed that highly loyal buyers tend to stay loyal if their attitude towards a
brand is positive. It is therefore easier to convert a switching buyer to a loyal buyer
if they have a favourable attitude towards the brand. Kabiraj & Shanmugan (2011)
further argue that a loyal customer and a satisfied customer are not necessarily
the same. Customers may be loyal for a number of reasons and may not be happy
with the product or service. In some cases the lack of customer defections might
be misinterpreted with satisfied customers. Difficulty in switching can be a result of
costs or penalty attached. This is not the case in relation to petrol purchase in
South Africa since the price is regulated by government throughout the country. In
some cases the alternative products may not be attractive hence switching the
supplier may not be necessary. There are a number of other reasons why
customers may be loyal to a product. Convenience i.e. ease of access to the
retailer’s premises may be one of them. Some petrol stations are situated next to
roadways where it is convenient to fill up. Price can also be a determinant.
Existing research confirms that there are no universally accepted definitions of
brand loyalty according to Uncles, Dowling & Hammond (2003). Tucker (1964)
defined brand loyalty as “simply biased choice behaviour with respect to the
branded merchandise...No consideration should be given what the subject thinks
or what goes on in his central nervous system; his behaviour is the full statement
of what brand loyalty is”. The definition explains observed behaviour as opposed to
12
psychological motivations. In their research article Kabiraj & Shanmugan (2011)
suggest that early work devoted little attention to conceptual explanation of brand
loyalty. The emphasis was more on a behavioural basis. Such research
concentrated on percentage purchases or repeat purchase sequences. Day
(1969) argues that brand loyalty should be discussed from a behavioural as well
as an attitudinal point of view. He further states that though once attitudinal criteria
has been imposed, loyalty tends to become a brand specific concept and no more
a general overall behaviour pattern. A buyer would therefore have a loyalty score
card for each brand that he buys in a given period based on the share of total
purchases and attitude towards the brand. He further argues that loyalty measures
based on reports of purchase decisions do not differentiate clearly between true or
“intentional” loyalty and “spurious “loyalty or because a brand offers a series of
deals as a result of purchasing one brand since there are no readily available
ones or a brand offers a series of deals. Engel & Blackwell (1982) suggested that
spurious loyalty is likely in situations of low involvement whereas true loyalty is
more likely in cases of high involvement. Engel, Blackwell & Miniard (1990)
categorised habitual purchasing into two forms. The first one was as a result of
inertia that resulted from a lack of involvement with the product category. The
second one was brand loyalty resulting from high involvement with the product.
Jacoby & Kyner (1973) stated that “repeat purchasing behaviour and brand loyalty
are functionally different phenomena and are mediated by different underlying
dynamics”. Their argument was based on the fact that the notion of commitment
required conceptual elaboration in order to facilitate the differentiation of different
degrees of brand loyalty. Newman & Werbel (1973) on the other hand raised a
different view where they argued that a measure of brand loyalty should reflect
buyer resistance to persuasion to switch brands in order to have a meaningful
insight to management.
Crainer (1995) defines Loyalty as “A measure of the commitment or obligation felt
by consumers to purchase or use a particular brand”. This is a notion that Traylor
(1981) agrees with. He suggested that commitment is attitudinal. The greater the
degree of brand commitment, the more likely the brand is to be the only choice in

13
the product class. This then creates an attachment to the brand. In another article
Traylor (1983) suggested that the brand commitment represents an emotional or
psychological attachment to a brand whilst brand loyalty is a behavioural
phenomenon. Jacoby & Chestnut (1978) defined brand loyalty as “ the biased
behavioural response, expressed over time, by some decision making unit with
respect to one or more alternative brands out of a set of such brands and is a
function of psychological (decision making , evaluative) processes exhibited over
time”. This was a more elaborate and conceptual definition according to Uncles et
al (2003). Clow & Baack (2010) attest to that brand loyalty occurs when a
consumer makes a concerted effort to find and purchase a specific brand. This is
simply because the consumer has developed a mental affinity with the brand.
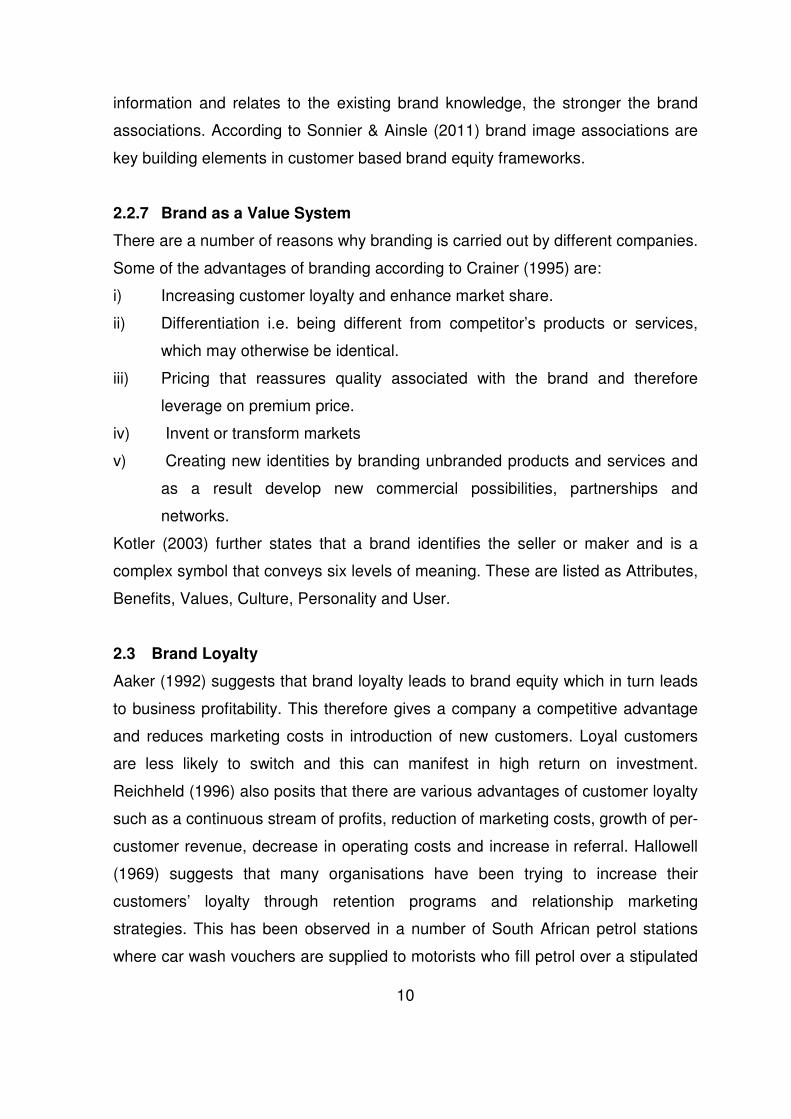
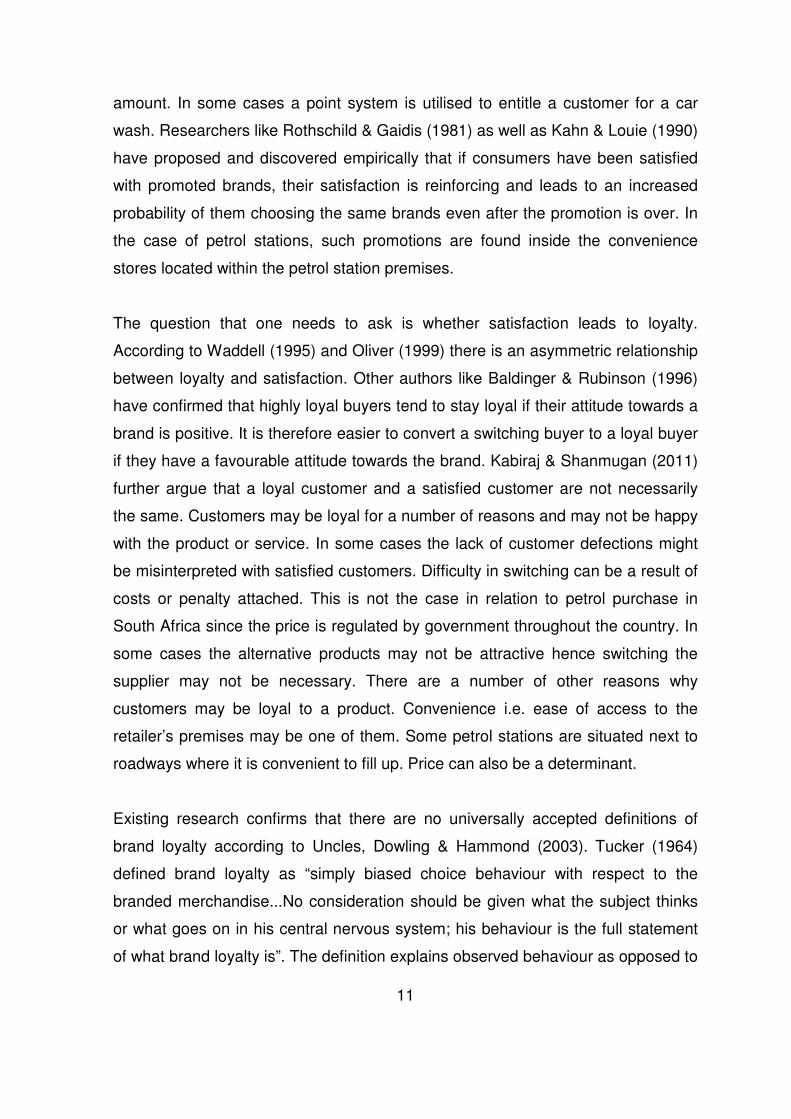
However Oliver (1997) portrayed a complex multidimensional picture of the
definition of brand loyalty. His framework included the full spectrum of brand
loyalty based on the hierarchy of effects model with cognitive, effective, conative
(behavioural intent) and action (repeat purchase behaviour) dimensions. His
definition is “ A deeply held commitment to rebuy or repatronise a preferred
product/service consistently in the future, thereby causing repetitive same brand
set purchasing, despite situational influences and marketing efforts having the
potential to cause switching behaviour”. He further describes loyalty in the
cognitive phase as based on either prior knowledge or experience about a certain
brand. Loyalty in the affective phase is a liking or attitude towards a brand as
shown in Figure 2.1.This form of loyalty is subject to switching. Thirdly conative
loyalty is a customer’s behavioural intention to keep on purchasing a product in the
future. Such loyalty is stronger than affective loyalty according to Oliver (1999) and
Pederson & Nysveen (2001). Finally action loyalty occurs when motivated intention
is changed into readiness to act, which is the behavioural approach.
14
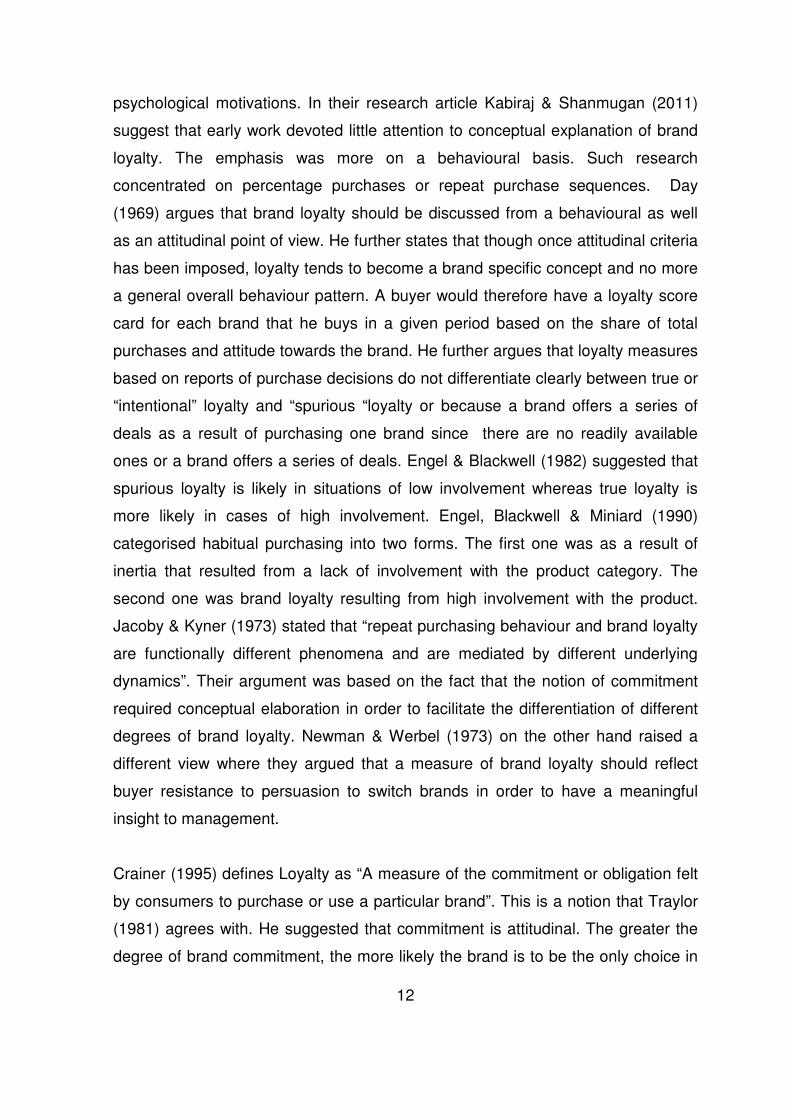
Figure 2.1 A Conceptual Framework of Customer Loyalty
Adapted from Dick, A.S. & Basu, K. 1994. Customer loyalty: toward an
integrated conceptual framework. Journal of the Academy of Marketing
Science, vol. 22, no. 2, pp. 99-113.
2.3.1 Brand Switching
Evans, Moutinho & Raaij (1996) classify brand loyal consumers into hardcore and
brand switchers. Hardcore consumers repeatedly purchase a brand regardless of
the premium price of the brand. On the other hand brand switchers are those that
utilise two or more brands when one brand does not satisfy all their needs.
2.3.2 Behavioural Loyalty
A number of studies of brand loyalty have been measured by the behavioural
aspect of brand loyalty e.g. repeat purchases disregarding the cognitive aspect.
According to Uncles et al (2003) behavioural measures define brand loyalty in
terms of the actual purchases observed over a time period. The advantage of this
is that the measures are firstly based on actual purchases directly related to the
performance and existence of the firm. Secondly they are not likely to be incidental
as they are based on behaviour over a period of time. Lastly they are relatively
easier to collect than attitudinal data. An example is a study carried out by Fader
& Schmittlein (1993) investigating the advantage of high share brands in brand
15
loyalty. In their research they concluded that high share brands have significantly
greater loyalty than small market share brands. The focus of measurement was
based on the behavioural aspect. According to Corstjens & Lal (2000) behavioural
loyalty can be expressed in different ways. Some customers may be loyal to
brands and or they can be loyal to stores. Schultz & Bailey (2000) further
discusses the fact that a satisfied customer is most likely to be loyal to a brand or
store over time than a customer whose purchase is as a result of other reasons
like time restriction. Day, Shocker & Srivastava (1979) argue that although
behavioural data is the most accurate presentation of the past behaviour, it is not
necessarily a good representation of future behaviour especially under changed
circumstances e.g. when a brand is out of stock.
2.3.3 Attitudinal Loyalty
As discussed above most definitions of brand loyalty consider the behavioural
aspect. Day (1969) argued that to be truly loyal, the consumer must also hold a
favourable attitude toward the brand. Mellens, Dekimpe & Steenkamp (1996) as
well as Foxall & Goldsmith (1994) support that there has to be attitudinal
commitment. They further state that a positive attitudinal response for a brand
attribute like “tastes nice”, “good value for money” or “Intention to buy” is an
indicative component of the consumer’s commitment and loyalty towards that
brand. Buying the brand would be then a result of a consumer having liked it. They
argue that if positive beliefs are reinforced by say one’s use of the brand or
advertising, one would by chance purchase it more often in the future. An
alternative view by Riley, Ehrenberg, Castleberry, Barwise & Barnard (1997) is that
liking follows behaviour and that strengthening one’s liking of the brand would not
increase repeat purchase tendencies. Jacoby and Chestnut (1978) have implied
that the underlying principles of brand loyalty are the consumer’s consistency of
choice. If a positive attitude displays commitment and loyalty, positive beliefs must
also be stable over time. In their research findings, Riley et al (1997) concluded
that attitude beliefs are not very firmly held. The attitudinal repeat rates for different
brands vary about a 50% average. The variations are dependent on initial
attitudinal responses regarding commitment and loyalty towards a brand as further

16
instance of Double Jeopardy effects i.e. the statistical selection effect that has to
happen every time two or more items only differ by popularity but otherwise are of
equal merit, McPhee (1963). It was found that the variation of repeat rates is not
brand specific.
A number of authors like Jacoby & Chestnut (1978), Dick & Basu (1994) and
Reichheld (1996) support the notion that brand loyalty is as a result of strong
attitudinal commitment. This is associated with favourable set of stated beliefs on
the brand purchased. The attitudes are actually measured by enquiring how much
people like the brand, how much they feel committed to it, whether they would
recommend to any person as well as positive beliefs and feelings in comparison
with competing brands. The strength of the attitudes is regarded as the major
predictor of a brand’s purchase and repeat patronage. It is expressed in terms of
revealed behaviour i.e. past purchase patterns. It is also displayed through buying
moderated by individual’s characteristics, circumstances, and or the purchase
situation.
2.4 The South African Petroleum Industry
2.4.1 Background
The history of the South African oil industry dates as far back as 1884, when a
company was established to manage importation of and sale of petroleum
products (Oil and Gas ... 2011). The industry grew as a result of growth in the
motoring industry and industrial enterprises that utilised liquid fuels.
From the 1950s for political, strategic and economic reasons, the South African
government started a programme to reduce dependence on crude oil imports.
Importation of all oil products occurred before 1954 and after that the first oil
refinery was built in Durban by Mobil, now known as Engen. Later during the same
decade Sasol I oil was built from coal plant to create liquid fuels. More refineries
were built thereafter as a result of demand. These comprised of Sapref (Shell and
BP) in1964 also in Durban. In 1966 there was the introduction of Calref (Caltex) in
Cape Town followed by Natref (Sasol and Total) in 1972.The Sasol II and III plants
17
were established in Secunda close to the coal fields. Towards the end of the
1980s, construction of Mossgas started to produce liquid fuels from natural gas in
the Bredasporp basin. Since then the industry has grown and matured and
exploration for gas and oil has been ongoing. There are currently seven major
players in the industry according to Maleka, Mashimbye & Goyns (2010).These
are BP, Chevron, PetroSA, Sasol, Shell and Total.
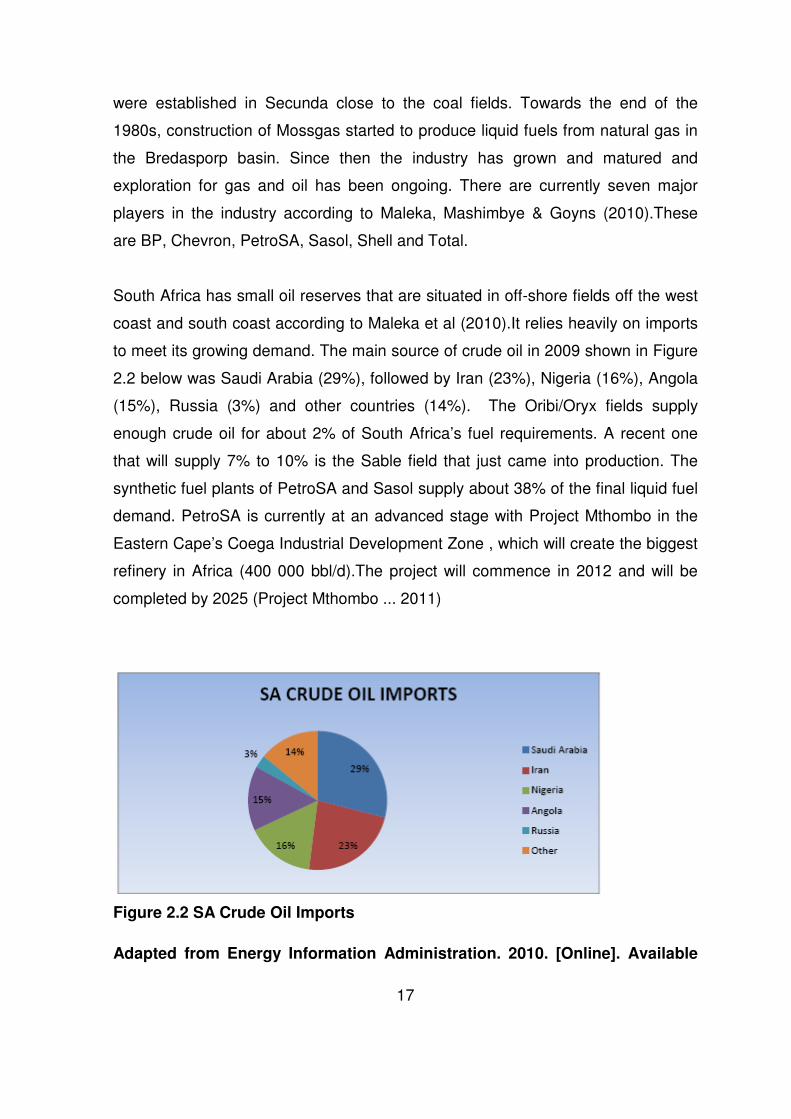
South Africa has small oil reserves that are situated in off-shore fields off the west
coast and south coast according to Maleka et al (2010).It relies heavily on imports
to meet its growing demand. The main source of crude oil in 2009 shown in Figure
2.2 below was Saudi Arabia (29%), followed by Iran (23%), Nigeria (16%), Angola
(15%), Russia (3%) and other countries (14%). The Oribi/Oryx fields supply
enough crude oil for about 2% of South Africa’s fuel requirements. A recent one
that will supply 7% to 10% is the Sable field that just came into production. The
synthetic fuel plants of PetroSA and Sasol supply about 38% of the final liquid fuel
demand. PetroSA is currently at an advanced stage with Project Mthombo in the
Eastern Cape’s Coega Industrial Development Zone , which will create the biggest
refinery in Africa (400 000 bbl/d).The project will commence in 2012 and will be
completed by 2025 (Project Mthombo ... 2011)
Figure 2.2 SA Crude Oil Imports
Adapted from Energy Information Administration. 2010. [Online]. Available

18
WWW: http://www.eia.gov/countries/country-data.cfm (Accessed 22 January
2011).
The South African refineries in 2009 contributed 708000 barrels per day of petrol.
The amount of petrol consumed approximately 11.3 billion litres in 2009 according
to the South African Petroleum Industry Association (2010).
The oil industry is a tightly regulated industry. During the apartheid years the
industry was characterised by secrecy and a high degree of state regulation
according to Miller & van Meelis (2005).Oil refineries were designated National
Key Points under the National Key Points Act of 1980 with strict access control.
With advent of democracy and lifting of sanctions, the industry opened up and
state ownership declined.
In 2002 the government decided to form the Petroleum, Oil and Gas Corporation
of South Africa (PetroSA), which serves as South Africa’s national oil company,
(PetroSA Historic Milestones ... 2011). It owns, operates and manages South
Africa’s petroleum industry commercial assets. PetroSA owns and operates one of
the world’s largest Gas to liquid refineries, recognised around the world for
producing the cleanest fuels through an environmentally responsible process.
The Minister of Minerals and Energy is responsible for the governance of the liquid
fuels industry in South Africa (White Paper on... 2003). Maleka et al (2010)
revealed that in 2009 the department was split into two independent departments
namely Department of Energy (DOE) and Department of Mineral Resources
(DMR). Price Control is managed by the Minister of Energy in terms of the
Petroleum Products Act (Act 120 of 1977). According to this act the Minister of
Minerals and Energy is “the liquid fuels industry regulator and may prescribe the
price at which any petroleum product may be sold or bought, method of trading,
publishing of prices and quantities of crude oil or petroleum products to be
maintained by any person”.
19
From a wholesaling perspective the South African Petroleum Industry Association
(SAPIA) members BP Southern Africa, Chevron South Africa, Engen Petroleum,
PetroSA, Sasol Oil, Shell South Africa and Total South Africa are the main players
in the South African oil industry. They operate storage terminals and distribution
facilities throughout the country. Until recently, there were very few non-refining
wholesalers supplying petrol and diesel in South Africa. Today, there are a number
that are registered with the Department of Energy.
There are approximately 4 600 service stations (forecourts, company owned and
dealer owned) in South Africa. Licensing of the petroleum industry occurred for the
first time in 2005, in terms of the Petroleum Products Amendment Act, 2003.
Government limits the number of licences allocated. Manufacturers and
wholesalers are prohibited from holding a retail licence except for training
purposes. SAPIA members are therefore restricted to a limited number of retail
licences (Industry Overview – South ... 2011).
SAPIA members do have the option to franchise a station to an independent
dealer and directly supply it with petroleum products. There are also stations that
are independently operated and unbranded.
2.5 Regulation of Petrol
2.5.1 Regulatory Framework
The Liquid industry is highly regulated by Government's Department of Energy
which, in turn, is monitored by a Parliamentary Portfolio Committee. Currently
there are licensing requirements regulations pertaining to, among other things;
Importation and exportation of Crude oil, Importation and exportation of petroleum
products, Importation and exportation of blending components, Operation of
petroleum pipelines including setting of tariff structures, Operation of storage
facilities and loading facilities, including approval of tariff structures, Manufacturing
of petroleum products, Wholesale of fuels ,Retailing of fuels, including the pump
price of petrol by grade and location, Recovery of transport costs, Liquefied
petroleum gas refinery gate price, Retail price for illuminating paraffin, Retail and
20
wholesale margins and Petroleum products specifications and standards (Industry
Overview – South ... 2011).
The Service Station Rationalisation Plan (Ratplan) places limitations on the
opening of new sites. Self-service is still illegal in South Africa for purposes of job
protection. Credit card payments were not allowed for service station sales until
2009 when amendments were made to the Petroleum Products Act, 1977 to allow
for payment cards such as credit cards, debit cards, cheque cards, fleet cards or
garage cards for purchase of petroleum products. Several aspects of existing
regulations are not being strictly enforced while the future regulation of the industry
is being deliberated. The existing regulations provided a delicate balance between
the various stakeholders and proposed changes to this balance have been
strongly resisted by the stakeholders whose shares are likely to diminish in a new
dispensation. They also provide a strong entry barrier to companies such as Agip,
Elf, Mobil and others which might have intentions to operate in the country (Oil and
Gas ... 2011).
The attributes required for the liquid fuel industry can ultimately be met in an
environment of minimum government intervention and regulation (White Paper
on... 1998). This statement indicated government’s stand on the deregulation of
the petroleum liquid fuel sector. The goal would be to achieve an international
competitiveness and investment for the purpose of contributing to low cost and
availability of products.
According to Terry & Frank (1990) “deregulated society means a society free from
government imposed restrictions, directives or orders”. This shift away from the
sovereignty of government makes an opportunity for sovereignty at the level of the
consumer. A deregulated market is characterised by competitive pricing driven by
forces of supply and demand. Such a market is different from a liberated one
which has simpler and less regulations that increase efficiency and protect
consumer’s rights. The South African petroleum industry currently exercises a
managed liberalisation, reason being that consumers are protected from exorbitant
fuel prices and increase efficiencies. According to Government the minimal
21
intervention aids in promoting and protecting employment within this industry. It
further facilitates the entry of historically disadvantaged communities in the sector.
This actually resulted in the Liquid Fuels Empowerment Charter being signed by
key industry players in 2002.
During the Energy Summit held by the Department of Minerals and Energy, there
were a number of schools of thoughts when it comes to regulating the Petroleum
industry (Outcomes of the ... 2007). The one school of thought is of the idea that
there is no need for regulation to increase completion in the energy market and
that removing regulation is not tantamount to influencing competition in the market.
Furthermore that the liquid market is oligopolistic and given constrained logistical
capacity it is not conducive to convert it to a market driven industry. The following
arguments were laid against deregulation taking into account the few
developments expected in the deregulated environment:
• intensified competition and sporadic price wars in the major urban
areas;
• regional wholesale price differentials reflecting variations in transport
costs;
• volume concentration of retail sales through larger outlets;
• diversified use of outlet sites with expanded accessory and grocery
stores;
• relocation of outlets from restricted inner city sites to sites with lower
land values;
• wholesaler acquisition and franchising of strategic sites, to secure
market shares; and
• continued niche markets for smaller suburban and rural outlets.
Another school of thought is entirely against competition. Its argument is that
competition will increase the prices of energy services which might affect the poor
in terms of affordability. Examples quoted were that of Norway where a
competitive market introduced in the electricity market resulted in initial reduced
22
rates but subsequently in increased electricity prices. However in Adelaide,
Melbourne and Sydney (Australia) deregulation in 1998 resulted in relatively low
petrol prices according to Davey (2010).It was found that regulation imposed
increased production costs that were ultimately paid by the consumers in relatively
high retail prices.
On the other hand some organisations are for deregulation of the industry. SAPIA
which also represents major oil companies has supported deregulation according
to the South African Petroleum Industry Association (2010).
2.5.2 Price of Petrol
As discussed above government regulates wholesale margins and controls the
retail price of petrol. The SAPIA website provides a detailed explanation of the
breakdown of the Fuel price.
The petrol retail price is changed every month on the first Wednesday by the
Central Energy Fund (CFE) on behalf of the Department of Energy. The petrol
pump price is divided into a number of components namely international and
domestic elements. The international element known as the Basic Fuel price (BFP)
is based on what it would cost a South African importer to purchase petrol from an
international refinery and to transport the product onto South African shores. The
diesel retail price on the other hand is not regulated. The retail margin is estimated
to be similar to the regulated retail margin on petrol.
2.6 Marketing Strategies
Strategy is “management’s game plan for growing the business, staking out a
market position, attracting and pleasuring customers, competing successfully,
conducting operations, and achieving targeted objectives” according to Thompson,
Strickland & Gamble (2005). A company strategy forms a map of how its
managers choose to attract and please customers, how to respond to changing
market conditions, how to compete successfully and how to grow the business.
The strategy formulated should assist the organisation in achieving a competitive

23
advantage over its competitors.
Marketing Strategy according to Day, Weitz & Wensley (1990) refers to the
marketing activities and decisions related to generating and sustaining competitive
advantage for the business. Kotler (2003) discusses that most large companies
have four organisational levels namely, corporate level, division level, business
unit level and product level. Strategy development within the different levels differ
in the planning process. The corporate headquarters formulate a corporate
strategic plan for the whole enterprise in terms of resources allocation and
business alignment. Business units are responsible for crafting strategic plan to
direct the business unit to a profitable plan. Lastly, the product level within a
business unit develops a marketing plan to achieve its objectives within the chosen
target market. The marketing plan is divided into Strategic as well as tactical plans.
The strategic marketing plan addresses the target markets and value proposition.
On the other hand the tactical marketing plan looks at the marketing tactics to be
utilised consisting of the marketing mix i.e. product, price, distribution and
promotion. For purposes of this study, promotion and service quality strategies will
be discussed. Price as mentioned earlier is a constant factor.
In view of the fact that the South African government is looking at deregulation of
the petroleum industry, Bytheway & Onojaefe (2009) suggest that as some
national economies deregulate and emerging economies take shape, market and
competitive forces are bound to change. As a result the competitive strength of
companies in those economies will greatly depend on their image created through
marketing and branding management. Those consumers that had no choice under
a sovereign government will now be empowered and enabled to choose. The
industry is thus presented with a need to strategise.
2.6.1 Service Quality Strategy
According to Agyapong (2011), the definition of quality may differ from person to
person and from situation to situation. The definitions of service quality vary only in
wording but typically involve determining whether perceived service delivery

24
meets, exceeds or fails to meet customer expectations as expressed by Cronin &
Taylor, 1992; Oliver, 1993; Zeithaml, Berry & Parasuraman, 1993. Czepiel (1990)
defines service quality as customer perception of how well a service meets or
exceeds their expectations. Service quality is commonly noted as a critical
prerequisite and determinant of competitiveness for establishing and sustaining
satisfying relationships with customers. Previous studies by Spreng & Mackoy
(1996) suggests that service quality is an important indicator of customer
satisfaction. Attention to service quality can make an organisation different from
other organisations and gain a lasting competitive advantage writes Boshoff &
Gray (2004). In particular, consumers prefer service quality when the price and
other cost elements are held constant. Services have grown dramatically and
constitute 67% of the South African gross domestic product according to Kotler &
Armstrong (2010). There are several Service industries ranging from Government
sector to profit making organisations like the airline industry and petroleum
industry. The nature and characteristics of a service is categorised by Kotler &
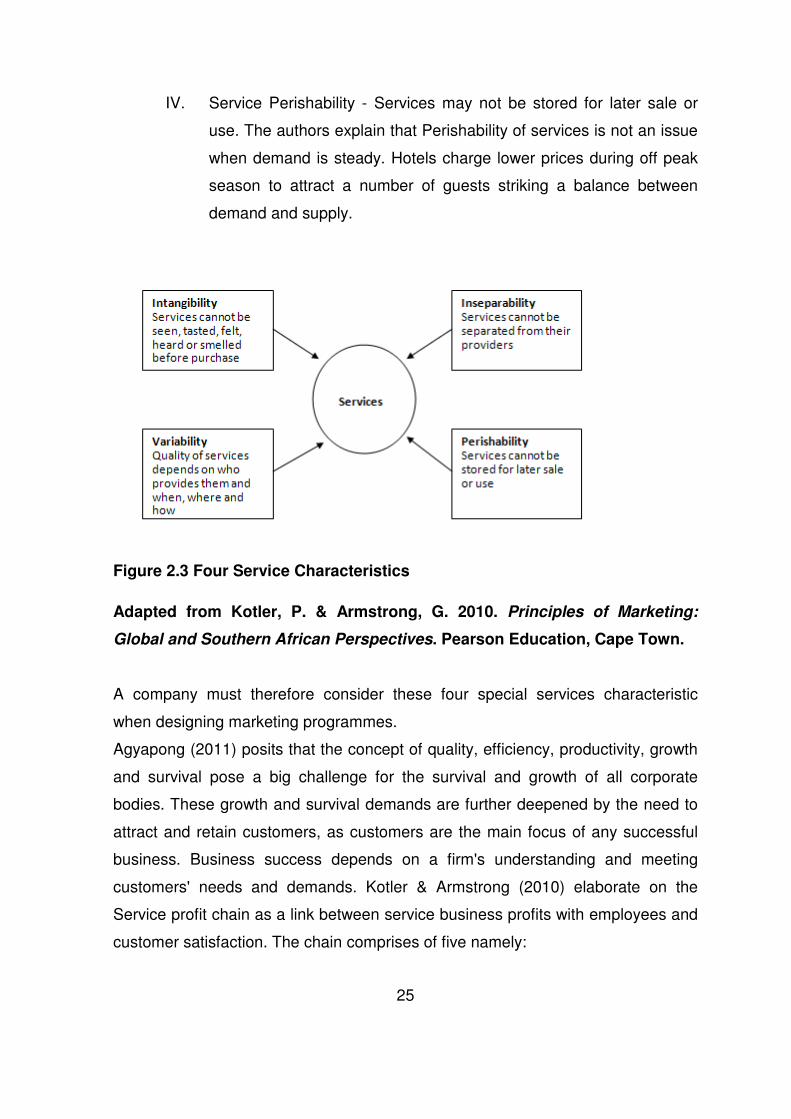
Armstrong (2010) in Figure 2.3 below into:
I. Service Intangibility- Services cannot be smelled, tasted, felt, heard
or seen. Buyers tend to look for signals or tangible clues about the
service quality. They tend to draw conclusions about the quality from
the place, people, price, equipment and communications. A good
example is a hospital.
II. Service Inseparability – Services are first sold, then produced and
consumed at the same time. This is contrary to a physical product
which is first produced, stored, sold and then consumed.
Inseparability refers to the fact that services cannot be separated
from their providers, regardless of whether the providers are people
or machines.
III. Service Variability- Quality of service depends on who provides it as
well as when, where and how it is rendered. One employee may
provide a different service as compared to another within the same
organisation.
25
IV. Service Perishability - Services may not be stored for later sale or
use. The authors explain that Perishability of services is not an issue
when demand is steady. Hotels charge lower prices during off peak
season to attract a number of guests striking a balance between
demand and supply.
Figure 2.3 Four Service Characteristics
Adapted from Kotler, P. & Armstrong, G. 2010. Principles of Marketing:
Global and Southern African Perspectives. Pearson Education, Cape Town.
A company must therefore consider these four special services characteristic
when designing marketing programmes.
Agyapong (2011) posits that the concept of quality, efficiency, productivity, growth
and survival pose a big challenge for the survival and growth of all corporate
bodies. These growth and survival demands are further deepened by the need to
attract and retain customers, as customers are the main focus of any successful
business. Business success depends on a firm's understanding and meeting
customers' needs and demands. Kotler & Armstrong (2010) elaborate on the
Service profit chain as a link between service business profits with employees and
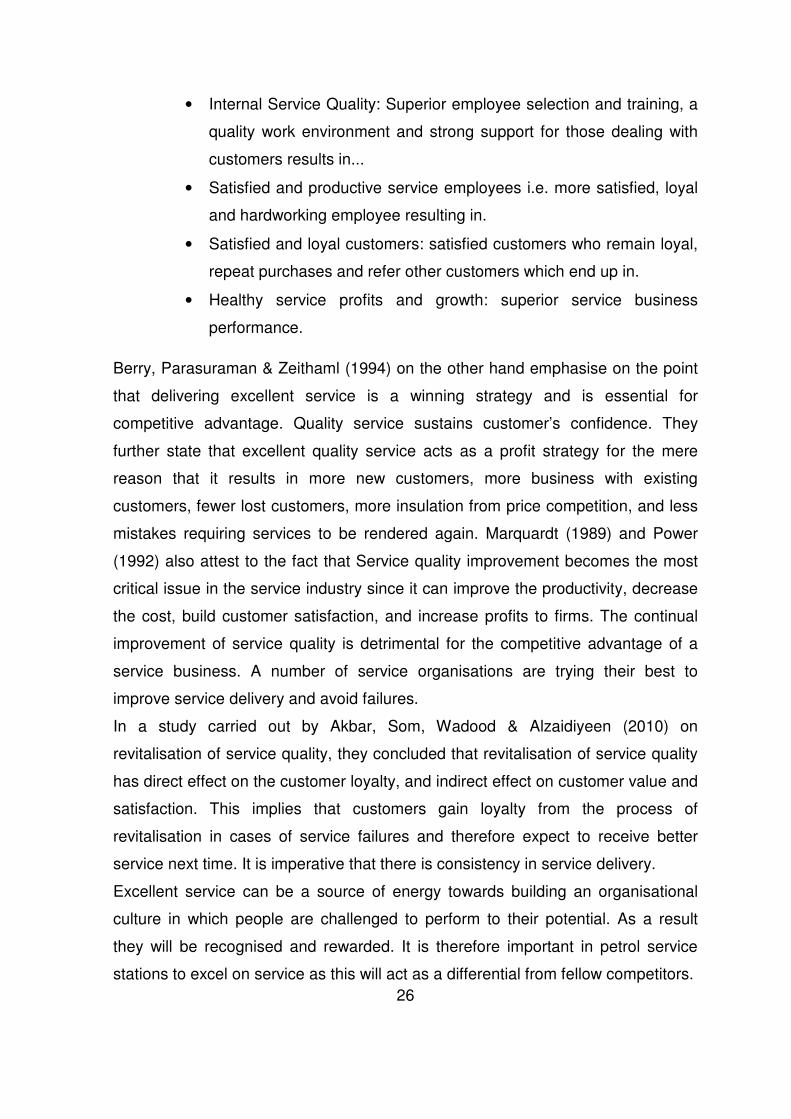
customer satisfaction. The chain comprises of five namely:
26
• Internal Service Quality: Superior employee selection and training, a
quality work environment and strong support for those dealing with
customers results in...
• Satisfied and productive service employees i.e. more satisfied, loyal
and hardworking employee resulting in.
• Satisfied and loyal customers: satisfied customers who remain loyal,
repeat purchases and refer other customers which end up in.
• Healthy service profits and growth: superior service business
performance.
Berry, Parasuraman & Zeithaml (1994) on the other hand emphasise on the point
that delivering excellent service is a winning strategy and is essential for
competitive advantage. Quality service sustains customer’s confidence. They
further state that excellent quality service acts as a profit strategy for the mere
reason that it results in more new customers, more business with existing
customers, fewer lost customers, more insulation from price competition, and less
mistakes requiring services to be rendered again. Marquardt (1989) and Power
(1992) also attest to the fact that Service quality improvement becomes the most
critical issue in the service industry since it can improve the productivity, decrease
the cost, build customer satisfaction, and increase profits to firms. The continual
improvement of service quality is detrimental for the competitive advantage of a
service business. A number of service organisations are trying their best to
improve service delivery and avoid failures.
In a study carried out by Akbar, Som, Wadood & Alzaidiyeen (2010) on
revitalisation of service quality, they concluded that revitalisation of service quality
has direct effect on the customer loyalty, and indirect effect on customer value and
satisfaction. This implies that customers gain loyalty from the process of
revitalisation in cases of service failures and therefore expect to receive better
service next time. It is imperative that there is consistency in service delivery.
Excellent service can be a source of energy towards building an organisational
culture in which people are challenged to perform to their potential. As a result
they will be recognised and rewarded. It is therefore important in petrol service
stations to excel on service as this will act as a differential from fellow competitors.
27
In the case of the South African Petrol Retail industry, petrol prices are the same
as determined by Government and self service is banned. In a research done by
Mlonzi (1996) he emphasized on the importance of improvement of service
delivery in order to satisfy consumers at petrol stations in black areas.
According to Lofstock (2003) in the United States of America there are certain
states such as New Jersey and Oregon where petrol is filled by petrol attendants
and in other states self service exist. In cases where a petrol attendance needs to
fill the tank, sometimes the response experienced is slow. Petrol attendants tend
to delay when they have to attend to customers that have been waiting. A typical
example is one that was experienced by an editor at a LUKOIL petrol station on
the Garden State Parkway where he waited for more than five minutes for an
attendant to come to the car and pump petrol. The employees were busy joking
with one another and the editor out of frustration decided to pump the petrol
herself (Editor’s Eye ... 2007). On another occasion in a West Virginia convenience
store, a CSNews staff member stopped to buy a couple of items. The store was
not clean at all and moreover the cashier was not friendly when she was asked for
a plastic bag to carry the items. As a result the CSNews staff vowed never to set
foot in that garage any time soon. This goes to show how important excellent
service is.
In a petrol service station the service given by the petrol attendant plays a vital role
in keeping the customer happy. Most petrol stations in South Africa provide extra
services such as checking tyre pressure or washing of the windscreen over and
above filling petrol. This is a means of rendering a differentiated service. According
to Kotler & Armstrong (2010) managing service differentiation is important more
especially in cases of intense price competitions. In the petroleum industry in
South Africa service differentiation is very important because of the fixed prices.
Quality service should not end with the petrol attendant but also with the
Convenience store employees. Service firms can therefore differentiate their
service by having more able and reliable customer contact people. This improves

28
the image of the brand. Another differentiating factor is consistent delivery of high
quality exceeding customers expectations, that sets a company apart from
competitors as supported by Disend (1991)
In a survey carried out in the United Kingdom less than 1% of shoppers think
petrol stations deliver good customer service (Customer service in ... 2010).The
national customer satisfaction revealed that 0.8 % of shoppers felt that they had
received good service at forecourts. A good 92% expressed that they had left the
place without making a purchase due to poor customer service. On the other hand
74% expressed that they would be prepared to pay more for a product if it meant
that they get better service. This shows that service is generally not good and
petrol stations have a competitive advantage to improve customer loyalty and
repeat business by delivering excellent service.
2.6.2 Promotion
How do marketers communicate with their target markets? Koekemoer, Blem,
Duckles, Skinner & van der Westhuizen (1998) assert that the process of
communication with consumers and customers is called promotion. In reaching the
target market the marketer uses the marketing mix. They further state that
promotion consist of advertising, personal selling, sales promotion, direct
marketing, public relations and sponsorship. Promotion is not something marketers
do to consumers but something that happens when marketers are sensitive to
consumers’ needs and wants and communicate it in a respectful, responsible and
relevant way.
It is to be noted though that promotion is supported by the other elements of the
marketing mix. Kotler & Armstrong (2010) support this notion by arguing that an
effective marketing programme blends all of the marketing mix elements into an
integrated programme that serves to deliver value to the customer.
The fuel retail sector has diversified so much in recent years according to Hadland
(2002). Petrol stations have become access points for a range of services
including banking, retail and other services. You find ATM, car sales, postal

29
services, dry cleaning, lotto ticketing, bakeries, food retail outlets and convenience
stores which incorporates retail shops like Woolworths. There are also cell phone
supplies, car wash arrears and recently movie outlets within the convenience
shops. This is a clear shift from the core business and has changed the face of the
fuel retail sector, allowing many marginal outlets to survive. A number of these
outlets open 24 hours.
According to Pearson (1996) today’s brands were created by mass marketing and
by television advertising. Television is a powerful and involving medium that is
engaging, entertaining and compelling. It clearly communicates features, benefits
and values that motivate customer choice. In the South African context, a few
petrol brands are advertised on television. BP has been a prominent brand on
television screens. There are no aggressive advertisements of the different petrol
brands. Pearson (1996) criticises the effectiveness of television advertisement in
recent times. He attributes this to addition of more channels hence resulting in less
audiences targeted, more advertisers, higher media costs and lower production.
In a study carried out in Singapore by Ang & Tan (1990) after deregulation of
diesel and petrol, they found that promotion strategies of petrol and diesel yielded
different results. The main promotional strategy utilised was giving away of free
gifts and having lucky draws. Chemical additives intended to enhance fuel quality
was also used as an advertising tool for product differentiation and to improve
company image. The diesel was mostly utilised by taxi drivers and heavy goods
vehicles whilst private cars and most light vehicles used petrol. It was observed
that the majority of diesel customers were not easily lured by promotions. The
companies had brand loyal diesel customers. The reason for this was that these
taxi drivers were cost conscious and insensitive to different types of promotions.
Furthermore taxi diesel users had established a relationship with retail outlet
operator through other services provided such as car washing. The commercial
heavy goods and buses had credit facilities, hence were brand loyal. Petrol sales
on the other hand were more volatile and competition was more intense. It was
found that petrol consumers were highly additive conscious due to the fact that
30
they took good care of their cars. Advertising created great awareness especially
during product launch. Promotions of free gifts and lucky draws also lured petrol
customers. The reason was that they were not brand loyal except for the
convenient location of the retail outlet and traditional habits.
According to Dugar (2007) for about hundred and forty odd years petrol existed as
an undifferentiated product in India. There were three government regulated
selling companies enjoying a monopoly status. After deregulation of the petroleum
industry suddenly there was a need to differentiate or brand petrol. The companies
never realised the seriousness of marketing of petrol to fight for market share after
so many years of regulation. Even consumers never thought they would be
standing at petrol pumps thinking about the brand to fill. The other need came from
the entry of private players in the market that had not been there before. Brand
Management strategies were employed by these companies to effect
differentiation competitive edge. The petrol commodity product has been changed
to a branded product. Value added services have been introduced to make the
clients experience in the purchase a very pleasant one. Examples were formation
of Retail Brand clubs that ensured high quality personalised Vehicle and consumer
care.
Govender (1997) suggests that there seems to exist a clear understanding of the
need for marketing at service station level, despite the franchise system that exists
in the South African industry. Service station managers have generally
underestimated the degree of regulation of their marketing activities. Most service
station managers did seem to have marketing objectives, but they did not
communicate such objectives to their staff. In a later study Bytheway & Onojaefe
(2009) supports this notion that in South Africa, petroleum retailers acknowledge
the need for branding and understand the huge financial and human resources
that will be needed to achieve it.
Hadland (2002) however suggests that oil companies in South Africa do not
compete amongst each other like in many countries around the world and as a
result consumers in general care less of the petrol brand they utilise. The oil
31
companies are more concerned with their image and branding than the products.
2.7 Summary
This chapter discussed the theory on branding and brand loyalty. It further looked
at the South African petroleum industry and how it operates. Literature on
marketing strategies was discussed, relevant to the topic under study. The next
chapter will discuss the research methodology that was used for the study.
32
CHAPTER THREE
3 Research Methodology
3.1 Introduction
The purpose of this chapter is to describe the Research methodology used in
answering the research questions posed in Chapter one. The methodology utilised
in obtaining data to assist in the analysis of the study is laid out with justifications
of the sample size chosen as well as the location. The method used to analyse the
data is defined and outlined.
White (2002) suggests that “Research is a process, a series of events unfolding
over time.”It involves several things such as choice of research design, collection
of data and evaluation of the results. Eriksson & Kovalainen (2008) asserts that
the “research questions dictate the choice of methods and type of research setting
and not the other way round”.
3.2 Aim and Objectives of the Study
The aim of the study was to establish if there is brand loyalty amongst South
African petrol consumers.
The objectives under consideration were to:
• Determine if petrol consumers in South Africa consider a particular
petrol brand when filling up with petrol or if they are influenced by
factors such as proximity or relationship with service stations.
• Determine the role played by Oil Company marketing strategies in
attaining brand loyalty.
• Establish if there are any inhibiting factors in attaining brand loyalty
experienced by the retailers.
• Establish if existing Oil company customer retention strategies work or
not.
33
3.3 Sample Technique and Data Collection Strategy
3.3.1 Sample Population and Size
Cooper & Schindler (1998) describe sampling as a means of selecting some
elements in a population to be able to draw conclusions about the entire
population, particularly where one cannot survey the whole population. Saunders,
Lewis & Thornhill (2003) define a population as “a full set of cases from which a
sample is taken”. In this particular study the population chosen was from parts of
Johannesburg and Pretoria found in the chosen Petrol stations under study
namely BP, Caltex, Shell, Engen, Total and Sasol. The target sample was made
up of private petrol users in these regions. Equal samples were selected for the
different brands within the designated petrol stations. Diesel users were excluded
from the study. The sample was representative and saved time considering the
timelines of the research. Saunders et al (2003) further suggest that collecting data
from fewer cases can result in the collection of detailed information.
A sample size of 80 customers was selected to participate in the research. Bryman
& Bell (2007) assert that the decision about a sample size is not easy. It is
dependent on a number of factors such as time and cost. Ideally the sample size
should be as large as possible to represent the population. Time and cost
constraints were the reasons why this sample size was chosen. Saunders et al
(2003) advise that the choice of sample size can also be determined by the
confidence required in the data i.e. the level of certainty that the data collected will
represent characteristics of the whole population.
3.3.2 Sample Technique
A non probability method called Convenience Sampling was used to collect data at
selected petrol stations. The main reason for utilising such a strategy was due to
time and cost constraints as stated above. Probability sampling on the other hand
requires a statistically chosen sample which might sometimes require time and
preparation. The assumption used in making the decision was that people at a
filling station want to fill petrol and then leave. Chances of them staying and

34
responding to surveys would be minimal. The other reason was to ensure that the
respondents sampled were actually people who filled petrol. Zikmund, Babin, Carr
& Griffin (2010) define Convenience sampling as “sampling by obtaining people or
units that are conveniently available”. The advantage of using this method is that it
is easy, fast and cost effective. Bryman & Bell (2007) however point out that the
disadvantage of this method is that it can sometimes result in unbiased results that
cannot be generalised as the population is not defined.
3.3.3 Data Collection Strategy
The primary data was collected using an interviewer administered questionnaire
that was structured. The time limit was the main reason for employing this
approach to accommodate a shot span of time that customers will be spending
while pouring petrol. Another reason is that by utilising this method it was ensured
that the respondent was the actual person that used the brand of petrol and
therefore increasing the reliability of the questionnaire. A set of defined questions
were posed to all respondents which ensured conformity. Saunders et al (2003)
attest to the fact that self administered questionnaire respondents are highly
unlikely to please the interviewer. Though the interview takes time it can be
guaranteed to get responses as opposed to utilising methods such as online or
postal interviews. Bryman & Bell (2007) argue that the advantage of having
structured questions is that interviewer variability and misinterpretation of replies is
minimised. The interviewers were well trained and guided in carrying out the
interviews.
3.4 Research Design and Methods
3.4.1 Description and Purpose
Research design is a term that covers different but related issues according to
White (2002).This comprises of the aim of the research, final selection of a
relevant methodology, data collection techniques and analysis in conjunction with
the reviewed literature. Cooper & Schindler (2002) define it as a “plan for selecting
the sources and types of information used to answer the research questions...a
framework for defining the relationships amongst the study variables”. Burns &
35
Burns (2008) distinctively differentiates between research design and research
method. They state that research design is a framework for collection and analysis
of data. A research method on the other hand is a technique for collecting data, a
definition that Bryman & Bell (2007) subscribe to.
A cross sectional approach was used for this design so as to establish the main
aim of the research and other objectives stated. Time constraint was of utmost
concern. Burns & Burns (2008) suggest that cross sectional studies are less
resource intensive as compared to longitudinal studies especially when looking at
relative popularity of brands.
The study conducted was descriptive. According to Burns & Burns (2008)
descriptive studies can either be qualitative or quantitative in nature. The aim is to
document what is actually occurring. In absence of existing information about the
subject of study, this was the most appropriate route to take. A structured survey
interview methodology was deemed suitable with use of a structured
questionnaire. The structured interview is sometimes referred to as a standardised
interview as described by Bryman & Bell (2007). The main objective is to ensure
that all interviewees are provided with the same questions to answer, hence
variation in replies is due to true variation and not the interview context.
The interview method is considered to be expensive over other methods as
indicated by Bryman & Bell (2007).However in this case the Geographic dispersion
between Pretoria and Johannesburg was not costly in conducting the interviews.
The fact that interviews were conducted over weekends was an added advantage
in making sure that ample time is properly utilised as patrons of the petrol stations
were not in so much of a hurry.
This particular study was quantitative in nature due to the fact that the main aim of
the study was to establish brand loyalty amongst South Africans; hence statistics
played a vital role. White (2002) suggests that surveys conducted by marketing
people using questionnaires where interview responses are given numerical
36
values qualify as quantitative research. The results of such a study are analysed
mathematically and statistically. In cases of qualitative research non mathematical
procedures are employed when analysing the results.
Saunders et al (2003) posits that all research will consist of some numerical data
or data that can be quantified. He further states that it can range from mere counts
such as frequency of occurrences to test scores or prices. It must be quantified
and then analysed and interpreted in order to be of value. In the study variables
such as the brand preference, consistent use of brand and recommendation of
brand formed an integral part of the analysis to address the main aim of the study.
3.4.2 Construction of the Instrument
The questionnaire was designed in such a way that the relevant information would
be obtained within reasonable time as earlier stated. Questions were arranged in a
manner that addressed the research questions and objectives. Closed ended
questions were posed so as to get prompt answers from the interviewees. Gill &
Johnson (2002) argue that questionnaires are mostly suited to closed specific
questions as unstructured and open ended questions cannot be easily coded for
analysis purposes. Arguments against this practice are that respondents might
come up with interesting replies that are not part of the fixed answers or
respondents might be irritated when the required category cannot be found
according to Gill & Johnson (2002). The questions were short and to the point.
According to White (2002) the questionnaire must not be excessive in length.
Cooper & Schindler (2002) defines scaling as “a procedure for the assignment of
numbers to a property of objects in order to impart some of the characteristics of
the numbers to the properties in question”. For this research some questions were
closed question with Yes or No and Not Sure. A majority of the questions were
constructed using the summated rating Likert Scale. White (2002) suggests that if
one is to gauge a degree of opinion then the Likert scale is appropriate for use.
37
Questions were categorised according to the research questions as follows:
Demographic
Gender
Age
Brand loyalty
• Is there a Petrol brand that you prefer?
• Amongst the six petrol brands which brand would you prefer to fill?
• Do you always fill the same brand of petrol?
• Would you buy the same brand of petrol even if you are in a hurry and the station
is out of your way?
• Do you use any other brands of petrol
• How likely are you to recommend your preferred brand to other people?
Influence of Marketing Strategies:
• Does advertising influence the choice of the Petrol brand that you
use?
• Is the decision to purchase petrol in your preferred filling station
influenced by the presence of services around the petrol station?
• Do Loyalty programs such as Car wash Vouchers or points gained
when filling petrol make you fill the same brand of petrol?
3.4.3 Recruitment of Study Participants
Study participants were recruited from the petrol stations. They were approached
on a convenience basis. These participants were the relevant group as they were
filling up petrol on their vehicles as opposed to questioning any individual found at
the filling station. Permission to perform interviews on site was granted by the
petrol station owners.
All participants were advised upfront that the survey was voluntary and could
withdraw at any point in time without prejudice. A confidentiality measure of all
participants’ names and responses was explained to them and guarantees of
anonymity given. Anonymity of all respondents was handled by use of coding.

38
Benefits of the research were explained to all participants and those participants
that required seeing the end report were noted.
3.4.4 Pretesting and Validation
Bryman & Bell (2007) argue that the two terms Validity and Reliability seem to be
synonymous though they are very different. They define Reliability as “consistency
of a measure of a concept”. This implies that another researcher can make use of
your design and obtain the same results.
Three main factors are to be considered when talking about reliability;
• Stability: A measure must be stable over time such that there is
confidence that the results for a sample does not fluctuate. This
means there will be little variation if the same exercise was carried
out later.
• Internal Reliability: Indicators that constitute the scale or index are
consistent
• Inter-observer consistency: Whether similar observations will be
reached by other observers
Subject or participant error has been cancelled out by making sure that
participants are interviewed during a period where there were no fuel increases.
Furthermore a weekend was utilised when most participants are relaxed and not at
work. This might contribute to error margins according to Saunders et al
(2003).For internal reliability the Cronbach’s alpha was utilised which according to
Bryman & Bell (2007) calculate all average split half reliability coefficients. The
coefficient varies between 1 denoting perfect reliability and 0 showing no reliability
at all. A figure of 0.8 is considered as acceptable reliability and 0.7 denotes
efficiency. The coefficient was calculated using SPSS for Windows and was found
to be 0.728.
White (2002) suggests that validity is merely a measure of whether the research
design entirely addresses the research questions and research objectives. In other
words whether the research findings are about what they appear to be about. The
construct of the research instrument displays that the questions posed were
39
thoroughly linked to the research questions.
A pilot study was successfully conducted prior to the actual interviews to predict
respondent’s behaviour and responses. Gill & Johnson (2002) advise that
conducting a pilot study or pre-test assist in identifying problems in the structure of
the questionnaire which can subsequently be corrected. It further assisted the
interviewers to familiarise themselves with the interview process and question
sequence.
3.4.5 Administration of the Questionnaire
All questions were pre-coded prior to interviews being conducted. This facilitated
easier administration of the questionnaires. Saunders et al (2003) advise that pre-
coding should be carried out before collecting data if possible. Since most of the
questions were closed questions, then it was easy to develop coding schemes.
Once the data had been collected then it was then entered into the SPPS for
Windows software for analysis.
3.4.6 Analysis of the Data
As this research was quantitative, the analysis of the data was carried out using
descriptive statistics. White (2002) suggests that for both quantitative and
qualitative analysis the data should be reduced in bulk in order for it to be
manageable. He further explains that Descriptive Statistics has to do with
describing and displaying of results in the form of tables and diagrams like bar
charts or pie charts. There are also arithmetical calculations that measure the
spread of the dispersion or spread of data. It is for this reason that this method
was chosen for analysing findings of this research in the absence of petrol brand
loyalty constants. White (2002) posits that diagrams and tables are a superb way
to describe and compare data. Due to structure of tables arranged in columns and
rows, it is easy to establish trends and patterns. Figures on the other hand assist
in enhancing the visual illustration of data. By using graphs and pie charts the
relationship between the different variables could be easily illustrated. Cross

40
tabulation tables were presented for easier bi-variate analysis of variable
relationships. Chi-square values were calculated and displayed to determine the
statistical significance of variables.
Variables were defined for all the questions during administration of the
questionnaire to facilitate easier analysis of the data. Since the Likert Scale
method had been utilised the scale statements were evaluated by Item analysis
per response category.
3.5 Summary
This chapter explored the research methodology used in collecting data by means
of a questionnaire. It further delved into how statistical analysis of the data
collected was carried out to determine the extent of petrol brand loyalty. The next
chapter will present the data collected.
41
CHAPTER FOUR
4 Presentation of Results
4.1 Introduction
This chapter presents the results obtained from the collection of data. The data
was captured on the Statistical Package for the Social Scientists (SPSS version
19) and then results were generated. In presenting the data, descriptive statics
was used. A variety of descriptive tools such as graphs, bar charts and frequency
tables were utilised to display appropriately the data obtained using the
questionnaire. Cross tabulation tables and Calculated Chi-Square values were
also presented for Bi-variate analysis of variables.
The data collected was based on the following questions and objectives:
Questions:
• Do consumers consider a brand when purchasing petrol?
• What roles do marketing strategies of Oil Companies play in relation to
consumer brand loyalty?
• What are the inhibiting factors experienced by petrol retailers in attaining
brand loyalty?
• Do existing customer retention strategies work?
Objectives:
• Determine if petrol consumers in South Africa consider a particular
petrol brand when filling up with petrol or if they are influenced by factors
such as proximity or a relationship with service stations.
• Determine the role played by Oil Company marketing strategies in
attaining brand loyalty to their brand of petrol such as house customer
specific convenience stores.
• Establish if there are any inhibiting factors in attaining brand loyalty
experienced by the retailers.
• Establish if existing Oil Company customer retention strategies work or
not.
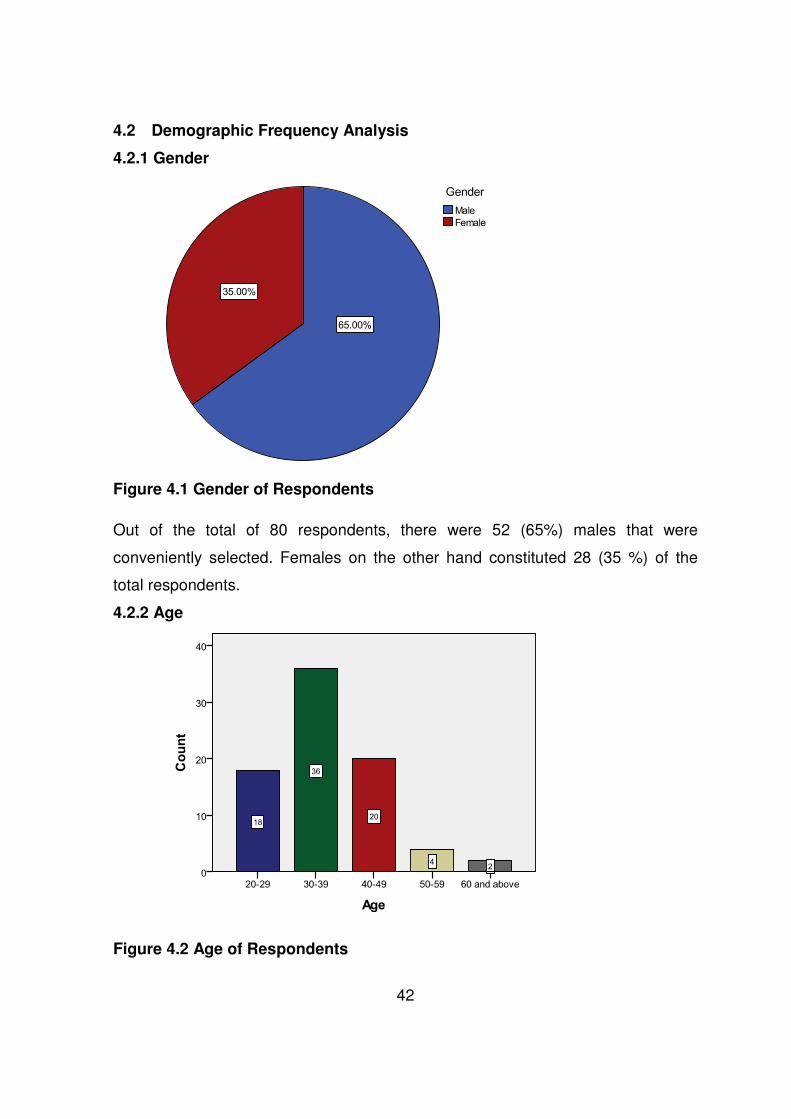
42
4.2 Demographic Frequency Analysis
4.2.1 Gender
Figure 4.1 Gender of Respondents
Out of the total of 80 respondents, there were 52 (65%) males that were
conveniently selected. Females on the other hand constituted 28 (35 %) of the
total respondents.
4.2.2 Age
Figure 4.2 Age of Respondents

43
The age category of respondents is displayed in Fig 4.2 above. A majority of
respondents fall within the 30-39 age range and comprised of 36 (45.0%) of
participants. Within the 20-29 categories there were 18 (22.5%) respondents.
There were 20 (25.0%) respondents in the 40-49 age range. Participants that were
in the 50-59 as well as 60 and above age category had the least numbers
represented by 4 (5.0%) and 2 (2.5%) respondents respectively.
4.3 Brand Loyalty Frequency Analysis
4.3.1 Is there a petrol brand that you prefer?
Figure 4.3 Existence of Preferred Petrol Brand
From the survey it can be noted that 57 (71.3%) respondents indicated that they
have a preferred brand of petrol. Twenty (25%) respondents indicated that they do
not have a preferred brand upfront. Only 3 (3.8%) of the respondents were not
sure whether they have a preferred brand or not.
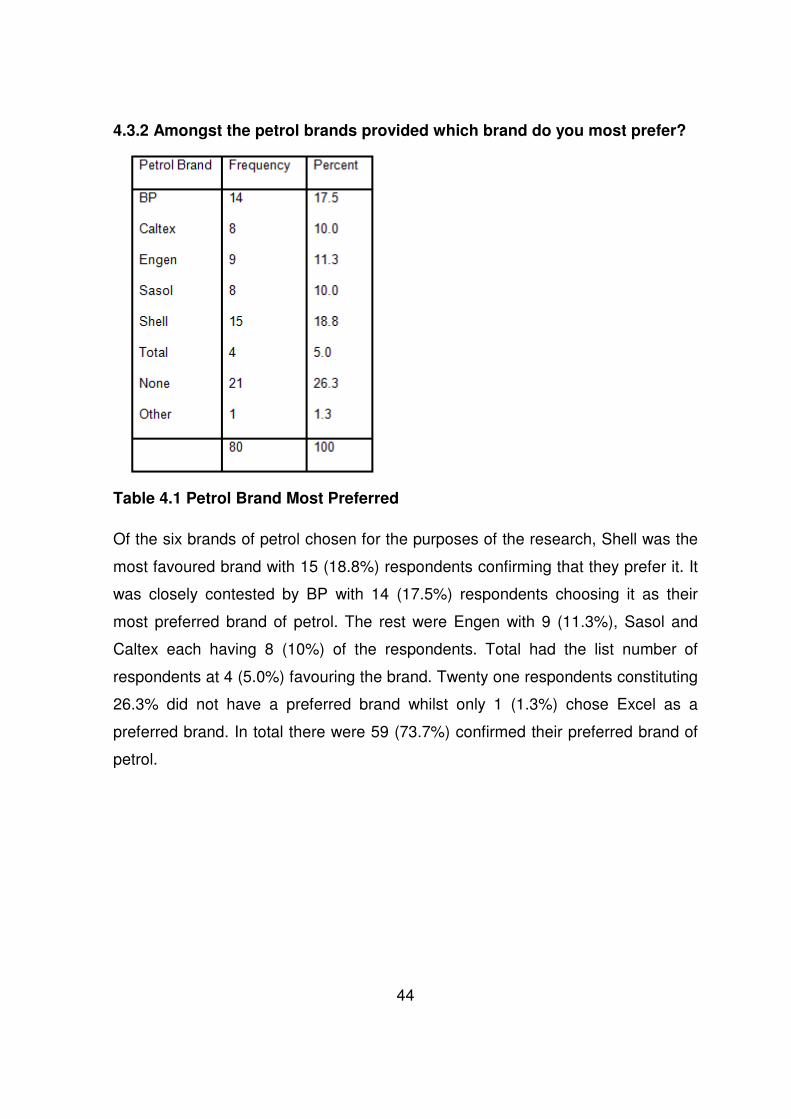
44
4.3.2 Amongst the petrol brands provided which brand do you most prefer?
Table 4.1 Petrol Brand Most Preferred
Of the six brands of petrol chosen for the purposes of the research, Shell was the
most favoured brand with 15 (18.8%) respondents confirming that they prefer it. It
was closely contested by BP with 14 (17.5%) respondents choosing it as their
most preferred brand of petrol. The rest were Engen with 9 (11.3%), Sasol and
Caltex each having 8 (10%) of the respondents. Total had the list number of
respondents at 4 (5.0%) favouring the brand. Twenty one respondents constituting
26.3% did not have a preferred brand whilst only 1 (1.3%) chose Excel as a
preferred brand. In total there were 59 (73.7%) confirmed their preferred brand of
petrol.
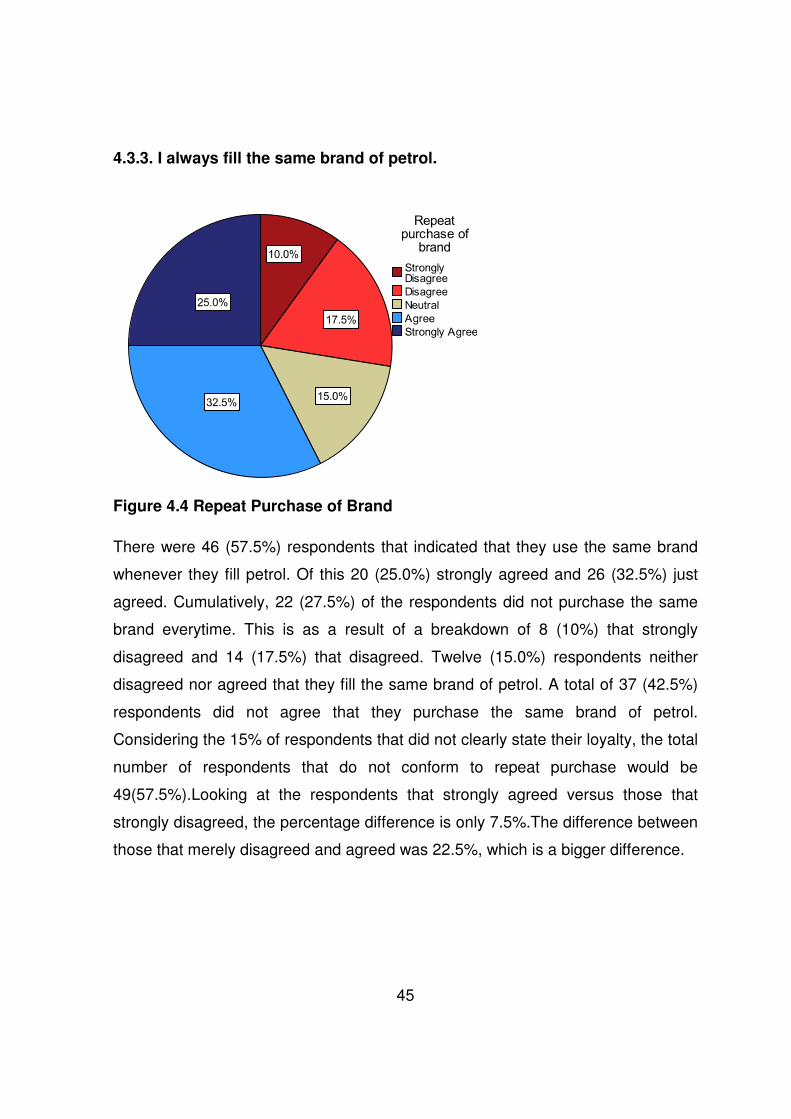
45
4.3.3. I always fill the same brand of petrol.
Figure 4.4 Repeat Purchase of Brand
There were 46 (57.5%) respondents that indicated that they use the same brand
whenever they fill petrol. Of this 20 (25.0%) strongly agreed and 26 (32.5%) just
agreed. Cumulatively, 22 (27.5%) of the respondents did not purchase the same
brand everytime. This is as a result of a breakdown of 8 (10%) that strongly
disagreed and 14 (17.5%) that disagreed. Twelve (15.0%) respondents neither
disagreed nor agreed that they fill the same brand of petrol. A total of 37 (42.5%)
respondents did not agree that they purchase the same brand of petrol.
Considering the 15% of respondents that did not clearly state their loyalty, the total
number of respondents that do not conform to repeat purchase would be
49(57.5%).Looking at the respondents that strongly agreed versus those that
strongly disagreed, the percentage difference is only 7.5%.The difference between
those that merely disagreed and agreed was 22.5%, which is a bigger difference.

46
4.3.4 I would buy the same brand of petrol even if i am in a hurry and the
station that stocks my preferred brand is out of my way.
Figure 4.5 Brand Commitment
Out of the eighty respondents a total of 52 (65.1%) suggested that they would
rather seek their petrol brand even if they are in a rush. Out of this number only 11
(13.8%) strongly agreed and 41 (51.3%) just agreed. Respondents that neither
agreed nor disagreed with the statement were 10 (12.5%). There was a total of 18
(22.6%) of the respondents that would not look for a preferred brand when in a
hurry. A total of 28(35.1%) of the respondents were not brand committed if one
includes the neutral portion of the respondents. However if one considers the
committed participants the value would be 62 (77.6%). The percentage difference
between the strongly committed and the ones not strongly committed is 2.5%. A
bigger percentage difference amounting to 40% was observed between those that
just agreed and those that disagreed on the statement.
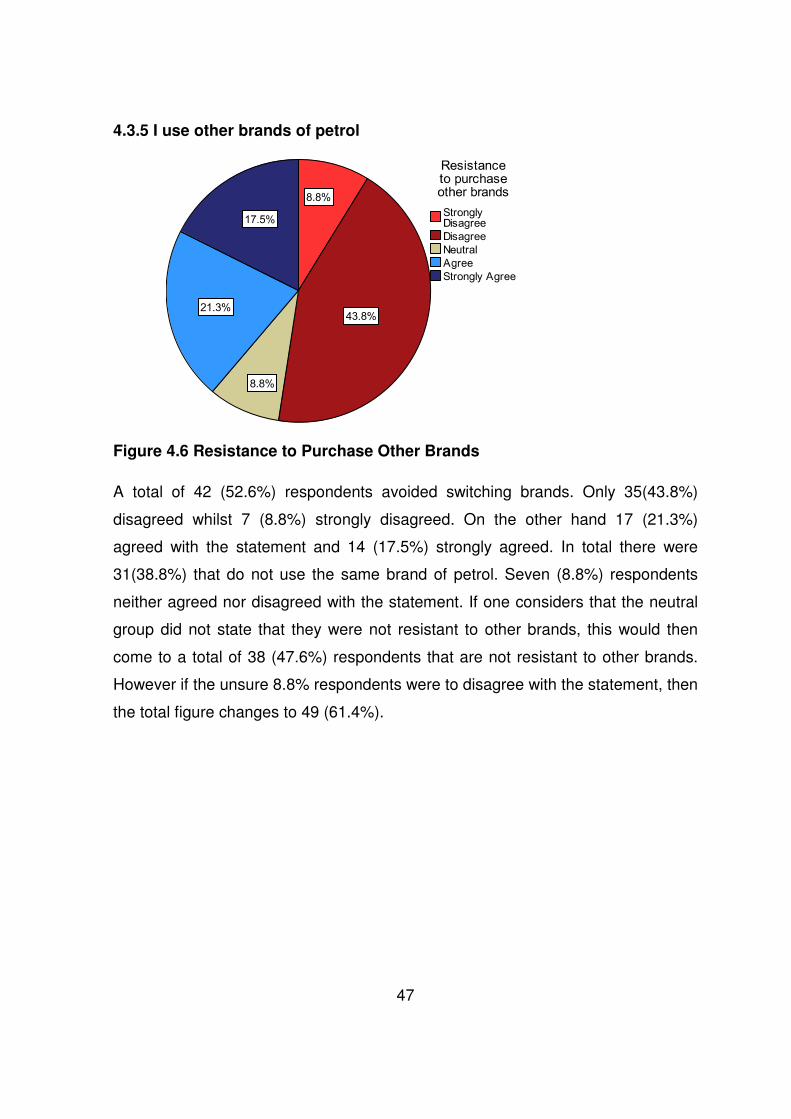
47
4.3.5 I use other brands of petrol
Figure 4.6 Resistance to Purchase Other Brands
A total of 42 (52.6%) respondents avoided switching brands. Only 35(43.8%)
disagreed whilst 7 (8.8%) strongly disagreed. On the other hand 17 (21.3%)
agreed with the statement and 14 (17.5%) strongly agreed. In total there were
31(38.8%) that do not use the same brand of petrol. Seven (8.8%) respondents
neither agreed nor disagreed with the statement. If one considers that the neutral
group did not state that they were not resistant to other brands, this would then
come to a total of 38 (47.6%) respondents that are not resistant to other brands.
However if the unsure 8.8% respondents were to disagree with the statement, then
the total figure changes to 49 (61.4%).

48
4.3.6 How likely am I to recommend my preferred brand of petrol?
Figure 4.7 Likeliness of Recommending Preferred Brand
There were 33 (41.3%) respondents that would very likely recommend their
preferred brand to others. Fifteen (18.8%) respondents alluded to the fact that they
are likely to recommend their preferred brand. Therefore a total of 48 (60.1%)
would recommend their brands of petrol. Thirteen (16.3%) were neutral, implying
that they were not sure as to whether they would provide recommendations.
Seven (8.8%) respondents were very unlikely to recommend their brand to anyone
whilst 12 (15.0%) were not likely. This resulted in a total of 19 (23.8%). If the
neutral respondents all decide to recommend the brand then this would yield a
total of 61 (76.4%).However if they decide not to recommend the brand then the
figure would change to 32 (40.1%)
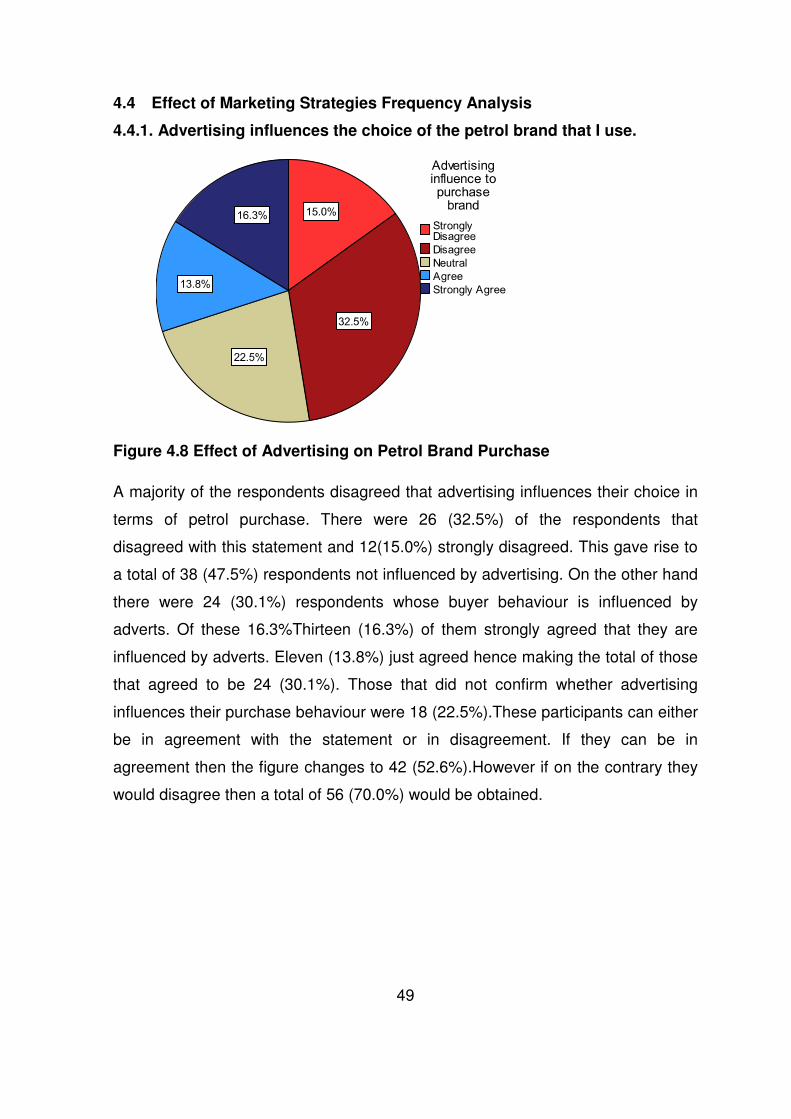
49
4.4 Effect of Marketing Strategies Frequency Analysis
4.4.1. Advertising influences the choice of the petrol brand that I use.
Figure 4.8 Effect of Advertising on Petrol Brand Purchase
A majority of the respondents disagreed that advertising influences their choice in
terms of petrol purchase. There were 26 (32.5%) of the respondents that
disagreed with this statement and 12(15.0%) strongly disagreed. This gave rise to
a total of 38 (47.5%) respondents not influenced by advertising. On the other hand
there were 24 (30.1%) respondents whose buyer behaviour is influenced by
adverts. Of these 16.3%Thirteen (16.3%) of them strongly agreed that they are
influenced by adverts. Eleven (13.8%) just agreed hence making the total of those
that agreed to be 24 (30.1%). Those that did not confirm whether advertising
influences their purchase behaviour were 18 (22.5%).These participants can either
be in agreement with the statement or in disagreement. If they can be in
agreement then the figure changes to 42 (52.6%).However if on the contrary they
would disagree then a total of 56 (70.0%) would be obtained.
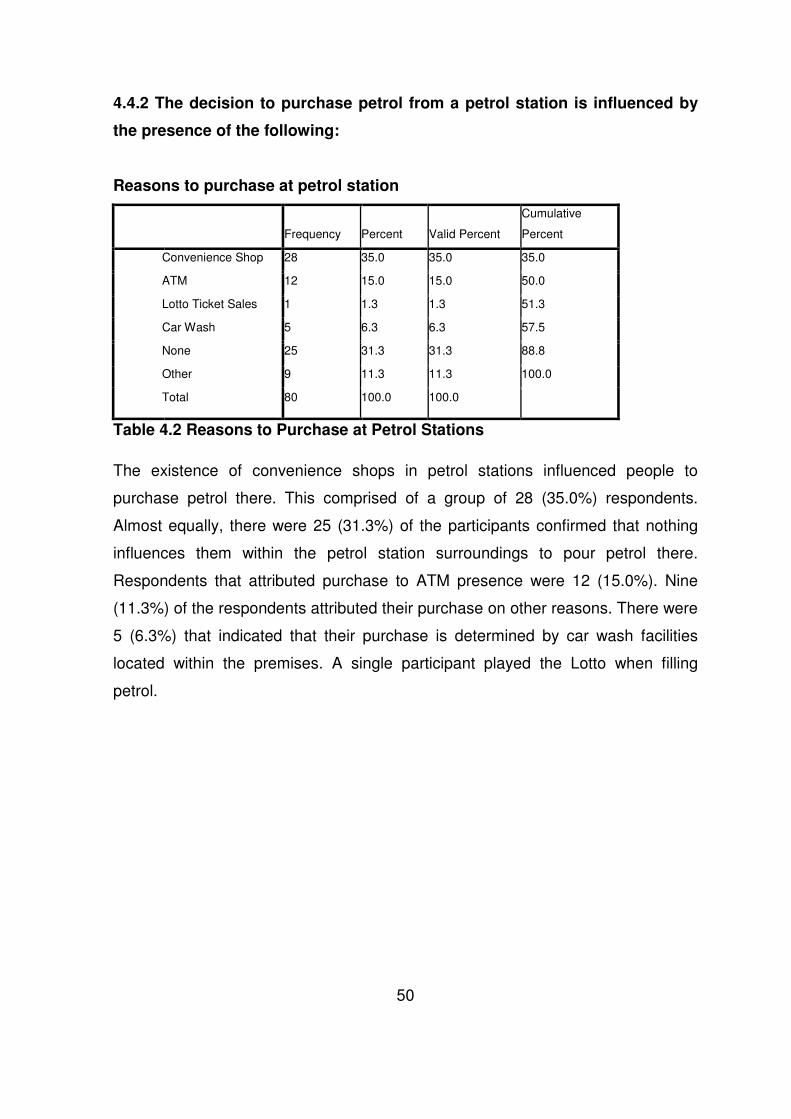
50
4.4.2 The decision to purchase petrol from a petrol station is influenced by
the presence of the following:
Reasons to purchase at petrol station
Frequency Percent Valid Percent
Cumulative
Percent
Convenience Shop 28 35.0 35.0 35.0
ATM 12 15.0 15.0 50.0
Lotto Ticket Sales 1 1.3 1.3 51.3
Car Wash 5 6.3 6.3 57.5
None 25 31.3 31.3 88.8
Other 9 11.3 11.3 100.0
Total 80 100.0 100.0
Table 4.2 Reasons to Purchase at Petrol Stations
The existence of convenience shops in petrol stations influenced people to
purchase petrol there. This comprised of a group of 28 (35.0%) respondents.
Almost equally, there were 25 (31.3%) of the participants confirmed that nothing
influences them within the petrol station surroundings to pour petrol there.
Respondents that attributed purchase to ATM presence were 12 (15.0%). Nine
(11.3%) of the respondents attributed their purchase on other reasons. There were
5 (6.3%) that indicated that their purchase is determined by car wash facilities
located within the premises. A single participant played the Lotto when filling
petrol.

51
4.4.3 Promotions run by petrol stations are beneficial.
Figure 4.9 Beneficial Aspect of Promotions on Brand Loyalty
Out of 80 respondents, 29 (36.3%) of the respondents did not consider promotions
run by petrol stations. This forms the largest quadrant in the pie chart above.
However 26 (32.5%) on the other hand confirmed that they were beneficial. A
further 8 (10%) strongly agreed that the statement was true which resulted in a
total of 34 (42.5%) agreeing about the correctness of the statement. A total of 17
(21.3) of the participants disagreed with the statement. Out of this figure 10
(12.5%) disagreed and 7 (8.8%) strongly disagreed. If the neutral value had to be
considered as participants that do not think promotions are of value when
purchasing petrol, then the total would be 46 (57.6%).However if the neutral value
is added to the value of participants that agree with statement, it would then total
to 63 (78.8%).

52
4.4.4 Loyalty programmes such as car wash vouchers or points gained when
filling petrol, make me use the same brand of petrol.
Figure 4.10 Brand Loyalty as a Result of Loyalty Programmes
There were 34 (42.6%) respondents that agreed with this statement. Of these 19
(23.8%) simply agreed and 15 (18.8%) strongly supported the statement. On the
other hand 24(30.1%) were in disagreement. From this total figure, 19 (23.8%)
disagreed and 5 (6.3%) strongly disagreed. It can be noted that the greatest
number of participants i.e. 22(27.5%) could not confirm whether loyalty
programmes make a difference during petrol purchase. If this figure is therefore
added to the number of those that do not find any value in loyalty programmes, the
value would increase to 46 (57.6%).

53
4.4.5 Good Customer Service received from a particular petrol station makes
me come back to fill petrol.
Figure 4.11 Repeat Purchase as a Result of Good Service
A number of participants agreed that good customer service is an essential factor
in them purchasing petrol from designated petrol stations. There was a total of 67
(83.8%) of such participants. Out of this number 44 (55.0%) strongly agreed and
23 (28.8) agreed. There were 8 (10.0%) participants that disagreed with this
statement. Of these 4 (5.0%) disagreed and 4 (5.0%) strongly disagreed. Only 5
(6.3%) were neutral.
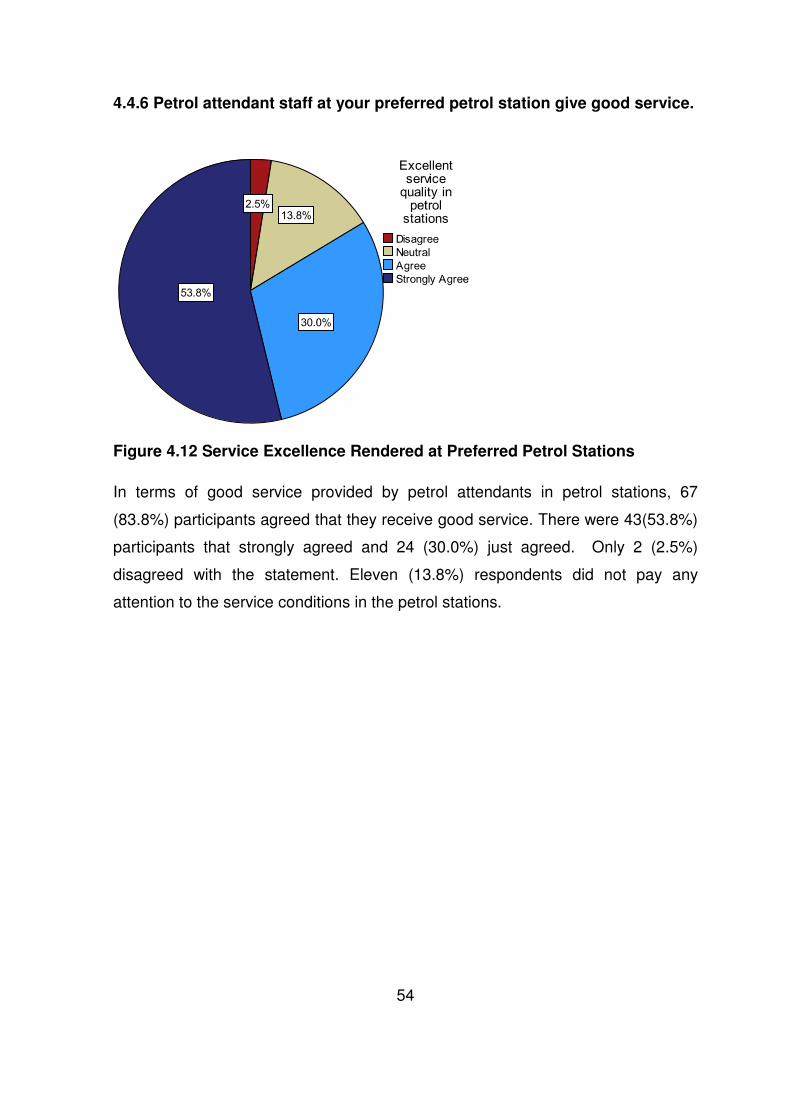
54
4.4.6 Petrol attendant staff at your preferred petrol station give good service.
Figure 4.12 Service Excellence Rendered at Preferred Petrol Stations
In terms of good service provided by petrol attendants in petrol stations, 67
(83.8%) participants agreed that they receive good service. There were 43(53.8%)
participants that strongly agreed and 24 (30.0%) just agreed. Only 2 (2.5%)
disagreed with the statement. Eleven (13.8%) respondents did not pay any
attention to the service conditions in the petrol stations.

55
4.4.7 Cleanliness at filling stations is important.
Figure 4.13 Importance of Cleanliness at Petrol Stations
A majority of the participants regard cleanliness in garages as an important factor.
This is shown by a total of 72 (90.1%) participants agreeing with the statement.
This figure can be partitioned into 49 (61.3%) that strongly agreed and 23 (28.8%)
that just agreed. A mere three (3.8%) participants disagreed with the above
statement, broken down to 2 (2.5%) that strongly agree and 1 (1.3%) that agrees.
The rest of the respondent 5 (6.3 %) neither agreed nor disagreed with the
statement.
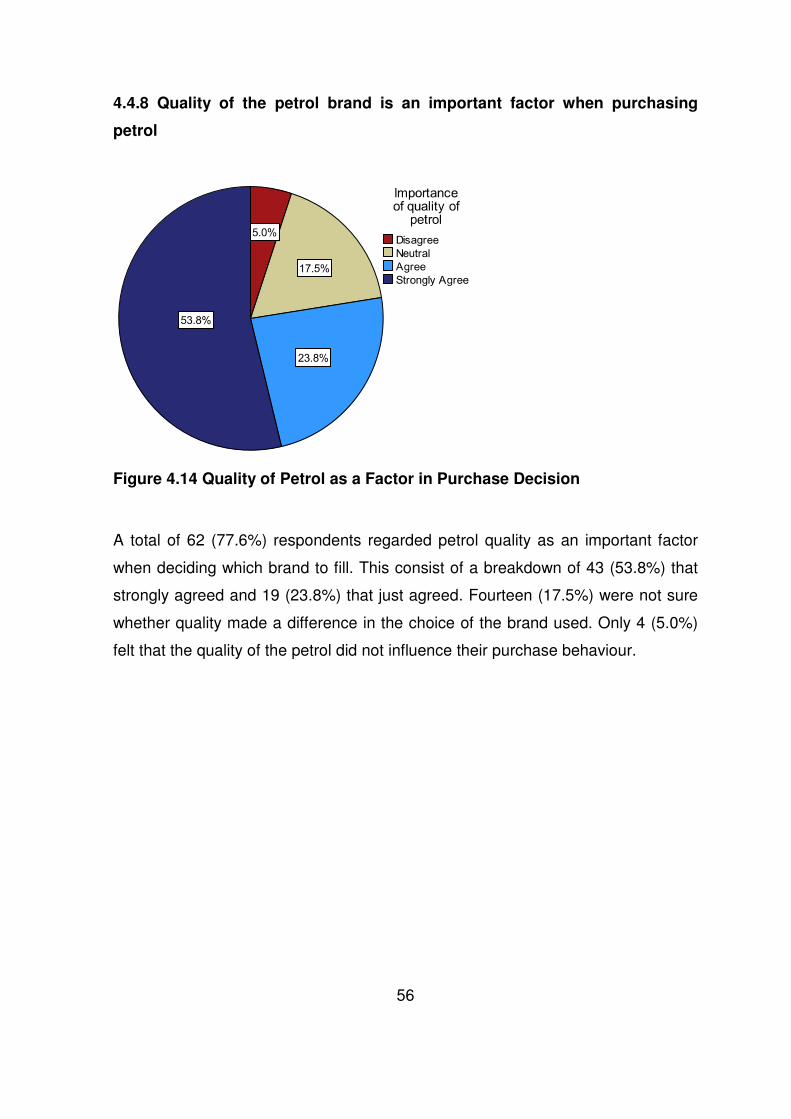
56
4.4.8 Quality of the petrol brand is an important factor when purchasing
petrol
Figure 4.14 Quality of Petrol as a Factor in Purchase Decision
A total of 62 (77.6%) respondents regarded petrol quality as an important factor
when deciding which brand to fill. This consist of a breakdown of 43 (53.8%) that
strongly agreed and 19 (23.8%) that just agreed. Fourteen (17.5%) were not sure
whether quality made a difference in the choice of the brand used. Only 4 (5.0%)
felt that the quality of the petrol did not influence their purchase behaviour.
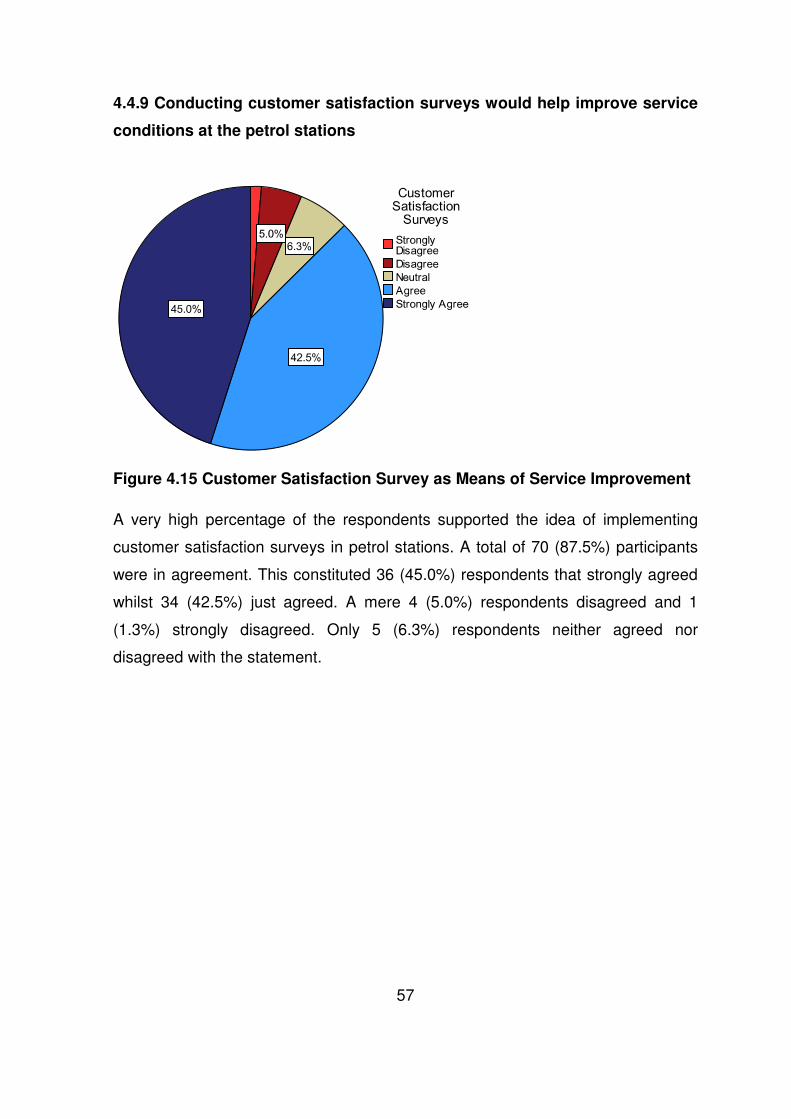
57
4.4.9 Conducting customer satisfaction surveys would help improve service
conditions at the petrol stations
Figure 4.15 Customer Satisfaction Survey as Means of Service Improvement
A very high percentage of the respondents supported the idea of implementing
customer satisfaction surveys in petrol stations. A total of 70 (87.5%) participants
were in agreement. This constituted 36 (45.0%) respondents that strongly agreed
whilst 34 (42.5%) just agreed. A mere 4 (5.0%) respondents disagreed and 1
(1.3%) strongly disagreed. Only 5 (6.3%) respondents neither agreed nor
disagreed with the statement.

58
4.4.10 Who owns the vehicle?
Figure 4.16 Owner of Vehicle Being Driven
A majority of the respondents owned the vehicle they were driving i.e. 63 (78.8%)
of them. Eleven (13.8%) were company cars. There were only 5 (6.3%) of the cars
that were owned by spouses. Only 1 (1.3%) respondent chose in terms of
ownership of the car.
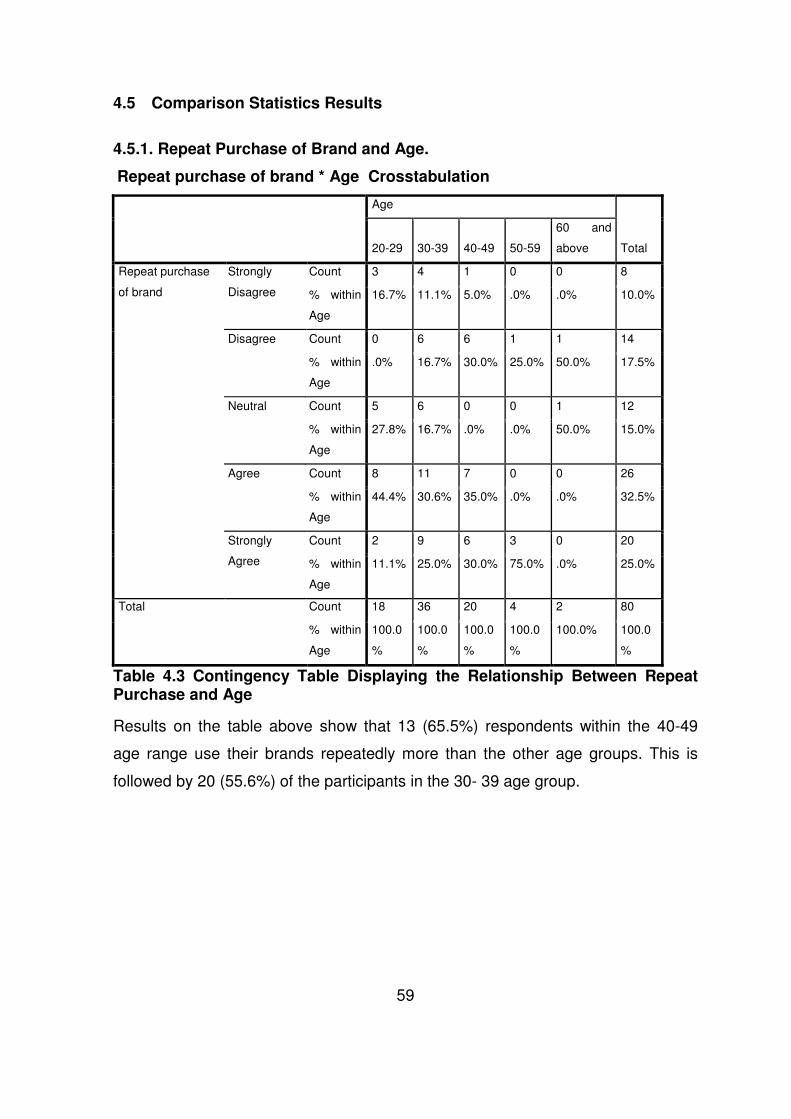
59
4.5 Comparison Statistics Results
4.5.1. Repeat Purchase of Brand and Age.
Repeat purchase of brand * Age Crosstabulation
Age
Total 20-29 30-39 40-49 50-59
60 and
above
Repeat purchase
of brand
Strongly
Disagree
Count 3 4 1 0 0 8
% within
Age
16.7% 11.1% 5.0% .0% .0% 10.0%
Disagree Count 0 6 6 1 1 14
% within
Age
.0% 16.7% 30.0% 25.0% 50.0% 17.5%
Neutral Count 5 6 0 0 1 12
% within
Age
27.8% 16.7% .0% .0% 50.0% 15.0%
Agree Count 8 11 7 0 0 26
% within
Age
44.4% 30.6% 35.0% .0% .0% 32.5%
Strongly
Agree
Count 2 9 6 3 0 20
% within
Age
11.1% 25.0% 30.0% 75.0% .0% 25.0%
Total Count 18 36 20 4 2 80
% within
Age
100.0
%
100.0
%
100.0
%
100.0
%
100.0% 100.0
%
Table 4.3 Contingency Table Displaying the Relationship Between Repeat Purchase and Age
Results on the table above show that 13 (65.5%) respondents within the 40-49
age range use their brands repeatedly more than the other age groups. This is
followed by 20 (55.6%) of the participants in the 30- 39 age group.
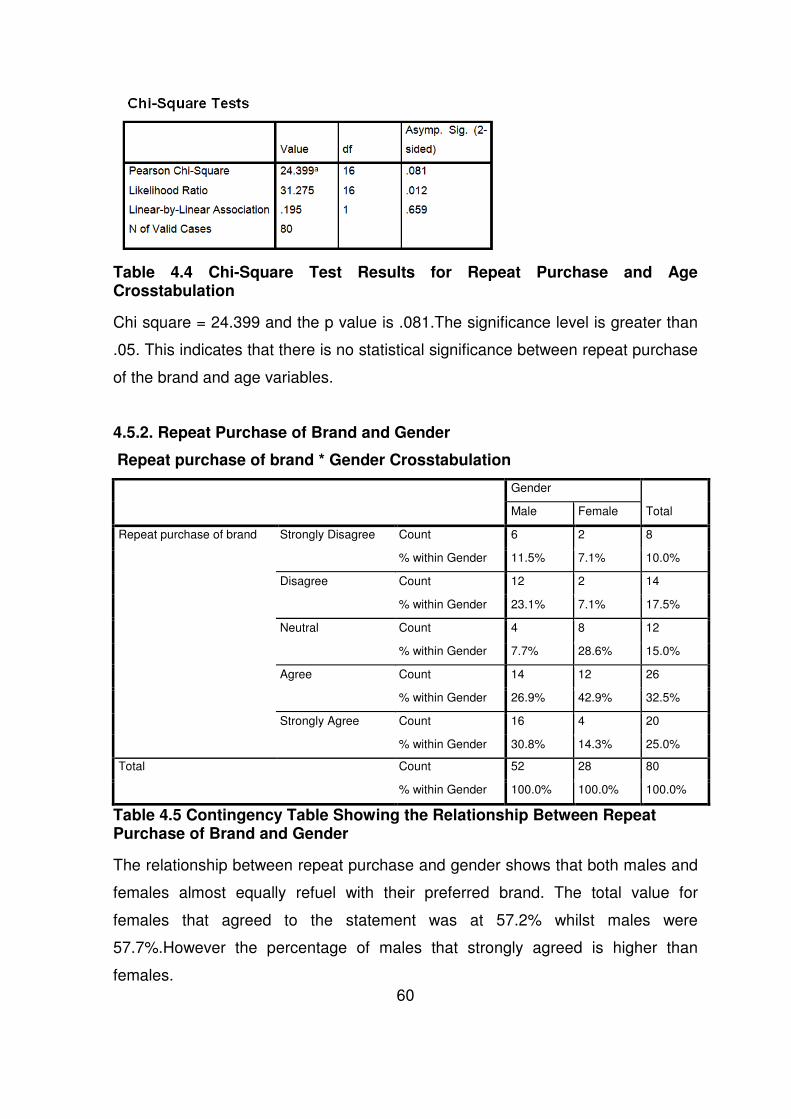
60
Table 4.4 Chi-Square Test Results for Repeat Purchase and Age Crosstabulation
Chi square = 24.399 and the p value is .081.The significance level is greater than
.05. This indicates that there is no statistical significance between repeat purchase
of the brand and age variables.
4.5.2. Repeat Purchase of Brand and Gender
Repeat purchase of brand * Gender Crosstabulation
Gender
Total Male Female
Repeat purchase of brand Strongly Disagree Count 6 2 8
% within Gender 11.5% 7.1% 10.0%
Disagree Count 12 2 14
% within Gender 23.1% 7.1% 17.5%
Neutral Count 4 8 12
% within Gender 7.7% 28.6% 15.0%
Agree Count 14 12 26
% within Gender 26.9% 42.9% 32.5%
Strongly Agree Count 16 4 20
% within Gender 30.8% 14.3% 25.0%
Total Count 52 28 80
% within Gender 100.0% 100.0% 100.0%
Table 4.5 Contingency Table Showing the Relationship Between Repeat Purchase of Brand and Gender
The relationship between repeat purchase and gender shows that both males and
females almost equally refuel with their preferred brand. The total value for
females that agreed to the statement was at 57.2% whilst males were
57.7%.However the percentage of males that strongly agreed is higher than
females.
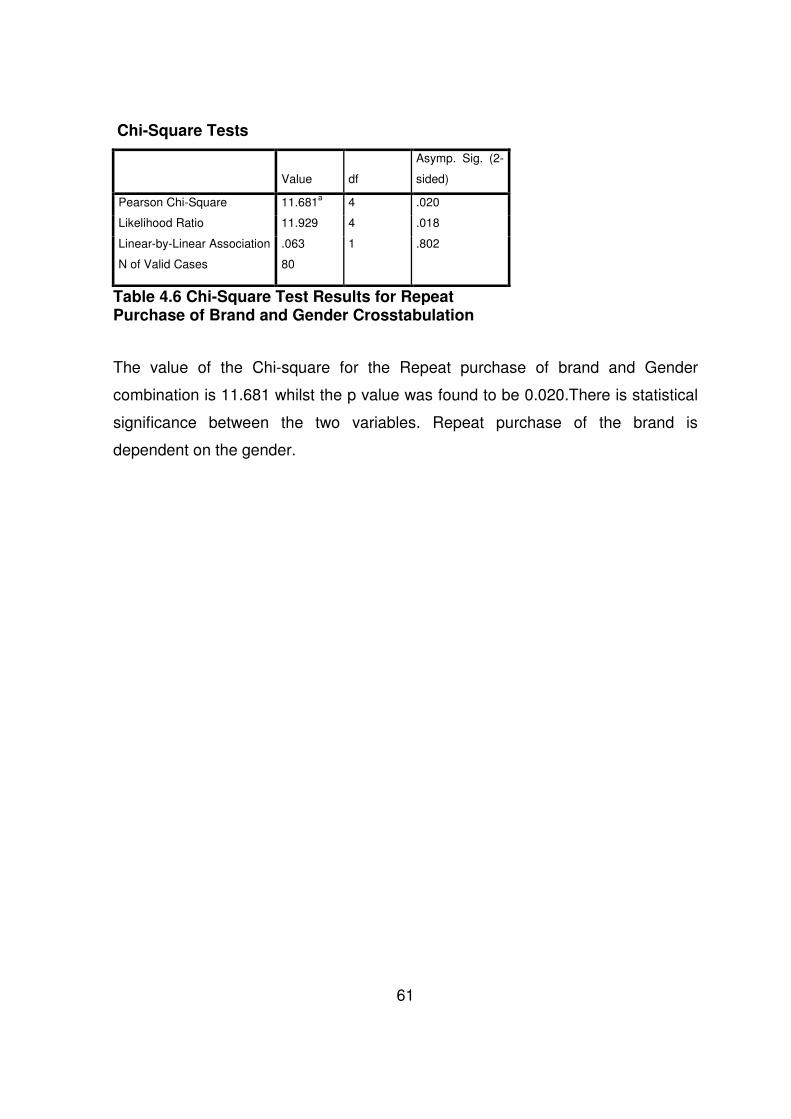
61
Chi-Square Tests
Value df
Asymp. Sig. (2-
sided)
Pearson Chi-Square 11.681a 4 .020
Likelihood Ratio 11.929 4 .018
Linear-by-Linear Association .063 1 .802
N of Valid Cases 80
Table 4.6 Chi-Square Test Results for Repeat Purchase of Brand and Gender Crosstabulation
The value of the Chi-square for the Repeat purchase of brand and Gender
combination is 11.681 whilst the p value was found to be 0.020.There is statistical
significance between the two variables. Repeat purchase of the brand is
dependent on the gender.
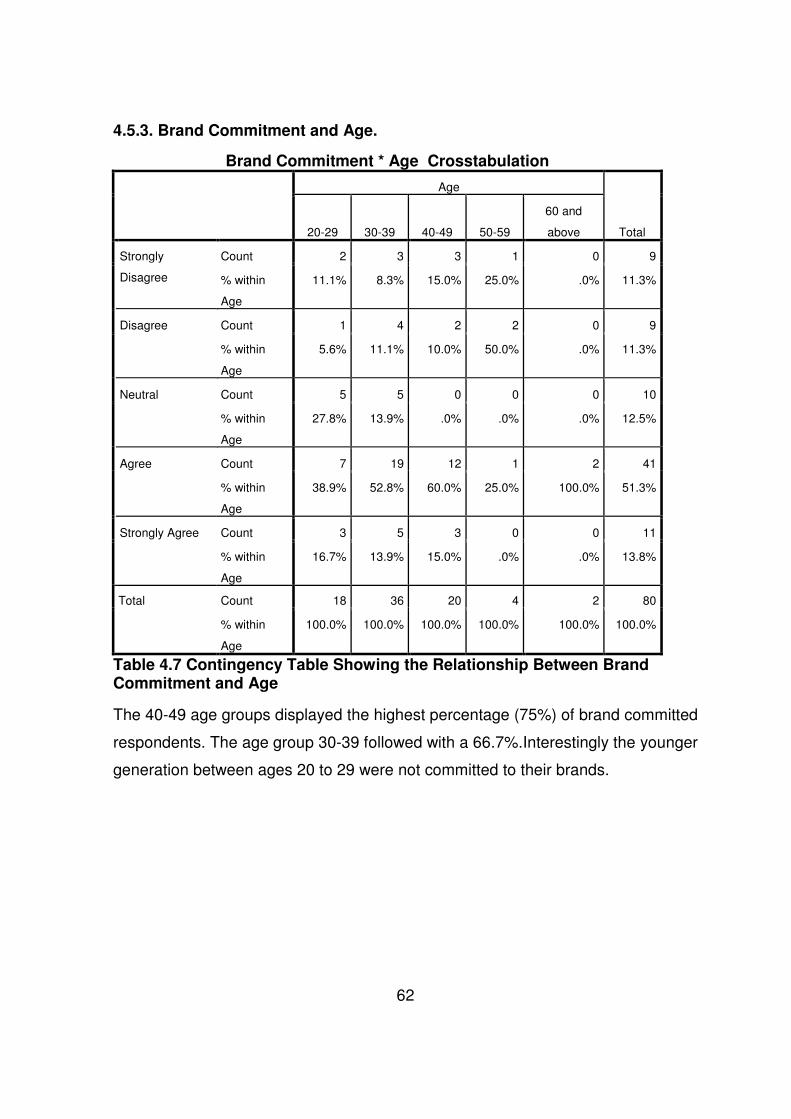
62
4.5.3. Brand Commitment and Age.
Brand Commitment * Age Crosstabulation
Age
Total 20-29 30-39 40-49 50-59
60 and
above
Strongly
Disagree
Count 2 3 3 1 0 9
% within
Age
11.1% 8.3% 15.0% 25.0% .0% 11.3%
Disagree Count 1 4 2 2 0 9
% within
Age
5.6% 11.1% 10.0% 50.0% .0% 11.3%
Neutral Count 5 5 0 0 0 10
% within
Age
27.8% 13.9% .0% .0% .0% 12.5%
Agree Count 7 19 12 1 2 41
% within
Age
38.9% 52.8% 60.0% 25.0% 100.0% 51.3%
Strongly Agree Count 3 5 3 0 0 11
% within
Age
16.7% 13.9% 15.0% .0% .0% 13.8%
Total Count 18 36 20 4 2 80
% within
Age
100.0% 100.0% 100.0% 100.0% 100.0% 100.0%
Table 4.7 Contingency Table Showing the Relationship Between Brand Commitment and Age
The 40-49 age groups displayed the highest percentage (75%) of brand committed
respondents. The age group 30-39 followed with a 66.7%.Interestingly the younger
generation between ages 20 to 29 were not committed to their brands.

63
Table 4.8 Chi-Square Test Results for Brand Commitment and Age Crosstabulation
The Chi-square calculated was equal to 17.474 whilst the p value was found to be
0.356.There is no statistical significance between the two variables namely brand
commitment and age.
4.5.4. Brand Commitment and Gender.
Brand Commitment * Gender Crosstabulation
Gender
Total Male Female
Brand Commitment Strongly Disagree Count 7 2 9
% within Gender 13.5% 7.1% 11.3%
Disagree Count 5 4 9
% within Gender 9.6% 14.3% 11.3%
Neutral Count 7 3 10
% within Gender 13.5% 10.7% 12.5%
Agree Count 26 15 41
% within Gender 50.0% 53.6% 51.3%
Strongly Agree Count 7 4 11
% within Gender 13.5% 14.3% 13.8%
Total Count 52 28 80
% within Gender 100.0% 100.0% 100.0%
Table 4.9 Contingency Table Displaying the Relationship Between Brand Commitment and Gender
From a gender perspective 67.9% females indicated that they would seek their
preferred brand even when in a hurry. This value is greater than males at 63.5%.
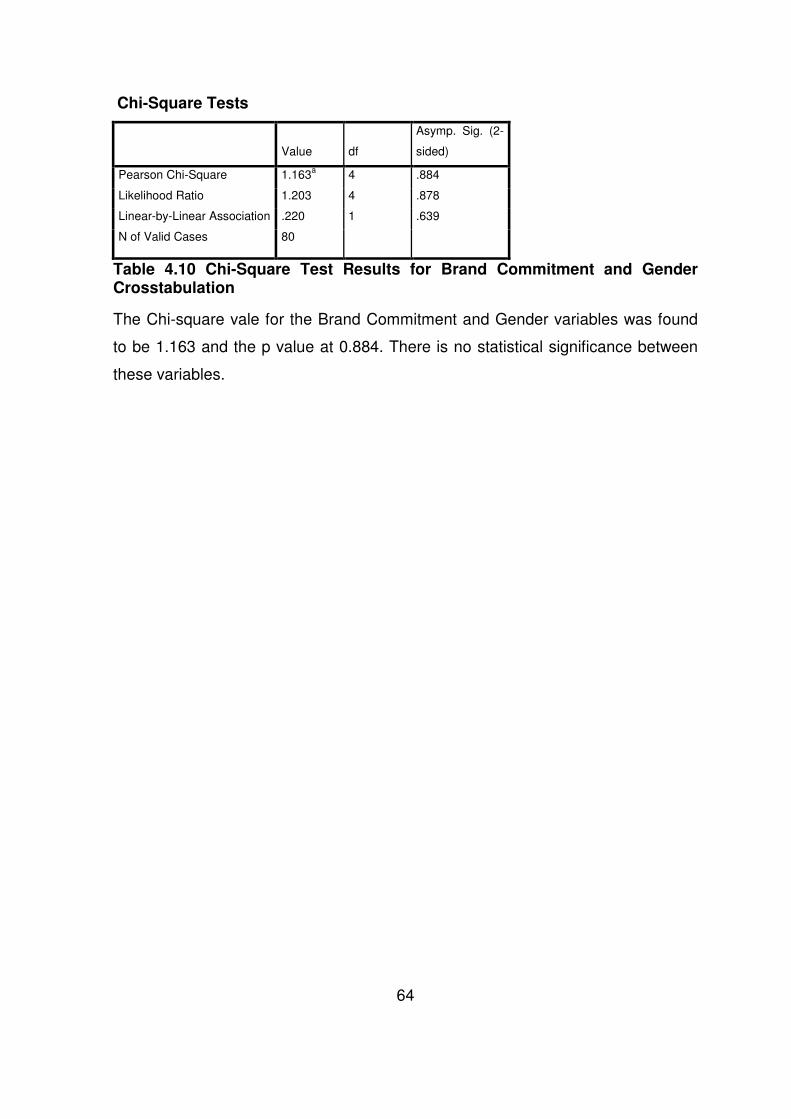
64
Chi-Square Tests
Value df
Asymp. Sig. (2-
sided)
Pearson Chi-Square 1.163a 4 .884
Likelihood Ratio 1.203 4 .878
Linear-by-Linear Association .220 1 .639
N of Valid Cases 80
Table 4.10 Chi-Square Test Results for Brand Commitment and Gender Crosstabulation
The Chi-square vale for the Brand Commitment and Gender variables was found
to be 1.163 and the p value at 0.884. There is no statistical significance between
these variables.

65
4.5.5. Resistance to Purchase Other Brands and Age.
Resistance to purchase other brands * Age Crosstabulation
Age
Total 20-29 30-39 40-49 50-59
60 and
above
Resistance to
purchase other
brands
Strongly
Disagree
Count 2 3 2 0 0 7
% within
Age
11.1% 8.3% 10.0% .0% .0% 8.8%
Disagree Count 4 18 10 1 2 35
% within
Age
22.2% 50.0% 50.0% 25.0% 100.0% 43.8%
Neutral Count 5 2 0 0 0 7
% within
Age
27.8% 5.6% .0% .0% .0% 8.8%
Agree Count 4 7 3 3 0 17
% within
Age
22.2% 19.4% 15.0% 75.0% .0% 21.3%
Strongly
Agree
Count 3 6 5 0 0 14
% within
Age
16.7% 16.7% 25.0% .0% .0% 17.5%
Total Count 18 36 20 4 2 80
% within
Age
100.0
%
100.0
%
100.0
%
100.0
%
100.0% 100.0
%
Table 4.11 Contingency Table Showing the Relationship Between Resistance to Purchase Other Brands and Age
The respondents within the age group of 50-59 mostly indicated that they
purchase different types of brands. They constituted 75% of the group. The next
group with the highest percentage at 40% was the 40-49 one. This was closely
matched by 38.9% respondents in the age category of 20-29.
Table 4.12 Chi-Square Test Results for Resistance to Purchase Other Brands and Age Crosstabulation
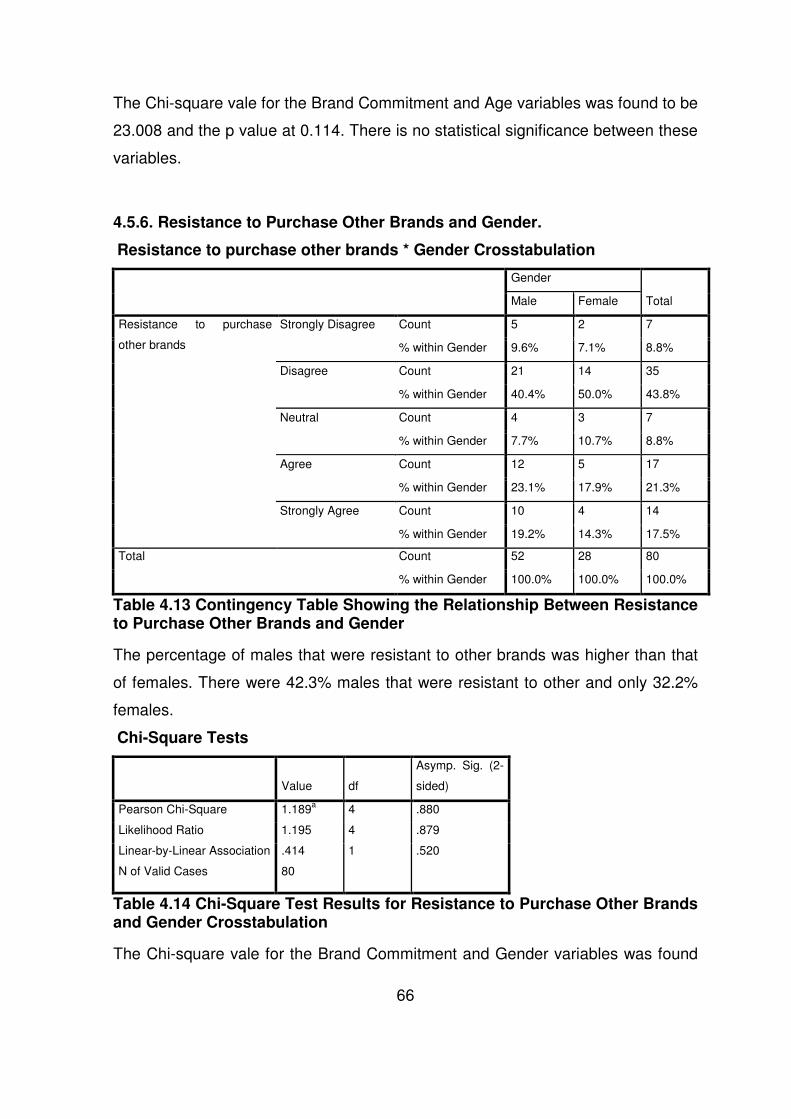
66
The Chi-square vale for the Brand Commitment and Age variables was found to be
23.008 and the p value at 0.114. There is no statistical significance between these
variables.
4.5.6. Resistance to Purchase Other Brands and Gender.
Resistance to purchase other brands * Gender Crosstabulation
Gender
Total Male Female
Resistance to purchase
other brands
Strongly Disagree Count 5 2 7
% within Gender 9.6% 7.1% 8.8%
Disagree Count 21 14 35
% within Gender 40.4% 50.0% 43.8%
Neutral Count 4 3 7
% within Gender 7.7% 10.7% 8.8%
Agree Count 12 5 17
% within Gender 23.1% 17.9% 21.3%
Strongly Agree Count 10 4 14
% within Gender 19.2% 14.3% 17.5%
Total Count 52 28 80
% within Gender 100.0% 100.0% 100.0%
Table 4.13 Contingency Table Showing the Relationship Between Resistance to Purchase Other Brands and Gender
The percentage of males that were resistant to other brands was higher than that
of females. There were 42.3% males that were resistant to other and only 32.2%
females.
Chi-Square Tests
Value df
Asymp. Sig. (2-
sided)
Pearson Chi-Square 1.189a 4 .880
Likelihood Ratio 1.195 4 .879
Linear-by-Linear Association .414 1 .520
N of Valid Cases 80
Table 4.14 Chi-Square Test Results for Resistance to Purchase Other Brands and Gender Crosstabulation
The Chi-square vale for the Brand Commitment and Gender variables was found

67
to be 1.189 and the p value at 0.88. There is no statistical significance between
these variables.
4.5.7. Recommendation of Preferred Brand and Age.
Recommendation of preferred brand * Age Crosstabulation
Age
Total
20-
29
30-
39 40-49 50-59
60 and
above
Recommendatio
n of preferred
brand
Very
Unlikely
Count 1 5 1 0 0 7
% within
Age
5.6
%
13.9
%
5.0% .0% .0% 8.8%
Not
Likely
Count 3 4 1 2 2 12
% within
Age
16.7
%
11.1
%
5.0% 50.0
%
100.0% 15.0
%
Neutral Count 5 3 5 0 0 13
% within
Age
27.8
%
8.3% 25.0
%
.0% .0% 16.3
%
Likely Count 2 7 5 1 0 15
% within
Age
11.1
%
19.4
%
25.0
%
25.0
%
.0% 18.8
%
Very
Likely
Count 7 17 8 1 0 33
% within
Age
38.9
%
47.2
%
40.0
%
25.0
%
.0% 41.3
%
Total Count 18 36 20 4 2 80
% within
Age
100.
0%
100.
0%
100.0
%
100.0
%
100.0% 100.0
%
Table 4.15 Contingency Table Showing the Relationship Between Recommendation of Preferred Brand and Age
The table above shows that 75% of respondents in the age group 40-49 would
refer their preferred brand to others. This is followed by the age group 30-39 with
66.6% of the respondents that would refer their brands. The age group 20-29
displayed a lower percentage at 50%.

68
Chi-Square Tests
Value df Asymp. Sig. (2-sided)
Pearson Chi-Square 24.419a 16 .081
Likelihood Ratio 20.840 16 .185
Linear-by-Linear Association .493 1 .483
N of Valid Cases 80
Table 4.16 Chi-Square Test Results for Recommendation of Preferred Brand and Age Crosstabulation
The Chi-square vale for the Brand Commitment and Gender variables was found
to be 24.419 and the p value at 0.81. There is no statistical significance between
these values.
4.5.8. Recommendation of Preferred Brand and Gender.
Recommendation of preferred brand * Gender Crosstabulation
Gender
Total Male Female
Recommendation of
preferred brand
Very Unlikely Count 4 3 7
% within Gender 7.7% 10.7% 8.8%
Not Likely Count 5 7 12
% within Gender 9.6% 25.0% 15.0%
Neutral Count 8 5 13
% within Gender 15.4% 17.9% 16.3%
Likely Count 12 3 15
% within Gender 23.1% 10.7% 18.8%
Very Likely Count 23 10 33
% within Gender 44.2% 35.7% 41.3%
Total Count 52 28 80
% within Gender 100.0% 100.0% 100.0%
Table 4.17 Contingency Table Showing the Relationship Between Recommendation of Preferred Brand and Gender
There were more males than females who would refer their preferred brands. Only
46.4% females would recommend as opposed to 67.3% males.

69
Chi-Square Tests
Value df
Asymp. Sig. (2-
sided)
Pearson Chi-Square 4.934a 4 .294
Likelihood Ratio 4.910 4 .297
Linear-by-Linear Association 2.489 1 .115
N of Valid Cases 80
Table 4.18 Chi-square Tests for Recommendation of Preferred Brand and Gender Crosstabulation
The Chi-square value for the two variables Recommendation of preferred brand
and Gender was found to be 4.934.The p value was calculated at 0.294.There is
no statistical significance between the variables.
4.5.9 Quality of Petrol and Gender.
Importance of quality of petrol * Gender Crosstabulation
Gender
Total Male Female
Importance of quality of
petrol
Disagree Count 1 3 4
% within Gender 1.9% 10.7% 5.0%
Neutral Count 10 4 14
% within Gender 19.2% 14.3% 17.5%
Agree Count 10 9 19
% within Gender 19.2% 32.1% 23.8%
Strongly Agree Count 31 12 43
% within Gender 59.6% 42.9% 53.8%
Total Count 52 28 80
% within Gender 100.0% 100.0% 100.0%
Table 4.19 Contingency Table Showing the Relationship Between Quality of Petrol and Gender
Table 4.19 above shows that both males and females are particular about the
quality of petrol they use. Evidence is shown by the 78.8% of males and 70% of
females.

70
Table 4.20 Chi-square Test Results for Importance of Quality of Petrol and Gender Crosstabulation
The Chi-Square value calculated for the above variables was found to be 5.296.
The calculated p value was 0.151. There is no statistical significance between the
two variables.
4.5.10 Importance of Cleanliness in Petrol Stations and Gender.
Importance of cleanliness in petrol stations * Gender Crosstabulation
Gender
Total Male Female
Importance of cleanliness in
petrol stations
Strongly Disagree Count 2 0 2
% within Gender 3.8% .0% 2.5%
Disagree Count 1 0 1
% within Gender 1.9% .0% 1.3%
Neutral Count 4 1 5
% within Gender 7.7% 3.6% 6.3%
Agree Count 12 11 23
% within Gender 23.1% 39.3% 28.8%
Strongly Agree Count 33 16 49
% within Gender 63.5% 57.1% 61.3%
Total Count 52 28 80
% within Gender 100.0% 100.0% 100.0%
Table 4.21 Contingency Table Showing the Relationship Between Cleanliness in Petrol Stations and Gender
A high percentage of both males and females regarded cleanliness as an
important factor in petrol stations. However women at 96.4% thought more highly
of cleanliness as compared to 86.6% males.

71
Chi-Square Tests
Value df
Asymp. Sig. (2-
sided)
Pearson Chi-Square 3.892a 4 .421
Likelihood Ratio 4.840 4 .304
Linear-by-Linear Association .418 1 .518
N of Valid Cases 80
Table 4.22 Chi-square Test Results for Cleanliness in Petrol Stations and Gender Crosstabulation
The Chi-Square value for cleanliness in petrol stations and Gender was 3.892.The
p value was calculated to be 0.421. There is no statistical significance between the
two values.
4.5.11 Name of Most Preferred Brand and Gender.
Name of most preferred petrol brand * Gender Crosstabulation
Gender
Total Male Female
Name of most preferred
petrol brand
BP Count 11 3 14
% within Gender 21.2% 10.7% 17.5%
Caltex Count 4 4 8
% within Gender 7.7% 14.3% 10.0%
Engen Count 5 4 9
% within Gender 9.6% 14.3% 11.3%
Sasol Count 7 1 8
% within Gender 13.5% 3.6% 10.0%
Shell Count 10 5 15
% within Gender 19.2% 17.9% 18.8%
Total Count 3 1 4
% within Gender 5.8% 3.6% 5.0%
None Count 11 10 21
% within Gender 21.2% 35.7% 26.3%
Other Count 1 0 1
% within Gender 1.9% .0% 1.3%
Total Count 52 28 80
% within Gender 100.0% 100.0% 100.0%
Table 4.23 Contingency Table Showing the Relationship Between the Name of Petrol Brand Preferred and Gender

72
The table above shows that only 21.2% males prefer to fill up with BP. This figure
was closely matched by those 19.2% males that preferred Shell. The next one that
nearly matched this figure was Sasol with a percentage of 13.5%. On the other
hand a number of females (17.9%) preferred Shell. The next highest preferred
brand by females was Engen and Caltex. Each of these brands accounted for
14.3% of the female population.
Chi-Square Tests
Value df
Asymp. Sig. (2-
sided)
Pearson Chi-Square 6.260a 7 .510
Likelihood Ratio 6.901 7 .439
Linear-by-Linear Association .692 1 .405
N of Valid Cases 80
Table 4.24 Chi-square Test Results for Name of Petrol Brand Preferred and Gender Crosstabulation
The Chi-Square value for cleanliness in petrol stations and Gender was 6.260.The
p value was calculated to be 0.510. There is no statistical significance between the
two values.
4.6 Summary This chapter presented results on the different aspects of brand loyalty under
study. A majority of the participants confirmed that they have preferred petrol
brands. From then a series of brand loyalty factors percentages were displayed.
The degree of brand commitment, repeat purchase and resistance to purchase
was comparatively shown with Likert scales ranging from strongly agree to
strongly disagree per statement. Figures that depicted the attitude of research
participants towards marketing strategies were also shown. Clearly good service,
petrol quality and cleanliness were of utmost importance to most respondents.
Also a very high percentage of them approved of service improvement by use of
customer satisfaction surveys.
The next chapter will discuss these set of results in detail. The findings will
determine the extent of loyalty to petrol brands and effectiveness of retention
methods.
73
CHAPTER FIVE
5 Discussion
5.1 Introduction
In this chapter detailed analysis and interpretation of respondent’s views is
discussed. Inferences of the findings are explained with reference to existing
literature on the topic. This includes analysis of purchase behaviour by petrol
consumers and ways in which this behaviour can be encouraged to assist brand
loyalty improvement. As discussed in the literature true brand loyalty is made up of
the attitudinal and behavioural aspect. Behavioural loyalty is complemented by
attitudinal loyalty and as a result this discussion delves into both loyalty forms.
5.2 Analysis and Interpretation of Results
5.2.1 Gender
The gender representation showed that during the research there were more
males that took part than females. Males constituted 65% of the population sample
and females were at 35%.It is important to note that there cannot be any deduction
made from these results as the participants were randomly chosen.
5.2.2 Age
The spread in the age difference of respondents gave a better insight into the
brand loyalty aspects. The ages ranged from youth to the older generation. The
majority of the participants were between ages of 30 and 39.This was followed by
the age category 40- 49 which consisted of 20 respondents. The youth of the age
category 20–29 were also adequately represented. This figure represents
purchase behaviour of the younger generation. It appears as if there were less of
the older generation greater than 50 years in the petrol stages visited. Getting
responses from this generation would have assisted perhaps in understanding the
loyalty behaviour of this sector of the population over a number of years.
74
5.2.3 Brand Loyalty
5.2.3.1 Existence of a Preferred Petrol Brand
A majority of the respondents confirmed that they have a preferred brand of petrol,
a figure over 70% of the sample size. The rest use any petrol brand. From the data
collected Shell was the most preferred brand, closely followed by BP with a
difference of 1.3%.The results show that there is a considerable level of brand
preference. The petrol consumers have tendencies of choosing their preferred
brands within a number of competing brands. The level though is reflected as
being balanced as shown by the small differences in percentages between
competing brands. Caltex for instance has the same percentage as Sasol. This
observation may be explained by Jacoby & Kyner (1973) in their conclusion that
preference for a certain brand is a single factor that consumers regard during the
purchasing exercise and sometimes not an important factor. Engen depicted a
1.3% value greater than Sasol and Caltex. Total was the least favoured brand.
5.2.3.2 Repeat Purchase of Brand
Participants were asked if they always purchase the same brand of petrol when
filling their cars. The response showed that only 57.5% purchased the same
brand. A majority of these within the 30-39 age categories. The rest either did not
purchase the same brand or could not account for their purchase behaviour. It is
interesting to note that only 25% of this group could definitely confirm that they
always purchase the same brand, i.e. they strongly agreed. A slightly greater
number than this at 32.5% just agreed that they purchase the same brand. The
degree of certainty was therefore not very high within a greater number of
consumers. This is even exacerbated by the fact that 15% of this group did not
confirm their purchase behaviour. If one were to consider the 15% of neutral
consumers and assume that they would disagree with the statement, then the total
percentage would increase to 57.5% as well. This would imply that petrol
consumers’ attitudinal component of brand loyalty is not very strong. However if
the opposite were to occur then the figure would increase to 72.5%.It would still
not be convincing as the true repeat purchasers would constitute only 25% plus
75
15% giving a total of 40%. Jacoby & Chestnut (1978) suggest that one of the basic
principles of brand loyalty is consumer’s consistency of choice. This is a
behavioural phenomenon in the brand loyalty field.
5.2.3.3 Brand Commitment
To test this factor a question was posed to the respondents whether they would
buy the same brand of petrol, even if they were in a hurry and the station that
stocks their brand was out of the way. The test was to find out if they were truly
committed to their preferred brands. Literature review suggested that brand
commitment is one of the measures of attitude. Results showed that 65.1%
respondents were committed to their brands. However those that were truly
committed were only 13.8 %.They would go out of the way to look for their desired
brand. Those that were just committed were 51.3%, meaning that they would seek
their brand by all means if possible. If not possible they would buy from another
petrol outlet. There is a big gap between the true loyal committed consumers and
those that are just loyal i.e. agreed to the statement. A total of 22.6% were not
brand committed at all. An additional 12.5% were neutral. If these two last figures
are added together then they total to 35.1%, assuming that the 12.5% would sway
to this group. Looking at this figure and the ones representing those that are just
committed, one would come to a conclusion that brand commitment is not really
strong. This assessment shows that there are consumers that are truly brand loyal
and those that are in a state of inertia and purchase the brand for other reasons
other than affection. If say the 12.5% would regroup with the strongly committed
lot, the figure would still not be convincing at 26.3%. A majority of the committed
consumers also came from the 30-39 age groups. This is followed by the 40-49
age categories. The trend shows that as consumers get older they get committed
76
towards their brands. Riley et al (1997) attributed the lack of attitudinal response to
lack of reinforced positive beliefs, perhaps through advertising. In their research
findings they concluded that attitude beliefs are not firmly held.
5.2.3.4 Resistance to Purchase Other Brands
Participants were asked whether they do purchase other brands of petrol. This
question was aimed at establishing whether the petrol consumers are resistant to
the purchase of other brands. If so then it would mean that they exhibit brand
loyalty. There were only 52.6% respondents that confirmed that they do not use
other brands of petrol. Out of this number only 8.8% were found to be hardcore
brand loyal consumers. These customers are the kind that would look for their
brand of petrol and fill up. They will not at any point in time just see any petrol
station and decide to pour petrol there for the sake of filling up their tanks. Such
consumers are not even drawn by special promotions run by competing brands. A
further 43.8% were not hardcore loyal consumers. This group would by all means
try to resist offers to switch to other brands. However they have a potential to
switch. The rest, 38.8% are switchers. If the neutral group is added to this group
then a potential total of 47.6% would be switchers. If one looks at the true loyal
consumers, it is evident that the figure is low and switching behaviour is prevalent
within the group. As discussed petrol price is the same in South Africa and as a
result the switching costs are very minimal or none at all for the consumers. A
consumer can substitute one brand with another at no cost.
5.2.3.5 Likeliness of Recommending a Preferred Brand of Petrol
The consumers were asked the level of likeliness in recommending their preferred

77
brands to anyone. The objective of this question was to find out if they like their
brand to an extent that they can exert a level of influence to other people. It was
established from the results that a slightly higher percentage at 41.3% said they
would very likely recommend the brand. This implied that the respondents held a
favourable set of stated beliefs about the brands that they utilised. As literature
suggests the measurement would be recommendation of the preferred brand
instead of competing ones. It also signifies the level of commitment. In total
including ones that would just likely recommend their brands a figure of 60.1% was
observed. A total of only 23.8% would not recommend their brand at all which was
quite a low figure.
The results show that there is willingness to recommend the brands for different
reasons that have not been precisely established in this study. Rosen & Olshavsky
(1987) conducted a study on brand choice strategies involving recommendations.
Their findings were that a consumer may obtain a recommendation from a
personal or non personal source for purchasing purposes. Seventy five percent of
these referrals were from friends. After getting key attribute value from the referrer
they would then search for more information on the brand’s attribute. Such
referrals can help boost brand loyalty. Through such referrals brand loyalty can
be increased. It is interesting to note again that the age group with the highest
referral rate is the 30-39 one. One can merely conclude that referral marketing of
the petrol brands would highly occur at this age group.
78
5.2.4 Effect of Marketing Strategies
5.2.4.1 Effect of Advertising on Petrol Brand Purchase
As highlighted earlier when reviewing literature, advertising in the South African
Petroleum industry is very minimal. Not all the petrol companies aggressively carry
out advertising either on the available media channels. The results obtained
definitely concur with this fact. A total of 47.5% of the respondents did not find
advertising vital in their petrol purchase decision making. A total of 22.5% were not
aware if advertising matters when they purchase petrol. This shows that
promotions of these brands are not in the face of the consumers. Had effective
brand communication been visible then they would have immediately agreed with
the statement. If the neutral respondents were to be converted not to agree with
statement, then a total figure of 70% would represent a section that is not
influenced by advertising. There were 30.1% respondents that said that they are
influenced by petrol advertising in the choice of brands they use. This number may
be reached via the small number of TV adverts that are currently shown on the
different channels. Alternatively it could be through promotional material at petrol
locations. Shell for example is associated with Formula 1 racing. Consumers might
then associate the petrol brand with speed characteristics. The other source of
awareness could be through sponsorships. Most of them are involved in sports.
BP has in the past before 2008 been sponsoring the BP Top 8 soccer tournament
(MTN8 Final goes … 2010). Similarly Total is involved in motorsport (Total
Motorsport ... 2012).The company is also engaged in Soccer development
programmes (Soccer Development ... 2012). Engen is involved in Soccer,
Motorsport, Cycling, Basketball and Athletics (Sports Sponsorships...2012).
79
Though there are such promotions, they do not reach a greater audience as not
everyone is a soccer or motorsport fanatic.
5.2.4.2 The Reason to Purchase Petrol from a Petrol Station Within a
Provided List
From the consumer’s response, the amenities found within the petrol stations do
not have much of a role in terms of convincing them to purchase a particular brand
or use that petrol station. A number of them at 35% attributed the presence of a
convenience shop as part of the reason why they use a certain brand of petrol.
This however does not really mean that they would purchase from one particular
petrol station. If they come across a Sasol convenience shop they will purchase
and might at the same time fill petrol. They can stop at another petrol station, say
Total the following day. Some may be in the habit of purchasing either bread or a
newspaper on their way home and decide to pour petrol.
The convenience shops are priced a little bit more than your normal grocery shops
and this might discourage some of the consumers and hence not work to the
advantage of the petrol station in increasing brand loyalty. The results do concur
with this observation as there were 31.3% participants that confirmed that
existence of Convenience shops does not influence their petrol purchase decision
making. An important factor to note is that until recently the shopping experience
within these outlets has been tremendously improved by introducing new outlets
such as Woolworths and DVD rental sections at Engen petrol stations, accessible
24 hours. Consumers therefore can fill petrol and buy the same Woolworths
perishable products found in standard stores. Though this research did not go to
the extent of finding out what exactly consumers buy from these convenient stores,
80
it appears that these convenience stores are attaining more customers, judging by
the high percentage observed over other amenities. Food stops have been
deemed an incredible success (Woolworths Food Stops ... 2010).There were initial
concerns whether an oil company could succeed in combining a niche Woolworths
brand of products with the Engen national brands at its Quick Shops. However a
consistent brand image was delivered and maintained with “flying colours”.
Homeward bound based stores were found to be very successful than highway
stores. According to the article food stores have increased the customer base
though there was still a lot to be done.
The second item that was found to attract customers to petrol station was ATM’s
(Automated Teller Machines). Their being located within the premises facilitates
the purchase of petrol. It was also convenient when filling petrol before the
introduction of use of debit and credit cards as customers could draw money to
pay. As to whether it will still allure customers in future due to use of cards it is
unknown.
Eleven percent of the respondents were drawn to petrol stations by other reasons
not listed on the questionnaires. Only 6.3% of them stated that car wash facilities
draw them to certain petrol stations. It was noted during fieldwork that it is not all
petrol stations that have car wash facilities. Those that had were competing with
independent car washes within surrounding arrears, which would explain the
reason why this figure is low.
It is important that petrol station owners provide amenities that will appeal to their
customers. An improved car wash programme can be initiated and points linked to
petrol purchase. These outlets must ensure that they have the right people for the
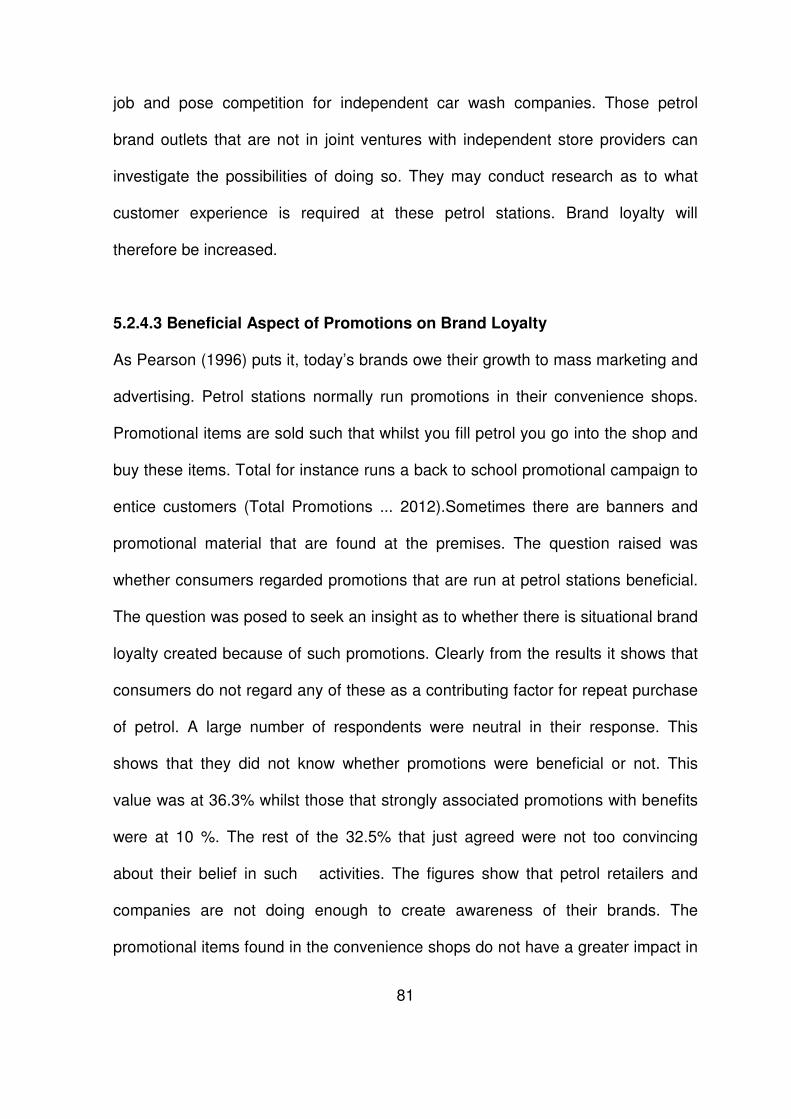
81
job and pose competition for independent car wash companies. Those petrol
brand outlets that are not in joint ventures with independent store providers can
investigate the possibilities of doing so. They may conduct research as to what
customer experience is required at these petrol stations. Brand loyalty will
therefore be increased.
5.2.4.3 Beneficial Aspect of Promotions on Brand Loyalty As Pearson (1996) puts it, today’s brands owe their growth to mass marketing and
advertising. Petrol stations normally run promotions in their convenience shops.
Promotional items are sold such that whilst you fill petrol you go into the shop and
buy these items. Total for instance runs a back to school promotional campaign to
entice customers (Total Promotions ... 2012).Sometimes there are banners and
promotional material that are found at the premises. The question raised was
whether consumers regarded promotions that are run at petrol stations beneficial.
The question was posed to seek an insight as to whether there is situational brand
loyalty created because of such promotions. Clearly from the results it shows that
consumers do not regard any of these as a contributing factor for repeat purchase
of petrol. A large number of respondents were neutral in their response. This
shows that they did not know whether promotions were beneficial or not. This
value was at 36.3% whilst those that strongly associated promotions with benefits
were at 10 %. The rest of the 32.5% that just agreed were not too convincing
about their belief in such activities. The figures show that petrol retailers and
companies are not doing enough to create awareness of their brands. The
promotional items found in the convenience shops do not have a greater impact in
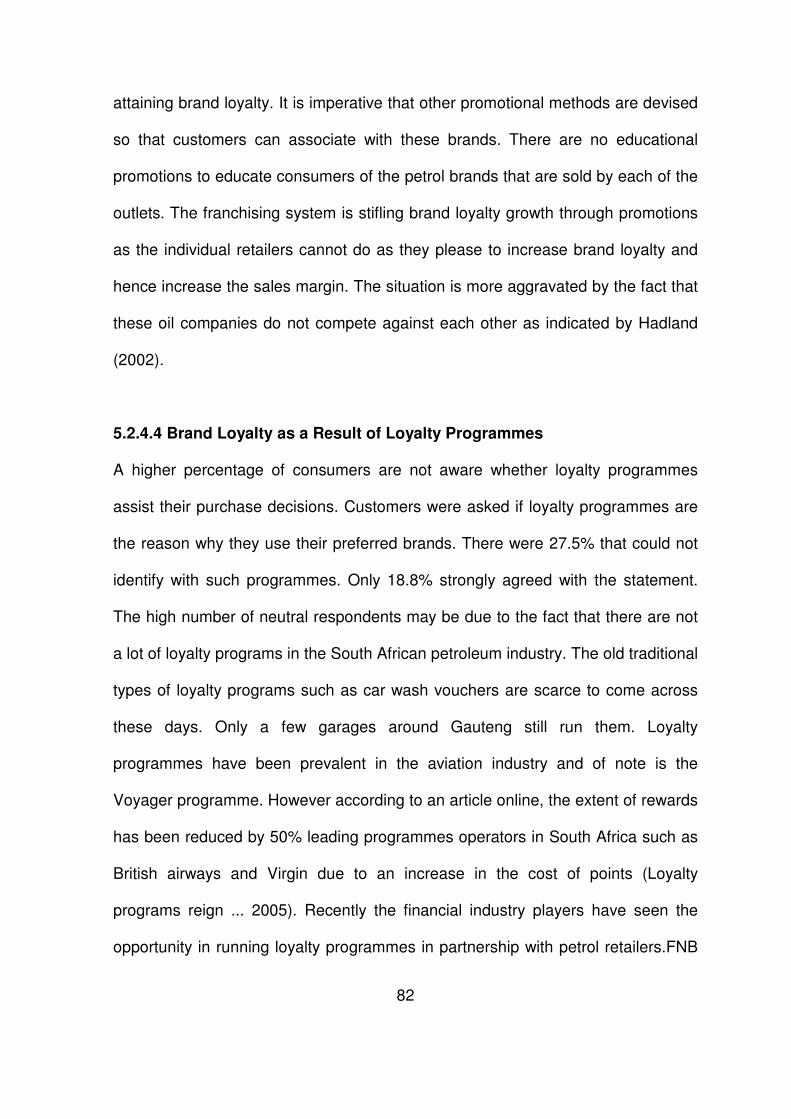
82
attaining brand loyalty. It is imperative that other promotional methods are devised
so that customers can associate with these brands. There are no educational
promotions to educate consumers of the petrol brands that are sold by each of the
outlets. The franchising system is stifling brand loyalty growth through promotions
as the individual retailers cannot do as they please to increase brand loyalty and
hence increase the sales margin. The situation is more aggravated by the fact that
these oil companies do not compete against each other as indicated by Hadland
(2002).
5.2.4.4 Brand Loyalty as a Result of Loyalty Programmes A higher percentage of consumers are not aware whether loyalty programmes
assist their purchase decisions. Customers were asked if loyalty programmes are
the reason why they use their preferred brands. There were 27.5% that could not
identify with such programmes. Only 18.8% strongly agreed with the statement.
The high number of neutral respondents may be due to the fact that there are not
a lot of loyalty programs in the South African petroleum industry. The old traditional
types of loyalty programs such as car wash vouchers are scarce to come across
these days. Only a few garages around Gauteng still run them. Loyalty
programmes have been prevalent in the aviation industry and of note is the
Voyager programme. However according to an article online, the extent of rewards
has been reduced by 50% leading programmes operators in South Africa such as
British airways and Virgin due to an increase in the cost of points (Loyalty
programs reign ... 2005). Recently the financial industry players have seen the
opportunity in running loyalty programmes in partnership with petrol retailers.FNB
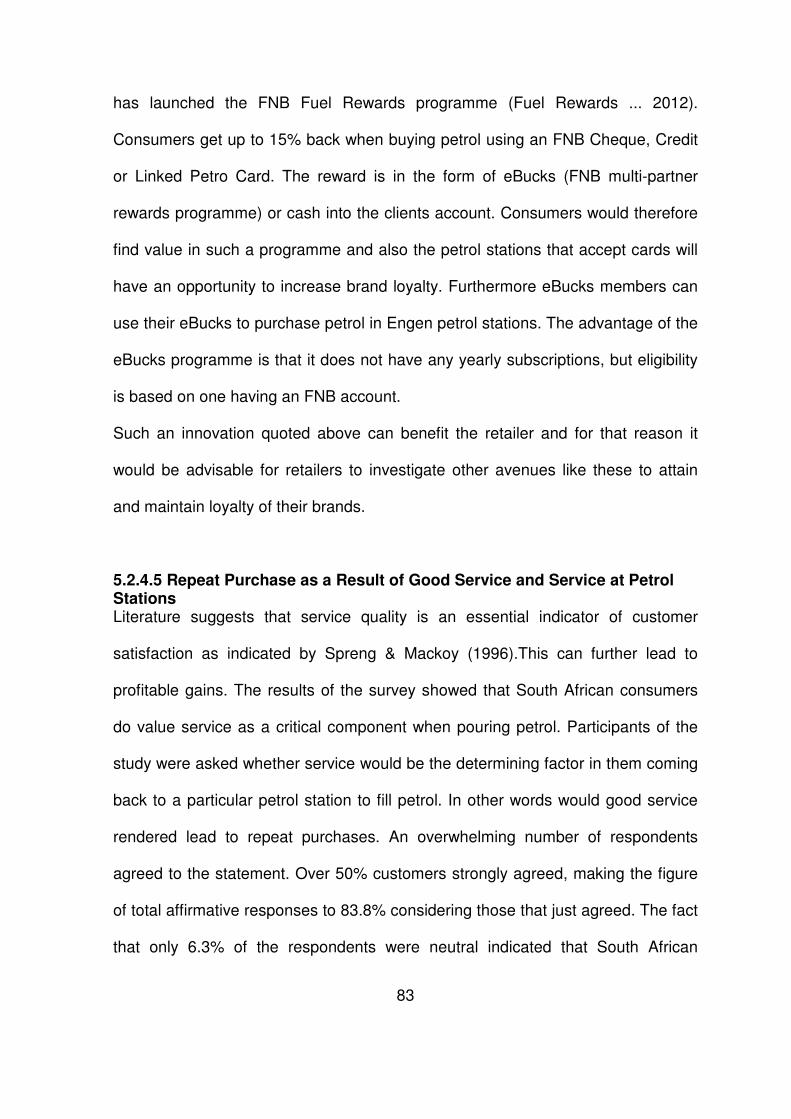
83
has launched the FNB Fuel Rewards programme (Fuel Rewards ... 2012).
Consumers get up to 15% back when buying petrol using an FNB Cheque, Credit
or Linked Petro Card. The reward is in the form of eBucks (FNB multi-partner
rewards programme) or cash into the clients account. Consumers would therefore
find value in such a programme and also the petrol stations that accept cards will
have an opportunity to increase brand loyalty. Furthermore eBucks members can
use their eBucks to purchase petrol in Engen petrol stations. The advantage of the
eBucks programme is that it does not have any yearly subscriptions, but eligibility
is based on one having an FNB account.
Such an innovation quoted above can benefit the retailer and for that reason it
would be advisable for retailers to investigate other avenues like these to attain
and maintain loyalty of their brands.
5.2.4.5 Repeat Purchase as a Result of Good Service and Service at Petrol Stations Literature suggests that service quality is an essential indicator of customer
satisfaction as indicated by Spreng & Mackoy (1996).This can further lead to
profitable gains. The results of the survey showed that South African consumers
do value service as a critical component when pouring petrol. Participants of the
study were asked whether service would be the determining factor in them coming
back to a particular petrol station to fill petrol. In other words would good service
rendered lead to repeat purchases. An overwhelming number of respondents
agreed to the statement. Over 50% customers strongly agreed, making the figure
of total affirmative responses to 83.8% considering those that just agreed. The fact
that only 6.3% of the respondents were neutral indicated that South African
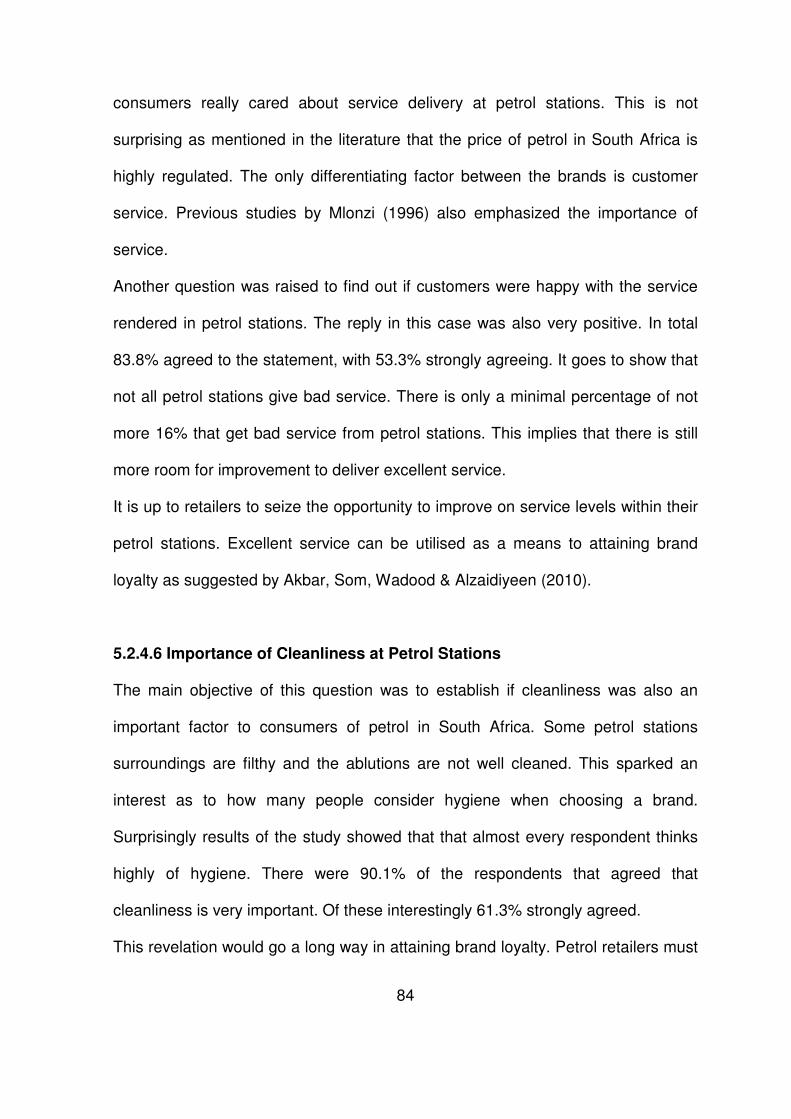
84
consumers really cared about service delivery at petrol stations. This is not
surprising as mentioned in the literature that the price of petrol in South Africa is
highly regulated. The only differentiating factor between the brands is customer
service. Previous studies by Mlonzi (1996) also emphasized the importance of
service.
Another question was raised to find out if customers were happy with the service
rendered in petrol stations. The reply in this case was also very positive. In total
83.8% agreed to the statement, with 53.3% strongly agreeing. It goes to show that
not all petrol stations give bad service. There is only a minimal percentage of not
more 16% that get bad service from petrol stations. This implies that there is still
more room for improvement to deliver excellent service.
It is up to retailers to seize the opportunity to improve on service levels within their
petrol stations. Excellent service can be utilised as a means to attaining brand
loyalty as suggested by Akbar, Som, Wadood & Alzaidiyeen (2010).
5.2.4.6 Importance of Cleanliness at Petrol Stations The main objective of this question was to establish if cleanliness was also an
important factor to consumers of petrol in South Africa. Some petrol stations
surroundings are filthy and the ablutions are not well cleaned. This sparked an
interest as to how many people consider hygiene when choosing a brand.
Surprisingly results of the study showed that that almost every respondent thinks
highly of hygiene. There were 90.1% of the respondents that agreed that
cleanliness is very important. Of these interestingly 61.3% strongly agreed.
This revelation would go a long way in attaining brand loyalty. Petrol retailers must

85
therefore ensure that they keep their premises clean, as this might be a
competitive advantage. Customers must not think of petrol stations as greasy and
filthy places.
5.2.4.7 Quality of Petrol as a Factor in Purchase Decisions Over fifty percent of the respondents feel strongly about the quality of the petrol
that they buy. Including those that do not feel strongly but agree with the
statement, the figure totals to 77.6%.This shows that the South African consumer
thrives on quality brands. As discussed earlier the only question that remains is
where this high percentage of consumers get education regarding quality of their
brands as there is insufficient marketing activities around petrol.
As it is evident that quality is a factor in petrol purchasing, the retailers need to
create more awareness of the quality of their brands to retain those clients that are
currently loyal and further attract new ones. The fact that there were 17.5% of the
respondents that were not sure that quality makes a difference in their decision
process leaves room to convert them to believe in the brand.
5.2.4.8 Customer Satisfaction Surveys as Means of Service Improvement Petrol consumers were asked whether customer satisfaction surveys would
improve service conditions at petrol stations or not. A relatively high number of
respondents (45%) felt strongly that such an exercise would be very beneficial.
Those that just agreed but not strongly increased the figure to 87.5%.
Generally petrol stations do not carry out surveys to find out from their clients if
they are receiving good service. The fact that the results show a high figure of
86
consumers that regard customer satisfaction surveys a critical component of
service improvement implies that retailers must take heed of this warning.
Customer satisfaction surveys could steer the petrol station in the right direction.
Petrol retailers would know what the current complaints are and furthermore be in
a position to know what amenities are required within the petrol station that can
add value to the customer’s experience.
5.2.4.9 Owner of Vehicle Being Driven These stats were solely taken to find out who the owner of the vehicle is. Those
that were driving their own vehicles determined which brand to use without
influence. A majority of the participants i.e. over seventy five percent were driving
their own vehicles. This further strengthens the validity of the results.
5.2 Summary This chapter has discussed and highlighted the extent of brand loyalty within the
South African petrol consumers. Both the behavioural and attitudinal aspects have
been explored. Brand loyalty has been found not to be very strong. Existing
marketing strategies have also been found to be inadequate in increasing brand
loyalty amongst consumers. The consumers have affirmed that cleanliness, quality
of petrol and customer satisfaction survey can play a role in attaining brand loyalty.
The next chapter will conclude the findings of the research and make
recommendations based on the aims and objectives of this research as well as
suggestions for future research.

87
CHAPTER SIX
6 Conclusions and Recommendations
6.1 Introduction
In this chapter the research findings are concluded upon. Furthermore the chapter
shows the contribution of this research in understanding brand loyalty in line with
aims and objectives of this study. Suggestions to improve brand loyalty are also
discussed. Recommendations for future studies to further enhance knowledge in
this field are made.
6.2 Discussion of Findings in Relation to Aims and Objectives
6.2.1 Brand Loyalty
The main aim of this research as discussed in preceding chapters was to establish
whether there is brand loyalty within South African petrol consumers. Findings
from the research have shown that there is lack of brand loyalty amongst these
consumers even though a greater number had indicated their preferred brands.
Both the attitudinal and behavioural aspect has been found to be not strong. The
percentage of consumers that feel strongly about their brands was not high. A
number of the consumers simply agreed with the statements posed to them. This
showed that they were not confident with their brands otherwise they could have
indicated a strong association with the brands. The fact that price is the same for
all brands, is a contributing factor as there is no competition to try and attain high
levels of brand loyalty. This affected repeat purchases and commitment from
consumers. In addition to this, switching tendencies were found to exist.
6.2.2 Marketing Strategies
Marketing strategies that are currently employed by the oil companies are not
effective as shown by the study. A number of consumers have attested that their
purchase behaviour is not really influenced by marketing programs. Advertising of

88
the different brands is minimal. So is promotion of the different brands. When
consumers were asked about loyalty programmes, many indicated that they were
not aware of any. This therefore does not create brand awareness to increase the
level of brand commitment and repeat purchase. The petrol retailers need to take
cognisance of the fact that if brand loyalty increases so does profit margins.
With respect to marketing of the brands brand loyalty attainment by petrol retailers
can be infringed due to the structure of the industry. As indicated Oil companies
are responsible for the marketing drives and as a result the retailers who are
franchisees do not determine the programs.
Most of the customers were happy with service given by petrol staff. Service as the
only differentiator in this industry seems to be fine, though improvement is always
required to be on top of things. Petrol retailers are in control of this important
element to achieve competitive advantage.
6.3 Suggestions
6.3.1 Brand Loyalty
Brand loyalty improvements can be driven by either marketing strategies or service
excellence improvement. In terms of marketing of brands a suggestion would be
for petrol retailers to communicate ideas to the oil companies through the Fuel
Retailers Association to help improve marketing of brands. This includes
educational marketing about the quality of the different brands. Secondly loyalty
programmes can be setup. If designed correctly the loyalty programmes can help
the retailers know their clients. Currently in the South African situation there are no
Customer Relationship Management systems in place in this industry. The most
important thing to do is to ensure that correct data is collected, that will be useful
as stated by Uncles et al (2003) .They further state that one of the aims of
customer loyalty programmes is to build a stronger bond between the customer
and the brand, hence retain the existing customer base. Customers must also see
value in the loyalty programmes.
The other sector that petrol retailers can still improve on would be service

89
excellence. To further maintain and improve service, they can ensure that their
staff attend customer service training programs and encourage refresher courses.
Hadland (2002) suggested that a number of petrol retail outlets lacked proper
management. He further stated that staff lacks training and they work long hours.
The long shift hours can also have a detrimental effect on service provided. They
can further ensure that hygienic practices are instilled. By constantly engaging
their customers via surveys, they will know what their customers want and apply
necessary improvements.
6.4 Recommendations for Future Research
For future studies it would be beneficial to look into the following:
♦ Study the brand loyalty on a national scale so as to get an accurate view, as
the sample in this case was only taken from one province.
♦ Ensure that data collection is given ample time. Interviews at the petrol station
took a long time per customer.
6.5 Summary
This chapter concludes the research in line with aims and objectives. It has been
established that brand loyalty is not strong amongst South African petrol
consumers. Ways to improve consumer fuel brand loyalty have been suggested.
Recommendations for future research have also been made.
If the recommendations made are carefully implemented and monitored for
deviation from the hoped for improvement in brand loyalty amongst fuel
consumers, it is probable that the recommendations will contribute to brand loyalty.

90
BIBLIOGRAPHY
Aaker, D. 1996. Building Strong Brands. Free Press, New York.
Aaker, D.1991. Managing Brand Equity: Capitalizing on the Value of a Brand
Name. The Free Press, New York.
Aaker, D. 1992. Strategic Market Management. John Wiley & Sons, New York.
Agyapong, G.K.Q. 2011.The Effect of Service Quality on Customer Satisfaction in
the Utility Industry - A Case of Vodafone (Ghana). International Journal of
Business and Management, vol. 6, no. 5, pp. 203-210.
Akbar, S., Som, A.P.M., Wadood, F., & Alzaidiyeen, N.J. 2010.Revitalization of
Service Quality to Gain Customer Satisfaction and Loyalty. International Journal of
Business and Management, vol. 5, no. 6, pp. 113-122.
American Marketing Association Dictionary. 1995. [Online]. Available WWW:
www.marketingpower.com/_layouts/Dictionary.aspx?dLetter=B (Accessed 22
January 2011).
Ang, B.W. & Tan, K.C.1990. Forecasting of diesel and petrol sales: an evaluation
of various marketing strategies. Energy Policy, vol. 18, no. 3, pp. 246-254.
Baldinger, A.L. & Rubinson, J. 1996. Brand Loyalty: The Link between attitude
and behavior. Journal of Advertising Research, vol. 36, no. 6, pp. 22-34.
Berry, L.L., Parasuraman, A., & Zeithaml, V.A. 1994. Improving service quality in
America: Lessons learned. Academy of Management Executive, vol. 8, no. 2,
pp. 32-52.
Boshoff, C., & Gray, B. 2004. The relationships between service quality, customer

91
satisfaction and buying intentions in the private hospital industry. South African
Journal of Business Management, vol. 35, no. 4, pp. 27-37.
Bryman, A. & Bell E. 2007. Business Research Methods. Oxford University
Press, New York.
Burns, R. B. & Burns R. A. 2008.Business Research Methods and Statistics Using
SPSS. SAGE Publications Ltd, London.
Bytheway, A. & Onojaefe, D. 2009.Brand management in a transforming economy:
An examination of the South African petroleum industry. African Journal of
Marketing Management, vol. 2, no. 1, pp. 001–009.
Clow, K.E. & Baack, D. 2010. Marketing Management. Sage Publications Inc,
California.
Cooper, D.R. & Schindler P.S.1998. Business Research Methods. Irwin/McGraw-
Hill, Boston.
Cooper, D.R. & Schindler P.S. 2002. Business Research Methods. Irwin/McGraw-
Hill, Boston.
Corstjens, M. & Lal, R. 2000. Building store loyalty through store brands. Journal
of Marketing Research, vol. 37, no. 3, pp. 281 – 292.
Crainer, S.1995. The Real Power of Brands: Making Brands Work for Competitive
Advantage. Pitman Publishing, London.
Cronin, J. & Taylor, S. A.1992. Measuring service quality: A re-examination and
extension. Journal of Marketing, vol. 56, no. 3, pp. 55-68.
Customer service in petrol stations not up to scratch. 2010. [Online]. Available

92
WWW:www.forecourttrader.co.uk/news/fullstory.php/aid/4071/Customer_service_i
n_petrol_stations_not_up_to_scratch.html (Accessed 2 October 2011).
Czepiel, J. A.1990. Service encounters and service relationships: Implications for
research. Journal of Business Research, vol. 20, no. 1, pp. 13-21.
Day, G.S.1969. A Two – Dimensional Concept of Brand Loyalty. Journal of
Advertising, vol. 9, no. 3, pp. 29-35.
Day, G.S., Shocker, A.D. & Srivastava, R.K.1979. Customer- Oriented Approaches
to Identifying Product-Markets. Journal of Marketing, vol. 43, no.4, pp. 8-19.
Day, G.S., Weitz, B., & Wensley R.1990. The Interface of Marketing and Strategy.
Jai Press, Greenwich.
Davey, A. 2010. Deregulation of wholesale petrol prices: what happened to capital
city petrol prices? The Australian Journal of Agricultural and Resource Economics,
vol. 54, no. 1, pp. 81–98.
De Chernatony, L., & Riley, F.D. 1998. Defining A "Brand": Beyond The Literature
With Experts' Interpretations. Journal of Marketing Management, vol. 14, no. 4/5,
pp. 417-443.
De Chernatony, L. & McDonald M.H.B. 1992. Creating Powerful Brands.
Butterworth Heinemann Ltd, Oxford.
Dibb, S., Simkin, L., Pride, W. M., & Ferrell, O.C. 1994. Marketing. Houghton
Mifflin, Boston.
Dick, A.S. & Basu, K. 1994. Customer loyalty: toward an integrated conceptual
framework. Journal of the Academy of Marketing Science, vol. 22, no. 2, pp. 99-
113.

93
Disend, J.1991. How to provide excellent service in any organisation. Chilton Book
Company, Pennsylvania.
Dugar, A. 2007. Marketing of Petrol in India-transformation of an undifferentiated
low involvement commodity into high involvement brands. Innovative Marketing,
vol. 3, no. 4, pp. 52-59.
Editor’s Eye.2007. [Online]. Available WWW: www.web.ebscohost.com/ehost
(Accessed 10 October 2011).
Energy Information Administration. 2010. [Online]. Available WWW:
http://www.eia.gov/countries/country-data.cfm. (Accessed 22 January 2011).
Engel, J. F. & Blackwell, R.D. 1982. Consumer Behavior. Dryden Press, Chicago.
Engel, J. F., Blackwell, R. D., & Miniard, P. W. 1990. Consumer Behavior.
Dryden Press, Hinsdale.
Eriksson, P. & Kovalainen, A. 2008. Qualitative methods in business research.
SAGE, London.
Evans, M., Moutinho, L., & Raaij, W.F.V.1996. Applied Consumer Behaviour.
Addison-Wesley Publication Co, Massachusetts.
Fader, P. S. and Schmittlein, D. C. 1993. Excess behavioural loyalty for high-share
brands: Deviations from the Dirichlet model for repeat purchasing. Journal of
Marketing Research, vol. 30, no. 4, pp. 478 – 499.
Foxall, G.R. & Goldsmith, R.E.1994. Consumer Psychology for Marketing.
Routledge, London.

94
Fuel Rewards. 2012. [Online]. Available WWW: www.fnb.co.za/fuelrewards/fuel-
rewards-faqs.html (Accessed 22 January 2012).
Gill, J. & Johnson, P. 2002. Research Methods for Managers. Sage Publishing,
London.
Govender, J.P. 1997. The marketing of petrol and diesel in the Durban area.
MCom dissertation. University of Potchefstroom, Potchefstroom.
Hallowell, R. 1996. The relationship of customer satisfaction, customer loyalty and
profitability: An empirical study. International Journal of Service Industry
Management, vol. 7, no. 4, pp. 27 – 42.
Hadland, A. 2002. In Terror and in Silence. [Online]. Available WWW:
www.hsrcpress.ac.za (Accessed 13 November 2011).
Hill, S.I., Macgrath, J., & Sandeep, D.1998. How to brand Sand. Strategy and
Business, Second Quarter, no. 11. [Online]. Available WWW: www.strategy-
business.com/article/16333?gko=7a2df&tid=27782251&pg=all (Accessed 15
January 2012).
Hoyer, W.D. & MacInnis, D.J. 1997.Consumer Behavior .Houghton Mifflin
Company, Boston.
Industry Overview - South African Fuel Industry. 2011. [Online]. Available WWW:
http://www.sapia.co.za/industry-overview/fuel-industry.html (Accessed 15 March
2011).
Jacoby, J. & Chestnut, R. 1978. Brand Loyalty Measurement and Management.
John Wiley & Sons, New York.
Jacoby, J. & Kyner, D. B. 1973. Brand loyalty versus repeat purchasing behavior.
95
Journal of Marketing Research, vol. 10, no. 1, pp. 1 – 9.
Kabiraj, S. & Shanmugan, J. 2011. Development of a conceptual framework for
brand loyalty: A Euro-Mediterranean perspective. Journal of Brand Management,
vol. 18, no. 4/5, pp. 285-299.
Kahn, B. E. & Louie, T. E. 1990. Effects of retraction of price promotions on brand
choice behavior for variety-seeking and last-purchase-loyal consumers.
Journal of Marketing Research, vol. 27, no. 3, pp. 279 – 289.
Kahn, B. E. & Meyer, R. 1989. Modelling Customer Loyalty: A Customer-Based
Source of Competitive Advantage. The Interface of Marketing and Strategy,
JAI Press.
Kapferer, J. 2008. The New Strategic Brand Management. Kogan Page Limited,
London.
Kay, M.J. 2006. Strong brands and corporate brands. European Journal of
Marketing, vol. 40, no. 7, pp. 742-760.
Keller, K. L. 2003. Strategic Brand Management. Pearson Education Inc, New
Jersey.
Koch, R.1994. The Financial Times A-Z of Management and Finance. Pitman,
London.
Koekemoer L., Blem N., Duckles R., Skinner C. & van der Westhuizen B.1998.
Promotional Strategy Marketing Communication in Practice. Juta & Co. Ltd,
Kenwyn.
Kotler, P., Armstrong, G., Saunders, J., & Wong, V.1996. Principles of Marketing.
Pearson Education International, Hemel Hempstead.

96
Kotler, P. 1988. Marketing Management: Analysis, Planning and Control. Pearson
Education International, New Jersey.
Kotler, P. 2003. Marketing Management. Pearson Education International, New
Jersey.
Kotler, P. & Armstrong, G. 2010. Principles of Marketing: Global and Southern
African Perspectives. Pearson Education, Cape Town.
Lofstock, J. 2003. At Your Service. Convenience Store News, vol. 39, no. 14.
[Online]. Available WWW: www.web.ebscohost.com/ehost (Accessed 10 October
2011).
Loyalty programs reign in the rewards. 2005. [Online]. Available WWW:
http://marketingx.co.za/article.aspx?pklarticleid=3419 (Accessed 20120103).
Maleka, E.M., Mashimbye, L.M. & Goyns, P. 2010. South African Energy Synopsis
2010. Department of Energy Information Management, Process Design and
Publications. [Online].Available WWW:
www.energy.gov.za/files/media/explained/2010/South_African_Energy_Synopsis_
2010.pdf (Accessed 3 February 2011).
Marquardt, I. A.1989.The Link between Total Quality Improvement and Market
Orientation, in Guiry M. Quality and Customer Service: The Critical Focus for a
Firm. Marketing Science Institute Conference. Cambridge, Massachusetts.
McPhee, W.M.1963. Formal Theories of Mass Behavior. Free Press, New York.
Mellens, M., Dekimpe, M.G., & Steenkamp, J.B.E.M.1996. A review of brand
loyalty measures in marketing. Tijdschrift voor Economie en Management, vol. 41,
no. 4, pp. 507-533.

97
Miller, S. & van Meelis, T. 2005. International relations in the oil industry in South
Africa. [Online]. Available WWW: http://www.ilo.org/wcmsp5/groups/public/---
ed_dialogue/---sector/documents/publication/ (Accessed 18 September 2011).
Mlonzi, L.L. 1996. An empirical investigation into consumer perceptions of service
quality at petrol service stations in black areas of the Cape Peninsula. MEcon
dissertation. University of Western Cape, Bellville.
MTN8 Final goes to Durban. 2010. [Online]. Available WWW:
www.psl.co.za/article.asp?id=373281 (Accessed 15 July 2012).
Newman, J. W. & Werbel, R. A. 1973. Multivariate analysis of brand loyalty for
major household appliances. Journal of Marketing Research, vol. 10, no. 4, pp.
404 – 409.
Oil and Gas in South Africa-History .2011. [Online]. Available WWW:
www.mbendi.com/indy/oilg/af/sa/p0010.htm (Accessed 17 September 2011).
Oliver, R. L. 1999. Whence consumer loyalty? Journal of Marketing, vol. 63,
special issue, pp. 33 – 44.
Oliver, R. L. 1993. Cognitive, affective, and attribute bases of the satisfaction
response. Journal of Consumer Research, vol. 20, no. 3, pp. 418-430.
Oliver, R. L. 1997. Satisfaction: A Behavioral Perspective on the Consumer.
McGraw-Hill, Boston.
Outcomes of the National Energy Summit.2007. [Online]. Available WWW:
www.energy.gov.za/files/esources/petroleum/Energy%20Summit%20Booklet%20_
Word_.pdf (Accessed 12 April 2011).

98
Pearson, S. 1996. Building Brands Directly. University Press, New York.
Pederson, P. E. & Nysveen, H. 2001. Shopbot banking: an exploratory study of
customer loyalty effects. International Journal of Bank Marketing, vol. 19, no. 4/5,
pp. 146 – 155.
PetroSA Historic Milestones. 2011. [Online]. Available WWW:
http://www.petrosa.co.za/history.php (Accessed 15 March 2011).
Power, C. 1992. Smart Selling: How Companies Are Winning over Today’s
Tougher Customer. Business Week, vol. 46, no.3, pp. 22-23.
Project Mthombo . 2011. [Online]. Available WWW:
www.petrosa.co.za/project_mthombo.php. (Accessed 21 May 2011).
Reichheld, F.F.1996. The Loyalty Effect. [Online]. Available WWW.
www.loyaltyrules.com/loyaltyrules/BB_Loyalty_effect_essay_4_Forces_loyalty_ch
aos.pdf (Accessed 13 May 2011).
Riley, F.D., Ehrenberg A.S.C., Castleberry, S.B., Barwise, T.P. &. Barnard, N.R.
1997. The variability of attitudinal repeat-rates. International Journal of Research
in Marketing, vol.14, no. 5, pp. 437-450.
Rosen, D.L. & Olshavsky, R.W.1987. A Protocol Analysis of Brand Choice
Strategies Involving Recommendations. Journal of Consumer Research, vol. 14,
no. 3, pp. 440-444.
Rothschild, M.L. & Gaidis, W.C.1981.Behavioral Learning Theory: Its Relevance to
Marketing and Promotions. Journal of Marketing, vol. 45, no. 2, pp. 70-78.
Schultz, D. & Bailey, S. 2000. Customer / brand loyalty in an interactive
marketplace. Journal of Advertising Research, vol. 40, no. 3, pp. 41 – 53.

99
Soccer Development. 2012. [Online]. Available WWW:
www.total.co.za/Os/ossouthafrica.nsf/VS_OPM/ (Accessed 21 January 2012)
Sonnier, G. & Ainslie, A. 2011. Estimating the Value of Brand –Image
Associations: The role of General and Specific Brand Image. Journal of Marketing
Research, vol. 48, no. 3, pp. 518 –531.
South African Petroleum Industry Association. 2005. Annual Report. [Online].
Available WWW: www.sapia.co.za/publications/annual-reports.html. (Accessed 2
March 2011).
South African Petroleum Industry Association. 2010. Annual Report. [Online].
Available WWW: www.sapia.co.za/publications/annual-reports.html. (Accessed 28
May 2011).
Sports Sponsorships. 2012. [Online]. Available WWW:
http://www.engen.co.za/home/apps/content/Sponsorship/ (Accessed 21 January
2012).
Spreng, R.A. & Mackoy, R.D. 1996. An empirical examination of a model of
perceived service quality and satisfaction. Journal of Retailing, vol. 72, no. 2, pp.
201-14.
Spreng, R.A., & Olshavsky, R.W. 1992. A desires-as-standard model of consumer
satisfaction: implications for measuring satisfaction. Journal of Consumer
Satisfaction, Dissatisfaction and Complaining Behaviour, vol. 6, no. 5, pp. 45-54.
Srivastava, M & Kamdar, R.M. 2009. Brand Image Formation as a function of
involvement and familiarity. The Journal of Indian Management and Strategy, vol.
14, no. 4, pp. 4-10.
100
Sunders, M., Lewis, P. & Thornhill, A. 2003. Research Methods for Business
Students. Pearson Education Limited, Harlow.
Terry. M. & Frank, V. 1990.Consumer power in free market. Creda Press, Cape
Town.
Thompson A.A., Strickland A.J., & Gamble J. E. 2005. Crafting and Executing
Strategy. McGraw Hill Irwin, New York.
Total Motorsport. 2012. [Online]. Available WWW: http://www.totalmotorsport.co.za
(Accessed 21 January 2012).
Total Promotions. 2012. [Online]. Available WWW:
www.total.co.za/Os/ossouthafrica.nsf/VS_OPM/ (Accessed 21 January 2012)
Traylor, M. B. 1981. Product involvement and brand commitment: Not necessarily
the same. Journal of Advertising Research, vol. 21, no. 6, pp. 51 – 56.
Traylor, M. B. 1983. Ego involvement and brand commitment: Not necessarily the
same. Journal of Consumer Marketing, vol. 1, no. 2, pp. 75 – 79.
Tucker, W. T. 1964.The Development of Brand Loyalty. Journal of Marketing
Research, vol.1, no. 3, pp. 32-35.
Uncles, M. D., Dowling, G. R., & Hammond, K. 2003. Customer Loyalty and
Customer loyalty programs. Journal of Consumer Marketing, vol. 20, no. 4, pp.
294-316.
Waddell, H .1995. Getting a straight answer. Marketing Research, vol. 7, no. 3, pp.
4 – 9.
Watkins, T. 1986. The economics of the brand. McGraw Hill Book Company,

101
Maidenhead.
White, B. 2002. Writing your MBA dissertation. Continuum, London.
White Paper on Renewable Energy of the Republic of South Africa. 2003. [Online].
Available WWW:
http://unfccc.int/files/meetings/seminar/application/pdf/sem_sup1_south_africa.pdf
(Accessed 7 April 2011).
White Paper on Renewable Energy of the Republic of South Africa. 1998. [Online].
Available WWW:
http://unfccc.int/files/meetings/seminar/application/pdf/sem_sup1_south_africa.pdf
(Accessed 7 April 2011).
Woolworths Food Stops are convenience destinations in South Africa .2010.
[Online]. Available WWW:
www.globalcstorefocus.com/cgibin/newsletter.pl?edition=201011&this_page=2
(Accessed 4 January 2012).
Zeithaml, V. A., Berry, L. L., & Parasuraman, A. 1993. Delivering quality service:
Balancing customer perceptions and expectations. New York Free Press, New
York.
Zikmund W.G., Babin, B.J., Carr, J.C. & Griffin, M. 2010. Business Research
Methods. Cengage Learning, South-Western.
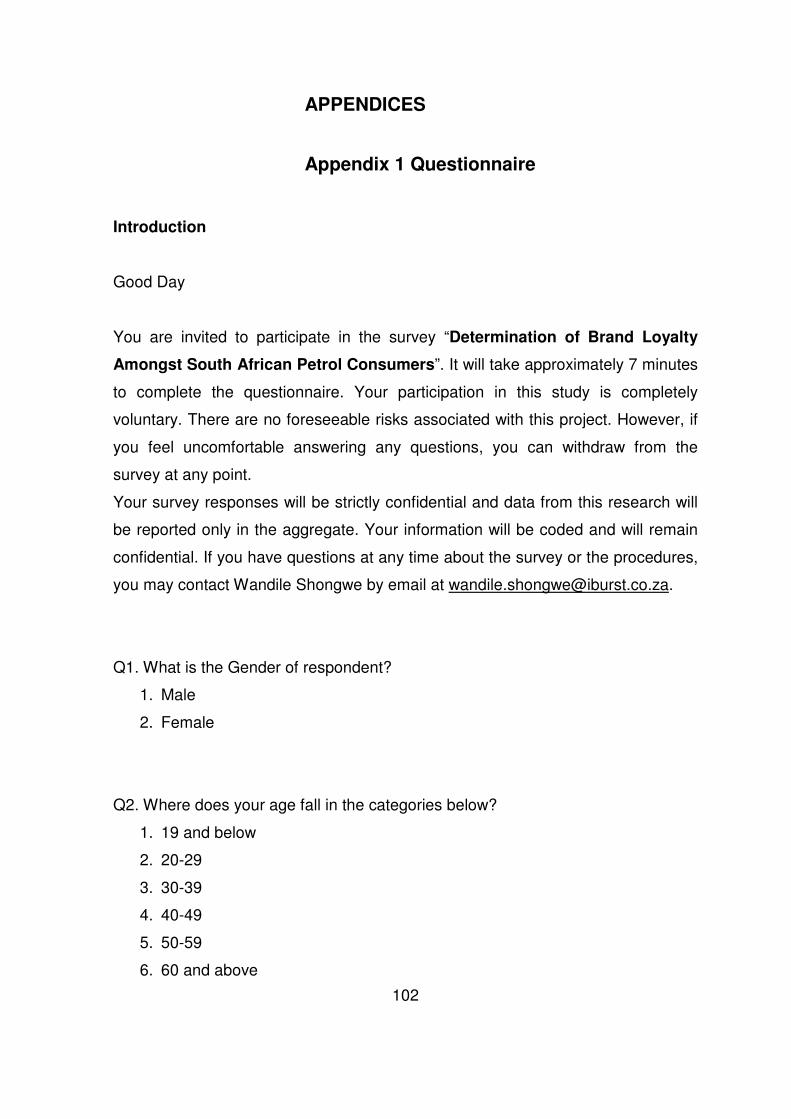
102
APPENDICES
Appendix 1 Questionnaire
Introduction
Good Day
You are invited to participate in the survey “Determination of Brand Loyalty
Amongst South African Petrol Consumers”. It will take approximately 7 minutes
to complete the questionnaire. Your participation in this study is completely
voluntary. There are no foreseeable risks associated with this project. However, if
you feel uncomfortable answering any questions, you can withdraw from the
survey at any point.
Your survey responses will be strictly confidential and data from this research will
be reported only in the aggregate. Your information will be coded and will remain
confidential. If you have questions at any time about the survey or the procedures,
you may contact Wandile Shongwe by email at [email protected].
Q1. What is the Gender of respondent?
1. Male
2. Female
Q2. Where does your age fall in the categories below?
1. 19 and below
2. 20-29
3. 30-39
4. 40-49
5. 50-59
6. 60 and above

103
Q3. Is there a Petrol station brand that you prefer?
1. Yes
2. No
3. Not Sure
Q4. Amongst the petrol brands below which brand would you prefer to fill?
1. BP
2. Caltex
3. Engen
4. Sasol
5. Shell
6. Total
7. None
8. Other-(Please Specify)...........................................
Q5. You always fill the same brand of petrol
Strongly
Disagree
Disagree Neutral Agree Strongly
Agree
1❏ 2❏ 3❏ 4❏ 5❏
Q6. You would buy the same brand even if you are in a hurry and the station is out
of your way
Strongly
Disagree
DisagreeNeutral Agree Strongly
Agree
1❏ 2❏ 3❏ 4❏ 5❏

104
Q7. You use any other brands of petrol
Strongly
Disagree
Disagree Neutral Agree Strongly
Agree
1❏ 2❏ 3❏ 4❏ 5❏
Q8.How likely are you to recommend your preferred brand to other people?
Very
Unlikely
Not
likely
Neutral Likely Very
Likely
1❏ 2❏ 3❏ 4❏ 5❏
Q9.Advertising influences the choice of the Petrol brand that you use
Strongly
Disagree
Disagree Neutral Agree Strongly
Agree
1❏ 2❏ 3❏ 4❏ 5❏
Q10. The decision to purchase petrol in your preferred filling station is influenced
by the presence of the following:
1. Convenience Shop
2. Restaurant
3. ATM
4. Lotto Ticket Sales
5. Car Wash
6. Other-(Please Specify)....................................

105
Q11. Loyalty programs such as Car wash Vouchers or points gained when filling
petrol makes you use the same brand of petrol.
Strongly
Disagree
DisagreeNeutral Agree Strongly
Agree
1❏ 2❏ 3❏ 4❏ 5❏
Q12. Good Customer Service received from a particular petrol station makes you
come back to fill petrol.
Strongly
Disagree
Disagree Neutral Agree Strongly
Agree
1❏ 2❏ 3❏ 4❏ 5❏
Q13. Petrol attendant staff is trained in giving good service.
Strongly
Disagree
Disagree Neutral Agree Strongly
Agree
1❏ 2❏ 3❏ 4❏ 5❏
Q14.Cleanliness at filling stations is important.
Strongly
Disagree
Disagree Neutral Agree Strongly
Agree
1❏ 2❏ 3❏ 4❏ 5❏

106
Q15. Quality of the petrol brand is an important factor when purchasing petrol
Strongly
Disagree
Disagree Neutral Agree Strongly
Agree
1❏ 2❏ 3❏ 4❏ 5❏
.
Q16. Conducting customer satisfaction surveys would help improve service
conditions at the petrol stations
Strongly
Disagree
Disagree Neutral Agree Strongly
Agree
1❏ 2❏ 3❏ 4❏ 5❏
Q17. Promotions run by petrol stations are beneficial.
Strongly
Disagree
Disagree Neutral Agree Strongly
Agree
1❏ 2❏ 3❏ 4❏ 5❏
Q18. Please indicate below the person who owns the vehicle that you are driving.
1. You
2. Spouse
3. Your Company
4. Rental Company
5. Other
107
Appendix 2 Ethical Clearance

108