
University of Huddersfield...
10
University of Huddersfield Repository Abdalla, Gaballa, Tian, Xiange, Zhen, Dong, Gu, Fengshou and Ball, Andrew Misalignment diagnosis of a planetary gearbox based on vibration analysis Original Citation Abdalla, Gaballa, Tian, Xiange, Zhen, Dong, Gu, Fengshou and Ball, Andrew (2014) Misalignment diagnosis of a planetary gearbox based on vibration analysis. In: 21st International Congress on Sound and Vibration, 13th - 17th July, 2014, Beijing, China. This version is available at http://eprints.hud.ac.uk/id/eprint/21927/ The University Repository is a digital collection of the research output of the University, available on Open Access. Copyright and Moral Rights for the items on this site are retained by the individual author and/or other copyright owners. Users may access full items free of charge; copies of full text items generally can be reproduced, displayed or performed and given to third parties in any format or medium for personal research or study, educational or not-for-profit purposes without prior permission or charge, provided: • The authors, title and full bibliographic details is credited in any copy; • A hyperlink and/or URL is included for the original metadata page; and • The content is not changed in any way. For more information, including our policy and submission procedure, please contact the Repository Team at: [email protected]. http://eprints.hud.ac.uk/
Transcript of University of Huddersfield...
University of Huddersfield Repository
Abdalla, Gaballa, Tian, Xiange, Zhen, Dong, Gu, Fengshou and Ball, Andrew
Misalignment diagnosis of a planetary gearbox based on vibration analysis
Original Citation
Abdalla, Gaballa, Tian, Xiange, Zhen, Dong, Gu, Fengshou and Ball, Andrew (2014) Misalignment diagnosis of a planetary gearbox based on vibration analysis. In: 21st International Congress on Sound and Vibration, 13th 17th July, 2014, Beijing, China.
This version is available at http://eprints.hud.ac.uk/id/eprint/21927/
The University Repository is a digital collection of the research output of theUniversity, available on Open Access. Copyright and Moral Rights for the itemson this site are retained by the individual author and/or other copyright owners.Users may access full items free of charge; copies of full text items generallycan be reproduced, displayed or performed and given to third parties in anyformat or medium for personal research or study, educational or notforprofitpurposes without prior permission or charge, provided:
• The authors, title and full bibliographic details is credited in any copy;• A hyperlink and/or URL is included for the original metadata page; and• The content is not changed in any way.
For more information, including our policy and submission procedure, pleasecontact the Repository Team at: [email protected].
http://eprints.hud.ac.uk/
MISALIGNMENT DIAGNOSIS OF A PLANETARY GEARBOX BASED ON VIBRATION ANALYSIS
Gaballa M Abdalla, Xiange Tian, Dong Zhen, Fengshou Gu and Andrew Ball
Centre for Efficiency and Performance Engineering, University of Huddersfield, Huddersfield, UK
e-mail:Gaballa Abdalla @hud.ac.uk.* [email protected]..
Zhi Chen
Department of Vehicle Engineering, Taiyuan University of Technology
Taiyuan, Shanxi Province, P.R. China
As a critical power transmission system, planetary gearbox is widely used in many industrial
important machines such as wind turbines, aircraft turbine engines, helicopters. Early fault detection
and diagnosis of the gearbox will help to prevent unexpected breakdowns of this important equip-
ment. Misalignment is one of the major operating problems in the planetary gearbox which may be
caused by inadequate system integration, variable operating conditions and differences of elastic
deformations in the system. In this paper, the effect of varying degrees of installation misalignment
of planetary gearbox are investigated based on vibration measurements using spectrum analysis and
modulation signal bispectrum (MSB) analysis. It has shown that the misalignment can be diagnosed
in the low frequency range in which the adverse effect due to co-occurrence of amplitude modula-
tion and frequency modulation (AM-FM) effect is low compared with the components around
meshing frequencies. Moreover, MSB produces a more accurate and reliable diagnosis in that it
gives correct indication of the fault severity and location for all operating conditions. In contrast,
spectrum can produce correct results for some of the operating conditions.
Keywords: Planetary gearbox, Condition Monitoring, Misalignment, Modulation signal bispectrum.
1. Introduction
The epicycle gearboxes or planetary gearboxes are widely used as important power transmis-
sion systems in critical machines such as wind turbine and helicopters. Because of multiple load
paths of planetary gearing, the horsepower transmitted is divided between several planet meshes.
Moreover, planetary stages can also be linked together efficiently to achieve high reduction ratios in
a minimum space. Because of planetary gearbox compactness, their systems offer significant enve-
lope and weight savings. They have reduced noise, vibration, and improved efficiency due to small-
er, stiffer components. Since the output shaft axes and input shaft axes are concentric, they are ef-
fective in transmitting torque. Therefore, there are trends toward increased utilization of planetary
gearboxes for industrial applications1.
Because of the criticalness of planetary gearbox associated applications, condition monitoring
of planetary gearbox has received significant attention by many researchers. As shown in the gen-
eral review paper by Leia et al2, considerable works have been carried out on the investigation of
vibration characteristics for monitoring various faults including gear pitting, crack and wear. In ad-
dition, many different signal processing methods in the time domain, frequency domain, time-
frequency domain and advanced intelligent methods have been applied to analyse the complicated
vibration signal for defining accurate and reliable diagnostic features.
However, it has noticed that little research has been done in developing methods for monitor-
ing misalignment which is deemed as the second most commonly observed disturbance source in
rotor systems3.Moreover, many signal processing methods applied are with insufficient considera-
tion in characterising the modulation characteristics although the modulation effects in planetary
gearbox is acceptable as one of the most important sources of vibration due to defects in gears4-
8Especially, both AM and FM are taken into account in developing vibration signal models in refer-
ence7
but the effect on spectrum structure has not been examined in analysing the measured signals
for fault diagnosis.
To fill these gaps, this paper investigates the effect of varying degrees misalignment on vibra-
tion spectra of a planetary gearbox system to develop more reliable methods for diagnosing the
faults. In addition to popular spectrum analysis methods in characterising the vibration signals, a
modulation signal bispectrum (MSB), which is particularly effective in capturing the weak modula-
tions in motor current signals for fault diagnosis 9, is also used to understand the AM-FM effects
and to enhance feature components for the detection and diagnosis of the misalignment at different
speeds and loads.
2. Planetary Gearbox Vibrations and MSB Analysis
2.1 Characteristic Frequencies for Diagnosis
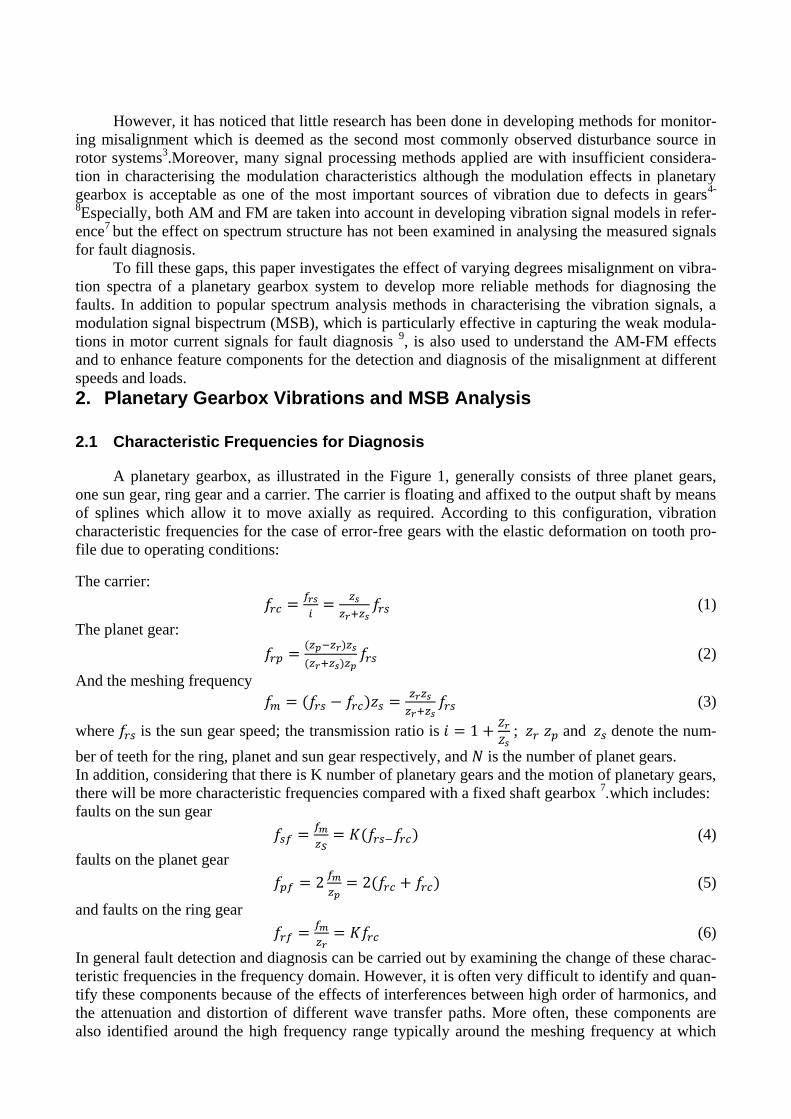
A planetary gearbox, as illustrated in the Figure 1, generally consists of three planet gears,
one sun gear, ring gear and a carrier. The carrier is floating and affixed to the output shaft by means
of splines which allow it to move axially as required. According to this configuration, vibration
characteristic frequencies for the case of error-free gears with the elastic deformation on tooth pro-
file due to operating conditions:
The carrier:
(1)
The planet gear:
(2)
And the meshing frequency
(3)
where is the sun gear speed; the transmission ratio is
; and denote the num-
ber of teeth for the ring, planet and sun gear respectively, and is the number of planet gears.
In addition, considering that there is K number of planetary gears and the motion of planetary gears,
there will be more characteristic frequencies compared with a fixed shaft gearbox 7.which includes:
faults on the sun gear
(4)
faults on the planet gear
(5)
and faults on the ring gear
(6)
In general fault detection and diagnosis can be carried out by examining the change of these charac-
teristic frequencies in the frequency domain. However, it is often very difficult to identify and quan-
tify these components because of the effects of interferences between high order of harmonics, and
the attenuation and distortion of different wave transfer paths. More often, these components are
also identified around the high frequency range typically around the meshing frequency at which
the characteristic components are modulated to and acceleration measurement systems are more
sensitive to.
Input shaft Output shaft
Planet gear
Sun gear
Ring gear
Carrier
Figure 1.Schematic of a planetary gearbox with the standstill ring gear
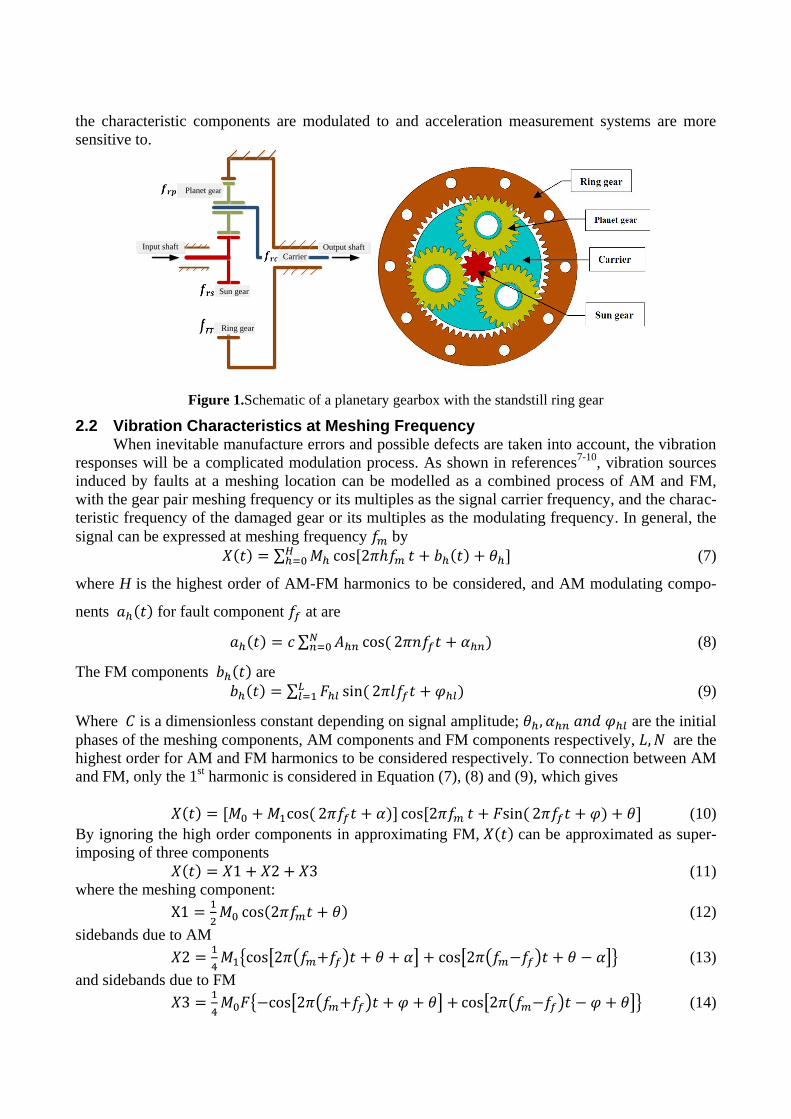
2.2 Vibration Characteristics at Meshing Frequency When inevitable manufacture errors and possible defects are taken into account, the vibration
responses will be a complicated modulation process. As shown in references7-10
, vibration sources
induced by faults at a meshing location can be modelled as a combined process of AM and FM,
with the gear pair meshing frequency or its multiples as the signal carrier frequency, and the charac-
teristic frequency of the damaged gear or its multiples as the modulating frequency. In general, the
signal can be expressed at meshing frequency by
∑ (7)
where H is the highest order of AM-FM harmonics to be considered, and AM modulating compo-
nents for fault component at are
∑ (8)
The FM components are
∑ (9)
Where is a dimensionless constant depending on signal amplitude; are the initial
phases of the meshing components, AM components and FM components respectively, are the
highest order for AM and FM harmonics to be considered respectively. To connection between AM
and FM, only the 1st harmonic is considered in Equation (7), (8) and (9), which gives
(10)
By ignoring the high order components in approximating FM, can be approximated as super-
imposing of three components
(11)
where the meshing component:
(12)
sidebands due to AM
{ [ ( ) ] [ ( ) ]} (13)
and sidebands due to FM
{ [ ( ) ] [ ( ) ]} (14)
It shows that the amplitude of sidebands is the vector sum of AM and FM components. As the
phases will always changes with operating conditions the sideband components will asymmetrically
distributed around the meshing frequency, which can be one of important causes of sideband
asymmetry in addition to sensor position effects shown in reference10
. For example, the upper side-
band may disappear completely when the phase is opposite whereas the lower sideband would be
doubled. This shows that the sideband will be asymmetric and can be fluctuated largely with operat-
ing conditions and gear faults. In addition, these asymmetric effects will be distorted further by vi-
bration transmission paths. Therefore appropriate signal analysis methods need to be used to reduce
the effect for a reliable and accurate diagnostic feature.
2.3 Modulation Signal Bispectrum
According to the definition of MSB in the frequency domain, the meshing frequency and
sideband in a vibration signal can be correlated9as
(15)
where is the complex conjugate of the Fourier transform of acoustic signal ; and is
the statistical expectation operator. And the power spectrum of is
( ) [ ( ) ( )]
Equation(15) shows that through the operation of vector average in the frequency domain, MSB can
extract the combination of components at the meshing frequency, the lower sideband and the higher
sideband. In the meantime, other components including random noise and interfering components
that are not meet the phase relationship will be suppressed significantly. In this way the modulation
effects in acoustic signal can be represented more accurately and reliably. To examine the modulating components along, rather than that of the combination with the meshing
component, a MSB sideband estimator (MSB-SE) can be used according to (17)
(16)
Because of the magnitude in equation (17) is normalised the magnitude of the MSB-SE is only the
products of the lower and upper sideband, which reflects more the modulating component from
faults.In addition, MSB coherence (MSBC) defined in Equation (17) can be based on to estimate
the influences of random components and hence confirms the reliability of MSB peak detected
(17)
MSB coherence has boundary [0 1]. 1 means that MSB magnitude from true modulation effects. On
other hand a zero value means that the MSB magnitude is mainly from random noise influences.
Thus middle values of MSBC will indicate the reliability of MSB peaks. In addition, for a given
measurement environment, the noise is relative the same. The increase of MSBC can be an indica-
tor of modulation degree and used for detecting the presence of modulations.
3. Test Facilities and Experimental Setups 3.1 Test Facility
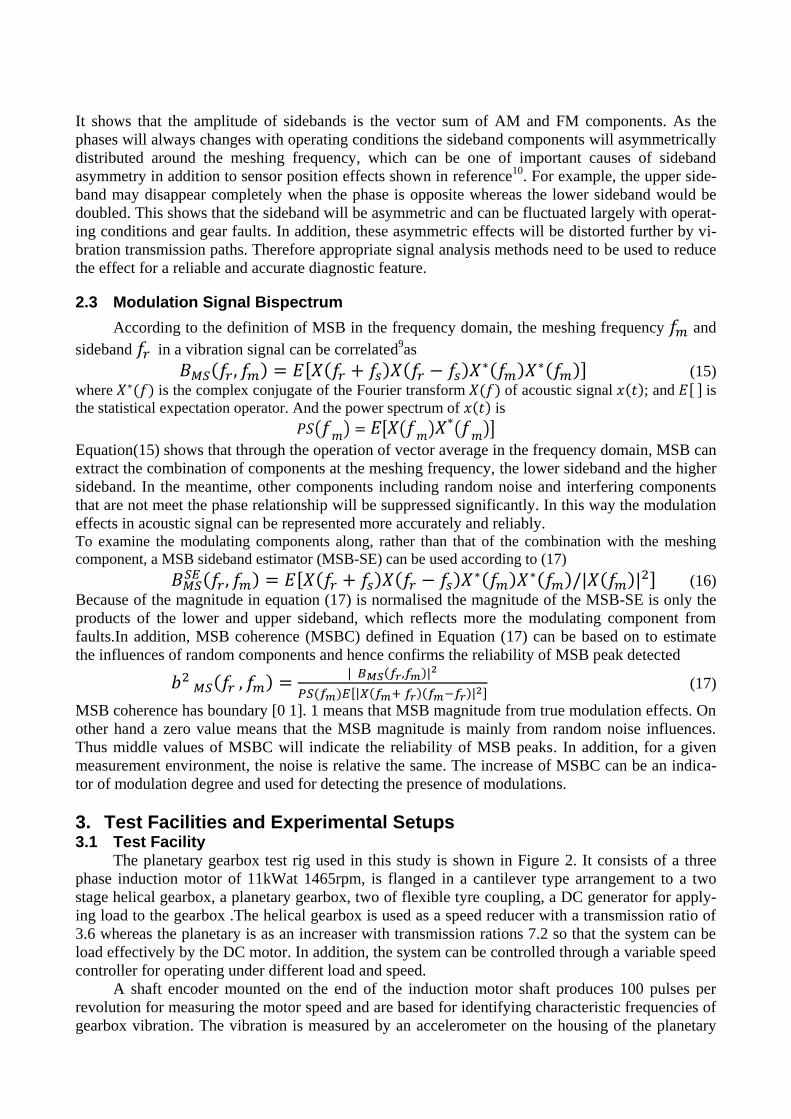
The planetary gearbox test rig used in this study is shown in Figure 2. It consists of a three
phase induction motor of 11kWat 1465rpm, is flanged in a cantilever type arrangement to a two
stage helical gearbox, a planetary gearbox, two of flexible tyre coupling, a DC generator for apply-
ing load to the gearbox .The helical gearbox is used as a speed reducer with a transmission ratio of
3.6 whereas the planetary is as an increaser with transmission rations 7.2 so that the system can be
load effectively by the DC motor. In addition, the system can be controlled through a variable speed
controller for operating under different load and speed.
A shaft encoder mounted on the end of the induction motor shaft produces 100 pulses per
revolution for measuring the motor speed and are based for identifying characteristic frequencies of
gearbox vibration. The vibration is measured by an accelerometer on the housing of the planetary
gearbox with the sensitivity of100 mv/g, and frequency response range is from 1HZ to 10 kHz. All
these data are logged simultaneously by a multiple channel high speed data acquisition system op-
erating at 100 kHz rate and 16bit resolution.
MOTOR H.G DC- GENERATOR
Encoder Accelerometer
RESISTOR BANK
AC
Controller
AC SourceData
Acquisition
Sysytem
Shims
P.G
Figure 2.Schematic diagram of planetary gearbox test facility
3.2 Test Procedure
To examine the influence of the operating condition on fault diagnosis performance the test
was carried out when the speed of the AC motor is at two speeds (30% and 40%). Because of the
transmission ratios the planetary gearbox will operates at 60% and 80 of its full speed correspond-
ingly. At each speed the system are load under five loads (0%, 25%, 50%, 75% and 90% of the full
load). These operating conditions will allow an exploration of different influences on vibration con-
tents for developing a reliable diagnosis method.
When all shafts in the system are aligned and checked using a dial-gauge method, a baseline
test was conducted to collect data under the designed operating conditions. Then the parallel misa-
lignment or vertical offset on the planetary gearbox was induced by adding shims underneath the
installation legs. Three tests were carried sequentially when the shim thickness is at 0.4mm, 0.7mm
and 1.0mm respectively, which allows three degrees of severity to be examined.
4. Results and Discussion
The vibration signals collected were processed with both MSB and power spectrum using fast
Fourier transform with a Hanning data windows of 524288 points, which achieved a frequency res-
olution of 0.1362Hz, allowing the carrier frequency to be differentiate sufficiently. In addition, an
average of 80 times is applied to obtain a more reliable spectrum by suppressing possible noise and
interfering components in MSB analysis.
4.1 Spectrum of Vibration Signals
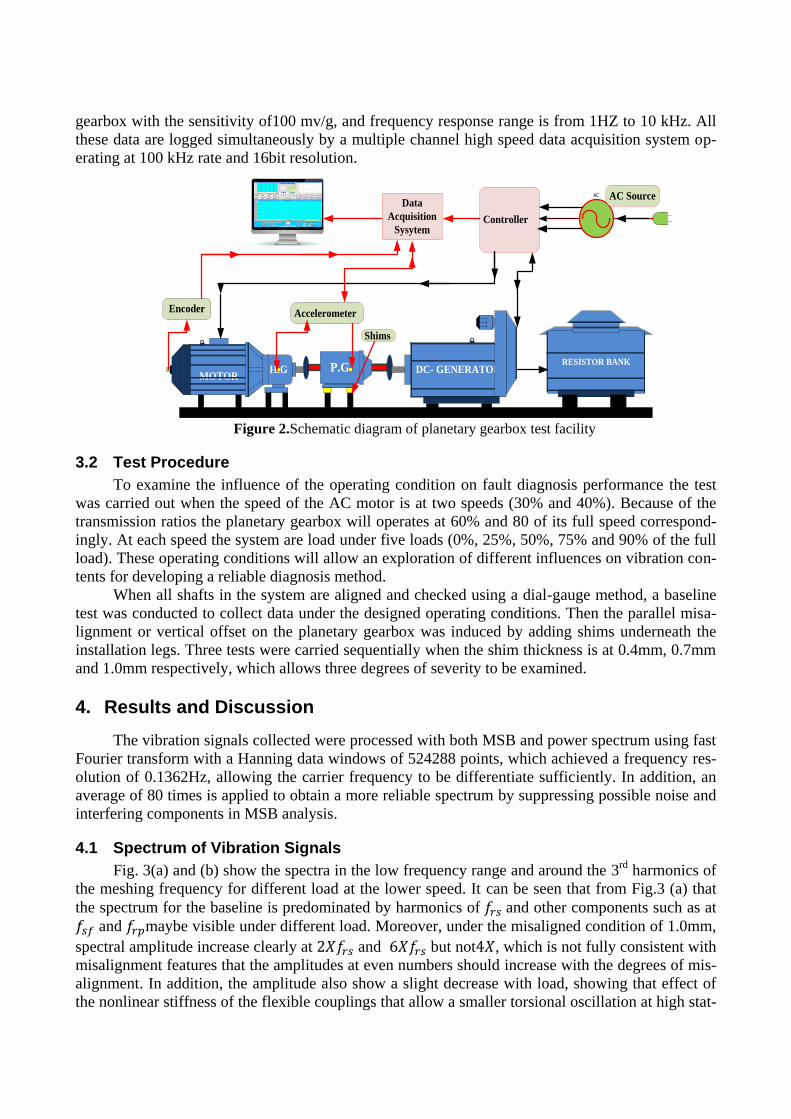
Fig. 3(a) and (b) show the spectra in the low frequency range and around the 3rd
harmonics of
the meshing frequency for different load at the lower speed. It can be seen that from Fig.3 (a) that
the spectrum for the baseline is predominated by harmonics of and other components such as at
and maybe visible under different load. Moreover, under the misaligned condition of 1.0mm,
spectral amplitude increase clearly at and but not , which is not fully consistent with
misalignment features that the amplitudes at even numbers should increase with the degrees of mis-
alignment. In addition, the amplitude also show a slight decrease with load, showing that effect of
the nonlinear stiffness of the flexible couplings that allow a smaller torsional oscillation at high stat-
ic load. For the similar reason the amplitude at is very small because it undertakes a load 7.2
time of that at the sun gear shaft.
(a) Spectrum in the low frequency range (b) Spectrum around 3rd
meshing frequency Figure 3. Baseline and misalignment vibration spectra under different loads
In the meantime, the spectrum sections around for the baseline case are generally high-
er than that of the low frequency range. Except for sidebands at ( ), it is difficult to iden-
tify other sideband patterns, indicating the AM-FM effects. Moreover, the differences between the
baseline and the misalignment is much smaller, compared that of the low frequency range. This
shows that the misalignment may cause a small effect on gear meshing processes due to the damp-
ing of key ways. In other words, this type of misalignment should be detected in the low frequency
range.
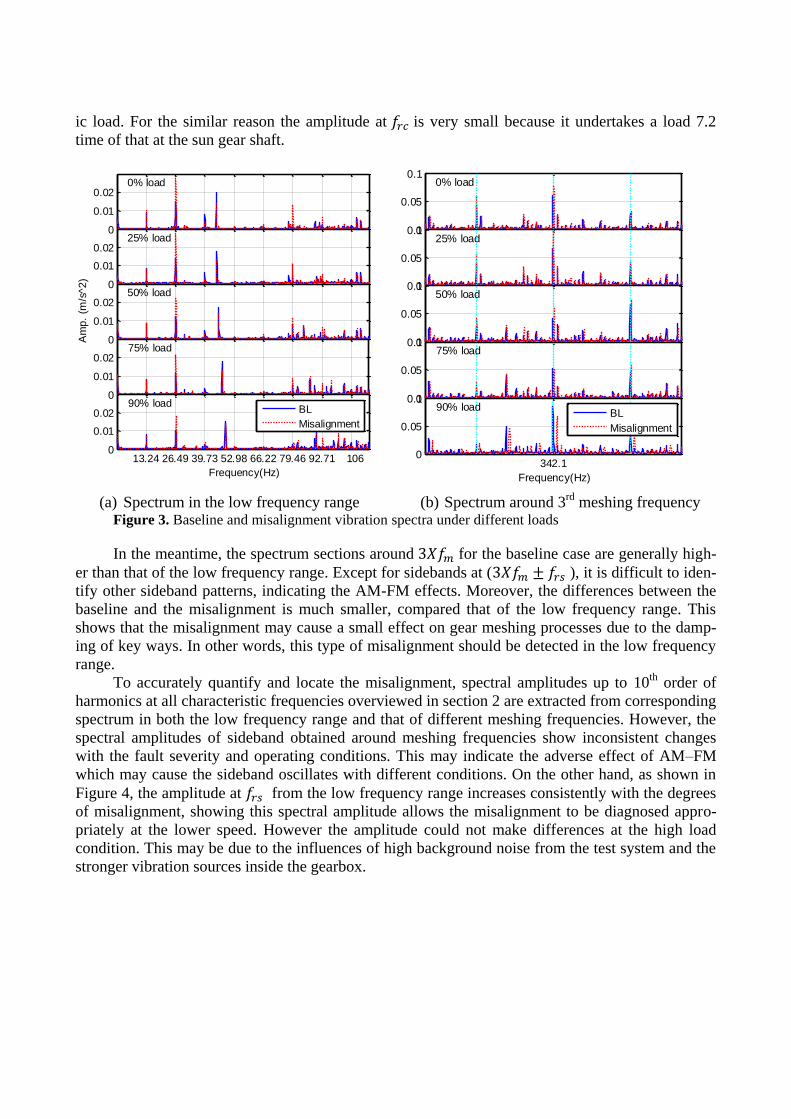
To accurately quantify and locate the misalignment, spectral amplitudes up to 10th
order of
harmonics at all characteristic frequencies overviewed in section 2 are extracted from corresponding
spectrum in both the low frequency range and that of different meshing frequencies. However, the
spectral amplitudes of sideband obtained around meshing frequencies show inconsistent changes
with the fault severity and operating conditions. This may indicate the adverse effect of AM–FM
which may cause the sideband oscillates with different conditions. On the other hand, as shown in
Figure 4, the amplitude at from the low frequency range increases consistently with the degrees
of misalignment, showing this spectral amplitude allows the misalignment to be diagnosed appro-
priately at the lower speed. However the amplitude could not make differences at the high load
condition. This may be due to the influences of high background noise from the test system and the
stronger vibration sources inside the gearbox.
0
0.01
0.020% load
0
0.01
0.0225% load
0
0.01
0.0250% load
Am
p.
(m/s
^2
)
0
0.01
0.0275% load
13.24 26.49 39.73 52.98 66.22 79.46 92.71 1060
0.01
0.0290% load
Frequency(Hz)
BL
Misalignment
0
0.05
0.10% load
0
0.05
0.125% load
0
0.05
0.150% load
Am
p.
(m/s
^2
)0
0.05
0.175% load
342.10
0.05
0.190% load
Frequency(Hz)
BL
Misalignment
(a)Spectra amplitudes of characteristic frequencies
at lower speed (b)Spectral amplitudes of characteristic frequencies
at higher speed
Figure 4 Diagnosis of misalignment by spectral amplitudes for different load and speed
In addition, at the lower speed, amplitudes at and also show higher amplitudes under low
loads, compared with that of baseline case. These changes may lead to incorrect diagnosis results that faults
also occur or influences on the planetary gears.
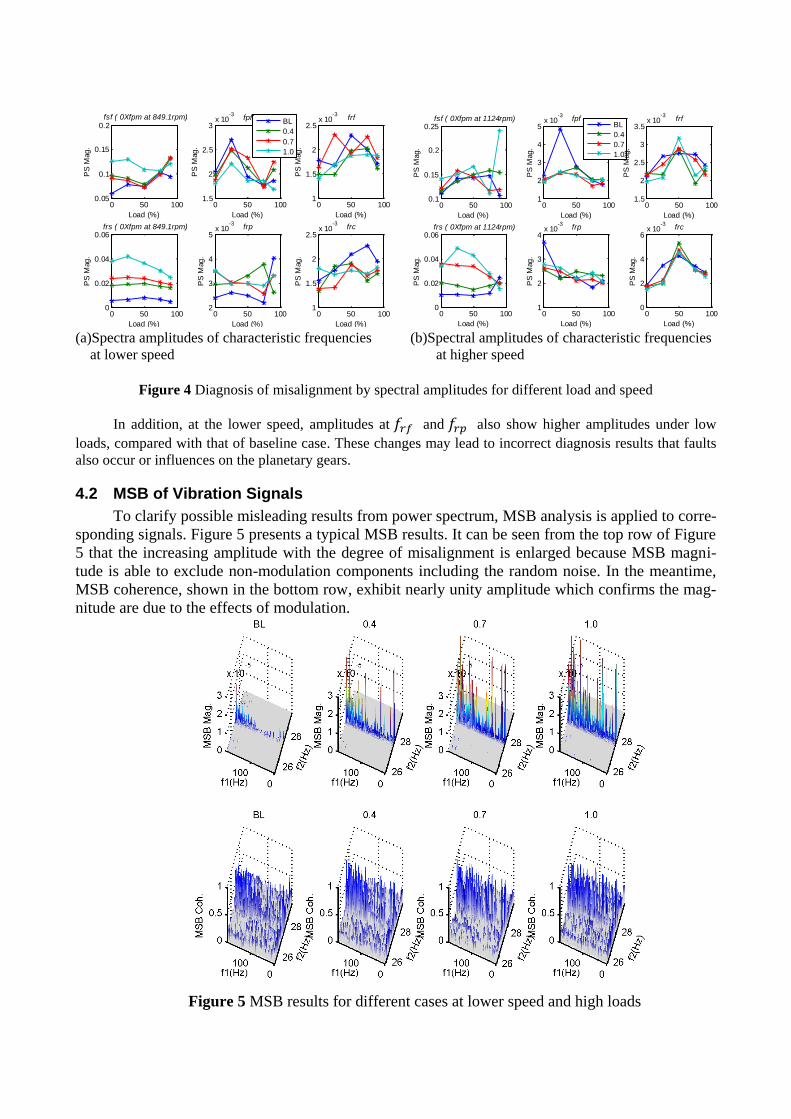
4.2 MSB of Vibration Signals
To clarify possible misleading results from power spectrum, MSB analysis is applied to corre-
sponding signals. Figure 5 presents a typical MSB results. It can be seen from the top row of Figure
5 that the increasing amplitude with the degree of misalignment is enlarged because MSB magni-
tude is able to exclude non-modulation components including the random noise. In the meantime,
MSB coherence, shown in the bottom row, exhibit nearly unity amplitude which confirms the mag-
nitude are due to the effects of modulation.
Figure 5 MSB results for different cases at lower speed and high loads
0 50 1000.05
0.1
0.15
0.2fsf ( 0Xfpm at 849.1rpm)
Load (%)
PS
Mag
.
0 50 1001.5
2
2.5
3x 10
-3fpf
Load (%)
PS
Mag
.
BL
0.4
0.7
1.0
0 50 1001
1.5
2
2.5x 10
-3frf
Load (%)
PS
Mag
.
0 50 1000
0.02
0.04
0.06frs ( 0Xfpm at 849.1rpm)
Load (%)
PS
Mag
.
0 50 1002
3
4
5x 10
-3frp
Load (%)
PS
Mag
.
0 50 1001
1.5
2
2.5x 10
-3frc
Load (%)
PS
Mag
.
0 50 1000.1
0.15
0.2
0.25fsf ( 0Xfpm at 1124rpm)
Load (%)
PS
Mag
.
0 50 1001
2
3
4
5x 10
-3fpf
Load (%)
PS
Mag
.
BL
0.4
0.7
1.0
0 50 1001.5
2
2.5
3
3.5x 10
-3frf
Load (%)
PS
Mag
.
0 50 1000
0.02
0.04
0.06frs ( 0Xfpm at 1124rpm)
Load (%)
PS
Mag
.
0 50 1001
2
3
4x 10
-3frp
Load (%)
PS
Mag
.
0 50 1000
2
4
6x 10
-3frc
Load (%)
PS
Mag
.
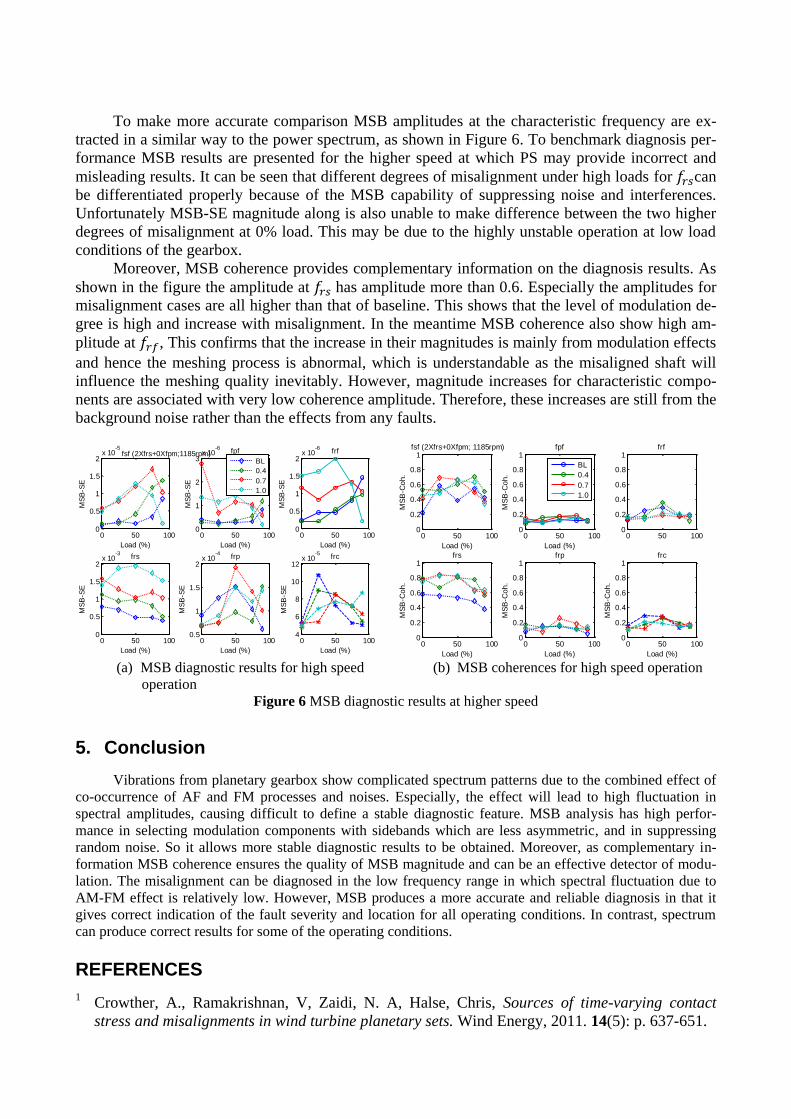
To make more accurate comparison MSB amplitudes at the characteristic frequency are ex-
tracted in a similar way to the power spectrum, as shown in Figure 6. To benchmark diagnosis per-
formance MSB results are presented for the higher speed at which PS may provide incorrect and
misleading results. It can be seen that different degrees of misalignment under high loads for can
be differentiated properly because of the MSB capability of suppressing noise and interferences.
Unfortunately MSB-SE magnitude along is also unable to make difference between the two higher
degrees of misalignment at 0% load. This may be due to the highly unstable operation at low load
conditions of the gearbox.
Moreover, MSB coherence provides complementary information on the diagnosis results. As
shown in the figure the amplitude at has amplitude more than 0.6. Especially the amplitudes for
misalignment cases are all higher than that of baseline. This shows that the level of modulation de-
gree is high and increase with misalignment. In the meantime MSB coherence also show high am-
plitude at , This confirms that the increase in their magnitudes is mainly from modulation effects
and hence the meshing process is abnormal, which is understandable as the misaligned shaft will
influence the meshing quality inevitably. However, magnitude increases for characteristic compo-
nents are associated with very low coherence amplitude. Therefore, these increases are still from the
background noise rather than the effects from any faults.
(a) MSB diagnostic results for high speed operation
(b) MSB coherences for high speed operation
Figure 6 MSB diagnostic results at higher speed
5. Conclusion
Vibrations from planetary gearbox show complicated spectrum patterns due to the combined effect of
co-occurrence of AF and FM processes and noises. Especially, the effect will lead to high fluctuation in
spectral amplitudes, causing difficult to define a stable diagnostic feature. MSB analysis has high perfor-
mance in selecting modulation components with sidebands which are less asymmetric, and in suppressing
random noise. So it allows more stable diagnostic results to be obtained. Moreover, as complementary in-
formation MSB coherence ensures the quality of MSB magnitude and can be an effective detector of modu-
lation. The misalignment can be diagnosed in the low frequency range in which spectral fluctuation due to
AM-FM effect is relatively low. However, MSB produces a more accurate and reliable diagnosis in that it
gives correct indication of the fault severity and location for all operating conditions. In contrast, spectrum
can produce correct results for some of the operating conditions.
REFERENCES
1 Crowther, A., Ramakrishnan, V, Zaidi, N. A, Halse, Chris, Sources of time-varying contact
stress and misalignments in wind turbine planetary sets. Wind Energy, 2011. 14(5): p. 637-651.
0 50 1000
0.5
1
1.5
2x 10
-5fsf (2Xfrs+0Xfpm;1185rpm)
Load (%)
MS
B-S
E
0 50 1000
1
2
3x 10
-6fpf
Load (%)
MS
B-S
E
BL
0.4
0.7
1.0
0 50 1000
0.5
1
1.5
2x 10
-6frf
Load (%)
MS
B-S
E
0 50 1000
0.5
1
1.5
2x 10
-3frs
Load (%)
MS
B-S
E
0 50 1000.5
1
1.5
2x 10
-4frp
Load (%)
MS
B-S
E
0 50 1004
6
8
10
12x 10
-5frc
Load (%)
MS
B-S
E
0 50 1000
0.2
0.4
0.6
0.8
1fsf (2Xfrs+0Xfpm; 1185rpm)
Load (%)
MS
B-C
oh
.
0 50 1000
0.2
0.4
0.6
0.8
1fpf
Load (%)
MS
B-C
oh
.
BL
0.4
0.7
1.0
0 50 1000
0.2
0.4
0.6
0.8
1frf
0 50 1000
0.2
0.4
0.6
0.8
1frs
Load (%)
MS
B-C
oh
.
0 50 1000
0.2
0.4
0.6
0.8
1frp
Load (%)
MS
B-C
oh
.
0 50 1000
0.2
0.4
0.6
0.8
1frc
Load (%)
MS
B-C
oh
.
2 Lei, Y., Lin, Jing, Zuo, Ming J.,He, Zhengjia, Condition monitoring and fault diagnosis of
planetary gearboxes: A review. Measurement, 2014. 48(0): p. 292-305. 3 Patel, T.H., Darpe, Ashish K, Vibration response of misaligned rotors. Journal of Sound and
Vibration, 2009. 325(3): p. 609-628. 4 Yong Gui , Q.K.H., Zheng Li , Zhi Ke Peng , Fu Lei Chu, The Fault Characteristics of
Planetary Gear System with Tooth Breakage. Key Engineering Materials, 2013. 569 - 570: p.
489-496. 5 McFadden , P.D., A technique for calculating the time domain averages of the vibration of the
individual planet gears and the sun gear in an epicyclic gearbox. Journal of Sound and
Vibration, 1991. 144(1): p. 163-172. 6 McFadden , P.D., Window Functions for the Calculation of the Time Domain Averages of the
Vibration of the Individual Planet Gears and Sun Gear in an Epicyclic Gearbox. Journal of
Vibration and Acoustics, 1994. 116(2): p. 179-187. 7 Feng, Z., Zuo, Ming J., Vibration signal models for fault diagnosis of planetary gearboxes.
Journal of Sound and Vibration, 2012. 331(22): p. 4919-4939. 8 Mosher, M., Understanding Vibration Spectra of Planetary Gear Systems for Fault Detection.
Design Engineering Division and Computers and Information in Engineering Division, 2003. 4:
p. 645-652. 9 Gu, F., et al., Electrical motor current signal analysis using a modified bispectrum for fault
diagnosis of downstream mechanical equipment. Mechanical Systems and Signal Processing,
2011. 25(1): p. 360-372. 10 McFadden , S.J.D., An explanation for the asymmetry of the modulation sidebands about the
tooth meshing frequency in epicyclic gear vibration. Institution of Mechanical Engineers 1985.
199(1): p. 65-70