University of Groningen Origins of asthma in childhood ...
35
University of Groningen Origins of asthma in childhood Savenije, Olga Elisabeth Maria IMPORTANT NOTE: You are advised to consult the publisher's version (publisher's PDF) if you wish to cite from it. Please check the document version below. Document Version Publisher's PDF, also known as Version of record Publication date: 2014 Link to publication in University of Groningen/UMCG research database Citation for published version (APA): Savenije, O. E. M. (2014). Origins of asthma in childhood. Gildeprint, Enschede. Copyright Other than for strictly personal use, it is not permitted to download or to forward/distribute the text or part of it without the consent of the author(s) and/or copyright holder(s), unless the work is under an open content license (like Creative Commons). The publication may also be distributed here under the terms of Article 25fa of the Dutch Copyright Act, indicated by the “Taverne” license. More information can be found on the University of Groningen website: https://www.rug.nl/library/open-access/self-archiving-pure/taverne- amendment. Take-down policy If you believe that this document breaches copyright please contact us providing details, and we will remove access to the work immediately and investigate your claim. Downloaded from the University of Groningen/UMCG research database (Pure): http://www.rug.nl/research/portal. For technical reasons the number of authors shown on this cover page is limited to 10 maximum. Download date: 26-01-2022
Transcript of University of Groningen Origins of asthma in childhood ...
University of Groningen
Origins of asthma in childhoodSavenije, Olga Elisabeth Maria
IMPORTANT NOTE: You are advised to consult the publisher's version (publisher's PDF) if you wish to cite fromit. Please check the document version below.
Document VersionPublisher's PDF, also known as Version of record
Publication date:2014
Link to publication in University of Groningen/UMCG research database
Citation for published version (APA):Savenije, O. E. M. (2014). Origins of asthma in childhood. Gildeprint, Enschede.
CopyrightOther than for strictly personal use, it is not permitted to download or to forward/distribute the text or part of it without the consent of theauthor(s) and/or copyright holder(s), unless the work is under an open content license (like Creative Commons).
The publication may also be distributed here under the terms of Article 25fa of the Dutch Copyright Act, indicated by the “Taverne” license.More information can be found on the University of Groningen website: https://www.rug.nl/library/open-access/self-archiving-pure/taverne-amendment.
Take-down policyIf you believe that this document breaches copyright please contact us providing details, and we will remove access to the work immediatelyand investigate your claim.
Downloaded from the University of Groningen/UMCG research database (Pure): http://www.rug.nl/research/portal. For technical reasons thenumber of authors shown on this cover page is limited to 10 maximum.
Download date: 26-01-2022

Chapter 3
Comparison of childhood wheezing phenotypes
in 2 birth cohorts: ALSPAC and PIAMA
OE Savenije*, R Granell*, D Caudri, GH Koppelman, HA Smit, A Wijga, JC De Jongste,
B Brunekreef, JA Sterne, DS Postma, J Henderson, M Kerkhof
J Allergy Clin Immunol 2011; 127: 1505-12.e14
* These authors contributed equally to this work

R1R2R3R4R5R6R7R8R9
R10R11R12R13R14R15R16R17R18R19R20R21R22R23R24R25R26R27R28R29R30R31R32R33R34R35R36R37R38R39
50 | Chapter 3
Abstract
Background
Asthma has its origins in early childhood, but different patterns of childhood wheezing vary
in their associations with subsequent asthma, atopy, and bronchial hyperresponsiveness (BHR).
Novel wheezing phenotypes have been identified on the basis of analyses of longitudinal data
from the Avon Longitudinal Study of Parents And Children (ALSPAC). It is unclear whether these
phenotypes can be replicated in other birth cohorts.
Objective
To compare wheezing phenotypes identified in the first 8 years of life in the ALSPAC study and
the Prevention and Incidence of Asthma and Mite Allergy (PIAMA) study.
Methods
We used longitudinal latent class analysis to identify phenotypes on the basis of repeated reports
of wheezing from 0 to 8 years in 5760 children from the ALSPAC study and 2810 children from
the PIAMA study. Phenotypes were compared between cohorts. Associations with asthma, atopy,
BHR, and lung function were analyzed by using weighted regression analyses.
Results
The model with the best fit to PIAMA data in the first 8 years of life was a 5-class model.
Phenotypes identified in the PIAMA study had wheezing patterns that were similar to those
previously reported in ALSPAC, adding further evidence to the existence of an intermediate-onset
phenotype with onset of wheeze after 2 years of age. Associations with asthma, atopy, BHR, and
lung function were remarkably similar in the 2 cohorts.
Conclusion
Wheezing phenotypes identified by using longitudinal latent class analysis were comparable
in 2 large birth cohorts. Study of genetic and environmental factors associated with different
phenotypes may help elucidate the origins of asthma.
R1R2R3R4R5R6R7R8R9R10R11R12R13R14R15R16R17R18R19R20R21R22R23R24R25R26R27R28R29R30R31R32R33R34R35R36R37R38R39
Comparison of childhood wheezing phenotypes in 2 birth cohorts: ALSPAC and PIAMA | 51
3
Introduction
It has been reported that the early-life period is important for the development of asthma.1,2
However, asthma symptoms are heterogeneous in early childhood.3,4 Identification of
different subtypes of asthma in early life is important to study potential pathways of asthma
development.5,6 Different asthma-related phenotypes have been categorized in early childhood
by using longitudinal analyses of wheezing history. The Tucson Children’s Respiratory Study
(TCRS) group identified different patterns of wheeze in early childhood on the basis of clinical
observations.7 They presented 4 wheezing phenotypes (never wheeze, transient early wheeze,
late-onset wheeze, and persistent wheeze), and it has been shown by many research groups
that these phenotypes differ in risk factors for asthma development,8-14 lung function,10,15-19
atopy development,10,11,19,20 number of encountered viral infections at a young age,21 genetic
polymorphisms,15,22-24 and gene expression.25 Although these phenotypes have served as a useful
model in the past decade, they may give an incomplete description of the heterogeneity in
wheezing phenotypes during childhood.26
Two British cohort studies have used latent class analysis to identify distinct phenotypes
underlying the observed heterogeneity in asthma symptoms during childhood.27,28 A population-
based cohort from Leicester identified 3 wheezing and 2 coughing phenotypes in 319 children
of 0 to 5 years on the basis of characteristics of wheeze and cough, skin prick test results, lung
function, and bronchial hyperresponsiveness (BHR).27 A birth cohort study of 6265 children, the
Avon Longitudinal Study of Parents And Children (ALSPAC), identified 6 wheezing phenotypes in
childhood from birth to age 7 years and demonstrated that these phenotypes differed in atopy
prevalence and lung function levels at 7 to 8 years of age.28 It is unclear whether phenotypes
identified by latent class analysis are comparable between birth cohorts observed in different
areas or countries, particularly because the number and timing of measurements, definitions of
wheeze, and population characteristics may differ between studies.
The aim of this study was to classify phenotypes of wheezing up to 8 years of age in the Dutch
Prevention and Incidence of Asthma and Mite Allergy (PIAMA) birth cohort study and to compare
these with wheezing phenotypes of the ALSPAC study. We examined associations of wheezing
phenotypes with asthma, atopy, BHR, and lung function at age 8 years in PIAMA and compared
these with the associations previously reported in ALSPAC.28

R1R2R3R4R5R6R7R8R9
R10R11R12R13R14R15R16R17R18R19R20R21R22R23R24R25R26R27R28R29R30R31R32R33R34R35R36R37R38R39
52 | Chapter 3
Methods
Study populations: ALSPAC and PIAMA
ALSPAC is a population-based birth cohort study that recruited 14,541 pregnant women resident
in Avon, United Kingdom, during 1991 and 1992.29,30 Study mothers were sent a self-completion
questionnaire about the health of their children at 6, 18, 30, 42, 54, 69, 81, and 91 months after
birth. The study protocol was approved by the ALSPAC Law and Ethics Committee (Institutional
Review Board 00003312) and the local research ethics committee.
PIAMA is a multicenter birth cohort study that selected 4146 pregnant women (1327 with and
2819 without allergy) in The Netherlands in 1996 and 1997.31 Parents were sent a self-completion
questionnaire about the health of their children at 3, 12, 24, 36, 48, 60, 72, 84, and 96 months
after birth. At 4 years and 8 years, children participated in a clinical examination. The study
protocol was approved by the medical ethics committees of the participating institutions.
Data on wheezing were collected at approximately 12-month intervals on the basis of parental
recall of wheezing during the preceding 12 months. In ALSPAC, wheezing definitions were used
as reported previously.28 A total of 11,740 children (80.7% of the original population) had at least
2 measures of wheezing, and 5,760 (39.6% of the original population) had complete reports of
wheeze at all 8 time points. In PIAMA, wheezing was defined to be present when 2 subsequent
questions were answered positively: ‘‘Has your child ever had wheezing or whistling in the chest
at any time in the past?’’ and ‘‘Has your child had wheezing or whistling in the chest in the past
12 months?’’ A total of 3789 children (91.4% of the original population) had returned at least
2 questionnaires in PIAMA, and 2810 (67.8% of original population) had complete reports of
wheeze at all 8 time points.
For comparison of PIAMA with ALSPAC, we used wheezing reports at 8 time points in PIAMA
(12, 24, 36, 48, 60, 72, 84, and 96 months). These are offset from the ALSPAC time points by a
maximum of 6 months (6, 18, 30, 42, 54, 69, 81, and 91 months). Outcome measures of asthma
in the PIAMA study are described in the Methods section in this article’s Online Repository.
Statistical analysis
Longitudinal latent class analysis (LLCA) attempts to explain the associations between wheeze
at different time points by identifying population phenotypes (latent classes) within which the
occurrence of wheeze at each time point is statistically independent of wheeze at other times. A

R1R2R3R4R5R6R7R8R9R10R11R12R13R14R15R16R17R18R19R20R21R22R23R24R25R26R27R28R29R30R31R32R33R34R35R36R37R38R39
Comparison of childhood wheezing phenotypes in 2 birth cohorts: ALSPAC and PIAMA | 53
3
latent class model estimates 2 sets of parameters: (1) conditional probabilities of wheeze at each
time point given membership of a phenotype, and (2) the posterior probabilities of phenotype
membership for each child given the child’s wheezing history. A full description of LLCA modeling
is given in the Online Repository. We plotted the conditional probability of wheeze over time for
each phenotype.
We compared phenotypes in PIAMA with those in ALSPAC in a 2-step approach: (1) derivation
of the best fitting model (optimal model) by unrestricted LLCA of PIAMA data and (2) derivation
of a constrained model by fixing a subset of the parameters to correspond to the phenotypes
found in ALSPAC (see the Online Repository for additional details). To assess model fit, we used
(1) the Bayesian information criterion (BIC), a function of the likelihood that rewards parsimony;
(2) entropy, an assessment of model classification based on the posterior class membership
probabilities; and (3) the bootstrap likelihood ratio test (BLRT),32 a test of an improvement in fit
between the n and n-1 class models (see the Online Repository for details). Models derived by
using PIAMA data were compared with those in ALSPAC in terms of goodness-of-fit statistics,
wheezing patterns assigned to each phenotype, trajectories of the conditional probability of
wheezing for each phenotype, and the prevalence of corresponding wheezing phenotypes. It
is important that statistical analyses account for correlations between repeated measurements
made over time. Our approach accounted for repeated reports of wheezing up to age 96 months
by using longitudinal latent class analyses, which model correlations between wheezing at
different times and account for these in defining the latent classes (phenotypes).
Associations of wheezing phenotypes with subsequent asthma, atopy, and BHR were examined
by using regression models that were weighted according to each individual’s posterior probability
of belonging to each phenotype. For example, a child might have a posterior probability 0.9 of
persistent wheeze and a posterior probability 0.1 of transient early wheeze. In regression analyses,
this child would contribute 2 lines of data, the first for persistent wheeze with weight 0.9 and
the second for transient early wheeze with weight 0.1. For binary (dichotomous) outcomes, odds
ratios (ORs) with 95% CIs were estimated by using weighted logistic regression models, whereas
for continuous outcomes, mean differences with 95% CIs were estimated by using weighted
linear regression models. Bronchial responsiveness was transformed to a dose-response slope by
regressing FEV1 change from baseline against dose of methacholine. The resulting slopes were
log-transformed for regression analyses. Means of log slopes and mean differences between
phenotypes were exponentiated and presented as geometric means and ratios of geometric
means, respectively. In all regression models, never/infrequent wheeze was the reference group.
R1R2R3R4R5R6R7R8R9
R10R11R12R13R14R15R16R17R18R19R20R21R22R23R24R25R26R27R28R29R30R31R32R33R34R35R36R37R38R39
54 | Chapter 3
Latent class analyses were performed with Mplus 4.1 software (2006; Muthen & Muthen, Los
Angeles, Calif), and weighted linear and logistic regression models were fitted by using Stata/
MP 10.0 (2007; StataCorp, College Station, Tex; see the Online Repository for further detailed
descriptions).
Primary analyses reported in the main manuscript were based on children with complete reports
of wheezing at each time. To evaluate potential bias as a result of children with missing reports
of wheeze, we repeated all analyses in children with at least 2 observations of wheeze. For
comparison, we present repeated analyses in the Online Repository including children with a
minimum of 2 reports of wheeze.
Results
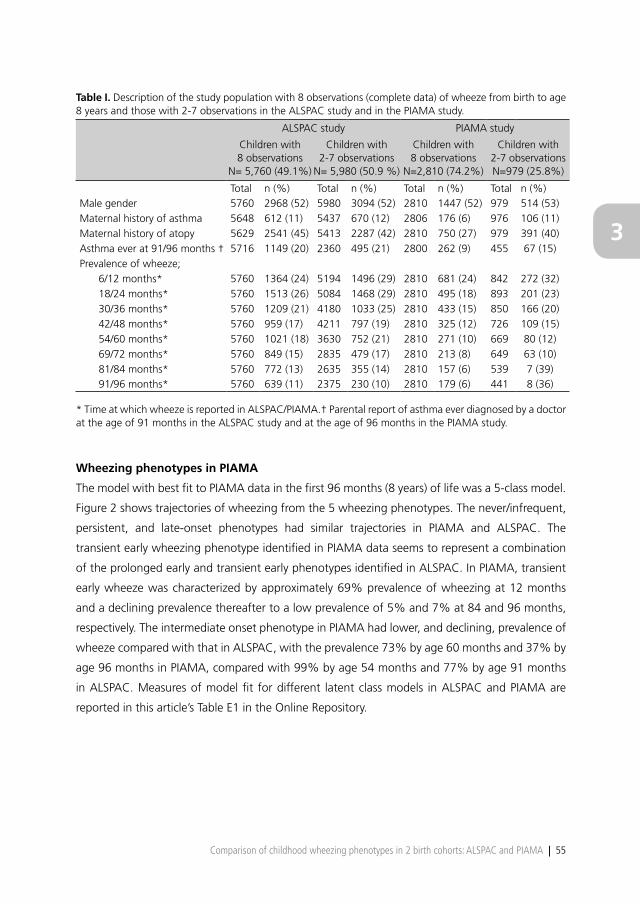
Characteristics of the study population of the ALSPAC study and the PIAMA study are shown in
Table I. In ALSPAC, 11,740 children returned at least 2 questionnaires, and 5760 (49.1%) had
complete reports of wheeze at all 8 time points. Children with complete data were less likely than
children with incomplete data to wheeze during childhood and to have a mother with atopy.
In PIAMA, 3789 children returned at least 2 questionnaires, and 2810 (74.2%) had complete
reports of wheeze. Children with complete data were less likely to wheeze during childhood,
to have had asthma by 8 years, or to have a mother with asthma and/or atopy compared with
children with incomplete data. When comparing complete data of both cohorts, children of
PIAMA had less frequent wheeze during childhood, asthma by 8 years, and mothers with asthma
and/or atopy than children of ALSPAC.
Wheezing phenotypes in ALSPAC
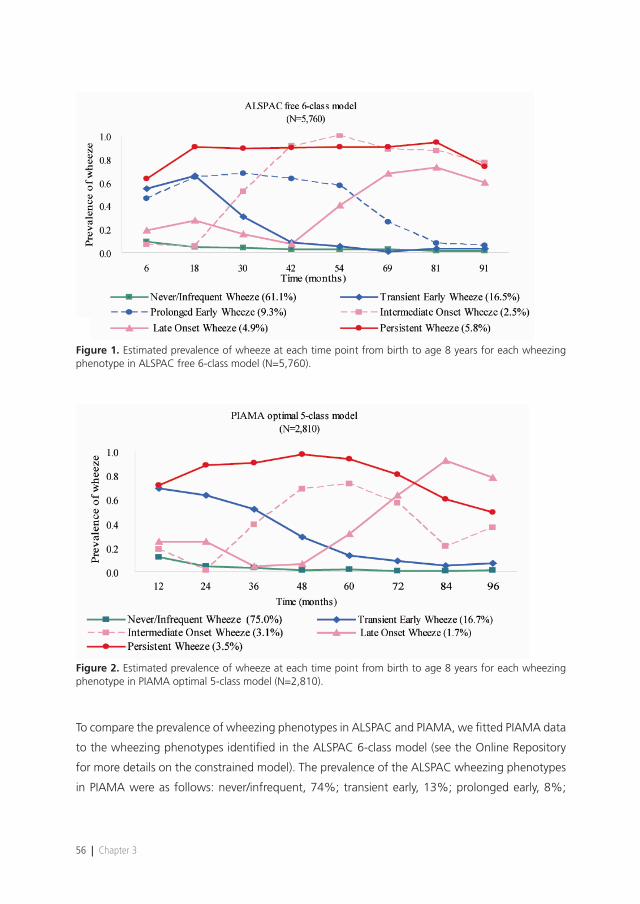
Figure 1 shows trajectories of wheezing from the 6-class model fitted to ALSPAC data extended
to include wheeze at 91 months (7½ years). The trajectories and the prevalence of wheezing
phenotypes were similar to those reported previously.28 There was evidence of improved fit
of a 7-class model: in this model, the additional phenotype appeared to represent transient
intermediate wheezing with a peak prevalence of 48% at age 54 months, resulting from splitting
the prolonged early wheezing phenotype. For simplicity and comparability with previous work,28
we restrict attention here to the 6-class model.
R1R2R3R4R5R6R7R8R9R10R11R12R13R14R15R16R17R18R19R20R21R22R23R24R25R26R27R28R29R30R31R32R33R34R35R36R37R38R39
Comparison of childhood wheezing phenotypes in 2 birth cohorts: ALSPAC and PIAMA | 55
3
Table I. Description of the study population with 8 observations (complete data) of wheeze from birth to age 8 years and those with 2-7 observations in the ALSPAC study and in the PIAMA study.
ALSPAC study PIAMA study
Children with 8 observations
N= 5,760 (49.1%)
Children with 2-7 observations
N= 5,980 (50.9 %)
Children with 8 observations
N=2,810 (74.2%)
Children with 2-7 observations N=979 (25.8%)
Total n (%) Total n (%) Total n (%) Total n (%)Male gender 5760 2968 (52) 5980 3094 (52) 2810 1447 (52) 979 514 (53)Maternal history of asthma 5648 612 (11) 5437 670 (12) 2806 176 (6) 976 106 (11)Maternal history of atopy 5629 2541 (45) 5413 2287 (42) 2810 750 (27) 979 391 (40)Asthma ever at 91/96 months † 5716 1149 (20) 2360 495 (21) 2800 262 (9) 455 67 (15)Prevalence of wheeze;
6/12 months* 5760 1364 (24) 5194 1496 (29) 2810 681 (24) 842 272 (32)18/24 months* 5760 1513 (26) 5084 1468 (29) 2810 495 (18) 893 201 (23)30/36 months* 5760 1209 (21) 4180 1033 (25) 2810 433 (15) 850 166 (20)42/48 months* 5760 959 (17) 4211 797 (19) 2810 325 (12) 726 109 (15)54/60 months* 5760 1021 (18) 3630 752 (21) 2810 271 (10) 669 80 (12)69/72 months* 5760 849 (15) 2835 479 (17) 2810 213 (8) 649 63 (10)81/84 months* 5760 772 (13) 2635 355 (14) 2810 157 (6) 539 7 (39)91/96 months* 5760 639 (11) 2375 230 (10) 2810 179 (6) 441 8 (36)
* Time at which wheeze is reported in ALSPAC/PIAMA.† Parental report of asthma ever diagnosed by a doctor at the age of 91 months in the ALSPAC study and at the age of 96 months in the PIAMA study.
Wheezing phenotypes in PIAMA
The model with best fit to PIAMA data in the first 96 months (8 years) of life was a 5-class model.
Figure 2 shows trajectories of wheezing from the 5 wheezing phenotypes. The never/infrequent,
persistent, and late-onset phenotypes had similar trajectories in PIAMA and ALSPAC. The
transient early wheezing phenotype identified in PIAMA data seems to represent a combination
of the prolonged early and transient early phenotypes identified in ALSPAC. In PIAMA, transient
early wheeze was characterized by approximately 69% prevalence of wheezing at 12 months
and a declining prevalence thereafter to a low prevalence of 5% and 7% at 84 and 96 months,
respectively. The intermediate onset phenotype in PIAMA had lower, and declining, prevalence of
wheeze compared with that in ALSPAC, with the prevalence 73% by age 60 months and 37% by
age 96 months in PIAMA, compared with 99% by age 54 months and 77% by age 91 months
in ALSPAC. Measures of model fit for different latent class models in ALSPAC and PIAMA are
reported in this article’s Table E1 in the Online Repository.
R1R2R3R4R5R6R7R8R9
R10R11R12R13R14R15R16R17R18R19R20R21R22R23R24R25R26R27R28R29R30R31R32R33R34R35R36R37R38R39
56 | Chapter 3
Figure 1. Estimated prevalence of wheeze at each time point from birth to age 8 years for each wheezing phenotype in ALSPAC free 6-class model (N=5,760).
Figure 2. Estimated prevalence of wheeze at each time point from birth to age 8 years for each wheezing phenotype in PIAMA optimal 5-class model (N=2,810).
To compare the prevalence of wheezing phenotypes in ALSPAC and PIAMA, we fitted PIAMA data
to the wheezing phenotypes identified in the ALSPAC 6-class model (see the Online Repository
for more details on the constrained model). The prevalence of the ALSPAC wheezing phenotypes
in PIAMA were as follows: never/infrequent, 74%; transient early, 13%; prolonged early, 8%;
R1R2R3R4R5R6R7R8R9R10R11R12R13R14R15R16R17R18R19R20R21R22R23R24R25R26R27R28R29R30R31R32R33R34R35R36R37R38R39
Comparison of childhood wheezing phenotypes in 2 birth cohorts: ALSPAC and PIAMA | 57
3
intermediate-onset, 1%; late-onset, 2%; and persistent, 2%. Thus, although the prevalence of
all wheezing phenotypes was lower in PIAMA than in ALSPAC (except for the never/infrequent
phenotype), the relative frequencies of the different wheezing phenotypes were similar.
This article’s Table E2 in the Online Repository shows the most frequently occurring patterns
of wheeze in the PIAMA 5-class optimal model and their most likely phenotype in the 6-class
constrained model. The patterns of wheeze assigned to the prolonged early wheeze phenotype
in the constrained model were assigned to the phenotype persistent wheeze or transient early
wheeze in the optimal model, depending on whether children continued to wheeze after the age
of 5 years.
This article’s Table E3 in the Online Repository shows that when PIAMA children with intermediate-
onset wheeze were classified according to the definitions of the TCRS, they were approximately
equally divided among the 4 TCRS phenotypes (21% of never wheeze, 21% of transient early
wheeze, 31% of persistent wheeze, and 26% of late-onset wheeze). This indicates that the
intermediate-onset phenotype is not well defined within the TCRS framework.
Association of wheezing phenotypes with outcome measures of asthma
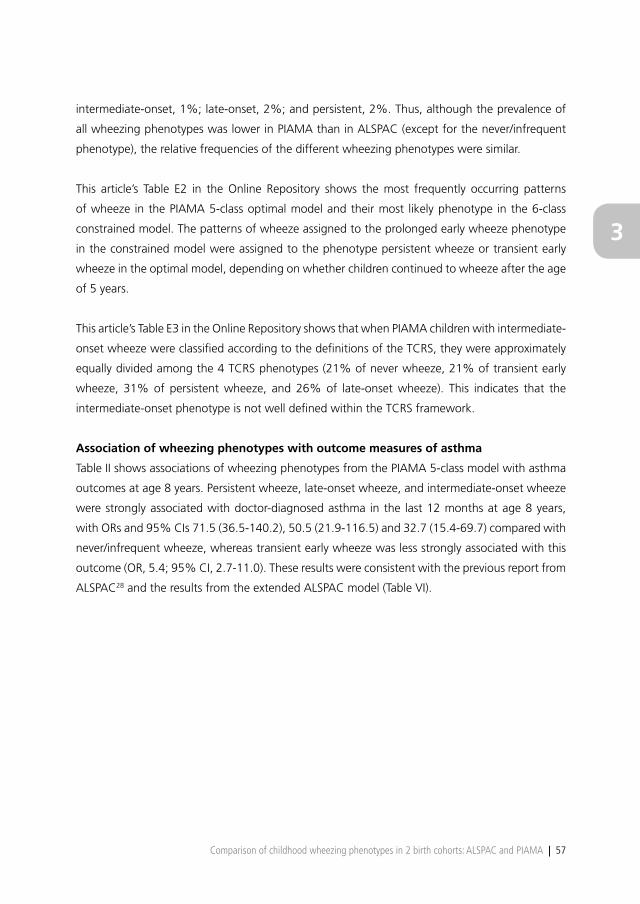
Table II shows associations of wheezing phenotypes from the PIAMA 5-class model with asthma
outcomes at age 8 years. Persistent wheeze, late-onset wheeze, and intermediate-onset wheeze
were strongly associated with doctor-diagnosed asthma in the last 12 months at age 8 years,
with ORs and 95% CIs 71.5 (36.5-140.2), 50.5 (21.9-116.5) and 32.7 (15.4-69.7) compared with
never/infrequent wheeze, whereas transient early wheeze was less strongly associated with this
outcome (OR, 5.4; 95% CI, 2.7-11.0). These results were consistent with the previous report from
ALSPAC28 and the results from the extended ALSPAC model (Table VI).
R1R2R3R4R5R6R7R8R9
R10R11R12R13R14R15R16R17R18R19R20R21R22R23R24R25R26R27R28R29R30R31R32R33R34R35R36R37R38R39
58 | Chapter 3
Table II. Associations of wheezing phenotypes (from PIAMA optimal 5-class model) with asthma ever, doctor-diagnosed asthma, and inhaled corticosteroids usage.
Asthma ever at 8 years
Doctor-diagnosed asthma at 8 years
Inhaled corticosteroids use at 3-8 yrs
PhenotypeTotal
n* (%)OR
(95% CI)Total
n* (%)OR
(95% CI)Total
n* (%)OR
(95% CI)
Never/Infrequent2067
105 (5.1)1.0
(reference)2101
14 (0.7)1.0
(reference)1971
145 (7.4)1.0
(reference)
Transient Early448
140 (31.2)8.5
(6.4, 11.2)468
17 (3.6)5.4
(2.7, 11.0)428
137 (32.0)5.9
(4.5, 7.7)
Intermediate Onset83
41 (78.9)17.9
(11.1, 28.6)85
16 (18.3)32.7
(15.4, 69.7)77
52 (67.5)26.1
(15.7, 43.4)
Late Onset45
36 (59.0)26.8
(14.3, 50.2)47
12 (25.7)50.5
(21.9, 116.5)42
22 (52.9)14.1
(7.5, 26.5)
Persistent94
70 (74.1)53.4
(32.3, 88.1)95
31 (32.9)71.5
(36.5, 140.2)90
75 (82.8)60.4
(34.1, 107.2)
Total2738
382 (14.0)-
2796 90 (3.2)
-2608
431 (16.5)-
Results from weighted logistic regression models using children with complete data.* n represents the sum of the membership probabilities of the affected children for that phenotype, and total represents the sum of the membership probability of all children for that phenotype.
Table III. Associations of wheezing phenotypes (from PIAMA optimal 5-class model) with sensitization to any allergen, indoor allergens or food allergens at 4 years.
Sensitization to any common allergen
at 4 years†
Sensitization to indoor allergens at 4 years
Sensitization to food allergens at 4 years
PhenotypeTotal
n* (%)OR
(95% CI)Total
n* (%)OR
(95% CI)Total
n* (%)OR
(95% CI)
Never/Infrequent369
131 (35.4)1.0
(reference)390
37 (9.5)1.0
(reference)372
97 (26.1)1.0
(reference)
Transient Early112
46 (40.9)1.3
(0.8, 2.0)115
21 (18.1)2.1
(1.2, 3.8)112
35 (31.1)1.3
(0.8, 2.0)
Intermediate Onset21
16 (75.2)5.5
(2.0, 15.1)22
13 (61.1)15.0
(5.9, 37.7)22
9 (39.7)1.9
(0.8, 4.5)
Late Onset16
11 (72.7)4.9
(1.6, 15.1)16
9 (60.0)14.3
(4.9, 41.5)15
5 (31.5)1.30
(0.4, 4.0)
Persistent28
14 (49.7)1.8
(0.8, 3.9)29
12 (39.8)6.3
(2.8, 14.3)28
7 (24.2)0.90
(0.4, 2.2)
Total546
218 (39.9)-
57192 (16.1)
-548
152 (27.7)-
Results from weighted logistic regression models using children with complete data.* n represents the sum of the membership probabilities of the affected children for that phenotype, and total represents the sum of the membership probability of all children for that phenotype.† Sensitization to any common allergen is a specific IgE serum concentration of ≥0.35 IU/ml to any indoor allergen (house dust mite, cat, and dog), food allergen (milk, egg) or other common allergen (mixed grasses, birch, Alternaria alternata).
R1R2R3R4R5R6R7R8R9R10R11R12R13R14R15R16R17R18R19R20R21R22R23R24R25R26R27R28R29R30R31R32R33R34R35R36R37R38R39
Comparison of childhood wheezing phenotypes in 2 birth cohorts: ALSPAC and PIAMA | 59
3
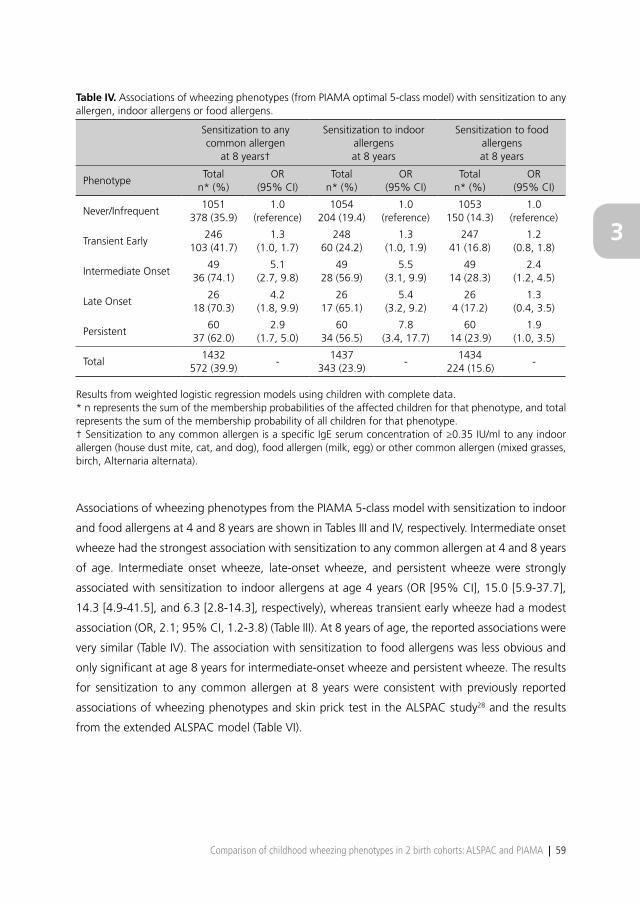
Table IV. Associations of wheezing phenotypes (from PIAMA optimal 5-class model) with sensitization to any allergen, indoor allergens or food allergens.
Sensitization to any common allergen
at 8 years†
Sensitization to indoor allergens at 8 years
Sensitization to food allergens at 8 years
PhenotypeTotal
n* (%)OR
(95% CI)Total
n* (%)OR
(95% CI)Total
n* (%)OR
(95% CI)
Never/Infrequent1051
378 (35.9)1.0
(reference)1054
204 (19.4)1.0
(reference)1053
150 (14.3)1.0
(reference)
Transient Early246
103 (41.7)1.3
(1.0, 1.7)248
60 (24.2)1.3
(1.0, 1.9)247
41 (16.8)1.2
(0.8, 1.8)
Intermediate Onset49
36 (74.1)5.1
(2.7, 9.8)49
28 (56.9)5.5
(3.1, 9.9)49
14 (28.3)2.4
(1.2, 4.5)
Late Onset26
18 (70.3)4.2
(1.8, 9.9)26
17 (65.1)5.4
(3.2, 9.2)26
4 (17.2)1.3
(0.4, 3.5)
Persistent60
37 (62.0)2.9
(1.7, 5.0)60
34 (56.5)7.8
(3.4, 17.7)60
14 (23.9)1.9
(1.0, 3.5)
Total1432
572 (39.9)-
1437 343 (23.9)
-1434
224 (15.6)-
Results from weighted logistic regression models using children with complete data.* n represents the sum of the membership probabilities of the affected children for that phenotype, and total represents the sum of the membership probability of all children for that phenotype.† Sensitization to any common allergen is a specific IgE serum concentration of ≥0.35 IU/ml to any indoor allergen (house dust mite, cat, and dog), food allergen (milk, egg) or other common allergen (mixed grasses, birch, Alternaria alternata).
Associations of wheezing phenotypes from the PIAMA 5-class model with sensitization to indoor
and food allergens at 4 and 8 years are shown in Tables III and IV, respectively. Intermediate onset
wheeze had the strongest association with sensitization to any common allergen at 4 and 8 years
of age. Intermediate onset wheeze, late-onset wheeze, and persistent wheeze were strongly
associated with sensitization to indoor allergens at age 4 years (OR [95% CI], 15.0 [5.9-37.7],
14.3 [4.9-41.5], and 6.3 [2.8-14.3], respectively), whereas transient early wheeze had a modest
association (OR, 2.1; 95% CI, 1.2-3.8) (Table III). At 8 years of age, the reported associations were
very similar (Table IV). The association with sensitization to food allergens was less obvious and
only significant at age 8 years for intermediate-onset wheeze and persistent wheeze. The results
for sensitization to any common allergen at 8 years were consistent with previously reported
associations of wheezing phenotypes and skin prick test in the ALSPAC study28 and the results
from the extended ALSPAC model (Table VI).
R1R2R3R4R5R6R7R8R9
R10R11R12R13R14R15R16R17R18R19R20R21R22R23R24R25R26R27R28R29R30R31R32R33R34R35R36R37R38R39
60 | Chapter 3
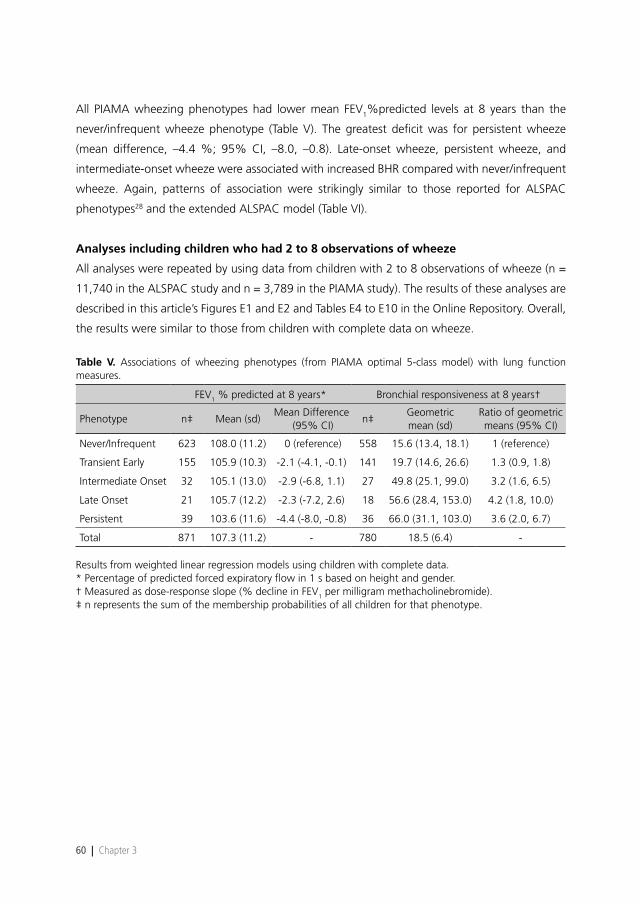
All PIAMA wheezing phenotypes had lower mean FEV1%predicted levels at 8 years than the
never/infrequent wheeze phenotype (Table V). The greatest deficit was for persistent wheeze
(mean difference, –4.4 %; 95% CI, –8.0, –0.8). Late-onset wheeze, persistent wheeze, and
intermediate-onset wheeze were associated with increased BHR compared with never/infrequent
wheeze. Again, patterns of association were strikingly similar to those reported for ALSPAC
phenotypes28 and the extended ALSPAC model (Table VI).
Analyses including children who had 2 to 8 observations of wheeze
All analyses were repeated by using data from children with 2 to 8 observations of wheeze (n =
11,740 in the ALSPAC study and n = 3,789 in the PIAMA study). The results of these analyses are
described in this article’s Figures E1 and E2 and Tables E4 to E10 in the Online Repository. Overall,
the results were similar to those from children with complete data on wheeze.
Table V. Associations of wheezing phenotypes (from PIAMA optimal 5-class model) with lung function measures.
FEV1 % predicted at 8 years* Bronchial responsiveness at 8 years†
Phenotype n‡ Mean (sd)Mean Difference
(95% CI)n‡
Geometric mean (sd)
Ratio of geometric means (95% CI)
Never/Infrequent 623 108.0 (11.2) 0 (reference) 558 15.6 (13.4, 18.1) 1 (reference)
Transient Early 155 105.9 (10.3) -2.1 (-4.1, -0.1) 141 19.7 (14.6, 26.6) 1.3 (0.9, 1.8)
Intermediate Onset 32 105.1 (13.0) -2.9 (-6.8, 1.1) 27 49.8 (25.1, 99.0) 3.2 (1.6, 6.5)
Late Onset 21 105.7 (12.2) -2.3 (-7.2, 2.6) 18 56.6 (28.4, 153.0) 4.2 (1.8, 10.0)
Persistent 39 103.6 (11.6) -4.4 (-8.0, -0.8) 36 66.0 (31.1, 103.0) 3.6 (2.0, 6.7)
Total 871 107.3 (11.2) - 780 18.5 (6.4) -
Results from weighted linear regression models using children with complete data.* Percentage of predicted forced expiratory flow in 1 s based on height and gender.† Measured as dose-response slope (% decline in FEV1 per milligram methacholinebromide).‡ n represents the sum of the membership probabilities of all children for that phenotype.

R1R2R3R4R5R6R7R8R9R10R11R12R13R14R15R16R17R18R19R20R21R22R23R24R25R26R27R28R29R30R31R32R33R34R35R36R37R38R39
Comparison of childhood wheezing phenotypes in 2 birth cohorts: ALSPAC and PIAMA | 61
3
Tab
le V
I. C
ompa
rison
of
asso
ciat
ions
bet
wee
n w
heez
ing
phen
otyp
es a
nd d
octo
r-di
agno
sed
asth
ma,
sen
sitiz
atio
n to
any
com
mon
alle
rgen
and
lung
fun
ctio
n m
easu
res
at 8
yea
rs in
ALS
PAC
and
PIA
MA
.
Doc
tor
diag
nose
d as
thm
a at
8 y
ears
*Se
nsiti
zatio
n to
any
com
mon
al
lerg
en a
t 8
year
sFE
V1%
pre
dict
ed a
t 8
year
s**
Bron
chia
l res
pons
iven
ess
at 8
yea
rs†
Phen
otyp
eO
R (9
5%C
I) O
R (9
5%C
I) M
ean
Diff
eren
ce (9
5%C
I) Ra
tio o
f ge
omet
ric m
eans
(95%
CI)
ALS
PAC
6-
clas
s ex
tend
ed
mod
el±
Nev
er/In
freq
uent
1 (r
ef)
1 (r
ef)
0 (r
ef)
1 (r
ef)
Tran
sien
t ea
rly1.
5 (0
.9, 2
.3)
0.9
(0.7
,1.2
)-2
.2 (-
3.2,
-1.2
)1.
2 (1
.0, 1
.4)
Prol
onge
d ea
rly9.
6 (6
.8, 1
3.7)
1.4
(1.0
,1.8
)-2
.5 (-
3.7,
-1.2
)1.
5 (1
.2, 1
.8)
Inte
rmed
iate
ons
et37
1.8
(201
.4, 6
86)
7.4
(4.8
,11.
3)-4
.5 (-
6.8,
-2.1
)4.
7 (3
.1, 7
.2)
Late
ons
et71
.6 (5
0.1,
102
.2)
5.2
(3.8
,7.0
)-3
.1 (-
4.8,
-1.4
)3.
8 (2
.8, 5
.2)
Pers
iste
nt38
6.6
(246
.4, 6
06)
4.8
(3.6
,6.4
)-4
.1 (-
5.6,
-2.5
)3.
2 (2
.4, 4
.2)
Tota
l52
0138
7241
0628
25
PIA
MA
5-
clas
s m
odel
Nev
er/In
freq
uent
1 (r
ef)
1 (r
ef)
0 (r
ef)
1 (r
ef)
Tran
sien
t ea
rly5.
4 (2
.7, 1
1.0)
1.3
(1.0
, 1.7
)-2
.1 (-
4.1,
-0.
1)1.
3 (0
.9, 1
.8)
Inte
rmed
iate
ons
et32
.7 (1
5.4,
69.
7)5.
1 (2
.7, 9
.8)
-2.9
(-6.
8, 1
.1)
3.2
(1.6
, 6.5
)La
te o
nset
50.5
(21.
9, 1
16.5
)4.
2 (1
.8, 9
.9)
-2.3
(-7.
2, 2
.6)
4.2
(1.8
, 10.
0)Pe
rsis
tent
71.5
(36.
5, 1
40.2
)2.
9 (1
.7, 5
.0)
-4.4
(-8.
0, -
0.8)
3.6
(2.0
, 6.7
)To
tal
2796
1432
871
780
Resu
lts f
rom
wei
ghte
d re
gres
sion
mod
els
usin
g ch
ildre
n w
ith c
ompl
ete
data
. ±
Ext
ende
d m
odel
with
8th
tim
e po
int
at 9
1 m
onth
s.*
Defi
ned
as a
par
enta
l rep
ort
of a
doc
tor’s
dia
gnos
is o
f as
thm
a at
any
tim
e an
d a
pare
ntal
rep
ort
of a
sthm
a in
the
pas
t 12
mon
ths,
rep
orte
d at
age
8**
Per
cent
age
of p
redi
cted
for
ced
expi
rato
ry fl
ow in
1 s
bas
ed o
n he
ight
and
gen
der.
† M
easu
red
as d
ose-
resp
onse
slo
pe (%
dec
line
in F
EV1
per
mill
igra
m m
etha
chol
ineb
rom
ide)
.

R1R2R3R4R5R6R7R8R9
R10R11R12R13R14R15R16R17R18R19R20R21R22R23R24R25R26R27R28R29R30R31R32R33R34R35R36R37R38R39
62 | Chapter 3
Discussion
In this study, we compared early childhood wheezing phenotypes identified by using LLCA in 2
independent birth cohorts. The never/infrequent, persistent, and late-onset wheezing phenotypes
identified in PIAMA had similar trajectories to the phenotypes with the same names previously
identified in ALSPAC. The transient early wheezing phenotype identified in PIAMA seemed to
represent a combination of the prolonged early and transient early phenotypes reported in
ALSPAC. The intermediate-onset phenotype in PIAMA had lower, and declining, prevalence of
wheeze compared with that in ALSPAC. The phenotypes identified in PIAMA showed remarkably
similar associations with asthma, atopy, lung function, and BHR compared with those previously
reported for ALSPAC phenotypes.28 Our results provide further evidence for the existence of an
intermediate-onset wheeze phenotype that is strongly associated with atopy and BHR.
The prolonged early phenotype defined in ALSPAC was not replicated in the PIAMA cohort.
This could be explained by (1) a smaller sample size decreasing the resolution of phenotype
identification, particularly of phenotypes with a relatively low prevalence, and (2) an overall lower
prevalence of wheeze in The Netherlands compared with the United Kingdom,33-35 resulting in
each phenotype accounting for a smaller proportion of the PIAMA sample.
Results in the context of other literature
The intermediate-onset phenotype identified in PIAMA and ALSPAC appears novel compared
with the categories of wheeze previously reported in the TCRS.7 The intermediate-onset, late-
onset, and persistent wheezing phenotypes had the strongest associations with atopy. Of interest,
transient and prolonged early wheeze were not associated with atopy but with reduced lung
function. These findings strengthen the evidence for discriminating wheezing phenotypes in early
childhood between those associated with the development and persistence of asthma and those
that recover spontaneously.7,36
It is of interest that sensitization to any common allergen at 4 and 8 years of age was most
strongly associated with intermediate-onset wheeze - that is, children who start wheezing in
preschool years. This phenotype was also strongly associated with the presence of asthma at 8
years. In addition, sensitization to common allergens at 4 years was associated with late-onset
wheeze, which suggests that sensitization may precede the development of wheeze in this
particular subgroup of children. This suggests the possibility of a critical window of exposure in the
preschool period leading to atopic sensitization and expression of allergic airway inflammation.

R1R2R3R4R5R6R7R8R9R10R11R12R13R14R15R16R17R18R19R20R21R22R23R24R25R26R27R28R29R30R31R32R33R34R35R36R37R38R39
Comparison of childhood wheezing phenotypes in 2 birth cohorts: ALSPAC and PIAMA | 63
3
Environmental factors such as allergen exposure, which may induce sensitization or allergen
tolerance, and viral respiratory infections, which can unmask wheeze in infants with narrow
airways and may have a role in the inception of asthma in early childhood, appear to have a
role in driving phenotype development in early childhood; these are likely to operate during the
preschool years.19,37
It remains difficult to establish the relative importance of predetermined features, such as atopic
disposition or abnormal airway development that result from genetic and prenatal factors and
postnatal environment, in the development of asthma in children.38,39 Multiple features likely
interact in the expression of early wheezing illnesses. It is the combination of such features
(atopy, lung function, airway inflammation secondary to allergen or viral exposure, and so
forth) and their timing that ultimately determine the likelihood of persistence of symptoms
into later childhood. Mathematical modeling of phenotypes as applied in this study is able to
reveal clinical characteristics that group together, either longitudinal trajectories of symptoms28
or combinations of clinical features.40 These are important findings for understanding better the
relative contributions of different pathophysiological processes that underlie the development
of asthma. Further research of the relation between the development of wheeze and the
development of other pathophysiological processes like sensitization is needed to understand
their temporal relation. However, the identified wheezing phenotypes are not yet applicable in
clinical practice when one needs to find a preasthma wheezing phenotype. Further studies are
needed in this respect to assess which environmental and personal factors identify at an individual
level a wheezing child that is at risk for asthma development.41
Strengths and limitations
Our study has several strengths. First, we have used 8 measurements to describe carefully the
wheezing patterns from birth to 8 years of age, in contrast with most previous studies, which
described phenotypes based on fewer measurements. Second, phenotypes were identified
by LLCA, an objective approach that avoids subjective identification of population subgroups.
A number of limitations have to be considered. PIAMA and ALSPAC collected data at slightly
different time points. PIAMA collected data yearly around the child’s birthday from 12 to 96
months, whereas ALSPAC collected data at 6, 18, 30, 45, 54, 69, 81, and 91 months. Wheezing
phenotypes were based on repeated parental reports of wheezing, which are subject to
misclassification - for example, because of imperfect recall.42 The latent class approach used
in our analyses allows for such misclassification in the sense that it accounts for correlations
between reports of wheeze at different time points. Children with sporadic or incomplete reports

R1R2R3R4R5R6R7R8R9
R10R11R12R13R14R15R16R17R18R19R20R21R22R23R24R25R26R27R28R29R30R31R32R33R34R35R36R37R38R39
64 | Chapter 3
of wheeze are assigned to classes with less certainty than those in whom reports are consistent
across time or who report patterns consistent with those reported in other children. Our analyses
were weighted for the probability of belonging to the different classes and thus accounted for
this varying certainty. The very strong associations of phenotypes with objective measures of
atopy and lung function that we observed in both ALSPAC and PIAMA are not consistent with
substantial misclassification of wheezing in these data.
Wheeze may be influenced by the use of inhaled corticosteroids, suppressing symptoms. In the
PIAMA study, the proportion of the study population that used inhaled steroids and did not
report wheezing was low, with a range from 2.1% of all studied children at 3 years of age to a
maximum of 4.0% of all studied children at 7 years of age. Nonetheless, corticosteroid use may
have affected our ability to distinguish the phenotypes most strongly associated with asthma,
atopy, and BHR.
In common with most population-based, longitudinal cohort studies, there were both loss to
follow-up and missing data in both PIAMA and ALSPAC. Furthermore, the sampling methods of
lung function and other measures in PIAMA led to higher proportion of children with a maternal
history of atopy than without such a history having lung function data available. However, we
do not think that lung function associations with wheezing phenotypes were likely to have
been substantially biased by this selection because the results were similar in ALSPAC, where no
selection was applied and 47% of children with lung function data had a maternal history of
asthma or allergy.
In conclusion, 2 independent birth cohorts identified partly similar wheezing phenotypes with an
identical statistical method and showed that these phenotypes are differentially associated with
asthma, atopy, BHR, and lung function at 8 years of age. The phenotypes that were defined in
ALSPAC and PIAMA will be used for further studies on genetic and environmental risk factors
for asthma and allergic diseases. Such studies are essential to study the biological implication
of the phenotypes and their possible causal pathways to asthma development but require large
numbers of participants. Analyses of data combined from multiple cohort studies have the
potential to provide novel insights into the implication of such risk factors for the development
and persistence of asthma and allergic disease.

R1R2R3R4R5R6R7R8R9R10R11R12R13R14R15R16R17R18R19R20R21R22R23R24R25R26R27R28R29R30R31R32R33R34R35R36R37R38R39
Comparison of childhood wheezing phenotypes in 2 birth cohorts: ALSPAC and PIAMA | 65
3
References
1. Gluckman PD, Hanson MA, Cooper C, Thornburg KL. Effect of in utero and earlylife conditions on adult health and disease. N Engl J Med 2008;3359:61-73.
2. Saglani S, Bush A. The early-life origins of asthma. Curr Opin Allergy Clin Immunol 2007;7:83-90.3. Henderson AJ. What have we learned from prospective cohort studies of asthma in children? Chron
Respir Dis 2008;5:225-31.4. Holloway JW, Yang IA, Holgate ST. Interpatient variability in rates of asthma progression: can genetics
provide an answer? J Allergy Clin Immunol 2008;121: 573-9.5. Kiley J, Smith R, Noel P. Asthma phenotypes. Curr Opin Pulm Med 2007;13: 19-23.6. Wardlaw AJ, Silverman M, Siva R, Pavord ID, Green R. Multi-dimensional phenotyping: towards a new
taxonomy for airway disease. Clin Exp Allergy 2005; 35:1254-62.7. Martinez FD, Wright AL, Taussig LM, Holberg CJ, Halonen M, Morgan WJ. Asthma and wheezing in the
first six years of life. The Group Health Medical Associates. N Engl J Med 1995;332:133-8.8. Sherriff A, Peters TJ, Henderson J, Strachan D. Risk factor associations with wheezing patterns in
children followed longitudinally from birth to 3(1/2) years. Int J Epidemiol 2001;30:1473-84.9. Rusconi F, Galassi C, Bellasio M, Piffer S, Lombardi E, Bonci E, et al. Risk factors in the pre-, perinatal
and early life (first year) for wheezing in young children. Epidemiol Prev 2005;29:47-51.10. Kurukulaaratchy RJ, Fenn M, Twiselton R, Matthews S, Arshad SH. The prevalence of asthma and
wheezing illnesses amongst 10-year-old schoolchildren. Respir Med 2002;96:163-9.11. Sandin A, Bjorksten B, Braback L. Development of atopy and wheezing symptoms in relation to heredity
and early pet keeping in a Swedish birth cohort. Pediatr Allergy Immunol 2004;15:316-22.12. Mai XM, Almqvist C, Nilsson L, Wickman M. Birth anthropometric measures, body mass index and
allergic diseases in a birth cohort study (BAMSE). Arch Dis Child 2007;92:881-6.13. Taussig LM, Wright AL, Holberg CJ, Halonen M, Morgan WJ, Martinez FD. Tucson Children’s Respiratory
Study: 1980 to present. J Allergy Clin Immunol 2003; 111:661-75.14. Stein RT, Martinez FD. Asthma phenotypes in childhood: lessons from an epidemiological approach.
Paediatr Respir Rev 2004;5:155-61.15. Wilson NM, Lamprill JR, Mak JC, Clarke JR, Bush A, Silverman M. Symptoms, lung function, and beta2-
adrenoceptor polymorphisms in a birth cohort followed for 10 years. Pediatr Pulmonol 2004;38:75-81.16. Lowe LA, Simpson A, Woodcock A, Morris J, Murray CS, Custovic A. Wheeze phenotypes and lung
function in preschool children. Am J Respir Crit Care Med 2005;171:231-7.17. Brussee JE, Smit HA, Koopman LP, Wijga AH, Kerkhof M, Corver K, et al. Interrupter resistance and
wheezing phenotypes at 4 years of age. Am J Respir Crit Care Med 2004;169:209-13.18. Young S, Arnott J, O’Keeffe PT, Le Souef PN, Landau LI. The association between early life lung function
and wheezing during the first 2 yrs of life. Eur Respir J 2000;15:151-7.19. Illi S, von Mutius E, Lau S, Niggemann B, Gruber C, Wahn U. Perennial allergen sensitisation early in life
and chronic asthma in children: a birth cohort study. Lancet 2006;368:763-70.20. Brussee JE, Smit HA, van Strien RT, Corver K, Kerkhof M, Wijga AH, et al. Allergen exposure in
infancy and the development of sensitization, wheeze, and asthma at 4 years. J Allergy Clin Immunol 2005;115:946-52.
21. Kusel MM, de Klerk NH, Kebadze T, Vohma V, Holt PG, Johnston SL, et al. Earlylife respiratory viral infections, atopic sensitization, and risk of subsequent development of persistent asthma. J Allergy Clin Immunol 2007;119:1105-10.
22. Simpson A, Maniatis N, Jury F, Cakebread JA, Lowe LA, Holgate ST, et al. Polymorphisms in a disintegrin and metalloprotease 33 (ADAM33) predict impaired early-life lung function. Am J Respir Crit Care Med 2005;172:55-60.
23. Sadeghnejad A, Karmaus W, Arshad SH, Kurukulaaratchy R, Huebner M, Ewart S. IL13 gene polymorphisms modify the effect of exposure to tobacco smoke on persistent wheeze and asthma in childhood, a longitudinal study. Respir Res 2008;9:2.
24. Melen E, Umerkajeff S, Nyberg F, Zucchelli M, Lindstedt A, Gullsten H, et al. Interaction between variants in the interleukin-4 receptor alpha and interleukin-9 receptor genes in childhood wheezing: evidence from a birth cohort study. Clin Exp Allergy 2006;36:1391-8.

R1R2R3R4R5R6R7R8R9
R10R11R12R13R14R15R16R17R18R19R20R21R22R23R24R25R26R27R28R29R30R31R32R33R34R35R36R37R38R39
66 | Chapter 3
25. Kapitein B, Hoekstra MO, Nijhuis EH, Hijnen DJ, Arets HG, Kimpen JL, et al. Gene expression in CD41 T-cells reflects heterogeneity in infant wheezing phenotypes. Eur Respir J 2008;32:1203-12.
26. Henderson J, Granell R, Sterne J. The search for new asthma phenotypes. Arch Dis Child 2009;94:333-6.
27. Spycher BD, Silverman M, Brooke AM, Minder CE, Kuehni CE. Distinguishing phenotypes of childhood wheeze and cough using latent class analysis. Eur Respir J 2008;31:974-81.
28. Henderson J, Granell R, Heron J, Sherriff A, Simpson A, Woodcock A, et al. Associations of wheezing phenotypes in the first 6 years of life with atopy, lung function and airway hyperresponsiveness in mid-childhood. Thorax 2008;63:974-80.
29. Pembrey M. The Avon Longitudinal Study of Parents and Children (ALSPAC): a resource for genetic epidemiology. Eur J Endocrinol 2004;151:U125-9.
30. Golding J, Pembrey M, Jones R. ALSPAC–the Avon Longitudinal Study of Parents and Children, I: study methodology. Paediatr Perinat Epidemiol 2001;15:74-87.
31. Brunekreef B, Smit J, de Jongste J, Neijens H, Gerritsen J, Postma D, et al. The Prevention and Incidence of Asthma and Mite Allergy (PIAMA) birth cohort study: design and first results. Pediatr Allergy Immunol 2002;13:55-60.
32. Muthén LK, Muthén BO. 1998-2007. Mplus user’s guide. 5th ed. Los Angeles (CA): Muthen and Muthen; 2006.
33. Patel S, Jarvelin M, Little M. Systemic review of worldwide variations of the prevalence of wheezing symptoms in children. Environ Health 2008;7:57.
34. Pearce N, Sunyer J, Cheng S, Chinn S, Bjorksten B, Burr M, et al. Comparison of asthma prevalence in the ISAAC and the ECRHS. ISAAC Steering Committee and the European Community Respiratory Health Survey. International Study of Asthma and Allergies in Childhood. Eur Respir J 2000;16:420-6.
35. Sembajwe G, Cifuentes M, Tak SW, Kriebel D, Gore R, Punnett L. National income, self-reported wheezing and asthma diagnosis from the World Health Survey. Eur Respir J 2010;35:279-86.
36. Brand PLP, Baraldi E, Bisgaard H, Boner AL, Castro-Rodriguez JA, Custovic A, et al. ERS Task Force. Definition, assessment and treatment of wheezing disorders in preschool children: an evidence based approach. Eur Respir J 2008;32:1096-110.
37. Jackson DJ, Gangnon RE, Evans MD, Roberg KA, Anderson EL, Pappas TE, et al. Wheezing rhinovirus illnesses in early life predict asthma development in high-risk children. Am J Respir Crit Care Med 2008;178:667-72.
38. Sharma S, Tantisira K, Carey V, Murphy AJ, Lasky-Su J, Celed_on JC, et al. A role for WNT-signaling genes in de pathogenesis of impared lung function in asthma. Am J Respir Crit Care 2009;181:328-36.
39. Substrata LS, Bizzintino J,Mamessier E, Bosco A,McKennaKL,Winstr€om ME,et al. Interactions between innate antiviral and atopic immunoinflammatory pathways precipitate and sustain asthma exacerbations in children. J Immunol 2009;183:2793-800.
40. Spycher BD, Silverman M, Barben J, Eber E, Guinand S, Levy ML, et al. A disease model for wheezing disorders in preschool children based on clinicians’ perceptions. PLoS One 2009;4:e8533.
41. Bush A. Update in pediatric lung disease 2008. Am J Respir Crit Care Med 2009; 179:637-49.42. Elphick HE, Sherlock P, Foxall G, Simpson EJ, Shiell NA, Primhak RA, et al. Survey of respiratory sounds
in infants. Arch Dis Child 2001;84:35-9.

Chapter 3
Online Repository
Comparison of childhood wheezing phenotypes
in 2 birth cohorts: ALSPAC and PIAMA
OE Savenije*, R Granell*, D Caudri, GH Koppelman, HA Smit, A Wijga, JC De Jongste,
B Brunekreef, JA Sterne, DS Postma, J Henderson, M Kerkhof
J Allergy Clin Immunol. 2011; 127: 1505-12.e14
* These authors contributed equally to this work

R1R2R3R4R5R6R7R8R9
R10R11R12R13R14R15R16R17R18R19R20R21R22R23R24R25R26R27R28R29R30R31R32R33R34R35R36R37R38R39
68 | Chapter 3
R1R2R3R4R5R6R7R8R9R10R11R12R13R14R15R16R17R18R19R20R21R22R23R24R25R26R27R28R29R30R31R32R33R34R35R36R37R38R39
Comparison of childhood wheezing phenotypes in 2 birth cohorts: ALSPAC and PIAMA | 69
3
Methods
Study populations
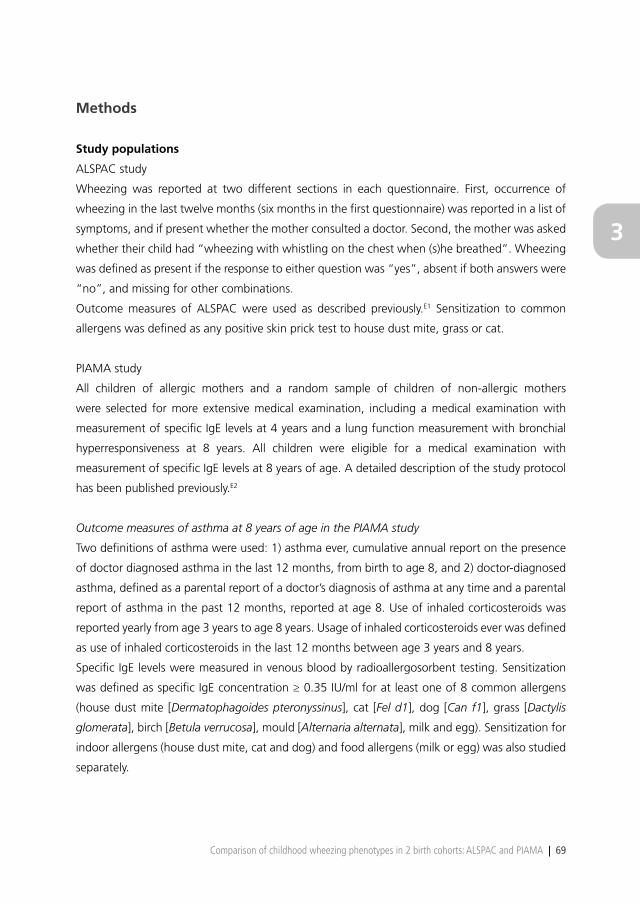
ALSPAC study
Wheezing was reported at two different sections in each questionnaire. First, occurrence of
wheezing in the last twelve months (six months in the first questionnaire) was reported in a list of
symptoms, and if present whether the mother consulted a doctor. Second, the mother was asked
whether their child had “wheezing with whistling on the chest when (s)he breathed”. Wheezing
was defined as present if the response to either question was “yes”, absent if both answers were
“no”, and missing for other combinations.
Outcome measures of ALSPAC were used as described previously.E1 Sensitization to common
allergens was defined as any positive skin prick test to house dust mite, grass or cat.
PIAMA study
All children of allergic mothers and a random sample of children of non-allergic mothers
were selected for more extensive medical examination, including a medical examination with
measurement of specific IgE levels at 4 years and a lung function measurement with bronchial
hyperresponsiveness at 8 years. All children were eligible for a medical examination with
measurement of specific IgE levels at 8 years of age. A detailed description of the study protocol
has been published previously.E2
Outcome measures of asthma at 8 years of age in the PIAMA study
Two definitions of asthma were used: 1) asthma ever, cumulative annual report on the presence
of doctor diagnosed asthma in the last 12 months, from birth to age 8, and 2) doctor-diagnosed
asthma, defined as a parental report of a doctor’s diagnosis of asthma at any time and a parental
report of asthma in the past 12 months, reported at age 8. Use of inhaled corticosteroids was
reported yearly from age 3 years to age 8 years. Usage of inhaled corticosteroids ever was defined
as use of inhaled corticosteroids in the last 12 months between age 3 years and 8 years.
Specific IgE levels were measured in venous blood by radioallergosorbent testing. Sensitization
was defined as specific IgE concentration ≥ 0.35 IU/ml for at least one of 8 common allergens
(house dust mite [Dermatophagoides pteronyssinus], cat [Fel d1], dog [Can f1], grass [Dactylis
glomerata], birch [Betula verrucosa], mould [Alternaria alternata], milk and egg). Sensitization for
indoor allergens (house dust mite, cat and dog) and food allergens (milk or egg) was also studied
separately.
R1R2R3R4R5R6R7R8R9
R10R11R12R13R14R15R16R17R18R19R20R21R22R23R24R25R26R27R28R29R30R31R32R33R34R35R36R37R38R39
70 | Chapter 3
Lung function was measured by spirometry with a pneumotachograph at age 8, and FEV1%predicted
values were calculated.E3 Bronchial responsiveness was measured with a methacholinebromide
provocation test until a fall of 20% in FEV1, using a dosimetric method.E4 Bronchial responsiveness
was expressed as dose-response slope of % decrease in FEV1 per milligram methacholinebromide,
and was logarithmically transformed to obtain a normal distribution.
Statistical analyses
Model Parameters in Longitudinal Latent Class Analysis
Longitudinal latent class analysis (LLCA) is a statistical approach to identify different latent groups
within a population within which the occurrence of wheeze at each time point is statistically
independent of wheeze at other times. LLCA identifies latent classes by use of a set of (longitudinal)
responses obtained for each subject. For example, a child might have responses “yes, no, no, no,
no, no, no and no” for the question on wheezing from birth to 8 years of age, whereas another
child might have responses “yes, yes, yes, yes, yes, yes, yes and no”. Such variability in these
patterns of responses is accounted for by a latent factor that groups together children exhibiting
similar patterns. LLCA models have two sets of parameters: 1) the conditional probabilities, i.e.
the probability of belonging to class n given a specific pattern of wheeze (for example: probability
of belonging to transient early wheeze given that a child wheezed at the first three responses)
and 2) the latent class probabilities, this is the proportion of children on each latent class. Based
on the assumption of conditional independence, the conditional probabilities can be used to
derive: 1) the probability of belonging to class n for each child, n=1,..,k where k is the total
number of classes (posterior membership probabilities) and 2) the prevalence of wheezing at each
time-point within each of the classes, from which a set of trajectories (wheezing trajectories) can
be plotted for comparison. In LLCA with incomplete data, the missing data adds uncertainty to
the posterior membership probabilities, which increases misclassification when assigning patterns
to phenotypes.
Measures of fit in Longitudinal Latent Class Analysis
The Bayesian Information Criterion (BIC) is a function of the likelihood that rewards parsimony,
i.e. models with fewer parameters are favored; the optimal model should have a low BIC value,
preferably the lowest.E5 The Bootstrap Likelihood Ratio Test (BLRT) is a test of an improvement in
fit between the n and n-1 class model, hence a high p-value for the test of fit of the n-class model
indicates that there was little improvement when compared with the n-1 class model. Entropy
is a single measure of the separation of the classes based on the posterior class membership
probabilities. Values between 0 and 1 are possible, with a value approaching 1 indicating a clear
R1R2R3R4R5R6R7R8R9R10R11R12R13R14R15R16R17R18R19R20R21R22R23R24R25R26R27R28R29R30R31R32R33R34R35R36R37R38R39
Comparison of childhood wheezing phenotypes in 2 birth cohorts: ALSPAC and PIAMA | 71
3
delineation of classes, i.e. each child has a high probability of being assigned to one class and low
probabilities for all other classes.E6
Optimal, free and constrained models
A free model is defined without any restrictions in the parameters, both conditional probabilities
and latent class probabilities are estimated free using a maximum likelihood procedure.
An optimal model is defined as the free model that best fits the data. As there is no single
measure of model fit that can be used to determine the optimal model, a variety of different
criteria were employed, each assessing a different aspect of the models to be compared. (See
section Measures of Fit in LLCA).
In the constrained models we only fixed the conditional probabilities, therefore the derived
wheezing trajectories in the constrained model in PIAMA were equivalent to the optimal ALSPAC
model; however the prevalences of each phenotype were different among cohorts.
Results
Analyses of children with complete data
Table E1 shows the measures of goodness of fit and the prevalences of the wheezing phenotypes
in the optimal, free and constrained models in the first 8 years of life in the ALSPAC study and the
PIAMA study. In ALSPAC, there was evidence of improved fit of a 7-class model based on the BIC
and the BLRT; however the entropy was slightly higher for the 6-class model (0.79 vs. 0.76). The
additional phenotype in the 7-class model, which we named “transient intermediate”, resulted
mainly from splitting the prolonged early wheezing phenotype.
In PIAMA, the BIC was lowest and the entropy was highest for the 5-class model. The BLRT from
the 6-class model showed no improvement in fit (p=0.18). Therefore we choose the 5-class model
as the optimal model. Interestingly, in the 6-class model the additional phenotype was similar to
the additional phenotype identified in ALSPAC 7-class model: transient intermediate.
When comparing the PIAMA 6-class constrained vs. 5-class optimal, the BIC was slightly lower
for the constrained model (possibly due to a reduced number of parameters), however the
constrained model had lower entropy than the optimal model, which indicates that the classes
were slightly better separated in the optimal model.

R1R2R3R4R5R6R7R8R9
R10R11R12R13R14R15R16R17R18R19R20R21R22R23R24R25R26R27R28R29R30R31R32R33R34R35R36R37R38R39
72 | Chapter 3
Table E1. Model characteristics and prevalences of wheezing phenotypes derived from longitudinal latent class models of complete data in the first 8 years of life in the ALSPAC study and the PIAMA study
ALSPAC
Free (Optimal)ALSPAC
FreePIAMA
Constrained†PIAMA Free(Optimal)
PIAMAFree
No. classes 7 6 6 5 6No. complete cases 5,760 5,760 2,810 2,810 2,810No. free parameters 62 53 5 44 53Bayesian Information Criterion* 33,718 33,737 13,147 13,241 13,291Entropy* 0.76 0.79 0.83 0.87 0.83Bootstrap Likelihood Ratio Test* 0.001 0.001 - <0.00001 0.18Prevalence of Wheezing Phenotypes‡ (%)
Never/Infrequent 56.1 61.1 73.5 75.0 69.7Transient Early 20.1 16.5 12.9 16.7 16.3
Prolonged Early 5.0 9.3 8.4 N/A N/ATransient Intermediate 6.3 N/A N/A N/A 7.3
Intermediate Onset 2.6 2.5 0.8 3.1 1.8Late Onset 4.4 4.9 2.2 1.7 1.8Persistent 5.5 5.8 2.1 3.5 3.2
* For a detailed description see Measures of fit in Longitudinal Latent Class Analysis. † LLCA models have two sets of parameters: the conditional probabilities (probability of belonging to a latent class n given a specific pattern of wheeze) and the latent class probabilities, this is the proportion of children on each latent class. In the constrained models we only fix the conditional probabilities, allowing the prevalences of the wheezing phenotypes to vary among the cohorts.‡ Based on estimated posterior probabilities.
R1R2R3R4R5R6R7R8R9R10R11R12R13R14R15R16R17R18R19R20R21R22R23R24R25R26R27R28R29R30R31R32R33R34R35R36R37R38R39
Comparison of childhood wheezing phenotypes in 2 birth cohorts: ALSPAC and PIAMA | 73
3
Tab
le E
2. M
ost f
requ
ently
occ
urrin
g pa
tter
ns o
f whe
eze
durin
g th
e fir
st 8
yea
rs o
f life
from
the
PIA
MA
5-c
lass
opt
imal
mod
el u
sing
2,8
10 c
hild
ren
with
com
plet
e da
ta a
nd t
heir
mos
t lik
ely
phen
otyp
e in
the
6-c
lass
con
stra
ined
mod
el.
Opt
imal
†N
Patt
ern
of
whe
eze§
PO†
C‡
PC‡
Opt
imal
†N
Patt
ern
of
whe
eze§
PO†
C‡
PC‡
Nev
er/
Infr
eque
nt (N
I)
1631
0000
0000
0.99
NI
0.98
Tran
sien
t Ea
rly (T
E)
7811
0000
000.
82TE
0.88
249
1000
0000
0.89
NI
0.80
4211
1000
000.
99TE
0.86
9801
0000
000.
78N
I0.
5440
1010
0000
0.81
TE0.
6463
0010
0000
0.78
NI
0.79
3001
1000
000.
91TE
0.75
3500
0010
000.
88N
I0.
9223
1111
0000
0.99
PE0.
7331
0001
0000
0.78
NI
0.88
1611
0100
000.
99TE
0.62
2400
0000
010.
93N
I0.
9115
0011
0000
0.75
PE0.
6413
0000
0100
0.81
NI
0.95
1310
0100
000.
75N
I0.
4310
0000
0010
0.79
NI
0.89
1211
1010
000.
99PE
0.77
710
0000
010.
57N
I0.
5810
0111
0000
0.99
PE0.
79
Inte
r.Ons
et(IO
)
1100
0110
000.
78PE
0.70
Late
ons
et
(LO
)
700
0000
110.
94LO
0.86
Pers
iste
nt (P
)
1411
1111
111.
00P
1.00
600
1111
010.
84IO
0.78
500
0001
110.
98LO
1.00
1111
1111
101.
00P
0.94
500
0011
000.
86N
I0.
425
1000
0111
0.98
LO1.
008
0111
1111
1.00
P0.
965
0011
1100
0.88
PE0.
904
0000
1111
0.89
LO0.
865
0111
1100
0.95
PE0.
954
0001
1111
0.76
IO0.
933
0000
0110
0.84
LO0.
845
1111
1001
0.88
PE0.
863
0000
1001
0.62
NI
0.45
301
0000
110.
93LO
0.89
401
1111
101.
00P
0.87
300
0101
000.
77N
I0.
502
0000
0101
0.44
LO0.
764
1011
1111
0.92
P0.
813
0001
1101
0.98
IO0.
812
0000
1011
0.85
LO0.
954
1111
1101
1.00
P0.
793
0010
1100
0.89
PE0.
862
0100
0111
1.00
LO0.
993
1111
1010
0.94
PE0.
613
0011
1011
0.75
IO0.
817
0000
0011
0.94
LO0.
862
0101
1110
0.92
P0.
55
† Mos
t lik
ely
whe
ezin
g ph
enot
ype
in t
he o
ptim
al m
odel
(O
ptim
al)
and
the
prob
abili
ty t
hat
a ch
ild w
ith t
his
patt
ern
will
bel
ong
to t
his
phen
otyp
e (P
O).
‡ Mos
t lik
ely
whe
ezin
g ph
enot
ype
in t
he c
onst
rain
ed m
odel
(C) a
nd t
he p
roba
bilit
y th
at a
chi
ld w
ith t
his
patt
ern
will
bel
ong
to t
his
phen
otyp
e (P
C).
§ Th
e ei
ght
digi
ts
repr
esen
t th
e pr
esen
ce o
f w
heez
e at
age
1,
2, 3
, 4,
5,
6, 7
and
8 y
ears
; 0=
no,
1=ye
s. A
bbre
viat
ions
: N
I=ne
ver/
infr
eque
nt w
heez
e, T
E=tr
ansi
ent
early
whe
eze,
PE
= p
rolo
nged
ear
ly w
heez
e, IO
=in
term
edia
te o
nset
whe
eze,
LO
=la
te o
nset
whe
eze,
P=
pers
iste
nt w
heez
e.

R1R2R3R4R5R6R7R8R9
R10R11R12R13R14R15R16R17R18R19R20R21R22R23R24R25R26R27R28R29R30R31R32R33R34R35R36R37R38R39
74 | Chapter 3
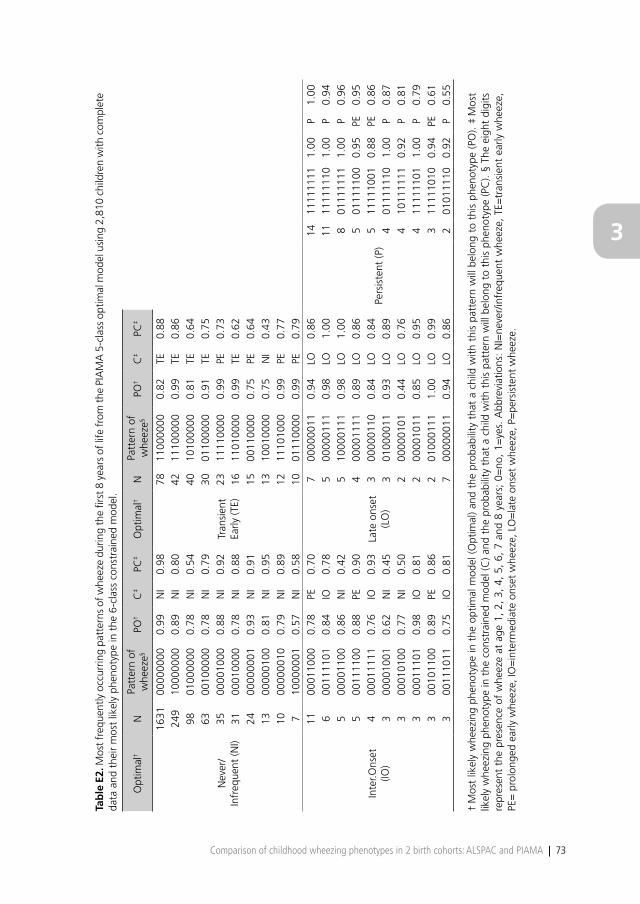
Table E2 shows the most frequently occurring patterns of wheeze in PIAMA data and their most
likely phenotype in the optimal and constrained model with 8 time-points. The patterns of wheeze
assigned to the “prolonged early wheeze” phenotype in the constrained model were assigned
mainly to the “transient early wheeze” in the optimal model, and also to the “intermediate onset”
and “persistent wheeze” phenotypes. The patterns that seem to ‘move’ more between models
are those that in the optimal model would be assigned to the “intermediate onset” phenotype.
The decrease in the prevalence of the “intermediate onset” phenotype of 2.3% (3.1% in optimal
model to 0.8% in constrained model) shows that this phenotype is quite different from the
intermediate phenotype defined in ASLPAC: not only in shape (see Figure 1 & Figure 2 in main
manuscript) but also in size, and when we constrain PIAMA data to the phenotypes as derived
in ALSPAC, this phenotype is under-represented, which is reflected with a decrease in entropy.
Analyses of children with 2-8 observations of wheeze
The figures of the wheezing phenotypes of the optimal models for the first 8 years of life in
children with 2-8 observations of wheeze in ALSPAC and PIAMA are shown in Figure E1 and
E2 respectively. These figures are remarkably similar to Figures 1 and 2 from the complete case
analysis.
Table E3 shows the measures of goodness of fit of the optimal, free and constrained models in
data of 2-8 observations of wheeze in ALSPAC and PIAMA. When using all children in PIAMA
with at least two observations of wheeze, the identified five phenotypes are consistent with those
from the analysis with complete cases. Together with the results of complete cases, these findings
show that the PIAMA models are very consistent independently of the number of observations
(children with 8 observations vs. children with 2-8 observations).

R1R2R3R4R5R6R7R8R9R10R11R12R13R14R15R16R17R18R19R20R21R22R23R24R25R26R27R28R29R30R31R32R33R34R35R36R37R38R39
Comparison of childhood wheezing phenotypes in 2 birth cohorts: ALSPAC and PIAMA | 75
3
Figure E1. Estimated prevalence of wheeze at each time point from birth to age 8 years for each wheezing phenotype in ALSPAC free 6-class model including children with 2-8 observations of wheeze (N=11,740).
Figure E2. Estimated prevalence of wheeze at each time point from birth to age 8 years for each wheezing phenotype in PIAMA optimal 5-class model including children with 2-8 observations of wheeze (N=3,789).

R1R2R3R4R5R6R7R8R9
R10R11R12R13R14R15R16R17R18R19R20R21R22R23R24R25R26R27R28R29R30R31R32R33R34R35R36R37R38R39
76 | Chapter 3
Table E3. Model characteristics and prevalences of wheezing phenotypes derived from longitudinal latent class models of data with 2-8 observations of wheeze in the first 8 years of life in the ALSPAC study and the PIAMA study.
ALSPAC Free
(Optimal)ALSPAC
FreePIAMA
Constrained†PIAMA Free(Optimal)
PIAMAFree
No. classes 7 6 6 5 6No. children with 2-8 observations 11,740 11,740 3,789 3,789 3,789No. free parameters 62 53 5 44 53Bayesian Information Criterion* 60,053 60,084 17,359 17,415 17,464Entropy* 0.69 0.72 0.81 0.85 0.78Bootstrap Likelihood Ratio Test* <0.0001 <0.0001 - <0.0001 0.03Prevalence of Wheezing Phenotypes‡ (%)
Never/Infrequent 55.2 60.4 73.4 73.2 65.7Transient Early 19.6 15.2 11.9 17.3 17.5
Prolonged Early 5.5 10.1 8.8 N/A N/ATransient Intermediate 6.5 N/A N/A N/A 9.3
Intermediate Onset 2.4 2.6 0.8 3.4 2.0Late Onset 4.6 5.1 2.5 1.8 1.7Persistent 6.2 6.6 2.7 4.3 3.8
* For a detailed description see Measures of fit in Longitudinal Latent Class Analysis. † LLCA models have two sets of parameters: the conditional probabilities (probability of belonging to a latent class n given a specific pattern of wheeze) and the latent class probabilities, this is the proportion of children on each latent class. In the constrained models we only fix the conditional probabilities, allowing the prevalences of the wheezing phenotypes to vary among the cohorts.‡ Based on estimated posterior probabilities.
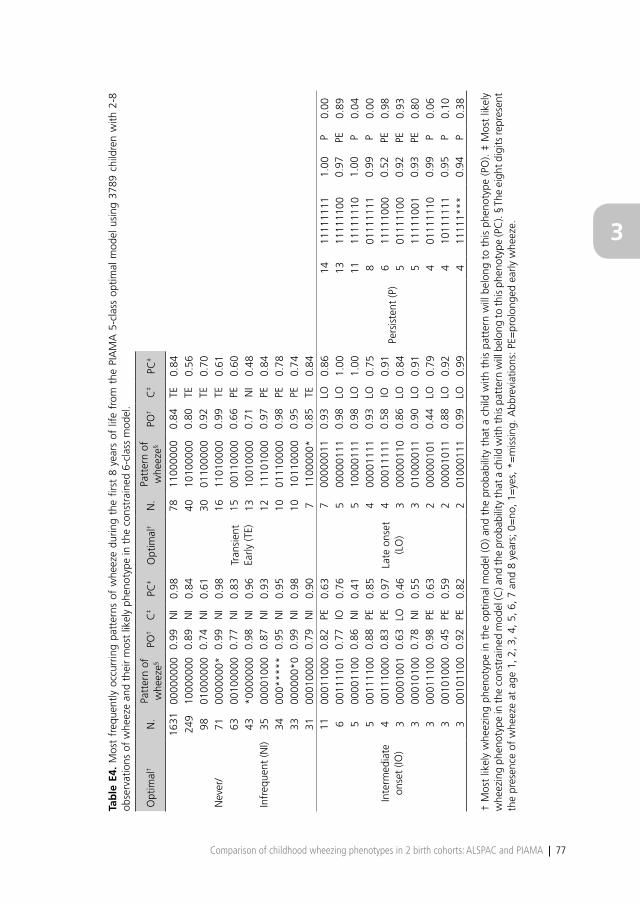
Table E4 shows the most frequently occurring patterns of wheezing and their most likely
phenotype in the optimal and constrained model with 8 time-points including children with 2-8
observations of wheeze. Similar conclusions as those derived from Table E2 can be applied to this
table.
Tables E5-E8 show the associations of wheezing phenotypes with asthma, sensitization and lung
function for children with 2-8 observations of wheeze. Similar patterns of associations as those
found in the complete case analysis were found when analyzing children with 2-8 observations
of wheeze.
Table E9 shows directly comparable associations of wheezing phenotypes with doctor-diagnosed
asthma, sensitization to any common allergen and lung function measures in the extended
ALSPAC 6-class free model and PIAMA optimal 5-class model for children with 2-8 observations
of wheeze.
Table E10 reports the distributions of the five identified wheezing phenotypes in PIAMA data
among the four wheezing phenotypes defined by the Tucson Children’s Respiratory Study.
R1R2R3R4R5R6R7R8R9R10R11R12R13R14R15R16R17R18R19R20R21R22R23R24R25R26R27R28R29R30R31R32R33R34R35R36R37R38R39
Comparison of childhood wheezing phenotypes in 2 birth cohorts: ALSPAC and PIAMA | 77
3
Tab
le E
4. M
ost
freq
uent
ly o
ccur
ring
patt
erns
of
whe
eze
durin
g th
e fir
st 8
yea
rs o
f lif
e fr
om t
he P
IAM
A 5
-cla
ss o
ptim
al m
odel
usi
ng 3
789
child
ren
with
2-8
ob
serv
atio
ns o
f w
heez
e an
d th
eir
mos
t lik
ely
phen
otyp
e in
the
con
stra
ined
6-c
lass
mod
el.
Opt
imal
†N
.Pa
tter
n of
w
heez
e§PO
†C
‡PC
‡O
ptim
al†
N.
Patt
ern
of
whe
eze§
PO†
C‡
PC‡
Nev
er/
Infr
eque
nt (N
I)
1631
0000
0000
0.99
NI
0.98
Tran
sien
t Ea
rly (T
E)
7811
0000
000.
84TE
0.84
249
1000
0000
0.89
NI
0.84
4010
1000
000.
80TE
0.56
9801
0000
000.
74N
I0.
6130
0110
0000
0.92
TE0.
7071
0000
000*
0.99
NI
0.98
1611
0100
000.
99TE
0.61
6300
1000
000.
77N
I0.
8315
0011
0000
0.66
PE0.
6043
*000
0000
0.98
NI
0.96
1310
0100
000.
71N
I0.
4835
0000
1000
0.87
NI
0.93
1211
1010
000.
97PE
0.84
3400
0***
**0.
95N
I0.
9510
0111
0000
0.98
PE0.
7833
0000
00*0
0.99
NI
0.98
1010
1100
000.
95PE
0.74
3100
0100
000.
79N
I0.
907
1100
000*
0.85
TE0.
84
Inte
rmed
iate
on
set
(IO)
1100
0110
000.
82PE
0.63
Late
ons
et
(LO
)
700
0000
110.
93LO
0.86
Pers
iste
nt (P
)
1411
1111
111.
00P
0.00
600
1111
010.
77IO
0.76
500
0001
110.
98LO
1.00
1311
1111
000.
97PE
0.89
500
0011
000.
86N
I0.
415
1000
0111
0.98
LO1.
0011
1111
1110
1.00
P0.
045
0011
1100
0.88
PE0.
854
0000
1111
0.93
LO0.
758
0111
1111
0.99
P0.
004
0011
1000
0.83
PE0.
974
0001
1111
0.58
IO0.
916
1111
1000
0.52
PE0.
983
0000
1001
0.63
LO0.
463
0000
0110
0.86
LO0.
845
0111
1100
0.92
PE0.
933
0001
0100
0.78
NI
0.55
301
0000
110.
90LO
0.91
511
1110
010.
93PE
0.80
300
0111
000.
98PE
0.63
200
0001
010.
44LO
0.79
401
1111
100.
99P
0.06
300
1010
000.
45PE
0.59
200
0010
110.
88LO
0.92
410
1111
110.
95P
0.10
300
1011
000.
92PE
0.82
201
0001
110.
99LO
0.99
411
111*
**0.
94P
0.38
† M
ost
likel
y w
heez
ing
phen
otyp
e in
the
opt
imal
mod
el (
O)
and
the
prob
abili
ty t
hat
a ch
ild w
ith t
his
patt
ern
will
bel
ong
to t
his
phen
otyp
e (P
O).
‡ M
ost
likel
y w
heez
ing
phen
otyp
e in
the
cons
trai
ned
mod
el (C
) and
the
prob
abili
ty th
at a
chi
ld w
ith th
is p
atte
rn w
ill b
elon
g to
this
phe
noty
pe (P
C).
§ The
eig
ht d
igits
repr
esen
t th
e pr
esen
ce o
f w
heez
e at
age
1, 2
, 3, 4
, 5, 6
, 7 a
nd 8
yea
rs; 0
=no
, 1=
yes,
*=
mis
sing
. Abb
revi
atio
ns: P
E=pr
olon
ged
early
whe
eze.

R1R2R3R4R5R6R7R8R9
R10R11R12R13R14R15R16R17R18R19R20R21R22R23R24R25R26R27R28R29R30R31R32R33R34R35R36R37R38R39
78 | Chapter 3
Table E5. Associations of wheezing phenotypes in PIAMA optimal 5-class model with diagnosed asthma at 0-8 years, doctor diagnosed asthma at 8 years and use of inhaled corticosteroids at 3-8 years.
Asthma everat 8 years
Doctor-diagnosed asthmaat 8 years
Use of inhaled corticosteroidsat 3-8 yrs
PhenotypeTotaln (%)
OR(95% CI)
Totaln (%)
OR (95% CI)
Totaln (%)
OR(95% CI)
Never/Infrequent2161
148 (6.9)1.0
(reference)2405
23 (0.9)1.0
(reference)2139
201 (9.4)1.0
(reference)
Transient Early517
193 (37.3)8.1
(6.3, 10.3)548
20 (3.7)4.0
(2.2, 7.4)513
191 (37.3)5.7
(4.5, 7.2)
Intermediate Onset107
54 (50.4)13.8
(9.1, 20.8)112
18 (16.3)20.5
(10.7, 39.2)104
71 (68.0)20.4
(13.2, 31.6)
Late Onset56
35 (62.6)22.7
(12.9, 39.9)61
17 (27.7)40.3
(20.1, 80.7)55
32 (57.4)13.0
(7.5, 22.6)
Persistent133
106 (79.4)52.1
(33.2, 81.9)124
38 (30.4)46.0
(26.2, 80.8)134
(15 (85.6)57.2
(34.6, 94.7)
Total2973
536 (18.0)-
3251116 (3.6)
-2945
609 (20.7)-
Results from weighted logistic regression models in children with 2-8 observations of wheeze.* n represents the sum of the membership probabilities of the affected children for that phenotype, and total represents the sum of the membership probability of all children for that phenotype.
Table E6. Associations of wheezing phenotypes in PIAMA optimal 5-class model with sensitization against any allergen, indoor allergens or food allergens at 4 years.
Sensitization to any common allergen
at 4 years
Sensitization to indoor allergensat 4 years
Sensitization to food allergensat 4 years
PhenotypeTotaln (%)
OR(95% CI)
Totaln (%)
OR (95% CI)
Totaln (%)
OR (95% CI)
Never/Infrequent462
167 (36.2)1.0
(reference)483
51 (10.6)1.0
(reference)339
100 (29.4)1.0
(reference)
Transient Early151
62 (41.0)1.2
(0.8, 1.8)158
27 (17.0)1.7
(1.0, 2.9)114
28 (24.5)1.3
(0.9, 1.9)
Intermediate Onset30
21 (69.9)4.1
(1.8, 9.1)31
16 (53.0)9.5
(4.4, 20.4)22
8 (35.9)2.1
(1.0, 4.4)
Late Onset20
14 (72.4)4.6
(1.7, 12.6)20
12 (60.7)13.0
(5.1, 33.6)14
4 (28.5)1.2
(0.4, 3.3)
Persistent43
23 (53.0)2.0
(1.1, 3.7)44
19 (42.1)6.1
(3.2, 11.9)29
9 (29.3)1.1
(0.5, 2.2)
Total707
288 (40.7)-
736125 (17.0)
-518
148 (28.6)-
Results from weighted logistic regression models in children with 2-8 observations of wheezing.* n represents the sum of the membership probabilities of the affected children for that phenotype, and total represents the sum of the membership probability of all children for that phenotype.

R1R2R3R4R5R6R7R8R9R10R11R12R13R14R15R16R17R18R19R20R21R22R23R24R25R26R27R28R29R30R31R32R33R34R35R36R37R38R39
Comparison of childhood wheezing phenotypes in 2 birth cohorts: ALSPAC and PIAMA | 79
3
Table E7. Associations of wheezing phenotypes in PIAMA optimal 5-class model with sensitization against any allergen, indoor allergens or food allergens at 8 years.
Sensitization to any common allergen at 8
years
Sensitization to indoor allergensat 8 years
Sensitization to food allergensat 8 years
PhenotypeTotaln (%)
OR(95% CI)
Totaln (%)
OR (95% CI)
Totaln (%)
OR (95% CI)
Never/Infrequent1220
446 (36.6)1.0
(reference)1223
243 (19.9)1.0
(reference)1221
183 (15.0)1.0
(reference)
Transient Early305
128 (41.9)1.3
(1.0, 1.6)307
75 (24.3)1.3
(1.0, 1.7)305
55 (18.2)1.3
(0.9, 1.7)
Intermediate Onset63
46 (72.2)4.5
(2.6, 7.9)63
35 (55.2)5.0
(3.0, 8.3)63
19 (29.9)2.4
(1.4, 4.2)
Late Onset35
26 (75.1)5.2
(2.4, 11.4)35
24 (69.7)9.3
(4.5, 19.4)35
8 (23.5)1.7
(0.8, 3.0)
Persistent78
47 (60.3)2.6
(1.7, 4.2)79
43 (54.4)4.8
(3.0, 7.7)79
19 (23.9)1.8
(1.0, 3.0)
Total1701
693 (40.7)-
1708420 (24.6)
-1704
285 (16.7)-
Results from weighted logistic regression models in children with 2-8 observations of wheezing.* n represents the sum of the membership probabilities of the affected children for that phenotype, and total represents the sum of the membership probability of all children for that phenotype.

R1R2R3R4R5R6R7R8R9
R10R11R12R13R14R15R16R17R18R19R20R21R22R23R24R25R26R27R28R29R30R31R32R33R34R35R36R37R38R39
80 | Chapter 3
Table E8. Associations of wheezing phenotypes in PIAMA optimal 5-class model of children with 2-8 observations of wheeze with lung function and airway hyper responsiveness.
FEV1 % predicted at 8 years* Bronchial responsiveness at 8 years†
Phenotype n ‡ Mean (sd)Mean Difference
(95% CI)n ‡
GeometricMean
(95% CI)
Ratio of Geometric Means
(95% CI)
Never/Infrequent 736 107.8 (11.1) 0 (reference) 657 16.3 (14.2, 18.7) 1 (reference)Transient Early 201 105.3 (10.7) -2.5 (-4.3, -0.8) 178 20.4 (15.6, 26.6) 1.3 (0.9, 1.7)Intermediate Onset 43 104.5 (13.5) -3.3 (-6.8, 0.1) 37 47.8 (26.7, 85.5) 2.9 (1.6, 5.3)Late Onset 27 105.4 (11.8) -2.4 (-6.8, 2.0) 22 58.3 (27.6, 123.0) 3.6 (1.7, 7.7)Persistent 51 102.1 (13.2) -5.8 (-9.0, -2.6) 44 49.0 (28.6, 83.7) 3.0 (1.7, 5.2)Total 1058 - - 938 - -
Results from weighted linear regression models in children with 2-8 observations of wheeze.* Percentage of predicted forced expiratory flow in 1 s based on height and gender.† Measured as dose-response slope (% decline in FEV1 per milligram methacholinebromide).‡ n represents the sum of the membership probabilities of all children for that phenotype.
Table E9. Comparison of associations between wheezing phenotypes and doctor-diagnosed asthma, sensitization to any common allergen and lung function measures at 8 years in ALSPAC and PIAMA.
Doctor diagnosed asthma at 8 years**
Sensitization to any common allergen
at 8 years
FEV1 % predicted at 8 years*
Bronchial responsiveness at
8 years†
Phenotype OR (95%CI) OR (95%CI)Mean Difference
(95%CI)Ratio of geometric
means (95%CI)
ALSPAC 6-class extended model±
Never/Infrequent 1 (ref) 1 (ref) 0 (ref) 1 (ref)
Transient early 1.5 (1.0, 2.2) 0.9 (0.8, 1.1) -2.1 (-2.9, -1.2) 1.2 (1.0, 1.4)
Prolonged early 7.6 (5.6, 10.2) 1.3 (1.0, 1.6) -3.0 (-4.0, -2.0) 1.5 (1.3, 1.8)
Intermediate onset 264.1 (163.1, 418) 6.9 (4.9, 9.7) -3.3 (-5.2, -1.5) 4.8 (3.5, 6.8)
Late onset 51.4 (38.6, 68.5) 4.0 (3.1, 5.1) -2.5 (-3.8, -1.1) 3.0 (2.4, 3.9)
Persistent 268.7 (190.6, 379) 4.0 (3.2, 5.0) -4.2 (-5.4, -3.0) 3.1 (2.5, 3.9)
Total 7305 5887 6262 4266
PIAMA 5-class model
Never/Infrequent 1 (ref) 1 (ref) 0 (ref) 1 (ref)
Transient early 4.0 (2.2, 7.4) 1.3 (1.0, 1.6) -2.5 (-4.3, -0.8) 1.3 (0.9, 1.7)
Intermediate onset 20.5 (10.7, 39.2) 4.5 (2.6, 7.9) -3.3 (-6.8, 0.1) 2.9 (1.6, 5.3)
Late onset 40.3 (20.1, 80.7) 5.2 (2.4, 11.4) -2.4 (-6.8, 2.0) 3.6 (1.7, 7.7)
Persistent 46.0 (26.2, 80.8) 2.6 (1.7, 4.2) -5.8 (-9.0, -2.6) 3.0 (1.7, 5.2)
Total 3251 707 1058 938
Results from weighted regression models using children with 2-8 observations of wheeze.± Extended model with 8th time point at 91 months.* Defined as a parental report of a doctor’s diagnosis of asthma at any time and a parental report of asthma in the past 12 months, reported at age 8.** Percentage of predicted forced expiratory flow in 1 s based on height and gender.† Measured as dose-response slope (% decline in FEV1 per milligram methacholinebromide).

R1R2R3R4R5R6R7R8R9R10R11R12R13R14R15R16R17R18R19R20R21R22R23R24R25R26R27R28R29R30R31R32R33R34R35R36R37R38R39
Comparison of childhood wheezing phenotypes in 2 birth cohorts: ALSPAC and PIAMA | 81
3
Table E10. Distribution of the five wheezing phenotypes identified in PIAMA data among the four phenotypes as defined by the Tucson Children’s Respiratory Study (TCRS).
TCRS’s phenotypes
PIAMA’s phenotypesNever
wheezeTransient early
wheezeLate onset wheeze
Persistent wheeze
Never/infrequent wheeze 81 % 18 % 1 % 0 %Transient early wheeze 5 % 86 % 1 % 8 %Intermediate onset wheeze 21 % 21 % 26 % 31 %Late onset wheeze 23 % 13 % 29 % 34 %Persistent wheeze 0 % 19 % 0 % 81 %Total 63 % 30 % 2 % 6 %
Results from weighted cross tabulation using children with complete data.

R1R2R3R4R5R6R7R8R9
R10R11R12R13R14R15R16R17R18R19R20R21R22R23R24R25R26R27R28R29R30R31R32R33R34R35R36R37R38R39
82 | Chapter 3
References
E1. Henderson J, Granell R, Heron J, Sherriff A, Simpson A, Woodcock A, et al. Associations of wheezing phenotypes in the first 6 years of life with atopy, lung function and airway hyperresponsiveness in mid-childhood. Thorax 2008;63:974-80.
E2. Brunekreef B, Smit J, de Jongste J, Neijens H, Gerritsen J, Postma D, et al. The prevention and incidence of asthma and mite allergy (PIAMA) birth cohort study: design and first results. Pediatr Allergy Immunol 2002;13 Suppl 15:55-60.
E3. Zapletal A, Paul T, Samanek M. [Significance of contemporary methods of lung function testing for the detection of airway obstruction in children and adolescents (author’s transl)]. Z Erkr Atmungsorgane 1977 August;149:343-71.
E4. De Meer G, Heederik DJ, Brunekreef B, Postma DS. Repeatability of bronchial hyperresponsiveness to adenosine-5’-monophosphate (AMP) by a short dosimeter protocol. Thorax 2001;56(5):362-5.
E5. Nylund KL, Asparouhov T, Muthén BO. Deciding on the Number of Classes in Latent Class Analysis and Growth Mixture Modeling. A Monte Carlo Simulation Study. Structural Equation Modeling 2007;14:535-69.
E6. Seleux G, Soromenho G. An entropy criterion for assessing the number of clusters in a mixture model. Journal of Classification 1996;13:195-212.