UNIVERSITY OF ELAWARE · University of Delaware ... Early Trial Pre-Harvest Data ... first flower...
35
Emmalea Ernest & Gordon Johnson _________ University of Delaware Carvel Research and Education Center 16483 County Seat Highway Georgetown, DE 19947 VARIETY TRIAL RESULTS 2016 UNIVERSITY OF DELAWARE
Transcript of UNIVERSITY OF ELAWARE · University of Delaware ... Early Trial Pre-Harvest Data ... first flower...

Emmalea Ernest & Gordon Johnson _________
University of Delaware
Carvel Research and Education Center 16483 County Seat Highway
Georgetown, DE 19947
VARIETY TRIAL RESULTS
2016
UNIVERSITY OF DELAWARE

I
Table of Contents
Introduction ................................................................................................................................... 1 Materials and Methods ................................................................................................................. 1 Discussion of Trial Results ........................................................................................................... 2 Early Trial Pre-Harvest Data ...................................................................................................... 3 Early Trial Harvest Data.............................................................................................................. 5 Plant Characteristics for Early Trial Varieties Based on a 10-Plant Sample ......................... 9 Early Trial Maturity Data.......................................................................................................... 12 Chart 1E: Adjusted Net Yield (lbs/A) by Heat Units Accumulated at T-Reading of 100 .... 13 Late Trial Pre-Harvest Data ...................................................................................................... 14 Late Trial Harvest Data ............................................................................................................. 16 Plant Characteristics for Late Trial Varieties Based on a 10-Plant Sample ......................... 20 Late Trial Maturity Data ........................................................................................................... 23 Chart 1L: Adjusted Net Yield (lbs/A) by Heat Units Accumulated at T-Reading of 100 .... 24 Appendix A: Weather Data for the 2016 Early Pea Variety Trial ......................................... 25 Appendix B: Weather Data for the 2016 Late Pea Variety Trial ........................................... 27 Appendix C: Adjusting Pea Yields to a T-reading of 100 ....................................................... 29

II
Acknowledgements
The authors wish to thank the following people and companies for their support, interest and guidance of the 2016 Pea Variety Trials. Participating Seed Companies Pure Line Seeds, Inc. Brotherton Seed Co., Inc. Crites Seeds, Inc. Monsanto Company, Seminis Vegetable Seeds Gallatin Valley Seed Storm Seeds Seed of standard varieties was provided by collaborating vegetable processors, Hanover Foods, The Pictsweet Company, and J.G. Townsend Frozen Foods. Thank you to the farm staff at the University of Delaware Research & Education Center, Georgetown, for their assistance in planting and irrigating the trials, as well as maintaining the viner. Our thanks also to the following seasonal employees for their hard work during the pea harvest: Brianna Bryfogle, Kenna Hunt, Brandon Hunt, Danielle Vanderhei and Bert Weber.

1
2016 University of Delaware Pea Variety Trial Emmalea Ernest & Gordon Johnson University of Delaware Elbert N. and Ann V. Carvel Research and Education Center 16483 County Seat Highway Georgetown Delaware 19947 (302) 856-7307 [email protected]; [email protected] Introduction The 2016 Pea Variety Trials were conducted at the University of Delaware Research and Education Center. The purpose of these trials is to evaluate and identify varieties best adapted for our production region. Yield, quality and maturity are important characteristics that can vary for any one variety between production regions. Similar trials have been conducted on the farm since 1994. Trials were planted on two dates (mid- March and mid-April) to place the varieties in the planting season appropriate for their maturity classification. This year’s trials were planted on March 17 and April 15. Early maturing varieties are generally planted during the first half of the planting season and longer maturing varieties are planted in the second half. Later plantings are exposed to warmer conditions, which generate quicker accumulations of heat units. Thus, longer maturing varieties are used in later plantings. Materials and Methods Planting and Crop Management Twenty-five varieties were planted in the March 17 trial, and 22 varieties in the April 15 trial. The trials were located in Field 27-A at the University of Delaware Research Farm in Georgetown, DE. Field was limed and potassium was applied according to soil test results prior to planting. Both were irrigated as needed, and grown under standard commercial management practices. Weed control in both trials was good. Planting Date: Early Trial – March 17, 2016; 25 varieties Late Trial – April 15, 2016; 22 varieties Herbicide: Pursuit @ 2 oz/A + Dual II Magnum @ 1 pt/A with 28% UAN at 30 gal/A (90 lbs
N/A) applied preemergence Planting: Trials were planted using an Almaco drill with 9 rows spaced 8 inches apart. Seeding rate was 8 to 9 seeds per foot of row. Insecticide: Late Trial – Diazinon Ag 500 3 qt/A incorporated the day before planting Stands: Early Trial – stands of some varieties were reduced by seed corn maggot Late Trial - stands were excellent Plot Design: 6 x 30 foot plots arranged in a randomized complete block design with 3 replications
1
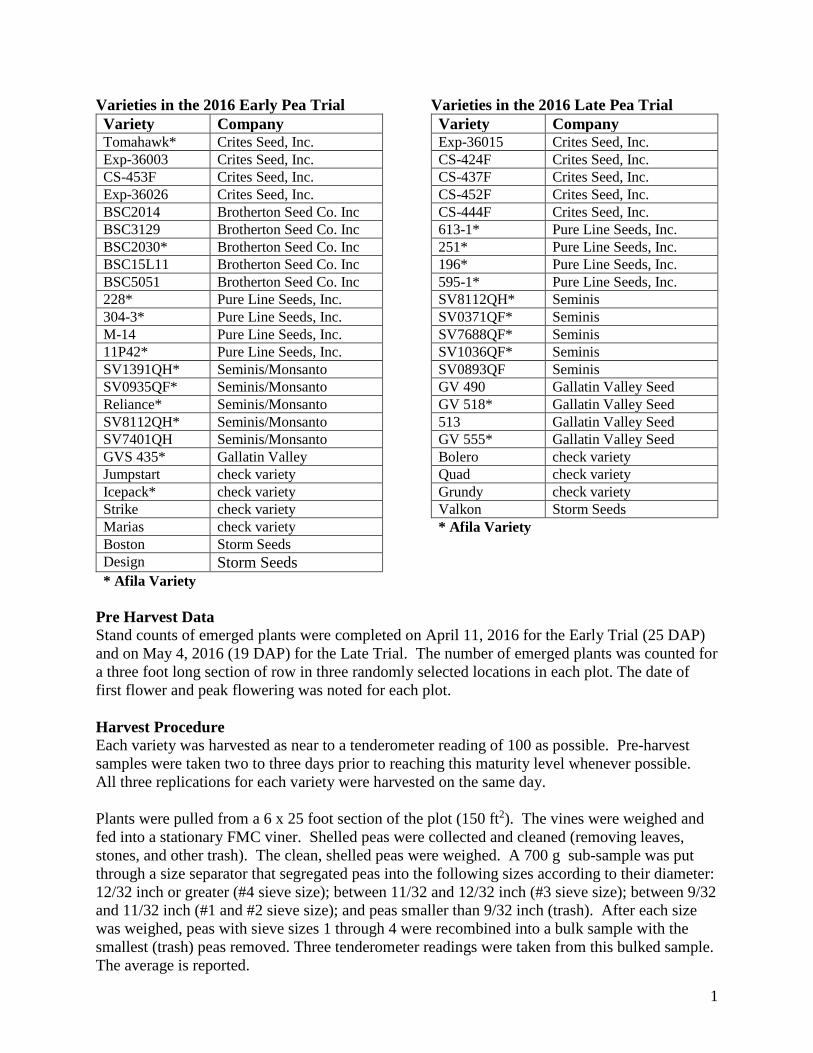
Varieties in the 2016 Early Pea Trial Variety Company Tomahawk* Crites Seed, Inc. Exp-36003 Crites Seed, Inc. CS-453F Crites Seed, Inc. Exp-36026 Crites Seed, Inc. BSC2014 Brotherton Seed Co. Inc BSC3129 Brotherton Seed Co. Inc BSC2030* Brotherton Seed Co. Inc BSC15L11 Brotherton Seed Co. Inc BSC5051 Brotherton Seed Co. Inc 228* Pure Line Seeds, Inc. 304-3* Pure Line Seeds, Inc. M-14 Pure Line Seeds, Inc. 11P42* Pure Line Seeds, Inc. SV1391QH* Seminis/Monsanto SV0935QF* Seminis/Monsanto Reliance* Seminis/Monsanto SV8112QH* Seminis/Monsanto SV7401QH Seminis/Monsanto GVS 435* Gallatin Valley Jumpstart check variety Icepack* check variety Strike check variety Marias check variety Boston Storm Seeds Design Storm Seeds * Afila Variety
Varieties in the 2016 Late Pea Trial Variety Company Exp-36015 Crites Seed, Inc. CS-424F Crites Seed, Inc. CS-437F Crites Seed, Inc. CS-452F Crites Seed, Inc. CS-444F Crites Seed, Inc. 613-1* Pure Line Seeds, Inc. 251* Pure Line Seeds, Inc. 196* Pure Line Seeds, Inc. 595-1* Pure Line Seeds, Inc. SV8112QH* Seminis SV0371QF* Seminis SV7688QF* Seminis SV1036QF* Seminis SV0893QF Seminis GV 490 Gallatin Valley Seed GV 518* Gallatin Valley Seed 513 Gallatin Valley Seed GV 555* Gallatin Valley Seed Bolero check variety Quad check variety Grundy check variety Valkon Storm Seeds * Afila Variety
Pre Harvest Data Stand counts of emerged plants were completed on April 11, 2016 for the Early Trial (25 DAP) and on May 4, 2016 (19 DAP) for the Late Trial. The number of emerged plants was counted for a three foot long section of row in three randomly selected locations in each plot. The date of first flower and peak flowering was noted for each plot. Harvest Procedure Each variety was harvested as near to a tenderometer reading of 100 as possible. Pre-harvest samples were taken two to three days prior to reaching this maturity level whenever possible. All three replications for each variety were harvested on the same day. Plants were pulled from a 6 x 25 foot section of the plot (150 ft2). The vines were weighed and fed into a stationary FMC viner. Shelled peas were collected and cleaned (removing leaves, stones, and other trash). The clean, shelled peas were weighed. A 700 g sub-sample was put through a size separator that segregated peas into the following sizes according to their diameter: 12/32 inch or greater (#4 sieve size); between 11/32 and 12/32 inch (#3 sieve size); between 9/32 and 11/32 inch (#1 and #2 sieve size); and peas smaller than 9/32 inch (trash). After each size was weighed, peas with sieve sizes 1 through 4 were recombined into a bulk sample with the smallest (trash) peas removed. Three tenderometer readings were taken from this bulked sample. The average is reported.

2
Ten plants were taken from each variety and the following measurements were taken: vine length; number of nodes setting usable pods; number of pods per plant; pod length; and peas per pod. Statistics for pod length and number of peas per pod were calculated based on ten pods that were randomly selected from the ten sampled plants. Discussion of Trial Results The results for the two trials are reported in separate sections. Each section consists of twelve tables of results and one chart. In most tables the variety means are listed in descending order. Means followed by the same letter are not significantly different as determined by Fischer’s protected LSD with 5% error (α=0.05). The LSD value and p-value for the effect of the independent variable are included at the bottom of each table. Rainfall levels were average during the time the trials were conducted and irrigation was applied as necessary via an overhead linear irrigation system. The weather this year was warmer than typical in March, with a hard freeze in early April. The end of April and first two weeks of May were cooler than average. Harvest of the Early Trial began on May 30, which is about five days later than the typical first harvest date for this trial. The harvest of the Late Trial began on June 15 which is typical for this trial. Complete weather data and heat unit accumulation for the trials is included in Appendices A & B.
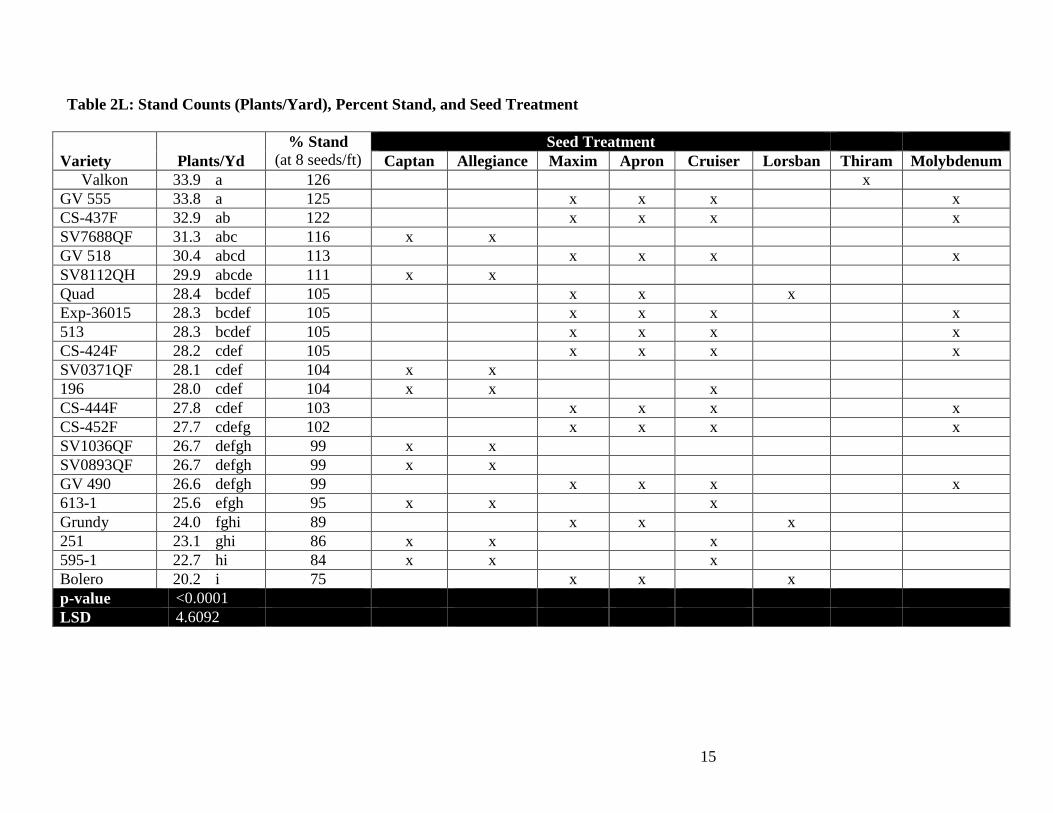
Tables 2E and 2L report the average stand counts, percent stand and seed treatment components for each variety in the trial. In the Early Trial, seed corn maggot caused major stand reduction in varieties that did not have an insecticide seed treatment. Varieties that were severely affected by seed corn maggot were evaluated for size and maturity characteristics but not for yield. Stands were good in the Late Trial, regardless of seed treatment. (For the Late Trial diazinon was applied before planting.)
Tables 3E and 3L report the net and gross yields adjusted to a tenderometer reading of 100. The adjustment calculation procedure is based on the method described by Pumphrey et al. (see Appendix C: Adjusting Pea Yields to a T-Reading of 100). Briefly, the adjustment factor (Y) is the percent of yield at a T-reading of 100 for the T-reading at harvest (X). Y= −1059.1 − 8.405X + 200X½
and
Yield adjusted to a T-reading of 100 = Yield at T-reading X (Y/100)
The net yield is calculated by subtracting the percent of peas smaller than 9/32 inch, trash, (as determined by sizing of a 700 g sub-sample) from the gross yield. Yields in the Early Trial were typical for this trial. The highest yielding varieties in the early trial were BSC3129, BSC5051, Marias, 11P42, CS-453F, Exp-36026, BSC2030 and Strike. The standard variety Strike, was the highest yielding early variety. Tomahawk and Exp-36003 matured at the same time as the earliest standard varieties. (Chart 1E). Yields in the Late Trial were below average compared to what we have seen in past years for this trial. The highest yielding variety in the late trial was CS-444F. CS-424F and PLS 196 were not significantly different than CS-444F in terms of yield. The aforementioned varieties all had significantly higher yields than all three trial check varieties, Bolero, Grundy and Quad. CS-424F was in the early trial in 2010, 2012 and 2014 and performed well in those trials, as well as the late trial in 2016. Some varieties were severely affected by root rot, particularly Valkon, and GV 490.

3
Early Trial Pre-Harvest Data Table 1E: Flowering Data
Variety First Flower Full Flower
DAP Heat Units DAP Heat Units Jumpstart 48 608 53 680 Strike 48 608 54 699 Exp-36003 49 619 53 680 Icepack 49 619 53 680 Tomahawk 50 629 54 699 Boston 50 629 55 719 M-14 53 680 56 743 11P42 53 680 56 743 Marias 53 680 56 743 GVS 435 53 680 57 766 BSC2014 53 680 58 790 BSC3129 53 680 61 830 304-3 54 699 60 814 CS-453F 56 743 60 814 Exp-36026 56 743 63 870 228 56 743 66 925 Design 57 766 67 946 BSC2030 57 766 69 1006 Reliance 58 790 68 975 SV1391QH 60 814 66 925 SV7401QH 62 848 69 1006 SV8112QH 62 848 69 1006 SV0935QF 63 870 68 975 BSC5051 63 870 69 1006 BSC15L11 64 891 69 1006

4
Table 2E: Stand Counts (Plants/Yard), Percent Stand, and Seed Treatment
Variety Plants/Yd % Stand
(at 8 seeds/ft) Seed Treatment
Captan Allegiance Maxim Apron Cruiser Lorsban Thiram Molybdenum BSC2014 31.8 a 118 x x x 228 28.7 ab 106 x x x Strike 24.4 bc 90 x x x Exp-36003 24.0 bc 89 x x x x Marias 23.8 bc 88 x x x Icepack 23.6 bc 87 Jumpstart 23.2 bcd 86 x x x CS-453F 23.1 bcd 86 x x x x Tomahawk 22.8 cd 84 x x x x BSC3129 22.7 cd 84 x x x BSC2030 22.6 cd 83 x x x BSC5051 22.3 cd 83 x x x BSC15L11 22.1 cd 82 x x x GVS 435 21.9 cd 81 x x x x Exp-36026 21.6 cde 80 x x x x 11P42 20.6 cdef 76 x x x 304-3 20.2 cdefg 75 x x x M-14 17.8 defgh 66 x x x SV8112QH 16.1 efghi 60 x x SV7401QH 15.1 fghij 56 x x Reliance 14.8 ghij 55 x x Boston 13.4 hij 50 x Design 10.9 ij 40 x SV0935QF 10.6 ij 39 x x SV1391QH 9.6 j 35 x x p-value <0.0001 LSD 5.6566

5
Early Trial Harvest Data Table 3E: Weight of Vines from 150 ft2 Harvest Area (lbs.) Variety Vine Weight (lbs.) 11P42 93 a Marias 90 ab 228 89 ab BSC2030 87 ab BSC5051 86 ab BSC2014 85 ab 304-3 83 abc CS-453F 83 abc Strike 82 abc BSC3129 82 abc M-14 80 abc Exp-36026 75 bcd BSC15L11 70 cde Jumpstart 64 de Tomahawk 63 de Exp-36003 60 de Icepack 60 de GVS 435 54 ef Design 40 f p-value <0.0001 LSD 15.441
The following varieties were not included in the analysis because of very poor stand (damage due to seed corn maggot) SV1391QH SV0935QF Reliance SV8112QH SV7401QH Boston

6
Table 4E: Net Yields (% Trash Subtracted) and Gross Yields Adjusted to a Tenderometer Reading of 100 (lbs/A) Variety Adj. Net Yield (lbs/A) Adj. Gross Yield (lbs/A) BSC3129 5362 a 5430 ab BSC5051 5256 a 5595 a Marias 5064 ab 5339 ab 11P42 5058 ab 5432 ab CS-453F 4869 abc 4945 abcd Exp-36026 4820 abc 5132 abc BSC2030 4766 abc 4951 abcd Strike 4721 abc 4827 abcd 228 4342 bcd 4462 cde M-14 4266 cde 4801 bcd Exp-36003 4155 cde 4231 def BSC2014 4109 cde 4461 cde 304-3 3901 def 3993 efg BSC15L11 3639 def 3639 fgh Tomahawk 3542 efg 3702 efgh Jumpstart 3520 efg 3938 efg Icepack 3151 fg 3234 gh GVS 435 2788 gh 2975 hi Design 2151 hi 2323 i p-value <0.0001 0.0003 LSD 775.46 791.47
The following varieties were not included in the analysis because of very poor stand (damage due to seed corn maggot) SV1391QH SV0935QF Reliance SV8112QH SV7401QH Boston

7
Table 5E: Pea Size (% peas by weight in each class) and Tenderometer Reading at Harvest
Variety % #4 % #3 % #1 & #2 % Trash T-reading at Harvest
Strike 50.4 a 35.2 hij 12.2 l 2.2 hijk 108 hi Exp-36003 49.8 a 36.8 fghij 11.5 l 1.8 ijk 116 de CS-453F 42.9 b 42.5 cdefg 13.1 kl 1.5 jk 131 c GVS 435 37.6 bc 32.3 ij 23.9 fgh 6.2 defg 104 jkl Tomahawk 36.8 bc 42.1 cdefg 16.9 ijkl 4.3 efghijk 112 fgh SV1391QH 35.7 cd 41.9 cdefg 19.6 hijk 2.8 ghijk 131 c 304-3 34.6 cd 43.0 cdef 20.1 hij 2.3 hijk 149 a Marias 32.4 cde 42.5 cdefg 19.9 hijk 5.1 defghi 109 hi Icepack 31.3 cdef 51.4 ab 14.7 jkl 2.7 ghijk 117 de M-14 29.3 def 39.1 efgh 21.0 hij 10.6 b 107 ij 11P42 25.7 efg 45.3 bcde 22.2 ghi 6.9 cdef 114 ef BSC2014 25.3 fg 41.2 defgh 25.6 efgh 8.0 bcd 114 efg BSC3129 25.0 fg 53.8 a 19.9 hijk 1.3 k 136 b Exp-36026 20.6 gh 37.6 fghi 35.6 ce 6.1 defg 113 efg BSC2030 20.3 gh 47.5 abcd 28.4 efg 3.7 fghijk 112 fgh 228 17.6 h 47.3 bcd 32.4 cde 2.7 ghijk 120 d Design 17.4 h 46.8 bcd 28.1 efg 7.8 bcde 115 ef BSC5051 16.5 h 47.7 abc 29.6 def 6.2 defg 101 l Reliance 16.3 h 42.6 cdefg 37.7 c 3.4 fghijk 110 ghi Boston 9.3 i 41.7 cdefg 38.8 bc 10.2 bc 109 hi SV7401QH 8.9 i 41.2 defgh 45.6 ab 4.2 efghijk 120 d SV0935QF 8.8 i 36.6 ghij 49.5 a 5.1 defghij 106 ijk SV8112QH 7.3 i 39.1 efgh 47.9 a 5.8 defgh 102 kl Jumpstart 6.8 ij 30.8 j 51.8 a 10.6 b 101 l BSC15L11 0.2 j 0.9 k 48.4 a 50.5 a 114 efg p-value <0.0001 <0.0001 <0.0001 <0.0001 <0.0001 LSD 6.7348 6.3684 6.9177 3.6254 4.0772

8
Table 6E: Tenderometer Reading at Harvest
Variety Tenderometer Reading
Standard Deviation
of T-Reading
Jumpstart 101 l 1.8 BSC5051 101 l 6.1 SV8112QH 102 kl 2.4 GVS 435 104 jkl 4.4 SV0935QF 106 ijk 3.8 M-14 107 ij 8.5 Strike 108 hi 3.2 Boston 109 hi 5.7 Marias 109 hi 3.9 Reliance 110 ghi 2.5 Tomahawk 112 fgh 5.9 BSC2030 112 fgh 4.3 Exp-36026 113 efg 4.9 BSC2014 114 efg 8.6 BSC15L11 114 efg 5.5 11P42 114 ef 4.4 Design 115 ef 4.4 Exp-36003 116 de 3.5 Icepack 117 de 3.7 228 120 d 4.9 SV7401QH 120 d 3.9 CS-453F 131 c 7.9 SV1391QH 131 c 3.4 BSC3129 136 b 6.1 304-3 149 a 6.8 p-value <0.0001 LSD 4.0772

9
Plant Characteristics for Early Trial Varieties Based on a 10-Plant Sample Table 7E: Vine Length in Centimeters Variety Vine Length (cm) Design 60.7 a 228 56.3 ab 304-3 54.5 bc 11P42 52.4 bcd BSC5051 52.2 bcde SV8112QH 50.4 cdef SV1391QH 48.0 defg M-14 47.2 defg BSC15L11 46.7 efgh BSC3129 46.3 fgh BSC2030 45.4 fgh Exp-36026 44.9 fghi Strike 44.5 ghij Marias 44.2 ghij Icepack 44.2 ghij SV7401QH 44.1 ghij BSC2014 43.2 ghijk Jumpstart 41.6 hijkl CS-453F 39.6 ijkl Tomahawk 39.2 jkl SV0935QF 38.2 kl GVS 435 38.0 kl Exp-36003 37.7 kl Reliance 36.4 lm Boston 31.8 m p-value <0.0001 LSD 5.56
Table 8E: Number of Pods per Plant Variety Pods/Plant Boston 5.1 a BSC15L11 5.0 a Design 4.7 ab 11P42 4.6 ab Marias 4.3 abc SV8112QH 4.2 abcd SV7401QH 4.2 abcd Exp-36003 4.1 abcde BSC3129 3.8 bcdef BSC5051 3.7 bcdefg 304-3 3.7 bcdefg BSC2030 3.6 bcdefg Exp-36026 3.3 cdefg SV0935QF 3.3 cdefg Jumpstart 3.3 cdefg M-14 3.2 cdefg 228 3.1 defg CS-453F 3.0 efg Icepack 3.0 efg SV1391QH 2.9 fg Reliance 2.9 fg GVS 435 2.8 fg Strike 2.8 fg Tomahawk 2.6 g BSC2014 2.6 g p-value <0.0001 LSD 1.13

10
Table 9E: Number of Pod-Bearing Nodes per Plant Variety Nodes w/ Pods/Plant Boston 4.3 a 11P42 3.2 b Exp-36026 2.9 bc Jumpstart 2.9 bc Marias 2.8 bcd Exp-36003 2.7 bcde Design 2.7 bcde BSC15L11 2.5 bcdef SV7401QH 2.5 bcdef Tomahawk 2.4 cdef BSC5051 2.4 cdef Strike 2.4 cdef BSC2030 2.3 cdefg 304-3 2.3 cdefg M-14 2.2 cdefg SV8112QH 2.2 cdefg GVS 435 2.2 cdefg Icepack 2.2 cdefg BSC3129 2.1 defg CS-453F 2.0 efg BSC2014 2.0 efg 228 1.9 fg SV1391QH 1.8 fg SV0935QF 1.6 g Reliance 1.6 g p-value <0.0001 LSD 0.70
Table 10E: Average Number of Peas/Pod Variety Peas/Pod SV7401QH 6.9 a Boston 6.7 ab Design 6.7 ab BSC15L11 6.6 ab SV1391QH 6.3 abc SV0935QF 6.2 abcd Tomahawk 6.1 abcde BSC5051 6.1 abcde Exp-36003 5.7 abcdef 11P42 5.7 abcdef Reliance 5.7 abcdef Jumpstart 5.7 abcdef GVS 435 5.6 bcdef Exp-36026 5.3 cdef SV8112QH 5.2 cdef BSC2030 5.1 cdefg 228 5.1 cdefg Icepack 5.1 cdefg Strike 5.0 defg BSC3129 4.9 efg M-14 4.8 fg BSC2014 4.7 fg 304-3 4.7 fg CS-453F 4.6 fg Marias 3.9 g p-value <0.0001 LSD 1.30

11
Table 11E: Average Pod Length (cm) Variety Pod Length (cm) GVS 435 8.1 a SV0935QF 7.5 ab Boston 7.2 bc Design 7.2 bc Tomahawk 7.1 bcd SV7401QH 7.1 bcde BSC5051 7.0 bcdef Reliance 6.8 bcdefg 304-3 6.8 vcdefg BSC2030 6.7 cdefg 11P42 6.7 cdefg SV1391QH 6.7 cdefg Icepack 6.7 cdefg Jumpstart 6.6 cdefgh Exp-36003 6.5 cdefgh SV8112QH 6.5 cdefgh 228 6.4 defghi M-14 6.4 efghi Strike 6.4 fghi Exp-36026 6.3 fghij BSC3129 6.2 ghij Marias 6.1 ghij BSC2014 5.9 hij BSC15L11 5.7 ij CS-453F 5.6 j p-value <0.0001 LSD 0.72
12
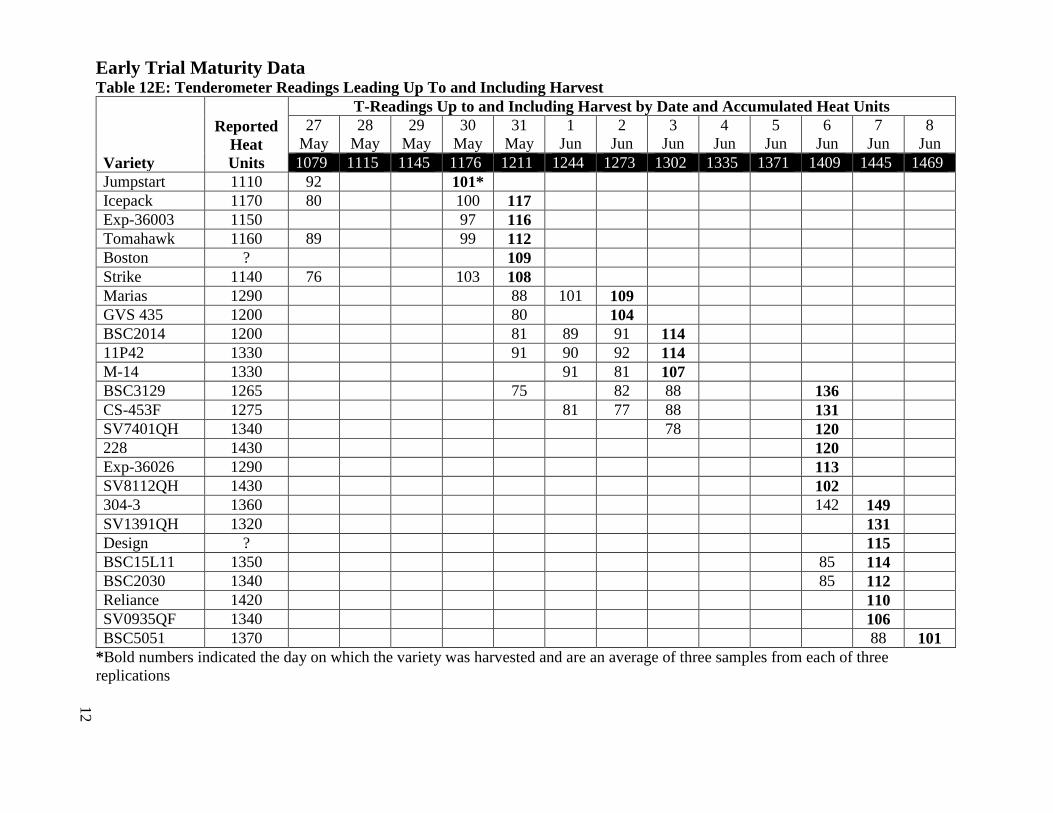
Early Trial Maturity Data Table 12E: Tenderometer Readings Leading Up To and Including Harvest
Variety
Reported Heat Units
T-Readings Up to and Including Harvest by Date and Accumulated Heat Units 27
May 28
May 29
May 30
May 31
May 1
Jun 2
Jun 3
Jun 4
Jun 5
Jun 6
Jun 7
Jun 8
Jun 1079 1115 1145 1176 1211 1244 1273 1302 1335 1371 1409 1445 1469
Jumpstart 1110 92 101* Icepack 1170 80 100 117 Exp-36003 1150 97 116 Tomahawk 1160 89 99 112 Boston ? 109 Strike 1140 76 103 108 Marias 1290 88 101 109 GVS 435 1200 80 104 BSC2014 1200 81 89 91 114 11P42 1330 91 90 92 114 M-14 1330 91 81 107 BSC3129 1265 75 82 88 136 CS-453F 1275 81 77 88 131 SV7401QH 1340 78 120 228 1430 120 Exp-36026 1290 113 SV8112QH 1430 102 304-3 1360 142 149 SV1391QH 1320 131 Design ? 115 BSC15L11 1350 85 114 BSC2030 1340 85 112 Reliance 1420 110 SV0935QF 1340 106 BSC5051 1370 88 101
*Bold numbers indicated the day on which the variety was harvested and are an average of three samples from each of three replications

13
Chart 1E: Adjusted Net Yield (lbs/A) by Heat Units Accumulated at T-Reading of 100

14
Late Trial Pre-Harvest Data Table 1L: Flowering Data
Variety First Flower Full Flower
DAP Heat Units DAP Heat Units CS-424F 43 831 45 892 GV 490 44 861 46 927 Exp-36015 44 861 46 927 GV 518 44 861 46 927 SV8112QH 45 892 47 960 CS-437F 45 892 47 960 CS-452F 45 892 47 960 613-1 45 892 49 1018 513 46 927 49 1018 SV0371QF 47 960 49 1018 GV 555 47 960 49 1018 Grundy 47 960 49 1018 Bolero 47 960 50 1051 SV1036QF 47 960 50 1051 Quad 49 1018 51 1087 SV7688QF 49 1018 52 1125 SV0893QF 49 1018 52 1125 251 49 1018 51 1087 595-1 49 1018 52 1125 CS-444F 50 1051 52 1125 196 50 1051 52 1125 Valkon 50 1051 53 1161
15
Table 2L: Stand Counts (Plants/Yard), Percent Stand, and Seed Treatment
Variety Plants/Yd % Stand
(at 8 seeds/ft) Seed Treatment
Captan Allegiance Maxim Apron Cruiser Lorsban Thiram Molybdenum Valkon 33.9 a 126 x
GV 555 33.8 a 125 x x x x CS-437F 32.9 ab 122 x x x x SV7688QF 31.3 abc 116 x x GV 518 30.4 abcd 113 x x x x SV8112QH 29.9 abcde 111 x x Quad 28.4 bcdef 105 x x x Exp-36015 28.3 bcdef 105 x x x x 513 28.3 bcdef 105 x x x x CS-424F 28.2 cdef 105 x x x x SV0371QF 28.1 cdef 104 x x 196 28.0 cdef 104 x x x CS-444F 27.8 cdef 103 x x x x CS-452F 27.7 cdefg 102 x x x x SV1036QF 26.7 defgh 99 x x SV0893QF 26.7 defgh 99 x x GV 490 26.6 defgh 99 x x x x 613-1 25.6 efgh 95 x x x Grundy 24.0 fghi 89 x x x 251 23.1 ghi 86 x x x 595-1 22.7 hi 84 x x x Bolero 20.2 i 75 x x x p-value <0.0001 LSD 4.6092

16
Late Trial Harvest Data Table 3L: Weight of Vines from 150 ft2 Harvest Area Variety Vine Weight (lbs.) CS-444F 94 a CS-452F 80 b 595-1 77 bc 196 76 bc 513 75 bc SV0371QF 74 bc SV8112QH 73 bcd SV7688QF 73 bcde Grundy 73 bcde SV1036QF 70 bcdef GV 555 70 bcdef GV 518 68 cdefg GV 490 62 defgh 613-1 62 efgh SV0893QF 61 fgh 251 58 ghi Bolero 58 ghi CS-424F 56 hi CS-437F 54 hi Exp-36015 51 hi Valkon 49 i Quad 48 i p-value <0.0001 LSD 11.414

17
Table 4L: Net Yields (% Trash Subtracted) and Gross Yields Adjusted to a Tenderometer Reading of 100 Variety Adj. Net Yield (lbs/A) Adj. Gross Yield (lbs/A) CS-444F 4206 a 4351 a CS-424F 4048 ab 4055 ab 196 3728 abc 3799 abc 513 3559 bcd 3569 bcd CS-452F 3546 bcd 3615 bcd 595-1 3265 cde 3335 cde SV0893QF 3243 cdef 3336 cde SV8112QH 3117 cdefg 3184 cdef SV1036QF 3075 defgh 3086 defg Bolero 3021 defghi 3073 defg 251 2863 efghij 2962 defgh Grundy 2806 efghijk 2841 efgh Exp-36015 2796 efghijk 2823 efgh Quad 2620 fghijk 2658 fgh SV0371QF 2536 ghijkl 3015 defg SV7688QF 2477 hijkl 2525 fghi GV 555 2437 hijkl 2480 ghij CS-437F 2424 ijkl 2463 ghij GV 490 2232 jklm 2724 efgh 613-1 2208 klm 2305 hij GV 518 1904 lm 1972 ij Valkon 1722 m 1809 j p-value <0.0001 <0.0001 LSD 637.31 676.09

18
Table 5L: Pea Size (% peas by weight in each class) and Tenderometer Reading at Harvest Variety % #4 % #3 % #1 & #2 % Trash T-reading at
Harvest SV1036QF 77.0 a 18.2 h 4.4 k 0.4 fg 135 e 513 75.8 a 19.7 gh 4.2 k 0.3 g 155 c 595-1 71.4 ab 17.2 h 9.3 jk 2.1 cdefg 122 f CS-444F 68.2 abc 18.0 h 10.5 ij 3.3 cd 105 ghi 196 65.8 bc 23.1 gh 9.3 jk 1.8 defg 108 g Grundy 65.2 bc 25.2 g 8.3 jk 1.2 defg 142 d CS-424F 60.1 cd 35.0 f 4.7 k 0.2 g 105 gh Bolero 53.3 de 33.5 f 11.5 ij 1.7 defg 120 f CS-452F 50.7 ef 37.4 ef 10.0 j 1.9 defg 96 jk Quad 50.4 ef 37.4 ef 10.8 ij 1.4 defg 168 a GV 490 48.3 efg 32.6 f 13.1 hij 5.9 b 103 ghi 251 43.1 fgh 38.2 def 15.5 ghi 3.3 cde 125 f CS-437F 42.9 fgh 44.6 cd 10.9 ij 1.6 defg 160 bc Exp-36015 40.3 ghi 43.4 cde 15.4 ghi 1.0 efg 121 f SV0893QF 37.5 hi 42.1 cde 17.8 fgh 2.6 cdef 101 hij SV7688QF 32.0 ij 44.2 cd 21.9 ef 1.9 defg 122 f GV 555 31.5 ij 47.1 bc 19.7 fg 1.7 defg 163 ab Valkon 27.0 jk 41.9 cde 26.7 de 4.3 bc 94 k GV 518 20.5 k 44.0 cde 32.1 bc 3.4 cd 99 ijk SV8112QH 8.8 l 60.0 a 29.1 cd 2.1 cdefg 109 g 613-1 6.5 l 52.6 b 36.6 b 4.2 bc 122 f SV0371QF 1.6 l 23.8 gh 58.8 a 15.8 a 93 k p-value <0.0001 <0.0001 <0.0001 <0.0001 <0.0001 LSD 9.08 6.66 5.11 2.28 6.03

19
Table 6L: Tenderometer Reading at Harvest Variety Tenderometer Reading Standard Deviation of T-Reading Quad 168 a 6.3836 GV 555 163 ab 6.3727 CS-437F 160 bc 13.3614 513 155 c 6.3792 Grundy 142 d 6.8557 SV1036QF 135 e 7.7621 251 125 f 6.0438 SV7688QF 122 f 6.1667 613-1 122 f 3.7081 595-1 122 f 7.1434 Exp-36015 121 f 4.7726 Bolero 120 f 7.828 SV8112QH 109 g 7.6485 196 108 g 5.3098 CS-424F 105 gh 3.4075 CS-444F 105 ghi 4.3811 GV 490 103 ghi 4.7288 SV0893QF 101 hij 7.4125 GV 518 99 ijk 2.1082 CS-452F 96 jk 3.3953 Valkon 94 k 7.9844 SV0371QF 93 k 3.3333 p-value <0.0001 LSD 6.03

20
Plant Characteristics for Late Trial Varieties Based on a 10-Plant Sample
Table 7L: Vine Length in Centimeters Variety Vine Length (cm) CS-444F 66.2 a 595-1 64.7 a SV1036QF 57.5 b SV0893QF 54.5 bc GV 555 54.5 bc GV 490 53.7 bcd 613-1 53.4 cde Grundy 52.4 cdef Valkon 52.1 cdef SV7688QF 52.0 cdefg 513 51.0 cdefg CS-437F 50.9 cdefg SV0371QF 50.5 defgh 251 49.0 defgh CS-452F 48.4 efgh GV 518 48.3 efgh 196 47.5 fghi Quad 46.6 ghi Bolero 44.8 hij CS-424F 43.4 ij SV8112QH 41.2 jk Exp-36015 38.6 k p-value <0.0001 LSD 4.66
Table 8L: Number of Pods per Plant Variety Pods/Plant Exp-36015 4.2 a 613-1 4.0 ab CS-452F 3.4 abc Quad 3.3 abcd 251 3.2 bcde GV 490 3.2 bcde GV 518 3.2 bcde GV 555 3.1 bcde CS-437F 2.9 cde SV0371QF 2.9 cde Bolero 2.9 cde SV1036QF 2.8 cdef CS-444F 2.7 cdefg CS-424F 2.6 cdefg 196 2.6 cdefg Grundy 2.5 cdefg SV0893QF 2.4 defg SV8112QH 2.3 efg 513 2.3 efg 595-1 1.9 fg Valkon 1.9 fg SV7688QF 1.8 g p-value <0.0001 LSD 0.96

21
Table 9L: Number of Pod-Bearing Nodes per Plant
Variety Nodes w/
Pods/Plant 613-1 2.7 a GV 518 2.6 ab Exp-36015 2.4 abc 251 2.4 abc GV 555 2.4 abc GV 490 2.3 abcd CS-437F 2.0 bcde CS-452F 2.0 bcde 196 2.0 bcde Grundy 2.0 bcde SV1036QF 1.9 cde Bolero 1.9 cde Quad 1.9 cde CS-424F 1.8 cdef CS-444F 1.7 def SV0371QF 1.7 def SV7688QF 1.5 ef 513 1.5 ef Valkon 1.5 ef SV8112QH 1.4 ef SV0893QF 1.4 ef 595-1 1.2 f p-value <0.0001 LSD 0.66
Table 10L: Average Number of Peas per Pod Variety Peas/Pod 613-1 8.4 a Grundy 7.6 ab SV0371QF 7.5 ab GV 490 7.5 ab GV 518 7.4 abc 251 6.9 abcd SV0893QF 6.6 bcde 196 6.5 bcde GV 555 6.3 bcdef Valkon 6.3 bcdef SV8112QH 5.9 cdefg CS-424F 5.8 defg CS-452F 5.7 defg Bolero 5.7 defg CS-437F 5.6 defg CS-444F 5.6 defg 595-1 5.6 defg SV1036QF 5.4 defg Quad 5.4 defg Exp-36015 5.2 efg 513 4.8 fg SV7688QF 4.7 g p-value <0.0001 LSD 1.57

22
Table 11L: Average Pod Length in Centimeters Variety Pod Length (cm) Grundy 9.3 a GV 490 8.7 ab GV 518 8.6 ab 595-1 8.6 ab 196 8.1 bc 613-1 8.1 bcd 251 7.9 bcd Valkon 7.9 bcd CS-437F 7.5 cde SV7688QF 7.3 def SV1036QF 7.1 efg Exp-36015 6.8 efgh 513 6.8 efgh SV0893QF 6.8 efgh CS-424F 6.7 efgh GV 555 6.7 efgh Bolero 6.7 fgh SV8112QH 6.5 fghi CS-452F 6.5 ghi CS-444F 6.3 hi Quad 6.2 hi SV0371QF 5.8 i p-value <0.0001 LSD 0.79

23
Late Trial Maturity Data Table 12L: Tenderometer Readings Leading Up To and Including Harvest
Variety
Reported Heat Units
Date and Accumulated Heat Units 13-Jun 14-Jun 15-Jun 16-Jun 17-Jun 18-Jun 19-Jun 20-Jun 21-Jun 22-Jun 1341 1372 1399 1426 1456 1485 1518 1554 1591 1626
Exp-36015 1330 87 121 CS-424F 1350 84 105 GV 518 1350 75 99 GV 490 1380 82 103 SV8112QH 1430 80 88 109 SV0371QF 1480 63 92 93 CS-452F 1450 83 80 96 CS-437F 1405 79 84 81 160 SV1036QF 1525 76 135 251 1520 71 125 613-1 1460 79 78 122 Bolero 1480 76 73 120 SV0893QF 1525 70 66 101 GV 555 1650 86 77 133 163 513 1550 72 144 155 Grundy 1595 79 122 142 SV7688QF 1520 94 122 196 1550 99 108 Quad 1600 66 82 122 168 595-1 1550 85 105 122 CS-444F 1560 83 96 105 Valkon ? 76 77 94
*Bold numbers indicated the day on which the variety was harvested and are an average of three samples from each of three replications

24
Chart 1L: Adjusted Net Yield (lbs/A) by Heat Units Accumulated at T-Reading of 100

25
Appendix A: Weather Data for 2016 Early Pea Variety Trial
Date DAP High Low Daily Heat Units
Accumulated Heat Units
Daily Rainfall/
Irrigation*
Accumulated Rainfall
17-Mar-16 0 68.9 41.4 0.0 0 0 0.00 18-Mar-16 1 64.3 40.1 12.2 12 0 0.00 19-Mar-16 2 47.6 37.0 2.3 15 0.13 0.13 20-Mar-16 3 42.8 34.7 -1.3 15 0.48 0.61 21-Mar-16 4 49.1 32.3 0.7 15 0.1 0.71 22-Mar-16 5 57.8 27.2 2.5 18 0 0.71 23-Mar-16 6 71.6 48.3 20.0 38 0 0.71 24-Mar-16 7 74.4 49.8 22.1 60 0 0.71 25-Mar-16 8 74.8 53.1 24.0 84 0.02 0.73 26-Mar-16 9 55.3 41.3 8.3 92 0 0.73 27-Mar-16 10 52.4 46.0 9.2 101 0 0.73 28-Mar-16 11 68.8 47.8 18.3 120 0.48 1.21 29-Mar-16 12 57.2 36.6 6.9 126 0 1.21 30-Mar-16 13 59.1 29.7 4.4 131 0 1.21 31-Mar-16 14 73.5 47.6 20.6 151 0 1.21
1-Apr-16 15 76.6 65.5 31.1 182 0.63 1.84 2-Apr-16 16 70.2 49.4 19.8 202 0.89 2.73 3-Apr-16 17 50.9 37.3 4.1 206 0.09 2.82 4-Apr-16 18 71.6 40.5 16.1 222 0.2 3.02 5-Apr-16 19 45.9 28.4 -2.9 222 0 3.02 6-Apr-16 20 54.6 24.4 -0.5 222 0 3.02 7-Apr-16 21 62.1 49.1 15.6 238 0.23 3.25 8-Apr-16 22 52.1 34.7 3.4 241 0 3.25 9-Apr-16 23 46.4 34.9 0.6 242 0.43 3.68
10-Apr-16 24 49.8 29.1 -0.5 242 0 3.68 11-Apr-16 25 68.4 40.4 14.4 256 0 3.68 12-Apr-16 26 60.7 44.6 12.7 269 0.39 4.07 13-Apr-16 27 55.5 36.1 5.8 275 0 4.07 14-Apr-16 28 57.8 30.7 4.3 279 0 4.07 15-Apr-16 29 58.5 31.4 5.0 284 0 4.07 16-Apr-16 30 60.3 31.7 6.0 290 0 4.07 17-Apr-16 31 69.5 33.9 11.7 302 0 4.07 18-Apr-16 32 80.5 39.6 20.1 322 0 4.07 19-Apr-16 33 82.3 45.2 23.8 346 0 4.07 20-Apr-16 34 68.6 40.8 14.7 360 0.3* 4.37 21-Apr-16 35 72.9 40.0 16.5 377 0 4.37 22-Apr-16 36 78.1 62.0 30.1 407 0.03 4.40 23-Apr-16 37 65.6 51.5 18.6 425 0.24 4.64 24-Apr-16 38 67.2 41.1 14.2 439 0 4.64 25-Apr-16 39 74.5 43.8 19.2 459 0 4.64 26-Apr-16 40 85.4 61.2 33.3 492 0 4.64 27-Apr-16 41 61.2 49.2 15.2 507 0.26 4.90 28-Apr-16 42 52.8 46.6 9.7 517 0.48 5.38 29-Apr-16 43 52.7 47.9 10.3 527 0.04 5.42 30-Apr-16 44 58.8 47.9 13.4 540 0 5.42 1-May-16 45 54.3 48.8 11.6 552 0.49 5.91 2-May-16 46 77.7 50.9 24.3 576 0.43 6.34 3-May-16 47 70.1 50.2 20.2 596 0.3 6.64 4-May-16 48 54.2 49.6 11.9 608 1.1 7.74 5-May-16 49 52.2 48.4 10.3 619 0 7.74 6-May-16 50 54.0 47.4 10.7 629 0.66 8.40 7-May-16 51 62.3 48.9 15.6 645 0.01 8.41 8-May-16 52 71.7 49.0 20.4 665 0 8.41

26
9-May-16 53 67.2 43.1 15.2 680 0.01 8.42 10-May-16 54 64.4 51.8 18.1 699 0 8.42 11-May-16 55 70.2 51.4 20.8 719 0.37 8.79 12-May-16 56 70.5 56.4 23.5 743 0 8.79 13-May-16 57 70.1 55.4 22.8 766 0.15 8.94 14-May-16 58 76.6 51.7 24.2 790 0.16 9.10 15-May-16 59 60.3 47.2 13.8 803 0 9.10 16-May-16 60 63.1 37.4 10.3 814 0 9.10 17-May-16 61 63.7 48.7 16.2 830 0.24 9.34 18-May-16 62 64.5 51.5 18.0 848 0 9.34 19-May-16 63 71.9 52.2 22.1 870 0 9.34 20-May-16 64 75.9 46.2 21.1 891 0 9.34 21-May-16 65 61.7 53.7 17.7 909 0.92 10.26 22-May-16 66 58.5 53.5 16.0 925 0.14 10.40 23-May-16 67 68.4 55.0 21.7 946 0.01 10.41 24-May-16 68 80.3 56.5 28.4 975 0.01 10.42 25-May-16 69 85.8 57.4 31.6 1006 0 10.42 26-May-16 70 89.5 58.3 33.9 1040 0 10.42 27-May-16 71 88.4 68.0 38.2 1079 0 10.42 28-May-16 72 88.1 64.6 36.4 1115 0 10.42 29-May-16 73 83.4 56.9 30.2 1145 0.01 10.43 30-May-16 74 75.5 67.1 31.3 1176 1.8 12.23 31-May-16 75 83.6 64.9 34.3 1211 0.23 12.46
1-Jun-16 76 82.7 64.5 33.6 1244 0 12.46 2-Jun-16 77 71.9 65.5 28.7 1273 0 12.46 3-Jun-16 78 74.7 64.3 29.5 1302 0.01 12.47 4-Jun-16 79 82.2 62.5 32.4 1335 0 12.47 5-Jun-16 80 85.7 66.1 35.9 1371 0.04 12.51 6-Jun-16 81 85.3 70.9 38.1 1409 0 12.51 7-Jun-16 82 88.1 63.9 36.0 1445 0.36* 12.87 8-Jun-16 83 74.1 54.3 24.2 1469 0 12.87

27
Appendix B: Weather Data for 2016 Late Pea Variety Trial
Date DAP High Low Daily Heat Units
Accumulated Heat Units
Daily Rainfall/
Irrigation*
Accumulated Rainfall/ Irrigation
15-Apr-16 0 58.5 31.4 0.0 0 0 0.00 16-Apr-16 1 60.3 31.7 6.0 6 0 0.00 17-Apr-16 2 69.5 33.9 11.7 18 0 0.00 18-Apr-16 3 80.5 39.6 20.1 38 0 0.00 19-Apr-16 4 82.3 45.2 23.8 62 0 0.00 20-Apr-16 5 68.6 40.8 14.7 76 0.3* 0.30 21-Apr-16 6 72.9 40.0 16.5 93 0 0.30 22-Apr-16 7 78.1 62.0 30.1 123 0.03 0.33 23-Apr-16 8 65.6 51.5 18.6 141 0.24 0.57 24-Apr-16 9 67.2 41.1 14.2 155 0 0.57 25-Apr-16 10 74.5 43.8 19.2 175 0 0.57 26-Apr-16 11 85.4 61.2 33.3 208 0 0.57 27-Apr-16 12 61.2 49.2 15.2 223 0.26 0.83 28-Apr-16 13 52.8 46.6 9.7 233 0.48 1.31 29-Apr-16 14 52.7 47.9 10.3 243 0.04 1.35 30-Apr-16 15 58.8 47.9 13.4 256 0 1.35 1-May-16 16 54.3 48.8 11.6 268 0.49 1.84 2-May-16 17 77.7 50.9 24.3 292 0.43 2.27 3-May-16 18 70.1 50.2 20.2 312 0.3 2.57 4-May-16 19 54.2 49.6 11.9 324 1.1 3.67 5-May-16 20 52.2 48.4 10.3 335 0 3.67 6-May-16 21 54.0 47.4 10.7 345 0.66 4.33 7-May-16 22 62.3 48.9 15.6 361 0.01 4.34 8-May-16 23 71.7 49.0 20.4 381 0 4.34 9-May-16 24 67.2 43.1 15.2 396 0.01 4.35
10-May-16 25 64.4 51.8 18.1 415 0 4.35 11-May-16 26 70.2 51.4 20.8 435 0.37 4.72 12-May-16 27 70.5 56.4 23.5 459 0 4.72 13-May-16 28 70.1 55.4 22.8 482 0.15 4.87 14-May-16 29 76.6 51.7 24.2 506 0.16 5.03 15-May-16 30 60.3 47.2 13.8 519 0 5.03 16-May-16 31 63.1 37.4 10.3 530 0 5.03 17-May-16 32 63.7 48.7 16.2 546 0.24 5.27 18-May-16 33 64.5 51.5 18.0 564 0 5.27 19-May-16 34 71.9 52.2 22.1 586 0 5.27 20-May-16 35 75.9 46.2 21.1 607 0 5.27 21-May-16 36 61.7 53.7 17.7 625 0.92 6.19 22-May-16 37 58.5 53.5 16.0 641 0.14 6.33 23-May-16 38 68.4 55.0 21.7 662 0.01 6.34 24-May-16 39 80.3 56.5 28.4 691 0.01 6.35 25-May-16 40 85.8 57.4 31.6 722 0 6.35 26-May-16 41 89.5 58.3 33.9 756 0 6.35 27-May-16 42 88.4 68.0 38.2 794 0 6.35 28-May-16 43 88.1 64.6 36.4 831 0 6.35 29-May-16 44 83.4 56.9 30.2 861 0.01 6.36 30-May-16 45 75.5 67.1 31.3 892 1.8 8.16 31-May-16 46 83.6 64.9 34.3 927 0.23 8.39
1-Jun-16 47 82.7 64.5 33.6 960 0 8.39 2-Jun-16 48 71.9 65.5 28.7 989 0 8.39 3-Jun-16 49 74.7 64.3 29.5 1018 0.01 8.40 4-Jun-16 50 82.2 62.5 32.4 1051 0 8.40 5-Jun-16 51 85.7 66.1 35.9 1087 0.04 8.44 6-Jun-16 52 85.3 70.9 38.1 1125 0 8.44
28
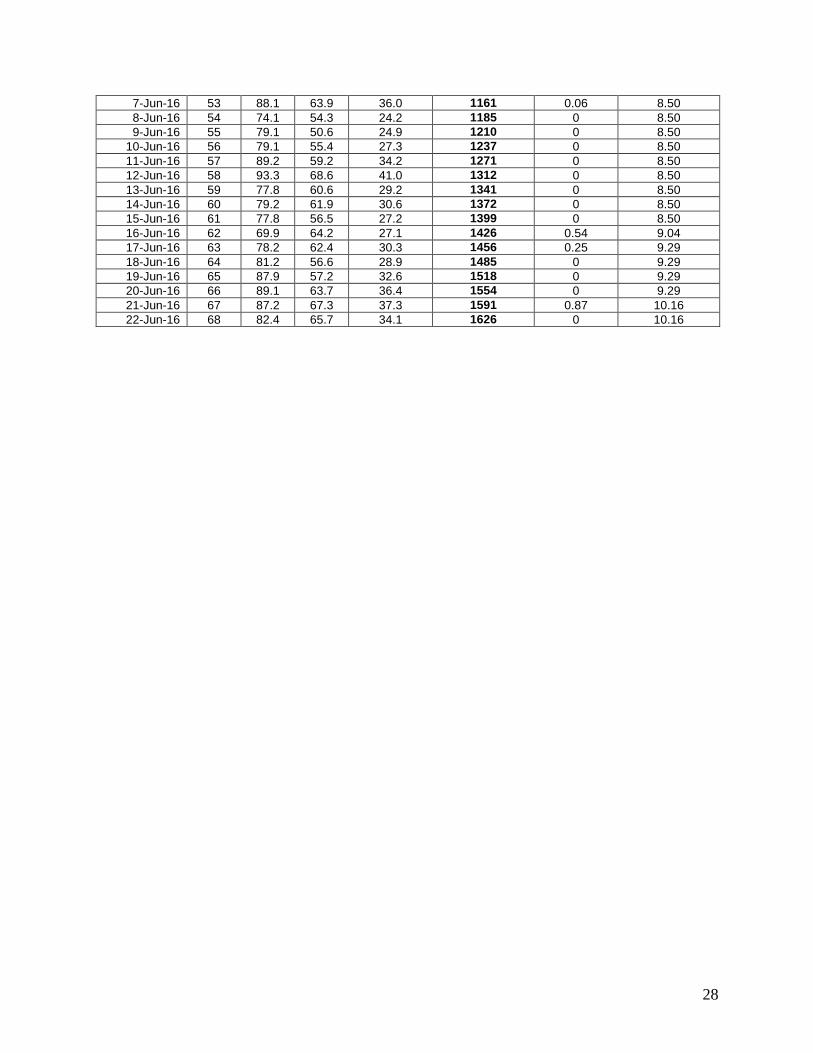
7-Jun-16 53 88.1 63.9 36.0 1161 0.06 8.50 8-Jun-16 54 74.1 54.3 24.2 1185 0 8.50 9-Jun-16 55 79.1 50.6 24.9 1210 0 8.50
10-Jun-16 56 79.1 55.4 27.3 1237 0 8.50 11-Jun-16 57 89.2 59.2 34.2 1271 0 8.50 12-Jun-16 58 93.3 68.6 41.0 1312 0 8.50 13-Jun-16 59 77.8 60.6 29.2 1341 0 8.50 14-Jun-16 60 79.2 61.9 30.6 1372 0 8.50 15-Jun-16 61 77.8 56.5 27.2 1399 0 8.50 16-Jun-16 62 69.9 64.2 27.1 1426 0.54 9.04 17-Jun-16 63 78.2 62.4 30.3 1456 0.25 9.29 18-Jun-16 64 81.2 56.6 28.9 1485 0 9.29 19-Jun-16 65 87.9 57.2 32.6 1518 0 9.29 20-Jun-16 66 89.1 63.7 36.4 1554 0 9.29 21-Jun-16 67 87.2 67.3 37.3 1591 0.87 10.16 22-Jun-16 68 82.4 65.7 34.1 1626 0 10.16

29
Appendix C: Adjusting Pea Yields to a T-reading of 100 Pumphery FV, RE Ramig, RR Allmoras. 1975 “Yield tenderness relationships in ‘Dark Skinned Perfection’ peas. Journal of the American Society of Horticultural Science. 100:507-509.

30

31