UNIVERSITY OF CAMBRIDGE INTERNATIONAL EXAMINATIONS … Levels/Environmental Management (5014... ·...
20
This document consists of 20 printed pages. DC (CW/JG) 15088/5 © UCLES 2010 [Turn over UNIVERSITY OF CAMBRIDGE INTERNATIONAL EXAMINATIONS General Certificate of Education Ordinary Level READ THESE INSTRUCTIONS FIRST Write your Centre number, candidate number and name on all the work you hand in. Write in dark blue or black pen. You may use a soft pencil for any diagrams, graphs or rough working. Do not use staples, paper clips, highlighters, glue or correction fluid. DO NOT WRITE IN ANY BARCODES. Answer all questions. All questions in Section A carry 10 marks. Both questions in Section B carry 40 marks. At the end of the examination, fasten all your work securely together. The number of marks is given in brackets [ ] at the end of each question or part question. * 893 4 866 1 7 4* ENVIRONMENTAL MANAGEMENT 5014/11 Paper 1 May/June 2010 2 hours 15 minutes Candidates answer on the Question Paper. Additional Materials: Ruler Protractor For Examiner’s Use 1 2 3 4 5 6 Total
Transcript of UNIVERSITY OF CAMBRIDGE INTERNATIONAL EXAMINATIONS … Levels/Environmental Management (5014... ·...
This document consists of 20 printed pages.
DC (CW/JG) 15088/5© UCLES 2010 [Turn over
UNIVERSITY OF CAMBRIDGE INTERNATIONAL EXAMINATIONSGeneral Certificate of Education Ordinary Level
READ THESE INSTRUCTIONS FIRST
Write your Centre number, candidate number and name on all the work you hand in.Write in dark blue or black pen.You may use a soft pencil for any diagrams, graphs or rough working.Do not use staples, paper clips, highlighters, glue or correction fluid.DO NOT WRITE IN ANY BARCODES.
Answer all questions.All questions in Section A carry 10 marks.Both questions in Section B carry 40 marks.
At the end of the examination, fasten all your work securely together.The number of marks is given in brackets [ ] at the end of each question or part question.
*8934866174*
ENVIRONMENTAL MANAGEMENT 5014/11
Paper 1 May/June 2010
2 hours 15 minutes
Candidates answer on the Question Paper.
Additional Materials: Ruler Protractor
For Examiner’s Use
1
2
3
4
5
6
Total
2
5014/11/M/J/10© UCLES 2010
ForExaminer’s
Use
Section A
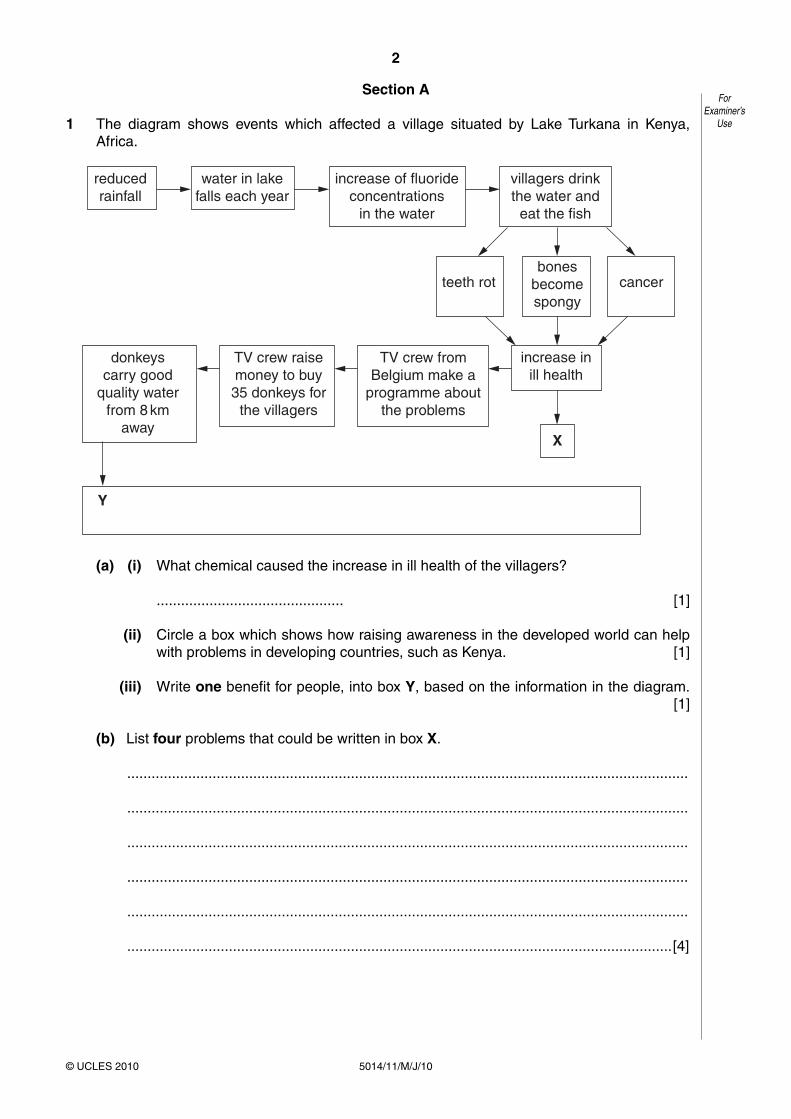
1 The diagram shows events which affected a village situated by Lake Turkana in Kenya, Africa.
reducedrainfall
water in lakefalls each year
increase of fluorideconcentrations
in the water
villagers drinkthe water and
eat the fish
bonesbecomespongy
increase inill health
TV crew fromBelgium make a
programme aboutthe problems
TV crew raisemoney to buy35 donkeys for
the villagers
donkeyscarry good
quality waterfrom 8 km
awayX
Y
teeth rot cancer
(a) (i) What chemical caused the increase in ill health of the villagers?
.............................................. [1]
(ii) Circle a box which shows how raising awareness in the developed world can help with problems in developing countries, such as Kenya. [1]
(iii) Write one benefit for people, into box Y, based on the information in the diagram. [1]
(b) List four problems that could be written in box X.
..........................................................................................................................................
..........................................................................................................................................
..........................................................................................................................................
..........................................................................................................................................
..........................................................................................................................................
......................................................................................................................................[4]
3
5014/11/M/J/10 [Turn over© UCLES 2010
ForExaminer’s
Use
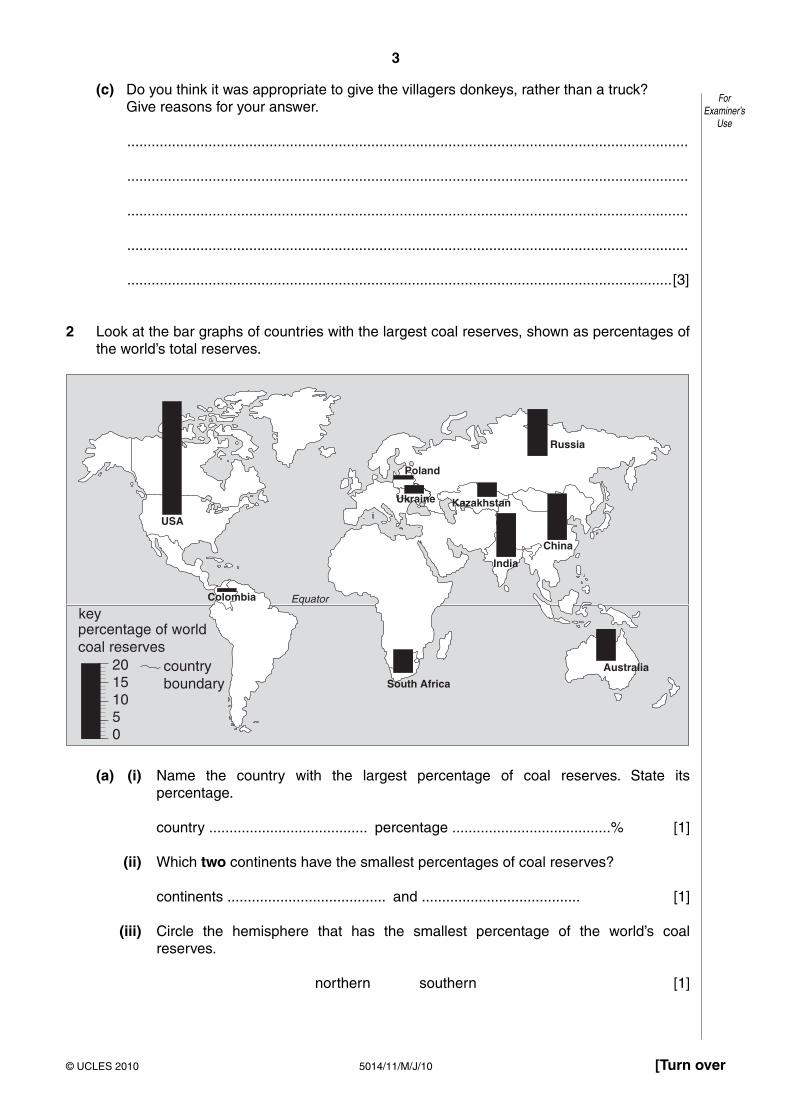
(c) Do you think it was appropriate to give the villagers donkeys, rather than a truck? Give reasons for your answer.
..........................................................................................................................................
..........................................................................................................................................
..........................................................................................................................................
..........................................................................................................................................
......................................................................................................................................[3]
2 Look at the bar graphs of countries with the largest coal reserves, shown as percentages of the world’s total reserves.
Equator
key
countryboundary
percentage of worldcoal reserves
South Africa
Colombia
Russia
China
India
Poland
Ukraine
USA
Australia
05101520
Kazakhstan
(a) (i) Name the country with the largest percentage of coal reserves. State its percentage.
country ....................................... percentage .......................................% [1]
(ii) Which two continents have the smallest percentages of coal reserves?
continents ....................................... and ....................................... [1]
(iii) Circle the hemisphere that has the smallest percentage of the world’s coal reserves.
northern southern [1]

4
5014/11/M/J/10© UCLES 2010
ForExaminer’s
Use
(b) Suggest why a country may not use all its coal reserves in the future.
..........................................................................................................................................
..........................................................................................................................................
..........................................................................................................................................
..........................................................................................................................................
......................................................................................................................................[3]
(c) Coal and water are both sources of power. What are the advantages of hydro-electric power?
..........................................................................................................................................
..........................................................................................................................................
..........................................................................................................................................
..........................................................................................................................................
..........................................................................................................................................
......................................................................................................................................[4]
5
5014/11/M/J/10 [Turn over© UCLES 2010
ForExaminer’s
Use
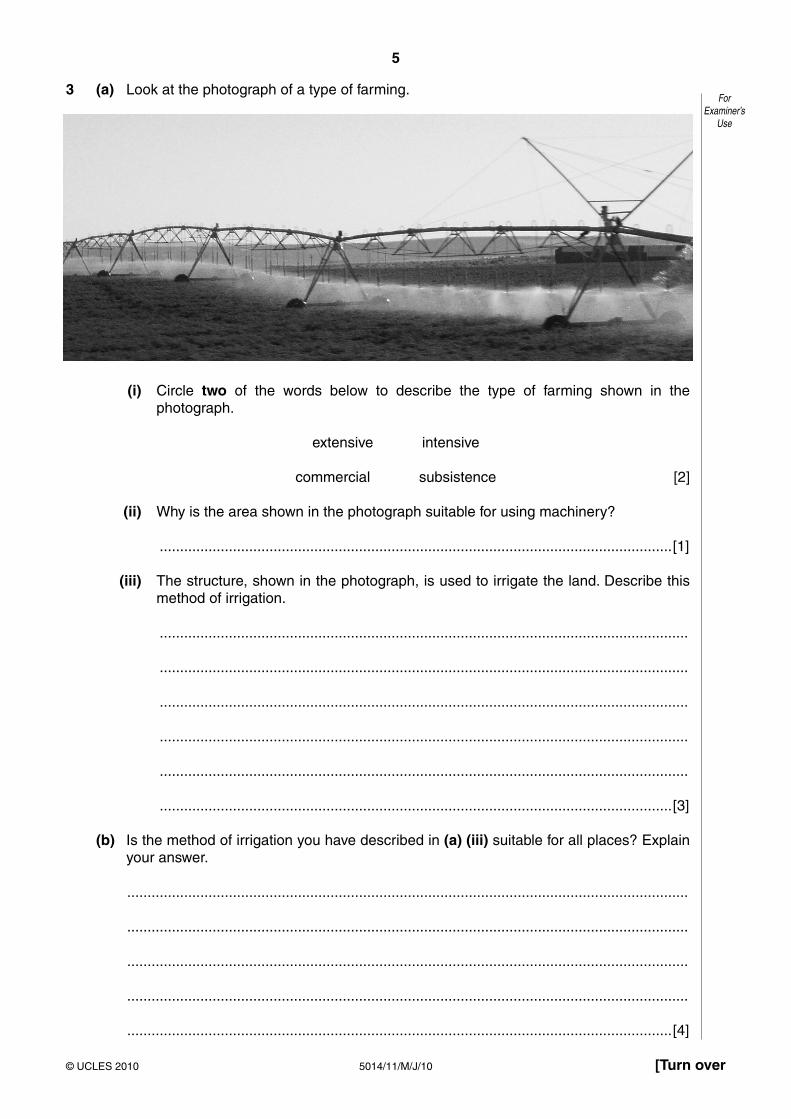
3 (a) Look at the photograph of a type of farming.
(i) Circle two of the words below to describe the type of farming shown in the photograph.
extensive intensive
commercial subsistence [2]
(ii) Why is the area shown in the photograph suitable for using machinery?
..............................................................................................................................[1]
(iii) The structure, shown in the photograph, is used to irrigate the land. Describe this method of irrigation.
..................................................................................................................................
..................................................................................................................................
..................................................................................................................................
..................................................................................................................................
..................................................................................................................................
..............................................................................................................................[3]
(b) Is the method of irrigation you have described in (a) (iii) suitable for all places? Explain your answer.
..........................................................................................................................................
..........................................................................................................................................
..........................................................................................................................................
..........................................................................................................................................
......................................................................................................................................[4]
6
5014/11/M/J/10© UCLES 2010
ForExaminer’s
Use
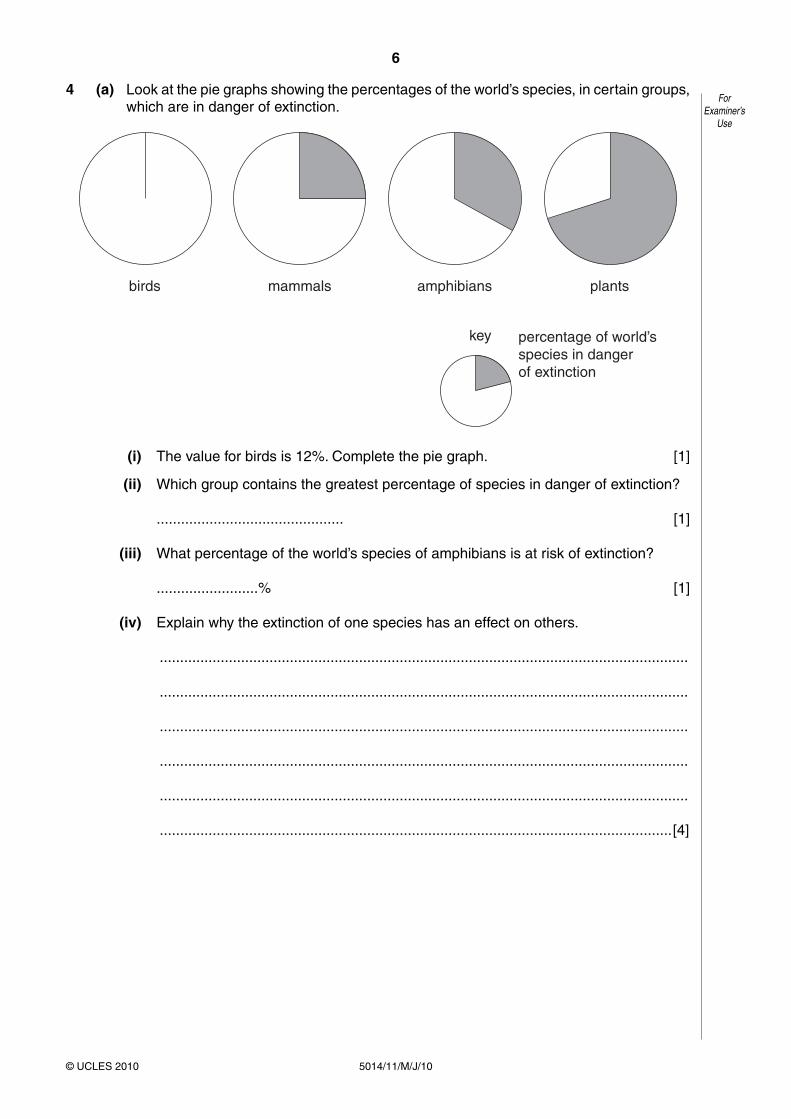
4 (a) Look at the pie graphs showing the percentages of the world’s species, in certain groups, which are in danger of extinction.
birds mammals amphibians plants
key percentage of world’sspecies in dangerof extinction
(i) The value for birds is 12%. Complete the pie graph. [1]
(ii) Which group contains the greatest percentage of species in danger of extinction?
.............................................. [1]
(iii) What percentage of the world’s species of amphibians is at risk of extinction?
.........................% [1]
(iv) Explain why the extinction of one species has an effect on others.
..................................................................................................................................
..................................................................................................................................
..................................................................................................................................
..................................................................................................................................
..................................................................................................................................
..............................................................................................................................[4]
7
5014/11/M/J/10 [Turn over© UCLES 2010
ForExaminer’s
Use
(b) Suggest three different reasons why it is difficult to prevent the extinction of plant species.
..........................................................................................................................................
..........................................................................................................................................
..........................................................................................................................................
..........................................................................................................................................
..........................................................................................................................................
......................................................................................................................................[3]
8
5014/11/M/J/10© UCLES 2010
ForExaminer’s
Use
Section B
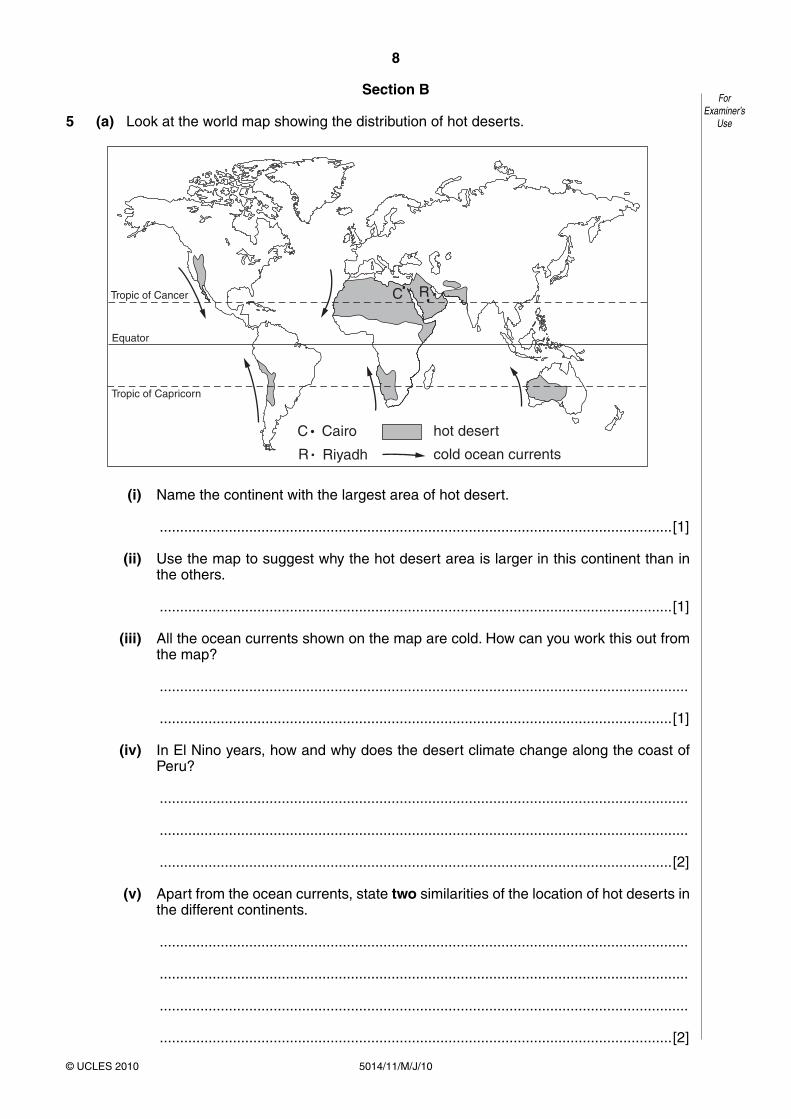
5 (a) Look at the world map showing the distribution of hot deserts.
hot desert
cold ocean currents
Equator
Tropic of Capricorn
Tropic of Cancer C
C
R
R
Cairo
Riyadh
(i) Name the continent with the largest area of hot desert.
..............................................................................................................................[1]
(ii) Use the map to suggest why the hot desert area is larger in this continent than in the others.
..............................................................................................................................[1]
(iii) All the ocean currents shown on the map are cold. How can you work this out from the map?
..................................................................................................................................
..............................................................................................................................[1]
(iv) In El Nino years, how and why does the desert climate change along the coast of Peru?
..................................................................................................................................
..................................................................................................................................
..............................................................................................................................[2]
(v) Apart from the ocean currents, state two similarities of the location of hot deserts in the different continents.
..................................................................................................................................
..................................................................................................................................
..................................................................................................................................
..............................................................................................................................[2]
9
5014/11/M/J/10 [Turn over© UCLES 2010
ForExaminer’s
Use
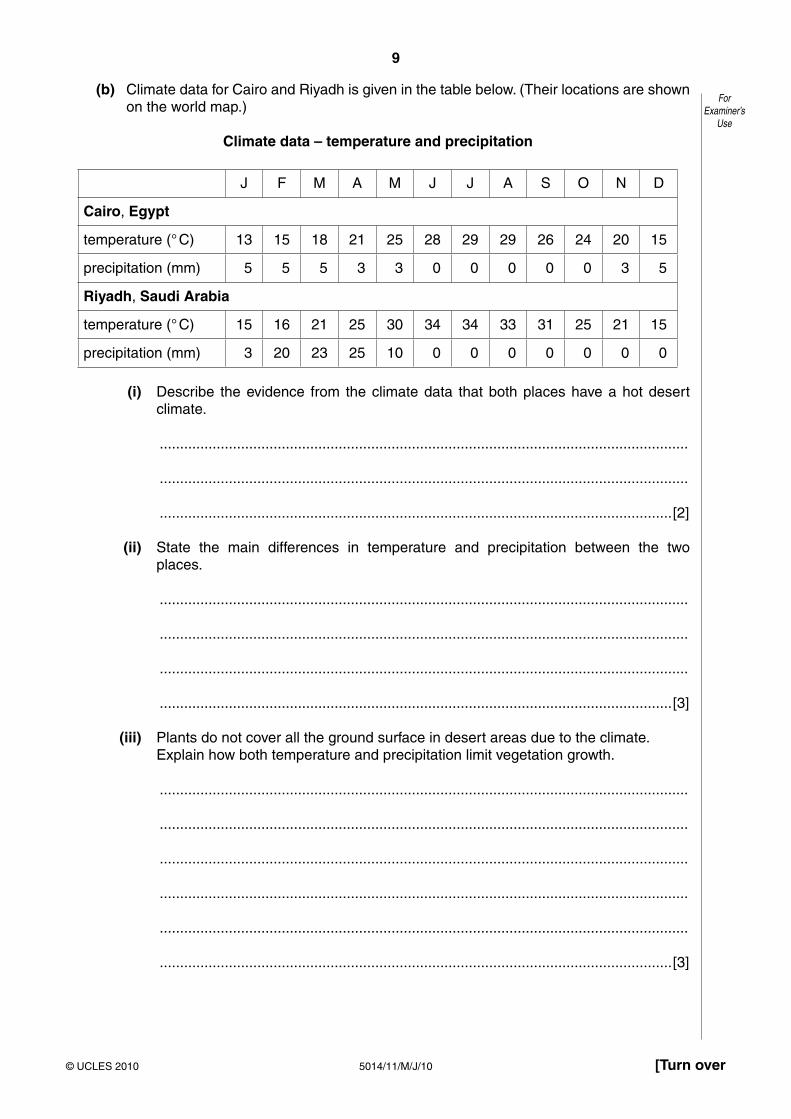
(b) Climate data for Cairo and Riyadh is given in the table below. (Their locations are shown on the world map.)
Climate data – temperature and precipitation
J F M A M J J A S O N D
Cairo, Egypt
temperature (° C) 13 15 18 21 25 28 29 29 26 24 20 15
precipitation (mm) 5 5 5 3 3 0 0 0 0 0 3 5
Riyadh, Saudi Arabia
temperature (° C) 15 16 21 25 30 34 34 33 31 25 21 15
precipitation (mm) 3 20 23 25 10 0 0 0 0 0 0 0
(i) Describe the evidence from the climate data that both places have a hot desert climate.
..................................................................................................................................
..................................................................................................................................
..............................................................................................................................[2]
(ii) State the main differences in temperature and precipitation between the two places.
..................................................................................................................................
..................................................................................................................................
..................................................................................................................................
..............................................................................................................................[3]
(iii) Plants do not cover all the ground surface in desert areas due to the climate. Explain how both temperature and precipitation limit vegetation growth.
..................................................................................................................................
..................................................................................................................................
..................................................................................................................................
..................................................................................................................................
..................................................................................................................................
..............................................................................................................................[3]

10
5014/11/M/J/10© UCLES 2010
ForExaminer’s
Use
(c) Look at the diagram which shows three plants with adaptations to allow them to survive the hot desert climate.
6
5
4
3
2
1
0
1
2
3
4
5
6
7
8
9
10
desert surface
water table
datepalm
cactusthornyshrub
metres
(i) On the diagram, add labels to show the different ways plants are adapted to living in the difficult desert climate. [4]
(ii) Why is the root system of the cactus different from those of the other plants?
..................................................................................................................................
..................................................................................................................................
..............................................................................................................................[2]
11
5014/11/M/J/10 [Turn over© UCLES 2010
ForExaminer’s
Use
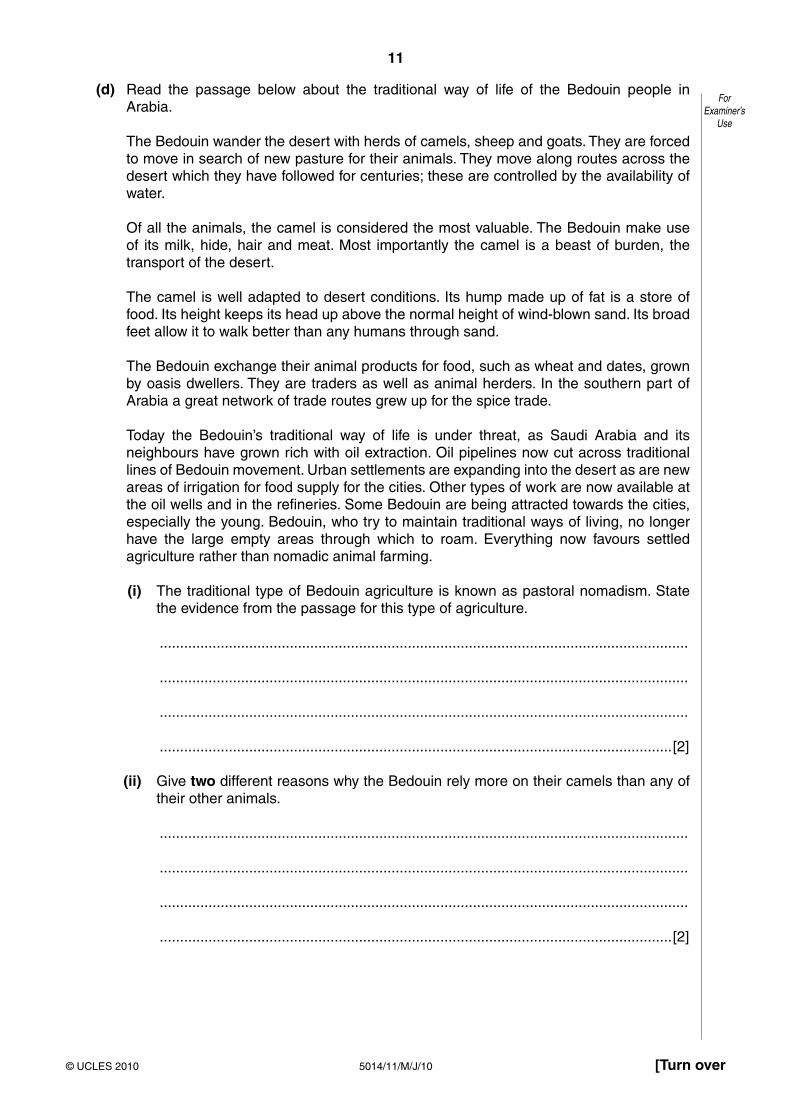
(d) Read the passage below about the traditional way of life of the Bedouin people in Arabia.
The Bedouin wander the desert with herds of camels, sheep and goats. They are forced to move in search of new pasture for their animals. They move along routes across the desert which they have followed for centuries; these are controlled by the availability of water.
Of all the animals, the camel is considered the most valuable. The Bedouin make use of its milk, hide, hair and meat. Most importantly the camel is a beast of burden, the transport of the desert.
The camel is well adapted to desert conditions. Its hump made up of fat is a store of food. Its height keeps its head up above the normal height of wind-blown sand. Its broad feet allow it to walk better than any humans through sand.
The Bedouin exchange their animal products for food, such as wheat and dates, grown by oasis dwellers. They are traders as well as animal herders. In the southern part of Arabia a great network of trade routes grew up for the spice trade.
Today the Bedouin’s traditional way of life is under threat, as Saudi Arabia and its neighbours have grown rich with oil extraction. Oil pipelines now cut across traditional lines of Bedouin movement. Urban settlements are expanding into the desert as are new areas of irrigation for food supply for the cities. Other types of work are now available at the oil wells and in the refineries. Some Bedouin are being attracted towards the cities, especially the young. Bedouin, who try to maintain traditional ways of living, no longer have the large empty areas through which to roam. Everything now favours settled agriculture rather than nomadic animal farming.
(i) The traditional type of Bedouin agriculture is known as pastoral nomadism. State the evidence from the passage for this type of agriculture.
..................................................................................................................................
..................................................................................................................................
..................................................................................................................................
..............................................................................................................................[2]
(ii) Give two different reasons why the Bedouin rely more on their camels than any of their other animals.
..................................................................................................................................
..................................................................................................................................
..................................................................................................................................
..............................................................................................................................[2]
12
5014/11/M/J/10© UCLES 2010
ForExaminer’s
Use
(iii) The traditional Bedouin way of life was an example of sustainable living. Explain how and why.
..................................................................................................................................
..................................................................................................................................
..................................................................................................................................
..................................................................................................................................
..............................................................................................................................[3]
(iv) Changes are now taking place in Arabia resulting from the discovery and extraction of oil. Describe some of the economic and likely social effects on the Bedouin people.
..................................................................................................................................
..................................................................................................................................
..................................................................................................................................
..................................................................................................................................
..................................................................................................................................
..................................................................................................................................
..................................................................................................................................
..............................................................................................................................[4]
13
5014/11/M/J/10 [Turn over© UCLES 2010
ForExaminer’s
Use
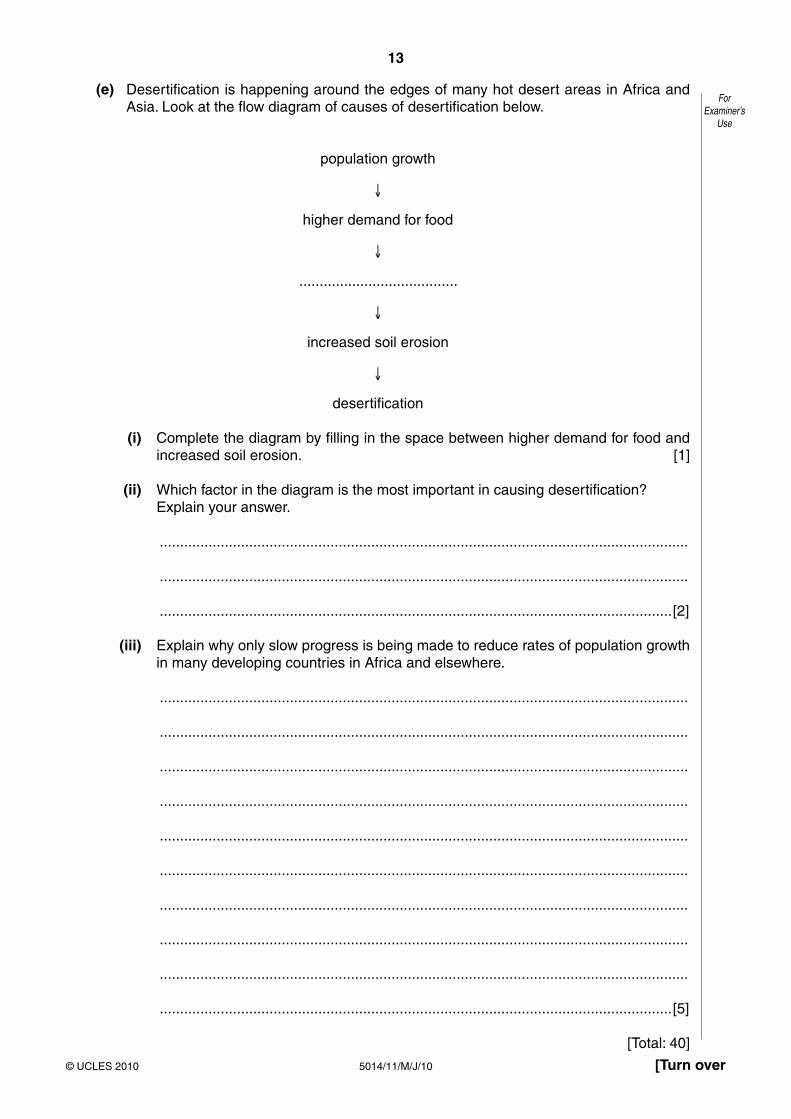
(e) Desertification is happening around the edges of many hot desert areas in Africa and Asia. Look at the flow diagram of causes of desertification below.
population growth
↓
higher demand for food
↓
.......................................
↓
increased soil erosion
↓
desertification
(i) Complete the diagram by filling in the space between higher demand for food and increased soil erosion. [1]
(ii) Which factor in the diagram is the most important in causing desertification? Explain your answer.
..................................................................................................................................
..................................................................................................................................
..............................................................................................................................[2]
(iii) Explain why only slow progress is being made to reduce rates of population growth in many developing countries in Africa and elsewhere.
..................................................................................................................................
..................................................................................................................................
..................................................................................................................................
..................................................................................................................................
..................................................................................................................................
..................................................................................................................................
..................................................................................................................................
..................................................................................................................................
..................................................................................................................................
..............................................................................................................................[5]
[Total: 40]

14
5014/11/M/J/10© UCLES 2010
ForExaminer’s
Use
6 (a) The coal that is mined today was formed millions of years ago.
300 million years ago
mine
recent rocks
rocks 300 millionyears old
coal seam
today
15
5014/11/M/J/10 [Turn over© UCLES 2010
ForExaminer’s
Use
(i) Explain how coal is formed.
..................................................................................................................................
..................................................................................................................................
..................................................................................................................................
..................................................................................................................................
..............................................................................................................................[3]
(ii) State two reasons why coal is called a fossil fuel.
..................................................................................................................................
..................................................................................................................................
..................................................................................................................................
..............................................................................................................................[2]
(iii) Why is carbon dioxide released into the atmosphere when coal is burnt?
..................................................................................................................................
..................................................................................................................................
..................................................................................................................................
..............................................................................................................................[2]
16
5014/11/M/J/10© UCLES 2010
ForExaminer’s
Use
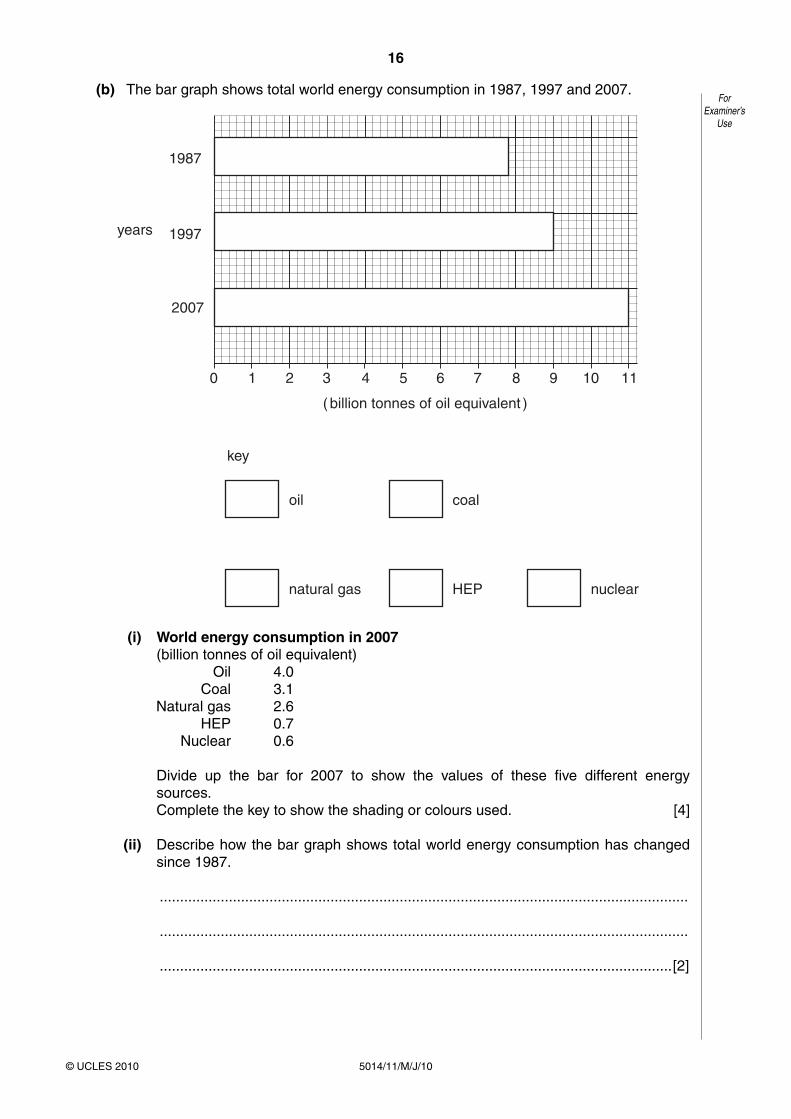
(b) The bar graph shows total world energy consumption in 1987, 1997 and 2007.
0 1 2 3 4 5 6 7 8 9 10 11
2007
1997
1987
years
( billion tonnes of oil equivalent )
oil coal
natural gas HEP nuclear
key
(i) World energy consumption in 2007 (billion tonnes of oil equivalent) Oil 4.0 Coal 3.1 Natural gas 2.6 HEP 0.7 Nuclear 0.6
Divide up the bar for 2007 to show the values of these five different energy sources.
Complete the key to show the shading or colours used. [4]
(ii) Describe how the bar graph shows total world energy consumption has changed since 1987.
..................................................................................................................................
..................................................................................................................................
..............................................................................................................................[2]
17
5014/11/M/J/10 [Turn over© UCLES 2010
ForExaminer’s
Use
(iii) How do the values for 2007 show the great importance of fossil fuels in world energy supply?
..................................................................................................................................
..................................................................................................................................
..................................................................................................................................
..................................................................................................................................
..............................................................................................................................[3]
(c) Describe the advantages of oil over coal for
(i) extraction from the ground,
..................................................................................................................................
..................................................................................................................................
..................................................................................................................................
..................................................................................................................................
(ii) transporting to place of use,
..................................................................................................................................
..................................................................................................................................
..................................................................................................................................
..................................................................................................................................
(iii) ease of use.
..................................................................................................................................
..................................................................................................................................
..................................................................................................................................
.................................................................................................................................. [6]
18
5014/11/M/J/10© UCLES 2010
ForExaminer’s
Use
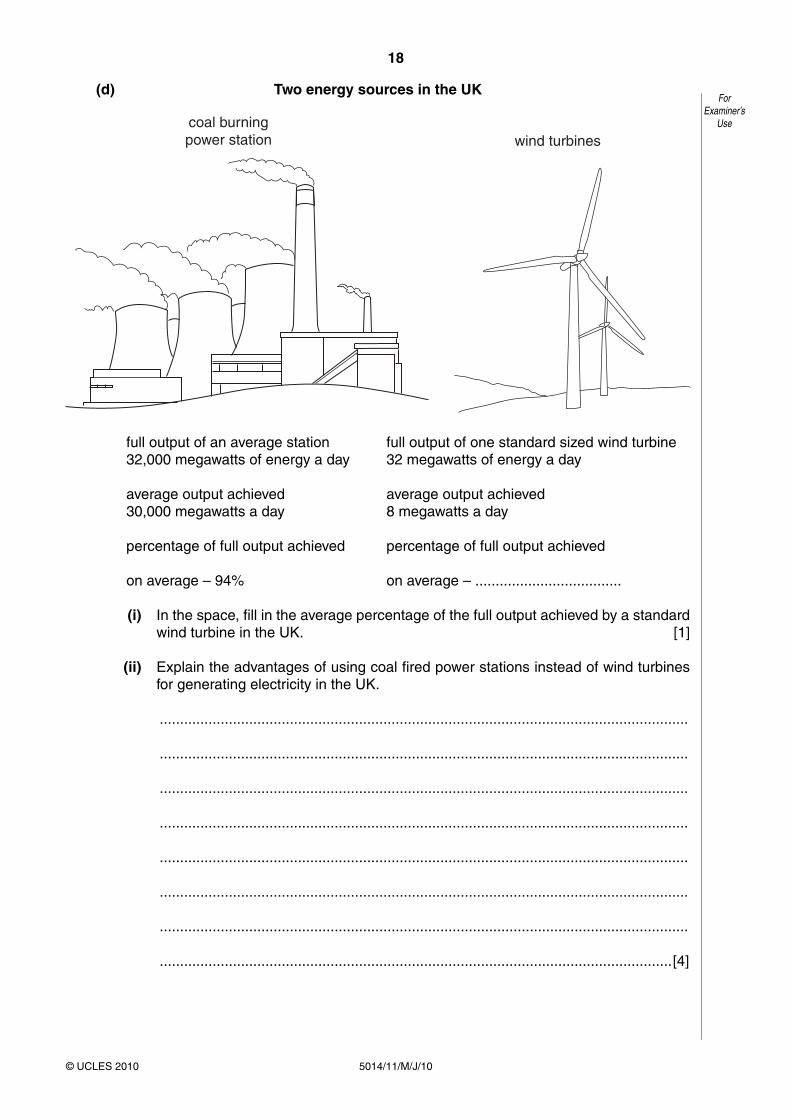
(d) Two energy sources in the UK
coal burningpower station wind turbines
full output of an average station full output of one standard sized wind turbine 32,000 megawatts of energy a day 32 megawatts of energy a day
average output achieved average output achieved 30,000 megawatts a day 8 megawatts a day
percentage of full output achieved percentage of full output achieved
on average – 94% on average – ....................................
(i) In the space, fill in the average percentage of the full output achieved by a standard wind turbine in the UK. [1]
(ii) Explain the advantages of using coal fired power stations instead of wind turbines for generating electricity in the UK.
..................................................................................................................................
..................................................................................................................................
..................................................................................................................................
..................................................................................................................................
..................................................................................................................................
..................................................................................................................................
..................................................................................................................................
..............................................................................................................................[4]
19
5014/11/M/J/10 [Turn over© UCLES 2010
ForExaminer’s
Use
(iii) State the environmental damage caused by coal fired power stations.
..................................................................................................................................
..............................................................................................................................[2]
(iv) Explain why the air pollution that results is both a local and an international problem.
..................................................................................................................................
..................................................................................................................................
..................................................................................................................................
..................................................................................................................................
..................................................................................................................................
..............................................................................................................................[3]
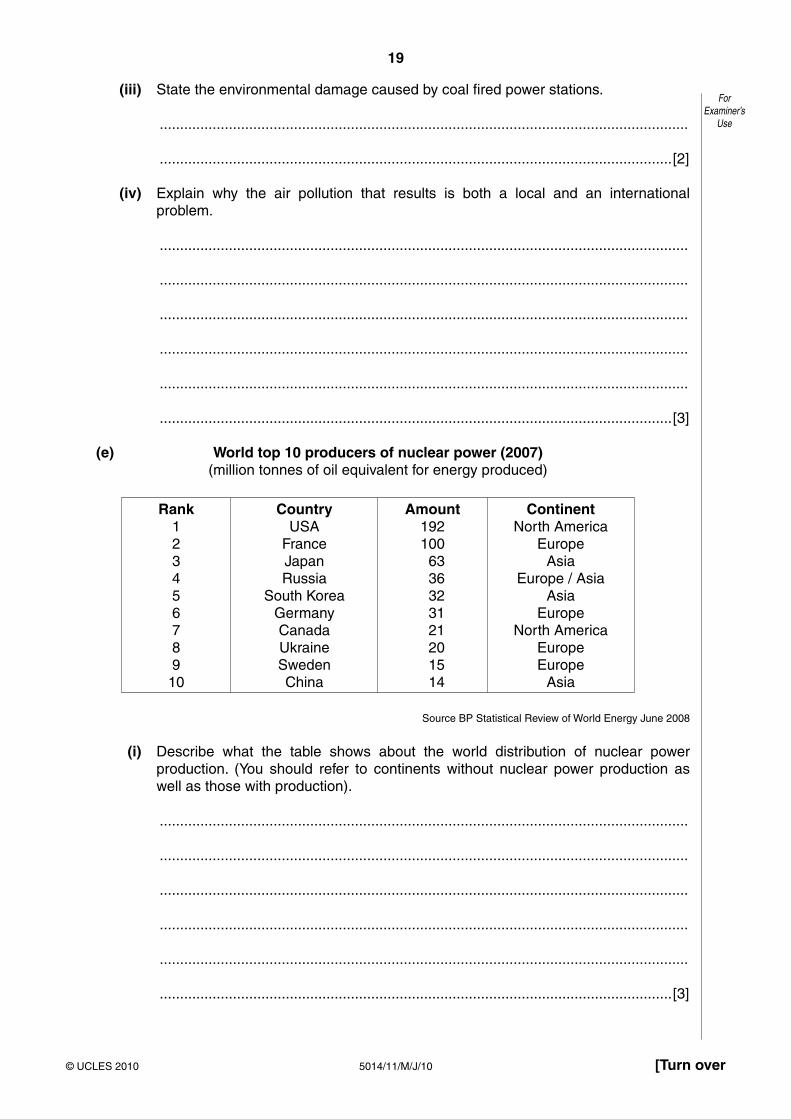
(e) World top 10 producers of nuclear power (2007) (million tonnes of oil equivalent for energy produced)
Rank12345678910
CountryUSA
FranceJapanRussia
South KoreaGermanyCanadaUkraineSwedenChina
Amount192100 63 36 32 31 21 20 15 14
ContinentNorth America
EuropeAsia
Europe / AsiaAsia
EuropeNorth America
EuropeEurope
Asia
Source BP Statistical Review of World Energy June 2008
(i) Describe what the table shows about the world distribution of nuclear power production. (You should refer to continents without nuclear power production as well as those with production).
..................................................................................................................................
..................................................................................................................................
..................................................................................................................................
..................................................................................................................................
..................................................................................................................................
..............................................................................................................................[3]
20
5014/11/M/J/10© UCLES 2010
ForExaminer’s
Use
(ii) Which are the stronger – arguments for more use of nuclear power, or arguments against more nuclear power use?
State the arguments for and against more nuclear power use, and explain your view.
..................................................................................................................................
..................................................................................................................................
..................................................................................................................................
..................................................................................................................................
..................................................................................................................................
..................................................................................................................................
..................................................................................................................................
..................................................................................................................................
..................................................................................................................................
..................................................................................................................................
..................................................................................................................................
..............................................................................................................................[5]
[Total: 40]
Permission to reproduce items where third-party owned material protected by copyright is included has been sought and cleared where possible. Every reasonable effort has been made by the publisher (UCLES) to trace copyright holders, but if any items requiring clearance have unwittingly been included, the publisher will be pleased to make amends at the earliest possible opportunity.
University of Cambridge International Examinations is part of the Cambridge Assessment Group. Cambridge Assessment is the brand name of University of Cambridge Local Examinations Syndicate (UCLES), which is itself a department of the University of Cambridge.