University of Birmingham Activation of the FGFR1 ...
34
University of Birmingham Activation of the FGFR1 signalling pathway by the Epstein-Barr virus-encoded LMP1 promotes aerobic glycolysis and transformation of human nasopharyngeal epithelial cells Lo, Angela Kwok-Fung; Dawson, Christopher W; Young, Lawrence S; Ko, Chuen-Wai; Hau, Pok-Man; Lo, Kwok-Wai DOI: 10.1002/path.4575 License: None: All rights reserved Document Version Peer reviewed version Citation for published version (Harvard): Lo, AK-F, Dawson, CW, Young, LS, Ko, C-W, Hau, P-M & Lo, K-W 2015, 'Activation of the FGFR1 signalling pathway by the Epstein-Barr virus-encoded LMP1 promotes aerobic glycolysis and transformation of human nasopharyngeal epithelial cells', Journal of Pathology, vol. 237, no. 2, pp. 238-248. https://doi.org/10.1002/path.4575 Link to publication on Research at Birmingham portal Publisher Rights Statement: Checked for eligibility: 01/04/2015. This is the peer reviewed version of the following article :Lo, A. K.-F., Dawson, C. W., Young, L. S., Ko, C.-W., Hau, P.-M. and Lo, K.-W. (2015), Activation of the FGFR1 signalling pathway by the Epstein–Barr virus-encoded LMP1 promotes aerobic glycolysis and transformation of human nasopharyngeal epithelial cells. J. Pathol., 237: 238–248. doi: 10.1002/path.4575. , which has been published in final form at DOI: 10.1002/path.4575 . This article may be used for non-commercial purposes in accordance with Wiley Terms and Conditions for Self-Archiving. General rights Unless a licence is specified above, all rights (including copyright and moral rights) in this document are retained by the authors and/or the copyright holders. The express permission of the copyright holder must be obtained for any use of this material other than for purposes permitted by law. • Users may freely distribute the URL that is used to identify this publication. • Users may download and/or print one copy of the publication from the University of Birmingham research portal for the purpose of private study or non-commercial research. • User may use extracts from the document in line with the concept of ‘fair dealing’ under the Copyright, Designs and Patents Act 1988 (?) • Users may not further distribute the material nor use it for the purposes of commercial gain. Where a licence is displayed above, please note the terms and conditions of the licence govern your use of this document. When citing, please reference the published version. Take down policy While the University of Birmingham exercises care and attention in making items available there are rare occasions when an item has been uploaded in error or has been deemed to be commercially or otherwise sensitive. If you believe that this is the case for this document, please contact [email protected] providing details and we will remove access to the work immediately and investigate. Download date: 19. Feb. 2022
Transcript of University of Birmingham Activation of the FGFR1 ...

University of Birmingham
Activation of the FGFR1 signalling pathway by theEpstein-Barr virus-encoded LMP1 promotes aerobicglycolysis and transformation of humannasopharyngeal epithelial cellsLo, Angela Kwok-Fung; Dawson, Christopher W; Young, Lawrence S; Ko, Chuen-Wai; Hau,Pok-Man; Lo, Kwok-WaiDOI:10.1002/path.4575
License:None: All rights reserved
Document VersionPeer reviewed version
Citation for published version (Harvard):Lo, AK-F, Dawson, CW, Young, LS, Ko, C-W, Hau, P-M & Lo, K-W 2015, 'Activation of the FGFR1 signallingpathway by the Epstein-Barr virus-encoded LMP1 promotes aerobic glycolysis and transformation of humannasopharyngeal epithelial cells', Journal of Pathology, vol. 237, no. 2, pp. 238-248.https://doi.org/10.1002/path.4575
Link to publication on Research at Birmingham portal
Publisher Rights Statement:Checked for eligibility: 01/04/2015. This is the peer reviewed version of the following article :Lo, A. K.-F., Dawson, C. W., Young, L. S., Ko,C.-W., Hau, P.-M. and Lo, K.-W. (2015), Activation of the FGFR1 signalling pathway by the Epstein–Barr virus-encoded LMP1 promotesaerobic glycolysis and transformation of human nasopharyngeal epithelial cells. J. Pathol., 237: 238–248. doi: 10.1002/path.4575. , whichhas been published in final form at DOI: 10.1002/path.4575 . This article may be used for non-commercial purposes in accordance withWiley Terms and Conditions for Self-Archiving.
General rightsUnless a licence is specified above, all rights (including copyright and moral rights) in this document are retained by the authors and/or thecopyright holders. The express permission of the copyright holder must be obtained for any use of this material other than for purposespermitted by law.
•Users may freely distribute the URL that is used to identify this publication.•Users may download and/or print one copy of the publication from the University of Birmingham research portal for the purpose of privatestudy or non-commercial research.•User may use extracts from the document in line with the concept of ‘fair dealing’ under the Copyright, Designs and Patents Act 1988 (?)•Users may not further distribute the material nor use it for the purposes of commercial gain.
Where a licence is displayed above, please note the terms and conditions of the licence govern your use of this document.
When citing, please reference the published version.
Take down policyWhile the University of Birmingham exercises care and attention in making items available there are rare occasions when an item has beenuploaded in error or has been deemed to be commercially or otherwise sensitive.
If you believe that this is the case for this document, please contact [email protected] providing details and we will remove access tothe work immediately and investigate.
Download date: 19. Feb. 2022

1
Title: Activation of the FGFR1 signalling pathway by the Epstein-Barr Virus-encoded LMP1
promotes Aerobic Glycolysis and Transformation of Human Nasopharyngeal Epithelial cells
Angela Kwok-Fung Lo1,2, Christopher W. Dawson2, Lawrence S. Young3, Chuen-Wai Ko1,
Pok-Man Hau1, and Kwok-Wai Lo1*
1 Department of Anatomical and Cellular Pathology, State Key Laboratory in Oncology in South
China and Li Ka Shing Institute of Health Science, Prince of Wales Hospital, The Chinese University
of Hong Kong, Hong Kong
2Cancer Research UK Cancer Centre, School of Cancer Sciences, University of Birmingham, Vincent
Drive, Edgbaston, Birmingham, B15 2TT, UK
3Warwick Medical School, University of Warwick, Coventry, CV4 7AL, UK
*Corresponding author: Kwok-Wai Lo
Department of Anatomical and Cellular Pathology, Prince of Wales
Hospital,
The Chinese University of Hong Kong, Shatin, N.T., Hong Kong
Tel: 852 – 2632 2178, Fax: 852 – 26376274
Email: [email protected]
Short Running Title: Activation of FGFR1 Signal Pathway by EBV LMP1
Conflict of Interest statement: The authors declare that there are no conflicts of interest.
Total Word No.: 3999 (Introduction to Discussion)

2
Abstract
Non-keratinizing nasopharyngeal carcinoma (NPC) is closely associated with Epstein-Barr virus (EBV)
infection. The EBV-encoded latent membrane protein 1 (LMP1) is believed to play an important role
in NPC pathogenesis by virtue of its ability to activate multiple cell signalling pathways which
collectively promote cell proliferation, transformation, angiogenesis and invasiveness as well as
modulation of energy metabolism. In this study, we report that LMP1 increases cellular uptake of
glucose and glutamine, enhances LDHA activity and lactate production, but reduces pyruvate kinase
activity and pyruvate concentrations. LMP1 also increases the phosphorylation of PKM2, LDHA and
FGFR1 as well as the expression of PDHK1, FGFR1, c-Myc and HIF-1 regardless of oxygen
availability. Collectively, these findings suggest that LMP1 promotes aerobic glycolysis. With respect
to FGFR1 signalling, LMP1 not only increases FGFR1 expression, but also upregulates FGF2, leading
to constitutive activation of the FGFR1 signalling pathway. Furthermore, two inhibitors of FGFR1
(PD161570 and SU5402) attenuate LMP1-mediated aerobic glycolysis, cellular transformation
(proliferation and anchorage-independent growth), cell migration and invasion in nasopharyngeal
epithelial cells, identifying FGFR1 signalling as a key pathway in LMP1-mediated growth
transformation. Immunohistochemical staining revealed that high levels of phosphorylated FGFR1 are
common in primary NPC specimens, and that this correlated with the expression of LMP1. In addition,
FGFR1 inhibitors suppress cell proliferation and anchorage-independent growth of NPC cells. Our
current findings demonstrate that LMP1-mediated FGFR1 activation contributes to aerobic glycolysis
and transformation of epithelial cells, thereby implicating FGF2/FGFR1 signalling activation in the
EBV-driven pathogenesis of NPC.
Key words: Nasopharyngeal Carcinoma; Epstein-Barr virus; Glycolysis; LMP1; FGFR1
3
Introduction
Non-keratinizing undifferentiated nasopharyngeal carcinoma (NPC) is closely associated with Epstein-
Barr virus infection. The EBV-encoded LMP1 protein, which is commonly expressed in NPC, is of
particular interest, as it displays oncogenic properties in vivo and in vitro [1]. LMP1 engages multiple
signalling cascades that include the NF-B, PI3K-AKT, ERK-MAPK, JNK, JAK-STAT, and
p38/MAPK pathways to alter various gene expression programs [1;2]. LMP1 is essential for EBV
immortalisation of primary B cells [3]. In epithelial cells, LMP1 promotes cell proliferation, anchorage
independent growth, cell survival, angiogenesis, cell invasion and migration. LMP1 also dysregulates
energy metabolism. These observations suggest that LMP1 is a prime candidate for driving NPC
development [1-3].
Cellular transformation is characterised by reduced oxidative phosphorylation and increased aerobic
glycolysis, where cells rapidly increase glucose utilization and lactate production regardless of oxygen
availability [4]. Aerobic glycolysis facilitates rapid cell division by providing both energy and metabolic
intermediates for the anabolic biosynthesis of macromolecules [4]. Accumulating evidence indicates
that HIF-1 and c-Myc play important roles in aerobic glycolysis by altering the activities of multiple
metabolic enzymes that include glucose transporter 1 (GLUT1), hexokinase 2 (HK2), lactate
dehydrogenase (LDHA), pyruvate dehydrogenase kinase 1 (PDHK1) and pyruvate kinase M2 isoform
(PKM2) [4-6]. In addition to HIF-1 and c-Myc, fibroblast growth factor 1 (FGFR1) is also found to
play an important role in aerobic glycolysis [7;8].
The FGFR family consists of four receptor tyrosine kinases (FGFR1-4). Upon FGF-ligand binding,
FGFRs undergo tyrosine autophosphorylation, activating various signalling cascades, which include the
MEK/ERK-MAPK and PI3K/Akt pathways. FGFR activation facilitates cell proliferation, survival,
invasion, migration and angiogenesis. In vitro studies have demonstrated that over-activation of FGFR1
in non-transformed mammary cells results in morphological transformation. Also, the induction of
FGFR1 in normal human urothelial cells promotes cell proliferation and cell survival [9]. Furthermore,
FGFR1 promotes aerobic glycolysis by inactivating PKM2, while enhancing the activities of LDHA1
and PDHK1 [7;8;10;11]. In this study, we report that LMP1 activates FGF2/FGFR1 signalling, an effect
that contributes to LMP1-mediated aerobic glycolysis, cell proliferation, anchorage-independent
growth, migration and invasion. Immunohistochemical analysis revealed that FGFR1 activation is
common in primary NPC and correlated with the expression of LMP1. Our findings demonstrate that
LMP1-mediated FGFR1 activation contributes to tumour progression, implicating the involvement of
FGF2/FGFR1 signalling in the pathogenesis of NPC.

4
Materials and methods
Cell lines, chemical, drug and transfection
C666-1 and SCC12F cells were maintained in RPMI 1640 and DMEM/F12 medium respectively. NP69
cells were maintained in keratinocyte-serum free medium (Life Technologies, Grand Island, NY, USA).
PD161570 and SU5402 were from Sigma, St Louis, MO, USA. Cell transfection was performed using
Fugene HD (Promega, Madison, WI, USA). LMP1 siRNA was from Dharmacon Inc., Lafayette, CO,
USA. Details are described in the Supplementary materials and methods.
Biochemical assays
Colorimetric assays were performed according to manufacturer’s protocol. The Lactate Assay Kit,
Glutamine and Glutamate Kit, and Lactate Dehydrogenase Activity Kit were from Sigma. The Glucose
Assay Kit, Pyruvate Assay Kit and Pyruvate Kinase Assay Kit were from Abcam. The Amplex® Red
Glutamic Acid/Glutamate Oxidase Assay Kit were from Life Technologies. Details are described in the
Supplementary materials and methods.
Quantitative RT-PCR
All QRT-PCR products were amplified using Power SYBR green PCR Master Mix Kit (Life
Technologies). Details are outlined in the Supplementary materials and methods.
Luciferase reporter assay
Luciferase reporter assays were performed using the Dual-Luciferase Reporter Assay System
(Promega). Details are outlined in the Supplementary materials and methods.
Western blotting analysis
Total cell lysates (5-50g of protein) were separated by 10% or 4-12% SDS-PAGE and transferred to a
PVDF membrane prior to immunoblotting. Antibodies to LMP1 were purchased from Dako, Glostrup,
Denmark and -tubulin from Santa Cruz, Dallas, TX, USA. All other antibodies were from Cell
Signalling Technology (Beveley, MA, USA).
Immunofluorescence staining
Immunofluorescence staining was performed as previously described [12]. Details are outlined in the
Supplementary.
Immunohistochemical staining
Immunohistochemical staining was performed as described previously [13]. Details are outlined in the
Supplementary materials and methods.

5
Cell Proliferation assay
Cell proliferation assay was performed with cell proliferation reagent CCK-8 (Dojindo Molecular
Technologies, Rockvilles, MD, USA). Details are outlined in the Supplementary.
Soft Agar Cloning Assay
Soft agar colony formation assays were performed as previously described [14;15]. Details are outlined
in the Supplementary.
Migration and Invasion Assays
Cell migration assays were performed using CytoSelect 24-well Wound Healing Assay Kit (Cell
Biolabs, San Diego, CA, USA). Boyden chamber invasion assays were performed using the CytoSelect
24-Well Cell Invasion Assay Kit (Cell Biolabs), respectively. For collagen gel invasion assays, a
collagen mixture was prepared with type I collagen solution (Life Technologies). Details are outlined in
the Supplementary.
Statistical Analysis
Where applicable, the significance of difference between two groups was evaluated with an unpaired
two-tailed student’s t-test. The IC50 values of PD161570 and SU5402 were determined using GraphPad
Prism software by applying the four-parameter logistic equation to generate the Sigmoidal dose-
response (variable slope) curves.
Results
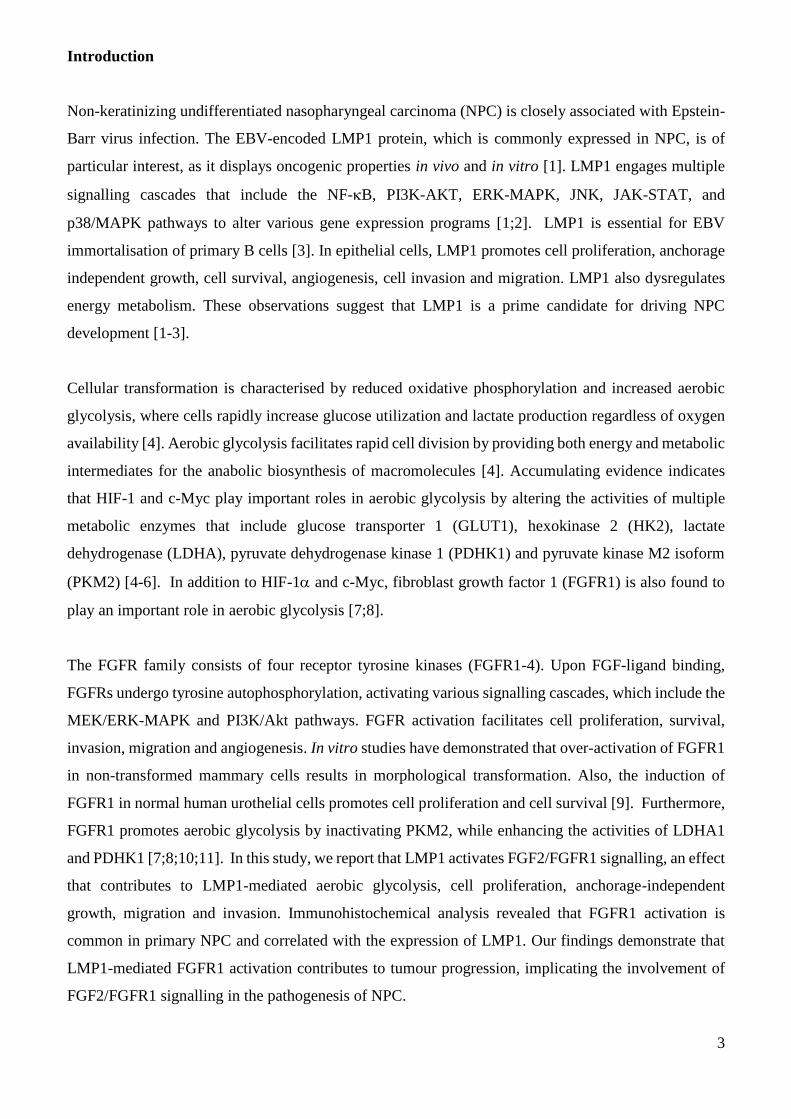
LMP1 promotes aerobic glycolysis
To examine the effects of LMP1 on the glycolytic pathway, we firstly examined lactate production in
control (NP69-pLNSX) and LMP1 expressing NP69 epithelial cells (NP69-LMP1). As shown in Figure
1A, increased levels of lactate production (approximately 1.4-fold higher) were observed in NP69-
LMP1 cells compared to NP69-pLNSX cells at day 7. We also found that LDHA activity in NP69-
LMP1 cells was 2.3-fold higher than that in NP69-pLNSX cells (Figure 1B). Pyruvate kinase (PK)
catalyses the conversion of PEP to pyruvate and ATP. Inactive PK promotes aerobic glycolysis [4;8;16].
Here, we demonstrate that PK activity was reduced by 20% in NP69-LMP1 cells (Figure 1C) and the
intracellular concentration of pyruvate in NP69-LMP1 cells was 22% lower than that in NP69-pLNSX
cells (Figure 1D). Aerobic glycolysis is associated with a high rate of glucose uptake. In agreement with
a recent study on NPC cells [17], the uptake of glucose in NP69-LMP1 cells was increased by
approximately 1.33-fold (Figure 1F). Glucose uptake is facilitated by glucose transporters (GLUT).
Using immunofluorescence staining, Sommermann T et al showed that LMP1 promotes the

6
translocation of GLUT1 from intracellular vesicles to the plasma membrane in B lymphocytes [18].
Here, compared to NP69-pLNSX cells, where GLUT1 was mainly found in intracellular membrane
compartments, GLUT1 was found in the plasma membrane of NP69-LMP1 cells (Figure 1E &
Supplementary Figure 1). This finding confirms that LMP1 promotes GLUT1 translocation to the
plasma membrane in nasopharyngeal epithelial cells, facilitating higher rates of glucose transport. In
addition to glucose, glutamine is another carbon source essential for cell growth. Here, we found that
NP69-LMP1 cells had a 1.67-fold higher level of glutamine consumption compared to NP69-pLNSX
cells (Figure 1G). The intracellular concentration of glutamate was also higher in NP69-LMP1
compared to NP69-pLNSX (approximately 1.24-fold) (Figure 1H). Overall, LMP1 increased the uptake
of glucose and glutamine, enhanced lactate production and reduced pyruvate kinase activity, suggesting
that LMP1 promotes aerobic glycolysis (Supplementary Figure 6).
Next, we examined the expression of glycolytic pathway-associated proteins. As shown in Figure 2A,
LMP1 induced the levels of Tyr10 phosphorylated-LDHA and Tyr105 phosphorylated-PKM2 as well
as the total amounts of LDHA and PDHK1 protein, in a dose dependent manner. However, LMP1 had
no effect on the expression of PKM2 and pyruvate dehydrogenase A1 (PDHA1). PKM2 phosphorylation
at Tyr105 is associated with decreased enzymatic activity, while LDHA phosphorylation at Tyr10
upregulates LDHA activity, promoting aerobic glycolysis [7;10]. PDHA1 is negatively regulated by
PDHK1. Inactivation of PDHA1 by PDHK1 leads to decreased conversion of pyruvate to acetyl-CoA,
allowing more pyruvate to convert to lactate [8]. Accordingly, LMP1 promotes aerobic glycolysis by
inactivating PKM2 and PDHA1 while enhancing the activities of LDHA and PDHK1 (Supplementary
Figure 6). Also, LMP1 alters the expression and activity of glycolytic proteins under both normoxic and
hypoxic conditions (Figure 2B), suggests that LMP1 induces aerobic glycolysis regardless of oxygen
availability. Aerobic glycolysis is regulated by numerous oncoproteins that include HIF-1 and c-Myc.
Previous studies have shown that HIF-1 and c-Myc are downstream targets of LMP1 [17;19-23]. Here,
we find the increased expression of both HIF-1 and c-Myc in NP69-LMP1 cells (Figure 2A & 2B).
Interestingly, LDHA, PKM2 and PDHK1 are transcriptional targets of c-Myc and HIF-1 [4-6].
Upregulation of LDHA and PDHK1 by LMP1 may be mediated through LMP1-induced c-Myc and
HIF-1 activity. However, this is still not clear as to the mechanism by which LMP1 induces the
phosphorylation of LDHA and PKM2.
LMP1 induces expression and activation of FGFR1
Previous studies have shown that FGFR1 directly phosphorylates LDHA at Tyr10 and PKM2 at Tyr105
to enhance LDHA activity and inactivate PKM2 respectively [7]. Thus, we sought to examine the effect
of LMP1 on FGFR1 expression. As shown in Figure 2A & B, we found that LMP1 increased the levels

7
of total and phosphorylated FGFR1 protein. Similar results were observed in LMP1 expressing
squamous carcinoma SCC12F (SCC12F-LMP1) cells (Supplementary Figure 2). By quantitative RT-
PCR, we found that LMP1 augmented FGFR1 mRNA expression in a dose dependent manner (Figure
2C & D). In both NP69-LMP1 and SCC12F-LMP1 cells, high levels of FGFR1 mRNA were observed.
The expression of LMP1 and FGFR1 mRNA was also observed in EBV-infected C666-1 NPC cells
(Supplementary Figure 3A & 3B). Using a luciferase reporter assay, we found that LMP1 stimulated
FGFR1 promoter activity in a dose dependent manner (Figure 2E). LMP1 has been reported to induce
FGF2, a ligand for FGFR1 [24]. We also found that LMP1 stimulated FGF2 expression in
nasopharyngeal epithelial cells (Figure 2F). High levels of FGF2 mRNA were also observed in NP69-
LMP1 and C666-1 cells (Supplementary Figure 3C). Our findings suggest a role for LMP1 in
constitutively activating FGF2/FGFR1 signalling pathway by upregulating both FGFR1 and FGF2.
Using a FGF2 specific neutralizing antibody, we found that inhibiting the binding of FGF2 to FGFR1
led to a robust reduction in FGFR1 phosphorylation in NP69-LMP1 cells (58%) compared to NP69-
pLNSX cells (20%) (Figure 2G). This finding indicates that activation of FGFR1 by LMP1 is mediated,
predominantly through LMP1-upregulation of FGF2. In C666-1 cells, which express low levels of
LMP1 protein [12;25], siRNA knock down of LMP1 resulted in a reduction in the levels of total and
phosphorylated FGFR1 proteins (Figure 2H), further confirming the activation of FGFR1 by LMP1 in
EBV-infected NPC cells.
Activation of FGFR1 signalling by LMP1 facilitates aerobic glycolysis
To determine whether LMP1-mediated FGFR1 activation contributed to aerobic glycolysis, NP69-
pLNSX and NP69-LMP1 cells were treated with PD16157 (PD) or SU5402 (SU), two specific FGFR1
inhibitors which suppress FGFR1 tyrosine kinase phosphorylation. As shown in Figure 3A, FGFR1
inhibitors suppressed FGFR1 phosphorylation in all cell lines examined; however, the suppression was
more obvious in NP69-LMP1 cells compared to NP69-pLNSX cells. Although treatment with 1M PD
resulted in no significant change in FGFR1 phosphorylation in NP69-pLNSX cells, a 50% reduction
was observed in NP69-LMP1 cells. FGFR1 inhibitors also suppressed LMP1-induced LDHA
phosphorylation and PDHK1 protein expression. Treatment with 1M PD reduced the level of LDHA
phosphorylation and PDHK1 protein by 50% and 40% respectively in NP69-LMP1 cells, while there
was no significant change in NP69-pLNSX cells. However, a high dose of PD (5M) inhibited
phosphorylation or the expression of FGFR1, LDHA, and PDHK1 in both NP69-pLNSX and NP69-
LMP1 cells. Similar results were observed when cells were treated with SU5402 (Figure 3A).
Furthermore, both FGFR1 inhibitors reduced HIF-1 expression, particularly in NP69-LMP1 cells. In
response to 1M PD treatment, the expression of HIF-1 in NP69-LMP1 and NP69-pLNSX cells was
reduced by 85% and 20% respectively. This finding suggests that LMP1-mediated FGFR1 signalling,

8
partially if not completely, upregulates HIF-1 expression. The ERK-MAPK and AKT pathways are
activated in response to FGFR stimulation [26;27]. In response to PD and SU, a reduction in Akt and
Erk1/2 phosphorylation was observed in both NP69-pLNSX and NP69-LMP1 cells (Figure 3A).
Although PKM2 has been reported to be a downstream target of FGFR1 [7], we did not observe any
significant inhibitory effect of PD161570 and SU5402 on PKM2 phosphorylation or protein expression
in all cell lines examined. (Figure 3A).
Next, we examined the effects of FGFR1 inhibitors on the activities of LDHA and PK. As shown in
Figure 3B, in the absence of FGFR1 inhibitors, LDHA activity in NP69-LMP1 cells was 2.2-fold higher
than that of NP69-pLNSX cells. In the presence of 5M PD or 20M SU, the LDHA activity in NP69-
LMP1 cells was reduced by 28% and 36% respectively, indicating that suppression of FGFR1 signalling
attenuates LMP1-induced LDHA activity. Both FGFR1 inhibitors had little or no effect on PK activity
in either NP69-pLNSX or NP69-LMP1 cells (Figure 3C), findings that are in agreement with results
obtained by western blot analysis of PKM2 protein and phosphorylation (Figure 3A). Overall, these
findings suggest that activation of FGFR1 by LMP1 alters the activity of glycolytic proteins, especially
LDHA, thereby facilitating aerobic glycolysis. Interestingly, our current data did not support a previous
report identifying PKM2 as a downstream target of FGFR1 [7].
FGFR1 activation is common in primary NPC tumours
Next, we sought to examine the activity of FGFR1 in NPC tumours. Immunohistochemical (IHC)
staining for phospho-FGFR1 (Tyr654) was performed on 42 NPC primary tumours. This set of samples
has been examined in a previous study, where 12/42 were found to express LMP1 protein [13]. The
intensity of phospho-FGFR1 staining was scored and a graph of the statistical dot plot of phospho-
FGFR1 staining intensity against LMP1 expression was generated (Figure 4F). IHC staining revealed
negative or weak expression of phospho-FGFR1 (immunoactivity score <3) in normal nasopharyngeal
epithelium (NP) (Figure 4A) and in 19/42 (45%) of NPC tumours (Figure 4B, representative NPC). In
contrast, moderate or high levels of phosphorylated FGFR1 (immunoactivity score ≥3) were detected in
23/42 NPC tumours (55%) (Figure 4C-4E, representative NPCs). In particular, LMP1-positive NPC
tumours were significantly associated with the higher levels of phosphorylated FGFR1 (p < 0.005).
(Figure 4F). These findings indicated that FGFR1 activation is common in NPC and correlates with
LMP1 expression. Given that 40% (12/30) of LMP1-negative tumours exhibited high levels of FGFR1
phosphorylation (Figure 4F). Other mechanisms, in addition to LMP1, may be involved in FGFR1
activation in NPC.
LMP1-induced FGFR1 signalling promotes cell growth and transformation

9
To determine whether increased FGFR1 activity conferred a growth advantage to LMP1-exprssing cells,
NP69-pLNSX and NP69-LMP1 cells were treated with increasing doses of PD or SU, and the effects
on cell growth examined. As shown in Figure 5A & 5B, suppression of FGFR1 activity reduced the
proliferation of both NP69-pLNSX and NP69-LMP1 cells; however, NP69-LMP1 cells were more
sensitive to FGFR1 inhibitors. At 2.5M PD, the growth of NP69-pLNSX and NP69-LMP1 cells was
reduced by 15% and 35% respectively (p<0.001), while 20M SU reduced cell proliferation of NP69-
pLNSX and NP69-LMP1 by 38% and 64% respectively (p<0.001). Similar growth inhibitory responses
were observed in SCC12F-LMP1 cells (Supplementary Figure 4). PD and SU also suppressed the
growth of C666-1 NPC cells; the IC50 of PD at day 3 and SU at day 5 were 2.9M and 9M respectively
(Figure 5C & 5D). These findings indicate that suppression of FGFR1 activity inhibits LMP1-induced
proliferation in non-malignant epithelial cells as well as the proliferation of LMP1 positive NPC cells,
and implicates FGFR1 activation by LMP1 as an important mechanism in facilitating cell proliferation.
Next, NP69-pLNSX and NP69-LMP1 cells were analysed for anchorage-independent growth. In
agreement with our previous data [14;15], NP69-pLNSX cells failed to grow in soft agar irrespective of
drug treatment (data not shown). In contrast, while NP69-LMP1 cells formed soft agar colonies under
drug-free conditions, they were susceptible to FGFR1 inhibitors. 2M PD reduced NP69-LMP1 colony
formation by 71% whereas 15M PD completely suppressed colony formation. 5M and 20M SU
reduced colony formation of NP69-LMP1 cells by 19% and 71% respectively (Figure 5E). We next
examined the anchorage-independent growth of C666-1 NPC cells. As shown in Figure 5E, PD was
more effective than SU in suppressing the colony formation of C666-1 cells, with 2M and 15M PD
reducing soft agar colony by 71% and 99% respectively, while 5M and 20M SU resulted in 9% and
74% reduction. Overall, these findings suggest that LMP1-induced FGFR1 activity contributes to
LMP1-mediated cellular transformation.
LMP1-induced FGFR1 signalling promotes cell migration and invasion
Our previous studies have shown that LMP1 promotes cell invasion and migration [14;15]. Here, we
sought to determine whether inhibition of FGFR1 activity attenuated these responses. In wound healing
assays (Figure 6A), NP69-pLNSX cells failed to migrate under drug-free conditions. Under the same
conditions, NP69-LMP1 cells migrated into the wound area away from the edge, indicating increased
motile response of NP69-LMP1 cells. However, in the presence 5M PD or 10M SU, the ability of
NP69-LMP1 to migrate was virtually abolished. In collagen gel invasion assays (Figure 6B), NP69-
pLNSX cells formed spherical and non-invasive structures within the collagen gel matrix in the presence
or absence of FGFR1 inhibitors, while, NP69-LMP1 cells formed long invasive branching tubules.
However, in the presence of 2M PD or 5M SU, NP69-LMP1 cells exhibited blunt-ended and short
tubules, indicating a reduction in cell invasion. In Boyden chamber invasion assays (Figure 6C),

10
invading cells located at the bottom of the membrane were stained and imaged (Supplementary Figure
5). Stained cells were then quantified after stain extraction. Under drug-free condition, NP69-LMP1
displayed 2- to 2.4-fold higher invasive ability than that of NP69-pLNSX. However, in the presence of
FGFR1 inhibitors, the invasive ability of NP69-LMP1was dramatically reduced. With 10M PD or
20M SU treatment, the invasive ability of NP69-LMP1 was reduced by 65% and 59% respectively. In
contrast, 10M PD or 20M SU treatment only suppressed the invasive ability of NP69-pLNSX cells
by 40% and 36%, respectively. Overall, our data suggest that LMP1-mediated FGFR1 activation
facilitates cell migration and invasion.
Discussion
LMP1 is crucial in EBV transformation of primary B cells, generating immortalized lymphoblastoid
cell lines (LCLs) in which aerobic glycolysis is active [28]. In non-malignant nasopharyngeal epithelial
cells, LMP1 induces cell proliferation, anchorage-independent growth, cell migration and invasion
[14;15]. LMP1 also deregulates cellular metabolism by inactivating LKB1-AMPK signalling [13].
Whilst, the impact of LMP1 on glycolytic pathways has not been fully explored. LMP1 has been shown
to increase the expression and activity of c-Myc and HIF-1, two key regulators of glycolytic
metabolism [17;19-23]. Here, we show that activation of the FGF2/FGFR1 signalling pathway by
LMP1 not only promotes aerobic glycolysis, but also cell proliferation and transformation as well as
migration and invasion (Figure 7).
In EBV immortalized LCLs, the concentration of lactate and pyruvate as well as LDHA activity were
found to be significantly higher compared to mitogen-activated B cells, suggesting that aerobic
glycolysis is active in LCLs [28]. Here, in nasopharyngeal epithelial cells, we show that LMP1 promotes
aerobic glycolysis by increasing the uptake of glucose and glutamine, enhancing LDHA activity and
lactate production, and by reducing PK activity and intracellular pyruvate concentrations (Figure 1).
Interestingly, NP69-LMP1 cells have lower pyruvate concentrations compared to NP69-pLNSX cells,
findings that differ to LCLs, which produce high levels of pyruvate [28]. The intracellular concentration
of pyruvate is regulated predominantly by three glycolytic enzymes which include PK which converts
PEP to pyruvate, LDHA which converts pyruvate to lactate in the cytosol and PDHA1 which converts
pyruvate to acetyl-CoA in the mitochondria [8;29]. Thus, the overall concentration of pyruvate relies
on the level and activities of these enzymes (Supplementary Figure 6). In NP69 and SCC12F cells, we
found that LMP1 increases the phosphorylation of LDHA at Tyr10 and PKM2 at Tyr105 and the levels
of LDHA and PDHK1 protein (Figure 2 & Supplementary Figure 2). LDHA phosphorylation at Try10
is necessary for LDHA activity, while, PKM2 phosphorylation at Tyr105 results in PKM2 inactivation
and PDHK1 upregulation [8,11]. The inactivation of PKM2 by LMP1 reduces pyruvate production but

11
increases the accumulation of upstream metabolic intermediates for biomass synthesis. Moreover,
PDHK1 functions to phosphorylate and inactivate PDHA1 activity. Activation of LDHA and PDHK1
by LMP1 inhibits oxidation of pyruvate to Acetyl-CoA but promotes conversion of pyruvate to lactate.
These observations suggest that LMP1 switches cellular oxidative phosphorylation to aerobic glycolysis
(Supplementary Figure 6). The increased uptake of glutamine by LMP1 may contribute to
glutaminolysis which is regulated by c-Myc [30]. Since c-Myc expression can be induced by LMP1
[17;19;21;23], the impact of LMP1 on glutaminolysis is worthy of further investigation.
In this study, we show that LMP1 increases FGFR1 expression in nasopharyngeal epithelial cells (Figure
2). Promoter luciferase reporter assays and qRT-PCR analysis indicate that LMP1 induces FGFR1
expressing by stimulating FGFR1 transcription (Figure 2C-E). The FGFR1 promoter is positively
regulated by Sp1 and E2F-1 [31;32]. The activity of Sp1 is regulated by various kinases that include
cyclin-dependent kinase (CDK), atypical protein kinase C- (PKC-) and ERK-MAPK [33]. LMP1 has
been reported to upregulate and/or activate CDK2, PKC-, and ERK kinases [1;34;35]. On the other
hand, the transcriptional activity of E2F-1, which is inhibited by RB interaction, is activated in response
to RB phosphorylation by cyclin D1. The induction of RB phosphorylation and cyclin D1 upregulation
by LMP1 is mediated through NFB, EGFR and STAT3 signalling [36-38]. As such, LMP1 induction
of FGFR1 expression appeared to be mediated through multiple downstream targets and/or signal
pathways (Supplementary Figure 7). Induction of FGF-2 by LMP1-mediated NFB activation has been
indicated [24]. We also found the upregulation of FGF2 in LMP1 expressing cells (Figure 2F). Blocking
the binding of FGF-2 to FGFR1 with a FGF-2 neutralising antibody resulted in reduction of FGFR1
phosphorylation in NP69-LMP1 cells (Figure 2G), supporting a role for FGF2 ligand in driving
constitutive FGFR1 signalling in LMP1 expressing nasopharyngeal epithelial cells.
Using conventional IHC, 12 of 42 NPC samples found to express detectable levels of LMP1 also
expressed high levels of phosphorylated FGFR1. However, among thirty LMP1-negative NPC tumours,
twelve displayed high levels of phosphorylated FGFR1. In this regard, mechanisms, in addition to
LMP1, may be responsible for FGFR1 activation. Another possibility is that the expression of LMP1
protein in the majority of NPC samples is below the level of detection using current methods. Using a
sensitive tyramid-augmented IHC method, Dietz et al have found that nearly all NPC specimens with
negative LMP1-staining in conventional IHC were positive for LMP1 expression [39]. Despite the
extremely low levels of expression, LMP1 can have dramatic consequences on the phenotype of
epithelial cells. Studies from transgenic mice have shown that LMP1 induces epithelial hyperplasia at
levels that are virtually undetectable using current available detection methods [40]. Our previous study
have also indicated that very small amount of LMP1, below the level of detection, are sufficient to

12
activate NFB signalling, a key pathway that contributes to LMP1-mediated cell transformation [41].
This is also reminiscent of C666-1 NPC cell line which expresses very low level of LMP1 but high level
of FGF2, regulated by NFB signalling (Supplementary Figure 3) [24]. This raises the possibility that
those NPC tumours in which LMP1 protein cannot be detected may nevertheless express functionally
active LMP1.
Constitutive FGFR1 activation has been shown to induce cellular transformation and promote cancer
progression. Aberrant activation of FGFR1 signalling, through overexpression of FGFR1 and/or its
ligands, mutations or amplification, have been documented in a variety of human malignancies
[26;27;42]. In this study, we demonstrate that FGFR1 signalling contributes to LMP1-mediated cellular
transformation. Inhibition of FGFR1 pathway significantly suppressed LMP1-induced cell proliferation,
anchorage-independent growth, migration and invasion (Figure 5). FGFR1 inhibitors also suppressed
LMP1-mediated glycolysis as they reduced both LDHA phosphorylation and activity (Figure 3). In
addition, we report that FGFR1 signalling is commonly activated in NPC, and is particularly evident in
cases that are LMP1 positive (Figure 4). Previous studies indicate that genetic alterations in FGFR1
and/or its ligands (FGF1 and FGF2) are rare in NPC tumours [2]. As FGFR1 activation in NPC correlates
significantly with LMP1 expression (Figure 4F), LMP1-activated FGFR1 signalling may play an
important role in NPC pathogenesis. The development of cancer therapeutics based on targeting FGFR
signalling is an attractive approach. Currently, many kinase inhibitors with anti-FGFR activity, in
addition to FGFR1 blocking antibodies are being evaluated in clinical trials. In this study, we show that
FGFR1 inhibitors suppress cell proliferation and anchorage-independent growth of C666-1 NPC cells,
highlighting the therapeutic potential of the FGFR1 pathway (Figure 5). Therapeutic strategies targeting
FGFR1 signalling in NPC is worthy of further examination particularly in the context of metastatic
disease.
Acknowledgements
This work was supported by Focus Investigation Scheme-A from the Chinese University of Hong Kong,
Research Grants Council of Hong Kong - GRF (471211, 470312, 471413), CRF (CUHK8/CRF/11R)
and Theme-Based Research Scheme (T12-401/13R) funding; This study was also supported by Direct
Grant for Research (2014.2.003) from the Chinese University of Hong Kong anda Cancer Research UK
(CRUK)-funded China Fellowship to AKF Lo, CRUK Programme Funding to AKF Lo, CW Dawson
and LS Young. We thank Masaya Imoto, Keio University for providing FGFR1 promoter construct.
Statement of author contributions

13
AKFL, CWD and KWL designed research, AKFL, CWD, CWK, PMH, KWL performed research,
AKFL, CWD LSY and KWL analysed data and drafted the manuscript. All authors discussed the
findings, reviewed the data and commented on the manuscript.
List of online Supporting Information
Supplementary File 1
Additional Materials and Methods
Supplementary Fig. 1
LMP1 induces translocation of GLUT1 from intracellular vesicles to the plasma membrane.
NP69-pLNSX and NP69-LMP1 cells were subject to immunofluorescence staining with GLUT1 (left
panel) and counterstained with DAPI to identify the nucleus (left panel). Three pairs of representative
pictures are shown. Red arrows indicate the localization of GLUT1 in intracellular membrane
compartments. Yellow arrows indicate the GLUT1 staining at the plasma membrane.
Supplementary Fig. 2
LMP1 alters the expression and phosphorylation of glycolytic protein in SCC12F cells
SCC12F-pLNSX and SCC12F-LMP1 cells were harvested and subjected to immunoblotting analysis
for the indicated proteins.
Supplementary Fig. 3
LMP1 increases the expression of FGFR1 and FGF2 mRNA
NP69-pLNSX, NP69-LMP1, C666-1, SCC12F-pLNSX and SCC12F-LMP1 cells were harvested and
subjected to quantitative RT-PCR analysis for FGFR1 (A) and LMP1 (B) expression. (C) The levels of
FGF2 mRNA were determined in NP69-pLNSX, NP69-LMP1 and C666-1 cells. The mRNA expression
of the target gene was normalized to expression of the TBP gene. Relative mRNA levels were calculated
using NP69-pLNSX cells (set at 1).
Supplementary Fig. 4
FGFR1 inhibitors attenuate LMP1-mediated proliferation
SCC12F-pLNSX and SCC12F-LMP1 cells were treated with increasing doses of PD161570 (A) or
SU5402 (B), as indicated, for 3 days prior to cell growth analysis.
Supplementary Fig. 5
FGFR1 inhibitors attenuate LMP1-mediated invasion

14
For Boyden Chamber invasion assays, 5x10⁵ NP69-pLNSX or NP69-LMP1 cells were plated into the
chambers coated with basement membrane matrix solution. After 24 h incubation with indicated
concentrations of FGFR1 inhibitors, invasive cells, which localise to the bottom of the membrane were
stained and photographed.
Supplementary Fig.6
Schematic diagram shows the effects of LMP1 in promoting aerobic glycolysis. (1) LMP1 increases
the uptake of glucose and glutamine, the concentration of intracellular glutamate and lactate, as well as
the enzymatic activity of LDHA. (2) LMP1 reduces the intracellular concentration of pyruvate and the
enzymatic activity of pyruvate kinase. (3) LMP1 increases the expression of HIF-1, c-Myc, FGFR1,
FGF2, LDHA and PDHK1, and increases the levels of phosphorylation of LDHA (Y10), PKM2 (Y105)
and FGFR1 (Y653/654) to promote aerobic glycolysis.
Supplementary Fig. 7
Schematic diagram showing the mechanism of LMP1-mediated upregulation of FGFR1 & FGF2
LMP1 activates multiple signal pathways and downstream targets to induce transcription of FGFR1 and
FGF2.
References
1. Dawson CW, Port RJ, Young LS. The role of the EBV-encoded latent membrane proteins LMP1
and LMP2 in the pathogenesis of nasopharyngeal carcinoma (NPC). Semin Cancer Biol 2012; 22:
144-153.
2. Lo KW, Chung GT, To KF. Deciphering the molecular genetic basis of NPC through molecular,
cytogenetic, and epigenetic approaches. Semin Cancer Biol 2012; 22: 79-86.
3. Tsao SW, Tramoutanis G, Dawson CW et al. The significance of LMP1 expression in
nasopharyngeal carcinoma. Semin Cancer Biol 2002; 12: 473-487.
4. Cairns RA, Harris IS, Mak TW. Regulation of cancer cell metabolism. Nat Rev Cancer 2011; 11:
85-95.
5. Yeung SJ, Pan J, Lee MH. Roles of p53, MYC and HIF-1 in regulating glycolysis - the seventh
hallmark of cancer. Cell Mol Life Sci 2008; 65: 3981-3999.
6. Chen JQ, Russo J. Dysregulation of glucose transport, glycolysis, TCA cycle and glutaminolysis
by oncogenes and tumor suppressors in cancer cells. Biochim Biophys Acta 2012; 1826: 370-384.
7. Hitosugi T, Kang S, Vander Heiden MG et al. Tyrosine phosphorylation inhibits PKM2 to promote
the Warburg effect and tumor growth. Sci Signal 2009; 2: ra73.
8. Hitosugi T, Chen J. Post-translational modifications and the Warburg effect. Oncogene 2014; 33:
4279-4285.

15
9. Knights V, Cook SJ. De-regulated FGF receptors as therapeutic targets in cancer. Pharmacol Ther
2010; 125: 105-117.
10. Fan J, Hitosugi T, Chung TW et al. Tyrosine phosphorylation of lactate dehydrogenase A is
important for NADH/NAD(+) redox homeostasis in cancer cells. Mol Cell Biol 2011; 31: 4938-
4950.
11. Hitosugi T, Fan J, Chung TW et al. Tyrosine phosphorylation of mitochondrial pyruvate
dehydrogenase kinase 1 is important for cancer metabolism. Mol Cell 2011; 44: 864-877.
12. Lo AK, Lo KW, Tsao SW et al. Epstein-Barr virus infection alters cellular signal cascades in
human nasopharyngeal epithelial cells. Neoplasia 2006; 8: 173-180.
13. Lo AK, Lo KW, Ko CW et al. Inhibition of the LKB1-AMPK pathway by the Epstein-Barr virus-
encoded LMP1 promotes proliferation and transformation of human nasopharyngeal epithelial
cells. J Pathol 2013; 230: 336-346.
14. Lo AK, Huang DP, Lo KW et al. Phenotypic alterations induced by the Hong Kong-prevalent
Epstein-Barr virus-encoded LMP1 variant (2117-LMP1) in nasopharyngeal epithelial cells. Int J
Cancer 2004; 109: 919-925.
15. Lo AK, Liu Y, Wang XH et al. Alterations of biologic properties and gene expression in
nasopharyngeal epithelial cells by the Epstein-Barr virus-encoded latent membrane protein 1. Lab
Invest 2003; 83: 697-709.
16. Luo W, Semenza GL. Emerging roles of PKM2 in cell metabolism and cancer progression. Trends
Endocrinol Metab 2012; 23: 560-566.
17. Xiao L, Hu ZY, Dong X et al. Targeting Epstein-Barr virus oncoprotein LMP1-mediated
glycolysis sensitizes nasopharyngeal carcinoma to radiation therapy. Oncogene 2014; 33: 4568-
4578.
18. Sommermann TG, O'Neill K, Plas DR et al. IKKbeta and NF-kappaB transcription govern
lymphoma cell survival through AKT-induced plasma membrane trafficking of GLUT1. Cancer
Res 2011; 71: 7291-7300.
19. Tudor CS, Dawson CW, Eckhardt J et al. c-Myc and EBV-LMP1: two opposing regulators of the
HLA class I antigen presentation machinery in epithelial cells. Br J Cancer 2012; 106: 1980-1988.
20. Kondo S, Seo SY, Yoshizaki T et al. EBV latent membrane protein 1 up-regulates hypoxia-
inducible factor 1alpha through Siah1-mediated down-regulation of prolyl hydroxylases 1 and 3
in nasopharyngeal epithelial cells. Cancer Res 2006; 66: 9870-9877.
21. Chen H, Hutt-Fletcher L, Cao L et al. A positive autoregulatory loop of LMP1 expression and
STAT activation in epithelial cells latently infected with Epstein-Barr virus. J Virol 2003; 77:
4139-4148.
22. Wakisaka N, Kondo S, Yoshizaki T et al. Epstein-Barr virus latent membrane protein 1 induces
synthesis of hypoxia-inducible factor 1 alpha. Mol Cell Biol 2004; 24: 5223-5234.
23. Dirmeier U, Hoffmann R, Kilger E et al. Latent membrane protein 1 of Epstein-Barr virus
coordinately regulates proliferation with control of apoptosis. Oncogene 2005; 24: 1711-1717.
24. Wakisaka N, Murono S, Yoshizaki T et al. Epstein-barr virus latent membrane protein 1 induces
and causes release of fibroblast growth factor-2. Cancer Res 2002; 62: 6337-6344.

16
25. Lo AK, To KF, Lo KW et al. Modulation of LMP1 protein expression by EBV-encoded
microRNAs. Proc Natl Acad Sci U S A 2007; 104: 16164-16169.
26. Kelleher FC, O'Sullivan H, Smyth E et al. Fibroblast growth factor receptors, developmental
corruption and malignant disease. Carcinogenesis 2013; 34: 2198-2205.
27. Lim SM, Kim HR, Shim HS et al. Role of FGF receptors as an emerging therapeutic target in lung
squamous cell carcinoma. Future Oncol 2013; 9: 377-386.
28. Darekar S, Georgiou K, Yurchenko M et al. Epstein-Barr virus immortalization of human B-cells
leads to stabilization of hypoxia-induced factor 1 alpha, congruent with the Warburg effect. PLoS
One 2012; 7: e42072.
29. Fritz V, Fajas L. Metabolism and proliferation share common regulatory pathways in cancer cells.
Oncogene 2010; 29: 4369-4377.
30. Wise DR, DeBerardinis RJ, Mancuso A et al. Myc regulates a transcriptional program that
stimulates mitochondrial glutaminolysis and leads to glutamine addiction. Proc Natl Acad Sci U S
A 2008; 105: 18782-18787.
31. Seyed M, Dimario JX. Sp1 is required for transcriptional activation of the fibroblast growth factor
receptor 1 gene in neonatal cardiomyocytes. Gene 2007; 400: 150-157.
32. Kanai M, Tashiro E, Maruki H et al. Transcriptional regulation of human fibroblast growth factor
receptor 1 by E2F-1. Gene 2009; 438: 49-56.
33. Tan NY, Khachigian LM. Sp1 phosphorylation and its regulation of gene transcription. Mol Cell
Biol 2009; 29: 2483-2488.
34. Everly DN, Jr., Mainou BA, Raab-Traub N. Induction of Id1 and Id3 by latent membrane protein
1 of Epstein-Barr virus and regulation of p27/Kip and cyclin-dependent kinase 2 in rodent
fibroblast transformation. J Virol 2004; 78: 13470-13478.
35. Mainou BA, Everly DN, Jr., Raab-Traub N. Unique signaling properties of CTAR1 in LMP1-
mediated transformation. J Virol 2007; 81: 9680-9692.
36. Mainou BA, Raab-Traub N. LMP1 strain variants: biological and molecular properties. J Virol
2006; 80: 6458-6468.
37. Shi Y, Tao Y, Jiang Y et al. Nuclear epidermal growth factor receptor interacts with transcriptional
intermediary factor 2 to activate cyclin D1 gene expression triggered by the oncoprotein latent
membrane protein 1. Carcinogenesis 2012; 33: 1468-1478.
38. Xu Y, Shi Y, Yuan Q et al. Epstein-Barr Virus encoded LMP1 regulates cyclin D1 promoter
activity by nuclear EGFR and STAT3 in CNE1 cells. J Exp Clin Cancer Res 2013; 32: 90.
39. Dietz A, Logothetis CA, Helbig M et al. Prognostic impact of EBV-related LMP-1, histologic
type, and environmental factors in nasopharyngeal carcinoma in a German population. Onkologie
2004; 27: 345-350.
40. Stevenson D, Charalambous C, Wilson JB. Epstein-Barr virus latent membrane protein 1 (CAO)
up-regulates VEGF and TGF alpha concomitant with hyperlasia, with subsequent up-regulation of
p16 and MMP9. Cancer Res 2005; 65: 8826-8835.

17
41. Lo AK, Dawson CW, Jin DY et al. The pathological roles of BART miRNAs in nasopharyngeal
carcinoma. J Pathol 2012; 227: 392-403.
42. Fearon AE, Gould CR, Grose RP. FGFR signalling in women's cancers. Int J Biochem Cell Biol
2013; 45: 2832-2842.
Figure Legends
Figure 1. LMP1 promotes aerobic glycolysis. NP69-pLNSX and NP69-LMP1 cells were incubated in
Keratinocyte-SFM medium supplemented with 0.2ng/ml EGF and 30g/ml bovine pituitary extract. (A)
Culture supernatants were collected at the indicated time for the determination of lactate production. (B-
D, H) Cell lysates were extracted for measurement of intracellular LDH activity (B), pyruvate kinase
activity (C), pyruvate concentration (D) and glutamate concentration (H). (F-G) Culture supernatants
were collected for measurement of glucose uptake (F), and glutamine consumption (G). The results are
expressed by defining the control (NP69-pLNSX) as 1. Bars represent the mean+ SEM of samples from
three independent experiments. The asterisks indicate a significant difference (*P <0.05 and **P
<0.001). (E) Immunofluorescence staining of GLUT1 in NP69-pLNSX and NP69-LMP1 cells. Yellow
arrows indicate the localization of GLUT1 in the plasma membrane. Red arrows indicate the GLUT1
staining in intracellular membrane compartments.
Figure 2. LMP1 alters the expression and activity of glycolytic proteins and increases the
expression of FGFR1. (A) The nasopharyngeal epithelial cell line NP69 was transfected with
increasing amounts of LMP1 expression vector as indicated. Forty-eight hours post-transfection, cells
were harvested and subjected to immunoblotting analysis for the indicated proteins. (B) NP69-pLNSX
(P) and NP69-LMP1 (L) cells were incubated under either normoxic (21% O2) or hypoxic (3% O2)
conditions for 24 hours prior to western blot analysis. (C-D, F) The NP69 cells were transferred with
increasing amounts of LMP1 expression vector as indicated. Forty-eight hours post-transfection, cells
were harvested and subjected to quantitative RT-PCR analysis for FGFR1 (C), LMP1 (D) and FGF2
(F). The mRNA expression of the target gene of interest was normalized to the expression of the TBP
gene. Relative mRNA levels were calculated using the sample without transfected LMP1 vector (set at
1). (E) Hela cells were transfected with FGFR1 luciferase promoter vector together with various doses
of LMP1 expression vector. Forty-eight hours post-transfection, cells were harvested for luciferase
analysis. Luciferase activity was normalized to Renilla activity and was plotted relative to that of
reporter alone (set at 1). (G). NP69-pLNSX (P) and NP69-LMP1 (L) cells were treated with 20g/ml
control IgG antibody or FGF2 neutralizing antibody in serum-free medium for 6 hours prior to western
blot analysis. (H). C666-1 cells were transfected with scrambled siRNA or LMP1 siRNA. Protein lysates
were harvested 48 hours after transfection for western blot analysis. Relative protein levels were
calculated using control NP69-pLNSX or parental C666-1 as a reference (set at 1).

18
Figure 3. Activation of FGFR1 by LMP1 facilitates aerobic glycolysis. (A) NP69-pLNSX and NP69-
LMP1 cells were treated with FGFR1 inhibitors, PD161570 (PD) or SU5402 (SU), for 7 h prior to
harvesting for immunoblotting. Relative protein levels were calculated using inhibitor-free NP69-
pLNSX as a reference (set at 1). (B&C) Cells were treated with FGFR1 inhibitors for 16 h prior to
analysis of LDH activity (B) and pyruvate kinase activity (C). Relative LDH activity was calculated
using inhibitor-free NP69-pLNSX as a reference (set at 1). The asterisks indicate a significant difference
(*P <0.02 and **P <0.05).
Figure 4. NPC tumours display increased levels of FGFR1 phosphorylation. Immunohistochemical
staining of NPC and normal nasopharyngeal epithelium specimens for Tyr 654 phosphorylated-FGFR1
(phospho-FGFR1). (A) Negative phospho-FGFR1 staining was observed in normal EBV-negative
nasopharyngeal epithelia. (B) Low (score: 2) levels of FGFR1 phosphorylation in NPC tumour cells.
(C) Moderate (immunoactivity score: 5) levels of phospho-FGFR1 expression in NPC tumour cells. (D
& E) Strong (immunoactivity score: 8 and 12) levels of phospho-FGFR1 staining of NPC tumour cells.
(F) Graph of a dot plot showing the immunoactivity score of phospho-FGFR1 staining within the group
of tumours with and without LMP1 expression (n=42). The majority of the LMP1-positive NPC tumours
(11/12, 92%) exhibited strong FGFR1 phosphorylation (score: ≥3). The median values of each group
are shown in the horizontal line. The p value between the two groups is shown. Black arrow: normal
nasopharyngeal epithelium; Red arrow: NPC tumour cells.
Figure 5. FGFR1 inhibitors attenuate the proliferation and anchorage-independent growth of
NP69-LMP1 and C666-1 cells. (A & B) NP69-pLNSX and NP69-LMP1 cells were treated with
increasing doses of PD161570 (PD) or SU5402 (SU), as indicated, for 3 days prior to cell growth
analysis. For NP69-pLNSX cells, the IC50 of PD and SU are 32.8±6.0m and 15.4±4.2m respectively.
For NP69-LMP1 cells, the IC50 of PD and SU are 25.5±6.5m and 11.9±0.75m respectively. (C & D)
The NPC cell line, C666-1, was treated with various doses of PD and SU for 2 to 5 days prior to cell
growth analysis. (E) Soft agar growth assays were performed in duplicate for each sample and the
experiment was repeated twice. The total number of colonies formed after 3 weeks from each sample
was quantitated. The asterisks indicate a significant difference (*P <0.001 and **P<0.05).
Figure 6. FGFR1 inhibitors attenuate LMP1-mediated migration and invasion. (A) In wound
healing assays, 0.5x10⁶ cells were plated into inserts on a well of 24-well plate. One day after seeding,
the insert was removed to generate a defined wound field. 12 hours after incubation with the indicated
concentration of FGFR1 inhibitors, cell migration was examined by phase microscopy. The wound
closures were photographed and a single representative area is shown (left panel). Three individual
experiments were performed and the average % of distance migration (gap difference before and after

19
treatment) is shown (right panel). (B). Three-dimensional collagen gel invasion assay. Cells in the
collagen gel matrix were maintained in Keratinocyte-SFM medium with indicated concentration of
FGFR1 inhibitors for 5 days. The growth pattern was examined and imaged. (C). The Boyden Chamber
invasion assay. 5x10⁵ cells were plated on the chamber coated with basement membrane matrix solution.
After 24 h incubation in the medium with indicated concentration of FGFR1 inhibitors, the invasive
cells on the bottom of the membrane were stained and quantified after stain extraction. The asterisks
indicate a significant difference (*P<0.05, **P<0.01).
Fig. 7 Schematic diagram showing the effect of LMP1 on FGFR1 signaling
LMP1 activation of FGF2/FGFR1 signaling increases the expression and/or activity of glycolysis-
associated proteins and pathways, facilitating aerobic glycolysis and transformation of nasopharyngeal
epithelial cells.
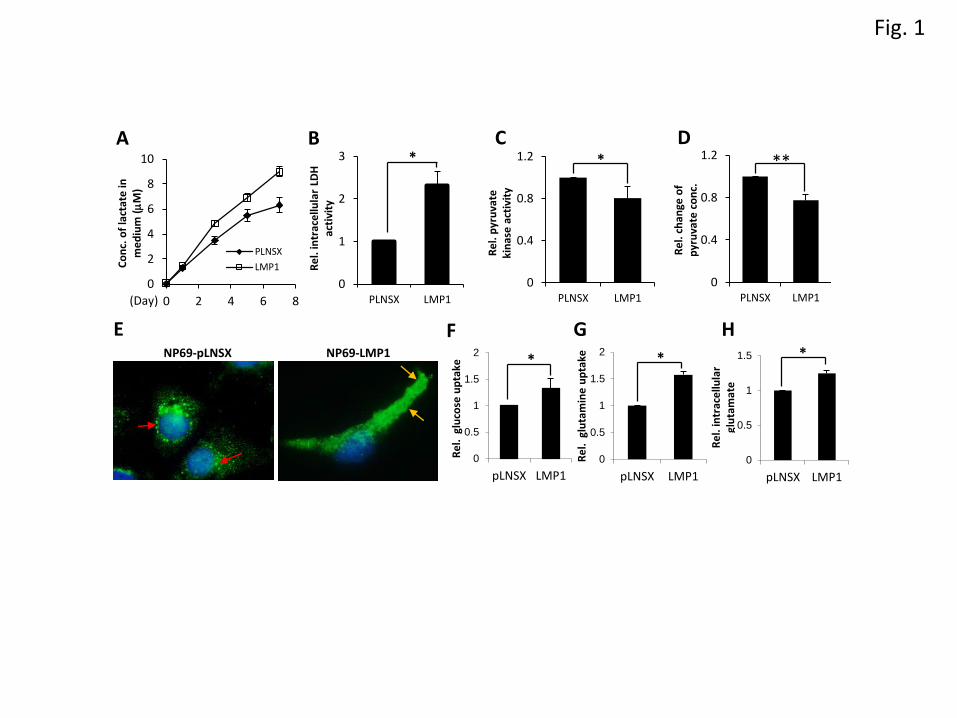
Fig. 1
AC
on
c. o
f la
ctat
e in
m
ed
ium
(m
M)
0
2
4
6
8
10
0 2 4 6 8
PLNSX
LMP1
(Day)
B
0
1
2
3
PLNSX LMP1R
el.
intr
ace
llula
r LD
H
acti
vity
*
*
0
0.4
0.8
1.2
PLNSX LMP1
C
Re
l. p
yru
vate
ki
nas
e a
ctiv
ity
*
0
0.4
0.8
1.2
PLNSX LMP1
D
Re
l. c
han
ge o
f p
yru
vate
co
nc.
**
E F
0
0.5
1
1.5
2
pLNSX LMP1
Re
l. g
luco
se u
pta
ke
*
0
0.5
1
1.5
2
pLNSX LMP1
G
Re
l. g
luta
min
e u
pta
ke *
H
Re
l. in
trac
ellu
lar
glu
tam
ate
0
0.5
1
1.5
pLNSX LMP1
*NP69-pLNSX NP69-LMP1
Fig. 2
0 20
40
80
15
0
25
0
35
0 No
rmo
xia
Hyp
oxi
a
p-PKM2
PKM2
p-LDHA
LDHA
c-Myc
LMP1
a-tubulin
HIF-1a
PDHK1
PDHA1
p-FGFR1
FGFR1
LMP1 (ng) P L P L
A B
Rel.
LM
P1 m
RN
A
(x100000)
D
0
4
8
12
LMP1 (ng) 0 20 50 100 200 LMP1 (ng) 0 20 50 100 200 0
0.5
1
1.5
2
Rel.
FG
F2 m
RN
A
F
C
Rel.
FG
FR
1 m
RN
A
0
5
10
15
20
25
LMP1 (ng) 0 20 50 100 200
E
Rel.
pro
mo
ter
acti
vit
y
LMP1 (ng) 0 1 2 3 6 12 0
1
2
3
p-FGFR1
FGFR1
LMP1
a-tubulin
G
P L P L
No
rmal
IgG
FGF2
Ab
1 5.2 1 5.4
1 3.6 0.8 1.5
H
Par
enta
l
Scra
mb
le s
iRN
A
LMP
1 s
iRN
A
p-FGFR1
FGFR1
LMP1
a-tubulin1 0.9 0.4
1 1 0.2
1 1 0.3
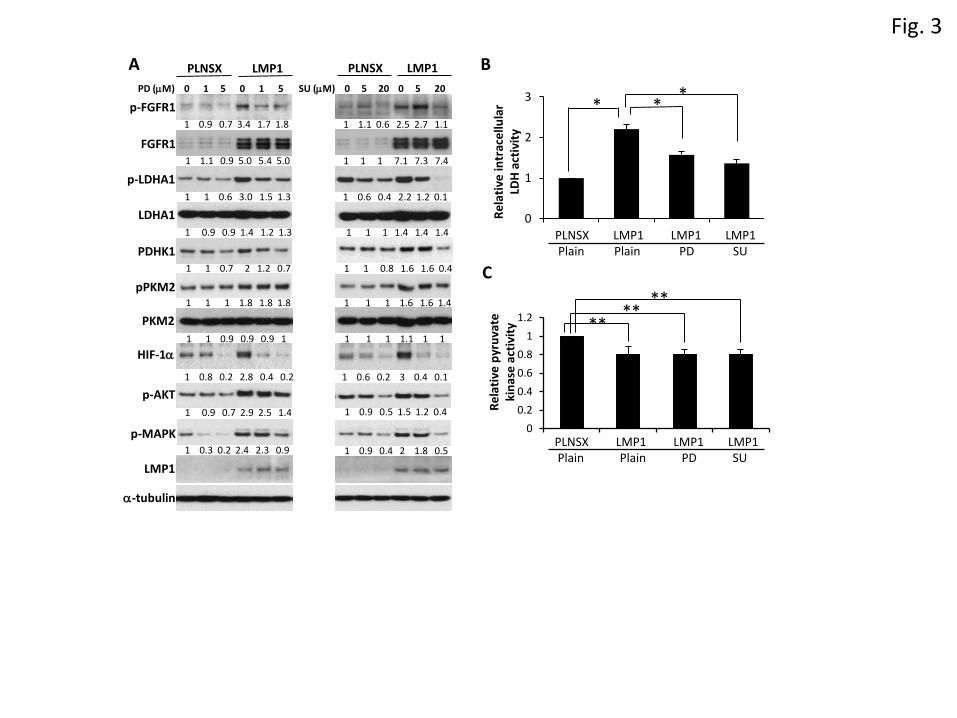
Fig. 3
BSU (mM) 0 5 20 0 5 20
PLNSX LMP1
1 1.1 0.6 2.5 2.7 1.1
1 1 1 7.1 7.3 7.4
1 0.6 0.4 2.2 1.2 0.1
1 1 1 1.4 1.4 1.4
1 1 0.8 1.6 1.6 0.4
1 1 1 1.6 1.6 1.4
1 1 1 1.1 1 1
1 0.9 0.5 1.5 1.2 0.4
1 0.9 0.4 2 1.8 0.5
1 0.6 0.2 3 0.4 0.1
FGFR1
p-FGFR1
PD (mM) 0 1 5 0 1 5
PLNSX LMP1
p-LDHA1
LDHA1
PDHK1
pPKM2
PKM2
1 0.9 0.7 3.4 1.7 1.8
1 1.1 0.9 5.0 5.4 5.0
1 1 0.6 3.0 1.5 1.3
1 0.9 0.9 1.4 1.2 1.3
1 1 0.7 2 1.2 0.7
1 1 1 1.8 1.8 1.8
1 1 0.9 0.9 0.9 1
A
p-AKT
LMP1
a-tubulin
p-MAPK
1 0.9 0.7 2.9 2.5 1.4
1 0.3 0.2 2.4 2.3 0.9
1 0.8 0.2 2.8 0.4 0.2
HIF-1a
C
PLNSX LMP1 LMP1 LMP1Plain Plain PD SU
0
0.2
0.4
0.6
0.8
1
1.2
PLNSX LMP1 LMP1 LMP1Plain Plain PD SU
Re
lati
ve p
yru
vate
ki
nas
e a
ctiv
ity **
****
0
1
2
3*
**
Re
lati
ve in
trac
ellu
lar
LDH
act
ivit
y

Fig. 4
C
ED
A B
Imm
un
oac
tivi
tysc
ore
of
pFG
FR1
FP<0.005
Positive NegativeLMP1 Expression
0
2
4
6
8
10
12
14
Tyr 654 phosphorylated-FGFR1
Normal NP NPC
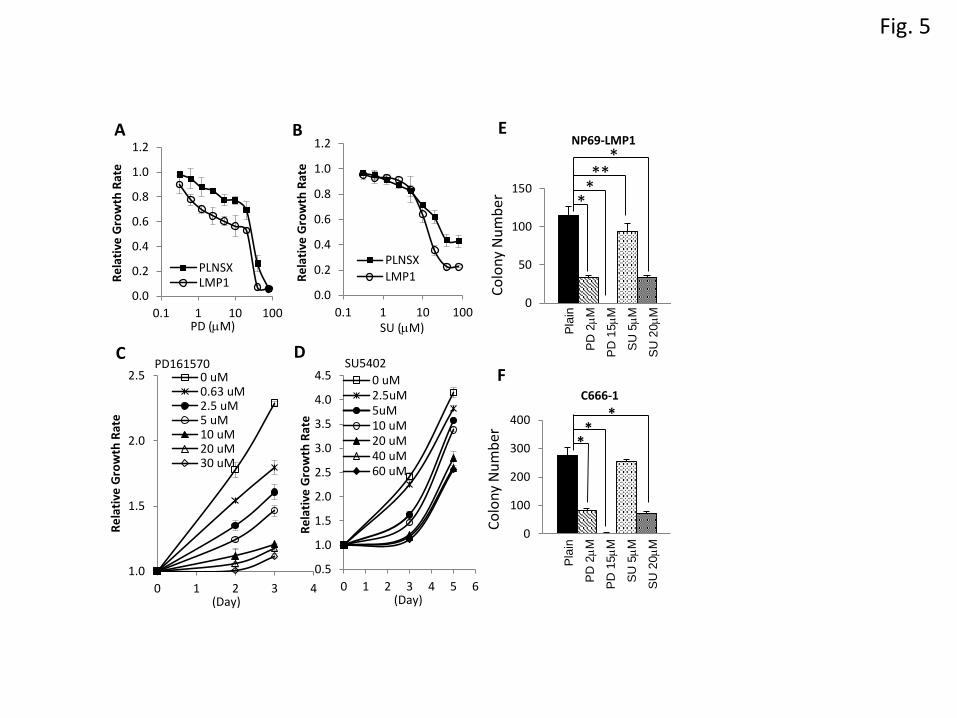
Fig. 5
SU (mM)
B
0.0
0.2
0.4
0.6
0.8
1.0
1.2
0.1 1 10 100
PLNSXLMP1R
ela
tive
Gro
wth
Rat
e0
50
100
150
NP69-LMP1
Co
lon
y N
um
ber
*
**
**
E
Pla
in
PD
2m
M
PD
15m
M
SU
5m
M
SU
20m
M
C666-1
Pla
in
PD
2m
M
PD
15m
M
SU
5m
M
SU
20m
M
0
100
200
300
400
Co
lon
y N
um
ber *
**
F
PD (mM)
AR
ela
tive
Gro
wth
Rat
e
0.0
0.2
0.4
0.6
0.8
1.0
1.2
0.1 1 10 100
PLNSXLMP1
(Day)
PD161570 C
Re
lati
ve G
row
th R
ate
1.0
1.5
2.0
2.5
0 1 2 3 4
0 uM0.63 uM2.5 uM5 uM10 uM20 uM30 uM
(Day)
SU5402D
Re
lati
ve G
row
th R
ate
0.5
1.0
1.5
2.0
2.5
3.0
3.5
4.0
4.5
0 1 2 3 4 5 6
0 uM2.5uM5uM10 uM20 uM40 uM60 uM

Fig. 6
CB
PLN
SXLM
P1
PD 2mMPlain
Plain SU 5mM
PLN
SXLM
P1
LMP1(Plain)PLNSX
(Plain) (SU 10mM)(PD 5mM)LMP1LMP1
0 h
12
hA
1.9mm
0.8mm
1.8mm
1.75mm
2.1mm
2mm
1.75mm
1.75mm 0
25
50
75
100
Dis
tan
ce M
igra
tio
n (
%)
PLNSX LMP1 LMP1 LMP1Plain Plain PD 5mM SU 10mM
Re
lati
ve c
ell
inva
sive
ab
ility
0
0.5
1
1.5
2
2.5
PLNSX LMP1
PD 0 uM
PD 2.5 uM
PD 10 uM
**
*
0
0.5
1
1.5
2
2.5
3
PLNSX LMP1
SU 0 uM
SU 5 uM
SU 20 uM
Re
lati
ve c
ell
inva
sive
ab
ility
****
**

Fig. 7
• Aerobic Glycolysis• Cellular Transformation: (proliferation,
anchorage-independent growth)• Cell migration & invasion
LDHA1PDHK1HIF-1Erk-MAPKAkt
FGF2
FGFR1
LMP1
FGF2
FGFR1

NP69-pLNSX
GLUT1 GLUT1+DAPI
NP69-LMP1
GLUT1 GLUT1+DAPI
Supplementary Fig. 1 LMP1 induces translocation of GLUT1 from intracellular vesicles to the plasma membrane.NP69-pLNSX and NP69-LMP1 cells were subject to immunofluorescence staining with GLUT1(left panel) and counterstained with DAPI to identify the nucleus (left panel). Three pairs ofrepresentative pictures are shown. Red arrows indicate the localization of GLUT1 in intracellularmembrane compartments. Yellow arrows indicate the GLUT1 staining at the plasma membrane.

PLN
SX
LMP
1
pLDHA
pPKM2
PKM2
LDHA
a-tubulin
LMP1
FGFR1
pFGFR1
PDHK1
PDHA1
Supplementary Fig. 2LMP1 alters the expression and phosphorylationof glycolytic protein in SCC12F cells. SCC12F-pLNSX and SCC12F-LMP1 cells were harvestedand subjected to immunoblotting analysis for theindicated proteins.

B
Re
l. m
RN
A o
f LM
P1
(x
10
00
00
)
0
2
4
6
8C
Re
l. m
RN
A o
f FG
F2
0
1
2
3
4
Re
l. m
RN
A o
f F
GFR
1
A
0
2
4
6
8
10
Supplementary Fig. 3 LMP1 increases the expression of FGFR1 and FGF2 mRNA. NP69-pLNSX, NP69-LMP1,C666-1, SCC12F-pLNSX and SCC12F-LMP1 cells were harvested and subjected toquantitative RT-PCR analysis for FGFR1 (A) and LMP1 (B) expression. (C) The levels ofFGF2 mRNA were determined in NP69-pLNSX, NP69-LMP1 and C666-1 cells. ThemRNA expression of the target gene was normalized to expression of the TBP gene.Relative mRNA levels were calculated using NP69-pLNSX cells (set at 1).

AR
ela
tive
Gro
wth
Rat
e
PD (mM)
0.0
0.2
0.4
0.6
0.8
1.0
1.2
0.1 1 10
PLNSXLMP1
B
SU (mM)
0.0
0.2
0.4
0.6
0.8
1.0
1.2
1 10 100
PLNSXLMP1R
ela
tive
Gro
wth
Rat
eSupplementary Fig. 4FGFR1 inhibitors attenuate LMP1-mediated proliferation. SCC12F-pLNSX and SCC12F-LMP1 cells were treated with increasing doses of PD161570 (A) or SU5402 (B), asindicated, for 3 days prior to cell growth analysis.

LMP
1P
LNSX
PD 0uM PD 2.5uM PD 10uM
LMP
1P
LNSX
SU 0uM SU 5uM SU 20uM
Supplementary Fig. 5FGFR1 inhibitors attenuate LMP1-mediated invasion. For Boyden Chamber invasionassays, 5x10⁵ NP69-pLNSX or NP69-LMP1 cells were plated into the chambers coatedwith basement membrane matrix solution. After 24 h incubation with indicatedconcentrations of FGFR1 inhibitors, invasive cells, which localise to the bottom of themembrane were stained and photographed.

PDHA1Pyruvate
Glucose
Glucose-6-P
Fructose Bisphosphate
Fructose-6-P
3-Phosphoglycerate
Phosphoenolpyruvate (PEP)
Acetyl-CoA
Glucose
CitrateMalate
Oxaloacetate
Pyruvate conc.
p-PKM2 (Y105) Pyruvate kinase activity
Glutamine
Glutamate
a-Ketoglutarate
Lipid Synthesis
Malate
Lactate
Citrate
Glutamine
Aer
ob
ic G
lyco
lysi
s
c-M
yc&
HIF
-1
6-P-gluconolactone
Glutaminolysisc-Myc
Ribose-5-phoaphate
6-P-gluconate
Pentose Phosphate Shunt
Nucleotide Synthesis
FGFR
1 e
xpre
ssio
nFG
F2 e
xpre
ssio
nP
-FG
FR1
(Y
65
3/6
54
)
PDHK1
KrebsCycle
Supplementary Fig.6Schematic diagram shows the effects of LMP1 in promoting aerobic glycolysis. (1) LMP1 increases the uptake ofglucose and glutamine, the concentration of intracellular glutamate and lactate, as well as the enzymatic activity ofLDHA. (2) LMP1 reduces the intracellular concentration of pyruvate and the enzymatic activity of pyruvate kinase. (3)LMP1 increases the expression of HIF-1a, c-Myc, FGFR1, FGF2, LDHA and PDHK1, and increases the levels ofphosphorylation of LDHA1 (Y10), PKM2 (Y105) and FGFR1 (Y653/654) to promote aerobic glycolysis.
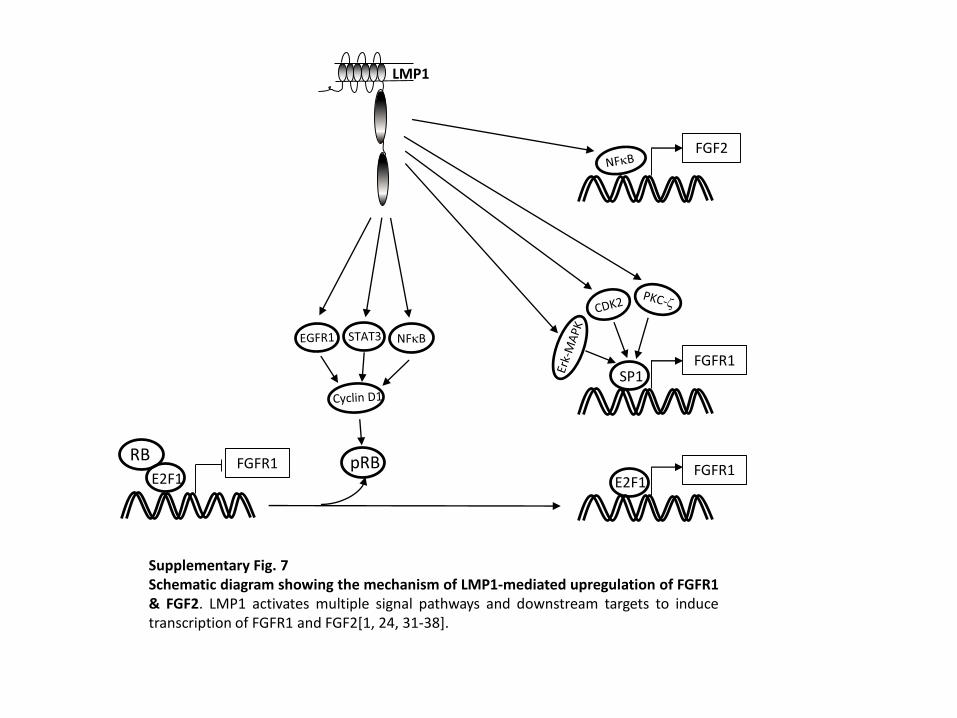
Supplementary Fig. 7Schematic diagram showing the mechanism of LMP1-mediated upregulation of FGFR1& FGF2. LMP1 activates multiple signal pathways and downstream targets to inducetranscription of FGFR1 and FGF2[1, 24, 31-38].
LMP1
pRB
FGF2
SP1FGFR1
E2F1FGFR1
E2F1
RB FGFR1