University of Arkansas at Little Rock Ottenheimer...
94
University of Arkansas at Little Rock Ottenheimer Library Association of Research Libraries / Texas A&M University www.libqual.org Language: Institution Type: Consortium: User Group: American English College or University None All Language: Institution Type: Consortium: User Group: American English College or University None All
-
Upload
truongmien -
Category
Documents
-
view
215 -
download
0
Transcript of University of Arkansas at Little Rock Ottenheimer...
University of Arkansas at Little Rock
Ottenheimer Library
Association of Research Libraries / Texas A&M University
www.libqual.org
Language:
Institution Type:
Consortium:
User Group:
American English
College or University
None
All
Language:
Institution Type:
Consortium:
User Group:
American English
College or University
None
All

Language:
Institution Type:
Consortium:
User Group:
American English
College or University
None
All
Language:
Institution Type:
Consortium:
User Group:
American English
College or University
None
All
University of Arkansas at Little Rock
Ottenheimer Library
Association of Research Libraries / Texas A&M University
www.libqual.org
Contributors
Colleen Cook MaShana DavisTexas A&M University Association of Research Libraries
Fred Heath Martha KyrillidouUniversity of Texas Association of Research Libraries
Bruce Thompson Duane WebsterTexas A&M University Association of Research Libraries
Language:
Institution Type:
Consortium:
User Group:
American English
College or University
None
All
Language:
Institution Type:
Consortium:
User Group:
American English
College or University
None
All
Association of Research Libraries
21 Dupont Circle NW
Suite 800
Washington, DC 20036
Phone 202-296-2296
Fax 202-872-0884
http://www.libqual.org
Copyright © 2008 Association of Research Libraries
Language:
Institution Type:
Consortium:
User Group:
American English
College or University
None
All
Language:
Institution Type:
Consortium:
User Group:
American English
College or University
None
All
LibQUAL+® 2008 Survey Results - UALR Ottenheimer Library Page 3 of 89
1 Introduction
1.1 Acknowledgements
This notebook contains information from the 2008 administration of the LibQUAL+® protocol. The material on the
following pages is drawn from the analysis of responses from the participating institutions collected in 2008.
The LibQUAL+® project requires the skills of a dedicated group. We would like to thank several members of the
LibQUAL+® team for their key roles in the development of this service. From Texas A&M University, the
qualitative leadership of Yvonna Lincoln has been key to the project's integrity. The behind-the-scenes roles of Bill
Chollet and others from the library Systems and Training units were also formative in the early years. From the
Association of Research Libraries, we are appreciative of the past contributions of Consuella Askew, Richard
Groves, Amy Hoseth, Mary Jackson, Jonathan Sousa, and Benny Yu.
A New Measures initiative of this scope is possible only as the collaborative effort of many libraries. To the directors
and liaisons at all participating libraries goes the largest measure of gratitude. Without your commitment, the
development of LibQUAL+® would not have been possible. We would like to extend a special thank you to all
administrators at the participating consortia and libraries that are making this project happen effectively across
various institutions.
We would like to acknowledge the role of the Fund for the Improvement of Post-secondary Education (FIPSE), U.S.
Department of Education, which provided grant funds of $498,368 over a three-year period (2001-03). We would
also like to acknowledge the support of the National Science Foundation (NSF) for its grant of $245,737 over a
three-year period (2002-04) to adapt the LibQUAL+® instrument for use in the science, math, engineering, and
technology education digital library community, an assessment tool in development now called DigiQUAL. We
would like to express our thanks for the financial support that has enabled the researchers engaged in this project to
exceed all of our expectations in stated goals and objectives and deliver a remarkable assessment tool to the library
community.
Colleen Cook MaShana Davis
Texas A&M University Association of Research Libraries
Fred Heath Martha Kyrillidou
University of Texas Association of Research Libraries
Bruce Thompson Duane Webster
Texas A&M University Association of Research Libraries
Language:
Institution Type:
Consortium:
User Group:
American English
College or University
None
All
Language:
Institution Type:
Consortium:
User Group:
American English
College or University
None
All
Page 4 of 89 LibQUAL+® 2008 Survey Results - UALR Ottenheimer Library
1.2 LibQUAL+®: A Project from StatsQUAL®
I would personally like to say a word about the development of LibQUAL+® over the last few years and to thank the
people that have been involved in this effort. LibQUAL+® would not have been possible without the many people
who have offered their time and constructive feedback over the years for the cause of improving library services. In a
sense, LibQUAL+® has built three kinds of partnerships: one between ARL and Texas A&M University, a second
one among the participating libraries and their staff, and a third one comprising the thousands of users who have
provided their valuable survey responses over the years.
LibQUAL+® was initiated in 2000 as an experimental project for benchmarking perceptions of library service
quality across 13 ARL libraries under the leadership of Fred Heath and Colleen Cook, then both at Texas A&M
University Libraries. It matured quickly into a standard assessment tool that has been applied at more than 1,000
libraries, collecting information on more than half a million library users. Each year since 2003, we have had more
than 200 libraries conduct LibQUAL+®, more than 100,000 users respond, and annually more than 50,000 users
provide rich comments about the ways they use their libraries.
There have been numerous advancements over the years. In 2005, libraries were able to conduct LibQUAL+® over a
two session period (Session I: January to May and Session II: July to December). The LibQUAL+® servers were
moved from Texas A&M University to an external hosting facility under the ARL brand known as StatsQUAL®.
Through the StatsQUAL® gateway we will continue to provide innovative tools for libraries to assess and manage
their environments in the coming years. In 2006, we added the LibQUAL+® Analytics (for more information, see
Section 1.6).
LibQUAL+® findings have engaged thousands of librarians in discussions with colleagues and ARL on what these
findings mean for local libraries, for their regions, and for the future of libraries across the globe. Consortia have
supported their members’ participation in LibQUAL+® in order to offer an informed understanding of the changes
occurring in their shared environment. Summary highlights have been published on an annual basis showcasing the
rich array of information available through LibQUAL+®:
LibQUAL+® 2007 Survey Highlights
<http://www.libqual.org/documents/admin/LibQUALHighlights2007_Full_Supplemental.pdf>
<http://www.libqual.org/documents/admin/LibQUALHighlights2007_Full.pdf>
LibQUAL+® 2006 Survey Highlights
<http://www.libqual.org/documents/admin/LibQUALHighlights2006.pdf>
LibQUAL+® 2005 Survey Highlights
<http://www.libqual.org/documents/admin/LibQUALHighlights20051.pdf>
LibQUAL+® 2004 Survey Highlights
<http://www.libqual.org/documents/admin/ExecSummary%201.3.pdf>
LibQUAL+® 2003 Survey Highlights
<http://www.libqual.org/documents/admin/ExecSummary1.1_locked.pdf>
Language:
Institution Type:
Consortium:
User Group:
American English
College or University
None
All
Language:
Institution Type:
Consortium:
User Group:
American English
College or University
None
All
LibQUAL+® 2008 Survey Results - UALR Ottenheimer Library Page 5 of 89
Summary published reports have also been made available:
<http://www.arl.org/pubscat/libqualpubs.html>
The socio-economic and technological changes that are taking place around us are affecting the ways users interact
with libraries. We used to think that libraries could provide reliable and reasonably complete access to published and
scholarly output, yet we now know from LibQUAL+® that users have an insatiable appetite for content. No library
can ever have sufficient information content that would come close to satisfying this appetite.
The team at ARL and beyond has worked hard to nurture the community that has been built around LibQUAL+®.
We believe that closer collaboration and sharing of resources will bring libraries nearer to meeting the ever changing
needs of their demanding users. It is this spirit of collaboration and a willingness to view the world of libraries as an
organic, integrated, and cohesive environment that can bring forth major innovations and break new ground.
Innovation and aggressive marketing of the role of libraries in benefiting their communities strengthen libraries.
In an example of collaboration, LibQUAL+® participants are sharing their results within the LibQUAL+®
community with an openness that nevertheless respects the confidentiality of each institution and its users .
LibQUAL+® participants are actively shaping our Share Fair gatherings, our in-person events, and our
understanding of how the collected data can be used. LibQUAL+® offers a rich resource that can be viewed using
many lenses, should be interpreted in multiple ways, and is a powerful tool libraries can use to understand their
environment.
LibQUAL+® is a community mechanism for improving libraries and I hope we see an increasing number of libraries
utilizing it successfully in the years to come. I look forward to your continuing active involvement in helping us
understand the many ways we can improve library services.
With warm regards,
Martha Kyrillidou
Director, ARL Statistics and Service Quality Programs
Language:
Institution Type:
Consortium:
User Group:
American English
College or University
None
All
Language:
Institution Type:
Consortium:
User Group:
American English
College or University
None
All
Page 6 of 89 LibQUAL+® 2008 Survey Results - UALR Ottenheimer Library
1.3 LibQUAL+®: Defining and Promoting Library Service Quality
What is LibQUAL+®?
LibQUAL+® is a suite of services that libraries use to solicit, track, understand, and act upon users’ opinions of
service quality. These services are offered to the library community by the Association of Research Libraries (ARL).
The program’s centerpiece is a rigorously tested Web-based survey bundled with training that helps libraries assess
and improve library services, change organizational culture, and market the library. The goals of LibQUAL+® are
to:
• Foster a culture of excellence in providing library service
• Help libraries better understand user perceptions of library service quality
• Collect and interpret library user feedback systematically over time
• Provide libraries with comparable assessment information from peer institutions
• Identify best practices in library service
• Enhance library staff members’ analytical skills for interpreting and acting on data
As of 2007, more than 1,000 libraries have participated in the LibQUAL+® survey, including Canadian government
libraries, colleges and universities, community colleges, health sciences and hospital/medical libraries, law libraries,
public libraries, and secondary school libraries---some through various consortia, others as independent participants.
LibQUAL+® has expanded internationally, with participating institutions in Canada, the U.K. and other European
countries as well as Australia and South Africa. It has been translated into a number of languages, including
Afrikaans, Chinese (Traditional), Danish, Dutch, Finnish, French, German, Japanese, Norwegian, Spanish, Swedish,
and Welsh. The growing LibQUAL+® community of participants and its extensive dataset are rich resources for
improving library services.
How will LibQUAL+® benefit your library?
Library administrators have successfully used LibQUAL+® survey data to identify best practices, analyze deficits,
and effectively allocate resources. Benefits to participating institutions include:
• Institutional data and reports that enable you to assess whether your library services are meeting user
expectations
• Aggregate data and reports that allow you to compare your library’s performance with that of peer
institutions
• Workshops designed for participants
• Access to an online library of LibQUAL+® research articles
• The opportunity to become part of a community interested in developing excellence in library services
LibQUAL+® gives your library users a chance to tell you where your services need improvement so you can
respond to and better manage their expectations. You can develop services that better meet your users’ expectations
by comparing your library’s data with that of peer institutions and examining the practices of those libraries that are
evaluated highly by their users.
How is the LibQUAL+® survey conducted?
Language:
Institution Type:
Consortium:
User Group:
American English
College or University
None
All
Language:
Institution Type:
Consortium:
User Group:
American English
College or University
None
All
LibQUAL+® 2008 Survey Results - UALR Ottenheimer Library Page 7 of 89
Conducting the LibQUAL+® survey requires little technical expertise on your part. You invite your users to take the
survey by distributing the URL for your library’s Web form via e-mail. Respondents complete the survey form and
their answers are sent to a central database. The data are analyzed and presented to you in reports describing your
users’ desired, perceived, and minimum expectations of service.
What are the origins of the LibQUAL+® survey?
The LibQUAL+® survey evolved from a conceptual model based on the SERVQUAL instrument, a popular tool for
assessing service quality in the private sector. The Texas A&M University Libraries and other libraries used
modified SERVQUAL instruments for several years; those applications revealed the need for a newly adapted tool
that would serve the particular requirements of libraries. ARL, representing the largest research libraries in North
America, partnered with Texas A&M University Libraries to develop, test, and refine LibQUAL+®. This effort was
supported in part by a three-year grant from the U.S. Department of Education’s Fund for the Improvement of
Post-Secondary Education (FIPSE).
Language:
Institution Type:
Consortium:
User Group:
American English
College or University
None
All
Language:
Institution Type:
Consortium:
User Group:
American English
College or University
None
All
Page 8 of 89 LibQUAL+® 2008 Survey Results - UALR Ottenheimer Library
1.4 Web Access to Data
Data summaries from the 2008 iteration of the LibQUAL+® survey will be available to project participants online
via the LibQUAL+® survey management site:
<http://www.libqual.org/Manage/Results/index.cfm>
Language:
Institution Type:
Consortium:
User Group:
American English
College or University
None
All
Language:
Institution Type:
Consortium:
User Group:
American English
College or University
None
All
LibQUAL+® 2008 Survey Results - UALR Ottenheimer Library Page 9 of 89
1.5 Explanation of Charts and Tables
A working knowledge of how to read and derive relevant information from the tables and charts used in your
LibQUAL+® results notebook is essential. In addition to the explanatory text below, you can find a self -paced
tutorial on the project web site at:
<http://www.libqual.org/Information/Tools/index.cfm>
Both the online tutorial and the text below are designed to help you understand your survey results and present and
explain those results to others at your library.
Radar Charts
Radar charts are commonly used throughout the following pages to display both aggregate results and results from
individual institutions. Basic information about radar charts is outlined below, and additional descriptive information
is included throughout this notebook.
What is a radar chart?
Radar charts are useful when you want to look at several different factors all related to one item. Sometimes called
“spider charts” or “polar charts”, radar charts feature multiple axes or “spokes” along which data can be plotted.
Variations in the data are shown by distance from the center of the chart. Lines connect the data points for each
series, forming a spiral around the center.
In the case of the LibQUAL+® survey results, each axis represents a different survey question. Questions are
identified by a code at the end of each axis. The three dimensions measured by the survey are grouped together on
the radar charts, and each dimension is labeled: Affect of Service (AS), Information Control (IC), and Library as
Place (LP).
Radar charts are used in this notebook to present the item summaries (the results from the 22 core survey questions).
How to read a radar chart
Radar charts are an effective way to show strengths and weaknesses graphically by enabling you to observe
symmetry or uniformity of data. Points close to the center indicate a low value, while points near the edge indicate a
high value. When interpreting a radar chart, it is important to check each individual axis as well as the chart’s overall
shape in order to gain a complete understanding of its meaning. You can see how much data fluctuates by observing
whether the spiral is smooth or has spikes of variability.
Respondents’ minimum, desired, and perceived levels of service quality are plotted on each axis of your
LibQUAL+® radar charts. The resulting “gaps” between the three levels are shaded in blue, yellow, green, and red.
Generally, a radar graph shaded blue and yellow indicates that users’ perceptions of service fall within the “zone of
tolerance”; the distance between minimum expectations and perceptions of service quality is shaded in blue, and the
distance between their desired and perceived levels of service quality is shown in yellow. When users’ perceptions
fall outside the “zone of tolerance,” the graph will include areas of red and green shading. If the distance between
users’ minimum expectations and perceptions of service delivery is represented in red, that indicates a negative
service adequacy gap score. If the distance between the desired level of service and perceptions of service delivery is
represented in green, that indicates a positive service superiority gap score.
Language:
Institution Type:
Consortium:
User Group:
American English
College or University
None
All
Language:
Institution Type:
Consortium:
User Group:
American English
College or University
None
All
Page 10 of 89 LibQUAL+® 2008 Survey Results - UALR Ottenheimer Library
Means
The mean of a collection of numbers is their arithmetic average, computed by adding them up and dividing by their
total number.
In this notebook, means are provided for users’ minimum, desired, and perceived levels of service quality for each
item on the LibQUAL+® survey. Means are also provided for the general satisfaction and information literacy
outcomes questions.
Standard Deviation
Standard deviation is a measure of the spread of data around their mean. The standard deviation (SD) depends on
calculating the average distance of each score from the mean.
In this notebook, standard deviations are provided for every mean presented in the tables.
Service Adequacy
The service adequacy gap score is calculated by subtracting the minimum score from the perceived score on any
given question, for each user. Both means and standard deviations are provided for service adequacy gap scores on
each item of the survey, as well as for each of the three dimensions of library service quality. In general, service
adequacy is an indicator of the extent to which you are meeting the minimum expectations of your users. A negative
service adequacy gap score indicates that your users’ perceived level of service quality is below their minimum level
of service quality and is printed in red.
Service Superiority
The service superiority gap score is calculated by subtracting the desired score from the perceived score on any
given question, for each user. Both means and standard deviations are provided for service superiority gap scores on
each item of the survey, as well as for each of the three dimensions of library service quality. In general, service
superiority is an indicator of the extent to which you are exceeding the desired expectations of your users. A positive
service superiority gap score indicates that your users’ perceived level of service quality is above their desired level
of service quality and is printed in green.
Sections with charts and tables are omitted from the following pages when there are three or fewer individuals in a
specific group.
In consortia notebooks, institution type summaries are not shown if there is only one library for an institution type .
Individual library notebooks are produced separately for each participant.
Language:
Institution Type:
Consortium:
User Group:
American English
College or University
None
All
Language:
Institution Type:
Consortium:
User Group:
American English
College or University
None
All
LibQUAL+® 2008 Survey Results - UALR Ottenheimer Library Page 11 of 89
1.6 A Few Words about LibQUAL+® 2008
Libraries today confront escalating pressure to demonstrate impact. As Cullen (2001) has noted,
Academic libraries are currently facing their greatest challenge since the explosion in tertiary
education and academic publishing which began after World War II... [T]he emergence of the
virtual university, supported by the virtual library, calls into question many of our basic
assumptions about the role of the academic library, and the security of its future. Retaining
and growing their customer base, and focusing more energy on meeting their customers'
expectations is the only way for academic libraries to survive in this volatile environment.
(pp. 662-663)
Today, "A measure of library quality based solely on collections has become obsolete" (Nitecki, 1996, p. 181).
These considerations have prompted the Association of Research Libraries (ARL) to sponsor a number of "New
Measures" initiatives. The New Measures efforts represent a collective determination on the part of the ARL
membership to augment the collection-count and fiscal input measures that comprise the ARL Index and ARL
Statistics, to date the most consistently collected statistics for research libraries, with outcome measures such as
assessments of service quality and satisfaction. One New Measures Initiative is the LibQUAL+® service (Cook,
Heath & B. Thompson, 2002, 2003; Heath, Cook, Kyrillidou & Thompson, 2002; Thompson, Cook & Heath, 2003;
Thompson, Cook & Thompson, 2002).
Within a service-quality assessment model, "only customers judge quality; all other judgments are essentially
irrelevant" (Zeithaml, Parasuraman, Berry, 1990, p. 16). LibQUAL+® was modeled on the 22-item SERVQUAL
tool developed by Parasuraman, Berry and Zeithaml (Parasuraman, Berry & Zeithaml, 1991). However,
SERVQUAL has been shown to measure some issues not particularly relevant in libraries, and to not measure some
issues of considerable interest to library users.
The final 22 LibQUAL+® items were developed through several iterations of studies involving a larger pool of 56
items. The selection of items employed in the LibQUAL+® survey has been grounded in the users' perspective as
revealed in a series of qualitative studies involving a larger pool of items. The items were identified following
qualitative research interviews with student and faculty library users at several different universities (Cook, 2002a;
Cook & Heath, 2001).
LibQUAL+® is not just a list of 22 standardized items. First, LibQUAL+® offers libraries the ability to select five
optional local service quality assessment items. Second, the survey includes a comments box soliciting open-ended
user views. Almost half of the people responding to the LibQUAL+® survey provide valuable feedback through the
comments box. These open-ended comments are helpful for not only (a) understanding why users provide certain
ratings, but also (b) understanding what policy changes users suggest, because many users feel the obligation to be
constructive. Participating libraries are finding the real-time access to user comments one of the most useful devices
in challenging library administrators to think outside of the box and develop innovative ways for improving library
services.
LibQUAL+® is one of 11 ways of listening to users, called a total market survey. As Berry (1995) explained,
When well designed and executed, total market surveys provide a range of information
unmatched by any other method... A critical facet of total market surveys (and the reason for
using the word 'total') is the measurement of competitors' service quality. This [also] requires
Language:
Institution Type:
Consortium:
User Group:
American English
College or University
None
All
Language:
Institution Type:
Consortium:
User Group:
American English
College or University
None
All
Page 12 of 89 LibQUAL+® 2008 Survey Results - UALR Ottenheimer Library
using non-customers in the sample to rate the service of their suppliers. (p. 37)
Although (a) measuring perceptions of both users and non-users, and (b) collecting perceptions data with regard to
peer institutions can provide important insights Berry recommended using multiple listening methods and
emphasized that "Ongoing data collection... is a necessity. Transactional surveys, total market surveys, and employee
research should always be included" (Berry, 1995, p. 54).
Score Scaling
"Perceived" scores on the 22 LibQUAL+® core items, the three subscales, and the total score, are all scaled 1 to 9,
with 9 being the most favorable. Both the gap scores ("Adequacy" = "Perceived" - "Minimum"; "Superiority" =
"Perceived" - "Desired") are scaled such that higher scores are more favorable. Thus, an adequacy gap score of +1.2
on an item, subscale, or total score is better than an adequacy gap score of +1.0. A superiority gap score of -0.5 on
an item, subscale, or total score is better than a superiority gap score of -1.0.
Using LibQUAL+® Data
In some cases LibQUAL+® data may confirm prior expectations and library staff will readily formulate action plans
to remedy perceived deficiencies. But in many cases library decision-makers will seek additional information to
corroborate interpretations or to better understand the dynamics underlying user perceptions.
For example, once an interpretation is formulated, library staff might review recent submissions of users to
suggestion boxes to evaluate whether LibQUAL+® data are consistent with interpretations, and the suggestion box
data perhaps also provide user suggestions for remedies. User focus groups also provide a powerful way to explore
problems and potential solutions. A university-wide retreat with a small-group facilitated discussion to solicit
suggestions for improvement is another follow-up mechanism that has been implemented in several LibQUAL+®
participating libraries.
Indeed, the open-ended comments gathered as part of LibQUAL+® are themselves useful in fleshing out insights
into perceived library service quality. Respondents often use the comments box on the survey to make constructive
suggestions on specific ways to address their concerns. Qualitative analysis of these comments can be very fruitful .
In short, LibQUAL+® is not 22 items. LibQUAL+® is 22 items plus a comments box!
Cook (2002b) provided case study reports of how staff at various libraries have employed data from prior renditions
of LibQUAL+®. Heath, Kyrillidou, and Askew edited a special issue of the Journal of Library Administration (Vol.
40, No. 3/4) reporting additional case studies on the use of LibQUAL+® data to aid the improvement of library
service quality. This special issue has also been published by Hayworth Press as a monograph. These publications
can be ordered by sending an email to [email protected].
2008 Data Screening
The 22 LibQUAL+® core items measure perceptions of total service quality, as well as three sub-dimensions of
perceived library quality: (a) Service Affect (9 items, such as "willingness to help users"); (b) Information Control (8
items, such as "a library Web site enabling me to locate information on my own" and "print and/or electronic journal
collections I require for my work"); and (c) Library as Place (5 items, such as "a getaway for study, learning, or
research").
Language:
Institution Type:
Consortium:
User Group:
American English
College or University
None
All
Language:
Institution Type:
Consortium:
User Group:
American English
College or University
None
All
LibQUAL+® 2008 Survey Results - UALR Ottenheimer Library Page 13 of 89
However, as happens in any survey, in 2008 some users provided incomplete data, inconsistent data, or both. In
compiling the summary data reported here, several criteria were used to determine which respondents to omit from
these analyses.
1. Complete Data. The Web software that presents the 22 core items monitors whether a given user has
completed all items. On each of these items, in order to submit the survey successfully, users must provide a rating of
(a) minimally-acceptable service, (b) desired service, and (c) perceived service or rate the item "not applicable"
("N/A"). If these conditions are not met, when the user attempts to leave the Web page presenting the 22 core items,
the software shows the user where missing data are located, and requests complete data. The user may of course
abandon the survey without completing all the items. Only records with complete data on the 22 items and where
respondents chose a "user group," if applicable, were retained in summary statistics.
2. Excessive "N/A" Responses. Because some institutions provided access to a lottery drawing for an incentive
(e.g., a iPod) for completing the survey, some users might have selected "N/A" choices for all or most of the items
rather than reporting their actual perceptions. Or, some users may have views on such a narrow range of quality
issues that their data are not very informative. In this survey it was decided that records containing more than 11
"N/A" responses should be eliminated from the summary statistics.
3. Excessive Inconsistent Responses. On the LibQUAL+® survey, user perceptions can be interpreted by
locating "perceived" results within the "zone of tolerance" defined by data from the "minimum" and the "desired"
ratings. For example, a mean "perceived" rating of 7.5 on the 1-to-9 (9 is highest) scale might be very good if the
mean "desired" rating is 6.0. But a 7.5 perception score is less satisfactory if the mean "desired" rating is 8.6, or if
the mean "minimum" rating is 7.7.
One appealing feature of such a "gap measurement model" is that the rating format provides a check for
inconsistencies (i.e., score inversions) in the response data (Thompson, Cook & Heath, 2000). Logically, on a given
item the "minimum" rating should not be higher than the "desired" rating on the same item. For each user a count of
such inconsistencies, ranging from "0" to "22," was made. Records containing more than 9 logical inconsistencies
were eliminated from the summary statistics.
LibQUAL+® Norms
An important way to interpret LibQUAL+® data is by examining the zones of tolerance for items, the three subscale
scores, and the total scores. However, the collection of such a huge number of user perceptions has afforded us with
the unique opportunity to create norms tables that provide yet another perspective on results.
Norms tell us how scores "stack up" within a particular user group. For example, on the 1-to-9 (9 is highest) scale,
users might provide a mean "perceived" rating of 6.5 on an item, "the printed library materials I need for my work."
The same users might provide a mean rating on "minimum" for this item of 7.0, and a mean service-adequacy "gap
score" (i.e., "perceived" minus "minimum") of -0.5.
The zone-of-tolerance perspective suggests that this library is not doing well on this item, because "perceived" falls
below "minimally acceptable." This is important to know. But there is also a second way (i.e., normatively) to
interpret the data. Both perspectives can be valuable.
A total market survey administered to more than 100,000 users, as was LibQUAL+® in 2004 and 2005, affords the
Language:
Institution Type:
Consortium:
User Group:
American English
College or University
None
All
Language:
Institution Type:
Consortium:
User Group:
American English
College or University
None
All
Page 14 of 89 LibQUAL+® 2008 Survey Results - UALR Ottenheimer Library
opportunity to ask normative questions such as, "How does a mean 'perceived' score of 6.5 stack up among all
individual users who completed the survey?", or "How does a mean service-adequacy gap score of -0.5 stack up
among the gap scores of all institutions participating in the survey?"
If 70 percent of individual users generated "perceived" ratings lower than 6.5, 6.5 might not be so bad. And if 90
percent of institutions had service-adequacy gap scores lower than -0.5 (e.g., -0.7, -1.1), a mean gap score of -0.5
might actually be quite good. Users simply may have quite high expectations in this area. They may also
communicate their dissatisfaction by rating both (a) "perceived" lower and (b) "minimum" higher.
This does not mean that a service-adequacy gap score of -0.5 is necessarily a cause for celebration. But a
service-adequacy gap score of -0.5 on an item for which 90 percent of institutions have a lower gap score is a
different gap score than the same -0.5 for a different item in which 90 percent of institutions have a higher
service-adequacy gap score.
Only norms give us insight into this comparative perspective. And a local user-satisfaction survey (as against a total
market survey) can never provide this insight.
Common Misconception Regarding Norms. An unfortunate and incorrect misconception is that norms make value
statements. Norms do not make value statements! Norms make fact statements. If you are a forest ranger, and you
make $25,000 a year, a norms table might inform you of the fact that you make less money than 85 percent of the
adults in the United States.
But if you love the outdoors, you do not care very much about money, and you are very service -oriented, this fact
statement might not be relevant to you. Or, in the context of your values, you might interpret this fact as being quite
satisfactory.
LibQUAL+® Norms Tables. Of course, the fact statements made by the LibQUAL+® norms are only valuable if
you care about the dimensions being evaluated by the measure. More background on LibQUAL+® norms is
provided by Cook and Thompson (2001), and Cook, Heath and B. Thompson (2002). We do not publish norms on
an annual basis any more as research indicates a remarkable stability of norms over time (see Thompson, Cook and
Kyrillidou, 2005). LibQUAL+® norms for earlier years are available on the Web at the following URLs:
<http://www.coe.tamu.edu/~bthompson/libq2005.htm>
<http://www.coe.tamu.edu/~bthompson/libq2004.htm>
Response Rates
At the American Library Association (ALA) Midwinter Meeting in San Antonio in January 2000, participants were
cautioned that response rates on the final LibQUAL+® survey would probably range from 25-33 percent. Higher
response rates can be realized (a) with shorter surveys that (b) are directly action-oriented (Cook, Heath & R.L.
Thompson, 2000). For example, a very high response rate could be realized by a library director administering the
following one-item survey to users:
Instructions. Please tell us what time to close the library every day. In the future we will close at
whatever time receives the most votes.
Should we close the library at?
Language:
Institution Type:
Consortium:
User Group:
American English
College or University
None
All
Language:
Institution Type:
Consortium:
User Group:
American English
College or University
None
All
LibQUAL+® 2008 Survey Results - UALR Ottenheimer Library Page 15 of 89
(A) 10 p.m. (B) 11 p.m. (C) midnight (D) 2 p.m.
Lower response rates will be expected for total market surveys measuring general perceptions of users across
institutions, and when an intentional effort is made to solicit perceptions of both users and non-users. Two
considerations should govern the evaluation of LibQUAL+® response rates.
Minimum Response Rates. Response rates are computed by dividing the number of completed surveys at an
institution by the number of persons asked to complete the survey. However, we do not know the actual response
rates on LibQUAL+®, because we do not know the correct denominators for these calculations.
For example, given inadequacy in records at schools, we are not sure how many e-mail addresses for users are
accurate. And we do not know how many messages to invite participation were actually opened. In other words, what
we know for LibQUAL+® is the "lower-bound estimate" of response rates.
For example, if 200 out of 800 solicitations result in completed surveys, we know that the response rate is at least 25
percent. But because we are not sure whether 800 e-mail addresses were correct or that 800 e-mail messages were
opened, we are not sure that 800 is the correct denominator. The response rate involving only correct e-mail
addresses might be 35 or 45 percent. We don't know the exact response rate.
Representativeness Versus Response Rate. If 100 percent of the 800 people we randomly selected to complete our
survey did so, then we can be assured that the results are representative of all users. But if only 25 percent of the 800
users complete the survey, the representativeness of the results is not assured. Nor is unrepresentativeness assured.
Representativeness is actually a matter of degree. And several institutions each with 25 percent response rates may
have data with different degrees of representativeness.
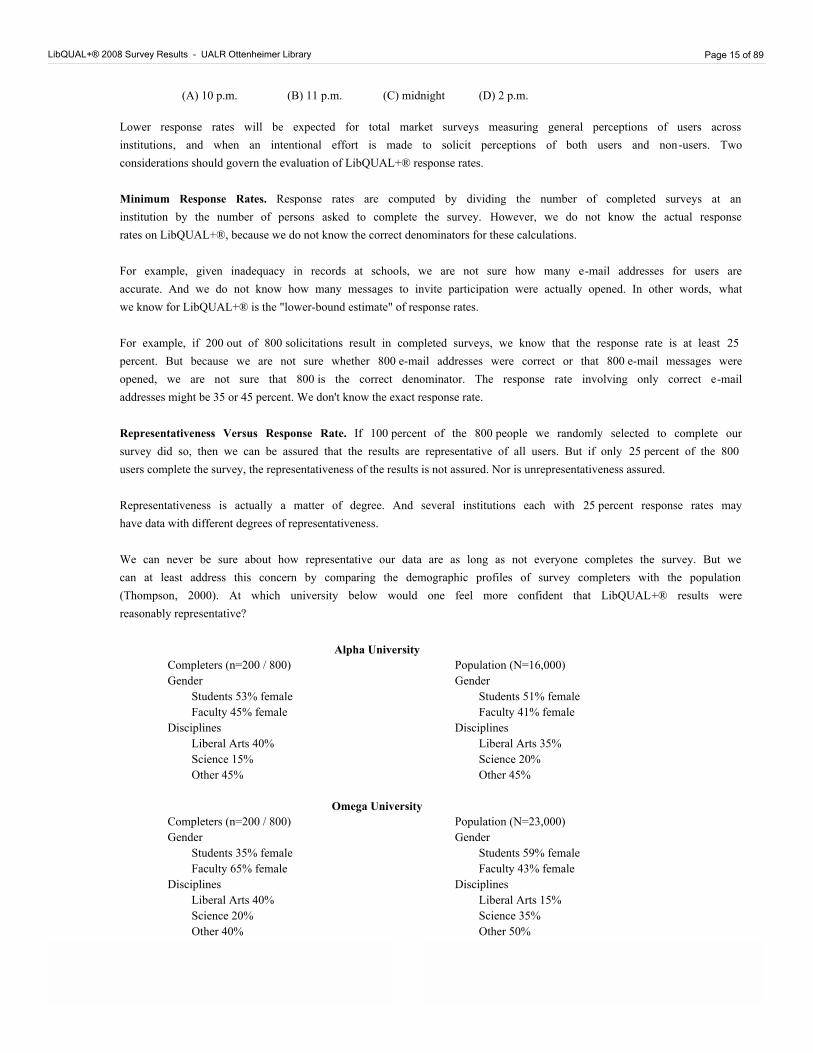
We can never be sure about how representative our data are as long as not everyone completes the survey. But we
can at least address this concern by comparing the demographic profiles of survey completers with the population
(Thompson, 2000). At which university below would one feel more confident that LibQUAL+® results were
reasonably representative?
Alpha University
Completers (n=200 / 800) Population (N=16,000)
Gender Gender
Students 53% female Students 51% female
Faculty 45% female Faculty 41% female
Disciplines Disciplines
Liberal Arts 40% Liberal Arts 35%
Science 15% Science 20%
Other 45% Other 45%
Omega University
Completers (n=200 / 800) Population (N=23,000)
Gender Gender
Students 35% female Students 59% female
Faculty 65% female Faculty 43% female
Disciplines Disciplines
Liberal Arts 40% Liberal Arts 15%
Science 20% Science 35%
Other 40% Other 50%
Language:
Institution Type:
Consortium:
User Group:
American English
College or University
None
All
Language:
Institution Type:
Consortium:
User Group:
American English
College or University
None
All
Page 16 of 89 LibQUAL+® 2008 Survey Results - UALR Ottenheimer Library
The persuasiveness of such analyses is greater as the number of variables used in the comparisons is greater. The
LibQUAL+® software has been expanded to automate these comparisons and to output side-by-side graphs and
tables comparing sample and population profiles for given institutions. Show these to people who question result
representativeness.
However, one caution is in order regarding percentages. When total n is small for an institution, or within a particular
subgroup, huge changes in percentages can result from very small shifts in numbers.
LibQUAL+® Interactive Statistics
In addition to the institution and group notebooks and the norms, LibQUAL+® had provided an experimental
interactive environment for data analysis where institutions could mine institutional data for peer comparisons in
2003 and 2004. The LibQUAL+® Interactive Statistics for these years includes graphing capabilities for all
LibQUAL+® scores (total and dimension scores) for each individual institution or groups of institutions. Graphs
may be generated in either JPEG format for presentation purposes or flash format that includes more detailed
information for online browsing. Tables may also be produced in an interactive fashion for one or multiple selections
of variables for all individual institutions or groups of participating institutions. Our goal is to integrate this
capability into the LibQUAL+® Analytics.
LibQUAL+® Analytics
The LibQUAL+® Analytics is a new tool that permits participants to dynamically create institution-specific tables
and charts for different subgroups and across years. The current interface grants access to 2004 to the most current
statistical data and has two sections:
(a) Institution Explorer includes a summary of all questions and dimension means for any combination of
user groups and disciplines.
(b) Longitudinal Analysis allows participants to perform longitudinal comparisons of their data across
survey years.
These two functionalities are only the beginning of our effort to provide more customized analysis. More features are
in development based on feedback we receive from our participants.
Survey Data
In addition to the notebooks, the norms, the Interactive Statistics, and the Analytics, LibQUAL+® also makes
available (a) raw survey data in SPSS at the request of participating libraries, (b) raw survey data in Excel for all
participating libraries, and (c) survey comments that can be downloaded to Excel or text format from the Web site..
Additional training using the SPSS data file is available as a follow-up workshop and through the Service Quality
Evaluation Academy (see below), which also offers training on analyzing qualitative data.
We continually analyze and publish findings from these data that highlight important aspects of the findings (see
Thompson, Kyrillidou & Cook, 2008) as well as new communities and types of libraries that have joined the project
(see Thompson, Kyrillidou & Cook, 2007).
ARL Service Quality Evaluation Academy
LibQUAL+® is an important tool in the New Measures toolbox that librarians can use to improve service quality .
But, even more fundamentally, the LibQUAL+® initiative is more than a single tool. LibQUAL+® is an effort to
Language:
Institution Type:
Consortium:
User Group:
American English
College or University
None
All
Language:
Institution Type:
Consortium:
User Group:
American English
College or University
None
All
LibQUAL+® 2008 Survey Results - UALR Ottenheimer Library Page 17 of 89
create a culture of data-driven service quality assessment and service quality improvement within libraries.
Such a culture must be informed by more than one tool, and by more than only one of the 11 ways of listening to
users. To facilitate a culture of service quality assessment, and to facilitate more informed usage of LibQUAL+®
data, the Association of Research Libraries has created the ARL Service Quality Evaluation Academy. For more
information about the Academy, see the LibQUAL+® events page at
<http://www.libqual.org/Events/index.cfm>
The intensive, five-day Academy teaches both qualitative and quantitative skills that library staff can use to evaluate
and generate service-quality assessment information. The Academy is one more resource for library staff who would
like to develop enhanced service-quality assessment skills.
For more information, about LibQUAL+® or the Association of Research Libraries’ Statistics and Measurement
program, see:
<http://www.libqual.org/>
<http://www.statsqual.org/>
<http://www.arl.org/stats/>
References
Berry, Leonard L. On Great Service: A Framework For Action. New York: The Free Press, 1995.
Cook, Colleen C., Fred Heath, and Bruce Thompson. LibQUAL+™ from the UK Perspective. 5th Northumbria
International Conference Proceedings, Durham, UK, July, 2003.
Cook, Colleen C. (Guest Ed.). “Library Decision-Makers Speak to Their Uses of Their LibQUAL+™ Data: Some
LibQUAL+™ Case Studies.” Performance Measurement and Metrics, 3 (2002b).
Cook, Colleen C. “A Mixed-Methods Approach to the Identification and Measurement of Academic Library Service
Quality Constructs: LibQUAL+™.” (PhD diss., Texas A&M University, 2001) Dissertation Abstracts
International, 62 (2002A): 2295A (University Microfilms No. AAT3020024).
Cook, Colleen C., and Fred Heath. “Users' Perceptions of Library Service Quality: A ’LibQUAL+™’ Qualitative
Study.” Library Trends, 49 (2001): 548-84.
Cook, Colleen C., Fred Heath, and Bruce Thompson. “’Zones of tolerance’ in Perceptions of Library Service
Quality: A LibQUAL+™ Study.” portal: Libraries and the Academy, 3 (2003): 113-123.
Cook, Colleen C., Fred Heath and Bruce Thompson.. “Score Norms for Improving Library Service Quality: A
LibQUAL+™ Study.” portal: Libraries and the Academy, 2 (2002): 13-26.
Cook, Colleen C., Fred Heath, and Russell L. Thompson. “A Meta-Analysis of Response Rates in Web- or
Internet-based Surveys.” Educational and Psychological Measurement, 60 (2000): 821-36.
Language:
Institution Type:
Consortium:
User Group:
American English
College or University
None
All
Language:
Institution Type:
Consortium:
User Group:
American English
College or University
None
All
Page 18 of 89 LibQUAL+® 2008 Survey Results - UALR Ottenheimer Library
Cook, Colleen C., and Bruce Thompson. “Psychometric Properties of Scores from the Web-based LibQUAL+™
Study of Perceptions of Library Service Quality.” Library Trends, 49 (2001): 585-604.
Cullen, Rowena. “Perspectives on User Satisfaction Surveys.” Library Trends, 49 (2002): 662-86.
Heath, Fred, Martha Kyrillidou. and Consuella A. Askew (Guest Eds.). “Libraries Report on Their LibQUAL+®
Findings: From Data to Action.” Journal of Library Administration 40 (3/4) (2004).
Heath, Fred, Colleen C. Cook, Martha Kyrillidou, and Bruce Thompson. “ARL Index and Other Validity Correlates
of LibQUAL+™ Scores.” portal: Libraries and the Academy, 2 (2002): 27-42.
Kyrillidou, Martha. The Globalization of Library Assessment and the Role of LibQUAL+®. From Library Science
to Information Science: Studies in Honor of G. Kakouri (Athens, Greece: Tipothito-Giorgos Dardanos,
2005). [In Greek]
Kyrillidou, Martha. “Library Assessment As A Collaborative Enterprise.” Resource Sharing and Information
Networks, 18 ½ (2005-2006): 73-87.
Kyrillidou, Martha. “Measuring Library Service Quality: A Perceived Outcome for Libraries. This chapter appears
in Revisiting Outcomes Assessment in Higher Education. Edited by Peter Hernon, Robert E. Dugan, and
Candy Schwartz (Westport, CT: Library Unlimited, 2006): 351-66.
Kyrillidou, Martha, Terry Olshen, Fred Heath, Claude Bonnelly, and Jean-Pierre Côte. “Cross-Cultural
Implementation of LibQUAL+™: the French Language Experience. 5th Northumbria International
Conference Proceedings (Durham, UK, 2003): 193-99.
Kyrillidou, Martha and Mark Young. ARL Statistics 2005-06. Washington, DC: Association of Research Libraries,
2008.
Nitecki, Danuta, A. “Changing the Concept and Measure of Service Quality in Academic Libraries.” The Journal of
Academic Librarianship, 22 (1996): 181-90.
Parasuraman, A., Leonard Berry, and Valerie Zeithaml. “Refinement and Reassessment of the SERVQUAL Scale.
Journal of Retailing, 67 (1991): 420-50.
Thompson, Bruce. “Representativeness Versus Response Rate: It Ain't the Response Rate!.” Paper presented at the
Association of Research Libraries (ARL) Measuring Service Quality Symposium on the New Culture of
Assessment: Measuring Service Quality, Washington, DC, October 2002.
Thompson, Bruce, Colleen C. Cook, and Fred Heath. “The LibQUAL+™ Gap Measurement Model: The Bad, he
Ugly, and the Good of Gap Measurement.” Performance Measurement and Metrics, 1 (2002): 165-78.
Thompson, Bruce, Colleen C. Cook, and Fred Heath. “Structure of Perceptions of Service Quality in Libraries: A
LibQUAL+™ Study.” Structural Equation Modeling, 10 (2003): 456-464.
Thompson, Bruce, Colleen C. Cook, and Russell L. Thompson. Reliability and Structure of LibQUAL+™ Scores:
Measuring Perceived Library Service Quality. portal: Libraries and the Academy, 2 (2002): 3-12.
Language:
Institution Type:
Consortium:
User Group:
American English
College or University
None
All
Language:
Institution Type:
Consortium:
User Group:
American English
College or University
None
All
LibQUAL+® 2008 Survey Results - UALR Ottenheimer Library Page 19 of 89
Thompson, Bruce, Colleen C. Cook, and Martha Kyrillidou. "Library Users' Service Desires: A LibQUAL+®
Study." The Library Quarterly, 78(1) (2008): 1-18.
Thompson, Bruce, Colleen C. Cook, and Martha Kyrillidou. "User Library Service Expectations in Health Science
vs. Other Settings: A LibQUAL+® Study". Health Information and Libraries Journal, 24(Supplement 1)
(2007): 38-45.
Thompson, Bruce, Colleen C. Cook, and Martha Kyrillidou. “Using Localized Survey Items to Augment
Standardized Benchmarking Measures: A LibQUAL+® Study. portal: Libraries and the Academy, 6(2)
(2006): 219-30.
Thompson, Bruce, Colleen C. Cook, and Martha Kyrillidou. “How Can You Evaluate the Integrity of Your Library
Assessment Data: Intercontinental LibQUAL+® Analysis Used as Concrete Heuristic Examples.” Paper
presented at the Library Assessment Conference: Building Effective, Sustainable, and Practical Assessment,
Charlottesville, VA, August 4-6, 2006.
Thompson, Bruce, Colleen C. Cook, and Martha Kyrillidou. “Stability of Library Service Quality Benchmarking
Norms Across Time and Cohorts: A LibQUAL+® Study.” Paper presented at the Asia-Pacific Conference
of Library and Information Education and Practice (A-LIEP), Singapore, April 3-4 2006.
<http://www.coe.tamu.edu/~bthompson/libq2005.htm#1>.
Thompson, Bruce, Colleen C. Cook, and Martha Kyrillidou. Concurrent Validity of LibQUAL+® Scores: What Do
LibQUAL+® Scores Measure? Journal of Academic Librarianship, 31 (2005): 517-22.
Zeithaml, Valerie, A. Parasuraman, and Leonard L. Berry. Delivering Quality Service: Balancing Customer
Perceptions and Expectations. New York: Free Press, 1990.
Language:
Institution Type:
Consortium:
User Group:
American English
College or University
None
All
Language:
Institution Type:
Consortium:
User Group:
American English
College or University
None
All
Page 20 of 89 LibQUAL+® 2008 Survey Results - UALR Ottenheimer Library
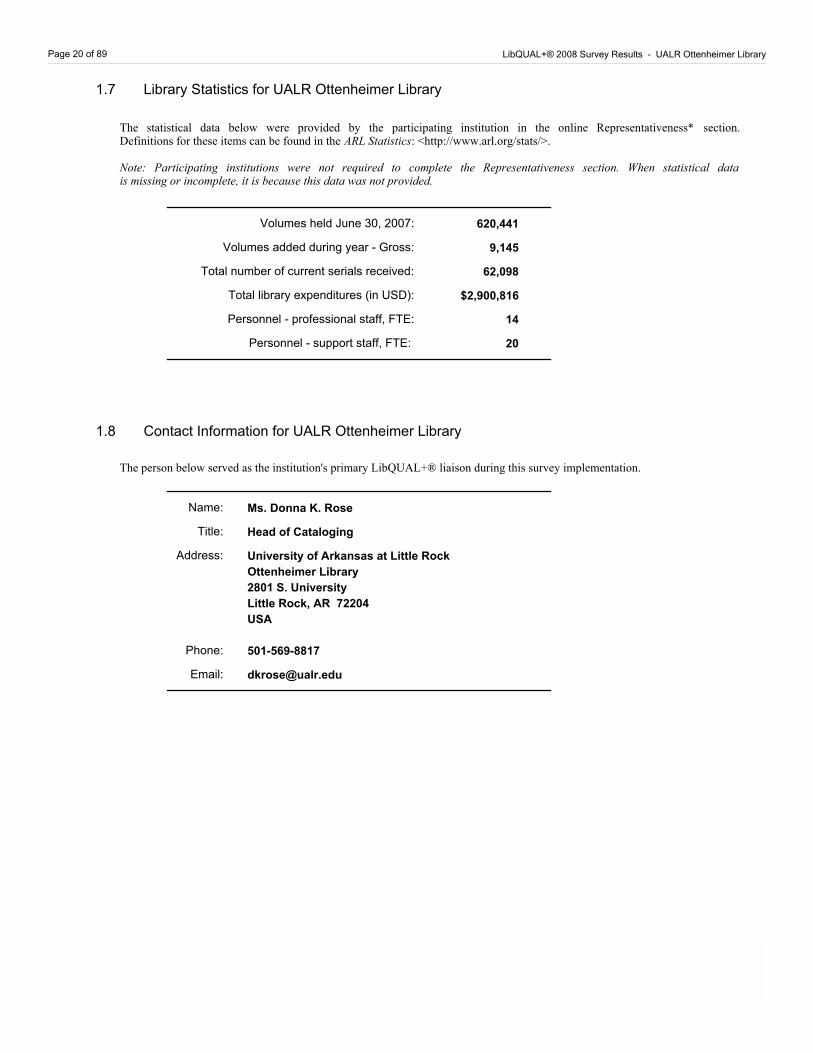
1.7 Library Statistics for UALR Ottenheimer Library
The statistical data below were provided by the participating institution in the online Representativeness* section. Definitions for these items can be found in the ARL Statistics: <http://www.arl.org/stats/>.
Note: Participating institutions were not required to complete the Representativeness section. When statistical data is missing or incomplete, it is because this data was not provided.
620,441
9,145
62,098
14
20
Volumes held June 30, 2007:
Volumes added during year - Gross:
Total number of current serials received:
Total library expenditures (in USD):
Personnel - professional staff, FTE:
Personnel - support staff, FTE:
$2,900,816
1.8 Contact Information for UALR Ottenheimer Library
The person below served as the institution's primary LibQUAL+® liaison during this survey implementation.
Name: Ms. Donna K. Rose
Address: University of Arkansas at Little Rock
Ottenheimer Library
2801 S. University
Little Rock, AR 72204
USA
Title: Head of Cataloging
Email: [email protected]
501-569-8817Phone:
Language:
Institution Type:
Consortium:
User Group:
American English
College or University
None
All
Language:
Institution Type:
Consortium:
User Group:
American English
College or University
None
All
LibQUAL+® 2008 Survey Results - UALR Ottenheimer Library Page 21 of 89
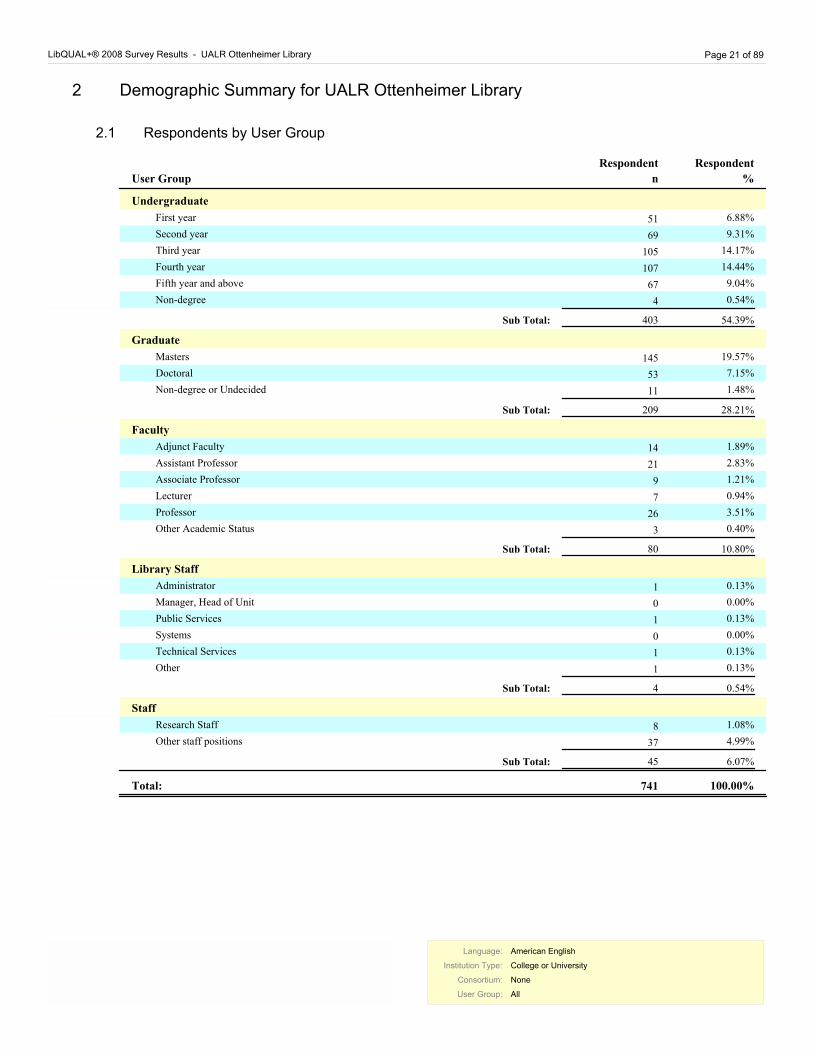
2 Demographic Summary for UALR Ottenheimer Library
2.1 Respondents by User Group
User Group
Respondent
n
Respondent
%
Undergraduate
51 6.88%First year
69 9.31%Second year
105 14.17%Third year
107 14.44%Fourth year
67 9.04%Fifth year and above
4 0.54%Non-degree
Sub Total: 54.39% 403
Graduate
145 19.57%Masters
53 7.15%Doctoral
11 1.48%Non-degree or Undecided
Sub Total: 28.21% 209
Faculty
14 1.89%Adjunct Faculty
21 2.83%Assistant Professor
9 1.21%Associate Professor
7 0.94%Lecturer
26 3.51%Professor
3 0.40%Other Academic Status
Sub Total: 10.80% 80
Library Staff
1 0.13%Administrator
0 0.00%Manager, Head of Unit
1 0.13%Public Services
0 0.00%Systems
1 0.13%Technical Services
1 0.13%Other
Sub Total: 0.54% 4
Staff
8 1.08%Research Staff
37 4.99%Other staff positions
Sub Total: 6.07% 45
Total: 741 100.00%
Language:
Institution Type:
Consortium:
User Group:
American English
College or University
None
All
Language:
Institution Type:
Consortium:
User Group:
American English
College or University
None
All
Page 22 of 89 LibQUAL+® 2008 Survey Results - UALR Ottenheimer Library
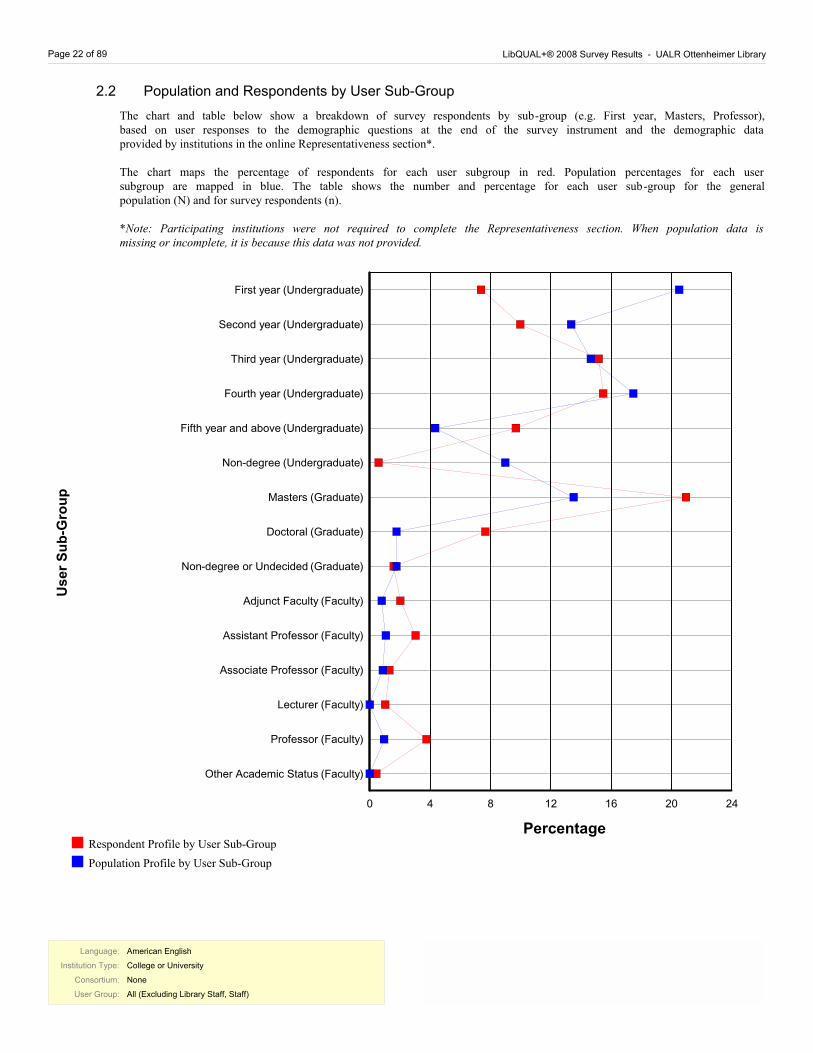
2.2 Population and Respondents by User Sub-Group
The chart and table below show a breakdown of survey respondents by sub-group (e.g. First year, Masters, Professor), based on user responses to the demographic questions at the end of the survey instrument and the demographic data provided by institutions in the online Representativeness section*.
The chart maps the percentage of respondents for each user subgroup in red. Population percentages for each user subgroup are mapped in blue. The table shows the number and percentage for each user sub-group for the general population (N) and for survey respondents (n).
*Note: Participating institutions were not required to complete the Representativeness section. When population data is missing or incomplete, it is because this data was not provided.
0
4
8
12
16
20
24
First year (Undergraduate)
Second year (Undergraduate)
Third year (Undergraduate)
Fourth year (Undergraduate)
Fifth year and above (Undergraduate)
Non-degree (Undergraduate)
Masters (Graduate)
Doctoral (Graduate)
Non-degree or Undecided (Graduate)
Adjunct Faculty (Faculty)
Assistant Professor (Faculty)
Associate Professor (Faculty)
Lecturer (Faculty)
Professor (Faculty)
Other Academic Status (Faculty)
Percentage
Population Profile by User Sub-Group
Respondent Profile by User Sub-Group
Us
er
Su
b-G
rou
p
Language:
Institution Type:
Consortium:
User Group:
American English
College or University
None
All (Excluding Library Staff, Staff)
Language:
Institution Type:
Consortium:
User Group:
American English
College or University
None
All (Excluding Library Staff, Staff)
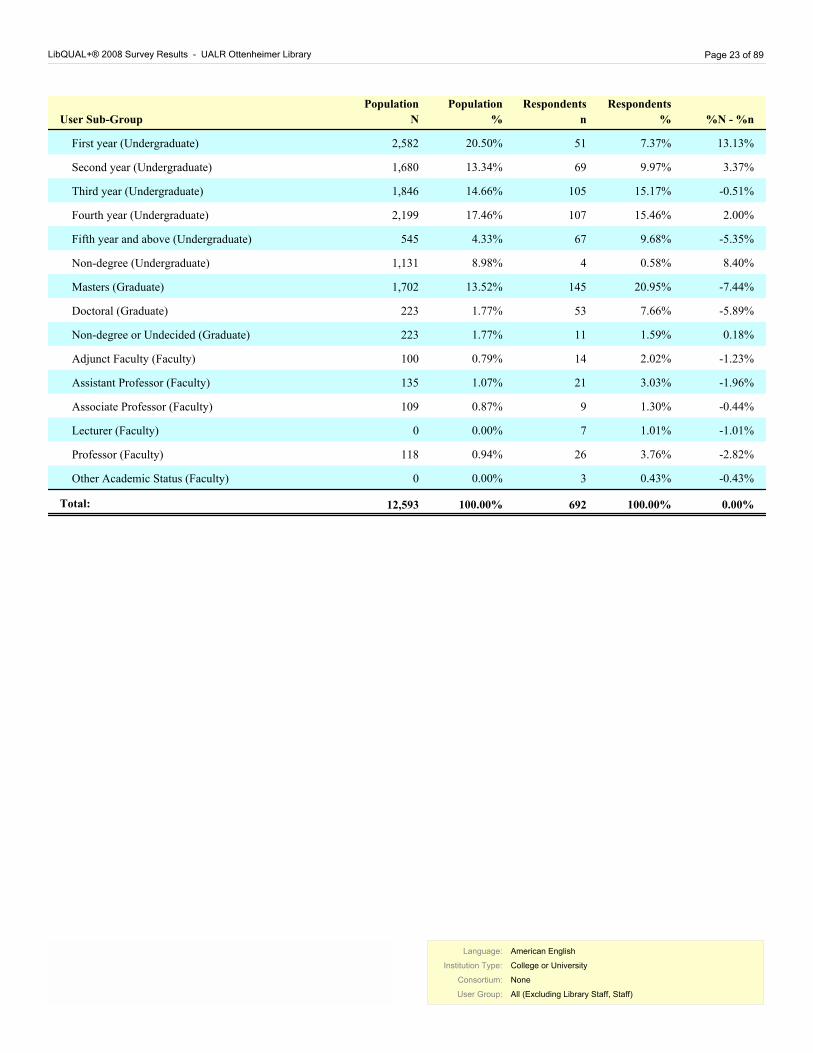
LibQUAL+® 2008 Survey Results - UALR Ottenheimer Library Page 23 of 89
Respondents
nUser Sub-Group
Respondents
%
Population
N
Population
% %N - %n
51 7.37% 2,582 20.50%First year (Undergraduate) 13.13%
69 9.97% 1,680 13.34%Second year (Undergraduate) 3.37%
105 15.17% 1,846 14.66%Third year (Undergraduate) -0.51%
107 15.46% 2,199 17.46%Fourth year (Undergraduate) 2.00%
67 9.68% 545 4.33%Fifth year and above (Undergraduate) -5.35%
4 0.58% 1,131 8.98%Non-degree (Undergraduate) 8.40%
145 20.95% 1,702 13.52%Masters (Graduate) -7.44%
53 7.66% 223 1.77%Doctoral (Graduate) -5.89%
11 1.59% 223 1.77%Non-degree or Undecided (Graduate) 0.18%
14 2.02% 100 0.79%Adjunct Faculty (Faculty) -1.23%
21 3.03% 135 1.07%Assistant Professor (Faculty) -1.96%
9 1.30% 109 0.87%Associate Professor (Faculty) -0.44%
7 1.01% 0 0.00%Lecturer (Faculty) -1.01%
26 3.76% 118 0.94%Professor (Faculty) -2.82%
3 0.43% 0 0.00%Other Academic Status (Faculty) -0.43%
Total: 100.00% 12,593 692 100.00% 0.00%
Language:
Institution Type:
Consortium:
User Group:
American English
College or University
None
All (Excluding Library Staff, Staff)
Language:
Institution Type:
Consortium:
User Group:
American English
College or University
None
All (Excluding Library Staff, Staff)
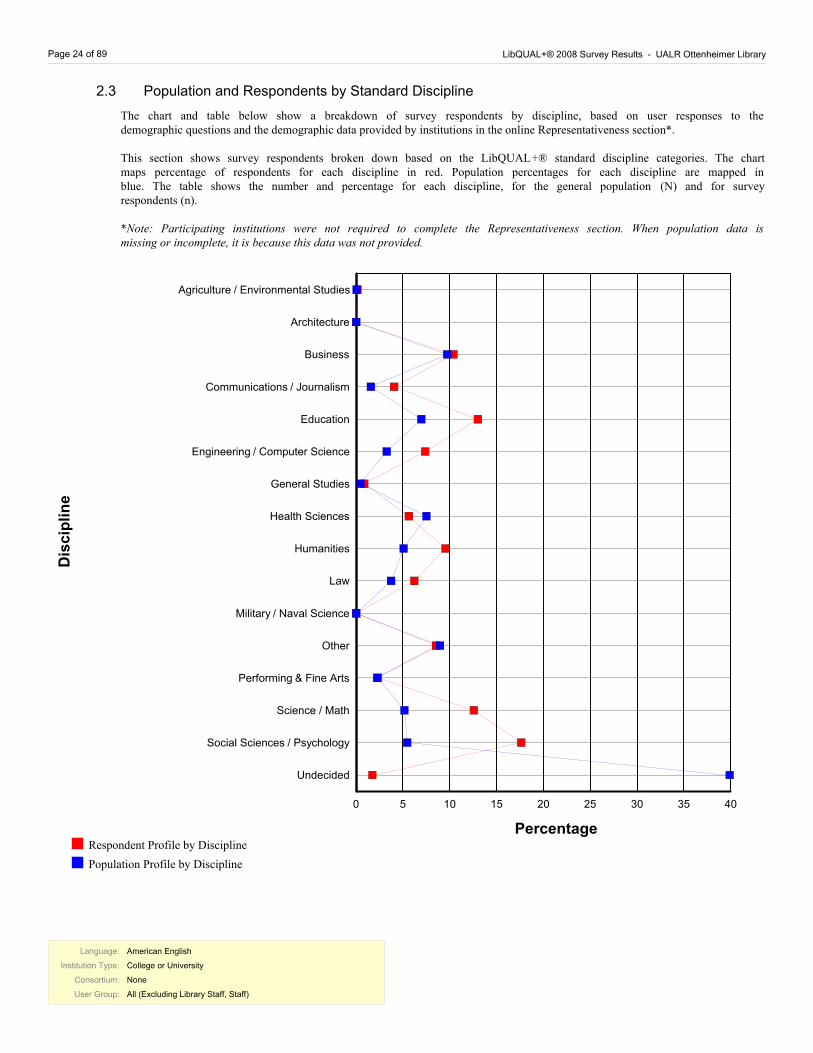
Page 24 of 89 LibQUAL+® 2008 Survey Results - UALR Ottenheimer Library
The chart and table below show a breakdown of survey respondents by discipline, based on user responses to the demographic questions and the demographic data provided by institutions in the online Representativeness section*.
This section shows survey respondents broken down based on the LibQUAL+® standard discipline categories. The chart maps percentage of respondents for each discipline in red. Population percentages for each discipline are mapped in blue. The table shows the number and percentage for each discipline, for the general population (N) and for survey respondents (n).
*Note: Participating institutions were not required to complete the Representativeness section. When population data is missing or incomplete, it is because this data was not provided.
2.3 Population and Respondents by Standard Discipline
0
5
10
15
20
25
30
35
40
Agriculture / Environmental Studies
Architecture
Business
Communications / Journalism
Education
Engineering / Computer Science
General Studies
Health Sciences
Humanities
Law
Military / Naval Science
Other
Performing & Fine Arts
Science / Math
Social Sciences / Psychology
Undecided
D
isc
ipli
ne
Percentage
Population Profile by Discipline
Respondent Profile by Discipline
Language:
Institution Type:
Consortium:
User Group:
American English
College or University
None
All (Excluding Library Staff, Staff)
Language:
Institution Type:
Consortium:
User Group:
American English
College or University
None
All (Excluding Library Staff, Staff)
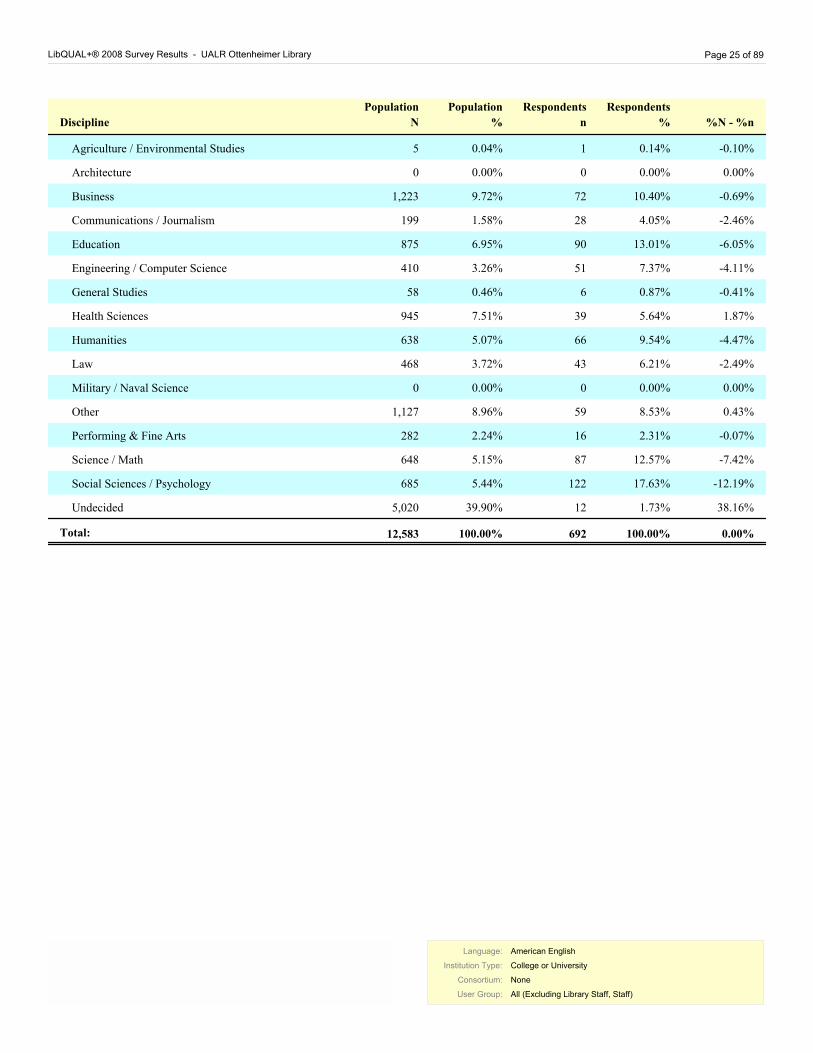
LibQUAL+® 2008 Survey Results - UALR Ottenheimer Library Page 25 of 89
Respondents
nDiscipline
Respondents
%
Population
N
Population
% %N - %n
Agriculture / Environmental Studies 1 0.14% 5 0.04% -0.10%
Architecture 0 0.00% 0 0.00% 0.00%
Business 72 10.40% 1,223 9.72% -0.69%
Communications / Journalism 28 4.05% 199 1.58% -2.46%
Education 90 13.01% 875 6.95% -6.05%
Engineering / Computer Science 51 7.37% 410 3.26% -4.11%
General Studies 6 0.87% 58 0.46% -0.41%
Health Sciences 39 5.64% 945 7.51% 1.87%
Humanities 66 9.54% 638 5.07% -4.47%
Law 43 6.21% 468 3.72% -2.49%
Military / Naval Science 0 0.00% 0 0.00% 0.00%
Other 59 8.53% 1,127 8.96% 0.43%
Performing & Fine Arts 16 2.31% 282 2.24% -0.07%
Science / Math 87 12.57% 648 5.15% -7.42%
Social Sciences / Psychology 122 17.63% 685 5.44% -12.19%
Undecided 12 1.73% 5,020 39.90% 38.16%
Total: 100.00% 12,583 692 100.00% 0.00%
Language:
Institution Type:
Consortium:
User Group:
American English
College or University
None
All (Excluding Library Staff, Staff)
Language:
Institution Type:
Consortium:
User Group:
American English
College or University
None
All (Excluding Library Staff, Staff)
Page 26 of 89 LibQUAL+® 2008 Survey Results - UALR Ottenheimer Library
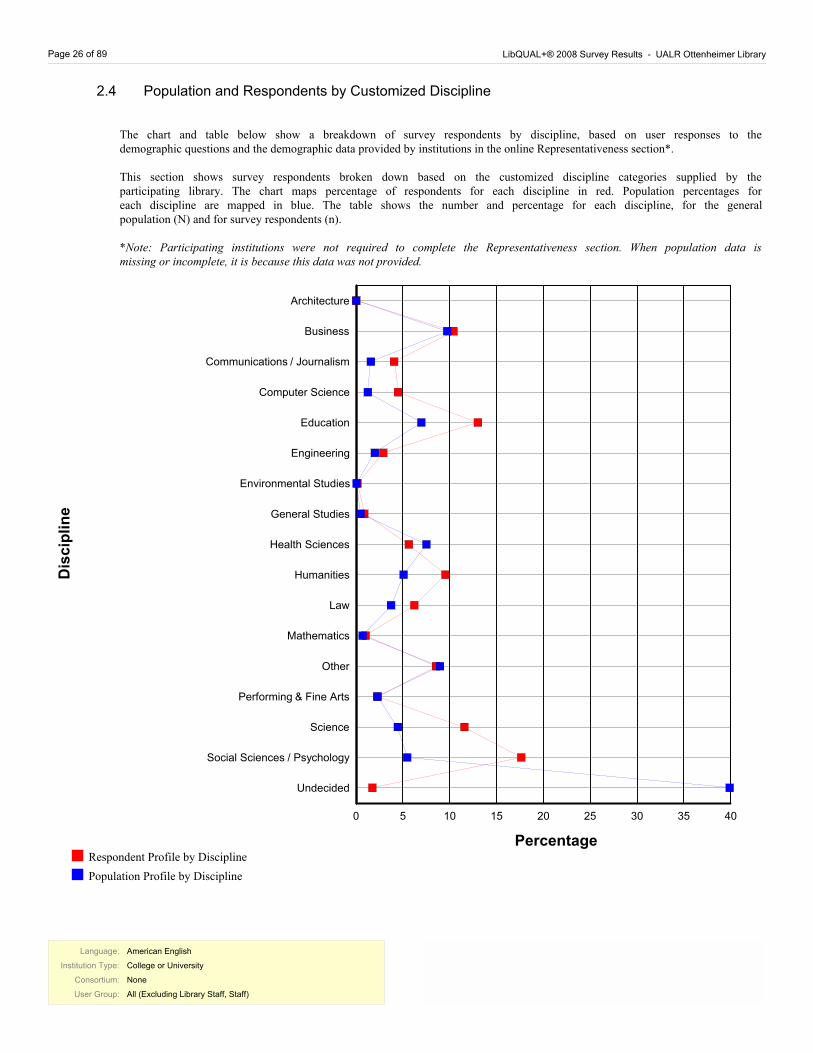
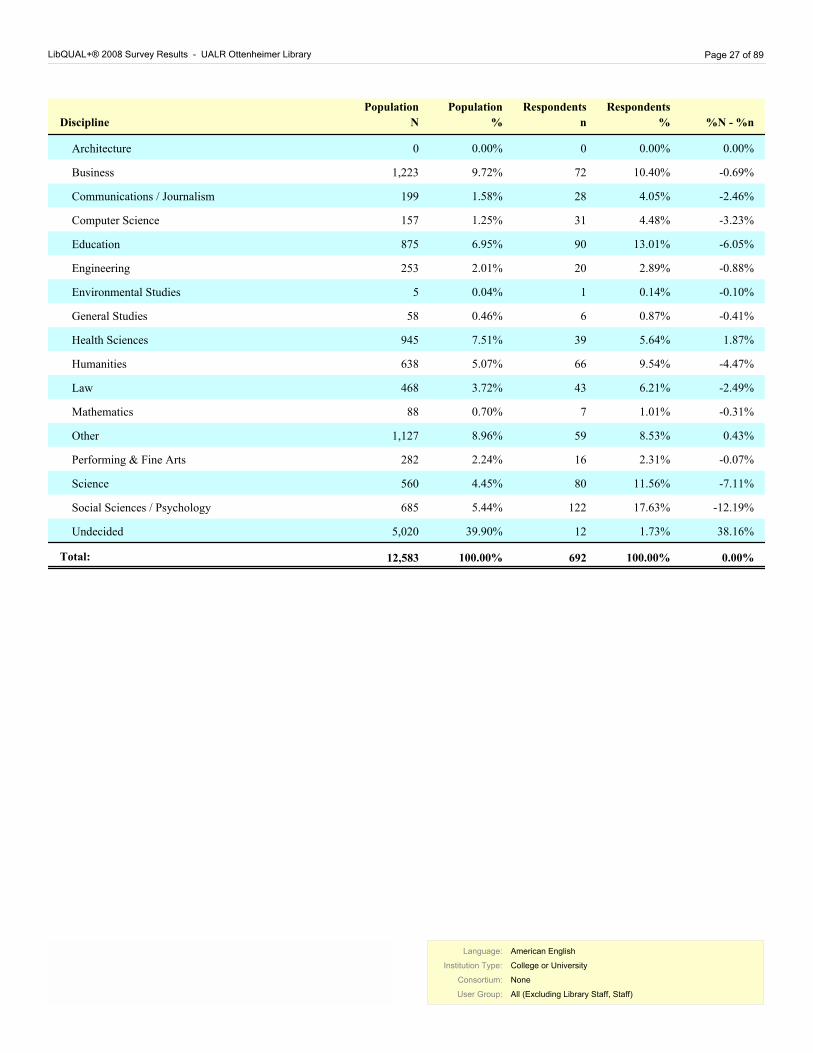
2.4 Population and Respondents by Customized Discipline
The chart and table below show a breakdown of survey respondents by discipline, based on user responses to the demographic questions and the demographic data provided by institutions in the online Representativeness section*.
This section shows survey respondents broken down based on the customized discipline categories supplied by the participating library. The chart maps percentage of respondents for each discipline in red. Population percentages for each discipline are mapped in blue. The table shows the number and percentage for each discipline, for the general population (N) and for survey respondents (n).
*Note: Participating institutions were not required to complete the Representativeness section. When population data is missing or incomplete, it is because this data was not provided.
0
5
10
15
20
25
30
35
40
Architecture
Business
Communications / Journalism
Computer Science
Education
Engineering
Environmental Studies
General Studies
Health Sciences
Humanities
Law
Mathematics
Other
Performing & Fine Arts
Science
Social Sciences / Psychology
Undecided
D
isc
ipli
ne
Percentage
Population Profile by Discipline
Respondent Profile by Discipline
Language:
Institution Type:
Consortium:
User Group:
American English
College or University
None
All (Excluding Library Staff, Staff)
Language:
Institution Type:
Consortium:
User Group:
American English
College or University
None
All (Excluding Library Staff, Staff)
LibQUAL+® 2008 Survey Results - UALR Ottenheimer Library Page 27 of 89
Respondents
nDiscipline
Respondents
%
Population
N
Population
% %N - %n
Architecture 0 0.00% 0 0.00% 0.00%
Business 72 10.40% 1,223 9.72% -0.69%
Communications / Journalism 28 4.05% 199 1.58% -2.46%
Computer Science 31 4.48% 157 1.25% -3.23%
Education 90 13.01% 875 6.95% -6.05%
Engineering 20 2.89% 253 2.01% -0.88%
Environmental Studies 1 0.14% 5 0.04% -0.10%
General Studies 6 0.87% 58 0.46% -0.41%
Health Sciences 39 5.64% 945 7.51% 1.87%
Humanities 66 9.54% 638 5.07% -4.47%
Law 43 6.21% 468 3.72% -2.49%
Mathematics 7 1.01% 88 0.70% -0.31%
Other 59 8.53% 1,127 8.96% 0.43%
Performing & Fine Arts 16 2.31% 282 2.24% -0.07%
Science 80 11.56% 560 4.45% -7.11%
Social Sciences / Psychology 122 17.63% 685 5.44% -12.19%
Undecided 12 1.73% 5,020 39.90% 38.16%
Total: 100.00% 12,583 692 100.00% 0.00%
Language:
Institution Type:
Consortium:
User Group:
American English
College or University
None
All (Excluding Library Staff, Staff)
Language:
Institution Type:
Consortium:
User Group:
American English
College or University
None
All (Excluding Library Staff, Staff)
Page 28 of 89 LibQUAL+® 2008 Survey Results - UALR Ottenheimer Library
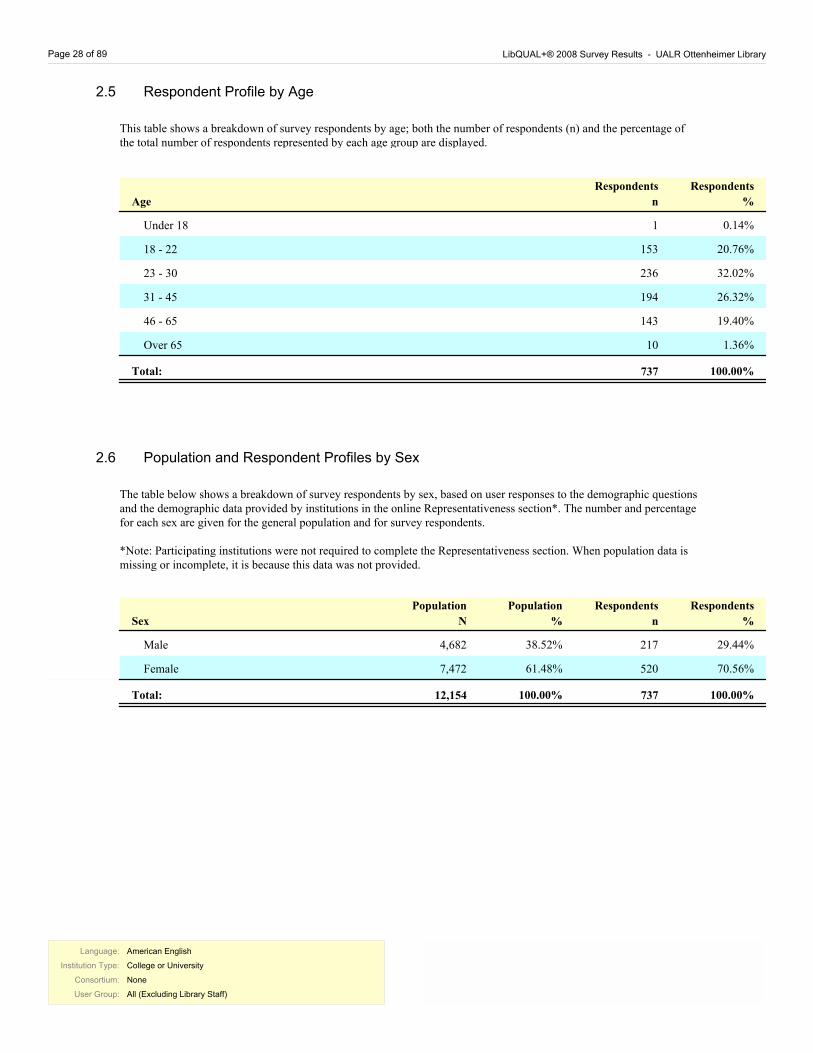
2.5 Respondent Profile by Age
This table shows a breakdown of survey respondents by age; both the number of respondents (n) and the percentage of the total number of respondents represented by each age group are displayed.
Age
Respondents
%
Respondents
n
Under 18 1 0.14%
18 - 22 153 20.76%
23 - 30 236 32.02%
31 - 45 194 26.32%
46 - 65 143 19.40%
Over 65 10 1.36%
Total: 100.00% 737
2.6 Population and Respondent Profiles by Sex
The table below shows a breakdown of survey respondents by sex, based on user responses to the demographic questions and the demographic data provided by institutions in the online Representativeness section*. The number and percentage for each sex are given for the general population and for survey respondents.
*Note: Participating institutions were not required to complete the Representativeness section. When population data is missing or incomplete, it is because this data was not provided.
Sex
Respondents
%
Respondents
n
Population
N
Population
%
Male 217 29.44%38.52% 4,682
Female 520 70.56%61.48% 7,472
Total: 100.00% 737100.00% 12,154
Language:
Institution Type:
Consortium:
User Group:
American English
College or University
None
All (Excluding Library Staff)
Language:
Institution Type:
Consortium:
User Group:
American English
College or University
None
All (Excluding Library Staff)
LibQUAL+® 2008 Survey Results - UALR Ottenheimer Library Page 29 of 89
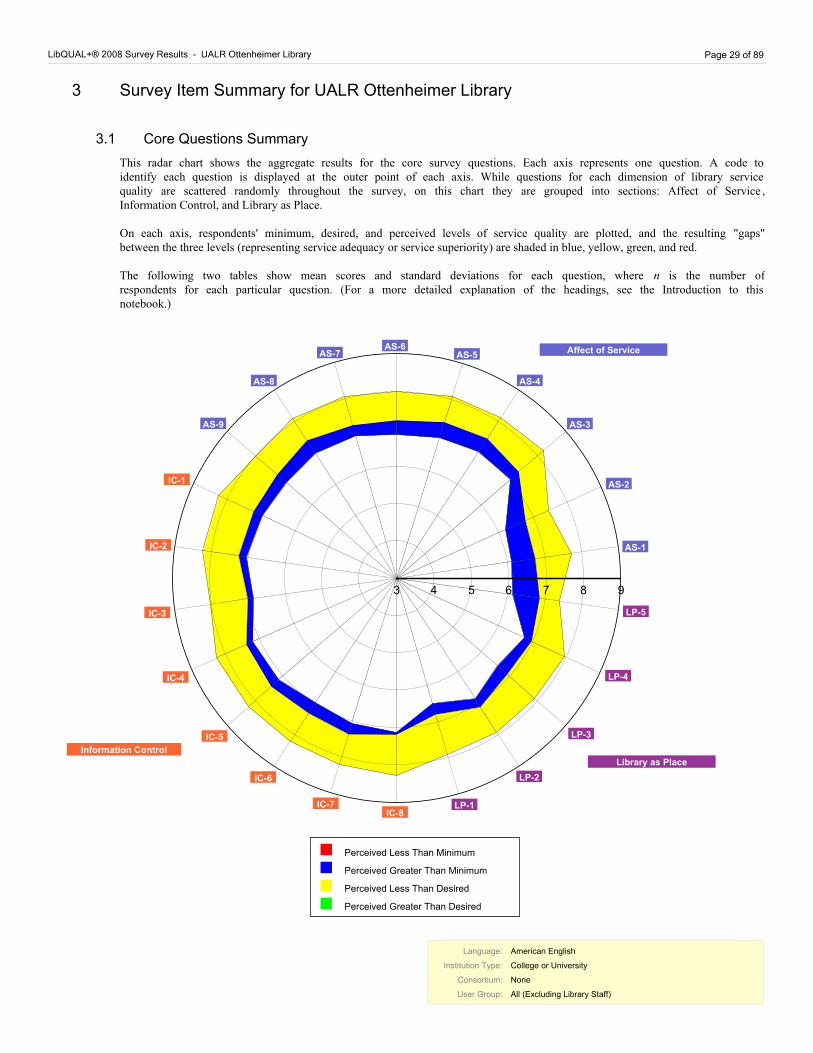
This radar chart shows the aggregate results for the core survey questions. Each axis represents one question. A code to identify each question is displayed at the outer point of each axis. While questions for each dimension of library service quality are scattered randomly throughout the survey, on this chart they are grouped into sections: Affect of Service , Information Control, and Library as Place.
On each axis, respondents' minimum, desired, and perceived levels of service quality are plotted, and the resulting "gaps" between the three levels (representing service adequacy or service superiority) are shaded in blue, yellow, green, and red.
The following two tables show mean scores and standard deviations for each question, where n is the number of respondents for each particular question. (For a more detailed explanation of the headings, see the Introduction to this notebook.)
3.1 Core Questions Summary
3 Survey Item Summary for UALR Ottenheimer Library
3
4
5
6
7
8
9
AS-1
AS-2
AS-3
AS-4
AS-5AS-6
AS-7
AS-8
AS-9
IC-1
IC-2
IC-3
IC-4
IC-5
IC-6
IC-7IC-8
LP-1
LP-2
LP-3
LP-4
LP-5
Affect of Service
Information Control
Library as Place
Perceived Less Than Minimum
Perceived Greater Than Minimum
Perceived Less Than Desired
Perceived Greater Than Desired
Language:
Institution Type:
Consortium:
User Group:
American English
College or University
None
All (Excluding Library Staff)
Language:
Institution Type:
Consortium:
User Group:
American English
College or University
None
All (Excluding Library Staff)
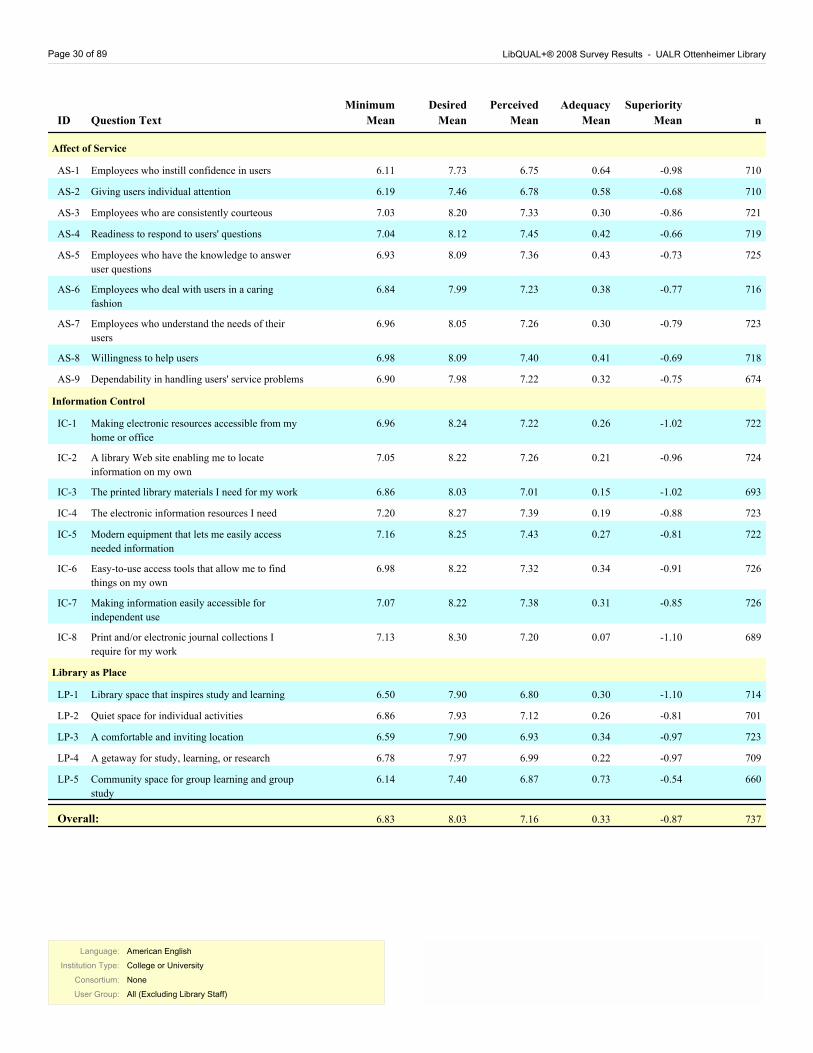
Page 30 of 89 LibQUAL+® 2008 Survey Results - UALR Ottenheimer Library
Adequacy
Mean
Perceived
Mean
Desired
MeanQuestion TextID
Minimum
Mean n
Superiority
Mean
Affect of Service
Employees who instill confidence in users 6.11 7.73 6.75 0.64AS-1 710-0.98
Giving users individual attention 6.19 7.46 6.78 0.58AS-2 710-0.68
Employees who are consistently courteous 7.03 8.20 7.33 0.30AS-3 721-0.86
Readiness to respond to users' questions 7.04 8.12 7.45 0.42AS-4 719-0.66
Employees who have the knowledge to answer
user questions
6.93 8.09 7.36 0.43AS-5 725-0.73
Employees who deal with users in a caring
fashion
6.84 7.99 7.23 0.38AS-6 716-0.77
Employees who understand the needs of their
users
6.96 8.05 7.26 0.30AS-7 723-0.79
Willingness to help users 6.98 8.09 7.40 0.41AS-8 718-0.69
Dependability in handling users' service problems 6.90 7.98 7.22 0.32AS-9 674-0.75
Information Control
Making electronic resources accessible from my
home or office
6.96 8.24 7.22 0.26IC-1 722-1.02
A library Web site enabling me to locate
information on my own
7.05 8.22 7.26 0.21IC-2 724-0.96
The printed library materials I need for my work 6.86 8.03 7.01 0.15IC-3 693-1.02
The electronic information resources I need 7.20 8.27 7.39 0.19IC-4 723-0.88
Modern equipment that lets me easily access
needed information
7.16 8.25 7.43 0.27IC-5 722-0.81
Easy-to-use access tools that allow me to find
things on my own
6.98 8.22 7.32 0.34IC-6 726-0.91
Making information easily accessible for
independent use
7.07 8.22 7.38 0.31IC-7 726-0.85
Print and/or electronic journal collections I
require for my work
7.13 8.30 7.20 0.07IC-8 689-1.10
Library as Place
Library space that inspires study and learning 6.50 7.90 6.80 0.30LP-1 714-1.10
Quiet space for individual activities 6.86 7.93 7.12 0.26LP-2 701-0.81
A comfortable and inviting location 6.59 7.90 6.93 0.34LP-3 723-0.97
A getaway for study, learning, or research 6.78 7.97 6.99 0.22LP-4 709-0.97
Community space for group learning and group
study
6.14 7.40 6.87 0.73LP-5 660-0.54
6.83 8.03 7.16 0.33 737-0.87Overall:
Language:
Institution Type:
Consortium:
User Group:
American English
College or University
None
All (Excluding Library Staff)
Language:
Institution Type:
Consortium:
User Group:
American English
College or University
None
All (Excluding Library Staff)
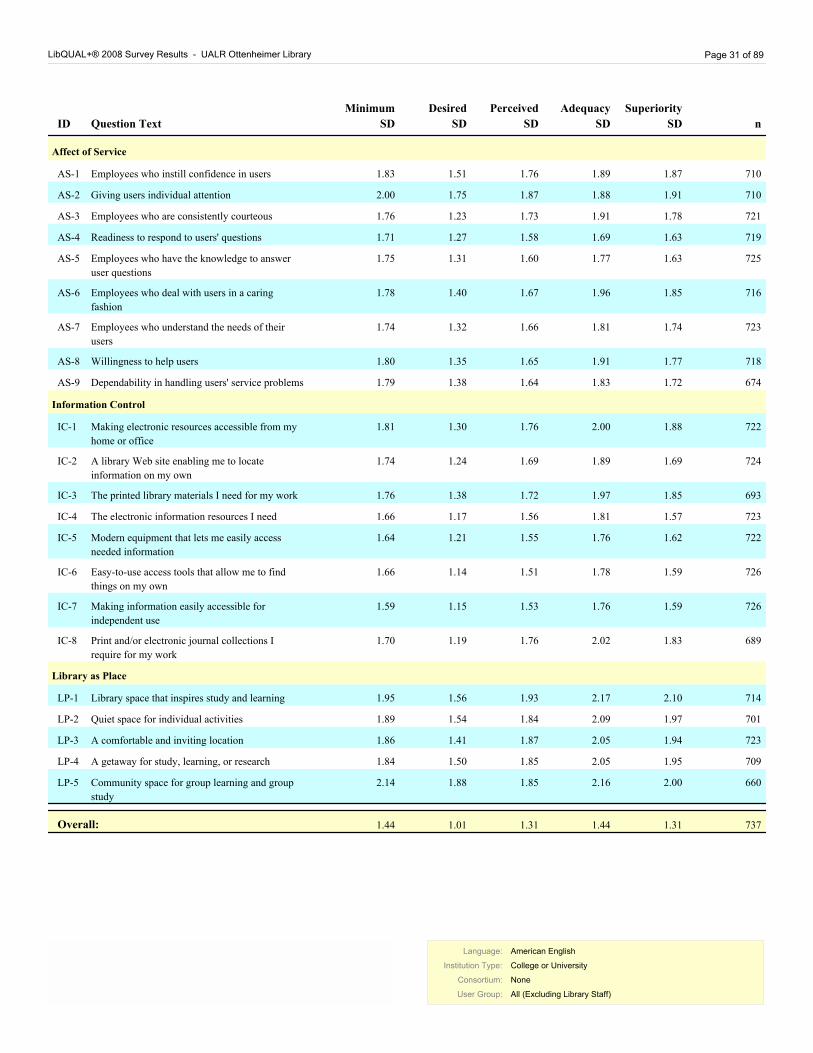
LibQUAL+® 2008 Survey Results - UALR Ottenheimer Library Page 31 of 89
Adequacy
SD
Perceived
SD
Desired
SDQuestion TextID
Minimum
SD n
Superiority
SD
Affect of Service
Employees who instill confidence in usersAS-1 710 1.83 1.87 1.89 1.76 1.51
Giving users individual attentionAS-2 710 2.00 1.91 1.88 1.87 1.75
Employees who are consistently courteousAS-3 721 1.76 1.78 1.91 1.73 1.23
Readiness to respond to users' questionsAS-4 719 1.71 1.63 1.69 1.58 1.27
Employees who have the knowledge to answer
user questions
AS-5 725 1.75 1.63 1.77 1.60 1.31
Employees who deal with users in a caring
fashion
AS-6 716 1.78 1.85 1.96 1.67 1.40
Employees who understand the needs of their
users
AS-7 723 1.74 1.74 1.81 1.66 1.32
Willingness to help usersAS-8 718 1.80 1.77 1.91 1.65 1.35
Dependability in handling users' service problemsAS-9 674 1.79 1.72 1.83 1.64 1.38
Information Control
Making electronic resources accessible from my
home or office
IC-1 722 1.81 1.88 2.00 1.76 1.30
A library Web site enabling me to locate
information on my own
IC-2 724 1.74 1.69 1.89 1.69 1.24
The printed library materials I need for my workIC-3 693 1.76 1.85 1.97 1.72 1.38
The electronic information resources I needIC-4 723 1.66 1.57 1.81 1.56 1.17
Modern equipment that lets me easily access
needed information
IC-5 722 1.64 1.62 1.76 1.55 1.21
Easy-to-use access tools that allow me to find
things on my own
IC-6 726 1.66 1.59 1.78 1.51 1.14
Making information easily accessible for
independent use
IC-7 726 1.59 1.59 1.76 1.53 1.15
Print and/or electronic journal collections I
require for my work
IC-8 689 1.70 1.83 2.02 1.76 1.19
Library as Place
Library space that inspires study and learningLP-1 714 1.95 2.10 2.17 1.93 1.56
Quiet space for individual activitiesLP-2 701 1.89 1.97 2.09 1.84 1.54
A comfortable and inviting locationLP-3 723 1.86 1.94 2.05 1.87 1.41
A getaway for study, learning, or researchLP-4 709 1.84 1.95 2.05 1.85 1.50
Community space for group learning and group
study
LP-5 660 2.14 2.00 2.16 1.85 1.88
737Overall: 1.44 1.31 1.44 1.31 1.01
Language:
Institution Type:
Consortium:
User Group:
American English
College or University
None
All (Excluding Library Staff)
Language:
Institution Type:
Consortium:
User Group:
American English
College or University
None
All (Excluding Library Staff)
Page 32 of 89 LibQUAL+® 2008 Survey Results - UALR Ottenheimer Library
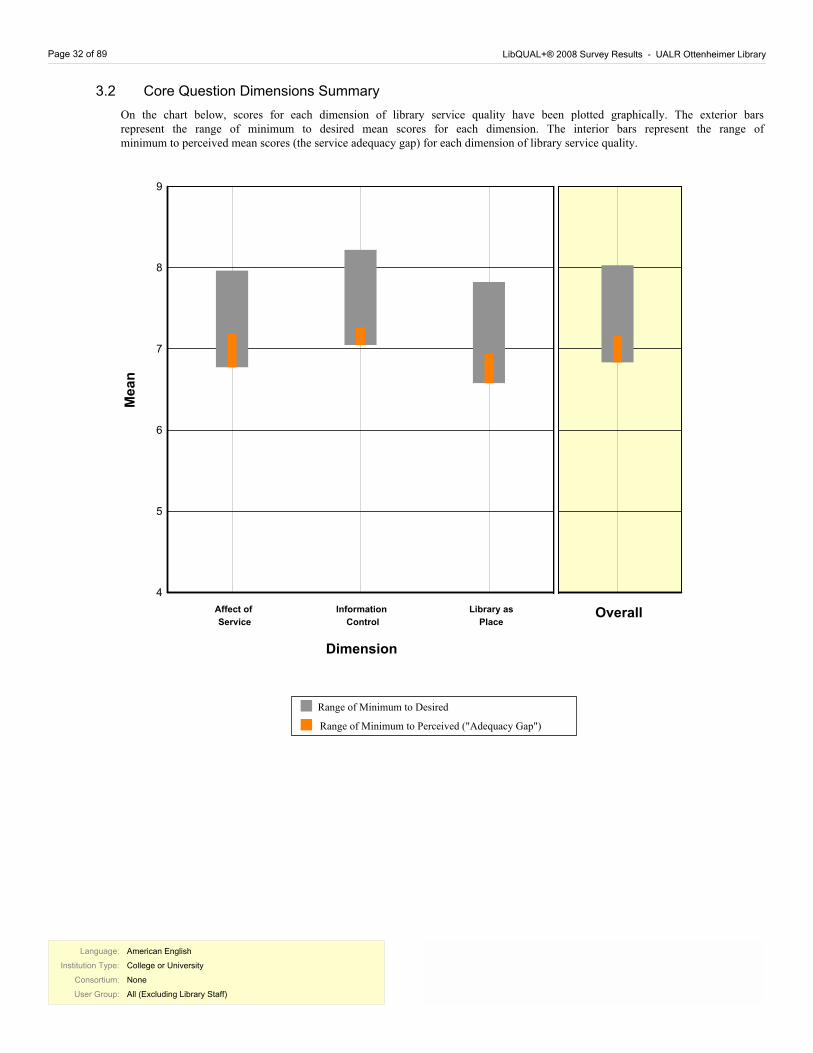
On the chart below, scores for each dimension of library service quality have been plotted graphically. The exterior bars represent the range of minimum to desired mean scores for each dimension. The interior bars represent the range of minimum to perceived mean scores (the service adequacy gap) for each dimension of library service quality.
3.2 Core Question Dimensions Summary
4
5
6
7
8
9
Information
Control
Affect of
Service
Library as
Place
Range of Minimum to Perceived ("Adequacy Gap")
Range of Minimum to Desired
Me
an
Dimension
Overall
Language:
Institution Type:
Consortium:
User Group:
American English
College or University
None
All (Excluding Library Staff)
Language:
Institution Type:
Consortium:
User Group:
American English
College or University
None
All (Excluding Library Staff)
LibQUAL+® 2008 Survey Results - UALR Ottenheimer Library Page 33 of 89
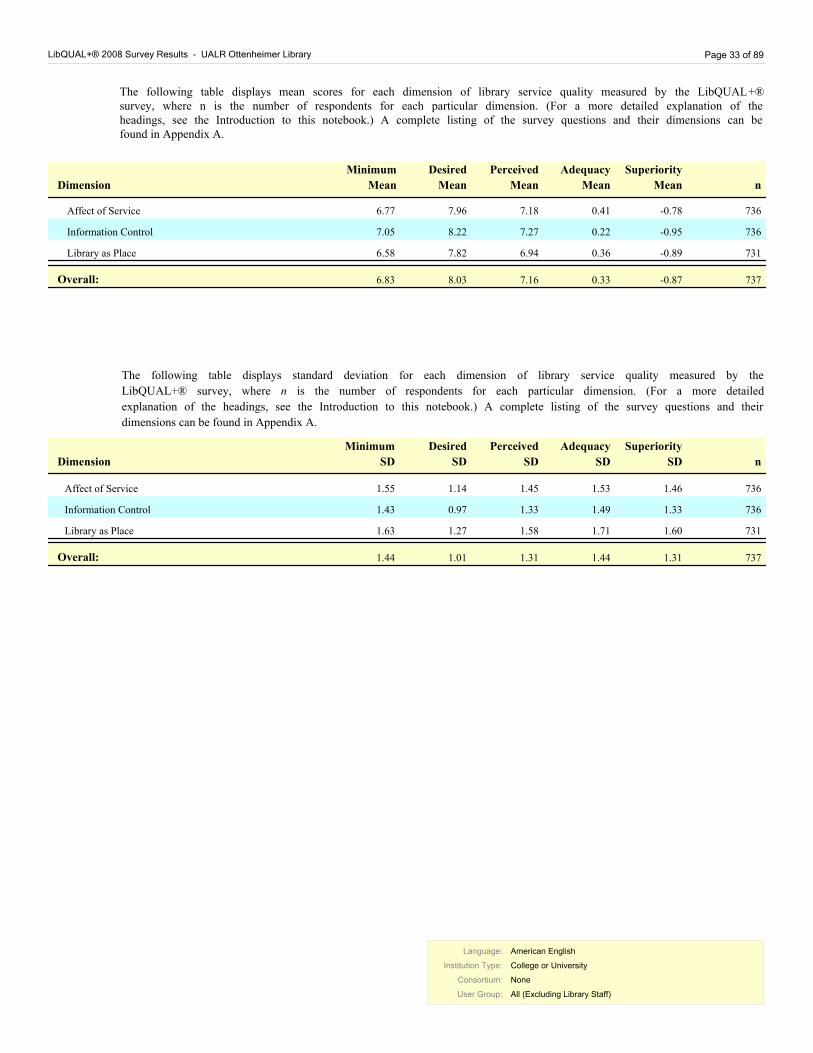
The following table displays mean scores for each dimension of library service quality measured by the LibQUAL+® survey, where n is the number of respondents for each particular dimension. (For a more detailed explanation of the headings, see the Introduction to this notebook.) A complete listing of the survey questions and their dimensions can be found in Appendix A.
Adequacy
Mean
Perceived
Mean
Desired
MeanDimension
Minimum
Mean n
Superiority
Mean
Affect of Service 6.77 7.96 7.18 0.41 736-0.78
Information Control 7.05 8.22 7.27 0.22 736-0.95
Library as Place 6.58 7.82 6.94 0.36 731-0.89
6.83 8.03 7.16 0.33 737-0.87Overall:
Adequacy
SD
Perceived
SD
Desired
SDDimension
Minimum
SD n
Superiority
SD
Affect of Service 736 1.55 1.46 1.53 1.45 1.14
Information Control 736 1.43 1.33 1.49 1.33 0.97
Library as Place 731 1.63 1.60 1.71 1.58 1.27
The following table displays standard deviation for each dimension of library service quality measured by the
LibQUAL+® survey, where n is the number of respondents for each particular dimension. (For a more detailed
explanation of the headings, see the Introduction to this notebook.) A complete listing of the survey questions and their
dimensions can be found in Appendix A.
737Overall: 1.44 1.31 1.44 1.31 1.01
Language:
Institution Type:
Consortium:
User Group:
American English
College or University
None
All (Excluding Library Staff)
Language:
Institution Type:
Consortium:
User Group:
American English
College or University
None
All (Excluding Library Staff)
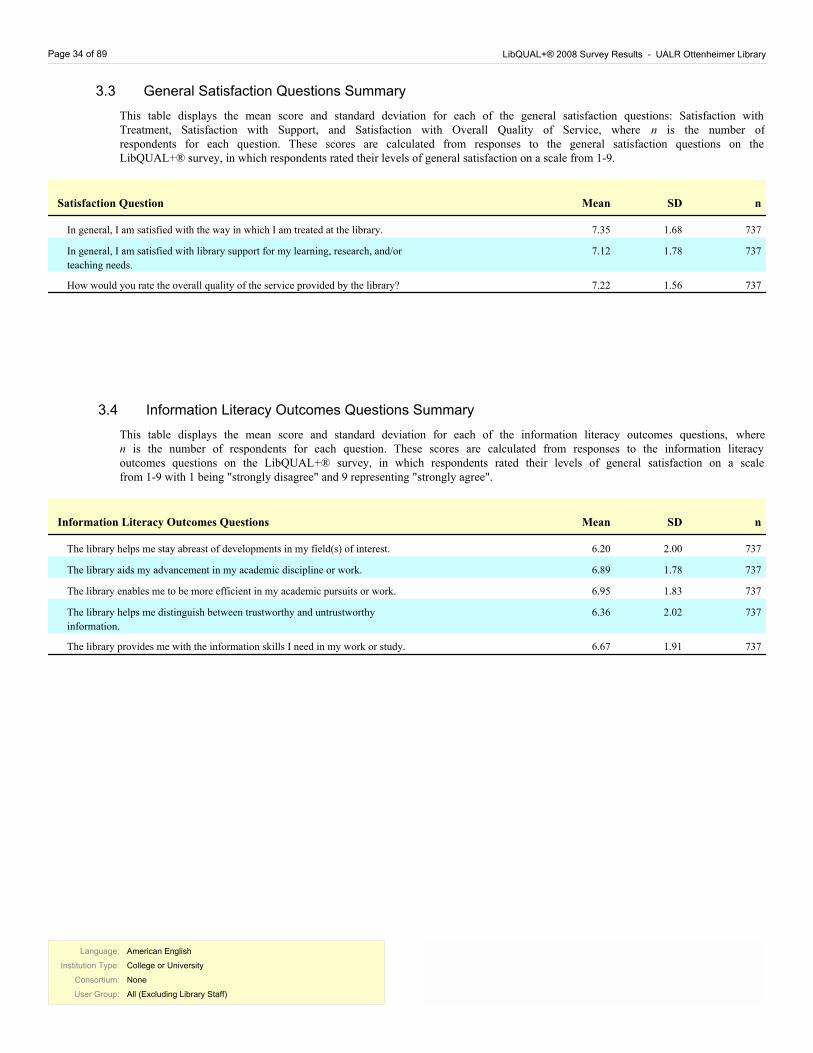
Page 34 of 89 LibQUAL+® 2008 Survey Results - UALR Ottenheimer Library
This table displays the mean score and standard deviation for each of the general satisfaction questions: Satisfaction with Treatment, Satisfaction with Support, and Satisfaction with Overall Quality of Service, where n is the number of respondents for each question. These scores are calculated from responses to the general satisfaction questions on the LibQUAL+® survey, in which respondents rated their levels of general satisfaction on a scale from 1-9.
3.3 General Satisfaction Questions Summary
MeanSatisfaction Question nSD
In general, I am satisfied with the way in which I am treated at the library. 7.35 737 1.68
In general, I am satisfied with library support for my learning, research, and/or
teaching needs.
7.12 737 1.78
How would you rate the overall quality of the service provided by the library? 7.22 737 1.56
This table displays the mean score and standard deviation for each of the information literacy outcomes questions, where n is the number of respondents for each question. These scores are calculated from responses to the information literacy outcomes questions on the LibQUAL+® survey, in which respondents rated their levels of general satisfaction on a scale from 1-9 with 1 being "strongly disagree" and 9 representing "strongly agree".
3.4 Information Literacy Outcomes Questions Summary
MeanInformation Literacy Outcomes Questions nSD
The library helps me stay abreast of developments in my field(s) of interest. 6.20 737 2.00
The library aids my advancement in my academic discipline or work. 6.89 737 1.78
The library enables me to be more efficient in my academic pursuits or work. 6.95 737 1.83
The library helps me distinguish between trustworthy and untrustworthy
information.
6.36 737 2.02
The library provides me with the information skills I need in my work or study. 6.67 737 1.91
Language:
Institution Type:
Consortium:
User Group:
American English
College or University
None
All (Excluding Library Staff)
Language:
Institution Type:
Consortium:
User Group:
American English
College or University
None
All (Excluding Library Staff)
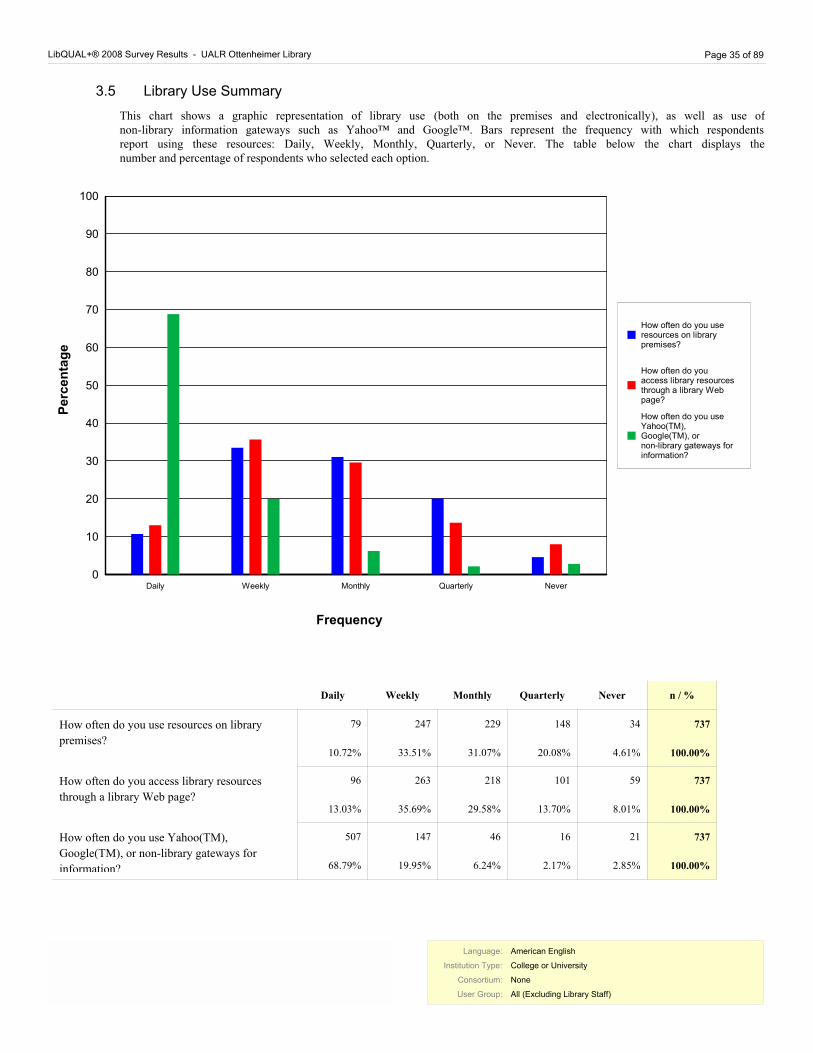
LibQUAL+® 2008 Survey Results - UALR Ottenheimer Library Page 35 of 89
This chart shows a graphic representation of library use (both on the premises and electronically), as well as use of non-library information gateways such as Yahoo™ and Google™. Bars represent the frequency with which respondents report using these resources: Daily, Weekly, Monthly, Quarterly, or Never. The table below the chart displays the number and percentage of respondents who selected each option.
3.5 Library Use Summary
0
10
20
30
40
50
60
70
80
90
100
Daily
Weekly
Monthly
Quarterly
Never
How often do you use
resources on library
premises?
How often do you
access library resources
through a library Web
page?
How often do you use
Yahoo(TM),
Google(TM), or
non-library gateways for
information?
Frequency
P
erc
en
tag
e
Daily Weekly Monthly Quarterly Never n / %
How often do you use resources on library
premises?
79
10.72%
247
33.51%
229
31.07%
148
20.08%
34
4.61%
737
100.00%
How often do you access library resources
through a library Web page?
96
13.03%
263
35.69%
218
29.58%
101
13.70%
59
8.01%
737
100.00%
How often do you use Yahoo(TM),
Google(TM), or non-library gateways for
information?
507
68.79%
147
19.95%
46
6.24%
16
2.17%
21
2.85%
737
100.00%
Language:
Institution Type:
Consortium:
User Group:
American English
College or University
None
All (Excluding Library Staff)
Language:
Institution Type:
Consortium:
User Group:
American English
College or University
None
All (Excluding Library Staff)
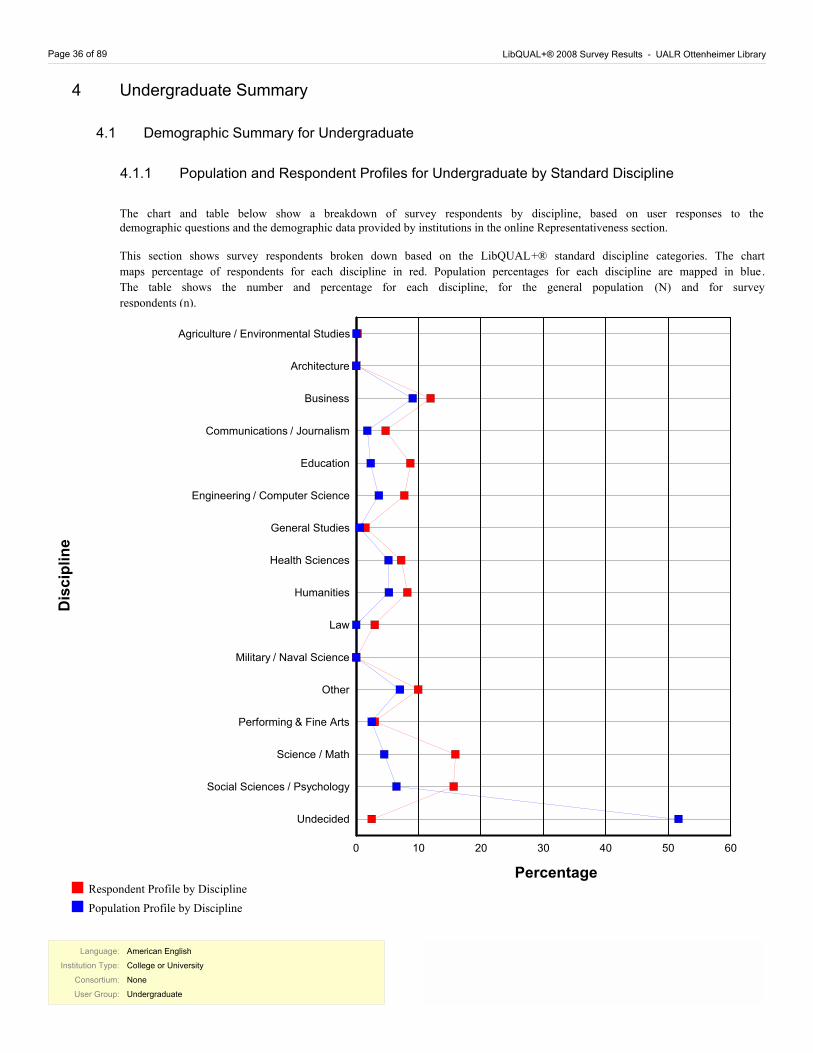
Page 36 of 89 LibQUAL+® 2008 Survey Results - UALR Ottenheimer Library
4 Undergraduate Summary
4.1 Demographic Summary for Undergraduate
4.1.1 Population and Respondent Profiles for Undergraduate by Standard Discipline
The chart and table below show a breakdown of survey respondents by discipline, based on user responses to the demographic questions and the demographic data provided by institutions in the online Representativeness section.
This section shows survey respondents broken down based on the LibQUAL+® standard discipline categories. The chart
maps percentage of respondents for each discipline in red. Population percentages for each discipline are mapped in blue.
The table shows the number and percentage for each discipline, for the general population (N) and for survey
respondents (n).
0
10
20
30
40
50
60
Agriculture / Environmental Studies
Architecture
Business
Communications / Journalism
Education
Engineering / Computer Science
General Studies
Health Sciences
Humanities
Law
Military / Naval Science
Other
Performing & Fine Arts
Science / Math
Social Sciences / Psychology
Undecided
D
isc
ipli
ne
Percentage
Population Profile by Discipline
Respondent Profile by Discipline
Language:
Institution Type:
Consortium:
User Group:
American English
College or University
None
Undergraduate
Language:
Institution Type:
Consortium:
User Group:
American English
College or University
None
Undergraduate
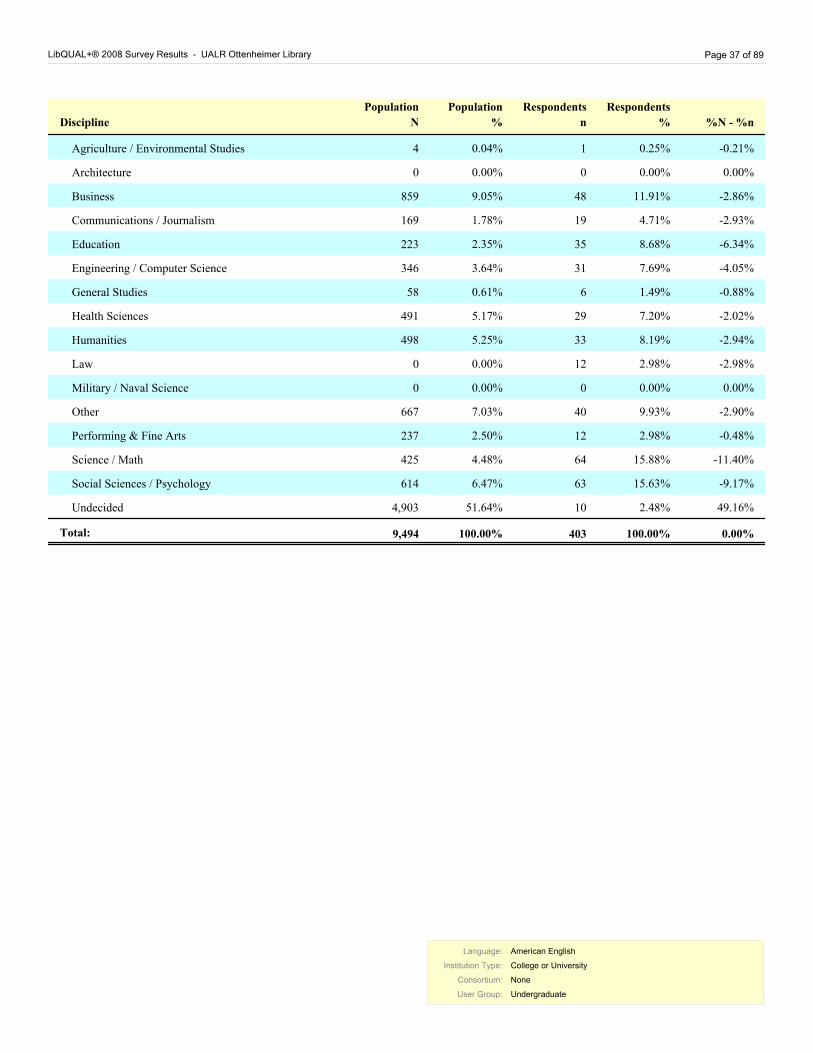
LibQUAL+® 2008 Survey Results - UALR Ottenheimer Library Page 37 of 89
Respondents
nDiscipline
Respondents
%
Population
N
Population
% %N - %n
Agriculture / Environmental Studies 1 0.25% 4 0.04% -0.21%
Architecture 0 0.00% 0 0.00% 0.00%
Business 48 11.91% 859 9.05% -2.86%
Communications / Journalism 19 4.71% 169 1.78% -2.93%
Education 35 8.68% 223 2.35% -6.34%
Engineering / Computer Science 31 7.69% 346 3.64% -4.05%
General Studies 6 1.49% 58 0.61% -0.88%
Health Sciences 29 7.20% 491 5.17% -2.02%
Humanities 33 8.19% 498 5.25% -2.94%
Law 12 2.98% 0 0.00% -2.98%
Military / Naval Science 0 0.00% 0 0.00% 0.00%
Other 40 9.93% 667 7.03% -2.90%
Performing & Fine Arts 12 2.98% 237 2.50% -0.48%
Science / Math 64 15.88% 425 4.48% -11.40%
Social Sciences / Psychology 63 15.63% 614 6.47% -9.17%
Undecided 10 2.48% 4,903 51.64% 49.16%
Total: 100.00% 9,494 403 100.00% 0.00%
Language:
Institution Type:
Consortium:
User Group:
American English
College or University
None
Undergraduate
Language:
Institution Type:
Consortium:
User Group:
American English
College or University
None
Undergraduate
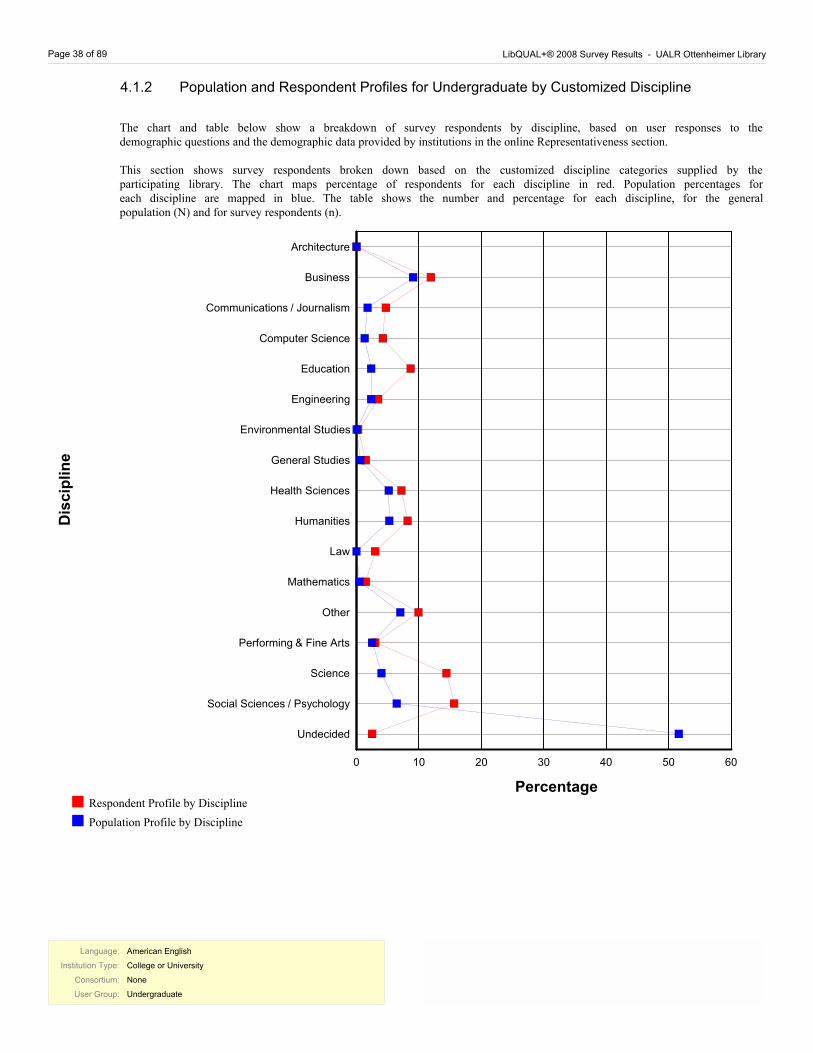
Page 38 of 89 LibQUAL+® 2008 Survey Results - UALR Ottenheimer Library
4.1.2 Population and Respondent Profiles for Undergraduate by Customized Discipline
The chart and table below show a breakdown of survey respondents by discipline, based on user responses to the demographic questions and the demographic data provided by institutions in the online Representativeness section.
This section shows survey respondents broken down based on the customized discipline categories supplied by the participating library. The chart maps percentage of respondents for each discipline in red. Population percentages for each discipline are mapped in blue. The table shows the number and percentage for each discipline, for the general population (N) and for survey respondents (n).
0
10
20
30
40
50
60
Architecture
Business
Communications / Journalism
Computer Science
Education
Engineering
Environmental Studies
General Studies
Health Sciences
Humanities
Law
Mathematics
Other
Performing & Fine Arts
Science
Social Sciences / Psychology
Undecided
D
isc
ipli
ne
Percentage
Population Profile by Discipline
Respondent Profile by Discipline
Language:
Institution Type:
Consortium:
User Group:
American English
College or University
None
Undergraduate
Language:
Institution Type:
Consortium:
User Group:
American English
College or University
None
Undergraduate
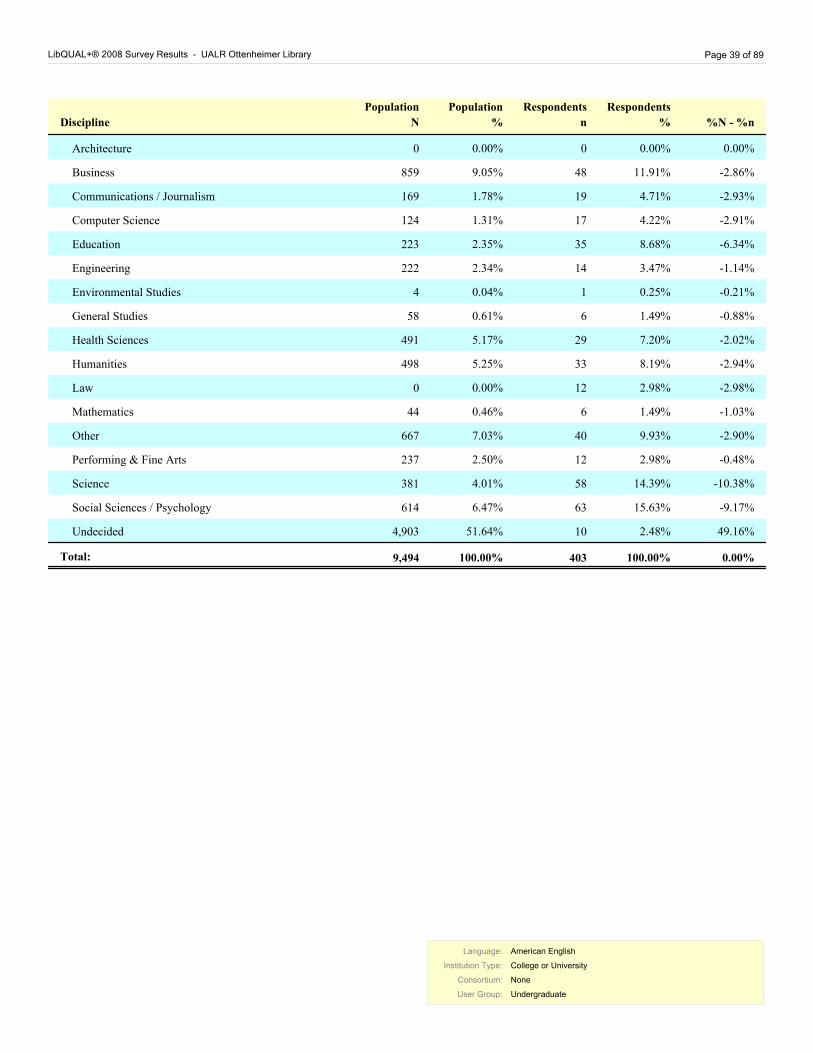
LibQUAL+® 2008 Survey Results - UALR Ottenheimer Library Page 39 of 89
Respondents
nDiscipline
Respondents
%
Population
N
Population
% %N - %n
Architecture 0 0.00% 0 0.00% 0.00%
Business 48 11.91% 859 9.05% -2.86%
Communications / Journalism 19 4.71% 169 1.78% -2.93%
Computer Science 17 4.22% 124 1.31% -2.91%
Education 35 8.68% 223 2.35% -6.34%
Engineering 14 3.47% 222 2.34% -1.14%
Environmental Studies 1 0.25% 4 0.04% -0.21%
General Studies 6 1.49% 58 0.61% -0.88%
Health Sciences 29 7.20% 491 5.17% -2.02%
Humanities 33 8.19% 498 5.25% -2.94%
Law 12 2.98% 0 0.00% -2.98%
Mathematics 6 1.49% 44 0.46% -1.03%
Other 40 9.93% 667 7.03% -2.90%
Performing & Fine Arts 12 2.98% 237 2.50% -0.48%
Science 58 14.39% 381 4.01% -10.38%
Social Sciences / Psychology 63 15.63% 614 6.47% -9.17%
Undecided 10 2.48% 4,903 51.64% 49.16%
Total: 100.00% 9,494 403 100.00% 0.00%
Language:
Institution Type:
Consortium:
User Group:
American English
College or University
None
Undergraduate
Language:
Institution Type:
Consortium:
User Group:
American English
College or University
None
Undergraduate

Page 40 of 89 LibQUAL+® 2008 Survey Results - UALR Ottenheimer Library
4.1.3 Respondent Profile for Undergraduate by Age
This table shows a breakdown of survey respondents by age; both the number of respondents (n) and the percentage of the total number of respondents represented by each age group are displayed.
Respondents
%
Respondents
nAge
Under 18 1 0.25%
18 - 22 141 34.99%
23 - 30 138 34.24%
31 - 45 90 22.33%
46 - 65 31 7.69%
Over 65 2 0.50%
Total: 100.00% 403
4.1.4 Population and Respondent Profiles for Undergraduate by Sex
The table below shows a breakdown of survey respondents by sex, based on user responses to the demographic questions and the demographic data provided by institutions in the online Representativeness section*. The number and percentage for each sex are given for the general population and for survey respondents.
*Note: Participating institutions were not required to complete the Representativeness section. When population data is missing or incomplete, it is because this data was not provided.
Respondents
%
Respondents
n
Population
%
Population
NSex
Male 100 24.81%39.56% 3,756
Female 303 75.19%60.44% 5,738
Total: 100.00% 403 9,494 100.00%
Language:
Institution Type:
Consortium:
User Group:
American English
College or University
None
Undergraduate
Language:
Institution Type:
Consortium:
User Group:
American English
College or University
None
Undergraduate
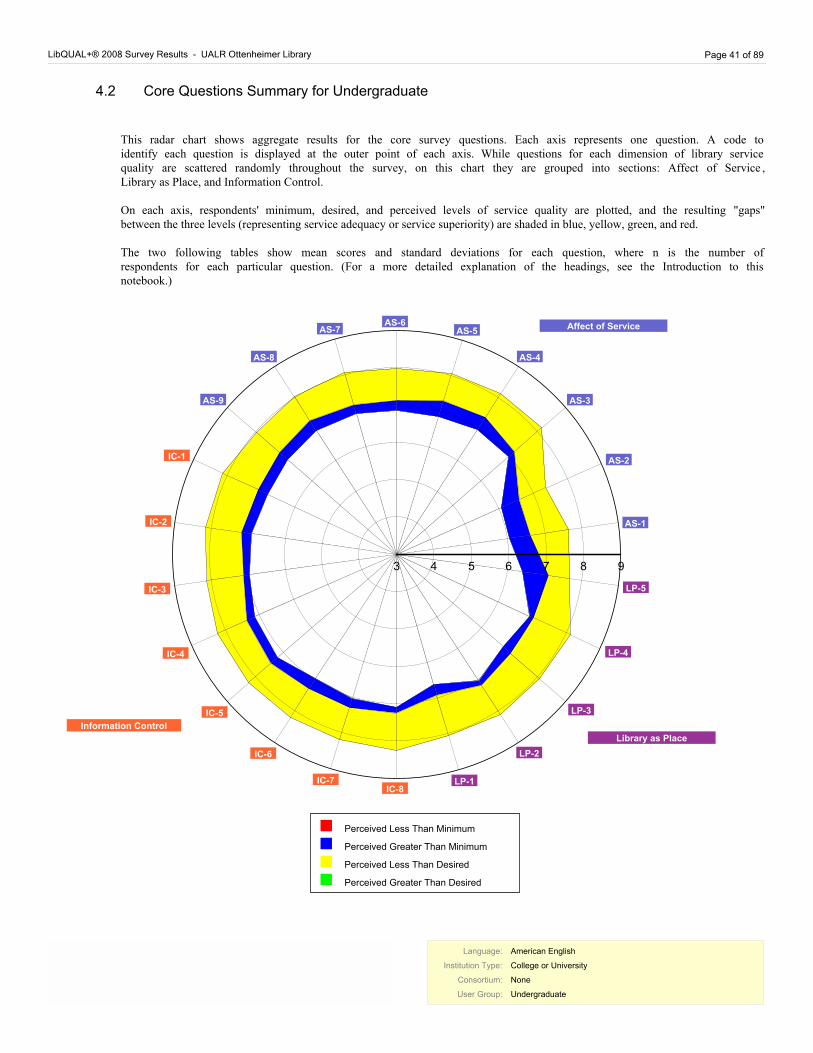
LibQUAL+® 2008 Survey Results - UALR Ottenheimer Library Page 41 of 89
4.2 Core Questions Summary for Undergraduate
This radar chart shows aggregate results for the core survey questions. Each axis represents one question. A code to identify each question is displayed at the outer point of each axis. While questions for each dimension of library service quality are scattered randomly throughout the survey, on this chart they are grouped into sections: Affect of Service , Library as Place, and Information Control.
On each axis, respondents' minimum, desired, and perceived levels of service quality are plotted, and the resulting "gaps" between the three levels (representing service adequacy or service superiority) are shaded in blue, yellow, green, and red.
The two following tables show mean scores and standard deviations for each question, where n is the number of respondents for each particular question. (For a more detailed explanation of the headings, see the Introduction to this notebook.)
3
4
5
6
7
8
9
AS-1
AS-2
AS-3
AS-4
AS-5AS-6
AS-7
AS-8
AS-9
IC-1
IC-2
IC-3
IC-4
IC-5
IC-6
IC-7IC-8
LP-1
LP-2
LP-3
LP-4
LP-5
Affect of Service
Information Control
Library as Place
Perceived Less Than Minimum
Perceived Greater Than Minimum
Perceived Less Than Desired
Perceived Greater Than Desired
Language:
Institution Type:
Consortium:
User Group:
American English
College or University
None
Undergraduate
Language:
Institution Type:
Consortium:
User Group:
American English
College or University
None
Undergraduate
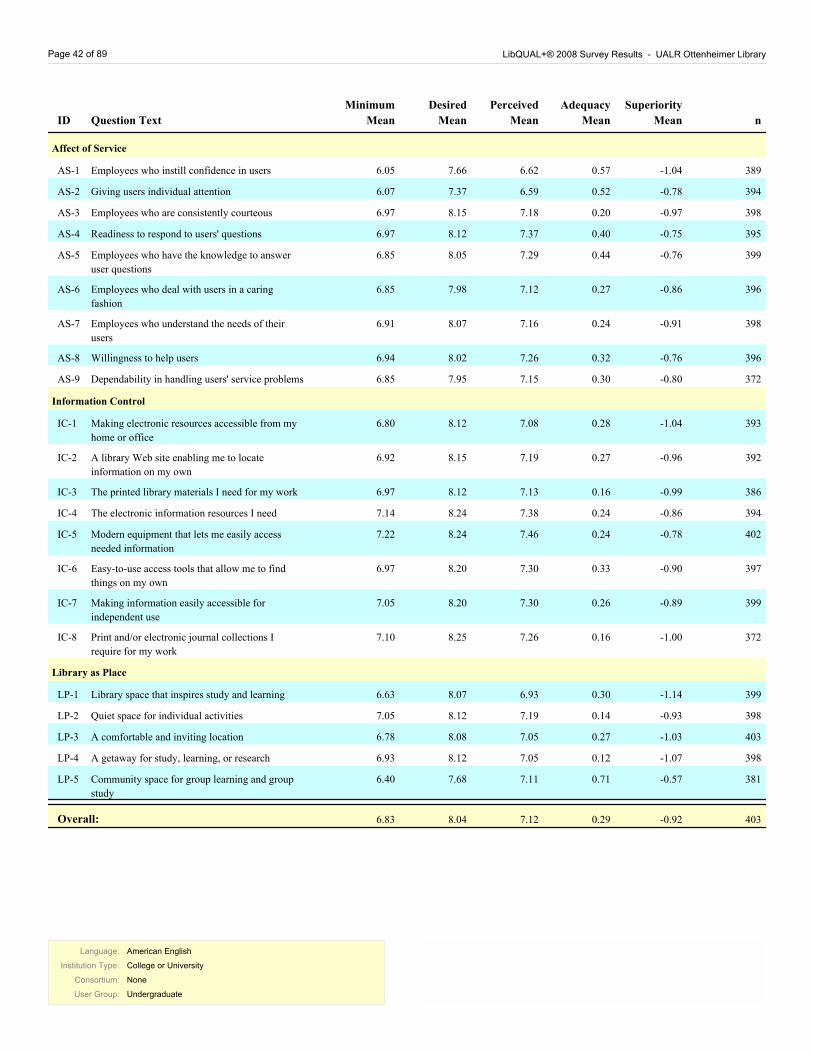
Page 42 of 89 LibQUAL+® 2008 Survey Results - UALR Ottenheimer Library
Adequacy
Mean
Perceived
Mean
Desired
MeanQuestion TextID
Minimum
Mean n
Superiority
Mean
Affect of Service
Employees who instill confidence in users 6.05 7.66 6.62 0.57AS-1 389-1.04
Giving users individual attention 6.07 7.37 6.59 0.52AS-2 394-0.78
Employees who are consistently courteous 6.97 8.15 7.18 0.20AS-3 398-0.97
Readiness to respond to users' questions 6.97 8.12 7.37 0.40AS-4 395-0.75
Employees who have the knowledge to answer
user questions
6.85 8.05 7.29 0.44AS-5 399-0.76
Employees who deal with users in a caring
fashion
6.85 7.98 7.12 0.27AS-6 396-0.86
Employees who understand the needs of their
users
6.91 8.07 7.16 0.24AS-7 398-0.91
Willingness to help users 6.94 8.02 7.26 0.32AS-8 396-0.76
Dependability in handling users' service problems 6.85 7.95 7.15 0.30AS-9 372-0.80
Information Control
Making electronic resources accessible from my
home or office
6.80 8.12 7.08 0.28IC-1 393-1.04
A library Web site enabling me to locate
information on my own
6.92 8.15 7.19 0.27IC-2 392-0.96
The printed library materials I need for my work 6.97 8.12 7.13 0.16IC-3 386-0.99
The electronic information resources I need 7.14 8.24 7.38 0.24IC-4 394-0.86
Modern equipment that lets me easily access
needed information
7.22 8.24 7.46 0.24IC-5 402-0.78
Easy-to-use access tools that allow me to find
things on my own
6.97 8.20 7.30 0.33IC-6 397-0.90
Making information easily accessible for
independent use
7.05 8.20 7.30 0.26IC-7 399-0.89
Print and/or electronic journal collections I
require for my work
7.10 8.25 7.26 0.16IC-8 372-1.00
Library as Place
Library space that inspires study and learning 6.63 8.07 6.93 0.30LP-1 399-1.14
Quiet space for individual activities 7.05 8.12 7.19 0.14LP-2 398-0.93
A comfortable and inviting location 6.78 8.08 7.05 0.27LP-3 403-1.03
A getaway for study, learning, or research 6.93 8.12 7.05 0.12LP-4 398-1.07
Community space for group learning and group
study
6.40 7.68 7.11 0.71LP-5 381-0.57
6.83 8.04 7.12 0.29 403-0.92Overall:
Language:
Institution Type:
Consortium:
User Group:
American English
College or University
None
Undergraduate
Language:
Institution Type:
Consortium:
User Group:
American English
College or University
None
Undergraduate
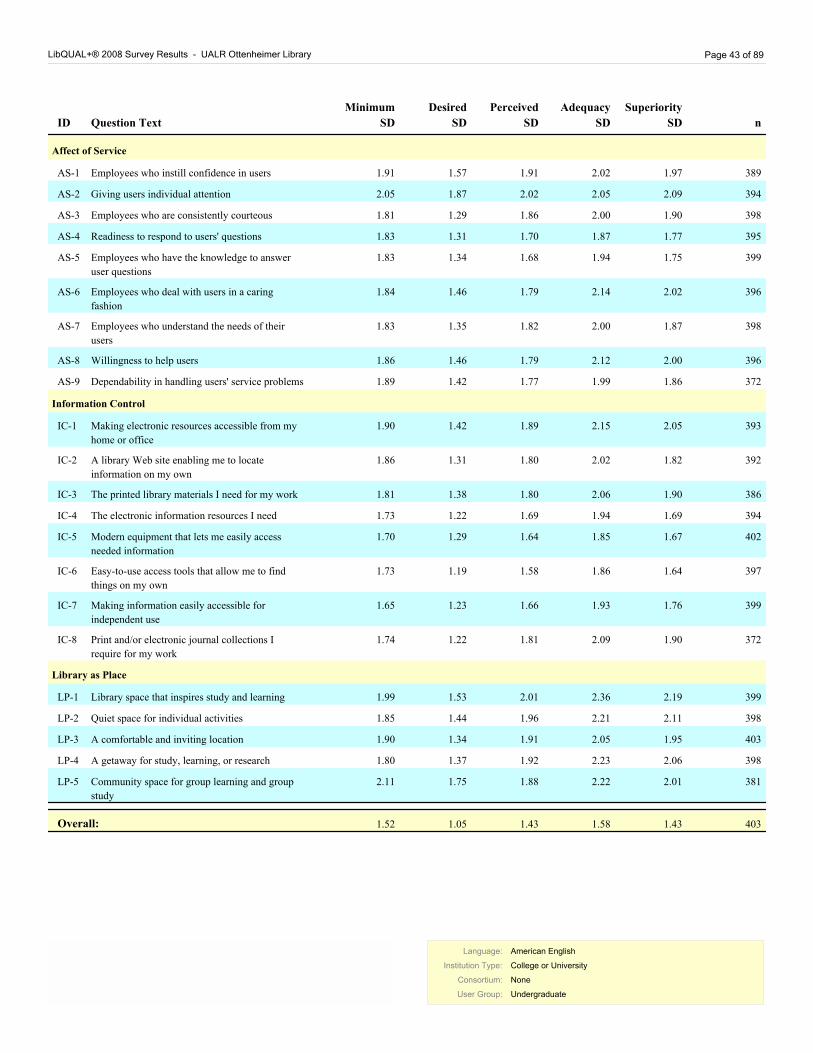
LibQUAL+® 2008 Survey Results - UALR Ottenheimer Library Page 43 of 89
Adequacy
SD
Perceived
SD
Desired
SDQuestion TextID
Minimum
SD n
Superiority
SD
Affect of Service
Employees who instill confidence in usersAS-1 389 1.91 1.97 2.02 1.91 1.57
Giving users individual attentionAS-2 394 2.05 2.09 2.05 2.02 1.87
Employees who are consistently courteousAS-3 398 1.81 1.90 2.00 1.86 1.29
Readiness to respond to users' questionsAS-4 395 1.83 1.77 1.87 1.70 1.31
Employees who have the knowledge to answer
user questions
AS-5 399 1.83 1.75 1.94 1.68 1.34
Employees who deal with users in a caring
fashion
AS-6 396 1.84 2.02 2.14 1.79 1.46
Employees who understand the needs of their
users
AS-7 398 1.83 1.87 2.00 1.82 1.35
Willingness to help usersAS-8 396 1.86 2.00 2.12 1.79 1.46
Dependability in handling users' service problemsAS-9 372 1.89 1.86 1.99 1.77 1.42
Information Control
Making electronic resources accessible from my
home or office
IC-1 393 1.90 2.05 2.15 1.89 1.42
A library Web site enabling me to locate
information on my own
IC-2 392 1.86 1.82 2.02 1.80 1.31
The printed library materials I need for my workIC-3 386 1.81 1.90 2.06 1.80 1.38
The electronic information resources I needIC-4 394 1.73 1.69 1.94 1.69 1.22
Modern equipment that lets me easily access
needed information
IC-5 402 1.70 1.67 1.85 1.64 1.29
Easy-to-use access tools that allow me to find
things on my own
IC-6 397 1.73 1.64 1.86 1.58 1.19
Making information easily accessible for
independent use
IC-7 399 1.65 1.76 1.93 1.66 1.23
Print and/or electronic journal collections I
require for my work
IC-8 372 1.74 1.90 2.09 1.81 1.22
Library as Place
Library space that inspires study and learningLP-1 399 1.99 2.19 2.36 2.01 1.53
Quiet space for individual activitiesLP-2 398 1.85 2.11 2.21 1.96 1.44
A comfortable and inviting locationLP-3 403 1.90 1.95 2.05 1.91 1.34
A getaway for study, learning, or researchLP-4 398 1.80 2.06 2.23 1.92 1.37
Community space for group learning and group
study
LP-5 381 2.11 2.01 2.22 1.88 1.75
403Overall: 1.52 1.43 1.58 1.43 1.05
Language:
Institution Type:
Consortium:
User Group:
American English
College or University
None
Undergraduate
Language:
Institution Type:
Consortium:
User Group:
American English
College or University
None
Undergraduate
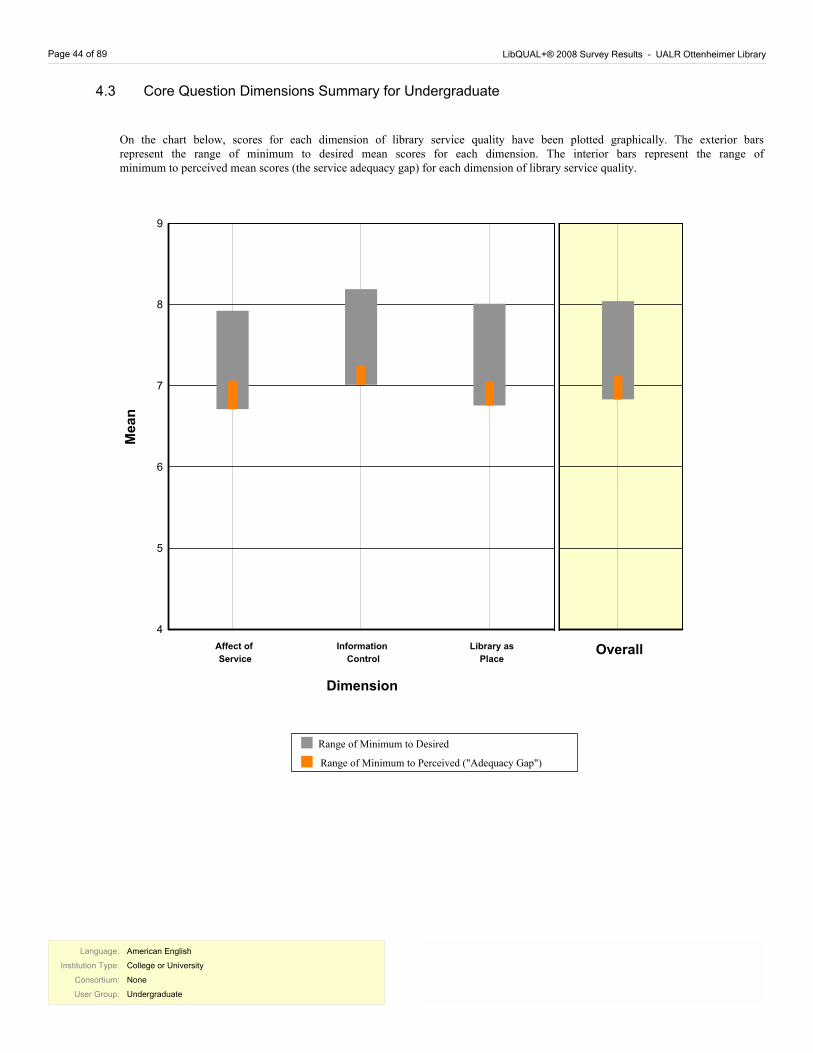
Page 44 of 89 LibQUAL+® 2008 Survey Results - UALR Ottenheimer Library
4.3 Core Question Dimensions Summary for Undergraduate
On the chart below, scores for each dimension of library service quality have been plotted graphically. The exterior bars represent the range of minimum to desired mean scores for each dimension. The interior bars represent the range of minimum to perceived mean scores (the service adequacy gap) for each dimension of library service quality.
4
5
6
7
8
9
Information
Control
Affect of
Service
Library as
Place
Range of Minimum to Perceived ("Adequacy Gap")
Range of Minimum to Desired
Me
an
Dimension
Overall
Language:
Institution Type:
Consortium:
User Group:
American English
College or University
None
Undergraduate
Language:
Institution Type:
Consortium:
User Group:
American English
College or University
None
Undergraduate
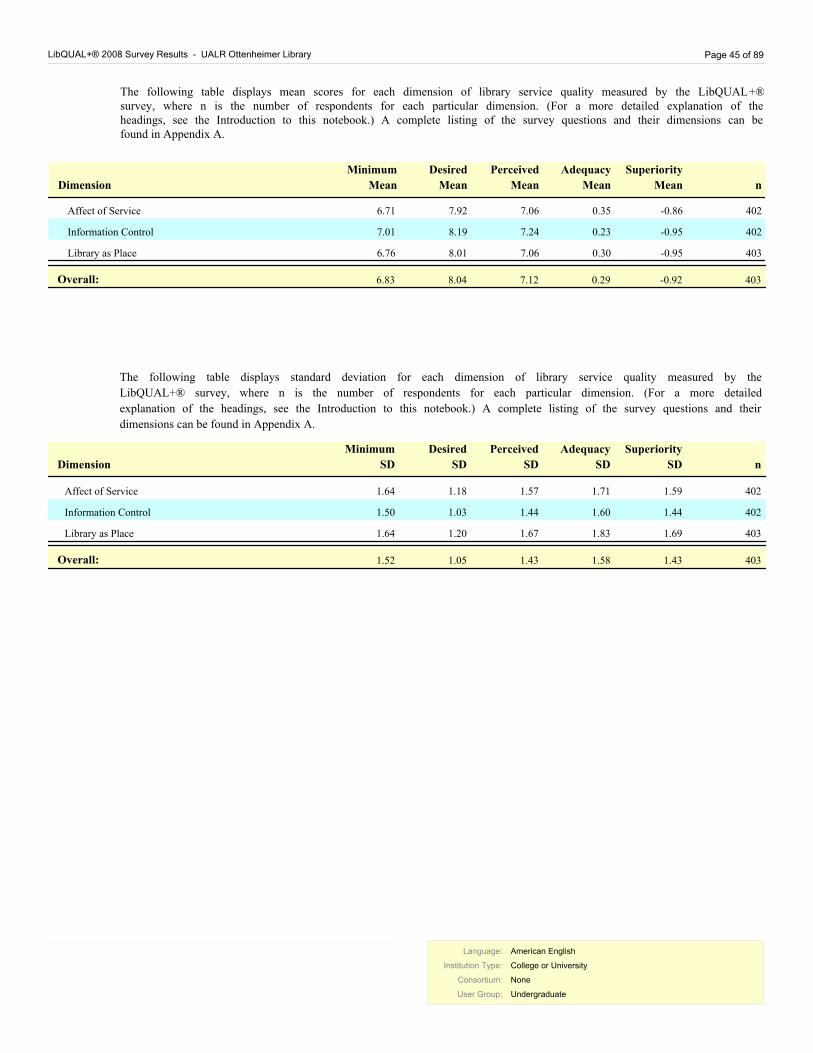
LibQUAL+® 2008 Survey Results - UALR Ottenheimer Library Page 45 of 89
The following table displays mean scores for each dimension of library service quality measured by the LibQUAL+® survey, where n is the number of respondents for each particular dimension. (For a more detailed explanation of the headings, see the Introduction to this notebook.) A complete listing of the survey questions and their dimensions can be found in Appendix A.
Adequacy
Mean
Perceived
Mean
Desired
MeanDimension
Minimum
Mean n
Superiority
Mean
Affect of Service 6.71 7.92 7.06 0.35 402-0.86
Information Control 7.01 8.19 7.24 0.23 402-0.95
Library as Place 6.76 8.01 7.06 0.30 403-0.95
6.83 8.04 7.12 0.29 403-0.92Overall:
Adequacy
SD
Perceived
SD
Desired
SDDimension
Minimum
SD n
Superiority
SD
Affect of Service 402 1.64 1.59 1.71 1.57 1.18
Information Control 402 1.50 1.44 1.60 1.44 1.03
Library as Place 403 1.64 1.69 1.83 1.67 1.20
The following table displays standard deviation for each dimension of library service quality measured by the
LibQUAL+® survey, where n is the number of respondents for each particular dimension. (For a more detailed
explanation of the headings, see the Introduction to this notebook.) A complete listing of the survey questions and their
dimensions can be found in Appendix A.
403Overall: 1.52 1.43 1.58 1.43 1.05
Language:
Institution Type:
Consortium:
User Group:
American English
College or University
None
Undergraduate
Language:
Institution Type:
Consortium:
User Group:
American English
College or University
None
Undergraduate
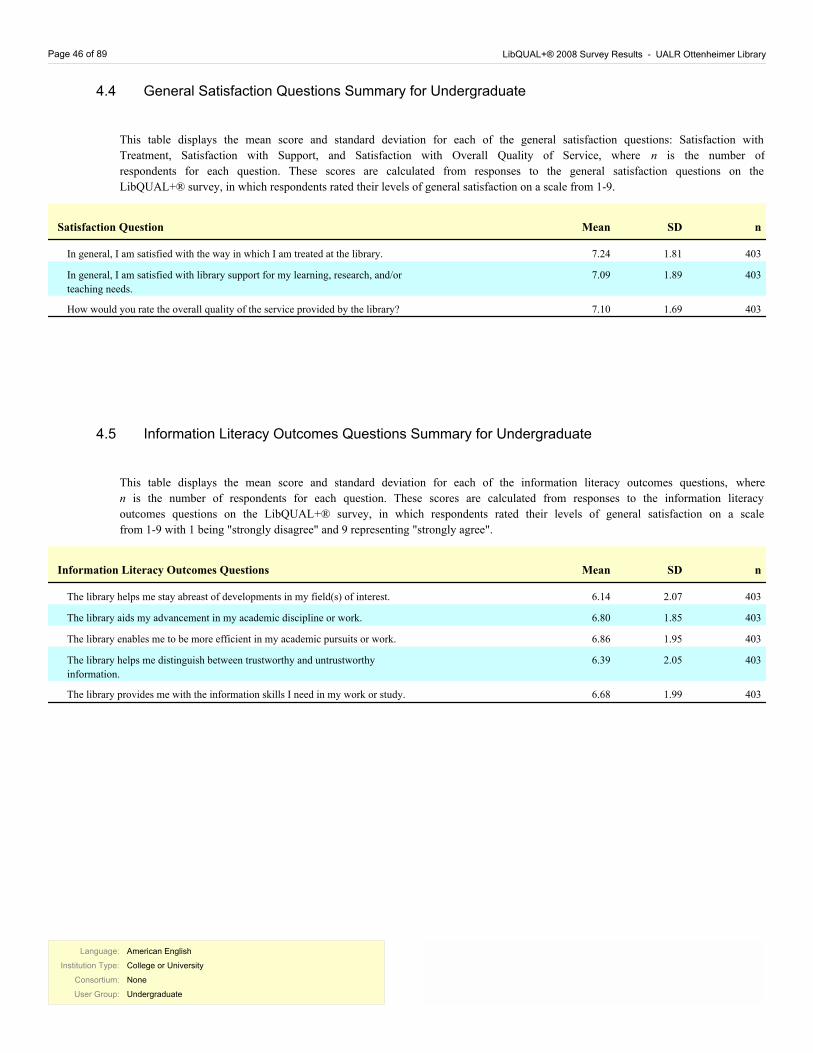
Page 46 of 89 LibQUAL+® 2008 Survey Results - UALR Ottenheimer Library
4.4 General Satisfaction Questions Summary for Undergraduate
MeanSatisfaction Question nSD
In general, I am satisfied with the way in which I am treated at the library. 7.24 403 1.81
In general, I am satisfied with library support for my learning, research, and/or
teaching needs.
7.09 403 1.89
How would you rate the overall quality of the service provided by the library? 7.10 403 1.69
This table displays the mean score and standard deviation for each of the general satisfaction questions: Satisfaction with
Treatment, Satisfaction with Support, and Satisfaction with Overall Quality of Service, where n is the number of
respondents for each question. These scores are calculated from responses to the general satisfaction questions on the
LibQUAL+® survey, in which respondents rated their levels of general satisfaction on a scale from 1-9.
4.5 Information Literacy Outcomes Questions Summary for Undergraduate
MeanInformation Literacy Outcomes Questions nSD
The library helps me stay abreast of developments in my field(s) of interest. 6.14 403 2.07
The library aids my advancement in my academic discipline or work. 6.80 403 1.85
The library enables me to be more efficient in my academic pursuits or work. 6.86 403 1.95
The library helps me distinguish between trustworthy and untrustworthy
information.
6.39 403 2.05
The library provides me with the information skills I need in my work or study. 6.68 403 1.99
This table displays the mean score and standard deviation for each of the information literacy outcomes questions, where
n is the number of respondents for each question. These scores are calculated from responses to the information literacy
outcomes questions on the LibQUAL+® survey, in which respondents rated their levels of general satisfaction on a scale
from 1-9 with 1 being "strongly disagree" and 9 representing "strongly agree".
Language:
Institution Type:
Consortium:
User Group:
American English
College or University
None
Undergraduate
Language:
Institution Type:
Consortium:
User Group:
American English
College or University
None
Undergraduate
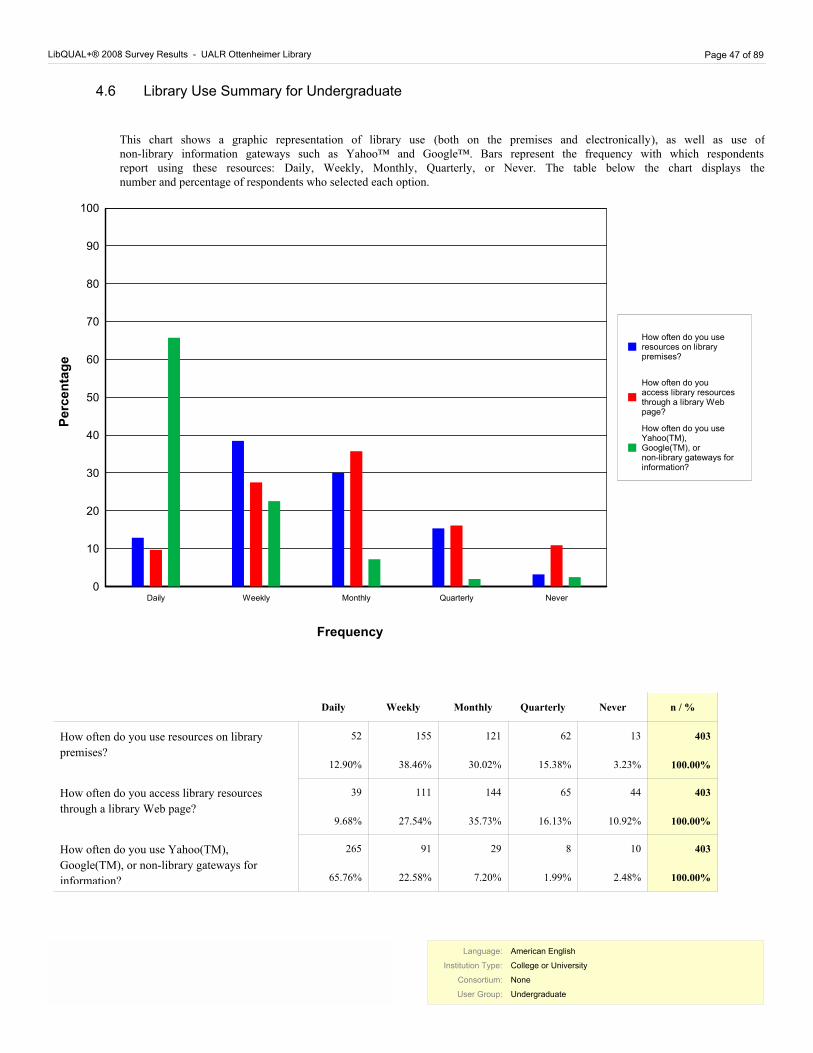
LibQUAL+® 2008 Survey Results - UALR Ottenheimer Library Page 47 of 89
4.6 Library Use Summary for Undergraduate
This chart shows a graphic representation of library use (both on the premises and electronically), as well as use of non-library information gateways such as Yahoo™ and Google™. Bars represent the frequency with which respondents report using these resources: Daily, Weekly, Monthly, Quarterly, or Never. The table below the chart displays the number and percentage of respondents who selected each option.
0
10
20
30
40
50
60
70
80
90
100
Daily
Weekly
Monthly
Quarterly
Never
How often do you use
resources on library
premises?
How often do you
access library resources
through a library Web
page?
How often do you use
Yahoo(TM),
Google(TM), or
non-library gateways for
information?
Frequency
P
erc
en
tag
e
Daily Weekly Monthly Quarterly Never n / %
How often do you use resources on library
premises?
52
12.90%
155
38.46%
121
30.02%
62
15.38%
13
3.23%
403
100.00%
How often do you access library resources
through a library Web page?
39
9.68%
111
27.54%
144
35.73%
65
16.13%
44
10.92%
403
100.00%
How often do you use Yahoo(TM),
Google(TM), or non-library gateways for
information?
265
65.76%
91
22.58%
29
7.20%
8
1.99%
10
2.48%
403
100.00%
Language:
Institution Type:
Consortium:
User Group:
American English
College or University
None
Undergraduate
Language:
Institution Type:
Consortium:
User Group:
American English
College or University
None
Undergraduate
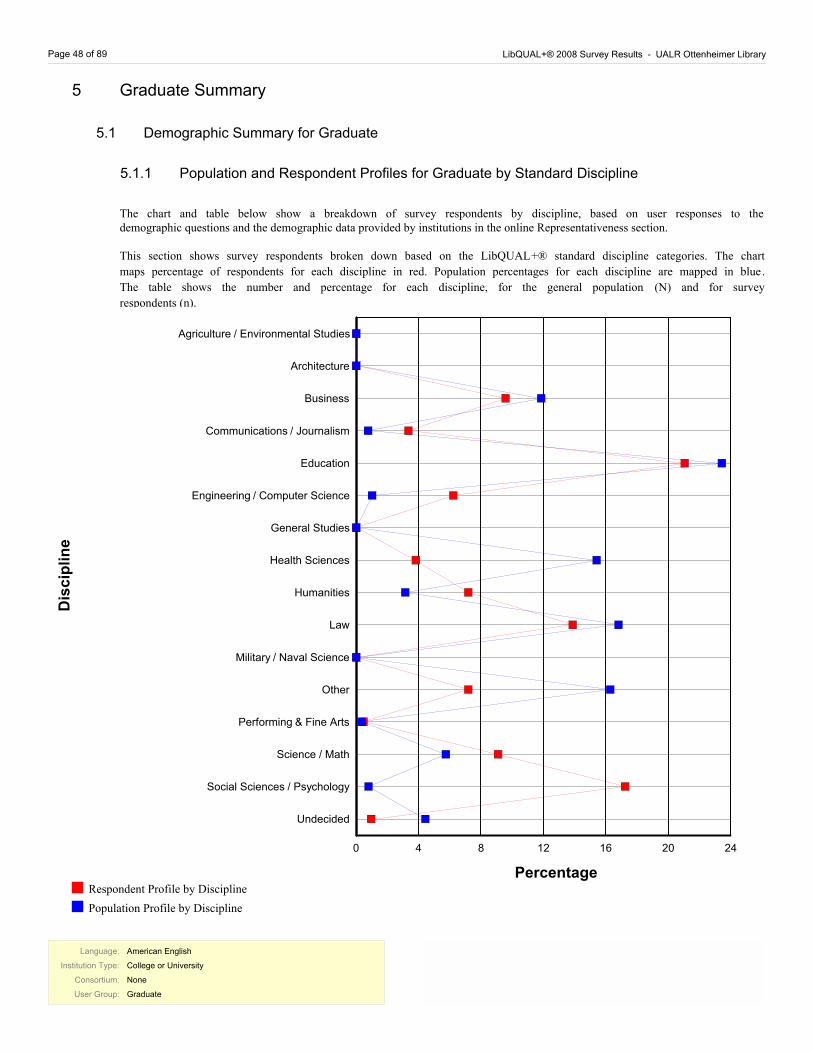
Page 48 of 89 LibQUAL+® 2008 Survey Results - UALR Ottenheimer Library
5 Graduate Summary
5.1 Demographic Summary for Graduate
5.1.1 Population and Respondent Profiles for Graduate by Standard Discipline
The chart and table below show a breakdown of survey respondents by discipline, based on user responses to the demographic questions and the demographic data provided by institutions in the online Representativeness section.
This section shows survey respondents broken down based on the LibQUAL+® standard discipline categories. The chart
maps percentage of respondents for each discipline in red. Population percentages for each discipline are mapped in blue.
The table shows the number and percentage for each discipline, for the general population (N) and for survey
respondents (n).
0
4
8
12
16
20
24
Agriculture / Environmental Studies
Architecture
Business
Communications / Journalism
Education
Engineering / Computer Science
General Studies
Health Sciences
Humanities
Law
Military / Naval Science
Other
Performing & Fine Arts
Science / Math
Social Sciences / Psychology
Undecided
D
isc
ipli
ne
Percentage
Population Profile by Discipline
Respondent Profile by Discipline
Language:
Institution Type:
Consortium:
User Group:
American English
College or University
None
Graduate
Language:
Institution Type:
Consortium:
User Group:
American English
College or University
None
Graduate
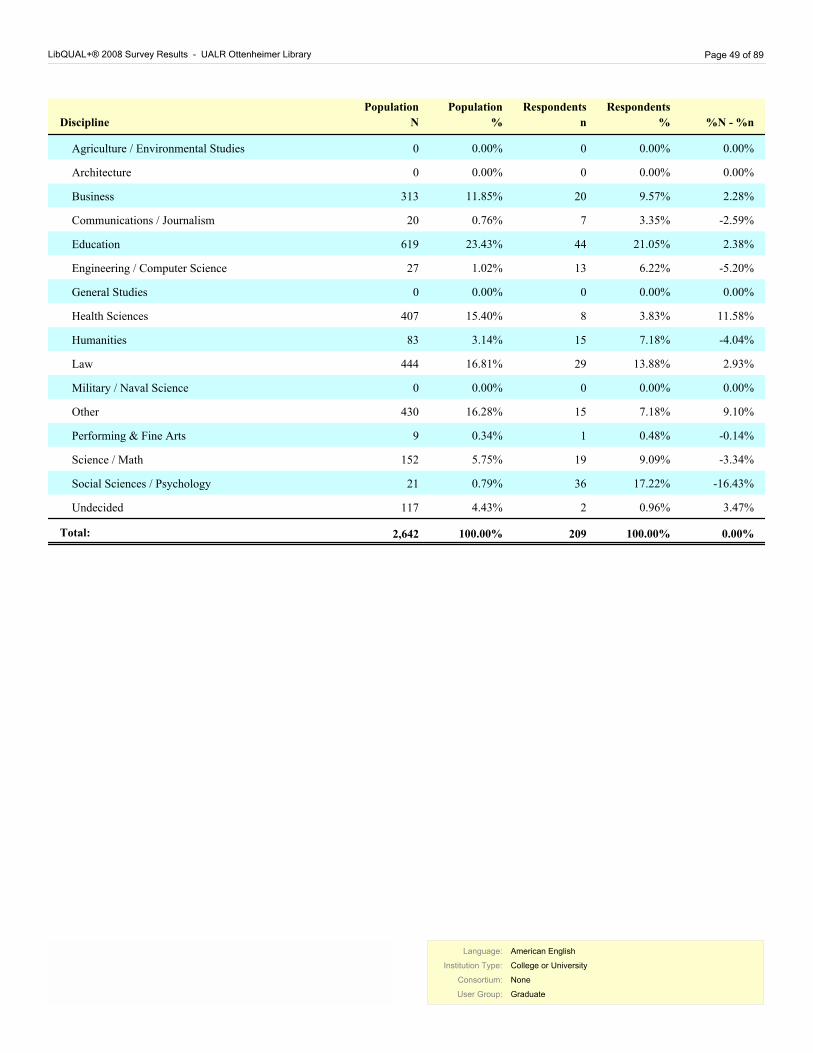
LibQUAL+® 2008 Survey Results - UALR Ottenheimer Library Page 49 of 89
Respondents
nDiscipline
Respondents
%
Population
N
Population
% %N - %n
Agriculture / Environmental Studies 0 0.00% 0 0.00% 0.00%
Architecture 0 0.00% 0 0.00% 0.00%
Business 20 9.57% 313 11.85% 2.28%
Communications / Journalism 7 3.35% 20 0.76% -2.59%
Education 44 21.05% 619 23.43% 2.38%
Engineering / Computer Science 13 6.22% 27 1.02% -5.20%
General Studies 0 0.00% 0 0.00% 0.00%
Health Sciences 8 3.83% 407 15.40% 11.58%
Humanities 15 7.18% 83 3.14% -4.04%
Law 29 13.88% 444 16.81% 2.93%
Military / Naval Science 0 0.00% 0 0.00% 0.00%
Other 15 7.18% 430 16.28% 9.10%
Performing & Fine Arts 1 0.48% 9 0.34% -0.14%
Science / Math 19 9.09% 152 5.75% -3.34%
Social Sciences / Psychology 36 17.22% 21 0.79% -16.43%
Undecided 2 0.96% 117 4.43% 3.47%
Total: 100.00% 2,642 209 100.00% 0.00%
Language:
Institution Type:
Consortium:
User Group:
American English
College or University
None
Graduate
Language:
Institution Type:
Consortium:
User Group:
American English
College or University
None
Graduate
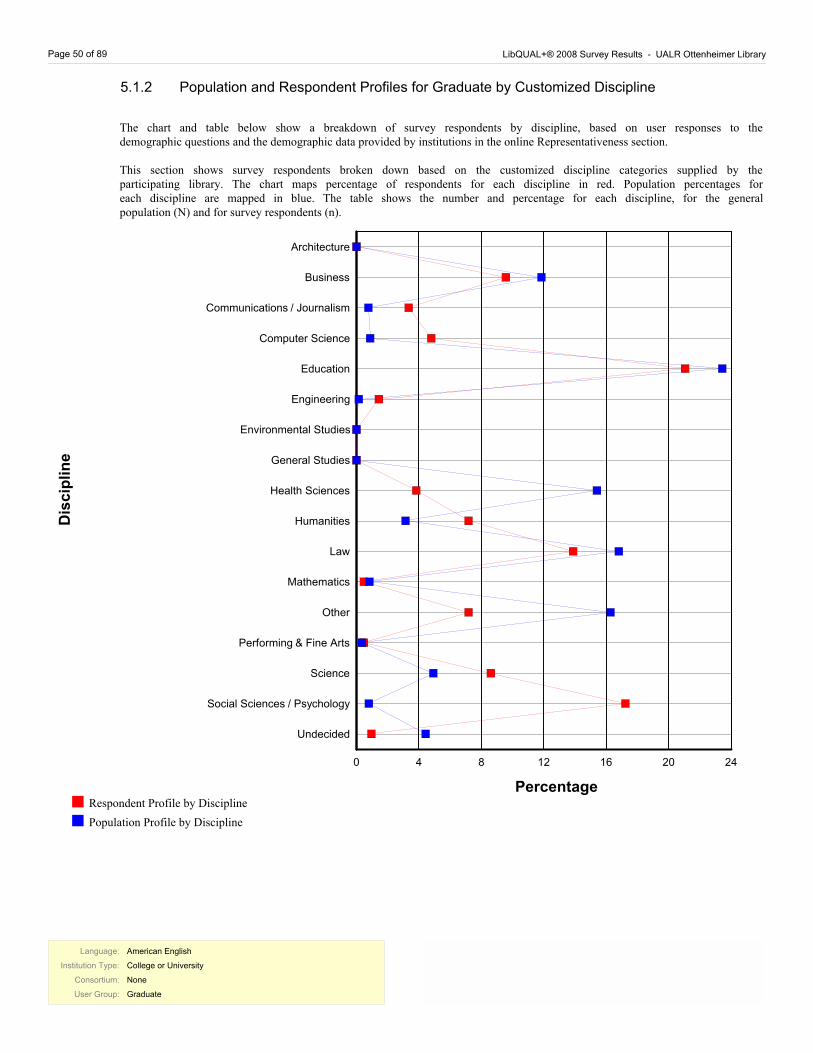
Page 50 of 89 LibQUAL+® 2008 Survey Results - UALR Ottenheimer Library
5.1.2 Population and Respondent Profiles for Graduate by Customized Discipline
The chart and table below show a breakdown of survey respondents by discipline, based on user responses to the demographic questions and the demographic data provided by institutions in the online Representativeness section.
This section shows survey respondents broken down based on the customized discipline categories supplied by the participating library. The chart maps percentage of respondents for each discipline in red. Population percentages for each discipline are mapped in blue. The table shows the number and percentage for each discipline, for the general population (N) and for survey respondents (n).
0
4
8
12
16
20
24
Architecture
Business
Communications / Journalism
Computer Science
Education
Engineering
Environmental Studies
General Studies
Health Sciences
Humanities
Law
Mathematics
Other
Performing & Fine Arts
Science
Social Sciences / Psychology
Undecided
D
isc
ipli
ne
Percentage
Population Profile by Discipline
Respondent Profile by Discipline
Language:
Institution Type:
Consortium:
User Group:
American English
College or University
None
Graduate
Language:
Institution Type:
Consortium:
User Group:
American English
College or University
None
Graduate
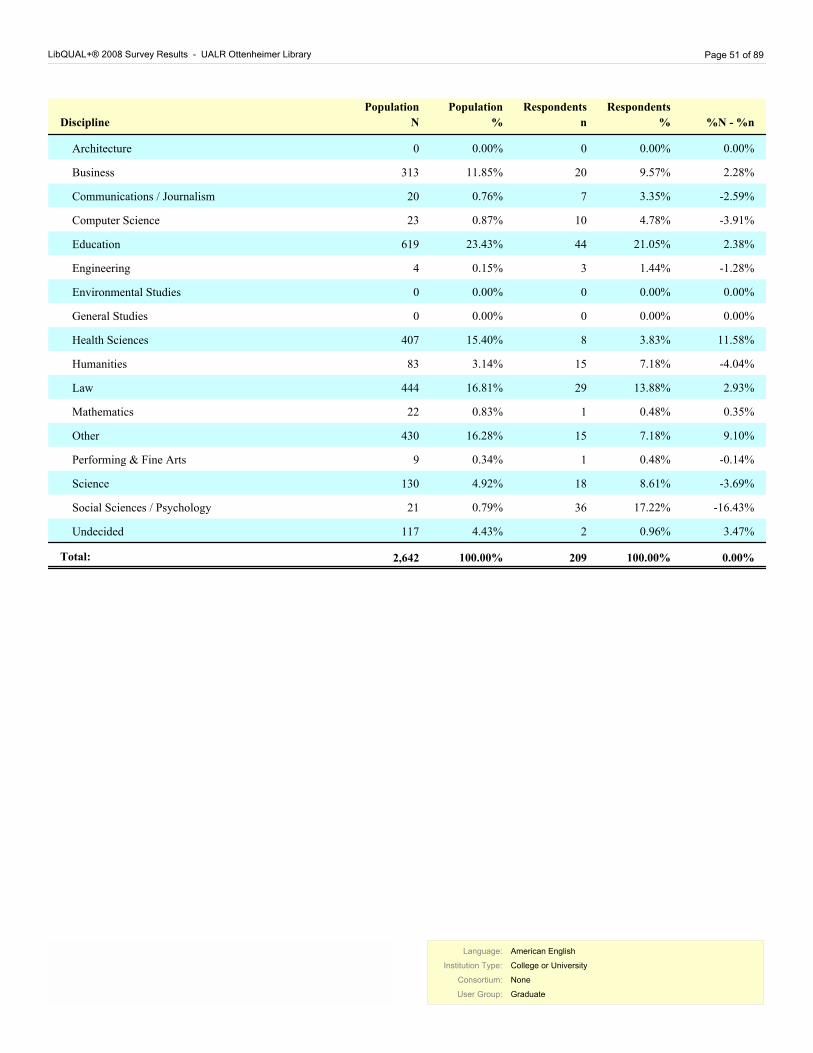
LibQUAL+® 2008 Survey Results - UALR Ottenheimer Library Page 51 of 89
Respondents
nDiscipline
Respondents
%
Population
N
Population
% %N - %n
Architecture 0 0.00% 0 0.00% 0.00%
Business 20 9.57% 313 11.85% 2.28%
Communications / Journalism 7 3.35% 20 0.76% -2.59%
Computer Science 10 4.78% 23 0.87% -3.91%
Education 44 21.05% 619 23.43% 2.38%
Engineering 3 1.44% 4 0.15% -1.28%
Environmental Studies 0 0.00% 0 0.00% 0.00%
General Studies 0 0.00% 0 0.00% 0.00%
Health Sciences 8 3.83% 407 15.40% 11.58%
Humanities 15 7.18% 83 3.14% -4.04%
Law 29 13.88% 444 16.81% 2.93%
Mathematics 1 0.48% 22 0.83% 0.35%
Other 15 7.18% 430 16.28% 9.10%
Performing & Fine Arts 1 0.48% 9 0.34% -0.14%
Science 18 8.61% 130 4.92% -3.69%
Social Sciences / Psychology 36 17.22% 21 0.79% -16.43%
Undecided 2 0.96% 117 4.43% 3.47%
Total: 100.00% 2,642 209 100.00% 0.00%
Language:
Institution Type:
Consortium:
User Group:
American English
College or University
None
Graduate
Language:
Institution Type:
Consortium:
User Group:
American English
College or University
None
Graduate
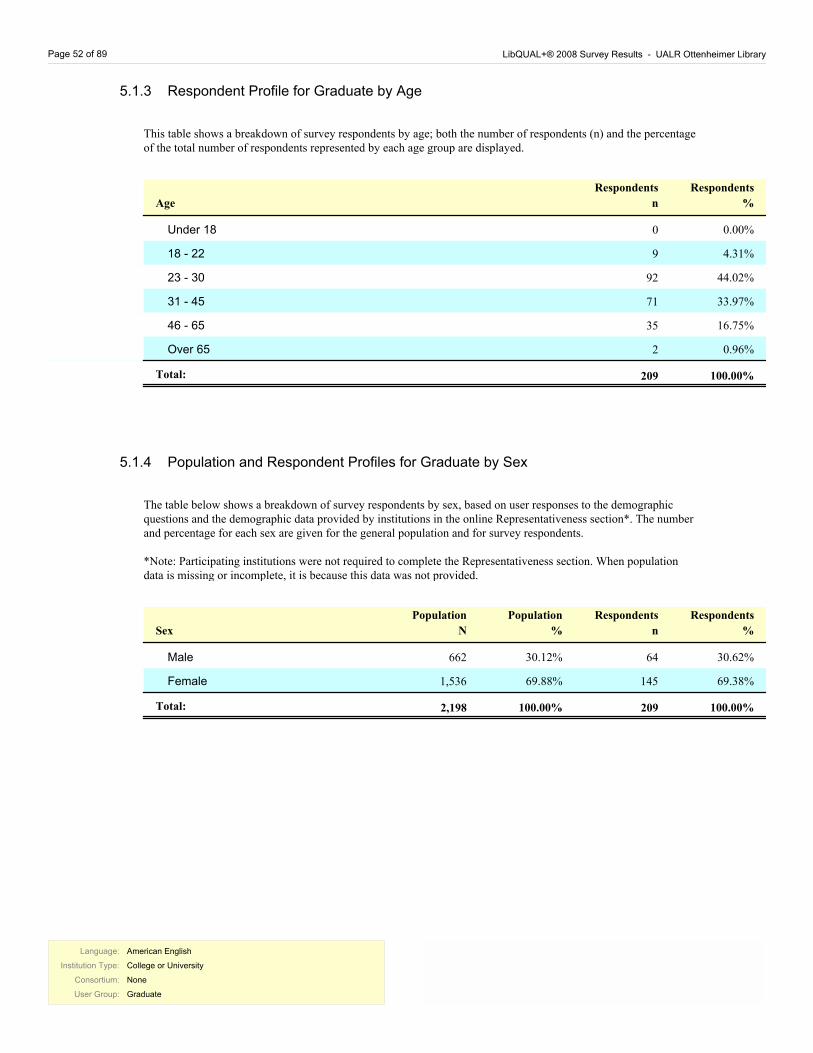
Page 52 of 89 LibQUAL+® 2008 Survey Results - UALR Ottenheimer Library
5.1.3 Respondent Profile for Graduate by Age
This table shows a breakdown of survey respondents by age; both the number of respondents (n) and the percentage of the total number of respondents represented by each age group are displayed.
Respondents
%
Respondents
nAge
Under 18 0 0.00%
18 - 22 9 4.31%
23 - 30 92 44.02%
31 - 45 71 33.97%
46 - 65 35 16.75%
Over 65 2 0.96%
Total: 100.00% 209
5.1.4 Population and Respondent Profiles for Graduate by Sex
The table below shows a breakdown of survey respondents by sex, based on user responses to the demographic questions and the demographic data provided by institutions in the online Representativeness section*. The number and percentage for each sex are given for the general population and for survey respondents.
*Note: Participating institutions were not required to complete the Representativeness section. When population data is missing or incomplete, it is because this data was not provided.
Respondents
%
Respondents
n
Population
%
Population
NSex
Male 64 30.62%30.12% 662
Female 145 69.38%69.88% 1,536
Total: 100.00% 209 2,198 100.00%
Language:
Institution Type:
Consortium:
User Group:
American English
College or University
None
Graduate
Language:
Institution Type:
Consortium:
User Group:
American English
College or University
None
Graduate
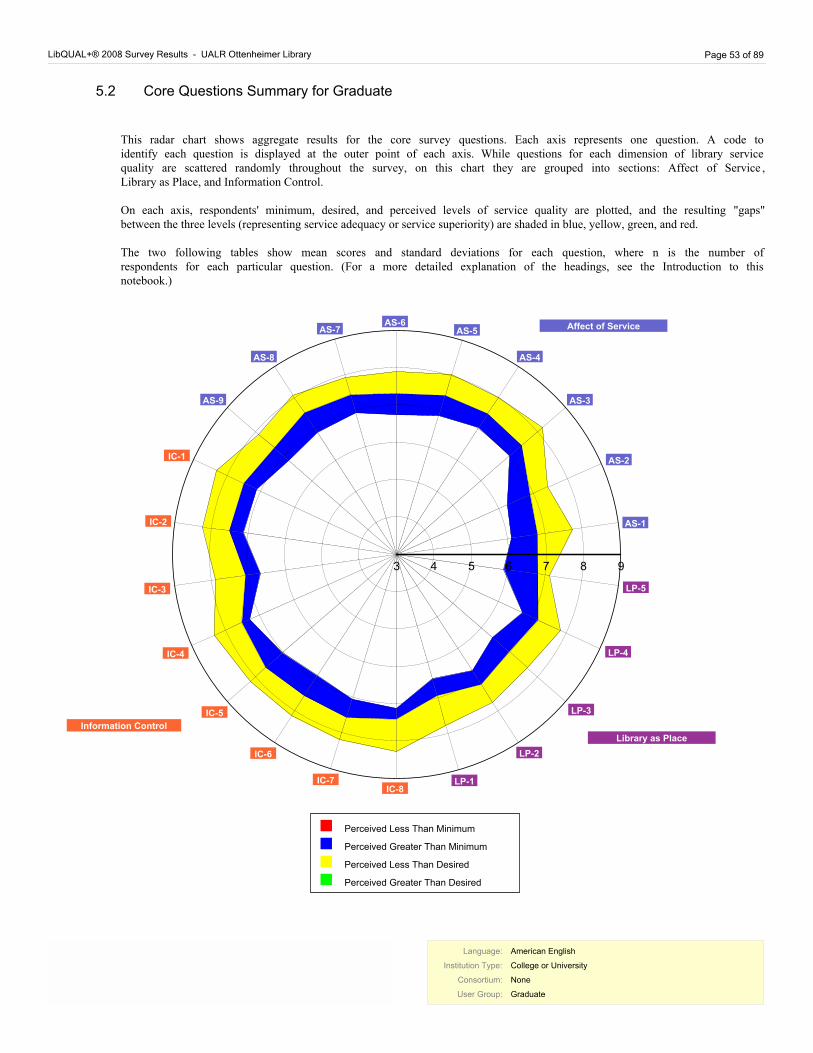
LibQUAL+® 2008 Survey Results - UALR Ottenheimer Library Page 53 of 89
5.2 Core Questions Summary for Graduate
This radar chart shows aggregate results for the core survey questions. Each axis represents one question. A code to identify each question is displayed at the outer point of each axis. While questions for each dimension of library service quality are scattered randomly throughout the survey, on this chart they are grouped into sections: Affect of Service , Library as Place, and Information Control.
On each axis, respondents' minimum, desired, and perceived levels of service quality are plotted, and the resulting "gaps" between the three levels (representing service adequacy or service superiority) are shaded in blue, yellow, green, and red.
The two following tables show mean scores and standard deviations for each question, where n is the number of respondents for each particular question. (For a more detailed explanation of the headings, see the Introduction to this notebook.)
3
4
5
6
7
8
9
AS-1
AS-2
AS-3
AS-4
AS-5AS-6
AS-7
AS-8
AS-9
IC-1
IC-2
IC-3
IC-4
IC-5
IC-6
IC-7IC-8
LP-1
LP-2
LP-3
LP-4
LP-5
Affect of Service
Information Control
Library as Place
Perceived Less Than Minimum
Perceived Greater Than Minimum
Perceived Less Than Desired
Perceived Greater Than Desired
Language:
Institution Type:
Consortium:
User Group:
American English
College or University
None
Graduate
Language:
Institution Type:
Consortium:
User Group:
American English
College or University
None
Graduate
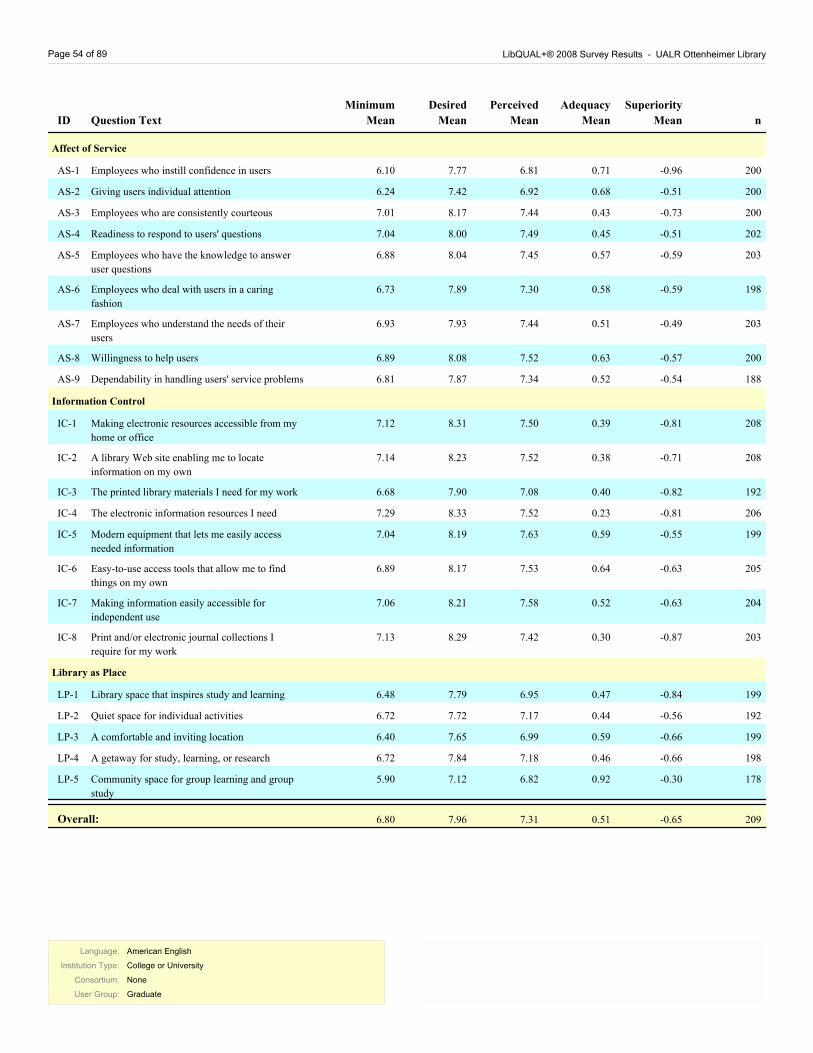
Page 54 of 89 LibQUAL+® 2008 Survey Results - UALR Ottenheimer Library
Adequacy
Mean
Perceived
Mean
Desired
MeanQuestion TextID
Minimum
Mean n
Superiority
Mean
Affect of Service
Employees who instill confidence in users 6.10 7.77 6.81 0.71AS-1 200-0.96
Giving users individual attention 6.24 7.42 6.92 0.68AS-2 200-0.51
Employees who are consistently courteous 7.01 8.17 7.44 0.43AS-3 200-0.73
Readiness to respond to users' questions 7.04 8.00 7.49 0.45AS-4 202-0.51
Employees who have the knowledge to answer
user questions
6.88 8.04 7.45 0.57AS-5 203-0.59
Employees who deal with users in a caring
fashion
6.73 7.89 7.30 0.58AS-6 198-0.59
Employees who understand the needs of their
users
6.93 7.93 7.44 0.51AS-7 203-0.49
Willingness to help users 6.89 8.08 7.52 0.63AS-8 200-0.57
Dependability in handling users' service problems 6.81 7.87 7.34 0.52AS-9 188-0.54
Information Control
Making electronic resources accessible from my
home or office
7.12 8.31 7.50 0.39IC-1 208-0.81
A library Web site enabling me to locate
information on my own
7.14 8.23 7.52 0.38IC-2 208-0.71
The printed library materials I need for my work 6.68 7.90 7.08 0.40IC-3 192-0.82
The electronic information resources I need 7.29 8.33 7.52 0.23IC-4 206-0.81
Modern equipment that lets me easily access
needed information
7.04 8.19 7.63 0.59IC-5 199-0.55
Easy-to-use access tools that allow me to find
things on my own
6.89 8.17 7.53 0.64IC-6 205-0.63
Making information easily accessible for
independent use
7.06 8.21 7.58 0.52IC-7 204-0.63
Print and/or electronic journal collections I
require for my work
7.13 8.29 7.42 0.30IC-8 203-0.87
Library as Place
Library space that inspires study and learning 6.48 7.79 6.95 0.47LP-1 199-0.84
Quiet space for individual activities 6.72 7.72 7.17 0.44LP-2 192-0.56
A comfortable and inviting location 6.40 7.65 6.99 0.59LP-3 199-0.66
A getaway for study, learning, or research 6.72 7.84 7.18 0.46LP-4 198-0.66
Community space for group learning and group
study
5.90 7.12 6.82 0.92LP-5 178-0.30
6.80 7.96 7.31 0.51 209-0.65Overall:
Language:
Institution Type:
Consortium:
User Group:
American English
College or University
None
Graduate
Language:
Institution Type:
Consortium:
User Group:
American English
College or University
None
Graduate
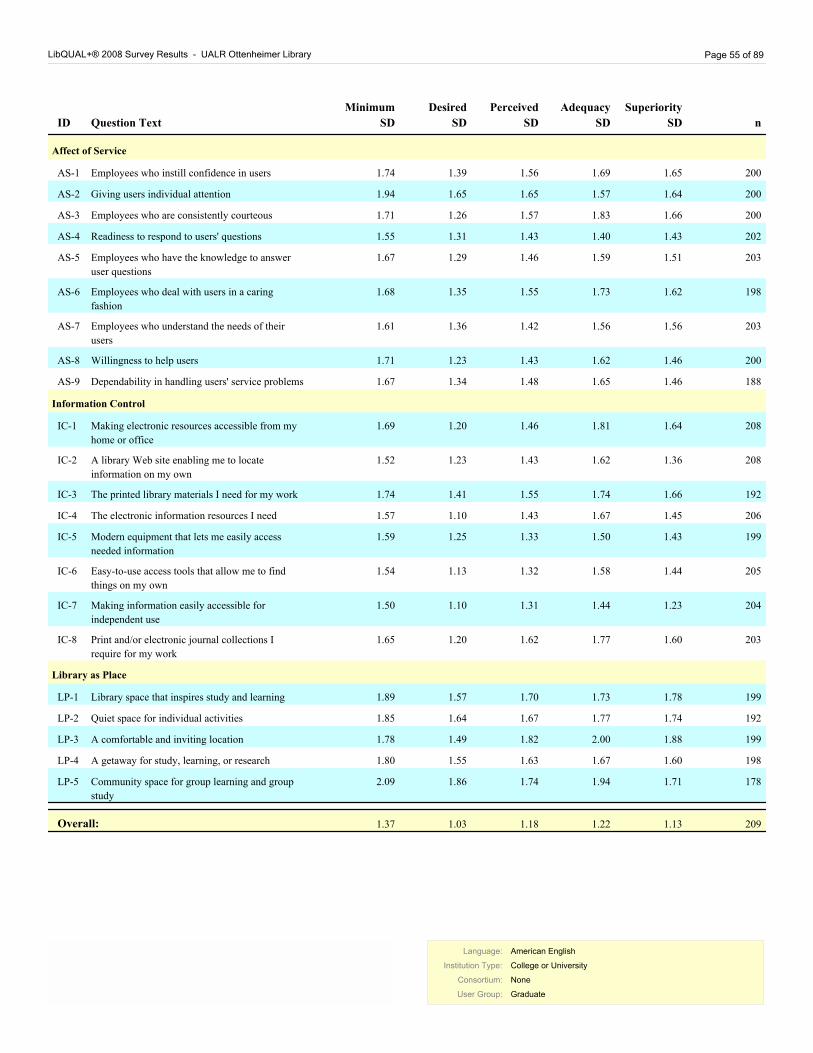
LibQUAL+® 2008 Survey Results - UALR Ottenheimer Library Page 55 of 89
Adequacy
SD
Perceived
SD
Desired
SDQuestion TextID
Minimum
SD n
Superiority
SD
Affect of Service
Employees who instill confidence in usersAS-1 200 1.74 1.65 1.69 1.56 1.39
Giving users individual attentionAS-2 200 1.94 1.64 1.57 1.65 1.65
Employees who are consistently courteousAS-3 200 1.71 1.66 1.83 1.57 1.26
Readiness to respond to users' questionsAS-4 202 1.55 1.43 1.40 1.43 1.31
Employees who have the knowledge to answer
user questions
AS-5 203 1.67 1.51 1.59 1.46 1.29
Employees who deal with users in a caring
fashion
AS-6 198 1.68 1.62 1.73 1.55 1.35
Employees who understand the needs of their
users
AS-7 203 1.61 1.56 1.56 1.42 1.36
Willingness to help usersAS-8 200 1.71 1.46 1.62 1.43 1.23
Dependability in handling users' service problemsAS-9 188 1.67 1.46 1.65 1.48 1.34
Information Control
Making electronic resources accessible from my
home or office
IC-1 208 1.69 1.64 1.81 1.46 1.20
A library Web site enabling me to locate
information on my own
IC-2 208 1.52 1.36 1.62 1.43 1.23
The printed library materials I need for my workIC-3 192 1.74 1.66 1.74 1.55 1.41
The electronic information resources I needIC-4 206 1.57 1.45 1.67 1.43 1.10
Modern equipment that lets me easily access
needed information
IC-5 199 1.59 1.43 1.50 1.33 1.25
Easy-to-use access tools that allow me to find
things on my own
IC-6 205 1.54 1.44 1.58 1.32 1.13
Making information easily accessible for
independent use
IC-7 204 1.50 1.23 1.44 1.31 1.10
Print and/or electronic journal collections I
require for my work
IC-8 203 1.65 1.60 1.77 1.62 1.20
Library as Place
Library space that inspires study and learningLP-1 199 1.89 1.78 1.73 1.70 1.57
Quiet space for individual activitiesLP-2 192 1.85 1.74 1.77 1.67 1.64
A comfortable and inviting locationLP-3 199 1.78 1.88 2.00 1.82 1.49
A getaway for study, learning, or researchLP-4 198 1.80 1.60 1.67 1.63 1.55
Community space for group learning and group
study
LP-5 178 2.09 1.71 1.94 1.74 1.86
209Overall: 1.37 1.13 1.22 1.18 1.03
Language:
Institution Type:
Consortium:
User Group:
American English
College or University
None
Graduate
Language:
Institution Type:
Consortium:
User Group:
American English
College or University
None
Graduate
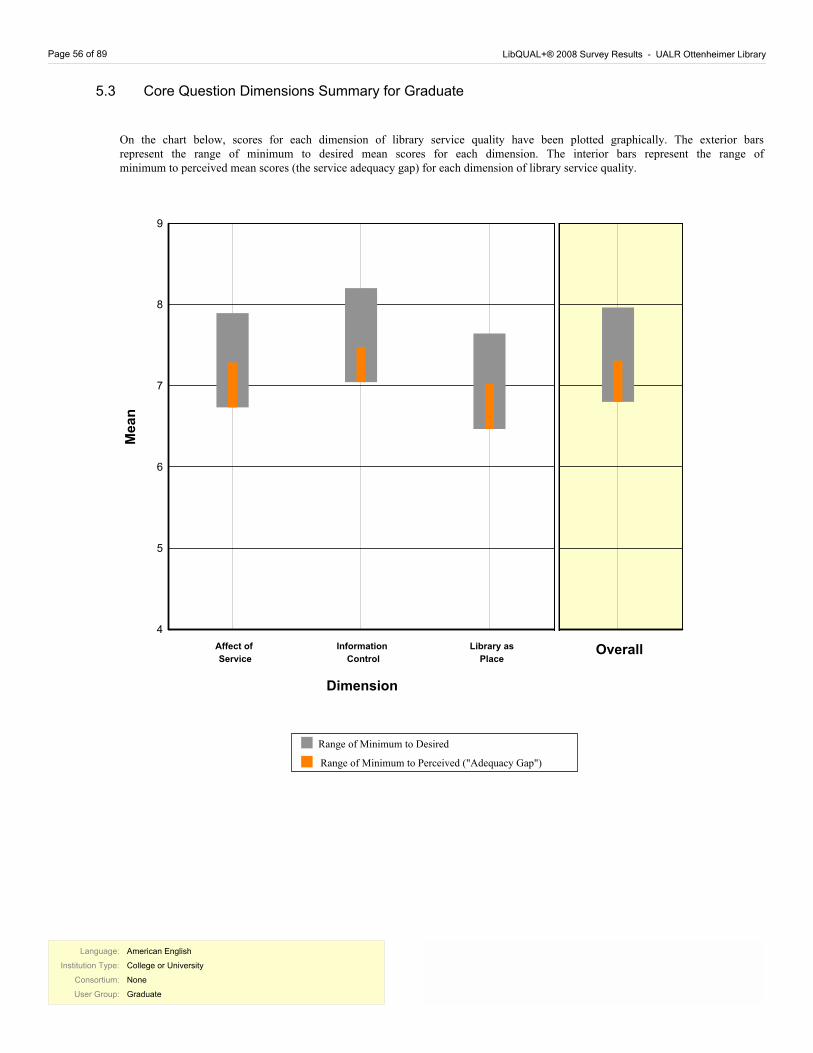
Page 56 of 89 LibQUAL+® 2008 Survey Results - UALR Ottenheimer Library
5.3 Core Question Dimensions Summary for Graduate
On the chart below, scores for each dimension of library service quality have been plotted graphically. The exterior bars represent the range of minimum to desired mean scores for each dimension. The interior bars represent the range of minimum to perceived mean scores (the service adequacy gap) for each dimension of library service quality.
4
5
6
7
8
9
Information
Control
Affect of
Service
Library as
Place
Range of Minimum to Perceived ("Adequacy Gap")
Range of Minimum to Desired
Me
an
Dimension
Overall
Language:
Institution Type:
Consortium:
User Group:
American English
College or University
None
Graduate
Language:
Institution Type:
Consortium:
User Group:
American English
College or University
None
Graduate
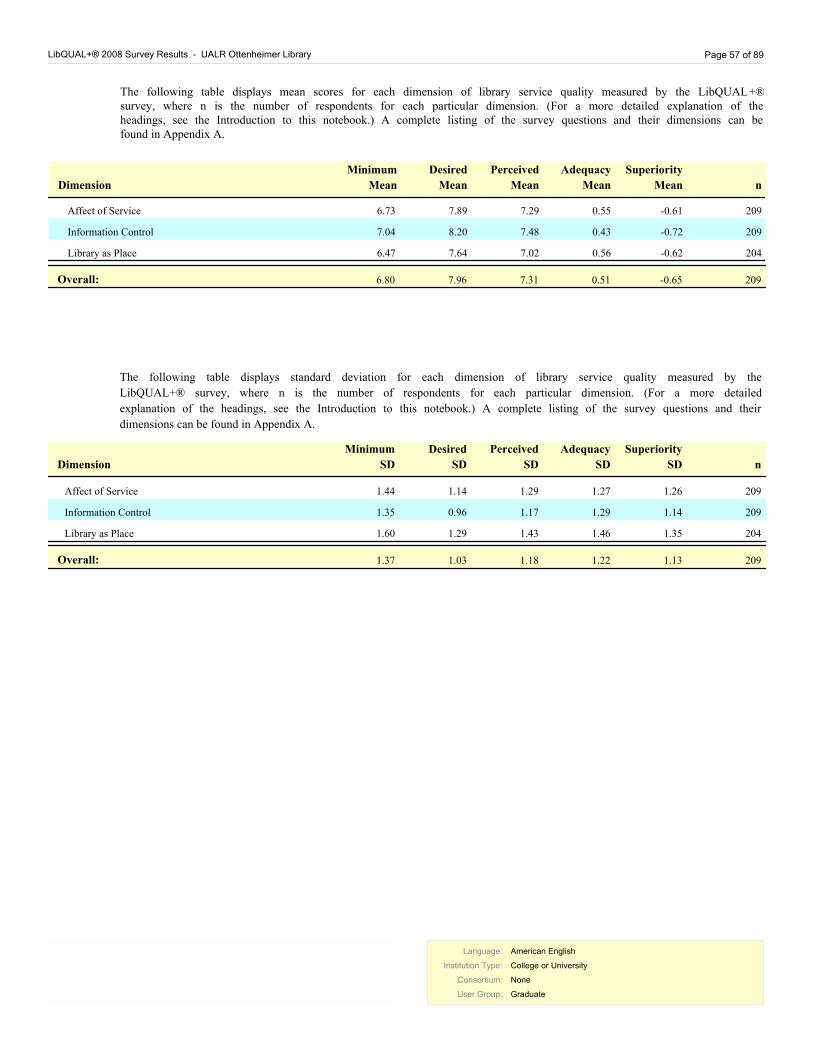
LibQUAL+® 2008 Survey Results - UALR Ottenheimer Library Page 57 of 89
The following table displays mean scores for each dimension of library service quality measured by the LibQUAL+® survey, where n is the number of respondents for each particular dimension. (For a more detailed explanation of the headings, see the Introduction to this notebook.) A complete listing of the survey questions and their dimensions can be found in Appendix A.
Adequacy
Mean
Perceived
Mean
Desired
MeanDimension
Minimum
Mean n
Superiority
Mean
Affect of Service 6.73 7.89 7.29 0.55 209-0.61
Information Control 7.04 8.20 7.48 0.43 209-0.72
Library as Place 6.47 7.64 7.02 0.56 204-0.62
6.80 7.96 7.31 0.51 209-0.65Overall:
Adequacy
SD
Perceived
SD
Desired
SDDimension
Minimum
SD n
Superiority
SD
Affect of Service 209 1.44 1.26 1.27 1.29 1.14
Information Control 209 1.35 1.14 1.29 1.17 0.96
Library as Place 204 1.60 1.35 1.46 1.43 1.29
The following table displays standard deviation for each dimension of library service quality measured by the
LibQUAL+® survey, where n is the number of respondents for each particular dimension. (For a more detailed
explanation of the headings, see the Introduction to this notebook.) A complete listing of the survey questions and their
dimensions can be found in Appendix A.
209Overall: 1.37 1.13 1.22 1.18 1.03
Language:
Institution Type:
Consortium:
User Group:
American English
College or University
None
Graduate
Language:
Institution Type:
Consortium:
User Group:
American English
College or University
None
Graduate
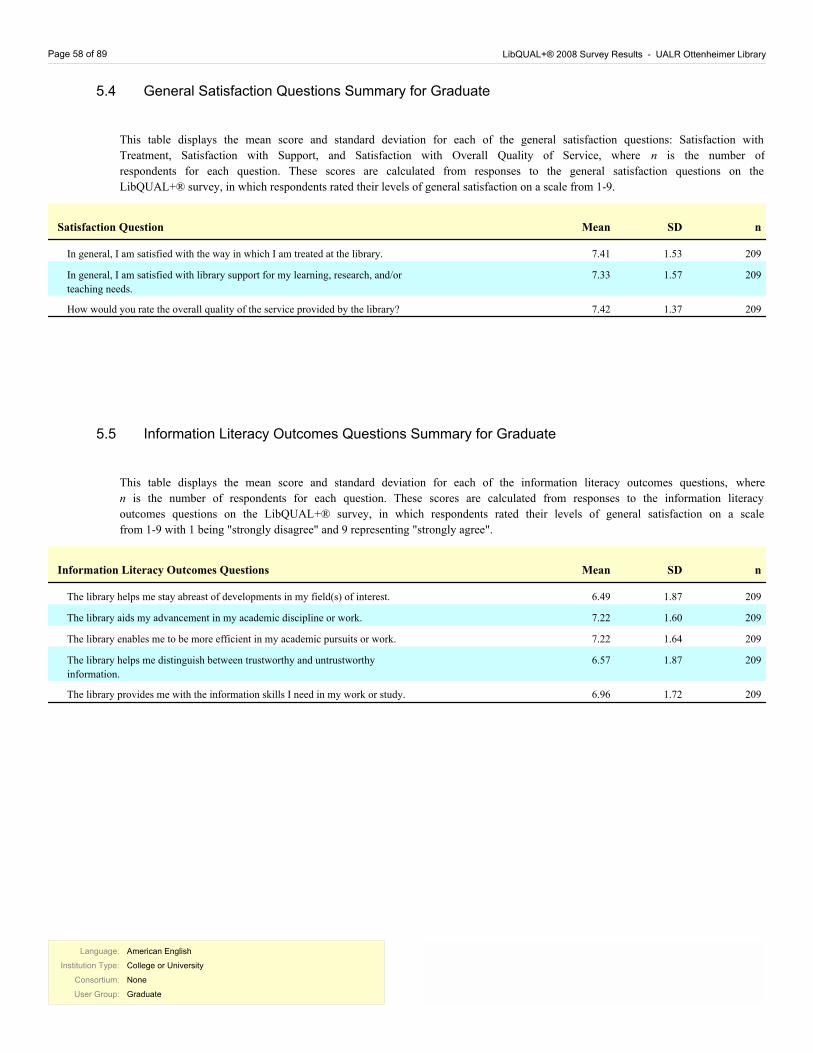
Page 58 of 89 LibQUAL+® 2008 Survey Results - UALR Ottenheimer Library
5.4 General Satisfaction Questions Summary for Graduate
MeanSatisfaction Question nSD
In general, I am satisfied with the way in which I am treated at the library. 7.41 209 1.53
In general, I am satisfied with library support for my learning, research, and/or
teaching needs.
7.33 209 1.57
How would you rate the overall quality of the service provided by the library? 7.42 209 1.37
This table displays the mean score and standard deviation for each of the general satisfaction questions: Satisfaction with
Treatment, Satisfaction with Support, and Satisfaction with Overall Quality of Service, where n is the number of
respondents for each question. These scores are calculated from responses to the general satisfaction questions on the
LibQUAL+® survey, in which respondents rated their levels of general satisfaction on a scale from 1-9.
5.5 Information Literacy Outcomes Questions Summary for Graduate
MeanInformation Literacy Outcomes Questions nSD
The library helps me stay abreast of developments in my field(s) of interest. 6.49 209 1.87
The library aids my advancement in my academic discipline or work. 7.22 209 1.60
The library enables me to be more efficient in my academic pursuits or work. 7.22 209 1.64
The library helps me distinguish between trustworthy and untrustworthy
information.
6.57 209 1.87
The library provides me with the information skills I need in my work or study. 6.96 209 1.72
This table displays the mean score and standard deviation for each of the information literacy outcomes questions, where
n is the number of respondents for each question. These scores are calculated from responses to the information literacy
outcomes questions on the LibQUAL+® survey, in which respondents rated their levels of general satisfaction on a scale
from 1-9 with 1 being "strongly disagree" and 9 representing "strongly agree".
Language:
Institution Type:
Consortium:
User Group:
American English
College or University
None
Graduate
Language:
Institution Type:
Consortium:
User Group:
American English
College or University
None
Graduate
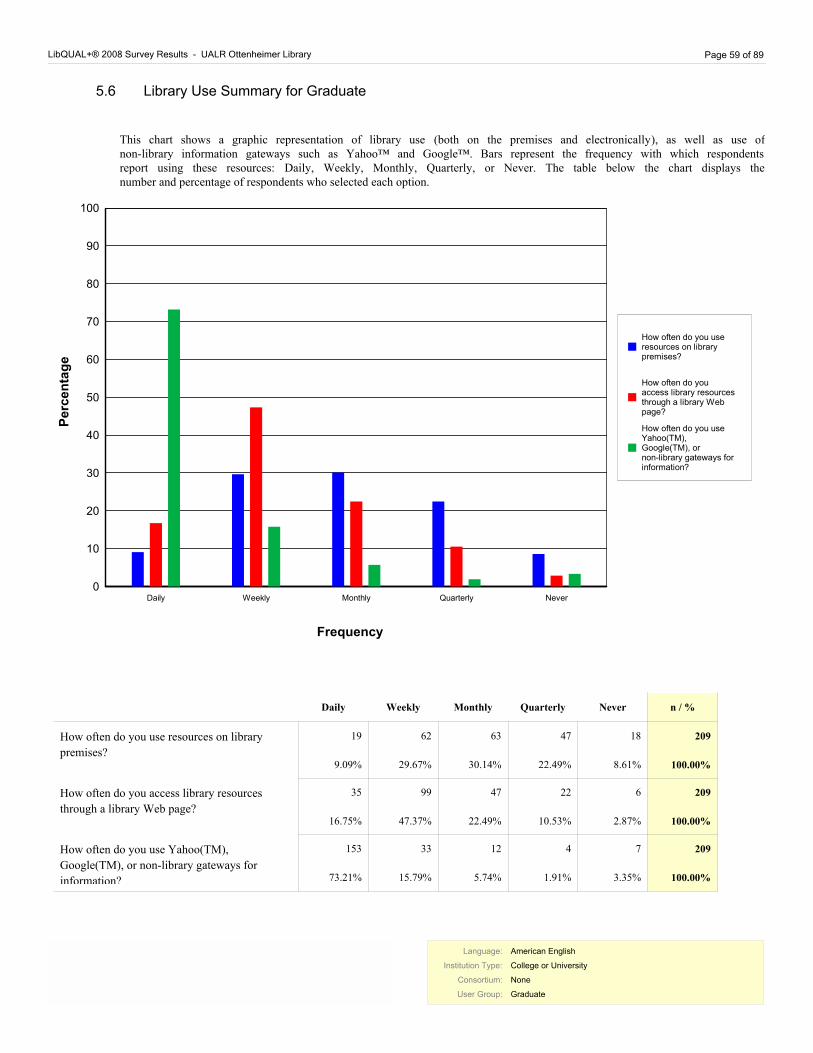
LibQUAL+® 2008 Survey Results - UALR Ottenheimer Library Page 59 of 89
5.6 Library Use Summary for Graduate
This chart shows a graphic representation of library use (both on the premises and electronically), as well as use of non-library information gateways such as Yahoo™ and Google™. Bars represent the frequency with which respondents report using these resources: Daily, Weekly, Monthly, Quarterly, or Never. The table below the chart displays the number and percentage of respondents who selected each option.
0
10
20
30
40
50
60
70
80
90
100
Daily
Weekly
Monthly
Quarterly
Never
How often do you use
resources on library
premises?
How often do you
access library resources
through a library Web
page?
How often do you use
Yahoo(TM),
Google(TM), or
non-library gateways for
information?
Frequency
P
erc
en
tag
e
Daily Weekly Monthly Quarterly Never n / %
How often do you use resources on library
premises?
19
9.09%
62
29.67%
63
30.14%
47
22.49%
18
8.61%
209
100.00%
How often do you access library resources
through a library Web page?
35
16.75%
99
47.37%
47
22.49%
22
10.53%
6
2.87%
209
100.00%
How often do you use Yahoo(TM),
Google(TM), or non-library gateways for
information?
153
73.21%
33
15.79%
12
5.74%
4
1.91%
7
3.35%
209
100.00%
Language:
Institution Type:
Consortium:
User Group:
American English
College or University
None
Graduate
Language:
Institution Type:
Consortium:
User Group:
American English
College or University
None
Graduate
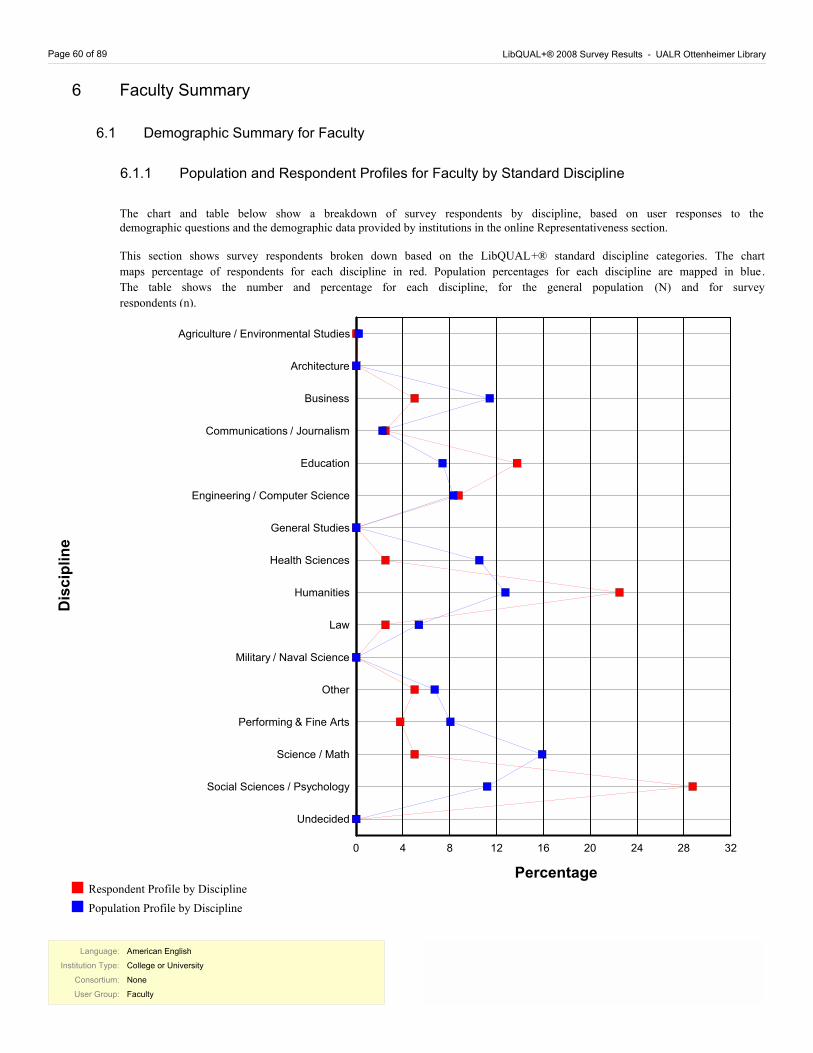
Page 60 of 89 LibQUAL+® 2008 Survey Results - UALR Ottenheimer Library
6 Faculty Summary
6.1 Demographic Summary for Faculty
6.1.1 Population and Respondent Profiles for Faculty by Standard Discipline
The chart and table below show a breakdown of survey respondents by discipline, based on user responses to the demographic questions and the demographic data provided by institutions in the online Representativeness section.
This section shows survey respondents broken down based on the LibQUAL+® standard discipline categories. The chart
maps percentage of respondents for each discipline in red. Population percentages for each discipline are mapped in blue.
The table shows the number and percentage for each discipline, for the general population (N) and for survey
respondents (n).
0
4
8
12
16
20
24
28
32
Agriculture / Environmental Studies
Architecture
Business
Communications / Journalism
Education
Engineering / Computer Science
General Studies
Health Sciences
Humanities
Law
Military / Naval Science
Other
Performing & Fine Arts
Science / Math
Social Sciences / Psychology
Undecided
D
isc
ipli
ne
Percentage
Population Profile by Discipline
Respondent Profile by Discipline
Language:
Institution Type:
Consortium:
User Group:
American English
College or University
None
Faculty
Language:
Institution Type:
Consortium:
User Group:
American English
College or University
None
Faculty
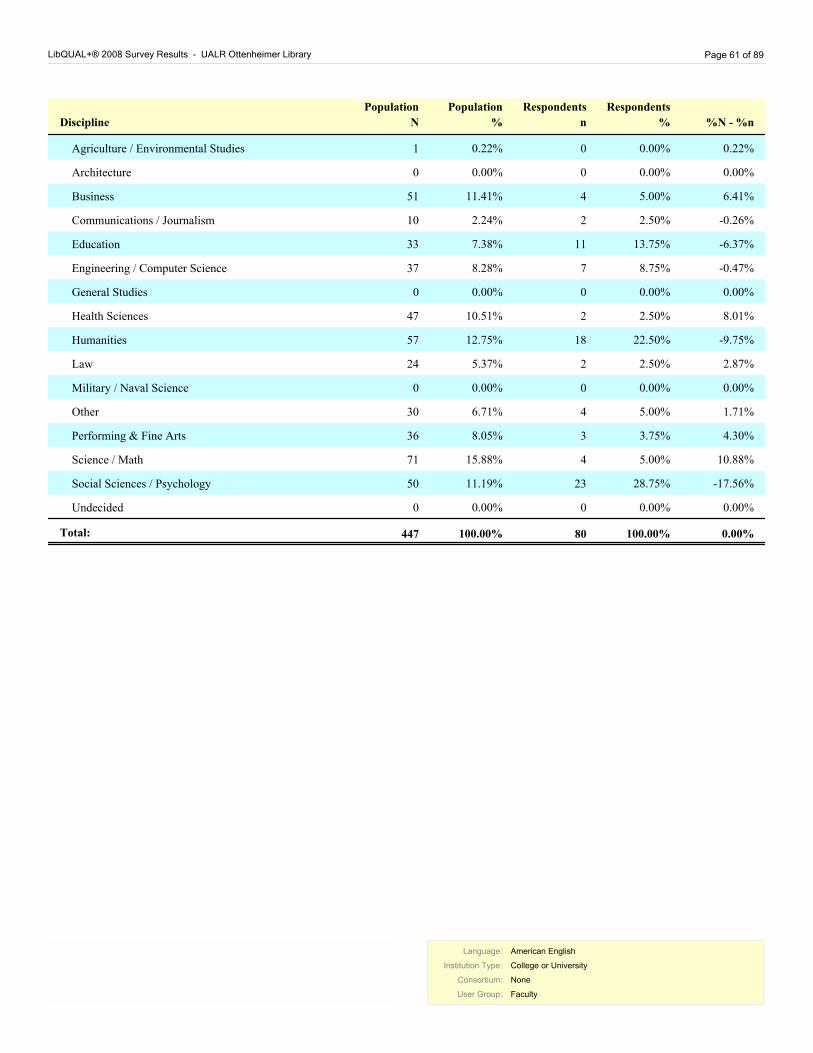
LibQUAL+® 2008 Survey Results - UALR Ottenheimer Library Page 61 of 89
Respondents
nDiscipline
Respondents
%
Population
N
Population
% %N - %n
Agriculture / Environmental Studies 0 0.00% 1 0.22% 0.22%
Architecture 0 0.00% 0 0.00% 0.00%
Business 4 5.00% 51 11.41% 6.41%
Communications / Journalism 2 2.50% 10 2.24% -0.26%
Education 11 13.75% 33 7.38% -6.37%
Engineering / Computer Science 7 8.75% 37 8.28% -0.47%
General Studies 0 0.00% 0 0.00% 0.00%
Health Sciences 2 2.50% 47 10.51% 8.01%
Humanities 18 22.50% 57 12.75% -9.75%
Law 2 2.50% 24 5.37% 2.87%
Military / Naval Science 0 0.00% 0 0.00% 0.00%
Other 4 5.00% 30 6.71% 1.71%
Performing & Fine Arts 3 3.75% 36 8.05% 4.30%
Science / Math 4 5.00% 71 15.88% 10.88%
Social Sciences / Psychology 23 28.75% 50 11.19% -17.56%
Undecided 0 0.00% 0 0.00% 0.00%
Total: 100.00% 447 80 100.00% 0.00%
Language:
Institution Type:
Consortium:
User Group:
American English
College or University
None
Faculty
Language:
Institution Type:
Consortium:
User Group:
American English
College or University
None
Faculty
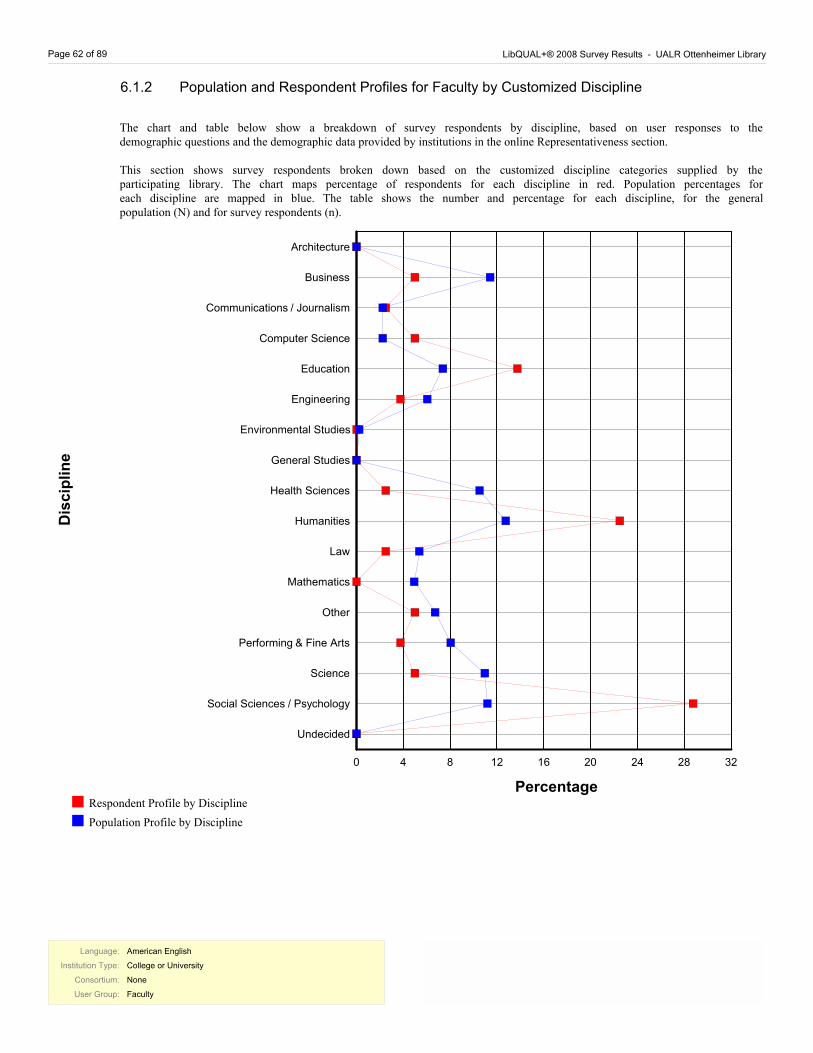
Page 62 of 89 LibQUAL+® 2008 Survey Results - UALR Ottenheimer Library
6.1.2 Population and Respondent Profiles for Faculty by Customized Discipline
The chart and table below show a breakdown of survey respondents by discipline, based on user responses to the demographic questions and the demographic data provided by institutions in the online Representativeness section.
This section shows survey respondents broken down based on the customized discipline categories supplied by the participating library. The chart maps percentage of respondents for each discipline in red. Population percentages for each discipline are mapped in blue. The table shows the number and percentage for each discipline, for the general population (N) and for survey respondents (n).
0
4
8
12
16
20
24
28
32
Architecture
Business
Communications / Journalism
Computer Science
Education
Engineering
Environmental Studies
General Studies
Health Sciences
Humanities
Law
Mathematics
Other
Performing & Fine Arts
Science
Social Sciences / Psychology
Undecided
D
isc
ipli
ne
Percentage
Population Profile by Discipline
Respondent Profile by Discipline
Language:
Institution Type:
Consortium:
User Group:
American English
College or University
None
Faculty
Language:
Institution Type:
Consortium:
User Group:
American English
College or University
None
Faculty
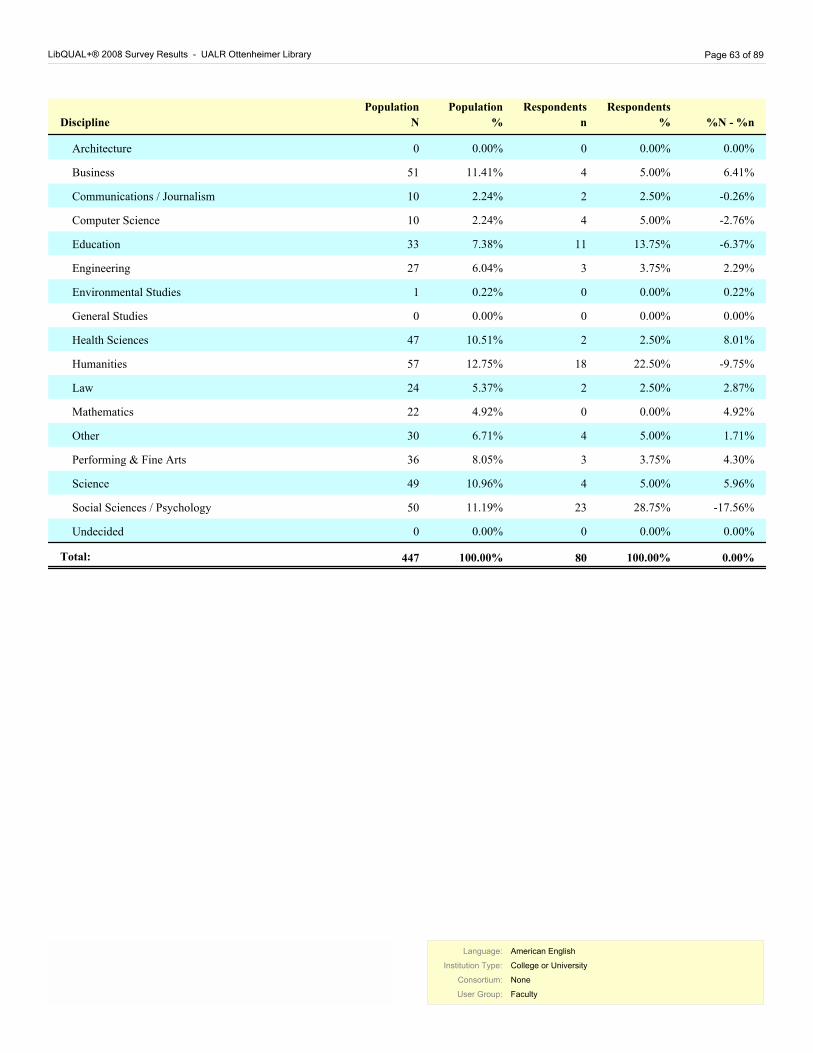
LibQUAL+® 2008 Survey Results - UALR Ottenheimer Library Page 63 of 89
Respondents
nDiscipline
Respondents
%
Population
N
Population
% %N - %n
Architecture 0 0.00% 0 0.00% 0.00%
Business 4 5.00% 51 11.41% 6.41%
Communications / Journalism 2 2.50% 10 2.24% -0.26%
Computer Science 4 5.00% 10 2.24% -2.76%
Education 11 13.75% 33 7.38% -6.37%
Engineering 3 3.75% 27 6.04% 2.29%
Environmental Studies 0 0.00% 1 0.22% 0.22%
General Studies 0 0.00% 0 0.00% 0.00%
Health Sciences 2 2.50% 47 10.51% 8.01%
Humanities 18 22.50% 57 12.75% -9.75%
Law 2 2.50% 24 5.37% 2.87%
Mathematics 0 0.00% 22 4.92% 4.92%
Other 4 5.00% 30 6.71% 1.71%
Performing & Fine Arts 3 3.75% 36 8.05% 4.30%
Science 4 5.00% 49 10.96% 5.96%
Social Sciences / Psychology 23 28.75% 50 11.19% -17.56%
Undecided 0 0.00% 0 0.00% 0.00%
Total: 100.00% 447 80 100.00% 0.00%
Language:
Institution Type:
Consortium:
User Group:
American English
College or University
None
Faculty
Language:
Institution Type:
Consortium:
User Group:
American English
College or University
None
Faculty
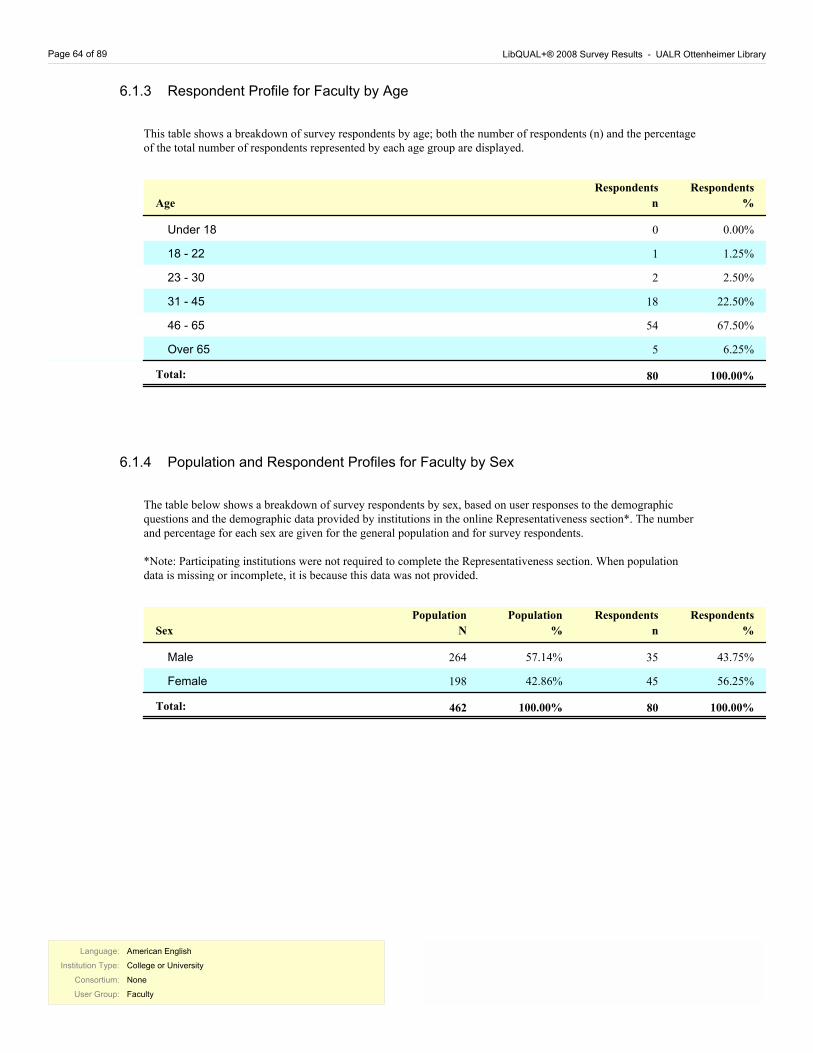
Page 64 of 89 LibQUAL+® 2008 Survey Results - UALR Ottenheimer Library
6.1.3 Respondent Profile for Faculty by Age
This table shows a breakdown of survey respondents by age; both the number of respondents (n) and the percentage of the total number of respondents represented by each age group are displayed.
Respondents
%
Respondents
nAge
Under 18 0 0.00%
18 - 22 1 1.25%
23 - 30 2 2.50%
31 - 45 18 22.50%
46 - 65 54 67.50%
Over 65 5 6.25%
Total: 100.00% 80
6.1.4 Population and Respondent Profiles for Faculty by Sex
The table below shows a breakdown of survey respondents by sex, based on user responses to the demographic questions and the demographic data provided by institutions in the online Representativeness section*. The number and percentage for each sex are given for the general population and for survey respondents.
*Note: Participating institutions were not required to complete the Representativeness section. When population data is missing or incomplete, it is because this data was not provided.
Respondents
%
Respondents
n
Population
%
Population
NSex
Male 35 43.75%57.14% 264
Female 45 56.25%42.86% 198
Total: 100.00% 80 462 100.00%
Language:
Institution Type:
Consortium:
User Group:
American English
College or University
None
Faculty
Language:
Institution Type:
Consortium:
User Group:
American English
College or University
None
Faculty
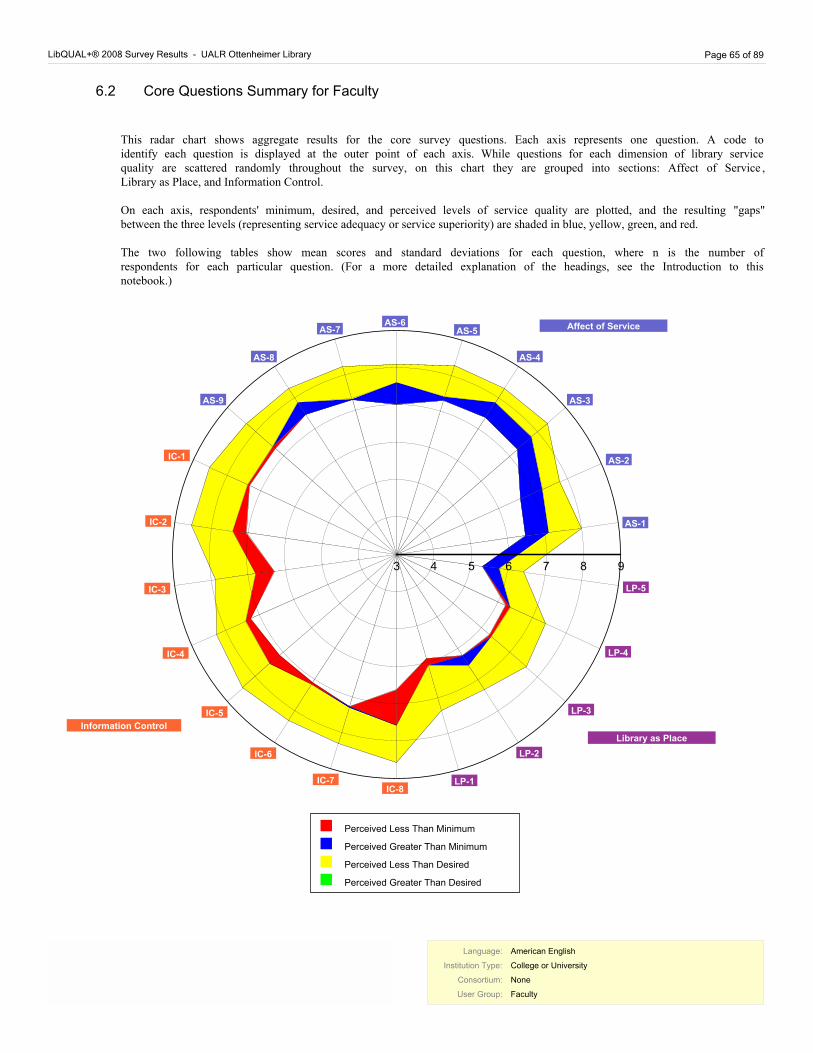
LibQUAL+® 2008 Survey Results - UALR Ottenheimer Library Page 65 of 89
6.2 Core Questions Summary for Faculty
This radar chart shows aggregate results for the core survey questions. Each axis represents one question. A code to identify each question is displayed at the outer point of each axis. While questions for each dimension of library service quality are scattered randomly throughout the survey, on this chart they are grouped into sections: Affect of Service , Library as Place, and Information Control.
On each axis, respondents' minimum, desired, and perceived levels of service quality are plotted, and the resulting "gaps" between the three levels (representing service adequacy or service superiority) are shaded in blue, yellow, green, and red.
The two following tables show mean scores and standard deviations for each question, where n is the number of respondents for each particular question. (For a more detailed explanation of the headings, see the Introduction to this notebook.)
3
4
5
6
7
8
9
AS-1
AS-2
AS-3
AS-4
AS-5AS-6
AS-7
AS-8
AS-9
IC-1
IC-2
IC-3
IC-4
IC-5
IC-6
IC-7IC-8
LP-1
LP-2
LP-3
LP-4
LP-5
Affect of Service
Information Control
Library as Place
Perceived Less Than Minimum
Perceived Greater Than Minimum
Perceived Less Than Desired
Perceived Greater Than Desired
Language:
Institution Type:
Consortium:
User Group:
American English
College or University
None
Faculty
Language:
Institution Type:
Consortium:
User Group:
American English
College or University
None
Faculty

Page 66 of 89 LibQUAL+® 2008 Survey Results - UALR Ottenheimer Library
Adequacy
Mean
Perceived
Mean
Desired
MeanQuestion TextID
Minimum
Mean n
Superiority
Mean
Affect of Service
Employees who instill confidence in users 6.48 8.00 7.11 0.63AS-1 79-0.89
Giving users individual attention 6.63 7.79 7.27 0.64AS-2 75-0.52
Employees who are consistently courteous 7.28 8.35 7.78 0.50AS-3 78-0.56
Readiness to respond to users' questions 7.36 8.29 7.84 0.48AS-4 77-0.44
Employees who have the knowledge to answer
user questions
7.30 8.29 7.41 0.10AS-5 79-0.89
Employees who deal with users in a caring
fashion
7.01 8.09 7.60 0.59AS-6 78-0.49
Employees who understand the needs of their
users
7.29 8.23 7.32 0.03AS-7 78-0.91
Willingness to help users 7.45 8.29 7.84 0.39AS-8 77-0.44
Dependability in handling users' service problems 7.39 8.33 7.30 -0.09AS-9 70-1.03
Information Control
Making electronic resources accessible from my
home or office
7.39 8.51 7.34 -0.05IC-1 77-1.17
A library Web site enabling me to locate
information on my own
7.43 8.53 7.06 -0.36IC-2 80-1.46
The printed library materials I need for my work 6.80 7.88 6.30 -0.50IC-3 76-1.58
The electronic information resources I need 7.41 8.26 7.26 -0.15IC-4 80-1.00
Modern equipment that lets me easily access
needed information
7.49 8.45 7.13 -0.36IC-5 78-1.32
Easy-to-use access tools that allow me to find
things on my own
7.16 8.30 7.10 -0.06IC-6 79-1.20
Making information easily accessible for
independent use
7.27 8.29 7.31 0.04IC-7 78-0.99
Print and/or electronic journal collections I
require for my work
7.60 8.58 6.64 -0.96IC-8 77-1.95
Library as Place
Library space that inspires study and learning 6.10 7.36 5.90 -0.19LP-1 73-1.45
Quiet space for individual activities 6.24 7.31 6.56 0.31LP-2 70-0.76
A comfortable and inviting location 6.36 7.60 6.30 -0.06LP-3 77-1.30
A getaway for study, learning, or research 6.36 7.40 6.23 -0.13LP-4 70-1.17
Community space for group learning and group
study
5.32 6.44 5.77 0.45LP-5 62-0.66
6.98 8.06 7.03 0.05 80-1.03Overall:
Language:
Institution Type:
Consortium:
User Group:
American English
College or University
None
Faculty
Language:
Institution Type:
Consortium:
User Group:
American English
College or University
None
Faculty

LibQUAL+® 2008 Survey Results - UALR Ottenheimer Library Page 67 of 89
Adequacy
SD
Perceived
SD
Desired
SDQuestion TextID
Minimum
SD n
Superiority
SD
Affect of Service
Employees who instill confidence in usersAS-1 79 1.79 1.72 1.75 1.56 1.41
Giving users individual attentionAS-2 75 1.91 1.67 1.90 1.55 1.37
Employees who are consistently courteousAS-3 78 1.62 1.43 1.68 1.39 1.02
Readiness to respond to users' questionsAS-4 77 1.43 1.49 1.47 1.35 1.07
Employees who have the knowledge to answer
user questions
AS-5 79 1.59 1.47 1.47 1.74 1.30
Employees who deal with users in a caring
fashion
AS-6 78 1.68 1.56 1.61 1.36 1.35
Employees who understand the needs of their
users
AS-7 78 1.51 1.63 1.63 1.56 1.09
Willingness to help usersAS-8 77 1.53 1.24 1.46 1.26 1.12
Dependability in handling users' service problemsAS-9 70 1.62 1.54 1.64 1.48 1.18
Information Control
Making electronic resources accessible from my
home or office
IC-1 77 1.64 1.45 1.37 1.60 1.02
A library Web site enabling me to locate
information on my own
IC-2 80 1.58 1.74 1.97 1.75 0.98
The printed library materials I need for my workIC-3 76 1.68 2.08 2.13 1.72 1.41
The electronic information resources I needIC-4 80 1.48 1.37 1.45 1.28 1.18
Modern equipment that lets me easily access
needed information
IC-5 78 1.28 1.48 1.57 1.36 0.80
Easy-to-use access tools that allow me to find
things on my own
IC-6 79 1.51 1.38 1.59 1.25 1.04
Making information easily accessible for
independent use
IC-7 78 1.41 1.48 1.68 1.34 0.94
Print and/or electronic journal collections I
require for my work
IC-8 77 1.38 1.86 2.02 1.79 0.89
Library as Place
Library space that inspires study and learningLP-1 73 1.97 2.39 2.33 1.98 1.71
Quiet space for individual activitiesLP-2 70 2.06 2.07 2.16 1.75 1.84
A comfortable and inviting locationLP-3 77 1.78 2.09 2.15 1.87 1.53
A getaway for study, learning, or researchLP-4 70 1.88 2.26 2.15 1.96 1.98
Community space for group learning and group
study
LP-5 62 2.24 2.47 2.29 1.65 2.30
80Overall: 1.23 1.10 1.21 1.04 0.83
Language:
Institution Type:
Consortium:
User Group:
American English
College or University
None
Faculty
Language:
Institution Type:
Consortium:
User Group:
American English
College or University
None
Faculty
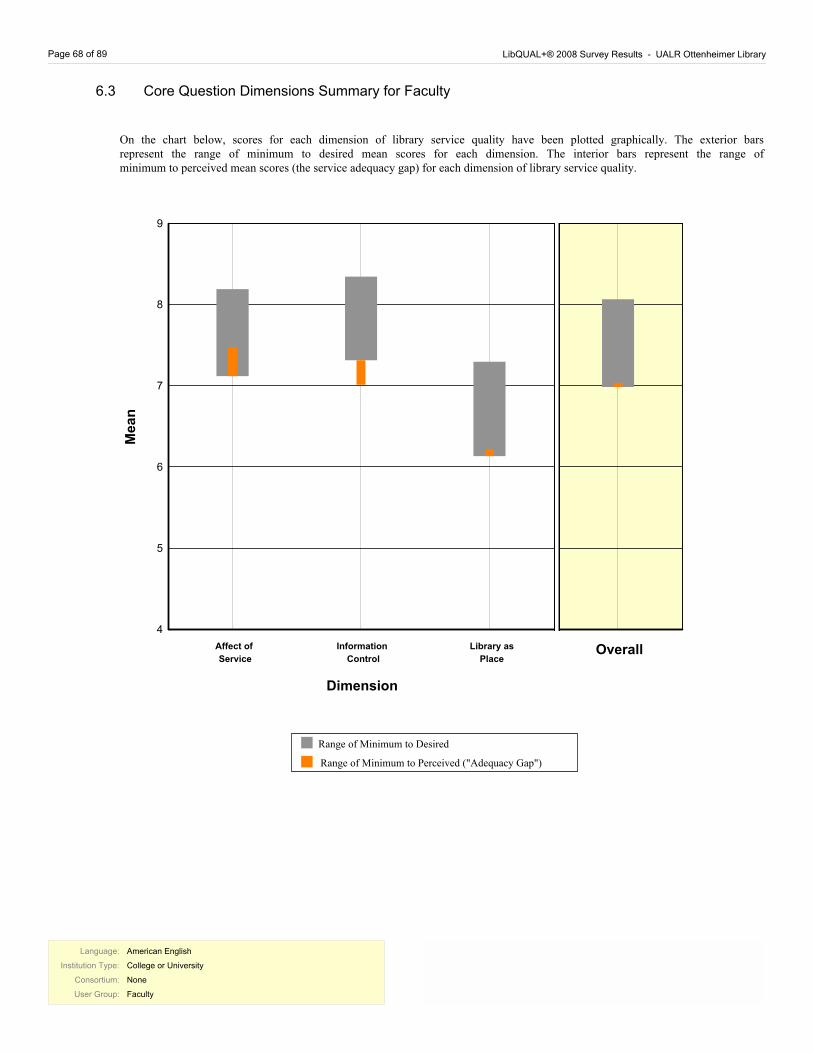
Page 68 of 89 LibQUAL+® 2008 Survey Results - UALR Ottenheimer Library
6.3 Core Question Dimensions Summary for Faculty
On the chart below, scores for each dimension of library service quality have been plotted graphically. The exterior bars represent the range of minimum to desired mean scores for each dimension. The interior bars represent the range of minimum to perceived mean scores (the service adequacy gap) for each dimension of library service quality.
4
5
6
7
8
9
Information
Control
Affect of
Service
Library as
Place
Range of Minimum to Perceived ("Adequacy Gap")
Range of Minimum to Desired
Me
an
Dimension
Overall
Language:
Institution Type:
Consortium:
User Group:
American English
College or University
None
Faculty
Language:
Institution Type:
Consortium:
User Group:
American English
College or University
None
Faculty
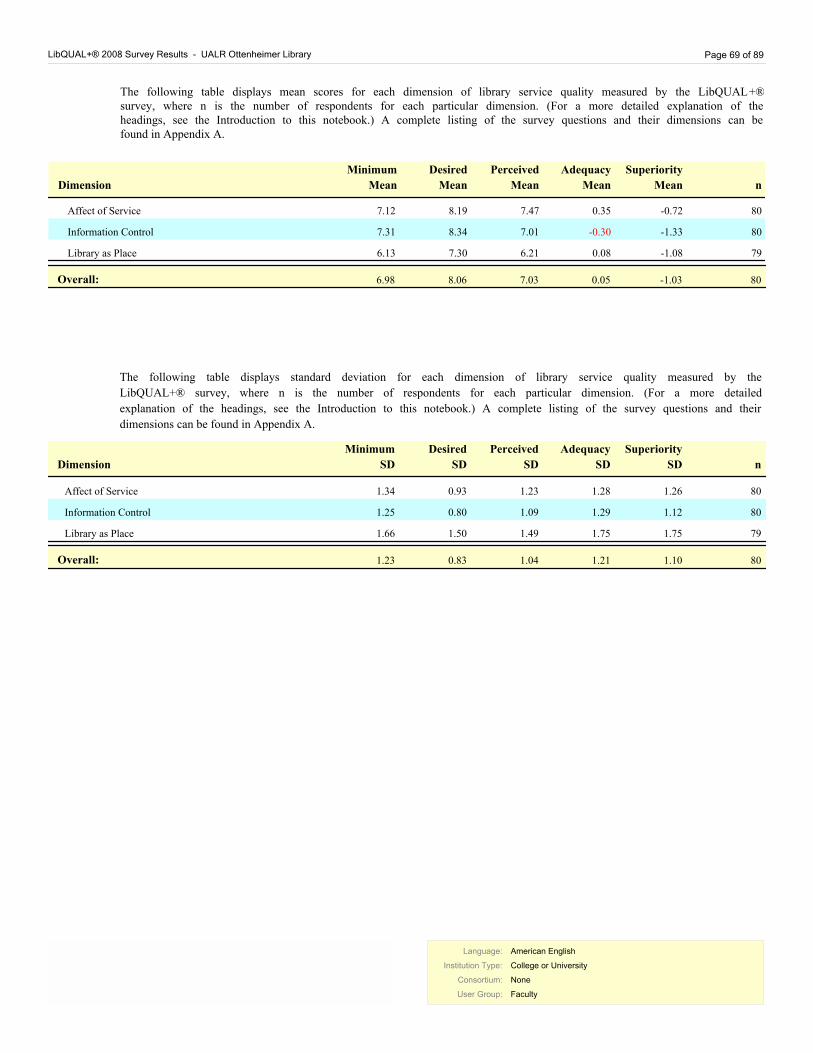
LibQUAL+® 2008 Survey Results - UALR Ottenheimer Library Page 69 of 89
The following table displays mean scores for each dimension of library service quality measured by the LibQUAL+® survey, where n is the number of respondents for each particular dimension. (For a more detailed explanation of the headings, see the Introduction to this notebook.) A complete listing of the survey questions and their dimensions can be found in Appendix A.
Adequacy
Mean
Perceived
Mean
Desired
MeanDimension
Minimum
Mean n
Superiority
Mean
Affect of Service 7.12 8.19 7.47 0.35 80-0.72
Information Control 7.31 8.34 7.01 -0.30 80-1.33
Library as Place 6.13 7.30 6.21 0.08 79-1.08
6.98 8.06 7.03 0.05 80-1.03Overall:
Adequacy
SD
Perceived
SD
Desired
SDDimension
Minimum
SD n
Superiority
SD
Affect of Service 80 1.34 1.26 1.28 1.23 0.93
Information Control 80 1.25 1.12 1.29 1.09 0.80
Library as Place 79 1.66 1.75 1.75 1.49 1.50
The following table displays standard deviation for each dimension of library service quality measured by the
LibQUAL+® survey, where n is the number of respondents for each particular dimension. (For a more detailed
explanation of the headings, see the Introduction to this notebook.) A complete listing of the survey questions and their
dimensions can be found in Appendix A.
80Overall: 1.23 1.10 1.21 1.04 0.83
Language:
Institution Type:
Consortium:
User Group:
American English
College or University
None
Faculty
Language:
Institution Type:
Consortium:
User Group:
American English
College or University
None
Faculty
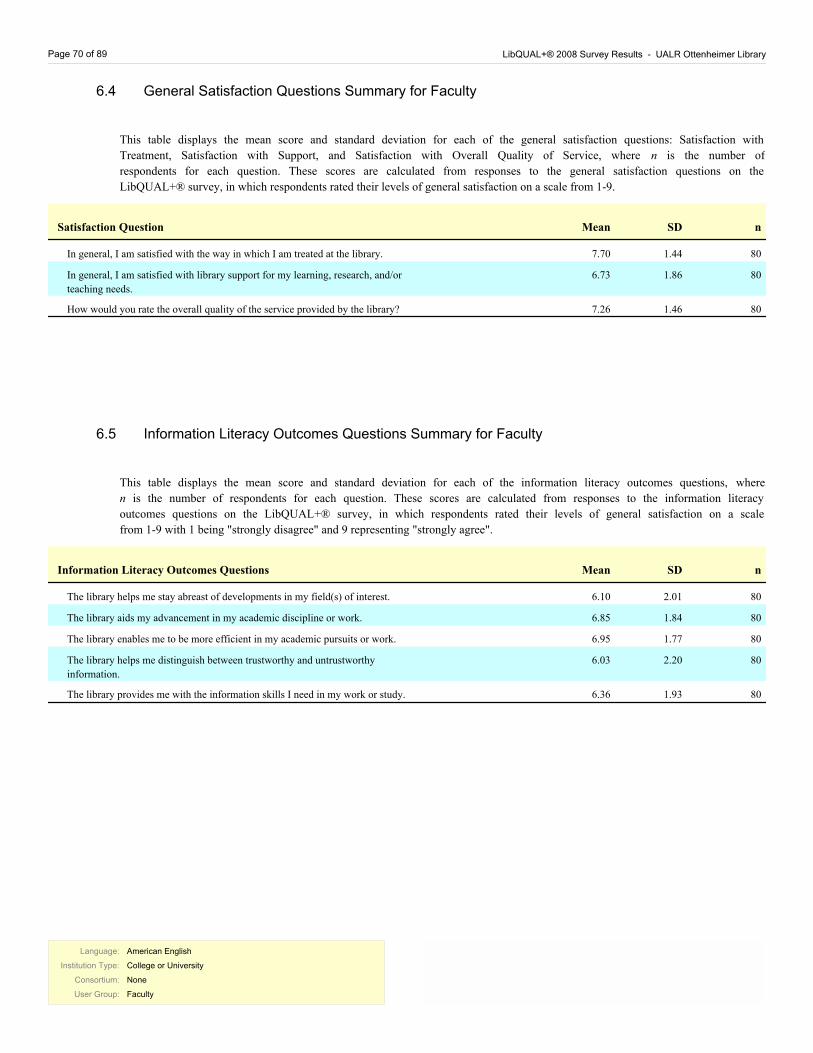
Page 70 of 89 LibQUAL+® 2008 Survey Results - UALR Ottenheimer Library
6.4 General Satisfaction Questions Summary for Faculty
MeanSatisfaction Question nSD
In general, I am satisfied with the way in which I am treated at the library. 7.70 80 1.44
In general, I am satisfied with library support for my learning, research, and/or
teaching needs.
6.73 80 1.86
How would you rate the overall quality of the service provided by the library? 7.26 80 1.46
This table displays the mean score and standard deviation for each of the general satisfaction questions: Satisfaction with
Treatment, Satisfaction with Support, and Satisfaction with Overall Quality of Service, where n is the number of
respondents for each question. These scores are calculated from responses to the general satisfaction questions on the
LibQUAL+® survey, in which respondents rated their levels of general satisfaction on a scale from 1-9.
6.5 Information Literacy Outcomes Questions Summary for Faculty
MeanInformation Literacy Outcomes Questions nSD
The library helps me stay abreast of developments in my field(s) of interest. 6.10 80 2.01
The library aids my advancement in my academic discipline or work. 6.85 80 1.84
The library enables me to be more efficient in my academic pursuits or work. 6.95 80 1.77
The library helps me distinguish between trustworthy and untrustworthy
information.
6.03 80 2.20
The library provides me with the information skills I need in my work or study. 6.36 80 1.93
This table displays the mean score and standard deviation for each of the information literacy outcomes questions, where
n is the number of respondents for each question. These scores are calculated from responses to the information literacy
outcomes questions on the LibQUAL+® survey, in which respondents rated their levels of general satisfaction on a scale
from 1-9 with 1 being "strongly disagree" and 9 representing "strongly agree".
Language:
Institution Type:
Consortium:
User Group:
American English
College or University
None
Faculty
Language:
Institution Type:
Consortium:
User Group:
American English
College or University
None
Faculty
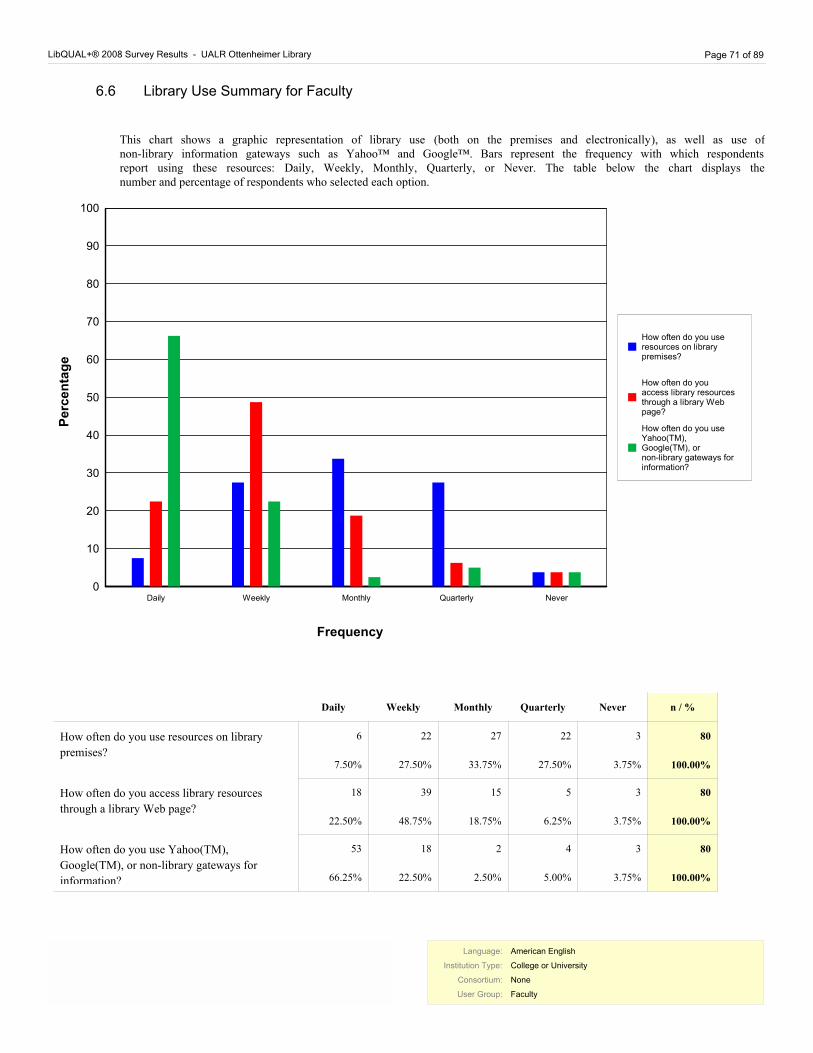
LibQUAL+® 2008 Survey Results - UALR Ottenheimer Library Page 71 of 89
6.6 Library Use Summary for Faculty
This chart shows a graphic representation of library use (both on the premises and electronically), as well as use of non-library information gateways such as Yahoo™ and Google™. Bars represent the frequency with which respondents report using these resources: Daily, Weekly, Monthly, Quarterly, or Never. The table below the chart displays the number and percentage of respondents who selected each option.
0
10
20
30
40
50
60
70
80
90
100
Daily
Weekly
Monthly
Quarterly
Never
How often do you use
resources on library
premises?
How often do you
access library resources
through a library Web
page?
How often do you use
Yahoo(TM),
Google(TM), or
non-library gateways for
information?
Frequency
P
erc
en
tag
e
Daily Weekly Monthly Quarterly Never n / %
How often do you use resources on library
premises?
6
7.50%
22
27.50%
27
33.75%
22
27.50%
3
3.75%
80
100.00%
How often do you access library resources
through a library Web page?
18
22.50%
39
48.75%
15
18.75%
5
6.25%
3
3.75%
80
100.00%
How often do you use Yahoo(TM),
Google(TM), or non-library gateways for
information?
53
66.25%
18
22.50%
2
2.50%
4
5.00%
3
3.75%
80
100.00%
Language:
Institution Type:
Consortium:
User Group:
American English
College or University
None
Faculty
Language:
Institution Type:
Consortium:
User Group:
American English
College or University
None
Faculty
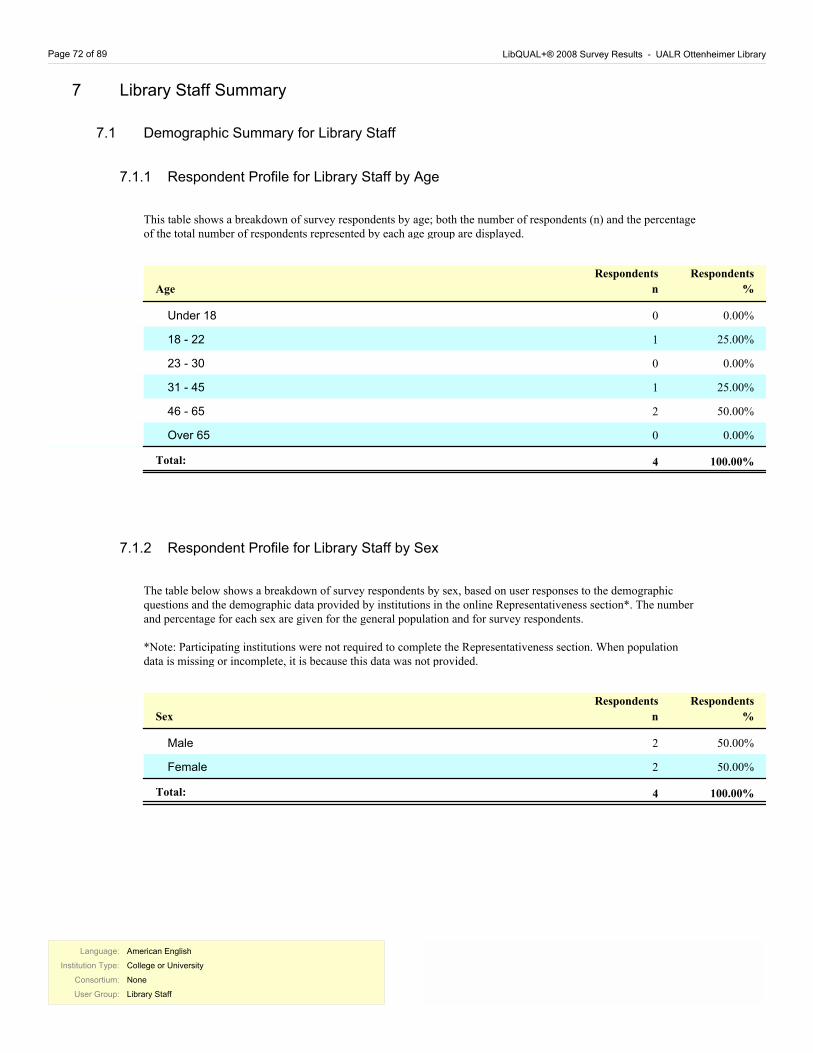
Page 72 of 89 LibQUAL+® 2008 Survey Results - UALR Ottenheimer Library
7 Library Staff Summary
7.1 Demographic Summary for Library Staff
7.1.1 Respondent Profile for Library Staff by Age
This table shows a breakdown of survey respondents by age; both the number of respondents (n) and the percentage of the total number of respondents represented by each age group are displayed.
Respondents
%
Respondents
nAge
Under 18 0 0.00%
18 - 22 1 25.00%
23 - 30 0 0.00%
31 - 45 1 25.00%
46 - 65 2 50.00%
Over 65 0 0.00%
Total: 100.00% 4
7.1.2 Respondent Profile for Library Staff by Sex
The table below shows a breakdown of survey respondents by sex, based on user responses to the demographic questions and the demographic data provided by institutions in the online Representativeness section*. The number and percentage for each sex are given for the general population and for survey respondents.
*Note: Participating institutions were not required to complete the Representativeness section. When population data is missing or incomplete, it is because this data was not provided.
Respondents
%
Respondents
nSex
Male 2 50.00%
Female 2 50.00%
Total: 100.00% 4
Language:
Institution Type:
Consortium:
User Group:
American English
College or University
None
Library Staff
Language:
Institution Type:
Consortium:
User Group:
American English
College or University
None
Library Staff
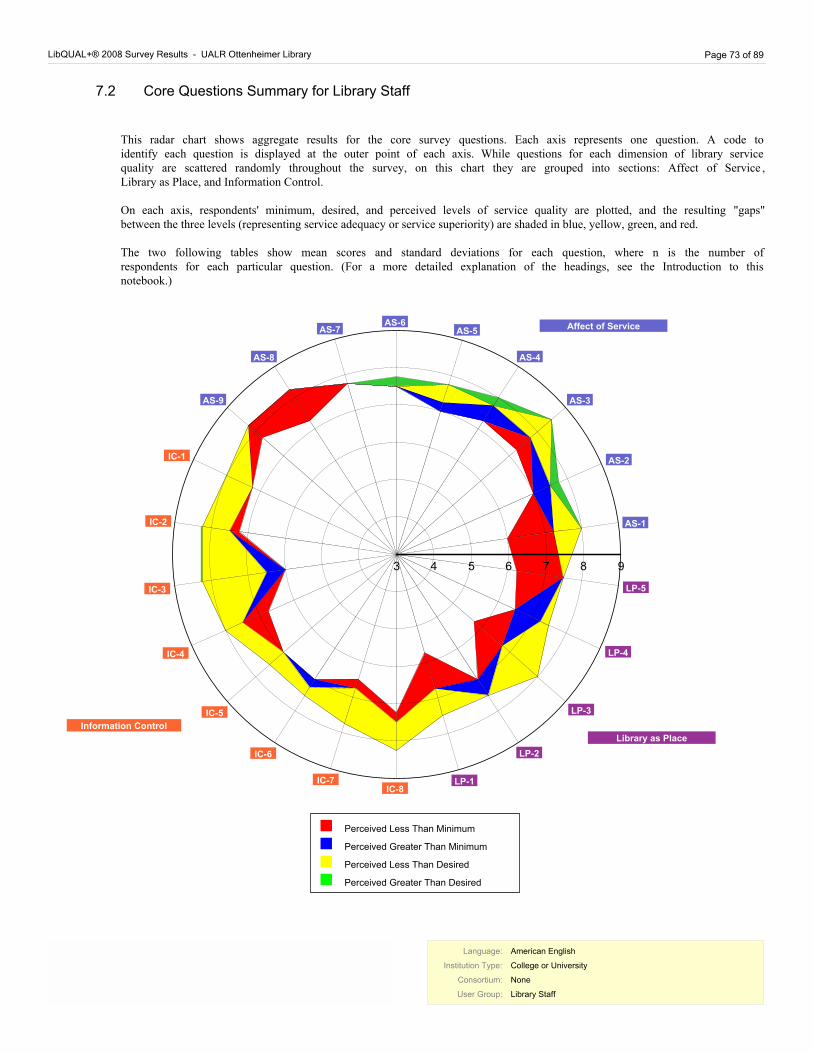
LibQUAL+® 2008 Survey Results - UALR Ottenheimer Library Page 73 of 89
7.2 Core Questions Summary for Library Staff
This radar chart shows aggregate results for the core survey questions. Each axis represents one question. A code to identify each question is displayed at the outer point of each axis. While questions for each dimension of library service quality are scattered randomly throughout the survey, on this chart they are grouped into sections: Affect of Service , Library as Place, and Information Control.
On each axis, respondents' minimum, desired, and perceived levels of service quality are plotted, and the resulting "gaps" between the three levels (representing service adequacy or service superiority) are shaded in blue, yellow, green, and red.
The two following tables show mean scores and standard deviations for each question, where n is the number of respondents for each particular question. (For a more detailed explanation of the headings, see the Introduction to this notebook.)
3
4
5
6
7
8
9
AS-1
AS-2
AS-3
AS-4
AS-5AS-6
AS-7
AS-8
AS-9
IC-1
IC-2
IC-3
IC-4
IC-5
IC-6
IC-7IC-8
LP-1
LP-2
LP-3
LP-4
LP-5
Affect of Service
Information Control
Library as Place
Perceived Less Than Minimum
Perceived Greater Than Minimum
Perceived Less Than Desired
Perceived Greater Than Desired
Language:
Institution Type:
Consortium:
User Group:
American English
College or University
None
Library Staff
Language:
Institution Type:
Consortium:
User Group:
American English
College or University
None
Library Staff
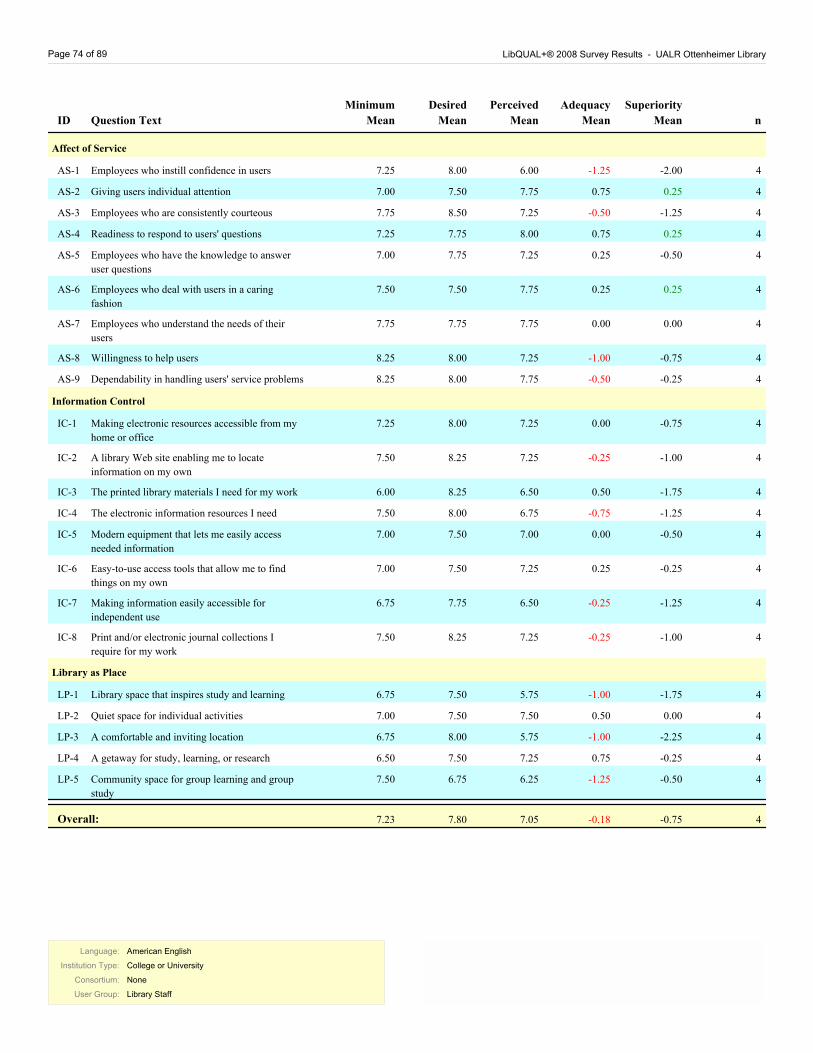
Page 74 of 89 LibQUAL+® 2008 Survey Results - UALR Ottenheimer Library
Adequacy
Mean
Perceived
Mean
Desired
MeanQuestion TextID
Minimum
Mean n
Superiority
Mean
Affect of Service
Employees who instill confidence in users 7.25 8.00 6.00 -1.25AS-1 4-2.00
Giving users individual attention 7.00 7.50 7.75 0.75AS-2 4 0.25
Employees who are consistently courteous 7.75 8.50 7.25 -0.50AS-3 4-1.25
Readiness to respond to users' questions 7.25 7.75 8.00 0.75AS-4 4 0.25
Employees who have the knowledge to answer
user questions
7.00 7.75 7.25 0.25AS-5 4-0.50
Employees who deal with users in a caring
fashion
7.50 7.50 7.75 0.25AS-6 4 0.25
Employees who understand the needs of their
users
7.75 7.75 7.75 0.00AS-7 4 0.00
Willingness to help users 8.25 8.00 7.25 -1.00AS-8 4-0.75
Dependability in handling users' service problems 8.25 8.00 7.75 -0.50AS-9 4-0.25
Information Control
Making electronic resources accessible from my
home or office
7.25 8.00 7.25 0.00IC-1 4-0.75
A library Web site enabling me to locate
information on my own
7.50 8.25 7.25 -0.25IC-2 4-1.00
The printed library materials I need for my work 6.00 8.25 6.50 0.50IC-3 4-1.75
The electronic information resources I need 7.50 8.00 6.75 -0.75IC-4 4-1.25
Modern equipment that lets me easily access
needed information
7.00 7.50 7.00 0.00IC-5 4-0.50
Easy-to-use access tools that allow me to find
things on my own
7.00 7.50 7.25 0.25IC-6 4-0.25
Making information easily accessible for
independent use
6.75 7.75 6.50 -0.25IC-7 4-1.25
Print and/or electronic journal collections I
require for my work
7.50 8.25 7.25 -0.25IC-8 4-1.00
Library as Place
Library space that inspires study and learning 6.75 7.50 5.75 -1.00LP-1 4-1.75
Quiet space for individual activities 7.00 7.50 7.50 0.50LP-2 4 0.00
A comfortable and inviting location 6.75 8.00 5.75 -1.00LP-3 4-2.25
A getaway for study, learning, or research 6.50 7.50 7.25 0.75LP-4 4-0.25
Community space for group learning and group
study
7.50 6.75 6.25 -1.25LP-5 4-0.50
7.23 7.80 7.05 -0.18 4-0.75Overall:
Language:
Institution Type:
Consortium:
User Group:
American English
College or University
None
Library Staff
Language:
Institution Type:
Consortium:
User Group:
American English
College or University
None
Library Staff
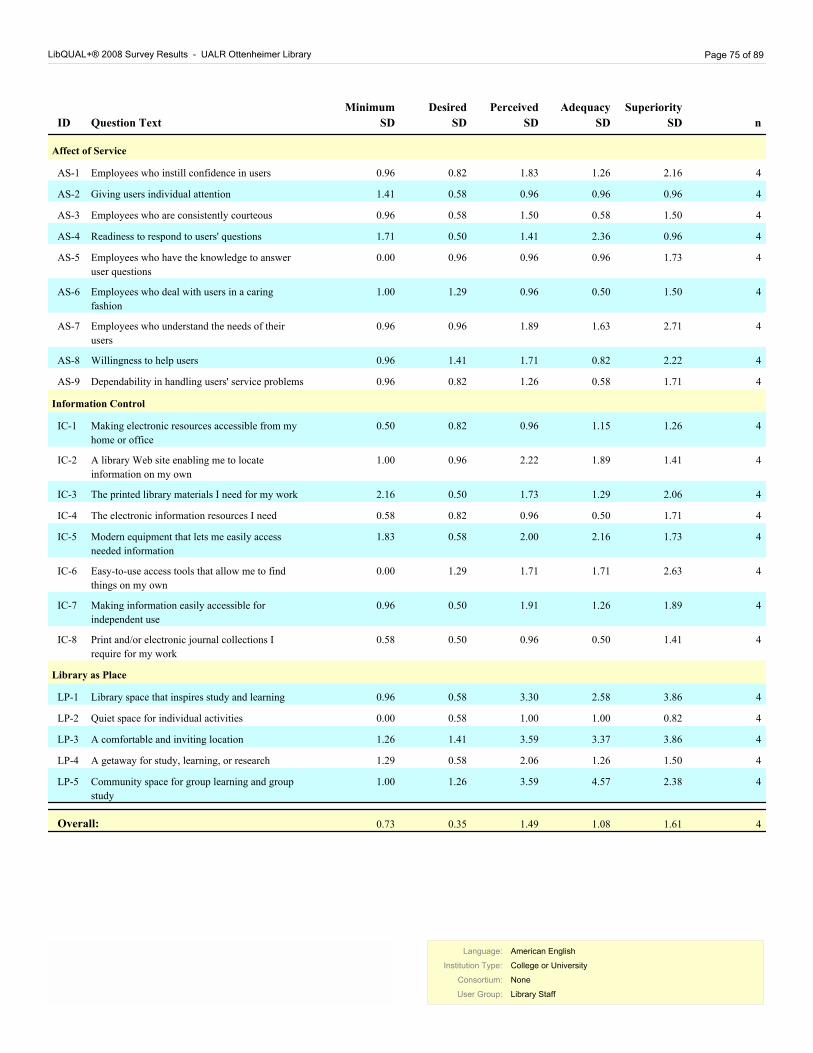
LibQUAL+® 2008 Survey Results - UALR Ottenheimer Library Page 75 of 89
Adequacy
SD
Perceived
SD
Desired
SDQuestion TextID
Minimum
SD n
Superiority
SD
Affect of Service
Employees who instill confidence in usersAS-1 4 0.96 2.16 1.26 1.83 0.82
Giving users individual attentionAS-2 4 1.41 0.96 0.96 0.96 0.58
Employees who are consistently courteousAS-3 4 0.96 1.50 0.58 1.50 0.58
Readiness to respond to users' questionsAS-4 4 1.71 0.96 2.36 1.41 0.50
Employees who have the knowledge to answer
user questions
AS-5 4 0.00 1.73 0.96 0.96 0.96
Employees who deal with users in a caring
fashion
AS-6 4 1.00 1.50 0.50 0.96 1.29
Employees who understand the needs of their
users
AS-7 4 0.96 2.71 1.63 1.89 0.96
Willingness to help usersAS-8 4 0.96 2.22 0.82 1.71 1.41
Dependability in handling users' service problemsAS-9 4 0.96 1.71 0.58 1.26 0.82
Information Control
Making electronic resources accessible from my
home or office
IC-1 4 0.50 1.26 1.15 0.96 0.82
A library Web site enabling me to locate
information on my own
IC-2 4 1.00 1.41 1.89 2.22 0.96
The printed library materials I need for my workIC-3 4 2.16 2.06 1.29 1.73 0.50
The electronic information resources I needIC-4 4 0.58 1.71 0.50 0.96 0.82
Modern equipment that lets me easily access
needed information
IC-5 4 1.83 1.73 2.16 2.00 0.58
Easy-to-use access tools that allow me to find
things on my own
IC-6 4 0.00 2.63 1.71 1.71 1.29
Making information easily accessible for
independent use
IC-7 4 0.96 1.89 1.26 1.91 0.50
Print and/or electronic journal collections I
require for my work
IC-8 4 0.58 1.41 0.50 0.96 0.50
Library as Place
Library space that inspires study and learningLP-1 4 0.96 3.86 2.58 3.30 0.58
Quiet space for individual activitiesLP-2 4 0.00 0.82 1.00 1.00 0.58
A comfortable and inviting locationLP-3 4 1.26 3.86 3.37 3.59 1.41
A getaway for study, learning, or researchLP-4 4 1.29 1.50 1.26 2.06 0.58
Community space for group learning and group
study
LP-5 4 1.00 2.38 4.57 3.59 1.26
4Overall: 0.73 1.61 1.08 1.49 0.35
Language:
Institution Type:
Consortium:
User Group:
American English
College or University
None
Library Staff
Language:
Institution Type:
Consortium:
User Group:
American English
College or University
None
Library Staff
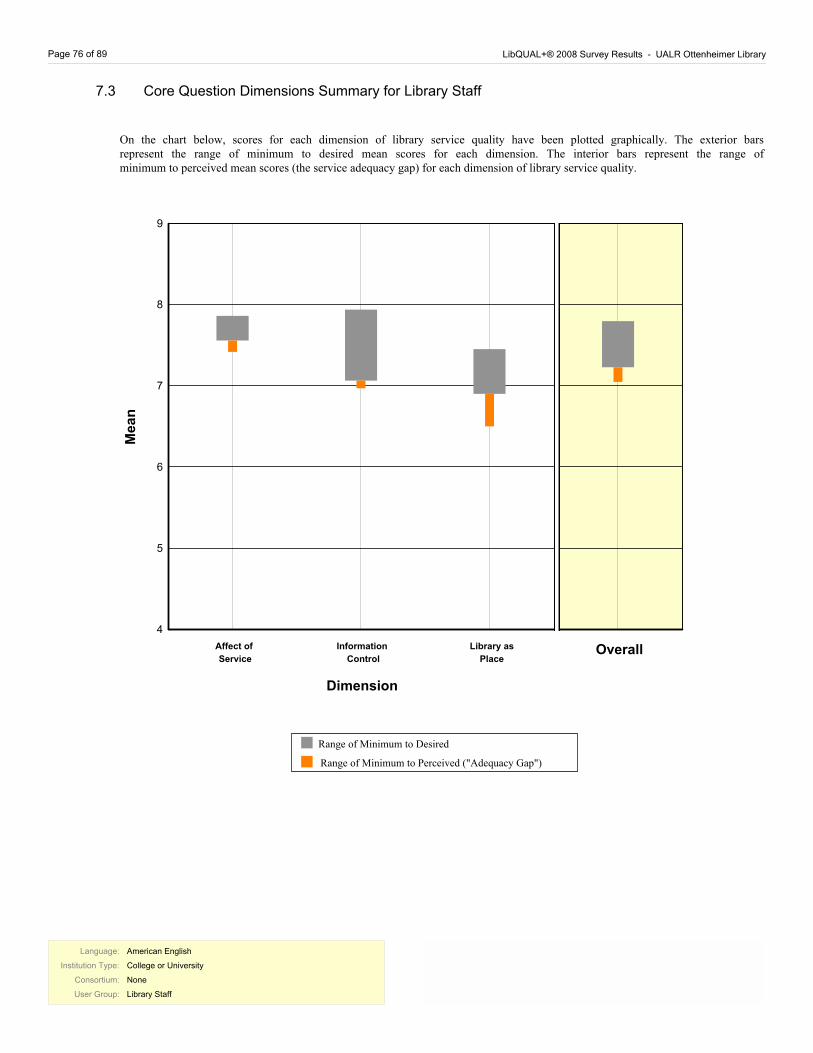
Page 76 of 89 LibQUAL+® 2008 Survey Results - UALR Ottenheimer Library
7.3 Core Question Dimensions Summary for Library Staff
On the chart below, scores for each dimension of library service quality have been plotted graphically. The exterior bars represent the range of minimum to desired mean scores for each dimension. The interior bars represent the range of minimum to perceived mean scores (the service adequacy gap) for each dimension of library service quality.
4
5
6
7
8
9
Information
Control
Affect of
Service
Library as
Place
Range of Minimum to Perceived ("Adequacy Gap")
Range of Minimum to Desired
Me
an
Dimension
Overall
Language:
Institution Type:
Consortium:
User Group:
American English
College or University
None
Library Staff
Language:
Institution Type:
Consortium:
User Group:
American English
College or University
None
Library Staff
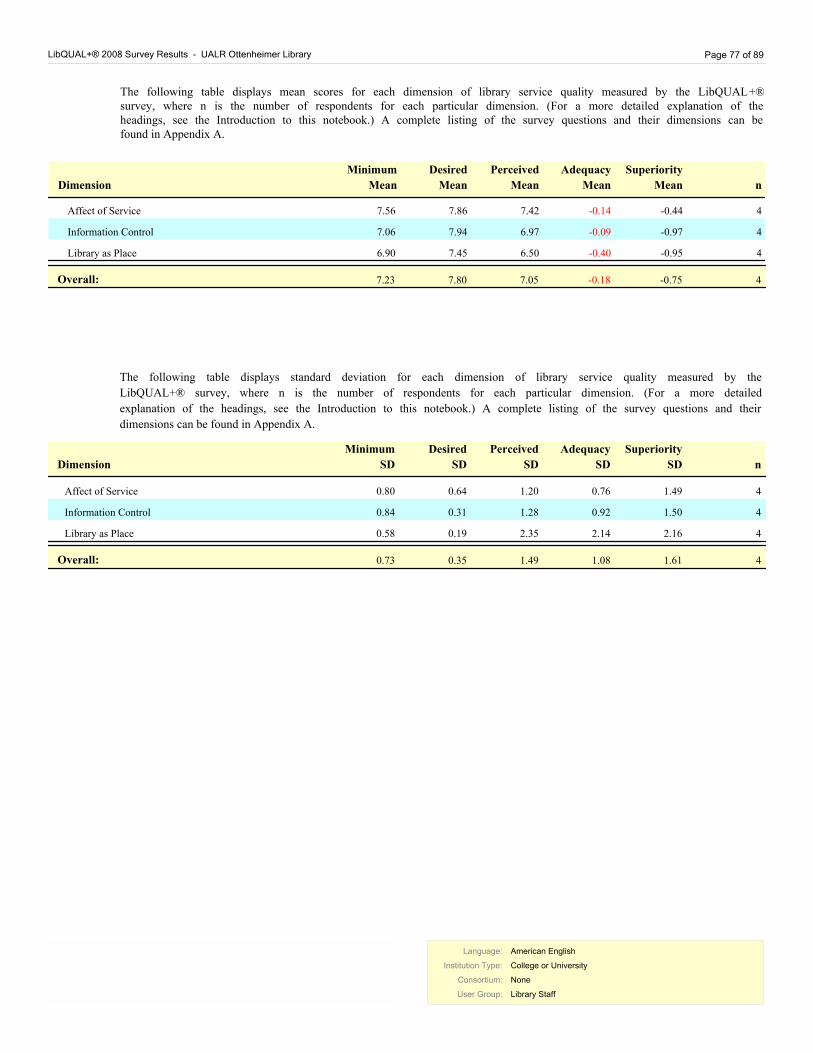
LibQUAL+® 2008 Survey Results - UALR Ottenheimer Library Page 77 of 89
The following table displays mean scores for each dimension of library service quality measured by the LibQUAL+® survey, where n is the number of respondents for each particular dimension. (For a more detailed explanation of the headings, see the Introduction to this notebook.) A complete listing of the survey questions and their dimensions can be found in Appendix A.
Adequacy
Mean
Perceived
Mean
Desired
MeanDimension
Minimum
Mean n
Superiority
Mean
Affect of Service 7.56 7.86 7.42 -0.14 4-0.44
Information Control 7.06 7.94 6.97 -0.09 4-0.97
Library as Place 6.90 7.45 6.50 -0.40 4-0.95
7.23 7.80 7.05 -0.18 4-0.75Overall:
Adequacy
SD
Perceived
SD
Desired
SDDimension
Minimum
SD n
Superiority
SD
Affect of Service 4 0.80 1.49 0.76 1.20 0.64
Information Control 4 0.84 1.50 0.92 1.28 0.31
Library as Place 4 0.58 2.16 2.14 2.35 0.19
The following table displays standard deviation for each dimension of library service quality measured by the
LibQUAL+® survey, where n is the number of respondents for each particular dimension. (For a more detailed
explanation of the headings, see the Introduction to this notebook.) A complete listing of the survey questions and their
dimensions can be found in Appendix A.
4Overall: 0.73 1.61 1.08 1.49 0.35
Language:
Institution Type:
Consortium:
User Group:
American English
College or University
None
Library Staff
Language:
Institution Type:
Consortium:
User Group:
American English
College or University
None
Library Staff

Page 78 of 89 LibQUAL+® 2008 Survey Results - UALR Ottenheimer Library
7.4 General Satisfaction Questions Summary for Library Staff
MeanSatisfaction Question nSD
In general, I am satisfied with the way in which I am treated at the library. 6.75 4 2.50
In general, I am satisfied with library support for my learning, research, and/or
teaching needs.
7.00 4 0.82
How would you rate the overall quality of the service provided by the library? 7.75 4 1.26
This table displays the mean score and standard deviation for each of the general satisfaction questions: Satisfaction with
Treatment, Satisfaction with Support, and Satisfaction with Overall Quality of Service, where n is the number of
respondents for each question. These scores are calculated from responses to the general satisfaction questions on the
LibQUAL+® survey, in which respondents rated their levels of general satisfaction on a scale from 1-9.
7.5 Information Literacy Outcomes Questions Summary for Library Staff
MeanInformation Literacy Outcomes Questions nSD
The library helps me stay abreast of developments in my field(s) of interest. 7.50 4 0.58
The library aids my advancement in my academic discipline or work. 7.75 4 1.26
The library enables me to be more efficient in my academic pursuits or work. 7.50 4 0.58
The library helps me distinguish between trustworthy and untrustworthy
information.
8.25 4 0.50
The library provides me with the information skills I need in my work or study. 7.75 4 0.50
This table displays the mean score and standard deviation for each of the information literacy outcomes questions, where
n is the number of respondents for each question. These scores are calculated from responses to the information literacy
outcomes questions on the LibQUAL+® survey, in which respondents rated their levels of general satisfaction on a scale
from 1-9 with 1 being "strongly disagree" and 9 representing "strongly agree".
Language:
Institution Type:
Consortium:
User Group:
American English
College or University
None
Library Staff
Language:
Institution Type:
Consortium:
User Group:
American English
College or University
None
Library Staff
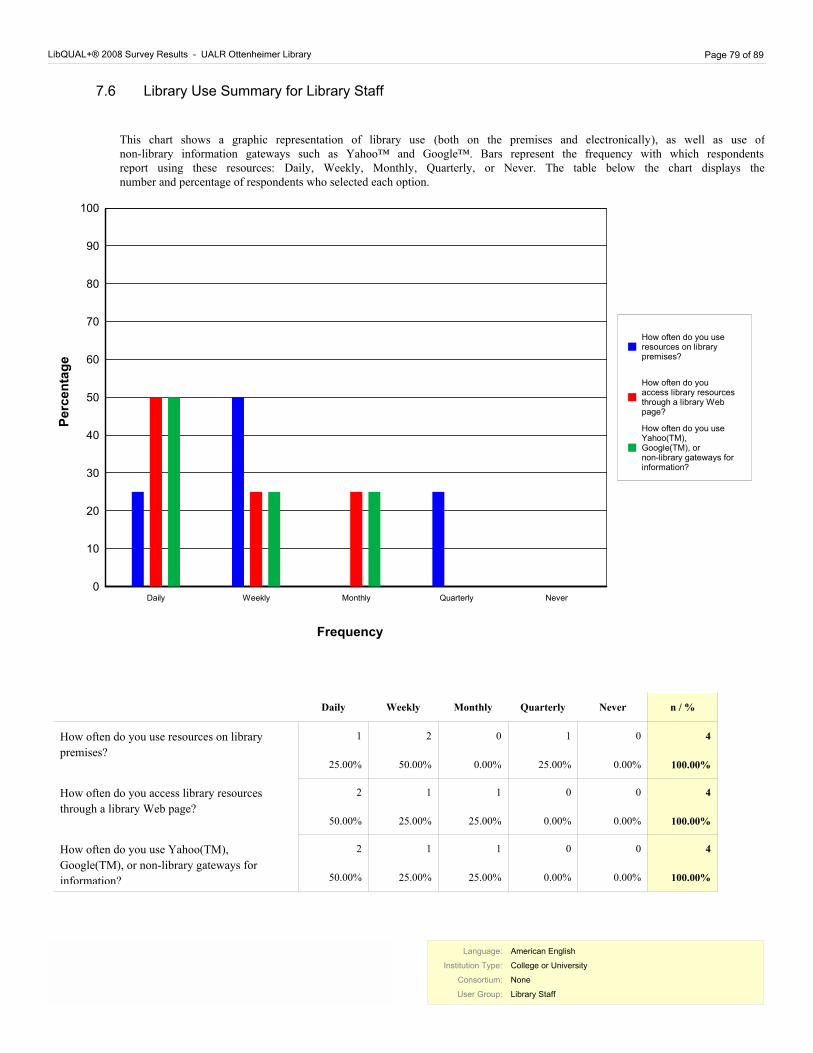
LibQUAL+® 2008 Survey Results - UALR Ottenheimer Library Page 79 of 89
7.6 Library Use Summary for Library Staff
This chart shows a graphic representation of library use (both on the premises and electronically), as well as use of non-library information gateways such as Yahoo™ and Google™. Bars represent the frequency with which respondents report using these resources: Daily, Weekly, Monthly, Quarterly, or Never. The table below the chart displays the number and percentage of respondents who selected each option.
0
10
20
30
40
50
60
70
80
90
100
Daily
Weekly
Monthly
Quarterly
Never
How often do you use
resources on library
premises?
How often do you
access library resources
through a library Web
page?
How often do you use
Yahoo(TM),
Google(TM), or
non-library gateways for
information?
Frequency
P
erc
en
tag
e
Daily Weekly Monthly Quarterly Never n / %
How often do you use resources on library
premises?
1
25.00%
2
50.00%
0
0.00%
1
25.00%
0
0.00%
4
100.00%
How often do you access library resources
through a library Web page?
2
50.00%
1
25.00%
1
25.00%
0
0.00%
0
0.00%
4
100.00%
How often do you use Yahoo(TM),
Google(TM), or non-library gateways for
information?
2
50.00%
1
25.00%
1
25.00%
0
0.00%
0
0.00%
4
100.00%
Language:
Institution Type:
Consortium:
User Group:
American English
College or University
None
Library Staff
Language:
Institution Type:
Consortium:
User Group:
American English
College or University
None
Library Staff
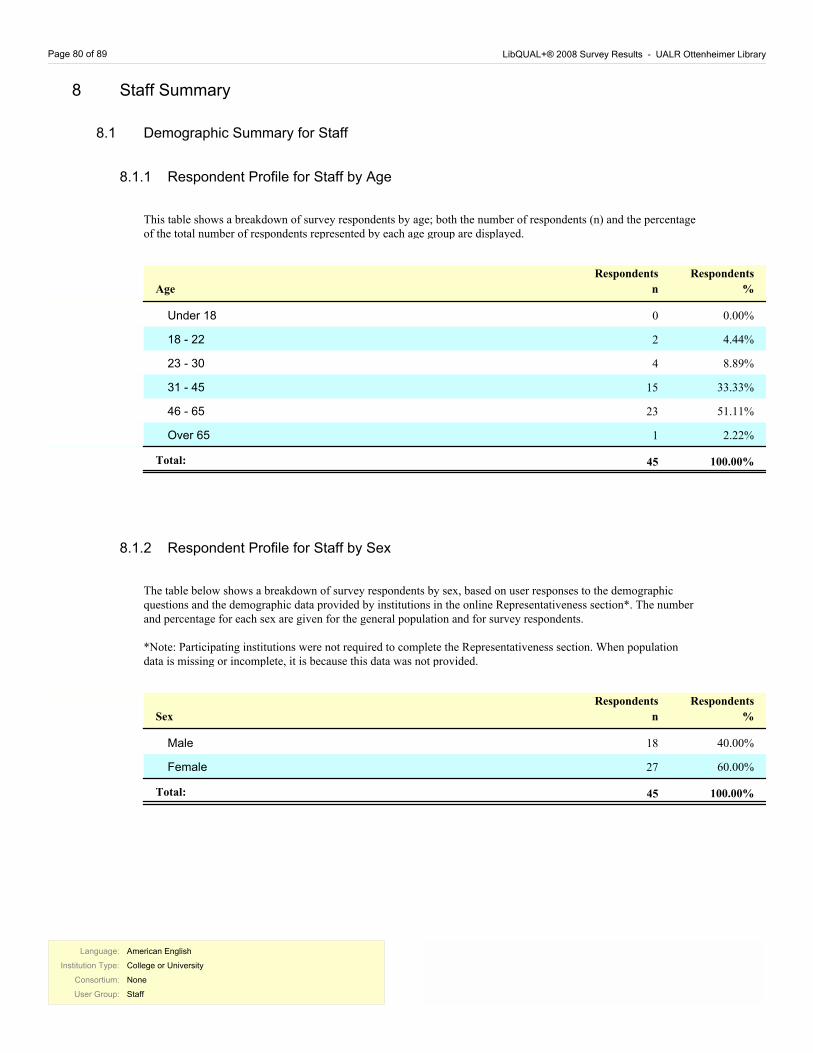
Page 80 of 89 LibQUAL+® 2008 Survey Results - UALR Ottenheimer Library
8 Staff Summary
8.1 Demographic Summary for Staff
8.1.1 Respondent Profile for Staff by Age
This table shows a breakdown of survey respondents by age; both the number of respondents (n) and the percentage of the total number of respondents represented by each age group are displayed.
Respondents
%
Respondents
nAge
Under 18 0 0.00%
18 - 22 2 4.44%
23 - 30 4 8.89%
31 - 45 15 33.33%
46 - 65 23 51.11%
Over 65 1 2.22%
Total: 100.00% 45
8.1.2 Respondent Profile for Staff by Sex
The table below shows a breakdown of survey respondents by sex, based on user responses to the demographic questions and the demographic data provided by institutions in the online Representativeness section*. The number and percentage for each sex are given for the general population and for survey respondents.
*Note: Participating institutions were not required to complete the Representativeness section. When population data is missing or incomplete, it is because this data was not provided.
Respondents
%
Respondents
nSex
Male 18 40.00%
Female 27 60.00%
Total: 100.00% 45
Language:
Institution Type:
Consortium:
User Group:
American English
College or University
None
Staff
Language:
Institution Type:
Consortium:
User Group:
American English
College or University
None
Staff
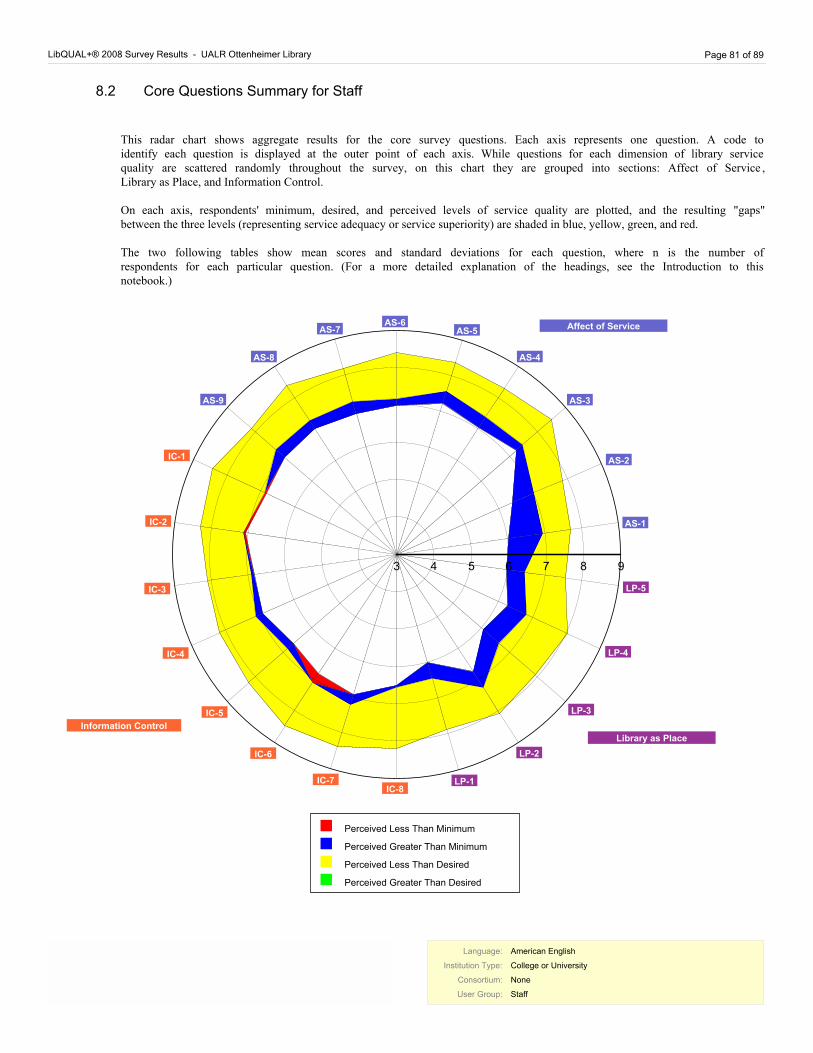
LibQUAL+® 2008 Survey Results - UALR Ottenheimer Library Page 81 of 89
8.2 Core Questions Summary for Staff
This radar chart shows aggregate results for the core survey questions. Each axis represents one question. A code to identify each question is displayed at the outer point of each axis. While questions for each dimension of library service quality are scattered randomly throughout the survey, on this chart they are grouped into sections: Affect of Service , Library as Place, and Information Control.
On each axis, respondents' minimum, desired, and perceived levels of service quality are plotted, and the resulting "gaps" between the three levels (representing service adequacy or service superiority) are shaded in blue, yellow, green, and red.
The two following tables show mean scores and standard deviations for each question, where n is the number of respondents for each particular question. (For a more detailed explanation of the headings, see the Introduction to this notebook.)
3
4
5
6
7
8
9
AS-1
AS-2
AS-3
AS-4
AS-5AS-6
AS-7
AS-8
AS-9
IC-1
IC-2
IC-3
IC-4
IC-5
IC-6
IC-7IC-8
LP-1
LP-2
LP-3
LP-4
LP-5
Affect of Service
Information Control
Library as Place
Perceived Less Than Minimum
Perceived Greater Than Minimum
Perceived Less Than Desired
Perceived Greater Than Desired
Language:
Institution Type:
Consortium:
User Group:
American English
College or University
None
Staff
Language:
Institution Type:
Consortium:
User Group:
American English
College or University
None
Staff
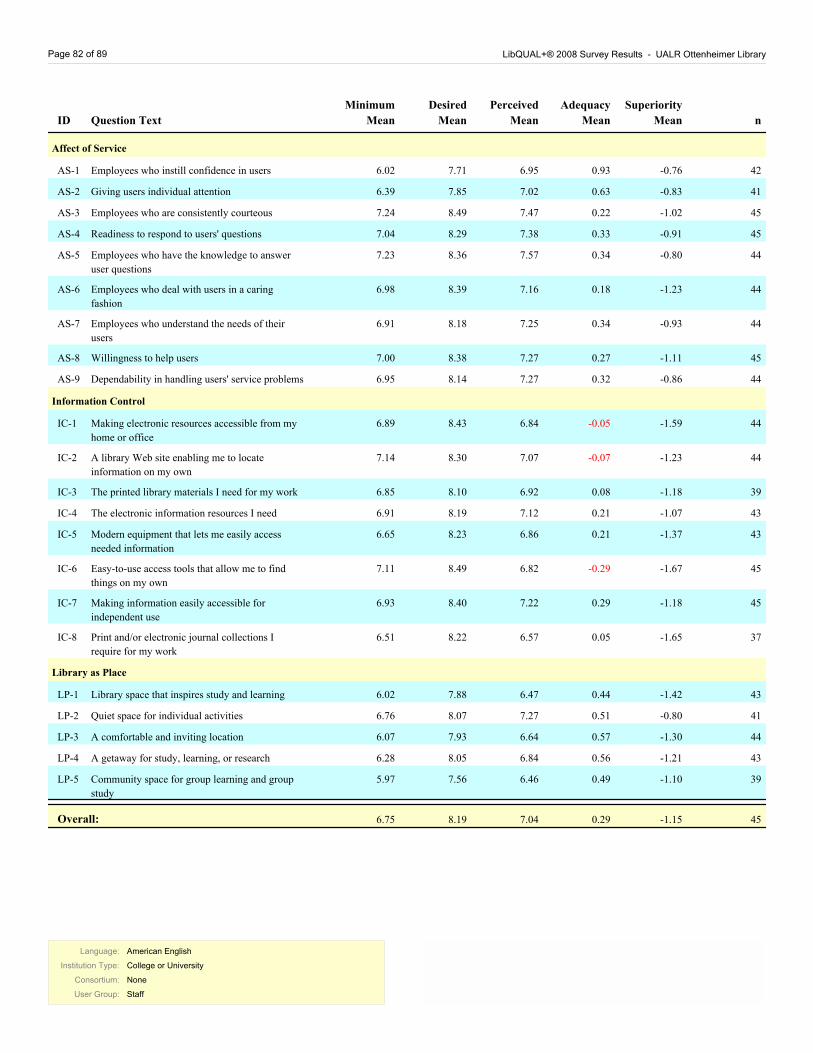
Page 82 of 89 LibQUAL+® 2008 Survey Results - UALR Ottenheimer Library
Adequacy
Mean
Perceived
Mean
Desired
MeanQuestion TextID
Minimum
Mean n
Superiority
Mean
Affect of Service
Employees who instill confidence in users 6.02 7.71 6.95 0.93AS-1 42-0.76
Giving users individual attention 6.39 7.85 7.02 0.63AS-2 41-0.83
Employees who are consistently courteous 7.24 8.49 7.47 0.22AS-3 45-1.02
Readiness to respond to users' questions 7.04 8.29 7.38 0.33AS-4 45-0.91
Employees who have the knowledge to answer
user questions
7.23 8.36 7.57 0.34AS-5 44-0.80
Employees who deal with users in a caring
fashion
6.98 8.39 7.16 0.18AS-6 44-1.23
Employees who understand the needs of their
users
6.91 8.18 7.25 0.34AS-7 44-0.93
Willingness to help users 7.00 8.38 7.27 0.27AS-8 45-1.11
Dependability in handling users' service problems 6.95 8.14 7.27 0.32AS-9 44-0.86
Information Control
Making electronic resources accessible from my
home or office
6.89 8.43 6.84 -0.05IC-1 44-1.59
A library Web site enabling me to locate
information on my own
7.14 8.30 7.07 -0.07IC-2 44-1.23
The printed library materials I need for my work 6.85 8.10 6.92 0.08IC-3 39-1.18
The electronic information resources I need 6.91 8.19 7.12 0.21IC-4 43-1.07
Modern equipment that lets me easily access
needed information
6.65 8.23 6.86 0.21IC-5 43-1.37
Easy-to-use access tools that allow me to find
things on my own
7.11 8.49 6.82 -0.29IC-6 45-1.67
Making information easily accessible for
independent use
6.93 8.40 7.22 0.29IC-7 45-1.18
Print and/or electronic journal collections I
require for my work
6.51 8.22 6.57 0.05IC-8 37-1.65
Library as Place
Library space that inspires study and learning 6.02 7.88 6.47 0.44LP-1 43-1.42
Quiet space for individual activities 6.76 8.07 7.27 0.51LP-2 41-0.80
A comfortable and inviting location 6.07 7.93 6.64 0.57LP-3 44-1.30
A getaway for study, learning, or research 6.28 8.05 6.84 0.56LP-4 43-1.21
Community space for group learning and group
study
5.97 7.56 6.46 0.49LP-5 39-1.10
6.75 8.19 7.04 0.29 45-1.15Overall:
Language:
Institution Type:
Consortium:
User Group:
American English
College or University
None
Staff
Language:
Institution Type:
Consortium:
User Group:
American English
College or University
None
Staff
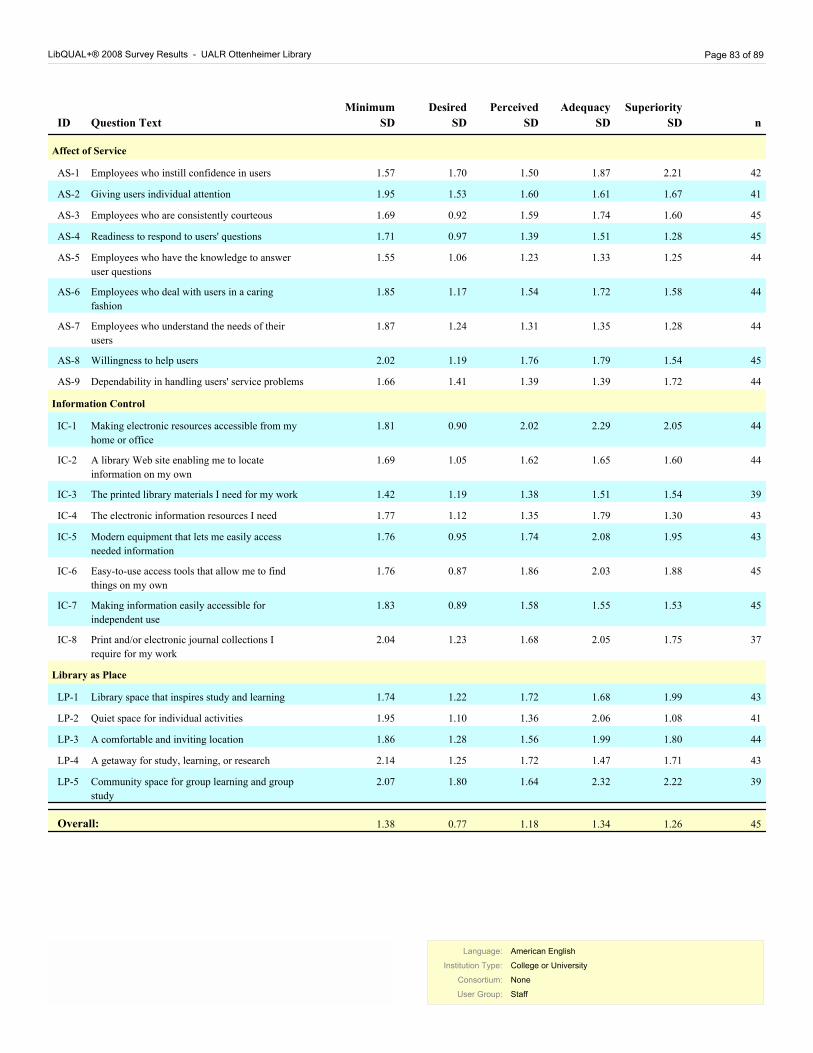
LibQUAL+® 2008 Survey Results - UALR Ottenheimer Library Page 83 of 89
Adequacy
SD
Perceived
SD
Desired
SDQuestion TextID
Minimum
SD n
Superiority
SD
Affect of Service
Employees who instill confidence in usersAS-1 42 1.57 2.21 1.87 1.50 1.70
Giving users individual attentionAS-2 41 1.95 1.67 1.61 1.60 1.53
Employees who are consistently courteousAS-3 45 1.69 1.60 1.74 1.59 0.92
Readiness to respond to users' questionsAS-4 45 1.71 1.28 1.51 1.39 0.97
Employees who have the knowledge to answer
user questions
AS-5 44 1.55 1.25 1.33 1.23 1.06
Employees who deal with users in a caring
fashion
AS-6 44 1.85 1.58 1.72 1.54 1.17
Employees who understand the needs of their
users
AS-7 44 1.87 1.28 1.35 1.31 1.24
Willingness to help usersAS-8 45 2.02 1.54 1.79 1.76 1.19
Dependability in handling users' service problemsAS-9 44 1.66 1.72 1.39 1.39 1.41
Information Control
Making electronic resources accessible from my
home or office
IC-1 44 1.81 2.05 2.29 2.02 0.90
A library Web site enabling me to locate
information on my own
IC-2 44 1.69 1.60 1.65 1.62 1.05
The printed library materials I need for my workIC-3 39 1.42 1.54 1.51 1.38 1.19
The electronic information resources I needIC-4 43 1.77 1.30 1.79 1.35 1.12
Modern equipment that lets me easily access
needed information
IC-5 43 1.76 1.95 2.08 1.74 0.95
Easy-to-use access tools that allow me to find
things on my own
IC-6 45 1.76 1.88 2.03 1.86 0.87
Making information easily accessible for
independent use
IC-7 45 1.83 1.53 1.55 1.58 0.89
Print and/or electronic journal collections I
require for my work
IC-8 37 2.04 1.75 2.05 1.68 1.23
Library as Place
Library space that inspires study and learningLP-1 43 1.74 1.99 1.68 1.72 1.22
Quiet space for individual activitiesLP-2 41 1.95 1.08 2.06 1.36 1.10
A comfortable and inviting locationLP-3 44 1.86 1.80 1.99 1.56 1.28
A getaway for study, learning, or researchLP-4 43 2.14 1.71 1.47 1.72 1.25
Community space for group learning and group
study
LP-5 39 2.07 2.22 2.32 1.64 1.80
45Overall: 1.38 1.26 1.34 1.18 0.77
Language:
Institution Type:
Consortium:
User Group:
American English
College or University
None
Staff
Language:
Institution Type:
Consortium:
User Group:
American English
College or University
None
Staff
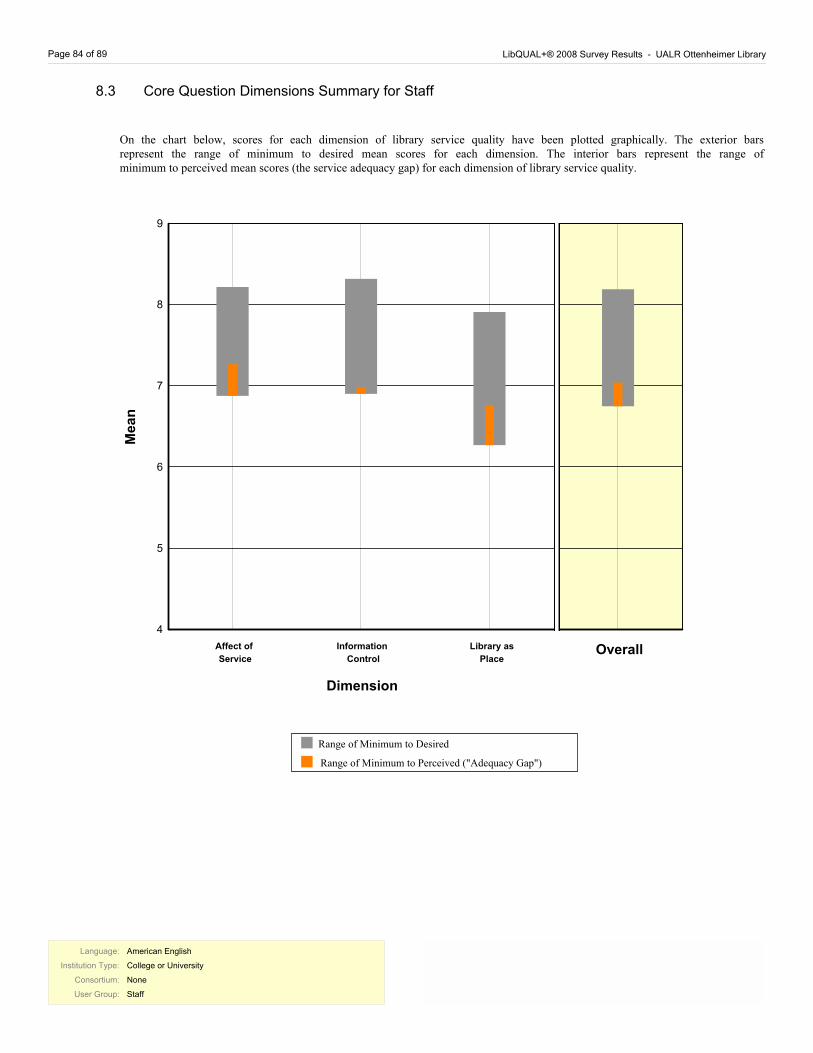
Page 84 of 89 LibQUAL+® 2008 Survey Results - UALR Ottenheimer Library
8.3 Core Question Dimensions Summary for Staff
On the chart below, scores for each dimension of library service quality have been plotted graphically. The exterior bars represent the range of minimum to desired mean scores for each dimension. The interior bars represent the range of minimum to perceived mean scores (the service adequacy gap) for each dimension of library service quality.
4
5
6
7
8
9
Information
Control
Affect of
Service
Library as
Place
Range of Minimum to Perceived ("Adequacy Gap")
Range of Minimum to Desired
Me
an
Dimension
Overall
Language:
Institution Type:
Consortium:
User Group:
American English
College or University
None
Staff
Language:
Institution Type:
Consortium:
User Group:
American English
College or University
None
Staff
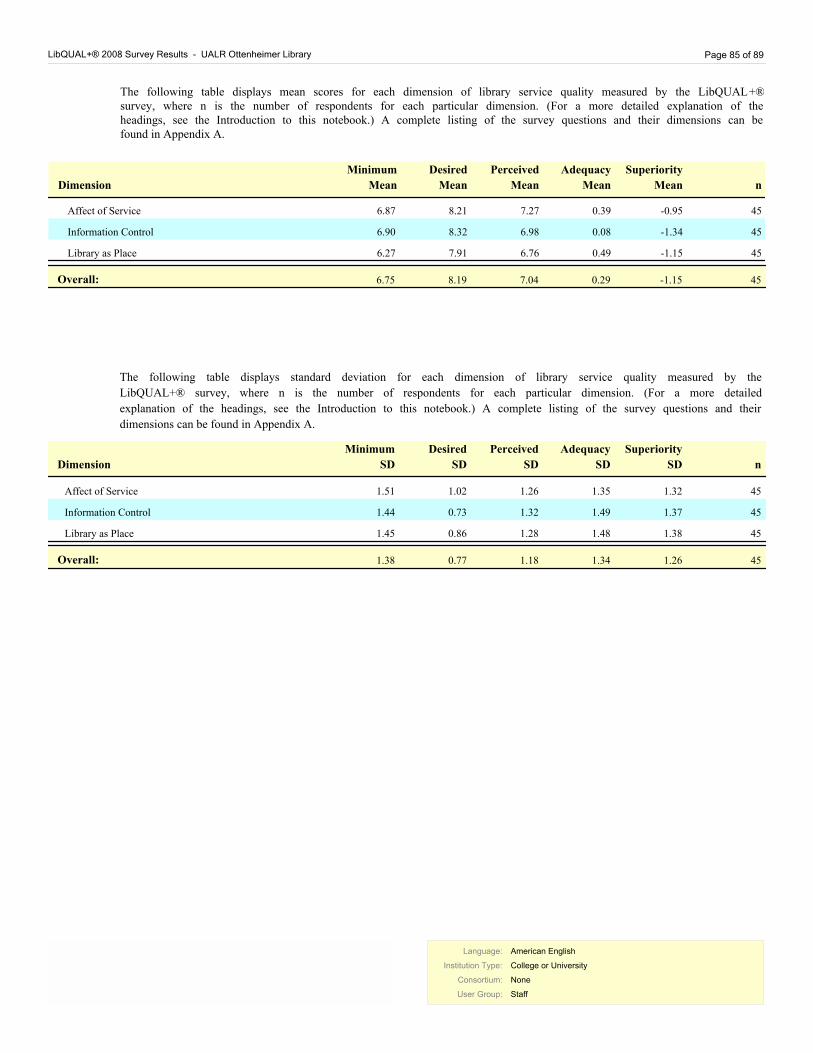
LibQUAL+® 2008 Survey Results - UALR Ottenheimer Library Page 85 of 89
The following table displays mean scores for each dimension of library service quality measured by the LibQUAL+® survey, where n is the number of respondents for each particular dimension. (For a more detailed explanation of the headings, see the Introduction to this notebook.) A complete listing of the survey questions and their dimensions can be found in Appendix A.
Adequacy
Mean
Perceived
Mean
Desired
MeanDimension
Minimum
Mean n
Superiority
Mean
Affect of Service 6.87 8.21 7.27 0.39 45-0.95
Information Control 6.90 8.32 6.98 0.08 45-1.34
Library as Place 6.27 7.91 6.76 0.49 45-1.15
6.75 8.19 7.04 0.29 45-1.15Overall:
Adequacy
SD
Perceived
SD
Desired
SDDimension
Minimum
SD n
Superiority
SD
Affect of Service 45 1.51 1.32 1.35 1.26 1.02
Information Control 45 1.44 1.37 1.49 1.32 0.73
Library as Place 45 1.45 1.38 1.48 1.28 0.86
The following table displays standard deviation for each dimension of library service quality measured by the
LibQUAL+® survey, where n is the number of respondents for each particular dimension. (For a more detailed
explanation of the headings, see the Introduction to this notebook.) A complete listing of the survey questions and their
dimensions can be found in Appendix A.
45Overall: 1.38 1.26 1.34 1.18 0.77
Language:
Institution Type:
Consortium:
User Group:
American English
College or University
None
Staff
Language:
Institution Type:
Consortium:
User Group:
American English
College or University
None
Staff

Page 86 of 89 LibQUAL+® 2008 Survey Results - UALR Ottenheimer Library
8.4 General Satisfaction Questions Summary for Staff
MeanSatisfaction Question nSD
In general, I am satisfied with the way in which I am treated at the library. 7.38 45 1.40
In general, I am satisfied with library support for my learning, research, and/or
teaching needs.
7.09 45 1.40
How would you rate the overall quality of the service provided by the library? 7.33 45 1.19
This table displays the mean score and standard deviation for each of the general satisfaction questions: Satisfaction with
Treatment, Satisfaction with Support, and Satisfaction with Overall Quality of Service, where n is the number of
respondents for each question. These scores are calculated from responses to the general satisfaction questions on the
LibQUAL+® survey, in which respondents rated their levels of general satisfaction on a scale from 1-9.
8.5 Information Literacy Outcomes Questions Summary for Staff
MeanInformation Literacy Outcomes Questions nSD
The library helps me stay abreast of developments in my field(s) of interest. 5.64 45 1.86
The library aids my advancement in my academic discipline or work. 6.31 45 1.61
The library enables me to be more efficient in my academic pursuits or work. 6.44 45 1.53
The library helps me distinguish between trustworthy and untrustworthy
information.
5.73 45 2.03
The library provides me with the information skills I need in my work or study. 5.84 45 1.78
This table displays the mean score and standard deviation for each of the information literacy outcomes questions, where
n is the number of respondents for each question. These scores are calculated from responses to the information literacy
outcomes questions on the LibQUAL+® survey, in which respondents rated their levels of general satisfaction on a scale
from 1-9 with 1 being "strongly disagree" and 9 representing "strongly agree".
Language:
Institution Type:
Consortium:
User Group:
American English
College or University
None
Staff
Language:
Institution Type:
Consortium:
User Group:
American English
College or University
None
Staff
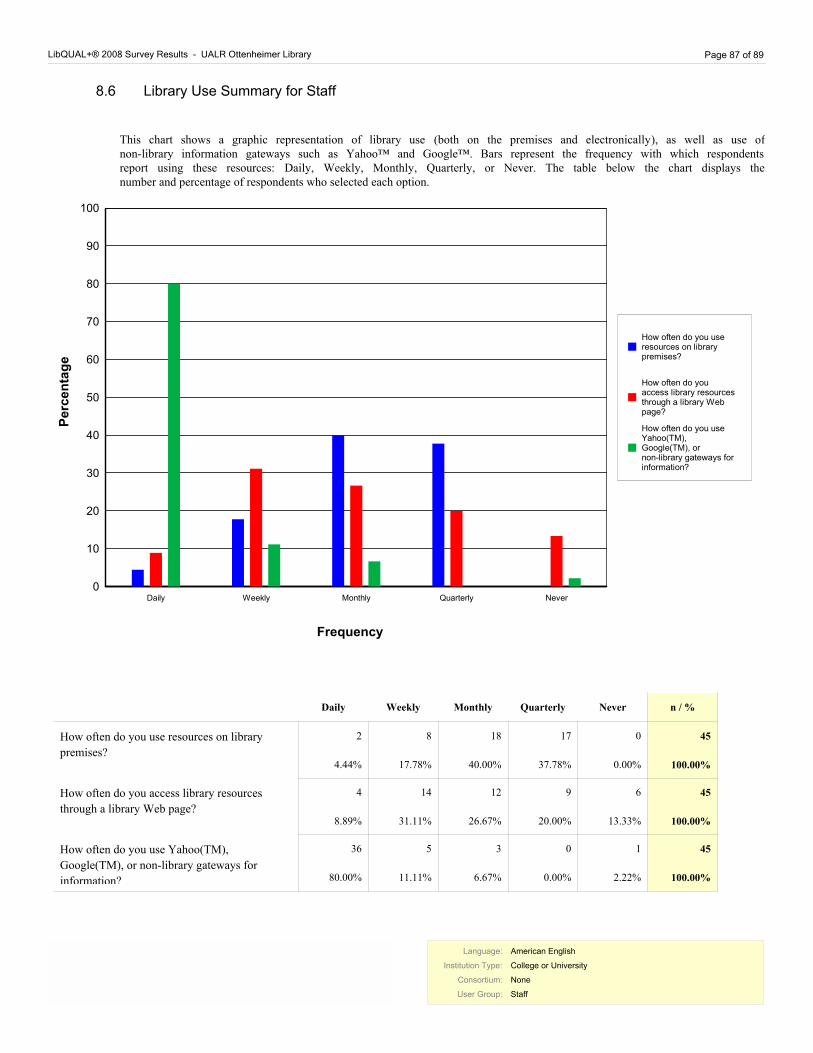
LibQUAL+® 2008 Survey Results - UALR Ottenheimer Library Page 87 of 89
8.6 Library Use Summary for Staff
This chart shows a graphic representation of library use (both on the premises and electronically), as well as use of non-library information gateways such as Yahoo™ and Google™. Bars represent the frequency with which respondents report using these resources: Daily, Weekly, Monthly, Quarterly, or Never. The table below the chart displays the number and percentage of respondents who selected each option.
0
10
20
30
40
50
60
70
80
90
100
Daily
Weekly
Monthly
Quarterly
Never
How often do you use
resources on library
premises?
How often do you
access library resources
through a library Web
page?
How often do you use
Yahoo(TM),
Google(TM), or
non-library gateways for
information?
Frequency
P
erc
en
tag
e
Daily Weekly Monthly Quarterly Never n / %
How often do you use resources on library
premises?
2
4.44%
8
17.78%
18
40.00%
17
37.78%
0
0.00%
45
100.00%
How often do you access library resources
through a library Web page?
4
8.89%
14
31.11%
12
26.67%
9
20.00%
6
13.33%
45
100.00%
How often do you use Yahoo(TM),
Google(TM), or non-library gateways for
information?
36
80.00%
5
11.11%
3
6.67%
0
0.00%
1
2.22%
45
100.00%
Language:
Institution Type:
Consortium:
User Group:
American English
College or University
None
Staff
Language:
Institution Type:
Consortium:
User Group:
American English
College or University
None
Staff
Page 88 of 89 LibQUAL+® 2008 Survey Results - UALR Ottenheimer Library
9 Appendix A: LibQUAL+® Dimensions
LibQUAL+® measures dimensions of perceived library quality---that is, each survey question is part of a broader
category (a dimension), and scores within those categories are analyzed in order to derive more general information
about library users' perceptions of service. These dimensions were first based on the original SERVQUAL survey
instrument (the framework for the LibQUAL+® survey tool; for more information on the origins of LibQUAL+®, go
to <http://www.libqual.org/Publications/>). The LibQUAL+® survey dimensions have evolved with each iteration,
becoming more refined and focused for application to the library context. Dimensions for each iteration of the
LibQUAL+® survey are outlined below.
LibQUAL+® 2000 Dimensions
The 2000 iteration of the LibQUAL+® survey, which had 41 questions, measured eight separate dimensions:
· Assurance (the knowledge and courtesy of employees, and their ability to convey trust and confidence)
· Empathy (caring, individual attention)
· Library as Place (library as a sanctuary/haven or site for learning and contemplation)
· Reliability (ability to perform the promised service dependably and accurately)
· Responsiveness (willingness to help customers and provide prompt service)
· Tangibles (appearance of physical facilities, equipment, personnel and communications materials)
· Instructions/Custom Items
· Self-Reliance
LibQUAL+® 2001 Dimensions
After careful analysis of the results from the 2000 survey, the dimensions were further refined to re-ground the
SERVQUAL items in the library context. Four sub-dimensions resulted for the 2001 iteration:
· Service Affect (nine items, such as “willingness to help users”)
· Library as Place (five items, such as “a haven for quiet and solitude”)
· Personal Control (six items, such as “website enabling me to locate information on my own”), and
· Information Access (five items, such as “comprehensive print collections” and “convenient business hours”)
LibQUAL+® 2002 and 2003 Dimensions
For the 2002 iteration of the LibQUAL+® survey, the dimensions were once again refined based on analysis of the
previous year's results. While the four dimensions were retained, their titles were changed slightly to more clearly
represent the questions and data. The same four dimensions were also used on the 2003 survey:
· Access to Information
· Affect of Service
· Library as Place
· Personal Control
LibQUAL+® 2004 - 2008 Dimensions
After the 2003 survey was completed, factor and reliability analyses on the resulting data revealed that two of the
Language:
Institution Type:
Consortium:
User Group:
American English
College or University
None
All
Language:
Institution Type:
Consortium:
User Group:
American English
College or University
None
All
LibQUAL+® 2008 Survey Results - UALR Ottenheimer Library Page 89 of 89
dimensions measured by the survey-Access to Information and Personal Control-had collapsed into one. The
following three dimensions have been measured since then: Affect of Service, Information Control, and Library as
Place. In addition, three core items were eliminated from the 2003 version of the survey, leaving 22 core items on the
final survey instrument.
The list below displays the dimensions used to present the results in the 2007 notebooks, along with the questions
that relate to each dimension. (Note: The questions below are those used in the College and University
implementation of the survey, American English version.)
Affect of Service
[AS-1] Employees who instill confidence in users
[AS-2] Giving users individual attention
[AS-3] Employees who are consistently courteous
[AS-4] Readiness to respond to users’ questions
[AS-5] Employees who have the knowledge to answer user questions
[AS-6] Employees who deal with users in a caring fashion
[AS-7] Employees who understand the needs of their users
[AS-8] Willingness to help users
[AS-9] Dependability in handling users’ service problems
Information Control
[IC-1] Making electronic resources accessible from my home or office
[IC-2] A library Web site enabling me to locate information on my own
[IC-3] The printed library materials I need for my work
[IC-4] The electronic information resources I need
[IC-5] Modern equipment that lets me easily access needed information
[IC-6] Easy-to-use access tools that allow me to find things on my own
[IC-7] Making information easily accessible for independent use
[IC-8] Print and/or electronic journal collections I require for my work
Library as Place
[LP-1] Library space that inspires study and learning
[LP-2] Quiet space for individual activities
[LP-3] A comfortable and inviting location
[LP-4] A getaway for study, learning or research
[LP-5] Community space for group learning and group study
Language:
Institution Type:
Consortium:
User Group:
American English
College or University
None
All
Language:
Institution Type:
Consortium:
User Group:
American English
College or University
None
All

Language:
Institution Type:
Consortium:
User Group:
American English
College or University
None
All
Language:
Institution Type:
Consortium:
User Group:
American English
College or University
None
All

Language:
Institution Type:
Consortium:
User Group:
American English
College or University
None
All
Language:
Institution Type:
Consortium:
User Group:
American English
College or University
None
All
Association of Research Libraries
21 Dupont Circle NW
Suite 800
Washington, DC 20036
Phone 202-296-2296
Fax 202-872-0884
http://www.libqual.org
Copyright © 2008 Association of Research Libraries
Language:
Institution Type:
Consortium:
User Group:
American English
College or University
None
All
Language:
Institution Type:
Consortium:
User Group:
American English
College or University
None
All