University of Malayastudentsrepo.um.edu.my/12287/1/Wan_Ahmad_Nadzim.pdf · 2021. 3. 28. · Hasil...
194
APPLICATION DEVELOPMENT FOR GOODS MANAGEMENT SYSTEM TOWARDS WASTE MINIMIZATION OPTIONS WAN AHMAD NADZIM FACULTY OF SCIENCE UNIVERSITY OF MALAYA KUALA LUMPUR 2020 University of Malaya
Transcript of University of Malayastudentsrepo.um.edu.my/12287/1/Wan_Ahmad_Nadzim.pdf · 2021. 3. 28. · Hasil...

APPLICATION DEVELOPMENT FOR GOODS
MANAGEMENT SYSTEM TOWARDS WASTE
MINIMIZATION OPTIONS
WAN AHMAD NADZIM
FACULTY OF SCIENCE
UNIVERSITY OF MALAYA
KUALA LUMPUR
2020
Univers
ity of
Mala
ya

APPLICATION DEVELOPMENT FOR GOODS MANAGEMENT SYSTEM TOWARDS WASTE
MINIMIZATION OPTIONS
WAN AHMAD NADZIM
DISSERTATION SUBMITTED IN PARTIAL
FULFILMENT OF THE REQUIREMENTS FOR THE DEGREE OF MASTER OF TECHNOLOGY
(ENVIRONMENTAL MANAGEMENT)
INSTITUTE OF BIOLOGICAL SCIENCES FACULTY OF SCIENCE
UNIVERSITY OF MALAYA KUALA LUMPUR
2020
Univers
ity of
Mala
ya

ii
UNIVERSITY OF MALAYA
ORIGINAL LITERARY WORK DECLARATION
Name of Candidate: WAN AHMAD NADZIM
Matric No: SGH130007
Name of Degree:
MASTER OF TECHNOLOGY (ENVIRONMENTAL MANAGEMENT)
Title of Project Paper/Research Report/Dissertation/Thesis (“this Work”):
APPLICATION DEVELOPMENT FOR GOODS MANAGEMENT SYSTEM
TOWARDS WASTE MINIMIZATION OPTIONS
Field of Study: WASTE MANAGEMENT (ENVIRONMENTAL SCIENCE)
I do solemnly and sincerely declare that:
(1) I am the sole author/writer of this Work; (2) This Work is original; (3) Any use of any work in which copyright exists was done by way of fair dealing
and for permitted purposes and any excerpt or extract from, or reference to or reproduction of any copyright work has been disclosed expressly and sufficiently and the title of the Work and its authorship have been acknowledged in this Work;
(4) I do not have any actual knowledge nor do I ought reasonably to know that the making of this work constitutes an infringement of any copyright work;
(5) I hereby assign all and every rights in the copyright to this Work to the University of Malaya (“UM”), who henceforth shall be owner of the copyright in this Work and that any reproduction or use in any form or by any means whatsoever is prohibited without the written consent of UM having been first had and obtained;
(6) I am fully aware that if in the course of making this Work I have infringed any copyright whether intentionally or otherwise, I may be subject to legal action or any other action as may be determined by UM.
Candidate’s Signature Date: / 1 / 20
Subscribed and solemnly declared before,
Witness’s Signature Date: / 1 / 20
Name:
Designation:
Univers
ity of
Mala
ya

iii
APPLICATION DEVELOPMENT FOR GOODS MANAGEMENT SYSTEM
TOWARDS WASTE MINIMIZATION OPTIONS
ABSTRACT
Waste is a global concern. Increasing waste generation levels are causing the increase of
waste management costs. In fact, the greatest costs of waste are measured by its impacts
to the environment, society and economy. Prevention is better than cure—since all wastes
come from goods, thus the best way to manage wastes is to manage goods. An application
model of goods management system has been developed using GIS (Geographic
Information System) and app prototyping. The primary purpose of goods management is
to maximize goods and minimize waste by promoting reduction and reuse. GIS was used
to perform spatial analyses on licensed goods and services providers in Kuala Lumpur in
order to understand types of goods and services and their distribution patterns. Given the
ubiquity of smartphones, app prototyping was carried out to design a platform to help
people reduce and reuse. The prototype was designed to integrate GIS with features
borrowed from shopping, reuse and how-to/product guide portals. The outcome of the
model suggests goods management has many potentials for sustainable development.
This makes goods management very useful not just in minimizing waste but also in
improving the environment, society and economy.
Keywords: Goods management, waste management, GIS, app, sustainable development.
Univers
ity of
Mala
ya

iv
PEMBANGUNAN APLIKASI SISTEM PENGURUSAN BARANGAN KE
ARAH OPSYEN PENGURANGAN SISA
ABSTRAK
Sisa merupakan satu kebimbangan yang dihadapi dunia. Peningkatan kadar penghasilan
sampah mengakibatkan peningkatan kos pengurusan sampah. Bahkan, akibat terburuk
sampah boleh diukur pada kesannya terhadap alam, masyarakat dan ekonomi. Mencegah
itu lebih baik daripada merawat—hakikatnya semua sisa berasal daripada barangan, jadi
cara yang terbaik untuk menguruskan sampah ialah dengan menguruskan barang. Sebuah
model aplikasi sistem pengurusan barangan telah dibangunkan menggunakan GIS
(Sistem Maklumat Geografi) dan pemprototaipan aplikasi. Matlamat utama pengurusan
barangan ialah menghargai nikmat barang dan mengurangkan sampah melalui galakan
untuk mengurang dan mengguna semula. GIS telah digunakan bagi pelaksanaan analisis
ruang terhadap pembekal barang dan perkhidmatan yang berlesen di Kuala Lumpur untuk
memahami jenis dan corak taburan barang dan perkhidmatan. Dek keserataan telefon
pintar, pemprototaipan aplikasi telah dijalankan untuk mereka sebuah pelantar yang dapat
membantu orang ramai mengurang dan mengguna semula. Prototaip ini direka untuk
menyepadukan GIS dengan ciri-ciri pinjaman daripada portal beli-belah, guna semula dan
petunjuk/panduan barang. Hasil modelan ini menunjukkan bahawa pengurusan barangan
memiliki banyak keupayaan dalam pembangunan mampan. Oleh yang demikian,
pengurusan barangan itu sangat bermanfaat bukan sahaja untuk mengurangkan sisa,
malah untuk memperbaiki alam, masyarakat dan ekonomi.
Kata kunci: Pengurusan barangan, pengurusan sisa, GIS, aplikasi, pembangunan
mampan.
Univers
ity of
Mala
ya

v
ACKNOWLEDGMENTS
In the name of Allah, the Most Gracious, the Most Merciful.
All praises be to Allah for giving His permission, grace and inspiration to produce this
humble treatise. My gratitude also goes to everyone especially my beloved family, friends
and teachers for their contributions and prayers. Special thanks to MARA and DBKL for
providing financial support and research data, respectively. May Allah reward your deeds
with goodness in abundance and may this treatise be useful to current and future mankind,
amen. All that is good comes from Allah whereas all that is bad comes from myself.
Happy reading dear readers—I hope that you can amend and expand on any weakness
and inadequacy, respectively, thank you.
♻
Dengan nama Allah yang Maha Pengasih lagi Maha Penyayang.
Alhamdulillah dengan izin, rahmat dan ilham daripada-Nya maka terhasillah karya
yang tidak seberapa ini. Tidak dilupakan juga jasa dan doa daripada semua pihak
terutama keluarga, sahabat handai dan guru-guru yang tersayang. Sekalung
penghargaan kepada pihak MARA dan DBKL atas sokongan kewangan serta
perkongsian maklumat kajian. Didoakan semoga Allah balas jasa-jasa kalian dengan
banyak kebaikan serta mudah-mudahan karya ini berguna buat umat manusia kini dan
akan datang, amin. Yang baik itu daripada Allah, yang buruk pula daripada diri sendiri.
Selamat membaca—harap para pembaca dapat memperbaik dan mengembangkan mana-
mana kelemahan dan kekurangan yang ada dalam karya ini, terima kasih.
Univers
ity of
Mala
ya

vi
TABLE OF CONTENTS
ORIGINAL LITERARY WORK DECLARATION ................................................... ii
ABSTRACT .................................................................................................................... iii
ABSTRAK ...................................................................................................................... iv
ACKNOWLEDGMENTS .............................................................................................. v
TABLE OF CONTENTS .............................................................................................. vi
LIST OF FIGURES ....................................................................................................... ix
LIST OF TABLES ....................................................................................................... xiv
LIST OF SYMBOLS AND ABBREVIATIONS ....................................................... xvi
LIST OF APPENDICES ........................................................................................... xviii
CHAPTER 1: INTRODUCTION .................................................................................. 1
1.1 Background .............................................................................................................. 1
1.2 Problem Statement ................................................................................................... 7
1.3 Objectives ................................................................................................................ 8
CHAPTER 2: LITERATURE REVIEW ................................................................... 10
2.1 Waste and People ................................................................................................... 10
2.1.1 State of Waste Around the World ............................................................. 14
2.1.2 State of Waste in Malaysia ........................................................................ 20
2.2 Costs of Waste ....................................................................................................... 23
2.2.1 Tangible Costs ........................................................................................... 23
2.2.2 Intangible Costs ......................................................................................... 25
Univers
ity of
Mala
ya

vii
2.3 Waste Management ................................................................................................ 27
2.4 Sustainable Development ....................................................................................... 36
2.4.1 Global Megatrends .................................................................................... 36
2.4.2 Goals and Strategies for Sustainability ..................................................... 48
2.5 Portals for Reduce and Reuse ................................................................................. 54
CHAPTER 3: METHODOLOGY .............................................................................. 63
3.1 Overview ................................................................................................................ 63
3.2 Data Collection ...................................................................................................... 63
3.3 Geographic Information System (GIS) .................................................................. 64
3.3.1 Geographic Layer ...................................................................................... 64
3.3.2 Information Layer ..................................................................................... 65
3.3.3 GIS Software ............................................................................................. 65
3.3.4 GIS Map .................................................................................................... 66
3.4 App Prototype ........................................................................................................ 68
3.5 Evaluation .............................................................................................................. 70
CHAPTER 4: RESULTS AND DISCUSSION .......................................................... 71
4.1 Goods and Services Providers in Kuala Lumpur ................................................... 71
4.2 A Geographic Information System (GIS) of Goods and Services Providers ......... 75
4.2.1 Premise (Premis) Licensees ...................................................................... 77
4.2.2 Vendor (Penjaja) Licensees ...................................................................... 83
4.2.3 Signboard Advertisement (Iklan Papan Tanda) Licensees ....................... 89
4.2.4 Entertainment (Hiburan) Licensees .......................................................... 98
Univers
ity of
Mala
ya

viii
4.2.5 Liquor (Minuman Keras) Licensees ........................................................ 109
4.2.6 Private Parking Lot (Tempat Letak Kereta Persendirian) Licensees ..... 114
4.2.7 Summary of GIS ...................................................................................... 118
4.3 Goods Management Prototype ............................................................................. 118
4.3.1 Maps ........................................................................................................ 120
4.3.2 Goods ...................................................................................................... 123
4.3.3 Waste ....................................................................................................... 131
4.3.4 Options .................................................................................................... 137
4.4 Potential Benefits of Goods Management ........................................................... 145
4.4.1 Direct Potential Benefits ......................................................................... 146
4.4.2 Indirect Potential Benefits ....................................................................... 150
CHAPTER 5: CONCLUSION .................................................................................. 157
REFERENCES ............................................................................................................ 160
APPENDICES ............................................................................................................. 176
Univers
ity of
Mala
ya

ix
LIST OF FIGURES
Figure 1.1 : London Bathing Season published in Punch periodical.............. 2
Figure 1.2 : Monster Soup commonly called Thames Water.......................... 2
Figure 1.3 : Recycling bins and center........................................................... 3
Figure 1.4 : Ownership of mobile phones versus basic utilities and services in 2020........................................................................................
6
Figure 2.1 : Relative percentage of waste...................................................... 15
Figure 2.2 : Projection of total MSW generation by region............................ 16
Figure 2.3 : MSW generation per capita versus income level, i.e., GNI per capita by country.........................................................................
16
Figure 2.4 : Recycling rate versus income level, i.e., GNI per capita by city.. 17
Figure 2.5 : MSW composition by income level............................................ 18
Figure 2.6 : Global annual MSW disposal..................................................... 18
Figure 2.7 : Average percentage of controlled disposal versus income level. 19
Figure 2.8 : Concentration of plastic debris in the ocean................................ 20
Figure 2.9 : Projection of Malaysia’s daily MSW generation........................ 21
Figure 2.10 : Malaysia’s percentage of MSW.................................................. 22
Figure 2.11 : Malaysia’s household waste composition................................... 22
Figure 2.12 : Waste management hierarchy..................................................... 28
Figure 2.13 : Life cycle stages......................................................................... 28
Figure 2.14 : Circular economy, life cycle and waste management................. 33
Univers
ity of
Mala
ya

x
Figure 2.15 : Zero Waste hierarchy by Zero Waste International Alliance...... 35
Figure 2.16 : Sustainable Developments Goals............................................... 49
Figure 2.17 : WHM (Winning the Hearts and Mind) & C4E (Communicate, Educate, Engage, Empower, Enforce) approach.........................
53
Figure 2.18 : Design characteristics of shopping portal, Amazon, containing departments, list of goods, photos, description and reviews........
56
Figure 2.19 : Design characteristics of shopping portal, eBay, containing categories, list of goods, photos, description and reviews...........
57
Figure 2.20 : Design characteristics of reuse portals, Olio (top) & Letgo (bottom), containing photos, description, location and categories of goods.....................................................................
58
Figure 2.21 : Design characteristics of reuse portal, Village, containing photos, description and categories of goods................................
59
Figure 2.22 : Design characteristics of how-to portal, wikiHow, containing procedures for proper usage and disposal...................................
61
Figure 2.23 : Design characteristics of product guide portals, Macworld (left) & TechRadar (right), containing reviews, pros and cons............
61
Figure 2.24 : Design characteristics of product guide portal, MacRumors, containing product release timeline and review..........................
62
Figure 3.1 : The flow of methodology............................................................ 63
Figure 3.2 : Map of Kuala Lumpur and its provinces (mukim)....................... 66
Figure 3.3 : Creation of GIS map of business licensees.................................. 67
Figure 4.1 : Classification of goods and services providers........................... 71
Figure 4.2 : Color schemes used for heat maps in Esri Maps for Office (left) and ArcGIS Maps for Office (right)...........................................
76
Univers
ity of
Mala
ya

xi
Figure 4.3 : Premise (Premis) licensees—catalog, clusters and heat map...... 80
Figure 4.4 : Premise (Premis) licensees—hot spots: p-value & z-score......... 81
Figure 4.5 : Premise (Premis) licensees—hot spots: FDR & Nearest Neighbors....................................................................................
82
Figure 4.6 : Vendor (Penjaja) licensees—catalog, clusters and heat map...... 86
Figure 4.7 : Vendor (Penjaja) licensees—hot spots: p-value & z-score......... 87
Figure 4.8 : Vendor (Penjaja) licensees—hot spots: FDR & Nearest Neighbors....................................................................................
88
Figure 4.9 : Signboard Advertisement (Iklan Papan Tanda) non-premise licensees— catalog, clusters and heat map..................................
91
Figure 4.10 : Signboard Advertisement (Iklan Papan Tanda) non-premise licensees—hot spots: p-value & z-score......................................
92
Figure 4.11 : Signboard Advertisement (Iklan Papan Tanda) non-premise licensees—hot spots: FDR & Nearest Neighbors........................
93
Figure 4.12 : Signboard Advertisement (Iklan Papan Tanda) premise licensees—catalog, clusters and heat map...................................
95
Figure 4.13 : Signboard Advertisement (Iklan Papan Tanda) premise licensees—hot spots: p-value & z-score......................................
96
Figure 4.14 : Signboard Advertisement (Iklan Papan Tanda) premise licensees—hot spots: FDR & Nearest Neighbors........................
97
Figure 4.15 : Game Entertainment (Hiburan Permainan) licensees—catalog, clusters and heat map..................................................................
100
Figure 4.16 : Game Entertainment (Hiburan Permainan) licensees—hot spots: p-value & z-score..............................................................
101
Figure 4.17 : Game Entertainment (Hiburan Permainan) licensees—hot spots: FDR & Nearest Neighbors................................................
102
Univers
ity of
Mala
ya

xii
Figure 4.18 : Evening Entertainment (Hiburan Malam) licensees—catalog, clusters and heat map..................................................................
106
Figure 4.19 : Evening Entertainment (Hiburan Malam) licensees—hot spots: p-value & z-score........................................................................
107
Figure 4.20 : Evening Entertainment (Hiburan Malam) licensees—hot spots: FDR & Nearest Neighbors..........................................................
108
Figure 4.21 : Liquor (Minuman Keras) licensees—catalog, clusters and heat map..............................................................................................
111
Figure 4.22 : Liquor (Minuman Keras) licensees—hot spots: p-value & z-score............................................................................................
112
Figure 4.23 : Liquor (Minuman Keras) licensees—hot spots: FDR & Nearest Neighbors....................................................................................
113
Figure 4.24 : Private Parking Lot (Tempat Letak Kereta Persendirian) licensees—catalog, clusters and heat map...................................
115
Figure 4.25 : Private Parking Lot (Tempat Letak Kereta Persendirian) licensees—hot spots: p-value & z-score......................................
116
Figure 4.26 : Private Parking Lot (Tempat Letak Kereta Persendirian) licensees—hot spots: FDR & Nearest Neighbors........................
117
Figure 4.27 : Main features of goods management prototype........................... 120
Figure 4.28 : Contents of “Maps”..................................................................... 121
Figure 4.29 : Screenshots of “Maps”................................................................ 122
Figure 4.30 : Contents of “Goods”................................................................... 123
Figure 4.31 : Screenshots of “Goods” (goods and services categories and action menu)................................................................................
126
Figure 4.32 : Screenshots of “Goods” (donation)............................................. 127
Univers
ity of
Mala
ya

xiii
Figure 4.33 : Screenshots of “Goods” (provider)............................................. 128
Figure 4.34 : Screenshots of “Goods” (product disposal)................................. 129
Figure 4.35 : Screenshots of “Goods” (product credentials)............................. 130
Figure 4.36 : Screenshots of “Goods” (services).............................................. 130
Figure 4.37 : Contents of “Waste”.................................................................... 131
Figure 4.38 : Screenshots of “Waste” (waste categories and action menu)....... 133
Figure 4.39 : Screenshots of “Waste” (organic waste infographic).................. 134
Figure 4.40 : Screenshots of “Waste” (recyclable waste infographic).............. 135
Figure 4.41 : Screenshots of “Waste” (other waste infographic)...................... 136
Figure 4.42 : Contents of “Options”................................................................. 137
Figure 4.43 : Screenshots of “Options” (main page and login page)................. 140
Figure 4.44 : Screenshots of “Options” (Law & Guidelines and Authority)..... 141
Figure 4.45 : Screenshots of “Options” (Feedback).......................................... 142
Figure 4.46 : Screenshots of “Options” (Facilities).......................................... 143
Figure 4.47 : Screenshots of “Options” (Events and Knowledge).................... 144
Figure 4.48 : Direct potential benefits of goods management........................... 146
Figure 4.49 : Indirect potential benefits of goods management........................ 150
Univers
ity of
Mala
ya

xiv
LIST OF TABLES
Table 1.1 : Percentage of time spent on apps by type....................................... 7
Table 2.1 : A Timeline of Trash...................................................................... 12
Table 2.2 : Malaysia’s MSW generation by year............................................. 21
Table 2.3 : Malaysia’s recycling rate by year.................................................. 23
Table 2.4 : Estimation of solid waste management costs for 2010 and 2025... 24
Table 2.5 : The intangible costs of waste......................................................... 25
Table 2.6 : Description of the waste hierarchy................................................ 29
Table 2.7 : PwC’s global megatrends.............................................................. 38
Table 2.8 : Hajkowicz’s global megatrends.................................................... 38
Table 2.9 : KPMG International’s global megatrends by group...................... 39
Table 2.10 : Summary of the SDGs................................................................... 49
Table 2.11 : Strategic objectives of Pelan Transformasi Minda........................ 54
Table 3.1 : Workflow in GIS software............................................................ 68
Table 3.2 : Critical p-values and z-scores for different confidence levels....... 68
Table 3.3 : Main features of goods management prototype............................. 69
Table 3.4 : Prototyping workflow................................................................... 70
Table 4.1 : Sources identified to collect data on goods and services providers 71
Table 4.2 : Categories of DBKL business licensee.......................................... 72
Table 4.3 : License datasets obtained from DBKL for year 2015.................... 73
Table 4.4 : Categories of Premise (Premis) licensees...................................... 77
Table 4.5 : Categories of Vendor (Penjaja) licensees..................................... 83
Table 4.6 : Categories of Signboard Advertisement (Iklan Papan Tanda) non-premise licensees...................................................................
89
Table 4.7 : Categories of Game Entertainment (Hiburan Permainan) licensees........................................................................................
98
Univers
ity of
Mala
ya

xv
Table 4.8 : Categories of Evening Entertainment (Hiburan Malam) licensees........................................................................................
103
Table 4.9 : Categories of Liquor (Minuman Keras) licensees......................... 109
Table 4.10 : Categories of Private Parking Lot (Tempat Letak Kereta Persendirian) licensees.................................................................
114
Table 4.11 : Goods and services categories in “Goods”.................................... 124
Table 4.12 : Waste categories in “Waste”......................................................... 132
Table 4.13 : Help sections................................................................................. 138
Univers
ity of
Mala
ya

xvi
LIST OF SYMBOLS AND ABBREVIATIONS
11MP : Eleventh Malaysia Plan
2R : Reduction and reuse / Reduce and Reuse
3D : Dirty, dangerous and demanding
3R : Reduce, Reuse, Recycle
AI : Artificial intelligence
C4E : Communicate, Educate, Engage, Empower, Enforce
C&D : Construction and demolition
C&I : Commercial and industrial
DBKL : Dewan Bandaraya Kuala Lumpur / Kuala Lumpur City Hall
DEB : Dasar Ekonomi Baru / New Economic Policy
ELV : End-of-life vehicle
EPA : Environmental Protection Agency
EPR : Extended producer responsibility
FDI : Foreign direct investment
FDR : False Discovery Rate
GDP : Gross Domestic Product
GHG : Greenhouse gas
GIS : Geographic Information System
GMS : Goods management system
GNI : Gross National Income
GPS : Global Positioning System
HHW : Hazardous household waste
ICT : Information and communications technology
IoT : Internet of Things
Univers
ity of
Mala
ya

xvii
KPKT : Kementerian Kesejahteraan Bandar, Perumahan dan Kerajaan Tempatan / Ministry of Urban Wellbeing, Housing and Local Government
LCA : Life-cycle assessment
MBT : Mechanical biological treatment
MDG : Millennium Development Goal
MSW : Municipal solid waste
OECD : Organisation for Economic Co-operation Development
POI : Place of Interest
PPP : Polluter-Pays Principle
PTM : Pelan Transformasi Minda / Mentality Transformation Plan
RDF : Refuse-derived fuel
RPF : Refuse-derived paper
RTCE : Related total consumer expenditure
SCP : Sustainable Consumption and Production
SDG : Sustainable Development Goal
SDSS : Spatial Decision Support System
SRF : Solid-recovered fuel
SWPCM : Solid Waste and Public Cleansing Management
TN50 : Transformasi Nasional 2050 / National Transformation 2050
UI : User Interface
UX : User Experience
UN DESA : United Nations
UNEP : United Nations Environment Programme
WGS84 : World Geodetic System 1984
WHM : Winning the Hearts and Minds
WTE : Waste-to-energy
Univers
ity of
Mala
ya

xviii
LIST OF APPENDICES
Appendix A : Categories of Premise (Premis) licensees (277/708).................. 176
Appendix B : Categories of Vendor (Penjaja) licensees (189/3694)................ 192
Appendix C : Categories of Evening Entertainment (Hiburan Malam) licensees (143/143).................................................................... 197
Appendix D : Legal Notices............................................................................. 202
Univers
ity of
Mala
ya

1
CHAPTER 1: INTRODUCTION
1.1 Background
There is arguably no issue more underrated than waste. Everyone realizes how misery,
sickness and poverty can affect each of their lives and why it is important to be content,
healthy and financially secure. But the same thing cannot be said for waste—most people
do not realize the effects of waste on themselves, society, the environment and the
economy, thus downplaying the importance of proper waste management such as Reduce,
Reuse and Recycle (3Rs). Historically, people have always been careless about waste.
Waste is not actually an issue from the outset because waste is naturally-occurring and
naturally degradable. Anthropogenic waste is the issue due to its enormous volume,
detrimental effects and low degradability which disrupts natural cycle.
In small quantities, waste may be disregarded as merely an issue of dirtiness and odor.
People have a habit of neglecting waste until the issue blows out of proportion. History
has taught that the issue of waste should not be taken lightly. Sheoal, a dumpsite in ancient
Jerusalem, periodically burned and became synonymous with hell based on historical
scriptures; in 1400, waste piled up so high outside of Paris gates that it interfered with
city defense (Barbalace, 2003). Perhaps the greatest example is the Great Stink: in the
summer of 1858, the River Thames became so contaminated—after centuries of being a
dumpsite—to the point that its overwhelming stench put London to a standstill (Lemon,
n.d.). The state of River Thames at that time developed a public fear of pestilence
(Lemon, n.d.). The government could barely function and even considered relocating the
Parliament to Oxford or St Albans after failing to mask the stench by soaking curtains in
lime chloride (UK Parliament, 2014). To the British people, the Great Stink was
degrading given the fact the British empire managed to colonized almost half of the world
Univers
ity of
Mala
ya

2
but failed to conserve its main river (Wilson, 2016). Figures 1.1 and 1.2 are examples of
satirical cartoons produced during that time. The River Thames was finally remediated
as the British government began constructing proper sewerage system to divert and
control wastewater flow (Lemon, n.d.).
Figure 1.1: London Bathing Season published in Punch periodical (The Victorian Web, n.d.)
Figure 1.2: Monster Soup commonly called Thames Water (Wellcome Collection, n.d.)
In modern times, proper waste management is founded upon the principles of 3Rs
(Reduce, Reuse and Recycle). Technically, there is a fourth R (Recover energy) and
Univers
ity of
Mala
ya
3
finally a D (Disposal) but the 3Rs have much wider recognition especially among the
general public (Urban Ore, 2010). 3Rs are systematic steps to effectively and efficiently
control and manage waste generation. Reduce means preventing and reducing waste or
wastage. There are a lot of ways to reduce. One of the easiest examples of prevention and
reduction are avoiding splurge or unnecessary shopping, and buying multiple-use goods
instead of single-use or disposable goods, respectively. People may refer to buyers’
guides, articles or websites for knowledge on goods and usage, and assistance in purchase
planning. Reuse means reusing and repairing goods to extend goods lifespan. Goods may
be reused by repurposing them, or donating or selling them to other people. Among the
platforms for reuse are donation boxes, second-hand stores, online portals such as eBay
and Freecycle, and repair shops. Besides repair, goods may also be upgraded as part of
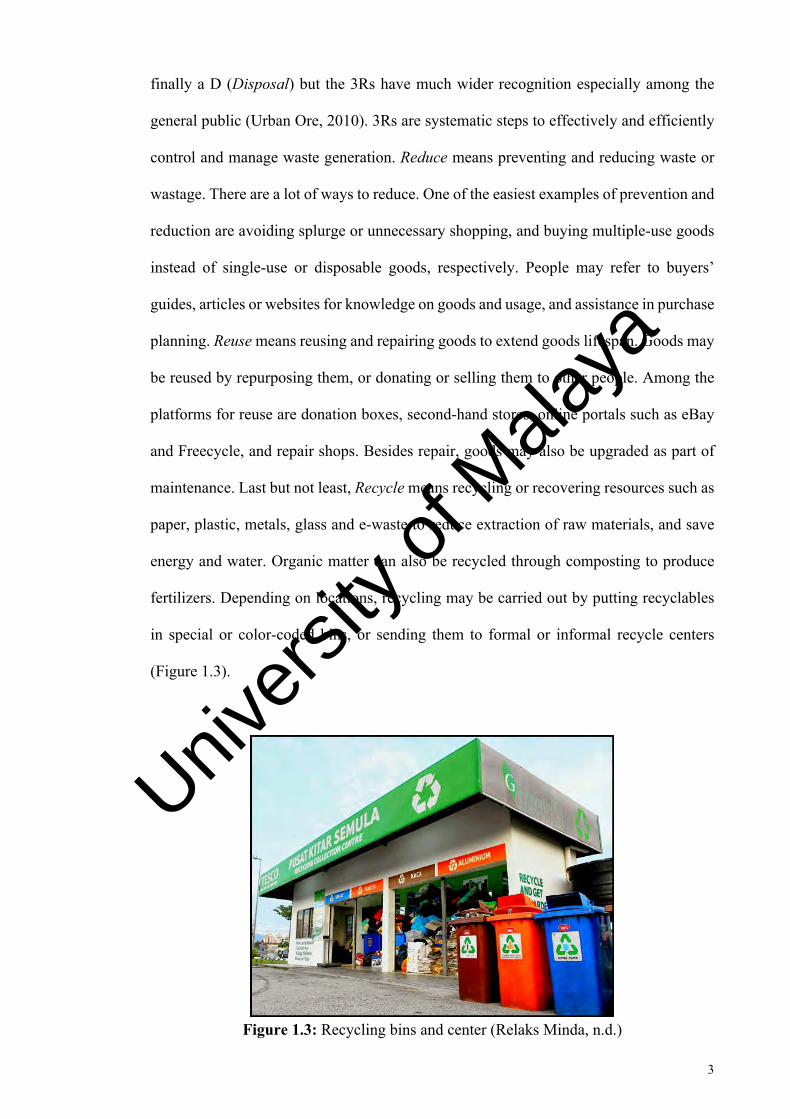
maintenance. Last but not least, Recycle means recycling or recovering resources such as
paper, plastic, metals, glass and e-waste to reduce extraction of raw materials, and save
energy and water. Organic matter can also be recycled through composting to produce
fertilizers. Depending on locations, recycling may be carried out by putting recyclables
in special or color-coded bins, or sending them to formal or informal recycle centers
(Figure 1.3).
Figure 1.3: Recycling bins and center (Relaks Minda, n.d.)
Univers
ity of
Mala
ya

4
Proper waste management is one of the key areas to achieve sustainable development.
Sustainable development is defined in the Brundtland Report 1987 as development that
meets the needs of the present without compromising the ability of future generations to
meet their own needs (Malaysia Productivity Corporation, 2010). It may only be achieved
if nations worldwide can overcome obstacles in the form of global megatrends. Global
megatrends are not merely issues—they are the larger geopolitical, environmental,
economic, social and technological forces that are shaping the future of the world in
profound ways (Hajkowicz, 2015; KPMG International, 2014; PwC, 2016). Among the
list of global megatrends by Hajkowicz (2015), KPMG International (2014) and PwC
(2016) are:
1. Resource scarcity & global climate change
2. Rapid urbanization
3. Ageing population & changing demographics
4. Economic power shift
5. Public debt
6. Porous boundaries & the imperative to innovate
7. Digital immersion
8. Great expectations of services & experiences
Such megatrends have direct and indirect relationship with waste. As the world
population increases and more cities are developed, economies will boom and human
activities will grow in numbers and complexity. This results in the evolution of goods
and services. Subsequently, all goods will become waste hence waste volume will
dramatically escalate, leading to pollution, resource scarcity and climate change. This is
why proper waste management is a key to achieving sustainable development.
Univers
ity of
Mala
ya

5
The most proper way to manage waste is to prevent rather than treat. An ounce of
prevention is better than a pound of cure. All wastes come from goods, thus prevention
of waste is possible through management of goods. Goods and services can never be
prevented as they are significant elements of human activities. Human culture and life
revolve around interaction with goods and services, be they natural or artificial. For that
reason, archaeologists and garbologists analyze remnants or waste to study human culture
and history (Rathje & Murphy, 2001). However, these fields only deal with retrospect or
hindsight. Goods management, on the other hand, can combine hindsight (past) with
insight (present) and foresight (future). A system which incorporates databases and maps
of goods and services can store historical records of goods and services, provide real-
time assistance to people in finding relevant goods and services, and provide data to
governments for urban planning and emergency preparedness (Yunus & Hassan, 2010).
In the age of digital immersion, goods management must take advantage of and
integrate with apps. Today, apps are ubiquitous—mobile computing has improved so
much since Apple revolutionized app development by launching the App Store in July
2008 (Apple, 2008). The revolution of apps has transformed mobile phones from
telecommunication devices to mobile computers. As of March 2017, the number of apps
available in the two leading app stores in the world—Google Play Store and Apple’s App
Store—was 2.8 million and 2.2 million apps, respectively (Statista, 2017a). The number
of apps downloaded worldwide in 2016 was 149.3 billion and it was forecasted to
increase to 197 billion in 2017 (Statista, 2017b). In term of worldwide users, it was
estimated that there were 2.32 billion smartphone users out of 4.77 billion mobile phone
users in 2017 (Statista, 2015, 2016). To put in perspective, the world’s population was
estimated around 7.55 billion in the same year (UN DESA, 2017). Based on the
proliferation of mobile phones, Cisco (2016) forecasted that more people will have
Univers
ity of
Mala
ya

6
mobile phones (5.4 billion) than utilities such as electricity (5.3 billion) and running water
(3.5 billion), and cars (2.8 billion) by 2020 (Figure 1.4).
Figure 1.4: Ownership of mobile phones versus basic utilities and services in 2020 (Cisco, 2016)
Apps—short for applications—typically refer to programs that run on mobile
operating systems on devices such as smartphones, tablets and wearables, and also on
web browsers. Apps are often built around targeted workflows that deliver streamlined
user experiences (Esri, n.d.). Apps extend the capabilities of mobile devices by enabling
users to perform particular tasks (Purcell et al., 2010). The versatility of apps is
transforming the way people socialize, work, study, play, entertain, exercise, navigate,
travel, search and transact. In other words, the way people interact with goods and
services. Even so, most people have not taken full advantage on apps and mobile
computing. Exact figures are impossible to obtain but on average, most of the time spent
on apps are on entertainment (including games) and social networking (Table 1.1).
Therefore, goods management should leverage the potentials of mobile computing and
become digitally immersed. As an app, goods management system will be more
accessible and more optimized to assist people in finding relevant goods and services in
Univers
ity of
Mala
ya

7
order to foster Reduce and Reuse.
Table 1.1: Percentage of time spent on apps by type (GO-Globe, 2015) Games 43% Social networking 26% Entertainment 10% Utilities 10% News 2% Productivity 2% Health & fitness 1% Lifestyles 1% Others 5%
As the world moves along the course set by megatrends, the necessity of sustainability
has become more pronounced than ever. The sorry state of the world is caused by none
other than mankind, as revealed in the Quran:
Mischief has appeared on land and sea because of (the meed) that the hands of men have earned, that (Allah) may give them a taste of some of their deeds; in order that they may turn back (from Evil). (Quran 30:41)
In response to this circumstance, this treatise proposes goods management as a
methodical means not just to reduce waste but also to realize sustainable and ethical way
of life. The cornerstone of goods management is goods appreciation. Goods management
is not and should not be a situational or temporary conduct. Mankind must express
appreciation or thankfulness for the blessings that Allah have bestowed upon them at all
times, not just hard times. Nothing whatsoever should be taken for granted. As caliphs
(vicegerents) of Earth, it is the responsibility of mankind to develop Earth sustainably.
May this effort contribute to the betterment of mankind for the sake of Allah.
1.2 Problem Statement
Mismanagement of waste is costly around the world including in Malaysia.
Approximately US$205.4 billion was spent globally on waste management in 2010 and
Univers
ity of
Mala
ya

8
it is estimated to increase to $375.5 billion by 2025 (Hoornweg & Bhada-Tata, 2012). On
the other hand, the impacts of waste on the environment, society and economy are
incalculable. Waste generation is not just growing fast but faster than urbanization. Now,
it is more crucial than ever to see the bigger picture and think beyond waste. The best
way to prevent waste is to control the source of waste, i.e., goods. Goods management is
needed to replace the limitative approach of waste management with a holistic approach.
Waste management is an end-of-life management whereas goods management is a life
management. Waste management does actually manage goods through Reduce and Reuse
but in literature, such phases are often designated as waste diversion instead of goods
management. Also, from a semantic point of view, waste management is a misnomer
because its name emphasizes waste whereas waste is actually what is needed to be de-
emphasized, i.e., reduced. This is why a paradigm shift is needed to overcome the paradox
of waste management.
Currently, no such system exists—at least in Malaysia—for an integrated reduction
and reuse that actively involves the government, providers and consumers. Therefore, it
is important to develop a system for goods management. According to Palmer (n.d.),
designing Zero Waste solutions require strong social engineering. Such a system should
promote appreciation of goods as they are elements of human culture and life. This is
because goods are materials that humans use or create to fulfill their needs and wants.
1.3 Objectives
The general objective of this research is to develop an app as a model for goods
management. The model will deliver a systemic approach to minimize waste and
Univers
ity of
Mala
ya

9
maximize the potential of goods and services through reduction and reuse. In order to
develop the model, this research undertook four specific objectives:
i. To collect current data on goods and services in Malaysia, and apps or
websites related to shopping, reuse and how-tos/product guides.
ii. To create a GIS map in order to analyze the type and spatial distribution of
goods and services providers in Kuala Lumpur.
iii. To develop a goods management system prototype with functional contents
involving mapping, goods and waste.
iv. To evaluate the potential benefits or applications of goods management
system.
Univers
ity of
Mala
ya
10
CHAPTER 2: LITERATURE REVIEW
2.1 Waste and People
Waste can be interpreted in many ways, especially among scientific and legal bodies.
Paul Palmer (2004b), the founder of Zero Waste, defines waste as any object whose
owner does not wish to take responsibility for it. Basel Convention interprets wastes as
substances or objects which are disposed of or are intended to be disposed of or are
required to be disposed of by the provisions of national laws [United Nations
Environment Programme (UNEP), 2002]. The United Nations Statistics Division groups
wastes along with emissions to air and wastewater as residuals; it interprets wastes as:
materials that are not prime products (that is products produced for the market) for which the generator has no further use in terms of his/her own purposes of production, transformation or consumption, and of which he/she wants to dispose. Wastes may be generated during the extraction of raw materials, the processing of raw materials into intermediate and final products, the consumption of final products, and other human activities. Residuals recycled or reused at the place of generation are excluded (UNEP, 2002).
The Organisation for Economic Co-operation Development (OECD) interprets waste by
categories:
1. Municipal waste is collected and treated by, or for municipalities that covers waste from households, including bulky waste, similar waste from commerce and trade, office buildings, institutions and small businesses, yard and garden, street sweepings, contents of litter containers, and market cleansing. Waste from municipal sewage networks and treatment, as well as municipal construction and demolition is excluded.
2. Hazardous waste is mostly generated by industrial activities and driven by specific patterns of production that represents a major concern as it entails serious environmental risks if poorly managed: the impact on the environment relates mainly to toxic contamination of soil, water and air.
3. Nuclear (radioactive) waste is generated at various stages of the nuclear fuel cycle (uranium mining and milling, fuel enrichment, reactor operation, spent fuel reprocessing) arises from decontamination and decommissioning of nuclear facilities, and from other activities using isotopes, such as scientific research and medical activities. (UNEP, 2002)
According to the Environmental Quality Act 1974 of Malaysia, waste includes:
Univers
ity of
Mala
ya

11
any matter prescribed to be scheduled waste, or any matter whether in a solid, semi-solid or liquid form, or in the form of gas or vapor which is emitted, discharged or deposited in the environment in such volume, composition or manner as to cause pollution (Attorney General Chambers of Malaysia, 2006)
The Solid Waste and Public Cleansing Management (SWPCM) Act 2007 of Malaysia
interprets as:
“Solid waste” includes: a) any scrap material or other unwanted surplus substance or rejected
products arising from the application of any process; b) any substance required to be disposed of as being broken, worn out,
contaminated or otherwise spoiled; c) or any other material that according to this Act or any other written law is
required by the authority to be disposed of, but does not include scheduled wastes as prescribed under the Environmental Quality Act 1974 [Act 127], sewage as defined in the Water Services Industry Act 2006 [Act 655] or radioactive waste as defined in the Atomic Energy Licensing Act 1984 [Act 304].
“Controlled solid waste” means any solid waste falling within any of the following categories:
• Commercial solid waste • Construction solid waste • Household solid waste • Industrial solid waste • Institutional solid waste • Imported solid waste • Public solid waste • Solid waste which may be prescribed from time to time [Jabatan
Pengurusan Sisa Pepejal Negara (JPSPN), 2013]
In essence, wastes are goods that are not useful—either non-functional, non-beneficial,
harmful or unclean—to the user, and/or not needed nor wanted by the user. Goods
become wastes for objective or subjective reasons.
Waste is an indicator of worldly activity. Its ubiquity attests to its significance in the
cycle of life. Likewise, goods are also an indicator. The difference is that goods precede
waste as all wastes comes from goods. The study of waste has given much insight into
Univers
ity of
Mala
ya

12
civilizations over the years. Humans are naturally careless with waste so it is not a trait
of the 20th century. Garbologists have discovered that people let waste fall where it may.
Anthropogenic waste has been a problem since humans’ earliest time. Four basic means
of dealing with waste have been used over and over in history which are dumping,
burning, recycling, and waste minimization (Barbalace, 2003). Table 2.1 outlines the
timeline of the history of trash.
Table 2.1: A Timeline of Trash (Barbalace, 2003)
A Timeline of Trash
Date Location Notes
6,500 BC North
America
Archaeological studies show a clan of Native Americans in what is now Colorado produced an average of 2.4 kilograms of waste a day.
500 BC Athens, Greece
First municipal dump in western world organized. Regulations required waste to be dumped at least a mile from the city limits.
New Testament of Bible
Jerusalem, Palestine
The Valley of Gehenna, also called Sheoal, in the New Testament of the Bible "Though I descent into Sheoal, thou art there." Sheoal was apparently a dump outside of the city that periodically burned. It became synonymous with "hell."
1388 England English Parliament bars waste dispersal in public waterways and ditches.
1400 Paris, France Garbage piles so high outside of Paris gates that it interferes with city defence.
1690 Philadelphia Rittenhouse Mill, Philadelphia makes paper from recycled fibers (waste paper and rags).
1842 England A report links disease to filthy environmental conditions - "age of sanitation" begins.
1874 Nottingham,
England
A new technology called "the Destructor" provided the first systematic incineration of refuse in Nottingham, England. Until this time, much of the burning was accidental, a result of methane production.
1885 Governor's Island, NY
The first garbage incinerator was built in USA (on Governor's Island in New York)
1889 Washington,
D.C. Washington, D.C. reported that they were running out of appropriate places for refuse.
Univers
ity of
Mala
ya

13
Table 2.1, continued.
A Timeline of Trash
Date Location Notes
1896 United States Waste reduction plants arrive in United States. (For compressing organic wastes). Later closed because of noxious emissions.
1898 New York New York has first rubbish sorting plant for recycling Turn of Century By the turn of the century the garbage problem was seen as
one of the greatest problems for local authorities.
1900
"Piggeries" were developed to eat fresh or cooked garbage (In the mid-50's an outbreak of vesicular exanthema resulted in the destruction of 1,000s of pigs that had eaten raw garbage. Law passed requiring that garbage had to be cooked before it could be fed to swine).
1911 New York City
New York City citizens were producing 2.1 kilograms of waste a day
1914 United States There were about 300 incinerators in the United States for burning trash.
1920's Landfills were becoming a popular way of reclaiming swamp land while getting rid of trash.
1954 Olympia, Washington Olympia, Washington pays for return of aluminium cans.
1965 United States The first federal solid waste management laws were enacted.
1968 By 1968 companies began buy back recycling of containers.
1970 United States The first Earth Day was celebrated, the Environmental Protection Agency (EPA) created and the Resource Recovery Act enacted.
1976 United States
In 1976 Resource Conservation and Recovery Act (RCRA) was created emphasizing recycling and waste management. This was the result of two major events: the oil embargo and the discovery (or recognition) of Love Canal.
1979 United States The Environmental Protection Agency (EPA) issued criteria prohibiting open dumping.
Today The list goes on and on.
The nature of the waste varies greatly from one civilization to another. Studies
indicated that Americans are more wasteful than similar civilizations of the past.
According to Barbalace (2003), there is an archaeological account of Native Americans
in Colorado around 6500 BC who killed 200 buffalo in one day and butchered 150 of
them, carrying away enough meat to feed 150 people for 23 days and leaving some 8,337
Univers
ity of
Mala
ya

14
kg of bones behind. In comparison, she stated that 150 modern day Americans would
produce about 6,418 kg of waste in 23 days. Based on the weight of the bones that
remained, the Native Americans in that clan produced about 2.4 kg of waste a day as
compared to 1.1 kg a day, which is a moderate figure for middle class American
consumption (Barbalace, 2003).
2.1.1 State of Waste Around the World
Waste generation levels are increasing fast around the world. Hoornweg and Bhada-
Tata (2012) from the World Bank estimated that, in 2012, the global municipal solid
waste (MSW) generation levels were approximately 1.3 billion tonnes of solid waste (per
capita generation rate of 1.2 kg per person per day). By 2025, the global MSW generation
levels were expected to increase to 2.2 billion tonnes per year (1.42 kg per person per
day) (Hoornweg & Bhada-Tata, 2012). However, in 2015, UNEP published a report
stating that—based on a best ‘order of magnitude’ estimate—the global MSW generation
levels may have reached around 2 billion tonnes per year. Urban wastes—MSW,
commercial and industrial (C&I) waste, and construction and demolition (C&D) waste—
were estimated around 7 to 10 billion tonnes per year (Wilson et al., 2015). Figure 2.1
shows the relative percentage of waste based on sectors, using OECD data as proxy.
However, such data does not include mining, and agriculture and forestry waste. Waste
is generated since the beginning of goods life cycle, thus the total global waste generated
may be greater than 10 billion tonnes per year.
Univers
ity of
Mala
ya

15
Figure 2.1: Relative percentage of waste (Wilson et al., 2015)
In term of waste generation growth rate, all except the high income regions of the
world are growing rapidly as populations rise, migration to cities continues, and
economies develop. In 2010, the traditional high income regions accounted for around
half of all waste generation (Wilson et al., 2015). But around 2030, Asia is forecasted to
overtake these countries in terms of overall MSW generation. Later in the century, Africa
could potentially overtake both (Wilson et al., 2015). Figure 2.2 shows the projection of
total MSW generation by region. Despite stabilized waste generation rate, high income
regions still generate higher amount of MSW compared to middle and low income
regions (Figure 2.3). This shows that waste generation is directly proportional to income
levels. However, such relationship is not evident between recycling rates and income
levels (Figure 2.4). On average, high income regions have closely similar recycling rates
with lower-middle income regions (~30%) while low income regions share rates with
upper-middle income regions (~10%). It is important to note that these recycling rates
may refer to rates of waste diverted rather than rates of goods resold, goods recaptured or
resources saved (Palmer, 2004a).
Univers
ity of
Mala
ya

16
Figure 2.2: Projection of total MSW generation by region (Wilson et al., 2015)
Figure 2.3: MSW generation per capita versus income level, i.e., GNI per capita by country (Wilson et al., 2015)
Univers
ity of
Mala
ya

17
Figure 2.4: Recycling rate versus income level, i.e., GNI per capita by city (Wilson et
al., 2015)
Solid waste is generally considered an urban issue. In rural areas, waste generation
rates tend to be much lower because—on average—residents are usually poorer, purchase
fewer store-bought items (therefore less packaging), and have higher levels of reuse and
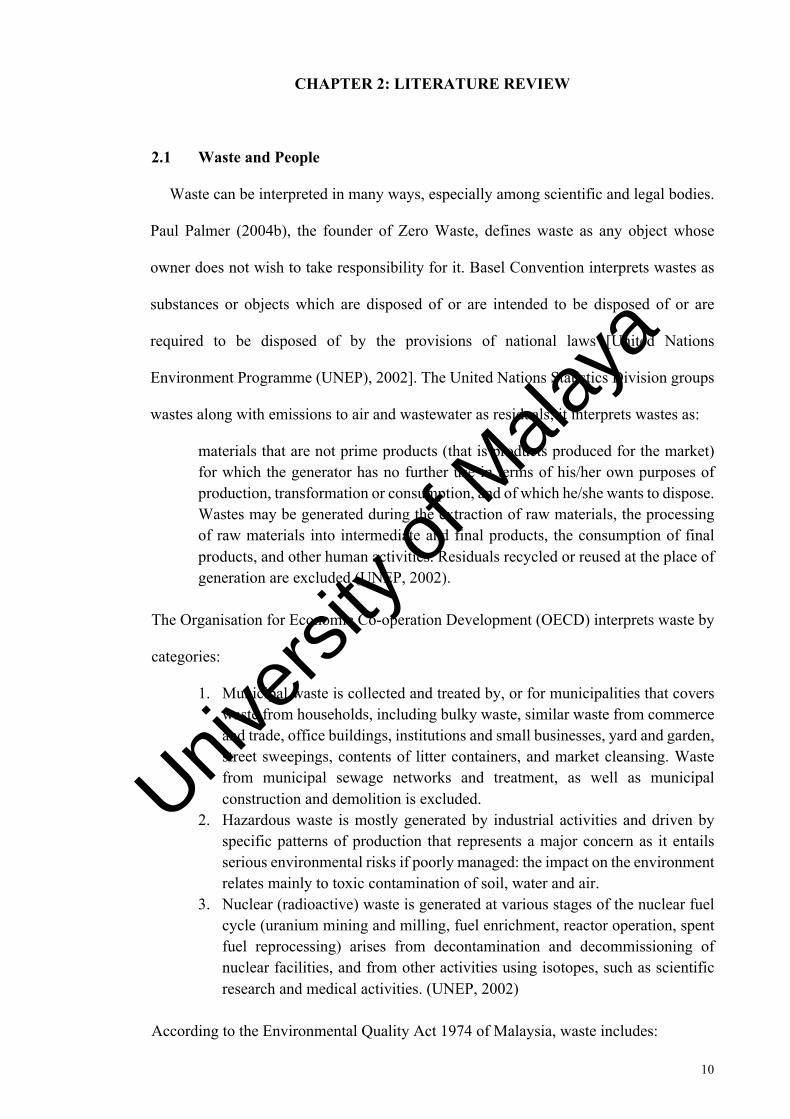
recycling (Hoornweg & Bhada-Tata, 2012). Waste composition is influenced by income
levels as well as rate of industrialization, culture, geography, climate and energy sources
(Hoornweg & Bhada-Tata, 2012). On average, organic waste is more prevalent in low
and middle income regions whereas recyclables such as paper, plastics, metals and glass
are more prevalent in middle and high income regions (Figure 2.5). In term of waste
management, disposal in landfills and dumps is still the main option due to its lower cost,
lower (or lack of) technology requirement and lack of access to waste collection and
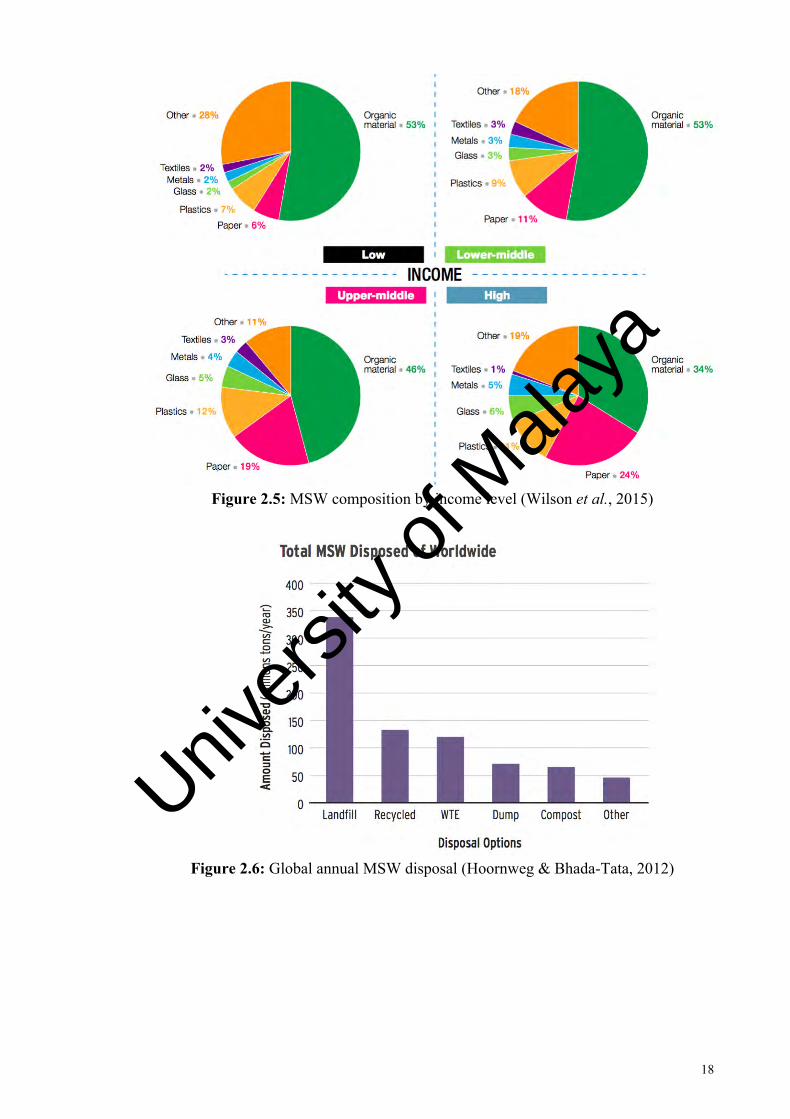
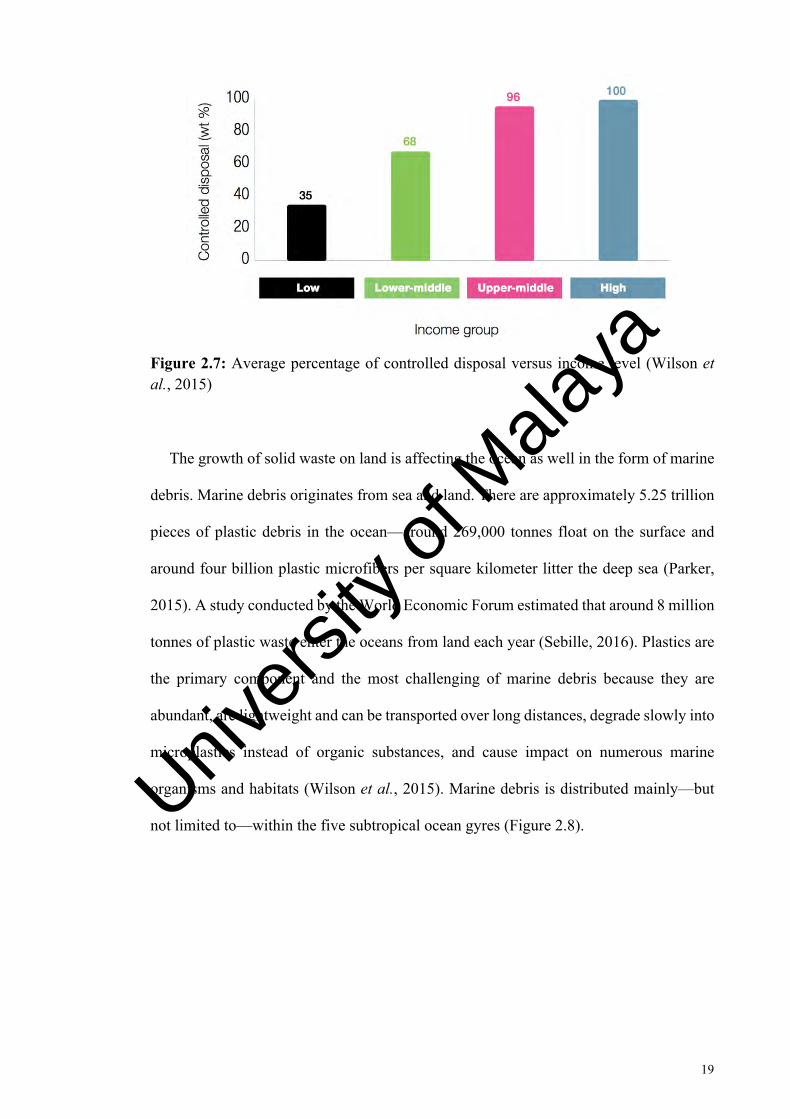
controlled disposal (Figure 2.6). Uncontrolled disposal—i.e., open dumping and open
burning—is particularly prevalent in low and lower-middle income regions (Figure 2.7).
Univers
ity of
Mala
ya
18
Figure 2.5: MSW composition by income level (Wilson et al., 2015)
Figure 2.6: Global annual MSW disposal (Hoornweg & Bhada-Tata, 2012)
Univers
ity of
Mala
ya
19
Figure 2.7: Average percentage of controlled disposal versus income level (Wilson et al., 2015)
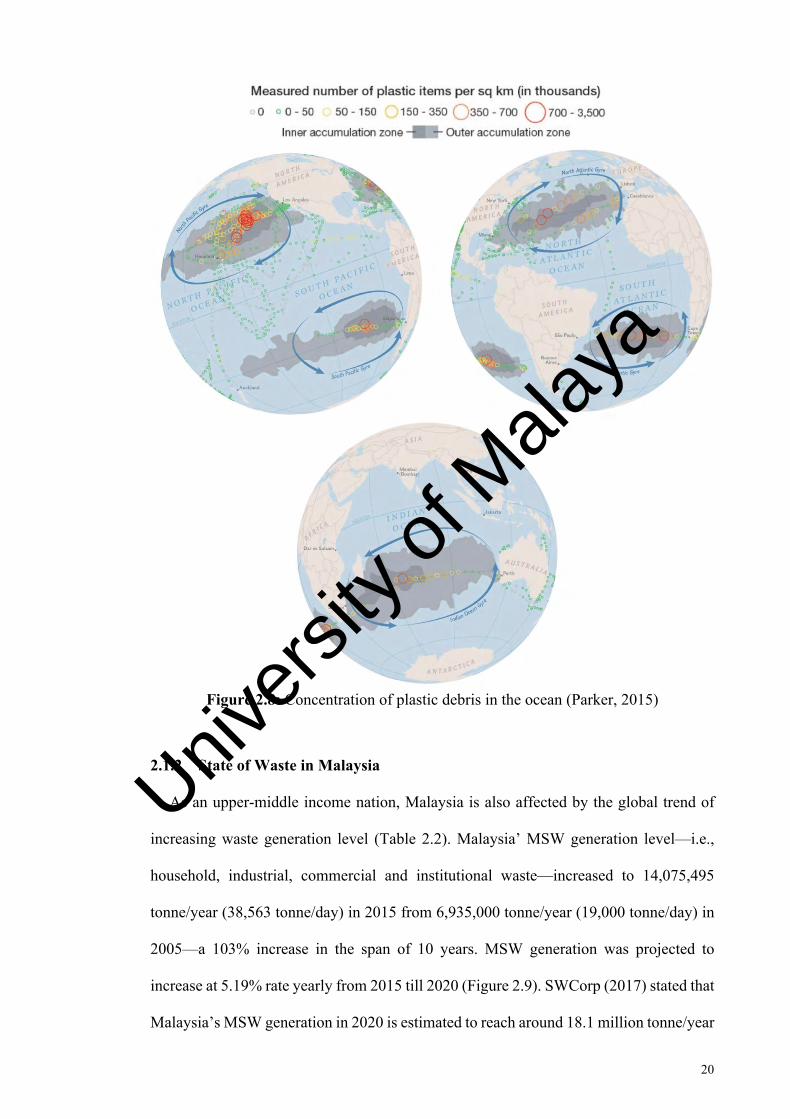
The growth of solid waste on land is affecting the ocean as well in the form of marine
debris. Marine debris originates from sea and land. There are approximately 5.25 trillion
pieces of plastic debris in the ocean—around 269,000 tonnes float on the surface and
around four billion plastic microfibers per square kilometer litter the deep sea (Parker,
2015). A study conducted by the World Economic Forum estimated that around 8 million
tonnes of plastic waste enter the oceans from land each year (Sebille, 2016). Plastics are
the primary component and the most challenging of marine debris because they are
abundant, are lightweight and can be transported over long distances, degrade slowly into
microplastics instead of organic substances, and cause impact on numerous marine
organisms and habitats (Wilson et al., 2015). Marine debris is distributed mainly—but
not limited to—within the five subtropical ocean gyres (Figure 2.8). Univers
ity of
Mala
ya
20
Figure 2.8: Concentration of plastic debris in the ocean (Parker, 2015)
2.1.2 State of Waste in Malaysia
As an upper-middle income nation, Malaysia is also affected by the global trend of
increasing waste generation level (Table 2.2). Malaysia’ MSW generation level—i.e.,
household, industrial, commercial and institutional waste—increased to 14,075,495
tonne/year (38,563 tonne/day) in 2015 from 6,935,000 tonne/year (19,000 tonne/day) in
2005—a 103% increase in the span of 10 years. MSW generation was projected to
increase at 5.19% rate yearly from 2015 till 2020 (Figure 2.9). SWCorp (2017) stated that
Malaysia’s MSW generation in 2020 is estimated to reach around 18.1 million tonne/year
Univers
ity of
Mala
ya

21
(49,670 tonne/day) whereas C&D generation is estimated to reach around 13.3 million
tonne/year (36,473 tonne/day). Thus, Malaysia’s urban waste is estimated to reach 31.4
million tonne/year. MSW is the major contributor to solid waste in Malaysia, surpassing
industrial or manufacturing waste and C&D waste (SWCorp, 2017).
Table 2.2: Malaysia’s MSW generation by year (Muzdalifah Mustapha, 2016; NEHAP Malaysia, 2016; Department of Statistics, Malaysia, 2017) Total Waste Generated Total Disposed to Landfills
Tonne/Year Tonne/Day Tonne/Day Percentage 2005 6,935,000 19,000 18,050 95% 2012 12,092,450 33,130 30,129 90.9% 2015 14,075,495 38,563 35,335 91.6%
Figure 2.9: Projection of Malaysia’s daily MSW generation (KPKT, 2015)
Based on 2012 MSW data, Malaysia generated approximately 33,130 tonne/day which
equals to per capita generation rate of 1.17 kg/person/day (Department of Statistics
Malaysia, 2017). Households were the major contributor to Malaysia’s MSW generation
(12,092,450 tonne/year) at 65% (7,860,092 tonne/year) followed by commercials and
Univers
ity of
Mala
ya

22
institutions at 28% (3,385,886 tonne/year) and industries at 7% (846,472 tonne/year)
(Figure 2.10). Industries contributed the least as MSW was not the main waste.
Approximately 2,854,516.8 tonne/year of scheduled waste (hazardous waste) was
generated by industries which did not count towards MSW (Department of Statistics
Malaysia, 2017). Figure 2.11 shows organic waste (51%)—i.e., food waste (45%) and
garden waste (6%)—predominate Malaysian household waste followed by plastics
(13%), diapers (12%) and paper (9%) (KPKT, 2015). High organic waste content is
typical of upper-middle income nations. The prominence of diapers (disposable sanitary
products) and the commingling of domestic waste with hazardous household waste
(HHW) including e-waste are some of the growing concerns in Malaysia’s MSW
management.
Figure 2.10: Malaysia’s percentage of MSW (KPKT, 2015)
Figure 2.11: Malaysia’s household waste composition (KPKT, 2015)
Recycling rate is low but has been steadily increasing over the years (Table 2.3). The
Malaysian government aims to reach 30% recycling rate by 2020 (SWCorp, 2018). On 1
September 2015, the government began implementing a law on solid waste separation at
source under the Solid Waste Management and Public Cleansing Act 2007 (Act 672) in
Kuala Lumpur, Putrajaya, Pahang, Johor, Melaka, Negeri Sembilan, Perlis and Kedah.
Univers
ity of
Mala
ya

23
According to the Dewan Rakyat session on 23 March 2017, a total of 1,719 tonnes of
recyclables were collected from door to door since the enforcement of solid waste
separation at source on 1 June 2016. This led to a 10.2% (358,489 tonne/year) reduction
of solid waste disposed in landfills (KPKT, 2017). The implementation of 3R programs
and solid waste separation is improving recycling rate and reducing disposal to landfills
(KPKT, 2017).
Table 2.3: Malaysia’s recycling rate by year (UPE, 2015; SWCorp, n.d., 2018) Malaysia’s Recycling Rate
2010 5.00% 2012 10.5% 2014 13.2% 2015 15.7% 2016 17.5% 2017 21.0%
2.2 Costs of Waste
2.2.1 Tangible Costs
Waste management involves a lot of money. It is costly for governments but lucrative
for waste capitalists—especially those who profit from resource and energy recovery—
because waste is renewable, inevitable and also increasing. According to Ali et al. (2012),
cost is the most important aspect for solid waste management system to operate in optimal
condition. Tangible, direct or financial cost covers investment cost and operation cost for
waste management. Tangibility refers to its calculability in the economics of waste. Aside
from politics, cost is also the bottleneck to environmentally sound waste management,
especially for low and lower-middle income countries (Hoornweg & Bhada-Tata, 2012;
World Bank, 2016). Environmentally sound waste management is in fact achievable but
not universally viable. Globally, solid waste management costs are estimated to increase
from US$205.4 billion in 2010 to US$375.5 billion in 2025 (Table 2.4).
Univers
ity of
Mala
ya

24
Table 2.4: Estimation of solid waste management costs for 2010 and 2025 (Hoornweg & Bhada-Tata, 2012)
Country Income Group 2010 Cost 2025 Cost
Low Income $1.5 billion $7.7 billion
Lower-Middle Income $20.1 billion $84.1 billion
Upper-Middle Income $24.5 billion $63.5 billion
High Income $159.3 billion $220.2 billion
Total Global Cost (US$) $205.4 billion $375.5 billion
In many lower income countries, municipalities already spend 20% to 50% of their
budgets on solid waste management, yet only manage to provide services for less than
half their citizens (Mugabi, 2014). According to Hoornweg and Bhada-Tata (2012), low
income countries allocate 80-90% of the budget on solid waste management to collection
but very little on disposal, middle income countries allocate 50-80% to collection and
spend much more on waste treatment and disposal than low income countries, and high
income countries allocate less than 10% to collection but spend most of the budget on
treatment and disposal. According to the World Bank (2016), solid waste management in
many developing countries can consume 20-50% of a city’s budget. In that regard, the
World Bank has been lending US$4.5 billion to support 329 solid waste management
programs around the globe since 2000. This is because countries on the verge of
transitioning from low to middle income status are hit particularly hard, with no tax or
fee structure to sustain solid waste programs and a population accustomed to using free,
open-air dumps (World Bank, 2016).
Financial cost of waste management in Malaysia is expected to keep increasing as
well. In 2015, Malaysia spent around RM2 billion on waste management and public
cleansing, compared to RM1.2 billion in 2013 (Utusan Malaysia, 2016). According to
KPKT (2015), public cleansing accounted for the majority of cost (63%) versus solid
Univers
ity of
Mala
ya

25
waste management (37%) in 2011-2014. Within the same period, the federal government
bore 61% (RM2,276 million) of the total cost while local authorities (PBTs) bore only
39% (RM1,337 million) (KPKT, 2015). According to Towonsing (2017), KPKT stated
that PBTs had to spend approximately 40-70% of the annual assessment tax revenue for
the purpose of waste collection and disposal.
2.2.2 Intangible Costs
Intangible costs (aka indirect, external or ghost costs) are costs or impacts of waste
borne by the environment, society and economy. Intangibility refers to complexity in
identification and calculation, thus making such costs often sidelined or externalized in
the economics of waste. Table 2.5 describes the breakdown of intangible costs.
Table 2.5: The intangible costs of waste Environment Society Economy
Pollution Disamenity Loss of property value Loss of natural resources Health hazards Loss of yield Loss of biodiversity Social unrest Disruption to industries Energy spending Climate change
Adapted from Zoï Environment Network and GRID-Arendal (2012).
Intangible costs are not necessarily monetary. They are best understood as the losses
that would be incurred if the commons is mismanaged or not managed at all. Intangible
costs greatly exceed tangible costs at least by a factor of 5-10 (UNEP, 2015). Nonetheless,
their significance should be based on pricelessness, rather than price. Environmentally
sound waste management is important in order to maintain the sustainability of home
planet. The lucrativeness of waste should only be a means to a sustainable end since
negative impacts due to exploitation of resources and waste can never be compensated
by money.
Univers
ity of
Mala
ya

26
Environmental cost represents the impacts of waste on the ecosystem. Emissions from
open dumps, open burning, landfills and incineration in the form of gases, fumes, leachate
and ashes will degrade the quality of natural resources such as air, aquifer, rivers, oceans
and soil. The physical, chemical and biological features of waste can harm lifeforms
through contact, cut, entanglement, ingestion, inhalation, skin absorption, contamination
and infection. Such stress on the whole ecosystem will cause the loss of biodiversity and
causing species extinction. Remediation or pollution control requires resources and
energy to function, leading to increase in greenhouse gas (GHG) emission. Constant
extraction of virgin materials for goods production will deplete more natural resources
and spend more energy than reuse and recycling (EPA, n.d.). All these will ultimately
lead to climate change which results in disasters, rise of diseases, loss of lives and
properties, food and water crisis, and ecological changes such as melting of polar ice
caps, rise of sea level, desertification and salinization of freshwater.
Social cost represents the impacts on human well-being. The presence of waste is a
disamenity to people in the vicinity. Such disamenity or discomfort is associated with
odor, decline in cleanliness and aesthetic value, pests and scavengers. Proximity to waste
treatment plants brings additional impacts such as heavy vehicle traffic and noise (Brown,
2003). Waste pose risks of health hazards such as vectors, pathogens, heavy metals,
particulates, fumes, fire, leachate, organic pollutants, inorganic pollutants, carcinogens,
mutagens and radiation (Zoï Environment Network & GRID-Arendal, 2012). The
collective stress exerted upon physical, mental and spiritual well-being can drastically
increase health and insurance expenditure needed to prevent, treat or alleviate diseases
and disorders. Personal or localized unrest, if not contained, can spread and magnify into
social or global unrest. The disamenity of waste will diminish the sense of ownership of
the land and increase dissatisfaction with poor governance. Loss of natural resources can
Univers
ity of
Mala
ya

27
affect quality of life due to the rise of cost of living and poverty (Samruhaizad
Samian@Samion et al., 2014).
Economic cost represents the financial impacts on sectors other than waste
management. Tenants are averse to invest in dirty, risky, visually unappealing or non-
strategically located properties. Such properties have a great risk of losing tenants,
resulting in loss of rental income and property tax which will lead to a subsequent loss in
capital value (Adeniran et al., 2014). Resource exploitation and pollution by waste will
cause ecosystem goods and services to decline. Consequently, the loss of yield will be
the effect of such decline. It will bring about unstable market price of commodities, goods
and services. Overall instability due to environmental, social and economic costs will
disrupt revenue stream of industries. These conditions will create a chain reaction among
various industries and disrupt their revenue streams. Tourism industry, in particular,
relies on the pleasant and aesthetic experience provided by visiting places of natural or
cultural value. Littering and poor sanitation can ruin such experience and nullify the
appeal of such places, thus resulting in loss of tourists and revenue.
2.3 Waste Management
Like the old adage “an ounce of prevention is worth a pound of cure”, waste
management is set on a hierarchic system, prioritizing the prevention of waste over its
treatment and disposal. This concept—known as waste management hierarchy, waste
hierarchy, or pollution prevention hierarchy (Figure 2.12)—began in the 1970s when the
environment movement started to critique the practice of disposal-based waste
management (Gertsakis & Lewis, 2003). Despite looking linear, waste management
hierarchy is not a cradle-to-grave approach. In fact, it is a series of options from most
desired to least desired. Cradle-to-grave is a term used in life cycle analysis to describe a
Univers
ity of
Mala
ya

28
linear model for materials that begins at the cradle of raw materials with resource
extraction, moves to goods production, followed by transportation, then use and, ends
with a grave where the goods are disposed of in a landfill. Waste is produced at all stages
of life cycle (Figure 2.13).
Figure 2.12: Waste management hierarchy
Figure 2.13: Life cycle stages (Venditti, n.d.)
Cradle-to-grave analysis or life-cycle assessment (LCA) is a technique to assess
environmental impacts associated with all the stages of a good’s life from raw material
extraction through materials processing, manufacture, distribution, use, repair and
maintenance, and disposal or recycling (The Global Development Research Center, n.d.).
Univers
ity of
Mala
ya

29
On the contrary, cradle-to-cradle is a term used to describe a material or good that is
recycled into a new product at the end of its life, so that ultimately there is no waste
(McDonough & Braungart, 2003). Cradle-to-grave is a direct contrast to cradle-to-cradle.
Waste management hierarchy is cradle-to-cradle ideal. Unfortunately, it is an ideal yet to
be realized entirely—due to environmental, economical, and political factors, the
majority of the world do not follow the hierarchy in proper sequence.
Table 2.6 describes the waste hierarchy or integrated waste management based on its
components, attributes and goals. A preventative approach seeks to eliminate or avoid
waste from the outset, an ameliorative approach can only ever reduce or minimize the
problem and an assimilative approach is underpinned by the view that the wider
ecosystem can continue absorbing and integrating the waste into a larger system
(Gertsakis & Lewis, 2003).
Table 2.6: Description of the waste hierarchy Hierarchy Component Attribute Goal
Reduce Prevention Reduction
Preventive Increase goods efficiency & reduce potential waste
Reuse Reuse Repair
Predominantly ameliorative Part preventive
Extend goods lifespan, or functional reuse
Recycle Recycling Composting
Predominantly ameliorative Part preventive
Recover materials from waste, or material reuse
Recover energy
Thermal treatment Biogas
Predominantly ameliorative Part assimilative
Recover energy from waste, or transform waste to energy
Dispose Landfill Assimilative Assimilate or isolate waste Adapted from Gertsakis and Lewis (2003).
The first order of the hierarchy, Reduce, is preventive as it manages waste from the
source, i.e., goods. Reduction goes hand in hand with prevention. Both prevention and
Univers
ity of
Mala
ya

30
reduction seek to minimize the amount of waste generated by reducing consumption,
redesigning goods to be more effective and efficient, or changing pattern of production
to maximize materials and minimize waste (Hoornweg & Bhada-Tata, 2012). Source
reduction is the most environmentally preferred strategy of the waste hierarchy as it
brings the most desirable outcomes in terms of saving natural resources, conserving
energy, reducing pollution, saving money and saving time.
The second order, Reuse, is predominantly ameliorative and part preventive. Reuse
comprises both reuse and repair. Reuse ameliorates by extending lifespan of used goods
through the practice of functional reuse thus prevent or delay the creation of waste.
Functional reuse means reusing or repairing goods that has already fulfilled their original
or primary function to serve similar or different function. Reuse does not involve
reprocessing or transforming goods into raw materials, thus it causes less environmental
impact than Recycle. Goods that are broken in parts or as a whole may be repaired with
new parts to maximize their lifespan, functionality as well as their value. Repairing
removes the need to replace broken goods with new goods that cost resources, energy
and money for the supply chain which creates waste and pollution. Sale or donation of
unwanted goods allows such goods to remain in circular economy and let other people
reuse and gain benefits for their needs and wants.
The third order, Recycle, is also predominantly ameliorative and part preventive.
Recycling includes composting of organic or wet waste. Recycling differs from reuse by
ameliorating used goods—ideally goods that cannot be reused—through the practice of
material reuse instead of functional reuse. Material reuse means reusing or recovering the
materials of goods to create similar or different goods. Recycle requires reprocessing of
used goods down to their main components which costs more and causes more
Univers
ity of
Mala
ya
31
environmental impact, hence making it less desired than Reuse. Segregation of waste into
organic and dry recyclable fractions is important to avoid cross-contamination, maintain
the quality of the materials, reduce health and safety related risks to waste pickers and to
the ecosystems around the waste treatment and disposal sites, which will lead to more
effective recycling (Wilson et al., 2015). Dry recyclables include but are not limited to
paper, plastic, metal, glass, ceramic, textile, wood, rubber, leather, stone and e-waste.
Organic waste such as food waste, garden waste and agricultural waste can be processed
into fertilizers according various composting techniques such as aerobic composting,
anaerobic digestion and vermicomposting. The benefits of recycling are reduced
quantities of disposed waste, the return of materials to the economy and reduced
environmental impacts compared to using virgin materials (Hoornweg & Bhada-Tata,
2012).
The fourth order, Recover energy, is predominantly ameliorative and part assimilative.
Energy recovery comprises both thermal treatment and biogas. It ameliorates by
recovering energy from waste—ideally goods that cannot be reused and recycled—and
assimilates by disposing residue of energy recovery. In the case of hazardous and clinical
waste, thermal treatment, in particular, is ameliorative and assimilative. It ameliorates
such waste by destroying pathogens and toxic contaminants in preparation for
assimilation or disposal in hazardous waste or secure landfills. Both thermal treatment
and biogas rely on the combustibility of waste, e.g., organic matter, paper, wood and
plastic as feedstock to generate heat or fuel on-site or off-site, respectively. Therefore, in
order to achieve high efficiency, non-combustible factors e.g., metals, inerts (for
example, glass, stones, sands) and moisture need to be removed prior to waste-to-energy
(WTE) treatment. Energy recovery is less desired than recycling because it costs even
more and causes more environmental impact than recycling particularly in the form of
Univers
ity of
Mala
ya

32
toxic emission of dioxin, furan, heavy metals and particulates. Thermal treatment
recovers energy in the form of heat; solid fuel such as refuse-derived fuel (RDF), solid-
recovered fuel (SRF), refuse-derived paper and plastic densified fuel (RPF); liquid fuel;
and gaseous fuel (UNEP, 2009). Techniques of thermal treatment include mass burn,
fluidized bed, gasification, pyrolysis, plasma arc gasification, steam autoclave and
mechanical biological treatment (MBT) (Simon, 2011; Zero Waste International
Alliance, n.d.). Biogas—primarily methane—is recovered from organic waste using
anaerobic digestion (Hoornweg & Bhada-Tata, 2012). Landfills that recover methane for
energy using anaerobic digestion are called bioreactor landfills. Odor and gas control is
critical to avoid pollution and disaster risk.
The last order, Dispose, is assimilative and comprises landfilling. Landfills are ideally
meant to assimilate or sequester residual waste—after reduction, reuse, recycling and
energy recovery—into the environment. As the ultimate approach, landfills are neither
preventive nor ameliorative. Unfortunately, landfills have been and are still the common
form of waste disposal worldwide especially in developing nations due to its low cost.
Landfills should be engineered and operated to protect the environment and public health
(Hoornweg & Bhada-Tata, 2012). Improper disposal may lead to various environmental,
social, health and economic issues such as soil, water, air and odor pollution, disease
infection, psychological problems, and loss of property value (Zoï Environment Network,
& GRID-Arendal, 2012). Thus, sanitary landfills with a combination of liners, leak
detection, leachate collection systems, and gas collection and treatment systems
(Hoornweg & Bhada-Tata, 2012) are the ideal forms of landfills. Incineration or thermal
treatment of waste without energy recovery is not part of ideal disposal.
Univers
ity of
Mala
ya

33
Since the early 2000s, there has been a lot of emphasis on Zero Waste (Figure 2.14)
which—like waste hierarchy—is a cradle-to-cradle approach. Similar to the waste
hierarchy, Zero Waste also originated in the 1970s. It was coined by Paul Palmer when
he created his company Zero Waste Systems Inc. which sold industrial byproduct
chemicals for reuse (Walsh, 2017). The idea is to generate zero or very minimal wastage
from start to end hence the name Zero Waste (or its much less popular name, Perpetual
Reuse) (The Zero Waste Institute, n.d.). Unfortunately, the actual Zero Waste concept is
often mistaken for and underutilized as Zero Waste to Landfill which—as the name
implies—only focuses on reducing disposal in landfills and incinerators to zero.
Figure 2.14: Circular economy, life cycle and waste management
Zero Waste may be defined in two ways, i.e., according to the term inventor, Paul
Palmer; and the international Zero Waste standard overseer, Zero Waste International
Alliance. According to the Zero Waste Institute (n.d.) which is founded by Paul Palmer:
Zero Waste is a practical theory of how to wring maximum efficiency from the use of resources. It is third generation planning, where wasting is the first generation and recycling is the second. Zero waste is in fact a high end, DESIGN principle, not a low end, MATERIALS capture.
Univers
ity of
Mala
ya

34
According to Zero Waste International Alliance (2009), the peer-reviewed internationally
accepted definition of Zero Waste is as follows:
Zero Waste is a goal that is ethical, economical, efficient and visionary, to guide people in changing their lifestyles and practices to emulate sustainable natural cycles, where all discarded materials are designed to become resources for others to use. Zero Waste means designing and managing products and processes to systematically avoid and eliminate the volume and toxicity of waste and materials, conserve and recover all resources, and not burn or bury them. Implementing Zero Waste will eliminate all discharges to land, water or air that are a threat to planetary, human, animal or plant health.
In addition, Zero Waste International Alliance (2009) outlined three overarching goals
needed for sustainable resource management:
i. Producer responsibility at the front end of the problem: industrial production and
design.
ii. Community responsibility at the back end of the problem: consumption, discard
use and disposal.
iii. Political responsibility to bring both community and industrial responsibility
together in a harmonious whole.
Zero Waste hierarchy (Figure 2.15) as adopted by Zero Waste International Alliance
in 2013 is fundamentally similar to the waste management hierarchy where it consists of
Reduce, Reuse, Recycle, Recover energy and Dispose. However, Zero Waste hierarchy
only approves energy recovery using systems that operate at biological temperature and
pressure, e.g., sustainable biodiesel from used vegetable oils or biologically or chemically
producing ethanol from urban wood, biosolids, manures or food scraps. Zero Waste
hierarchy does not approve energy recovery using other systems like incineration at high
temperature, e.g., mass burn, fluidized bed, gasification, plasma arc, pyrolysis and also
bioreactor landfills (Zero Waste International Alliance, n.d.).
Univers
ity of
Mala
ya

35
Figure 2.15: Zero Waste hierarchy by Zero Waste International Alliance
Earlier in the 1990s, the OECD developed extended producer responsibility (EPR) as
a strategy in waste management designed to promote the integration of environmental
costs associated with goods throughout their life cycles into the market price of the goods.
OECD (2001) defines EPR as an environmental policy approach in which a producer’s
responsibility for a product is extended to the post-consumer stage of the product’s life
cycle, including its final disposal. In line with the Polluter-Pays Principle (PPP), an EPR
policy is characterized by the shifting of responsibility (physically and/or economically;
fully or partially) upstream toward the producer and away from municipalities; and the
provision of incentives to producers to incorporate environmental considerations in the
design of their products. It is a pollution prevention policy that focuses on product
systems rather than production facilities.
EPR helps producers to minimize their environmental impacts by encouraging them
to find ways to reduce the costs associated with end-of-life products. According to the
OECD (2001), EPR is implemented through mandatory legislation, voluntary
Univers
ity of
Mala
ya

36
participation or negotiated agreements where policy mechanisms include take-back
requirements, recycling and disposal tax, deposit and refund fees and minimum recycled
content. Germany’s The Green Dot (Der Grüne Punkt) is a popular example of take-back
scheme for goods packaging. Under EPR, producers can secure better access to secondary
materials for their own supply chains (The European Commission, 2015). The potential
benefits of EPR are sustainable consumption of raw materials, sustainable product
designs that last longer, and environmental friendly products which are less hazardous
and more easily recyclable. Current EPR systems are in electronics, packaging, tires, end-
of-life vehicles (ELVs) and lead-acid batteries (OECD, 2016).
2.4 Sustainable Development
Brundtland Report 1987 defined sustainable development as development that meets
the needs of the present without compromising the ability of future generations to meet
their own needs (Malaysia Productivity Corporation, 2010). Sustainability is a paradigm
for thinking about a future in which environmental, social and economic considerations
are balanced in the pursuit of development and an improved quality of life [United
Nations Educational, Scientific and Cultural Organization (UNESCO), 2012].
Sustainable development or living is designed to meet current needs without sacrificing
future needs. Nevertheless, many environmentalists believe sustainability should be
replaced with recovery or ecological regeneration as the earth is too degraded to maintain
in its present status (Gomes; 2018; Palmer, 2004c).
2.4.1 Global Megatrends
In recent years, the growing concerns for the environment and global climate change
have placed sustainable development as well as ecological regeneration under the
spotlight. The concept of sustainable development for the first time is widely distributed
Univers
ity of
Mala
ya
37
around the 1970s, followed by Brundtland Report in 1987 and Rio Declaration in 1992
on Earth Summit (Malaysia Productivity Corporation, 2010), which recommended action
strategies towards achieving sustainable development by bringing the world's attention
to the conservation and preservation of the environment and natural resources.
Understanding emerging global megatrends has always been a vital issue for the world
and rapid response is required by developing the capacities for effectively dealing with
the global megatrends identified. PwC (2016) considered megatrends as macroeconomic
and geostrategic forces that are shaping the world, and the people’s collective future in
profound ways. Hajkowicz (2015) defined a megatrend as a significant shift in
geopolitical, environmental, economic, social or technology conditions that are shaping
the world that we live. KPMG International (2014) emphasized that megatrends not
simply the important issues facing by the governments but they are the larger forces
shaping the policy choices available to governments to deal with emerging issues. In
essence, megatrends are disrupting the status quo of the world and portending serious
negative implications for the future of nature and societies. To an extent, Malaysia has
already anticipated a number of megatrends, and formulated appropriate strategies, i.e.,
Wawasan 2020, TN50 and the Eleventh Malaysia Plan (11MP) to address the impacts of
these trends.
The literature on global megatrends in this review will be limited to the more recent
publications produced by PwC (2016), Hajkowicz (2015), and KPMG International
(2014) that address the identification of global megatrends and implications toward
sustainable development.
Univers
ity of
Mala
ya

38
PwC (2016) focused on five global megatrends that impact the defense and security
environments particularly (Table 2.7). Governments of all countries must take more agile
actions and greater collaboration in dealing and adapting with the potential impacts of the
megatrends to mitigate risk for the national survival.
Table 2.7: PwC’s global megatrends
1. Significant shift in global economic power 2. Demographic change 3. Rapid urbanization 4. Rise of technology 5. Climate change or resource scarcity
Hajkowicz (2015) analyzed and identified seven interconnected megatrends on a
macro scale without focusing on a specific sector like that of PwC and KPMG
International (Table 2.8).
Table 2.8: Hajkowicz’s global megatrends
1. A scarcity of natural resources 2. The challenge to protect biodiversity and the global climate 3. Rapid economic growth and urbanization 4. Changing demographics 5. The impact of new digital technologies 6. Consumer expectations for services and experiences 7. An imperative to innovate
Finally, KPMG International (2014) and the Mowat Centre at the School of Public
Policy and Governance of the University of Toronto described nine salient global
megatrends that will impact the operations of governments worldwide. The nine
megatrends are divided into three groups, i.e., individuals (1-3), physical environment (4-
6) and global economy (7-9) (Table 2.9):
Univers
ity of
Mala
ya
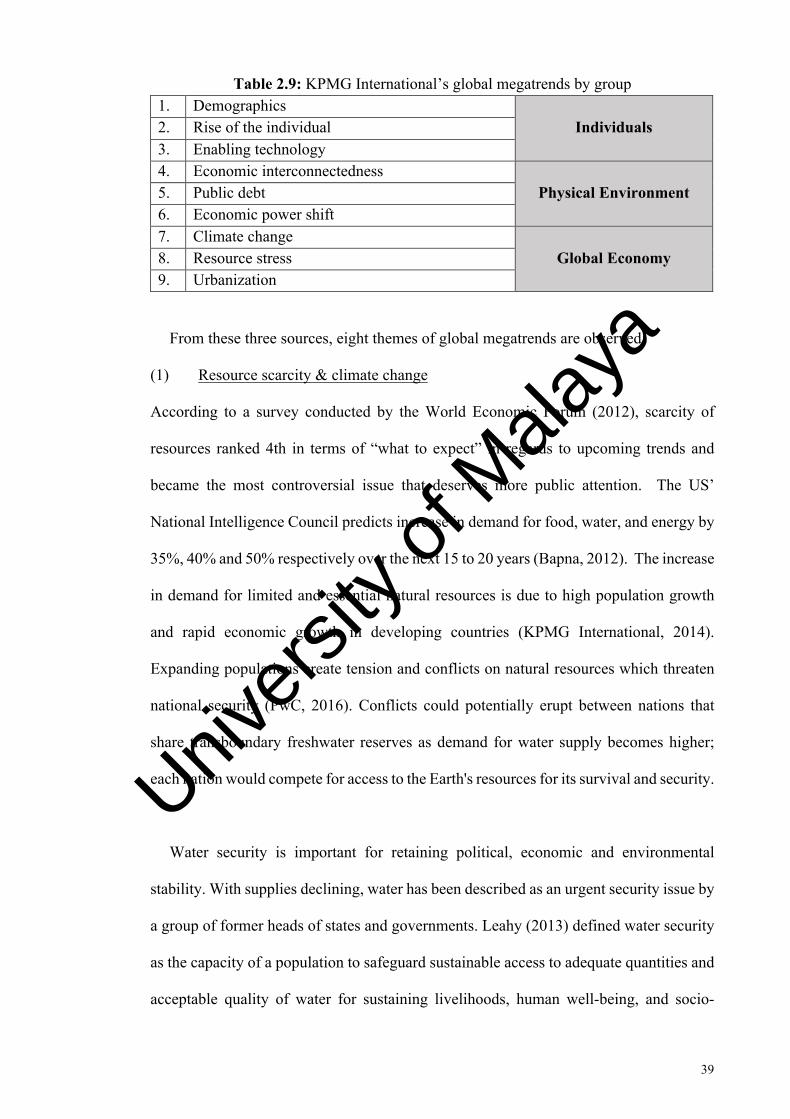
39
Table 2.9: KPMG International’s global megatrends by group 1. Demographics
Individuals 2. Rise of the individual 3. Enabling technology 4. Economic interconnectedness
Physical Environment 5. Public debt 6. Economic power shift 7. Climate change
Global Economy 8. Resource stress 9. Urbanization
From these three sources, eight themes of global megatrends are observed:
(1) Resource scarcity & climate change
According to a survey conducted by the World Economic Forum (2012), scarcity of
resources ranked 4th in terms of “what to expect” in regards to upcoming trends and
became the most controversial issue that deserves more public attention. The US’
National Intelligence Council predicts increase in demand for food, water, and energy by
35%, 40% and 50% respectively over the next 15 to 20 years (Bapna, 2012). The increase
in demand for limited and essential natural resources is due to high population growth
and rapid economic growth in developing countries (KPMG International, 2014).
Expanding populations create tension and conflicts on natural resources which threaten
national security (PwC, 2016). Conflicts could potentially erupt between nations that
share transboundary freshwater reserves as demand for water supply becomes higher;
each nation would compete for access to the Earth's resources for its survival and security.
Water security is important for retaining political, economic and environmental
stability. With supplies declining, water has been described as an urgent security issue by
a group of former heads of states and governments. Leahy (2013) defined water security
as the capacity of a population to safeguard sustainable access to adequate quantities and
acceptable quality of water for sustaining livelihoods, human well-being, and socio-
Univers
ity of
Mala
ya

40
economic development, for ensuring protection against water-borne pollution and water-
related disasters, and for preserving ecosystems in a climate of peace and political
stability.
According to Hajkowicz (2015), demand of energy, food and water will increase as
the world becomes more populous, urbanized and prosperous, but the Earth has a finite
amount of natural resources and non-renewable resources to cater the demand. In a
nutshell, the world's current economic model, production and consumption are pushing
beyond the limits of the Earth's ability to cope.
According to Wai (2016), four billion people—more than half of the world
population—are experiencing water scarcity problems. In Malaysia, water supply
problems become the current concern due to pollution, climate change and wasteful
habits (Le & Facon, 2001; Nah, 2016). Malaysia has experienced a serious water supply
crisis in 1998 in the Klang Valley areas where approximately 600,000 residents of
Selangor and Kuala Lumpur were affected (Berita Harian, 2016). This problem persists
until today because people's water usage habits remained the same. Habits may be
difficult to change immediately, but they are the most important things to consider in
shaping sustainable civilizations.
Earth's climate is always changing and has gone through warmer and cooler periods.
According to Dunbar (2015), Earth's temperature has risen more than one degree
Fahrenheit during the past 100 years, which may impact humans and their activities as
well as natural systems and processes directly and indirectly. Global climate change is
usually associated with increasing world temperatures that are complex and time
consuming. Dunbar (2015) defined climate change as long-term change in Earth's
Univers
ity of
Mala
ya

41
climate, for a long period of time (typically decades or more), including warming, cooling
and changes besides temperature. Rising greenhouse gas emissions are not just causing
climate change and a complex mix of unpredictable changes to the environment but are
also taxing the resilience of natural and built systems (KPMG International, 2014).
In recent years, Malaysia has witnessed extreme weather changes, including the
Monsoon cycle, El-Nino causing more floods, droughts and heatwaves. Throughout the
country, rainfall is expected to decline between 20-60%, especially the Northern states of
the Peninsular (Suraya Roslan, 2016). Based on records, El Nino has hit Malaysia 12
times since 1951-1952 and the worst occurrence was in 1997-1998 with the highest
temperature of 40.1°C recorded at Chuping Meteorological Station, Perlis on 9 April
1998 (Suraya Roslan, 2016). Increase in extreme weather and rising sea levels could
make traditional methods of farming, hunting and fishing difficult or impossible in some
places (PwC, 2016).
Population at coastal cities will require large infrastructure investments to ensure
physical safety. The world is currently experiencing the effects of tremendous climate
change phenomenon that will create difficulties in sustaining resources, biodiversity and
ecological habitats. As Hajkowicz (2015) mentioned, climate change will impact the
world's ecological habitats and biodiversity which can lead to extinction of species.
(2) Rapid urbanization
By 2030, two-thirds of the world's population will be located in urban areas (KPMG
International, 2014). Recent economic and political changes have fostered migration to
urban centers of the world; the urban population is growing at an unprecedented rate
particularly in developing countries (KPMG International, 2014; PwC, 2016). Rapid
Univers
ity of
Mala
ya
42
urbanization creates significant opportunities for social and economic development, but
it also creates significant risks on the environment as well as society and economy. In
developed economies and older cities in developing countries, infrastructure will be
strained as population expand—in emerging economies, on the other hand, new cities
will rise rapidly and require massive investments in smart infrastructure to accommodate
explosive growth (PwC, 2016). Smart cities require smart traffic management; urban
planners need to systematically map out the best possible and sustainable solution to
minimize congestion and optimize accessibility. Urbanization comes at a great cost to the
environment, society and economy. Thus, governments must make sure they do not
underestimate the carrying capacity of the ecosystem and not overestimate their abilities
in governance. Failure to cater the needs of the population by providing basic services—
e.g., goods, healthcare, security—will result in destabilized societies. As cities grow into
megacities, their power and impact on the environment, society and economy may rival
that of national governments due to their massive size (PwC, 2016).
(3) Ageing population & changing demographics
Ageing population is one of the most significant trends of the 21st century. Malaysia’s
population structure is expected to experience a dramatic shift, as Asian countries—e.g.,
China, Singapore, Korea, Thailand and Philippines—begin to follow the global trends of
an ageing population during the next several decades. Based on a study by Abdul Rashid
et al. (2016), significant decline in both fertility and mortality rates have improved the
life expectancy in Malaysia. As a result, the baby boomer generation grows old and
Malaysia will experience increasing number of elderly population. There is a dramatic
change of the age distribution of Malaysians from 1970 to 2010. The research indicated
the percentage of the population aged less than 20 years old has decreased by 18.3% from
55.6% in 1970 to 37.3% in 2010. Meanwhile, the elderly population (age 60 years or
Univers
ity of
Mala
ya

43
over) has increased from 5.5% to 7.9% in the same time frame. The researchers stated
that Malaysia is expected to become an ageing nation by 2030.
According to the United Nations Population Fund (2015), among the factors of the
increase in life expectancy are better nutrition, sanitation, health care, education and
economic well-being. The contributions of older generation to society are invaluable,
such as caregiving, volunteering, and passing cultural traditions to younger generations.
As population ages, the demand for social services and healthcare will put severe pressure
on government's budget priorities (PwC, 2016). Hajkowicz (2015) suggested that
improving health care and funding retirement plans to cater the well-being of the older
generation, and at the same time, older generation can transfer their skills, knowledge,
wisdom and abilities for the benefit of younger generation and countries as a win-win
situation.
(4) Economic power shift
Globalization is a process that enables people worldwide to reach one another or
interconnect in all aspects of their life—culture, health, economics, politics, technology
and the environment—where most of their lives are largely determined by global
processes. More than at any point in human history, people are living in a world where
events and decisions in one part of the world can influence lives at the opposite end of
the planet (KPMG International, 2014). From an economic perspective, globalization
brings benefits to nations worldwide by establishing foreign direct investment (FDI),
boosting technological innovation for more efficient processes and expanding economic
scale for economic growth (Kuepper, 2017). The shift in world economy will increase
the level of international trade and capital flows.
Univers
ity of
Mala
ya

44
The significant change in the economic performance from commodity-dependent
economies to more diversified economies will achieve greater economic stability
(Strategy&, 2011). In Malaysia, economic diversification from the production of raw
natural resource materials, including rubber and tin, and become a leading exporter of
electrical appliances, electronic components and natural gas has built new export markets,
trade relations and business opportunities that brings benefit to economic growth and
improve well-being of the people (World Bank, 2017). Improving the well-being of the
people, reducing poverty, and shifting people from low-income class to middle-income
class has resulted in the increase of purchasing and spending power which eventually,
boosts the economic growth (Hajkowicz, 2015). The economic power shift trend is
moving economies out of poverty and bringing about a rebalancing of global power
which forces countries to be more transparent and inclusive (KPMG International, 2014).
The rebalancing refers to emerging-market countries becoming leading growth centers
which will create a wave of new middle-class consumers but also drive profound
innovation in product design, market infrastructure and value chains.
(5) Public debt
According to KPMG International (2014), public debt is expected to operate as a
significant constraint on fiscal and policy options through to 2030 and beyond.
Government's capacity to respond to major social, economic and environmental
challenges is affected by their ability to bring debt under control and find new ways of
delivering public services (KPMG International, 2014). A country's rate of economic
growth—the expansion of its capacity to produce goods and services—is largely a matter
of investments that significantly relate to its revenue and expenditure (Lojanica, 2015).
Sustainably productive investments require balanced resource spending between capital
goods and consumer goods. When a country saves more, it can allocate more resources
Univers
ity of
Mala
ya
45
to the development of new technology, the production of new machinery, the investment
in human capital and the security of its economy (Peter G. Peterson Foundation, n.d.).
Overspending will only diminish its future potential to grow. The burden of public debt—
especially in emerging economies—poses a serious threat to economic and human
development initiatives and social stability.
(6) Porous boundaries & the imperative to innovate
Future businesses, governments, and societies will not operate the same way as before
as they are radically changing from the structural core. Such changes in employment
markets and organizational structures are due to the emergence of digital technology and
the establishment of platform economics. Hajkowicz (2015) described the importance of
organizational agility to anticipate fundamental ability to remain competitive and
responsive in this flexible economy era. According to Bersin et al. (2017), in the past,
organizations were designed for efficiency and effectiveness—but as organizations
become more digital, successful organizations will require themselves to move faster,
adapt more quickly, facilitate fast learning, and embrace the dynamic career demands of
their people. New, horizontal networks are displacing traditional, vertical networks of the
days of old. Peer-to-peer economy is set to disrupt and bypass many of the traditional
intermediaries in the industries such as banking and finance, retail, tourism, transport,
and knowledge work, making them obsolete. Instead of efficiency and effectiveness,
successful organizations must be designed for speed, agility and adaptability to enable
them to survive in today's global business environment (Deloitte, 2017).
(7) Digital immersion
In an increasingly globalized world, people’s way of life is undergoing a tremendous
societal shift with the rise of technology. The current world has more digitally connected
Univers
ity of
Mala
ya

46
people, signaling the new era of Internet of Things (IoT) (Hajkowicz, 2015).
Advancement in technologies such as artificial intelligence (AI), mobile platforms,
sensors and social collaboration systems will transform the way we live, work and
communicate (Deloitte, 2017). Nowadays, the world is facing dramatic digital
transformation by the development and innovation of technologies such as
nanotechnologies, 3D printing, sensors, autonomous drones and intelligent robots
(Schwab, 2016). The second machine age marks the time where computers and other
digital advances are doing for mental power—the ability to use brains to understand and
shape the environments—what the steam engine and its descendants did for muscle
power (Brynjolfsson & McAfee, 2016). This change reflects Moore's Law on significant
changes in the speed of information technology and computing power, and the evolution
of a super intelligent machine that is beyond human understanding (Deloitte, 2015).
Hajkowicz (2015) described this new digital era as consisting of smart data, highly
automated and digitally connected city. Marr (2016) defined Industry 4.0 as the smart
factory in which computers, automation and robotics connected together to replace
human workers. Industry 4.0 will raise global income levels and improve the quality of
life people around the world, whereby people are able to afford and access digital world;
innovation in new products and services that can be done remotely such as ordering a
taxi, booking a flight, buying a product, making a payment, listening to music, watching
a film, or playing a game (Schwab, 2016). Industry 4.0 requires machine transformation
in gathering and analyzing data faster, more flexible, and more efficient processes to
produce higher-quality goods at much lower costs (Scalabre, 2017). Technological
breakthroughs on hardware and software are required to make big data analysis possible,
efficient and effective in extracting value out of data assets.
Univers
ity of
Mala
ya

47
With the transformation to digital technology and Industry 4.0, routine and repetitive
human work is being automated as machines, computers and robots can perform many
tasks quicker, more safely and more efficiently than humans. The world will value skills
that cannot be performed by machines or robotics such as complexity, creativity, social
interaction, and fuzziness (Hajkowicz, 2015). In addition, people's knowledge, skills and
abilities in using technology will become better and, at the same time, can increase
employability (Chui et al., 2016). However, new technological advancement that
promotes even greater automation, analytics, and communications will create new
vulnerabilities that challenge law enforcement, security and defense organizations like
never before such as cybercrime, cyber warfare and cyber terrorism (PwC, 2016).
(8) Great expectations of services and experiences
Future consumers are trending towards having great expectations for services and
experiences in addition to basic expectations. Basic expectations for the necessities of
life such as water, food, clothing, shelter and personal security are still important
especially for impoverished people of the world—but due to income growth and the
oversupply of mass consumables, people are demanding experience over products and
prioritizing social relationships (Hajkowicz, 2015). According to Chang (2015, June 10),
the world will be surrounded by people who are about 4.4 times wealthier than they are
today by the year 2060. Great expectations—as Hajkowicz aptly called it—is a consumer,
societal, demographic and cultural megatrend. Hajkowicz (2015) further stated that the
worldwide growth in experience economy—tourism, entertainment arts and culture, and
creative services—attests to the continuation of the great expectations megatrend. People
will demand more personalized, better, and fast services that meet their unique needs and
wants to gain greater level of satisfaction and happiness (Hajkowicz, 2015).
Univers
ity of
Mala
ya

48
In this globalized era, experience is more important than the function of tangible
products (Zhang, 2010). People have their own unique experiences, so services should
be heterogeneous. Under this circumstance, the world is facing the Industrialist’s
Dilemma in fulfilling the different needs of consumers (Siegel, 2016). Innovators need
to provide individualized services and service innovations for different consumers
because consumers seek and often expect for experimental or uniquely memorable
experiences (Lazarus, 2017). In order to create memorable experiences to the customers,
companies small or large must produce disruptive innovations. Hutt (2016) described
disruptive innovation as a small company with less resources being able to successfully
compete with established incumbent businesses, by targeting segments that larger
companies overlook and concentrating on profitability by improving its niche products
and services.
To sum it up, this general review covers global megatrends that are considered highly
relevant to the world and the actions needed to effectively deal with the impacts of global
megatrends. Megatrends are the intersection of many trends as discussed above that alter
the pattern of environmental, social, and economic activity. In the presence of global
megatrends, people and governments alike need to cooperate and communicate in order
to overcome challenges of the future and stay on the track towards sustainable living and
development.
2.4.2 Goals and Strategies for Sustainability
Since 1 January 2016, countries began to officially adopt the Sustainable Development
Goals (SDGs) which outlines 17 goals and 169 targets to be achieved by the year 2030.
The Division for Sustainable Development of the United Nations (2015) defined the 2030
Agenda of Sustainable Development as the action agenda for humans, the planet and
Univers
ity of
Mala
ya

49
prosperity. The SDGs (Figure 2.16) are a continuation of the Millennium Development
Goals (MDGs), cover all sustainable development issues and apply to all countries. Table
2.10 describes the summary of the SDGs.
Figure 2.16: Sustainable Development Goals (UN, n.d.)
Table 2.10: Summary of the SDGs (UN, n.d.) 1 No Poverty End poverty in all its forms everywhere 2 Zero Hunger End hunger, achieve food security and improved
nutrition, and promote sustainable agriculture 3 Good Health and Well-being Ensure healthy lives and promote well-being for
all at all ages 4 Quality Education Ensure inclusive and equitable quality
education and promote lifelong learning opportunities for all
5 Gender Equality Achieve gender equality and empower all women and girls
6 Clean Water and Sanitation Ensure availability and sustainable management of water and sanitation for all
7 Affordable and Clean Energy Ensure access to affordable, reliable, sustainable and modern energy for all
8 Decent Work and Economic Growth
Promote sustained, inclusive and sustainable economic growth, full and productive employment and decent work for all
Univers
ity of
Mala
ya

50
Table 2.10, continued. 9 Industry, Innovation and
Infrastructure Build resilient infrastructure, promote inclusive and sustainable industrialization and foster innovation
10 Reduced Inequalities Reduce inequality within and among countries 11 Sustainable Cities and
Communities Make cities and human settlements inclusive, safe, resilient and sustainable
12 Responsible Consumption and Production
Ensure sustainable consumption and production patterns
13 Climate Action Take urgent action to combat climate change and its impacts
14 Life Below Water Conserve and sustainably use the oceans, seas and marine resources for sustainable development
15 Life on Land Protect, restore and promote sustainable use of terrestrial ecosystems, sustainably manage forests, combat desertification, and halt and reverse land degradation and halt biodiversity loss
16 Peace, Justice and Strong Institutions
Promote peaceful and inclusive societies for sustainable development, provide access to justice for all and build effective, accountable and inclusive institutions at all levels
17 Partnerships for the Goals Strengthen the means of implementation and revitalize the global partnership for sustainable development
Malaysia has its own goals and targets towards sustainable development. Dasar
Ekonomi Baru (DEB or New Economic Policy, NEP) was a social re-engineering and
affirmative action program designed as a long-term program that ran for 20 years from
1970 to 1990 and was a starting point for the establishment of Malaysia’s policies
(Jabatan Perkhidmatan Awam, 2017). Wawasan 2020 (Vision 2020) succeeds DEB in
the period of 1991 to 2020 which sets Malaysia’s vision of achieving high-income status
and becoming a fully developed nation by 2020 (Mahathir Mohamad, 1991).
Inclusiveness and sustainability are the main thrusts of Wawasan 2020 (Sustainable
Consumption and Production Malaysia, 2014).
Univers
ity of
Mala
ya

51
Kita perlu menjadi negara yang maju menurut acuan kita sendiri. Malaysia tidaklah hanya menjadi negara maju dari segi ekonominya semata-mata. Negara kita mestilah menjadi negara maju dalam segala aspek seperti ekonomi, politik, sosial, kerohanian, kejiwaan dan kebudayaan. Kita hendaklah mencapai kemajuan sepenuhnya dari segi perpaduan negara dan kesepaduan sosial, kestabilan politik, sistem pemerintahan, mutu kehidupan, nilai-nilai sosial dan kerohanian, selain rasa bangga dan yakin akan bangsa sendiri. (Mahathir Mohamad, 1991)
The above passage describes Malaysia’s aspiration for Wawasan 2020. It stresses upon
becoming an advanced nation based on its own mold, i.e., not following others. As an
advanced nation by the year 2020, the people of Malaysia need to have confidence in
their leader and leadership, strong moral and ethical values, live in a democratic society,
tolerant, caring, economically just and equitable, progressive and prosperous, and
establishment of an economy that is competitive, dynamic, robust and resilient.
In order to realize Wawasan 2020, Malaysia develops the Sustainable Consumption
and Production (SCP) policy. The basis of the SCP policy living standards, quality of life
and well-being of the population are not only dependent on sustained economic growth
but also the "green" element (Sustainable Consumption and Production Malaysia, 2014).
As a matter of fact, the SCP policy interrelates with the SDGs particularly Goal 12.
According to Sustainable Consumption and Production Malaysia (2014), sustainable
consumption and production have significant relationship with Wawasan 2020 by
utilizing natural resource and energy efficiently, developing sustainable infrastructure,
and providing access to basic services, green and decent jobs for better quality of life.
This is done by reducing pollution and emission of GHG, reducing waste, avoiding
inefficient use of natural resources, protecting biodiversity and strengthening security of
supplies (Sustainable Consumption and Production Malaysia, 2014).
Univers
ity of
Mala
ya

52
As the successor of Wawasan 2020, TN50 (National Transformation 2050) is set up
to plan for the future of Malaysia in the period of 2021 to 2050 [Jabatan Perkhidmatan
Awam (JPA), 2017]. The main objective of TN50 is to transform Malaysia into the top
20 nations in the world in major fields. In the context of sustainable development,
Malaysia is building the fundamentals of change and development by adopting sharia
factors to become the future model of Islamic countries (Baba, 2017). According to Hasan
Mad (2017), PwC targets Malaysia to remain among the 32 countries in the world
categorized as Fast-Growing Nations, where its annual growth rate is not less than 4.0%.
Based on current performance, the IMF (International Monetary Fund) projected annual
global economic growth of about 3.5% in 2017. Malaysia is in a group categorized as
emerging economies, with an average growth of 4.5% (Hasan Mad, 2017).
Sustainable development has always been a focus in government planning as seen in
the formulation of the Environment Quality Act 1974, the National Environment Policy
(2002), National Green Technology Policy (2009) and National Climate Change Policy
(2009) [Ministry of Energy, Green Technology and Water (KeTTHA), Malaysia, n.d;
Ministry of Natural Resources and Environment, Malaysia, n.d.]. Islam Hadhari (Islamic
Civilization) also focuses on the environment by listing the preservation of nature as its
ninth principle. It was established by the then Prime Minister, Tun Abdullah Ahmad
Badawi in 2004 as a concept of building civilization based on Islamic principles
(Mohamed Sharif Bashir, 2005). The Eleventh Malaysia Plan—which plans for the final
five years towards realizing Wawasan 2020, i.e., 2016-2020—intends to completely
reorient socioeconomic growth from the conventional “grow first, clean-up later”
development trajectory to Green Growth trajectory (Economic Planning Unit, Malaysia,
2015). Green Growth refers to the growth that uses resources efficiently, clean and
resilient.
Univers
ity of
Mala
ya
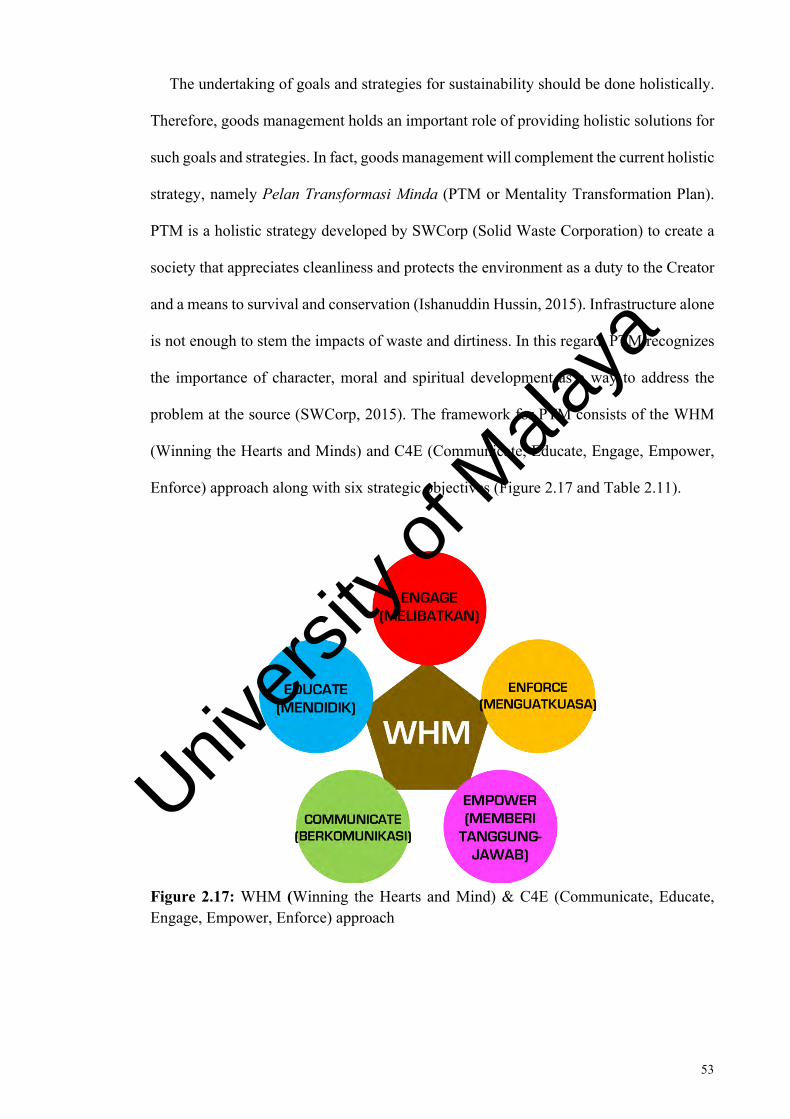
53
The undertaking of goals and strategies for sustainability should be done holistically.
Therefore, goods management holds an important role of providing holistic solutions for
such goals and strategies. In fact, goods management will complement the current holistic
strategy, namely Pelan Transformasi Minda (PTM or Mentality Transformation Plan).
PTM is a holistic strategy developed by SWCorp (Solid Waste Corporation) to create a
society that appreciates cleanliness and protects the environment as a duty to the Creator
and a means to survival and conservation (Ishanuddin Hussin, 2015). Infrastructure alone
is not enough to stem the impacts of waste and dirtiness. In this regard, PTM recognizes
the importance of character, moral and spiritual development as a way to address the
problem at the source (SWCorp, 2015). The framework for PTM consists of the WHM
(Winning the Hearts and Minds) and C4E (Communicate, Educate, Engage, Empower,
Enforce) approach along with six strategic objectives (Figure 2.17 and Table 2.11).
Figure 2.17: WHM (Winning the Hearts and Mind) & C4E (Communicate, Educate, Engage, Empower, Enforce) approach
Univers
ity of
Mala
ya
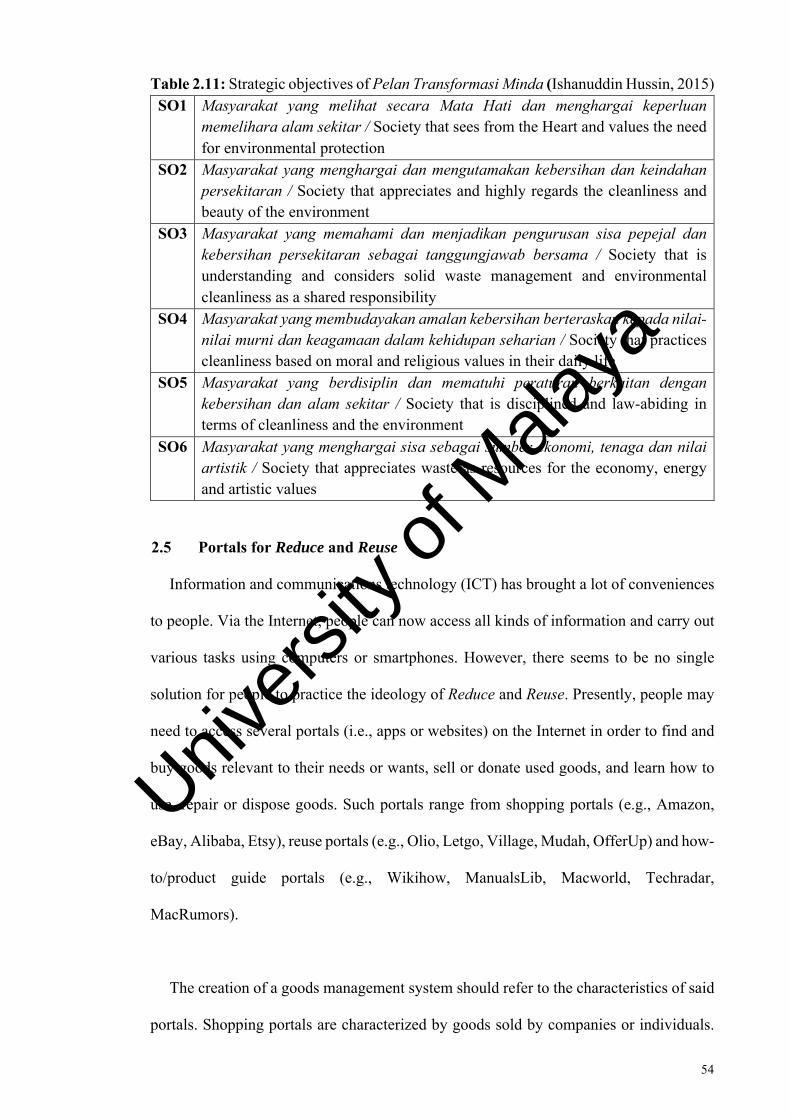
54
Table 2.11: Strategic objectives of Pelan Transformasi Minda (Ishanuddin Hussin, 2015) SO1 Masyarakat yang melihat secara Mata Hati dan menghargai keperluan
memelihara alam sekitar / Society that sees from the Heart and values the need for environmental protection
SO2 Masyarakat yang menghargai dan mengutamakan kebersihan dan keindahan persekitaran / Society that appreciates and highly regards the cleanliness and beauty of the environment
SO3 Masyarakat yang memahami dan menjadikan pengurusan sisa pepejal dan kebersihan persekitaran sebagai tanggungjawab bersama / Society that is understanding and considers solid waste management and environmental cleanliness as a shared responsibility
SO4 Masyarakat yang membudayakan amalan kebersihan berteraskan kepada nilai-nilai murni dan keagamaan dalam kehidupan seharian / Society that practices cleanliness based on moral and religious values in their daily life
SO5 Masyarakat yang berdisiplin dan mematuhi peraturan berkaitan dengan kebersihan dan alam sekitar / Society that is disciplined and law-abiding in terms of cleanliness and the environment
SO6 Masyarakat yang menghargai sisa sebagai sumber ekonomi, tenaga dan nilai artistik / Society that appreciates waste as resources for the economy, energy and artistic values
2.5 Portals for Reduce and Reuse
Information and communications technology (ICT) has brought a lot of conveniences
to people. Via the Internet, people can now access all kinds of information and carry out
various tasks using computers or smartphones. However, there seems to be no single
solution for people to practice the ideology of Reduce and Reuse. Presently, people may
need to access several portals (i.e., apps or websites) on the Internet in order to find and
buy goods relevant to their needs or wants, sell or donate used goods, and learn how to
use, repair or dispose goods. Such portals range from shopping portals (e.g., Amazon,
eBay, Alibaba, Etsy), reuse portals (e.g., Olio, Letgo, Village, Mudah, OfferUp) and how-
to/product guide portals (e.g., Wikihow, ManualsLib, Macworld, Techradar,
MacRumors).
The creation of a goods management system should refer to the characteristics of said
portals. Shopping portals are characterized by goods sold by companies or individuals.
Univers
ity of
Mala
ya

55
For example, Amazon facilitates business-to-consumer sales whereas eBay facilitate
business-to-consumer and consumer-to-consumer sales. On the other hand, Alibaba
focuses on wholesale of various goods whereas Etsy focuses on retail of handmade goods,
vintage items and craft supplies. As illustrated in Figures 2.18 and 2.19, shopping portals
present a large catalog of goods with detailed description. The catalog provides buyers
information such as departments or categories of goods, list of goods, names, prices,
photos, description and reviews. This is important to build confidence in buyers.
Meanwhile, reuse portals are characterized by posts or advertisements by the public.
For example, Olio facilitates free- or donation-based food sharing whereas Letgo,
Village, Mudah and OfferUp facilitate donation or sale of used goods. From Figures 2.20
and 2.21, it is apparent that the catalog of goods for reuse—donation or sale—presented
is simple, straightforward and contains minimal description. Such a catalog contains
categories, names, photos, description and location of goods. This is necessary to promote
reuse among people.
Univers
ity of
Mala
ya

56
Figure 2.18: Design characteristics of shopping portal, Amazon, containing departments, list of goods, photos, description and reviews
Univers
ity of
Mala
ya

57
Figure 2.19: Design characteristics of shopping portal, eBay, containing categories, list of goods, photos, description and reviews
Univers
ity of
Mala
ya

58
Figure 2.20: Design characteristics of reuse portals, Olio (top) & Letgo (bottom), containing photos, description, location and categories of goods
Univers
ity of
Mala
ya
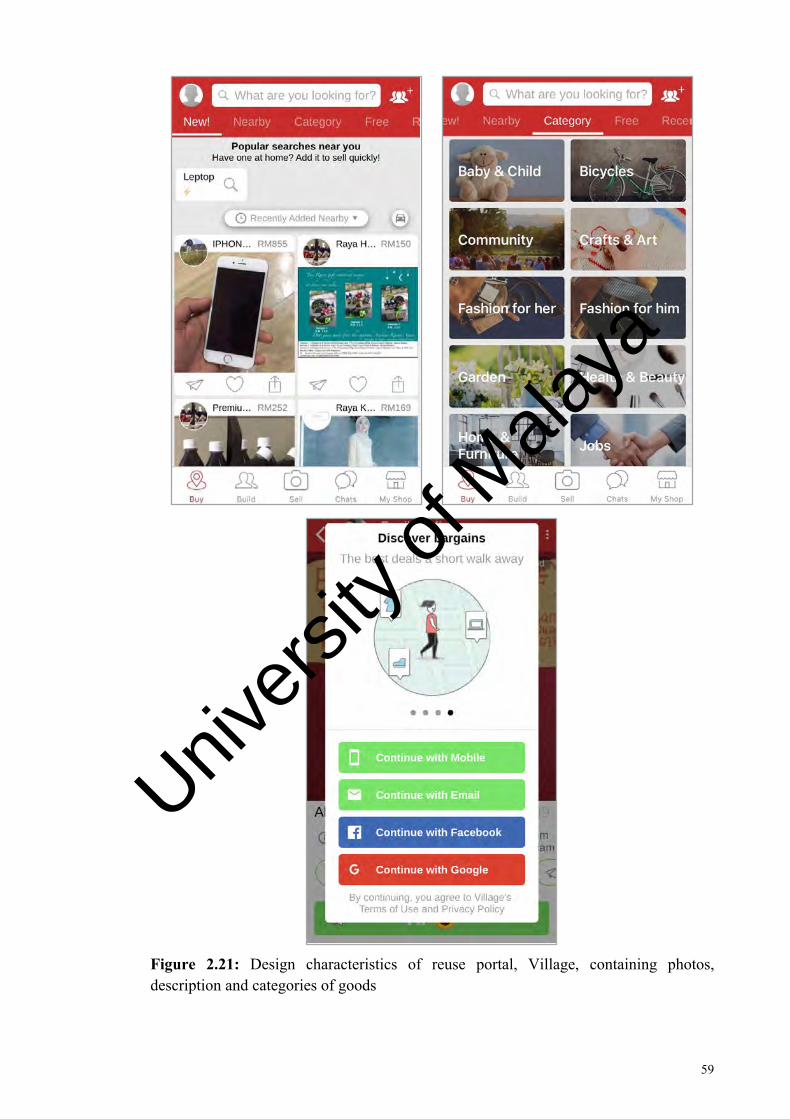
59
Figure 2.21: Design characteristics of reuse portal, Village, containing photos, description and categories of goods
Univers
ity of
Mala
ya
60
Last but not least, how-to/product guide portals are characterized by articles and
reviews related to products and usage. For example, WikiHow provides how-tos on
various subjects whereas ManualsLib provides product manuals online. On the other
hand, Macworld, TechRadar and MacRumors provide news and guides on consumer
technologies and electronics. Figures 2.22-2.24 illustrate the way how-to/product guide
portals are designed to deliver consumer-oriented contents aim to educate and assist in
decision making. Among the examples of educational contents are procedures for proper
usage/techniques of ice cream cake decoration and proper disposal of car seats. As for
assistance in decision making, the examples show contents related to finding the right
computer such as computer reviews, pros, cons and product release timeline. All of these
are essential to protect the rights of consumers as well as to promote their interests.
These portals revolve around Experience Economy and Sharing Economy. The
synergy between Experience Economy and Sharing Economy is built on interpersonal
values. Robinson (2015) refers Experience Economy as using technology to create
experiences based on human value which can create employment, fulfillment and social
capital. Sharing Economy, on the other hand, refers to business models and technology
platforms that enable people with a potentially mutual interest to make contact with each
other (Robinson, 2015). Physical interaction is a significant aspect of human experience
especially when it involves something that people share a mutual affiliation. According
to Robinson (2015), this creates an incentive to use technology to identify opportunities
for people to interact and meet and that incentive could be an important component of a
long-term sustainable economy. Thus, in line with Palmer’s (n.d.) recommendation for
strong social engineering, goods management system must leverage the potentials of
Experience Economy and Sharing Economy in order to promote reduction and reuse as
well as responsible and sustainable living.
Univers
ity of
Mala
ya

61
Figure 2.22: Design characteristics of how-to portal, wikiHow, containing procedures for proper usage and disposal
Figure 2.23: Design characteristics of product guide portals, Macworld (left) & TechRadar (right), containing reviews, pros and cons
Univers
ity of
Mala
ya

62
Figure 2.24: Design characteristics of product guide portal, MacRumors, containing product release timeline and review
Univers
ity of
Mala
ya

63
CHAPTER 3: METHODOLOGY
3.1 Overview
In correspondence to the research objectives, the methodology for the application
development of goods management system contained four parts: data collection,
Geographic Information System (GIS), app prototype, and evaluation. Figure 3.1
describes the flow of methodology. Each part will be explained in the following
subchapters.
Figure 3.1: The flow of methodology
3.2 Data Collection In order to understand the current state of Malaysian goods and services, multiple
sources—i.e., authority, third party analytics and online/digital presence—were
identified and evaluated. Such sources were evaluated for the following criteria: reliable,
Univers
ity of
Mala
ya

64
comprehensive and convenient. The source(s) which fulfilled these criteria were used to
extract and collect data regarding:
• names or company names,
• addresses, and
• types of goods and/or services.
In order to design an integrated system that combines shopping with 2R (Reduce and
Reuse) and product guides, multiple portals—i.e., shopping, reuse and how-to/product
guide—were identified and assessed. Key features of such portals were used as the basis
for the prototype’s UI (user interface) and UX (user experience).
3.3 Geographic Information System (GIS)
Analysis of goods and services providers was carried out as preliminary to modeling
of goods management system in Malaysia. Real-world data were used as input to create
a Geographic Information System (GIS). There were four components in this research’s
GIS.
3.3.1 Geographic Layer
The Federal Territory of Kuala Lumpur was the chosen sample to represent Malaysia
due to its status as the national capital and the most densely populated city. It is 100%
city and has around 1.79 million citizens over 243 km2 land area. It is also the state with
second highest Gross Domestic Product (GDP) contribution at 15.3%, behind Selangor
(22.7%) for the year 2016 (Department of Statistics, Malaysia, 2017). Qualitatively and
quantitatively, Kuala Lumpur represents peak goods and services activities. Two types
of base maps were used: Esri HERE Streets map and OpenStreet map.
Univers
ity of
Mala
ya

65
Figure 3.1 shows the map of Kuala Lumpur and its provinces (mukim): Mukim Hulu
Kelang (far northeast), Mukim Setapak (northeast), Mukim Batu (northwest), Mukim
Kuala Lumpur (west and upper south), Mukim Petaling (lower south), Mukim Cheras
(far southeast), Mukim Ampang (east) and Bandar Kuala Lumpur (shown as Seksyen 1-
100; central). The city center is located in Bandar Kuala Lumpur.
3.3.2 Information Layer
From data collected in 3.1, the chosen source was used as input. Datasets of business
licensees for the year 2015 (as of June 2015) were obtained from Jabatan Pelesenan dan
Pembangunan Penjaja (Licensing & Petty Traders Management Department) of Dewan
Bandaraya Kuala Lumpur (DBKL, or Kuala Lumpur City Hall). The datasets were saved
in Microsoft Excel Workbook (.xlsx) format, containing information (rows and columns)
on individual/company names, addresses and business activities. The total number of
business licensees was 84,597.
3.3.3 GIS Software
Esri Maps for Office, version 3.1 (later renamed ArcGIS Maps for Office in version
4) was used to create a system based on geographic and information layers and run spatial
analyses. Esri Maps for Office was specifically chosen for its ease of use, accessibility
via Excel (Windows operating system only), online connectivity, multiple base map
availability, and efficiency in analyzing spatial data as clusters and heat maps. Both
versions 3.1 and 4 were used; version 4 added support for OpenStreet base map and
utilized different color schemes for heat maps. The online portal, ArcGIS Online was
used concurrently for hotspot analysis.
Univers
ity of
Mala
ya

66
Figure 3.2: Map of Kuala Lumpur and its provinces (mukim) (NAPIC, Malaysia, 2010)
3.3.4 GIS Map
Creation of GIS map of business licensees was carried out in two parts: cataloging and
spatial analyses (Figure 3.2).
Univers
ity of
Mala
ya
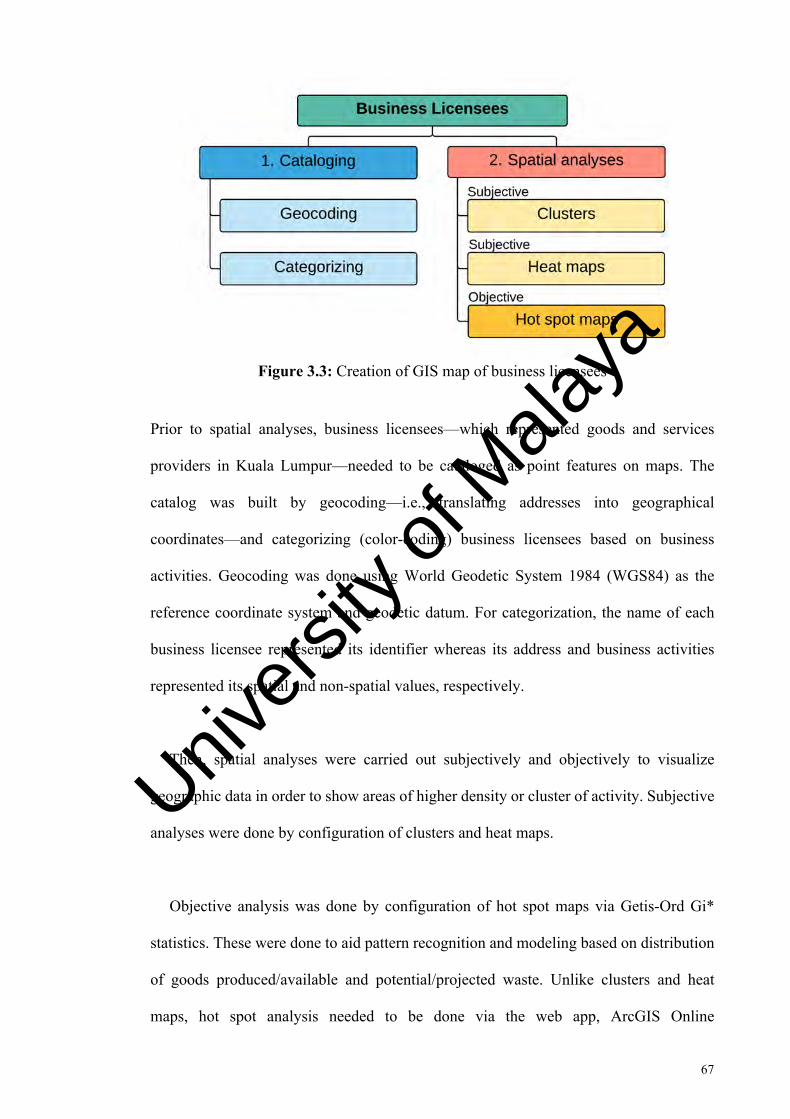
67
Figure 3.3: Creation of GIS map of business licensees
Prior to spatial analyses, business licensees—which represented goods and services
providers in Kuala Lumpur—needed to be cataloged as point features on maps. The
catalog was built by geocoding—i.e., translating addresses into geographical
coordinates—and categorizing (color-coding) business licensees based on business
activities. Geocoding was done using World Geodetic System 1984 (WGS84) as the
reference coordinate system and geodetic datum. For categorization, the name of each
business licensee represented its identifier whereas its address and business activities
represented its spatial and non-spatial values, respectively.
Then, spatial analyses were carried out subjectively and objectively to visualize
geographic data in order to show areas of higher density or cluster of activity. Subjective
analyses were done by configuration of clusters and heat maps.
Objective analysis was done by configuration of hot spot maps via Getis-Ord Gi*
statistics. These were done to aid pattern recognition and modeling based on distribution
of goods produced/available and potential/projected waste. Unlike clusters and heat
maps, hot spot analysis needed to be done via the web app, ArcGIS Online
Univers
ity of
Mala
ya
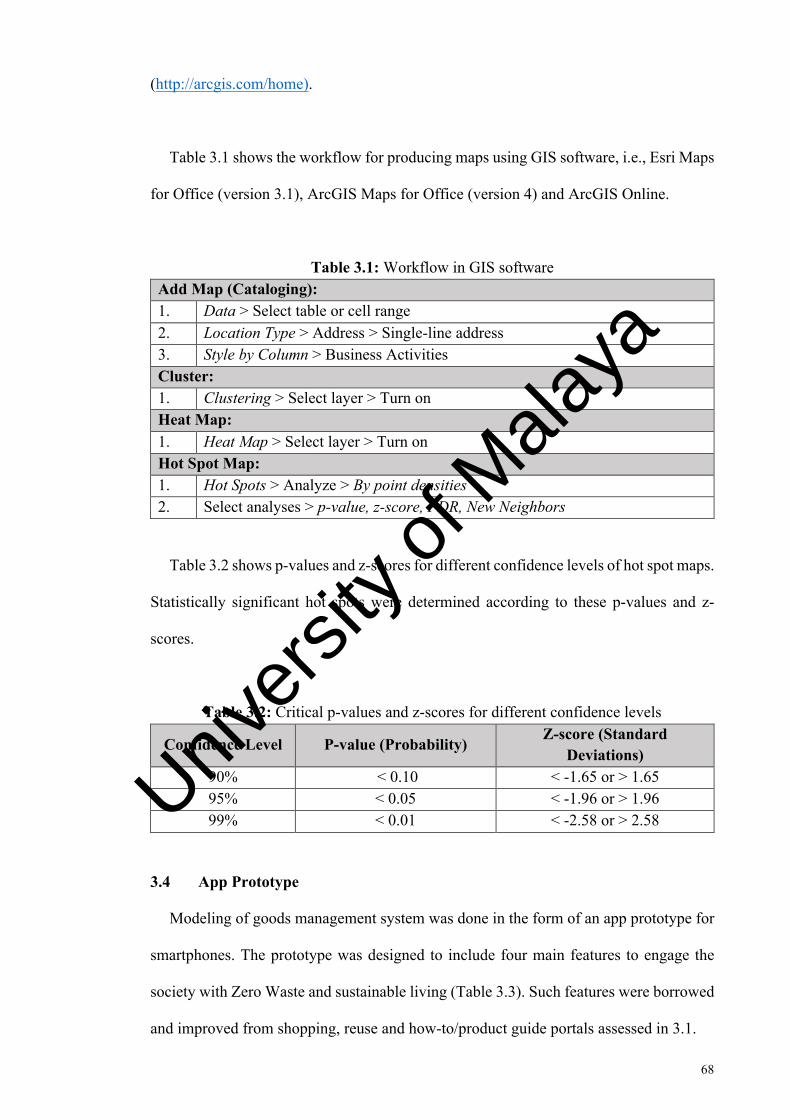
68
(http://arcgis.com/home).
Table 3.1 shows the workflow for producing maps using GIS software, i.e., Esri Maps
for Office (version 3.1), ArcGIS Maps for Office (version 4) and ArcGIS Online.
Table 3.1: Workflow in GIS software Add Map (Cataloging): 1. Data > Select table or cell range 2. Location Type > Address > Single-line address 3. Style by Column > Business Activities Cluster: 1. Clustering > Select layer > Turn on Heat Map: 1. Heat Map > Select layer > Turn on Hot Spot Map: 1. Hot Spots > Analyze > By point densities 2. Select analyses > p-value, z-score, FDR, New Neighbors
Table 3.2 shows p-values and z-scores for different confidence levels of hot spot maps.
Statistically significant hot spots were determined according to these p-values and z-
scores.
Table 3.2: Critical p-values and z-scores for different confidence levels
Confidence Level P-value (Probability) Z-score (Standard Deviations)
90% < 0.10 < -1.65 or > 1.65 95% < 0.05 < -1.96 or > 1.96 99% < 0.01 < -2.58 or > 2.58
3.4 App Prototype
Modeling of goods management system was done in the form of an app prototype for
smartphones. The prototype was designed to include four main features to engage the
society with Zero Waste and sustainable living (Table 3.3). Such features were borrowed
and improved from shopping, reuse and how-to/product guide portals assessed in 3.1.
Univers
ity of
Mala
ya

69
Table 3.3: Main features of goods management prototype Function Content
Maps Provides maps to find, geolocate, analyze and navigate to goods and services providers
• Maps of business licensees in Kuala Lumpur
• Spatial analysis tools
Goods
Helps people discover goods and services and promote reduction and reuse among them
• Goods and services categories • Search • Product page • Mechanism for reuse
Waste Informs people on waste and proper waste disposal
• Waste categories • Waste infographics
Options Configures in-app settings and provides help
• Settings • Help • Knowledge on 3R
App UI and UX were designed in Microsoft PowerPoint. Multiple screens with 16:9
aspect ratio were illustrated to simulate app workflow. These screens were saved as PNG
(.png) images with 800px width and at least 1422px height. Then, each PNG image was
reduced to optimal size via http://tinypng.com without altering original resolution and
quality as preparation for upload.
App prototyping was done online via InVision (http://invisionapp.com). All screens
were uploaded, sorted in order and given hotspots (interaction zones) for tactile
interaction. Afterwards, the prototype was tested on multiple devices to make sure it
functions properly and smoothly.
Table 3.4 shows the workflow for app prototyping using a vector graphics software
(Microsoft PowerPoint), a PNG compressor web app (TinyPNG) and a prototyping web
app (InVision).
Univers
ity of
Mala
ya
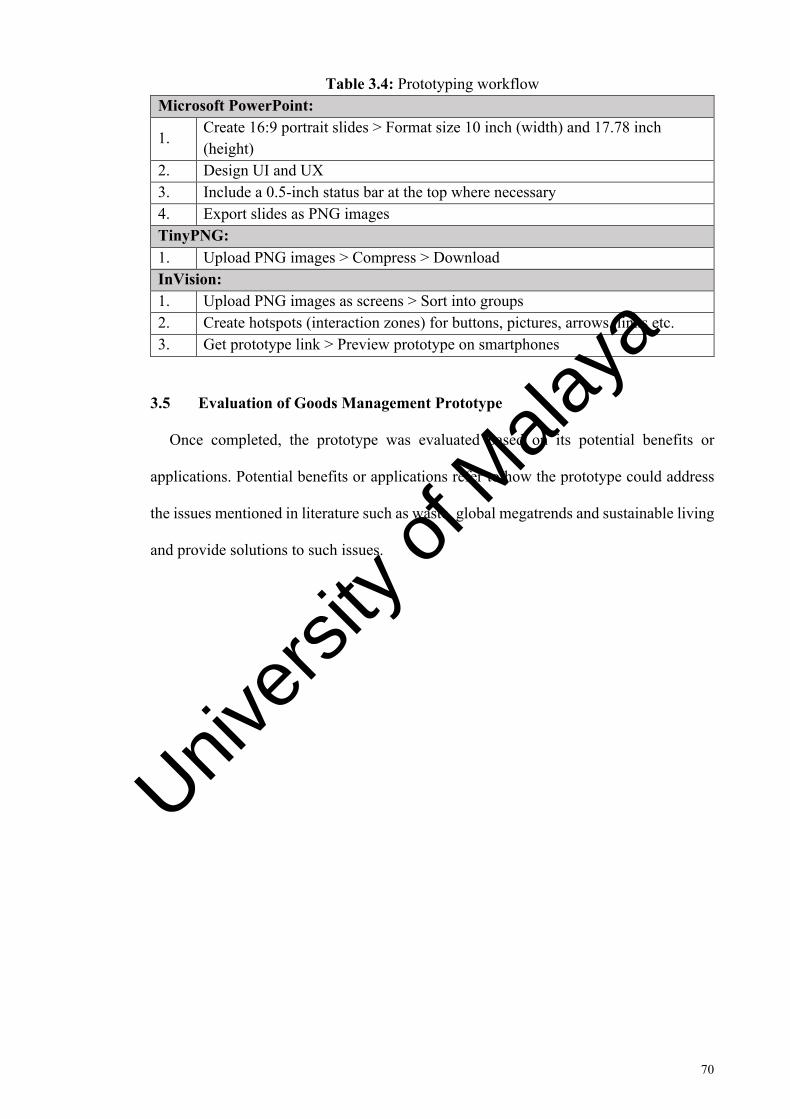
70
Table 3.4: Prototyping workflow Microsoft PowerPoint:
1. Create 16:9 portrait slides > Format size 10 inch (width) and 17.78 inch (height)
2. Design UI and UX 3. Include a 0.5-inch status bar at the top where necessary 4. Export slides as PNG images TinyPNG: 1. Upload PNG images > Compress > Download InVision: 1. Upload PNG images as screens > Sort into groups 2. Create hotspots (interaction zones) for buttons, pictures, arrows, links etc. 3. Get prototype link > Preview prototype on smartphones
3.5 Evaluation of Goods Management Prototype
Once completed, the prototype was evaluated based on its potential benefits or
applications. Potential benefits or applications refer to how the prototype could address
the issues mentioned in literature such as waste, global megatrends and sustainable living
and provide solutions to such issues.
Univers
ity of
Mala
ya

71
CHAPTER 4: RESULTS AND DISCUSSION
4.1 Goods and Services Providers in Kuala Lumpur
Goods and services providers are the subjects of this research as they are the sources
of goods and services. Goods and services, in turn, are the sources of waste; goods
become waste whereas services produce waste. Goods and services providers may be
distinguished into two groups: commercial and noncommercial. Commercial goods and
services providers can be grouped into formal (i.e., registered and licensed) and informal
(i.e., unregistered, unlicensed and usually small- or micro-scale). Noncommercial goods
and services providers, on the other hand, are nonprofit such as libraries, places of
worship, museums, orphanages and parks. Figure 4.1 illustrates the classification of
goods and services providers. During data collection, several sources were identified to
provide information on goods and services providers in Kuala Lumpur (Table 4.1).
Figure 4.1: Classification of goods and services providers
Table 4.1: Sources identified to collect data on goods and services providers Authority Third Party Online/Digital Presence
DBKL (Kuala Lumpur City Hall)
Local search Social media
Jabatan Pendaftaran Pertubuhan Malaysia (Registry of Societies, Malaysia)
Online shops/stores
Various government agencies
Univers
ity of
Mala
ya

72
After deliberation, this research decided to refer to authoritative source and focus
particularly on formal commercial goods and services providers, i.e., shops. Data on
licensed formal commercial goods and services providers were obtained from Jabatan
Pelesenan dan Pembangunan Penjaja (Licensing & Petty Traders Management
Department) of Dewan Bandaraya Kuala Lumpur (DBKL, or Kuala Lumpur City Hall)
as all formal commerce or businesses in Kuala Lumpur are required to apply for licenses
from the authority. DBKL proved to be a reliable, comprehensive and convenient source
for data collection. Table 4.2 describes categories of business licenses managed by
DBKL. Table 4.3 shows the datasets obtained from DBKL for analysis.
Table 4.2: Categories of DBKL business license (DBKL, n.d.) Native Name English Translation 1 Lesen Premis Premise License § Premis § Premise § Premis dan Iklan Papan Tanda § Premise and Signboard
Advert. 2 Lesen Penjaja Vendor License § Penjaja Statik § Static Vendor § Penjaja Pasar § Market Vendor § Penjaja Sementara § Temporary Vendor § Penjaja Beredar § Mobile Vendor 3 Lesen Iklan Advertisement License § Iklan Papan Tanda Premis § Premise’s Signboard
Advertisement § Iklan Paparan Sementara § Temporary Display Advert. § Paparan Luar § Outdoor Display § Iklan Tiang Lampu § Lamppost Advertisement § Iklan Kain Rentang § Banner Advertisement § Iklan Belon § Balloon Advertisement 4 Lesen Hiburan Entertainment License § Hiburan Malam § Evening Entertainment § Hiburan Permainan § Game Entertainment § Hiburan Semasa § Current Entertainment o Konsert o Concert o Karnival o Carnival o Pesta Ria o Festival o Pertunjukan Fesyen o Fashion Show
Univers
ity of
Mala
ya

73
Table 4.2, continued. 4 o Ratu Cantik o Beauty Pageant o Jamuan Makan Malam o Dinner Banquet o Drama/Teater o Drama/Theater o Promosi o Promotion o Tayangan Amal o Charity Show o Opera Cina o Chinese Opera o Ekspo/Pameran o Expo/Exhibition o Pertunjukan Pentas o Stage Show § Hiburan Panggung Wayang § Cinema Entertainment 5 Lesen Minuman Keras Liquor License 6 Lesen Tempat Letak Kereta Persendirian Private Parking Lot License 7 Lesen Pelelong Auctioneer License 8 Lesen Penulis Petisyen Petition Writer License 9 Permit Menggali Semula Kubur Grave Exhumation Permit
Table 4.3: License datasets obtained from DBKL for year 2015 Obtained No. of licensees
1 Lesen Premis (Premise License)
11,844
2 Lesen Penjaja (Vendor License)
24,403
3 Lesen Iklan (Advertisement License)
45,719
4 Lesen Hiburan (Entertainment License)
1,159
5 Lesen Minuman Keras (Liquor License)
777
6 Lesen Tempat Letak Kereta Persendirian (Private Parking Lot License)
695
TOTAL: 84,597
Not Obtained
7 Lesen Pelelong (Auctioneer License) NA
8 Lesen Penulis Petisyen (Petition Writer License) NA
9 Permit Menggali Semula Kubur (Grave Exhumation Permit) NA
Business listings from third-party sources such as local search were not used as
sources for three reasons. First, they were not reliable because they depend on analytics
Univers
ity of
Mala
ya

74
data. Second, they were not comprehensive because not all businesses participate in such
listings. Third, it was not convenient to extract listings data. Local search services such
as Foursquare, Google, TripAdvisor and OpenStreetMap allow the public to either create,
claim or edit business listings via registration or location sharing (Foursquare, n.d.-b;
Google, n.d.; OpenStreetMap, 2017; TripAdvisor, n.d.). Certain listings display only
names, addresses and business types while others may include reviews and ratings. In
addition, goods and services providers can opt for paid advertising to have their business
promoted or featured on certain local search services (Foursquare, n.d.-a; Yelp, n.d.).
Similar to local search, online/digital presence was also not used as a source. First, it
was not reliable because it was optional and not required like license. Second, it was not
comprehensive because not all businesses have online or digital presence. And third, it
was also not convenient to extract data. Social media such as Facebook and Instagram
are used for business purposes—marketing, communication and sales—by goods and
services providers given their ease of use, freeness and popularity. Online shops (or e-
commerce sites) such as Lazada and FashionValet are online platforms dedicated for
browsing and shopping which facilitate inventory management and transaction. Formal
commercial goods and services providers may use both social media and online shops
whereas informal commercial goods and services providers may depend only on social
media because online shops require fees to operate. For future studies, social media can
be used as a source because such data are not available from authorities or local search.
Noncommercial goods and services providers were originally planned to be included
but had to be excluded because data were inconvenient to obtain given the budget and
time constraint. Data on noncommercial goods and services providers such as charity and
nonprofit organizations are available from the authority in charge of societies, i.e.,
Univers
ity of
Mala
ya
75
Jabatan Pendaftaran Pertubuhan Malaysia (Registry of Societies, Malaysia). Data on
other types of noncommercial goods and services providers such as places of worships,
parks and recreational areas, museums, libraries, halls, and academic and research
institutions are available from and scattered across various government agencies. Local
search and social media also provide data on such places and designate them as places of
interests (POIs).
4.2 A Geographic Information System (GIS) of Goods and Services Providers
The creation of a GIS for goods and services providers in Kuala Lumpur is necessary
to perform spatial analyses. Spatial analyses are beneficial in providing location
intelligence through recognition of patterns or trends related to the distribution of goods
and services providers. In order to gain a sense of ownership, Malaysians must know their
surroundings as the Malay proverb befittingly says, “Tak kenal maka tak cinta”
(ignorance leads to disinterest).
Analyses using clusters and heat maps are subjective because they vary depending on
range parameter set by user—cluster radius and areas of influence, respectively—and
zoom level. Clusters represent nearby point features as groups and summarize their
attributes, i.e., business activities. Heat maps represent geographic density of point
features on maps. The density of point features is calculated around each raster cell. In
concept, each raster cell is defined as a neighborhood, and the size and shape of the
neighborhood can be adjusted. In Esri Maps for Office (version 3.1), heat maps were
visualized using the violet-green-red gradient which signified low-medium-high density.
In ArcGIS Maps for Office (version 4), the color scheme was updated to be less colorful
and the gradient used was gray-red-yellow (low-medium-high density). Figure 4.2 shows
the color schemes used for heat maps.
Univers
ity of
Mala
ya

76
Figure 4.2: Color schemes used for heat maps in Esri Maps for Office (left) and ArcGIS Maps for Office (right)
While similar to heat maps, analyses using hot spot maps are objective because they
are fixed—unaffected by zoom level—as calculated using Getis-Ord Gi* statistics. Hot
spot analysis is a method to model spatial relationships by calculating spatial statistics—
p-values (probabilities) and z-scores (standard deviations)—which represent the
statistical significance of the spatial clustering of point feature, given the
conceptualization of spatial relationships and the scale of analysis, i.e., distance
parameter. Each point feature is analyzed within the context of neighboring point
features. Statistically significant spatial clusters are attributed to small p-values and high
or low z-scores. Meanwhile, spatial clusters that are statistically insignificant mean they
occur at random. In short, hot spots quantify spatial patterns to identify only significant
or critical spatial clustering at 90%, 95% and 99% confidence levels.
Furthermore, False Discovery Rate (FDR) is a correction parameter that reduce critical
p-values thresholds to account for multiple testing and spatial dependence. The reduction
is a function of the number of input features and the neighborhood structure employed.
The default parameter for conceptualization of spatial relationships used was Fixed
Distance Band which uses fixed spatial scale across all features. On the contrary, Nearest
Neighbors is a parameter for conceptualization of spatial relationships which ensure
minimum number of neighbors especially for features that are skewed or not normally
distributed. All these different techniques of spatial analyses were used to complement
each other.
Univers
ity of
Mala
ya

77
This study only dealt with 2D maps and fixed-time data for year 2015. In addition, the
study did not take into account business traffic so all goods and services providers were
assumed to be equal in traffic volume. Inclusion of 3D maps, indoor maps, real-time data
as well as data on individual provider’s size of enterprise and business traffic in the form
of an index representing their overall popularity would expand qualitative dimensions
and greatly enhance spatial and temporal analyses in future studies. A wide context of
space and time is important as it reflects the dynamics of goods and services.
4.2.1 Premise (Premis) Licensees
Figure 4.3 shows the catalog, clusters and heat map of 11,844 Premise (Premis)
licensees. The catalog covers only Premise (Premis) subcategory and not Premise and
Signboard Advertisement (Premis dan Iklan Papan Tanda) subcategory. It shows
business premises were spread all over Kuala Lumpur except in Mukim Hulu Kelang (far
northeast). There were 708 categories, showing a very wide range of business activities.
Table 4.4 shows a partial list of 28 categories (for more lists, refer to Appendix A). The
top five categories were restaurant (kedai makan/restoran: 1637), fashion boutique (butik
pakaian fesyen/lain-lain pakaian: 883), café (kedai kopi/kafe: 523), grocery store (kedai
barang-barang runcit: 443) and telecommunication device sale/repair
(menjual/membaiki alat telekomunikasi: 440).
Table 4.4: Categories of Premise (Premis) licensees Categories Count 1 Restaurant Kedai makan/restoran 1637
2 Fashion boutique Butik pakaian fesyen/lain-lain
pakaian 883 3 Café Kedai kopi/kafe 523 4 Grocery store Kedai barang-barang runcit 443
5 Telecommunication device sale/repair
Menjual/membaiki alat telekomunikasi 440
Univers
ity of
Mala
ya

78
Table 4.4, continued. Categories Count
6 Warehouse/store (non-food) Gudang/stor (bukan makanan) 323
7 Selling cosmetic/beauty set Menjual kosmetik/kelengkapan
dandanan diri 249
8 Perm salon/hair salon Kedai kerinting rambut/salun
pendandan rambut 209
9 Selling ready-to-wear clothes/textiles (arcade/kiosk)
Menjual pakaian siap/tekstil (arked/gerai) 202
10 Fashion boutique/other clothes , warehouse/store (non-food)
Butik pakaian fesyen/lain-lain pakaian , gudang/stor (bukan
makanan) 201
11 Cosmetic and facial beauty salon center
Pusat salun persolekan dan kecantikan muka/andaman 184
12 Playground (indoor) Taman permainan kanak-kanak
(dalam bangunan) 178
13 Selling snacks / soft drinks Menjual makanan ringan /
minuman ringan 177 14 Laundry cleaner Kedai dobi 160
15 Selling furniture /home/office deco Menjual perabut /hiasan
rumah/pejabat 145 16 Hotel (budget) Hotel (budget)* 145
17 Selling & storing motor car Menjual & menyimpan kereta
motor 135 18 Selling ready-to-wear/textile Menjual pakaian siap/tekstil 131
19
Medical treatment (cupping , ear, acupuncture, bone, scraping, slug, chiropractic)
Rawatan kesihatan (bekam, telinga, akupuntur, tulang,
scraping, lintah, kiropraktik)** 129 20 Mini market Pasar mini 119 21 Travel agency Agensi pelancongan 119
22 Auto repair, service Bengkel kereta-
membaiki,menservis 114
23 Sale of computers, computer parts and accessories
Penjualan komputer, alat ganti komputer dan aksesori
komputer 110
24 Stalls in restaurants/ food courts Gerai dalam restoran/ dimedan
selera 109
25 Jewelry and precious stones shop (buy and sell)
Kedai barang kemas dan permata (jual dan beli) 108
26 Tailor shop Kedai tukang jahit 107
27 Selling electrical and electronic appliances
Menjual barang elektrik dan elektronik 105
28 Bag shop Kedai beg 103
Univers
ity of
Mala
ya

79
Some business premises carried out multiple business activities, thus they had more
than one category. In the datasets, multiple categories were grouped together under one
label. For example, if a business premise operated as a café (kedai kopi/kafe) and a
restaurant (kedai makan/restoran), then its license was labeled or categorized as ‘café,
restaurant’ (kedai kopi/kafe, kedai makan/restoran) instead of ‘café’ [kedai kopi/kafe
(category 1)] and ‘restaurant’ [kedai makan/restoran (category 2)]. Apparently, diversity
in business activities contributed to large number of business premise categories.
Due to large number of categories, the clusters of business premises did not accurately
visualize the breakdown of categories because a majority of categories was grouped
together as ‘others’ (white color-code). Heat map subjectively visualizes high spatial
clustering of business premises across Mukim Batu (northwest), Mukim Setapak
(northeast), Mukim Kuala Lumpur (west and upper south), Bandar Kuala Lumpur
(central), Mukim Ampang (east) and Mukim Petaling (lower south).
Figures 4.4 and 4.5 illustrate the outcomes of objective analysis, i.e., hot spot maps
for Premise (Premis) licensees. Hot spots of business premises were determined in only
Bandar Kuala Lumpur (central) based on small p-values (< 0.48) and high z-scores (>
1.1). After FDR correction, there were indeed statistically significant hot spots of
business premises in Bandar Kuala Lumpur (central) at 90%, 95% and 99% confidence
levels, therefore spatial clustering of business premises was significant. Furthermore,
based on Nearest Neighbors hot spot map, there was a statistically significant spatial
relationship between the clusters of business premises across Mukim Batu (northwest),
Mukim Setapak (northeast), Bandar Kuala Lumpur (central), Mukim Kuala Lumpur
(upper south) and Mukim Petaling (lower south).
Univers
ity of
Mala
ya
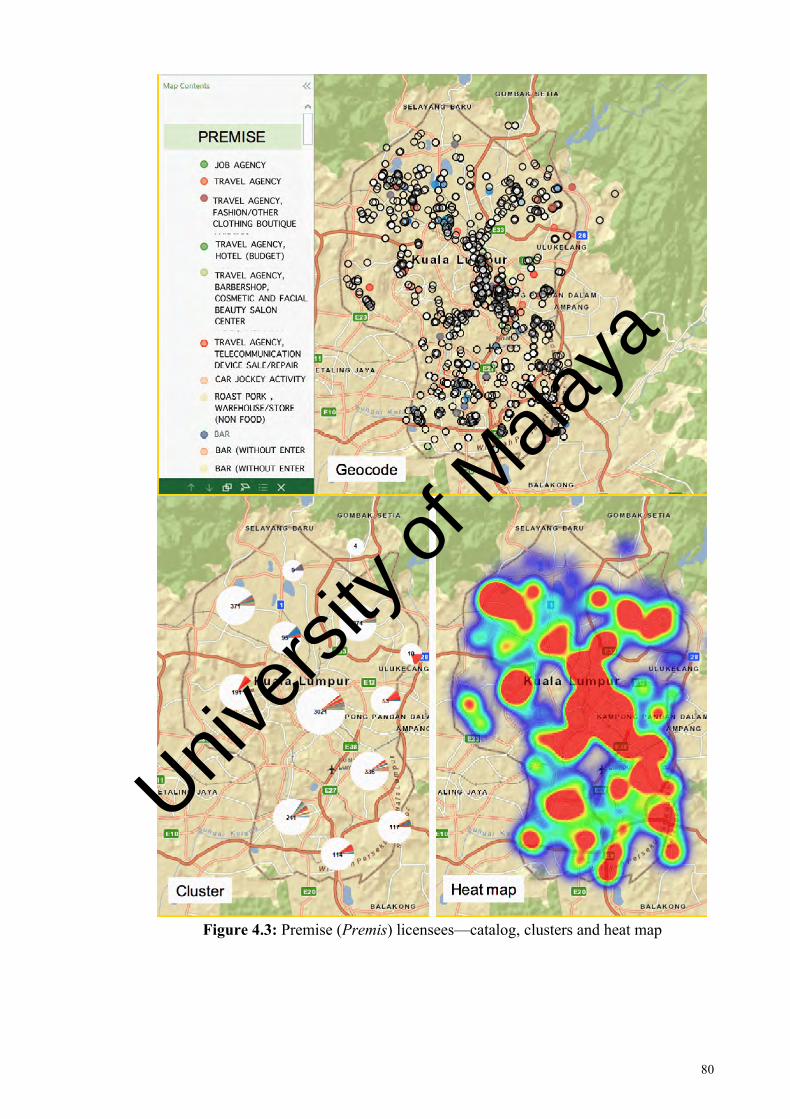
80
Figure 4.3: Premise (Premis) licensees—catalog, clusters and heat map
Univers
ity of
Mala
ya

81
Figure 4.4: Premise (Premis) licensees—hot spots: p-value & z-score
Univers
ity of
Mala
ya

82
Figure 4.5: Premise (Premis) licensees—hot spots: FDR & Nearest Neighbors
Univers
ity of
Mala
ya

83
4.2.2 Vendor (Penjaja) Licensees
Figure 4.6 shows the catalog, clusters and heat map of 24,403 Vendor (Penjaja)
licensees. The catalog shows vendors were spread all over Kuala Lumpur except in
Mukim Hulu Kelang (far northeast). The datasets recorded most of the addresses of
Vendor (Penjaja) licensees in basic or informal format—e.g., street name or market
name—which greatly affected geocoding. There were 3694 categories, showing a very
wide range of business activities. Redundancy may have also contributed to the large
number of categories. Table 4.5 shows a partial list of 53 categories that contained
redundancy (for more lists, refer to Appendix B). After taking account of redundancy
error, the top five categories were food (makanan: 2614), food and beverages (makanan
dan minuman: 2342), clothes (pakaian: 2087), vegetables (sayur: 1780), and fruits (buah-
buahan: 1111). As recommendations, DBKL should formalize address of vendors and
standardize the names and spelling of categories to ensure uniform data reporting and
analysis.
Table 4.5: Categories of Vendor (Penjaja) licensees Categories Count 1 Food Makanan 2515 2 Clothes Pakaian 1940 3 Vegetable Sayur 1191 4 Food and beverages Makanan dan minuman 1112 5 Food & beverages Makanan & minuman 984 6 Fruits Buah-buahan 882 7 Food, beverages Makanan, minuman 823 8 Fish Ikan 633 9 Vegetable Sayur 589
10 Groceries Barang runcit 528 11 Beverage Minuman 458 12 Processed chicken Ayam proses 413 13 Fish Ikan 407 14 Shoe Kasut 268
Univers
ity of
Mala
ya
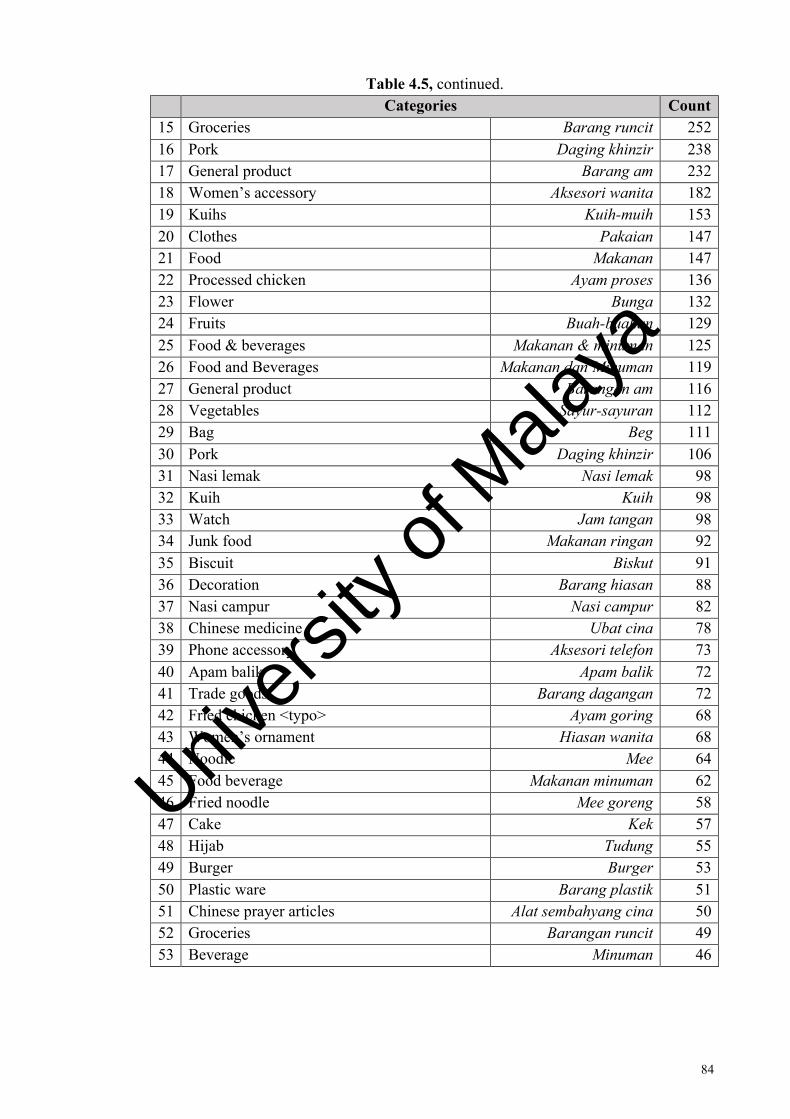
84
Table 4.5, continued. Categories Count
15 Groceries Barang runcit 252 16 Pork Daging khinzir 238 17 General product Barang am 232 18 Women’s accessory Aksesori wanita 182 19 Kuihs Kuih-muih 153 20 Clothes Pakaian 147 21 Food Makanan 147 22 Processed chicken Ayam proses 136 23 Flower Bunga 132 24 Fruits Buah-buahan 129 25 Food & beverages Makanan & minuman 125 26 Food and Beverages Makanan dan Minuman 119 27 General product Barangan am 116 28 Vegetables Sayur-sayuran 112 29 Bag Beg 111 30 Pork Daging khinzir 106 31 Nasi lemak Nasi lemak 98 32 Kuih Kuih 98 33 Watch Jam tangan 98 34 Junk food Makanan ringan 92 35 Biscuit Biskut 91 36 Decoration Barang hiasan 88 37 Nasi campur Nasi campur 82 38 Chinese medicine Ubat cina 78 39 Phone accessory Aksesori telefon 73 40 Apam balik Apam balik 72 41 Trade goods Barang dagangan 72 42 Fried chicken <typo> Ayam goring 68 43 Women’s ornament Hiasan wanita 68 44 Noodle Mee 64 45 Food beverage Makanan minuman 62 46 Fried noodle Mee goreng 58 47 Cake Kek 57 48 Hijab Tudung 55 49 Burger Burger 53 50 Plastic ware Barang plastik 51 51 Chinese prayer articles Alat sembahyang cina 50 52 Groceries Barangan runcit 49 53 Beverage Minuman 46
Univers
ity of
Mala
ya
85
Due to very large number of categories, the clusters of vendors did not accurately
visualize the breakdown of categories because a majority of categories was grouped
together as ‘others’ (white color-code). Heat map subjectively visualizes high spatial
clustering of vendors across Mukim Batu (northwest), Mukim Setapak (northeast),
Mukim Kuala Lumpur (west and upper south), Bandar Kuala Lumpur (central), Mukim
Petaling (lower south) and Mukim Cheras (far southeast).
Figures 4.7 and 4.8 illustrate the outcomes of objective analysis, i.e., hot spot maps
for Vendor (Penjaja) licensees. Hot spots of vendors were determined in Mukim Kuala
Lumpur (west and upper south), Bandar Kuala Lumpur (central) and partially in Mukim
Batu (northwest) based on small p-values (< 0.3) and high z-scores (> 0.8). After FDR
correction, there was no statistically significant hot spots of vendors in the said provinces
at 90%, 95% and 99% confidence levels, therefore spatial clustering of vendors was not
significant. However, based on Nearest Neighbors hot spot map, there was a statistically
significant spatial relationship between the clusters of vendors across Mukim Batu
(northwest), Mukim Setapak (northeast), Bandar Kuala Lumpur (central), Mukim Kuala
Lumpur (upper south), Mukim Petaling (lower south) and Mukim Cheras (far southeast).
Univers
ity of
Mala
ya

86
Figure 4.6: Vendor (Penjaja) licensees—catalog, clusters and heat map
Univers
ity of
Mala
ya

87
Figure 4.7: Vendor (Penjaja) licensees—hot spots: p-value & z-score
Univers
ity of
Mala
ya

88
Figure 4.8: Vendor (Penjaja) licensees—hot spots: FDR & Nearest Neighbors
Univers
ity of
Mala
ya

89
4.2.3 Signboard Advertisement (Iklan Papan Tanda) Licensees
The catalog of 45,719 Signboard Advertisement (Iklan Papan Tanda) licensees only
covers Premise’s Signboard Advertisement (Iklan Papan Tanda Premis) license
subcategory. It is separated into two: non-premise (7,554) and premise (38,165). Such
distinction is necessary because non-premise refers to business premises that do not fall
within Premise (Premis) license category. On the other hand, premise refers to licensed
premises—the discrepancy between the number of premises under Advertisement (Iklan)
license (38,165) and under Premise (Premis) license (11,844) can be attributed to Premise
(Premis) license catalog covering only Premise (Premise) subcategory and not Premise
and Signboard Advertisement (Premis dan Iklan Papan Tanda) subcategory.
Figure 4.9 shows the catalog, clusters and heat map of 7,554 Signboard Advertisement
(Iklan Papan Tanda) non-premise licensees. The catalog shows non-premises were
spread all over Kuala Lumpur except in Mukim Setapak (northeast). Table 4.6 shows
there were six categories.
Table 4.6: Categories of Signboard Advertisement (Iklan Papan Tanda) non-premise licensees Categories Count 1 Office Pejabat urusan 5,559 2 Clinic Klinik 694 3 Bank Bank 650 4 Tuition center Pusat tuisyen 280 5 Nursery Taska 110 6 Money changer Pengurup wang 261
The clusters of non-premises visualize the breakdown of categories and show that the
main category of non-premises was office (pejabat urusan), followed by clinic (klinik),
bank (bank), tuition center (pusat tuisyen), nursery (taska), and money changers
(pengurup wang). Heat map subjectively visualizes high spatial clustering of non-
Univers
ity of
Mala
ya
90
premises in Bandar Kuala Lumpur (central). A different color scheme for heat map was
used due to the update from Esri Maps for Office (version 3.1) to ArcGIS Maps for Office
(version 4).
Figures 4.10 and 4.11 illustrate the outcomes of objective analysis, i.e., hot spot maps
for Signboard Advertisement (Iklan Papan Tanda) non-premise licensees. Hot spots of
non-premises were determined in Bandar Kuala Lumpur (central), Mukim Kuala Lumpur
(upper south) and Mukim Petaling (lower south) based on small p-values (< 0.24) and
high z-scores (> 1.0). After FDR correction, there were no statistically significant hot
spots of non-premises in the said provinces at 90%, 95% and 99% confidence levels,
therefore spatial clustering of non-premises was not significant. However, based on
Nearest Neighbors hot spot map, there was a statistically significant spatial relationship
between the clusters of non-premises across Mukim Batu (northwest), Bandar Kuala
Lumpur (central), Mukim Kuala Lumpur (upper south) and Mukim Petaling (lower
south).
Univers
ity of
Mala
ya

91
Figure 4.9: Signboard Advertisement (Iklan Papan Tanda) non-premise licensees—catalog, clusters and heat map
Univers
ity of
Mala
ya

92
Figure 4.10: Signboard Advertisement (Iklan Papan Tanda) non-premise licensees—hot spots: p-value & z-score
Univers
ity of
Mala
ya

93
Figure 4.11: Signboard Advertisement (Iklan Papan Tanda) non-premise licensees—hot spots: FDR & Nearest Neighbors
Univers
ity of
Mala
ya

94
Figure 4.12 shows the catalog, clusters and heat map of 38,165 Signboard
Advertisement (Iklan Papan Tanda) premise licensees. The catalog shows premises were
spread all over Kuala Lumpur except in Mukim Setapak (northeast). There was only
category, namely Signboard Advertisement (Iklan Papan Tanda). Such premises
licensees did not have multiple categories like other licensees.
In this case, the clusters of premises visualize the breakdown of quantities—instead of
categories—and show that the main cluster of premises was located within Bandar Kuala
Lumpur (central: 1,354 point features), followed by Mukim Kuala Lumpur (west and
upper south: 633 point features), Mukim Batu (northwest: 340 point features), Mukim
Petaling (lower south: 329 point features) and Mukim Setapak (northeast: 155 point
features). Heat map subjectively visualizes high spatial clustering of premises in Bandar
Kuala Lumpur (central). A different color scheme for heat map was used due to the update
from Esri Maps for Office (version 3.1) to ArcGIS Maps for Office (version 4).
Figures 4.13 and 4.14 illustrate the outcomes of objective analysis, i.e., hot spot maps
for Signboard Advertisement (Iklan Papan Tanda) premise licensees. Hot spots of
premises were determined in Bandar Kuala Lumpur (central) only based on small p-
values (< 0.42) and high z-scores (> 1.3). After FDR correction, there were indeed
statistically significant hot spots of premises in Bandar Kuala Lumpur (central) at 90%,
95% and 99% confidence levels, therefore spatial clustering of premises was significant.
This correlated with the result of FDR correction for Premise (Premis) licensees.
Furthermore, based on Nearest Neighbors hot spot map, there was a statistically
significant spatial relationship between the clusters of premises across Mukim Batu
(northwest), Bandar Kuala Lumpur (central), Mukim Kuala Lumpur (upper south), and
Mukim Petaling (lower south).
Univers
ity of
Mala
ya

95
Figure 4.12: Signboard Advertisement (Iklan Papan Tanda) premise licensees—catalog, clusters and heat map
Univers
ity of
Mala
ya

96
Figure 4.13: Signboard Advertisement (Iklan Papan Tanda) premise licensees—hot spots: p-value & z-score
Univers
ity of
Mala
ya

97
Figure 4.14: Signboard Advertisement (Iklan Papan Tanda) premise licensees—hot spots: FDR & Nearest Neighbors
Univers
ity of
Mala
ya

98
4.2.4 Entertainment (Hiburan) Licensees
The catalog of 1,159 Entertainment (Hiburan) licensees is separated into two license
subcategories: Game Entertainment (Hiburan Permainan: 199) and Evening
Entertainment (Hiburan Malam: 960). The other two license subcategories—Current
Entertainment (Hiburan Semasa) and Cinema Entertainment (Hiburan Panggung
Wayang)—were not covered in the catalog.
Figure 4.15 shows the catalog, clusters and heat map of 199 Game Entertainment
(Hiburan Permainan) licensees. The catalog shows game entertainment premises were
spread all over Kuala Lumpur except in Mukim Hulu Kelang (far northeast), Mukim
Ampang (east) and Mukim Cheras (far southeast). There were 13 categories, showing a
wide range of business activities (Table 4.7).
Table 4.7: Categories of Game Entertainment (Hiburan Permainan) licensees Categories Count 1 Billiard Biliard 141 2 Family entertainment center Pusat hiburan keluarga 32 3 Playground Pusat permainan kanak-kanak 10 4 Bowling Bowling 5 5 Electronic dart Damak elektronik 2 6 Theme park Taman tema 2 7 Children’s game Permainan kanak-kanak 1 8 Table football, snooker Bola meja, snuker 1 9 Table football Bola meja 1
10 Electronic dart, snooker Damak elektronik, snuker 1 11 Dart, pool table Damak, meja pool 1
12 Electronic dart, pool table, snooker Damak elektronik, meja pool,
snuker 1
13 Electronic dart, children’s game Damak elektronik, permainan
kanak-kanak 1
Univers
ity of
Mala
ya

99
The clusters of game entertainment premises visualize the breakdown of categories
and show that the main category of game entertainment premises was billiard (biliard:
141), followed by family entertainment center (pusat hiburan keluarga: 32), playground
(pusat permainan kanak-kanak: 10), bowling (bowling: 5) and electronic dart (damak
elektronik: 2) together with theme park (taman tema: 2). Heat map subjectively visualizes
high spatial clustering of game entertainment premises in Bandar Kuala Lumpur
(central).
Figures 4.16 and 4.17 illustrate the outcomes of objective analysis, i.e., hot spot maps
for Game Entertainment (Hiburan Permainan) licensees. Hot spots of game
entertainment premises were determined in Bandar Kuala Lumpur (central) only based
on small p-values (< 0.36) and high z-scores (> 0.9). After FDR correction, there were
indeed statistically significant hot spots of game entertainment premises in Bandar Kuala
Lumpur (central) at 90%, 95% and 99% confidence levels, therefore spatial clustering of
game entertainment premises was significant. Furthermore, based on Nearest Neighbors
hot spot map, there was a statistically significant spatial relationship between the clusters
of game entertainment premises across Mukim Batu (northwest), Bandar Kuala Lumpur
(central), Mukim Kuala Lumpur (upper south) and Mukim Petaling (lower south).
Univers
ity of
Mala
ya

100
Figure 4.15: Game Entertainment (Hiburan Permainan) licensees—catalog, clusters and heat map
Univers
ity of
Mala
ya

101
Figure 4.16: Game Entertainment (Hiburan Permainan) licensees—hot spots: p-value & z-score
Univers
ity of
Mala
ya

102
Figure 4.17: Game Entertaiment (Hiburan Permainan) licensees—hot spots: FDR & Nearest Neighbors
Univers
ity of
Mala
ya

103
Figure 4.18 shows the catalog, clusters and heat map of 960 Evening Entertainment
(Hiburan Malam) licensees. The catalog shows evening entertainment premises were
spread all over Kuala Lumpur except in Mukim Ampang (east) and Mukim Cheras (far
southeast). There were 143 categories, showing a wide range of business activities
(Appendix C). Table 4.8 shows a partial list of 61 categories. Redundancy (e.g., pub, bar;
pub,bar; bar, pub) and typo (e.g., barn restoran) in DBKL data recording may have also
contributed to the large number of categories by creating duplicates.
Table 4.8: Categories of Evening Entertainment (Hiburan Malam) licensees Categories Count 1 Pub Pub 95 2 Karaoke Karaoke 78 3 Bar Bar 71 4 Pub, bar Pub, bar 68 5 Bar,restaurant Bar,restoran 67 6 Pub,restaurant Pub,restoran 51 7 Hotel Hotel 48 8 Pub,lounge Pub,lounge 44 9 Restaurant Restoran 37
10 Pub,café Pub,kafe 31 11 Bar,lounge Bar,lounge 29 12 Lounge Lounge 25 13 Bar,café Bar,kafe 23 14 Bar,lounge,karaoke Bar,lounge,karaoke 19 15 Pub,karaoke Pub,karaoke 18 16 Bar,karaoke Bar,karaoke 17 17 Restaurant, café Restoran, kafe 16 18 Bar,pub,restaurant Bar,pub,restoran 15 19 Pub,lounge Pub,istirehat/lounge 8 20 Bar,pub Bar,pub 7 21 Bar, restaurant Bar, restoran 6 22 Pub,bar,karaoke Pub,bar,karaoke 6 23 Ballroom Dewan tari menari 5 24 Lounge,restaurant Lounge,restoran 5
Univers
ity of
Mala
ya
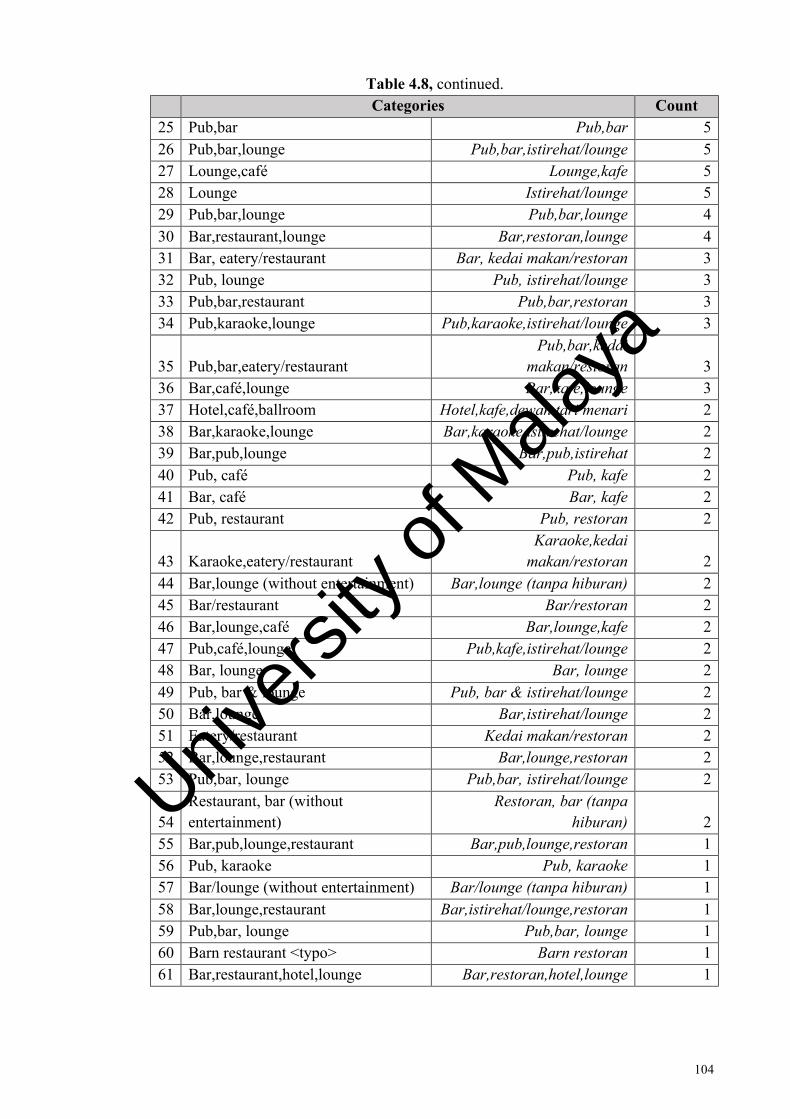
104
Table 4.8, continued. Categories Count
25 Pub,bar Pub,bar 5 26 Pub,bar,lounge Pub,bar,istirehat/lounge 5 27 Lounge,café Lounge,kafe 5 28 Lounge Istirehat/lounge 5 29 Pub,bar,lounge Pub,bar,lounge 4 30 Bar,restaurant,lounge Bar,restoran,lounge 4 31 Bar, eatery/restaurant Bar, kedai makan/restoran 3 32 Pub, lounge Pub, istirehat/lounge 3 33 Pub,bar,restaurant Pub,bar,restoran 3 34 Pub,karaoke,lounge Pub,karaoke,istirehat/lounge 3
35 Pub,bar,eatery/restaurant Pub,bar,kedai
makan/restoran 3 36 Bar,café,lounge Bar,kafe,lounge 3 37 Hotel,café,ballroom Hotel,kafe,dewan tari menari 2 38 Bar,karaoke,lounge Bar,karaoke,istirehat/lounge 2 39 Bar,pub,lounge Bar,pub,istirehat 2 40 Pub, café Pub, kafe 2 41 Bar, café Bar, kafe 2 42 Pub, restaurant Pub, restoran 2
43 Karaoke,eatery/restaurant Karaoke,kedai
makan/restoran 2 44 Bar,lounge (without entertainment) Bar,lounge (tanpa hiburan) 2 45 Bar/restaurant Bar/restoran 2 46 Bar,lounge,café Bar,lounge,kafe 2 47 Pub,café,lounge Pub,kafe,istirehat/lounge 2 48 Bar, lounge Bar, lounge 2 49 Pub, bar & lounge Pub, bar & istirehat/lounge 2 50 Bar,lounge Bar,istirehat/lounge 2 51 Eatery/restaurant Kedai makan/restoran 2 52 Bar,lounge,restaurant Bar,lounge,restoran 2 53 Pub,bar, lounge Pub,bar, istirehat/lounge 2
54 Restaurant, bar (without entertainment)
Restoran, bar (tanpa hiburan) 2
55 Bar,pub,lounge,restaurant Bar,pub,lounge,restoran 1 56 Pub, karaoke Pub, karaoke 1 57 Bar/lounge (without entertainment) Bar/lounge (tanpa hiburan) 1 58 Bar,lounge,restaurant Bar,istirehat/lounge,restoran 1 59 Pub,bar, lounge Pub,bar, lounge 1 60 Barn restaurant <typo> Barn restoran 1 61 Bar,restaurant,hotel,lounge Bar,restoran,hotel,lounge 1
Univers
ity of
Mala
ya

105
The clusters of evening entertainment premises visualize the breakdown of categories
and show that the main category of evening entertainment premises was pub (pub: 95),
followed by karaoke (karaoke: 78), bar (bar: 71), pub, bar (pub, bar: 68) and
bar,restaurant (bar,restoran: 67). Heat map subjectively visualizes high spatial clustering
of evening entertainment premises in Mukim Batu (northwest), Mukim Kuala Lumpur
(west and upper south), Bandar Kuala Lumpur (central) and Mukim Petaling (lower
south).
Figures 4.19 and 4.20 illustrate the outcomes of objective analysis, i.e., hot spot maps
for Evening Entertainment (Hiburan Malam) licensees. Hot spots of evening
entertainment premises were determined in Bandar Kuala Lumpur (central) and partially
in Mukim Kuala Lumpur (upper south) based on small p-values (< 0.25) and high z-
scores (> 1.1). After FDR correction, there were no statistically significant hot spots of
evening entertainment premises in the said provinces at 90%, 95% and 99% confidence
levels, therefore spatial clustering of premises was not significant. However, based on
Nearest Neighbors hot spot map, there was a statistically significant spatial relationship
between the clusters of premises across Mukim Batu (northwest), Bandar Kuala Lumpur
(central), Mukim Kuala Lumpur (upper south), and Mukim Petaling (lower south).
Univers
ity of
Mala
ya

106
Figure 4.18: Evening Entertainment (Hiburan Malam) licensees—catalog, clusters and heat map
Univers
ity of
Mala
ya

107
Figure 4.19: Evening Entertainment (Hiburan Malam) licensees—hot spots: p-value & z-score
Univers
ity of
Mala
ya

108
Figure 4.20: Evening Entertainment (Hiburan Malam) licensees—hot spots: FDR & Nearest Neighbors
Univers
ity of
Mala
ya
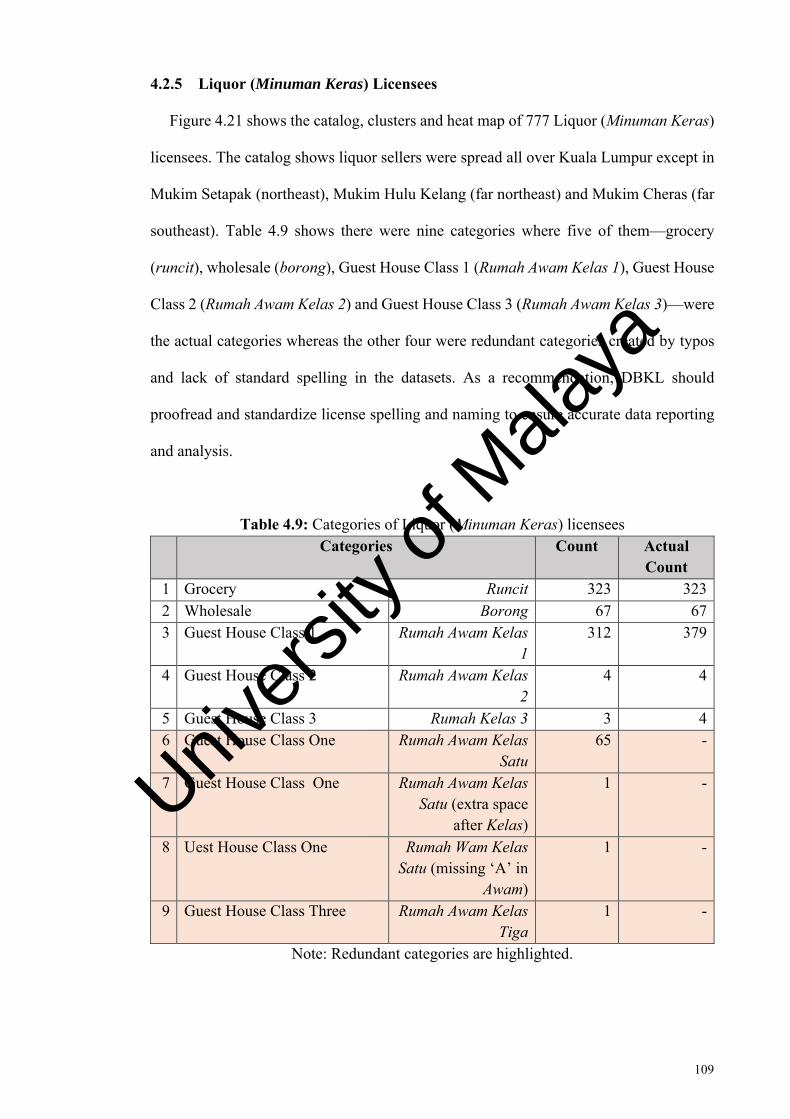
109
4.2.5 Liquor (Minuman Keras) Licensees
Figure 4.21 shows the catalog, clusters and heat map of 777 Liquor (Minuman Keras)
licensees. The catalog shows liquor sellers were spread all over Kuala Lumpur except in
Mukim Setapak (northeast), Mukim Hulu Kelang (far northeast) and Mukim Cheras (far
southeast). Table 4.9 shows there were nine categories where five of them—grocery
(runcit), wholesale (borong), Guest House Class 1 (Rumah Awam Kelas 1), Guest House
Class 2 (Rumah Awam Kelas 2) and Guest House Class 3 (Rumah Awam Kelas 3)—were
the actual categories whereas the other four were redundant categories created by typos
and lack of standard spelling in the datasets. As a recommendation, DBKL should
proofread and standardize license spelling and naming to ensure accurate data reporting
and analysis.
Table 4.9: Categories of Liquor (Minuman Keras) licensees Categories Count Actual
Count 1 Grocery Runcit 323 323 2 Wholesale Borong 67 67 3 Guest House Class 1 Rumah Awam Kelas
1 312 379
4 Guest House Class 2 Rumah Awam Kelas 2
4 4
5 Guest House Class 3 Rumah Kelas 3 3 4 6 Guest House Class One Rumah Awam Kelas
Satu 65 -
7 Guest House Class One Rumah Awam Kelas Satu (extra space
after Kelas)
1 -
8 Uest House Class One Rumah Wam Kelas Satu (missing ‘A’ in
Awam)
1 -
9 Guest House Class Three Rumah Awam Kelas Tiga
1 -
Note: Redundant categories are highlighted.
Univers
ity of
Mala
ya

110
Redundant categories have led to redundant clusters. The clusters of liquor sellers
visualize the breakdown of categories and after taking account of redundancy error, the
clusters show that the main category of liquor sellers was Guest House Class 1 (Rumah
Awam Kelas 1: 379), followed by grocery (runcit: 323), wholesale (borong: 67), and
Guest House Class 2 (Rumah Awam Kelas 2: 4) together with Guest House Class 3
(Rumah Awam Kelas 3: 4). Heat map subjectively visualizes high spatial clustering of
liquor sellers in Mukim Kuala Lumpur (west), Bandar Kuala Lumpur (central) and also
partially in Mukim Batu (northwest).
Figures 4.22 and 4.23 illustrate the outcomes of objective analysis, i.e., hot spot maps
for Liquor (Minuman Keras) licensees. Hot spots of liquor sellers were determined in
Bandar Kuala Lumpur (central) only based on small p-values (< 0.33) and high z-scores
(> 1.3). After FDR correction, there were indeed statistically significant hot spots of
liquor sellers in Bandar Kuala Lumpur (central) at 90%, 95% and 99% confidence levels,
therefore spatial clustering of liquor sellers was significant. Furthermore, based on
Nearest Neighbors hot spot map, there was a statistically significant spatial relationship
between the clusters of liquor sellers across Mukim Batu (northwest), Mukim Kuala
Lumpur (west and upper south), Bandar Kuala Lumpur (central) and Mukim Petaling
(lower south).
Univers
ity of
Mala
ya

111
Figure 4.21: Liquor (Minuman Keras) licensees—catalog, clusters and heat map
Univers
ity of
Mala
ya

112
Figure 4.22: Liquor (Minuman Keras) licensees—hot spots: p-value & z-score
Univers
ity of
Mala
ya

113
Figure 4.23: Liquor (Minuman Keras) licensees—hot spots: FDR & Nearest Neighbors
Univers
ity of
Mala
ya
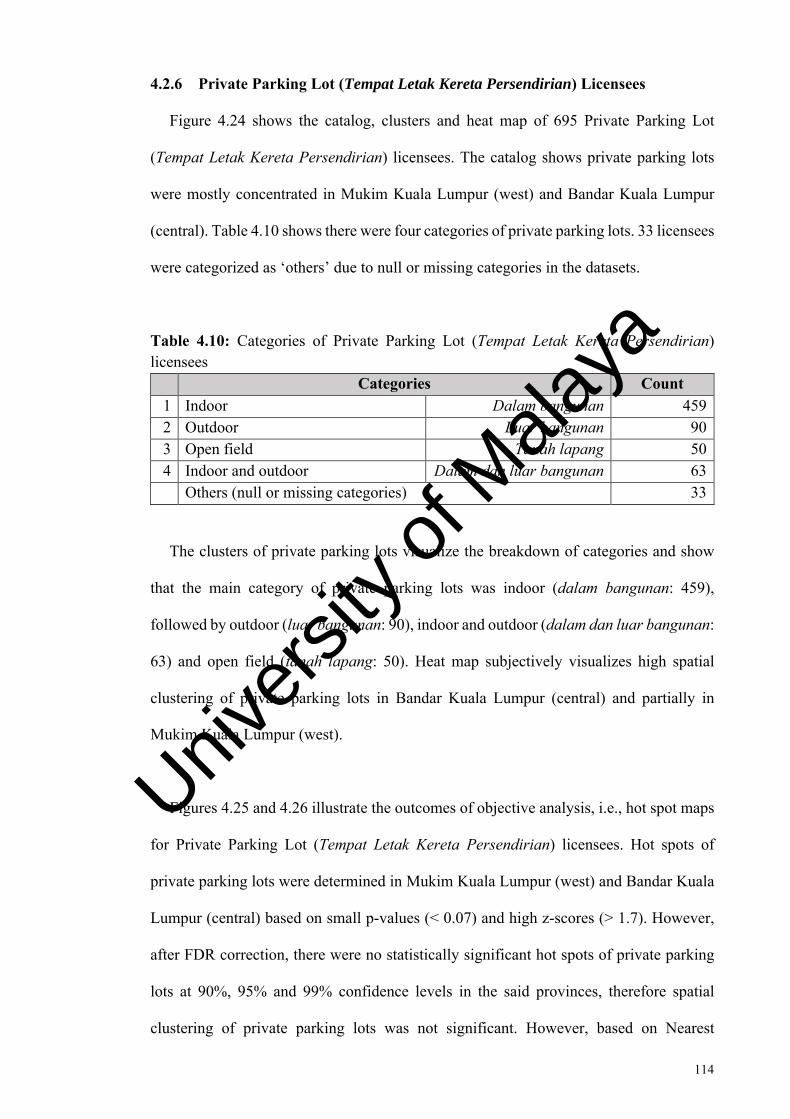
114
4.2.6 Private Parking Lot (Tempat Letak Kereta Persendirian) Licensees
Figure 4.24 shows the catalog, clusters and heat map of 695 Private Parking Lot
(Tempat Letak Kereta Persendirian) licensees. The catalog shows private parking lots
were mostly concentrated in Mukim Kuala Lumpur (west) and Bandar Kuala Lumpur
(central). Table 4.10 shows there were four categories of private parking lots. 33 licensees
were categorized as ‘others’ due to null or missing categories in the datasets.
Table 4.10: Categories of Private Parking Lot (Tempat Letak Kereta Persendirian) licensees Categories Count 1 Indoor Dalam bangunan 459 2 Outdoor Luar bangunan 90 3 Open field Tanah lapang 50 4 Indoor and outdoor Dalam dan luar bangunan 63
Others (null or missing categories) 33
The clusters of private parking lots visualize the breakdown of categories and show
that the main category of private parking lots was indoor (dalam bangunan: 459),
followed by outdoor (luar bangunan: 90), indoor and outdoor (dalam dan luar bangunan:
63) and open field (tanah lapang: 50). Heat map subjectively visualizes high spatial
clustering of private parking lots in Bandar Kuala Lumpur (central) and partially in
Mukim Kuala Lumpur (west).
Figures 4.25 and 4.26 illustrate the outcomes of objective analysis, i.e., hot spot maps
for Private Parking Lot (Tempat Letak Kereta Persendirian) licensees. Hot spots of
private parking lots were determined in Mukim Kuala Lumpur (west) and Bandar Kuala
Lumpur (central) based on small p-values (< 0.07) and high z-scores (> 1.7). However,
after FDR correction, there were no statistically significant hot spots of private parking
lots at 90%, 95% and 99% confidence levels in the said provinces, therefore spatial
clustering of private parking lots was not significant. However, based on Nearest
Univers
ity of
Mala
ya

115
Neighbors hot spot map, there was indeed a statistically significant spatial relationship
between the clusters of private parking lots in Mukim Kuala Lumpur (west) and Bandar
Kuala Lumpur (central).
Figure 4.24: Private Parking Lot (Tempat Letak Kereta Persendirian) licensees—catalog, clusters and heat map
Univers
ity of
Mala
ya

116
Figure 4.25: Private Parking Lot (Tempat Letak Kereta Persendirian) licensees—hot spots: p-value & z-score
Univers
ity of
Mala
ya

117
Figure 4.26: Private Parking Lot (Tempat Letak Kereta Persendirian) licensees—hot spots: FDR & Nearest Neighbors
Univers
ity of
Mala
ya

118
4.2.7 Summary of GIS
Overall, the outcomes of spatial analyses indicated a high diversity of goods and
services providers in Kuala Lumpur and the differences in level of spatial clustering of
goods and services providers that the heat maps (subjective) and hot spot maps (objective)
can produce. Highly diverse goods and services signify highly diverse economics and
wastes. The benefits gained from GIS and spatial analyses on goods and services
providers in Kuala Lumpur are knowing the whats and wheres of goods and services
providers, i.e., the diversity of goods and services providers and the distribution patterns
of goods and services providers across the provinces (mukim). These answers can help
the government understand the whys, i.e., the underlying processes promoting to the
patterns or relationships observed. In other words, GIS can provide solutions based on
the causes and effects observed from the variables. Previous studies have made use of
GIS to determine spatial patterns relative to nonspatial values such as measuring
distribution of greenspace and parks to assess accessibility and equity relative to
population in urban settings (Comber et al., 2008; Nicholls, 2001). The maps of goods
and services providers along with spatial analyses would later be included as contents for
prototype development in Subchapter 4.3.
4.3 Goods Management Prototype
After analyzing goods and services providers, a model for goods management system
was developed in the form of an app prototype. The goal of the prototype was to minimize
waste and maximize the potential of goods and services through reduction and reuse. To
experience the prototype, readers may access https://invis.io/BG93C76W9. For best
experience, readers may need to open the URL using a smartphone web browser (e.g.,
Safari, Chrome), create a web app by adding the webpage to home screen and access via
the web app, rather than web browser.
Univers
ity of
Mala
ya

119
The ubiquity of smartphones allows easy access to information and tools via apps or
websites. ICT (information and communications technology) is a modern tool for
problem solving as demonstrated in various researches, such as urban planning for built,
natural and social environments using UrbanSim and a Web 2.0 mapping service, and
road conditions monitoring using smartphones and machine learning (Abdel Gawad et
al., 2016; Bugs et al., 2010; El-Wakeel et al., 2017; Waddell, 2002).
The prototype was developed as a platform model for two primary activities. First,
helping people reduce—i.e., giving access to information on goods and services that are
relevant to their needs and wants. And second, helping people reuse—i.e., reuse, repair,
donate or sell goods. The lack of an integrated system that combines shopping with
Reduce, Reuse and product guides necessitated the development of the prototype. Thus,
the prototype borrowed and improved upon key features of shopping portals (e.g.,
Amazon, eBay), reuse portals (e.g., Olio, Letgo, Village) and how-to/product guide
portals (e.g., wikiHow, MacRumors, Macworld, TechRadar, HowStuffWorks) in order
to leverage the potentials of Experience Economy and Sharing Economy.
Prototyping of goods management system required effective UI (user interface) and
UX (user experience) as well as functional contents. For the sake of simplicity, UI and
UX can be defined as form and function, respectively. An app that is beautiful but hard
to use means it has a good UI but a bad UX. If it is easy to use but not beautiful, then it
has a good UX but a bad UI. As mentioned before, the maps of goods and services
providers along with spatial analyses were included as one of the contents of the
prototype. Figure 4.27 shows the complete main features of the goods management
prototype.
Univers
ity of
Mala
ya
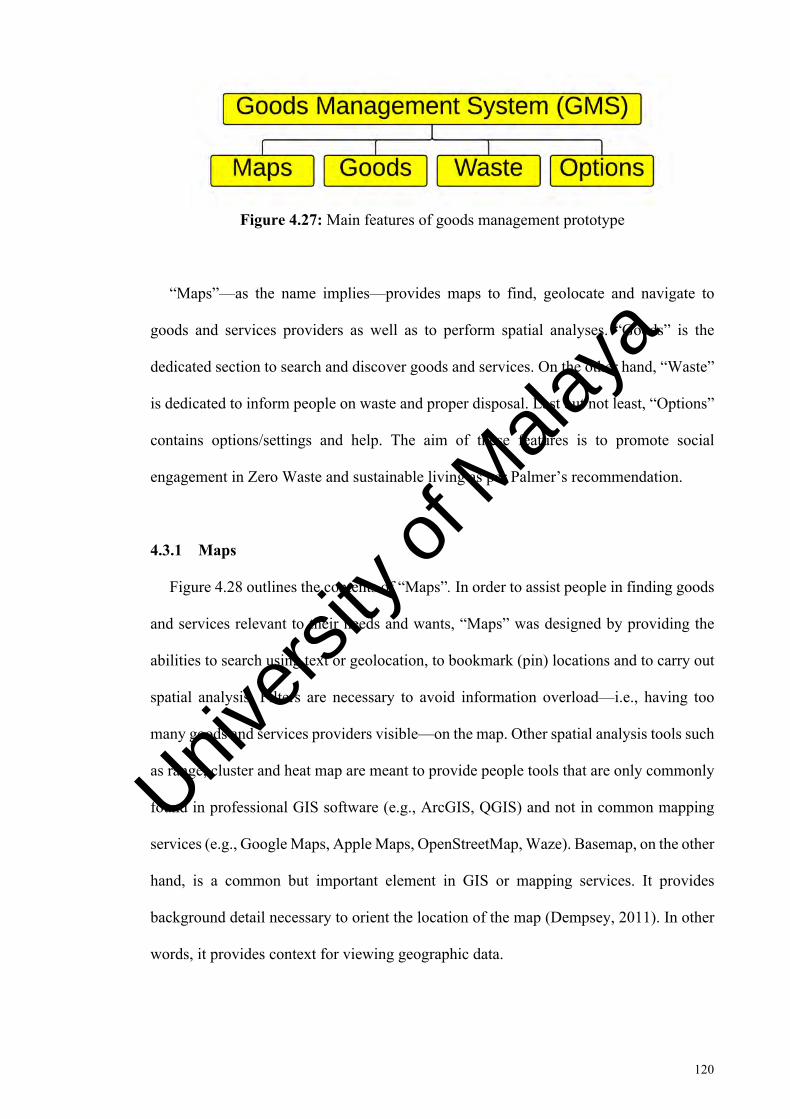
120
Figure 4.27: Main features of goods management prototype
“Maps”—as the name implies—provides maps to find, geolocate and navigate to
goods and services providers as well as to perform spatial analyses. “Goods” is the
dedicated section to search and discover goods and services. On the other hand, “Waste”
is dedicated to inform people on waste and proper disposal. Last but not least, “Options”
contains options/settings and help. The aim of these features is to promote social
engagement in Zero Waste and sustainable living as per Palmer’s recommendation.
4.3.1 Maps
Figure 4.28 outlines the contents of “Maps”. In order to assist people in finding goods
and services relevant to their needs and wants, “Maps” was designed by providing the
abilities to search using text or geolocation, to bookmark (pin) locations and to carry out
spatial analysis. Filters are necessary to avoid information overload—i.e., having too
many goods and services providers visible—on the map. Other spatial analysis tools such
as range, cluster and heat map are meant to provide people tools that are only commonly
found in professional GIS software (e.g., ArcGIS, QGIS) and not in common mapping
services (e.g., Google Maps, Apple Maps, OpenStreetMap, Waze). Basemap, on the other
hand, is a common but important element in GIS or mapping services. It provides
background detail necessary to orient the location of the map (Dempsey, 2011). In other
words, it provides context for viewing geographic data.
Univers
ity of
Mala
ya
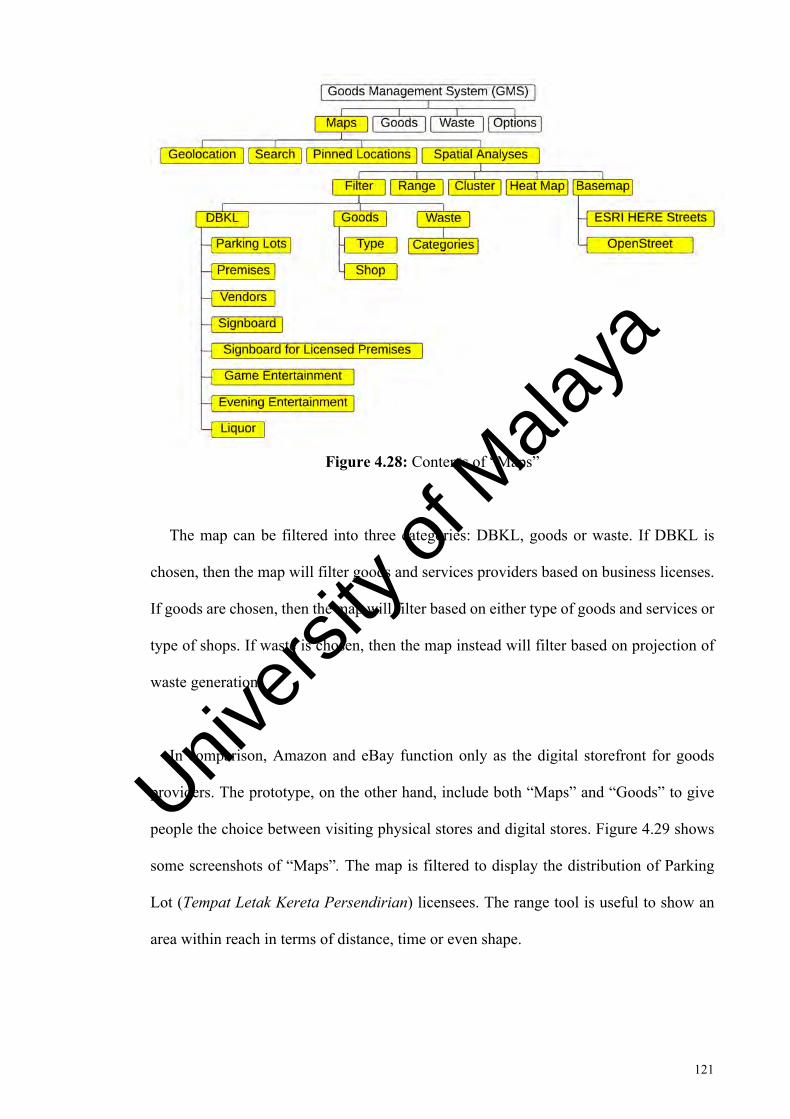
121
Figure 4.28: Contents of “Maps”
The map can be filtered into three categories: DBKL, goods or waste. If DBKL is
chosen, then the map will filter goods and services providers based on business licenses.
If goods are chosen, then the map will filter based on either type of goods and services or
type of shops. If waste is chosen, then the map instead will filter based on projection of
waste generation.
In comparison, Amazon and eBay function only as the digital storefront for goods
providers. The prototype, on the other hand, include both “Maps” and “Goods” to give
people the choice between visiting physical stores and digital stores. Figure 4.29 shows
some screenshots of “Maps”. The map is filtered to display the distribution of Parking
Lot (Tempat Letak Kereta Persendirian) licensees. The range tool is useful to show an
area within reach in terms of distance, time or even shape.
Univers
ity of
Mala
ya

122
Figure 4.29: Screenshots of “Maps”
Univers
ity of
Mala
ya

123
4.3.2 Goods
Figure 4.30 outlines the contents of “Goods”. In order to develop a one-stop app for
goods and services, “Goods” was designed by providing users access to goods and
services database and allowing users to search using text or image (i.e., scan goods using
object recognition), to use a pinboard for notes or bookmarks, to trade or donate goods,
to request for goods or services to be provided or removed and lastly, to contact the
authority.
Figure 4.30: Contents of “Goods”
Univers
ity of
Mala
ya

124
Similar to shopping and reuse portals, goods and services are sorted into categories.
In total, there are 16 categories (Table 4.11):
Table 4.11: Goods and services categories in “Goods” Category Description of Goods and Services
Home Homes and home supplies Supply All goods and services Work Office and industrial supplies, office buildings, factories, warehouses Study Learning supplies and institutions Kitchen Food, cooking and kitchen supplies Health Health, medicine and medical institutions Culture Culture, history, arts and related institutions Social Personal and interpersonal matters, social welfare, venue for social
events and cemeteries Eat Places to eat, food delivery and food catering Play Games, sports and exercise Outdoor Gardening, farming, recreation and nature Connect Telecommunications, postage and money transfer Ride Trade and maintenance of vehicles including license and insurance Travel Transportation, tour, accommodation, traffic and immigration Fix Repair, service and maintenance Job Employment
Goods management covers all facets of goods and services, be them natural (e.g.,
herbs, trees, animals, water, coal), artificial (e.g., synthetic drugs, buildings, transport,
electricity), tangible (e.g., books, hardware), digital (e.g., e-books, software) or intangible
(e.g., knowledge, language, music). Goods management aims to emphasize the notion
that goods and services are not mere objects and actions but blessings and provisions that
the Almighty has provided. For this reason, the prototype implemented a mechanism for
donation. Donation can be made to individuals, organizations and events that are verified.
Donation inserts the element of charity into reduction and reuse. Nevertheless, the
prototype also allows for trade of used goods to reduce wastage, remove clutter and earn
money at the same time.
Univers
ity of
Mala
ya
125
Unlike regular product catalogs, the prototype provides how-tos or guides like the web
portals, wikiHow and MacRumors. How-tos or guides for goods usage and waste disposal
can be accessed via “Goods” and also “Options”. This is important to empower, educate
and protect consumers from fraud, misinformation, abuse, misuse and hazard. A good
understanding of goods will help people to practice reduction by extending the lifespan
of goods.
The description of a good or service is listed in its product page. A product page is
divided into three sections: Provider, Goods and Credentials. ‘Provider’ describes the
particulars of the provider—i.e., seller, shop or company—such as name, address,
contact, rating, operating hours, and business description including goods and services
offered and job prospects. ‘Goods’ describes the good or service in details—e.g., name,
price, function, rating, review—as well as how-tos for usage and disposal. Last but not
least, ‘Credentials’ describes the technicalities related to the provider, goods and services.
For example, business license, tax ID, trademarks, standards, patents, halal certificate,
grade of premise’s hygiene, country of origin, composition and nutrition content.
Figures 4.31-4.36 show screenshots of “Goods”. Figure 4.31 describes some of goods
and services categories as well as the action menu. Figure 4.32 shows the mechanism for
donation where people can either supply or demand goods and services. Figure 4.33-4.35
shows examples of product page and its sections: Provider, Goods and Credentials.
Finally, Figure 4.36 shows examples of services, i.e., taxi hailing and furniture repair.
Univers
ity of
Mala
ya

126
Figure 4.31: Screenshots of “Goods” (goods and services categories and action menu)
Univers
ity of
Mala
ya

127
Figure 4.32: Screenshots of “Goods” (donation)
Univers
ity of
Mala
ya

128
Figure 4.33: Screenshots of “Goods” (provider)
Univers
ity of
Mala
ya

129
Figure 4.34: Screenshots of “Goods” (product disposal)
Univers
ity of
Mala
ya
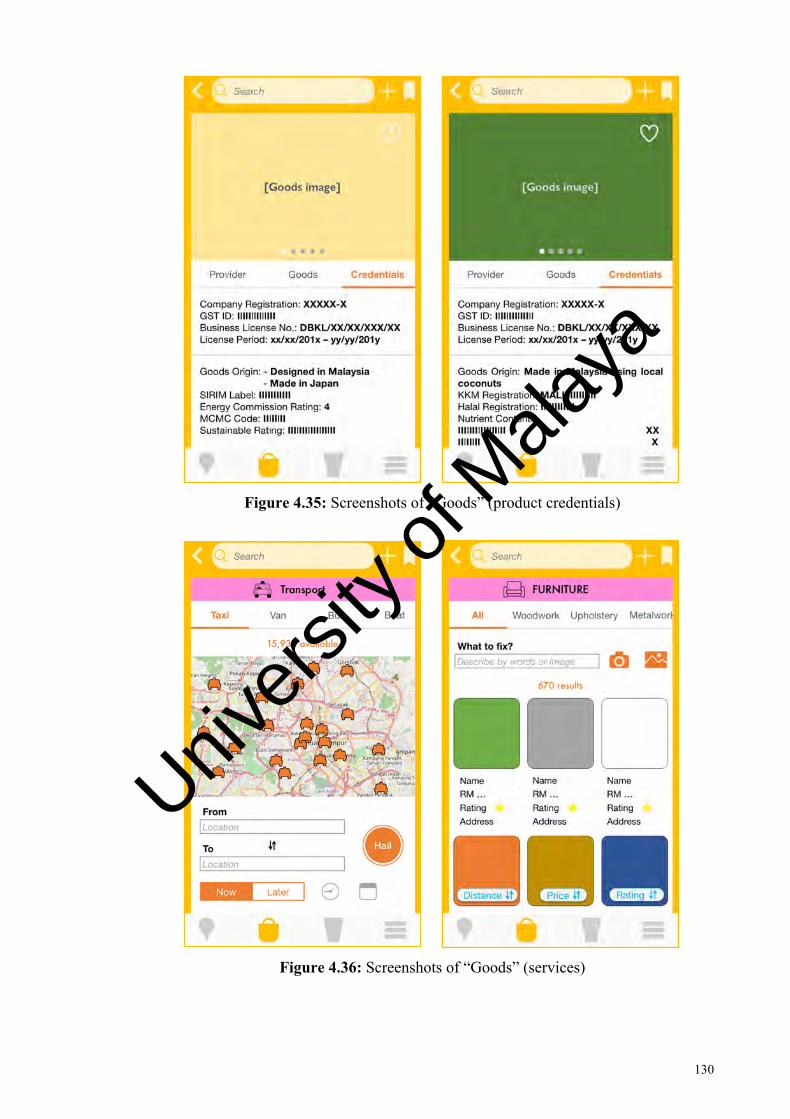
130
Figure 4.35: Screenshots of “Goods” (product credentials)
Figure 4.36: Screenshots of “Goods” (services)
Univers
ity of
Mala
ya
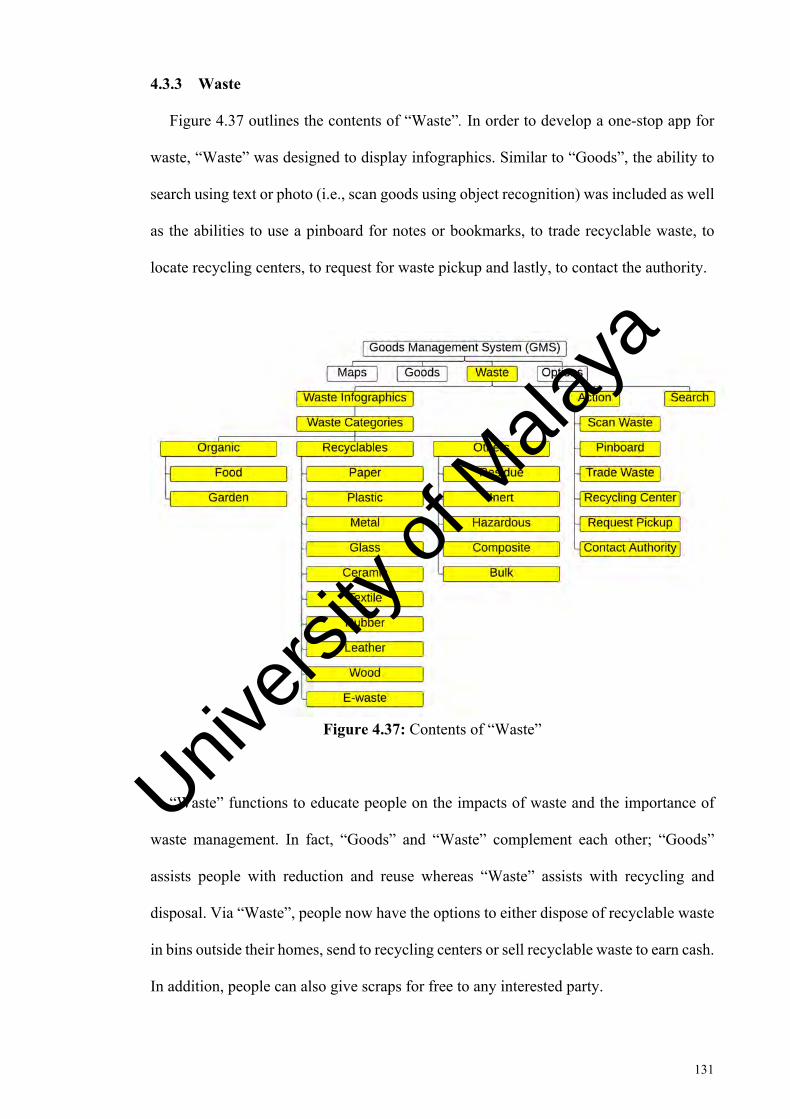
131
4.3.3 Waste
Figure 4.37 outlines the contents of “Waste”. In order to develop a one-stop app for
waste, “Waste” was designed to display infographics. Similar to “Goods”, the ability to
search using text or photo (i.e., scan goods using object recognition) was included as well
as the abilities to use a pinboard for notes or bookmarks, to trade recyclable waste, to
locate recycling centers, to request for waste pickup and lastly, to contact the authority.
Figure 4.37: Contents of “Waste”
“Waste” functions to educate people on the impacts of waste and the importance of
waste management. In fact, “Goods” and “Waste” complement each other; “Goods”
assists people with reduction and reuse whereas “Waste” assists with recycling and
disposal. Via “Waste”, people now have the options to either dispose of recyclable waste
in bins outside their homes, send to recycling centers or sell recyclable waste to earn cash.
In addition, people can also give scraps for free to any interested party.
Univers
ity of
Mala
ya

132
The infographics cover three main categories of waste: organic, recyclables and others
(Table 4.12). These categories cover an extensive range of consumer waste. Organic
waste refers to compostable waste, recyclable waste includes commonly and rarely
recycled waste, and other waste refers to non-recyclable and complex waste.
Table 4.12: Waste categories in “Waste” Category Component
Organic Food and garden waste Recyclables Paper, plastic, metal, glass, ceramic, textile, rubber, leather, wood
and e-waste Others Residue, inert, hazardous, composite and bulk waste
For each category of waste, the infographics will provide description and examples of
waste, disposal guide and schedule, waste lifespan, the costs (or negative effects) of
improper waste management, the benefits of proper waste management and finally, the
technology used for waste treatment. Such information is provided to familiarize people
with waste and its effects. Disposal guide and schedule will be useful to help people
separate their waste and avoid from incurring any penalty.
Figures 4.38-4.41 show screenshots of “Waste”. Figure 4.38 describes the waste
categories as well as the action menu. Figures 4.39-4.41 illustrate some examples of
waste infographics from each category, i.e., organic, recyclables and others.
Univers
ity of
Mala
ya

133
Figure 4.38: Screenshots of “Waste” (waste categories and action menu) Univ
ersity
of M
alaya

134
Figure 4.39: Screenshots of “Waste” (organic waste infographic)
Univers
ity of
Mala
ya

135
Figure 4.40: Screenshots of “Waste” (recyclable waste infographic)
Univers
ity of
Mala
ya

136
Figure 4.41: Screenshots of “Waste” (other waste infographic)
Univers
ity of
Mala
ya

137
4.3.4 Options
Figure 4.42 outlines the contents of “Options”. In order to enhance the experience of
goods management, “Options” was designed to provide ancillary contents, i.e., in-app
options and help. The in-app options contain the control panel for the prototype.
Accessing the in-app options will allow users to configure settings for notification,
language, background Global Positioning System (GPS) process, theme, accessibility for
visually impaired users, cache, history and user profile. Users can choose whether to save
their profile data locally (on-device) or the cloud. In addition, the in-app options also
allow users to contact the developer, rate the app and read information about the app.
Figure 4.42: Contents of “Options”
Univers
ity of
Mala
ya

138
On the other hand, help contains contents to promote cooperation among the public
and the authorities as well as how-tos of 3Rs. Help contains six sections: Law &
Guidelines, Feedback, Authority, Facilities, Event and Knowledge (Table 4.13).
Table 4.13: Help sections Section Description
Law & Guidelines Provides information on regulations and enforcement under federal and state jurisprudence
Feedback Provides messaging service to communicate with the authorities, e.g., reporting issues, querying, giving suggestions etc.
Authority Provides information on governing bodies, i.e., ministries, agencies and municipalities
Facilities Provides information on recycling centers and waste treatment facilities
Event Broadcasts events and public announcements Knowledge Compiles learning materials on reduction, reuse and recycling
as well as learning courses and practice
Accessing Law & Guidelines will allow the public to take one step closer to
familiarization with regulations. The prototype included all sorts of regulation and
enforcement, not just limited to environment and waste management. The combination
of Feedback and Authority will assist the public in engaging and communicating with the
authorities as well as assisting the authorities in serving the public. Increased interaction
and understanding between the public and the authorities are important to decrease the
perceptual gaps between them, ultimately leading to increase in sense of satisfaction and
ownership. Via Facilities, the public can get to know and locate waste treatment facilities
especially recycling centers. Event functions to facilitate the broadcasting of social
events, educative events and public announcements especially related to health and
distress. Finally, Knowledge is the one-stop place for how-tos and guides. All how-tos
and guides available in “Goods” are also available in Knowledge. In addition, Knowledge
also promotes learning in general by providing information on available seminars and
Univers
ity of
Mala
ya

139
programs. These sections are meant to improve user perception of authorities’
accountability and openness.
Figures 4.43-4.47 show screenshots of “Options”. Figure 4.43 presents the main page
of “Options” as well as the profile login page. Figure 4.44 shows Law & Guidelines and
Authority. Figure 4.45 illustrates examples of Feedback mechanism for issues related to
goods and waste. Figure 4.46 displays examples of material recovery, waste treatment
and landfill available via Facilities. Figure 4.47 describes examples of events and how-
tos available via Event and Knowledge.
Univers
ity of
Mala
ya

140
Figure 4.43: Screenshots of “Options” (main page and login page)
Univers
ity of
Mala
ya

141
Figure 4.44: Screenshots of “Options” (Law & Guidelines and Authority)
Univers
ity of
Mala
ya
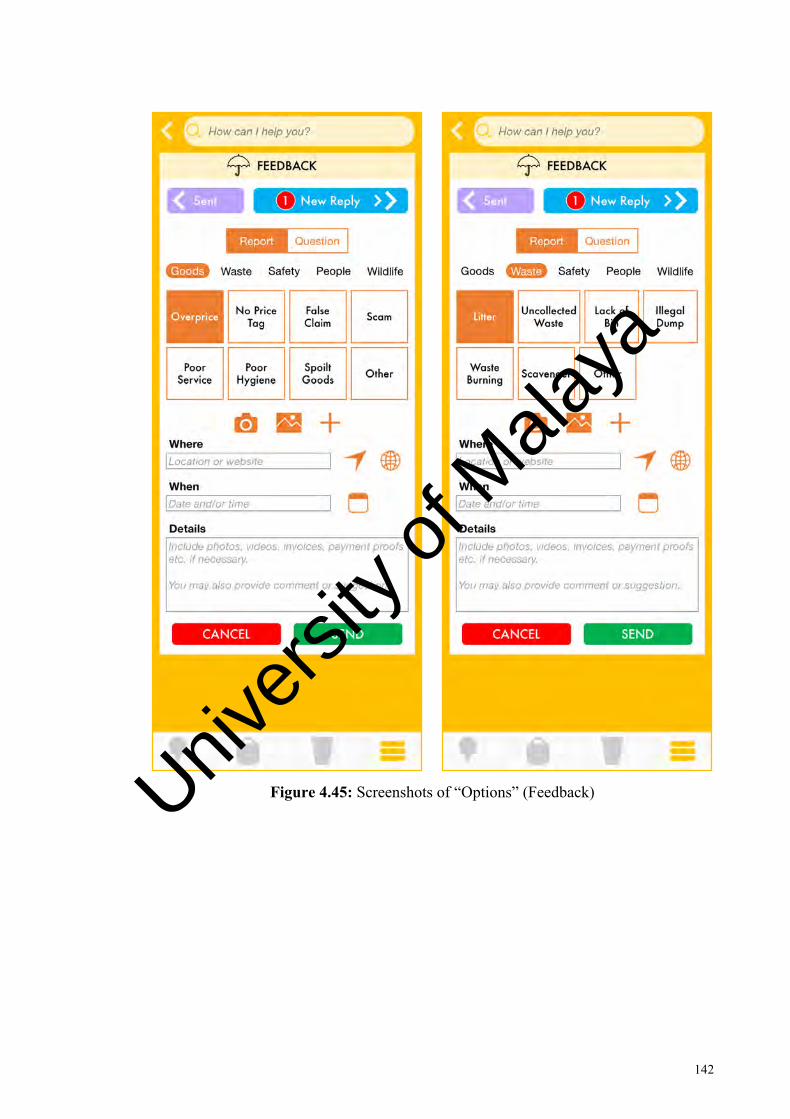
142
Figure 4.45: Screenshots of “Options” (Feedback)
Univers
ity of
Mala
ya

143
Figure 4.46: Screenshots of “Options” (Facilities)
Univers
ity of
Mala
ya

144
Figure 4.47: Screenshots of “Options” (Events and Knowledge)
Univers
ity of
Mala
ya

145
4.4 Potential Benefits of Goods Management
GIS proves to be effective in collecting, analyzing and presenting information. Such
information (i.e., location intelligences) supports goods management in a lot of aspects,
enabling it to achieve its goal of promoting reduction and reuse. Goods management is
most effective in the form of a Spatial Decision Support System (SDSS) that is packaged
as an interactive app for the masses. As an app, goods management becomes an
indispensable tool for perception, prediction and decision-making. Goods management
has lots of potentials in preparing mankind for the global megatrends, i.e., resource
scarcity, climate change, rapid urbanization, ageing population, changing demographics,
economic power shift, public debt, porous boundaries, the imperative to innovate, digital
immersion, and great expectations of services and experiences. This is because
megatrends are influenced by goods and services which shape human activities. As a
matter of fact, by taking the form of an app, goods management makes use of some of
the megatrends, namely, porous boundaries, the imperative to innovate, digital
immersion, and great expectations of services and experiences.
Furthermore, goods management also helps in realizing environmental, social and
economic sustainability, thus making it in line with the SDGs as well as the national plans
including Wawasan 2020, TN50 and Pelan Transformasi Minda (PTM). Shellenberger
and Nordhaus argued that engaging the moral base of the public as well as embracing a
new awareness of public concern and participation is important to address the looming
crisis of climate change (Palmer, 2007, March 29).
With this, goods management has the potential to create a blue ocean in waste
management. Despite its waste management origin, the resultant blue ocean can spread
across various aspects of human life, emphasizing goods management as a holistic and
Univers
ity of
Mala
ya
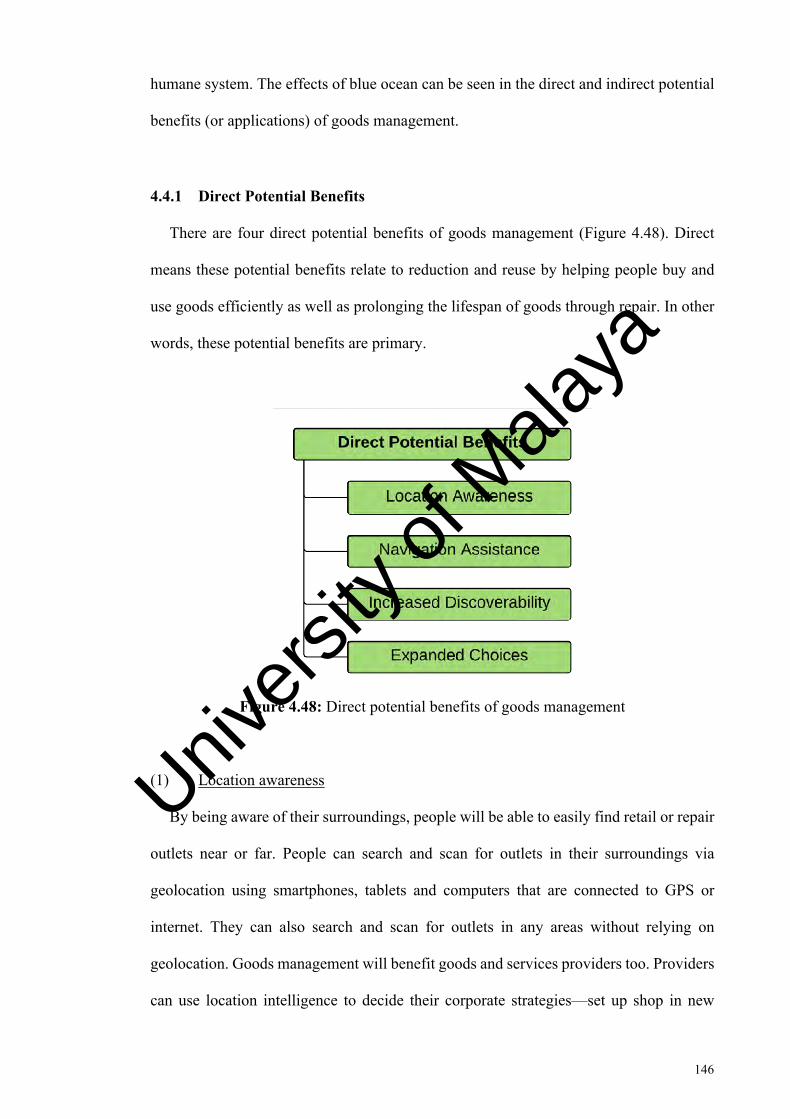
146
humane system. The effects of blue ocean can be seen in the direct and indirect potential
benefits (or applications) of goods management.
4.4.1 Direct Potential Benefits
There are four direct potential benefits of goods management (Figure 4.48). Direct
means these potential benefits relate to reduction and reuse by helping people buy and
use goods efficiently as well as prolonging the lifespan of goods through repair. In other
words, these potential benefits are primary.
Figure 4.48: Direct potential benefits of goods management
(1) Location awareness
By being aware of their surroundings, people will be able to easily find retail or repair
outlets near or far. People can search and scan for outlets in their surroundings via
geolocation using smartphones, tablets and computers that are connected to GPS or
internet. They can also search and scan for outlets in any areas without relying on
geolocation. Goods management will benefit goods and services providers too. Providers
can use location intelligence to decide their corporate strategies—set up shop in new
Univers
ity of
Mala
ya

147
markets or less competitive areas, offer niche goods and services, wholesale or retail,
etc.—based on outlet availability and proximity. The existence of shops is perceived
through many ways: advertisements (visual, audio), reviews (good, bad, OK),
recommendations (yes, no), mentions (hashtags, conversation, publication), exploration
(driving, walking etc.) and search (listings, search engines) (Chae et al., 2015; Dou et al.,
2010; Lewis & Reiley, 2009; Mudambi & Schuff, 2010; Sweeney et al., 2008). Goods
management is able to streamline and simplify perception process by collecting relevant
shop information and share it with people. Sharing good information is also charity; it
can help people be more productive by saving time, money and effort when searching for
shops and gives opportunities to disabled people—those with physical or mental
conditions that limit senses, movements or activities—or even those with limited
transport to search without struggle.
(2) Navigation assistance
Goods management does not just pinpoint shop locations but also assists people in
getting there. This helps people to proactively achieve their goal to reduce and reuse,
rather than just advertising retail and repair shops in text and visual format. As social and
emotional beings, people need to physically interact with other people and things, and go
places. Granted, online shopping has its benefits—easy, saves time, less hassle, avoid
crowd, borderless shopping etc.—but it should only enhance real life, not replace it (Jiang
et al., 2013; Peypoch, 2017). By using the maps in goods management, people can
navigate to their destinations using familiar tools like route selection, public transit info,
ride hailing, turn-by-turn direction, rerouting, traffic assessment and traffic alerts.
Location intelligence makes it possible for people to identify shops with respect to a
defined area, distance from a reference point, and travel time. All these tools are possible
by applying and extending navigation features from ESRI Maps for Office and other
Univers
ity of
Mala
ya

148
software into goods management. People do not just get to be productive by saving time,
money and effort in their travel but they also get to analyze their localities. In short,
locality analysis can lead to something bigger than choosing a place to buy or set up shop.
(3) Increased discoverability
Goods and services are no longer limited by marketing power. Goods management
compiles lists of licensed goods and service providers without exclusivity. It is a win-win
situation as all providers have equal chances to be visible to people. Visibility allows
people to find shops, goods and services according to their preferences, e.g., location,
quality, brand, value, range etc. High visibility of retail and repair outlets can promote
reduction and reuse among people. With the added visibility of charity organizations,
more people can discover such organizations and donate goods or even services to them
easily. In fact, those who are needy can easily seek assistance and shelter from these
organizations by using the databases.
In comparison, business listings from local search and shopping portals have a risk of
partiality. These listings rely on clients, subscribers, members or contributors for business
data (eBay, n.d; Foursquare, n.d.; Google, n.d.; OpenStreetMap, 2017; TripAdvisor, n.d.;
Yelp, n.d.). In some cases, providers can opt for paid advertising to have their shops
promoted in the listings (Farina, 2018). Partiality occurs when buyers have to make
decisions based on marketing presence or popularity due to incomplete information. This
causes them to automatically and consciously incur a risk in every purchase and non-
purchase decision (Kumar & Raju, 2013). In fact, shoppers who rely on search engines
may be at risk of intellectual isolation due to the filter bubble created by the engines’
algorithm which personalizes the information shoppers need based on their personal
information, location, search history and online behaviors (Techopedia, n.d.).
Univers
ity of
Mala
ya

149
Thus, goods management’s comprehensive coverage of goods and services can help
solve the rising problem of obtrusive online tracking and advertisements. In recent years,
advertisement-driven business model has been ruining the user experience in browsing
online contents (Mossberg, 2017). According to HubSpot Research, among the reasons
people are resorting to ad blockers are online advertisements are annoying, intrusive,
disruptive, create security and privacy concerns, and affect load times and bandwidth
usage (An, 2016). By making goods and services more accessible, providers can stop
depending on tracking and advertisements to reach their target audience and start
focusing solely on the quality of their goods or services.
(4) Expanded choices
Goods management’s all-inclusive listings of goods and services offer people a wider
selection to cater to their needs and wants. As a result, people can search for any provider,
shop, good or service as well as discover similar or better alternatives. Inclusiveness
allows people to search anything generally or specifically, ranging from common to rare.
Over time, goods will become old, obsolete, obscure and rare that they will be replaced
by new ones. Goods management can help people find out if the current market sells,
buys and repairs old, obsolete, obscure, and rare goods. Alternatives are useful for many
reasons. One, people get to know and compare various types of provider, shop, good and
service that they can use instead of the familiar ones. Two, people can do flexible and
dynamic planning in the events of unavailability, inaccessibility and relocation—e.g.,
discontinued services, closing hours, traffic jams, overcrowding, etc.—without
compromising their tasks. Three, alternatives can create better markets through healthy
competition which leads to better offerings to consumers in terms of price, variety, quality
and innovation (Hausman & Leibtag, 2007). This is important to avoid monopoly which
is often disadvantageous to consumers and providers alike (Pettinger, n.d.).
Univers
ity of
Mala
ya

150
4.4.2 Indirect Potential Benefits
There are at least six indirect potential benefits of goods management (Figure 4.49).
Indirect does not mean lesser importance but means these potential benefits do not relate
to reduction and reuse. In other words, these potential benefits are secondary to or
derivative of direct potential benefits.
Figure 4.49: Indirect potential benefits of goods management
(1) Waste prediction
Proactive approach can minimize future inconvenience. Over time, goods will turn
into waste. Goods management improves upon the reactive behavior of waste
management—recycling, energy recovery and disposal—by using insight and foresight.
As stated by Nicholls (2001), GIS can not only map and assess current situations but also
envisage future scenarios under different sets of hypothetical parameters. Insight can
compile data on the attributes and composition of goods available meanwhile foresight
can provide readiness in handling future waste efficiently. Such data can help people
become familiar with the potential hazards of goods when turned into waste. Big data
Univers
ity of
Mala
ya
151
collected from goods management can be used to produce a new waste prediction model
to complement previous models such as the RTCE (related total consumer expenditure)
to GDP model by Daskalopoulos et al. (1998) and the grey fuzzy dynamic model by Chen
and Chang (2000).
In order to minimize waste homogeneity, local governments can devise a system for
handling, collecting and transporting heterogeneous waste individually from the sources.
For example, organic waste—a major component of waste in Malaysia—can be collected
in bulk from organic waste hot spots such as restaurants, food courts, supermarkets and
farms. This will facilitate waste-to-resources and waste-to-energy programs, prevent
landfill issues, and control future pollution. In addition, goods management can be used
to predict litter based on areas of anthropogenic activities.
(2) Resource management
The significance of goods and services should be emphasized. Goods and services—
natural, artificial, tangible, digital or intangible—should not be taken for granted as they
are blessings from the Most Benevolent. Goods and services are essential elements that
provide for human needs and wants which ensure human survival and comfort,
respectively. Goods management can develop and protect a nation’s rich resource of
goods and services. In terms of development, governments can analyze key national
resources, and execute economic and social strategies for the resources’ long-term growth
and maintenance. In terms of protection, governments and people can collaborate in
monitoring national resources and controlling resource exploitation and exploration to
avoid extravagance, depletion and catastrophe. Furthermore, goods management can be
a potent mechanism to regulate and supervise goods and services for the protection of
rights, quality and health. Last but not least, goods management can provide a solution to
Univers
ity of
Mala
ya

152
managing resources for people in distress. Readiness in facing distress like emergencies
and disasters should be a priority to all nations regardless of the probabilities (PwC,
2013). Goods management can assist in allocating goods (e.g., supplies for food, water,
medicine, clothes, power and tools) and services (e.g., accommodation, medical, search
and rescue) for charity and aid in all possible contingencies.
(3) Urban planning
Shops are the cornerstone of society. Detailed synthesis of goods and services data can
serve as steppingstones for city development. The advancement in the life of societies
starts with the understanding of their needs and wants. Goods management can provide
details on the economy (i.e., supply and demand) of localities based on provider-
consumer interaction. Data on goods, services, supply and demand can describe human
activities; just like archaeology can describe human activities in retrospect or with
hindsight (past), goods management combines hindsight with insight (present) and
foresight (future). With hindsight, insight and foresight, governments can efficiently
manage the driving forces of economy—resources, workforce, providers, consumers,
infrastructures, knowledge, technologies—to build prosperous, pleasant, safe, healthy
and beautiful cities. Not forgetting, monitoring and overcoming vice—crimes,
prostitution, gambling, alcohol, drugs—as well as hedonism and materialism in order to
prevent moral decay and decadence among people.
Suppose a city wants to be a technology hub, then it should support a technological
ecosystem that match local skills with local opportunities. According to Collens, this
means building a business center that catered to the engineering students coming out of
local schools and then connecting them with advisors and investors who are familiar with
the computer engineering and digital technology sectors (Harrison, 2014). Goods
Univers
ity of
Mala
ya

153
management can facilitate by connecting prospective students to schools, graduates to
industries, and products to consumers. Although the main focus is developing technology
entrepreneurs, the city ecosystem must also build infrastructures that are accessible,
secure and inclusive to all walks of life. With the help of maps and goods data in goods
management, city planners can balance the distribution of commercial buildings with
public spaces, minimize congestion as well as facilitate citywide commute especially for
disabled people, the elderly, pregnant women and children in their first and last mile. This
way, an ecosystem can grow to be economically, socially and environmentally
sustainable as a result of culture and nature being in perfect harmony.
Communication between stakeholders is vital to building better cities. This is possible
with the help of goods management as it emphasizes two-way communication between
the public and the authorities on a wide range of matters. In fact, South Korea has a
similar concept to goods management called Green Bean which is a social community
platform for government and citizens to cooperate in solving urban problems involving
transportation, environment, water and sewage (Korea Land and Housing Corporation,
2018). Thus, goods management can also be useful in realizing the New Urban Agenda
and Local Agenda 21 like Green Bean.
(4) Support local culture
Goods management can promote cultural development. The development of goods
and services can lead to the development in science and technology as well as social
sciences and humanities. For example, people will develop their languages by creating
new words, terminologies and concepts to improve communication of information on
goods and services. Bohm argued that world views are particularly enfolded within the
ways scientists use language and claimed that fixed forms and the insensitive use of
Univers
ity of
Mala
ya
154
language can lead to blocks in scientific creativity (Ford & Peat, 1988). Above all, the
importance of language in the conveyance and development of knowledge and wisdom
is undeniable as evidenced by how Allah taught Prophet Adam:
And He taught Adam the names of all things; then He placed them before the angels, and said: “Tell me the names of these if ye are right.” (Quran 2:31)
In addition, goods management can also act as a springboard for cultural revival.
Through promotion of traditional goods and services (e.g., food, clothes, crafts, arts,
medicine, treatment), goods management can instill pride and appreciation of local
culture, ethnoscience and way of life among people. Knowledge and history will be
preserved and shared with current and future generations. This can build characters and
avoid cultural homogenization as well as identity loss due to globalization as argued by
Featherstone (1995).
(5) Support local economy and jobs
Goods management can make it easier for people to buy locally made or locally
distributed goods. As a digital platform, goods management can provide extensive
information on goods and service providers to a wide audience, making it an effective
and efficient online marketplace especially for locals. Increased publicity can give local
goods and service providers—especially small and medium enterprises—a boost in
revenue. This will in turn boost revenue for investment in community, state and national
development because foreign cash flow is minimized (Institute for Local Self-Reliance,
2012).
High visibility can make employment easier. Aside from being a marketplace, goods
management can aid in human resource development. Goods management provides a
platform for goods and service providers to offer job opportunities to all walks of life
Univers
ity of
Mala
ya
155
especially less fortunate people such as disabled and poor people. Instead of just buying
or selling goods, people can search and apply for jobs at their desired workplaces. People
can find nearby jobs using geolocation or search for any job regardless of location. Given
goods management’s extensive listing, job seekers will have plenty of options for
potential employers. Likewise, employers will have plenty of job candidates as a result
of goods management’s wide publicity.
Employing local workers is more desirable than employing foreign workers—
documented or undocumented—in order to prevent overdependence on the latter (Abdul-
Rahman et al., 2012). Overdependence on foreign workers for 3D (dirty, dangerous and
demanding) jobs creates a disproportion of skilled and unskilled local workers. If
employed, local workers will maintain cash flow inside the country and support economic
development whereas foreign workers will create a remittance outflow to their origin
countries to support their families abroad (Athukorala, 1992). Hence, employing local
workers will strengthen the local economy and increase the quality of life of local people.
Not forgetting less fortunate and homeless people, goods management can also assist in
rebuilding their lives by giving them training and temporary or permanent jobs.
(6) Resources for other applications
Last but not least, goods management can provide invaluable input for various fields.
Integration of GIS into the structure allows goods management to methodically collect
data, present data and analyze the current state of goods and services. The results for the
analysis can be used in plenty of applications. Goods management is indispensable due
to its prioritization of goods over waste. The scope of waste is limited as it covers end-
of-life stage whereas the scope is goods is large as it covers life stages. Data and tools in
goods management can be used in studies and applications that relate to goods and
Univers
ity of
Mala
ya

156
people, such as—but not limited to—governance, history, anthropology, psychology,
sociology, health, economy, business, law and ergonomics. Governments can use them
to monitor businesses to ensure compliance with license, trade, health, safety, securities
and environmental regulations. Goods management can provide governments with data
that will help them understand goods and services better, and improve relevant policies
and legislations to make them conducive to progress. As for historians, they can record
and study the trends of goods and services to observe how they reflect and affect societies
and cultures.
These are just a few examples highlighting the nexus between goods management and
various fields. With these arguments, it is hoped that people will develop a more
appreciative outlook on goods and begin managing goods properly so they are not wasted.
Mismanaged waste can set off a chain reaction of problems but goods management can
deter it and change it into a chain reaction of benefits instead. May goods management
continue to develop as a system that prevents harmful effects to the environment, society
and economy as well as promote sustainable and balanced growth.
Univers
ity of
Mala
ya

157
CHAPTER 5: CONCLUSION
Goods management system (GMS) is designed as a proactive approach to minimize
waste and maximize the potential of goods and services by emphasizing reduction and
reuse. A model was developed using elements of Geographic Information System (GIS)
and mobile app.
Based on collected data, the variety of goods and services in Malaysia and the lack of
an integrated solution for Reduce and Reuse necessitate the creation of goods
management system. Without goods management, people may need to access several
portals in order to find and buy goods relevant to their needs or wants, sell or donate used
goods, and learn how to use, repair or dispose goods.
GIS is the important element of goods management which provided people with
location intelligence. By performing spatial analyses subjectively (visual-based) and
objectively (statistics-based), distribution patterns of goods and services in the locality
can be recognized in the forms of clusters, heat maps and hot spot maps. The overall
outcomes of spatial analyses indicated a high diversity of goods and services providers
in Kuala Lumpur and the differences in level of spatial clustering of goods and services
providers that the heat maps (subjective) and hot spot maps (objective) can produce.
These data can be collected and applied in various strategic applications.
The prototype of goods management demonstrated possible real-world uses of the app.
Prototyping borrowed and improved upon key features from shopping portals, reuse
portals and how-to/product guide portals. The four main features of goods management
app prototype—“Maps”, “Goods”, “Waste” and “Options”—are dedicated to help and
Univers
ity of
Mala
ya

158
guide people in living sustainably especially by practicing reduction and reuse. “Maps”
provides the interface for navigation and spatial analysis. “Goods” helps people discover
all kinds of goods and services to promote reduction, reuse and charity among them.
“Waste” complements “Goods” by educating people on waste and proper waste disposal.
Finally, “Options” is the place to configure in-app settings and access help. Help provides
a variety of contents to promote public-authority cooperation as well as how-tos of 3Rs.
As a blue ocean strategy, goods management has plenty of direct and indirect potential
benefits. Its direct potential benefits concern with promoting and developing reduction
and reuse whereas its indirect potentials concern with matters beyond reduction and
reuse. Among the direct potentials are location awareness, navigation assistance,
increased discoverability and expanded choices. Among the indirect potential benefits
are waste prediction, resource management, urban planning, support local culture,
support local economy and jobs, and resources for other applications. All these potential
benefits should be taken full advantage of as a means to prepare for global megatrends as
well as realize environmental, social and economic sustainability.
Through application of goods management, lifespan of goods can be extended and
amount of waste will decrease as a result of reduction and reuse. Decrease in waste can
lead to better resources, health, environment and wellbeing. In fact, various aspects of
human life can be improved due to goods management’s holistic and humane approach.
Most importantly, goods management is necessary in order to carry out the Almighty’s
decree of which He ordered mankind to develop the earth sustainably, be benevolent and
not destroy the earth which He generously provides them with.
Univers
ity of
Mala
ya
159
Hopefully in the future, goods management will be put to practice and grow into a
more robust system that incorporates various features such as accessible UI and UX,
private and secure protocols, prediction algorithms, and infrastructure. It is important for
the development of good management to be open and based on waqf (endowment) as to
promote universal participation, collaboration, accountability and goodwill.
Univers
ity of
Mala
ya
160
REFERENCES
Abdel Gawad, S.M., El Mougy, A., El-Meligy, M.E. (2016). Dynamic mapping of road conditions using smartphone sensors and machine learning techniques. Proceedings of the 84th Vehicular Technology Conference (VTC-Fall). Retrieved on February 1, 2018 from https://ieeexplore.ieee.org/document/7880972/
Abdul-Rahman, H., Wang, C., Wood, L. C., & Low, S. F. (2012). Negative impact induced by foreign workers: Evidence in Malaysian construction sector. Habitat International, 36(4), 433-443.
Abdul Rashid, S., Ab. Ghani, P., Daud, N., Ab Ghani Hilmi, Z., Nor Azemi, S. N. A., Syed Wahid, S. N., & Razak, M. R. (2016). Malaysia’s ageing population trends. Regional Conference on Science, Technology and Social Sciences (RCSTSS 2014), 981-990. Singapore: Springer.
Adeniran A., Adewole A.A., & Olofa S.A. (2014). Impact of solid waste management on Ado Ekiti property values. Retrieved on February 20, 2016 from http://www.iiste.org/Journals/index.php/CER/article/viewFile/15445/15853
Ali, H., Dermawan, D., Ali, N., Ibrahim, M., & Yaacob, S. (2012). Masyarakat dan amalan pengurusan sisa pepejal ke arah kelestarian komuniti: Kes isi rumah wanita di Bandar Baru Bangi, Malaysia (Society and the practice of solid waste management towards sustainable community: The case of female households in Bandar Baru Bangi, Malaysia). Geografia-Malaysian Journal of Society and Space, 8(5), 64-75.
An, M. (2016). Why people block ads (and what it means for marketers and advertisers). Retrieved on December 31, 2017 from https://research.hubspot.com/why-people-block-ads-and-what-it-means-for-marketers-and-advertisers
Apple. (2008). iPhone App Store downloads top 10 million in first weekend. Retrieved on December 25, 2017 from https://www.apple.com/newsroom/2008/07/14iPhone-App-Store-Downloads-Top-10-Million-in-First-Weekend/
Athukorala, P. (1992). The use of migrant remittances in development: lessons from the Asian experience. Journal of International Development, 4(5), 511-529.
Bapna, M. (2012). National Intelligence Council report: Megatrends that matter for business. Retrieved on January 1, 2017 from https://www.forbes.com/sites/manishbapna/2012/12/19/national-intelligence-council-report-megatrends-that-matter-for-business/#6575ecd43a00
Univers
ity of
Mala
ya

161
Barbalace, R. C. (2003). The history of waste. Retrieved on January 1, 2017 from https://environmentalchemistry.com/yogi/environmental/wastehistory.html
Berita Harian. (2016, January 17). Air sebagai sumber kehidupan. Retrieved on January 1, 2017 from https://www.bharian.com.my/node/115197
Bersin, J., McDowell, T., Rahnema, A., & Van Durme, Y. (2017). The organization of the future: Arriving now. Retrieved on March 5, 2018 from https://dupress.deloitte.com/dup-us-en/focus/human-capital-trends/2017/organization-of-the-future.html
Brown, P. (2003). How a landfill site can hit the value of your home. Retrieved on November 9, 2015 from https://www.theguardian.com/money/2003/feb/22/houseprices.uknews
Brynjolfsson, E., & McAfee, A. (2016). The second machine age: Work, progress, and prosperity in a time of brilliant technologies. Retrieved on December 31, 2017 from https://edisciplinas.usp.br/pluginfile.php/622156
Bugs, G., Granell, C., Fonts, O., Huerta, J., & Painho, M. (2010). An assessment of Public Participation GIS and Web 2.0 technologies in urban planning practice in Canela, Brazil. Cities, 27(3), 172-181. Retrieved on January 1, 2016 from https://www.sciencedirect.com/science/article/pii/S0264275109001358
Chae, H., Shin, J., & Ko, E. (2015). The effects of usage motivation of Hashtag of fashion brands’ image based SNS on customer social participation and brand equity: Focusing on moderating effect of SNS involvement. Fashion & Textile Research Journal, 17(6), 942-955.
Chang, C. (2015, June 10). The seven global megatrends that could change our future. News.com.au. Retrieved on July 8, 2017 from http://www.news.com.au/finance/economy/world-economy/the-seven-global-megatrends-that-could-change-our-future/news-story/275cc4cc238e7085ba4149c0e9550691
Chen, H. W., & Chang, N. B. (2000). Prediction analysis of solid waste generation based on grey fuzzy dynamic modeling. Resources, Conservation and Recycling, 29(1-2), 1-18.
Chui, M., Manyika, J., & Miremadi, M. (2016). Where machines could replace humans—and where they can’t (yet). McKinsey. Retrieved on January 3, 2017 from https://www.mckinsey.com/business-functions/digital-mckinsey/our-insights/where-machines-could-replace-humans-and-where-they-cant-yet
Univers
ity of
Mala
ya
162
Cisco. (2016). 10th annual Cisco Visual Networking Index (VNI) mobile forecast projects 70 percent of global population will be mobile users. Retrieved on January 16, 2017 from https://newsroom.cisco.com/press-release-content?articleId=1741352
Comber, A., Brunsdon, C., & Green, E. (2008). Using a GIS-based network analysis to
determine urban greenspace accessibility for different ethnic and religious groups. Landscape and Urban Planning, 86(1), 103-114.
Daskalopoulos, E., Badr, O., & Probert, S. D. (1998). Municipal solid waste: a prediction methodology for the generation rate and composition in the European Union countries and the United States of America. Resources, Conservation and Recycling, 24(2), 155-166.
Deloitte. (2015). Industry 4.0: Challenges and solutions for the digital transformation and use of exponential technologies. Retrieved on July 4, 2016 from https://www2.deloitte.com/content/dam/Deloitte/ch/Documents/manufacturing/ch-en-manufacturing-industry-4-0-24102014.pdf
Deloitte. (2017). Rewriting the rules for the digital age. Retrieved on January 11, 2018 from https://www2.deloitte.com/content/dam/Deloitte/global/Documents/About-Deloitte/central-europe/ce-global-human-capital-trends.pdf
Dempsey, C. (2011). Basemaps defined. Retrieved on August 20, 2016 from https://www.gislounge.com/basemaps-defined/
Dewan Bandaraya Kuala Lumpur (DBKL). (n.d.). Jenis Lesen (License Type). Retrieved on April 1, 2015 from https://elesen.dbkl.gov.my/UserPages.aspx?id=2
Dou, W., Lim, K. H., Su, C., Zhou, N., & Cui, N. (2010). Brand positioning strategy using search engine marketing. MIS Quarterly, 261-279.
Dunbar, B. (2015). What are climate and climate change? Retrieved on October 3, 2017 from https://www.nasa.gov/audience/forstudents/5-8/features/nasa-knows/what-is-climate-change-58.html
eBay. (n.d.). New business seller. Retrieved on May 24, 2018 from https://pages.ebay.com/seller-center/get-started/new-business-seller.html
El-Wakeel, A.S., Li, J., Rahman, M.T., Noureldin, A., & Hassanein, H.S. (2017). Monitoring road surface anomalies towards dynamic road mapping for future smart cities. Proceedings of IEEE Global Conference on Signal and Information Processing (GlobalSIP) (pp. 828-832). Retrieved on February 3, 2018 from
Univers
ity of
Mala
ya

163
https://ieeexplore.ieee.org/document/8309076/
Environmental Protection Agency (EPA). (n.d.). Reducing and reusing basics. Retrieved on July 17, 2017 from https://www.epa.gov/recycle/reducing-and-reusing-basics
Esri. (n.d.). Chapter 7: The power of apps. The ArcGIS Book. Retrieved on May 17, 2016 from https://learn.arcgis.com/en/arcgis-book/chapter7/#learn-more
The European Commission. (2015). Development of guidance on Extended Producer Responsibility (EPR). Retrieved on August 3, 2017 from http://ec.europa.eu/environment/archives/waste/eu_guidance/introduction.html
Farina, F. (2018). eBay Promoted Listings explained: Beating the competition for customer attention. Retrieved on October 7, 2018 from https://wearepentagon.com/2018/01/16/ebay-promoted-listings/
Featherstone, M. (1995). Undoing culture: Globalization, postmodernism and identity (Vol. 39). Sage.
Ford, A., & Peat, F. D. (1988). The role of language in science. Foundations of Physics, 18(12), 1233-1242.
Foursquare. (n.d.-a). Promote. Retrieved on May 24, 2018 from http://business.foursquare.com/ads/
Foursquare. (n.d.-b). Foursquare for Business. Retrieved on May 24, 2018, from http://business.foursquare.com
Gertsakis, J., & Lewis, H. (2003). Sustainability and the waste management hierarchy. Retrieved on December 8, 2017, from http://www.helenlewisresearch.com.au/wp-content/uploads/2014/05/TZW_-_Sustainability_and_the_Waste_Hierarchy_2003.pdf
The Global Development Research Center. (n.d.). Life cycle analysis. Retrieved on December 08, 2017, from https://www.gdrc.org/sustdev/concepts/17-lca.html
GO-Globe. (2015). Mobile apps usage – Statistics and trends. Retrieved on June 13, 2017 from https://www.go-globe.com/blog/mobile-apps-usage/
Univers
ity of
Mala
ya

164
Gomes, A. (2018). Beyond sustainability towards ecological regeneration. Paper presented at Universiti Malaya, Kuala Lumpur.
Google. (n.d.). Google My Business. Retrieved on May 24, 2018, from https://www.google.com/business/
Hajkowicz, S. (2015). Global megatrends: seven patterns of change shaping our future. Melbourne: CSIRO Publishing.
Harrison, J.D. (2014). SXSW: Why your city should stop trying to become “the next Silicon Valley”. Retrieved on September 11, 2016 from https://www.washingtonpost.com/business/on-small-business/sxsw-why-your-city-should-stop-trying-to-become-the-next-silicon-valley/2014/03/10/83a89de6-a628-11e3-84d4-e59b1709222c_story.html
Hasan Mad. (2017, July 30). Realiti pertumbuhan ekonomi Malaysia. Utusan Malaysia. Retrieved on October 7, 2017 from http://www.utusan.com.my/rencana/utama/realiti-pertumbuhan-ekonomi-malaysia-1.508888
Hausman, J., & Leibtag, E. (2007). Consumer benefits from increased competition in shopping outlets: Measuring the effect of Wal-Mart. Journal of Applied Econometrics, 22(7), 1157-1177.
Hoornweg, D., & Bhada-Tata, P. (2012). What a waste: A global review of solid waste management. Retrieved on December 8, 2014 from https://openknowledge.worldbank.org/handle/10986/17388
Hutt, R. (2015). What is disruptive innovation? Retrieved on January 15, 2016 from https://hbr.org/2015/12/what-is-disruptive-innovation
Institute for Local Self-Reliance. (2012). Top 10 to support locally owned businesses. Retrieved on March 2, 2016 from https://ilsr.org/wp-content/uploads/2010/12/10reasons-2012.pdf
Ishanuddin Hussin. (2015). Pelan transformasi minda 2015-2020: Ke arah negara bersih, indah dan sejahtera (Mentality transformation plan 2015-2020: Towards a clean, beautiful and prosperous nation). Retrieved on November 10, 2016 from http://www.swcorp.my/docfile/pendidikan/PELAN%20TRANSFORMASI%20MINDA.pdf
Univers
ity of
Mala
ya

165
Jabatan Pengurusan Sisa Pepejal Negara (JPSPN). (2013). Survey on solid waste composition, characteristics & existing practice of solid waste recycling in Malaysia. Retrieved on April 9, 2016 from http://jpspn.kpkt.gov.my/resources/index/user_1/Sumber_Rujukan/kajian/Final_Report_REVz.pdf
Jabatan Perkhidmatan Awam (JPA). (2017). Info ringkas TN50 (TN50 basic info). Retrieved on August 16, 2017 from http://docs.jpa.gov.my/docs/pelbagai/2017/INFO_RINGKAS_TN50.pdf
Jiang, L., Yang, Z., & Jun, M. (2013). Measuring consumer perceptions of online shopping convenience. Journal of Service Management, 24(2), 191-214.
Kementerian Kesejahteraan Bandar, Perumahan dan Kerajaan Tempatan (KPKT). (2015). Solid waste management lab 2015. Retrieved on October 17, 2016 from http://www.kpkt.gov.my/resources/index/user_1/Attachments/hebahan_slider/slaid_dapatan_makmal.pdf
Kementerian Kesejahteraan Bandar, Perumahan dan Kerajaan Tempatan (KPKT). (2017, April 24). Buletin Bandar Edisi 3 (Urban Bulletin 3rd Edition). Retrieved on April 24, 2017 from http://www.kpkt.gov.my/resources/index/user_1/GALERI/PDF_PENERBITAN/BULETIN/Buletin_Bandar/Buletin_Bandar_Edisi3.pdf
Korea Land and Housing Corporation. (2018). Green Bean: A citizen-led platform for creating social values. Paper presented at World Urban Forum, Kuala Lumpur, Malaysia.
KPMG International. (2014). Future state 2030: The global megatrends shaping governments. Retrieved on June 13, 2015 from http://www.kpmg-institutes.com/institutes/government-institute/articles/2013/12/future-state-2030--the-global-megatrends-shaping-governments.html
Kuepper, J. (2017). Globalization and its impact on economic growth. Retrieved on February 28, 2018 from https://www.thebalance.com/globalization-and-its-impact-on-economic-growth-1978843
Kumar, D. P., & Raju, K. V. (2013). The role of advertising in consumer decision making. IOSR Journal of Business and Management, 14(4), 37-45.
Lazarus, Z. (2017). The experience economy: key trends for 2017. Retrieved on September 2, 2018 from http://www.campaignlive.co.uk/article/experience-economy-key-trends-2017/1431150
Univers
ity of
Mala
ya

166
Le, H. T., & Facon, T. (2001). Malaysia’s water vision: The way forward - The Malaysian Water Partnership. The FAO-ESCAP Pilot Project on National Water Visions - From Vision to Action - A Synthesis of Experiences in Southeast Asia. Bangkok: FAO/ESCAP.
Leahy, S. (2013). Water crisis hitting food, energy – and everything else. Retrieved on January 6, 2016 from https://www.globalpolicy.org/the-dark-side-of-natural-resources-st/water-in-conflict/52367-water-crisis-hitting-food-energy--and-everything-else.html?itemid=id#40395
Lemon, J. (n.d.). The great stink. Retrieved on November 12, 2019 from http://www.choleraandthethames.co.uk/cholera-in-london/the-great-stink/
Lewis, R., & Reiley, D. (2009). Retail advertising works! Measuring the effects of advertising on sales via a controlled experiment on Yahoo!. Retrieved on October 9, 2017 from http://citeseerx.ist.psu.edu/viewdoc/download?doi=10.1.1.153.7038&rep=rep1&type=pdf
Lojanica, N. (2015). Government expenditure and government revenue–the causality on the example of the republic of Serbia. Management International Conference, Portoroz, Slovenia (pp. 28-30).
Mahathir Mohamad. (1991). Malaysia: The way forward (Vision 2020). Retrieved on January 6, 2016 from http://unpan1.un.org/intradoc/groups/public/documents/apcity/unpan003223.pdf
Malaysia Productivity Corporation. (2010). Sustainable development initiatives in Malaysia. Retrieved on August 20, 2016 from http://www.mpc.gov.my/wp content/uploads/2016/04/Sustainable-Development-Initiatives-In-Malaysia.pdf
Malaysia, Attorney General Chambers of. (2006). Environmental Quality Act 1974 [Act 127]. Retrieved on July 1, 2016 from http://www.agc.gov.my/agcportal/uploads/files/Publications/LOM/EN/Act%20127.pdf
Malaysia, Department of Statistics. (2017). Data siri masa indikator GEI Malaysia mengikut komponen (Time series data of GEI Malaysia indicator by component). Retrieved on April 1, 2018 from https://www.dosm.gov.my/v1/uploads/files/1_Articles_By_Themes/Green_Economy_Indicator/GEI%202018_9Mac2018/5_DATA%20SIRI%20MASA%20GEI%202017.pdf
Univers
ity of
Mala
ya
167
Malaysia, Department of Statistics. (2017). GDP by state 2010-2016. Retrieved on April 1, 2018 from https://www.dosm.gov.my/v1/index.php?r=column/cthemeByCat&cat=102&bul_id=VS9Gckp1UUpKQUFWS1JHUnJZS2xzdz09&menu_id=TE5CRUZCblh4ZTZMODZIbmk2aWRRQT09
Malaysia, Economic Planning Unit. (2015). Bab 6: Menuju ke arah pertumbuhan hijau bagi meningkatkan kemampanan dan daya tahan (Chapter 6: Going towards green growth to increase sustainability and endurance). Rancangan Malaysia Kesebelas 2016-2020 (The Elevent Malaysia Plan 2016-2020). Retrieved on April 1, 2016 from http://epu.gov.my/sites/default/files/Bab%206.pdf
Malaysia, Ministry of Energy, Green Technology and Water (KeTTHA). (n.d.). National Green Technology Policy. Retrieved on May 20, 2016 from http://portal.ppj.gov.my/c/document_library/get_file?p_l_id=17335&folderId=27605&name=DLFE-4709.pdf
Malaysia, Ministry of Natural Resources and Environment. (n.d.). Environment facts. Retrieved on November 31, 2016 from http://www.nre.gov.my/en-my/Environment/Pages/Environment-Fact.aspx
Malaysia, Pusat Maklumat Harta Tanah Negara (NAPIC). (2010). Laporan pasaran harta separuh pertama 2010 – Wilayah Persekutuan Kuala Lumpur (Property market report during first half of 2010). Retrieved on February 4, 2016 from http://napic.jpph.gov.my/portal/web/guest/publication-new?p_p_id=ViewPublishings_WAR_ViewPublishingsportlet&p_p_lifecycle=2&p_p_state=normal&p_p_mode=view&p_p_resource_id=fileListDownload&p_p_cacheability=cacheLevelPage&p_p_col_id=column-1&p_p_col_count=1&_ViewPublishings_WAR_ViewPublishingsportlet_publishingId=446&_ViewPublishings_WAR_ViewPublishingsportlet_action=renderFileListingScreen&_ViewPublishings_WAR_ViewPublishingsportlet_from=archive&_ViewPublishings_WAR_ViewPublishingsportlet_pageno=1&_ViewPublishings_WAR_ViewPublishingsportlet_reportId=679&fileUploadId=693
Marr, B. (2016). What everyone must know about Industry 4.0. Forbes. Retrieved on September 23, 2016 from https://www.forbes.com/sites/bernardmarr/2016/06/20/what-everyone-must-know-about-industry-4-0/#28397798795f
McDonough, W., & Braungart, M. (2003). The cradle-to-cradle alternative. Retrieved on December 7, 2017, from http://www.mcdonough.com/writings/cradle-cradle-alternative/
Mohamed Sharif Bashir. (2005). Islam Hadhari: Concept and prospect. Retrieved on May 20, 2016 from https://www.islamawareness.net/Asia/Malaysia/hadhari.html
Univers
ity of
Mala
ya

168
Mossberg, W. (2017). Mossberg: Lousy ads are ruining the online experience. Retrieved on December 17, 2017 from https://www.theverge.com/2017/1/18/14304276/walt-mossberg-online-ads-bad-business
Mudambi, S. M., & Schuff, D. (2010). Research note: What makes a helpful online review? A study of customer reviews on Amazon. com. MIS quarterly, 185-200.
Mugabi, J. (2014). How to finance solid waste management – Starting from results. Retrieved on February 15, 2015 from http://www.worldbank.org/en/news/feature/2014/10/30/how-to-finance-solid-waste-management
Muzdalifah Mustapha. (2016, May 18). Pengurusan sisa pepejal masih rendah (Solid waste management still low). Utusan Malaysia. Retrieved on May 19, 2016 from http://www.utusan.com.my/berita/wilayah/kl-putrajaya/pengurusan-sisa-pepejal-masih-rendah-1.331739
Nah, K. W. (2016, February 16). Water scarcity getting serious. Malaysiakini. Retrieved on February 17, 2016 from https://www.malaysiakini.com/letters/330533
NEHAP Malaysia. (2016). Integrated solid waste management: Challenge and future. Retrieved on January 20, 2017 from http://nehapmalaysia.moh.gov.my/wp-content/uploads/2016/03/Paper-2-Solid-Waste.pdf
Nicholls, S. (2001). Measuring the accessibility and equity of public parks: A case study using GIS. Managing leisure, 6(4), 201-219.
OpenStreetMap. (2017). Map features. Retrieved on October 1, 2017 from https://wiki.openstreetmap.org/w/index.php?title=Map_Features&oldid=1506438
The Organisation for Economic Co-operation Development (OECD). (2001). Extended Producer Responsibility: A guidance manual for governments. Retrieved on March 30, 2016 from http://www.oecd-ilibrary.org/environment/extended-producer-responsibility_9789264189867-en
The Organisation for Economic Co-operation Development (OECD). (2016). Policy Highlights- Extended Producer Responsibility. Retrieved on November 30, 2016 from https://www.oecd.org/environment/waste/Extended-producer-responsibility-Policy-Highlights-2016-web.pdf
Univers
ity of
Mala
ya

169
Palmer, P. (n.d.). Discussions about Zero Waste actions. Retrieved on July 29, 2018 from http://gettingtozerowaste.com
Palmer, P. (2004a). Chapter 2: Concepts. Getting to zero waste (pp. 23). California: Purple Sky Press.
Palmer, P. (2004b). Chapter 6: Waste definitions. Getting to zero waste (pp. 88). California: Purple Sky Press.
Palmer, P. (2004c). Glossary. Getting to zero waste (pp. 285). California: Purple Sky Press.
Palmer, P. (2007, March 29). The death of recycling. Rachel’s Democracy & Health News, 900. Retrieved on June 16, 2016 from http://www.precaution.org/lib/07/prn_death_of_recycling.070322.htm
Parker, L. (2015). Ocean trash: 5.25 trillion pieces and counting, but big questions remain. Retrieved on October 11, 2015 from https://news.nationalgeographic.com/news/2015/01/150109-oceans-plastic-sea-trash-science-marine-debris/
Peter G. Peterson Foundation. (n.d.). The fiscal & economic impact. Retrieved on August 15, 2018 from https://www.pgpf.org/the-fiscal-and-economic-challenge/fiscal-and-economic-impact
Pettinger, T. (n.d.). Diagram of monopoly. Retrieved on May 16, 2018 from https://www.economicshelp.org/microessays/markets/monopoly-diagram/
Peypoch, R. (2017). Technology should augment, not replace, the human touch. Retrieved on November 11, 2017 from https://www.csoonline.com/article/3230448/security/technology-should-augment-not-replace-the-human-touch.html
Purcell, K., Entner, R., & Henderson, N. (2010). The rise of apps culture. Retrieved on November 11, 2016 from http://www.pewinternet.org/2010/09/14/the-rise-of-apps-culture/
PwC. (2013). UNISDR and PwC – Working together to reduce disaster risk. Retrieved on March 1, 2015 from https://www.pwc.com/gx/en/governance-risk-compliance-consulting-services/resilience/publications/pdfs/pwc-unisdr-report.pdf
Univers
ity of
Mala
ya

170
PwC. (2016). Five megatrends and their implications for global defense. Retrieved on December 9, 2016 from http://www.pwc.com/gx/en/government-public.../five-megatrends-implications.pdf
Rathje, W. L., & Murphy, C. (2001). Rubbish!: The archaeology of garbage. University of Arizona Press.
Relaks Minda. (n.d.). Pusat kitar semula punca masalah? (Recycling center is the cause of problems?). Retrieved on February 1, 2018 from http://www.relaksminda.com/2014/05/pusat-barang-kitar-semula-punca-masalah.html
Robinson, R. (2015). 3 human qualities digital technology can’t replace in the future economy: experience, values and judgement. The Urban Technologist. Retrieved on December 9, 2016 from https://theurbantechnologist.com/2015/04/12/3-human-qualities-digital-technology-cant-replace-in-the-future-economy-experience-values-and-judgement/
Samruhaizad Samian@Samion, Jamaluddin Md. Jahi & Azahan Awang. (2014). Isu perbandaran dan kualiti hidup penduduk pinggir bandar (Urban issues and quality of life of suburban residents). International Journal of the Malay World and Civilisation 2(1), 63-75. Retrieved on December 9, 2016 from http://www.myjurnal.my/filebank/published_article/29752/23.pdf
Scalabre, O. (2017). Industry 4.0: The next Industrial Revolution. Retrieved on February 3, 2017 from https://www.bcg.com/capabilities/operations/embracing-industry-4.0-rediscovering-growth.aspx
Schwab, K. (2016). The Fourth Industrial Revolution: What it means and how to respond. Retrieved on February 3, 2017 from https://www.weforum.org/agenda/2016/01/the-fourth-industrial-revolution-what-it-means-and-how-to-respond/
Sebille, E.V. (2016). How much plastic is there in the ocean? Retrieved on June 6, 2016 from https://www.weforum.org/agenda/2016/01/how-much-plastic-is-there-in-the-ocean/
Siegel, R. (2016). The Industrialist’s dilemma. Retrieved on November 26, 2016 from https://www.degroote.mcmaster.ca/files/2016/10/Industrialists-Dilemma-Lecture-092916a.pdf
Simon, J. M. (2011). Mechanical Biological Treatment (MBT) & Zero Waste. Retrieved on July 23, 2015 from https://zerowasteeurope.eu/2011/09/mechanical-
Univers
ity of
Mala
ya

171
biological-treatment-mbt-zero-waste/
Statista. (2015) Number of mobile phone users worldwide from 2013 to 2019 (in billions). Retrieved on February 4, 2018 from https://www.statista.com/statistics/274774/forecast-of-mobile-phone-users-worldwide/
Statista. (2016). Number of smartphone users worldwide from 2014 to 2020 (in billions). Retrieved on February 4, 2018 from https://www.statista.com/statistics/330695/number-of-smartphone-users-worldwide/
Statista. (2017a). Number of apps available in leading app stores as of March 2017. Retrieved on February 4, 2018 from https://www.statista.com/statistics/276623/number-of-apps-available-in-leading-app-stores/
Statista. (2017b). Number of mobile app downloads worldwide in 2016, 2017 and 2021 (in billions). Retrieved on February 4, 2018 from https://www.statista.com/statistics/271644/worldwide-free-and-paid-mobile-app-store-downloads/
Strategy&. (2011). Resilient, stable, sustainable: The benefits of economic diversification. Retrieved on April 22, 2016 from https://www.strategyand.pwc.com/media/file/Strategyand-Resilient-Stable-Sustainable-Benefits-Economic-Diversification.pdf
Suraya Roslan. (2016, January 13). 27 hari tanpa hujan (27 days without rain). Harian Metro. Retrieved on October 18, 2017, from https://www.hmetro.com.my/node/106890
Sustainable Consumption and Production Malaysia. (2014). Wawasan 2020 adalah wawasan yang mungkin dicapai dengan SCP. Retrieved on October 28, 2017, from http://scpmalaysia.gov.my/ms/node/189
SWCorp. (n.d.). Kadar kitar semula (Recycling rate). Retrieved on January 1, 2018, from http://www.swcorp.gov.my/index.php/penyelidikan
SWCorp. (2015). Pelan transformasi minda ke arah negara bersih, indah dan sejahtera 2015-2020 (Mentality transformation plan towards a clean, beautiful and prosperous nation). Retrieved on January 1, 2018 from http://www.swcorp.my/docfile/ptm/1.%20BUKU%20PTM%202015%20-%202020.pdf
Univers
ity of
Mala
ya

172
SWCorp. (2017). Pengurusan sisa pepejal pembinaan (Construction solid waste management). Paper presented at the Issue of C&D Waste in Malaysia Construction Industry seminar, Kuala Lumpur, Malaysia.
SWCorp. (2018). Malaysia recycling rate. Paper presented at the World Urban Forum (WUF), Kuala Lumpur, Malaysia.
Sweeney, J. C., Soutar, G. N., & Mazzarol, T. (2008). Factors influencing word of mouth effectiveness: receiver perspectives. European Journal of Marketing, 42(3/4), 344-364.
Techopedia. (n.d.). Filter bubble. Retrieved on November 19, 2019, fromhttps://www.techopedia.com/definition/28556/filter-bubble
Towonsing, A. (2017). Penjagaan alam sekitar: Cabaran dan pengurusan sisa pepejal domestik (Environmental care: Domestic solid waste challenges and management). Retrieved on December 3, 2017 from https://www.malaysian-ghost-research.org/pengurusan-sisa-pepejal-domestik/
TripAdvisor. (n.d.). List your business on TripAdvisor. Retrieved on May 24, 2018, from https://www.tripadvisor.com.my/GetListedNew
UK Parliament. (2014). Parliament and the Thames. Retrieved on April 26, 2016 from https://web.archive.org/web/20141213114830/http://www.parliament.uk/business/publications/parliamentary-archives/archives-highlights/archives-parliament-and-the-thames/
United Nations Educational, Scientific and Cultural Organization (UNESCO). (2012). Education for sustainable development sourcebook. Paris: UNESCO.
United Nations Environment Programme (UNEP). (2002). A multitude of approaches and definitions of waste. Retrieved on August 31, 2016 from http://www.grid.unep.ch/waste/html_file/06-07_what_waste.html
United Nations Environment Programme (UNEP). (2009). Converting waste plastics into a resource. Retrieved on November 27, 2017, from http://wedocs.unep.org/bitstream/handle/20.500.11822/7864/WastePlasticsEST_AssessmentGuidelines.pdf?sequence=3&isAllowed=y
United Nations Environment Programme (UNEP). (2015). Global waste management outlook summary. Retrieved on August 31, 2016 from https://www.iswa.org/fileadmin/galleries/Publications/ISWA_Reports/GWMO_
Univers
ity of
Mala
ya

173
summary_web.pdf
United Nations, Department of Economic and Social Affairs (UN DESA). (2017). World population prospects 2017. Retrieved on May 15, 2017 from https://esa.un.org/unpd/wpp/Publications/Files/WPP2017_DataBooklet.pdf
United Nations, Division for Sustainable Development. (2015). Transforming our world: the 2030 agenda for Sustainable development. Retrieved on May 15, 2017 from https://sustainabledevelopment.un.org/post2015/transformingourworld
Urban Ore. (2010). Only 3 Rs – Reduce, Reuse, Recycle. Retrieved on October 7, 2015 from http://urbanore.com/1293-only-3-rs-reduce-reuse-recycle/
Utusan Malaysia. (2016). Kerajaan peruntuk RM2 bilion urus sisa pepejal (Government allocated RM2 billion for solid waste management). Retrieved on December 1, 2016 from http://www.utusan.com.my/berita/wilayah/kerajaan-peruntuk-rm2-bilion-urus-sisa-pepejal-1.333772
Venditti, R. A. (n.d.). Life cycle analysis (LCA) and sustainability assessment. Retrieved on December 8, 2017, from http://www4.ncsu.edu/~richardv/documents/IntroductiontoLCAAU32013.pdf
The Victorian Web. (n.d.). The London Bathing Season. Retrieved on January 29, 2018 from http://www.victorianweb.org/periodicals/punch/publichealth/1.html
Waddell, P. (2002). UrbanSim: Modeling urban development for land use, transportation, and environmental planning. Journal of the American Planning Association, 68(3), 297-314. DOI: 10.1080/01944360208976274
Wai, N. K. (2016, February 16). Water scarcity getting serious. Malaysiakini. Retrieved on October 16, 2017, from https://www.malaysiakini.com/letters/330533
Walsh, J. (2017). The Zero Waste movement. Retrieved on November 5, 2017 from https://zerowasterepublic.com/the-zero-waste-movement/
Wellcome Collection. (n.d.). Monster Soup commonly called Thames Water. [coloured etching]. Retrieved on January 29, 2018 from https://wellcomecollection.org/works/qqcx38hr
Wilson, B. (2016). Heyday: Britain and the birth of the modern world. London, UK: Orion Publishing Co.
Univers
ity of
Mala
ya

174
Wilson, D.C., Rodic, L., Modak, P., Soos, R., Rogero, A.C., Velis, C., … Simonett, O. (2015). Global Waste Management Outlook. Retrieved on February 4, 2016 from http://apps.unep.org/publications/index.php?option=com_pub&task=download&file=011782_en
World Bank. (2016). Waste not, want not – Solid waste at the heart of sustainable development. Retrieved on June 6, 2016 from http://www.worldbank.org/en/news/feature/2016/03/03/waste-not-want-not---solid-waste-at-the-heart-of-sustainable-development
World Bank. (2017). Overview: The World Bank in Malaysia. Retrieved on October 18, 2017, from http://www.worldbank.org/en/country/malaysia/overview
World Economic Forum. (2012). Scarcity of resources. Retrieved on October 7, 2015 from http://reports.weforum.org/global-agenda-survey-2012/trends/scarcity-of-resources/
Yelp. (n.d.). Yelp for business owners. Retrieved on May 24, 2018 from https://biz.yelp.com
Yunus, M. Z. B. M., & Hassan, H. B. (2010). Managing road maintenance using geographic information system application. Journal of Geographic Information System, 2, 215-219. Retrieved on March 18, 2018 from https://pdfs.semanticscholar.org/0024/01417d791f0c1330f5440bfe779ce21a91e6.pdf
The Zero Waste Institute. (n.d.). FAQs. Retrieved on May 26, 2016 from http://zerowasteinstitute.org/?page_id=18
Zero Waste International Alliance. (n.d.). Zero Waste hierarchy. Retrieved on May 26, 2016 from http://zwia.org/standards/zero-waste-hierarchy/
Zero Waste International Alliance. (2009). Global principles for Zero Waste communities. Retrieved on May 26, 2016 from http://zwia.org/standards/zw-community-principles/
Zero Waste International Alliance. (2009). ZW Definition. Retrieved on May 26, 2016 from http://zwia.org/standards/zw-definition/
Zhang, J. (2010). The coming era of experience economy and breakthrough of service innovation dilemma. Retrieved on May 26, 2016 from https://www.researchgate.net/publication/251955120_The_Coming_Era_of_Ex
Univers
ity of
Mala
ya

175
perience_Economy_and_Breakthrough_of_Service_Innovation_Dilemma
Zoï Environment Network, & GRID-Arendal. (2012). Vital waste graphics 3. Retrieved on January 7, 2015 from http://www.envsec.org/publications/vitalwaste_br_1.pdf
Univers
ity of
Mala
ya


![BAB I PENDAHULUAN 1.1 Latar Belakang Masalahdigilib.uinsgd.ac.id/12287/4/4_bab1[1].pdf · di PT. Gojek Indonesia Cabang Bandung, ... mengetahui secara jelas apa yang sebenarnya diinginkan](https://static.fdocuments.net/doc/165x107/5e51dd6f9a3cfd35b724ad6f/bab-i-pendahuluan-11-latar-belakang-1pdf-di-pt-gojek-indonesia-cabang-bandung.jpg)