University, Edinburgh. - Environmental Change Institute Newborough, Andrew Peacock (Heriot-Watt),...
130
Transcript of University, Edinburgh. - Environmental Change Institute Newborough, Andrew Peacock (Heriot-Watt),...


Funded by:
The 40% House project has been a collaboration between the Environmental Change Institute,University of Oxford (who co-ordinated the work), the Manchester Centre for Civil and ConstructionEngineering at the University of Manchester Institute of Science and Technology (now part of theUniversity of Manchester), and the School of Engineering and Physical Sciences at Heriot-WattUniversity, Edinburgh.
ACKNOWLEDGEMENTSThe project was mainly funded through the UK Tyndall Centre for Climate Change Research. Wegratefully record our thanks for guidance from members of the Tyndall Centre throughout the courseof the work - in particular, Kevin Anderson and Simon Shackley. The costs of publishing this report andof the launch conference were met by a grant from the Natural Environment Research CouncilKnowledge Transfer Fund, with additional support from the UK Market Transformation Programme.
Thanks are due to Richard Moore, Joanne Wade, David Olivier, Geoff Levermore, Michael Laughton,and the many contributors to the four workshops held in the course of the project.
Many colleagues have contributed to the project. At UMIST, David Chow made his data available forthe modelling of possible climatic impacts on residential energy needs. At the ECI, Catherine Bottrill,Robert Pugh, Minna Sunikka, Ben Taylor and Rebecca White all contributed background material to thestudy. Tina Fawcett gave invaluable help during the editing, Rudra Kapila organised the disseminationconference, and Asher Minns, Deborah Strickland and Ian Curtis publicised it.
FUTURE WORKThe 40% House project will be followed up by Building Market Transformation (BMT), a consortium ledby the ECI under Carbon Vision – Buildings, funded by the Engineering and Physical Sciences ResearchCouncil and the Carbon Trust. BMT will focus on scenarios that cover all energy use in the entire UKbuilding stock, except for industrial processes. There are two other consortia in Carbon Vision –Buildings. One is led by Heriot-Watt University, Edinburgh; and the other by University College, Londonand De Montfort University.
ISBN 1 874370 39 7© Environmental Change Institute, 2005 February 2005

Brenda Boardman, Sarah Darby, Gavin Killip, Mark Hinnells,Christian N. Jardine, Jane Palmer and Graham Sinden
With contributions from:Kevin Lane, Russell Layberry (ECI),Marcus Newborough, Andrew Peacock (Heriot-Watt),Andrew Wright, Sukumar Natarajan (UMIST)
Environmental Change Institute, University of Oxford1a Mansfield Road, Oxford OX1 3SZTel: +44 (0)1865 281180Web: www.eci.ox.ac.ukemail: [email protected]
40% house

Figures 4Tables 4Executive summary 5
1 Introduction 81.1 Project scope 81.2 Climate change 91.3 UK carbon emissions 111.4 UK energy policy 111.5 Policy approach 141.6 Conclusions 16
2 Views of the future 182.1 Modelling an uncertain future 182.2 The UK Domestic Carbon Model 182.3 The Foresight scenarios 212.4 Modelling carbon emissions 212.5 Conclusions 25
3 Households and living space 263.1 Population 263.2 Household size and numbers 273.3 Living space 293.4 Number of dwellings 303.5 Conclusions 31
4 Thermal comfort and control 324.1 Comfort, health and climate 324.2 Heating 334.3 Cooling 344.4 Water heating 364.5 Other policy considerations 364.6 Conclusions 37
5 Building fabric and housing stock 385.1 Context 385.2 Heat losses and gains in buildings 385.3 Current picture 395.4 40% House scenario 405.5 Housing renewal 435.6 Policies 445.7 Priorities for action 465.8 Conclusions 46
6 Lights and appliances 486.1 The low carbon house 486.2 Current picture 486.3 Barriers to the low carbon house 546.4 Key technologies for 40% House scenario 556.5 Future policy 586.6 Priorities for action 606.7 Conclusions 61
7 Provision of heating and electricity through low and zero carbon technologies 62
7.1 The low carbon house scenario in 2050 627.2 Current picture 627.3 LZC technologies 637.4 40% House scenario 667.5 Cost and finance issues 697.6 LZC market transformation 707.7 Priorities for action 717.8 Conclusions 72
Contents

8 Electricity and gas implications 748.1 Introduction 748.2 Demand, supply and carbon emissions 748.3 Peak demand and supply issues 768.4 Finance and policy implications 818.5 Priorities for action 828.6 Conclusions 83
9 Achieving the 40% House scenario 849.1 The 40% House scenario 849.2 Constraints 859.3 Policy focus 859.4 Timescales 869.5 Opportunities for action: the housing
stock 869.6 Opportunities for action: lights and
appliances 899.7 Opportunities for action: space and
water heating and low and zero carbontechnologies 90
9.8 Opportunities for action: peak demand 909.9 Market transformation strategy and
housing 919.10 Other considerations 969.11 Minimising costs 1009.12 People transformation 1019.13 Summary and conclusion:
a 40% society 102
Glossary 104
References 114
Background material reports A–Q may be foundon the Energy and Environment pages on the ECI website: www.eci.ox.ac.uk
Background material A Model methodology
Background material B Foresight scenarios
Background material C Thermal comfort
Background material D Skills and training,employment
Background material E Climate
Background material F Built fabric and buildingregulations
Background material G Home Information Packs
Background material H Decent Homes
Background material I Demographics
Background material J Energy Performance ofBuildings Directive
Background material K Conservation areas andlisted buildings
Background material L Personal carbonallowances
Background material M The future of fuel
Background material N Teleworking andhomeworking
Background material O Technical potential
Background material P Load management

4
Figure 1.1 Key factors determining UK residential sector carbon emissions 8
Figure 1.2 Residential energy indices, GreatBritain, 1970-2001 11
Figure 1.3 Market transformation strategy 16
Figure 1.4 Schematic structure of 40% House report 17
Figure 2.1 UK Domestic Carbon Model structure 19
Figure 2.2 Foresight scenarios on a grid of governance and social values 21
Figure 2.3 UK residential carbon emissions under the Foresight scenarios, 1996-2050 23
Figure 3.1 Effects of household size on energy use 28
Figure 5.1 English housing tenure by SAP rating,2001 39
Figure 5.2 Net space heating energy demand,existing stock and new-build to 2050 41
Figure 8.1 UK residential sector energy use,40% House scenario, 1996-2050 74
Figure 8.2 Electricity generated by UK residentialLZC technologies, 40% House scenario,1996-2050 75
Figure 8.3 UK residential carbon emissions,40% House scenario, 1996-2050 75
Figure 8.4 Influences of load profile on networkoperation 76
Figure 8.5 UK residential and non-residential profiles for typical winter demand, 2002 77
Figure 8.6 Winter and summer demand profiles,England and Wales, 2002 77
Figure 8.7 Schematic influence on load profile of a) improved energy efficiency, b) improvedefficiency of lights and appliances, c) demandshifting through use of smart appliances 77
Figure 8.8 Carbon intensity variations throughout the day, UK, 2002 78
Table 1.1 Examples of long-term climate change targets set by European countries 10
Table 1.2 The RCEP energy demand and supplyscenarios for 2050 13
Table 1.3 Departmental responsibility: housing and energy 14
Table 1.4 Examples of UK policies and programmes affecting the residential sector 15
Table 2.1 Socio-economic and energy trends of the Foresight scenarios 22
Table 2.2 Main variables in Local Stewardship scenario 24
Table 3.1 UK population projections used in the 40% House scenario 27
Table 3.2 Projected UK household numbers, 2050 28
Table 3.3 Average floor space by household size and category, England, 2001 29
Table 4.1 Temperatures in homes and health effects, England 1996 33
Table 5.1 Housing stock assumptions,40% House scenario, 1996 and 2050 41
Table 5.2 Refurbishment measures,40% House scenario, 1996 and 2050 42
Table 5.3 Performance standard of new housing, 40% House scenario 42
Table 6.1 Electricity consumption and ownership,residential lights and appliances, 1998 & 2050 49
Table 6.2 Summary of current European policyinstruments, residential lights and appliances 52
Table 7.1 Types of LZC considered, 40% House scenario 62
Table 7.2 Uptake of LZC under the 40% House scenario, 2050 67
Table 7.3 Comparison of 40% House scenario with PIU and RCEP studies 68
Table 7.4 Installations of LZC by decade,40% House scenario 69
Table 8.1 Emissions factors, UK, 1996-2050 76
Table 8.2 Impact of 40% House scenario on UKelectricity load, 2050 80
Table 9.1 Housing stock demolition rate, lifetime and energy consumption, UK 87
Table 9.2 Effect of space per person on total residential built fabric 88
Table 9.3 Main variables in 40% House scenario 95
Figures and tables
5
The UK residential sector can deliver a 60%reduction in carbon dioxide emissions by 2050, inline with the targets outlined in UK Government’s2003 Energy White Paper. Such a reduction isessential in light of the growing impact of climatechange. This represents a significant challengethat requires some hard, but necessary, decisionsif these savings are to be achieved. Urgentproblems require radical solutions – current policyis not taking us to where we need to be.
Many of the constituents of the 40% Housescenario for 2050 are challenging, but thatdemonstrates the scale of change needed. Whilstthis represents just one solution to the issuesfaced, it is clear that the overall target is non-negotiable – if less is done in one area or sector,more will need to be achieved in another.• The focus is on the role of households in
securing emissions reductions, covering thebuilding fabric, lighting and appliances, andbuilding-integrated technologies.
• The aim is market transformation of the totalhousing stock to the average of a 40% house,with the emphasis on strong regulation andproduct policy. A proactive, rather than reactiveapproach is taken.
• All four principles in the Energy White Paper areaddressed in achieving the 40% House: the60% target, fuel poverty, security of supply andcompetitive markets.
• These savings are achievable even with theconstraining assumptions made, including a33% increase in household numbers between1996 and 2050, a smaller average householdsize (from 2.4 to 2.1 people per household),stable emissions factors from 2030 and noreliance on unknown technological advances.
Over a span of 50 years, substantial changes willoccur – technologies, appliances, housing stylesnot even thought of today could form part ofeveryday life. In five decades from now, mostcentral heating systems and appliances wouldhave been replaced at least three times, themajority of power stations replaced twice andalmost the whole of the electrical and gas
distribution network renewed. As well asillustrating the level of change that will occurover this timeframe, this also highlights theconsiderable opportunities for intervention thatexist, fitting in with the natural cycles ofreplacement. Prompt action will ensure that theappropriate technologies are available to matchthese cycles. The improvements set in motionnow to reach the 60% reductions target willcontinue to provide benefits to 2050 and beyond.
Housing The efficiency of the UK housing stock isimproved substantially by 2050. This occursthrough altering the standard of the existingstock, the quality of new-build and the relativeproportions of each.
Current stock• Two-thirds of the dwellings standing in 2050
are already in existence. A substantialprogramme to upgrade these existing housesresults in an average space heating demand of6,800 kWh per annum.
• This requires insulation of 100% of all cavitywalls, 15% of all solid walls, 100% loft insulation(to a depth of 300 mm) and 100% highperformance windows.
• The aim is to achieve as much as possiblethrough retrofit measures before resorting todemolition, which is more disruptive andexpensive.
• The worst houses, around 14% of the currentstock, are removed through a targeteddemolition strategy – care must be taken not toinvest money in upgrading those homes thatwill ultimately be demolished.
• This requires demolition rates to be increasedto four times current levels, rising to 80,000dwellings per annum by 2016.
New-build• Construction rates are increased to replace the
demolished homes and to meet the rise indemand for housing due to the growingpopulation.
Executive summary

6
• New build is a third of the stock in 2050.• This requires an average construction rate of
220,000 per annum.• These new homes are built to a high energy-
efficiency standard, with an average netheating demand of 2,000 kWh pa in all newdwellings from 2020.
• Appropriate design and siting limits therequirement for air conditioning. Cooling isachieved through passive measures.
Housing stock in 2050• By 2050, the number of households will have
increased to 31.8 million, housing a populationof 66.8 million, with an average of 2.1 peopleper household.
• The average efficiency of dwellings is a SAPrating of 80, with a SAP of 51 (the currentaverage) as the minimum standard.
• Fuel poverty has been eliminated, withaffordable warmth and cooling for allhouseholds.
• The needs of single people are recognisedthrough the provision of smaller housing inappropriate locations.
Policy • The various aims would be best incorporated
into a long-term, over-arching UK energy andhousing strategy that covers both the rate ofturnover in the housing stock and the resultantenergy use and carbon emissions.
• The strategy would have a full remit to considerthe implications of location, tenure, size anddensity of housing developments over the next50-100 years.
• The energy and housing strategy clearly definesthe role of grants in improving the stock ofdwellings and the extent to which these shouldbe primarily focused on eliminating fuelpoverty, as at the moment, and whetheradditional resources should be available forencouraging best practice.
• Responsibility for implementing the energy andhousing strategy is largely devolved to local andregional authorities.
• The Building Regulations set the minimumstandard for new build and renovation. A clearstrategy for standards (and their enforcement)over the next 40-50 years is required to identifythe necessary technologies and appropriatetimescales to ensure transformation of thehousing stock.
• Providing information to consumers and localauthorities on the energy performance of adwelling is essential to guide policy and pushthe market towards more efficient homes. Auniversal, address-specific database of theenergy efficiency of individual homes (on anestablished scale), collated at the level of eachhousing authority, would provide this detail.
Lights and appliancesAll households, new and existing, are installedwith energy efficient appliances and lightingthroughout, representing the best technologycurrently available. Further savings are possiblethrough new and unforeseen technologies thatmay emerge over the next 50 years, but do notform part of the quantified scenario.• Household electricity demand for domestic
lights and appliances (excluding space andwater heating) is reduced to 1680 kWh perannum – almost half current levels.
• The key technologies installed include vacuuminsulated panels (VIPs) for refrigeration and LED(light emitting diode) lighting in all households.
• Peak electricity demand is reduced throughappropriate appliance design.
• The rapid turnover of the stock of lights andappliances means that savings can be achievedquickly, once appropriate policies are in place.This would contribute additional savings toachieve the UK’s Kyoto targets for 2008-12.
Policy• Market transformation is already established as
the main policy approach in this sector, but hasnot yet be used to full effect. The emphasisneeds to be on stronger, more focusedmeasures, such as minimum standards.

7
• Replacing policy on energy efficiency withpolicies on absolute energy demand wouldencourage downsizing and could reverse thepresent trend towards larger (more energyconsuming) equipment.
• Manufacturers must be encouraged to viewenergy-efficiency as a vital component ofproduct design to prevent energy-profligateequipment appearing on to the market. Thiscould be achieved under the European Energy-using Products Directive.
Space and water heatingThe way in which the space and water heatingneeds of the residential sector are met isrevolutionised, with an average of nearly two lowand zero carbon (LZC) technologies perhousehold.• LZCs cover community CHP (combined heat and
power), micro-CHP (at the household level),heat pumps, biomass, photovoltaics (PV), solarhot water heating and wind turbines.
• In all new build, LZCs are installed as matter ofcourse. Existing dwellings are retrofitted whenand where appropriate.
• This would be sufficient to meet totalresidential electricity demand from low-carbonsources and turn the residential sector into anet exporter of electricity by 2045.
Policy • A complete market transformation to LZC could
be achieved over the course of 2005 to 2050,which could be considered as three heatingsystem replacement cycles of 15 years each.
• Building regulations specify the minimumstandard for LZC technologies in new build andrenovations.
• The substantial capital investment in building-integrated LZC will only occur through novelpolicies, for instance, energy service companiesor feed-in tariffs.
Consumers and societySociety has been transformed to become morecommunity-minded and environmentally-aware,providing the necessary framework and supportfor successful implementation of the requiredpolicies.• If UK society continues to develop along current
trends, no carbon emissions reductions areexpected by 2050.
• Only societies where environmental concernand awareness are much stronger than todaywill produce significantly reduced carbonemissions.
• Changing social priorities is an importantGovernment action as part of meeting itscarbon reduction target.
Policy • Feedback and information are an essential part
of raising awareness. The design of utility bills,electricity disclosure labels, the tariff structureand the existence of the standing charge allneed to be considered in terms of discouragingconsumption and improving the energy-literacyof society.
• As an example of an appropriate framework,personal carbon allowances (PCAs) offer anequitable solution to achieving greater carbonawareness amongst consumers, by placing acap on individual consumption.
ConclusionsSecuring a 60% reduction in carbon emissionsfrom UK households is a considerable challengethat requires a radical shift in perspective in thehousing, appliance and electricity supplyindustries and policy co-ordination across anumber of Government departments. Currentpolicies, programmes and trends are not sufficientto put the UK on a trajectory that will lead to thislevel of emissions reductions by 2050. A clearover-arching strategy that deals with both theenergy and housing needs of UK dwellings, withan emphasis on carbon mitigation, is necessary.

8 Chapter 1: Introduction
The 40% House project has investigated how theUK Government’s commitment to a 60% cut incarbon emissions from 1997 levels by 2050 can berealised in the residential sector, so that thetypical home becomes a ‘40% House’.
This report summarises the main findings andrecommendations of the 40% House projecttowards achieving this target, setting out, asexplicitly as possible, the decisions that facepolicy-makers. It explores the technical and socialpossibilities for reducing energy demand andintegration of renewable energy technologieswithin the building fabric, in order to propose apolicy agenda for transforming the housing stockover the coming half-century. The policy pathwaychosen is market transformation – thesubstitution of products, systems and servicesthat have lower environmental impact than thoseused at present. The elements of the ‘40% Housescenario’, developed over the course of thisproject, are discussed, demonstrating how acombination of technological advances andpolicies can cut carbon emissions radicallywithout compromising comfort and service levels.
1.1 Project scope The 40% House project has focused primarily ondemand-side influences on residential carbonemissions which can be changed throughgovernment policy. Figure 1.1 provides a simplifiedrepresentation of the key factors influencingcarbon dioxide emissions from the UK residentialsector. These can be divided into threeoverlapping spheres: carbon intensity of energy,household-level factors and individual andsocietal factors. Fuel prices and economic factorsinfluence all three spheres. This project hasfocused on policy approaches which providesavings by influencing the factors shown in boldtype, ie household-level low and zero carbonenergy sources (LZC), including solar hot waterheating, solar photovoltaics (PV) and micro-combined heat and power (CHP); the efficiency ofthe building fabric and the efficiency of energy-using equipment.
Although the other factors identified in thediagram, as well as cost issues, are also of greatimportance in determining carbon emissions,they are not the main focus of the report for thefollowing reasons:• Household numbers. Household numbers are
discussed thoroughly in Chapter 3, but policieswill not be suggested to influence them. Acentral projection of household numbers will beused to inform analysis on how to achieve the40% House.
• Energy services. These are the services thatpeople gain from using energy and includewarm rooms, hot water, a well-lit home andrefrigerated food. The general approach in thisproject has been to broadly accept today’sstandards of energy services as a given –policies to influence this component of energydemand are not developed. The key exception isthat home temperatures are expected to behigher in future (Chapter 4). Social changecould result in higher or lower demand forenergy services (Chapter 2). A reduction indemand could come about as a response to the
Introduction
GlossaryThis report is intendedfor a non-specialistreader, so technicaljargon and acronymshave been kept to aminimum. Specialistlanguage is explained ina glossary at the back ofthe report.
Figure 1.1: Key factors determining UK residential sector carbon emissions

repeated impact of extreme weather events, athome and abroad, or from the imposition oftougher post-Kyoto international agreements.One route to influencing energy servicedemand would be to introduce personal carbonallowances (Section 1.5.1).
• Carbon intensity of centrally-supplied fuels. Afuture ‘fuel world’ that is largely similar to thepresent has been assumed, with no constraintson the use of natural gas. Emissions factorsfrom electricity generation in power stationshave been addressed in Chapter 8. By notincluding the possibility of very significantcontributions from lower carbon options on thesupply side, the target set for the project of a40% House was made all the more challenging.
• Cost of fuels. The impacts of future residentialfuel prices were not included in the analysisbecause of the huge uncertainties in energyprices over 45 years, depending on futureavailability. For example, if over-use in the next30 years creates scarcity in 2050, energy pricesin 2050 will be much higher than if efficiencyand low carbon energy supply measures wereintroduced early.
1.2 Climate changeThere can be little doubt that climate change isthe most important environmental problemfacing the world community. Indeed, it is seen bymany as the most important problem of any sort,with the UK government’s chief scientist, SirDavid King, declaring: “climate change is the mostsevere problem that we are facing today – moreserious even than the threat of terrorism” (King2004).
Climate change is caused by the emission ofadditional ‘greenhouse gases’ (GHGs) into the
atmosphere. The single most important GHG iscarbon dioxide, which is generated primarily fromfossil fuel burning. Additional carbon dioxidestays in the atmosphere for up to 200 years, andthere is no quick way of reducing atmosphericconcentrations (Jardine et al 2004). The best thatcan be done is to reduce emissions in order tostabilise concentrations at the earliestopportunity.
The evidence for climate change both in theUK and globally is extremely clear. Global surfacetemperatures have risen by 0.6°C, with those overcentral England rising by 1°C over the last century(IPCC 2001, Hulme et al 2002). In the summer of2003, a new temperature record of 38.5°C was setin the UK (Met Office 2004). These highertemperatures are already having serious impacts:during summer 2003, a heat wave throughoutEurope caused an estimated 35,000 deaths (EEA2004). Rising temperatures have not been theonly consequence. There is strong UK evidence forchanging rainfall patterns and extremes ofclimate. Because of accelerated climate change, ithas been suggested that: ‘Many regions andpopulations are already beyond acceptablethresholds of exposure to climatic risk’ (RS 2002).
The degree of climate change expected infuture depends on emissions of greenhousegases, with higher emissions totals leading togreater climate change. The UK can expectwarmer and wetter winters along with warmerand drier summers, with the average annualtemperature rising by between 2°C and 3.5°C by2080 (Hulme et al 2002). Globally, temperaturescould rise by up to 6°C by 2100 (IPCC 2001). Thelikely effects on humans and the naturalenvironment of high emissions scenarios rangefrom the extinction of species to the creation ofmillions of environmental refugees (Thomas et al2004, Conisbee and Simms 2003). Many countrieswill be under threat from rising sea levels,droughts, storms, heat waves and extremeeconomic and social disruptions. Sea level ispredicted to rise by up to a metre over thiscentury which could, for example, lead to a loss of
9 Chapter 1: Introduction
The serious consequencesof climate change can beaverted by reducingcarbon dioxide emissions.One quarter of allemissions come from theresidential sector

10 Chapter 1: Introduction
over 20% of Bangladesh’s land area, where aneighth of the country’s population live (IPCC2001). The consequences of allowing the higheremissions scenarios to become reality are global,highly damaging and almost unthinkable.
1.2.1 UK and international response to climate changeThe world community has responded collectivelyto climate change by adopting the United NationsFramework Convention on Climate Change in1992, followed by the Kyoto Protocol, which cameinto force in February 2005. Under Kyoto, the UKhas a greenhouse gas reduction target of 12.5% of1990 levels by 2010, as part of a European Unioncollective target of an 8% reduction. Several EUcountries, including the UK, have gone beyond theKyoto target to suggest future greenhouse gas
and carbon dioxide emissions targets, and theseare summarised in Table 1.1. These targets are farmore ambitious than the short-term Kyoto goaland may offer a starting point for futureinternational negotiations.
The UK’s target of a 60% reduction by 2050was originally suggested by the RoyalCommission on Environmental Pollution (RCEP) asa means to limit the rise in atmosphericconcentrations of carbon dioxide to 550 parts permillion (ppm) (RCEP 2000) and was adopted bythe Government in the 2003 Energy White Paper(DTI 2003c). The RCEP target was based on theassumption that all nations would becontributing to a global reduction in carbonemissions via a framework called ‘contraction andconvergence’. This ensures that over time, firstlyglobal carbon emissions would contract andsecondly, there would be global convergence toequal per capita shares of this contraction (GCI2001). The UK Government has not yet adoptedcontraction and convergence as its internationalnegotiating position for the period after the Kyotoagreement, despite RCEP’s advice. Setting anational target is only part of what is needed tostabilise global atmospheric concentrations ofcarbon dioxide and other greenhouse gases – ithas little value unless it eventually forms part of astrong global agreement, which the UK mustwork towards achieving.
There are increasing fears, based on newscientific data, that 550ppm may far exceed a‘safe’ level of carbon dioxide in the atmosphere.For example, the recent report of theInternational Climate Change Taskforce claimsthat 400ppm is likely to represent a point of noreturn, beyond which climate change could spiralout of control (ICCT 2005). The current level is378ppm, rising at around 2ppm per year – only 20years away from what could be a critical level. Ifthis proves to be the case then a greaterreduction in UK carbon emissions will be required,well before 2050.
Table 1.1: Examples of long-term climate change targets set by Europeancountries
Maximum allowable atmospheric concentrations Carbon dioxide emissions
Country of GHGs reductions commitments France Stabilise CO2 concentrations Limit per capita emissions to
at 450ppm or less 0.5 tonnes carbon (tC) by 2050Germany Limit surface temperature rise Reduce energy-related CO2
to 2°C or less compared with emissions by 45-60% pre-industrial levels, and to compared with 1990 levels by 0.2°C or less per decade. 2050; will commit to 40% Limit CO2 concentrations to reduction by 2020 if EU below 450ppm commits to a 35% reduction
over that periodSweden Stabilise atmospheric Reduce per capita emissions
concentrations of all GHGs of CO2 and other GHGs of at 550ppm, with CO2 developed countries from concentrations at 500ppm 2.3 tC to below 1.2 tC by 2050,or less and further reduce thereafter
UK Stabilise CO2 concentrations Reduce national CO2 emissions at 550ppm or less by 60% compared with 1997
levels by 2050
Sources: French Interministerial Task Force on Climate Change (2004); German Advisory Council onGlobal Change (2003); Swedish Environmental Protection Agency (2002); DTI (2003c)

11 Chapter 1: Introduction
1.3 UK carbon emissionsContrary to experience in most countries, UKcarbon emissions have fallen in recent years,being around a fifth lower in 2003 than in 1970.Over the same period, energy use has increasedby 8.2%, with the upward trend still continuing(DTI 2004a). The fall in emissions is largelybecause of a switch to lower carbon intensityfuels (ie fuels which produce lower carbonemissions per unit of energy provided). The keychanges have been an increase in nuclear energyand a switch away from coal and oil towardsnatural gas, both at the power station level andfor heating homes and businesses. In addition,the efficiency with which electricity is generatedhas increased considerably.
The UK is expected to meet its Kyoto target ofa 12.5% reduction of 1990 levels in all GHGemissions by 2010. Until recently, it also boasted anational target of reducing carbon dioxideemissions by 20% by 2010. Unfortunately, theGovernment announced in 2004 that this targetwould not be met (DEFRA 2004d).
1.3.1 Residential energy use and carbonemissionsThe residential sector accounts for 30% of totalUK energy demand. In some respects, this sectorappears to offer potential reductions in energyuse and carbon emissions that are relatively easyto achieve: many energy-efficient and low-carbontechnologies are available or being developed and
there is huge scope for improvements to theenergy efficiency of homes in the UK. On theother hand, achieving these improvements is notstraightforward, because it is not simply a matterof applying a few new technologies in a uniformway. The future of household energy supply anduse lies in the hands and minds of some 25million householders, over 400 local authoritiesand the many elements of the construction,building services, appliance and fuel supplyindustries, as well as with central government.Levels of knowledge are often low, many peoplehave limited access to capital for homeimprovements, not all new developments lead toenergy conservation and a sense of urgency aboutreducing carbon emissions from housing is stilllacking.
Energy use in the residential sector is risingmore quickly than in the UK economy as a whole.Total UK energy demand has grown by 7.3%between 1990 and 2003, but residential energyconsumption grew by an astounding 17.5% overthe same period (DTI 2004a). Looking atdevelopment of household energy trends over thelonger term (Figure 1.2), the major influences onenergy consumption can be illustrated.
Since 1970, energy use per household haschanged very little, but due to increasinghousehold numbers, overall energy use in theresidential sector has increased by 32%. At ahousehold level, the energy saving effect of muchreduced heat losses has been offset by increasesin demand (eg for electricity use in lights andappliances). Energy use for heating still dominatesdemand, being responsible for 60% of the total,with around 20% used to provide hot water andthe remaining 20% supplying all other needs.
1.4 UK energy policyThe Energy White Paper brings together allexisting policies for achieving carbon reductionsand provides a framework for energy policy withfour key goals (DTI 2003c):• reduce UK carbon dioxide emissions by 60% by
2050, with real progress by 2020;
Figure 1.2: Residential energy indices, Great Britain, 1970-2001Source: Based on Shorrock and Utley (2003)

12 Chapter 1: Introduction
• ensure that every home is adequately andaffordably heated;
• maintain the reliability of energy supplies; and• promote competitive markets in the UK and
beyond.For the purposes of this report, it is assumed thatcarbon reductions will be shared equally across allsectors of the economy and therefore theresidential sector reduction target will be 60%.Whilst the 60% target is the main focus of thisproject, the issue of equity and fuel povertyunderpins the approach and policyrecommendations made. The other two objectiveshave also been addressed, but to a lesser extentgiven that the focus is on the residential sectoralone.
1.4.1 Fuel povertyFuel poverty is an important social problem, andconcern to eradicate it has led to the aim, as partof energy policy, to ensure that every home is‘adequately and effectively heated’. A person is infuel poverty if they need to spend more than 10%of their income to afford adequate energyservices – a warm and well-lit home, for example.The key causes of fuel poverty are inefficienthousing, low income, under-occupation ofdwellings and fuel prices. The effects of fuelpoverty include cold homes, illness, discomfortfrom cold and money budgeting problems. Thereis clear evidence that the winter death rate ishigher for people living in cold homes than it isfor those that are able to keep their homes warm(Wilkinson et al 2001). In the UK there are tens ofthousands excess winter deaths every year. TheGovernment has pledged to ensure that, by 2016at the latest in England and Wales, ‘as far asreasonably practicable persons do not live in fuelpoverty’ (UK Government 2000). There iscomparable legislation for Scotland and NorthernIreland.
The number of households in fuel poverty iscontested, but the most recent Governmentestimate for 2002 stands at around 2.25 millionhouseholds in the UK (DEFRA 2004b). Downward
trends in fuel poverty statistics in recent yearshave not reflected improvement in the energyefficiency of housing so much as the lowering ofgas and electricity prices following liberalisation,relatively low levels of unemployment andincreased benefits. The most recent residentialfuel price rises in 2004 mean that severalhundred thousand households have gone backinto fuel poverty. Thus, to achieve permanentreductions in fuel poverty, definite improvementsin energy efficiency are vital, rather than relianceon reductions in energy price, which cannot beguaranteed to last.
1.4.2 Security of supply and competitivemarkets Anticipated peak demand for electricity is animportant factor in national energy policy, as itdetermines the electricity generating capacitythat will be planned. The design, use andownership of lights and appliances, as well as thedeployment of low and zero carbon technologieswithin the home can contribute to lowering peakresidential demand and, therefore, improving thesecurity of electricity supply in the UK (Chapter 8).The development of these new technologies alsocontributes to the promotion of competitivemarkets.
1.4.3 Routes to the 60% targetThe 60% target relates to carbon dioxideemissions. In theory, if sufficient carbon-freeenergy sources (nuclear power and renewableenergy) could be provided, energy use couldcontinue at current levels, or even increase, whilecarbon emissions reduce. However, it is very farfrom certain that adequate carbon-free sourcescould be developed, or that all or most carbonemissions from fossil fuel could be captured andstored (carbon sequestration). Therefore,significant energy demand reduction is almostcertain to be required. Table 1.2 shows fourscenarios designed to reach the end-point of 60%reductions in UK carbon emissions for the wholeeconomy, developed by the RCEP. These use

13 Chapter 1: Introduction
demand were to remain the same as in 1997(Scenario 1), the nation would have to acceptchanges such as an increase in nuclear power toprovide one quarter of all energy (presently itsupplies around one quarter of electricity). Therewould also need to be a huge increase in the useof renewable energy sources.
The approach taken in the 40% House projectwas to focus primarily on reduction in energydemand and an increase in low and zero carbonenergy supply methods at a household level,rather than changes to the carbon intensity of theenergy supplied nationally. For this reason muchof the analysis focuses on reducing energyconsumption as the key means of reducingcarbon emissions.
1.4.4 Residential sectorWhilst Government policy has contributed toincreasing the efficiency of the housing stock,particularly in regard to heating, overall energydemand is still increasing. Before consideringcurrent policies and their likely impact, thepolitical and organisational complexity of housingand energy policy is outlined.
There are four major Government departments
Table 1.2: The RCEP energy demand and supply scenarios for 2050
Scenario 1 Scenario 2 Scenario 3 Scenario 4Change in energy demand compared with 1997 (%) 0 –36% –36% –47%Total energy supply (TWh) 1848 1323 1314 1104Fossil fuels (TWh/% of total) 929 (50%) 929 (70%) 929 (71%) 929 (84%)Renewables (TWh/% of total) 464 (25%) 394 (30%) 219 (17%) 175 (16%)Nuclear/carbon 456 (25%) 0 166 (13%) 0sequestration (TWh/% of total)
Source: RCEP (2000)
different combinations of reduced carbonintensity of energy supply and reductions in thetotal energy demand to reach the 60% target.Only one scenario features no reduction indemand for energy and none allows for growth inenergy demand, which would result if currenttrends continue.
Reducing demand for energy poses a majorchallenge to our ways of thinking and acting –but so does a failure to reduce it. For example, if
Supply-side fixes, such asoptimistic use ofcentralised renewableenergy are not consideredin the 40% House scenario

14 Chapter 1: Introduction
involved in Whitehall alone (Table 1.3), notincluding the parallel responsibilities in thedevolved administrations. Several departmentsfund additional, external groups, such as theEnergy Saving Trust and Carbon Trust, and someinitiatives have joint oversight, such as theClimate Change Project Office, which was set upby the DTI and DEFRA to advise business on Kyotoobligations. Below Whitehall, there are variouslevels of regional and local government. Thiscomplexity and fragmentation is a barrier to the‘joined-up governance’ needed to achievesignificant energy and carbon reductions fromthe housing stock.
An illustration of the variety of policiesaffecting the residential section is shown in Table1.4, which lists a number of important policiesand describes what is known about their impacts.
The government expects existing policies todeliver a total cut in residential sector carbonemissions by 2010 of 4.2 MtC (DEFRA 2004a).These savings would amount to a 10% cut inemissions since 1990, when residential sectoremissions stood at 41.7 MtC (DEFRA 2004e).Emissions in 2002 were just 3% lower than in1990, so there is a considerable way to go beforeeven this modest target is achieved.
Despite the wide range of policies in place, and
Table 1.3: Departmental responsibility: housing and energy
Department PolicyODPM Sustainable communities; neighbourhood renewal; planning;
Housing Corporation; housing funding; building regulations;urban policy; devolution; regions
DEFRA Climate Change Programme; air quality; energy efficiency;sustainable energy; fuel poverty; pollution prevention and control;consumer products; Market Transformation Programme; Carbon Trust;Energy Saving Trust
DTI Sustainable construction; conventional and renewable energy;Foresight programme; Energy Saving Trust; fuel poverty;neighbourhood renewal implementation strategy
Treasury House prices; fiscal incentivesDevolved administrations Housing and energy efficiency are devolved matters
some very good individual initiatives, it isdoubtful whether current policies will meet thesavings target. As mentioned earlier, theGovernment has already admitted that it will notmeet its economy-wide target of a 20% cut incarbon emissions by 2010. Beyond 2020, there islittle policy thinking in place and certainly nodetailed long term strategy to deliver the 2050target. This report will build on existing policies toshow how 60% carbon reductions could beachieved by 2050 in the residential sector andwhy it is vital that action begins now to meet thistarget.
1.5 Policy approachThe philosophy underlying the suggested policyapproach to achieve the 40% House is describedhere, prior to outlining individual policies in thefollowing chapters.
1.5.1 OptionsThere are currently two major potentialapproaches to achieving lower energy use andlower carbon emissions in the residential sector:product-based market transformation, focusingon the equipment/capital stock used, andincreasing fuel prices, eg via carbon taxation. Thisreport is based on a market transformation (MT)

15 Chapter 1: Introduction
approach, which uses a variety of policyinstruments to deliver higher levels of efficiencyby directly targeting individual products. Bycontrast, carbon taxation would work bypromoting more efficient, lower carbon solutionsthrough raising the price of carbon-based fuels.Carbon taxation would not necessarily conflictwith an MT approach and the two could be usedtogether. However, carbon taxation wouldseriously disadvantage the poor in society. Recentresearch shows the practical impossibility offinancially compensating the poor for carbontaxation, so that it would inevitably add to theburden of fuel poverty (Ekins and Dresner 2004).Given the aims of this study, this rules out carbontaxation as a policy approach.
A new approach, which is just beginning to bediscussed, is that of personal carbon allowances(PCAs), also known as personal carbon rations ordomestic tradable quotas (DTQs) (Hillman andFawcett 2004, Anderson and Starkey 2004). WithPCAs, each adult has an equal carbon allocation tocover purchases of gas, electricity, petrol andaviation. The PCA brings home to the individual,in a forceful way, the amount of carbon beingreleased through daily activities. It reflects theprinciples of contraction and convergence, and isstrongly rooted in the need for equity. PCAs couldform the umbrella of an overall emissionsreduction policy, within which many specificproduct and systems policies would still berequired. This policy could work well with markettransformation to deliver carbon savings.However, the main focus of this report remainsmarket transformation.
1.5.2 Market transformation Market transformation is already the establishedpolicy approach when dealing with much energy-using equipment (eg fridges, light bulbs, boilers).It combines individual policies into a strategicframework, moving the distribution of salestowards greater energy efficiency over severalyears. The typical suite of policies includeslabelling – to distinguish the good from the bad –
Table 1.4: Examples of UK policies and programmes affecting the residentialsector
Policy/ Programme Summary AchievementBuilding 2002, 2005, 2008 – continual 2002 regulations Regulations Part L revision. Amendments under estimated to have
consideration should increase reduced heating energy efficiency of new build and needed by 50% on 1990 home extensions by 25% regulation levels (DTI
2003c). Not confirmedby evidence
Energy Efficiency All suppliers with >15,000 Estimated annual savingsCommitment residential customers to of 0.1 MtC from EESoP 3,(previously EESoP) install efficiency measures. 2000-2002 (Ofgem/EST
Aim for 0.4 MtC (million 2003)tonnes of carbon) pa saving over lifetime of measures by 2005; 0.7 MtC pa by 2010.EEC renewed every 3 yrs.Current spend is £150m pa,mostly on cavity wall and loftinsulation + low-energy lighting. Half the benefit togo to vulnerable households
Home Energy Obligation on all housing Claimed mean Conservation Act authorities to submit plans improvement of 13.4% 1995 to improve energy efficiency by 2003 (DEFRA 2003),
of housing stock by 30% by but thought to be based 2010 over 1996 level on overestimates
Market Continued promotion of Operates a consultative Transformation ‘resource efficiency’ for review process to Programme products, systems and develop policy strategies
services, leading to removal with business, consumers of least efficient products and other bodies.and appliances;encouragement of mostefficient
Energy efficiency Through national network of EEACs advised 2 million advice Energy Efficiency Advice + householders by
Centres (EEACs) and other 2004.sources

16 Chapter 1: Introduction
followed by combinations of procurement,rebates, minimum standards and education(Figure 1.3). The objective is to introduce new,super-efficient equipment onto the marketthrough procurement and then support it withrebates, until it can be produced by severalmanufacturers and competition exists (about20% of the market). In parallel, there is a clearstrategy to ensure that the least efficient itemsare no longer manufactured or sold, throughmandatory minimum standards or voluntary
agreements with industry. As a result, the salesprofile of new equipment and the stock inpeople’s homes is gradually transformed towardsgreater energy efficiency.
The cycle can be undertaken several times, forinstance by introducing a new procurementactivity today in preparation for a second, tighter,minimum standard at a stated point in the future.The market transformation strategy works wellwith products that have a natural turnover in thestock as they break down and need replacement(Boardman 2004a, b). The detailed design andtimetable of a market transformation strategydepends upon the relative importance given tofactors such as the cost to government, thecertainty of the savings and the inclusion of allsocial groups (Boardman et al 1995).
1.5.3 Market transformation and housingThe market transformation approach is such apowerful analytical tool that it is used here tostructure the debate on policy options for housingas a whole. This is notwithstanding the majordifferences that exist between houses and whitegoods. For instance there is no clear end-of-life toa dwelling; it is not a traded good that can bemoved around but a social necessity withpowerful emotional associations, and the way inwhich people chose their home is influencedmainly by location and price rather than thequality of the building. Where housing isconcerned, present policies support the statusquo rather than encouraging transformation.However, it is possible to upgrade and improve ahouse, and thus make it more energy efficient,and in this way the housing stock is open tomarket transformation. The case for markettransformation of housing will be made in greaterdetail in the following chapters.
1.6 ConclusionsThe key conclusions from this chapter are:• Climate change is a deeply serious problem and
action both in the UK and internationally iscurrently insufficient to address it.
Figure 1.3: Market transformation strategy
The 40% House scenarioproposes a radical agendafor the transformation ofthe entire housing stock

17 Chapter 1: Introduction
• Energy use in the residential sector is asignificant component of the UK’s contributionto climate change. Energy use in this sector isrising much faster than in the economy as awhole and carbon emissions have fallen verylittle.
• In order to achieve a total reduction inresidential carbon emissions of 60% by 2050,emissions will have to drop around 2% perannum – this compares starkly with the 3%reduction in total during the twelve years since1990.
• Fuel poverty is an important social problemlinked with energy use, and must be resolved inparallel with reducing carbon emissions. This,along with other considerations, leads to theadoption of market transformation as thepolicy strategy for achieving change.
• A clear strategy is needed to reverse the currenttrend of increasing energy consumption, withcontinuing cuts in emissions between now and2050, and beyond. The 40% House projectproposes an agenda for the future of the wholehousing stock of the UK, with a 60% cut inhousehold carbon emissions as the target for2050 throughout.
Figure 1.4: Schematic structure of 40% House report

18 Chapter 2: Views of the future
This chapter concerns future energy use andcarbon emissions from the UK residential sectorand how these were modelled through the UKdomestic carbon model (UKDCM), developed aspart of the 40% House project. This modelunderpins the energy and carbon savingscalculations throughout the report. The structureof the model is briefly described, then the broadercontext of modelling energy futures is examined,with the introduction of the UK Foresightscenarios. These are combined with the UKDCMto provide four varied future scenarios to 2050,showing how carbon emissions could change inthe residential sector if different pathways werefollowed. The Foresight scenario expected todeliver the highest carbon savings is identified sothat it can be investigated further and developedinto a more robust and realistic ‘40% House’scenario.
2.1 Modelling an uncertain futureHow well insulated will buildings be by themiddle of the century? How efficient willappliances be in design and use? What will theuptake rate of new technologies be and what willbe the design priorities? What types of home willpeople be choosing? How many individuals willlive in the average dwelling and for how much ofthe year? It is impossible to predict such variableswith any accuracy when looking as far ahead as2050 and many depend crucially on politicalcommitment. For example, the technology toinsulate new buildings so that they requirevirtually no artificial heating already exists: thequestion is how far Government is prepared to goin setting such insulation standards and howquickly the construction industry can build qualityhomes to meet the standards on a large scale.
To give an idea of how significant the changescould be, it is useful to look back 50 years and toconsider the changes in energy use, socialorganisation and technological possibilities sincethen. For example, in 1950, almost 90% of theUK’s total primary energy was supplied by coaland it was the dominant fuel used for household
heating, primarily in very inefficient open fires(PIU 2002). By 2003, less than one fifth of UKprimary energy came from coal (DTI 2004a) andnatural gas had become the heating fuel used infourth-fifths of homes (DTI 2004c). A choice ofbasic parameters can be overtaken rapidly byevents: for example, energy projections for the UKmade only a short time ago were based on energyprice scenarios that now seem highly unlikely,such as oil prices in 2005-10 ranging from $10 to$20 per barrel (DTI 2001a). In 2004, oil reached $55a barrel.
Long-term scenario building therefore needs toprovide decision makers with information on thepotential impacts of different directions in whichsociety might develop. For example, householdsize will be tied in with incomes, land availability,house prices and social provision for the elderlyand the young – all of which will be affected bythe prevailing political consensus. Similarly, thechoice of high- or low-technology pathways isaffected by availability of materials, scientists andengineers, and by public attitudes towardsdifferent technologies. Scenarios can demonstratehow one or two fundamental shifts in society inthe near future could radically alter a wide rangeof aspects of life by 2050. They are a way ofhandling complexity and uncertainty bygenerating possible futures, not by makingaccurate predictions. These can then be translatedinto detailed estimates for use in modelling tohelp assess the likely effects of specific mediumand long-term government policies.
2.2 The UK Domestic Carbon ModelIn order to investigate how 60% savings could beachieved in the UK residential sector, a detailedbottom-up model, the UK domestic carbon model(UKDCM), was developed. Bottom-up modelling isa long-established technique for modellingpossible futures based on highly disaggregated,physically-based data and relationships. Aconsiderable amount of data are required for thistype of model, including annual values forpopulation, levels of insulation, efficiency of
Views of the future

19 Chapter 2: Views of the future
heating equipment, ownership of appliances andmany other energy related characteristics of theUK housing stock. The most well-known priormodel of this type is BREHOMES (Shorrock andDunster 1997), with more recent work havingbeen carried out by Johnston (2003). However, theBREHOMES model is not publicly available andJohnston’s model included just two dwellingtypes: a typical pre-1996 dwelling and a typicalpost-1996 dwelling. In order to understand moreof the detail of how homes and house-buildingmight change over 45 years, a decision was madeto create a new bottom-up residential sectormodel for the 40% House project.
2.2.1 Data inputsThe UKDCM uses detailed housing data from theEnglish Housing Condition Survey (EHCS) and thecorresponding surveys of housing in NorthernIreland and Scotland to form the basis of a stockmodel of UK housing (Figure 2.1). In the absenceof survey data for Wales, data from the WestFigure 2.1: UK Domestic Carbon Model structure
In 1950, almost all houseswere heated by coal.What, if anything, will beused in 2050?
20 Chapter 2: Views of the future
Midlands were used, as the closest geographicalfit.
The resulting UK housing stock profile is highlydisaggregated, with data sets for ninegeographical areas, seven age classes and tentypes of construction (mid-terraced houses, semi-detached houses, etc). Different combinations ofthese data sets are further divided by tenure,number of floors and method of construction. Inall, over 12,000 dwelling types are modelled in theUKDCM for 1996. The period 2005 to 2050 isdivided into decadal age classes for futuredwellings, so that different building standards canbe modelled over time. With the addition of thesefuture age classes, the UKDCM models over20,000 dwelling types for 2050.
In addition to the housing stock profile, thefollowing trends and projections are incorporated:• Historic demolition and future regional
dwelling forecasts (National Statistics/ODPM).• Scenarios for future population growth and
dwelling numbers (DEFRA, Foresight/SPRU2002).
• Scenarios for future average monthlytemperatures. The UKCIP high scenario hasbeen used and this shows a 2°C from 1996annual average temperatures (UKCIP).
This information was combined into a databasemodel and predictions regarding house types,numbers and their energy use and carbonemissions were made. Four sub-models were alsodeveloped to feed in information on space andwater heating, cooling and lights and appliances.The energy performance of existing dwellings anddomestic equipment was used as a baseline toestimate the rates of change and as a startingpoint for the sub-models.
The number of new dwellings that will beconstructed between now and 2050 is stronglydependent on demolition rates. While predictionscan be made regarding the thermal performanceof future dwellings, based on assumptions aboutfuture Building Regulations, the shape and size ofthese dwellings is unknown. The size and shape ofnew buildings are based on the most recent age
class data, with some variation from this startingpoint as the model progresses (for example,average size of dwellings is expected to decreaseslightly and this is reflected in the model).
2.2.2 CostsThe key aim of the modelling was to demonstratea plausible technological route, backed by policy,which can achieve 60% savings by 2050. Thefinancial costs and benefits of particulartechnology adoptions in future scenarios aredifficult to estimate, both in principle and inpractice, for a number of reasons:• The cost of any given technical improvement is
not a given, but strongly dependent on policy(Hinnells and McMahon 1997).
• The cost of any given technical improvement isdependent on the timescales forimplementation. If changes can be made to fitwith natural product improvement cycles,changes can be met at much lower, zero or evennegative costs.
• The cost of future technical options is not fullyknown and will depend on a wide range offactors which determine economies of scale.
• Cost, both initial and life-cycle cost, is not theonly criterion on which consumers base theirdecisions. A number of other factors, includingthe level of service, style preferences andavailability, all come into play.
• The cost/benefit of external effects is unclear, iethe societal value of a tonne of carbon savedvaries with projections of climate change andtimescale. The value in 2050 may be verydifferent to current expectations.
Although costs and financial benefits are ofimportance, particularly on shorter timescales,they were considered to be a second order effectin terms of the modelling, particularly given theinherent uncertainties that exist over atimeframe of 50 years. The main drivers of policyover this time will be factors such as population,household numbers and household size, buildingand demolition rates. Costs were therefore notmodelled – it was considered more important to

21 Chapter 2: Views of the future
identify a route to the necessary carbon savings,whilst keeping an awareness of the cost andfeasibility issues that would need to be addressedalong the way.
2.3 The Foresight scenariosHaving developed the UKDCM and calibrated itagainst current energy use, the aim was todevelop a scenario that would achieve 60%carbon savings by 2050. In order to quantify thedetails of possible futures in terms of energy useand carbon emissions, it was first necessary tolook at some alternative futures in broad terms –the Foresight scenarios were used as the basis forthis.
The UK ‘Foresight’ programme was set up in1994 as a ‘national capacity to think ahead’. Oneof the research outputs has been the creation offour future scenarios, which have been widelyused in a variety of research. The Foresightscenarios are framed in the context of two basicdimensions of change: social values andgovernance systems (Figure 2.2), which are takenas axes to define the four scenarios. For example,the World Markets scenario has values ofconsumerism and globalisation, whereas LocalStewardship is the society that develops understrong regionalisation and community values.
Although none of the scenarios was intended torepresent business-as-usual, it is generallyconsidered that World Markets best describes thetrajectory we are on at present.
The Foresight scenarios do not offerprobabilities of a given outcome but supply auseful way of thinking about possible futuresassociated with different worldviews andmindsets. They give a snapshot of how life mightbe in 2050, to aid more detailed assessment ofpossible energy futures. Using the Foresightscenarios as a basis for the detailed modelling hastwo main advantages:• Compatibility: the broad world-views
underlying the scenarios are consistent withprevious work done under the Foresightprogramme and other modelling work that hasused the Foresight scenarios.
• Consistency: the scenarios provide a frameworkto ensure that developments in the residentialsector are consistent with developments inother sectors of the UK economy, includingconsumer patterns, investment, regulation,market and environmental factors.
Table 2.1 summarises the key aspects of the fourForesight scenarios that are particularly relevantto this project. The energy aspects of theForesight scenarios are given in general terms andshow very different fuel mixes, variation in totalenergy use and strongly divergent aims forenergy policy. These overall statements weretranslated into carbon emissions projections to2050 for the residential sector, using the UKDCM.It should be noted that UK population projectionshave been revised since the Foresight scenarioswere developed, with an increase of severalmillion additional people by 2050 under ‘businessas usual’. Therefore, population figures are likelyto have been underestimated in all the Foresightscenarios.
2.4 Modelling carbon emissions In order to calculate carbon emissions under eachof the Foresight scenarios using the UKDCM,detailed assumptions were created for each type
Figure 2.2: Foresight scenarios on a grid of governance and social valuesSource: PIU (2001)

22 Chapter 2: Views of the future
of energy using equipment, each element of thebuilding fabric and the carbon intensity of energyused. The following guiding principles were usedin developing the scenario parameters:• Energy efficiency: improvements in energy
efficiency will be greater in the WM and GRthan in the LS or NE scenarios.
• Adoption rates for technology and efficiencymeasures: higher adoption rates for energyefficiency measures will occur in the moreregulated scenarios, GR and LS, with lower ratesin WM and NE. High adoption rates ofelectronics-based and labour-savingtechnologies occur in the WM scenario.
• Behaviour and energy services: the highestdemand for most energy services (eg hours of
lighting, uses of washing machines, etc) isfound in WM, followed by GR and NE, with LSexperiencing the lowest demand.
2.4.1 Model resultsOnce all the parameters for each scenario wereestablished, carbon emissions from the UKhousing stock were modelled to 2050. The resultsare shown in Figure 2.3, illustrating the verydifferent levels of carbon emissions projectedunder the four scenarios.
Household numbers – ranging from 21.2 millionunder LS to 29.5 million under WM – based onassumptions of household size, have a significanteffect on carbon emissions under each scenario.However, this is not the only important factor –
Table 2.1: Socio-economic and energy trends of the Foresight scenarios
World markets Global responsibility National enterprise Local stewardshipCore value Consumerism Sustainable development Individualism Conservation Environmental concern Limited, health-linked Strong Limited StrongAnnual rate of GDP growth 3.5% 2.75% 2% 1.25%Population, 2050 (000s) 59,000 57,000 57,000 55,000Household size, 2050* 2.0 2.2 2.4 2.6Households, 2050 (000s)* 29,500 25,900 23,800 21,200Energy policy priorities Low prices Efficiency and development Security of supply Efficiency and local
of renewables fuel sourcingPrimary energy +1.7% +0.1% +1.5% +0.1%consumption average annual changeEnergy prices Low High High HighEnergy efficiency Limited adoption Strong international Limited – low High priority
of improvements agreements capital availability & environmental concern
Security of supply More interconnection, Wide range of sources used. Nuclear and coal ‘Think global, actdecentralised Increase in distributed power stations replaced, local’ policy generation, generation to avoid imports. reduces importsliberalisation Quota system for
coal, nuclear and gasRenewables Renewables are 10% Renewable generation Renewables are Renewable
of electricity, from expands to 30% of 10% of electricity generation wind and waste electricity supply expands to 20%
of electricity supply
Sources: PIU (2001), SPRU (2002), DTI (2000), UKCIP (2000)* Assumes 2050 household size values equal those published for 2020

23 Chapter 2: Views of the future
GR has higher household numbers than NE butachieves considerably lower emissions.
These runs of the Foresight scenarios providevaluable clues as to which policy orientations aremost likely to succeed in reducing carbonemissions (although not necessarily ineliminating fuel poverty). It is clear that WM – thescenario that comes closest to present policies –does not achieve any reduction in carbonemissions. NE, which is relatively isolationist,
non-innovative and reliant on coal, gives somereductions. The two scenarios which achieve thelowest carbon emissions, GR and LS, involve someradical changes. Both assume societies that set ahigh value on environmental quality and educatepeople accordingly. The technological possibilitiesopen to them are a product of this basicorientation. Global Responsibility comes close tothe 40% target, due to strong environmentalconcern, an international framework ofenvironmental legislation and plenty ofinnovative technology. But only Local Stewardshiptakes the UK below the 40% threshold; itachieved 33% of 1996 emissions levels by 2050.Hence, LS was taken as the starting point fordeveloping the 40% House scenario.
2.4.2 Local Stewardship Scenario Local Stewardship is the scenario with the lowestcarbon emissions. It combines low householdnumbers with lower levels of energy demandwithin the home as a result of the integration ofsome low and zero carbon technologies into thebuilding fabric. This scenario also involves majorchanges in the way in which individual and socialpriorities develop. The key changes by 2050 underLS, as assumed in the UKDCM and shown in Table2.2, are:• relatively low population growth combined
with increased household size, leading to threemillion fewer households than in 1996;
• demolition rates increased considerably, leadingto more rapid replacement of the old,inefficient housing stock as well as removal ofexcess housing;
• improved efficiency of the building fabric ofnew and old houses, but new houses will stillbe considerably more efficient than retro-fittedold ones with lower heat demand;
• heating energy supplied far more efficiently,primarily through gas condensing boilers, butalso increasingly by micro-CHP; and
• a wide uptake of renewable energy forelectricity generation (25% of households) andhot water (75% of households).
Figure 2.3: UK residential carbon emissions under the Foresight scenarios,1996-2050Source: UKDCM
Our current world marketeconomy will not bringabout the carbon savingsneeded. A new approach isrequired.

24 Chapter 2: Views of the future
Table 2.2: Main variables in Local Stewardship scenarioVariable 1996 2050People and dwellingsPopulation (000s) 59,000 55,000Household size (people per household) 2.47 2.6UK household 23,900 21,150numbers (000s)UK rate of new 162,000 91,000construction(dwellings per year) UK demolition 8,000 227,000 (note: artificially high due (dwellings per year) to falling household numbers)Building fabricFabric values for retrofit Cavity wall insulation U=0.4 U=0.3 (90% ownership)to existing stock Solid wall insulation U=0.5 U=0.3 (30% ownership)U values in w/m2 K Double glazing U= 2.5 U=0.8 (90% ownership)
Loft insulation U=0.35 U=0.14 (100% ownership)New building fabric Walls U=0.45 U=0.1 (all 100% ownership)values Windows U=2.1 U=0.8U values in w/m2 K Loft insulation U=0.24 U=0.1
Floors U=0.6 U=0.09Doors U=2.5 U=2.0
Ventilation rate (air 3.5 0.6changes per hour) for new buildingsEnergy usesInternal temperatures (°C) – zone 1 18.3 21zone 2 17.3 18Relative electricity 100 83consumption in lights and appliances (including cooking) per householdSupplying energy demandGas boilers ownership 69% 54%efficiency 68% 95% Electric space heatingownership 9% 9%efficiency 100% 100%Micro-CHPownership 0% 26.5%Photovoltaics (electricity production)ownership 0% 25%Solar Thermal water heatingownership 0% 75%Emissions factorselectricity (kgC/kWh) 0.136 0.095gas (kgC/kWh) 0.052 0.052
Source: UKDCM

25 Chapter 2: Views of the future
Whilst the Local Stewardship scenario was foundto deliver in excess of 60% carbon savings for theresidential sector, the factors behind this cannotall be delivered via energy policy (or perhaps anypolicy). A key feature which leads to the lowemissions under this scenario is the considerabledecrease in household numbers, resulting from anincrease in household size and a reduction in UKpopulation. However, household size has beendecreasing for 150 years, so to assume an increaseto 2050 is problematic. These issues are discussedfurther in Chapter 3. Given the doubt around thelow LS household numbers (and other factors)and the lack of policy mechanisms to achievethem, a more robust and realistic scenario wasdeveloped – the ‘40% House’ scenario.
2.4.3 The 40% House scenarioThe 40% House scenario took the LocalStewardship scenario as a starting point, drawingon some of the technical analysis whichunderpins LS and assuming similar societalattitudes, but with some significant changes. The40% House scenario does not rely on decreasingnumber of households and yet can still deliver60% carbon savings. The various assumptionsmade under this scenario will be described anddiscussed in greater detail in the followingchapters.
Inevitably, modelling possible future housingscenarios has many dimensions. Radicalimprovements in one factor or collection offactors may be traded off against less challengingones in others. As the remainder of the report willshow, the proposed carbon savings in theresidential sector are made up of a wide range ofactions from increased demolition rates (so thatold inefficient homes are replaced by new lowenergy ones), to greatly improved insulationstandards, to a huge increase in adoption ofhousehold-level renewable technologies for hotwater and electricity. The balance of thesedifferent measures illustrated in the 40% Housescenario is not the only mix that could have
achieved the same saving. However, it ispresented as one possible solution, offering agood insight into the considerable changes whichhave to be made to all factors affecting carbonemissions from the residential sector.
2.5 ConclusionsThe key conclusions from this chapter are:• A new modelling tool for the UK residential
sector – the UK domestic carbon model(UKDCM) – has been developed and tested.
• In combination with detailed data assumptions,the UKDCM illustrated the wide range ofcarbon emissions futures that are possible,based on the Foresight scenarios. These rangefrom a slight increase in emissions by 2050 to a67% decrease.
• UK society is on track at present to develop in aWorld Markets manner. If this continues, nocarbon emissions reductions are expected by2050.
• Only societies where environmental concernand awareness are much stronger than today(ie LS and GR) produced significantly reducedcarbon emissions. Therefore, changing socialpriorities must become an importantGovernment action as part of meeting itscarbon reduction target.
• The future scenario that resulted in lowestcarbon emissions, LS, did this in considerablepart due to assumptions about low numbers ofhouseholds in 2050.
• Household numbers cannot be reducedthrough energy policy or guaranteed in anyway. Thus a risk-averse future scenario shouldnot rely on these and must be able to deliver60% savings even with increasing numbers ofhouseholds.
• The ‘40% House’ scenario can deliver savingspurely due to improvements delivered byhousing and energy policy, which is withinGovernment control. This will be developed anddescribed in the remainder of the report.

26 Chapter 3: Households and living space
Demographics have a major impact on theprospects for reducing residential emissions – notonly how many people will be living in the UK by2050, but how many live in each household, whatages they are, how much space they occupy andwhere the households are located. The number ofhouseholds is one of the driving forces behind thegrowth in residential energy consumption. Whilstnot easily amenable to policy, it is important tounderstand the population trends and projectionsin order to develop a reliable estimate of futureenergy demand and consequent carbonemissions. Assumptions about householdnumbers and amount of living space haveimplications for space heating and cooling, waterheating and the number, size and usage ofappliances, which raise important policyconsiderations. Likely trends in population,household numbers and household size (both interms of number of people and living space) to2050 are summarised here, along with theassumptions made under the 40% Housescenario.
3.1 Population Population projections are based on censusfigures, extrapolated to the present and thenprojected into the future on the basis of threefactors: fertility, life expectancy and net migration.
3.1.1 Net migrationNet migration is the most difficult factor topredict and accounts for around 60% of projectedincreases. A net migration gain of 130,000 eachyear between 2004 and 2031 is assumed by theOffice of National Statistics (NS 2004e) – this issomewhat lower than estimates for the past fiveyears of between 151,000 and 172,000 (NS 2004g)and any changes to these figures could have asignificant impact on current projections.
3.1.2 Fertility Post-war fertility peaked in 1964 with a totalfertility rate of 2.95 children per woman, falling to1.71 in 2003. While actual births each year will
continue to fluctuate, the overall trend since thebaby boom has been downward (NS 2004f). Thebirth rate is unlikely to rise significantly in theforeseeable future and it is assumed that thenumber of children born to women born after1985 will level off at 1.74, close to the current level(NS 2004e).
3.1.3 Population age structure Life expectancy at birth is projected to rise from76.2 years in 2003 to 81.0 in 2031 for men andfrom 80.6 to 84.9 for women (NS 2004e). Thelatest projections for the UK show that the totalpopulation of pensionable age (over 65 years) willincrease from 10.9 million in 2002 to 12.7 millionby 2021 and 15 million by 2031, peaking at over 17million in the 2060s (Shaw 2004). This representsalmost a quarter of all residents and an increasein the potentially vulnerable population. Homeswill be needed that allow for as much self-sufficiency as possible in old age. In March 2004,the ODPM committed itself to reviewing Part Mof the Building Regulations (access and facilitiesfor disabled people) in order to incorporateLifetime Home Standards, so that homes caneasily be adapted to different stages of life and tochronic illness or disability.
3.1.4 Population assumptionsThe current UK population is approximately 60million. Projections of population size, and alsothe size and year of the ‘peak’ population, haverisen considerably over the last decade. The rangeof predicted figures widens as the time horizonlengthens into the future and it is extremelydifficult to give an accurate projection of thepopulation in 2050 – the Government Actuary’sDepartment figures range from 62.5 million to 72million (Shaw 2004). A mid-range projection of66.8 million for 2050 has been adopted for use inthe 40% House scenario (Table 3.1) since this isthought likely to be the period of peakpopulation. This figure was felt to be morerealistic than the 2050 population figure of 55million assumed under the Local Stewardshipscenario.
Households and living space

3.2 Household size and numbersThe number of households, each with its ownlighting and set of appliances, will be a key factorin future energy consumption. Communal spaceand water heating are unlikely to spread beyond20% of dwellings – a large majority of householdswill still have their own systems. The actualnumber of households is dependent on the totalpopulation and the average number of people perdwelling (household size).
3.2.1 Trends in household sizeThere has been a downward progression inhousehold size for some time to the currentfigure of 2.3 people per dwelling. Only 7% ofhouseholds in Great Britain contained more thanfour people in 2002 – half the figure for 1971 –whilst the proportion of one-person householdsrose from 18% to 29% over the same period (NS2004b). Traditional families make up a decreasingproportion of the population: for example,Scottish projections are for a drop in householdswith two or more adults with children from 21%of the total in 2002 to only 15% in 2016 (ScottishExecutive 2004).
Almost 70% of the expected rise in householdnumbers in England between 1996-2016 isattributed to single-person households (Holmans2001), nearly half of which currently containpensioners (NS 2004d). The Treasury report onfuture housing needs anticipates a continuationof this trend, with approximately 9 million single-person households by 2021 (Barker 2004).However, it is possible that this is actually comingto an end: ‘over the last five years there have beenno statistically significant changes in the overallproportion of adults living in one-personhouseholds, and among people aged 65 and over,the proportion living alone has remained relativelystable since the mid-1980s’ (NS 2002).
Household size in the future will depend on anumber of socioeconomic factors that shapepeople’s preferences. For example, the downwardtrend in extended families living together couldchange given house price trends, increased lifeexpectancy, pension under-funding and increasedcosts of residential care. It was recently estimatedthat the number of three-generation familiescould rise from 75,000 to 200,000 over the next20 years (Skipton Building Society 2004).
3.2.2 Regional issuesGovernment projections show increases inhousehold numbers for all four countries of theUK, although some population decline is expectedin Scotland and in North-East and North-WestEngland (ODPM live tables). Projected householdgrowth in the English regions is highest in theSouth East, South West, East and the EastMidlands and lowest in the North East, NorthWest and the West Midlands. These figures mirrorexisting and expected trends in employment –there is momentum towards growth in the partsof the country that are most economically activeand current policy is to adapt to this: ‘predict andprovide’. The East of England Regional Assembly islikely to ratify plans for 500,000 new homes inthe region – an increase of 20% in the number ofhouseholds, in a region that is alreadyexperiencing water shortages. The planned
27 Chapter 3: Households and living space
Table 3.1: UK population projections used in the 40% House scenario (thousands)
Year end 2003 2011 2021 2031 2051England 49,856 51,595 53,954 55,885Wales 2,938 3,020 3,106 3,153Scotland 5,057 5,034 4,963 4,825Northern Ireland 1,703 1,753 1,811 1,840United Kingdom 59,554 61,401 63,835 65,700 66,800
Source: Shaw (2004)
By 2050, a quarter of thepopulation will be over 65

28 Chapter 3: Households and living space
Thames Gateway development is the biggestco-ordinated building programme for more than50 years, with 120,000 new homes planned(ODPM 2004f). The House Builders Federationclaim that 47% of projected growth in Englandbetween 2001 and 2021 is likely to be in Londonand the South East, with three quarters of thetotal in these two regions plus the East and SouthWest (HBF 2003). Hence the highest growth inhousehold numbers is expected in the warmestregions of the country.
3.2.3 Household size and energy demandPer capita consumption plummets when peoplelive in larger households, with a particularlymarked difference between one- and two-personhouseholds. Figure 3.1 illustrates how, in theory,60% energy savings could be achieved for all one-person households simply by moving them intofive-person households, although this is unlikelyin reality.
3.2.4 Household size assumptionsHousehold size is not easily amenable to policyintervention as it results from a complex mixtureof factors such as income, house prices andavailability, employment opportunities, socialprovision for children and the elderly, and the ageat which young people move into their ownhomes. It was therefore important not to base themodelling on household size assumptions thatmight be over-optimistic in terms of the impacton carbon emissions.
The lowest European figure for household sizeis for Sweden, with 1.9 persons per household in2002 (Eurostat 2004). If household size in the UKwere to drop to this level, there would be a 47%increase in the number of households by themiddle of the century, assuming a population of66.8 million. If household size were to hold steady
Figure 3.1: Effects of household size on energy useNote: One-person household = 100Source: Fawcett et al (2000), based on analysis of EHCS 1996 data
Table 3.2: Projected UK household numbers, 2050
% Change inHousehold household
Household Population numbers numbers,Year size (people) (000) (000) 1996-20501996 2.43 58,139 23,926 –2002 2.31 59,232 25,641 –2050 (household size falls 1.9 66,800 35,158 46.9to current Swedish level)2050 (household size 2.31 66,800 28,918 20.1stabilises at current level)2050 (40% House scenario) 2.1 66,800 31,810 33.02050 (Local Stewardship scenario) 2.6 55,000 21,154 -11.6
Sources: population figures – NS (2004a); household size estimates – NS (2004b); LS scenario - UKCIP (2000)

29 Chapter 3: Households and living space
at its current level of around 2.3, this wouldrepresent a 20% rise in household numbers by2050 (Table 3.2). The Local Stewardship scenarioassumes an average household size that stabilisesat 2.6 by the 2020s (UKCIP 2000), giving 21.2million households by 2050. Although this wasthe average household size in the UK as recentlyas 1985 (GHS 2002), it was thought unlikely thatthere will be a return to this level. A conservativeapproach was adopted for the 40% Housescenario, stabilising household size at 2.1 by 2020.This allows for some continuation of thedownward trend but stops short of the Swedishfigure.
Under the 40% House scenario there is asubstantial increase of 33% in the number ofdwellings needed, over and above the number in1996, which would give rise to a 33% increase incarbon emissions, all other things being equal.The table also demonstrates the huge differencein projected housing demands between the LocalStewardship and 40% House scenarios: the latterhas an additional 10.7m homes, accommodating11.8m more people, living in households with 0.5fewer inhabitants on average.
The relationship between new households,replacements, new construction and house pricesis complex, particularly when regional issues areincluded. Currently, most new housing is for newhousehold formation; very little replaces old
stock. The recent Treasury review of housingproposes 242,000 new starts per year in Englandin order to reduce annual house price inflationfrom 2.4% to 1.8%, whilst building extra socialhousing and meeting the backlog of need,although no time horizon is given (Barker 2004).Building on this scale has occurred before – thepeak was in 1968, when over 425,000 new homeswere built in the UK (ODPM live table 241). This isconsiderably higher than the figures proposedunder the 40% House scenario.
3.3 Living space The amount of living space has implications forthe energy required to heat (or cool) the spaceand the number and size of appliances that canfit into the dwelling. On average, personal livingspace has risen primarily because of dwindlingnumbers of people per household – from 38 m2
per person in 1991 to 43 m2 in 1996 and 44 m2 in2001 (ODPM 2003a). Table 3.3 indicates the rangeof personal living space, from single retiredpeople to those in large households.
When they can afford to, people tend to buythemselves more living space: among singlepeople in the private sector who moved housebetween 1996 and 2001, the highest earnersbought or rented accommodation that was 17 m2
larger on average than that for the lowest
Table 3.3: Average floor space by household size and category, England, 2001 (m2/person)
1 person 2 people 3 people 4 people 5+people AllOwner-occupied 77 48 33 27 21 46RSL* 54 31 24 19 15 36Couple + dependent – – 31 26 20 26child(ren)Couple aged 60 + – 48 34 27 20 461 person under 60 65 – – – – 651 person aged 60+ 71 – – – – 71All 69 44 31 25 20 44
* Registered Social LandlordSource: ODPM (2003a)

30 Chapter 3: Households and living space
earners. For households of four or more, thedifference was still 11 m2 per person (ODPM2003a).This supports the contention that ‘demandfor small dwellings will generally be restricted tothose on low incomes, including many first-timebuyers … and the elderly trading down from afamily home’ (HBF 2003).
3.3.1 Under-occupancy and fuel povertyMuch of the current housing stock is able toaccommodate larger households (ie more people)than it does at present, because of under-occupation. It is estimated that 36% of all Englishhouseholds (45% of owner-occupiers) have two ormore rooms above the ‘bedroom standard’ (ODPM2004d). Under-occupancy is of course notnecessarily a problem for individuals, although itdoes drive up the demand for space and spaceheating per person. However, it is a factor incausing and compounding fuel poverty.Approximately 29% of fuel poor households inEngland surveyed for the 1996 EHCS were under-occupying by two or more bedrooms above thestandard, while 65% (4.5m) were under-occupyingby one or more bedrooms above standard. Theyconsisted predominantly of single householdersover 60, couples over 60 and single adults under60 (Houghton and Bown 2003). There wouldseem to be a clear case for building moreattractive, efficient and relatively small-scalehousing, to provide a range of alternatives forthose who are in fuel poverty living in largeproperties (often a family home that they arereluctant to leave).
The median floor area of those in severe fuelpoverty was 102 m2 in 1998, whereas the majorityof the population spending 10% or less of theirincome on fuel – those free from fuel poverty –had the use of 82 m2 per household (DTI 2002b).Households in the lowest income quintile cannormally only stay out of fuel poverty if they livein the smallest and most energy-efficient housing– under 63 m2 with a SAP of 60+ (DETR 2000).Larger homes need a higher SAP in order toprovide affordable warmth.
Where should standards be set, in order to bespacious enough to appeal to elderly people andsmall enough to heat effectively on a pension?The Housing Corporation gives 40-45m2 as‘typical’ for a new 1-bedroom dwelling and 72.5 m2
for a ‘2.5-bedroom’ dwelling (HC 2002). The formermay be too small to appeal to most elderly people(Appleton 2002). An average living space of 74m2
(35.2 m2 per person) is assumed for the 40%House scenario for all dwellings built betweennow and 2050.
3.3.2 Overcrowding The ODPM estimate that 2.4% of the Englishhousing stock is overcrowded (ODPM, 2004d) –around 492,000 dwellings – with the highestpercentage in London (6.1%). As withhomelessness (Section 3.4.1), the problem relatesto social and economic factors such as high rentsand employment opportunities.
3.3.3 Teleworking and home-workingHome-working could potentially increase thedemand for space, with a requirement for a homeoffice, as well as resulting in higher use andownership of home office and other equipment.The number of teleworkers has been rising rapidlyin recent years, being estimated in 2001 at 2.2million, of whom approximately one-third workpart-time (Hotopp 2002). However, the estimatedextra consumption was not thought significantenough to include in the model.
3.4 Number of dwellingsThe number of dwellings in the UK exceeds thenumber of households by around 3% because ofthe existence of second homes and long-termvacant dwellings. This is balanced out to someextent by the fact that around 1.5% of thepopulation live in communal establishments.
3.4.1 Homelessness and vacant dwellingsHomelessness is a social, economic and locationissue, rather than one of actual housing space. In2004 there were approximately 300,000 homes

31 Chapter 3: Households and living space
in England that had been vacant for six months ormore – roughly 1.5% of the housing stock – andaround three times as many as the (rising)number of homeless households beingaccommodated temporarily by local authorities(ODPM 2004e).
The Housing Act of 2004 allows councils toapply to make Empty Homes Management Orderson long-term empty properties. The owner retainslegal ownership and will be entitled to rentalincome generated by letting the property, afterdeduction of relevant costs such as renovation(UK Government 2004). This provides anopportunity to reduce homelessness and improveenergy efficiency, in a housing stock wherebetween a quarter and a third of homes areestimated to be ‘non-decent’ – that is, they arenot wind and weather-tight, warm and withmodern facilities (ODPM 2004b).
3.4.2 Second homesUK household statistics – and references tohousehold data used in this report – relate tooccupied dwellings unless otherwise stated. The
figure for English households with a second homein Great Britain (not counting those held as aninvestment and rented out) has risen by 37,000since 1993-94 to 228,000 (ODPM 2004d). Thefigure for the UK is therefore around 1% of thetotal housing stock, giving a total for vacant andsecond homes of 2.5%. This has implications interms of duplication of appliances and heatingsystems, and how much they are in use when adwelling is unoccupied. The impact of secondhomes in the UK on residential energy use is notgreat at present – and is not modelled – but thetrend needs watching.
3.5 ConclusionsPopulation and household size are importantfactors in determining residential energy demand.Other important policy considerations relate to anageing population, under-occupancy and regionalplanning. By exploring the current and projectedtrends, the following assumptions have beenmade for the 40% House scenario:• A population projection of 66.8 million by 2050.
This represents a mid-range estimate.• An average household size of 2.1, giving 31.8
million households by 2050. This assumes aslight trend downward, but does not go as lowas the lowest figures for some Europeancountries today.
• An average living space of 74m2 per dwelling inthese new homes by 2050.
• Almost 70% of the expected rise in householdnumbers in England between 1996-2016 isattributed to single-person households, half ofwhom are likely to be pensioners.
• By 2060, Government projections give a figureof 17 million pensioners, making up 25% of thepopulation and potentially a much higherproportion of households.
Of the 31.8 millionhouseholds in 2050, 10million of them will benew

32 Chapter 4: Thermal comfort and control
Overall demand for space heating as a service hasgrown over the past three decades. Improvedefficiency compensated for higher internaltemperatures, higher levels of central heating andthe heating of a larger part of the home, so thatenergy consumption per household remainedmore or less stable; but growth in householdnumbers meant that total energy demand forspace heating rose by 36% between 1970 and2001 (DTI 2004c). This chapter sets out some keyconsiderations related to comfort and energy, inthe present and for the future, setting the contextfor the discussion of the building fabric and lowcarbon heating options in later chapters.
4.1 Comfort, health and climateIn physiological terms, thermal comfort is whatwe experience when the body functions well,with a core temperature of around 37°C and skintemperature of 32-33°C. There are many ways ofmaintaining these body temperatures in a widerange of climates and this has been the case forcenturies. If it were not so, large parts of theglobe would be uninhabited. In the UK climate,comfort is a major consideration whenconsidering the future demand for space heatingand cooling, and the ways in which this can bemet. There are interactions between climate,behaviour, building design and heating, coolingand insulation technologies.
The immediate challenge is to raise the level ofenergy efficiency in housing so that indoorwarmth is sufficient for health and well-being inwinter – ensuring that all households areadequately and affordably heated is a priority ofcurrent UK energy policy. As well as raisingcomfort levels, improving the energy efficiency ofthe housing stock provides cost, health andenvironmental benefits, both for individuals andsociety at large. The significant improvementsrequired in the UK housing stock represent anopportunity to maximise these benefits for all.Once a safe level of thermal comfort for healthhas been reached, personal preferences will affectthe extent to which improvements in residential
energy efficiency are realised as energy savings, orlost because people live in larger homes, heat alarger proportion of their homes, and/or turn uptheir thermostats. Personal comfort preferences,and the technologies available for meeting them,will also determine how much the demand forartificial cooling is likely to grow between nowand 2050, particularly given rising temperaturesdue to climate change.
4.1.1 Climate changeThe United Kingdom Climate Impacts Programmehas modelled four scenarios for future climatechange (UKCIP 2002). A study of the potentialimpacts of climate change on human healthnotes the trend towards higher temperatures inall four scenarios and calculates that, withoutadaptation, there could be a rise to 2,800 heat-related deaths per year by the 2050s under amedium-high climate change scenario(Donaldson et al 2001). These would beaccompanied by a fall in cold-related deaths inmilder winters (assuming no disruption of theGulf Stream), but are clearly a cause for concern.During the 2003 heat wave, it is estimated thatapproximately 2,000 excess deaths were causedin the UK (NS 2003b). Deaths peaked on the dayafter the highest temperatures were recorded.The elderly are most at risk from overheating, asfrom cold; and the highest risk is for those wholive on their own (DEFRA 2004b, Rau 2004).
4.1.2 Policy approaches to comfortComfort is a complex issue which raises a numberof policy considerations. Comfort conditions ingeneral are socially influenced and may changewith time as design, activity, technology andclothing fashions change (Shove 2003). However,the main question addressed here is the extent towhich thermal comfort should be addressed byengineered solutions to the problem ofmaintaining a defined optimum temperaturerange in winter and summer (Fanger 1970, CIBSE1999). This is a common approach in officebuildings and could spread to homes.
Thermal comfort and control

The main alternative to this approach is toconcentrate on getting the materials, design,location and shading of the building as suitableas possible for likely future climate conditions,while leaving it possible for residents to makethemselves comfortable by adaptation that doesnot involve energy-intensive engineeredsolutions: shedding or adding clothes, alteringthermostats, opening or closing doors andwindows and being more or less active (Nicol andHumphreys 2002).
Decisions on the best course of action willdepend on a number of factors, not least whethera building is being designed from scratch oradapted. Design of new buildings offers far moreoptions for the use of natural ventilation, highquality insulation, high thermal mass and shadingin order to avoid thermal discomfort.
4.2 Heating People are normally sedentary for around two-thirds of their time at home (provided they arenot immobile through disability), regardless oftheir age, or how much of each day they spend inthe home (Boardman 1985). The World HealthOrganisation (WHO) recommends temperaturesof 21°C for the main living area and 18°C for therest of the home. The values recorded for livingareas in the UK have so far been lower than this,although they are increasing. Winter conditions in1986 and 1996 were comparable, and recordedtemperatures in England show that living roomswere on average 0.9°C warmer in 1996, whilsthallways were 1.6°C warmer (DETR 2000).
4.2.1 UnderheatingThe 1996 English House Condition Survey (EHCS),using spot temperatures, found that 6.9 millionhomes (28%) had living rooms at or below 16°C,and 10.9 million (44%) had cold hallways (Table4.1). Although around 80% of those interviewedclaimed that they were satisfied with their hometemperatures, the data show that many were
33 Chapter 4: Thermal comfort and control
Table 4.1: Temperatures in homes and health effects, England. 1996
Halls/stairs Indoor Living rooms at at these temperature these temperatures temperatures(°C) Assumptions of physiological effect (million) (million)24+ Risk of strokes and heart attacks 0.4 0.321-24 Increasing discomfort 3.5 2.118-21 Comfortable temperatures 8.8 6.316-18 Discomfort, small health risk 4.1 4.612-16 Risk of respiratory diseases 2.5 4.79-12 Risk of strokes, heart attacks 0.2 0.9< 9 Risk of hypothermia 0.1 0.7
Unhealthily cold (<12°C) 2.8 6.3Total cold homes (<16°C) 6.9 10.9
Source: Richard Moore, pers. comm. Note: Outside temperature 5°C or below
The 2003 heatwave wasgood for some – butcaused 2,000 excessdeaths in the UK

34 Chapter 4: Thermal comfort and control
living at temperatures that are associated withphysiological discomfort and danger to health(DETR 2000). The national temperature survey hassince been dropped from the EHCS, but it isimportant that this is reinstated if progresstowards warmer, healthy homes is to bemonitored and confirmed.
Mortality in the UK rises on either side of anoutdoor temperature of approximately 16-19°C(Donaldson et al 2001). Low temperatures are themost hazardous to health, with England andWales having excess mortality of 23,500 duringthe winter of December 2003 – March 2004 (NS2004c). This was a relatively low figure: theaverage for the previous eight years was 35,220.The UK has one of the highest levels of excesswinter mortality in northern Europe and housingconditions are a contributory factor (Boardman1991, Wilkinson et al 2001). Elderly people spend ahigher proportion of their lives at home, so theyneed to be able to afford to heat it for longerhours. They are more likely to suffer from ‘coldstrain’ than the young, so that even short periodsof cold stress may damage their cardiovascularand respiratory systems (Healy and Clinch 2002).
An evaluation of the Warm Front/HEESprogramme, the main initiative to lessen fuelpoverty in vulnerable households for owner-occupied and privately rented housing, showsthat temperatures in the homes of the fuel poorare now rising, although those in extreme fuelpoverty are not gaining much as yet (Sefton2004). There is therefore still a large hiddendemand for heating and many people are still atrisk of death or disease, as well as enduringdiscomfort and distress from cold homes inwinter.
4.2.2 Comfort factorsThe percentage of potential energy savings thatare taken as improved comfort is known as the‘comfort factor’. This has to be taken into accountwhen estimating the effect of improvements tothe housing stock. ‘Warm Front’ allows for up to75% of theoretical savings to be taken as comfort.
The comfort factor in the Energy EfficiencyStandards of Performance (EESoP) programme ofefficiency improvements was found to be 55% for‘disadvantaged’ customers (Henderson et al2003). The best general estimate available is that80% of potential energy savings from efficiencyimprovements in housing will be taken as savings,once the average temperature has risen above19°C, with only 20% of the potential savings takenin the form of further energy consumption or‘takeback’ (Milne and Boardman 2000).
4.2.3 Model assumptions – heating Under the 40% House scenario it is assumed thatthere will be adequate, affordable heating for allin line with the Government’s legal obligation toeliminate fuel poverty by 2016. In the short term,there may be a further increase in emissions if thefuel poor become able to achieve higher indoortemperatures through higher incomes or benefits.This will be more easily achieved, with less of anenergy penalty, as homes become more efficientand better at retaining heat.
Whilst the requirement to meet basicphysiological needs and to do away with fuelpoverty can be addressed in a relativelystraightforward way, it remains difficult todescribe, evaluate and prescribe for thermalcomfort, or to predict the temperature beyondwhich all efficiency gains will be taken as energysavings. The 40% House scenario assumes 24-hour averages of 21°C for the living room and18°C for the rest of the dwelling in line with WHOrecommendations. These are on the high side forall-day averages, but allow for higher living roomtemperatures than 21°C for the elderly during thedaytime, along with factors such as the use ofbedrooms for homework.
4.3 CoolingAdequate heating is the main issue in the shortterm, but cooling is likely to become anincreasingly important issue over the comingyears with rising global temperatures. Therefore,at the same time as improving the energy

35 Chapter 4: Thermal comfort and control
efficiency of the housing stock, it is essential thatcooling needs are taken into account in design,construction and refurbishment to avoid intensiveenergy demand for cooling in the future. Some ofthe solutions will overlap – for example, improvedinsulation is also important for keeping homescooler in summer, especially in attic rooms.
It is estimated that 70-90% of energy decisionsare made at the ‘concept’ stage of a building,which will go on to affect the behaviour of thepeople who use it (Chappells and Shove 2004).The commercial pressure to design for air-conditioning can be powerful, bringing moreenergy-intensive behavioural change in its wake:during the 1950s, the USA summer ‘comfort zone’became cooler than the winter comfort zone of20.5-26.7°C, as people became able to controlindoor temperatures and wanted to achieve acontrast with the weather outside (Ackermann2002). Eighty-three percent of US homes are nowair-conditioned (Ackermann 2002) and sales of airconditioning are rising in the UK, especiallyduring heat waves. Cooling existing buildingsduring heat waves, especially in dense urban
developments, is likely to pose a challengewithout air-conditioning, although there is scopefor retrofitting with shading and shutters. Thiscould be grant-aided, just as heating efficiencymeasures are now.
Although the use of air-conditioning in the UKis modest at present, ownership could rise steeplyif temperatures were a few degrees higher and ifpeople were to be in a position to switch on air-conditioning rather than using other methods tokeep cool. Outdoor summer temperatures in thesouth of the UK are now occasionally close to theAmerican threshold for air-conditioning(Levermore et al 2004), although Europeanhouseholders show less inclination to purchaseair-conditioning at a given outdoor temperaturethan those in the USA. This is partly because ofthe higher average thermal mass of dwellingsand differences in humidity. Southern Europeanhousing designs are therefore likely to providebetter models for housing in a warmer UK thanthose from America.
There is a danger that climate change willcontribute to continued growth of a market for
Shading over windowscould reduce the need for energy intensive air-conditioning units

36 Chapter 4: Thermal comfort and control
air-conditioning, resulting in a destructivepositive-feedback cycle of hot summers thatincrease a demand for fossil-fuel-based coolingsystems. The cooling demand sub-model of theUKDCM looked at the possible effects of climatechange on demand for air-cooling. Even under alow carbon emissions scenario, it showed asubstantial rise in the number of ‘cooling degreedays’ (CDD, that is, equivalent days above a basemean temperature of 18.3°C), rising to 193 CDDsfor Heathrow in 2050, with comparable figures forEdinburgh and Manchester at 29 and 66. Such anincrease in temperatures in the south of Englandcould lead to 29% of homes there having someair-conditioning by 2050 – and as many as 42%under a high-emissions scenario – if other factorssuch as fuel prices, affluence, buildingconstruction type and sunlight intensity werecomparable with the USA, and if policy operatedon a World Markets-type scenario.
4.3.1 Model assumptions – coolingThe 40% House scenario does not include any air-conditioning but allows for some cooling, forexample in hard-to-cool dwellings (mostly high-density, highly-glazed flats). This might bethrough absorption cooling from a district chillingnetwork (using the heat from CHP), or heatpumps circulating cold water (or cold air) duringthe summer.
4.4 Water heatingHot water demand has not been dealt with indetail in the UKDCM, but some basic assumptionshave been made for modelling purposes.Although demand for hot water per householdhas risen in recent years, it is assumed to stabiliseat the current level under the 40% Housescenario. This is mainly due to a decrease in theuse of water from the home’s central water-heating system as more people adoptdishwashers and cold-fill washing machines, withthe trend towards colder washes. This, along withthe replacement of bathing by showering, isestimated to compensate for increased use of hot
water for additional, or more high-powered,showers. Figures for water heating energyconsumption are given in Chapter 5, while theenergy required is covered in Chapter 7.
4.5 Other policy considerationsOther factors which influence energy demand forheating and cooling need to be taken intoaccount when developing a policy approach toensure that maximum savings are achieved.
4.5.1 Controls and consumption feedbackPredictions of energy use tend to suffer fromover-reliance on an assumption that the publicuse control devices in the way that the designersintended. Eighty-eight percent of UK householdshad some form of programmed heating by thetime of the 1996 EHCS, yet many householdersstill do not fully understand how to operate theircontrols, with many preferring to use them as on-off switches whether or not they are designed tobe used in that way (Pett and Guertler 2004).There is a clear need for simpler, more user-friendly controls if householders are to be able touse timers and thermostats to best effect. Digitalwall thermometers, which warn the householderwhen the temperature is too hot or cold forhealth, would also be useful as standardinstallations.
More accessible metering and informative billscan both help with user understanding andcontrol of their heating: better direct feedbackthrough meter-reading or direct displays can givesavings of the order of 10%, while informativebills can produce savings of 5-10% or more,especially if feedback is incorporated into adviceprogrammes (Darby 2001).
4.5.2 Training and infrastructure for comfortTightly controlled comfort conditions are morecommon in offices and public buildings than inhomes, but conditions in the workplace are likelyto affect what people do when they return home– for example, altering the thermostat in order tostay comfortable in the same clothes as they wear

37 Chapter 4: Thermal comfort and control
at work. It is going to be important to traindesigners, engineers, architects and building usersin low-energy methods of controllingtemperature in order to achieve comfort, whetherin public or residential buildings.
Shading and thermal mass are going tobecome increasingly important considerations inbuilding design and refurbishment, whilst air-conditioning and electrical fans are likely tobecome significant energy end-uses under‘business as usual’ assumptions. Convergence ona high-energy controlled indoor environment isnot inevitable, though. There is still plenty ofscope to extend traditional, low-energy forms ofcooling and to educate for an approach thatconcentrates on imaginative use of buildingdesign and low and zero carbon technologies tominimise heat gain during the summer andnatural ventilation, along with the use of blinds,shutters and other forms of shading. Some of thisexpertise would then be usable in providing cool
buildings through environmentally-sympatheticsystems (Chappells and Shove 2004). Grants fromschemes such as the Energy EfficiencyCommitment could be used to provide summershading and two-way heat pumps.
4.6 ConclusionsComfort is a concept that goes beyond healthneeds to personal preferences. There is stillconsiderable unmet need for warmth for the fuelpoor in winter, while a warming climate poses thequestion of how best to achieve cooling insummer. Policy needs to be geared towardsdesign for high thermal mass, high insulationvalues and the use of shading and naturalventilation wherever possible, rather than energy-intensive solutions; and better controls and use offeedback are advocated as a way of improvinghouseholders’ control over their own comfortlevels while reducing consumption. There is anurgent need for training in the use of techniquesto minimise energy use for cooling during hotspells, which are likely to become increasinglyimportant in the future. The approach andtechnologies for achieving improved comfortlevels are discussed in detail in the followingchapters.
In terms of the 40% House scenario, thefollowing assumptions were made:• There will be adequate, affordable heating for
all in line with the Government’s legalobligation to achieve affordable warmth by2016.
• Beyond 2020, there will be average all-daytemperatures of 21°C in the main living areaand 18°C in the rest of the dwelling.
• Cooling demand is met by design for naturalventilation and shading and/or low and zerocarbon technologies.
• The quantity of hot water per householdremains stable.
The 40% House scenarioassumes adequatewarmth for all, with anaverage living roomtemperature of 21°C

38 Chapter 5: Building fabric and housing stock
This chapter considers the state of the existing UKhousing stock and the options for improving theenergy efficiency of dwellings to provideappropriate levels of comfort whilst minimisingenergy consumption. The role of the buildingfabric in achieving the 60% target is discussed,along with a consideration of the levels ofrefurbishment, construction and demolition thatare required, whilst ensuring social and politicalacceptability. Policy options forming part of amarket transformation strategy for the housingstock are introduced.
Results from the UKDCM show that the 60%reduction target can only be met if there is a step-change in the quality of the fabric of the housingstock. Demolition and construction rates bothneed to rise; the average energy consumption ofthe existing stock needs to be brought up to a SAP(Standard Assessment Procedure) rating of 80,and all new homes need to achieve close to zerospace heating demand from 2020 at the latest.
5.1 ContextThere were 25 million homes in the UK in 2003,making up one of the oldest and least efficienthousing stocks in Europe. The poor quality of thebuilding fabric across the whole stock means thatspace heating accounts for roughly 60% of totaldelivered residential energy demand (Shorrockand Utley 2003). Some 2 million homes in Englandare rated with a SAP score of below 30 (ODPM2003a), representing a very low efficiencystandard. In contrast, a handful of pioneeringhousing developments have been designed andbuilt to achieve zero space heating demand.
Improvements through a range of cost-effective energy efficiency measures are currentlypromoted in a variety of Governmentprogrammes, and heat loss standards for newhomes have become progressively tighter in theregular cycle of revisions to the BuildingRegulations. The net effect on the UK housingstock has been a 1% annual drop in fabric heatloss from UK homes between 1970 and 2001(Figure 1.2).
However, current policies are inadequate to thescale and urgency of the task. Existing grants andadvice programmes promoting cost-effectiveenergy efficiency measures are planned toachieve 2020 targets (DEFRA 2004a) but the sameset of measures cannot deliver enough additionalsavings beyond 2020. The Building Regulations setstandards for new construction which, thoughthey get tighter with each five-yearly revision, falla long way short of the low or zero space heatingenergy demand of the best current practice usingexisting technology. There is a poor record ofcompliance with the design standards and adearth of data on real-life performance of newhomes.
5.2 Heat losses and gains in buildingsHeat is lost from buildings through the fabric ofthe building itself (roof, walls, floor, windows anddoors) and through infiltration of cold air via anyholes and gaps. Fabric heat loss can be sloweddown with insulation materials, the performanceof which is a function of the material used, itsthickness and a number of other factors to dowith how well the insulation is installed: gaps ininsulation quickly compromise performance, forexample. Ventilation heat loss can only bereduced by minimising infiltration of cold air:construction needs to be airtight, with controlledventilation supplying adequate fresh air, possiblywith a heat recovery system to reduce the heatloss even further. Airtight construction requiresgood design and close attention to detail duringconstruction. As insulation standards haveimproved in the UK for new construction, theissue of ventilation heat loss has becomerelatively more significant (ODPM 2004h).
Buildings also gain heat – from sunshinecoming through windows, from body warmth,from hot water in pipes and storage tanks, andfrom the heat given off by lights and appliances.In a building where the total heat loss is kept to aminimum, these incidental gains contribute moreof the heating.
Building fabric and housing stock

5.3 Current picture The main challenge in working towards a 60%reduction in carbon emissions from theresidential sector is the poor state of the existinghousing stock.
5.3.1 Stock profileNational statistics on energy in housing use theStandard Assessment Procedure (SAP), whichgives a score of up to 120 – the higher thenumber, the better the rating (recalibration underSAP 2005 will give a top score of 100). SAP isbased on the thermal performance of a building,its heating appliances and the energy prices fordifferent heating fuels used. SAP 2005 will takemore account of carbon emissions.
The average SAP rating in England in 2001 was51 (Figure 5.1). Almost 2 million homes have a SAPrating below 30 (ODPM 2003a). A transformationof the housing stock to a target SAP rating of 70would reduce CO2 emissions by 34.5% (DETR2000). Such a transformation of the stock wouldbe an enormous challenge but would still notprovide enough savings in space heating demandto make the overall 60% carbon reductionachievable.
5.3.2 Refurbishment opportunitiesThe distinction between old and new housing iscrucial to the overall performance of the stock, asthere are practical limits to what can be done toimprove a building. Energy efficiency is mucheasier to achieve when it is incorporated at thedesign stage in new build, rather than as arefurbishment. However, since many of theexisting dwellings will still be standing in 2050,refurbishment will be a necessary part ofimproving the energy efficiency of the stock.
Options for refurbishment range from easy,cost-effective measures to more expensive anddisruptive solutions. Although a certain numberof measures have already been installed in theexisting stock, there is still substantialopportunity for further improvement.
In 2003 there were an estimated 17 millionhomes with cavity walls, of which 11 million wereuninsulated (DEFRA 2004a). Cavity wall insulationis one of several cost-effective measuressupported by the Energy Efficiency Commitment(EEC) and Warm Front grant schemes. Another 7million dwellings have solid walls, almost all ofwhich are uninsulated, as solid wall insulation is acostly, disruptive measure resulting in slightlyreduced room sizes (if the wall is insulated on theinside) or a changed façade (if the insulation isclad on the outside). A future technicalbreakthrough may lead to the development of anew insulation product without these drawbacks,but has not been assumed here.
Most homes with a loft have some loftinsulation, although the commonest thickness of100mm is well below the current recommended
39 Chapter 5: Building fabric and housing stock
Figure 5.1: English housing tenure by SAP rating, 2001Source: ODPM (2003a)
15% of solid walls will beinsulated by 2050

40 Chapter 5: Building fabric and housing stock
level, and performance may frequently becompromised through compaction due to thestorage of heavy items directly on top of theinsulation material. Loft insulation is a cost-effective measure, causing minimal disruption,and is also supported by grants under EEC andWarm Front.
Solid ground floors can be insulated duringconstruction, with the insulation under a slab ofpoured concrete. In refurbishment, the floorwould need to be excavated and re-laid to achievecomparable performance. Suspended timberfloors can be insulated more easily as arefurbishment measure, typically to the depth ofthe floor joists, although deeper insulation can beinstalled on hangers fixed to the joists wherethere is sufficient space below the floor. There areno data on floor insulation or the proportion ofsolid versus suspended timber floors in publishedhousing statistics, and so the potential for uptakein older dwellings is unknown.
The performance of glazing has increasedconsiderably in recent years with multiple panes(double-, triple- and quadruple-glazing), lowemissivity coatings, inert gas fills between thepanes, and improved seals and frame designs.Whole window replacements are regulated by theBuilding Regulations, although compliance isreported to be low (EAC 2005). Replacementglazing is a home improvement that improvessecurity and sound-proofing, as well as energyefficiency, and the market is already mature.
5.3.3 Demolition and construction ratesCurrent levels of construction are relatively low,with around 167,000 housing starts in the UK in2002-3. Demolition rates are also low – between1996-2004, a total of nearly 160,000 dwellingswere demolished, approaching 20,000 a year.Continuing at these rates means that the averagehouse will last for over 1000 years – clearly anunrealistic scenario.
Historically, the highest level of demolitionoccurred between 1961-75, when the annual ratewas just over 81,000 pa in GB, the majority being
defined as unfit. Only 20% of those demolishedbetween 1996-2004 were considered to be unfit(EHCS 2001), indicating a shift in the criteria usedto decide which properties are removed from thestock.
5.3.4 Decent homesA third of dwellings in England are acknowledgedto be ‘non-decent’ – unhealthy, in disrepair, inneed of modernisation or providing insufficientthermal comfort, with 80% of these failing thecomfort criterion (ODPM, 2003a). Current policyon decent homes sets a basic standard and atimetable for implementation. Homes should befree from serious disrepair, structurally stable, freefrom damp, have adequate light, heat andventilation. All social housing should be up tostandard by 2010; for vulnerable private-sectorhouseholds, 65% are to reach the standard by2006 and 70% by 2010.
There are useful policies and programmes toaddress fuel poverty and market transformation,such as the Energy Efficiency Commitment, WarmFront and Decent Homes, but these areinadequate, not linked to each other and theireffect is limited in relation to the scale andurgency of the challenge.
The policies needed to achieve 60% reductionsin residential carbon emissions can also deliverdecent homes to the most vulnerable in society.
5.4 40% House scenarioBy 2050, 31.8 million dwellings will be needed tomeet the growth in population (Chapter 3). Thisrepresents a net increase of 7.9 million homes(33%) from 1996. The stock increased by 1.1 millionbetween 1996 and 2004, leaving 6.8 million tobuild between 2005 and 2050. Under the 40%House scenario this has been achieved throughthe construction of 10 million new homes anddemolition of 3.2 million existing homes (Table5.1). In other words, over two-thirds of the 2050housing stock has already been built, highlightingthe importance of refurbishment of thesedwellings. The total space heating energy

41 Chapter 5: Building fabric and housing stock
demand in 2050 is reduced by 38% compared to1996 levels, despite a 33% increase in the numberof households.
The demolition rate is assumed to rise fromcurrent levels until it reaches 80,000 per annumin 2016, after which time it remains constant. Thisrepresents an increase from 0.1% of the stock nowto 0.25% of the housing stock in 2050. Continuingat this rate means that it will take 400 years toreplace the 2050 stock of houses. The averageannual construction rate is assumed to be220,000 completions per annum between 2005and 2050.
5.4.1 Space heating demandThe energy efficiency of the fabric of the
housing stock in 2050 is a function of the energyefficiency improvements made to existing homes,the number of existing homes demolished andthe quality of the new homes built. In the 40%House scenario, the average net space heatingdemand across the whole stock in 2050 is 6,800kWh/year. For homes built before 1996, theaverage net space heat demand in 2050 is 9,000kWh/year (after energy efficiency improvementsand incidental heat gains) – a 38% reductioncompared to 1996 levels. For homes built after1996, the average net space heating demand is2,000 kWh pa (Figure 5.2).
5.4.2 Refurbishment of existing stockTo achieve a 38% reduction in the average spaceheating demand of the existing stock, a high levelof refurbishment has been assumed. This wasconsidered a preferable option (even whereexpensive and disruptive) compared to higherlevels of demolition (potentially more expensiveand disruptive) in order to realise the necessarylevels of energy efficiency.
Under the 40% House scenario, energyefficiency improvements to the existing stock aremodelled, with average uptake rates andinsulation levels for each decade. Values for 1996and 2050 are given in Table 5.2. It is assumed thatthere is a considerable market in replacementdouble-glazing, so that all windows in 2050 have
Table 5.1: Housing stock assumptions, 40% House scenario, 1996 and 2050
40% HouseBase year scenario1996 2050
Total number of dwellings 23,900,000 31,800,000New build 1996 – 2004 1,280,000Demolition 1996 – 2004 160,000Homes already built and remaining in 2050 21,800,000Homes demolished 2005 to 2050 3,200,000New homes built from 2005 to 2050 10,000,000Heat demand for space heating per 14,600 9,000dwelling built pre-1996 (kWh delivered energy)Heat demand for space heating per 2,000dwelling built post-1996 (kWh delivered energy)Total space heating demand (TWh 348 216delivered energy)Energy saving from fabric measures 148(TWh delivered energy)Average heat demand for hot water 5,000 3,400*per dwelling (kWh delivered energy)Total water heating demand (TWh 120 108*delivered energy)Total space and water heating demand 468 324*(TWh delivered energy)Energy saving from all space and water 144*measures (TWh delivered energy)
Source: UKCDM* net of solar hot water
Figure 5.2: Net space heating energy demand, existing stock and new-buildto 2050Source: UKDCM

42 Chapter 5: Building fabric and housing stock
a U value of 0.8 W/m2K. Solid wall insulation isassumed to reach 15% uptake by 2050, with a Uvalue of 0.25 W/m2K for work done between 2030and 2050. From 2030 onwards, many cavity-walled dwellings will have external cladding inaddition to filled cavities, so that 35% of thisdwelling type has a wall U value of 0.25 W/m2K by2050. All lofts are assumed to be insulated by2050 with a U value in 2050 of 0.15 W/m2K,equivalent to about 300 mm of insulation(dwellings with no roof above or a flat roof are
not insulated). Although technically feasible, noretro-fit floor insulation is modelled, erring on theside of extreme caution in the absence of reliabledata. The U value for floors varies with the age ofthe dwelling.
The 40% House scenario assumes no loss ofarchitectural heritage in conservation areas (1.2million dwellings) or listed buildings (300,000dwellings). Internal measures that do not alterthe appearance of valuable interiors arepermitted (eg loft insulation), but solid walls,doors and windows are assumed to remainuntouched by energy efficiency improvements inthese dwellings.
5.4.3 Performance of new homesAll new homes built to 2050 are assumed to be ofa high efficiency standard, based ondemonstrated design and technology already inexistence (Table 5.3). The average net spaceheating demand of 2,000 kWh pa across all newhomes built since 1996 incorporates a range ofefficiencies, gradually improving to 2020 whenthe standard for space heating energy demand innew housing is assumed to be close to zero,depending on the availability of solar gains. Siteconditions (eg shading of sunlight) may meanthat zero is not always achieved but demand forspace heating will still be low.
Table 5.2: Refurbishment measures, 40% House scenario, 1996 and 2050
Efficiency measure U value 1996 U value 2050 Uptake by W/m2K W/m2K 2050
Cavity wall insulation 0.4 0.25 100%Solid wall insulation 0.5 0.25 15%Loft insulation 0.6 0.15 100%Floor insulation Varies with Varies with 0%
dwelling age dwelling ageGlazing 3.3 0.8 100%Doors 3.5 2.0 100%
Air changes Air changes per hour, 1996 per hour, 2050
Ventilation 3.5 0.6
Source: UKDCM
Table 5.3: Performance standard of new housing, 40% House scenario
Rate of heat loss (U value, W/m2K)1997- 2005- 2010- 2020- 2030- 2040-
Source of fabric heat loss 2004 2009 2019 2029 2039 2050walls 0.35 0.3 0.2 0.1 0.1 0.1roof 0.24 0.15 0.1 0.1 0.1 0.1floor 0.35 0.2 0.15 0.1 0.1 0.1glazing 2.2 2.0 1.5 0.8 0.8 0.8doors 2.5 2.0 2.0 2.0 2.0 2.0Ventilation heat loss (air changes 2.0 1.5 0.6 0.6 0.6 0.6per hour)
Source: UKDCM

43 Chapter 5: Building fabric and housing stock
5.5 Housing renewalAside from improving the efficiency of thehousing stock, the building of 10 million housesand demolition of 3.2 million by 2050 raises anumber of other issues around design, locationand the amount of energy and waste involved inthis level of housing renewal.
5.5.1 Energy in construction and demolition processesConstruction and demolition processes all useenergy, but the amount is relatively smallcompared to the energy consumption in the useof buildings. When an old, inefficient building isreplaced with a new, efficient one, the embodiedenergy in the construction process will be offsetwithin a few years by the lower energyconsumption of the more efficient building inoccupation: thereafter, the more efficient buildingwill represent savings throughout its lifetime(Matsumoto 1999, XCO2 2002).
While the priority is clearly to reduce energy inuse, there are significant secondary concerns todo with the carbon balance of building materialsand processes. When local plant-derived materialsare used, they may act as net carbon sinks,helping to offset carbon emissions (Reid et al2004).
5.5.2 Waste minimisationThe construction and demolition industryproduces some 70 million tonnes of waste, ofwhich 13 million tonnes (19%) are materials thatare ordered but never used (EAC 2005). Anaccelerated programme of housing stockreplacement would exacerbate the problemunless waste management is also improved.Where practically possible, old buildings need tobe dismantled brick by brick and re-used, ratherthan demolished into rubble. The re-use ofbuilding materials needs to be considered at thedesign stage of new construction, so that amaximum quantity of materials can be
Demolition at currentrates means the averagehouse will last over 1,000years. Demolition willhave to increase to turnover an inefficient housingstock by 2050

44 Chapter 5: Building fabric and housing stock
dismantled intact, rather than being ‘down-cycled’at the end of the building’s useful life (OECD2003). However, it is beyond the scope of thisreport to analyse waste issues in detail.
5.5.3 Modern Methods of ConstructionThere is renewed interest in making modular,prefabricated building elements as a solution tothe dual problems of a housing shortage and apersistent low level of quality in construction.Modern Methods of Construction (a new term forhigh-quality prefabrication) has inherentadvantages: quality control is easier in a factoryenvironment than on a building site and fewerdays are lost due to inclement weather. However,pre-fabrication using mainly lightweight buildingmaterials may lead to an increase in summerover-heating and an energy penalty fromresidential air-conditioning demand. Pre-fabricated panels may also be harder to re-usethan conventional building materials, adding tofuture waste problems.
5.5.4 The built environment in a changing climateBuilding design and planning policy in thetwenty-first century need to take account of thelikely impacts of climate change, including greaterextremes of summer heat and increased floodrisks. One estimate is that over 2 millionproperties in the UK already are at risk of flooding(OST 2004). Avoiding flood-risk areas in future is aplanning issue, and will put additionaldevelopment pressure on other areas.
As highlighted in Chapter 4, the take-up of air-conditioning in UK homes is at negligible levelsnow, but a warming climate may well increasedemand, potentially adding significantly toelectricity consumption and carbon emissions.Optimising the adaptive potential of buildingsand minimising demand for air-conditioning willbe increasingly important across the wholehousing sector. New and existing homes can befitted with shutters or other shading devices tohelp prevent over-heating in summer. A key
design strategy for new buildings is to make useof materials with high thermal mass, whichmoderate extreme temperature changes andprovide comfort without mechanical cooling.
5.5.5 Spatial developmentIn the 40% House scenario, the housing stockincreases by a net 7.9 million homes from 1996 to2050, risking increased pressure on green-fieldsites.
Raising the demolition rate not only createsthe opportunity to remove some of the worsthousing from the stock, but it also creates newdevelopment sites in urban areas. Local planningauthorities will need to ensure that replacementhousing increases in density, as well as energyefficiency, across the local area, particularly sinceincreased density is also well suited to carbon-efficient heating and cooling systems (Chapter 7).
5.6 PoliciesA market transformation approach to the housingstock requires an overall coherent strategy if it isto be effective. Improvement of the energyefficiency of the housing stock is a vital part ofthis strategy and there are a number of measuresthat need to be put in place in order to achievethis and meet the 60% target.
5.6.1 InformationClear, reliable information about the energyperformance of a dwelling is a crucial first step inmarket transformation. By 2006, all EU memberstates are required to have a methodology inplace for providing information on the energyperformance of all buildings when they are built,sold or rented, as set out in the EnergyPerformance of Buildings Directive (EPBD). Thecurrent revisions to SAP are intended to fulfil therequirement for a building rating methodologyunder this Directive. The SAP rating of a dwelling,together with other information about energyuse and potential for efficiency improvements,will be included in the proposed HomeInformation Pack (HIP), which puts the onus on

45 Chapter 5: Building fabric and housing stock
the vendor of a property to gather all relevantinformation about the property prior to sale. BothSAP and HIP cover space and water heating only.An equivalent information service is needed forthe rented sector.
5.6.2 Regulation at point of sale or rentalSales and rentals of residential properties totalled1.3 million transactions in 2002, far exceeding thenumber of newly built homes (ODPM 2003e). Thepoint of sale or rental is therefore of criticalimportance to the transformation of the housingstock. Tenants in rented housing move, onaverage, every five years, while owner occupiersmove less often – about once every fifteen years(Robinson et al 2004). By 2050, each renteddwelling therefore needs to be transformedthrough the process of nine propertytransactions. Owner-occupied homes need toachieve the same transformation in only threetransactions.
Energy consumption is typically not a decidingfactor in the purchase of somewhere to live,especially when there is a shortage of choice inthe sought-after areas. Therefore, information onenergy efficiency – necessary though it is – isunlikely to be enough on its own to transform thehousing stock. A system of rebates on stamp dutyis proposed as a means of motivating energyefficiency improvements in the time justfollowing a property sale, when major works areoften undertaken or considered. In the rentalsector, where the efficiency cost savings andcomfort improvement are enjoyed by the tenantrather than the landlord, there is far less scope forincentivising improvement. Regulation of therented sector could provide an obligation toimprove the property to a minimum standardbefore a new rental contract can be agreed.
5.6.3 Regulation of refurbishmentRecent revisions to the Building Regulations haveincluded controls on replacement heating boilersand replacement windows, extending thecoverage of the legal standard to include
refurbishment works, as well as new construction.For the 2005 revision, consideration is being givento a new requirement aimed at majorrenovations: for works costing over a thresholdamount, an additional percentage of the totalbudget would have to be spent on cost-effectiveenergy efficiency measures. By extending thescope of the Building Regulations to coverrenovation in this way, energy efficiency will haveto be considered at a time when major disruptionand cost are already being contemplated.
The proposed extension of the BuildingRegulations to cover major refurbishments is awelcome first step, but its impact will beinsufficient if it only covers those measures whichare cost effective today. The 40% House scenariorepresents a massive level of improvement to theexisting housing stock, as well as an acceleratedprogramme of stock replacement. Increases ininsulation and measures to reduce ventilationheat loss are all needed if the 60% target is to bemet. As cost effective measures are taken up, theonus needs to shift towards new measures.
5.6.4 Ensuring complianceCompliance with Building Regulations needs tobe improved if claimed carbon savings fromhomes are to have any basis in fact. Very fewstudies are conducted on the performance ofbuildings in use, but these few suggest thatstandards are frequently not being met (eg Olivier2001, EST 2004c). The current shortage of buildingcontrol inspectors has led to trials of self-certification schemes, for example withreplacement double-glazed windows. Widespreadnon-compliance has been reported (EAC 2005).
A policy which relies on un-policed standardsor self-assessed compliance is unlikely to deliverall the expected benefits. The 2005 revision to theBuilding Regulations is likely to include a newrequirement for pressure-testing a percentage ofnew dwellings as a proxy for overall quality inconstruction. It remains to be seen whether thiswill bring about improved performance.
For refurbishments, there will be a need for

46 Chapter 5: Building fabric and housing stock
more qualified surveyors to carry out energyaudits. The requirements of the EPBD allow EUmember states until 2009 to put in place thesystems for energy audits to take place.
5.7 Priorities for actionTranslating these policy measures into practicalsteps identifies the following priorities for action:• Initiate a system of incentives using rebates on
stamp duty to encourage greater energyefficiency;
• Instigate a system of regulation for the rentedsector to compel landlords to meet minimumenergy efficiency standards;
• Extend the scope of the Building Regulations’coverage of major refurbishments;
• Broaden the coverage of the BuildingRegulations beyond ‘cost effective’ measures;
• Invest in research to create a database of real-life energy performance from a representativesample of UK homes;
• Develop a strategy to ensure compliance basedon performance rather than design standards;
• Recruit and train enough surveyors to carry outclear and reliable residential energy audits.
5.8 ConclusionsReducing space heating demand across the wholehousing stock is made difficult by the poorstandard of so many existing homes. A dualstrategy of refurbishment and replacement isneeded in order to make the necessary carbonsavings, and compliance with design standardsneeds to be much better enforced.
Information on the energy performance of adwelling at the point of sale or rental has thepotential to increase the rate of improvementthrough refurbishment, but the impact ofinformation alone is likely to be low. Regulationand financial incentives could help translateinformation on the quality of homes into lastingenergy efficiency improvements, using a markettransformation approach. Preparation for theimplementation of the EPBD is already providingsome of the groundwork for a markettransformation system to be in place from 2009.
All insulation measures,including costly anddisruptive measures likeunderfloor insulation,need to be taken up athigher rates than atpresent

47 Chapter 5: Building fabric and housing stock
The quality of the audits will be key to the successof the EPBD. Financial incentives and, in time, thesetting of minimum standards will also beneeded.
The list of measures needs to be extended toinclude solid wall insulation, ground floorinsulation (where feasible) and works to reduceventilation heat loss from existing dwellings (egblocking up chimneys, sealing skirting boards andservice pipe penetrations). All measures – thosethat are currently promoted, as well as the morecostly and disruptive ones – need to be taken upat higher rates than are currently achieved if the60% carbon reduction target is to be met by2050. Stamp duty rebates would be one way ofincreasing uptake in the private sector.
The major findings from the 40% Housescenario for space and water heating aresummarised below:• The 21.8 million pre-1996 homes that are still
standing in 2050 are much more energyefficient and only need 62% of the deliveredenergy for space heating.
• From 2020, all new homes have a space heatdemand of near zero to achieve an acceptablestock average in 2050.
• The demand for hot water per home is assumedto stay at 1996 levels until 2050 though anincreasing proportion is met by solar waterheating.
• The quantity of energy for space heating, forthe whole stock, has been reduced by 38% in2050, despite the 33% increase in the number ofhomes and a nearly 2°C rise in internaltemperatures.
• The rate of demolition in the UK rises to 80,000per year by 2016, and stays at the same level to2050: a total of 3.2 million demolitions from2005-2050.
• The rate of new construction in the UK is anaverage of 220,000 dwellings per year for thenext 45 years.

48 Chapter 6: Lights and appliances
This chapter considers the potential for reducingenergy consumption and carbon emissions fromresidential lights and appliances. An overview ofthe current situation is provided, along with anoutline of existing trends and policies, followed bya discussion of the barriers to achieving a 60%reduction in this sector. The key technologies thatunderpin the lights and appliances in the ‘40%House’ are discussed, with proposals for futurepolicy, building on the market transformationapproach already established in this area.
6.1 The low carbon houseUnder the 40% House scenario, by 2050,electricity consumption in residential lights andappliances (RLA) in the low carbon house isalmost half current levels (excluding space andwater heating). This represents savings that couldbe achieved mainly through improvements intechnology alone and does not take into accountmany possible behavioural shifts, beyondadopting the technologies. These necessarytechnologies are available now, with some atearly stages of development, hence the challengeis to bring these products onto the market andinto people’s homes.
One of the advantages of reducing energyconsumption in RLA is that savings can berealised relatively quickly due to the turnover ofappliances in the stock. A cold appliance lasts, onaverage, 14-18 years, compared to 60+ years forthe house itself. By 2050, all appliances in thehouse will have been replaced at least twice, ifnot three or four times, providing ampleopportunity for the introduction of more efficienttechnologies. Conversely, a new technology that isinadvertently inefficient can be rapidly taken upinto the stock, with negative impacts lasting foryears, as in the case of large-screen plasma TVswhich consume 350 W in the on-mode, comparedto 75 W for the average cathode ray tube (CRT) TV.
6.2 Current pictureLights and appliances represent the area ofgreatest growth in residential energy use (Figure1.2). This increase is mainly in electricity, which iscurrently the most-polluting energy source,emitting at least twice as much carbon dioxideper unit of delivered energy as gas in the UK. Atpresent, RLA account for 23% of residentialdelivered energy consumption (electricity andgas), the other 77% being used for space andwater heating. In 1998, electricity consumption inlights and appliances was 73 TWh or 3000 kWhper household, equating to emissions of 330 kgCper household (Table 6.1).
Over the last 31 years, RLA consumption hasbeen steadily increasing at around 2% per annumand is set to continue along this path givencurrent trends. A 60% reduction will only beachievable if these trends are reversed. This willbe possible through a combination of improvedappliance efficiency along with a reduced growthin ownership levels (ie ownership levels stillincrease to a certain extent, but at a slower rate),as illustrated in the 40% House scenario (Table6.1). Energy conservation, not just energyefficiency, is the crucial issue here (Chapter 9).
The assumptions in the 40% House scenarioare based on current knowledge relating to therange of appliances available at present. It iscertain that new appliance types and unforeseeninnovations will emerge over the next 50 years orso. Some of these may well come and go quiterapidly – either becoming obsolete or combinedwith other technologies, as has already been seen,for instance, with mobile phones becoming mini-computers. Given the difficulties in predictingwhat these changes might be, such novel deviceshave not been incorporated into the UKDCM.
Despite the problems inherent in makingforecasts of what might happen over half acentury, it is possible to identify wheretechnological improvements should be focused,whatever the appliance. The majority of energyused in household appliances is related to heat
Lights and appliances

Table 6.1: Electricity consumption and ownership, residential lights and appliances, 1998 & 2050
Current – 1998 40% House – 2050ownership kWh per ownership kWh per per appliance per appliance
TWh household per year TWh household per yearCold 17.5 3.5Refrigerator 3.1 0.43 300 0.8 0.43 58Fridge-freezer 9.5 0.60 650 1.8 0.6 94Upright freezer 2.9 0.24 500 0.7 0.32 64Chest freezer 2.0 0.18 460 0.2 0.12 54Consumer electronics 10.4 21.0TV – CRT 5.3 1.7 128 4.4 0.5 277TV – Plasma – – – 6.6 0.3 693TV – LCD – – – 4.2 1.2 111VCR 1.9 0.94 84 – – –DVD – – 15 0.6 1.3 15IRD (digital box) 0.6 0.28 95 0.8 2 13Computer 0.5 0.3 75 1.1 1 36Games console – – – 3.3 1 105Miscellaneous 2.1 – – – – –Cooking 11.9 11.5Hob – electric 3.0 0.46 270 2.8 0.43 203Oven – electric 3.4 0.57 245 1.8 0.69 80Kettle 3.9 0.95 170 4.5 1 140Microwave 1.6 0.77 85 2.4 0.85 90Lighting 17.4 4.1Indoor 17.4 1 715 3.9 1 122Security – – – 0.2 1 5Miscellaneous 4.0 4.0Wet 11.8 9.3Dishwasher 2.2 0.22 410 1.6 0.60 83Tumble dryer 3.1 0.35 365 1.0 0.25 128Washing machine 5.1 0.77 270 1.1 0.50 72Washer dryer 1.4 0.15 380 5.6 0.50 352TOTAL 73.0 53.4Total kWh per hhold 3000 1680
Sources: 1998 data: Fawcett et al 2000; 2050 data: UKDCM
49 Chapter 6: Lights and appliances

50 Chapter 6: Lights and appliances
(or the removal of heat). Less than 10% is used inmotor control and another 10% goes into theelectronics (eg display, controls). Therefore themost significant savings can be achieved throughconcentrating on reductions in the heatrequirement (eg through improved insulation,lower temperature washes).
6.2.1 TrendsThe population is increasing and the rise inhousehold numbers is a strong driver towardshigher levels of total consumption, but is a trendthat is virtually impossible to alter. This makes it
all the more important to secure reductions inenergy consumption per household tocompensate.
Energy consumption at the household level isdetermined by a combination of ownership,technology and usage patterns, each of whichvaries between the different appliance sectors.There has been a general trend over the last 20years towards increased ownership across allsectors – whilst it was once uncommon to own aTV or refrigerator, practically all households nowhave at least one cold appliance and TV, if not twoor more. Multiple appliance ownership hasincreased with the trend towards morefragmented households, with additional TVs inbedrooms, for example. Ownership levels havenow reached saturation in some areas, such asthe cold appliances, but are still growing inothers, particularly the consumer electronicssector. The overall trend is still towards moreappliances in each house.
Technological improvements are seen as thekey to decreasing energy consumption in lightsand appliances. There have been some majorimprovements in energy efficiency over the last 10years, mainly as a result of European policy. Themost significant advances have been made withcold appliances, through the combination of theEuropean energy label and minimum standards –the energy consumption of an average 140-litrerefrigerator in a UK home has dropped by 29%between 1990 and 2001 (Boardman 2004b).Progress has also been made in wet and cookingappliances. However, such advances are notexpected to be sufficient to completely offset theincrease in overall consumption due to populationand appliance ownership trends. The average sizeof cold appliances on the market increased by 15%between 1995 and 2001, reducing the impact ofthe efficiency improvements. The efficiency gainshave also been negated to a certain extent byunregulated growth in the consumer electronicssector, where the trend appears to be towardshigher rather than lower energy use (eg plasmaTVs and the digital revolution).
Unrelegated growth in theuse of plasma TVs haswiped out efficiencysavings achieved byimproved stand-byconsumption

51 Chapter 6: Lights and appliances
Behavioural trends are more difficult toquantify. There have been some changes in usagepatterns, for example, a shift towards lowerwashing temperatures and an increase inmicrowave meals, but such changes are the leastcertain and most difficult to predict or alter.
Household size has a significant impact onenergy consumption, with average energyconsumption per person increasing as householdsize decreases. One-person households inparticular have a much higher energyconsumption per person than larger households(Fawcett et al 2000) since they have many of thesame basic appliances which would normally beshared. The actual size of the dwelling is morelikely to have an impact on reducingconsumption. One-person households will, ingeneral, occupy smaller dwellings, which will limitthe size and number of appliances installed – apolicy trend that needs to be encouraged. Withthe growing number of single people living alone,appliances specifically designed for smallerhouses are needed. These are more likely to bemulti-functional devices, such as washer-dryersand fridge-freezers, where careful design isrequired to make sure that efficiency and serviceare not compromised. It is essential that thesefactors are optimised in the appliance design toensure that reductions in the number ofappliances do not result in higher consumption.
6.2.2 Current policyFor the past 10 years, technological improvementsin energy efficiency have been the main focus ofproduct policy at the European level, using amarket transformation approach (Boardman et al1997, Fawcett et al 2000). Essentially, this employsa synergistic package of policies that worktogether to bring about a shift on the markettowards more efficient appliances. Whilst not theonly factor behind reducing energy consumption,technological improvements have the advantagethat savings are guaranteed and irreversible,unlike behavioural changes.
One of the key elements of a markettransformation approach, consumer information,is in place for many appliances in the form of theEU energy label. Although the label has beensuccessful in increasing sales of more efficientappliances, weak minimum standards havelimited the effectiveness of this tool, but theopportunity is still there to bring about a morepowerful shift on the market. Due to the commonmarket, policies such as labelling, minimumstandards and voluntary agreements must beimplemented at the European level (althoughvoluntary agreements can be country specific)(Table 6.2). Procurement, rebates, subsidies andeducation are more suited to national policy.
Achievement of the 60% target, as outlined inthe UK Energy White Paper, depends on strongEuropean policy. This expectation appears to bemisplaced given the EU is moving away fromminimum standards towards weaker and slowervoluntary agreements proposed by the industry,eg the fleet average target of 1W standbyconsumption for all audio equipment by 2007. Ifsignificant savings are to be achieved, then astronger approach is essential – the market isunlikely to get there alone since energy efficiencyis not (yet) a priority for manufacturers.
Policy can deliver a significant shift in themarket, as demonstrated in the cold appliancesector. The effect of the 1999 minimum standardsfor cold appliances in the UK was a 15%improvement in energy efficiency of the averageappliance sold over 15 months (January 1999 -March 2000), accompanied by a 14% drop inaverage purchase price. For those appliancesbought in the year 2000, this translates intolifetime savings of 2.9 TWh of electricity, £285m inreduced costs to consumers and a third of amillion tonnes of carbon (Boardman 2004b,Schiellerup 2002). This benefit to the environmentand consumers was achieved at no cost togovernment or manufacturers. Similar shifts arenecessary over the next 20-30 years if the 40%House is to be realised.

52 Chapter 6: Lights and appliances
Table 6.2: Summary of current European policy instruments, residential lights and appliances
Minimum efficiency/ In force/Sector Sub-sector Instrument Directive maximum power target dateMultiple Framework 92/75 1.1.94
legislation for energy labelsEco-design amending 1.7.06*requirements 92/42for Energy- using products
Cold Label 03/66 Introduced A+ and 1.1.05A++ classes
Minimum 96/57 C (E for chest freezers) 3.9.99standardIndustry Fleet average of EEI 2006agreement of 52
Cooking Electric ovens Label 02/40 1.7.03Gas ovens Label* – 2006
Consumer TV with inbuilt Code of Passive standby: 3W 1.1.05 – electronics IRD (integrated conduct Active standby: 7-9W 31.12.07
receiver decoder)Stand-alone STB Code of Passive standby: 3W 1.1.06 – (set-top box) conduct Active standby: 6-8W 31.12.07Digital TV Code of Passive standby: 2W 1.1.05converters conduct On: 11-14W 1.1.06
On: 7-10WAudio Industry Standby: 1W 1.1.07
agreementExternal Industry No-load: 0.3-1W 1.1.05power supplies agreement No-load: 0.3-0.5W 1.1.07
Active loadLighting Lamps Label 98/11 1.1.01
Fluorescent Minimum 00/55 C 1.4.02ballasts standard B2 1.10.05
Wet Washing Label 95/12 1.10.96machines
Industry C 31.12.03agreement Fleet average of 2008
0.2 kWh/kgTumble dryers Label 95/13 1.10.96Washer dryers Label 96/60 1.2.98Dishwashers Label 97/17 1.8.99
Note: ‘In force’ indicates the date on which the provisions should be in force in the Member States eg the date from which energylabels should be on all appliances in the shops
* under negotiation or development

53 Chapter 6: Lights and appliances
6.3 Barriers to the low carbon houseAlthough the low carbon house is achievable, it isby no means a given. Reaching a 60% reduction inRLA energy consumption requires somesignificant barriers to be overcome.
6.3.1 Weak policyDespite some advances in reducing energyconsumption in RLA, far greater savings couldhave been achieved through stronger, morefocused policy. This is particularly evident in thecold appliance sector where the energy label hasnot been used to full effect. Originally, two roundsof minimum standards were proposed – one in1999 and a second in 2003, requiring an
additional 20% reduction over the 1992 baseline.However, only the first standard wasimplemented which required just a 15% reductionin consumption – far lower than the 46%reduction identified as the minimum life-cyclecost in an EU-wide study in 1992 (GEA 1993). Theease with which this standard was met impliesthat a more ambitious standard could have beenachieved (Schiellerup 2002).
A second opportunity to increase the impact ofthe label was missed when the categories wererevised to reflect the 1999 minimum standard,after which the models were concentrated in thetop categories. Instead of re-calibrating thecategories, two additional groups, A+ and A++,were added and the redundant D-G categoriesleft in place. Not only does this weaken the effectof the label, since there now appear to be three‘good’ categories, it is also confusing forconsumers.
In the lighting sector, the main approach in theUK has been subsidies for the energy-efficientcompact fluorescent lamps (CFLs) through theelectricity industry. Almost 17 million CFLs weredistributed between 1994-2002 under the EnergyEfficiency Standards of Performance (Ofgem/EST2003), with the delivery of a further 26.7 millionCFLs expected through the 2002-5 EnergyEfficiency Commitment (Ofgem 2004b). This mayactually have had a detrimental effect on theretail market for CFLs and resulted in continuingdependence on such subsidies, rather thanbuilding a mature market (Boardman 2004a,Schiellerup and Fawcett 2001). Grants andsubsidies are appropriate at the early stages ofmarket building, but grant-dependency issomething to be avoided. This illustrates a needfor a coherent approach, with a mix of subsidies,minimum standards and other policy tools, ratherthan relying on only one of these measures.
6.3.2 Over-emphasis on energy efficiencyWhilst an emphasis on energy efficiency isimportant, without a parallel focus on energyconservation this will not necessarily lead to
Label categories A-Gshould reflect what isavailable on the market.New A+ and A++categories are confusingfor the consumer

54 Chapter 6: Lights and appliances
reduced energy consumption, as demonstrated bythe appliance energy label. Because the label isbased on relative values, such as kWh/litre, itactually encourages manufacturers to producelarger models since this makes it easier to attainan A-rating. A smaller appliance consuming thesame amount of energy overall would have ahigher kWh/litre value and would thereforereceive a lower rating. If the aim is to reduceconsumption, then smaller, not larger, appliancesare needed, particularly given the trend towardssmaller household and dwelling size, as assumedin the 40% House scenario. Using absoluteconsumption as the basis for the energy labelwould help to encourage energy conservation.
6.3.3 Manufacturer priorities Energy efficiency is not seen as a priority by themajority of manufacturers, partly because they donot perceive it as being demanded by consumers.More often than not it is a beneficial side effectas a result of other design requirements eg longbattery life for laptop computers. Energyefficiency needs to become a systematicrequirement of product development – it isestimated that over 80% of all product-relatedenvironmental impacts are determined duringthe product design phase. Shifting these prioritiesmay only be possible through regulation, giventhe urgent need for reduction in consumption. Itwill happen too slowly, if it all, if left to voluntaryagreements or the market alone.
This is particularly evident in the consumerelectronics sector. One of the difficulties with thissector is that a traditional market transformationapproach is not possible since technical change istoo fast for a test procedure and energy label tobe developed and implemented. A different policyapproach is required. There has been somesuccess in the use of voluntary agreements – thestandby consumption in colour televisions andvideo recorders was reduced by around 50% overfive years (1996-2000). However, rapid,unregulated growth in other areas, such asplasma TVs, has completely wiped out these
savings and more, indicating a lack of concern forthe environment amongst manufacturers(Boardman 2004b). Clear policy is needed toprevent manufacturers taking such an approachin the first place – pro-active rather than reactivepolicy. The draft European Energy-using Products(EuP) Directive, which aims to provide eco-designrequirements for energy using products,represents a move in this direction. It is expectedto become law in Member States by December2005, with manufacturer compliance requiredfrom 1 July 2006.
6.3.4 Lack of consumer awarenessDemand from consumers can create a strongmarket pull towards more efficient technologies.However, this is dependent on consumers beingaware of the technologies available and, to acertain extent, making the links between theirenergy use and the impact of the resultantcarbon dioxide emissions. There is evidence thatpeople do understand these associations, but thisdoes not necessarily translate into actions toimprove the energy efficiency of their homes andappliances (Boardman 2004a). Whenhouseholders were made aware of the high levelsof standby consumption in their homes, thisresulted in ‘substantial behavioural inducedreductions in standby levels’ (Vowles 2000). Thisimplies that with the right information,householders will take action to reduce theirelectricity consumption, demonstrating the valueof feedback.
The increasing focus on carbon in energy policyrequires a greater awareness amongst consumersof the importance of carbon (Fawcett et al 2002).The introduction of the disclosure rule under therevised European Liberalisation Directive(2003/53/CE) is a step in this direction. Under thislegislation, from October 2005, UK consumers willreceive information about how their electricityhas been generated, provided on an annual basiswith their electricity bills. Details on theconsequent environmental impact in terms ofcarbon dioxide emissions and radioactive waste

55 Chapter 6: Lights and appliances
will also be provided on a website (Ofgem 2004a).Such information could help raise carbonawareness, enabling householders to choose theirelectricity supply on the basis of environmentalinformation and not price alone (Boardman andPalmer 2003).
6.3.5 Increasing appliances In this age of labour-saving devices, there is anever-increasing number of appliances available toperform all manner of tasks. Appliance ownershiphas been on the rise throughout the 20th Centuryand this appears set to continue into the future.The ‘digital revolution’ that started in the 90s, andstill continues, has resulted in an explosion ofnew appliances onto the market – something thatwould have been hard to predict 30 or 40 yearsago. Analogue services are likely to be fullyphased out by 2012 (Digital Television Project2004). How many more such ‘revolutions’ arelikely to occur between now and 2050? Will therebe a shift towards multi-functional ‘hybrid’appliances? And how would these be labelled?Whilst it is difficult to predict what will happen, itis clear that if consumption in appliances is todecrease, then the general ethos has to moveaway from accumulating more and moreappliances. This would require a significant shiftin peoples’ attitudes and the way in whichmanufacturers and retailers drive such trends.
6.4 Key technologies for 40% house scenario
The three main areas where significant savingsare possible are:• vacuum insulated panels in cold appliances;• light emitting diode (LED) lighting;• consumer electronics.There are, of course, savings to be made in otherappliance groups. However, the focus here is onthose sectors that offer the greatest reductions.
6.4.1 Vacuum insulated panelsVacuum insulated panels (VIPs) improve theinsulation of the cold appliance, refrigerator orfreezer, thus reducing the energy needed tomaintain the required temperature. VIPs canreduce the consumption of a cold appliance toaround a fifth of the average appliance in thestock and half the consumption of the best modelcurrently available to between 58-94 KWh(depending on the type of appliance).
This technology has been available for the last10-15 years, but uptake in the residential sectorhas been limited due to price constraints andconcerns about its durability. Weak efficiencystandards have also hindered its introductionsince the current standards can be met throughthe cheaper options of better compressors andimproving evaporator surface area. Hence therehas been no incentive for manufacturers toincorporate this technology.
The 40% House scenario assumes 100%adoption of VIPs in the total stock of coldappliances by 2050. This would require stricterminimum standards to bring these appliancesonto the market. Procurement programmeswould also be helpful in pulling the market in theright direction. This could follow the format of the‘Energy+’ co-operative procurement scheme,which proved successful in building the marketfor A+ appliances prior to the revision of the EUenergy label in January 2004 (Boardman andAttali 2003).
If VIP cold appliances are to be installed in
Phasing out of analogueradio and TV and goingdigital offers anopportunity to incorporatemore energy efficienttechnologies. This has notyet been recognised byindustry
56 Chapter 6: Lights and appliances
every home by 2050, allowance must be made forthe turnover of appliances in the stock. Theaverage life of a cold appliance is 14-18 years,therefore it will take this long before the fullimpact of the energy efficiency improvement isseen. In order to achieve the savings, minimumstandards would be necessary, along with theappropriate notice period, to allow manufacturersthe time to adjust their product range. In the caseof the 1999 minimum standards, the officialnotice period was three years (with an additionalthree years in negotiation) for a 15% improvementin energy efficiency. Given that VIPs are an alreadyestablished technology, a minimum standardrequiring the 50% reduction in consumptioncould be brought in by 2015. Hence, the marketwould be fully transformed, with only VIPproducts available, by 2035.
6.4.2 LED lightingTo date, the main focus for energy efficiencyimprovements in this sector has been thecompact fluorescent lamp (CFL), which consumesaround 25% of the energy of an equivalentincandescent lamp. Despite numerous subsidyprogrammes and the introduction of an energylabel, the rise in CFL ownership has been slow,estimated to be around 0.9 CFLs per household in2000.
In the longer term, LED (light emitting diode)lighting may offer a more effective solution. LEDsare already in use in the automotive, advertisingand retail industries and in some traffic lights.This technology is advancing rapidly, with LEDsnow being produced that replicate the light froman incandescent bulb (LumiLeds 2003), although,as yet, they are not used in residentialapplications. Large-scale replacement of bulbs isnot expected for 5 to 10 years (Mills 2003). Theintroduction of LEDs has the potential to reducelighting electricity consumption by over 80%,from 720 to 122 kWh per household pa (the bestprototypes currently available are around anefficiency of 75 lumens/Watt). No take-back hasbeen included since this is assumed to be
minimised by the use of occupancy sensors. The40% House scenario assumes full achievement ofthis ‘technical potential’.
To change the type of lighting used in allhouseholds is a major challenge since it is not justa case of switching bulbs, but altering the lightfixtures as well (in existing dwellings). Whilstturnover of light bulbs is rapid (in the case ofordinary incandescent bulbs), turnover of fixturesis much slower, particularly since many areinstalled when the house is built. A large-scalereplacement of the lighting technology wouldrequire a significant shift in consumerperceptions about how a house is lit. It would alsoinvolve a major retrofit of existing homes andcomplete transformation of products available inretail outlets. Lighting design trends, such as thecurrent move towards more focused task lighting,are difficult to predict over such long periods.However, the rapid uptake and popularity ofhalogens in recent years has resulted in arevolution in residential lighting. Given thesimilarity of LEDs and halogens – both in terms oflight quality and being directional light sources –a major step-change in the type of lighting inpeoples’ homes is by no means inconceivable,particularly over the time-scale of 50 years.
Assuming an average of 24 lighting fixturesper household and that each house buys one newfixture each year, the lighting market will takearound 25 years to be fully transformed to onlyLED lights and fittings. Alongside this, theBuilding Regulations will need to be revised torequire the installation of LED fixtures. Since LEDsfor residential applications are unlikely to beavailable before 2015, any revisions to theregulations will need to start from this point. Onepossibility is to require all fixed lighting fixturesin new build to be for LEDs from 2020. This willhelp build the market for LED lights and fixtures,but design competitions and active procurementprogrammes will also be needed for both fixedand portable fixtures. This could include thedevelopment of versatile fixtures that can bealtered to take CFLs, halogens or LEDs.

57 Chapter 6: Lights and appliances
Incandescent light bulbs will have to be banned –whilst a drastic measure, this is the only way toensure that the savings are guaranteed. The shifttowards more efficient lighting sources could beachieved through a Corporate Average BulbEfficiency (CABE) (Palmer and Boardman 1998,Hinnells 1997).
6.4.3 Consumer electronicsThis sector covers everything from homeentertainment equipment (TVs, VCRs, musicsystems) to home office appliances (computers,faxes). This is the fastest growing appliancesector, with rapid advances being made intechnology, although not necessarily in energyefficiency. As such, it is difficult to predict futuretrends for this sector – many of the current issuesnow faced were unforeseen a few years ago.
Under the 40% House scenario, the fulltechnical potential has been assumed. For TVs thisrequires almost static ownership levels, with ashift away from conventional and plasma TVs toLCD screens. VCRs are phased out with the switchover to digital services and replaced with DVDs,but with a slight increase in overall ownershiplevels. This is mainly due to the increaseddominance of computers in the household toperform these functions, which shows a rise inownership to one in every household, alsosupported by the likely increase in teleworking.Technologies for these appliances are assumed toreach the best that is currently available on themarket – a conservative assumption for 2050 andeasily achieved provided energy-profligateappliances are discouraged.
One of the key areas of growth in the last fewyears has been in Integrated Receiver Decoders(IRDs), which accompanied the introduction ofdigital TV. People tend to leave these on 24 hoursa day and IRDs therefore represent a significantarea of consumption, particularly given the rapidgrowth in ownership to two per household in2050 (one for each TV). This is the key area interms of the technical potential, with a 95%reduction in consumption for the on-mode and a
1W standby consumption. The sooner these moreefficient technologies are introduced the better,to ensure that the total stock will be fullytransformed by 2050 and preferably earlier. Whilstminimum standards would guarantee thesavings, strong voluntary agreements may bemore appropriate due to the fast rate of changein this sector. One possibility is a series of fourrounds of agreements over 15 years, with a 50%reduction in consumption at each stage. Thiswould result in a transformed market by 2020,allowing ample time for the efficienttechnologies to be adopted by all households.
The major risk with this sector is that therange and number of appliances will continue toincrease at the cost of energy efficiency andconservation. The 40% House scenario assumesthat this trend has been curbed, with morecircumspect research and development bymanufacturers. Given the current attitudes of themajority of manufacturers, it is quite likely thatthis will require some form of legislation (Section6.5.2). There are also significant opportunitieswithin this sector – the phasing out of analogueand switch over to digital services represents anopportunity for energy-efficient technologies tobe incorporated into this new era of appliances. Itis possible that by 2050, computers (or someother multi-functional device) have completelyreplaced many of the traditional appliances inthis sector – yet another chance to incorporateenergy-efficiency into the home. Hence, thefigures used in the scenarios may well beconservative given that no such combination-appliances have been assumed.
6.4.4 Other appliances In the cooking sector, the main savings areexpected through a combination of behaviouraland technical changes. Low emissivity electricoven design could reduce consumption by 35%(Kasanen 2000). Energy display meters have beenshown to result in a 15% reduction in the energyused in cooking (Wood and Newborough 2003).Together, these give a 50% reduction, resulting in

58 Chapter 6: Lights and appliances
consumption of 80kWh per year when applied tothe best model currently available. Savings inelectric hob consumption have been attributed tobehavioural changes only. For the 40% Housescenario, the full technical potential isimplemented, with usage staying constant and acontinuation of the trend in ownership towardselectric, rather than gas, ovens. In addition to theenergy savings available, there is a fuel-switchingopportunity in this sector (from electric to gas)that could contribute towards carbon reductions,particularly given that cooking is one of the maincontributors to peak demand.
For wet appliances, technological changes arethe key factor, such as increased insulation, higherspin speeds and heat pump tumble dryers. Atrend towards cooler temperature, longer washeshas also been assumed. These representimprovements of between 20-55% in relation tothe best models currently available on themarket. Fuel-switching is also an option to reducecarbon emissions in this sector through gastumble dryers.
6.5 Future policyIn order to achieve the 40% House scenario, thefull technical potential in all lights and appliancesmust be reached for all households. Many of thecurrent trends are in the wrong direction, leadingto increased consumption – some way must befound to reverse these trends wherever possible.This is a considerable challenge and one thatrequires strong and clear policies at both thenational and European level. Although muchpolicy has to be EU-wide, since appliances aretraded goods, there are opportunities forindividual countries to speed up the process,through, for example, procurement, todemonstrate that new technologies are feasible.The EU may well be supportive of UK efforts tomeet the 60% carbon reductions target since thelikely failure of many Member States to achievetheir Kyoto targets means that the EU needs totake urgent action to address the shortfall (EEA2004). Market transformation is the key policy
approach for this area and requires careful designand timetabling for maximum effect. Where therehas been a coherent approach in the past (eg wetand cold appliances), the result has been anoverall drop in energy consumption despite risinghousehold numbers and ownership (Lane andBoardman 2001). Whilst some elements of amarket transformation strategy are already inplace, a number of improvements could be madeto strengthen their impact.
6.5.1 Revisions to the energy labelThere are three key revisions to the energy labelthat would be beneficial:1. Use absolute consumption as the basis of the
label to discourage trends towards larger (andthus more consuming) appliances.
2. Reconfigure the label categories to A-G toprovide a more realistic reflection of what isavailable on the market, in conjunction withminimum standards.
3. For cold appliances, remove the compensationfactor for frost-free appliances in the energyefficiency index calculation.
In addition to this, the full potential of the labelas an awareness raising tool has not been realised– it represents a missed opportunity in terms ofeducating the public about the links betweenenergy use and the environment and the savingsthat can be made. Used effectively, the energylabel could become an even more powerful tool.
6.5.2 Minimum standardsMinimum standards are the cheapest and mosteffective approach for achieving guaranteedsavings. They also treat imports and the productsproduced within a country equally. If substantialreductions in consumption are to be made, strictminimum standards are essential. Voluntaryagreements are not an option because they donot deliver large enough savings over therequired time-frame. In Australia, regulation is themain focus of energy policy: a situation whichindustry is content with (provided they are givensufficient notice) and has resulted inmanufacturers taking a leading role in actually

59 Chapter 6: Lights and appliances
creating national efficiency standards (Holt andHarrington 2003).
Most policy acts retrospectively, allowingmanufacturers to develop and produce appliancesthat consume unnecessarily high levels of energy.Manufacturers need to be encouraged to takeresponsibility for incorporating energy efficiencyas a vital component of design, as could happenunder the draft EuP Directive. This does notnecessarily have to limit advances in technologyand product design, but would ensure that energyefficiency is at the core of any such developments.
6.5.3 Building Regulations Building Regulations can be an effective tool forcertain appliance groups, most notably lightingwith the specification of LED lights and fittings.
With the trend towards incorporatingappliances, such as fridges and washingmachines, into new homes at the building stage,specification of efficient technologies in thebuilding regulations would guarantee substantialsavings. With the 10 million new homes assumedin the 40% House scenario, this also represents asignificant procurement opportunity throughbulk purchasing.
6.5.4 Introducing new technologies to marketvia procurementIntroducing new technologies to market viaprocurement is a vital component in building themarket for energy-efficient products and will beessential if the technical potential for all lightsand appliances is to be achieved. The UKGovernment, with the Energy Saving Trust andCarbon Trust, needs to develop a clear strategythat identifies the new, upcoming and promisingtechniques and technologies and provide supportfor their introduction to market. Key technologiesinclude LED lighting and VIPs in cold appliances.These technologies will see application in bothhigh value commercial applications and massmarket residential applications, therefore a cross-sectoral approach is appropriate. Governmentpurchasing can also play a role in building themarket, as demonstrated by the US Government’s1W initiative which required federal governmentsto purchase products with low-standby from July2001 (IEA 2002).
Co-operative procurement is a relatively newapproach which has proved extremely successfulin the cold appliance market under the Energy+programme. Energy+ has brought togethermanufacturers, retailers, buyers and consumerswith the aim of promoting very efficient coldappliances through design competitions andinformation exchange; the number of super-efficient models (a minimum energy efficiencyindex of 42 – equivalent to the A+ category) hasincreased from two in 1999 to nearly 900 in 2004(Energy+ website). Hence, when the new labelwas introduced in 2004, there were already asignificant number of models in the A+ category(Boardman and Attali 2003).
6.5.5 FeedbackWhilst not part of a market transformationpackage, feedback has been shown to be effectivein reducing household energy consumption – areview of 38 feedback studies which took placeover 25 years showed that savings ranged from 5-20% (Boardman and Darby 2000). Feedback can
Washing machines haveimproved significantly inefficiency – but largermachines still consumemore. Downsizing wouldoccur if labels emphasisedtotal energy consumption

60 Chapter 6: Lights and appliances
take a number of different forms ranging fromdirect, immediate feedback, as with the cookingenergy display meters and interactive electricitymeters, to information provided on the electricitybill, such as bar charts comparing consumption tothe previous quarter. The latter has been shownto reduce consumption by 10% (Boardman2004a).
A further step would be to introduce a systemof personal carbon allowances which cover all fueldirectly consumed by an individual (eg gas,electricity and petrol) (Fawcett 2003), creating anumbrella policy under which the individualproduct policies would sit. This would represent amove towards increasing consumer awareness ofcarbon and help them make the links betweentheir personal actions and climate change(Chapter 9).
6.6 Priorities for actionResidential lights and appliances is one of theeasiest and quickest sectors in which to realisepotential savings. Most household appliances willbe replaced two to five times over the next 45years – the aim is to bring the efficienttechnologies onto the market without delay inorder to access these savings as soon as possible.Action needs to be taken now, building on themarket transformation tools already establishedso far. The necessary technologies have beenidentified – the challenge is how to bring them tothe market. The following steps represent the keypriorities for action:• Active procurement programmes to start
immediately for all appliance groups, with theEnergy Saving Trust and Carbon Trust workinginternationally. This will help set futureminimum efficiency standards.
• Minimum standards introduced for cold andwet appliances by 2015 and by 2020 forlighting, so that all lighting is LED. Negotiationsneed to be started now for a decision by 2010(2015 for lighting), allowing 5 years to takeeffect.
• Revision of the energy labels to absoluteconsumption and reconfiguration of the scalein preparation for the minimum standards in2015.
• EU level collaboration with consumerelectronics manufacturers to incorporateenergy efficiency as a central feature of productdesign.
• Negotiation of strong voluntary agreementswith manufacturers on 1W standbyconsumption for IRDs and other consumerelectronics. If ineffective, minimum standardswill be needed.
• Revision of the Building Regulations to specifythe installation of energy efficient appliancesby 2015 and LED lighting by 2020 (to tie in withminimum standards).
A 1 Watt Initiative isrequired to improvestandby electricityconsumption of newappliances

61 Chapter 6: Lights and appliances
6.7 ConclusionsSignificant and essential savings are available inresidential lights and appliances, but this requiressome radical shifts in attitudes and perceptionsamongst manufacturers and consumers and astrengthening of the market transformationapproach taken in this sector. For the 40% Housescenario:• By 2050, electricity consumption in residential
lights and appliances is reduced by 44% to 1680kWh per annum per household.
• This is equivalent to a 27% reduction overall(due to the increase in household numbers) to53.4 TWh, equivalent to a saving of 1.96 MtC.Therefore, greater savings need to be madethrough space and water heating if the 40%House is to be realised.
• These savings are based on technologies whichare already proven and available.
• Energy service through RLA increases, withmore households having a clothes dryer anddishwasher.
• With the move towards smaller households(both in terms of size and people), appliancedesign needs to be optimised for reduced spaceand single person households to ensure thatdown-sizing does not result in higherconsumption.
• The success of market transformation policy inthis area to date has been limited by weakpolicy, an over-emphasis on energy efficiencyrather than energy reduction, energyconsumption being a low priority amongstmanufacturers, lack of consumer awarenessand the trend towards increasing numbers ofappliances.
• A clear market transformation strategy, with afocus on strong regulation, is necessary if thesesavings are to be achieved.
• Action must be taken now to realise theavailable savings as soon as possible and toensure that low energy lights and appliancesare in all homes by 2050.

62 Chapter 7: Provision of heating and electricity through low and zero carbon technologies
Low and zero carbon technologies (LZCs) providespace and water heating and electricity throughrenewable technologies or combined heat andpower (CHP), which are retrofitted or integral tothe building or community. This chapter exploreswhat those technologies could be, how they couldcome about and the major issues (technical andregulatory) that would need to be addressedalong the way. It synthesises what is known abouteach of these emergent technologies and thenbrings them together to show what could beachieved under the 40% House scenario. Thepolicy implications to deliver this change are thendiscussed.
7.1 The low carbon house scenario in 2050
Under the 40% House scenario, by 2050, spaceand water heating requirements (ie useful heatprovided) have been substantially reduced from375 TWh in 1996 to 318 TWh in 2050, throughimprovements to the building fabric in bothexisting dwellings and highly efficient new build(Chapter 5). Electricity consumption in residentiallights and appliances (RLA) has decreased from 73to 53.4 TWh through the use of more efficienttechnologies (Chapter 6). Households have, onaverage, almost two LZCs, equivalent to a totalinstalled capacity of 55.6 GW. This is sufficient by2050 to generate 82% of total space and waterheating demand and meet total residentialelectricity demand, with around 15 TWh exportedback to the grid. By 2050, more than 20% ofhomes will have very low space heating demand(1,500 kWh pa useful energy) with no need forcentral heating. All homes are expected to needaround 4,000 kWh useful energy for waterheating. Around 75% of homes have eithercommunity heating (with CHP or biomass), microcombined heat and power (micro-CHP), biomassor heat pumps, as the basis for their heatingsystem. Around two-thirds of homes will have
solar hot water heating and around 30% will havephotovoltaics (PV).
Whereas it is relatively easy to foresee some ofthe improvements in fabric construction, orimprovements in lights and appliances, therevolution which could be LZC (Table 7.1) hashardly started. In 1950 central heating wasvirtually unknown. Within five decades, 90% ofhomes have central heating. In five decades fromnow most central heating systems will have beenreplaced three times, most power stations twice,and probably the majority of the electrical andgas distribution network. Whilst no newtechnology is envisaged, significant developmentof existing technologies (eg PV and fuel cells) isexpected to drive down costs. Investmentdecisions on the infrastructure for the provisionof heating, cooling and electricity over thistimeframe will be hugely affected by climatechange, political change and regulatory change.
7.2 Current pictureThe majority of UK homes (69%) have gas centralheating and 9% electricity. Average space heatingdemand is 14,600 kWh pa, with an additional5,000 kWh pa for hot water delivered energy.Installation of LZC technologies is low, forexample, only around 1% of UK homes areconnected to a community heating scheme.Continued high penetration of boilers and centralpower-only generation (however high efficiency)will not deliver a 60% reduction in carbon.
Proposals for amending part L of the BuildingRegulations (ODPM 2004a) stated that “if we areto achieve a 60% reduction in carbon emissions by2050, we are likely to need renewables by then tobe contributing 30% to 40% of our electricitygeneration and possibly more… We have thereforeincluded in the proposals measures that willencourage greater uptake of low or zero carbon(LZC) energy generation systems. This is also in linewith Article 5 of the Energy Performance of
Provision of heating and electricity through low and zero carbon technologies

Buildings Directive.” The consultation documenttherefore proposed that, in addition to “whatmight be achieved by a typical package ofconventional energy efficiency measures, thereshould be an additional reduction in carbonemissions of 10%. This 10% can be seen as a‘notional’ LZC contribution, but leaves thedeveloper to decide how best to achieve theimprovement.”.
If implemented as proposed, the 2005regulations are expected to deliver a 27% carbonsaving in new build housing, of which more thana third, 10% carbon savings, will come from LZCtechnologies (Ted King pers. comm.) The questionis, therefore, given an expected revision to theregulations perhaps every 5 years, what might bethe opportunity for LZC technologies to generateheat as well as electricity by 2050? And whatmight be the effect if Building Regulations wereto apply to refurbishments as well as new build?
7.2.1 Current support for LZCsThe main mechanisms for supporting uptake ofhousehold renewables at present are Clear Skies(England and Wales), and the Scottish Communityand Household Renewables Initiative. Communityenergy and PV are supported through the EnergySaving Trust (EST).
The Clear Skies programme provides grants aswell as lists of manufacturers and installers. Datafrom the first 20 months of the Clear Skies grantprogramme shows that 92% of projects fundedare solar thermal. At present only about 100grants for heat pumps are awarded per year. To
date, the EST solar grant programme has installedaround 600 residential systems. In terms ofcommunity energy, the EST has £60 million toinvest in refurbishing or extending communityheating, which is expected to deliver around £240million in total investment (EST website).PowerGen is the first of several manufacturersand suppliers to offer micro CHP on a commercialbasis (micro-CHP website) but whilst field trials ofa range of designs are ongoing, programmesupport is yet to be developed. PowerGen also hasa programme to install 1000 heat pump systemsover several years, principally in social housing aspart of their Energy Efficiency Commitment (EEC)programme.
Whilst these measures are important andbeneficial, there is insufficient cross-programmeand cross-sectoral learning in terms ofprogramme design. These programmes are at asmall scale compared to what is needed and arenot adequate to enable the uptake oftechnologies required to achieve the 60%reduction target.
7.3 LZC technologiesTable 7.1 summarises the LZC technologiesconsidered, from simple, heat based renewables,to technologies that supply both electricity andheat, to those that supply electricity only. Theseare discussed in more detail below. LZCtechnologies that supply cooling (eg Riffat andZhu 2004) are additional and not discussedfurther here.
63 Chapter 7: Provision of heating and electricity through low and zero carbon technologies
Table 7.1: Types of LZC considered, 40% House scenario
Heat only Heat and electricity Electricity onlyLow carbon Heat pumps Gas fired CHP in community heating
Gas fired micro-CHP (Stirling engine)Gas fired micro-CHP (fuel cells) –
Zero net carbon Solar hot water Energy from Waste or biomass CHP Biomass in community heatingGeothermal Biomass in micro-CHP (eg Stirling Photovoltaics
engines) Wind

64 Chapter 7: Provision of heating and electricity through low and zero carbon technologies
7.3.1 Heat pumpsHeat pumps can provide space heating, cooling,water heating and in some cases recover heatfrom exhaust air. Heat pumps can be designed forindividual dwellings or as a heat source for a heatnetwork, often in conjunction with CHP (Section7.3.4). There are currently only a few hundredinstallations in the UK, although the market ismature in Scandinavia and the US (IEA HeatPumps website).
Heat pumps work like a refrigerator, movingheat from one place to another. To move heattakes energy, either electrical (vapourcompression heat pumps) or thermal energy(absorption heat pumps). Up to five units of heatcan be provided for one unit of electrical energyused. The efficiency of a heat pump depends onthe relationship between the energy used tomove the heat and the amount of heat recoveredfrom the heat source, eg the ground. Air to airheat pumps are expected to find the coldest UKdays difficult to provide for. Heat pump efficiencyshows significant seasonal variation. A heat pumpoperates most effectively when the temperaturedifference between the heat source anddistribution system is small (EEBPP 2000). Thusheat distribution systems need to be lowtemperature and therefore large surface area (eg
underfloor heating systems). Consequently, thehighest efficiency units (and therefore the largestcarbon reductions) are limited to new build sinceinstalling such units in existing buildings wouldrequire major internal disruption. Refurbishmentwith lower efficiency units is possible, althoughwith lower carbon savings. It is unlikely that thistechnology could provide all UK homes with heat.
Consumer barriers to this technology includeunfamiliarity, uncertainty about continuingmaintenance and service availability, and noise,although these have been tackled successfullyelsewhere.
Heat pumps are only appropriate under certainconditions:• The large surface area required for the heat
distribution system and the disruption to landexternal to the dwelling during installationmeans that many existing properties withmature gardens or insufficient land would notbe suitable.
• With a low distribution temperature and highlyefficient heat pump, a long on-time is requiredto ensure an adequate indoor temperature. Thiswould not be well suited to poorly insulatedproperties or intermittently occupied dwellings.
7.3.2 Solar water heatingSolar water heaters are simple, reliable, wellknown and widespread (Greenbuilder undated).They are probably the LZC technology closest tobeing commercially viable. The most efficientdesigns concentrate solar radiation onto a smalldiameter tube to maximise heating efficiency.Usually an installation of around 4 m2 is neededfor solar hot water, producing sufficient to keep a200 litre tank topped up. Water heaters canprovide all of summer demand and around 50%of current year round demand in an averagehouse, but this could increase to over 60%. It isconceivable that in the most efficient dwellings, awood burning stove and a solar water heatercould provide all space and water heatingrequirements.
Solar thermal systems willprovide hot water heatingin 60% of homes by 2050

65 Chapter 7: Provision of heating and electricity through low and zero carbon technologies
7.3.3 BiomassBiomass can be used to generate heat inindividual dwellings or as part of a communityheating scheme. At the household level, abiomass boiler can provide space heating for thewhole house as well as water heating on a timeddaily basis, with automated fuel feeding from ahopper. This technology relies on a ready supplyof fuel, such as woodchip, pellets or logs. Themain potential is in rural dwellings (around 10%of households) and some suburban areas.
Biomass in heat networks can be more diverseand complex, serving both local rural and urbanschemes. In addition to crop-based products, useof biomass in heat networks may also include treewastes from council services; energy from waste;anaerobic digestion of food wastes or farmwastes to produce gases for combustion; landfillgas; or methane from pyrolysis.
7.3.4 Community heating using LZCtechnologiesA community heating scheme provides heat froma central source to more than one building ordwelling via a network of heat mains. Significantcarbon savings are available if heat is suppliedfrom biomass, geothermal heat, or the waste heatfrom power generation (known as combined heatand power or CHP). A community heating schememay also provide cooling via an absorptionchilling plant. A network is ‘future proofed’, in thatthe introduction of a single installation canswitch a whole portion of a city over to a newlower carbon fuel, such as biomass, combinedcycle gas turbines or fuel cells. Indeed the firstfuel cell in operation in the UK was in acommunity heating scheme in Woking (DTI2004d).
In the UK, less than 1% of homes are served bycommunity heating, but in Scandinavia aroundhalf of homes are heated in this way (Euroheatundated). Community heating schemes can varyin size, from a small block of say half a dozen flatsto individual tower blocks or whole portions of acity with tens of thousands of homes connected,
as is the case in Southampton, Sheffield, orNottingham. Schemes can start with a singletower block with additional buildings connectedover time.
Community heating is most appropriate in thefollowing circumstances:• Dense housing: there are around 4 million
dwellings in low and high-rise housing.• Off-gas communities, where oil, solid fuel
heating, or electricity is displaced (EST 2004aand b).
• In new and dense build, typically over 50dwellings per hectare (Wiltshire pers. comm.),where electrical and gas network infrastructureis not already installed.
• Where there is decision making on behalf of agroup, eg a strong residents association or newbuild developer.
7.3.5 Micro-CHP Micro-combined heat and power (micro-CHP)units provide sufficient heat for a single dwelling,similar to a conventional boiler. Indeed, units arephysically similar to boilers and are designed asdrop-in replacements. However, the heat isprovided as the by-product of the generation ofelectricity in the home – this is more efficientthan the generation of heat in a boiler and importof electricity via the electrical network.
The power generation unit can be a Stirlingengine, reciprocating engine, or fuel cell, eachwith different power and heat efficiencies: around20% for larger Stirling engines (with up to 70%provided as heat) and up to around 35% for fuelcells (net of reformer and DC to AC conversionlosses, with up to 55% of fuel converted to heat)Micro-CHP is capable of operating in condensingmode and thus at a high overall efficiency. In thelonger term, fuel cells offer the greatest carbonsaving potential, but there are a number ofsignificant issues that need to be addressed first.For example, major cost reductions would beneeded for large scale uptake, but theunderpinning materials are themselves veryexpensive. DTI is investing significantly in fuel cell

66 Chapter 7: Provision of heating and electricity through low and zero carbon technologies
research (DTI 2001, 2002a, 2003a and 2004b).The carbon savings from micro-CHP are
strongly dependent on electrical efficiency as wellas the operating strategy. As with conventionalboilers, micro-CHP units operate to match heatdemand, but it is also possible to turn them on atother times, for instance, to generate electricitywhen prices are high. The heat generated couldthen be stored in a high pressure water vesselcontained within the unit for later supply to thedwelling.
Micro-CHP only generates a portion ofhousehold electricity demand, the balance beingimported from the electrical network. At certaintimes, more electricity may be generated than isrequired by the home, allowing export back to thenetwork. This represents a significantly differentproposition for distribution companies andenergy suppliers compared to the currentsituation, and there are a range of issues aboutconnection, metering and the value of suchelectricity exports (FaberMaunsell et al 2002,Harrison and Redford 2002, Cogen Europe 1999and 2004).
The most likely scenario for large-scaleimplementation is for units to be installed on anenergy services basis (Section 7.5.2), in otherwords, financed, owned, operated and maintainedby a supplier, with the household buying heat andelectricity on a combined tariff (Harrison 2001,2004).
The opportunities for community heating withCHP and micro-CHP are different and additional.Micro-CHP is best suited to:• detached and semi-detached dwellings with a
higher heat demand, where the micro-CHP unitwill run for a sufficient length of time togenerate enough electricity to make it costeffective;
• individual decision making, eg by owner-occupiers.
7.3.6 Photovoltaics (PV)Photovoltaics (PV) convert light directly intoelectricity. Whereas the UK has around 600
installations, Germany has close to 100,000because of support through electricity tariffs(Wustenhagen and Bilharz 2005). A typical currentresidential installation of 12m2 could generatearound 1,300 kWh pa with a peak of around 1.9kW, though larger and more efficient installationsare possible. Different materials can be used togive different efficiencies, with amorphous siliconefficiencies around 4-6% and crystallineefficiencies at around 15% and potentially up to20%. The output from PV depends on theparticular installation: shading can reduce outputseverely and orientation is also important (Jardineand Lane 2003). There may be an upper limit of PVon UK roofs (domestic and non-domestic)imposed by UK electricity summer peak demand(currently 20-25 GW) and network managementissues if sufficient electrical storage is notavailable on the local distribution network.
7.3.7 Wind turbinesWind in urban areas or around buildings isunpredictable with significant disturbance. Acleaner more concentrated flow can be achievedby channelling or ducting wind into a turbine,most suited to high rise blocks with strongerwinds and higher load factors. However, thesetechnologies are still in development and mayhave some associated noise management issues.In rural areas, only a small percentage ofdwellings could support a wind turbine as astand-alone device (without the need forducting).
7.4 40% House scenarioUnder the 40% House scenario, the aim is toreduce heat and electricity demands, and then tomeet remaining heat demands from LZC to themaximum extent possible, and to meet or exceedthe demand for electricity in households. Thisstrategy is similar to the approach adopted whenconsidering CHP for any given site.
Many of the available technologies may beperceived to be either in competition (eg PV andsolar thermal competing for roof space) or

67 Chapter 7: Provision of heating and electricity through low and zero carbon technologies
complementary (eg PV and micro-CHP both needsimilar metering and remunerative arrangementsfor exported electricity). However, the savings arenot dependent on the success or failure of anyone technology – it is the achievement of theportfolio that is challenging and necessary. Eachtechnology is appropriate to a different portion of
the housing stock. In addition, each technologyhas a contribution to make at a different part ofthe load curve (Chapter 8), therefore a diverseportfolio of technologies will require fewer back-up fossil fuel plants.
The following assumptions were made underthe 40% House scenario (Table 7.2):• Heat pumps are best suited to large dwellings
not on the gas network, or in new build. This isassumed to give 2.7 million installations by2050, consistent with other estimates (Hitchen2004).
• Solar water heating is assumed to be installedin around two thirds of homes by 2050.Installation occurs at the same time as roofreplacement (to avoid the biggest installationcost which is scaffolding) or boiler replacement(to reduce plumbing costs). These assumptions,combined with volume, are expected to make itcost effective in most situations.
• Biomass boilers are assumed to remain aspecialist product for rural areas.
• Community heating using a combination ofCHP, biomass, and heat pumps is focused indense urban areas in both new build andrefurbishment. 4.1 million homes arerefurbished with community heating by 2050,
Table 7.2: Uptake of LZC under the 40% House scenario, 2050
OwnershipGas boilers 10%Electric heating 10%Community heating (using CHP and biomass) 20%Stirling micro-CHP 21%Fuel cell micro-CHP 17%Heat pumps 8%Biomass (wood boiler rather than stove) 5%PV 30%Solar water heating 60%Wind 5%
Total number of LZC installed 53.6 m Electricity generated by LZC (TWh pa) 100.9 TWh Heat generated by LZC (TWh pa) 260.9 TWh
Producing electricity at thesame time as providingheat is efficient either inthe home or for a localcommunity

68 Chapter 7: Provision of heating and electricity through low and zero carbon technologies
which is within the cost effective potential (EST2003). An additional 2.2 million new homeshave community heating by 2050; a proportionof these will only provide hot water and a verysmall space heating load (like BedZED). By 2050,most schemes will be non-gas based (egbiomass CHP, energy from waste), or convertedto higher electrical efficiency generation, suchas combined cycle gas turbines or fuel cells,with biomass boilers for back-up and top-upheat.
• Micro-CHP is a suburban technology for semi-detached and detached owner-occupied homes.It is installed in some 12.4 million homes(around 40% of households) by 2050, similar toother estimates of the potential in this sector(Harrison 2001, 2004, EST 2002, FaberMaunsellet al 2002). Whilst the majority of CHP unitswill utilise gas, a proportion of Stirling enginescould utilise biomass or bio-diesel. The electricalefficiency of the stock improves with time, andfuel cell micro-CHP emerges by 2020, with most
uptake after 2040, resulting in 9.3 GW of fuelcell capacity installed by 2050. This compareswith the 10 GW target Japan has set for fuelcells by 2020 (H2FC website).
• Photovoltaics. The period to 2020 replicateswhat has happened in Germany already, withhundreds of thousands, rather than millions,being installed. By 2050, 9.4 million units areinstalled, amounting to 28.3 GW in theresidential sector, which is in excess of currentsummer daytime demand. Power storage onthe local distribution network is thereforeassumed. Around a quarter of homes will havethe main roof facing between South East andSouth West, which retains output within 95% ofmaximum. West or East facing roofs stillachieve 80% of peak output. South facing wallsreceive 70% of the maximum potential solarradiation, but are more subject to shading. Themajority of the installations are assumed tooccur after 2040, when costs are assumed to bewell within product lifetime.
Stirling engine 12.8 GW 1.7-2.4 million at 2 kWmicro-CHP (average of 4.1, max 4.8 GW)Fuel cell 9.3 GW micro-CHPPV 28.3 GW 100 TWh from an 0.75 -15 million roofs at 4 kW
estimated 133 GW across (average of 31.5, max 60 GW)the UK economy
Wind 0.2 GW not building integratedTotal LZC capacity 55.6 GW 171 GW across the UK 44 GW average across
in households economy several sectors
Source: PIU (2002, Table 6.1), RCEP (2000, Table E7)
micro-CHP
Table 7.3: Comparison of 40% House scenario with PIU and RCEP studies
40% House PIU RCEP (scenarios 1-4)Community heating 4.9 GW Report states that “by 3-20 plants 8-60 MW fuelled with CHP (25% are not 2050 all low temperature by MSW (average of 0.4 GW)or biomass gas fired) heat could be provided 42-2900 plants between 0.5
from CHP units of an and 10 MW fuelled by biomass appropriate size … (energy crops and wastes)However, these are more (average of 7.9 GW)likely to be micro units than community heating.”Therefore assume 114 TWh generated by an expected 28-57 GW of mchp

69 Chapter 7: Provision of heating and electricity through low and zero carbon technologies
Table 7.4: Installations of LZC by decade (thousands), 40% House scenario
Installed 2004 to 2010 to 2020 to 2030 to 2040 to currently 2010 2020 2030 2040 2050
Total installed in 650 6,972 11,974 16,064 17,966the decadeCumulative 37 688 7,660 19,634 35,698 53,665installations
• Wind turbines are assumed to be installed in10% of dwellings, half being ducted turbines intower blocks with good wind speeds and highload factors, and the other half being eitherfreestanding or ducted devices in rural areas.
7.4.1 Comparison with other studiesTable 7.3 compares the 40% House scenario towork done by the Cabinet Office (PIU 2002) andthe Royal Commission on Environmental Pollution(RCEP 2000). In summary, the 40% House scenariois considerably more challenging than theaverage of the RCEP scenarios, but equivalent inuptake to the future foreseen by the PIU for theresidential sector alone.
7.4.2 Competitive markets The 40% House scenario equates to aninstallation industry that grows at 30% perannum (Table 7.4). This is challenging, particularlygiven that, so far, renewables in the UK have onlyincreased at 15% per annum since 1996 (DTI2004d). This is a huge step requiring changes ininfrastructure, householder perception,manufacturing, and employment, education andtraining of installers. It is the creation of a newindustry, in line with the goal of the Energy WhitePaper to promote competitive markets. However,the UK lags behind many OECD countries, forexample, Germany for PV, Scandinavia incommunity heating and heat pumps, the US incommunity heating, PV and heat pumps. Thetechnology is available, but needs the rightmarket framework to grow.
7.5 Cost and finance issues7.5.1 Cost issues now and in futureFew LZC technologies are commercially costeffective at present or as cost effective as energyefficiency. Many struggle to pay back within theirlifetime. However, technologies and markets forLZC are not mature and current cost-effectivenessis no guide to future cost-effectiveness. Eventechnologies which are considered mature (iflittle understood), such as community heatingwith CHP, can strongly benefit from increasedmarket volumes to bring down costs. Hitchen(2004) suggests that for heat pumps, UK costsappear to be higher than those overseas, soincreasing market size and the consequent moreefficient use of resources and increased skill levelscould lead to cost reductions.
‘Technology learning’ – reductions in costthrough learning by doing and examining theunderlying cost trajectory of a technology – is awell understood concept (Kobos et al in press).Achieving cost reductions depends ontechnologies being developed, economies of scalebeing achieved, the market for installers beingexpanded to a state of full competition and thecosts of connection to the electrical networkstandardized with appropriate metering in place.
One technology that will particularly beaffected by a change in costs is PV, the cost ofwhich is commonly estimated to halve every tenyears, with current costs at around £7250/kWpeak. Greenpeace and EPIA (2001) estimate costsin 2020 to be a third of costs now, although this isclearly dependent on the international policyframework. Such a reduction in costs would bring

70 Chapter 7: Provision of heating and electricity through low and zero carbon technologies
payback within product lifetime and thereforeincrease installation rates. However, to payback ina timeframe competitive with other investments(eg five years) and increase installation further,costs need to be 16 times less, which may takefour decades. Over half the cost of installation islabour, requiring good competition and trainingto bring it down. A good portion of the cost isscaffolding, which can be avoided if installation isrequired at the time of roof replacement.
As highlighted in Chapter 9, the cost of anygiven technical improvement is stronglydependent on policy. The future cost of LZCtechnologies is a political decision and dependsupon the support framework now. Markettransformation policies need to pay closeattention to changing the cost structure of LZC,with R&D support targeted at improvingefficiency, as well as a range of measures aimed atsignificant price reductions, including installertraining and finance mechanisms.
7.5.2 Financing The sceptic would read this and point out that ithas taken some 20 years to get condensingboilers into 5% of homes. If decisions are left tohouseholders, nothing very much happens.Householders are, by comparison to institutions,ill-informed and do not put a high priority onemissions or cost savings; they only make adecision on boilers once every 15 years or so.Incentives or requirements are therefore morelikely to be effective if targeted at installers orenergy suppliers or group decision-makers (likebuilders and housing managers) than athouseholds.
Indeed, many of the products discussed hereare best delivered through an Energy ServiceCompany (ESCo) approach. For example, mostschemes under Community Energy are beingdelivered through ESCos, and many of thebenefits of micro-CHP accrue to the supplier, notto the household. ESCos currently serve a verysmall portion of the housing stock, but couldpotentially supply more than half of homes, for
instance, with CHP at the levels given in the 40%House scenario. Where there is more than one LZCsystem in each home, the ESCo approach becomeseven more important for several reasons: toensure the best interactions between LZCtechnologies; to support investment in fabricmeasures and in efficient lights and appliances;and to deliver appropriate support systems suchas metering and billing.
7.6 LZC market transformation The market transformation approach, outlined inChapter 1, can support the movement of heatingsystems away from those based on boilers andelectric heating, to one where the provision ofheat and electricity is very substantially from LZC.
At the moment, the focus is on transformingthe boiler market, through the MarketTransformation programme, EST and the EEC.However, there is a limit to the carbon savingopportunities possible once efficient A or B ratedboilers are a Building Regulation requirement.Programmes focused on renewables aresupporting the larger scale technologies such asoffshore wind, wave and tidal. There is a need tomove resources away from condensing boilersonto building integrated LZC if the substantialcarbon savings available are to be realised.
7.6.1 Provision of informationProvision of information on products that delivera heating service should allow a comparison ofboilers with the LZC options such as solar hotwater, micro-CHP, or community heating. Thisincludes product labels (although this will not bestraightforward) as well as advice tohouseholders and larger decision-makers such ascouncils, housing associations and house-builders.Information at the level of the building, throughthe Energy Performance of Buildings Directive(EPBD), will clearly help to show the improvementthat can be gained through LZC.
7.6.2 Financial incentives Introducing new technologies and techniques to

71 Chapter 7: Provision of heating and electricity through low and zero carbon technologies
market is a vital component in building themarket for LZC technologies and will be essentialif the potential is to be achieved. To create longterm investor confidence, there needs to be claritythat support will be maintained for a sufficientperiod to build the market and establish expertisein every geographical area and specifier group, sothat the costs per house have come down, beforesupport is withdrawn.
The Government, along with Ofgem, EST andthe Carbon Trust, needs to develop a clearstrategy that supports the techniques andtechnologies during their introduction to market.Indeed, the Government has committed to amicro-generation strategy by 2005 (GreenAlliance 2004). LZC technologies are suited tonon-domestic as well as domestic applications,therefore a cross-sectoral approach is appropriate.Lessons from the Community Energy, Clear Skies,and Solar PV programmes have shown that it isnot only the grant support, but development ofguidance and case studies, as well as support fortraining and approving consultants, specifiers andinstallers, that has helped begin the process oftransforming markets. These programmes couldalso benefit from being better integrated withschemes involving visits to install energyefficiency measures, resulting in installation ofLZCs at the same time.
Options for large scale support includeexpanding the scope of the Enhanced CapitalAllowances scheme (ECA website) to include LZC;reduced VAT for installation needs to be extendedto all LZC; and stamp duty rebates forimprovements may include LZC. The difficulty isthat whilst all these are welcome, they are,individually, small support, and there is a hightransaction cost in ensuring consumersunderstand what support is available. All of thesemechanisms need to consider the relativeimportance of support for the householder andthe installer or ESCo.
Ultimately, a tariff-based approach is far moreeffective, as used in Germany to support PV.Amendments to the UK’s Renewable Obligation
(RO) could include tariff support for LZCtechnologies, including electricity generated innatural gas based CHP. The RO could also beextended to include a heat obligation for heat-only renewables.
7.6.3 Regulation to increase market shareA range of measures may provide regulation tosupport LZC in new build, such as the EPBD andthe 2005 Building Regulations. The energystrategy of the London Mayor requires planningapplications to include renewables, CHP andcommunity heating where viable, and expects theLondon Development Agency to promote thesetechnologies in its work (GLA 2004). Developersare already taking this on in their thinking, with arange of LZC options built into proposals for newurban communities (BioRegional 2004).
Existing dwellings are more challenging.Heating system replacement needs to become acontrolled service, ie bringing it within the scopeof the Building Regulations. An easy changemight be in social housing by laying out amethodology requiring LZC, or measuresachieving an equivalent reduction in carbonemissions, to be installed as electric heating isreplaced. A more difficult, and more distantchange, might be to require the same of owner-occupiers.
The Sustainable and Secure Buildings Act 2004(the Stunell Act) may help to support uptake ofLZC, two-way metering and fiscal incentives aswell as requiring a report on the extent to whichown-generation is integrated into the buildingstock.
7.7 Priorities for actionA complete market transformation to LZC couldbe achieved over the course of 2005 to 2050,which could be considered as three heatingsystem replacement cycles of 15 years each.• The first of these could be characterised by
technology development, eg throughinnovation support, grant or preferably tariffsupport programmes, testing, training and
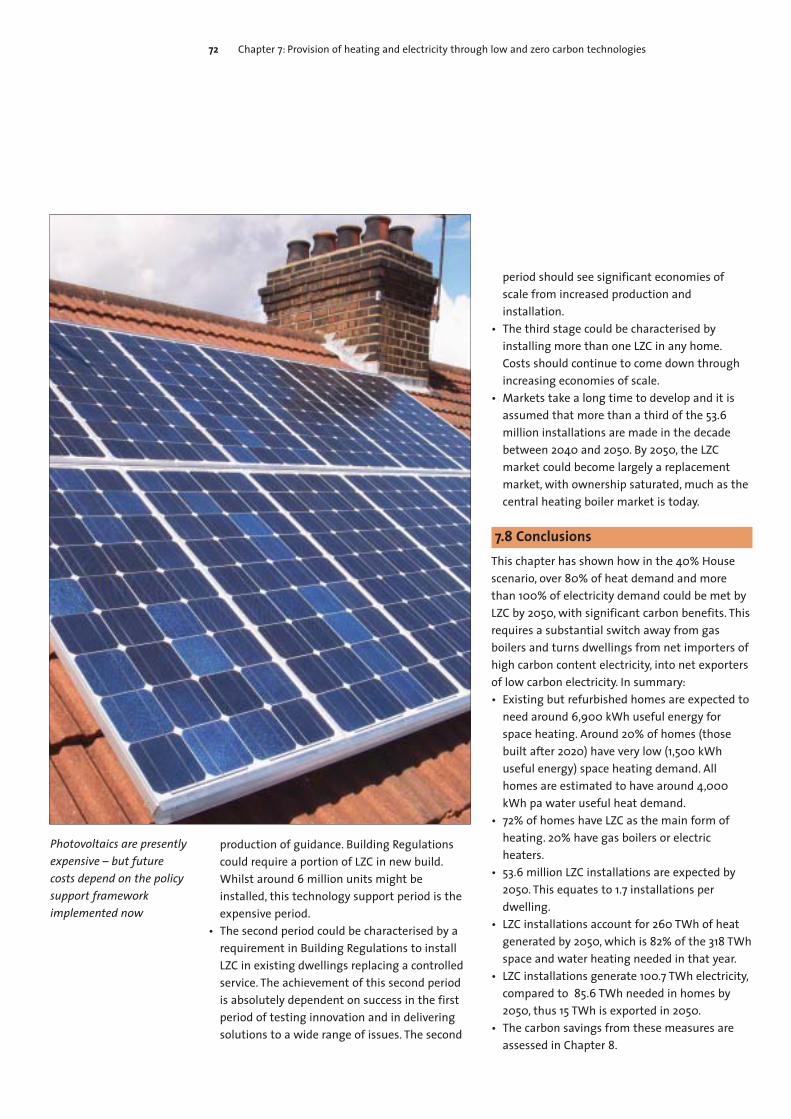
72 Chapter 7: Provision of heating and electricity through low and zero carbon technologies
production of guidance. Building Regulationscould require a portion of LZC in new build.Whilst around 6 million units might beinstalled, this technology support period is theexpensive period.
• The second period could be characterised by arequirement in Building Regulations to installLZC in existing dwellings replacing a controlledservice. The achievement of this second periodis absolutely dependent on success in the firstperiod of testing innovation and in deliveringsolutions to a wide range of issues. The second
period should see significant economies ofscale from increased production andinstallation.
• The third stage could be characterised byinstalling more than one LZC in any home.Costs should continue to come down throughincreasing economies of scale.
• Markets take a long time to develop and it isassumed that more than a third of the 53.6million installations are made in the decadebetween 2040 and 2050. By 2050, the LZCmarket could become largely a replacementmarket, with ownership saturated, much as thecentral heating boiler market is today.
7.8 ConclusionsThis chapter has shown how in the 40% Housescenario, over 80% of heat demand and morethan 100% of electricity demand could be met byLZC by 2050, with significant carbon benefits. Thisrequires a substantial switch away from gasboilers and turns dwellings from net importers ofhigh carbon content electricity, into net exportersof low carbon electricity. In summary:• Existing but refurbished homes are expected to
need around 6,900 kWh useful energy forspace heating. Around 20% of homes (thosebuilt after 2020) have very low (1,500 kWhuseful energy) space heating demand. Allhomes are estimated to have around 4,000kWh pa water useful heat demand.
• 72% of homes have LZC as the main form ofheating. 20% have gas boilers or electricheaters.
• 53.6 million LZC installations are expected by2050. This equates to 1.7 installations perdwelling.
• LZC installations account for 260 TWh of heatgenerated by 2050, which is 82% of the 318 TWhspace and water heating needed in that year.
• LZC installations generate 100.7 TWh electricity,compared to 85.6 TWh needed in homes by2050, thus 15 TWh is exported in 2050.
• The carbon savings from these measures areassessed in Chapter 8.
Photovoltaics are presentlyexpensive – but futurecosts depend on the policysupport frameworkimplemented now

73 Chapter 7: Provision of heating and electricity through low and zero carbon technologies
Whilst few LZC technologies are cost effectiveright now, this is not a good guide to the real costof achieving this change – costs are dependent onuptake and uptake is policy dependent.
Diversity is hugely important, with differenttechnologies making contributions in differenttypes of housing and at different parts of the loadcurve, thereby providing security andsustainability.
The installation of LZC technologies wouldneed to grow by around 30% per annum, whichwill be challenging. The technology exists, thoughimprovements will be needed to bring downcosts. The UK lags behind many OECD countries inthe use of LZC and can import much technical,market and policy know-how.
Market transformation policies have a role increating the right environment for investmentwhich will be needed to deliver the requiredannual 30% growth. Investor confidence is keyand for this reason, support needs to range frominstaller training to advice to large-scale decision-makers, to financial support. Stamp duty rebates,enhanced capital allowances, and lower levels ofVAT, would all help, but tariff support is the mostpromising option, based on experience inGermany. In the longer term, Building Regulationsneed to focus as much on LZC in existing build asin new build.
The strategy outlined here is not meant to be aforecast or a prediction, nor is it about pickingtechnological winners and losers. It is difficult topredict which technology will benefit most fromtechnical or market driven reductions in cost: ifone technical route proves difficult, another willfill its place. Some combination of most or all ofthese technologies is a necessary component of asustainable energy future a basket oftechnologies offers diversity and resilience.

74 Chapter 8: Electricity and gas implications
This chapter discusses the impact of the 40%House scenario on the energy infrastructure,bringing together the substantial changes in gasand electricity demand and high penetration oflow and zero carbon technologies (LZC) discussedin previous chapters, and looking at theimplications for operation of the electricitynetwork. The influence of these changes forcarbon savings, peak demand, required new plantcapacity, and associated policy and investmentdecisions are considered.
8.1 IntroductionUK generation capacity will change over the nexttwenty years as 11.6 GW of coal plant are retiredand 10.5 GW of nuclear power stations aredecommissioned. New capacity will certainly berequired – the question is, what form should thistake? The 40% House scenario envisages acapacity of 55.6 GW in residential LZC by 2050,sufficient to meet the majority of heating andelectricity demands in households, whilstassuming minimal changes in the carbonintensity of centrally generated electricity. Majorchanges in policy and investment patterns will berequired to support the family of LZCtechnologies, thus avoiding building new
centralised fossil fuel plant and associated gridreinforcement. New plant can also be avoided byminimising peak demand for electricity throughthe implementation of measures under the 40%House scenario.
8.2 Demand, supply and carbonemissions
Overall, by 2050, energy demand in the home isreduced to 64% of 1996 values under the 40%House scenario (Figure 8.1), with changes in bothconsumption of electricity and gas and the way inwhich the demand is met.
Gas demand for space and water heating andcooking is reduced by 38% due to better buildingfabric, improved efficiency and use of solarthermal systems. There is a dramatic switch fromconventional heating systems to combined heatand power (CHP) boilers in 2030 which slows thereduction in gas consumption, as additional gas isrequired for the electricity generation componentof CHP.
Electricity consumption falls by 16% from 1996levels by 2050, from 101.7 to 85.6 TWh. The 27%reduction achieved in residential lights andappliances (RLA) is offset by the increased use ofelectric space and water heating in homes withminimal space heating demand. These homes arewithout a central heating system (since heatingdemand is so low) but still require hot water andsome top-up heating, supplied by electricitygenerated in the home.
Homes have become significant generators ofelectricity, driven by the high levels ofphotovoltaic (PV) installations and fuel cell micro-CHP (Figure 8.2), and net annual exporters by2045. Any individual dwelling with these LZCsinstalled will both import and export electricity,depending on demand, as will be the case for theresidential sector as a whole by 2030. Theseimports and exports will inevitably make nationaldemand balancing and operation of energymarkets more complex. A change from thepresent centralised operation towards a moreflexible decentralised approach is required,
Electricity and gas implications
Figure 8.1: UK residential energy use, 40% House scenario, 1996-2050

capable of supporting high penetration levels ofdistributed generation. Such issues are beyondthe scope of this project, but will be addressed byfuture studies such as EPSRC’s SUPERGENconsortium on highly distributed power systems.
8.2.1 Carbon emissionsThe carbon savings under the 40% Housescenario depend on the relative emissions factorsof centrally generated electricity, residential gascombustion and LZCs. The target of a 60%
reduction in carbon emissions is reached in 2045,with additional savings from this point onwardsreducing emissions still further (Figure 8.3). From2050, the residential sector remains on a fallingcarbon trajectory. The 40% target is reached atthe same time that the residential sectorbecomes a net exporter of electricity. In contrastto recent studies (Johnston et al 2005), thisimplies that the required savings can be madewithin the housing stock alone, as a combinationof improved building fabric, reduced demandfrom RLA, and introduction of LZC, and withoutreliance on ‘supply-side fixes’ or the effect of thenet export of electricity.
Conservative assumptions have been maderegarding emissions factors from networksupplied electricity (see box) requiring greatersavings to be made within the building fabric,lights and appliances and through installation ofLZC capacity to meet the 60% reduction target.Emissions factors for LZC generated electricity,from renewables and CHP, are assumed to bezero. Renewables are inherently zero carbontechnologies. Emissions from CHP are morecomplex since the electricity generated requiresadditional gas consumption beyond that requiredfor heat alone (79 TWh of electricity generatedfrom 110 TWh of additional gas in 2050). Forsimplicity, all emissions from CHP are attributedto the heat demand, since CHP essentiallyreplaces central heating boilers; the electricityfrom CHP is therefore assigned an emission factorof zero.
Despite electricity demand rising to 2050,carbon emissions reduce over the entire period.This is primarily due to the widespread uptake ofLZC, especially post-2030, and reduced gasconsumption. Reductions in residential gas andelectricity consumption contribute 8.3MtC and15.6MtC respectively. All this is achieved despitethe rise in household numbers. The average housein 2050 will produce around a quarter of thecarbon emissions of 1996 (1.66 tC to 0.42 tC).
75 Chapter 8: Electricity and gas implications
Figure 8.2: Electricity generated by UK residential LZC technologies, 40%House scenario, 1996-2050
Figure 8.3: UK residential carbon emissions, 40% House scenario, 1996-2050

76 Chapter 8: Electricity and gas implications
8.3 Peak demand and supply issuesThe 40% House scenario has consequences forthe electricity network, with a change in thediversity of demand. In particular, generationcapacity and transmission and local distributionnetworks must be sufficient to meet peakdemand to ensure security of supply. None of theRoyal Commission on Environmental Pollution(RCEP) scenarios to achieve the 60% target havesufficient generating plant to meet peak winterdemand, implying back-up plant capable of peakoperation (RCEP 2000 para 9.27).
8.3.1 Present peak demandThere are two key issues relating to the existingnetwork operation:• The generation capacity required on the
network is determined by the height of the
maximum annual peak, presently winterevenings (Figure 8.4). Minimising peakconsumption will reduce the amount of newfossil fuel plant that will need to be built.
• Meeting the predicted rate of increase indemand (gradient changes) requires plant tooperate at part-load for a significant period oftime (spinning reserve) in preparation for thechange in demand, which has a carbonconsequence. Traditionally coal plant has beenused, with additional pumped storage for rapidresponse. Gradient changes can also be metfrom modern gas plants, but the response is notso rapid as for coal. Fewer and less steepgradient changes in the national demandprofile would help save carbon and simplifydemand balancing.
The current peak load occurs on a typical winterday in early evening. In 2002, the average winterpeak was 51 GW (Figure 8.5), from an installedcapacity of approximately 77 GW; the 25% excesscapacity covering plant unavailability(maintenance, failure etc). This was sufficient tomeet the maximum recorded UK peak of 61.7 GWin 2002 (DTI 2004a). Summer profiles are smallerin magnitude and smoother, with no clear eveningpeak, but a rapid gradient change (ie a rapidincrease in demand) still exists in the morning(Figure 8.6).
The residential sector is partially responsiblefor the morning gradient (Figure 8.5) and entirelyaccountable for the evening rise and maximumpeak (EA 1998). The morning gradient arises frompeople getting up at the same time for work, and
Emissions factorsThe emissions factors for network supplied electricity assumed in theUKDCM are outlined in Table 8.1. The projections from the MarketTransformation Programme (MTP) are based on historical data from theNational Atmospheric Emissions Inventory with future emissions utilising DTIenergy projections (DTI 2001a). The general trend is towards a decrease inemissions factors as renewables and gas replace nuclear and coal.
The 40% House scenario takes the MTP emissions factors and projectsthese beyond 2020, assuming nuclear retirements are offset by an increase inrenewables, so there is no net change in emissions factor. It is also envisagedthat gas will replace coal. This gives an emissions factor of 0.1 kgC/kWh from2030 onwards.
Table 8.1: Emissions factors (kgC/kWh), UK, 1996-2050
Year MTP predictions 40% House scenario1996 0.139 0.1392000 0.136 0.1362005 0.111 0.1112010 0.106 0.1062015 0.110 0.1102020 0.107 0.1072030 – 0.12040 – 0.12050 – 0.1
Source: Market Transformation Programme, 40% House project
Figure 8.4: Influences of load profile onnetwork operation

Figure 8.5: UK residential and non-residential profiles for typical winterdemand, 2002Source: 40% House project, based on Electricity Networks Association data
Figure 8.6: Winter and summer demand profiles, England and Wales, 2002Source: National Grid (2003)
Load
(GW
)Lo
ad (G
W)
77 Chapter 8: Electricity and gas implications
the maximum peak from people leavingcentralised shared workspace and schools andreturning home to distributed, lower-occupancyspace.
The residential sector offers the greatestpotential for reducing peak demand and thereforeplant capacity. The non-residential sector, despiteusing more electricity in total, is less able toreduce consumption at peak times due to thehigher load factor (ratio of average to maximumdemand).
8.3.2 Influence of lights and appliancesSince the demise of the Electricity Association,load monitoring has not been conducted and dataavailability is poor. The precise contribution ofdifferent appliance loads to the evening peakcaused by the residential sector has not beenquantified since 1988 (Boardman et al 1994).However, qualitative assessments of the influenceof technological changes in RLA and LZC arepossible. Examples of how technologicaladvances may influence the present demandprofile are illustrated in Figure 8.7.
Figure 8.7: Schematic influence on load profileof a) improved energy efficiency, b) improvedefficiency of lights and appliances, c) demandshifting through use of smart appliancesNote: blue-current, red-altered
c)b)
a)
The residential sector isresponsible for the winterevening peak in demand

78 Chapter 8: Electricity and gas implications
The potential impacts of lights and applianceson load management are as follows:• Efficiency improvements in those appliances
used mainly at peak times (eg lighting,televisions) will reduce both the height andgradient of the peak.
• Lighting is responsible for at least 20% of peakresidential demand (Boardman et al 1995). On atypical winter’s day, this represents a minimumnational residential lighting load of 3.3 GW (150W per household) at peak demand. Switchingto 100% LED lighting would reduce this demandto 0.55 GW – implying 2.75 GW of avoided plantcapacity.
• Cookers are significant users of peak timeelectricity but it is socially difficult to shift theload to another time. Ovens have particularscope for efficiency improvements (Chapter 6).
• Consumer electronics are the fastest growingcomponent of residential demand and are likelyto be in use at peak times. In stand-by mode,they represent a significant baseloadcomponent.
• Efficiency improvements of appliances inconstant use (eg refrigerators) will reduce boththe height of the peak and the baseload.However, the rate of change in demand (the
gradient) will not be altered by suchimprovements.
• Smart appliances – appliances capable ofshifting load to times of low demand, or turningoff during peak periods – would reduce bothpeak load and gradients in demand. There isalso the potential to use smart appliances toshift load to times of low carbon generation. Atpresent, carbon intensity is virtually constantduring daylight hours but drops at night (Figure8.8). In future, carbon intensity will fluctuatemore, as penetration of wind, PV and other LZCsincreases. Smart appliances could be switchedon at times of home generation to minimiseexport of electricity to the grid. However, smartappliances will require more sophisticatedmeters to be installed and possibly new pricingtariffs (Section 8.3.4).
• Spreading demand for individual appliancesand dwellings across the day will also helpminimise peak load (Newborough 1999).Coincidence of high power activities such aselectric cooking, dishwashers and laundry canresult in peak demand in excess of 10 kW from asingle dwelling. Appliances may be redesignedto reduce their peak load: washing machinesand dishwashers can use lower power heatersfor longer and ovens may cascade the on/offcycles of individual heating elements such thatcoincidence of demand does not occur.
8.3.3 Influence of LZC TechnologiesSome LZC technologies have beneficial influenceson required capacity or carbon (eg micro-CHPreduces peak winter demand), whilst others mayexacerbate it (eg PV reduces daytime demand andtherefore accentuates the summer evening peak).However, once the nature of these influences isunderstood, there is an opportunity to designappliances, and the mix and operational modes ofLZCs, to minimise peak height and gradientchange. There is a benefit in diversity of supply toease grid-management. The potential influencesof LZC technologies on load management are asfollows:
Figure 8.8: Carbon intensity variations throughout the day, UK, 2002Source: 40% House project
Car
bon
inte
nsity
(kgC
O2/
kWh)
79 Chapter 8: Electricity and gas implications
• Community heating with CHP can replace bothgas and electric heating with heat storage andback-up and top-up boilers providing heat atother times.
• Stirling engine micro-CHP devices (with a highheat to power output) are most likely to beheat demand led with electricity for the homegenerated as a by-product, but electricitygeneration with heat storage would allowoperation at peak electrical demand.
• Fuel cell devices with a lower heat to poweroutput may simply not run at peak times.Small units may operate close to baseloadwhilst modular units may provide more at peakthan at baseload.
• Heat pumps in well-insulated buildings withlow temperature emitters (eg underfloorheating) would have a relatively steadyelectrical demand, rather like a refrigerator.However, they would utilise electricity more attimes of peak heat demand compared to thesystems they would replace (eg Economy 7heating).
• Photovoltaics reduce demand for centrally-generated electricity during the day time,especially in summer, but create a day time‘valley’ with higher gradient changes, therebyincreasing the spinning reserve on the system.Seasonally, they can generate eight times asmuch energy per day in summer as in winter,which is the converse to residential demand.However, PV matches extremely well with non-residential demand (Figure 8.5) althoughensuring supply can be delivered to the rightlocation to meet this demand may beproblematic.
8.3.4 Influence of tariffsAs well as technological innovation to reducepeak demand, changes in consumer behaviourcan also influence the shape of the demandprofile. Most notably, novel pricing tariffs can beimplemented by suppliers to encouragemovement or reduction of peak demand, therebyreducing the price they pay to generators.
Time-of-day tariffs charge different prices atdifferent times of day, with peak usage moreexpensive than baseload consumption. This isusually a simple two-tier pricing structure, butmore advanced systems charge real-time prices ona half-hourly basis, as with national demandbalancing. The expectation is that once consumersare aware of the tariff, they will transfer the use ofsome appliances (typically washing machines anddishwashers) to off-peak hours. In future, smartappliances may be able to shift loadautomatically. Time-of-day tariffs have alreadybeen implemented in the USA to minimise peakdemand of air conditioners and this has reducedrequirements for new installed, centralisedgenerating capacity. Such tariffs applied to LZCelectricity exported from the home would alsobenefit the demand profile. Technologiesoperating at peak times (eg CHP) would berewarded over those generating at times of lowdemand (eg PV). Market signals would thereforeencourage the optimum mix of LZCs for ease ofnational demand balancing.
Another option is maximum demand tariffs,which are common in the UK industrial andcommercial sectors and in the residential sectorsof other countries. With these, the tariff isdetermined by the customer’s peak (maximum)power demand, providing a strong incentive tosmooth load throughout the day.
Although tariff structures may aid LZCdeployment and decarbonisation of the network,there remain concerns about the equity of suchschemes, which may penalise the greater heatingrequirements of the fuel poor. Hence solutionshave to be researched to ensure that they areequitable.
8.3.5 StorageIn the longer term, storage will be required oncepenetration of LZCs and other intermittentrenewables reaches a critical threshold – likely tobe between 2020 and 2030 – with facilitiesincorporated into the electricity network athousehold, substation or national level. These

80 Chapter 8: Electricity and gas implications
devices will be capable of smoothing intermittentgeneration and demand profiles, providing a trulyflexible network capable of keeping the lights onwith minimum active demand balancing. Thisallows each individual generator to operate atmaximum efficiency.
Storage may be for a microsecond, seconds,minutes, hours or even over seasons. Technologiesinclude: pumped storage (already used to meettimes of peak demand in the UK) which storeenergy as potential energy; flywheels, which storeenergy as kinetic energy; batteries and hydrogenstores for fuel cells, which store as chemicalenergy. Less storage is required with the carefulplanning of intermittent sources, ensuring theoptimum geographical distribution of a full rangeof technologies (HoL 2004). Power storage isbeyond the scope of this study but forms a keypart of both industry and Government work inmoving to sustainable energy (EPRI and DTIwebsites).
8.3.6 Overall impact on peak demandThe 40% House scenario proposes highpenetration of all LZC technologies, which, incombination, have less effect on the grid than anindividual technology and ensure greater securityof supply.
Table 8.2 illustrates the maximum level ofchange in demand and supply measures underthe 40% House scenario, in relation to currentdemand. The implication is that, particularly post-2040 when uptake of PV is strong, renewables orLZC will run as baseload, if available, with fossilplant operating over a shorter and moreintermittent run time. Many modern gas plantsembedded in the distribution network couldbalance demand, both spatially and temporally.Figures shown are the maximum possiblechanges – in reality, electricity from LZC is notguaranteed generation since the individualtechnologies will operate at different times.
The influence of all measures combined issubstantial – demand profiles seen by centralgeneration will be significantly different from
Table 8.2: Impact of 40% House scenario on UK electricity load, 2050
Winter evening Mid meritpeak (maximum) (average demand) Summer midday
Current demand 61.7 GW Around 35 GW Around 20-25 GW40% House scenarioLighting 3.3 GW demand
down to 0.55 GW at peak (–2.75 GW)
Consumer likely peak electronics expected to rise
from 2 GW to 4 GW (+2 GW)*
Community 4.9 GW new 4.9 GW new heating with capacity operating capacity operating CHP/biomass for around 5500 for around 5500
hours a year hours a year (–4.9 GW) (–4.9 GW)
Stirling engine 12.8 GW of new micro-CHP capacity operating
at peak (–12.8 GW) most of which available at peak
Fuel cell around 9.3 GW of around 9.3 GW of micro-CHP new capacity new capacity
operating circa operating circa 4000 hours pa 4000 hours pa depending on depending on operating strategy operating strategy (–9.3 GW) (–9.3 GW)
Heat pumps 2.5 GW peak 2.5 GW peak (+2.5 GW) (+2.5 GW)
PV up to 14 GW around 28.3 GW (winter midday) peak new
capacity,operating duringdaylight hours (–28.3 GW)
Net effect in reduction of reduction of surplus of 3-8 GW 2050 demand on demand on over demand,
central plant of central plant requiring storage up to 25 GW of up to 25 GW or export (–112%)**(–40%) (–75%)
Source: UKDCM* Current maximum demand from all consumer electronics devices used simultaneously is 4.3 GW. Thisis expected to rise to 8.9 GW by 2050. However, not all appliances are used together.** The total stock of PV will rarely, if ever, be operating at peak simultaneously across the UK. The peakoutput of 28.3 GW is notional, but still implies some need for storage.

81 Chapter 8: Electricity and gas implications
today, to the extent that the peak may not occurin winter evenings. Winter peak is predicted toreduce by approximately 40% and mid-merit(average demand) by up to 75%. Summer middaycould see household output exceed currentnational demand, requiring some level of storage.
8.4 Finance and policy implicationsWith 22.1 GW of coal and nuclear plant to beretired over the next twenty years, there is a needfor new capacity. The question is: what formshould this new capacity take and how might itbe managed? The current approach in theelectricity supply industry is to let the solutionsregarding installed capacity and supply-demandbalancing be determined by the market. The onlyincentive at present is via the RenewablesObligation – additional market mechanisms arerequired.
Delivering the 40% House scenario wouldimply some 55.6 GW of LZC supplying around100.9 TWh – just over a quarter of UK generationin 2004 (DTI 2004a). This implies a much-reducedrole for new centralised generation and a radicallydifferent pattern of expenditure in electricalnetwork renewal.
The current costs of LZC are higher per unitcapacity than conventional plant. In addition, LZCoperates at lower load factor than conventionalplant and so greater capacity would be required. Acombination of policy support and commercialfactors would be needed to drive the change fromnew conventional plant to LZC. Policy supportmight include:• Market transformation to reduce the costs of
LZC, making it cheaper than reinvesting in newcentralised plant (Chapter 7).
• Policies that favour or require LZC overcentralised plant. For example, the ElectricityAct 1989 and Energy Act 1976 allow theSecretary of State power to withhold consentfor new capacity of 10 MW and above for gas,and 50 MW or over for other fuels. Appliedconsistently over a long period (excluding goodquality CHP or large-scale renewables), thiscould be a key tool in ensuring that newcapacity to replace coal and nuclear isembedded and possibly building-integrated.Current guidance on power station consentsonly requires consideration of CHP (DTI 2001d),which is not likely to be sufficient to encourageLZC over central plant.
Commercial factors centre around four mainthemes:• Peak demand. Whilst LZC technologies may be
more expensive per kW of firm capacity, thosethat operate at peak generate more valuableelectricity. Micro-CHP for example, avoids theneed to buy in capacity at peak times thusavoiding purchase of the most expensiveelectricity. The savings made could be used tooffset the cost of installation.
• Competition. LZC technologies can help winnew customers and retain existing customers ina competitive market. This could be achievedthrough free installation of LZC (paid for bylong-term contracts for provision of lower-costelectricity, heat and servicing), as well asbranding and affinity marketing based aroundthe offer of energy with low environmentalcost.
Installing LZC will causesignificant imports andexports from the home. By2045 the residential sectoris expected to be a netexporter of electricity

82 Chapter 8: Electricity and gas implications
• Added-value services. Supplying a range ofservices (heat, electricity, servicing) through thesame billing system results in cost reductions.There is also an opportunity to provideadditional services such as the provision ofenergy-efficient lights and appliances.
• Risk management. LZC technologies representan incremental risk in what is likely to be arapidly changing investment environment.Capacity can be made available flexibly andrapidly without the need to select and acquiresites, obtain consent or incur time delaysbetween a decision to invest and plant comingon line. Investment cycles are likely to be nearerthe 15 year life of a boiler, rather than the 40years or so associated with conventional plant.This means the portfolio of investments can befine tuned to match requirements more readilythan with conventional plant.
This would mean a transformation of the marketfor delivery of energy services well beyond theproducts that deliver the energy. An EnergyService Company (ESCo) approach is one option.This would require a substantially differentregulatory framework to create a system in whichan ESCo model was more attractive to suppliersthan the current business model and represents achallenge for Government, with Ofgem a keyplayer. Such a change in business and in structureis radical, but possible over a 50-year time
horizon. The last half century or so has seennationalisation of supply through the 1948Electricity Act, re-privatisation in 1989 and theintroduction of new generators and supplierswith competition in supply.
8.5 Priorities for actionThe following have been identified as the keypriorities for action in this area:• To avoid new fossil fuel plant, efficiency
improvements in appliances that operate atpeak time need to be a focus for markettransformation policy, particularly for lightingand televisions.
• Minimising consumption of residential lightsand appliances should be a priority as technicalpotential can be achieved rapidly. This couldalso avoid investment in new central plant.
• Demand side management should receivehigher priority in future network design, both ata micro and macro scale.
• Diversity of LZCs has operational benefits forgrid management and so the full range ofoptions need to be supported by policy.
• Electrical storage technologies, includinghydrogen generation as a means of storage,should remain priority research goals forsmoothing demand and minimising any effectof intermittent generation.
• An ESCo approach would need support to divert
22 GW of nuclear and coalplant are to be retired. Thiscapacity could be met byLZC technologies in theresidential sector

83 Chapter 8: Electricity and gas implications
finance from investment in central plant andnetwork towards the implementation of LZCtechnologies and demand reduction measures.Withholding consent for new build centralisedplant (that is not CHP or renewable) would be akey incentive for encouraging theimplementation of LZC technologies.
8.6 Conclusions• The 40% House scenario is achieved in 2045, as
a combination of improved building fabric,reduced demand from RLA and introduction ofLZC, and without reliance on ‘supply-side fixes’.
• Emissions from electricity are reduced by 15.6MtC primarily due to widespread uptake of LZC.
• Emissions from gas reduce by 8.3 MtC, due tothe lower heat demand of both existing andnew-build dwellings.
• Decommissioning of nuclear power stationsand closure of coal plant over the next 20 yearsmeans new capacity must be built to ensuresecurity of supply. This could be either central orembedded generation. The 40% House scenarioassumes high penetration of embeddedgeneration.
• The amount of national system capacityrequired is determined by peak demand, whicharises from the residential sector.
• The residential sector is responsible for theevening rise and peak in total demand.
• Demand profiles seen by future centralisedgeneration will be very different to currentprofiles. Implementation of LZCs and reducedpeak demand from appliances could reducewinter peak by 40%.
• Minimizing investment in centralised plant willallow money to be diverted towardshouseholds for implementation of LZCs, whichcould be achieved through an ESCo approach.
• An ESCo approach needs to be researched sincehouseholds are unlikely to be able to deliver theinvestment envisaged. There are compellingcommercial reasons for the development ofESCos over conventional energy supplybusinesses and such an approach could besupported by policy.
• The residential sector becomes a net exporterof electricity after 2045.

84 Chapter 9: Achieving the 40% House scenario
The policies that will deliver a 60% reduction incarbon dioxide emissions in the residential sectorinvolve a wide range of decisions and decision-makers. A market transformation approach isoutlined as a possible delivery mechanism.
9.1 The 40% House scenarioThe 40% House scenario achieves a reduction ofcarbon dioxide emissions to 40% of 1996 levels atleast by 2050 and probably by 2047 andcontributes to all four Energy White Paperobjectives. This is based on a host of initiatives tocontrol energy use and carbon emissions in thissector, resulting in the following changes:• electricity consumption in lights and appliances
has been reduced by nearly half, to 1680 kWhper household in 2050;
• all energy services have increased, per person(more warmth, hot water, space and access toappliances);
• the standard of new build means that homeshave close to zero heating requirements from2020 onwards. The average rate of constructionhas been increased by a third to 220,000 pa, so10 million homes are built between now and2050;
• about 87% of today’s houses are still in use in2050, but only those that can be refurbished upto a standard equivalent to 2004 new build;
• demolition is focused on the least energyefficient dwellings that are unhealthy to live in.The rate has increased from 0.1% pa of thehousing stock in 2003 to 0.25% pa in 2050, bywhich time it will take only 400 years toreplace the stock;
• there is an average of nearly two LZCtechnologies per house by 2050 and thehousing stock as a whole is producing moreelectricity than it is consuming;
• national grid peak demand has been loweredby up to 25 GW.
The targets set are challenging but feasible, ifGovernment starts now, and 45 years provides asubstantial period of time in which to achieve amajor new trajectory for residential carbon
emissions, even acknowledging the inertia of thehousing stock. In reality, these targets areapproaching the extreme end of the policyenvelope: it would be close to inconceivable toplan for tougher standards on lights andappliances or more low and zero carbontechnologies on this timescale. Higher demolitionand construction could be possible – and higherconstruction rates were proposed in the BarkerReview (2004) – but a higher rate of demolitionwas deemed to be socially unacceptable.
Finding: The target of a 60% reduction in carbonemissions by 2050 is achievable in the residentialsector, but requires a strong commitment bymany sectors of society. The 40% House can beachieved.
Finding: The level of energy services increases perperson: the average individual is warmer, hasmore hot water, more space and access to moreappliances.
The 40% House scenario is demanding anddemonstrates the task to be faced if the UK is toachieve its commitment to mitigating climatechange. It may be that a tougher target should beaimed for, because:• more may be expected and demanded from the
residential sector, to compensate for the greaterchallenge posed in areas like transport, wherereductions of 60% are even more difficult toenvisage;
• climate change is proving to be more of athreat than previously anticipated, so actionand cuts are more urgent and should bestronger than 60% by 2050 (Hare andMeinshausen 2005, Hillman and Fawcett 2004).
The 40% House scenario demonstrates anappropriate basis for policy. It is recognised thatdifferent combinations of measures to the onesproposed in the scenario are possible, but anylowering of activity in one area has to be offset bymore stringent standards elsewhere. For instance:• if the number of demolitions is not as high,
then tougher Building Regulations will beneeded, eg getting to zero space heating
Achieving the 40% House scenario

85 Chapter 9: Achieving the 40% House scenario
demand in 2010, rather than 2020;• if the full technical potential in lights and
appliances is not met, or substantial demandfrom unexpected new uses occurs, then eachhome will need more than two LZCtechnologies.
Finding: The individual targets in the 40% Housescenario can be traded off against each other(more of one, less of another), but the options arelimited.
9.2 ConstraintsAll of this could be achieved, despite the followingconservative assumptions made by the project:• The carbon emissions factor for electricity does
not change after 2030 – it does not eveninclude the effect of any electricity exportedfrom the domestic sector, because ofuncertainty about what is happeningelsewhere.
• There are no major technological advances, justthe strong development of known technologies,such as light emitting diodes, vacuum insulatedpanels in fridges and freezers, photovoltaics,micro-combined heat and power.
• The stock grows from 23.9 million properties in1996 to 31.8 million in 2050 because ofpopulation growth and a diminishinghousehold size (down to 2.1 people perhousehold) – factors which are not amenable topolicy intervention. Other things being equal,this would produce a 33% increase in energydemand and an immense policy challenge. Thisis one area where energy policy has to copewith the consequences and prepare for such anincrease.
The 40% House scenario has numerousimplications for other parts of society and theeconomy. These are recognised as of importance,but not included within the boundaries of thisproject. There is no intention of shifting theproblem from the residential sector elsewhere,but the energy system is an integrated whole, soaffecting one part will inevitably haveimplications in other places.
Finding: Over time, changes in population anddeclining household size result in morehouseholds and hence could lead to up to a 33%increase in energy demand, if nothing elsechanges. This demonstrates the scale of thechallenge of achieving a 60% reduction.
Finding: The 40% House scenario is achieved,despite cautious assumptions on householdnumbers and the carbon intensity of electricity.The savings will be greater if these assumptionsare too conservative.
9.3 Policy focusThe main focus of the project has been onproduct policy, using a market transformationstrategy. In the past, housing has not beenconsidered a traditional product, partly because itis not a commodity that can be moved around,although building components and technologiescan. However, the European Commission isincreasingly looking at making policy on buildingsmore consistent across Member States, forinstance through the Energy Performance ofBuildings Directive (EPBD). The novel approachtaken in this project has been to investigate howmarket transformation may be extended tohouses in order to promote a more rapid turnoverof the housing stock and the development ofultra-low carbon technologies and lifestyles(Section 9.9). This requires a combined energy andhousing strategy, focused on carbon mitigation.This moves away from the present suite ofpolicies, which encourage the continuing use ofthe existing stock even if energy-inefficient.
Product policy has to be a priority, especially
There will be more hotwater, space, warmth andappliances per person in2050 – but carbonemissions are reduced by60%

86 Chapter 9: Achieving the 40% House scenario
when prices are rising as a result of resourcescarcity and political pressures or there is a focuson raising prices through taxation. Consumersneed information to help identify which productsto buy in order to use energy efficiently and cutcosts. The scale of the challenge – and theincreasing concerns about climate change –means that policy should aim at certainty ofoutcome. For this reason, there is a strongemphasis on regulation, for instance BuildingRegulations and minimum standards for newappliances and existing houses.
Certainty of outcome requires that policy shiftsmore from reactive to proactive mode: ensuringthe right products come to market, rather thantrying to minimise the impact of harmfulequipment once it is being manufactured. Unlessa genuine concern for the environment envelopesindustry, Government may have to take strongermeasures to protect consumers and the planet.
Another component of a proactive policy iseducation of the public about the seriousness ofclimate change and the vital role of personalresponsibility. This is an essential backdrop to the40% House scenario, so people begin to learnabout the need to control their energyconsumption and carbon emissions, andrecognize that this can be achieved without adrop in standard of living and, probably, with anenhanced quality of life.
Finding: A combined UK energy and housingstrategy covering all energy use in the home isrequired, with the main criterion being to ensurethe best contribution to carbon mitigation.
Finding: A market transformation strategy forhousing represents a novel application andidentifies the way policy can be proactive, ratherthan reactive.
9.4 TimescalesThis report is primarily concerned with the targetof a 60% carbon reduction by 2050, but this dateshould be seen as part of a continuum, with thenecessary carbon savings being long-lasting,
permanent and irreversible. By 2100, the UK willhave to reduce carbon emissions by 80% in orderto achieve atmospheric carbon dioxideconcentrations of 550 parts per million (RCEP2000), or even more if recent claims about thelikely scale of climate change are correct. Whilstthere are currently no formal commitments overthis time period, the scale of reductions is in linewith the philosophy of contraction andconvergence (GCI 2001). A prompt, decisiveintroduction of the policies outlined in 40%House scenario would help towards theachievement of a low carbon society in the longterm as well as improving the chances of meetingexisting targets. For the latter, improvedstandards for lights and appliances areparticularly important, as turnover is alreadyrapid and energy standards are undemanding.
Finding: A key policy objective is to make savingsthat are long-lasting, permanent and irreversible,that contribute to carbon reduction targets bothbefore and after 2050.
Finding: An early requirement of the energy andhousing strategy is to identify the timescale forpolicy action, so that future targets are notjeopardised by a failure to act soon. The timetableis tight and the aspirations substantial.
9.5 Opportunities for action: the housing stock
The slow turnover of the housing stock meansthat improved energy efficiency is limited byopportunities in existing dwellings and the rate ofnew construction and demolition. The biggestbenefits come from replacing old, energyinefficient properties with new, low-carbondwellings, if on a sufficient scale. The rate ofdemolition is an important component of the40% House scenario, although this is a complexissue given the UK’s architectural heritage andthe fact that 70% of homes are owner-occupied.
9.5.1 Historic buildingsMany of the buildings that form the historiccentre of UK towns and cities were originally

87 Chapter 9: Achieving the 40% House scenario
houses but are now occupied by the offices oflawyers, accountants and doctors. These are nolonger part of the housing stock, though they areoften part of the image people have whendiscussing the country’s architectural heritage.There are, however, 1.2 million dwellings inconservation areas and about 300,000 individualresidential buildings listed as architecturallyimportant. This 5% of the housing stock is treatedas sacrosanct and not included in any plans fordemolition; it represents about a quarter of thedwellings built before 1919. Hence, the majority ofhomes that are approaching 100 years of age arenot protected under either of these pieces oflegislation, at the moment. They have not beenidentified as part of the UK’s ‘official’ architecturalheritage. By implication, three-quarters of pre-1919 homes could be demolished if deemedunhealthy and incapable of providing affordablewarmth.
Finding: Preservation of the architectural heritagefocuses primarily on 25% of the pre-1919 housingstock.
9.5.2 Refurbishing the existing stockThe main factor determining decisions about thedemolition rate is the extent to which theexisting stock can be improved. In the 40% Housescenario, existing homes that are still occupied in2050 (21.8 million dwellings) have all beenbrought up to the standard of current BuildingRegulations for new building (ie a SAP ofapproximately 80), with an average heatingdemand of about 9,000 kWh pa. At present, onlyabout 9% of the stock has a SAP of 70 or more.
The policies to achieve this will be based onthe Building Regulations – which already covermajor improvements – and on existing policies,such as the Decent Homes standard for muchrented accommodation. A substantial upgrade inthe effectiveness of these policies is needed,combined with local authority action on theworst housing and new initiatives such asfinancial incentives through stamp duty rebateson investments to reduce the carbon emissionsfrom a building. The rebates should be linked to aproportion of the investment, not to a percentageof the duty paid as this would unduly favour therichest householders.
Finding: The aim is to achieve the maximumreduction through retrofitting the existing stock,to minimise costs and social disruption.
Finding: The target of getting 21.8 million homesup to an average of SAP 80 (heat demand of9,000 kWh pa) by 2050 will require substantial,forceful new policies that need to beimplemented as soon as possible.
9.5.3 DemolitionThere is a direct relationship between demolitionlevels, the resultant lifespan of the averagedwelling and the energy use in the whole stock.Present levels of demolition (20,000 pa) aredemolishing barely 0.1% of houses each year,implying a stock lifetime of nearly 1,300 years(Table 9.1). Energy demand from the total stockwill continue to rise if the amount of energy usedin new buildings (for growth in householdnumbers) is not offset by reductions in theexisting stock through demolition.
Table 9.1: Housing stock demolition rate, lifetime and energy consumption, UK
Annual demolition Lifespan Average Average % over 100 Energy change rate (years) SAP, 1996 SAP, 2050 years, 2050 by 205020,000 1300 44 66 31 +6%150,000 250 44 77 25 -12%234,000 120 44 84 19 -24%
Source: UKDCM

88 Chapter 9: Achieving the 40% House scenario
Under the 40% House scenario, the demolitionrate increases from 20,000 pa now to 80,000 pain 2016 and stays at this level until 2050, giving atotal demolition over the whole period 2005-2050of 3.2 million properties. By this stage, thedemolition rate will have increased to 0.25% ofthe housing stock, taking 400 years to replace the2050 stock of houses. The majority of homesdemolished would have a low SAP (for instancethere are currently 3 million below 33 SAP points),or be deemed unhealthy under the HousingHealth and Safety Rating Scheme. Savings beyondthose in the 40% House scenario would comefrom increasing the demolition rate further to150,000 pa and would reduce the notionallifespan of the average building to 250 years. Toget down to 120 years, demolition would have torise to 234,000 pa. The latter would enable energyconsumption for space and water heating to bereduced by 24% and the average SAP to rise to 84.
Finding: The current demolition rate needs to beincreased fourfold, targeted at the mostinefficient and unhealthy homes.
9.5.4 New construction A key focus of the 40% House scenario is on thestandard of construction – both as designed andits performance in practice – and on the size andtype of dwelling. By 2020, the standard in theBuilding Regulations results in homes with nearlyzero space heating demand.
The rate of new construction in the UK underthe 40% House scenario is an average of 220,000pa from now to 2050. This is 38% above the
current rate of 160,000, but lower than theannual figure of 242,000 recommended at leastfor a period to bring house price inflation inEngland down to 1.8% pa (Barker 2004). Barkerdid not consider the rate of demolition, thereforethe rate of construction may need to be evenhigher than the one proposed under the 40%House scenario.
In addition to the quantity of new homesrequired to reduce pressure on house prices, thereare several other important interlocking issuesrelated to new construction, which are beyondthe remit of the project. These include whetherthe homes (and related jobs) should be moved outof the South East, the relative importance ofdifferent tenure groups and whether more socialhousing should now be constructed.
In recognition of the growth of single-personhouseholds, the 40% House scenario assumesthat much new construction is of smaller homes:the average new dwelling is 74m2 by 2050. Thislinks to the quantity and density of construction(Table 9.2). If the space per person is kept thesame, the projected 33% increase in householdnumbers only results in a 15% increase in totalresidential floor area. Whereas, if the size of theaverage dwelling is maintained, then the 33%increase in household numbers does result in a33% increase in total floor area, with 14% extraspace per person.
The Government is already encouragingdevelopment of denser housing. From March2005, it aims for 30-50 dwellings per hectare inLondon and the South East, South West, East of
Table 9.2: Effect of space per person on total residential built fabric
Total Number of Size residential households (m2) floor area People per Space per
(million) (billions m2) household person (m2)1996 23.9 84 2.0 2.4 352050 31.8 74 2.3 2.1 352050 31.8 84 2.7 2.1 40

89 Chapter 9: Achieving the 40% House scenario
England and Northamptonshire (ODPM 2005). Butthis is still treating the dwelling as the mainmeasure. There needs to be more recognition ofthe interaction between the space per dwelling,the space per person and the quantity of builtfabric in total (including communal space), as thelatter has implications for the amount of landthat is needed for new housing construction.
Finding: The rate of construction is increased from160,000pa to 220,000pa, with only 30% (3.2million) replacing demolished houses; the rest isfor new household formation. In total there are10 million new homes.
Finding: The need for cooling is minimised in thedesign of new buildings (eg high thermal mass)and there are strategies to retrofit existingbuildings (eg with shading grills).
Finding: The remit of the proposed energy andhousing strategy covers location, tenure, size anddensity of housing developments over the next50 years.
9.6 Opportunities for action:lights and appliances
Historically, the greatest increase in energydemand in the home has come from theacquisition of more electrical equipment – up70% from 1970 to 2001 (Figure 1.2). The biggestthreat to additional residential energyconsumption, at least over the next decade or so,
comes from the acquisition of more electricalequipment. There has to be a strong policy focuson lights and appliances, if the residential sectoris to contribute to the 60% carbon reduction.However, much UK policy in this area isdetermined by the European Commission asthese are traded goods that should be of acommon standard. In the 1990s, EU policy wasfairly rigorous and beginning to be influential,through the use of market transformationstrategies. For some groups of appliances, notablyrefrigeration and washing machines,consumption declined. In the last few years, theCommission has become less interventionist, forinstance relying on voluntary agreements withindustry, rather than mandatory minimumstandards. As a result, there has been lessconstraint on demand and electricityconsumption is rising.
Finding: Unless the present rate of growth ofelectricity use in lights and appliances can becurbed and reversed, the 60% carbon reduction inthe residential sector will be all but impossible.This requires the UK, together with other MemberStates, to focus on strong European policies, withimmediate effect.
Finding: The rapid turnover of the stock of lightsand appliances means that savings can beachieved quickly, once policy is implemented. Thiscould, even now, contribute to additional savingsto achieve the EU’s Kyoto target for 2008-12.
In the last few years, there have been examples ofmanufacturers producing new designs andequipment that is particularly profligate in itsconsumption of energy – the plasma TV is a goodexample, as it has a power rating of 350 W incomparison with the 75 W TV that it replaces. Theunnecessary high demand in digital set-top boxesis another example. In certain sectors, particularlyconsumer electronics, a reactive policy approachcannot keep pace with the evolution of newtechnology. The introduction of eco-designrequirements under the European Energy-using
Construction of newhomes must average220,000 per year until2050. By 2020 they useonly 2000 kWh per yearfor heating

90 Chapter 9: Achieving the 40% House scenario
Products Directive would encouragemanufacturers to place greater importance onenergy efficiency and demand reduction as part ofproduct design, helping to control theintroduction of profligate appliances.
Finding: Manufacturers must be encouraged toview energy efficiency as a vital component ofproduct design to prevent energy-profligateequipment appearing on the market. This couldbe achieved under the European Energy-usingProducts Directive.
Finding: Existing market transformationprogrammes, and forthcoming EU Directives,provide useful experience and the appropriateframework for tough reductions in residentiallights and appliances.
Finding: To aid consumer choice, all energy-relatedproducts would have an energy consumptionlabel, before being placed on the market.
9.7 Opportunities for action: space and water heating and low and zero carbon technologies
The 40% House strategy is to plan for the nextgeneration of technologies for space and waterheating as low and zero carbon emitters. Policy isdealing with the short-term by ensuring that gas-fired condensing boilers become the norm andthe gas network is extended, but a longer-termview is necessary.
Low and zero carbon technologies includemethods of generating electricity at thehousehold level (photovoltaics, PV, and combinedheat and power, CHP). Many of these technologiesare not yet cost-effective and will need support tobecome so. Substantial development of existingtechnologies is required, for instance, considerableadvances and cost reductions in bothphotovoltaics and micro-CHP.
At present, a significant number of householdsuse electricity either for space or water heating, orfor both. The use of electricity in the UK emits atleast twice as much carbon dioxide per unit ofdelivered energy as gas in the UK. In the 40%
House scenario, the use of electricity from thenational grid in the home for space and waterheating is minimised.
Finding: The LZC technologies could contributeabout a third of the savings to the 40% House.They are a portfolio of building-integratedmeasures (micro-CHP, solar thermal,photovoltaics, heat pumps and perhaps somewind) and community heating either with CHP orfired by biomass.
Finding: 53.6 million LZC installations for theresidential sector will stimulate new employment,both in their manufacture and installation.
Finding: This level of LZC installation will onlyoccur if there is considerable support to ensurethat the technological improvements areachieved, the cost per installation drops and thatthey can be financed.
Finding: LZC can provide 81% of the heat demandfor space and water and all of the electricity usedin the home, by 2050.
Finding: This transformation of energy demand inthe residential sector has major implications forthe utilities and particularly the electricity supplyindustry.
Finding: The preferred residential fuel may vary byregion and by house type. In the 40% Housescenario, the use of electricity from the nationalgrid is at a minimal level.
9.8 Opportunities for action:peak demand
This project has examined the proportion of peakdemand that comes from the residential sectorand the extent to which this can be reduced, as acontribution towards maintaining integrity of theelectricity supply. This is particularly important ata time when substantial capacity (coal andnuclear) is about to be retired from the system.This is not so much a carbon reduction strategy(though it contributes), more a component of theEnergy White Paper aim to improve security ofsupply.

91 Chapter 9: Achieving the 40% House scenario
There are two ways in which peak electricitydemand can be reduced through a focus on thoseuses that already contribute to the residentialpeak: first by installing and accelerating thedeployment of known, efficient equipment, forinstance light emitting diodes. Secondly byspecifically designing new equipment with alower maximum demand, which would generallycontribute to lowering the peak. There are smalladditional savings available, for instance throughfuel switching out of electricity for peak demanduses, such as cooking. Some of these – a return togas kettles – may not match consumerpreferences. When peak demand reduction iscombined with the installation of equipment thatproduces electricity in the home (eg micro-CHP),the net effect is considerable. Under the 40%House scenario, UK peak demand is reduced by 25 GW in 2050, in comparison with a 2002 peak of62 GW.
Finding: Residential energy policy can contributesubstantially to lowering peak electricity demandand hence reducing the need for generatingcapacity and infrastructure, with considerableexpenditure reductions and security of supplyimprovements.
Finding: The design and installation of lights andappliances can be optimised to reflect the need tokeep peak demand low.
9.9 Market transformation strategy and housing
There is already considerable experience of theways in which market transformation can work,successfully, with lights and appliances(Boardman 2004a, b). The same strategicapproach, integrating a range of policies, wouldfacilitate the implementation of the 40% Housescenario. The main components of a markettransformation strategy are labels, minimumstandards, procurement, grants and rebates. Suchan approach would form the basis of an overallUK housing and energy strategy.
9.9.1 LabelsA home energy label on its own will have minimalimpact – there are too many competing factorsaffecting the way people choose where they live –but is central to a product policy approach. Anaccurate, complete national labelling system, withthe information stored in a central database, isvital to a coherent housing strategy.
Currently few properties have any type ofenergy label and there is no consistent format orpublicity. Consequently, the public, and policymakers, are unaware of the inefficiency of theproperties they occupy and cannot differentiatethe good from the bad. Labelling of individualhouses is being incorporated into the BuildingRegulations (although compliance is poor) and inother policies such as the Home Information Pack,as a result of the Energy Performance of BuildingsDirective. Neither of these cover all energy use inthe home, which would be the ideal approach,particularly when future homes have zero heatingdemand and most of the energy used will be inlights, appliances and water heating. In manyhomes, the majority of appliances areincorporated into a fitted kitchen – a trend thatseems to be increasing – and should beconsidered as fixed entities. In all cases, the labelis based on a theoretical calculation – forinstance, what would be required to achieve adefined internal temperature – rather thanreflecting the bills and unknown lifestyle of theoccupants. It is therefore a rough guide, but stillone that allows for useful comparisons.
The Sustainable and Secure Buildings Act 2004(the Stunell Act) enables the Building Regulationsin England and Wales to cover the protection ofthe environment and facilitate sustainabledevelopment. This includes renewabletechnologies, two-way metering and fiscalincentives for energy efficiency measures. The Actalso requires the Secretary of State to provide areport every two years on the change in theefficiency with which energy is used in buildings,the emissions of greenhouse gases and theextent to which own-generation is integrated into

92 Chapter 9: Achieving the 40% House scenario
the building stock. Local authorities have to keepsupporting documentation.
Under the Home Energy Conservation Act 1995,the 400 local housing authorities have to provideannual reports on the energy efficiency of all thehouses (no matter what tenure) in theirgeographical area. In this way, the whole countryis covered. The HECA reports are, apparently, oflimited accuracy at present (Smith 2000). Oneway to deliver the necessary focused action andclear reporting would be to upgrade the standardof the HECA reports, make them moresophisticated and use them as the basis for policy.This fits well with the requirements of the StunellAct and could utilise the results from HomeInformation Packs.
Finding: For a comprehensive markettransformation strategy, the dwelling energylabel would cover all uses of energy in the home(not just space and water heating). The use oflabels would be enforced and coverage of thewhole stock achieved as quickly as possible.
Finding: The information from the label could beheld in an address-specific database, for eachgeographical area, to provide a national policyresource. This would support local authoritycompliance with the Stunell Act and link toexisting HECA reports.
9.9.2 Minimum standards – unhealthydwellings At the moment, there is no strategy to ensure aminimum level of efficiency for all occupieddwellings. There are still homes with a SAP ratingbelow zero – a situation that was deemedvirtually impossible when the scheme wasdevised – and 9% of properties with a SAP below30 in England in 2001 (0DPM 2003a). Many ofthese are solid-walled properties, dependent uponelectricity for the main fuel, the vast majority
occupied by low-income families. The poorestpeople are purchasing the most expensivewarmth.
The Housing Act 2004 introduces a new systemfor defining homes that are unhealthy or unsafe,called the Housing Health and Safety RatingSystem (HHSRS). This provides for cold homes tobe included for that reason alone. Theeffectiveness of the HHSRS will depend upon theobligations placed on housing authorities toidentify and act on unfit properties. The BuildingResearch Establishment estimates that about 8%of properties in England are ‘actionable’ for one ormore reasons (Nicol 2003). Whilst the HHSRS ismandatory, the action and funding may bediscretionary, therefore it is difficult to predict theextent to which this new legislation will result inthe removal of the worst houses from the stock,particularly in the short term. The legislation does,however, provide a strong potential force.
It is not suggested that an unhealthy propertyhas to be pulled down and certainly not when it isvalued highly for its architectural heritage. Therequirement is for improvement to a greater levelof energy efficiency so that it provides affordablewarmth. The upgrade should be substantial sothat it does not require further work as standardsrise in the future. This could be delivered by theindividual housing authorities, through a rollingtarget that combines average improvements withthe minimum standard: a 10% improvement by2010, 20% by 2020 and so forth.
Finding: A primary objective of the proposedenergy and housing strategy is to define aminimum standard of thermal performance andensure that it is rigorously and quickly enforced.The new Housing Health and Safety RatingSystem provides the mechanism for this, as longas funds are available for local authorities andutilised.
9.9.3 Minimum standards – BuildingRegulationsThe Building Regulations define the minimumstandard of heat loss in new buildings and major
Homes that are unhealthyand do not provideaffordable warmth shouldbe the target forimprovement ordemolition

93 Chapter 9: Achieving the 40% House scenario
conversions. The next upgrade in 2005 is likely tobe framed in terms of carbon emissions per m2,rather than U values of individual components.The 40% House scenario assumes continuing,substantial improvements in the BuildingRegulations at regular intervals, including theinstallation of LZC progressively, in both existingand new dwellings. From 2020 onwards, there isclose to zero heating demand.
Research to establish the energy efficiencygains achieved in practice from the currentBuilding Regulations – post-occupancyevaluations – together with better analysis of theU values ascribed to individual constructionmethods would both go towards ensuring thatthe standards are accurate in their consumptionpredictions (Olivier 2001). At present, new housesare often built in ignorance. Poor design detailsand construction methods can annul many of thebenefits of the added insulation. Thus, enforcingthe Building Regulations, both through thestandard of what is built and in their applicationto the existing stock, is a major challenge. Itrequires:• a better-educated public to demand good
quality advice and service, and to know whentheir plans might interact with the BuildingRegulations;
• more training in the construction industry(including small builders) to ensure that theyare scrupulous at informing the public aboutthe required standards and that what ispromised is actually delivered;
• more resources for local authorities, so thereare more and better-trained building inspectorsand less reliance on builders self-certificating;
• greater emphasis in the Building Regulationson performance criteria, for instance pressuretesting, to ensure that the whole buildingachieves the defined and designed standard.
The standard of new accommodation provided bysocial landlords – local authorities and housingassociation – will improve with the BuildingRegulations. The homes of low-incomehouseholds should be disproportionately efficient
and higher than specified in the BuildingRegulations. This is already the situation inScotland where new housing associationdwellings have to obtain a SAP rating of 85-90,which is above the present English BuildingRegulations. In Wales, sustainable development isa legal requirement of all policies.
The Energy Efficiency Partnership for Homeshas already introduced an annual trainingprogramme for 45,000 people, to prepare for theanticipated, mandatory installation of condensingboilers in the 2005 Building Regulations (EEPH2004). Each successful trainee gets a City andGuilds certificate. This process should be repeatedto include low and zero carbon technologies. If,under the 40% House scenario, the BuildingRegulations require the installation oftechnologies such as solar hot water heaters, thenthe building industry will be required to upgradetheir skills on a regular basis.
Finding: In order to provide affordable warmth,despite higher fuel prices, the standards of newconstruction of social housing would be to ahigher standard than those for the general public.
Finding: To ensure that the expected savings areachieved, the Building Regulations wouldincorporate, or be redefined as, performancestandards.
Finding: To aid the deployment of LZCtechnologies, they could be specified in theBuilding Regulations, increasingly, for both newand existing dwellings;
Finding: If an ongoing strategy for BuildingRegulation standards is identified, even in themost general terms over the next 40 years, theextent of improvements can be identified,appropriate technologies prepared andmandatory training provided for installers andthe construction industry.
9.9.4 Procurement and exemplarsA clear policy focus on procurement and thetesting of low and zero carbon techniques (inpreparation for new Building Regulations) is

94 Chapter 9: Achieving the 40% House scenario
required. Demonstration projects in the UK andexperience in other European countries wouldclarify any lessons and causes of concernsurrounding new approaches and technologies,such as ever-wider cavity walls. To date, there areonly a few advanced demonstration schemes,such as BedZED and the York housingdevelopment being constructed as a test for thelikely 2005 Building Regulations (Lowe et al 2003).
New building-integrated technologies arecurrently supported by £60 million pa in grantsthrough Clear Skies to encourage the take-up ofmore efficient new equipment, for instance solarthermal, photovoltaics and heat pumps. Most ofthe initial grants have been used for solar thermalinstallations, as the individual grant level isinadequate to encourage the more advanced andexpensive technologies. Really innovativetechnologies, such as integrated wind turbines,are not yet considered. This scheme providestoken support for new ideas rather than adeveloped procurement programme.
Finding: Knowledge of the combined effects ofdemand reduction and building-integrated lowand zero carbon technologies would be increasedsubstantially if each local authority had at leastone demonstration development, like BedZED, assoon as possible.
9.9.5 Grants and rebatesThe traditional role of grants in a markettransformation strategy is to grow the market fornew technologies by reducing the unit cost. Thisshould be a limited initiative, until demand forthe product is secure and it is manufactured byseveral companies. With housing, however,existing grant schemes are used principally toimprove the worst housing, mainly for the fuelpoor occupants – not to boost demand for a newtechnology. The effect of most of these grants isto improve the energy efficiency of the propertyby about 20 SAP points. The recent fuel povertyaction plan sets the objective of raising propertiesto 65 SAP points in England (DEFRA 2004c), as fuel
poverty is deemed to be unlikely above this level.In Scotland the target is 65-70 SAP points. Thefight against fuel poverty is both a moralimperative and a legal requirement, but resourcesare scarce and there appears to be no strategicdebate about the validity of insulating buildingsthat should, sometime soon, be pulled down. Thepresent approach is fossilising the existing stock,albeit for humane reasons.
The rented sector suffers from the problem of‘split incentives’ – it is the tenant that benefitsfrom investment in energy efficiency by thelandlord. This problem is particularly acute in theprivately-rented sector, where there is aconcentration of old, energy-inefficient propertiesoccupied by low income households sufferingfrom fuel poverty. In 2004, the Governmentintroduced the Landlord Energy Saving Allowance(energy efficiency investments can be offsetagainst tax), lower VAT on some energy savingmeasures and a Green Landlord Scheme. The neteffect of these initiatives is difficult to predict.
The role of grants needs to be reassessed, inthe context of a realistic approach to eradicatingfuel poverty. As fuel prices rise, the numbers infuel poverty will increase again, forcing thedevelopment of a clearer fuel poverty strategy.Meanwhile, there is a role for grants to the non-fuel poor, for instance to encourage greaterenergy efficiency through stamp duty rebates. Thepoint of sale is a good time to intervene.
Finding: An energy and housing strategy wouldclarify the role of grants and the extent to whichthese are primarily focused on eliminating fuelpoverty, as at present, and whether additionalresources are also needed to encourage bestpractice, as in a traditional market transformationstrategy.
9.9.6 Summary: the complete strategyThe net effect of policy today is a few initiativeswhich maintain the present housing stock, ratherthan transform it towards greater energyefficiency. The proposed energy and housing

95 Chapter 9: Achieving the 40% House scenario
Table 9.3: Main variables in 40% House scenario compared to 1996 baseline
Variable 1996 – baseline 2050 – 40% HousePeople and dwellingsPopulation (millions) 59 66.8Household size (people per household) 2.47 2.1UK household numbers (000s) 23,900 31,800UK rate of new construction (pa) 162,000 220,000UK demolition rate (pa) 8,357 80,000m2 per person 34 38m2 per dwelling 84 84 (refurbished)
74 (new)Building fabricSpace heating demand (kWh per household) 14,600 8,300 existing
2,000 newVentilation rate (air changes per hour) for new buildings 3.5 0.5Energy usesInternal temperature (°C) – zone 1 18.3 21Internal temperature (oC) –zone 2 17.3 18Cooling temperatures No air No air
conditioning conditioningElectricity consumption in lights and appliances, 3,000 1,680including cooking (kWh per household)Energy for hot water, kWh per household 5,000 3,400*Supplying energy demandGas boilersownership 69% 8%efficiency 68% 95%Electric heatingownership 9% 10%efficiency 100% 100%Community heating with CHP and biomass ownership 0% 22%Micro-CHPownership 0% 21% (Stirling)efficiency (heat:electricity) 85:10 80:18 (Stirling)
20% (fuel cell)55:35 (fuel cell)
Heat pumpsownership 0% 9%efficiency 300% 300%Photovoltaics (electricity production)ownership 0% 30% (20m2,
15% efficiency)Solar thermal water heatingownership 0% 60% (5m2)Emissions factorselectricity (kgC/kWh) 0.136 0.1gas (kgC/kWh) 0.049 0.049
Source: UKDCM* net of solar hot water

96 Chapter 9: Achieving the 40% House scenario
strategy would develop a proper markettransformation approach with clear, statedtargets (Table 9.3). In the 40% House scenario by2050, the 21.8m existing homes have beenrefurbished up to a high standard.
Finding: By 2050, the aim is for the average,existing property to have a SAP of 80 (the level oftoday’s new build) and for there to be no homeswith a SAP lower than 51 points (today’s average).
Finding: A detailed, comprehensive markettransformation strategy for all energy use in thehousing stock could be a major deliverymechanism for the 40% House scenario. Thiswould identify the contribution of individualpolicies, the target standards for specific datesand the role of different delivery agents.
In addition to the Energy White Paper, thestarting point for this project was the RoyalCommission on Environmental Pollution’s 2000report and its four scenarios (Table 1.2). The maindifferences between the RCEP scenarios is theextent to which demand could be reduced andthen the way in which the resultant demand ismet from varying combinations of renewables,nuclear and carbon sequestration. The carbonreduction achieved in the 40% House scenariocomes from a combination of demand reduction(two-thirds) and the provision of buildingintegrated low and zero carbon technologies(one-third).
The carbon intensity of the electricity from thenational grid has been kept stable at the 2030level until 2050. Further or alternative reductionscould come from the energy supply system –there has been no assumption of carbon captureand storage (also known as carbon sequestration),seen by some as a necessary end-of-pipe solutionto reducing carbon emissions, and no newnuclear. The supply mix has been kept at the 2030level and the effect of the reductions inresidential demand on carbon emissions per unitof centralised electricity have been ignored.
Finding: The 40% House scenario hasdemonstrated the substantial extent to whichresidential demand can be reduced through acoherent policy approach, without resorting tocleaner centralised electricity generation. Indeed,central capacity is reduced.
9.10 Other considerationsThere are a number of considerations thatunderpin the development of a markettransformation for housing which must beaddressed to ensure full coherence andeffectiveness of any strategy.
9.10.1 Responsibilities of local and regionalauthoritiesThe local and regional housing authorities have amajor role in the delivery of housing policy andthis could be reinforced. There are numerousindividual policy activities and reports thatinfluence the housing stock – Warm Zones,Housing Market Renewal, English Partnerships,Energy Efficiency Plans for Action, the EganReview and Sustainable Building Partnerships – toname but a few. It has been beyond the scope ofthis project to examine the potential combinedeffect of all these initiatives, but one of thereasons behind the call for an energy and housingstrategy is to ensure that these components addup to a coherent whole.
The devolution of greater, but flexible,responsibility to local authorities (whetherregional or district) appears appropriate. The firststudy on Housing Market Renewal demonstratedthat the local authorities, when given thefreedom and resources, give priority to demolitionof obsolete properties as a housing renewalstrategy (Cole and Nevin 2004).
The new Regional Housing Boards are gaininga clearer remit, which will be defined further in2005 (ODPM 2004i). They were establishedfollowing the publication of the SustainableCommunities Plan in February 2003 by the ODPM,with the aim of improving regional planning forhousing.

97 Chapter 9: Achieving the 40% House scenario
Finding: The devolution of responsibility to bothregional and district housing authorities, ifproperly funded, represents an opportunity for atargeted approach to an energy and housingstrategy, whilst recognising the need forflexibility.
9.10.2 Energy efficiency versus energyconservationThe trend is towards larger appliances (fridgesand washing machines) and more housing areaper person, increasing the demand for energy,sometimes in the name of energy efficiency.
Property developers needto design dwellings forsmaller households

98 Chapter 9: Achieving the 40% House scenario
Energy efficiency is a relative term – in thecontext of the European Energy Label, it is definedas the demand for energy per unit of ‘service’, forinstance the volume of a refrigerator or theweight of clothes washed. As the equipment getslarger, it is easier to achieve a high level of energyefficiency, which is the strategy thatmanufacturers have adopted. In 1996, manywashing machines had a capacity of 4.5-5kg. Nowmost of them are 6-7kg, even though the averagenumber of people using that washing machinehas declined. The machines are both more energyefficient and using more energy than they wouldhave if they had stayed the same size.
The energy penalties of larger, but efficient,appliances are not great, but they are there. If theformat of the EU Energy Label is the main reasonthey are being designed, manufactured andmarketed as larger appliances, it would bebeneficial to alter the label and remove theincentive. If the trend is then still towards largerappliances, it will clearly be because of consumerpreferences. The expectation is that energy labelsbased on absolute consumption, not relativeperformance, would encourage downsizing. Thisis the policy behind the design of the energy labelfor cars in many countries, such as Denmark.
A similar theme is developing with housing,where the two dominant trends are occurring atdifferent timescales: the turnover of the stock isslow, whereas new (smaller) household formationis relatively rapid. As a result, smaller householdshave to live in properties that were originally builtfor much larger families and the amount of spaceoccupied per person is increasing. The energypenalties of additional space per person are notlarge if the home is energy efficient. In 1996, asuper-efficient home cost £2/m2 pa to heat,whereas the average was £6/m2. However, in theleast efficient homes, the cost was £15/m2 – a verysubstantial penalty for extra space (DETR 2000).
Most developers (outside London) have beenbuilding properties for the archetypal family,despite its diminishing importance, withoutpaying sufficient attention to the present and
future household mix. With household size nowbelow 2.4 people per household and falling,smaller properties and denser developments maybe more appropriate. In 2002, there were already7.4 million single-person households, 29% of thetotal. With an ageing population, this group is ofgrowing importance, and many are living in large,underused properties (Houghton and Bown2003). The poorest people spend more money perperson on household energy because the lowestquintile consists predominantly of one or twoperson households (Fawcett 2003).
Finding: Separate, but interacting, policyinitiatives are needed to enable people to moveinto more energy efficient homes and intosmaller homes. These particularly apply to elderly,single pensioners living in under-occupieddwellings.
Finding: The replacement of policy on energyefficiency with policies on absolute energydemand may encourage downsizing and couldinhibit, then reverse, the present trend towardslarger equipment and more space per person. Thiswould apply to policy on the energy labelling ofbuildings in the UK, under the EnergyPerformance of Buildings Directive and throughthe Home Information Pack.
9.10.3 Capital expenditureThe home of the future will have more capitalequipment – this could be solar panels, microcombined heat and power, heat pumps – all ofwhich will involve additional capital expenditureto the single boiler there at present. Consumersmay obtain the same economic utility from eachpiece of equipment – it is used less frequently, solasts longer – but there is a peak of capitalexpenditure when a new technology is adopted.
At the same time, the utilities will have toinvest less in central plant, as there will be a lowerlevel of demand for centralised electricity. This isbecause:• the demand for electricity will be lower, as
lights and appliances become more efficient;

99 Chapter 9: Achieving the 40% House scenario
• there will be less use of electricity for space andwater heating – because of its carbon intensity,policy will have focused on reducing thisthrough insulation and alternative energysources;
• there will be more building-integratedgeneration, for instance through photovoltaicsand micro- and community level CHP.
This situation requires a switch in capital outlay,from utility to householder. This could beachieved through a greater outlay by theindividual householder or result from thedevelopment of energy service companies(ESCos), whereby the utilities invest in individualhomes instead of centralised plant.
The net effect for society could be beneficialbecause the electricity transmission anddistribution systems will only need to beupgraded and maintained to a lower capacitylevel. Significant replacement of the ageingelectricity grid is needed in the near future andthis, along with the decommissioning of coal andnuclear plant, gives the opportunity to planstrategically now.
One of the issues for policy is to recognisethese different capital requirements and tosupport householder investment. Policy support isparticularly important for low-income householdsthat are renting or have no capital: 28% of allhouseholds have no savings and, by implication,no access to capital loans. Amongst the pooresthouseholds, those with a weekly income of lessthan £200, the proportion with no savings rises tonearly half (46%) (NCC 2004). The aim of policyhas to be to ensure that the homes of the poorestpeople are disproportionately energy efficient sothat they have affordable energy services, even attheir low incomes.
Finding: Strong financial support will need to befocused on the owners of existing properties ifthey are going to improve their properties to theextent envisaged. These could include stamp dutyrebates.
Finding: The policies envisaged in the 40% Housescenario involve substantial capital flows, in non-traditional directions. Policy is needed topromote investment in energy efficiency and lowand zero carbon technologies for all groups insociety, both individually and collectively. Oneroute of financing the LZC technologies in thehome may be through energy service companies.
9.10.4 Equity Equity is now a main driver of energy policy,through the provision of adequate and affordablewarmth (and all other energy services in thehome), and an important component of theapproach taken in this project: climate changemitigation must not be achieved at the expenseof the poor.
Recent policies to reduce fuel poverty havefocused on raising incomes and lowering energyprices, and have had less effect on improving theenergy efficiency of the properties they occupy.This makes the fuel poor vulnerable to energyprice increases as a result of world energy trends.Additional upward pressure, particularly onelectricity prices, will come from the increasingscale of the Energy Efficiency Commitment, theRenewables Obligation and other utility-basedpolicies, if these result in higher costs beingpassed through to customers. In February 2004,before the recent price increases, the Fuel PovertyAdvisory Group stated that Governmentexpenditure on reducing fuel poverty needed toincrease by 50% (FPAG 2004). This is now aconsiderable underestimate.
Existing policies are strongly criticised becausethey are having difficulty identifying and treatingthe worst homes. However, if they become bettertargeted, money will be spent on continuing thelife of the worst properties. Although this isessential whilst occupied, there must beimmediate intervention once one of theseproperties becomes vacant, so that no newoccupant suffers. A complementary approach is to

100 Chapter 9: Achieving the 40% House scenario
increase the quantity of new dwellings with lowcarbon footprints (from all uses of energy),probably also smaller in size (45-65m2) specificallyfor the young or elderly in town centres. Thesewould provide an acceptable choice for those fuelpoor currently living in dreadful homes.
Finding: The 40% House scenario includes new,appropriate construction as a major contributorto reducing fuel poverty and releasing homes fordemolition. The existing homes of the fuel poorneed to be upgraded to a standard of SAP 80, asquickly as possible, to offset fuel price rises whilstensuring that fuel poverty is eradicated.
9.11 Minimising costs Policy can be used to reduce the cost implicationssubstantially through an integrated, well-structured strategy such as markettransformation (Boardman 2004b). Capital costswill be offset by considerable savings in runningcosts, particularly if fuel prices continue to rise.Hence, these details interact strongly with anassessment of the costs of the programme and ofthe constituent parts. The emphasis in the 40%House scenario has been on refurbishment ratherthan demolition, partly in recognition of thediffering costs associated with these policies. Thefollowing are some of the components of thedebate about ways to minimise costs:• Early warning to industry about pending
legislation and standards means they can planand incorporate the necessary design changesinto normal product development. This wasachieved with the European minimum standardfor fridges and freezers when a 15%improvement in the efficiency of models soldwas achieved over a 15 month period, whilst theretail cost per appliance dropped 14%(Schiellerup 2002; Boardman 2004b). Theaggregate saving to consumers was £285m pa,so there was a substantial net benefit tosociety.
• Expenditure on awareness-raising (eg throughadvertising) is necessary for an informed,
supportive public and the cost accrues toGovernment or utilities.
• Incorporating more efficient lightingequipment into the home will require somenecessary household expenditure, for instancethe switch over to light emitting diodes overthe next 25 years.
• Upgrading the quality of the existing housingfabric to the standard required will be costly.The expected increase in activity to eradicatefuel poverty and offset the effect of rising fuelprices will mean that some significantproportion of this expenditure stays theresponsibility of central government, forinstance in homes where the energy andmoney savings are insufficient to repay thecapital.
• Incentives to richer households, for instancethrough stamp duty rebates, would involvegovernment expenditure, but this could beoffset by VAT receipts on the same investments.
• The introduction of LZC technologies toindividual houses is expensive and the extentto which this is offset will depend upon thetariff paid to individual householders for theexport or own-use of electricity. A feed-in tariffthat covers the cost of the electricity generatedwould reduce some of these costs to nil. Analternative funding avenue is through energyservice companies.
• Demolition potentially involves the largestexpenditure. The costs depend upon the valueof the property demolished: if it is alreadydeclared unhealthy or is sitting in a flood plainand uninsurable, then they will be lower. Thesale of a development site will offset the costsin the former, but not the latter, case. Ifresponsibility has been transferred to localauthorities or regional housing boards, thencentral Government has to ensure they havesufficient funds.
• A lack of planning, or emergency responses,increase the costs considerably. An earlycommitment to a trajectory that gets the UK tothe 60% target would minimise these costs,

101 Chapter 9: Achieving the 40% House scenario
whether they fall on the householder, theGovernment or other funders.
Finding: The capital investment associated withachieving the 40% House scenario will beconsiderably higher than present levels ofexpenditure on demand reduction in theresidential sector, whether funded byGovernment, the utilities, or private individuals.
Finding: The cost implications of a 40% Housescenario will be minimised by an early, clear,rigorous approach to planning, so that everyone,from the construction industry, to appliancemanufacturers, to local authorities andhouseholders, knows the direction of policy andcan plan accordingly.
9.12 People transformationAchievement of the 40% House scenario requiresthe active involvement and commitment of thepublic, particularly if gains in the efficiency of thehousing stock are not to be lost through thepurchase of additional electrical equipment.Whilst product policy can deliver a great deal, it ismost effective when working with the grain ofsociety. Therefore, policy should focus ondeveloping an informed society that is supportiveof strong climate change mitigation. This will notbe easy, particularly as the dominant mindsetappears to be in line with the World Marketsscenario at present (Figure 2.2). The importance ofpublic education (including practical initiatives) todevelop understanding, support and everydayskills for low-impact ways of life cannot be
stressed enough. This is needed at all levels andfor all ages.
More specifically, the 40% scenario also impliesa huge programme of training in the skills neededto design, construct and maintain a low-energybuilding stock, the appliances used within it andthe technologies on which all will depend. Theintegrated approach to education and training forsustainable communities set out in the Eganreview (ODPM 2004g) is one very much inkeeping with the scenario, and one that needsimplementing urgently.
Finding: An immediate training programme willensure that the workforce has the skills toimplement and maintain the 40% Housescenario.
Finding: If UK society continues to develop alongcurrent trends, no carbon emissions reductionsare expected by 2050.
A key element of the 40% House scenario is thedevelopment of a high level of carbon awareness,so that people want carbon reductions and areprepared to take personal responsibility. One wayof achieving this would be through a system ofpersonal carbon allowances (or tradable domesticquotas). This has a number of benefits, as it:• is equitable – everyone has an equal allowance;• will rapidly lead to an informed society, as
people understand the carbon impact of theirdirect fuel purchases;
• ensures that carbon reductions can beguaranteed (by the amount of allowancesissued);
• gives individuals the choice of where to maketheir carbon cuts, for instance offsettingemissions from travel with carbon reductions inthe home.
Although not a major focus of this project, it is afast developing concept – there has already beena Domestic Tradable Quotas (Carbon Emissions)Bill, introduced by Colin Challen, MP. Further workis being undertaken in this area through the UK
Methods to encouragepersonal responsibility willbe needed by 2050

102 Chapter 9: Achieving the 40% House scenario
Energy Research Centre’s Demand Reductiontheme.
There is a strong link between policies on fuelpoverty and personal responsibility: low-incomehouseholds cannot be expected to takeresponsibility for their carbon impact when theyhave no capital or control over the energyefficiency of their home. Progress towardspersonal carbon allowances or residential carbontaxation depends upon minimising hardship forlow-income households.
An alternative approach to triggering publicaction and involvement would be considerablyhigher energy prices. To achieve the 60% carbonreduction target, real prices would have to risesignificantly. Household energy costs are alreadyrising, with resultant increases in fuel poverty. Theexpectation is that UK governments would bereluctant to have a policy that relied on majoradditional increases in fuel prices, particularlythose sufficient to confirm a 60% reduction incarbon emissions, as these are both unpopularand regressive.
Finding: Research is needed into the role thatcould be played by personal carbon allowancesand to identify appropriate precursor policies thatprepare and aid the public. The timescale forimplementation needs to be considered, but aslow approach (longer than 10 years, say)jeopardises the 60% carbon reduction by 2050.
In preparation for greater carbon awareness,policies would be introduced to help make thepublic more aware of their carbon budgets –some are already in development. For instance,Ofgem is in discussion with utilities about thedevelopment of more informative bills thatidentify the actual amount of energyconsumption over the last five quarters at thehousehold level. Elsewhere in Europe this hasproved to be an effective way of focusing people’sminds and bringing forward energy-savingactivity (Roberts et al 2004, Darby 2001). Aseparate initiative, required by the European
Directive on electricity liberalisation, is theprovision of information about the electricity fuelmix being purchased (the quantity that has comefrom coal, gas, nuclear or renewable generation)with or on utility bills (known as disclosure). TheDepartment of Trade and Industry are requiringthis information to be sent to customers fromOctober 2005. Another way in which to encouragelow-carbon responses from consumers is througha change in the tariff structure, so that unit costsincrease with consumption. The reverse is thecurrent situation.
Finding: The design of utility bills, electricitydisclosure labels, tariff structure and theexistence of the standing charge could all beconsidered in terms of discouraging consumptionand improving the energy literacy of society. Atthe moment, they neither inform nor encouragecareful consumption. This is a disservice toconsumers at a time of rising energy prices andcarbon concern.
9.13 Summary and conclusion:a 40% society
Society in 2050 under the 40% House scenariowould contain these elements:• there is considerable concern about climate
change and a strong support for effectiveinternational action to reduce greenhouse gasemissions, particularly in the developed world;
• this concern is translated into comprehensiveformal and informal training for low-carbonways of life, from childhood through toprofessional and vocational training;
• a 60% reduction in carbon dioxide emissions in2050 is seen as a minimal EU level ofcommitment that must be achieved;
• the UK has a national target of a higherreduction in greenhouse gas emissions;
• there is a high level of carbon literacy in society,so actions are focused and effective;
• there is a willingness by individuals to takeaction at home and elsewhere;

103 Chapter 9: Achieving the 40% House scenario
• companies are developing low carbon products:insulation, low-energy lights and appliances,and for generating electricity and providingheat in the home. The UK is at the forefront ofthese developments, supported by Government;
• proven low carbon technologies are adoptedquickly by householders, creating andmaintaining a market for these innovativeindustries;
• a strong community focus imbues decisions,reinforcing a regional housing policy and givingrise to denser town centres and thedevelopment of community-level energynetworks;
• world fuel prices have risen substantially;• equity is an important dimension, resulting in
priority being given to policies that help thedisadvantaged and elderly, along with a focuson healthy housing to provide the poorest withaffordable warmth and other energy services;
• all of this has been achieved as a result of aclear energy and housing strategy thatoriginated in 2005, despite the large number ofGovernment departments and stakeholdersinvolved.
The overarching conclusion of this project is thatthere is a desperate need for a clear strategy thatbrings housing and energy policy together, in thecontext of climate change commitments. Therange of stakeholders, Government departmentsand present policy initiatives is not delivering therate of change and focus required by the 60%target. The project has demonstrated that majorreductions of carbon dioxide emissions could beachieved by 2050 in the residential sector, butonly if tough decisions are taken soon in severalpolicy arenas. These policies will contribute to allfour of the Energy White Paper objectives: inaddition to the climate change targets, the 40%House scenario reduces fuel poverty, increasessecurity of supply and even improvescompetitiveness by creating a demand for lowand zero carbon technologies that could well bedeveloped in the UK.

104 Glossary
Absorption chiller A type of chilling plant that uses heat as its energy source, as opposed to electricalenergy.
ACE Association for the Conservation of Energy.
Anaerobic digestion A process for making useful fuel gas (methane) by controlled decomposition oforganic matter by micro-organisms.
Baseload Electricity from generating plant that runs constantly through the day and night.
Bedroom standard An indication of occupation density: a standard number of bedrooms are allocatedto each household according to its composition with respect to age, sex and marital status. See alsoOvercrowding.
Biomass Anything derived from plant or animal matter (though not fossilised) – including agriculturaland forestry wastes or residues and energy crops. Biomass requires processing before use, eg chippingof tree material, drying and pelletising of crops, digestion of food or farm waste to produce methane.
Biomass boiler A device for burning biomass to provide space and water heating to a whole dwelling(or to a collection of end-users via a heat network) on a controlled time and temperature regime, andwith continuous fuel supply.
Biomass stove A device for burning biomass to provide direct radiant heat to a single room.
Building Research Establishment (BRE) The BRE is a UK centre of expertise on buildings, construction,energy, environment, fire and risk.
BREDEM Building Research Establishment Domestic Energy Model.
BREHOMES Building Research Establishment Housing Model for Energy Studies.
Carbon In this report carbon is an abbreviation of carbon dioxide. Emissions of carbon dioxide aremeasured in terms of the weight of carbon emitted. To convert tonnes of carbon (tC) into tonnes ofCO2 (tCO2), multiply by 3.67.
Carbon dioxide (CO2) Carbon dioxide contributes approximately 60% of the potential global warmingeffect of human-made emissions of greenhouse gases worldwide. The burning of fossil fuels releasesCO2 fixed by plants millions of years ago and thus increases its concentration in the atmosphere (DTI2004a).
Carbon Index (CI) The CI is based on the total annual CO2 emissions associated with space and waterheating per square metre of floor area. It is expressed as a number between 0.0 and 10.0 rounded toone decimal place. The Carbon Index (CI) can be used to demonstrate compliance with the relevantstandard under the Building Regulations 2002: Approved Document L1 (England and Wales), TechnicalStandards Part J (Scotland), or Part F (Northern Ireland).
Carbon Storage Long-term storage of CO2 in the ocean or underground in depleted oil and gasreservoirs, coal seams and saline aquifers. Also referred to as engineered carbon sequestration (DTI 2003a).
Glossary

Carbon Trust The Carbon Trust is an independent company funded by government to assist the UKmove to a low carbon economy by helping business and the public sector reduce emissions andcapture the commercial opportunities of low carbon technologies.
Cathode ray tube (CRT) A vacuum tube in which a beam of electrons is produced and focused onto afluorescent screen. The traditional technology for computer monitors and televisions, CRTs are nowbeing superseded by liquid crystal display screens.
Climate Change Levy (CCL) A levy applied to the energy use of all non-domestic sectors, subject tosome exemptions and reductions to encourage energy efficiency (DTI, 2003a).
Climate Change Programme (CCP) The UK contribution to the global response to climate change. Itsets out a strategic package of policies and measures across all sectors of the economy.
Centrally-generated electricity Electricity generated in power stations and supplied via the NationalGrid.
Clear Skies A grant scheme for a number of low- and zero-carbon technologies, open to householdersand community groups in England, Wales and Northern Ireland. See http://www.clear-skies.org/
Scottish householders and not-for-profit community organisations can apply for grants from theScottish Community and Household Renewables Initiative – see http://www.est.co.uk/schri
Combined Cycle Gas Turbine (CCGT) Combined cycle gas turbines use both gas and steam turbinecycles in a single plant to produce electricity with high conversion efficiencies and relatively lowemissions.
Combined heat and power (CHP) Combined Heat and Power is the simultaneous generation of usableheat and power (usually electricity) in a single process, thereby discarding less waste heat thanconventional generation (DTI, 2003a).
Comfort factor The proportion of an energy efficiency improvement which results in improvedcomfort or higher levels of service, instead of reduced energy consumption. For improvements tospace heating, the comfort factor is typically 30-50%. In lighting it is usually less significant.
Communal establishment An establishment providing managed residential accommodation (2001Census).
Community heating A community heating system provides heat to more than one building ordwelling from a central plant via a heat network.
Compact fluorescent lamp (CFL) Commonly referred to as low energy light bulbs, CFLs are energy-efficient replacements for ‘ordinary’ incandescent light bulbs.
Condensing mode The efficiency of a boiler can be improved if it is designed for and operated in‘condensing mode’. In the right conditions, extra energy is retained in the heating system as watercondenses (thereby giving up some heat), rather than all being lost in exhaust gases.
Conservation Area An area of special architectural or historic interest, the character or appearance ofwhich it is desirable to preserve or enhance.
105 Glossary

106 Glossary
Contraction and convergence The science-based, global climate policy framework proposed by theGlobal Commons Institute. Contraction means all governments agree to be collectively bound by anupper limit to greenhouse gas (GHG) concentration in the atmosphere, subject to periodic review.Convergence means that developed and developing countries converge on the same allocation perinhabitant by an agreed date. It combines the ‘global commons’ of the atmosphere with the principleof equal rights per person.
Daytime valley A reduction in the national electricity demand profile in between the morning andevening peaks.
Decent Homes Standard Set by the ODPM, the Decent Homes Standard is a minimum standard thatall social housing in England should achieve by 2010. A decent home is ‘wind and weather tight,warm, and has modern facilities’.
DEFRA UK Department of the Environment, Food and Rural Affairs.
Delivered energy Energy supplied to a customer. Also referred to as ‘energy supplied’. See also primaryenergy and useful energy.
Demolition Any building work which involves demolishing and rebuilding 50% or more of the externalwalls. Where a façade is retained (eg for heritage/building conservation reasons), this is still ademolition if a substantially new building is built behind the old façade.
Distributed generation Electricity generation plant that is connected directly to distribution networksrather than to the high voltage transmission systems (the National Grid). It includes much renewablegeneration (eg wind farms) as well as LZC technologies that generate electricity.
District Heating See community heating.
District Chilling Provision of space cooling to more than one building or customer, via chilled water ina network of pipes.
Domestic Energy Efficiency Scheme (DEES) The Northern Ireland equivalent of Warm Front.
Domestic Tradable Quota (DTQ) See Personal Carbon Allowance.
DTI UK Department of Trade and Industry.
Dwelling A dwelling is a self-contained unit of accommodation. Self-containment is where all therooms (in particular the basic facilities ie kitchen, bathroom and toilet) are behind a door that onlythe household can use. A dwelling can therefore be a single household or a number of householdswhich share at least one of the basic facilities but do not share living accommodation. In all stockfigures, vacant dwellings are included but non-permanent dwellings are generally excluded. Forhousebuilding statistics, only data on permanent dwellings are collected.
Energy Efficiency Commitment (EEC) The Energy Efficiency Commitment is an obligation placed on alldomestic energy suppliers to achieve a specified energy saving target through the installation ofenergy efficiency measures in homes across Great Britain. At least 50% of the benefits should accrueto vulnerable households. A similar scheme (the Energy Efficiency Levy) operates in Northern Ireland.

107 Glossary
Energy Performance of Buildings Directive (EPBD) This European Union directive requires eachmember state to: establish a methodology for rating the energy performance of buildings; ensurethat energy certificiates are issued when a building is built, sold or rented; establish an inspectionregime for large energy installations in buildings; ensure that LZC technologies are considered when anew building is being designed.
Energy Efficiency Standards of Performance (EESoP) The precursor of EEC.
Energy-using Products Directive A European Union framework directive to reduce the environmentalimpacts of energy-using products (except vehicles), paving the way for the development of eco-design requirements on a product-specific basis.
Embedded generation An alternative term for distributed generation.
Emissions factor The carbon emitted as a by-product of generating one kilowatt-hour of energy from afuel or mix of fuels. Different electricity generators are brought on-line to meet peak demand, so theoverall fuel mix typically changes, resulting in different emissions factors at different times of dayand at different seasons. Expressed as kilogrammes of carbon (or carbon dioxide) per unit of deliveredenergy (kgC/kWh or kgCO2/kWh).
Energy centre In a community heating scheme, the energy centre is the building that houses theenergy generating plant. This may include boilers or CHP units.
Energy Conservation Authority (ECA) One of the 408 local authorities in Great Britain responsible forreporting on all the housing in their area under the Home Energy Conservation Act. The HousingExecutive for Northern Ireland acts as ECA for the whole province.
Energy from waste Electricity, and sometimes heat, generated from municipal waste. Cleanertechniques than incineration include pyrolysis or gasification of waste (see Methane UK report atwww.eci.ox.ac.uk).
Energy Saving Trust (EST) The Energy Saving Trust was set up by the UK Government following the1992 Rio Earth Summit, with the goal of achieving sustainable and efficient use of energy, and cuttingcarbon dioxide emissions from the residential sector. The EST is a non-profit organisation funded bygovernment and the private sector.
Energy Service Company (ESCo) An organisation that can provide energy supply (both conventionaland low and zero carbon) and demand management to enable implementation of the least costoption, taking into account the cost of borrowing.
Foresight The DTI-sponsored Foresight programme produces visions of the future, to guide strategy.Foresight projects aim to identify opportunities from new science and technology, or to consider howfuture science and technology could address key future challenges for society.http://www.foresight.gov.uk/
Fuel cell A fuel cell produces electricity in a chemical reaction combining hydrogen fuel and oxygen(present in the air). Hydrogen is often extracted from natural gas (CH4). There are many differentdesigns of fuel cell, each with advantages and disadvantages. In the context of the 40% House report,fuel cells could be used to generate electricity in combined heat and power applications, with betterelectrical efficiencies (and thus carbon savings) than current designs using a Stirling engine.

108 Glossary
Fuel Poverty Of the various contested definitions, the one most often used in policy-making is: Ahousehold is in fuel poverty if, in order to maintain a satisfactory heating regime, it would be requiredto spend more than 10% of its income (including Housing Benefit or Income Support for MortgageInterest) on all household fuel use.
Geothermal energy Energy from below the surface of the earth. In a small number of locations, thegeology allows useful heat to be extracted from deep below the ground.
Government Actuary’s Department (GAD) The source of forecasts, studies and reports on UKpopulation.
Greenhouse gas (GHG) A greenhouse gas is one that contributes to global warming. The mostsignificant GHGs are carbon dioxide, methane and nitrous oxide. Water vapour is also a GHG, but thewater vapour in the atmosphere is largely beyond human control.
Heat network A system of pipes taking heat, typically in the form of hot water, from a centrally sitedenergy centre to any number of homes, or other end-users.
Heat pump Heat pumps work like a refrigerator, moving heat from one place to another. To move heattakes energy. Energy can come in the form of electricity (vapour compression) or be thermal energy(absorption heat pumps). Heat pumps can provide space heating, cooling, water heating andsometimes exhaust air heat recovery. A ground-source heat pump typically gives out 3 units ofwarmth for each unit of electricity used.
Heat recovery A technique for maximising efficiency by making use of heat that would otherwise bewasted (eg in hot exhaust gases).
Home Energy Conservation Act (HECA) HECA requires all Energy Conservation Authorities to reportannually on the energy efficiency of the housing stock in their area.
Home Energy Efficiency Scheme (HEES) A grant scheme for low income, fuel-poor households to funda range of insulation and heating measures. The name HEES is still in use in Wales, but has beensuperseded in England (Warm Front), Scotland (Warm Deal) and Northern Ireland (Warm Homes).
Homelessness A homeless person is someone who has no accommodation available, or hasaccommodation which cannot be secured or is moveable.
Household A household comprises one person living alone, or a group of people (not necessarilyrelated) living at the same address who either share at least one meal a day or share livingaccommodation, that is, a living or sitting room. The occupant(s) of a bedsit who do not share asitting or living room with anyone else comprise a single household.
Housing Benefit Housing benefit is paid by local authorities to assist with rent payments of tenantswho are on state benefits or on low incomes.
Housing Corporation Funds and regulates registered social landlords (RSLs) in England. Other bodiesperform similar roles in Northern Ireland, Scotland and Wales. The Corporation is sponsored by theODPM. http://www.housingcorp.gov.uk/

109 Glossary
Housing Health and Safety Rating System (HHSRS) This replaces the Housing Fitness Standard by theautumn of 2005. The central concept is one of hazard, and separate hazards in a dwelling areweighted according to the harm that could result. Excessive cold and high temperatures are classifiedas potentially hazardous to the elderly (no other age group). For each, the ‘ideal’ is stated to be a SAPrating of 80-85, with minimum and maximum temperatures of 16.25oC and 25.25oC.
Income Support for Mortgage Interest (ISMI) Government assistance for those on low incomes withrepayments on mortgages of up to £100,000.
Infiltration Uncontrolled exchange of (cold) outside air for (warm) inside air, leading to unnecessaryheat loss. The term ‘infiltration’ is used to refer to uncontrolled losses: controlled exchange of air,which is necessary for human health and to avoid damage to the building fabric through excesswater content, is ‘ventilation’.
Kyoto Protocol The Kyoto Protocol binds those industrialised nations that are signatories to reduceemissions of greenhouse gases by an average of 5.2% below 1990 levels by 2008-2012. The UK islegally bound by its Kyoto target to reduce greenhouse gas emissions by 12.5% over that period.Originally signed in 1997, the protocol came into force on 16th February 2005.
Learning and Skills Council (LSC) The Learning and Skills Council is responsible for funding andplanning education and training for over-16-year-olds in England and Wales.
Light emitting diode (LED) A semiconductor device that emits visible light when an electric currentpasses through it. It is highly efficient and long-lived, and has a low power requirement.
Listed Building A building of special architectural or historic interest.
Load factor Usually applied to generating plant, load factor is the ratio of the average electrical load tothe theoretical maximum load, expressed as a percentage.
Low or zero carbon (LZC) technologies Low or zero carbon technologies are taken to be renewableenergy generators or technologies with better fuel efficiency than conventional technologies, andwhich are retrofitted to or integral to the building or community. Examples of LZC technologies arecommunity heating with CHP or biomass, combined heat and power (CHP), solar water heaters,ground-source or air-source heat pumps, solar photovoltaics, and wind turbines.
Major photovoltaics demonstration programme A programme funded by the DTI to installphotovoltaic systems on domestic and community buildings. Grants of up to half the installation costwere provided.
Market transformation Changing the market for products and services to reduce environmentalimpact, using a combination of information, incentives and regulation in a coherent strategy.
Market Transformation Programme (MTP) The MTP is a DEFRA initiative that develops policy strategiesfor improving the resource efficiency of traded goods and services in the UK. MTP uses marketprojections and policy scenarios to explore alternative future developments.
Micro-CHP CHP at the scale of a single dwelling, and used in place of a domestic central heatingboiler.

110 Glossary
MtC Million tonnes of carbon (ie carbon dioxide weighed as carbon only).
Municipal Solid Waste (MSW) All rubbish collected by local authorities (or their contractors), includingrubbish from homes, schools, colleges and co-collected trade waste.
ODPM UK Office of the Deputy Prime Minister, responsible for policy on housing, planning, devolution,regional and local government and the fire service.
Ofgem Ofgem (Office of Gas and Electricity Markets) is the UK energy regulator, charged with: makinggas and electricity markets work effectively regulating monopoly businesses intelligently securingBritain’s gas and electricity supplies meeting its increased social and environmental responsibilities.Ofgem oversees the operation of the Energy Efficiency Commitment.
Overcrowding The UK Census of 2001 uses an occupancy rating to give a measure of under-occupancyand overcrowding, based on the ‘room standard’ of the 1985 Housing Act. This relates the actualnumber of rooms to the number ‘required’ by members of the household, based on the relationshipbetween individuals and their ages.
Payback The capital cost of a device can be related to the energy savings it makes in terms of apayback period. If a device costs £120 and saves £20 a year, the simple payback period is six years.Payback should also take account of the cost of borrowing the initial investment.
Permanent dwelling A building whose structure should satisfy at least one of the following criteria:the walls are of brick, stone and mortar, concrete, breeze block or similar material the roof is ofceramic tiles, slate, thatch, shingle or concrete the length of the shortest wall is at least 4.5 metres – it has over 60 years of life span (Housing Statistics 2002)
Personal Carbon Allowance (PCA) Under a system of PCAs, each adult would be given an equalallowance covering carbon emissions generated from fossil fuel energy used within the home and forpersonal transport, including air travel. Allowances would be tradable, and would decrease over timewithin a mandatory, UK-wide scheme. The primary aim of the scheme would be to deliver guaranteedlevels of carbon savings in successive years in an equitable way.
Photovoltaics (PV) A photovoltaic solar cell converts light directly into electricity. Light striking thefront of a solar cell produces a voltage and current – it has no moving parts. A group ofinterconnected cells creates a solar panel and solar panels, in turn, can be connected in series orparallel to create a solar array and any voltage-current combination required.
Primary energy Primary energy to deliver a given service is the energy converted when a fuel isburned, for instance, to generate electricity. With the current electricity generation system, primaryenergy is roughly three times delivered energy: for each unit of electricity delivered to the consumer,two units are lost in generation and transmission. See also delivered energy and useful energy.
Pyrolysis The production of gaseous fuels by heating hot materials containing organic matter in theabsence of air.
Royal Commission on Environmental Pollution (RCEP) An independent standing body established in1970 to advise the Queen, the Government, Parliament and the public on environmental issues.

111 Glossary
Reformer A device for processing a fuel such as methane (CH4) into hydrogen (H2) for use in a fuel cell.
Refurbishment Repairs and alterations to a building that involve a lesser degree of destruction thandemolition.
Registered Social Landlord (RSL) Housing associations, trusts and co-operatives registered with theHousing Corporation.
Renewable energy Energy flows that occur naturally and repeatedly in the environment. This includessolar power, wind, wave and tidal power and hydroelectricity. Solid renewable energy sources includeenergy crops and other biomass; gaseous renewables come from landfill and sewage waste.
Renewables Obligation The obligation placed on electricity suppliers to deliver a stated proportion oftheir electricity from eligible renewable sources.
Renewables Obligation Certificate (ROC) Eligible renewable generators receive ROCs for each MWh ofelectricity generated. These certificates can be sold to suppliers. In order to fulfil their obligation,suppliers can present enough certificates to cover the required percentage of their output, or pay a‘buyout’ price per MWh for any shortfall. All proceeds from buyout payments are recycled to suppliersin proportion to the number of ROCs they present.
RLA Residential lights and appliances.
Solar thermal/solar hot water A system for using solar radiation to heat water, typically in a roof-mounted panel connected with pipes to a storage tank.
Standard Assessment Procedure (SAP) The SAP is the Government’s recommended system for energyrating of dwellings. It is used for calculating the SAP rating, on a scale from 1 to 120, based on theannual energy costs for space and water heating; and for calculating the Carbon Index, on a scale of0.0 to 10.0, based on the annual CO2 emissions associated with space and water heating. The SAPrating is used to fulfil requirements of the Building Regulations to notify and display an energy ratingin new dwellings, and for monitoring the energy efficiency of the housing stock. Revisions to SAP in2005 will include a recalibration of the scale from 1-120 to 1-100.
Stirling engine An external combustion engine used for generating electricity. Heat moves a pistoninside the device, and the moving piston can be used to power an electrical generator. Early designsof micro-CHP units use Stirling engines, although there is potential to increase the overall efficiencyof micro-CHP with new, emerging technologies, such as fuel cells.
Takeback See comfort factor.
Teleworker The UK Labour Force Survey defines teleworkers as people who do some paid or unpaidwork in their own home and who use both a telephone and a computer (Hotopp, 2002).
Total Fertility Rate (TFR) Total Fertility Rate is the average number of children a woman would have ifshe experienced the age-specific fertility rates of a particular cohort for her entire childbearing years.Changes in the number of births are in part due to changes in the population age structure. So theTFR is commonly used to look at fertility because it standardises for the changing age structure of thepopulation (NS 2004f).

112 Glossary
Under-occupancy A dwelling is under-occupied when it contains two or more bedrooms above thebedroom standard, calculated in accordance with age/sex/marital status composition and therelationship of the members to each other (Definitions in ODPM 2004d).
United Kingdom Climate Impacts Programme (UKCIP) The UK Climate Impacts Programme publishesscenarios that show how our climate might change and co-ordinates research on adapting to ourfuture climate. UKCIP shares this information, free of charge, with organisations in the commercialand public sectors to help them prepare for the impacts of climate change.
United Kingdom Domestic Carbon Model (UKDCM) A highly disaggregated computer model of theenergy and carbon emissions associated with the UK housing stock and the residential sector. TheUKDCM was developed as part of the 40% House project, and provides all of the key numbers behindthe 40% House scenario, described in the 40% House report.
Useful energy The net energy provided to a dwelling for space or water heating, from a heat source (iethe delivered energy multiplied by the boiler efficiency). See also primary energy and deliveredenergy.
U-value The U value of a building element (wall, floor, roof, window etc) is an expression of the rate ofenergy flow (Watts) for a given surface area (m2) and a given temperature difference between indoorsand outdoors, conventionally expressed on the Kelvin scale (K), but practically measured in degreescelsius. U values are measured in W/m2K. The lower the U-value, the better the thermal insulation.
Vacant dwelling A dwelling is defined as vacant if all the household spaces within it are empty.
Vacuum insulation panel (VIP) A VIP consists of a special panel enclosed in an air-tight envelope, towhich a vacuum is applied. This product gives three to seven times as much insulation as theequivalent thickness of materials such as rigid foam boards or foam beads. Panels can be made inalmost any size, so that they can be fitted within products. They are currently used in large-scalerefrigeration and in container systems, with potential for residential refrigeration and the insulationof solid walls.
Ventilation The controlled exchange of outside air for inside air. Fresh air is necessary for humanhealth and to avoid damage to the building fabric through excess water content, but it needs to becontrolled to minimise heat loss. The principle of ‘build tight, ventilate right’ is important to super-efficient buildings, maintaining adequate fresh air without wasting heat. See infiltration.
Vulnerable A vulnerable household is one in receipt of at least one of the principal means-tested ordisability-related benefits (ODPM 2004b). Alternatively, it is an older household, one with children, orone where there is disability or long-term illness (DTI 2002b).
Warm Deal (Scotland) A scheme for the provision of energy efficiency improvements to households inreceipt of a range of benefits, administered by EAGA partnership for all housing stock and by localauthorities for their own stock (DTI, 2003a).
Warm Front (England) A scheme for the reduction of fuel poverty in vulnerable households byimproving energy efficiency. It is aimed at households with children, the over-60s and the disabled orlong-term sick (DTI, 2003a). Annual expenditure is approximately £150m (NAO, 2003).

113 Glossary
Warm Homes (Northern Ireland) A scheme for the provision of energy efficiency improvements,designed to increase access to energy efficiency advice, including grant availability, among low-income households with young children, particularly single-parent families. It also aims to reduce theincidence of fuel debt within the target group, improve comfort levels and prevent cold-related illness(DTI, 2003a).
Warm Homes Act The Warm Homes and Energy Conservation Act 2000.
W/m2K See U value.
UNITS OF ENERGY
Energy is the ability to do work. In this report, energy is measured in multiples of Watt-hours (Wh). 1 Whis the amount of energy used by a 1 W device operating for an hour, or a 2 W device operating for half anhour, and so on.
kWh (kilowatt-hour) 1 kWh = 1,000 Wh
MWh (megawatt-hour) 1 MWh = 1,000 kWh = 1,000,000 Wh
GWh (gigawatt-hour) 1 GWh = 1,000 MWh = 1,000,000,000 Wh
TWh (terawatt-hour) 1 TWh = 1,000 GWh = 1,000,000,000,000 Wh
UNITS OF POWER
Power is the rate at which energy is converted. The SI unit of power is the Watt (W).
kW (kilowatt) 1 kW = 1,000 Watts
MW (megawatt) 1 MW = 1,000 kW = 1,000,000 Watts
GW (gigawatt) 1 GW = 1,000 MW = 1,000,000,000 Watts
TW (terawatt) 1 TW = 1,000 GW = 1,000,000,000,000 Watts

114 References
Ackermann M (2002) Cool comfort: America’s romancewith air-conditioning. Smithsonian Institution Press,ISBN 1588340406
Anderson K and Starkey R (2004) Domestic tradablequotas: A policy instrument for the reduction ofgreenhouse gas emissions. Project T3.22, Tyndall Centrefor Climate Change Research
Appleton NJW (2002) Planning for the majority: theneeds and aspirations of older people in generalhousing. Joseph Rowntree Foundation, York
Barker K (2004) Review of housing supply. Deliveringstability: securing our future housing needs. Final report– recommendations. HM Treasury, London.http://www.hm-treasury.gov.uk/media/0F2/D4/barker_review_report_494.pdf
Battersby S, Court R, Moore R and Ormandy D (2004)Preparation of HHSRS Guidance, Version 2. Safe andHealthy Housing Research Unit, Law School, Universityof Warwick. Office of the Deputy Prime Minister,London http://www.odpm.gov.uk/stellent/groups/odpm_housing/documents/page/odpm_house_032782.pdf
BedZED http://www.bedzed.org.uk/
Bill Dunster Architects www.zedfactory.com
BioRegional (2004) Z-squared: Enabling one planet livingin the Thames Gateway. www.bioregional.com/programme_projects/opl_prog/zsquared/bz_zsquared.htm
Boardman B (1985) Activity levels within the home.Proceedings, joint meeting CIB W17/77 – ControllingInternal Environment, Budapest
Boardman B (1991) Fuel poverty: from cold homes toaffordable warmth. Belhaven Press
Boardman B (2004a) New directions for householdenergy efficiency: evidence from the UK. Energy Policy32, pp. 1921-1933
Boardman, B (2004b) Achieving energy efficiencythrough product policy: the UK experience.Environmental Science and Policy 7(3), 165-176
Boardman B and Attali S (2003) The impact of Energy+,paper presented to Energy Efficiency DomesticAppliances and Lighting. Third InternationalConference 1-3 October, Turin. ECI website
Boardman B and Darby S (2000) Effective advice. Energyefficiency and the disadvantaged. Research report 24,Environmental Change Institute, University of Oxford,Oxford
Boardman B and Palmer J (2003) 4CE – Consumer Choiceand Carbon Consciousness: electricity disclosure inEurope. Research report 28, Environmental ChangeInstitute, University of Oxford, Oxford
Boardman B, Favis-Mortlock D, Hinnells M, Lane K, MilneG, Small E, Strang V, Wade J (1994) DECADE: first yearreport. Environmental Change Institute, University ofOxford.
Boardman B, Favis-Mortlock DT, Hinnells M, Lane K,Milne G, Palmer J, Small, E, Strang V, Wade J. (1995)DECADE – Domestic Equipment and Carbon DioxideEmissions, second year report. Environmental ChangeUnit, University of Oxford
Boardman B, Fawcett T, Griffin H, Hinnells M, Lane K andPalmer J (1997) 2MtC – two million tonnes of carbon.DECADE project. Research report 18, EnvironmentalChange Institute, University of Oxford, Oxford
CEC (2003) Energy Performance of Buildings Directive,http://europa.eu.int/eur-lex/pri/en/oj/dat/2003/l_001/l_00120030104en00650071.pdf
Chappells H and Shove E (2004) Report on the ‘FutureComforts’ workshop, http://www.comp.lancs.ac.uk/sociology/research/projects/futcom/documents/webreport.htm
Christie A (2004) Energy Performance of BuildingsDirective – Article 8 Implementation. Proceedings ofseminar held by the ODPM and DirectiveImplementation Advisory Group, October 14th 2004.Energy Policy Division, DEFRA.http://www.diag.org.uk/pdf/epbd/Alan_Christie.pdf
CIBSE (1999) Guide A: Environmental Design. CharteredInstitute of Building Services Engineers, London
ClearSkies (2004) ClearSkies renewable energy grants.DTI/BRE http://www.clear-skies.org/
Cogen Europe (1999) An Introduction to Micro-Cogeneration. www.cogen.org/publications/briefings.htm
Cogen Europe (2004) Micro-CHP Fact Sheet UnitedKingdom, from www.cogen.org/publications/reports_and_studies.htm
References

Cole I and Nevin B (2004) The road to renewal: the earlydevelopment of the Housing Market RenewalPathfinder programme in England. Joseph RowntreeFoundation, York
Conisbee M and Simms A (2003) Environmentalrefugees: the case for recognition, New EconomicsFoundation, London
Darby S (2001) Making it obvious: designing feedbackinto energy consumption. Proceedings, 2ndInternational Conference on Energy Efficiency inHousehold Appliances and Lighting. Italian Associationof Energy Economists/ EC-SAVE programme.
DEFRA (2003) Home Energy Conservation Act 1995.Seventh progress report data for 1 April 2002 to 31March: energy conservation authorities in England.
DEFRA (2004a) Energy efficiency: the Government’s Planfor Action. UK Department for Environment, Food andRural Affairs. Cm 6168, Stationery Office, London.http://www.official-documents.co.uk/document/cm61/6168/6168.pdf
DEFRA (2004b) The UK fuel poverty strategy 2nd annualprogress report. Department for Food, Environmentand Rural Affairs, Londonhttp://www.defra.gov.uk/environment/energy/fuelpov/pdf/fuelpov_2nocover.pdf
DEFRA (2004c) Fuel poverty in England: the Government’splan for action. Department for Food, Environment andRural Affairs, Londonhttp://www.defra.gov.uk/environment/energy/fuelpov/pdf/fuelpov_actionplan.pdf
DEFRA (2004d) UK Climate Change Programme review:consultation launch. Press Release, 8 December.www.defra.gov.uk/news/2004/041208b.htm
DEFRA (2004e) Digest of Environmental ProtectionStatistics. Department for Food, Environment and RuralAffairs, London
DETR (2000) English House Condition Survey 1996:Energy Report. Department of the Environment,Transport and the Regions, London
Digital Television Project (2004) A guide to digitaltelevision and digital switchover. Digital TelevisionProject, DTI, October. www.digitaltelevision.gov.uk
Donaldson G, Kovats RS, Keatinge WR and McMichael AJ(2001) Overview of climate change impacts on humanhealth in the UK: heat- and cold-related mortality andmorbidity and climate change. In Health effects ofclimate change in the UK, Department of Health,Londonhttp://www.dh.gov.uk/PublicationsAndStatistics/
DSDNI (2004) Ending fuel poverty: a strategy forNorthern Ireland. Department for Social Development,Belfast http://www.dsdni.gov.uk/publications/documents/FUEL_POVERTY.pdf
DTI (1995) Energy projections for the UK. Energy Paper 65,Stationery Office, London
DTI (2001a) Energy projections for the UK. Energy Paper68, Department of Trade and Industry, The StationeryOffice, London, UKhttp://www.dti.gov.uk/energy/inform/energy_projections/ep68_final.pdf
DTI (2001b) Energy for Tomorrow – Powering the 21stCentury. Department of Trade and Industry, London, UK
DTI (2001c) Development of a 1KW SOFC stack ETSU/F/01/00144/REP fromwww.dti.gov.uk/energy/renewables/publications/pubs_fuel_cells.shtml
DTI (2002a) Assessment of the implementation issues forfuel cells in domestic and small scale stationary powergeneration and CHP applications ETSU/03/00235/00/00 DTI PUB URN No. 02/1349, fromwww.dti.gov.uk/energy/renewables/publications/pubs_fuel_cells.shtml
DTI (2002b) Energy – its impact on the environment andsociety. Department of Trade and Industry, TheStationery Office, London, UKhttp://www.dti.gov.uk/energy/environment/energy_impact/impact_booklet.pdf
DTI (2003a) Fuel processing for fuel cells – a status reviewand assessment of prospects. ETSU F/03/00252/REPURN 031644 www.dti.gov.uk/energy/renewables/publications/pubs_fuel_cells.shtml
DTI (2003b) Review of Fuel Cell Commercial Potential forDTI and the Carbon Trust. Final Report, E4Tech for DTI.www.dti.gov.uk/energy/renewables/publications/pubs_fuel_cells.shtml
115 References

116 References
DTI (2003c) Our energy future – creating a low-carboneconomy. Energy White Paper. Department of Tradeand Industry, The Stationery Office, London, UKhttp://www.dti.gov.uk/energy/whitepaper/ourenergyfuture.pdf
DTI (2004a) Digest of UK Energy Statistics (DUKES 2004),UK . Department of Trade and Industry. The StationeryOffice, London, UK.http://www.dti.gov.uk/energy/inform/energy_stats/total_energy/index.shtml
DTI (2004b) A Strategic Framework for Hydrogen Energyin the UK – final report from www.dti.gov.uk/energy/sepn/hydrogen.shtml.
DTI (2004c) UK Energy Sector Indicators 2004: asupplement to the first annual report on the EnergyWhite Paper. Department of Trade and Industry, TheStationery Office, London, UKhttp://www.dti.gov.uk/energy/inform/energy_indicators/index.shtml
DTI (2004d) Woking Park PAFC CHP Monitoring Phase 1:Planning, Installation and Commissioning. DTI/PubURN 03/879 fromwww.dti.gov.uk/energy/renewables/publications/pubs_fuel_cells.shtml
DTI Energy storage website: http://www.alti.gov.uk/energy/sepn/energy_storage.shtml
EA (1998) Electricity Association Sectoral Profiles
EAC (2005) Housing: building a sustainable future, Houseof Commons Environmental Audit Committee firstreport of session 2004-2005, vol 1, HC 135-I, TheStationery Office
ECA website: www.eca.gov.uk
EEA (2004) Analysis of greenhouse gas emission trendsand projections in Europe in 2003. Technical report 4,EEA, Copenhagen
EEA (2004) Environmental signals 2004 EuropeanEnvironment Agency, Copenhagen
EEBPP (2000) Description of a scheme in West Grimstead,Wiltshire. Energy Efficiency Best Practice Programme,GIR 72
EEPH (2004) Energy Efficiency Partnership for HomesAnnual Report 2003/2004. Energy Saving Trust, London
EPRI website: www.epri.com
EST (2003) The UK Potential for Community Heating withCombined Heat & Power. www.est.org.uk/communityenergy/ukpotential/
EST (2004a) Community heating using new andrenewable sources. www.est.org.uk/communityenergy/guidance/chusingrenwablesources.cfm
EST (2004b) Rural Biomass Community Heating CaseStudy. http://www.est.org.uk/bestpractice/publications/detail.jsp?pk=1152
EST (2004c) Assessment of energy efficiency impact ofBuilding Regulations compliance. BRE client report219683, November. Energy Saving Trusthttp://www.est.org.uk/partnership/uploads/documents/Houses_airtightness_report_Oct_04.pdf
EST website: www.est.org.uk/communityenergy/index.cfm
Entec (2004) Study into the environmental impacts ofincreasing the supply of housing in the UK. Reportcommissioned by DEFRA available athttp://statistics.defra.gov.uk/esg/reports/housing/default.asp
Ekins P and Dresner S (2004) Green taxes and charges:reducing their impact on low-income households.Joseph Rowntree Foundation, York.
‘Energy+’ website: www.energy-plus.org
Euroheat (undated)www.euroheat.org/redirects/redirect_cbyc.htm).
Eurostat http://europa.eu.int/comm/eurostat/
FaberMaunsell et al (2002) Micro-map, mini and microCHP – Market Assessment and Development Plan. SAVE.http://www.microchap.info/
Fanger (1970) Thermal comfort analysis and applicationsin environmental engineering. McGraw Hill
Fawcett T (2003) Carbon rationing, equity and energyefficiency. Proceedings, European Council for anEnergy-Efficient Economy, Paper 1.204, pp 239-248
Fawcett T, Hurst A and Boardman B (2002) Carbon UK.Research report 25, Environmental Change Institute,University of Oxford
Fawcett T, Lane K and Boardman B (2000) Lower carbonfutures. Environmental Change Institute, University ofOxford

117 References
Foresight programme material is available from theDepartment of Trade and Industry and fromhttp://www.foresight.gov.uk/
FPAG (2004) Second annual report. Fuel Poverty AdvisoryGroup, Department of Trade and Industry, London.
GCI (2001) ‘Contraction and convergence’ – a policybriefing on climate change to the Performance andInnovation Unit for the UK Government Energy Review.Global Commons Institute, September.http://www.gci.org.uk/papers/PIU.pdf
GEA (1993) Study on energy efficiency standards fordomestic refrigeration appliances. Final report. Groupfor Efficient Appliances, ADEME, France
GLA (2004)http://www.london.gov.uk/mayor/strategies/energy/index.jsp
Green Alliance (2004) A micro-generation manifesto.Joanna Collins. ISBN 0 95481378www.greenalliance.org.uk/
Greenbuilder (undated)www.greenbuilder.com/sourcebook/HeatCool.html#ACTIVEDHW
Greenpeace and EPIA (2001) Solar Generation.ISBN 90-73361-77-X. See www.epia.org andwww.greenpeace.org
GROS (2001) Registrar General’s 2001 Census Report tothe Scottish Parliament. http://www.gro-scotland.gov.uk/grosweb/grosweb.nsf/pages/scotcen4
H2FC.com http://www.h2fc.com/news.html 2.1.05,Ministry to finance fuel-cell research.
Hare B and Meinshausen M (2004) How much warmingare we committed to and how much can be avoided?PIK report number 93, Potsdam Institute for ClimateImpact Research (PIK), Potsdam, October
Harrison J (1999) Micro-CHP implications for energycompanies. Commercial paper, Sigma ElektrotekniskA/S, 1999 from www.microchap.info
Harrison J (2001) Micro combined heat and powerpotential impact on the electricity supply industry.CIRED (Congrès International de Réseaux Electriquesde Distribution), Amsterdam/Kuala Lumpur.http://www.microchap.info
Harrison J and Redford S (2002) Domestic CHP What arethe potential benefits? A report to the Energy SavingTrust by EA Technology Limited. http://www.est.org.uk/aboutest/resources/publications/
Harrison J (2004) Micro Combined Heat and Power (CHP)for housing, SET 2004 – 3rd International Conferenceon Sustainable Energy Technologies. Nottingham UK,28-30 June. http://www.microchap.info
HBF (2003) The will to succeed – constructing policies tomeet housing need. House Builders Federationsubmission to the Barker Review.http://www.hm-treasury.gov.uk/media/E35C2/barkresp_HouseBuildersFederationRA_0903_150.4kb.pdf
HC (2002) Total cost indicator, grant rate and rentanalyses for 2003/2004. The Housing Corporation,October. http://www.housingcorplibrary.org.uk/housingcorp.nsf/AllDocuments/851539DA104C305A80256C59003AABB1/$FILE/tcianal0304.pdf
Healy JD and Clinch JP (2002) Fuel poverty, thermalcomfort and occupancy: results of a national householdsurvey in Ireland. Environmental studies research seriesworking paper 02/08, Department of EnvironmentalStudies, University College Dublin
Henderson G, Staniasek D, Anderson B and Phillipson M(2003) Energy savings from insulation improvements inelectrically heated dwellings in the UK. Proceedings,European Council for an Energy-Efficient Economy.
Hillman M and Fawcett T (2004) How we can save theplanet. Penguin, London
Hinnells M (1997) Market transformation of domesticlighting: what can the lighting industry learn fromAmerican automobiles? Proceedings of Right Light 4,Vol 1, 269-274, Copenhagen, Denmark
Hinnells MJ and McMahon JE (1997) Stakeholders andMarket Transformation: an integrated analysis of costsand benefits. Proceedings of the European Council foran Energy-Efficient Economy, June
Hitchen R (2004) The UK heat pump market. IEA HeatPump Centre Newsletter 22 (4).http://www.heatpumpcentre.org
Hockerton Housing Projecthttp://www.hockerton.demon.co.uk/

118 References
HoL (2004) Renewable energy: practicalities. House ofLords Science and Technology Committee 4th report ofsession 2003-04, volume I. The Stationery Office Ltd,London
Holmans A (2001) Housing demand and need in England1996-2016. London, Town and Country PlanningAssociation.
Holt S and Harrington L (2003) Lessons learnt fromAustralia’s standards and labelling. Proceedings of theEuropean Council for an Energy Efficient Economy(ECEEE) Summer Study, Time to Turn Down EnergyDemand, Vol 1, 21-27.
Hotopp U (2002) Teleworking in the UK. Labour MarketTrends, June, 311-317
Houghton T and Bown H (2003) Too big to be warm: fuelpoverty and underoccupation in private homes.National Right to Fuel Campaign, London, UK
Hulme M, Jenkins GJ, Lu X, Turnpenny JR, Mitchell TD,Jones RG, Lowe J, Murphy JM and Hassell D. (2002)Climate Change Scenarios for the United Kingdom: theUKCIP02 Scientific Report. Tyndall Centre, University ofEast Anglia.
ICCT (2005) Meeting the climate challenge:recommendations of the International Climate ChangeTaskforce. Institute for Public Policy Research, London;Center for America Progress, Washington DC; TheAustralia Institute, Canberra ACT.
ICM (2004) Poll of British adults on climate change
IEA (2002) The 1 Watt-Standby Power Initiative: anInternational Action to Reduce Standby Power Waste ofElectrical Equipmenthttp://www.iea.org/dbtw-wpd/textbase/papers/2002/globe02.pdf
IEA Heat Pumps Centre (2004) (seehttp://www.heatpumpcentre.org/).
Ilex (2003) Importing gas into the UK – quality issues.Report to the Department of Trade and Industry,Ofgem and the Health and Safety Executive,November.
Integration of New and Renewable Energy intoBuildings – the INREB Faraday Partnership.http://www.inreb.org/
IPCC (2000) CO2 emissions from stationary combustion offossil fuels. Good practice guidance and uncertaintymanagement in national greenhouse gas inventories,Inter-governmental Panel on Climate Change
IPCC (2001) Climate Change 2001: The synthesis report: Acontribution of Working Groups I, II and III to the ThirdAssessment Report of the Intergovernmental Panel onClimate Change. Watson,R.T.and the Core Writing Team(Eds), Cambridge University Press, Cambridge, UK
Jardine CN and Lane K (2003) Photovoltaics in the UK: anintroductory guide for new consumers. ECI ResearchReport 27, Environmental Change Institute, Universityof Oxford
Jardine CN, Boardman B, Osman A, Vowles J, Palmer J(2004) Methane UK. Research report 30, EnvironmentalChange Institute, University of Oxford
Johnston D (2003) A physically-based energy and carbondioxide emission model of the UK housing stock,Doctoral thesis, Leeds Metropolitan University.http://www.leedsmet.ac.uk/as/cebe/assets/djthesis.pdf.
Johnston D, Lowe R, Bell M (2005) An exploration of thetechnical feasibility of achieving CO2 emissionreductions in excess of 60% within the UK housingstock by the year 2050. Energy Policy 33, 1643-1659
Kasanen P (ed) (2000) Efficient domestic ovens finalreport. SAVE II study (4.1031/D/97-047), Helsinki
Keatinge W (2003) Death in heat waves. British MedicalJournal 327, 412-413
King, DA (2004) Climate change science: Adapt, mitigateor ignore? Science 303 (5655), 176-177.
King E (pers comm) Ted King, ODPM, meeting 11.11.04
Kobos P, Erikson J and Drennen T (in press). Technologicallearning and renewable energy costs: implications forUS renewable energy policy. Energy Policy. Availableonline 1 February 2005 from www.sciencedirect.com/
Lane K and Boardman B (2001) Data analysis forEuropean Climate Change Programme Joint(WG3/WG5) Sub-Working Group, EnvironmentalChange Institute, University of Oxford.http://europa.eu.int/comm/environment/climate/eccp.htm

119 References
Levermore G, Chow D, Jones P and Lister D (2004)Accuracy of modelled extremes of temperature andclimate change and its implications for the buildenvironment in the UK. Technical Report 14, TyndallCentre for Climate Change Research, Norwich
Lowe R, Bell M and Roberts D (2003) Developing futureUK energy performance standards: St Nicholas Courtproject - Executive summary Centre for the BuiltEnvironment, Leeds Metropolitan University, Aprilhttp://www.leedsmet.ac.uk/as/cebe/projects/energy/pdfs/summary.pdf
Lowe. R., Oreszczyn, T. and Olivier, D. (1998) WindowEnergy Performance Rating. British Fenestration RatingCouncil website http://www.bfrc.org/Technical_Publications_Window_energy_performance_rating.htm
LumiLeds (2003) http://www.lumileds.com/index.html
Marmot M, Banks J, Blundell R, Lessof C and Nazroo J(2004) Health, wealth and lifestyles of the olderpopulation in England: the 2002 English longitudinalstudy of ageing. Institute for Fiscal Studies, London, UK
Matsumoto H (1999) System Dynamics Model for LifeCycle Assessment (LCA) of Residential Buildings.Proceedings of Building Simulation conference 1999.http://www.ibpsa.org/proceedings/bs99/papers/PB-07.pdf
Meier, A., K. Rosen & W. Huber (1998). Reducing LeakingElectricity to 1 Watt. Proceedings of ACEEE SummerStudy on Energy Efficiency in Buildings. Pacific Grove,CA: American Council for An Energy-Efficient Economy.
Met Office (2004) Extreme weather The UKMeteorological Officehttp://www.metoffice.gov.uk/climate/uk/extremes/index (accessed Aug 2004).
Micro-CHP website: www.microchp.info
Milne G and Boardman B (2000) ‘Making cold homeswarmer: the effect of energy efficiency improvementsin low-income homes’. Energy Policy 28 (6-7), 411-424
Mills A (2003) Solid state lighting – a world ofexpanding opportunities at LED 2002. The AdvancedSemi-Conductor Magazine 16 (1)
Moore, Richard, pers comm. Part of a presentation givenat the 40% House comfort workshop, 23.10.03
MTP Carbon emissions factors for UK energy use. BNXS01,accessed February 2005 http://www.mtprog.com/approvedbriefingnotes/BriefingNoteTemplate.aspx?intBriefingNoteID=150
MTP (2002) Air Conditioning in housing. Briefing noteBNCR20, revised 18/11/02. UK Market TransformationProgramme, see www.mtprog.com
MTP (2004) Briefing notes, UK Market TransformationProgramme, DEFRA http://www.mtprog.com/approvedbriefingnotes/
National Atmospheric Emission Inventoryhttp://www.aeat.co.uk/netcen/airqual/naei/home.html
NCC (2004) In touch. Annual report 2003/04, NationalConsumer Council, London
New Perspectives (1999) Energy efficiency of owneroccupied homes - differences between apparent andactual improvement rates through different monitoringmethods. Personal communication based on researchcarried out for the Energy Saving Trust, 1993-97
New Perspectives (2004) HECA officers’ views of thefuture of HECA: final report on a consultation survey,April 2004. New Perspectives, Woodbridge, Suffolk
NG (2003) National Grid 7 year statement. National Grid
Nicol JF and Humphreys M (2002) Adaptive thermalcomfort and sustainable thermal standards forbuildings. Energy and Buildings 34, 563-572
Nicol S (2003) Measuring the Housing Health and SafetyRating System through the English House ConditionSurvey. University of Warwickhttp://www2.warwick.ac.uk/fac/soc/law/research/shhru/nicolpaper.pdf
NS (2002) Living in Britain. General Household Survey,2002 http://www.statistics.gov.uk/downloads/theme_compendia/lib2002.pdf
NS (2003) Summer mortality figureshttp://www.statistics.gov.uk/cci/nugget.asp?id=480
NS (2004a) Population Trends 117, Autumn 2004.http://www.statistics.gov.uk/downloads/theme_population/PT117_V2.pdf
NS (2004b) Social Trends 34. National Statistics, TheStationery Office, Londonhttp://www.statistics.gov.uk/downloads/theme_social/Social_Trends34/Social_Trends34.pdf

120 References
NS (2004c) National Statistics press release 15 October2004 http://www.statistics.gov.uk/cci/nugget.asp?id=574
NS (2004d) National Census – main report for Englandand Wales. National Statistics.http://www.statistics.gov.uk/downloads/census2001/National_report_EW_Part2.pdf
NS (2004e) National Statistics press release, 30September 2004http://www.statistics.gov.uk/pdfdir/ukpop0904.pdf
NS (2004f) Fertility. National Statistics Onlinehttp://www.statistics.gov.uk/cci/nugget.asp?id=951
NS (2004g) International migration 2003. NationalStatistics
ODPM Live tables of housing stock, viahttp://www.odpm.gov.uk/
ODPM (2003a) English House Condition Survey, 2001:building the picture. Office of the Deputy PrimeMinister, London, UK
ODPM corrections to the English House ConditionSurvey, http://www.odpm.gov.uk/stellent/groups/odpm_housing/documents/page/odpm_house_024319.hcsp
ODPM (2003b) Housing market report, July 2003http://www.odpm.gov.uk/stellent/groups/odpm_housing/documents/downloadable/odpm_house_025259.pdf
ODPM (2004a) Proposals for amending Part L of theBuilding Regulations and Implementing the EnergyPerformance of Buildings Directive. A consultationdocument, July 2004.
ODPM (2004b) A Decent Home – the definition andguidance for implementation. February 2004, Office ofthe Deputy Prime Minister, Londonhttp://www.odpm.gov.uk/stellent/groups/odpm_housing/documents/pdf/odpm_house_pdf_027427.pdf
ODPM (2004c) Creating Sustainable CommunitiesConsultation Paper on Planning Policy Statement 1http://www.odpm.gov.uk/stellent/groups/odpm_planning/documents/page/odpm_plan_027494.pdf.
ODPM Live tables of housing stock, viahttp://www.odpm.gov.uk/
ODPM (2004d) Survey of English Housing ProvisionalResults, 2003-04. NS Housing Statistics Summary no. 23http://www.odpm.gov.uk/stellent/groups/odpm_housing/documents/page/odpm_house_030713.pdf
ODPM (2004e) Statutory homelessness: England secondquarter, 2004. Statistical release 2004/2016,September 13th http://www.odpm.gov.uk/pns/DisplayPN.cgi?pn_id=2004_0216
ODPM (2004f) Overview of the Thames Gateway:Creating Sustainable Communities. Office of theDeputy Prime Minister, Londonhttp://www.odpm.gov.uk/stellent/groups/odpm_communities/documents/pdf/odpm_comm_pdf_030604.pdf
ODPM (2004g) The Egan review: skills for sustainablecommunities. Office of the Deputy Prime Minister,London.http://www.odpm.gov.uk/stellent/groups/odpm_urbanpolicy/documents/pdf/odpm_urbpol_pdf_028549.pdf
ODPM (2004h) Proposed amendment of ApprovedDocument F of the building regulations: VentilationOctober 2004http://www.odpm.gov.uk/stellent/groups/odpm_buildreg/documents/page/odpm_breg_030165-04.hcsp
ODPM (2004i) Creating sustainable communities:guidance for Regional Housing Boardshttp://www.odpm.gov.uk/stellent/groups/odpm_housing/documents/page/odpm_house_029019-01.hcsp#P17_935
ODPM (2005) The Town and Country Planning(residential density) (London, south east of England,south west of England, east of England andNorthamptonshire) direction 2005, ODPM circular01/2005http://www.odpm.gov.uk/stellent/groups/odpm_planning/documents/page/odpm_plan_034149.pdf
OECD (2003) Environmentally sustainable buildings –challenges and policies. Organisation for EconomicCooperation and Development, Paris
Ofgem (2004a) Fuel mix disclosure: summary ofresponses and revised draft license condition. Novemberhttp://www.ofgem.gov.uk/temp/ofgem/cache/cmsattach/9346_25604.pdf

121 References
Ofgem (2004b) A review of the Energy EfficiencyCommitment to the end of the second year. July
Ofgem/EST (2003) A review of the Energy EfficiencyStandards of Performance, 1994-2002 A joint report byOfgem and the Energy Saving Trust, July, London
Olivier D (2001) Building in ignorance. Demolishingcomplacency: improving the energy performance of 21stcentury homes. Association for the Conservation ofEnergy/Energy Efficiency Advice Services forOxfordshirehttp://www.ukace.org/pubs/reportfo/BuildIgn.pdf
OST (2004) Future flooding: executive summary report ofthe Foresight programme, Parliamentary Office ofScience and Technology, London
Palmer J and Boardman B (1998) DELight – Domesticefficient lighting. Research report 19, EnvironmentalChange Institute, University of Oxford, Oxford
Pett J and Guertler P (2004) User behaviour in energyefficient homes. Report by the Association for theConservation of Energy for the Energy Saving Trustand the Housing Corporation.http://www.ukace.org/research/behaviour/User%20Behaviour%20-%20Phase%202%20report%20v1.0.pdf
PIU (2001) Energy Scenarios to 2020. Cabinet OfficePerformance and Innovation Unit.http://www.pm.gov.uk/files/pdf/PIUe.pdf
PIU (2002) The Energy Review. A Performance andInnovation Unit report.http://www.number-10.gov.uk/su/energy/10.html
Planning Portal (2005) 01/02 The Town and CountryPlanning (Residential Density) (London and South EastEngland) Direction 2002http://www.planningportal.gov.uk/wps/portal/actionDispatcher/.aref/66636712
Rau R (2004) Winter mortality in elderly people inBritain: lack of social gradient in winter excessmortality is obvious in Denmark. Letter to BritishMedical Journal, 23.10.1004
R2000 website: http://r2000.chba.ca/What_is_R2000/R2000_standard.php
RCEP (2000) Energy – the changing climate. RoyalCommission on Environmental Pollution 22nd report.http://www.rcep.org.uk/newenergy.htm
Reid H, Huq S, Inkinen A, MacGregor J, Macqueen D,Mayers J, Murray L and Tipper R (2004) Using woodproducts to mitigate climate change, InternationalInstitute for Environment and Developmenthttp://www.iied.org/docs/climate/wood_climatechange.pdf
Riffat SB and Zhu J (2004) Mathematical model ofindirect evaporative cooler using porous ceramic andheat pipe. Applied thermal engineering 24 (4), 457-470
Roberts S, Humphries H and Hyldon V (2004) Consumerpreferences for improving energy consumptionfeedback. Report for Ofgem. Centre for SustainableEnergy, Bristol
Robinson C, Humphrey A, Kafka E, Oliver R and Bose S(2004) Housing in England 2002/03: A report principallyfrom the 2002/03 Survey of English Housing. Office ofthe Deputy Prime Minister, Londonhttp://www.odpm.gov.uk/stellent/groups/odpm_housing/documents/page/odpm_house_032552.pdf
RS (2002) Climate change: what we know and what weneed to know The Royal Society, August 2002.http://www.royalsoc.ac.uk/policy/climate_report.pdf
Schiellerup P (2002) An examination of the effectivenessof the EU minimum standard on cold appliances: theBritish case. Energy Policy 30, 327-332
Schiellerup P and Fawcett T (2001) Subsidies and markettransformation. Paper presented to Lower CarbonFutures Group at an Environmental Change Instituteworkshop, June
Scottish Executive (2004) Household projections forScotland. http://www.scotland.gov.uk/pages/news/2004/04/Sec440.aspx
Sefton T (2004) Aiming high – an evaluation of thepotential contribution of Warm Front towards meetingthe government’s fuel poverty target in England. Areport to the EAGA Partnership Charitable Trust.Centre for the Analysis of Social Exclusion, LondonSchool of Economics, November 2004.http://www.eaga.co.uk/Charitable/Sefton_EagaPCT_FinalReport.pdf
Shaw C (2004) Interim 2003-based national populationprojections for the UK and constituent countries.Population Trends 118, Winter 2004, 6-16. NationalStatistics, London

122 References
SHCS (2003) The 2002 Scottish House Condition Survey.See also http://www.scotland.gov.uk/pages/news/2003/11/SEnw1032.aspx andhttp://www.communitiesscotland.gov.uk/Web/Site/Press/9_March_2004.asp
Shorrock L (2000) Identifying the individual componentsof UK domestic sector carbon emission changesbetween 1990 and 2000. Energy Policy 28 (3), 193-200,Elsevier Science Ltd, Oxford
Shorrock L and Dunster J (1997) The physically-basedmodel BREHOMES and its use in deriving scenarios forthe energy use and carbon dioxide emissions of theUK housing stock. Energy Policy 25 (12), 1027 – 1037,Elsevier Science Ltd, Oxford
Shorrock L and Utley J (2003) Domestic energy fact file2003. BRE, Watford http://projects.bre.co.uk/factfile/BR457prtnew.pdf
Shove E (2003) Comfort, cleanliness and convenience: thesocial organisation of normality. Berg Publishers
Skipton Building Society (2004) Financing your future.http://www.skipton.co.uk/press_office/press_releases/extended_families_to_make_a_comeback.asp
Smith P (2000) Transforming the existing housing stock:a strategy for achieving minimum standards ofthermal comfort. Chapter in Edwards B and Turrent D(eds) Sustainable Housing: Principles and Practice, Spon
SPRU (2002) Foresight Futures 2020 – revised scenariosand guidance. Science and Technology Policy Research,University of Sussex, Brighton
Thomas C, Cameron A, Green R A, Bakkenes M andBeaumont L J (2004) Extinction risk from climatechange, Nature 427, 145-148
Tinch R, Peters M, Diaz-Rainey I, Monahan J, Waddams Cand Tovey K (2003) Powergen Energy Monitor.University of East Anglia/Powergen.
UKCIP (2000) Socio-economic scenarios for climatechange impact assessment: a guide to their use in theUK Climate Impacts Programme. United KingdomClimate Impacts Programme, ECI, University of Oxford.
UKCIP (2002) Climate change scenarios for the UnitedKingdom. United Kingdom Climate ImpactsProgramme, ECI, University of Oxford.
UKCIP (UK Climate Impacts Programme)
http://www.ukcip.org.uk/
UK Government (2000) Warm Homes and EnergyConservation Act 2000. The Stationery Office, London
UK Government (2004) Housing Act 2004. TheStationery Office, London
Scottish Executive (2004) Statistical Bulletin HousingSeries HSG/2004/4, August 2004http://www.scotland.gov.uk/about/DD/EAS/00014844/QTrend2003Q4_2004Q1.pdf
Vowles JC (2000) The challenge of domestic standbyconsumption. Unpublished MSc Dissertation, ECI,University of Oxford, Oxford
Wilkinson P, Landon M, Armstrong B, Stevenson S,Pattenden S, McKee M and Fletcher A (2001) ColdComfort: the social and environmental determinants ofexcess winter deaths in England, 1986-96. Published forthe Joseph Rowntree Foundation by The Policy Press,Bristol
Wiltshire R (pers comm). Robin Wiltshire, BRE, based onan unpublished client report by BRE to the CarbonTrust
Wood G and Newborough M (2003) Dynamic energy-consumption indicators for domestic appliances:environment, behaviour and design. Energy andBuildings, 35 (8), 821-841
Wuestenhagen R and Bilharz H (2005) Green energymarket development in Germany: effective publicpolicy and emerging customer demand. Energy Policyin press, available online February 9, 2005
XCO2 (2002) Insulation for Sustainability: A guide.Research study by XCO2 for Bing (Federation ofEuropean Rigid Polyurethane Foam Associations)

123 Recent publications
Boardman, B (2004) Starting on the road tosustainability. Environmentally SustainableBuildings: Challenges and Policies. Building Researchand Information (May-June 2004) 32 (3), 264-268
Boardman, B (2004) Achieving energy efficiencythrough product policy: the UK experience.Environmental Science and Policy, 7 (3), 165-176
Boardman, B (2004) New directions for householdenergy efficiency: evidence from the UK. EnergyPolicy, 32 (17), pp. 1921-1933
Jardine CN, Boardman B, Osman A, Vowles J, Palmer J(2004) Methane UK. Research report 30,Environmental Change Institute, University ofOxford, Oxford, December 2004
Lane K, Ürge-Vorsatz D and Ritter H (2004) Electricitydisclosure: will it transform markets? Proceedings,American Council for an Energy Efficient Economy,2004
Boardman B (2003) Reducing UK residential carbonemissions by 60%. Proceedings, European Council foran Energy Efficient Economy, June 2003, France
Boardman B, Palmer J, Lane K et al (2003) 4CE –Consumer choice and carbon consciousness: electricitydisclosure in Europe. Final project report.Environmental Change Institute, University ofOxford. ECI research report 28, ISBN 1-8734370 360
Brand C and Preston J (2003) Which technology forurban public transport? A review of systemperformance, costs and impacts. Proceedings of theInstitution of Civil Engineers. Transport Studies Unit,University of Oxford
Darby, S (2003) Making sense of energy advice.Proceedings of European Council for an Energy-Efficient Economy
Jardine CN and Lane K (2003) Photovoltaics in the UK:An Introductory Guide For New Customers. ECIresearch report 27, Environmental Change Institute,University of Oxford
Lipp J and Lane K (2003) Labelling electricity:disclosing information for consumer choice. Refocus:International Renewable Energy. Elsevier Publishing,UK. March 2003
Lane, K (2003) Electricity labelling in the EU.Proceedings, European Council for an Energy EfficientEconomy
Lane K (2003) Various sections in Gestion de lademande d’energie - dans le cadre des efforts aaccomplir par la Belgique pour reduire ses emissionsde gaz a effet de serre. Report for the Ministry ofEconomic Affairs, Belgium. Fraunhofer Institute forSystems and Innovation Research FhG-ISE, Karlsruhe,Germany
Boardman B and Fawcett T (2002) Competition forthe poor. Liberalisation of electricity supply and fuelpoverty: lessons from Great Britain for NorthernIreland. Environmental Change Institute, Universityof Oxford. ISBN: 1 874370 32 X
Fawcett T, Hurst A, and Boardman B (2002) CarbonUK. Environmental Change Institute, University ofOxford. ISBN 1 874370 1
Gottschalg R, Jardine CN, Rüther R, Betts TR, ConibeerGJ, Close J, Infield DG, Kearney MJ, Lam KH, Lane K,Pang H and Tscharner R (2002) Performance ofAmorphous Silicon Double Junction PhotovoltaicSystems in Different Climatic Zones, 29th IEEEConference for Photovoltaic Specialists, New Orleans
Recent publications

124 References
Jardine CN, Betts TR, Gottschalg R, Infield DG andLane K (2002) Influence of Spectral Effects on thePerformance of Multi-junction Amorphous SiliconCells, PV in Europe Conference and Exhibition, Rome
Jardine CN and Lane K (2002) PV-Compare: RelativePerformance of Photovoltaic Technologies in Northernand Southern Europe. PV in Europe Conference andExhibition, Rome
Jardine CN and Lane K (2002), PV-Compare:18 months’ green electricity from Begbroke, UK.Environmental Change Institute, University of Oxford
Lane, K (2002) Scenario analysis. Chapter 6 ofLabelling and other measures for heating systems in dwellings. Final report. SAVE contract4.1031/Z/99-283, BRE, UK
125 Authors
Dr Brenda Boardman, MBE, FEI (contact author)Brenda is head of the Lower Carbon Futures teamand has been at the ECI since 1991. She is also Co-Director of the new UK Energy Research Centre(UKERC), launched in October 2004. Her mainresearch focus is on energy efficiency and the fuelpoor in terms of the economic, social and technicalaspects, with a strong policy emphasis. She has beena member of the DTI’s Energy Advisory Panel and iswidely viewed as one of the most experienced in herfield. She was awarded an MBE in 1998 for her workon energy issues.
Dr Sarah DarbySarah’s main research interests are the social andbehavioural aspects of energy use, especially as theyrelate to individual and social learning. She hasworked on the evaluation of energy advice andaudit programmes, the feasibility of electricity fuelmix disclosure, and on the impact of different formsof user feedback on energy consumption.
Graham SindenGraham has had a long involvement in theenvironment sector, working with organisations suchas the Environment Protection Authority (Australia),United Nations High Commissioner for Refugees andOxford University. His experience includes energy &environmental policy, environmental legislation,regulation & litigation, and field-based work. Inaddition to his research at the EnvironmentalChange Institute, Graham collaborates withCambridge University through the SuperGen projectand with the Carbon Trust through the MarineEnergy Challenge.
Dr Mark HinnellsMark has returned to the ECI after 6 years managingprojects and providing policy advice to Government.Mark has a wide range of expertise in the use ofenergy in buildings, energy efficiency measures, aswell as generation technologies, both in renewablesand combined heat and power (CHP). He managesthe Building Market Transformation programme.BMT, funded by Carbon Trust and the EPSRC, seeks toidentify what policy actions are needed to reducecarbon emissions from the entire UK Building stockby 50% by 2030, given what we know of thetechnical options, energy markets, social trends, andimpacts of climate change on energy use inbuildings.
Dr Christian N JardineChristian is a researcher in the Lower Carbon Futuresteam and studies technologies and policies forgreenhouse gas emission reductions. Primarily, hisfocus is on renewables, especially the use of solarphotovoltaics within the household and oncommercial buildings. His work covers the wholerange of issues from technical monitoring throughto social attitudes and policy and support measures.
Gavin KillipGavin’s MSc thesis was on the prospects forsustainable energy use in English housing,addressing what is required to reduce carbon dioxideemissions from the domestic sector by 60% by 2050.He has worked for nine years in the voluntary andpublic sector on energy efficiency and renewableenergy projects in urban areas. Gavin’s researchinterests include the social and economic policychanges that are implicit in the climate changeagenda.
Jane PalmerJane has worked at the ECI over various periods since1995 on domestic energy efficiency and electricitydisclosure. She has also managed communityconsultation processes on environmental policy bothin the UK and Australia.
Authors

126 Contributors
Dr Kevin LaneKevin has contributed to over a dozen Europeanenergy end-use studies commissioned as preparationfor EU product policy (eg labelling, minimumefficiency standards and voluntary agreements).During his 10-year spell at the ECI he created anddeveloped the DECADE and CADENCE models thatwere used as the basis for DEFRA’s MarketTransformation Programme modelling. He helpeddevelop the UK Domestic Carbon Model for the 40%House project and is now a Business Manager forAEA Technology plc, where he is undertaking areview of the UK’s Climate Change Programme (asdomestic sector expert) for DEFRA, and part of theknowledge management team of the MarketTransformation Programme.
Sukumar NatarajanSukumar completed his MPhil in EnvironmentalDesign in Architecture from Cambridge in 2001. Hecoordinated a nationwide debate on sustainabledevelopment in the run-up to the Johannesburgsummit, from the Centre for Science andEnvironment in New Delhi, and has been studyingfor a PhD on energy and carbon emissions in thehousing sector at the Manchester Centre for Civiland Construction Engineering.
Professor Marcus NewboroughMarcus holds the ScottishPower/The Royal Academyof Engineering Research Chair in Energy &Environmental Engineering at Heriot-WattUniversity. His research interests have includedmicro-combined heat and power, renewable energysystems, smart heat exchangers, thermaldepolymerisation and the design of energy-efficientbuildings. While a professor in the Applied EnergyGroup at Cranfield University, he was awarded theJohn Hopkinson Premium by the Institution ofElectrical Engineers for his work on demand-sideenergy management in the domestic sector.
Andrew PeacockAndrew holds an MSc in Energy Systems and theEnvironment from the University of Strathclyde,where his thesis was on the alleviation of fuelpoverty. His research interests include low-energyarchitecture, building-integrated renewables,dynamic insulation, building simulation anddemand-side modelling and management.
Andrew WrightAndrew has recently taken up a post as SeniorResearch Fellow at the Institute of Energy andSustainable Development at De Montfort University,with particular interests in energy use in buildings,weather and climate change. His PhD investigatedcomputer modelling of the thermal performance ofindustrial buildings. Andrew was ProgrammeManager of an MSc course in Sustainable ElectricalBuilding Services at UMIST (now University ofManchester. He has worked for the UK ElectricityIndustry at EA Technology Ltd; Newcastle University;and the Building Design Partnership in Manchester.Andrew has been a member of the CharteredInstitute of Building Services Engineers for manyyears, and was one of the authors of the recentguides on Environmental Design and Weather.
Contributors

Photo credits
Solar Century 8, 62, 72Kádár Viktor 9Chris Jardine 13Brenda Boardman 16, 31, 35, 38, 53, 64, 89, 92Collwyn Cleveland 18Mark Harris 19Murat Cokal 23Simon Brander 26Jeff Osborn 27Susie Sinharay 32Matthew Bowden 33, 48Mariano Lesser 37Gavin Killip 39, 46, 67, 84Margus Kyttä 43Lotus Head 50Florian Burghardt 55Josep Lluís 59Nick Benjaminsz 60Nathan Sudds 74Tomek Michalski 77Aaron McMahon 81Les Powell 82Phil Landowski 85Mark Hinnells 97Tina Fawcett 101

ECI RESEARCH REPORT 31
Environmental Change InstituteUniversity of Oxford
1a Mansfield RoadOxford OX1 3SZUnited Kingdom
Telephone: +44 1865 281180E-mail: [email protected]: www.eci.ox.ac.uk