Universities of Leeds, Sheffield and York ...eprints.whiterose.ac.uk/42809/2/WRRO_42809.pdf · des...
21
promoting access to White Rose research papers White Rose Research Online [email protected] Universities of Leeds, Sheffield and York http://eprints.whiterose.ac.uk/ This is an author produced version of a paper published in Materials and Structures. White Rose Research Online URL for this paper: http://eprints.whiterose.ac.uk/42809 Published paper Tlemat, H., Pilakoutas, K., Neocleous, K. (2006) Modelling of SFRC using inverse finite element analysis, Materials and Structures, 39 (286), pp. 221-233 http://dx.doi.org/10.1617/s11527-005-9010-y
Transcript of Universities of Leeds, Sheffield and York ...eprints.whiterose.ac.uk/42809/2/WRRO_42809.pdf · des...

promoting access to White Rose research papers
White Rose Research Online [email protected]
Universities of Leeds, Sheffield and York http://eprints.whiterose.ac.uk/
This is an author produced version of a paper published in Materials and Structures. White Rose Research Online URL for this paper: http://eprints.whiterose.ac.uk/42809
Published paper Tlemat, H., Pilakoutas, K., Neocleous, K. (2006) Modelling of SFRC using inverse finite element analysis, Materials and Structures, 39 (286), pp. 221-233 http://dx.doi.org/10.1617/s11527-005-9010-y

PAPER SUBMITTED TO MATERIALS AND STRUCTURES / MATÉRIAUX ET CONSTRUCTIONS Reference number assigned by RILEM: MS1722
submit.dot 1/20 2003-10-27
Right side of the page reserved to our referees
Modelling of SFRC using inverse finite element analysis Authors: H. Tlemat, K. Pilakoutas and K. Neocleous Centre for Cement and Concrete, Department of Civil & Structural Engineering, The University of Sheffield, UK Abstract A method of inverse finite element analysis is used to determine the constitutive relationship of SFRC in tension, using primary experimental data. Based on beam bending test results and results from pull-out tests, an attempt is made to explain the physical processes taking place during the cracking stage. Basic models predicting the behaviour of SFRC in tension are proposed.
Une méthode de FEA réversible est employée pour déterminer le rapport constitutif de SFRC en tension, en utilisant des données expérimentales primaires. Basé sur des résultats d'essai de flexion de poutre et des résultats des essais d’adhérence, une tentative est faite pour expliquer les processus physiques ayant lieu pendant l'étape fendante. On propose des modèles de base prévoyant le comportement de SFRC dans la tension.
1. Introduction The design method for steel fibre reinforced concrete (SFRC) recommended by RILEM TC 162-TDF [1, 2] is based on the traditional section-analysis method used for normal reinforced concrete (RC) and, hence, offers a convenient means for designing SFRC elements [3]. The difference between the two design methods is that the stress-strain (σ-ε) model used for the design of SFRC does not ignore tension and takes into account the tension stiffening due to the steel fibres. The RILEM TC 162-TDF also proposes an alternative to the σ-ε approach, based on the stress-crack (σ-w) method [4] that requires results from uniaxial tension tests [5]. This method is promising for use in design models with the kinematic approach, and in finite element analysis (FEA) using the discrete crack approach. For the RILEM SFRC σ-ε formulation, the following parameters need to be determined, by using experimentally obtained load-deflection curves: a) load at the limit of proportionality (Fu), b) flexural tensile strength at the limit of proportionality (ffct), c) equivalent flexural tensile strengths (feq2, feq3) [6].
The main problem of the RILEM σ-ε model is in the accuracy of the procedure adopted for the selection of the initial slope of the load-deflection curve. The procedure used is subjective and, hence, it may not lead to the correct value of Fu. The determination of ffct, feq2 and feq3 is not accurate either, since the values of these parameters are influenced directly by the value adopted for Fu. As a result, a 10% variation in the calculation of ffct may be obtained due to the subjectivity of the procedure [7].
Another disadvantage of the RILEM σ-ε model is found in the assumption used for the calculation of the tensile stresses in the cracked SFRC section. These stresses are calculated by using equivalent elasto-plastic stress

Materials and Structures / Matériaux et Constructions
Tlemat, Pilakoutas & Neocleous – FE Modelling of SFRC 2/20 2003-10-27
Right side of the page reserved to our referees
diagrams, which are determined by assuming specific values for the neutral axis depth (0.66hsp and 0.9hsp, at feq2 and feq3, respectively) [3]. As a result of this latter assumption, the SFRC tensile stress is overestimated. The authors showed by using nonlinear FEA [8], that the RILEM model in particular overestimates the load-carrying capacity of SFRC. The same result was reported by Hemmy [9].
It is worth mentioning that the RILEM stress-strain model is a simplified model given to facilitate section analysis for design purposes and, hence, may not be intended to be used in the general modelling in finite element analysis.
The aim of this paper is to determine a more accurate tensile stress-strain relationship for SFRC by using step-by-step numerical analysis. The ABAQUS finite element package [10] is used to perform the analysis. The objective is to optimise the stress-strain model input until the analytical load-deflection curve fits experimental results.
It should be mentioned that the authors are involved in research on SFRC and recycled SFRC (RSFRC). The experimental work used included tests on conventional industrial steel fibres (ISF-1 and ISF-2), as well as on chopped tyre wire (VSF) and two types of recycled fibre (PRSF and SRSF) [11, 12, 13].
2. Background To design complicated SFRC structural elements, it is necessary to employ non-linear FEA. The concrete constitutive model and the representation of the cracks are the main parameters affecting the accuracy of FEA of concrete. Commercially available FEA packages (e.g. DIANA, ATENA, ANSYS and ABAQUS) use the stress-displacement or stress-strain relationship to describe the tension softening of the concrete in the cracked region. The cracking process can be represented by two approaches.
The first approach uses the discrete crack representation model, which is based on the stress-displacement (σ-w) concept. This model was introduced by Ngo and Scordelis [14]. In general the location of the discrete crack need to be predefined [9]. This method is more precise as far as local post-crack behaviour is concerned, but it is computationally more intensive and less useful when trying to develop design models for practical applications. Hence, the more general and most widely accepted smeared crack approach is adopted in this work.
The smeared crack approach assumes cracks to be smeared out over the element (σ-ε method). This model was first introduced by Rashid [15] and then enhanced by Leibengood et al [16] considering the effects of shear retention, Poisson’s ratio and tension stiffening due to reinforcement. The main disadvantage of this model is that, in particular for small amounts of flexural reinforcement, it introduces mesh sensitivity in the analysis, since mesh refinement will lead to narrower crack bands.
To obtain the ideal stress-strain characteristics of concrete, an ideal uniaxial tensile test should be performed. However

Materials and Structures / Matériaux et Constructions
Tlemat, Pilakoutas & Neocleous – FE Modelling of SFRC 3/20 2003-10-27
Right side of the page reserved to our referees
such a test is not easy to perform due to the localisation of the strain introduced by cracks. A simple alternative to direct tensile tests is displacement controlled flexural tests, which are easier to perform, but do not give a direct result. Results from flexural tests can be used to develop the stress-strain or stress-crack width characteristics for FEA modelling.
Dupont and Vandewalle [17] used an iterative procedure to derive the σ-w characteristics by employing what they called “inverse analysis” of experimental results using the FEA package ATENA. Due to restrictions in ATENA package, the post-cracking σ-ε characteristics were modelled with a linear drop. This model was found to be simple to simulate the behaviour of SFRC.
Ostergaard et al [18] also used an inverse analysis based on the bi-linear σ-w law model implemented in DIANA to simulate the non-linear behaviour of an imaginary hinge in the crack zone. Stang [19] used non-linear springs between element nodes to simulate the crack. Both methods resulted in good agreements with experimental data but no σ-ε law model was proposed.
Hemmy [9] used ANSYS in his analysis. Since ANSYS does not allow much flexibility in defining the characteristics of concrete in tension, Hemmy added the effect of fibres by introducing smeared reinforcement in 3-D. His attempts did not reach a successful conclusion.
To avoid the problems encountered by previous researchers, ABAQUS was chosen by the authors because it allows the user to define the strain-softening behaviour for cracked concrete in as many stages as needed.
3. FE Analysis
3.1 Element type used A two-dimensional solid biquadratic element (CPS4) with eight-nodes having two degrees of freedom per node (X,Y) was chosen. A 3x3 Gaussian integration rule over the element plane was adopted. The Gaussian element length is measured perpendicular to the crack direction (as illustrated in Fig. 1) by assuming that the element is a rectangle, and the crack propagation is perpendicular to the tensile surface of the beam.
Figure 1 Element used in ABAQUS
The analysis is performed by incremental loading, with integration in each increment. Since considerable nonlinearity is expected in the response of the analysed

Materials and Structures / Matériaux et Constructions
Tlemat, Pilakoutas & Neocleous – FE Modelling of SFRC 4/20 2003-10-27
Right side of the page reserved to our referees
beam (including the possibility of instability region as the concrete cracks), the load magnitudes are covered by a single scalar parameter. The modified Riks algorithm with automatic increments is used [10]. This method uses the “arc length” along the static equilibrium path in load-displacement space. This method in general worked well and provided a solution.
3.2 SFRC model and inverse analysis
3.2.1 Compressive characteristic In ABAQUS, the concrete model developed by Kupfer
et al [20] is used. A Mohr–Coulomb type compression surface combined with a crack detection surface is used to model the failure surface of concrete (Fig. 2).
Figure 2 Concrete failure surfaces in plane stress [16]
When the principal stress components of concrete are predominantly compressive, the response of the concrete is modelled by the elastic-plastic theory with associated flow and isotropic hardening rule.
Previous research by the authors [8] indicates that the compressive strain measured at peak load for SFRC containing 1.5% virgin steel fibres (VSF), during third-point bending tests, is around 0.4‰. This strain is considered to be in the linear elastic region. However, for SFRC with higher fibre ratios and at post-peak load displacement, the strain magnitude could fall in the non-linear region. To cover all possibilities, the uniaxial non-linear stress-strain relationship for concrete in compression, as defined by Eurocode 2 [21] and adopted by RILEM [1, 2], is used in the analysis (Fig. 3).
Ecm can be calculated according to EC2 [13] as follows. 3/19500 fcmcm fE ⋅= (N/mm2) (1)
cmfcm ff ⋅= 85.0 (N/mm2) (2) Where: ffcm mean compressive cylinder strength in SFRC,

Materials and Structures / Matériaux et Constructions
Tlemat, Pilakoutas & Neocleous – FE Modelling of SFRC 5/20 2003-10-27
Right side of the page reserved to our referees
fcm mean compressive cube strength in SFRC.
Figure 3 Compressive stress-strain curve implemented in
ABAQUS
In ABAQUS the failure ratios option is used to define the shape of the failure surface. Two values are required. The first one is the ratio of the ultimate biaxial compressive stress to the ultimate uniaxial compressive strength (Fig. 2). This value was kept constant at 1.15. The second value is the absolute value of the ratio of uniaxial tensile stress at failure to the ultimate uniaxial compressive stress. In SFRC this value depends on fibre content and type as will be discussed later.
3.2.2 Shear Retention During the post cracking stage, the cracked SFRC can still retain shear through transfer of shear forces through aggregate interlock or shear friction through fibres. Assuming that the shear modulus of intact concrete is Gc, then the reduced shear modulus GR of cracked concrete can be expressed by; GR = ρcloseGc (3) and ρclose = 1- ε / εmax (4) Where: ε strain normal to the crack direction, εmax strain at which the concrete tensile stress reduces
to zero.
In ABAQUS, a very large value is usually assumed for εmax, which is automatically invoked with default data value ρclose equal to 1.0 (full shear retention). In this investigation the values for shear retention parameter ρclose = 0.1 and 1.0 (full shear retention) were used. The overall deformation was very similar for the two solutions. Since this parameters did not make much deference in this flexural dominated problem, the value of ρclose =1.0 was chosen for further analysis since it gives more stable results.
3.2.3 SFRC Tensile Characteristics In tension, once cracking is defined to occur (by the crack detection surface), the orientation of the cracks is stored, and fixed. Damaged elasticity is then used to model existing cracks.
Due to the random orientation of fibres in concrete, the behaviour of SFRC in tension can be assumed to be similar to the one of plain concrete, but with improved tension

Materials and Structures / Matériaux et Constructions
Tlemat, Pilakoutas & Neocleous – FE Modelling of SFRC 6/20 2003-10-27
Right side of the page reserved to our referees
stiffening. By changing the tensile softening characteristics step-by-step, a stress-strain relationship can be found that will equate the analytical load-deflection curve with the experimental one. This method is called “back-calculation” or “inverse analysis” for the determination of the stress-strain characteristics.
The tension softening of concrete after cracking is simulated by a multi-linear descending curve. The gradient of the stress-strain curve along the softening region is varied as illustrated in Fig. 4.
Figure 4 Tension softening model
Up to point (1), the concrete is considered to be uncracked having an elastic modulus of Ecm (same as initial modulus in compression). This point is established by determining the first deviation from linearity of the load deflection curve. After this stage, subsequent points (2), (3) and (4) are obtained by iteration, until the complete load deflection curve is followed relatively accurately.
4. FE sensitivity analysis and results Taking advantage of symmetry, only half of the beam is modelled. To simulate the notch along the symmetry axis, nodes within the notch’s height are unrestrained. This means that the notch is modelled physically as a discontinuity in the beam. However, since the smeared crack approach is used, this means that the crack propagation cannot be followed directly in this type of analysis.
A mesh sensitivity study was performed using three meshes shown in Fig. 5. Mesh (b) was used to optimise the initial results. The input tension softening curve was modified until the calculated load versus mid-span-deflection curve agreed with the experimental results, as shown in Fig. 6 for the integration point nearest to the crack. This stress-strain response was used to describe the SFRC characteristic for all meshes. The load deflection curves obtained from analysis and experiments are shown in Fig. 7.
Figure 5 FE model with coarse, middle and fine meshes

Materials and Structures / Matériaux et Constructions
Tlemat, Pilakoutas & Neocleous – FE Modelling of SFRC 7/20 2003-10-27
Right side of the page reserved to our referees
Figure 6 Input and output stress-strain relationship (1.5%
VSF)
Figure 7 Predicted load-displacement curves for beam with
1.5% VSF
As expected, mesh (a) leads to an increase in the post-crack energy absorption capacity, whilst mesh (c) underestimates the capacity after cracking. The results showed that the FE analysis for mesh (c) is unstable at a deflection of 1.25 mm. This is because the post-crack energy is two low, causing local cracking failure in the SFRC and leading to unstable behaviour in the overall response of the model. To get larger deflections, it is necessary to increase the post-crack energy input. In concrete modelling with the smeared crack approach, the choice of mesh is influenced by the energy dissipated in tension, which also depends on the aggregate size. Mesh b is chosen for further analysis, since it is on the lower limit of dimensions allowed for this particular concrete.
4.1 Discussion on the SFRC tensile behaviour To examine the initial response of the critical section obtained from the model using mesh (b), Fig. 8(a) zooms in the first 1000 micro-strains of the load (left axis) and stress (right axis) versus strain diagram. Fig. 8(b) shows a diagrammatic illustration of the various phases of crack development and Fig. 8(c) shows the corresponding stress diagrams. It can be seen that the calculated ultimate uniaxial tensile stress ( u
tσ ,) and the first crack load (F1,u) are attained at the same value of strain (92 μs). The calculated load at this point is 19 kN, which is equivalent to the load obtained from the tests [8].

Materials and Structures / Matériaux et Constructions
Tlemat, Pilakoutas & Neocleous – FE Modelling of SFRC 8/20 2003-10-27
Right side of the page reserved to our referees
Figure 8 Initial load vs stress, stress vs strain and stress
distribution.
By considering the above, the load-stress relationship can be described in four phases. In phase 1, the load-stress relationship can be idealised as linear elastic. There is no crack in the tensile zone (T1) and the maximum tensile stress is reached at strain MS. In this phase, the fibre geometry usually has no influence on the load [22], hence, the maximum tensile stresses are only related to the concrete strength and fibre ratio. The corresponding strain is a function of concrete compressive strength, fibre ratio and elastic modulus.
In phase 2, cracking is initiated in the concrete resulting in a sharp drop in the stress-strain behaviour of SFRC as shown in Fig. 8(a). Phase 2 starts at the first major deviation from linearity of the load-deflection curve, also shown in Fig. 8(a) and 9(b). From the top left part of Fig. 9(b) it can be seen that this point signifies the onset of cracking.
The lower left part of Fig. 9(b) shows the load-slip relationship obtained from a pull-out test for an individual PRSF. It is clear that the fibres are mobilised at very low slip values. Once the crack starts opening (around 0.1-0.2

Materials and Structures / Matériaux et Constructions
Tlemat, Pilakoutas & Neocleous – FE Modelling of SFRC 9/20 2003-10-27
Right side of the page reserved to our referees
mm), the fibres with long embedment length are still capable to carrying extra load with increasing slip, but the shorter fibres start to pull-out.
By the end of phase 2, the crack is well established (the concrete tensile contribution is lost) and most fibres have exceeded their peak loads and are beginning to slip at more or less constant loads.
On the element level, by the end of phase 2, the deflection behaviour of the prism changes from elastic to more or less elasto-plastic, with a hinge developing in the mid-span.
Figure 9 (a) Relationship between load-crack width, load-
slip and load-deflection.
Figure 9 (b) Initial parts of the curves of Fig. 9 (a)
Phase 3 starts when the main concrete crack (or cracks) has formed and the fibres resisting the opening are doing so primarily through fibre-pullout. Naturally, not all fibres that cross the crack provide resistance, since many are not sufficiently anchored. The equivalent SFRC stress in this phase should theoretically be expected to remain constant if all the fibres were aligned in the load direction. However, a substantial amount of fibres are inclined and are less activated. With increasing crack opening, the inclined fibres will crash the concrete between the fibre and the crack as they try to straighten out [23]. This will decrease the effective stress across the crack during the middle stage of

Materials and Structures / Matériaux et Constructions
Tlemat, Pilakoutas & Neocleous – FE Modelling of SFRC 10/20 2003-10-27
Right side of the page reserved to our referees
phase 3 as shown in Fig. 6. However, it is possible that the contribution of inclined fibres increases later on, when they are re-engaged by the uncrushed concrete. Eventually, with increasing crack opening, most fibres will pull-out with no residual force and that brings phase 3 to an end.
During phase 4, the concrete near the notch carries no tensile stress, but the load is carried by the part of the section in which the fibres are still engaged and the neutral axis depth moves closer to the compressive zone.
4.2 Discussion on the analytical results
4.2.1 Deflection-strain, deflection-neutral axis The relationship between deflection and strain is examined in Fig. 10. The figure confirms the linear relationship between mid-span deflection and strain and at the same time validates the choice of hinge length used to derive the stress-strain curves [8].
Figure 10 Numerical mid-span deflections versus tensile
strains (1.5% VSF)
By using Figures 6 and 7, it can be determined that the maximum strain of 10‰ (used by the original RILEM model [1]) corresponds only to 0.8 mm in deflection and hence, can not describe the full behaviour of the element which is capable of still resisting a substantial load at much higher deformations.
Fig. 11 shows the shift of the calculated normalised neutral axis depth from the notch tip (y) for a prism reinforced with 1.5% VSF. The positions of the neutral axis are 0.85, 0.83 and 0.97 at first crack, peak load and 2 mm deflection, respectively. These values agree with experimental results reported previously by the authors [8].
Figure 11 Deflection vs normalised neutral axis

Materials and Structures / Matériaux et Constructions
Tlemat, Pilakoutas & Neocleous – FE Modelling of SFRC 11/20 2003-10-27
Right side of the page reserved to our referees
4.2.2 Principal Stress Vectors Fig. 12 shows the distribution of the maximum principal stress vectors in the beam at first crack. Due to the discontinuity, the maximum stresses at the element adjacent to the notch are forced to change direction towards the notch tip. The stress singularity at the notch tip, can lead to infinite stress. Since Abaqus uses a fixed crack approach; this can lead to a loss of the coaxiality between the principal stress and strain axis during simulation, and provide an apparent strengthening of the modelled material at larger crack openings [24].
Figure 12 Distribution of the principal stress vectors at first
crack
Another way of looking at the accuracy of the analysis is by examining the reactions along the line of symmetry, as shown in Fig. 13 for three difference mesh sizes. It is clear that the notch creates a disturbance in the reaction forces and this disturbance reduces as the number of elements increase.
mesh (b) mesh (c) mesh (d)
Figure 13 Deformed reaction forces
4.3 Mesh independent stress-strain relationship To get the numerical results for mesh (a) to agree with the experimental, the tension softening has to be reduced (σ-ε(a)) as shown in Fig. 14.
Figure 14 Tension softening for mesh (a) before and after
modification
Materials and Structures / Matériaux et Constructions
Tlemat, Pilakoutas & Neocleous – FE Modelling of SFRC 12/20 2003-10-27
Right side of the page reserved to our referees
It is evident that lower tension softening is required to fit the result for the coarser mesh and vice-a-versa for the finer mesh (c). This is clearly related to the inverse relationship between strain and element length (ε = ∆l/l).
It is necessary to develop a method, which will be able to derive the stress-strain curves for any mesh sizes, when the optimum stress-strain curves for a given mesh size is known. This method should allow an amount of energy to be dissipated in a crack irrespective of element size.
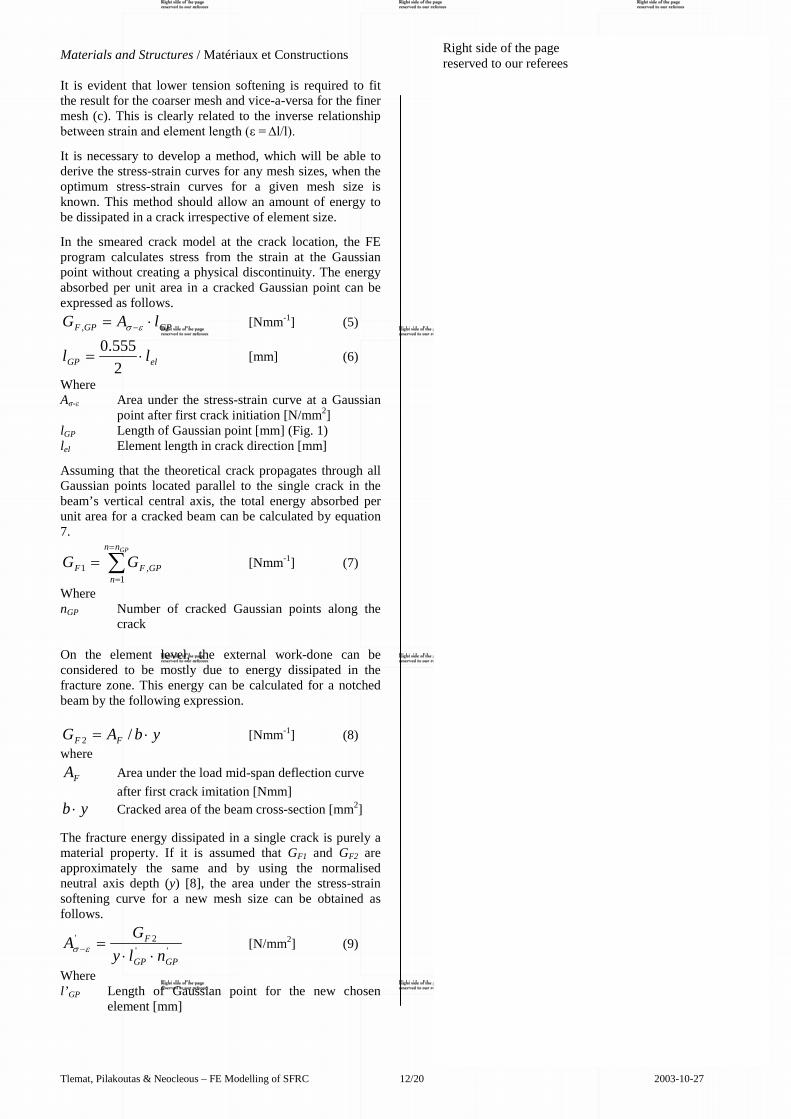
In the smeared crack model at the crack location, the FE program calculates stress from the strain at the Gaussian point without creating a physical discontinuity. The energy absorbed per unit area in a cracked Gaussian point can be expressed as follows.
GPGPF lAG ⋅= −εσ, [Nmm-1] (5)
elGP ll ⋅=2555.0
[mm] (6)
Where Aσ-ε Area under the stress-strain curve at a Gaussian
point after first crack initiation [N/mm2] lGP Length of Gaussian point [mm] (Fig. 1) lel Element length in crack direction [mm]
Assuming that the theoretical crack propagates through all Gaussian points located parallel to the single crack in the beam’s vertical central axis, the total energy absorbed per unit area for a cracked beam can be calculated by equation 7.
∑=
=
=GPnn
nGPFF GG
1,1 [Nmm-1] (7)
Where nGP Number of cracked Gaussian points along the
crack On the element level, the external work-done can be considered to be mostly due to energy dissipated in the fracture zone. This energy can be calculated for a notched beam by the following expression.
ybAG FF ⋅= /2 [Nmm-1] (8) where
FA Area under the load mid-span deflection curve after first crack imitation [Nmm]
yb ⋅ Cracked area of the beam cross-section [mm2]
The fracture energy dissipated in a single crack is purely a material property. If it is assumed that GF1 and GF2 are approximately the same and by using the normalised neutral axis depth (y) [8], the area under the stress-strain softening curve for a new mesh size can be obtained as follows.
''2'
GPGP
F
nlyGA
⋅⋅=−εσ [N/mm2] (9)
Where l’GP Length of Gaussian point for the new chosen
element [mm]

Materials and Structures / Matériaux et Constructions
Tlemat, Pilakoutas & Neocleous – FE Modelling of SFRC 13/20 2003-10-27
Right side of the page reserved to our referees
n’GP Number of cracked Gaussian points along the crack for the new chosen element
According to Hillerborg [25], the element length, along the crack path should not be greater than 0.1-0.2 lch. lch is the characteristic length (or the width of the fracture zone in a smeared tensile test) and defined by Bazant and Pijaudier-Cabot [26] as the ratio :
εσ −
==AG
WG
l F
F
Fch
23 [mm] (10)
The surface fracture energy, GF3 expresses the energy dissipated to create a unit crack area. WF, represents the energy absorbed by a volume of material during a smeared tensile test, where a large number of micro-cracks are created. Both the surface fracture energy and the volumetric fracture energy are determined from the complete area enclosed by the stress-displacement or stress-strain curves. In a bending test, those values can be replaced by GF2 and Aσ-ε .
By assuming that the energy is dissipated in the Gaussian points nearest to the crack, and that the pre-crack part of the stress-strain relationship remains elastic, the strain values for the stress-strain curves for a new element length can be expressed by equation 11 and illustrated in Fig. 15.
'''εσ
εσ
εεεε
−
−=−−
AA
utn
utn (11)
Where ε Strain for new element size ε′ Strain from initial element size n Number of linear portions
Figure 15 Determination of the strain values for the a given
element size
The proposed procedure is used to determine the σ-ε diagram for mesh (c), using the result obtained for mesh (b) for the beam reinforced with 1.5% VSF fibres as shown in Appendix A. The plastic strains ε1, ε2 and ε3 were determined at values of 2‰, 10‰ and 25‰, respectively.
The input parameters for the remaining tested fibres are shown in table 1. The values shown in the table for σn1, σn2 and σn3 are normalised against u
tσ .
Materials and Structures / Matériaux et Constructions
Tlemat, Pilakoutas & Neocleous – FE Modelling of SFRC 14/20 2003-10-27
Right side of the page reserved to our referees
Table 1 Input parameters for the tested fibres Material input Element input lel = 25 mm
Type Fibres GF2 Ecm utσ u
ntσ utε σn1/ε1 σn2/ε2 σn3/ε3
- % [Nmm1] [N/mm2] [N/mm2] [‰] Plain 0 - 33400 1.9 1 0.06 - - -
VSF
1.5 3.04 34000 2.68 1.4 0.07 0.57/2 0.5/10 0.20/25 3.0 4.8 35500 4.2 2.2 0.10 0.70/2 0.40/10 0.25/25 6.0 7.52 37500 5.7 3.0 0.13 0.70/2 0.50/10 0.25/25
PRSF
1.5 2.7 31000 2.6 1.36 0.08 0.55/2 0.30/10 0.15/25 3.0 3.7 30000 3.4 1.78 0.11 0.60/2 0.35/10 0.25/25 6.0 6.7 33000 5.3 2.78 0.16 0.70/2 0.60/10 0.30/25
ISF-1 6.0 7.3 33500 5.9 3.10 0.17 0.70/2 0.50/10 0.35/25 ISF-2 6.0 7.2 36000 5.6 2.94 0.15 0.70/2 0.55/10 0.25/25
SRSF
0.5 1.0 33000 2.03 1.07 0.06 0.30/2 .015/10 0.05/25 1.0 1.7 33000 2.41 1.26 0.07 0.40/2 0.25/10 0.10/25 2.0 2.6 32000 2.7 1.42 0.08 0.50/2 0.3/10 0.15/25
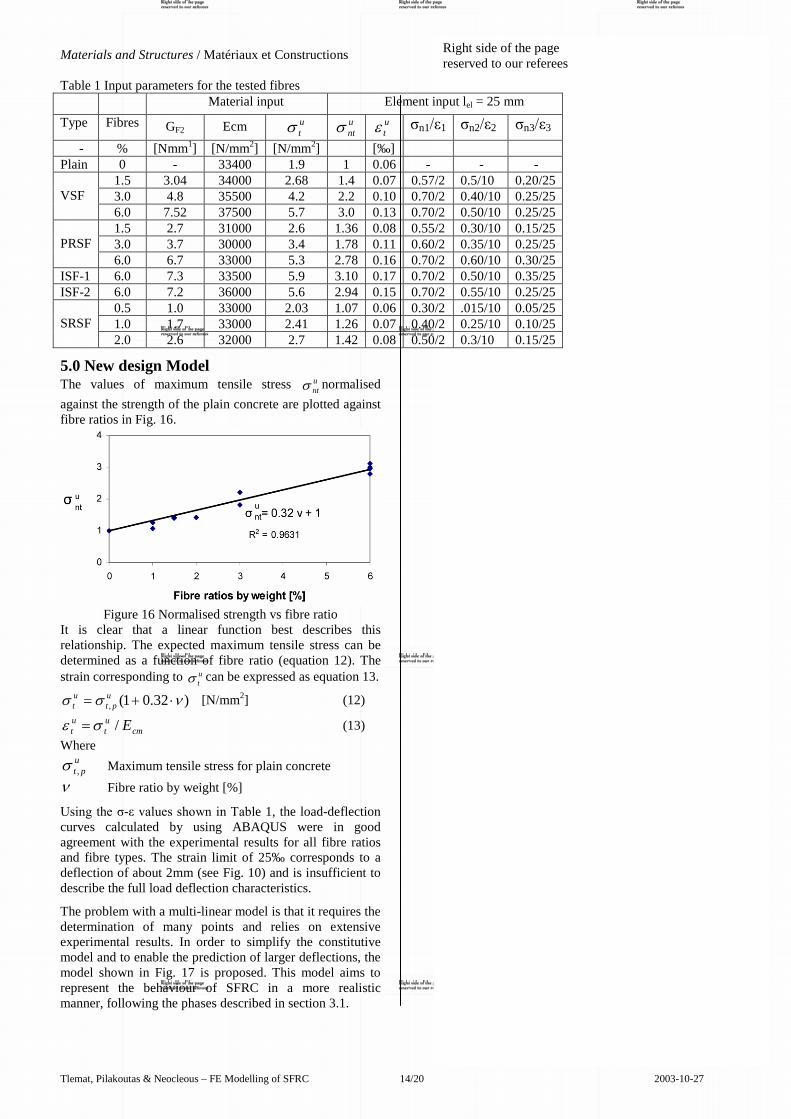
5.0 New design Model The values of maximum tensile stress u
ntσ normalised against the strength of the plain concrete are plotted against fibre ratios in Fig. 16.
Figure 16 Normalised strength vs fibre ratio
It is clear that a linear function best describes this relationship. The expected maximum tensile stress can be determined as a function of fibre ratio (equation 12). The strain corresponding to u
tσ can be expressed as equation 13.
)32.01(, νσσ ⋅+= upt
ut [N/mm2] (12)
cmut
ut E/σε = (13)
Where u
pt ,σ Maximum tensile stress for plain concrete ν Fibre ratio by weight [%]
Using the σ-ε values shown in Table 1, the load-deflection curves calculated by using ABAQUS were in good agreement with the experimental results for all fibre ratios and fibre types. The strain limit of 25‰ corresponds to a deflection of about 2mm (see Fig. 10) and is insufficient to describe the full load deflection characteristics.
The problem with a multi-linear model is that it requires the determination of many points and relies on extensive experimental results. In order to simplify the constitutive model and to enable the prediction of larger deflections, the model shown in Fig. 17 is proposed. This model aims to represent the behaviour of SFRC in a more realistic manner, following the phases described in section 3.1.

Materials and Structures / Matériaux et Constructions
Tlemat, Pilakoutas & Neocleous – FE Modelling of SFRC 15/20 2003-10-27
Right side of the page reserved to our referees
Figure 17 Proposed uniaxial tensile stress-train model for
mesh (b).
Phase 1 remains unchanged and relies on equation 12 for the determination of u
tσ and utε .
In phase 2 an exponential stress drop is introduced which can be determined by using equation 14. The magnitude of the drop depends on the fibre type and is determined by the factor ξ, which has to be determined experimentally.
Phase 3 has been simplified and comprises of a linear drop of stress to zero at strain ε4 (40‰).
1
)( 1
εεε
σσ εεξ
<<
⋅= −⋅
ut
utt
fore
(14)
Where ξ Factor reflects the influence of the fibre type on
the tensile softening (Table 2). ε1 equal to 2‰
Table 2 Factors for the proposed model
Fibre type ξ Factors VSF 0.20
PRSF 0.28 ISF-1 0.17 ISF-2 0.19 SRSF 0.51
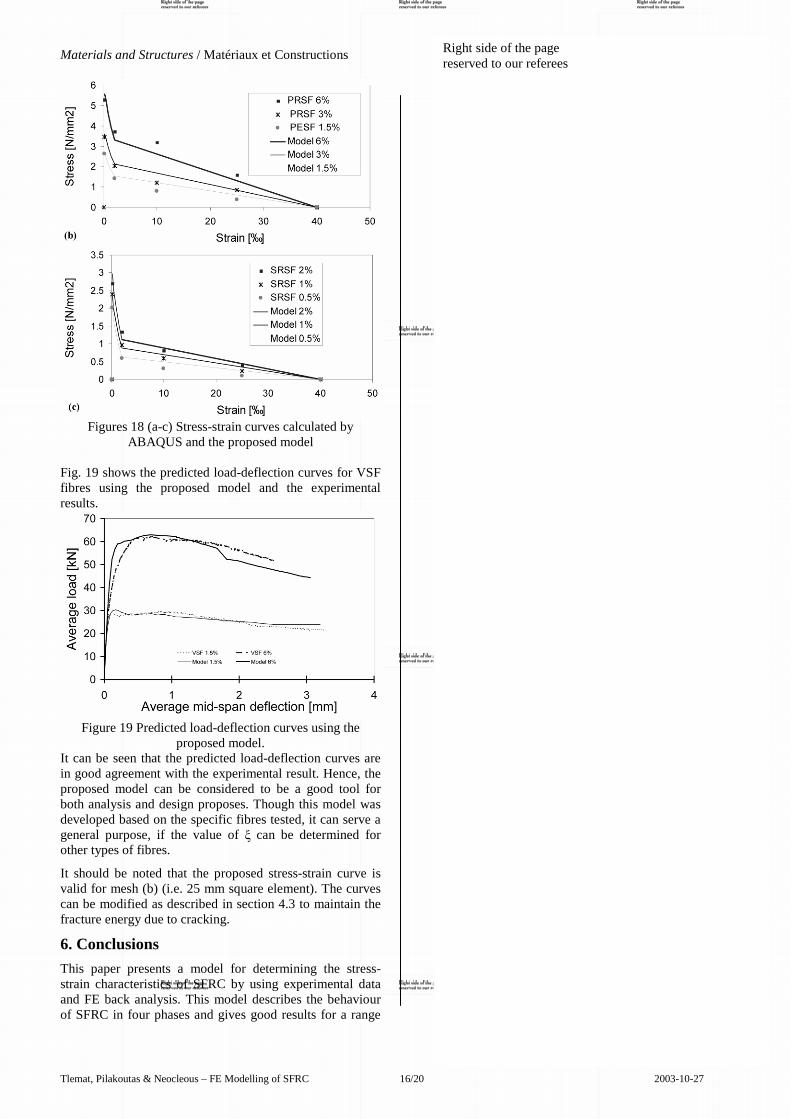
Figures 18(a-c) show the prediction of the proposed model (indicated by solid lines) in comparison with the results obtained from ABAQUS back analysis (indicated by points)
Materials and Structures / Matériaux et Constructions
Tlemat, Pilakoutas & Neocleous – FE Modelling of SFRC 16/20 2003-10-27
Right side of the page reserved to our referees
Figures 18 (a-c) Stress-strain curves calculated by
ABAQUS and the proposed model Fig. 19 shows the predicted load-deflection curves for VSF fibres using the proposed model and the experimental results.
Figure 19 Predicted load-deflection curves using the
proposed model. It can be seen that the predicted load-deflection curves are in good agreement with the experimental result. Hence, the proposed model can be considered to be a good tool for both analysis and design proposes. Though this model was developed based on the specific fibres tested, it can serve a general purpose, if the value of ξ can be determined for other types of fibres.
It should be noted that the proposed stress-strain curve is valid for mesh (b) (i.e. 25 mm square element). The curves can be modified as described in section 4.3 to maintain the fracture energy due to cracking.
6. Conclusions This paper presents a model for determining the stress-strain characteristics of SFRC by using experimental data and FE back analysis. This model describes the behaviour of SFRC in four phases and gives good results for a range

Materials and Structures / Matériaux et Constructions
Tlemat, Pilakoutas & Neocleous – FE Modelling of SFRC 17/20 2003-10-27
Right side of the page reserved to our referees
of fibres tested. A procedure is given to enable the use of the model with different mesh sizes.
Acknowledgments The authors wish to acknowledge the Marie-Curie EU Community program “Improving Human Research Potential and the Socio-Economic Knowledge Base” under contract number HPMF-CT-2002-01825, the UK Government’s Department of Trade and Industry for the partners in Innovation project “Demonstrating steel fibres from waste tyres as reinforcement in concrete” (contract: CI 39/3/684, cc2227) and the University of Sheffield.
References 1. RILEM TC 162-TDF, ‘Test and design methods for
steel fibre reinforced concrete: σ-ε design method’, Materials and Structures 33 (226) (2000) 75-81.
2. RILEM TC 162-TDF, ‘Test and design methods for steel fibre reinforced concrete, σ-ε design method. Final recommendation’. Materials and Structures 36 (262) (2003) 560-567.
3. Vandewalle L., and Dupont, D., ‘Bending tests and interpretation’, in ‘Test and design methods for steel fibre reinforced concrete – background and experiences’, Proceedings of the RILEM TC 162-TDF Workshop, Edited by B. Schnütgen and L. Vandewalle, Bochum Germany, March 2003 (RILEM S.A,R.L., Bagneux, 2003) 1-13.
4. RILEM TC 162-TDF, ‘Test and design methods for steel fibre reinforced concrete: σ-w method: principles and applications’, Materials and Structures 35 (249) (2002) 262-278.
5. RILEM TC 162-TDF, ‘Test and design methods for steel fibre reinforced concrete: uni-axial tension test for steel fibre reinforced concrete’, Materials and Structures 34 (235) (2001) 3-6.
6. RILEM TC 162-TDF, ‘Test and design methods for steel fibre reinforced concrete: bending test’, Materials and Structures 35 (253) (2002) 579-582.
7. Barr, B., and Lee, M.K., ‘Interpretation in the procedure of calculating RILEM TC-162 beam design Parameters. Definition of round robin test, preparation of specimens, execution and evaluation of round Robin testing’, Report of subtasks 2.1 and 2.2’, Brite-Euram project BRPR-CT98-0813: Test and Design Methods for Steel Fibre Reinforced Concrete, Project funded by the European Community under the Industrial & Materials Technologies Programme (Brite-Euram II) (2002).
8. Tlemat, H., Pilakoutas, K. and Neocleous, K. `Stress-strain characteristic of SFRC using recycled fibres`. Materials and Structures, paper submitted March 2004.
9. Hemmy, O., `Recommendations for Finite Element Analysis of FRC`, Report of Subtask 3.5, Brite-EuRam Project BRPR-CT98-0813: Test and Design Methods for Steel Fibre Reinforced Concrete, Project funded by the European Community under the Industrial & Materials Technologies Programme (Brite-Euram II) (2002).
10. Hibbitt, et al. `ABAQUS User’s Manual`, Version 6.1, (2000).

Materials and Structures / Matériaux et Constructions
Tlemat, Pilakoutas & Neocleous – FE Modelling of SFRC 18/20 2003-10-27
Right side of the page reserved to our referees
11. Pilakoutas, K., and Strube R., ‘Reuse of tyre fibres in concrete’, Proceedings of the International Symposium on Recycling and Reuse of Used Tyres, Dundee UK, March 2001 (Thomas Telford Ltd, London, 2001) 225-236.
12. Tlemat, H., Pilakoutas, K., and Neocleous, K., ‘Pullout behaviour of steel fibres recycled from used tyres’, Proceedings of International Symposia on Celebrating Concrete: People and Practice (in Role of Concrete in Sustainable Development), Dundee UK, Sept. 2003, (Thomas Telford Ltd, London, 2003) 175-184.
13. Tlemat, H., Pilakoutas, K., and Neocleous, K., ‘Flexural toughness of SFRC made with fibres extracted from tyres’, Proceedings of International Symposium on Advances in Waste Management and Recycling (in Recycling and Reuse of Waste Materials), Dundee UK, Sept. 2003, (Thomas Telford Ltd, London, 2003) 365-374.
14. Ngo, D and Scordelis, A. C., ‘Finite element analysis of reinforced concrete beams’, ACI 64 (3) (1967) 152-163
15. Rashid, Y. R., `Analysis of prestressed concrete vessels`, Nuclear Eng. and Design (1968) 334-344.
16. Leibengood, L. D., Darwin, D. and Dodds, R. H., `Parameters affecting FE analysis of concrete structures`, Journal of Structural Engineering ASCE 12 (2) (1986) 326-341.
17. Dupont, D., Vandewalle, L, ‘Recommendations for finite element analysis of FRC’, Report of Subtask 3.5, Brite-EuRam Project BRPR-CT98-0813: : Test and Design Methods for Steel Fibre Reinforced Concrete, Project funded by the European Community under the Industrial & Materials Technologies Programme (Brite-Euram II) (2002).
18. Ostergaard, L., Olesen, J. F., Stang, H. and Lange, D., ‘A method for fast and simple interpretation and inverse analysis of the wedge splitting test’, Report of Subtask 3.5, Brite-EuRam Project BRPR-CT98-0813: : Test and Design Methods for Steel Fibre Reinforced Concrete, Project funded by the European Community under the Industrial & Materials Technologies Programme (Brite-Euram II), (2002).
19. Stang, H., ‘Finite element modelling using discrete crack elements’, Report of Subtask 3.5, Brite-EuRam Project BRPR-CT98-0813: Test and Design Methods for Steel Fibre Reinforced Concrete, Project funded by the European Community under the Industrial & Materials Technologies Programme (Brite-Euram II) (2002).
20. Kupfer, H., Hilsdorf, H. K. and Rusch, H., ‘Behaviour of concrete under biaxial stress’, ACI 99 (8) (1973) 656-666.
21. Eurocode 2, ‘EVV 1992-1-1, Design of concrete structures-Part 1: General rules and rules for buildings’, British Standards Institution, London (1991).
22. Banthia, N. and Trottier, J. F., ‘Concrete reinforced with deformed steel fibres, part1: bond-slip mechanisms’, ACI Material Journal 91 (5) (1994) 435-446.
23. Chanvillard, G. and Aitcin, P. C., ‘Pullout behaviour of corrugated steel fibres’, Advanced Cement Based Materials 4 (1) (1996) 28-41.

Materials and Structures / Matériaux et Constructions
Tlemat, Pilakoutas & Neocleous – FE Modelling of SFRC 19/20 2003-10-27
Right side of the page reserved to our referees
24. Mechtcherine, V. and Mueller, H. S., ‘Analysis of concrete fracture using a heterogeneous continuum model’, in Computional Modelling of Concrete Structures, Edited by Bicanic et al, Swets and Zeitlinger, Lisse, Netherlands (2003).
25. Hillerborg, A., ‘Analysis of one single crack’, in Fracture Mechanics of Concrete’, (Elsevier Science Publishers B.V., Amsterdam, 1983).
26. Bazant, Z. P. and Pijaudier-Cabot, G. ‘Measurement of characteristic length of non-local continuum’. Journal of Engineering Mechanics (ASCE) 115 (4) (1989) 755-767.
Appendix A The procedure for determining the σ-ε characteristics for any mesh size is outlined diagrammatically in the flow chart shown in Fig. A1.
Figure A1 Flow diagram for determining the σ-ε
characteristic for a given element size For a notched beam with a nominal size of 150x150x550 mm and a notch length of 25 mm, the input parameters for an element length of 25 mm are shown in Fig A2 and table 1.

Materials and Structures / Matériaux et Constructions
Tlemat, Pilakoutas & Neocleous – FE Modelling of SFRC 20/20 2003-10-27
Right side of the page reserved to our referees
Figure A2 Input stress strain curve for Virgin fibres 1.5%
and lel = 25 mm Table A1 Input parameters for the case study
Material input Element input lel = 25 mm lel =12.5 mm
Type Fibres %
GF2 [Nmm-1]
Ecm [N/mm2]
utσ
[N/mm2]
utε
[‰] σn1/ε1
σn2/ε2
σn3/ε3
n’GP
[mm] n’GP
VSF 1.5 3.04 34000 2.68 0.07 0.57/2 0.50/10 0.2/25 3.46 30
For the determination of GF2, only the area under the experimental load-deflection curve from first crack up to 2 mm is considered (corresponding to a strain of 25‰, see Fig. 10). The position of the neutral axis is about 0.97, see Fig. 11. Assuming that the stress values remain constant, the strain values for an element length of 12.5 mm can be determined as follows.
GF2 = 55e103/0.97x150x125 = 3.04[Nmm-1] (12)
Aσ-ε post crack area under the softening curve in Fig. A2 up to a strain of 25‰
=0.02 [N/mm2]
lch = 3.04/0.02 = 152 [mm] (13)
lel = 12.5 mm ≤ 0.2x152 = 30.4 mm
A’σ-ε =3.04/0.97x3.46x30 = 0.030 [N/mm2] (14)
020.0030.0
1007.0025.01007.0
1007.0002.01007.0
3
3'3
3
3'1 =
−−
=−
−−
−
−
−
ee
ee εε
0375.0,015.0,003.0 '3
`2
'1 === εεε
Fig. A3 compares the experimental load-deflection curve with the one calculated by using mesh (c) and the modified strains ε1,12.5, ε2,12.5 and ε3,12.5. There is a good agreement between both curves and hence, this confirms that the adopted procedure is reliable.
Fig. A3 Cooperation between experimental and by
ABAQUS calculated result for VSF 1.5%
New element length
for mesh ©
l’≤ 0.1-0.2 lch