UNIVERSITI TEKNIKAL MALAYSIA MELAKA FINAL...
24
i UNIVERSITI TEKNIKAL MALAYSIA MELAKA FACULTY OF ELECTRICAL ENGINEERING FINAL YEAR PROJECT REPORT COST MONITORING DIGITAL POWER METER PREPARED BY: LOO SEONG ENG B020810001 BACHELOR DEGREE IN ELECTRONIC ENGINEERING (WIRELESS TELECOMMUNICATION) WITH HONOUR
Transcript of UNIVERSITI TEKNIKAL MALAYSIA MELAKA FINAL...

i
UNIVERSITI TEKNIKAL MALAYSIA MELAKA
FACULTY OF ELECTRICAL ENGINEERING
FINAL YEAR PROJECT REPORT
COST MONITORING DIGITAL POWER METER
PREPARED BY:
LOO SEONG ENG
B020810001
BACHELOR DEGREE IN ELECTRONIC ENGINEERING
(WIRELESS TELECOMMUNICATION)
WITH HONOUR
ii
UNIVERSTI TEKNIKAL MALAYSIA MELAKAFAKULTI KEJURUTERAAN ELEKTRONIK DAN KEJURUTERAAN KOMPUTER
BORANG PENGESAHAN STATUS LAPORANPROJEK SARJANA MUDA II
Tajuk Projek : COST MONITORING DIGITAL POWER METERSesiPengajian : 2 0 1 1
Saya Loo Seong Eng mengaku membenarkan Laporan Projek Sarjana Muda ini disimpan diPerpustakaan dengan syarat-syarat kegunaan seperti berikut:
1. Laporan adalah hakmilik Universiti Teknikal Malaysia Melaka.
2. Perpustakaan dibenarkan membuat salinan untuk tujuan pengajian sahaja.
3. Perpustakaan dibenarkan membuat salinan laporan ini sebagai bahan pertukaran antara institusi
pengajian tinggi.
4. Sila tandakan ( √ ) :
SULIT**(Mengandungi maklumat yang berdarjah keselamatan ataukepentingan Malaysia seperti yang termaktub di dalam AKTARAHSIA RASMI 1972)
TERHAD** **(Mengandungi maklumat terhad yang telah ditentukan olehorganisasi/badan di mana penyelidikan dijalankan)
TIDAK TERHAD
Disahkan oleh:
__________________________ ___________________________________(TANDATANGAN PENULIS)
Tarikh: 03.05.2011
(COP DAN TANDATANGAN PENYELIA)
Tarikh: 03.05.2011
Tarikh: ……………………….. Tarikh: ………………………..
iv
“I hereby declare that I have read this report and in my opinion this report is
Sufficient in terms of the scope and quality for the award of Bachelor of Electronic
Engineering (Computer Engineering) With Honours.”
Signature :.........................................................................
Supervisor’s Name : Engr. Zulkifli Shariff
Date : 03.05.2011
iii
I declare that this report entitle “Cost Monitoring Digital
Power Meter” is the result of my own research except as cited in the references. The
report has not been accepted for any degree and is not concurrently submitted in
candidature of any other degree.
Signature : ……………………………………
Name : Loo Seong Eng
Date : 03.05.2011

v
ACKNOWLEDGEMENT
Thanks to God that is always blessing to me, finally the Final Year Project
(FYP) report is completed. In order to complete this report, I was in contact with
many people. They have contributed towards my understanding and thought.
First and foremost, I would like to express my sincere appreciation to both of
my supervisor’s that are Engr. Zulkifli Shariff and Engr. Ranjit Singh Sarban Singh
who is really kind, patience and continuously guided me by share her time and
knowledge during my study. I am also very thankful to Ms. Siti Aisyah bte Anas for
helping and guiding me a lot on the PIC coding in order to complete my coding for
the project.
Other than that, I am also wish to express my deepest thanks to PM. Tan Kim
See for spending his times to give explanation and discuss about electronic system in
for my energy meter chip. His knowledge was helping me a lot in completing my
research.
My special thanks to all my friends for the collaboration in helping me to
complete my site work. Last but not least, million thanks to my beloved parents and
my siblings who support and encouraging me all the time. Thanks a lot to them.

vi
ABSTRACT
Projek ini dinamakan “COST MONITORING DIGITAL MULTIMETER”.
Robot ini merupakan satu PROTOTAIP yang dapat diaplikasikan dalam sektor
industri untuk meengira jumlah kuasa electric dan mengira kos berdasarkan jumlah
kuasa elektrik yang teleh digunakan. Projek ini telah dibahagi kepada 3 bahagian
iaitu input, peripheral interface dan output.
Litar kawalan masukkan kami menggunakan suis tekan sebagai Reset. Litar
keluaran kami merupakan LCD yang akan memaparkan nilai kuasa elektrik dan kos.
Manakala litar kiraan utama kami ialah PIC16f877A. Kelebihan menggunakan
PIC16F877A ini adalah kerana ia mempunyai I/O PORT yang banyak berbanding
dengan lain. Selain itu PIC16F877A juga mempunyai kawalan pada pwm, jadi ia
sesuai diggunakan dalam projek kami kerana litar kami memerlukan ROM yang
tinggi untuk menyimpan data.

vii
ABTRACT
This project is called COST MONITORING DIGITAL MULTIMETER. This
project is a prototype which can implemented in industrial that can help to calculate
total electric power and calculate the cost based on the consumption. This project
categorized into 3 parts, which are input, peripheral interface and output.
The input section of our project use’s push button as Reset button, while the
output of our project is LCD that can be seen the total power consumption and the
cost base on the power consumption value. The main controller circuit we use as
controller is PIC 16F877A. The advantages of this controller is, its have many I/O
PORT than others. Moreover, this controller is suitable because it have more ROM to
saving the data.

viii
TABLE OF CONTENT
CHAPTER TITLE PAGE
TITLE i
DECLARATION ii
ACKNOWLEDGEMENT v
ABSTRACT vi
TABLE OF CONTENTS viii
LIST OF FIGURES xi
LIST OF APPENDICES xiii
CHAPTER TITLE PAGE
1 INTRODUCTION 1
1.1 Introduction 1-5
1.2 Background of problems 5
1.3 Objectives 6
1.4 Scope 6-7
1.4.1 Flow of the System 7-8
1.5 Importance of Study 8-9

ix
CHAPTER TITLE PAGE
2 LITERATURE REVIEW 10
2.1 Related system 10-12
3 METHODOLOGY 13
3.1 Methodology for the system 13-14
3.2 Simplification of circuit 15-16
3.3 Component 17-18
3.3.1 Passive Electronic Component 19-20
3.3.2 Active Electronic Component 21-23
4 EXPLANATION FULL SYSTEM OF THE METER 24
4.1 Explanation for the system 24
4.1.1 Power supply 25-27
4.1.2 Voltage sensing 27-29
4.1.3 Current sensing 30-31
4.2 Explanation the full system for all block 32-35
4.3 Explanation for the calculating system 35-37
5 SOFTWARE PROJECT 38
5.1 Introduction for Coding Project Software 38
5.2 Instruction to CCS Compiler 39
5.2.1 Choosing the PIC type 39
5.2.2 Bits Setting 40

x
CHAPTER TITLE PAGE
5.2.3 Generating Coding by Using EDITOR 40
5.2.4 Generating C file to HEX file 41
5.3 Instruction for using CCS Compiler 42
5.3.1 WINPIC800 42
5.3.2 Setting of WINPIC800 43
5.3.3 Choosing Program / Coding to BOOTLOADER 43
5.3.4 Burn Coding to PIC 44
5.4 Project Coding 45
6 RESULT AND DISCUSSION 46
6.1 Result 46-47
6.2 Discussion 47-48
7 CONCLUSION 49
8 FUTURE / UPGRADE PLAN 50
8.1 Suggestion 50
REFERENCES 51-53
xi
FIGURE PAGE
Figure 1: electric usage in industry. 2
Figure 2: electric consumption by industry. 2
Figure 3: electric usage in home housing. 3
Figure 4: electrical energy consumption is proportional towards 4the usage of electrical devices.
Figure 5: System Flow 7
Figure 6: flow chart diagram 15
Figure 7: block diagram flow of the system 16
Figure 8: Capacitor 19
Figure 9: Resistor 19
Figure 10: Inductor 20
Figure 11: Small inductance inductor 20
Figure 12: PIC 16 F 877A (DIP IC) 21
Figure 13: Thermistor 21
Figure 14: Voltage Regulator IC 21
Figure 15: Light Emitting Diode 22
Figure 16: Triode Vacuum Tubes (valves) 22
Figure 17: Bridge Rectifier 23
Figure 18: Diode 23
Figure 19: Transistor 23
Figure 20: block diagram flow of the meter system 24
Figure 21: Pulsating DC 25
Figure 22: Filter to smooth the pulsating waveform to DC ripple
waveform 25
Figure 23: Voltage Regulator 26
Figure 24: Step down 240VAC voltage as a voltage signal 27
Figure 25: Equation for transformer 28

xii
FIGURE PAGE
Figure 26: Ohm’s Law in finding the voltage value 29
Figure 27: Ohm’s Law for current (I) value 30
Figure 28: Current sensing circuit 30
Figure 29: the binary to decibel number 35
Figure 30: grouping for the 7 segment display. 36
Figure 31: meanings for the grouping of the 7 segment 36
Figure 32: calculation for total power value 36
Figure 33: flow of the cost calculation 37
Figure 38 : CCS Compiler 38
Figure 39: Choosing the model of the PIC 39
Figure 40 : Windows of Bits Setting 40
Figure 41 : Generating Coding in CCS Compiler 40
Figure 42: Generating the HEX. File coding 41
Figure 43: WINPIC800 Software 42
Figure 44: WINPIC800 Setting Software 43
Figure 45: Choosing BOOTLOADER file 43
Figure 46: Finished burning coding to PIC by WINPIC800 44
Figure 47: Draft of the system 46
Figure 48: Completed Meter System 47
xiii
LAMPIRAN MUKA SURAT
LAMPIRAN A : PIC DATA SHEET 54
LAMPIRAN B : PIN DIAGRAM 55
LAMPIRAN C : DEVICE OVERVIEW 56
LAMPIRAN D : PIC16F877A BLOCK DIAGRAM 57
LAMPIRAN E : PIC16F877A PINOUT DESCRIPTION 58-61
LAMPIRAN F : INSTRUCTION SET SUMMARY 62-63
LAMPIRAN G : INSTRUCTION DESCRIPTION 64-68

1
CHAPTER 1
INTRODUCTION
1.1 Introduction
Malaysia is toward to a develop country and the utility is becoming very high
burden for the public especially to pay the rate of electricity bills. With this, we open
this opportunity to develop a new product which can calculate and presented the cost
of power electric usage through a display device which is inexpensive, small size and
clarity to the users. Elements of electronics hardware, digital system, programming
and digital display are applied and combined into our products to make them more
easy to use. Industries mostly will spend 24 hours [1] [2] [4] [5] for electricity and
home housing mostly will spend an average of 18 hours a day in electricity usage. [2]
[3] [4] [6] [7] [8]
Payment of electricity bills usually dependents on the usage of the electricity.
The more users utilize the electricity, the higher the more the user have to pay for
their utility. To create awareness, users need to have a system where it can monitor
the usage of the electricity. Based on this idea, Cost Monitoring Digital Power Meter
device will be designed and developed. This device will measure the usage of
electric power and calculate the cost of the electricity used daily for instances in
houses or factories. This system will indirectly help the users to monitor the usage in
electricity which will help them to control and overcome any wastage.
The main purpose of the product is to overcome the electricity wastage by
giving awareness for the users by monitoring and keep track on their daily power
usage. Power Consumption Meter is an automatic system to calculate the cost base
on electric power unit that is used by electricity users.
2
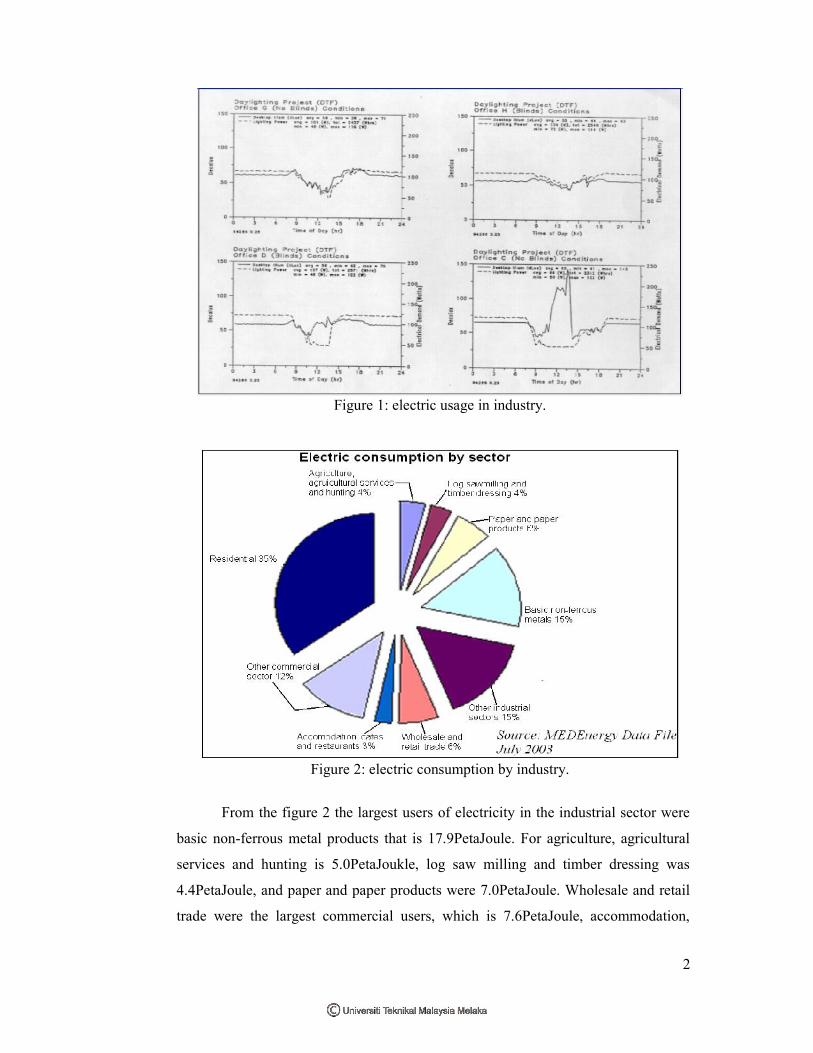
Figure 1: electric usage in industry.
Figure 2: electric consumption by industry.
From the figure 2 the largest users of electricity in the industrial sector were
basic non-ferrous metal products that is 17.9PetaJoule. For agriculture, agricultural
services and hunting is 5.0PetaJoukle, log saw milling and timber dressing was
4.4PetaJoule, and paper and paper products were 7.0PetaJoule. Wholesale and retail
trade were the largest commercial users, which is 7.6PetaJoule, accommodation,

3
cafes and restaurants is 3.6PetaJoule and finance, insurance, property and business
services is the less, it was 3.5PetaJoule. [5]
*peta=10^15
Figure 3: electric usage in home housing.
Figure 3 is a graph that is showing about the electric power consumption of a
home housing in US, the graph show the electric consumption time is about 16hours
and it starting increased from time 4am then it is slightly decreased from 4am till
6am, then it is increased highly from 6am when people is rushing for school and
work, but it dropped about 1hour after that. Then the consumption starting increased
again on 8am till it reaches the maximum because of daily activities then it is slightly
decreased till rest time that is 9pm. [7]
This system will indirectly help the users to monitor the usage in electricity
which will help them to control and overcome any wastage. Therefore the purpose of
this project is to overcome the electricity wastage by giving awareness for the
electricity users by monitoring and keep track on their daily power usage. With this
system, it can help industries and home housing save a lot of money for paying the
electric bills by monitoring and planning their daily spend for the electric power
usage. Because of the unstable economic flowed many of individual, private and also
government needs this technologies in term of reducing their bill payment.
As we know the electrical energy consumption is proportional towards the
usage of electrical devices. The higher the usage of electrical devices, the higher the
electrical power used which will lead to higher bill costing. Users do not realize that
if they did not switch off the electrical devices, this will lead to the increment of the

4
electrical billing cost. Hence a bill monitoring electric power meter is developed to
monitor the usage and spending of electricity. [9] [10]
Figure 4: electrical energy consumption is proportional towards the usage of
electrical devices.
The concepts of this system is each time the electricity users is using the
electricity, the LCD display will show the cost, and digital counter will show the unit
of power that have been used by the user. All information and notification will be
shown on the LCD displays. By using this product, users are able to manage their
electricity consumption in daily used. Customer can compare the original meter
reading from supplier with our product to ensure either the usage is synchronized.
The monitoring power meter are able provide information about power flow
and demand and help identify the total of the cost. Effective monitoring programs are
important for power reliability assurance for both utilities and customers. While
power quality problems can and do occur on utility power systems, many surveys
have shown that most customer power quality problems originate within the
customer facility.
With this in mind, it is clear that monitoring is essential for both power
suppliers and users to ensure optimal power system performance and effective
energy management. Cost Monitoring Digital Power Meter can provide information
about power flow and demand and help identify the cause of power system
disturbances. It can even help identify problem conditions on a power system before
they cause interruptions or disturbances. Effective monitoring programs are
5
important for power reliability assurance for both utilities and customers. While
power quality problems can and do occur on utility power systems, many surveys
have shown that most customer power quality problems originate within the
customer facility.
With this in mind, it is clear that monitoring is essential for both power
suppliers and users to ensure optimal power system performance and effective
energy management. Metro Power Enterprise offers product to help users monitor
and manage power system. These solutions provide powerful access and analytical
capabilities along with event notification, with a high degree of flexibility.
1.2 Background of problems
As we know, the electrical energy comsumption is proportional towards the
usage of electrical devices. The higher the usage of electrical devices, the higher the
electrical power used which will lead to higher bill costing. Users do not realise that
if they did not switch off the electrical devices, this will lead to the increament of the
electrical billing cost. Hence, Cost Monitoring Digital Power Meter is developed to
monitor the usage and spending of electricity.
This system will indirectly help the users to monitor the usage in electricity
which will help them to control and overcome any wastage. Therefore the purpose of
this project is to overcome the electricity wastage by giving awareness for the
electricity users by monitoring and keep track on their daily power usage. With this
system, it can help industries and home housing save a lot of money for paying the
electric bills by monitoring and planning their daily spend for the electric power
usage. Because of the unstable economic flowed many of individual, private and also
government needs this technologies in term of reducing their bill payment.

6
1.3 Objectives
The objectives of this project are:
1. To study on the users comment on increase of electricity billing cost.
2. To design a system that will monitor the usage of electrical energy being used
by users.
3. To design a system that calculates the payment for the electrical energy being
used by users.
4. Electric users can plan out on their daily power usage by monitoring the cost
that is show by the device.
1.4 Scope
Firstly, the electric power from Tenaga Nasional Berhad (TNB) will be sent
to electrical power meter located at the user’s house or factories. The input power
that is sending by Tenaga Nasional Berhad (TNB) will connected through the meter
then electric power will be converting to digital waveform to peak the clock of the
counter, and then the counter will show the units of the power that is used by the user
through the LCD display. The digital data that is from step up counter will be
transferred to the PIC16F877 microcontroller [11] [12]. The digital data that was
transferred to PIC16F877 microcontroller will be analyzed and the cost will be
calculated based on the program which was integrated in the PIC16F877, The cost of
the units based on the electric power will be shown in LCD [13] [14]. This can be
seen in Figure 5.

7
Figure 5: System Flow
1.4.1 Flow of the System
PIC16F877 is one of the most commonly used microcontrollers especially in
automotive, industrial, appliances and consumer applications. In this section,
properties of PIC16F877 microcontroller, CCS compiler, ICD-S, the
reference book “Embedded C programming and the microchip PIC” will be
used for software implementations [15]. Following are the reasons why
microcontrollers are incorporated in project systems:
a. Cost: Microcontrollers with the supplementary circuit components are
much cheaper than a computer with an analog and digital I/O
b. Size and Weight: Microcontrollers are compact and light compared
to computers
c. Simple applications: If the application requires very few number of
I/O and the code is relatively small, which do not require extended

8
amount of memory and a simple LCD display is sufficient as a user
interface, a microcontroller would be suitable for this application.
d. Reliability: Since the architecture is much simpler than a computer it
is less likely to fail.
e. Speed: All the components on the microcontroller are located on a
single piece of silicon. Hence, the applications will run much faster than
it does on a computer.
1. The functionality of the components such as digital counter, 240volts
AC power step down transformer, I/O Ports will be explained in detail as
they will being used for this project, the fundamental concepts would be
better understood and, the reader can flashback to this section to view the
schematics and the specifications.
2. This project is base on cost monitoring for electric power usage, so
the digital counter will be implemented to sense the electric power unit as
an input signal for the PIC controller [16]. Therefore, the calculation
programming system application will be using.
LCD screen will be implemented as the output of the mechanism. In this project, C
language will be used in the PIC16F877 which will do the calculating process.
1.5 Importance of Study
Base on survey and study on the electrical power consumption by the user’s
to get the idea of designing a system which is user friendly and efficient to observe
the usage and spending electrical energy. Metro Power Enterprise has wide
knowledge and experiences in research and development of power solution
applications. Almost all of our current staffs have a research background and are
actively doing research in the power technical areas, power application market and
its trends and users’ needs. We will continue to conduct R&D to ensure that our
products are competitive on the market, will not obsolete quickly, and we are able to
produce innovative products that support the current market needs and trends.
The Cost Monitoring Digital Power Meter is important to develop system due
to the market needs. Research on the condition to be convenient up the Cost
9
Monitoring Digital Power Meter user, the circuit will be integrated in PIC, and
impact of the actions are continuously conducted to create the best products which
can be used to help the user by let them plan how to use the electric power, thus
creating satisfied while using it. This satisfactions will increase the amount of time
that the user will use the products, thereby increasing the effectiveness of the
program thus help us quickly gain market share.
This project is important to giving awareness for electric utility users. This
system can be applied on housing and industries where it is used as power meter and
cost calculation. Due to this, electric power is not widely utilizes, and thus user have
to pay very expensive price. If this project proves that the meter are showing same
value as the appearance meter nowadays, then there will be investors to invest on this
system because it have market. This will reduce the cost of paying for wasted electric
energy. Hence, there will be wise applications of this system in future.
10
CHAPTER 2
LITERATURE REVIEW
This chapter describes the system design and methodology of the study. The
study is done by reviewing each part of the process. Each part required the design of
the idea and related system for the Cost Monitoring Digital Power Meter system. The
methods are also discussed through this chapter.
2.1 Related system
Chun-Lien Sua, and Jen-Ho Teng (2007); They stated that deregulation of
electric power industry has motivated electricity customers to pay more attention in
evaluating both the direct cost of electric service and the monetary value of reliable
electric service. This movement has been recognized by the utilities and the value-
based aspects are introduced into the planning and design of power systems to
consider the outage costs [17]. With this electric consumer will pay more attention to
prevent the waste of electric energy power, with this a lot of electric energy will not
be wasted.
Single Phase Low Voltage PLC Energy Meter operation data and PC
management function of energy data. The power line carrier wave technology is
applied for the communication between the data concentrator and each data collector
and data remote transmitter terminals for realizing the dual-direction data
transmission. Meanwhile the data interchange between the data concentrator and
main station PC is processed through public network or other ways. The management
of energy data gathering, price/payment calculation, power line loss calculation and
report creation have been entirely automat zed and computerized. The master

11
computer is installed in the power authorities, and it communicates with the meter-
reading concentrator through the public line. The meter-reading software is installed
in the master computer, and it is a consummate power consumption
management system integrating the functions of meter file management, meter data
collection, meter data management and meter abnormality analysis. The software is
developed by DELPHI7. The ACCESS97 database is the existing database at the
software launch. The system user can upgrade the database to ACCESS2000 or
higher edition [18]. This system is a system that is used to calculating the cost of
based on the usage and the timing for serving internet. The total cost of serving
internet will be shown on the LCD screen based on the calculation and the speed data
that have been transfer.
Phason electronic control system The PLC case study is an overview of the
features of Phason.s PLC-1 and PLC-2 Programmable Lighting Controls. The case
study briefly explains the features and electrical ratings of the controls and then
shows an example of how to create a lighting program [19]. This is a system from
Phason Company (a smart electric lighting device manufacturer) that have design a
system by using PLC to control and manage the usage of lighting to prevent energy
waste by using PLC as switching to control (ON / OFF) of the switch by detecting
whether the place have people or not, based on the system it will show the and
calculate the electric consuming value in the LCD screen.
Shun-Yu Chan , Jen-Hao Teng , Chia-Yen Chen , David Chang (2010) This
peoples tries to use USB and personal digital assistant to develop a novel power
quality (PQ) monitoring platform and then integrates GPRS technique into the
proposed PQ platform to realize a wide-area PQ monitoring and report-back system.
The works of this paper can be divided into three parts. First, a small-scale PQ
monitoring platform with appropriately designed I/O interfaces and peripherals is
designed and implemented. Next, a GPRS module which can be integrated into the
designed PQ monitoring platform is developed. Finally, a web server with well-
designed database and web human–machine interfaces used to record abnormal PQ
data and display PQ data are designed [20]. This system is a system that can
calculate the total number of data and the accuracy of the GPS system based on the
power transfer and received of the PQ digital data value that have flowing of the GPS