UNIVERSITI PUTRA MALAYSIA AN ANALYSIS OF MARKET ...psasir.upm.edu.my/6125/1/FP_2004_12(1-24).pdf ·...
25
UNIVERSITI PUTRA MALAYSIA AN ANALYSIS OF MARKET CONCENTRATION ON SELECTED FOOD MANUFACTURING INDUSTRY IN MALAYSIA KONG CHEE SING. FP 2004 12
Transcript of UNIVERSITI PUTRA MALAYSIA AN ANALYSIS OF MARKET ...psasir.upm.edu.my/6125/1/FP_2004_12(1-24).pdf ·...
UNIVERSITI PUTRA MALAYSIA
AN ANALYSIS OF MARKET CONCENTRATION ON SELECTED FOOD MANUFACTURING INDUSTRY IN MALAYSIA
KONG CHEE SING.
FP 2004 12
AN ANALYSIS OF MARKET CONCENTRATION ON SELECTED FOOD MANUFACTURING INDUSTRY IN MALAYSIA
BY
KONG CHEE SING
Thesis Submitted to the School of Graduate Studies, Universiti Putra Malaysia in Fulfilment of the Requirements for the
Degree of Master of Science
April 2004

Abstract of thesis presented to the Senate of Universiti Putra Malaysia in fulfilment of the requirement for the degree of Master of Science
AN ANALYSIS OF MARKET CONCENTRATION ON SELECTED FOOD MANUFACTURING INDUSTRY IN MALAYSIA
BY
KONG CHEE SING
April 2004
Chairperson : Professor Mohd. Ghazali Mohayidin, Ph.D.
Faculty : Agriculture
The Malaysian food manufacturing industry is an important industry in terms of its
contribution to manufacturing output, growth and profitability in the food sector.
One of the most influential approaches among various theories of industrial
organisation is the Structure-Conduct-Performance (S-C-P) model, which highlights
the competitive conditions in an industry by examining the structure of the industry
related to the behaviour and performance of firms. The elements that constitute
market structure and the manner in which it affects firms7 performance and conduct
are important aspects to consider in understanding the S-C-P relationships.
This study analyses the determinants of changes in S-C-P over time for the food
manufacturing industry in Malaysia, which is divided into five selected sub-
industries. The data used in this study are based on secondary data collected from
various firms registered under the Company Commission of Malaysia. This study

covers a period of 10 years, i.e. from 1992 to 2002. Concentration Ratio and
Herfindahl-Hirschman Index and Gini Coefficient are used to measure the market
structure. Meanwhile, the market conduct is measured by Advertising-Sales Ratio,
whilst, the Profitability Ratio Analysis and Sales Ratio are used to measure market
performance. Regression analysis using Two-Stage Least-Square is carried out to
study the S-C-P model.
The results indicate that the Malaysian food manufacturing industry tended to have
low concentrated market throughout the study period. Nevertheless, the findings also
show the industry was still characterised with oligopolistic practices which was
evident by the existence of a few large firms. The advertising and rate of return also
fluctuated slightly due to the influence of market elements.
The results of regression analysis prove the existence of primary and feedback
effects between market structure, conduct and performance based on industrial
organisation approach in Malaysian food manufacturing industry. The main findings
of this study are concentration do depend on firm profitability as well as advertising
intensity; concentration do determine advertising; however, advertising seems to
have no effect on profitability. In addition, advertisement intensity and profitability
demonstrate the feedback effect; effect of conduct on structure; and performance on
conduct and market structure. The relationship between concentration and
advertising shows that concentrated industry spends more on advertising. Thus,
higher profits also lead to higher advertising.
Abstrak tesis yang dikemukakan kepada Senat Universiti Putra Malaysia sebagai memenuhi keperluan untuk ijazah Master Sains
ANALISIS KONSENTRASI PASARAN TERHADAP INDUSTRI PERKILANGAN MAKANAN TERPILIH DI MALAYSIA
Pengerusi
Fakulti
Oleh
KONG CHEE SING
April 2004
: Profesor Mohd. Ghazali Mohayidin, Ph.D.
: Pertanian
Industri perkilangan makanan merupakan sebuah industri yang penting dari segi
surnbangannya dalam pengeluaran perkilangan, pertumbuhan dan keuntungan dalarn
sektor makanan. Antara pendekatan yang paling berpengaruh dalam teori organisasi
perindustrian adalah model struktur-kelakuan-prestasi (S-K-P), yang menekankan
keadaan persaingan kompetitif dalam suatu industri menerusi kajian stuktur industri
berkaitan dengan pelakuan dan prestasi sesebuah syarikat. Elemen-elemen yang
mewakili struktur pasaran and tatacara bagaimana ia mempengaruhi prestasi dan
kelakuan syarikat adalah aspek penting dalam memahami hubungan antara S-K-P.
Kajian ini menganalisis faktor-faktor perubahan di dalam S-K-P bagi industri
perkilangan di Malaysia yang dibahagikan kepada lima sub-industri terpilih. Kajian
ini menggunakan data sekunder yang dikumpul dari pelbagai finna berdaftar di
bawah Suruhanjaya Syarikat Malaysia. Tempoh kajian merangkumi 10 tahun iaitu
1992 hingga 2002. Kaedah nisbah konsentrasi, indeks Herfindahl-Hirschman dan
nisbah Gini digunakan sebagai pengukur struktur pasaran. Sementara itu, pelakuan
pasaran dikaji melalui nisbah pengiklanan-jumlah jualan, manakala nisbah kewangan
dan nisbah jualan dijadikan sebagai penunjuk prestasi pasaran. Analisis regresi juga
dijalankan dalarn mengkaji model struktur-kelakuan-prestasi.
Keputusan kajian menunjukkan bahawa industri perkilangan makanan di Malaysia
mempunyai tahap konsentrasi yang rendah. Walau bagaimmapun, keputusan juga
menunjukkan industri tersebut masih mempunyai ciri-ciri oligopolistik dengan
wujudnya kehadiran beberapa buah firma besar. Pengiklanan dan tahap perolehan
juga berubah disebabkan adanya pengaruh dari elemen-elemen pasaran.
Keputusan analisis regresi membuktikan adanya pengaruh utarna dan kesan maklurn
balas antara struktur pasaran, kelakuan dan prestasi adalah berdasarkan pendekatan
organisasi perindustrian dalam industri perkilangan makanan. Penemuan utarna
menunjukkan konsentrasi dipengaruhi oleh keuntungan syarikat dan intensiti
pengiklanan; dan ia sendiri mempengaruhi pengiklanan; namun pengiklanan tidak
mempunyai pengaruh terhadap keuntungan. Tambahan pula, intensiti pengiklanan
dan keuntungan menunjukkan berlakunya kesan maklum balas; kesan kelakuan
terhadap struktur; dan, prestasi terhadap kelakuan dan struktur pasaran. Hubungan
antara konsentrasi dan pengiklanan menunjukkan industri yang mempunyai nisbah
konsentrasi yang tinggi, menggunakan lebih banyak pengiklanan. Oleh itu-
keuntungan yang tinggi juga meningkatkan intensiti pengiklanan.

ACKNOWLEDGEMENTS
This study would not have been possible without the advice, contribution and
support of several individuals.
First and foremost, I wish to express my gratitude to my supervisory committee:
chairperson Professor Dr. Mohd. Ghazali Mohayidin, for his guidance, suggestions
and support helped in improving this thesis. From him, I learnt to think analytically.
Associate Professor Dr. Zainal Abidin Mohamed for his untiring and inspiring
supervision, who is ever helpful, and whose constructive criticisms and suggestions
throughout the preparation of this thesis. I would also like to thank En. Ismail Abdul
Latif for his precious advice, guidance and help in the completion of the thesis. My
appreciation is also extended to my advisor, Associate Professor Dr. Mohd. Mansor
Ismail for his valuable suggestions and comments.
I also owe a great deal of appreciation to all my friends ind Miss Lee Yen Cher, who
had rendered their help in one way or another towards the completion of this thesis.
In addition, I would thank the all the officers and staffs of Universiti Putra Malaysia,
Universiti Malaya, Companies Commission of Malaysia and Federation of
Malaysian Manufacturers for the information provided during my search.

vii
Last but not least, my deepest gratitude to my family who has been very supportive
and understanding throughout my years at Universiti Putra Malaysia. I would like to
record my appreciation for their sacrifices and love.

I certify that an Examination Committee met on lSt April 2004 to conduct the final examination of Kong Chee Sing on his Master of Science thesis entitled "An Analysis of Market Concentration on Selected Food Manufacturing Industry in Malaysia" in accordance with Universiti Pertanian Malaysia (Higher Degree) Act 1980 and Universiti Pertanian Malaysia (Higher Degree) Regulations 198 1. The Committee recommends that the candidate be awarded the relevant degree. Members of the Examination Committee are as follows:
MOHD. MANSOR ISMAIL, Ph.D. Associate Professor Faculty of Agriculture Universiti Putra Malaysia (Chairman)
MOHD. GHAZALI MOHAYIDIN, Ph.D. Professor Director of Academic Development Center Universiti Putra Malaysia (Member)
ZAINAL ABIDIN MOHAMED, Ph.D. Associate Professor Faculty of Agriculture Universiti Putra Malaysia (Member)
ISMAIL ABDUL LATIF Faculty of Agriculture Universiti Putra Malaysia (Member)
School of Graduate Studies Universiti Putra Malaysia
Date:
This thesis submitted to the Senate of Universiti Putra Malaysia and has been accepted as fulfilment of the requirement for the degree of Master of Science. The members of the Supervisory Committee are as follows:
MOHD. GHAZALI MOHAYIDIN, Ph.D. Professor Director of Academic Development Center Universiti Putra Malaysia (Member)
ZAINAL ABIDIN MOHAMED, Ph.D. Associate Professor and Head Faculty of Agriculture Universiti Putra Malaysia (Member)
ISMAIL ABDUL LATIF, M. Econs Faculty of Agriculture Universiti Putra Malaysia (Member)
- AINI IDERIS, Ph.D. ProfessorEIean School of Graduate Studies Universiti Putra Malaysia
DECLARATION
I hereby declare that the thesis is based on my original work except for quotations and citations which have been acknowledged. I also declare that this thesis has not been previously or concurrently submitted for any other degree at UPM or any other institutions.
Date: 30 -*

TABLE OF CONTENTS
Page
ABSTRACT ABSTRAK ACKNOWLEDGEMENTS APPROVAL DECLARATION LIST OF TABLES LIST OF FIGURES LIST OF ABBREVIATIONS
CHAPTER
INTRODUCTION 1.1 Background of Malaysian Manufacturing Industry
1.1.1. Sectoral Performance in Malaysian Economy 1.1.2 Performance of Manufacturing Industry Background of Malaysian Food Manufacturing Industry 1.2.1 Performance of Food Manufacturing Industry 1.2.2 Food Trade 1.2.3 Foreign Direct Investment on Food
Manufacturing Industry 1.2.4 Employment on Food Manufacturing Industry Malaysia's National Policies 1.3.1 National Agricultural Policy 1.3.2 Industrial Master Plan 1.3.3 Eighth Malaysian Plan Problem Statement Objectives of the Study Significance of the Study Outline of the Thesis
LITERATURE REVIEW 2.1 Market Structure, Conduct and Performance Paradigm
2.1.1 Market Structure 2.1.2 Market Conduct 2.1 -3 Market Performance Conceptual Framework for S-C-P Paradigm Empirical Evidence on S-C-P Paradigm
. . 11
iv vi . . .
Vll l
X . . . Xll l
xvii xviii
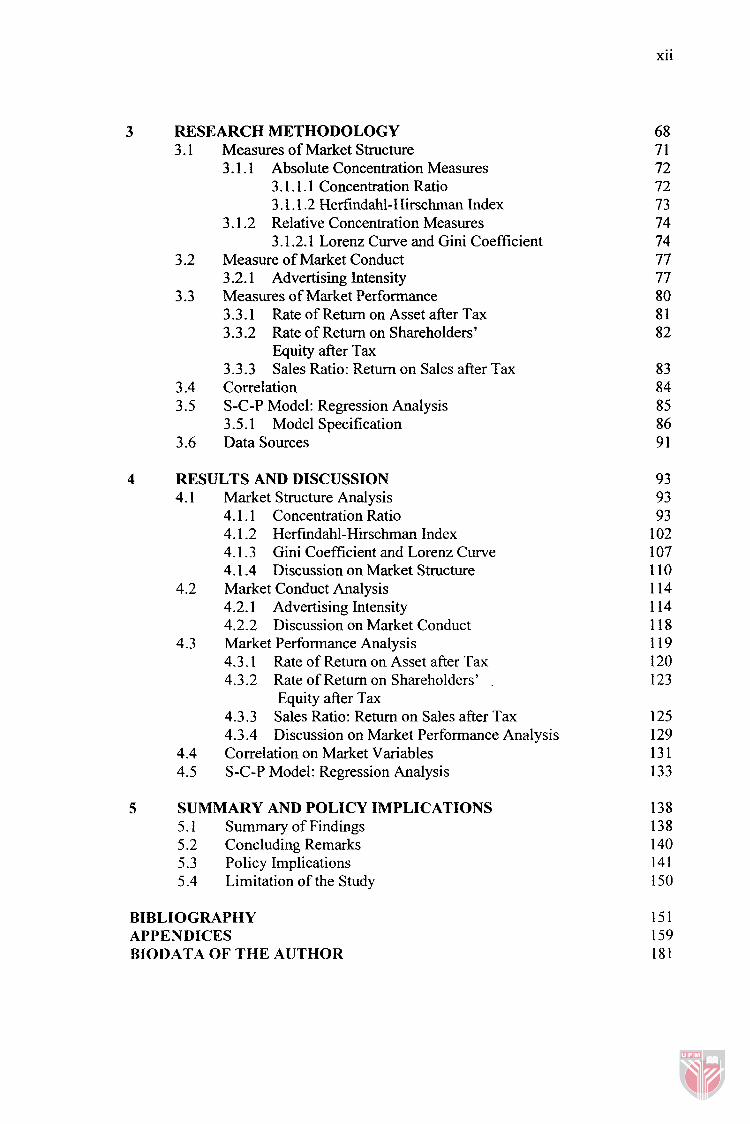
RESEARCH METHODOLOGY Measures of Market Structure 3.1.1 Absolute Concentration Measures
3.1.1.1 Concentration Ratio 3.1.1.2 Herfindahl-Hirschrnan Index
3.1.2 Relative Concentration Measures 3.1.2.1 Lorenz Curve and Gini Coefficient
Measure of Market Conduct 3 -2.1 Advertising Intensity Measures of Market Performance 3.3.1 Rate of Return on Asset after Tax 3.3.2 Rate of Return on Shareholders'
Equity after Tax 3.3.3 Sales Ratio: Return on Sales after Tax Correlation S-C-P Model: Regression Analysis 3 -5.1 Model Specification Data Sources
RESULTS AND DISCUSSION 4.1 Market Structure Analysis
4.1.1 Concentration Ratio 4.1.2 Herfindahl-Hirschman Index 4.1.3 Gini Coefficient and Lorenz Curve 4.1.4 Discussion on Market Structure
4.2 Market Conduct Analysis 4.2.1 Advertising Intensity 4.2.2 Discussion on Market Conduct Market Performance Analysis 4.3.1 Rate of Return on Asset after Tax 4.3.2 Rate of Return on Shareholders' .
Equity after Tax 4.3.3 Sales Ratio: Return on Sales after Tax 4.3.4 Discussion on Market Performance Analysis Correlation on Market Variables S-C-P Model: Regression Analysis
SUMMARY AND POLICY IMPLICATIONS 5.1 Summary of Findings 5.2 Concluding Remarks 5.3 Policy Implications 5.4 Limitation of the Study
BIBLIOGRAPHY APPENDICES BIODATA OF THE AUTHOR
..a
X l l l
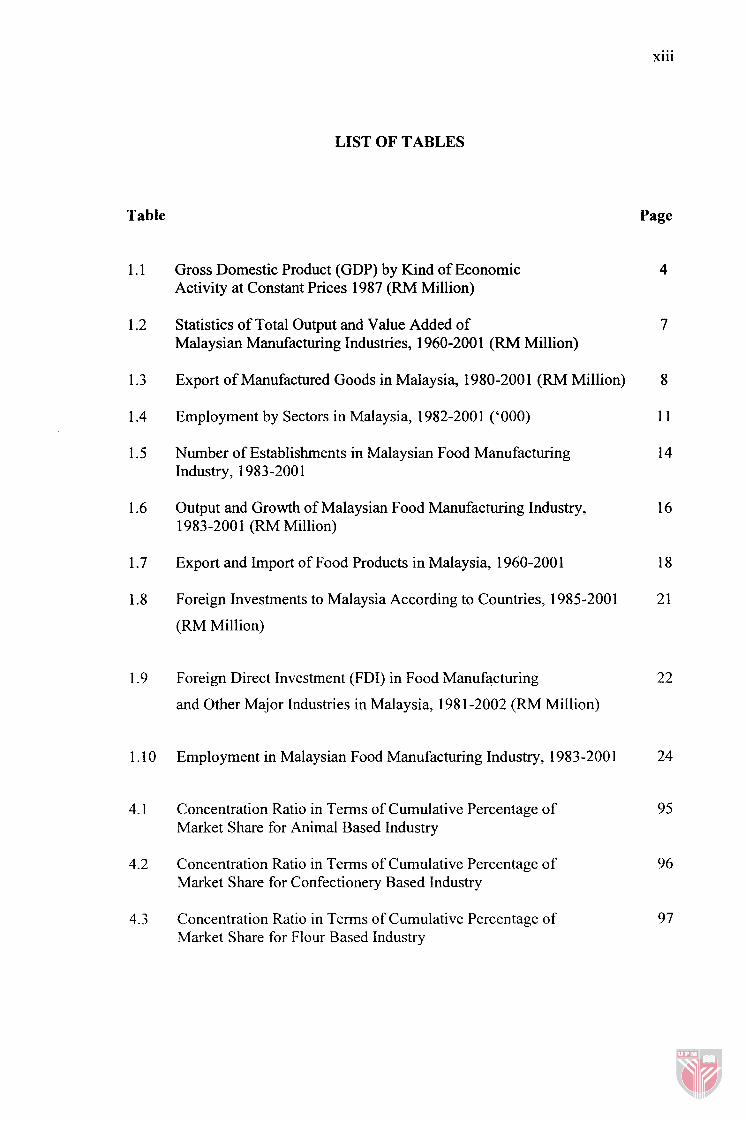
LIST OF TABLES
Table Page
1.1 Gross Domestic Product (GDP) by Kind of Economic Activity at Constant Prices 1987 (RM Million)
1.2 Statistics of Total Output and Value Added of Malaysian Manufacturing Industries, 1960-200 1 (RM Million)
1.3 Export of Manufactured Goods in Malaysia, 1980-200 1 (RM Million)
1.4 Employment by Sectors in Malaysia, 1982-200 1 ('000)
1.5 Number of Establishments in Malaysian Food Manufacturing Industry, 1983-200 1
1.6 Output and Growth of Malaysian Food Manufacturing Industry, 1983-200 1 (RM Million)
1.7 Export and Import of Food Products in Malaysia, 1960-200 1
1.8 Foreign Investments to Malaysia According to Countries, 1985-2001
(RM Million)
1.9 Foreign Direct Investment (FDI) in Food Manufacturing
and Other Major Industries in Malaysia, 198 1-2002 (RM Million)
1.10 Employment in Malaysian Food Manufacturing Industry, 1983-200 1
4.1 Concentration Ratio in Terms of Cumulative Percentage of Market Share for Animal Based Industry
4.2 Concentration Ratio in Terms of Cumulative Percentage of Market Share for Confectionery Based Industry
4.3 Concentration Ratio in Terms of Cumulative Percentage of Market Share for Flour Based Industry

xiv
1
4.4 Concentration Ratio in Terms of Cumulative Percentage of Market Share for Spices Based Industry
4.5 Concentration Ratio in Terms of Cumulative Percentage of Market Share for Marine Based Industry
4.6 Concentration Ratio in Terms of Cumulative Percentage of Market Share for Overall Malaysian Food Manufacturing Industry
4.7 Herfindahl-Hirshman Index (HHI) of Malaysian Food Manufacturing 105 Industry
4.8 Gini Coefficient of Malaysian Food Manufacturing Industry
4.9 Joe Bain's Concentration Ratios and Classifications
4.10 Correlation Coefficients Matrix between HHI, CR4 and GC measurements
4.1 1 Industry's Advertising-Sales Ratio (ADV) in Percentage
4.12 Market Performance: Rate of Return on Asset (ROA) in Percentage
4.13 Market Performance: Rate of Return on Shareholders' Equity (ROE) in Percentage
4.14 Market Performance: Rate of Return on Sales (ROS) in Percentage
4.15 Correlation Coefficients Matrix of Market Variables in the S-C-P Model Equations
4.16 OLS and TSLS regression Results for Malaysian Food Manufacturing Industry
A1 Malaysian Food Manufacturing Categorised under Five-digit Malaysian Standard Industrial Classification (MSIC)
B1 Concentration Ratio for Five Sub-industries in Food Manufacturing Industry, 1992
B2 Concentration Ratio for Five Sub-industries in Food Manufacturing Industry, 1993
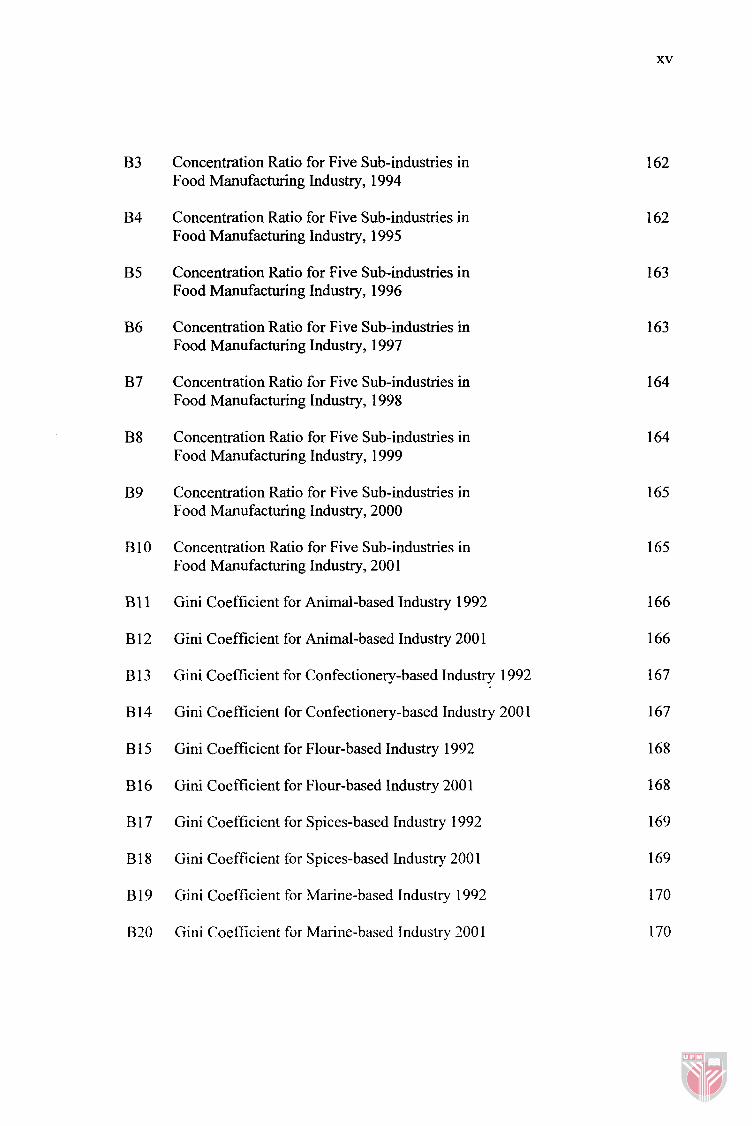
Concentration Ratio for Five Sub-industries in Food Manufacturing Industry, 1994
Concentration Ratio for Five Sub-industries in Food Manufacturing Industry, 1995
Concentration Ratio for Five Sub-industries in Food Manufacturing Industry, 1996
Concentration Ratio for Five Sub-industries in Food Manufacturing Industry, 1997
Concentration Ratio for Five Sub-industries in Food Manufacturing Industry, 1998
Concentration Ratio for Five Sub-industries in Food Manufacturing Industry, 1999
Concentration Ratio for Five Sub-industries in Food Manufacturing Industry, 2000
B 10 Concentration Ratio for Five Sub-industries in Food Manufacturing Industry, 200 1
B 1 1 Gini Coefficient for Animal-based Industry 1992
B 12 Gini Coefficient for Animal-based Industry 200 1
B 13 Gini Coefficient for Confectionery-based Industry 1992
B 14 Gini Coefficient for Confectionery-based Industry 200 1
B 15 Gini Coefficient for Flour-based Industry 1992
B 16 Gini Coefficient for Flour-based Industry 2001
B 1 7 Gini Coefficient for Spices-based Industry 1992
B18 Gini Coefficient for Spices-based Industry 2001
B 19 Gini Coefficient for Marine-based Industry 1992
B20 Gini Coefficient for Marine-based Industry 200 1

xvi
B21 Total Sales of Five Sub-industries in Food Manufacturing Industry, 1992-200 1
B22 Marker Performance (Return on Asset) of Five Sub-industries in Food Manufacturing Industry, 1 992-200 1
B23 Marker Performance (Return on Shareholders' Equity) of Five Sub-industries in Food Manufacturing Industry, 1992-200 1
B24 Marker Performance (Return on Sales) of Five Sub-industries in Food Manufacturing Industry, 1992-200 1
C 1 Market Value and Firms According to Size Group in Animal-based Industry, 1994
C2 Market Value and Firms According to Size Group in Animal-based Industry, 1995
C3 OLS Regression Result on Market Structure
C4 OLS Regression Result on Market Conduct
C5 OLS Regression Result on Market Performance
C6 TSLS Regression Result on Concentration Equation
C7 TSLS Regression Result on Advertising Equation
C8 TSLS Regression Result on Profitability Equation

xvii
LIST OF FIGURES
Figure
1.1 Major Exporter of Manufactured Goods According to Countries
2.1 A Model of Structure-Conduct-Performance Paradigm
3.1 The Structure-Conduct-Performance Paradigm
3.2 Indicators for Market Structure, Conduct and Performance
3.3 Lorenz Curve and Gini Coefficient
Page

xviii
ADV
AFTA
ASEAN
CAP
CCM
CR
DOS
EU
FDI
FMM
GC
GDP
GRO
H
HHI
ICT
IMP
IT
MCR
MES
LIST OF ABBREVIATIONS
Advertising Intensity
ASEAN Free Trade Area
Association of South-East Asian Nation
Capital Intensity
Companies Commission of Malaysia
Concentration Ratio
Department of Statistic Malaysia
European Union
Foreign Direct Investment
Federation of Malaysian Manufacturers
Gini Coefficient
Gross Domestic Product
Growth of Sales
Entropy
Herfindahl-Hirschman Index
Information and Communication Technology
Industrial Master Plan
Information Technology
Marginal Seller Concentration
Minimum Efficient Scale
xix
MIDA
MITI
MNC
MOF
MP
MSC
MSIC
NAP
NEP
NDP
OLS
OPP
PCM
RED
RM
ROA
ROE
ROS
R&D
S-C-P
SITC
SMEs
Malaysian Industrial Development Authority
Ministry of International Trade and Industry
Multinational Corporations
Ministry of Finance Malaysia
Malaysian Plan
Multimedia Super Corridor
Malaysian Standard Industrial Classification
National Agricultural Policy
New Economy Policy
National Development Policy
Ordinary Least-Square
Long-term Outline Perspective Plan
Price-Cost Margin
Redundancy Measure
Ringgit Malaysia
Rate of Return on assets after ax Rate of Return on Shareholders' Equity after Tax
Rate of Return on Sales after Tax
Research and Development
S tructure-Conduct-Per formance
Standard International Trade Classification
Small and Medium Enterprises
SPSS
TSLS
UK
Statistical Package for Social Science
Two-Stage Least-Square
United Kingdom
United States of America
Three-Stage Least-Square

CHAPTER 1
INTRODUCTION
1.1 Background of Malaysian Manufacturing Industry
The Malaysian economy has gone through rapid structural changes since the
country's independence in 1957. It has now become one of the most advanced
countries in the Third World. The economy of Malaysia was a balanced mix of
traditional primary commodity productions. The fast-expanding manufacturing
sector has shown a promise of strong continuous growth in the hture.
Malaysia's industrialisation process has undergone five distinctive phases (Jomo,
1993). The first phase of industrialisation during British colonial rule was largely
limited to export and import, processing and packaging of food and simple consumer
items, especially when encouraged by transport cost con'sideration. The second phase
that took place after independence (1957-1968) saw the growth of import
substituting manufacturing on industrial estates which is protected by high tariffs.
Subsequently, the third phase of export-oriented industrialisation (1 968- 1980) began
as the limits of import substitution became apparent and a new international division
of labour emerged, particularly involving manufacturing. The new labour intensive

industries generated much new and necessary employment. Next came the fourth
phase (1983-1986) which was less distinct because it did not involve explicit
abandonment of export-oriented industrialisation, but only the promotion of selected
heavy industries. The fifth and also the current phase of industrialisation (since
1986), has seen a dramatic recovery of the Malaysian manufacturing sector. Lower
cost production, deregulation and new investment incentives have contributed to the
increases in manufacturing investment, growth, export and employment.
The Second Malaysian Plan introduced by the government, which encouraged
foreign investment, was one of the factors that contributed to the growth of
manufacturing sector in the earlier years. Since 1970, the manufacturing sector has
been the fastest growing sector in Malaysia's economy. Manufactured exports
gradually became an important direct source of growth by 1975. By 1974 to 1976,
manufactured exports had maintained their contribution to growth at about 20
percent and additional import substitution appeared to have contributed 12 to 13
percent to growth in those years. Significantly, for the first time in 1983, Malaysian
manufactured exports overtook petroleum to become the country's top foreign
exchange earner (Economic Report, 1984).

1.1.1 Sectoral Performance in Malaysian Economy
Following a period of expansion in the previous eight years, Malaysian economy
expanded at a more sustainable pace in 2000 (Economic Report 199912000).
Malaysia's real average gross domestic product (GDP) growth increased from 9.7
percent in 1990 to 10.0 percent in 1996. However, due to the world financial crisis
which happened at the end of 1997, the country's GDP dropped to negative 7.4
percent in 1998. Nevertheless, Malaysian GDP growth rebounded to 8.3 percent in
2000.
The performance of the Malaysian economy in 2001 was adversely affected by the
greater-than-expected slowdown in the world economy particularly in the United
States (US) as well as the continuing weak performance of the Japanese economy.
The terrorist attack on the US led to greater uncertainties with respect to the severity
and duration of the recovery in the US (Economic Report 200112002). In the light of
the more difficult environment, real GDP growth of Malaysian economy was only
0.5 percent in 2001. Malaysian economy was expected to recover from a slower
growth in 200 1 to register a higher real GDP growth of 4 to 5 percent in 2002.
The Malaysian economic activities are divided into ten major groups which are;
agriculture, livestock, forestry and fishing; mining and quarrying; manufacturing;
electricity, gas and water; construction; wholesale and retail trade, hotel and

restaurant; transport, storage and communication; finance, insurance, real estate and
business services; government services; and other services. As shown in Table 1.1,
manufacturing sector was the largest contributor to the national GDP starting from
with 30.2 percent fiom the total national GDP which carried about RM 63.5 billion
in 2001. This was followed by 'wholesale and retail trade, hotel and restaurant'
sector, and the finally, 'finance, insurance, real estate and business services' sector
with GDP of 15.2 and 14.2 percent respectively fiom the total GDP.
Table 1.1 : Gross Domestic Product (GDP) by Kind of Economic Activity at Constant Prices 1987 (RM Million)
Economic 1987 1991 1995 1998 200 1 Activity YO YO YO YO %
CON WTR TSC FIR OSS
GDP share GDP share GDP share GDP share ALF 16,185 19.96 17,292 14.90 17,115 10.27 17,512 9.61
MNQ 10,235 12.62 10,432 8.99 13,863 8.32 14,357 7.88 MFG 16,058 19.80 29,708 25.59 45,174 27.1 1 50,899 27.93 EGW 2,129 2.63 2,838 2.44 5,876 3.53 6,745 3.70
4.45 7,241 3.97 15.19 28,489 15.63 7.38 14,720 8.08
10.37 23,583 12.94 7.67 15,036 8.25
GDP 17,897 15,258 63,536 8,427 7,108
3 1,904 18,079 29,8 19 16,388
share 8.50 7.25
30.19 4.00 3.38
15.16 8.59
14.17 7.79
GSS 8,853 10.92 9,738 8.39 11,803 7.08 .13,180 7.23 14,895 7.08 Total GDP 8 1.086 100.00 1 16,092 100.00 166,625 100.00 182,236 100.00 210,640 100.00
MFG = Manufacturing ALF = Agriculture, Livestock, Forestry and Fishing MNQ = Mining and Quarrying WTR = Wholesale and Retail Trade, Hotel and Restaurant EGW = Electricity, Gas and Water TSC =Transport, Storage and Communication CON = Construction FIR = Finance, Insurance, Real Estate and Business Services OSS = Other services GSS = Government Services
Source: Department of Statistic Malaysia, 2002