
Università di Pavia Facoltà di Ingegneria -...
61
From data to information, from information to knowledge Computational Sustainability and land use Prof.ssa Maria Grazia Albanesi Università di Pavia - Facoltà di Ingegneria
Transcript of Università di Pavia Facoltà di Ingegneria -...
From data to information, from information to
knowledge
Computational Sustainability and land use Prof.ssa Maria Grazia Albanesi
Università di Pavia - Facoltà di Ingegneria

Outline
Research/Development field: Computational Sustainability
ACI Project
The problem: Land use
Solution: Anthropentropy indicator
First approach: GIS data
Second approach: open data Google Earth & social network
Third approach: open data & open software
DANTHE Project
Goals
Methodology
Case studies
A cosa può servire il progetto? Proposte e discussione
Presentation
Maria Grazia Albanesi is the chief of
Informatica per la Sostenibilità
Computational Sustainability Unit
csu.unipv.it
Site: DCAlab
Multidisciplinary approach:
Dipartimento di Scienze Economiche e Aziendali
Dipartimento di Scienze della Terra e dell’Ambiente
http://csu.unipv.it/

International framework
Computational Sustainability
First conference: 2009 USA
Definition (1987) rapporto della World Commission on Environment and
Development (WCED), commission Brundtland, Our Common Future:
«Sustainable development is development that meets the needs of the present without compromising the ability of future generations to meet
their own needs”
It contains within it two key concepts:
The concept of 'needs', in particular the essential needs of the world's poor, to which overriding priority should be given; and
The idea of limitations imposed by the state of technology and social organization on the environment's ability to meet present and future
needs.

Sustainability
Implicit in teh definition:
Temporal spread of years
We nedd to measure the effects of
defintion
Opposing needs present-future

I progetti
Progetti precedenti/attuali:
Progetto ACI: un nuovo indicatore (Fattore di Antropentropia, FA) di consumo di suolo per
misurare il livello di degrado del consumo di suolo. Febbraio 2013
Progetto DANTHE: un modello predittivo e il relativo sistema di supporto alle decisioni
basato sull’indicatore FA per predire il futuro consumo di suolo di nuovi insediamenti
urbani. Novembre 2013.
Progetti/attività correnti:
Completamento del progetto ACI
Studiare le correlazioni tra il nuovo indicatore e altri bioindicatori, eventualmente
proponendone di nuovi (per es: lo stato delle foreste). Con Scienze della Terra e
dell’Ambiente.
Studiare la correlazione tra il FA e indicatori economici (popolazione, livello di ricchezza,
ecc…)
Fare trasferimento tecnologico verso le aziende.
Land use: definition
The percentage of land occupied by:
houses
Buildings (firms, schoiols, hospitals ecc.)
roads
railways
Intensive agriculture sites (i.e., plant nursery)

Land use: negative effects
Soil sealing
Fragmentation and reduction of biodiversity
Pollution
111 788 ha/year in EU*
Land take in Italy: + 6.3%** (1956-2006)
Sources: * European Environment Agency, **ISPRA
8

Fragmentation
9

Effects
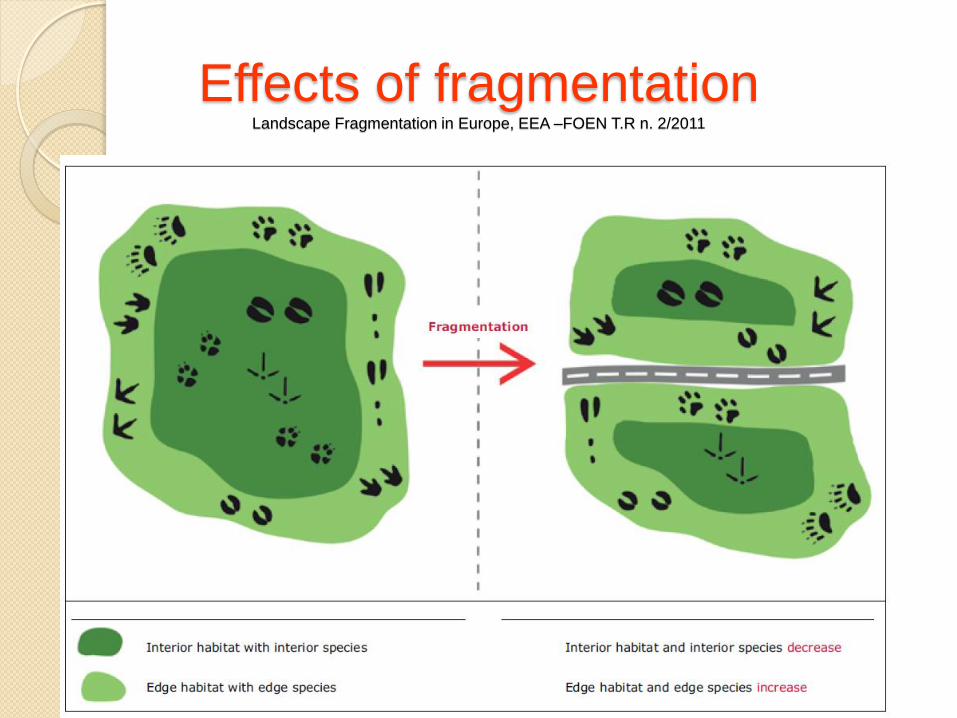
Effects of fragmentation Landscape Fragmentation in Europe, EEA –FOEN T.R n. 2/2011

Effect of fragmentation Landscape Fragmentation in Europe, EEA –FOEN T.R n. 2/2011
Un uso scorretto della frammentazione

Fragmentation
Uncorrect indicator

Decentration
Belgio 97 Ecuador 66 Gran Bretagna 90 Irlanda 62 Danimarca 87 Grecia 61 USA 82 Siria 55 Canada 80 Cina 44 Francia 78 Egitto 43 Germania 74 Zimbabwe 38 Svizzera 74 India 30 Russia 73 Lesotho 26 Italia 68 Afghanistan 24 Nepal 18
0 20 40 60 80 100
Belgio
Gran Bretagna
Danimarca
USA
Canada
Francia
Germania
Svizzera
Russia
Italia
Ecuador
Irlanda
Grecia
Siria
Cina
Egitto
Zimbabwe
India
Lesotho
Afghanistan
Nepal
Percentage of habitants who live in urban areas
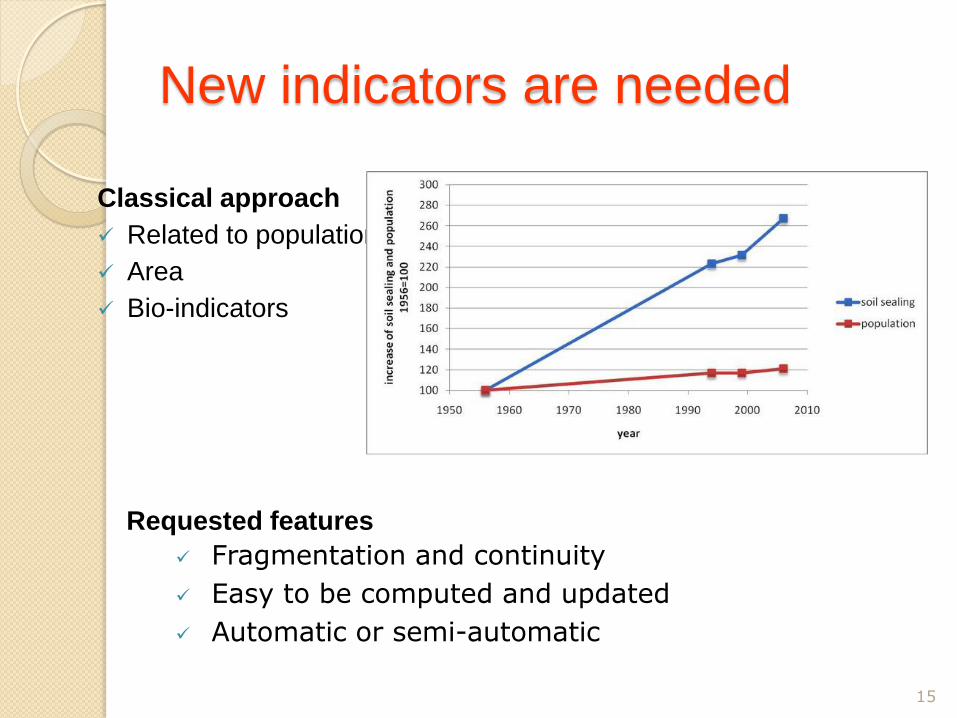
New indicators are needed
Classical approach
Related to population
Area
Bio-indicators
15
Requested features
Fragmentation and continuity
Easy to be computed and updated
Automatic or semi-automatic

Framework
Models DPSIR
Type of indicators (A, B, C, D)
Sources:
E. Smeets and R. Weterings, “Environmental indicators: typology and overview,” European Environment Agency Technical Report n. 25/1999 European Environment Agency, “Urban sprawl in Europe - The ignored challenge,” EEA Report n. 10/2006 European Environment Agency, “Towards a green economy in Europe - EU environmental policy targets and objectives 2010–2050,” EEA Report n. 8/2013
16

A new indicator: Anthropentropy
Anthropos (Άνθρωπος) = man & Entropy (disorder)
The anthropentropy of a territory
AF = DA / (S – NA)
Where
S: Area of the territory
DA: Death Area
NA: Neutral area
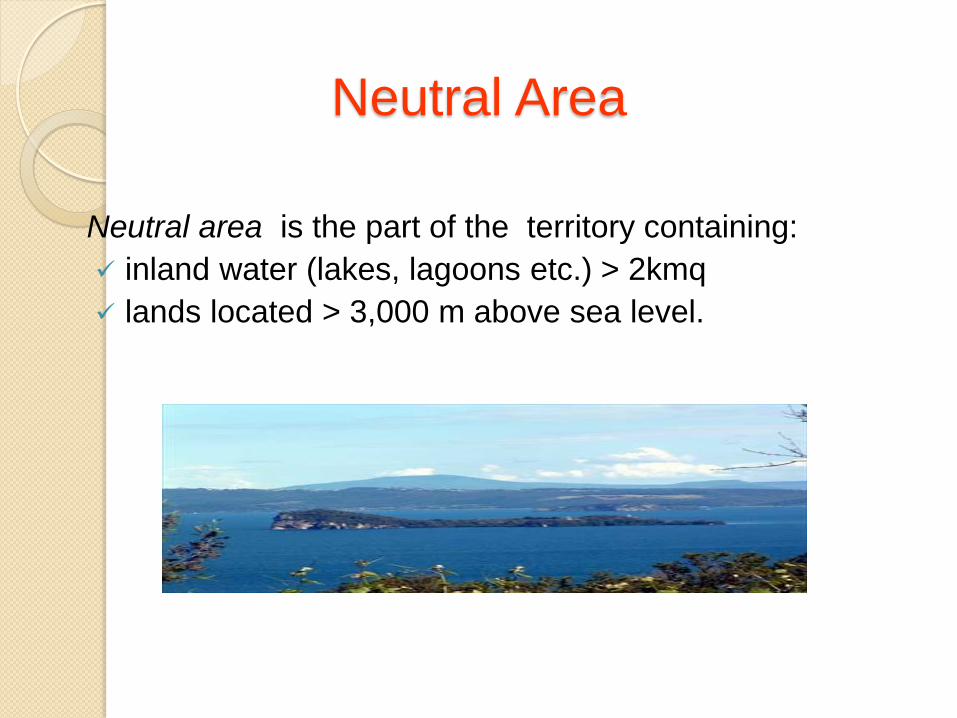
Neutral Area
Neutral area is the part of the territory containing:
inland water (lakes, lagoons etc.) > 2kmq
lands located > 3,000 m above sea level.

Death Area
The anthropic places are enlarged of a buffer of 50 m in each direction (bidimentional metric).

Death area and fragmentation
20

The metric
AF
0 < AF <= 0.2 OK optimal environment preservation for land use, ideal condition 0.2 < AF <= 0.4 First worrying level 0.4 < AF <= 0.6 Serious level of degradation 0.6 < AF <= 0.8 Very serious level of degradation 0.8 < AF <= 1 Irreversible situation A possible application: to help local government in planning new urban expansions.

Data sources
Two main problems:
Availability of a description of land use in terms of anthropic places
Accuracy of scale comparable with the size of the dilation (50 m) accomplished by the algorithm.
Data sources:
Corine Land Cover Data and GIS software
Social network (UGC content and crowdsourcing)

IV – Legend of CLC
Workshop - L’informatica e i social network al servizio dell’ecologia: il progetto ACI Pavia, 18 aprile 2013
CLC types 2000

The goal of the project
AF
Each municipality is labelled with a AF value
ACI: Antropentropia Comuni Italiani (i.e., Italian Municipality Anthropentropy)

Liguria
ICCGI13: Nice, we are here!
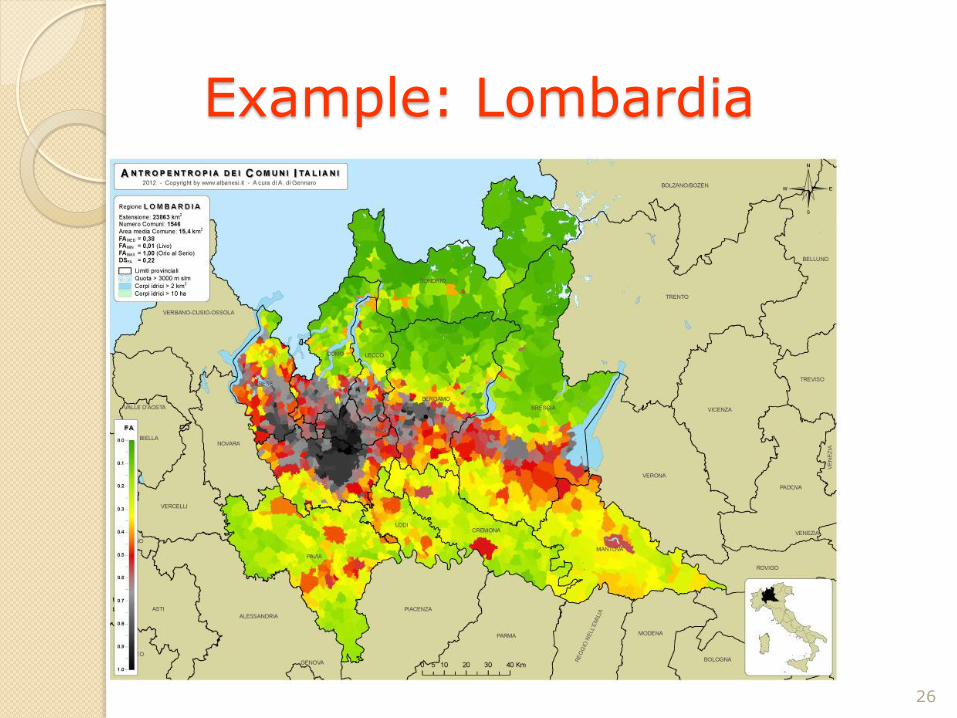
Example: Lombardia
26

Pavia
27

VI – Sintesi dei risultati: Province & Comuni FA

The total Anthropentropy map for Italy
FA
Only a little part of Italy is covered with Corine Land Cover data What about white areas?? Here the social network came into the game!!! Users of social network Facebook linked to www.albanesi.it

UGC data and crowdsourcing
A “bottom-up”, collaborative procedure generates, from Google Earth maps, a map with anthropic places and neutral zones. Characteristics of the procedure: “Bottom” side: It requires a low level of computer skills Based on open software and open data (Google Earth maps and Gimp). “Up” side: Fully automated algorithm based on computer vision operators (software Matlab)

UGC Maps: examples

Procedure
Collect and check the UGC maps
Calibration (determination of scale)
AF computation by completely automatized image
processing procedure.
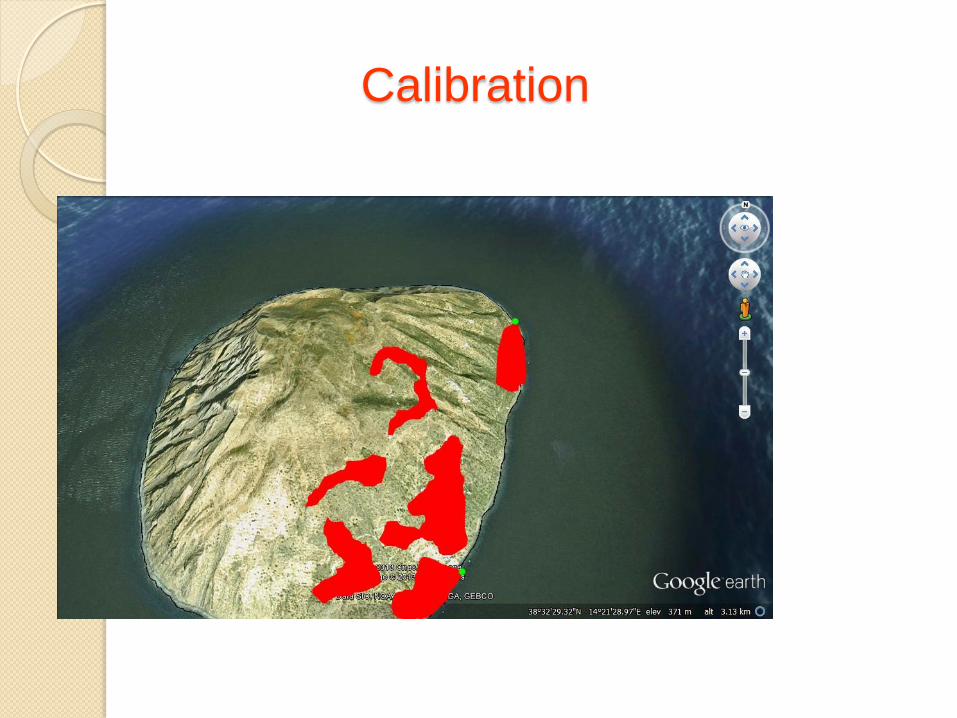
Calibration

Image processing
Maps are processed by image
processing primitives
Morphological operator: dilation Programming environment: Matlab Image toolbox
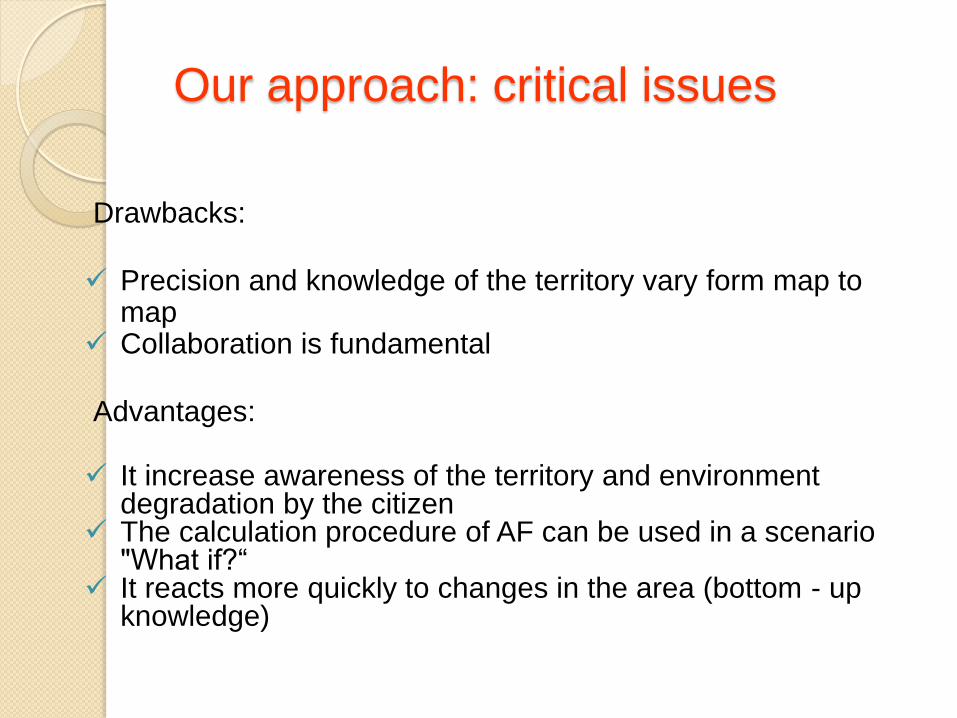
Our approach: critical issues
Drawbacks:
Precision and knowledge of the territory vary form map to
map Collaboration is fundamental
Advantages:
It increase awareness of the territory and environment
degradation by the citizen The calculation procedure of AF can be used in a scenario
"What if?“ It reacts more quickly to changes in the area (bottom - up
knowledge)

Some computed AF by UGC maps
45 maps received and processed in the first 3 months (rejected percentage <1%)
Municipality S (Area in kmq) Neutral Area AF
Scarperia 79.3700 0.00 0.1637
Erice 47.3000 0.00 0.214
Verbania 37.6200 0.37 0.674
Pomigliano d'Arco 11.4400 0.00 0.98040
Praia a Mare 22.9100 0.00 0.4370

An example
37
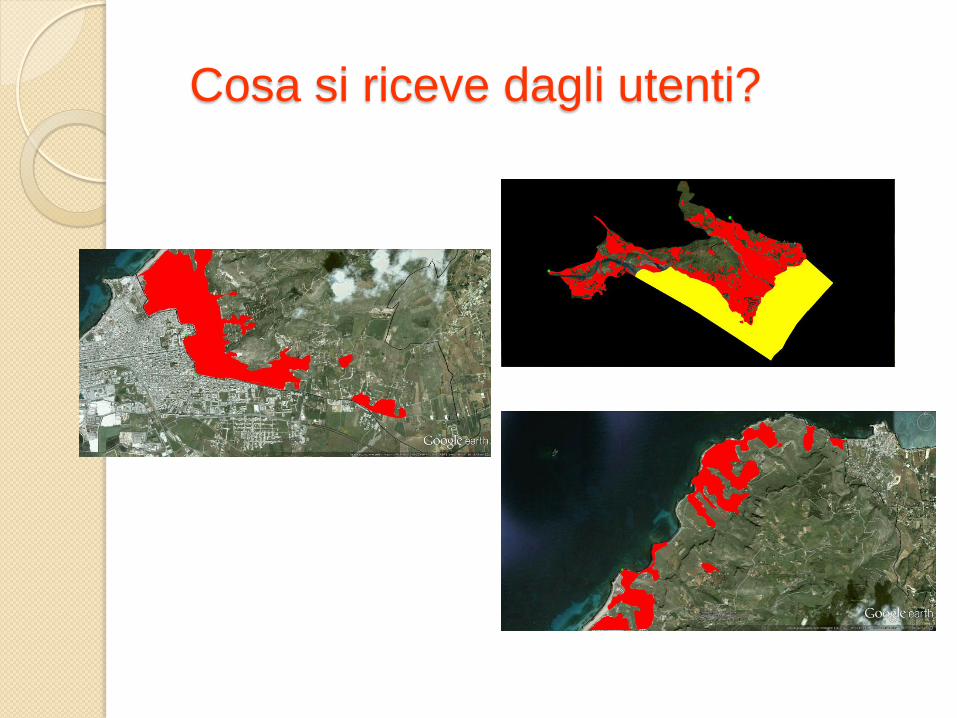
Cosa si riceve dagli utenti?

Procedura
Acquisizione e check della mappa UGC
Calibrazione
Lettura dati input
Calcolo del FA con elaborazione visuale/interattiva
Possibilità di loop a seconda della dimensione del comune.

Calibration

Computer vision algorithm
Mathematical morphology operator of dilation MATLAB
(Image toolbox)

Some values
Comune Superficie (kmq) Area neutra FA
Scarperia 79.3700 0.00 0.1637
Erice 47.3000 0.00 0.214
Verbania 37.6200 0.37 0.674
Pomigliano d'Arco 11.4400 0.00 0.98040
Praia a Mare 22.9100 0.00 0.4370

Adding temporal perpspective
DANTHE project How can you estimate the future land use? Hypothesis on new anthropic places (ap)
DANTHE = Dynamic ANTHropentropy Expansion
A new ap is, in turn, capable of attracting new sites (anthropogenicity)
Antrhopic places are divided in typologies
New expansions Uniform
Gravitational
>Road
43

DANTHE
The expansions
44

I luoghi antropentropogeni
45

Predictive modelDANTHE
New sites?
worst case approach
Predicted expansions in terms of growth/year
Term: 2050
𝐹𝑖 = 𝑆𝑓 − 𝑆𝑖
𝑆𝑖 ∙ 𝑦𝑒𝑎𝑟 , 𝑖 = 𝑎𝑛𝑡ℎ𝑟𝑜𝑝𝑜𝑔𝑒𝑛𝑖𝑐 𝑠𝑖𝑡𝑒 , 𝑖 = 1, 2, … 10
46
𝐹𝑖𝑚𝑎𝑥 > 𝐹𝑖 ∀𝐹𝑖

Example of computation of Fmax
47
𝐹𝑚𝑎𝑥 = 0,0503

48
𝐹𝑚𝑎𝑥 = 0,1053
Example of computation of Fmax

Uniform expansion
49

Uniform expansion
(with constraint)
50

Gravitational expansion
51

Road expansion (1)
52

Prediction(1)
53
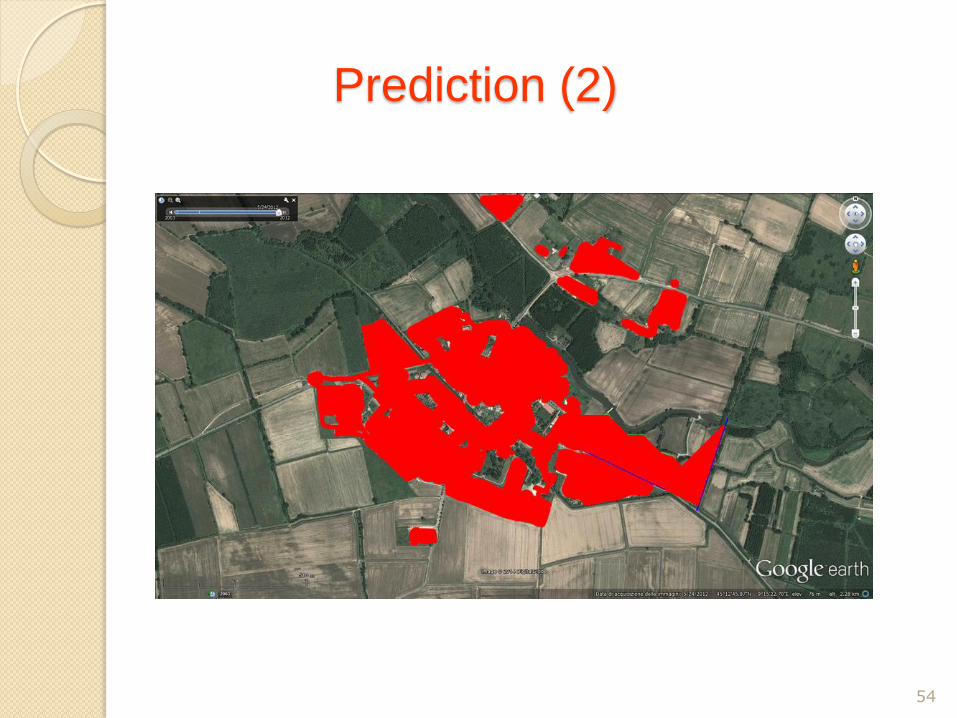
Prediction (2)
54
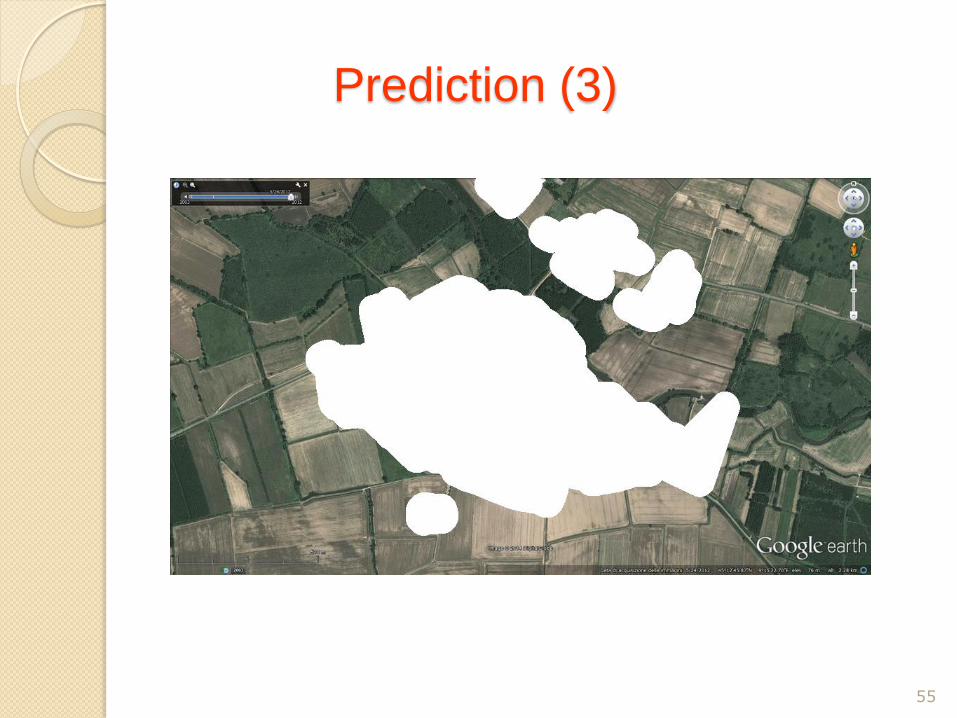
Prediction (3)
55

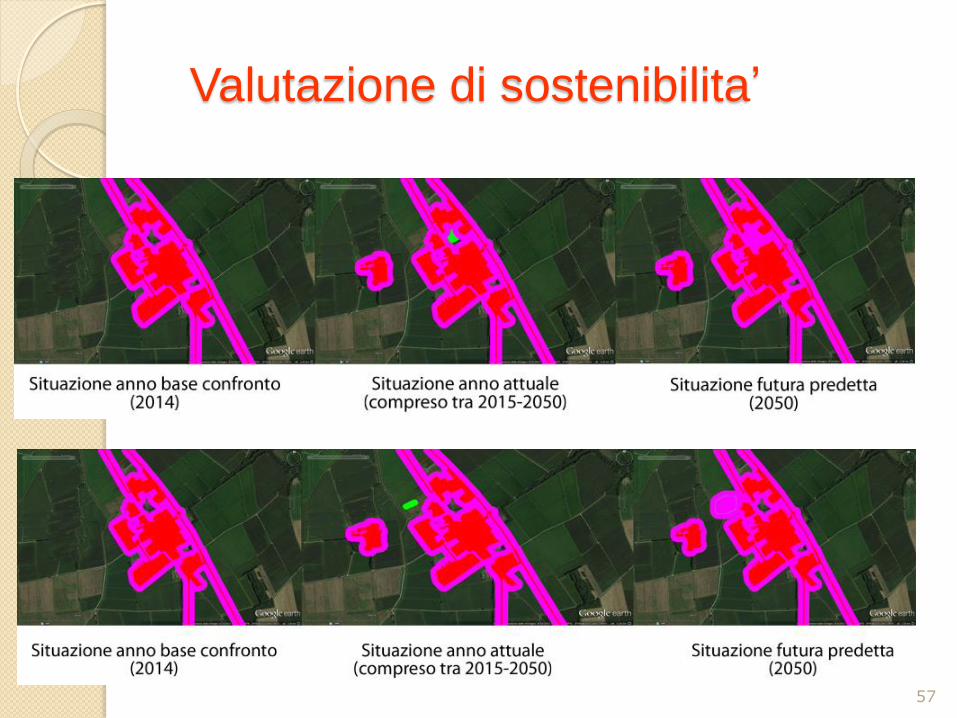
Valutazione di sostenibilita’
Constraint of Land Use Sustainability (CLUS)
56
𝐴𝐹 2050 – 𝐴𝐹 𝑡
𝐴𝐹 𝑡< 0.05 𝐴𝑁𝐷
𝐴𝐹 𝑡 – 𝐴𝐹 2014
𝐴𝐹 2014 < 0.20
Future Constraint
Past constraint
Steps: The predictive model computes all teh expansions until 2050 The system computes AF(2014) e AF(t) Test of CLUS and conclude if the new site is sustainable or not.
Valutazione di sostenibilita’
57

Implementation
PHP
HTML
CSS
Javascript
About 3500 lines, with ad hoc libraries
58

59

DANTHE & DPSIR
DPSIR
Tipi di indicatori (A, B, C, D)
Sources:
E. Smeets and R. Weterings, “Environmental indicators: typology and overview,” European Environment Agency Technical Report n. 25/1999 European Environment Agency, “Urban sprawl in Europe - The ignored challenge,” EEA Report n. 10/2006 European Environment Agency, “Towards a green economy in Europe - EU environmental policy targets and objectives 2010–2050,” EEA Report n. 8/2013
60

Thank you!
More info: dcalab.unipv.it/ies [email protected]
To our children To let them know that we tried to change (G. Porro)


