Università degli Studi di Padova - unipd.ittesi.cab.unipd.it/26707/1/Riccadonna_Cristina.pdf ·...
82
Università degli Studi di Padova Facoltà di Scienze MM. FF. NN. Laurea Magistrale in Biologia Sanitaria Peripheral immune status in the GFAP-V 12 HA- ras B8 spontaneous astrocytoma model Relatore : Marina De Bernard Dipartimento di Biologia, Padova. Correlatore : Paul R.Walker Hôpitaux Universitaires de Genève, Suisse. Laureanda: CRISTINA RICCADONNA ANNO ACCADEMICO 2009 / 2010
Transcript of Università degli Studi di Padova - unipd.ittesi.cab.unipd.it/26707/1/Riccadonna_Cristina.pdf ·...

U n i v e rs i tà d eg l i S tud i d i Pa d ova
F a c o l t à d i S c i e n z e M M . F F . N N .
Laurea Magistrale in Biologia Sanitaria
Peripheral immune status in the GFAP-V12
HA-ras B8 spontaneous astrocytoma model
Relatore : Marina De Bernard
Dipartimento di Biologia, Padova.
Correlatore : Paul R.Walker
Hôpitaux Universitaires de Genève, Suisse.
Laureanda: CRISTINA RICCADONNA
ANNO ACCADEMICO 2009 / 2010


“The real voyage of discovery consists
not in seeking new landscapes,
but in having new eyes.”
(M. Proust)


Alla mia famiglia,
per avermi sostenuto ed aiutato durante questo cammino così
impegnativo...
per avermi spinto a fare solo quello che più mi piaceva e per
non avermi mai posto alcun limite...
per avermi insegnato a non arrendermi e a sorridere in ogni
situazione...
per tutta la stima e l’illimitata fiducia che sono sempre state
riposte nelle mie mani...


1
INDEX
ABSTRACT............................................................................................................4
RIASSUNTO..........................................................................................................5
ABBREVIATIONS................................................................................................9
1. INTRODUCTION ...........................................................................................11
1.1. GLIOMA .......................................................................................................11
1.1.1. Classification, histopathology and origin of glioma ...................................11
1.1.2. Human Glioblastoma Multiforme: a general overview...............................12
1.1.3. Glioblastoma prognosis and standard treatment..........................................16
1.2. CANCER AND IMMUNOLOGY...............................................................17
1.3. IMMUNOLOGY OF THE CENTRAL NERVOUS SYSTEM................19
1.3.1. The brain: an immunologically specialized site...........................................19
1.3.2. Brain tumour innate immunity.....................................................................20
1.3.3. Brain tumour adaptive immunity.................................................................22
1.3.4. Tumour immune escape...............................................................................24
1.3.5. Impaired immune function in glioma patients.............................................27
1.3.6. Glioma antigens and immunotherapy..........................................................28
1.4. MOUSE MODELS TO STUDY BRAIN TUMOURS...............................29
1.4.1. Animal models in tumour immunology.......................................................29
1.4.2. Murine models of glioma……………………………………….……...….30
1.4.3. RasB8 glioma model…………………...………………………….………31
1.5. AIM OF THE PROJECT.............................................................................32

2
2. MATERIALS AND METHODS....................................................................34
2.1. MICE..............................................................................................................34
2.1.1. Strains and breeding.....................................................................................34
2.1.2. Polymerase Chain Reaction: general principles...........................................34
2.1.3. Genotyping...................................................................................................35
2.2. FLOW CYTOMETRY.................................................................................36
2.2.1. General principles of immunofluorescence.................................................36
2.2.2. Principles of flow cytometry........................................................................38
2.2.3. Surface staining protocol..............................................................................39
2.2.4. Intracellular staining protocol......................................................................40
2.2.5. Determination of cell numbers and viability by Trypan Blue exclusion.....40
2.3. CFSE PROLIFERATION ASSAY..............................................................40
2.3.1. General principles of the technique.............................................................40
2.3.2. CFSE proliferation assay protocol...............................................................42
2.3.3. Data analysis................................................................................................42
2.4. DETECTION OF SPECIFIC ANTIGEN RESPONSE.............................44
2.4.1. Lac-Z recombinant vaccinia virus................................................................44
2.4.2. Resume of the experiment............................................................................44
2.4.3. Mice vaccination and sacrifice.....................................................................45
2.4.4. Ex-vivo staining............................................................................................45
2.4.5. Cell re-stimulation........................................................................................46
2.4.6. INF-γ staining...............................................................................................46
2.5. STATISTICAL ANALYSIS.........................................................................47
3. RESULTS..........................................................................................................48
3.1. SPLENOCYTE AND LN ANALYSIS........................................................48
3.1.1. Surface staining of splenocytes and LN cells..............................................48
3.1.2. Quantitative analysis of T and B cells in spleen and LN.............................48

3
3.1.3. Memory CD4 and CD8 T cells: Ly-6C marker...........................................50
3.1.4. Myeloid-derived suppressor cells................................................................51
3.1.5. CFSE dilution assay for in vitro T cells proliferative response...................52
3.1.6. Results of proliferation assay.......................................................................52
3.2. IN VIVO PRIMED T CELL IMMUNE RESPONSE................................53
3.2.1. LacZ Vaccinia Virus vaccination and mouse sacrifice……......………….53
3.2.2. Ex-vivo phenotype………………..…………………..………………...….53
3.2.3. In vitro re-stimulation..................................................................................56
3.2.4. Selection of spleens for INF-γ production analysis…....…….……………56
3.2.5. INF-γ production….……………………………………………….………57
4. DISCUSSION………………………………………………………………...61
4.1. PERIPHERAL IMMUNE BALANCE IN GLIOMA................................61
4.1.1. Glioma does not have a major impact on B cell proportions…………...…61
4.1.2. The proportion of CD4 T cells can be reduced in RasB8 glioma................61
4.1.3. Memory phenotype T cells remain intact in RasB8 glioma…………….…62
4.1.4. Myeloid-derived suppressor cell proportion is not increased in RasB8
glioma.....................................................................................................................63
4.2. T CELLS DO NOT EXHIBIT IMPAIRED IN VITRO
FUNCTIONALITY IN RASB8 GLIOMA.........................................................64
4.3. ACTIVATED T CELLS DO NOT RESPOND TO GLIOMA
ANTIGEN.............................................................................................................64
5. CONCLUSIONS..............................................................................................67
APPENDIX…………………………………………………………………...…68
BIBLIOGRAPHY……………………………………………………………....70
Acknowledges/Ringraziamenti............................................................................75

4
ABSTRACT
Glioma represents one of the deadliest primary CNS tumours. We used a
transgenic spontaneous astrocytoma mouse model to analyse glioma-immune
system interactions at the peripheral level. Importantly, this model allows analyses
at early (asymptomatic) stages of the disease without the influence of concomitant
treatments. In patients, local immunosuppression is induced by soluble factors and
cell-associated molecules; in the periphery, T-cell hyporesponsiveness to in vitro
mitogen-stimulation and a decreased CD4/CD8 T cell ratio were demonstrated.
We performed functional and quantitative analyses on mouse LN and spleen cells
to determine whether mice exhibit immunosuppression. In contrast to a parallel
study of local immune status, there was little alteration in immune function or
phenotype at early stages of tumour development. However, certain trends were
apparent in symptomatic mice, and the CD4/CD8 ratio was significantly reduced.
Furthermore, we used a recombinant virus vaccination to elicit or enhance an
antigen-specific immune response. Although there was no significant difference
between groups, a modest trend to have greater response in transgenic rather than
control mice was observed. Overall, differently to local immune status, limited
peripheral immune defects were restricted to later disease stages. Moreover, there
were no significant alterations in specific immune response in transgenic mice.

5
RIASSUNTO
Glioma. Il glioma, tumore maligno alle cellule gliali, è uno tra i più comuni e
mortali tumori primari al cervello. Anche a seguito di intervento chirurgico e
chemio-radioterapia, la prognosi rimane limitata a meno di due anni. Esistono
quattro differenti tipologie di glioma, secondo il tipo cellulare predominante di cui
esso è composto: astrocitoma, ependimoma, oligodendroglioma e
oligoastrocitoma. L’origine del glioma rimane ancora incerta; due meccanismi
sono stati proposti per spiegare l’origine del tumore: la trasformazione di cellule
staminali endogene e il de-differenziamento di astrociti maturi. A livello
istologico, il glioma è caratterizzato da pleomorfismo nucleare, alta densità
cellulare, figure mitotiche, necrosi e proliferazione dell’endotelio vascolare. Un
aspetto peculiare di questo tipo di tumore è l’eterogeneità. Esso è inoltre molto
invasivo e risulta costituito da cellule necrotiche circondate da una massa ad
elevata attività angiogenica. A differenza di altri tumori solidi, il glioma non
metastatizza al di fuori del sistema nervoso centrale. Esso viene classificato in
quattro gradi, secondo la gravità crescente della patologia (classificazione
dell’Organizzazione Mondiale della Sanità, 2007): I grado, caratterizzato da basso
potenziale proliferativo e di possibile cura tramite resezione chirurgica; II grado,
ricorrente e anch’esso interessato da basso potenziale proliferativo; III grado,
tumore maligno contraddistinto da atipia nucleare; IV grado, definito glioblastoma
multiforme, associato ad alta attività mitotica, elevata malignità e prognosi
infausta. Vengono distinte due tipologie di glioblastoma multiforme: glioblastoma
primario, il quale si sviluppa de novo in un periodo mediamente inferiore ai tre
mesi, e secondario, il quale è la conseguenza di una lenta progressione da glioma
di II o di III grado. Differenti mutazioni genetiche caratterizzano i due tipi di
glioblastoma multiforme, supportando l’ipotesi che diversi meccanismi molecolari
portano allo sviluppo di essi. Tuttavia, caratteristiche istologiche e risposta al
trattamento sono comparabili tra i due.
Immunologia tumorale. In questo lavoro sperimentale, è stata in particolare
studiata l’interazione tra tumore e sistema immunitario. Essa è stata recentemente
designata dall’ipotesi dell’immunoediting, processo suddiviso in tre fasi
temporaneamente conseguenti: eliminazione, equilibrio e fuga. Nella fase di
eliminazione, il sistema immunitario individua ed elimina il tumore; nella seconda
fase, si instaura un equilibrio dinamico tra i componenti del sistema immunitario e
le cellule tumorali, le quali accumulano mutazioni genetiche ma la loro
proliferazione risulta limitata. Nell’ultima fase, si verifica progressione tumorale,

6
grazie alla presenza di cellule tumorali resistenti, selezionate durante la fase
precedente. Inoltre, il tumore a questo ultimo stadio è in grado di influenzare
negativamente l’azione del sistema immunitario (immunosoppressione tumorale).
E’ ampiamente riconosciuto che a livello cerebrale l’interazione tra sistema
immunitario e tumore è specializzata ed unica. In passato, il cervello era
considerato un organo immunologicamente “privilegiato”, a causa dell’esistenza
della barriera emato-encefalica, della mancanza di convenzionali vasi linfatici e
della presenza di diversi fattori immunosoppressivi. Diversi studi hanno
dimostrato che cellule del sistema immunitario possono infiltrare la massa
tumorale. Il cervello è ora considerato un organo immunologicamente
“specializzato”.
Immunosoppressione locale associata al glioma. I meccanismi
immunosoppressivi associati al glioma possono essere divisi in passivi ed attivi.
La cellula tumorale può sottrarsi attivamente al riconoscimento da parte del
sistema immunitario sottoesprimendo le molecole MHC I. Essa può indurre
inoltre apoptosi di cellule immunitarie esprimendo FasL sulla membrana cellulare.
Inoltre, l’ipossia caratterizzante il microambiente tumorale contribuisce a
sopprimere le normali funzioni delle cellule del sistema immunitario. Le cellule
tumorali possono inoltre secernere fattori solubili immunosoppressivi come IL-10
e TGF-β (immunosoppressione passiva). Le cellule T regolatrici (Treg) rivestono
infine un ruolo essenziale nell’immunosoppressione. Esse possono secernere
citochine inibitorie e/o modulare la funzionalità delle cellule presentanti
l’antigene. Inoltre, possono presentare citotossicità.
Immunosoppressione periferica associata al glioma? In questo lavoro
sperimentale, abbiamo analizzato se il glioma può indurre immunosoppressione
anche a livello periferico. Per questo scopo, abbiamo utilizzato un modello
murino di astrocitoma. Il modello utilizzato è transgenico e sviluppa il tumore in
modo spontaneo, riproducendo quello che avviene nell’uomo. E’ stato infatti
dimostrato che le mutazioni genetiche e l’eterogeneità del modello riproducono la
progressione e le caratteristiche del glioma umano. Inoltre, il transgene contiene il
gene LacZ, il quale codifica per un antigene conosciuto (β-galattosidasi),
considerato un antigene tumore-associato.
Studi su pazienti affetti da glioma hanno dimostrato diverse disfunzioni nella
risposta immunitaria a livello periferico; una conseguenza di queste è la
dimostrata anergia cutanea a comuni antigeni batterici. Inoltre, è stato osservato
che alcuni tipi cellulari del sistema immunitario di pazienti malati sono affetti da
anomalie a livello quantitativo e funzionale. In particolare, il rapporto T

7
linfocitario CD4/CD8 risulta diminuito; inoltre, la responsività dei linfociti T alla
stimolazione in vitro con mitogeno risulta ridotta. Non sono invece state
dimostrate alterazioni nelle proporzioni dei linfociti B. E’ però da considerare il
fatto che questi studi non hanno valutato la possibile concomitante terapia
somministrata ai pazienti analizzati e sono stati effettuati solamente durante gli
ultimi, sintomatici stadi della malattia. L’utilizzo di un modello risulta
vantaggioso principalmente perché permette lo studio dell’immunologia tumorale
anche ai primi stadi della malattia e l’analisi del modello evita l’influenza che il
trattamento terapeutico ha sul sistema immunitario.
In questo lavoro sperimentale, abbiamo determinato quantitativamente diverse
tipologie di cellule immunitarie in milza e linfonodi inguinali, per determinare se
significative alterazioni interessano i topi portatori di tumore. Abbiamo inoltre
eseguito un test in vitro, per analizzare se la risposta dei linfociti T splenici alla
stimolazione con mitogeno è diminuita come osservato nei pazienti. Infine,
abbiamo indagato la capacità di attivazione dei linfociti T in topi transgenici, dopo
vaccinazione con un virus ricombinante. Abbiamo inoltre analizzato la loro
risposta specifica in vivo ad un antigene tumore-associato.
Stato immunologico periferico nel modello spontaneo di astrocitoma.
Abbiamo osservato che il bilancio immunologico non è alterato a partire dai primi
stadi della malattia, ma solo nelle ultime fasi della progressione tumorale. Il
rapporto T linfocitario CD4/CD8 è infatti risultato significativamente diminuito
solo nel topo malato. Abbiamo inoltre dimostrato che le cellule soppressive di
origine mieloide (gruppo eterogeneo di cellule immunosoppressive) non sono
presenti in aumentate quantità a livello splenico in topi affetti da glioma, come
invece dimostrato in altri modelli. Come osservato nell’uomo, anche nel modello
murino di glioma la porzione periferica dei linfociti B non risulta alterata. La
risposta dei linfociti T alla stimolazione in vitro si è dimostrata mitogeno dose-
dipendente. Non abbiamo osservato iporesponsività dei linfociti T provenienti da
topi malati, ma è da considerare il fatto che il test eseguito è in vitro e di
conseguenza non è stato riprodotto lo stesso ambiente immunosoppressivo
presente in vivo. Recenti studi hanno infatti dimostrato una correlazione tra
presenza del glioma e anormalità dei linfociti T. Abbiamo infine eseguito una
vaccinazione con un virus ricombinante: VV-LacZ. Abbiamo analizzato in primo
luogo la capacità dei linfociti di attivarsi. Nel topo transgenico, la capacità di
attivazione delle suddette cellule non risulta diminuita. Non è stata invece
osservata una risposta specifica all’antigene tumore-associato nei topi transgenici,
dopo vaccinazione e stimolazione in vitro. Da discutere è l’efficienza dello

8
strumento di vaccinazione utilizzato, il quale è stato dimostrato susciti un’elevata
risposta virus-specifica ed una modesta risposta immunologica rivolta verso il
gene codificato nel costrutto. Infine, la stimolazione in vitro è stata effettuata con
due differenti peptidi dell’antigene e da esaminare è la loro immunogenicità.
Conclusioni. Abbiamo dimostrato che la presenza del glioma non influenza in
modo significativo lo stato immunologico periferico del modello di astrocitoma
utilizzato, eccetto durante gli ultimi stadi della malattia (quando la porzione di
linfociti T CD4 risulta compromessa). Inoltre, non abbiamo osservato alterazioni
nella responsività e nella capacità di attivazione dei linfociti T in topi affetti dal
tumore. Nel contesto del glioma umano, coi dati ottenuti si può ipotizzare che
l’immunoterapia è efficace solo se somministrata nelle prime fasi del tumore. La
risposta immunologica specifica anti-glioma deve evidentemente avvenire a
livello locale, e questo aspetto può rappresentare un fattore limitante per
l’efficacia clinica della vaccinazione terapeutica testata.
9
ABBREVIATIONS
ACK: ammonium cloridium lysis buffer
Ag : antigen
APC : antigen-presenting cell
BBB : blood-brain barrier
BTSCs : brain tumour stem cells
CFSE : carboxyfluorescein succinimidyl ester
cLN : cervical lymph node
CNS : central nervous system
ConA : concanavalin A
CTL : cytotoxic T lymphocyte
DC : dentritic cell
EGFR : epidermal growth factor receptor
FasL : Fas Ligand
FCS : fetal calf serum
FWB : flow cytometer wash buffer
FWB fix : flow cytometer wash buffer with fixative
GBM : glioblastoma
GFAP : glial fibrillary acidic protein
GIM : glioma-infiltrated macrophages
HBSS medium : Hanks Balanced Salt Solution
IL : interleukin
Iono : ionomicyn
LN : lymph node
MDSCs : myeloid-derived suppressor cells
MHC : major histocompatibility complex
NK : natural killer
NTG : non transgenic
PCR : polymerase chain reaction
PGE2 : prostaglandin E2
PMA : phorbol 12-myristate 13-acetate
RasB8 mice : GFAP-V12
HA-ras B8 mice
RPMI : Roswell Park Memorial Institute medium
SD : standard deviation
10
TAAs : tumour-associated antigens
TG : transgenic
TGF-β : transforming growth factor β
Th2 : T helper type 2
TLR : toll-like receptor
Th1 : T-helper type 1
TMZ : temozolomide
TNF : tumour necrosis factor
Treg cells: regulatory T cells
VEGF: vascular endothelial growth factor
VEGFR : vascular endothelial growth factor receptor
VV : Vaccinia virus
WHO : World Health Organization
wo : week-old
βgal : β-galactosidase

11
1. INTRODUCTION
1.1. GLIOMA
1.1.1. Classification, histopathology and origin of glioma
Glioma, a malignant tumour affecting glial cells, presents some of the
greatest challenges in the management of cancer patients worldwide. Even with
aggressive surgical resections, along with recent advances in radiotherapy and
chemotherapy, the prognosis for patients remains very poor (Kanu et al., 2009).
The World Health Organization (WHO) published in 2007 the fourth
edition of the Classification of Tumours of the Central Nervous System (CNS), in
which the categorization and the different grades of tumours are clearly described
(Louis et al., 2007). The classification is relevant in terms of possible therapies
and possible outcome. It permits also to have a worldwide definition of the
tumour, based on histopathological and clinical diagnostic criteria, in order to
permit epidemiological studies and clinical trials without considering national
boundaries. There are four different types of glioma: astrocytoma, ependymoma,
oligodendroglioma and oligoastrocytoma. In the brain, glial cells are non-neural
cells that perform several essential functions, such as anchoring to neurons and
regulating the trafficking of molecules and ions through them (astrocytes),
covering the cavities of the CNS (ependymal cells) and forming myelin
(oligodendrocytes). The WHO classification, depending on the presence of
histological features of malignancy, divides tumours in four different prognostic
grades. The grade I tumours are surgically curable tumours with low proliferative
potential, grade II show low-grade malignancy and are infiltrative, grade III are
malignant and require radio and/or chemotherapy.
Glioma usually manifests itself as a focal lesion with central necrosis
surrounded by an angiogenic tumour rim; it can be roughly separated into an
angiogenic component and an invasive or migratory one. Migration of glioma
cells in brain parenchyma relatively far away from the tumour core is common,
complicating surgery and radiotherapy (Kanu et al., 2009). In Wen et al. (2008),
the histological features of malignant glioma were described. Nuclear
pleomorphism, dense cellularity, mitotic figures, pseudopalisading necrosis and
vascular endothelial proliferation are observed. Heterogeneity is considered one of
the hallmark characteristics of the tumour. Unlike other solid tumours, glioma
rarely metastasizes to locations out of the CNS (de Vries, 2009).
Recently, studies about the cell of origin of brain tumours have stimulated
new hypotheses. The discovery of the presence of a small subpopulation of brain

12
tumour stem cells (BTSCs) has led to the hypothesis that neural stem cells are the
candidate cells of origin of CNS tumours. In Vescovi et al., BTSCs are defined
through different characteristics: they are pluripotent cells with extensive self-
renewal ability in vivo and ex vivo, they have genetic alterations, aberrant
differentiation properties, capacity to generate non-tumourigenic as well as
tumourigenic cells and have cancer-initiating ability upon orthotopic implantation.
Two different mechanisms have been proposed to explain the origin of the
tumour: either the de-differentiation of mature astrocytes or the transformation of
the endogenous neural stem cell population. The presence of the cell surface
marker CD133 on BTSCs has lately been reported and different studies have
demonstrated correlation between the CD133 cells and the resistance of tumour to
chemo and radio therapies (Vescovi et al., 2006). Although widely used, the
validation of CD133 as a unique glioma stem cell marker is debated. Recent data
show that CD133+ and CD133- cells share similar tumourigenic properties and the
isolation of the formers lacks of specificity (Clement et al., 2009). Therefore,
additional characterization of the functional role of BTSCs is needed to better
understand tumour initiation, progression and resistance to treatment.
1.1.2. Human Glioblastoma Multiforme: an overview
Glioblastoma multiforme (hereafter GBM or glioblastoma) is one of the
commonest brain tumours and one of the deadliest ones. It is an invasive,
aggressive and neurologically destructive astrocytoma. It is characterised by a
very poor median survival, which has only marginally improved over last several
decades, despite new technologies and different treatments used. In the most
favourable situations and with standard treatments, less than 10% of patients can
survive longer than five years (Stupp et al., 2009). GBM is a grade IV
astrocytoma: highly malignant, mitotically active, necrosis-prone neoplasm
typically associated with fatal outcome (Louis et al., 2007).
Glioblastoma can be separated into two main subtypes, on the basis of
genetic differences and of the median age distribution, even if they are largely
comparable from the histological point of view and they respond similarly to
conventional therapies (Wen et al., 2008; Ohgaki and Kleihues, 2009). Primary
glioblastoma typically occurs in patients of mean age of 62 years, whereas
Secondary GBM occurs on average in 45 years-old patients (de Vries et al., 2009).
Primary tumours are de novo tumours, which show a clinical history of a period <
3 months (68% of cases). Secondary GBM develop more slowly from low-grade
astrocytoma (WHO grade II) or from anaplastic astrocytoma (WHO grade III)
(figure 1). In the first case, the mean time of progression is estimated to be 5.1

13
years, for the second case 1.9 years. Progression from WHO grade II through
WHO grade III to grade IV GBM is also possible (Kanu et al., 2009).
Figure 1: Primary and Secondary Glioblastoma. Glioma is hypothesised to derive from brain
tumour stem cells (BTSCs) or from de-differentiated mature astrocytes. In this figure, two
different pathways leading to Primary and Secondary Glioblastoma are shown. Primary GBM are
de novo tumours, whereas Secondary GBM derive from low-grade astrocytoma and/or from
anaplastic astrocytoma.
In the United States and in the European countries, the annual incidence of
total Primary and Secondary malignant glioma is estimated to be 5 per 10,000
person-years (Wen et al., 2008). The aetiology of the tumour is likely to be
multifactorial; genetic and environmental factors can influence the outcome of the
tumour. Suspected predisposing factors are exposure to therapeutic ionizing
radiation and chemical carcinogens. Only the first one recently has been
statistically proven (Kanu et al., 2009). The adverse prognostic factors include
advanced age. Other factors are histological features of glioblastoma and
unresectable tumour. Furthermore, glioblastoma is more common in men than in
women and in whites than in blacks (Wen et al., 2008). The symptoms are
different and include peritumoural edema, venous thromboembolism, seizures,
fatigue, memory loss, confusion, personality changes, focal neurologic deficits,
high intracranial pressure, headaches that when severe may be associated with

14
nausea and vomiting (Wen et al., 2008; Kanu et al., 2009). Generally, the tumour
progression is accompanied by symptoms and preventative screening is not
considered useful for asymptomatic patients. The diagnosis is usually performed
using magnetic resonance imaging (MRI); when MRI is not possible, computed
tomography scan is useful, even if remains inferior in image detail. Furthermore,
positron emission tomography, magnetic resonance perfusion and magnetic
resonance spectroscopy can be used to delineate levels of metabolites and to
discriminate malignant tumour from benign lesion (Wen et al., 2008; Kanu et al.,
2009).
It is well-known that neoplasms occur as a consequence of successive
accidental mutational events; generally, the alterations concern signalling
pathways and cell-cycle regulation. In particular, oncogenes and tumour-
suppressor genes play an important role in carcinogenesis; the activation of the
former and the deactivation of the latter favour glioma evolution. Many molecular
studies have been performed in order to have a better understanding of the genetic
mutations in glioma cells. These can help to identify new therapeutic targets and,
consequently, to develop new, more efficient therapies. From the molecular
profiles point of view, Primary and Secondary glioblastoma are different and are
believed to derive from two different genetic pathways (Martinez and Esteller,
2010). Many different genetic mutations characterise the tumour, but only the
main ones are considered in this section (table 1).
The epithelial growth factor-receptor (EGFR) becomes activated through
the binding of its ligand EGF; afterwards the complex
EGFR/RAS/NF1/PTEN/PI3K signalling pathway is initiated, resulting in cell
proliferation and increased cell survival. EGFR gene overexpression is generally
observed in Primary GBM (approximately 40%), but it is very rare in Secondary
tumours (Ohgaki and Kleihues, 2009). The most common mutated variant of
EGFR that has been identified is EGFRvIII; the resulting defective receptor is
constitutively activated (Ohgaki and Kleihues, 2009; Kanu et al., 2009; Wen et
al., 2009). Even if high levels of RAS-GTP have been documented in primary
tumours, specific mutations affecting RAS in GBM have not been detected. RAS
overexpression is likely to be caused by upstream factors or by the loss-of-
function of the neurofibromatosis 1 (NF1) gene, which encodes for the
neurofibromin protein, a RAS negative regulator (Kanu et al., 2009). RAS
synergy with other signalling pathways is relevant to give rise to glioma (Munoz
et al., 2009). Inactivation of the PTEN gene, a tumour-suppressor gene that
regulates the PI3K pathway, is more common in Primary glioblastoma (40%) than
in Secondary (Wen et al., 2008). The TP53/MDM2/MDM4/p14ARF
pathway is
another important pathway involved in the evolution of glioma (Ohgaki and

15
Kleihues, 2009). Notably, TP53 gene encodes a protein that promotes cell cycle
arrest or apoptosis in response to DNA damage, hypoxia or cell cycle
abnormalities. It is essential for cellular and genetic stability. TP53 induces
transcription of genes such as p21, which prevents the progression through G1
cell cycle phase into S cell cycle phase. Unlike EGFR and PTEN mutations, TP53
alterations are more frequent in Secondary than in Primary glioblastoma. TP53
mutations observed in the two different subtypes of glioblastoma are diverse and
this suggests, as previously stated, that the acquisition of genetic alterations may
result from dissimilar molecular mechanisms. RB1 controls the transition from G1
into the S phase of the cell cycle by inhibiting the action of elongation factor 2
(E2F), and its expression is in general altered in glioma cells (Kanu et al., 2009).
One of the most frequent mutations in GBM is loss of heterozygosity (LOH) on
chromosome 10q, very common in both of glioblastoma subtypes (Martinez and
Esteller, 2010; Ohgaki and Kleihues, 2009). The IDH1 gene encodes isocitrate
dehydrogenase 1, the enzyme that catalyses the oxidative carboxylation of
isocitrate to α-ketogluatrate in the Krebs cycle. When mutated, the enzyme loses
affinity for its substrate. In low-grade astrocytoma and in Secondary glioblastoma,
IDH1 is frequently mutated (> 80%); in contrast, in Primary glioblastoma
mutations are rare (< 5%). As Ohgaki and Kleihues (2009) explain, this can be
additional evidence of the possible different origins of the two subtypes of glioma.
Vascular endothelial growth factor receptor (VEGFR) is over expressed both in
Primary and Secondary GBM (Wen et al., 2008).
Genetic and epigenetic mutations Primary GBM Secondary GBM
EGFR overexpression 40% rare
PTEN inactivation 40% rare
TP53 alteration rare frequent
LOH 10q 5% 80%
VEGFR overexpression frequent frequent
MGMT methylation 36% 75%
Table 1: Genetic and epigenetic mutations in Primary and Secondary GBM. All different
mutations mentioned in this section are listed. Interestingly, alterations observed in the two
different kinds of GBM are different. This suggests that different molecular mechanisms lead to
different types of GBM, although histology and therapy response is largely comparable between
the two.

16
Epigenetics are also important in glioma evolution (Martinez and Esteller,
2010). An explicative example of a regulator gene undergoing methylation-
mediated inactivation in glioblastoma is the DNA repair gene O6
-methylguanine-
DNA methyl transferase MGMT), which removes promutagenic alkyl groups
from O6
-methylguanine. Reduction or loss of MGMT activity can occur due to the
promoter methylation and is associated with improved response to chemotherapy
and better prognosis (Ohgaki and Kleihues, 2009). Methylation is more frequently
observed in Secondary GBM (75%) than in Primary GBM (36%); in Secondary
GBM is often associated with TP53 mutations (Martinez and Esteller, 2010).
Martinez and Esteller (2010) have underlined another important epigenetic change
that has to been taken into consideration: the expression level of certain micro
RNA. Recent studies have shown that miR-21 has a higher expression in GBM in
comparison with normal brain; moreover, downregulation of miR-21 in glioma
cells can lead to reduction of their invasive capacity.
1.1.3. Glioblastoma prognosis and standard treatment
The current standard of care for GBM patients is maximum surgical
resection if feasible, followed by radiotherapy and concomitant systemic
temozolomide (TMZ) chemotherapy. TMZ is an oral alkylating agent with
antitumor activity and it can cross the blood-brain barrier (BBB) (Kanu et al.,
2009). Notably, Stupp et al. (2009) performed a clinical trial on glioblastoma
patients, in which radiotherapy alone is compared to radiotherapy and
concomitant TMZ chemotherapy followed by adjuvant TMZ chemotherapy
(figure 2). The median survival benefit with chemo-radiotherapy is statistically
significant and clinically meaningful; chemo-radio is considered preferable to
radiotherapy alone. Toxic effects of the currently used therapy include nausea,
leucopoenia, anemia, thrombocytopenia, fatigue and severe infections, but all of
them are considered acceptable (Stupp et al., 2009). The poorly efficacious
outcome of the currently used treatment can be explained by diverse reasons.
BTSCs seem to be remarkably resistant to radio and chemo therapies, probably
owing to their hallmark genomic profile (Kanu et al., 2009). Furthermore, the
standard TMZ chemotherapy fails due to the presence of MGMT (see section
1.1.2.). Recently, combinations of TMZ with MGMT inhibitors and inhibitors of
other repair enzymes have studied, in order to improve the efficacy of this therapy
(Kanu et al., 2009; Wen et al., 2008).

17
Figure 2: Survival curve of patients treated with combined chemo-radiotherapy. (Reproduced
from Stupp et al., 2009). Survival curve in glioblastoma patients treated with radiotherapy alone
versus glioblastoma patients treated with radiotherapy with concomitant and adjuvant
temozolomide chemotherapy. Survival is greater with combined treatment: a few patients in
favourable prognostic categories survive longer than 5 years.
Other different therapies are at present investigated, to improve the
prognosis and to ameliorate the quality of life of glioblastoma patients.
Bevacizumab (Avastin®
), a monoclonal antibody against vascular endothelial
growth factor (VEGF), combined with irinotecan, a chemotherapeutic agent, is a
new chemotherapy protocol increasingly used for recurrent malignant glioma. To
consider is that this combined treatment has many side-effects, such as
thromboembolic complications and gastrointestinal toxicities (Xu et al., 2010).
Other types of treatment under investigation are targeted molecular
therapy, such as anti-EGFR therapy, immunotherapy (discussed in detailed in
section 1.3.6.) and gene therapy; additionally, drugs to overcome resistance are
studied. Combinations of different kinds of therapy are required, due to the fact
that several pathways can be concurrently altered in glioma cells, which are very
heterogenic and may manifest different types of alterations and different capacity
of resistance (Kanu et al., 2009).
1.2. CANCER AND IMMUNOLOGY
Most information about the interaction between cancer and immune
system has come from tumours in sites other than the brain. In the past, the
hypothesis of “immunosurveillance”, which is the detection and elimination of
tumour cells by the immune system, has been proposed. Different studies have
been performed in immunodeficient mice strains to prove the correlation with the

18
lack of components of immune system and the develop of the tumour (Swann and
Smith, 2007). Nevertheless, evidence of immunosurveillance is rare in clinical
settings (Bui and Schreiber, 2007). The concept of “immunosurveillance” has left
room for a refined theory, named “immunoediting”, which consists of a process
divided into three different phases: elimination, equilibrium and escape (Bui and
Schreiber, 2007; Swann and Smith, 2007) (figure 3). The elimination corresponds
to the mechanism previously described by the “immunosurveillance” theory. After
that, a phase of dynamic equilibrium is thought to be established, in which tumour
cells can continue to evolve and they probably can accumulate genetic changes.
The third phase is characterised by the progression of the tumour, which is now
able to resist the action of the immune system, probably thanks to the selection of
specific resistance tumour cells variants (Swann and Smith, 2007). There is an
ongoing interest to validate or to refute the immunoediting hypothesis, in relevant
cancer models and in clinical pathologies.
Figure 3: Cancer immunoediting (adapted from Swann and Smyth, 2007). Cancer
immunoediting is a process divided into three phases. The first one, named elimination,
corresponds to cancer immune surveillance. During the equilibrium phase, immune cells and
tumour cells are temporary in dynamic equilibrium and tumour cells continue to evolve,
accumulating genetic changes. Resistant tumour cell variants are also selected. In the escape
phase, immune response fails to completely eliminate the tumour and this results in cancer
progression.
19
Referring in particular to the central nervous system, our understanding of
the interaction between immune system and tumour is not so clear; information is
frequently extrapolated from other tissues which are indeed different from brain
(Walker et al., 2002). It is well-known that immune reactions happening in the
brain are specialised and unique (see the 1.3.1.) and further investigations are
needed in order to completely understand them.
1.3. IMMUNOLOGY OF THE CENTRAL NERVOUS SYSTEM
1.3.1. The brain: an immunologically specialised site
For many decades, the CNS has been believed to be an immunologically
inert site completely separated from the peripheral immune system. It has been
defined as an “immunologically privileged” site. Initially, in fact, it was observed
that foreign tissue grafts survive for more prolonged periods when placed within
the parenchyma of the brain compared with being placed under the skin (Carson
et al., 2006). Accordingly, the presence of the BBB, the regulation of the cell
trafficking through it, the lack of conventional lymphatics, many local
immunosuppressive factors and the absence of resident dendritic cells (DCs) have
given support to the hypothesis that the brain is an immunologically inert site
(Carson et al., 2006; Grauer et al., 2009). The BBB consists of specialised
cerebrovascular endothelium, basement membrane, pericytes and astrocytes. The
BBB endothelium has tight junctions, low pinocytotic activity and lacks of
transendothelial fenestrations. Primarily, it has been presumed to limit movement
of leucocytes and solutes from blood to CNS (Carson et al., 2006). Besides the
physical restrictions described, it has to be taken in consideration the fact that the
brain is an essential organ for survival and that has to be protected by pathogens;
even so, it cannot tolerate volume increase after an inflammatory cellular
accumulation, because the skull lacks elasticity (Carson et al., 2006). In addition,
inflammatory reactions have to be kept under control in order to avoid their
potential capacity to damage neurons (Carson et al., 2006; Walker et al., 2009).
Diseases such as multiple sclerosis (MS) and experimental autoimmune
encephalitis (EAE), multiple sclerosis model in animals, provide strong evidence
that immune cells can act in the brain (Okada et al., 2009). Moreover, the
documentation of neuroinflammation in diverse CNS disorders has led to the
conclusion that the CNS cannot be considered an immunologically inert, but
rather an “immunologically specialised” site.
With respect to brain and glioma, there is much evidence which proves an
interaction between immune system and tumour (Walker et al., 2009; Okada et al.,

20
2009; Grauer et al., 2009). It should be noted that the BBB may be compromised
in glioma patients and this can affect immune cells migration: permeability is
higher due to increased fenestrations and due to the diminished number of BBB-
associated pericytes (Okada et al., 2009). But leukocyte entry into the CNS is
generally not absolutely dependent on breakdown of BBB integrity. Tissue-
selective trafficking of leucocytes is mediated by unique combination and
sequential interactions of adhesion molecules and chemokines (Kunkel and
Butcher, 2002). What is unique to the CNS is the specific combination of
molecules and receptors used. The translocation of leucocytes occurs by the multi-
step model, clearly described in Kunkel and Butcher (2002). This model consists
of a first process called rolling in which blood leucocytes interacting transiently
and reversibly with the vascular endothelium. The second step is the activation of
leucocytes which, after their biding to activation factors on the endothelium
surface, express integrins. During the following process named adhesion,
leucocytes reversibly arrest and adhere on vascular endothelium. The final step is
the transmigration across the endothelium, directed by chemokine gradients.
1.3.2. Brain tumour innate immunity
The immune system is based on two distinct types of responses: innate
immunity and adaptive immunity. Innate immunity provides the first defence of
our organism against pathogens; it involves recognition of pathogens by receptors
encoded by conventional genes, followed by activation of destructive effector
mechanisms. The cells that orchestrate the innate immune response are
monocytes, macrophages, granulocytes (eosinophils, basophils, neutrophils and
mast cells), natural killer (NK) cells and DCs. Also serum proteins of the
complement system participate in immune innate defence (Parham, The immune
system, 2009).
Adaptive immunity forms the second line of defence and is constituted by
B and T cells. It acts in a highly specific way but the receptors are not necessarily
pathogen-specific. They are characterised by infinite diversity, because encoded
by genes which undergo somatic recombination. During an infection, a small
subset of lymphocytes specific for the pathogen is selected and expanded.
Adaptive immunity can also provide long-term immunological memory (Parham,
The immune system, 2009). The interaction between immune cells of the innate
immune system and immune cells of the adaptive immune system is determinant
for mounting an effective immune response. As seen in section 1.3.1., the
distinctive conditions imposed by the CNS influence the anti-tumour immune
response happening in the brain.

21
Microglia, glial cells that are resident macrophages in the CNS, are
considered the first cells which respond to a variety of stress signals in the brain
(Okada et al., 2009). In common with the other cells of the innate immune system,
they can detect pathogen-associated molecular patterns (PAMPs) by means of
pathogen-recognition receptors (PPRs) that include the toll-like receptors (TLRs)
(Walker et al., 2009). In glioma, resident microglia are difficult to be clearly
distinguished from glioma-infiltrated macrophages (GIMs) apart from by flow
cytometry. The GIMs express raised levels of TLRs. GIMs are the largest
subpopulation infiltrating glioma, however, differently to microglia, they do not
appear to be stimulated to produce pro-inflammatory cytokines (Okada et al.,
2009), such as nitric oxide (NO) and tumour necrosis factor (TNF)-α (Prins and
Liau, 2004). Both microglia and GIMs are phagocytic cells of myeloid origin with
capacity of presenting antigen, but their ability of doing this is much lower than
DCs (Grauer et al., 2009). NK cells can mediate cytolysis of infected or
transformed cells and secrete INF-γ. In order to induce cytolysis, they require the
presence of an activating signal, for example given by the expression of stress-
induced proteins by tumour cells, and simultaneously, the absence of an inhibitory
signal (reviewed in Walker et al., 2009). In fact, although all nucleated cells
normally express major histocompatibility complex (MHC) class I, transformed or
virus-infected cells often down-regulate the classical MHC class I expression in
an effort to avoid recognition by CD8+ cytotoxic T lymphocytes (CTLs). NK cells
can recognise and kill cells which do not present MHC class I (reviewed in
Walker et al., 2009). Actually, little is known about the potential impact of NK
cells on human glioma (Walker et al., 2009). Also the role of granulocytes in the
contest of glioma is not well-characterised in the literature.
Another important cellular component of innate immunity is the dendritic
cell. DCs are professional antigen-presenting cells (APC) and can activate naïve T
cells and induce their differentiation into T-effector cells. Hence, their role in
inducing adaptive immunity is very important. They are present in virtually all
tissues and organs and they continuously monitor their environment. Moreover,
they can be recruited to the tumour site from the periphery (Grauer et al., 2009).
Two different subtypes of DCs exist: plasmacytoid and conventional DCs. The
conventional DCs can further be divided in migratory and lymphoid-tissue-
resident. DCs, after the capture of the pathogen or antigen and activation via
PPRs, undergo a process named maturation and present the processed antigen
(Ag) to the T cells in secondary lymphoid organs, using MHC class II and/or
MHC class I. Co-stimulatory molecules, such as members of the B7 family,
highly expressed by DCs, are needed to obtain full activation of naïve T cells
(Walker et al., 2009). Focusing on glioma, the process of presenting tumoural

22
antigen has been formerly hypothesized to happen through different possible
mechanisms: (1) after the uptaken of the Ag, DCs migrate to the cervical lymph
node (cLN) and therein presents the Ag to the T cells; (2) Ag itself drains to cLN
where it is taken up by DCs and processed; (3) tumoural cells that express Ag
may directly drain to cLN and present their own Ag. The first hypothesis is
currently supported by several lines of evidence (Okada et al., 2009).
1.3.3. Brain tumour adaptive immunity
The cells that orchestrate adaptive immune responses are T cells and B
cells. Both of them are bone marrow-derived cells. They can recognise their
cognate antigen through their specific receptor: T cell receptor (TCR) and B cell
receptor (BCR). In particular, the portion of the antigen recognised by the T cell
receptors is called the epitope, which derives from proteolytic cleavage (Parham,
The immune system, 2009).
Concerning B cells, when cognate antigen binds to their receptor, they
proliferate and differentiate into plasma cells, which secrete high level of
antibodies specific to the precise antigen encountered. Five different classes of
antibodies exist: IgG, IgA, IgM, IgD and IgE. They are involved in several
immune reactions, such as neutralisation and opsonisation, and they constitute the
humoral arm of immunity (Parham, The immune system, 2009). In this section,
the attention is focused on T cells rather than on B cells, because the B
lymphocytes are probably not a major component of spontaneous immunity to
brain tumours (Walker et al., 2009). In fact, B cells poorly infiltrate brain tumours
and in addition, the capacity of antibodies to enter the brain is limited.
Immature T cells are selected in the thymus to recognise self-MHC
molecules (positive selection) and for the absence of autoreactivity against self-
antigens (negative selection). This process makes the immune system tolerant of
self. In the context of self tolerance, a key role is played by the transcriptional
factor called autoimmune regulator (AIRE), which facilitates expression of
different tissue-specific genes by a subpopulation of epithelial cells in the medulla
of the thymus. The phenomenon of tolerance is not limited to central (i.e. thymic)
tolerance; autoreactive cells which escape deletion by central tolerance can be
induced to become anergic or can be suppressed by regulatory T cells in the
periphery. Autoimmune diseases are generally caused by defects in self tolerance
which result in autoreactive inflammation (Parham, The immune system, 2009).
Immature T cells in the thymus express both CD4 and CD8 co-receptors.
After maturation, they become single-positive CD4+ or CD8
+ T cells. CD8
+ T
cells generally recognise epitopes of endogenous origin, presented on MHC class
23
I. CD4+ T cells recognise epitopes derive from exogenous sources, presented on
MHC class II.
CD8+ T cells recognise cognate peptide and the specific target cell if it
expresses appropriate MHC class I. They can adopt different cytotoxic
mechanisms to induce apoptosis in their target cells. Cytotoxicity can derive from
the contents of cytotoxic granules, released by exocytosis in the immunological
synapse formed between the CTL and the target cell. The granule contents include
perforin, granulysin and granzymes (Parham, The immune system, 2009). The
hypothesis that perforin is inserted into the target-cell membrane and creates pores
through which granzymes can penetrate the cell has recently been debated in the
literature. However, perforin is necessary to mediate the release of granzymes in
the cell. Granzymes trigger apoptosis of target cells via the activation of the
caspase proteolityc cascade or via caspase-indipendent mechanisms. CTLs can
also secrete TNF and lymphotoxins (LTs); they can also induce apoptosis of the
target cell through Fas Ligand (FasL) binding (Parham, The immune system,
2009). After antigen presentation in the cLN, CD8 T cells undergo clonal
expansion. Using orthotopically implanted glioma mice models, it was
demonstrated that CD8 T cell proliferation happens in superficial and deep cLNs
and in lumbar lymph nodes (LNs), and it is associated with a rapid up-regulation
of the integrin heterodimer α4β1, very relevant for the brain tropism of the
activated T cells (Calzascia et al., 2005). Moreover, this study demonstrated that
the imprinting of T cells depends on the site in which the antigen is captured,
rather than the particular LN in which T cell proliferation occurs (Calzascia et al.,
2005). When CD8 T cells reach the tumour site, they further differentiate in the
brain, exhibiting enhanced INF-γ and Granzyme B expression and induction of
αEβ7 integrin expression that facilitates T cell retention in the brain (Masson et al.,
2007). INF-γ, a type II interferon, activates macrophages and increases the
processing and presentation of antigens (Pharam, The immune system).
Naïve CD4+ T-cells can differentiate, depending upon the stimulus, into T-
helper type 1 (Th1), T-helper type 2 (Th2), Th17 cells or regulatory T cells (Treg
cells). CD4 T cells are called “helper cells” when they secrete a variety of
cytokines that enhance the function of other cells (Prins and Liau, 2004).
Generally, CD4+ T cells can help B cells make antibodies, they induce
macrophages to develop enhanced microbicidal activity, and they recruit
neutrophils, eosinophils and basophils to sites of infection (Parham, The immune
system, 2009). Defining the role of CD4+ T cells in brain tumour immunity is
complicated, due to the fact that they can either manifest pro- or anti- tumour
effects. Besides, very few glioma antigens recognised by CD4+
T cells have been
identified (Walker et al., 2009).

24
1.3.4. Tumour immune escape
Despite the observation that immune cells can infiltrate the tumour in
glioma patients (see section 1.3.1.), the role of the immune system in tumour
progression is still debated. In section 1.2., the theory of “immunoediting” is
explained; according to this concept, the tumour can overwhelm immune response
due to selection of resistant tumour cell variants. The escape of the tumour from
the immune system response is usually defined as tumour immune escape.
Tumour escape permits the progression of the tumour to advanced stages (Cao,
2009), thus understanding the mechanism is a major challenge for cancer research.
Glioma immune escape mechanisms can be divided into two different
groups: passive and active. The passive mechanisms are represented by intrinsic
properties of glioma cells. Indeed, glioma may attempt to passively escape
immune detection by downregulation of MHC expression; furthermore, areas of
hypoxia represent a hostile microenvironment for immune cells (Walker et al.,
2009). The immunosuppression actively elicited by glioma concerns soluble
factors, cell surface molecules and immunosuppressive cells (Walker et al., 2009;
Grauer et al., 2009; Okada et al., 2009). As a consequence, in the tumour
microenvironment the normal function of immune effector cells is profoundly
suppressed (Grauer et al., 2009; Tran Thang et al., 2010) and the presence of
immunostimulatory molecules such as interleukin (IL)-12 and INF-γ is lacking
(Grauer et al., 2009; Tran Thang et al., 2010). The glioma microenvironment is
composed of tumour cells, endothelial cells, intermingling glia, neurons,
extracellular matrix fibers, soluble mediators and a variety of leukocyte subsets
(Okada et al., 2009).
One of the most extensively studied glioma-derived immunosuppressive
factors is Transforming Growth Factor (TGF)-β2, originally called glioblastoma
cell-derived T-cell suppressor factor (Walker et al., 2002). TGF-β2 is an isoform
of TGF-β in mammals; the isoforms TGF-β1, 3 and 4 are differentially expressed.
TGF-β2 has multiple and complex effects; in particular it inhibits maturation and
antigen presentation by DCs or other APC (Okada et al., 2009) and also
suppresses NK and T-cell proliferation (Walker et al., 2009). It has been
demonstrated that TGF-β2 is produced by glioma cells and by glioblastoma in
vivo (reviewed in Walker et al., 2009). All these characteristics make TGF-β2 an
attractive target for novel therapeutic approaches and the most advanced in the
clinical application is the use of an antisense oligonucleotide (Grauer et al., 2009).
Other immunosuppressive soluble glioma origin-factors are gangliosides,
prostaglandin E2 and IL-10 (Walker et al., 2002). Gangliosides (GANGs) are
sialic acid-containing glycosphingolipids present in human plasma (Dix et al.,

25
1999). GANGs can modulate lymphocytes responsiveness; it can be speculated
that immunosuppression by GANGs might account for some of the dysfunctions
observed in glioma patients (Dix et al., 1999). Prostaglandin E2 (PGE2) is a
product of arachadonic acid metabolism and it is produced at the sites of
inflammation or tissue damage where it can enhance the vascular permeability
(Dix et al., 1999). The role of PGE2 in glioma tolerance has not been clarified yet
and further characterizations are needed. In fact, PGE2 can be associated with the
suppression of T-cell function and is synthesized by glioma (Dix et al., 1999).
However, the concentration of PGE2 observed in glioma-cell supernatant is not
comparable to the concentration required to inhibit T-cell proliferation (reviewed
in Okada et al., 2009). Glioma cells synthesize and secrete IL-10; mRNA levels of
IL-10 are higher in high-grade astrocytoma rather than in low-grade astrocytoma
(reviewed in Dix et al., 1999). IL-10 also has been shown to reduce the antigen
presentation capacity of monocytes by down regulating MHC class II expression
(Dix et al., 1999).
With respect to the cell surface molecules expressed on glioma cells, FasL
has been proposed to contribute to tumour immune escape. FasL belongs to the
Tumour Necrosis Factor (TNF) family and it is expressed on glioma cells in vivo
and in vitro (Walker et al., 2009). Its receptor is Fas. The interaction of the latter,
expressed on Fas-positive cells, with FasL, leads to a complex cascade of
intracellular events ending with cell apoptosis (Okada et al., 2009). The
expression of FasL on glioma cells can induce apoptosis of Fas-positive T-cells
that infiltrate into the tumour tissue (Okada et al., 2009). The microenvironment
can influence the consequences of FasL expression by tumour cells: it has been
hypothesized that tumours expressing both FasL and TGF-β2 may be particularly
advantaged to overwhelm the action of CD8 T-cells (Walker et al., 2002). Other
two cell surface molecules proposed to facilitate glioma immune escape are
CD70, a member of the TNF family, and Human Leukocyte antigen (HLA)-G, a
non classical MHC class I molecule (Okada et al., 2009).
Immunosuppressive cells play an important physiological role in
regulating autoimmunity and controlling inflammation. In some cases, they can be
recruited or activated by factors produced by tumour cells, promoting tumour
escape (Walker et al., 2009). Treg cells represent a subpopulation of CD4 T-cells
and are the most studied immunosuppressive cells in cancer research (Cao, 2009).
A large numbers of Treg cells have been found either in circulation or in the
tumour micro-environment of patients with various cancers, such as lung, breast,
gastric, colorectal cancer and melanoma (reviewed in Cao, 2009). Also in patients
with malignant glioma, the Treg fraction is greatly increased (Fecci et al., 2006).
Two populations of Treg exist: natural Treg (nTreg) are produced in the thymus,

26
whereas induced Treg (iTreg) derive from CD4 naïve T cells which differentiate
under the influence of certain cytokines, in particular IL-2 and TGF-β (Walker et
al., 2009). nTreg normally migrate to the periphery and account for 10-15% of
CD4+ lymphocytes (Cao, 2009). Distinguishing the functions of these two
populations and their relative contribution to the comprehensive action of Treg in
humans and in experimental animals is challenging (Cao, 2009). FoxP3+ is a
useful Treg marker. It is a transcription factor and therefore it is inaccessible to
antibodies in vivo, largely used for depletion in experimental studies with mouse
models (Walker et al., 2009). The function of Treg in immune homeostasis is
exemplified by the immunodysregulation polyendocrinopathy enteropathy X-
linked (IPEX) human disease. IPEX is caused by mutations in the gene FOXP3;
as a result, the product of this gene is non-functional and this results in
autoimmunity and inflammation. The mouse genetic equivalent for this disease is
the so-called Scurfy mouse. The impact of FOXP3+ mutation either in humans or
in mice underlines the critical role of the transcriptional factor Foxp3 in
controlling autoimmune and immunopathologic responses (Walker et al., 2009). It
is likely that Treg cells utilise multiple mechanisms to suppress protective tumour
immunity. The first mechanism considered is the secretion of inhibitory cytokines,
in particular IL-10, TGF-β and IL-35 (Cao et al., 2009). Diverse studies have been
performed to better understand the role of these cytokines, either in vivo or in
vitro. Previously in this section, the role of IL-10 and TGF-β, also produced by
glioma cells, has been explained. IL-35 has been recently investigated in immune
suppression. The role of this cytokine in Treg function in the tumour setting has not
been reported (Cao, 2009) and human studies demonstrated that Treg cells do not
express IL-35 constitutively (reviewed in Cao, 2009). A second mechanism of
action of Treg cells is the use of perforin/granzyme-mediated cytotoxicity. This
pathway is known to be utilized by CD8+ T cells and NK cells to kill host cells
infected by pathogens or transformed tumour cells. In addition to these two
mechanisms, Treg cells may also suppress immune responses by modulating APC.
In a transgenic EAE model, it has been reported that the presence of Treg
attenuates the establishment of stable contacts between effector T cells and DCs
during T cell priming in the lymph nodes (reviewed in Cao 2009). Another type of
immunosuppressive cell which is considered to have a role in glioma escape is the
myeloid derived suppressor cell (MDSC). Also mesenchymal stem cells, a
phenotypically heterogeneous cell population, are immune suppressive cells.
Normally, they have anti-inflammatory or anti-proliferative effects on immune
cells, but they increase glioma proliferation (Walker et al., 2009).

27
Figure 4: Different mechanisms of glioma immune escape. Passive and active tumour immune
escape mechanisms are shown in this figure. Glioma cell down regulates MHC class I molecules
expression. Furthermore, FasL is present on cell surface. Hypoxia in tumour microenvironment
contributes to suppress normal functions of immune cells. Glioma cell actively secretes soluble
immunosuppressive factors (TGF-β, IL-10 and PGE2 are represented). Immunosuppressive Treg
cells also play an important role in glioma immune escape. Their functions are briefly illustrated in
the figure.
1.3.5. Impaired immune function in glioma patients
Immunosuppression is frequently associated with malignancy. In glioma
patients, although the tumour remains in the intracranial compartment,
immunosuppression is both systemic and profound (Fecci et al., 2006). As
previously discussed, glioma can adopt different mechanisms to escape immune
system responses and to influence the normal activity of immune cells.
Proliferative hyporesponsiveness of peripheral blood T cells in response to
mitogen stimulation in vitro was shown in glioma patients (reviewed in Waziri,
2010). The decrease in responsiveness is variable; tumour size and not location
influences the observed amount of immunosuppression (Morford et al., 1997).
Additionally, reduced secretion of IL-2 and the presence of defective IL-2
receptor (IL-2R) on T cells characterised glioma patients (Dix et al., 1999).
Specifically, proliferative dysfunction is manifested within the CD4+ T-cell subset
(reviewed in Fecci et al., 2006). T cell abnormalities are temporarily reversed with
tumour resection and return with tumour recurrence, potentially confirming an
association between tumour and the suppressive phenotype (reviewed in Waziri,
2010). Severe T cell lymphopenia is another frequently observed defect in patients

28
bearing glioma (reviewed in Dix et al., 1999). Lymphopenia involves T cells,
whereas B cells percentage and absolute number in the peripheral blood of
patients are normal (reviewed in Dix et al., 1999). With respect to the percentages
of T cells, the number of CD4+ T cells obtained from patients is reduced in
comparison to the number of CD8+ T cells. The normal CD4/CD8 T cells ratio is
consequently shifted, resulting closer to 1, rather than the usual 2:1 (reviewed in
Waziri, 2010). Treg frequently represents an important fraction in the CD4
compartment (Fecci et al., 2006). Furthermore, cytokine production is aberrant.
Th2 cytokine production in glioma patients is usually at higher levels than the
production of Th1 cytokines (Fecci et al., 2006). Th1 CD4 T cells mediate immune
responses against intracellular pathogens, and they produce INF-γ, IL-2 and
lymphotoxin α (LTα). Th2 cells mediate immune responses against parasites and
are involved in allergy and asthma; they secrete IL-4, IL-5, IL-13, IL-25 and IL-
10 (Parham, The immune system, 2009). Another hallmark of glioma patients is
diminished delayed type hypersensitivity (Walker et al., 2002). Moreover, in
glioma patients Treg negatively regulates cellular immunity. In peripheral blood,
Treg fraction is increased and it correlates with T cell proliferative defects.
Although the mass of information on immune function in patients strongly
supports the idea of immune impairment, there are certain issues that remain. In
general, the studies on glioma patients peripheral immune status did not report
and did not take into account the treatment they were receiving, which interferes
with immune cell functionality and viability. Furthermore, all data refer to later
stages of the disease, corresponding to the symptomatic phase when patients are
studied, and give no information on the origin of glioma systemic
immunosuppression. Many tests are in vitro, and thus do not necessary
recapitulate in vivo immune function. Additionally, the studies are limited to
blood samples, because tissues such as spleen or lymphoid tissues are not readily
available in patients.
1.3.6. Glioma antigens and immunotherapy
Immunotherapy aims to induce antitumour immune response leading to the
eradication of malignant cells (Grauer et al., 2009). The understanding of the
particular circumstances required and the identification of the immune cells that
are able to perform it are essential in developing efficient strategies for cancer
therapy (Walker et al., 2009).
In order to obtain efficient and safe immunotherapy, immune cells have to
identify correctly and specifically tumour-associated antigens (TAAs) (Prins et
al., 2004). Evidently, an ideal target for immunotherapy is an antigen that is

29
specifically and stably expressed by the tumour and absent in normal tissues
(Grauer et al., 2009). Importantly, TAAs used in immunotherapy have to be
immunogens, namely they induce immune responses. Advances in molecular
genetics and immunology have enabled the identification of several human glioma
antigens (Prins et al., 2004). One of the most intensely studied tumour-specific
antigens expressed by human glioma is EGFRvIII (Kanu et al., 2009), expression
of which is derived from the oncogenic transformation process. Three principal
diverse approaches of immunotherapy can be investigated: passive, active and
adoptive (Grauer et al., 2009).
Passive immunotherapy consists of using a variety of effective molecules,
including monoclonal antibodies (Okada et al., 2009). Specific monoclonal
antibodies can be conjugated with radionucleotides and recognise TAAs (Okada
et al., 2009). Notably, with respect to brain tumour, antibodies have the
disadvantage to be quite limited in penetrating into the tumour tissue (Grauer et
al., 2009).
Active immunotherapy, which can also be defined as tumour vaccination,
is an active immunization of patients with the aim to induce potent antitumour
responses in vivo. In order to induce specific T cell responses, peptide vaccines or
recombinant bacterial or viral vaccines can be used (Walker et al., 2009). To
obtain reproducible, effective, long lasting anti-tumour response, the utilisation of
adjuvants is required. Adjuvants enhance the immune response by prolonging the
time of exposure to antigen and by increasing the activity of APCs (Walker et al.,
2009).
Adoptive immunotherapy consists of adoptive transfer of effector T cells
harvested from patients, activated and expanded in vitro. Using this technique,
optimal conditions for the culture and amplification of these cells is provided, in
absence of tumour-derived immunosuppressive factors (Grauer et al., 2009).
1.4. MOUSE MODELS TO STUDY BRAIN TUMOURS
1.4.1. Animal models in tumour immunology
Brain tumour models, reflecting different characteristics of human glioma,
are relevant for the evaluation of new potential therapies. They also represent an
essential tool for understanding complex molecular pathways occurring in brain
tumours. The features of a robust glioma model include (1) tumours arise from
glial cells, (2) similar molecular pathogenesis and similar molecular profiles to
human glioma, (3) responsiveness to known therapeutics, (4) predictable
development of tumours at a high incidence (Munoz et al., 2009). Importantly,
30
focusing on glioma progression and its interactions with the immune system, the
use of models allows the study of the tumour even at early stages. In contrast,
patients cannot be studied until the clinical diagnosis, which is usually made
during the later stages of the disease. Furthermore, there are several problems and
limitations in studying the immunology of glioma in patients, because they are
usually undergoing a specific treatment which interferes with immune responses.
Also tissues such as human brain or lymphoid tissue are not readily available.
1.4.2. Murine models of glioma
Different kinds of murine models can be utilised in brain tumour
immunology; in particular, grafted models and genetically engineered mouse
models (GEM) are described in this section. Human glioma xenografted into
immunodeficient mice, although commonly used, will not be considered here
because they exclude the study of physiological immune interactions. In contrast,
in fully syngeneic grafted mouse models and in GEMs, interactions between
tumour and immune system can be studied. The most appropriate model to use
has to be chosen according to the questions the specific research addresses.
In grafted models, cell lines from individuals of the same strain are
implanted by intra-cerebral injection. This kind of model has predictable features
and kinetics, but it does not mimic tumour heterogeneity, the hallmark feature in
glioma. In grafted models, tumour is usually homogeneous and has not
accumulated multiple genetic defects as happens in humans. Furthermore, the
implantation of tumour is an artificial process and influences several in vivo
parameters. In fact, the injection itself can affect the integrity of the BBB and
immune responses may not occur as gradually as in the spontaneous pathology.
Genetically engineered glioma mouse models have been created
introducing some of the same genetic abnormalities seen in humans. They can be
generated by introducing germ-line or somatic modifications (de Vries et al.,
2009). Germ-line models, in particular, give the possibility to obtain spontaneous
tumours. They are based on loss or increased expression of relevant genes
implicated in human glioma pathogenesis and they also provide a unique
opportunity to examine pathological alterations associated with tumour
development (Shannon et al., 2005). In these models the integrity of brain and of
the BBB is only disrupted subsequent to tumorigenesis.

31
1.4.3. RasB8 glioma model
GFAP-V12
HA-ras B8 (referred to hereafter as RasB8) is a germ-line
genetically engineered astrocytoma mouse model. In this thesis, we utilised two
different genetic backgrounds of the strain: RasB8-CD1 and RasB8-129 (see
section 2.1.1.). RasB8 model is characterised by the presence of the transgene V12
HA-ras:IRES-LacZ, the expression of which is regulated by the astrocytes-
specific glial fibrillary acid protein (GFAP) promoter (Ding et al., 2001).
Figure 5: The transgenic construct in RasB8 mice (adapted from Ding et al., 2001). The
specific GFAP promoter drives the expression of 12V HA-ras gene. IRES-LacZ (which encodes
for β-galactoside protein) is also under the control of the same promoter.
The technique to obtain RasB8 mice used the transfection of a retrovirus,
which carries the gene of interest and a selection marker, into cultured mouse
embryonic stem (ES) cells. After positive selection, cells undergo aggregation and
are transferred to a pseudo-pregnant female mouse to create chimeric embryos.
The chimeric mice are then bred to normal mice and mice which incorporated the
transgene in their germ-line generate transgenic offspring (Munoz et al., 2009).
The overexpression of V12 HA-ras gene, although not a primary molecular
aberration of human astrocytoma, can initiate the sequence of genetic events that
lead to the development of astrocytoma in mice (Munoz et al., 2009). It was also
demonstrated that astrocytoma formation is dependent on V12 HA-ras gene dosage
(Ding et al., 2001). There is evidence that RasB8 mice exhibit similarities in
pathological and molecular progression features to human astrocytoma (Shannon
et al., 2005; Ding et al., 2001). In fact, the mouse astrocytoma is composed of
GFAP-positive, highly mitotic, pleomorphic and infiltrative astrocytes, also
associated with increased vascularity and necrosis (Ding et al., 2001). Besides,
several genetic alterations associated with human low- and high- grade
astrocytoma are noted in this mouse model. They present gain-of-function
mutations as evidenced by increased expression of EGFR and VEGFR, as well as

32
loss-of-function alterations, including changes in Tp53 expression or TP53
mutations (Shannon et al., 2005).
The development and the progression of astrocytoma in RasB8 model are
heterogeneous in frequency, latency, growth and location; this heterogeneity is
reminiscent of human tumour heterogeneity. RasB8 tumour progression was
examined by Shannon and colleagues (2005). At birth RasB8 transgenic mice
appear normal and astrocytes are not transformed. Glial hyperplasia is the first
distinguishing feature in 3-week-old mice. From 3 to 8 weeks, the incidence of
low-grade astrocytoma progressively increased. 80% of 12-week-old mice
harbour low- or high- grade astrocytoma, 50% of mice die by 4 months.
Figure 6: Astrocytoma progression in RasB8 mice (adapted from Shannon et al., 2005). The
development of the pathology is analysed at different time points. Glial hyperplasia is observed in
the majority of the 4 week-old mice; low-grade astrocytoma progression is gradual. High-grade
astrocytoma is found in 30% of the 12 week-old mice.
1.5. AIM OF THE PROJECT
Glioma is one of the most aggressive and deadliest brain tumours.
Different new therapeutic approaches have led to an improvement in survival, but
prognosis still remains poor. This study focuses on glioma immunology. Different
studies demonstrated immunosuppression in patients, both at the local and at the
peripheral level. However, as discussed, whether this occurs at early stages of
disease, and whether it is independent of treatment status is unclear. In this
project, we used a spontaneous astrocytoma mouse model, RasB8, in order to
investigate peripheral immune status.

33
Three principal issues were addressed in this thesis:
1) Do RasB8 mice display an altered peripheral immune phenotype and is this
reflected in the CD4/CD8 T cell ratio?
2) Do RasB8 T cells show impaired functional responses once removed from the
potentially immunosuppressive in vivo environment (i.e. in vitro)?
3) Are RasB8 T cells able to exhibit functional responses in vivo, after
vaccination?

34
2. MATERIALS AND METHODS
2.1. MICE
2.1.1. Strains and breeding
Hemizygous transgenic GFAP-V12 HA-ras B8 (RasB8) mice (kindly
supplied by Dr A. Guha), expressing a single allele of oncogenic V12 HA-ras,
were used. The strain was previously described (section 1.4.3). Other two mouse
model strains used in this study are 129 S2/SvPasCr1 (MHC haplotype H2b)
inbred strain (Charles Rivers) and C57BL/6 (MHC haplotype H2b) inbred strain
(Charles Rivers). Also outbred mouse strain CD1 (Charles Rivers) was bred at our
institution. RasB8 mice were maintained on the CD1 background (hereafter
RasB8-CD1); S2/SvPasCr1 mice were back-crossed with RasB8 mice and mice
from seventh to tenth generation were utilised in this study. Both RasB8-CD1 and
129 S2/SvPasCr1xRasB8 (hereafter RasB8-129) mice were screened for the
presence of the oncogene V12 HA-ras. Mice were sacrificed by isoflurane
inhalation. All procedures adopted were approved by the Institutional Ethical
Committee and the Cantonal Veterinary Office (Suisse).
RasB8-CD1 and RasB8-129 mice were followed weekly for the
development of symptoms. They were considered ill when exhibit more than one
of the following symptoms: loss of weight, ruffled fur, debility, irregular
breathing, convulsions, difficulty of movement, hunched posture.
2.1.2. Polymerase Chain Reaction: general principles
The Polymerase Chain Reaction (PCR) is a molecular biology technique
which permits the amplification of a precise fragment of DNA called “target
DNA” starting from DNA termed “template DNA”. The enzyme which catalyses
this reaction is a thermostable DNA polymerase, isolated from the Gram- bacteria
Thermus aquaticus. Oligonucleotides complementary to the sequences which
flank the target DNA are required as primers to specifically direct the polymerase
to copy the sequence of interest. Primers provide a free 3'-hydroxyl group. In the
reaction mix, deoxyribonucleotides (dNTPs) are also needed. PCR is based on
thermal cycling and is divided in different stages: denaturation, annealing and
extension. Each step is repeated from 30 to 40 times. In the first stage, the
template DNA is denaturated by heating above 90°C. The two strands of DNA
separate and the target DNA is made accessible. During the annealing stage the
temperature is cooled to around 60°C. During this step, oligonucleotide primers

35
hybridise with their complementary sites. The DNA synthesis step is termed
extension. During this stage, polymerase extends the target sequences. The
temperature required for the extension corresponds to the optimum temperature of
the enzyme used (commonly around 72°C). After one cycle of PCR, new strands
are synthesised and they become templates during the next cycle of the reaction.
In this way, PCR provides an exponential increase in the amount of DNA
produced. Furthermore, all new strands have a precise length, because polymerase
amplifies the target DNA and the regions flanking it. After the reaction, the
amplified DNA fragments can be visualised on an agarose gel. The specificity of
this technique depends on the design of the two oligonucleotide primers. The
sensitivity of PCR is very high, foreign DNA contamination has to be avoided
using dedicated equipment.
2.1.3. Genotyping
DNA extraction was performed on crude lysate of mice tails. After 5%
isoflurane (Abbott, Baar, Switzerland) inhalation anaesthesia, 0.5 cm of tail was
cut. DNA digestion was performed with 200 μl tail lysis reagent (PeqLab Direct
PCR) containing 0.3 mg/ml proteinase K (Roche). A 55°C overnight incubation, a
45 minutes 85°C final incubation were performed. Lysates were directly used for
PCR reaction or stored at -20°C. PCR amplification used a forward primer located
in the GFAP promoter (5'-ACTCCTTCATAAAGCCCTCG-3') and a reverse
primer located in the 3' region of the HA-ras cDNA (5'-
CTCGAATTCTCAGGAGAGCACACACTT-3') and was controlled by a PCR
amplification of β-actin, using the following primers (all primers from Sigma):
forward 5'-GCCAACCGTGAAAAGATGAC-3' and reverse 5'-
GACCAGAGGCATACAGGGACAG-3'. Primers were used at 333 nM
concentration. Both PCR were performed in the same 25 μl mix (12.5 μl REdTaq
Ready Mix Sigma, 8.5 μl distillated H2O, primers, 2 μl template DNA). PCR of
35 cycles with denaturation at 94°C for 1 minute, annealing at 61°C for 1 minute
and extension at 72°C for 1 minute (and with initial denaturation at 94°C for 5
minutes and final extension at 72°C for 5 minutes) was performed in GTC thermal
cycler (Cleaver Scientific). Amplified DNA fragments were loaded on a 1%
agarose (Sigma) gel prepared in 100 ml TBE buffer 1x with 4 µl Sybrsafe (SYBR,
safe DNA gel stain 10,000x concentrated in DMSO, Invitrogen). One hour DNA
electrophoresis at 85 V in TBE 1x was performed. The SMARTLADDER SF
(Eurogentec) marker ladder was used to determine the length of the fragments
amplified.

36
Figure 7: Example of DNA genotyping. In this figure, an example of PCR agarose gel used to
discriminate transgenic RasB8 and non transgenic mice is shown. On the left of the picture, the
molecular weight marker ladder is observed; band size displayed refers to base-pair (bp). The
house keeping gene used is β-actin, corresponding to the 700 bp bands. It is present in all samples,
with the exception of negative controls (first and last column), in which distillated water was
added to PCR reaction mix, instead of DNA. 800 bp bands correspond to the transgene; hence,
samples which show two bands are RasB8 transgenic mice. In non transgenic mice, only the β-
actin band is visible.
2.2. FLOW CYTOMETRY
2.2.1. General principles of immunofluorescence
Immunofluorescence is a technique that permits to visualise cellular
antigens by using fluorescent molecules (fluorochromes) conjugated to specific
monoclonal antibodies. Fluorochromes, if excited at their excitation wavelength,
are able to emit light at their emission wavelength. Two different kinds of
immunofluorescence staining exist: direct and indirect. The direct
immunofluorescence technique uses antibodies directly conjugated to a
fluorochrome (primary antibody). The indirect technique uses one primary non-
labelled antibody and a second antibody conjugated with a fluorochrome
(secondary antibody). Indirect immunofluorescence can also utilise a tertiary
fluorochrome-conjugated antibody if the secondary is not-labelled, or can adopt
an antibody biotin-conjugated. For the latter case, streptavidin (SA)-conjugated
fluorochrome is required.
Antibody Fluorochrome Emission
peak (nm)
Clone Company
CD4 PE 575 GK 1.5 BD Bioscences
CD4 APC/ Cy 7 774 GK 1.5 Biolegend
CD8 APC 660 53-6.7 BD Bioscences
CD8 APC/ Cy 7 774 53-6.7 BD Bioscences
Ly-6C* SA-PerCP/Cy5.5 690 HK 1.4 Biolegend

37
CD11b PE/ Cy 7 774 M1/70 BD Bioscences
B220 APC 660 RA3-6B2 BD Bioscences
CD44° FITC 525 IM7 BD Bioscences
CD62L PE 575 Mel-14 ImmunoKontact
INF-γ PE/ Cy 7 774 XMG 1.2 Biolegend
Table 2: Antibodies. In the table, antibodies used in this experimental work are shown with
emission peak of their conjugated fluorochromes. (*) this antibody was biotinilated. All antibodies
were from rat, except (°) from mouse.
If the amount of antibody used is appropriate to saturate all antigenic sites
on cells, the amount of the emission light is proportional to the number of target
molecules stained. The correct antibody concentration is determinated by titration.
As negative control, staining is performed with an antibody of the same isotype,
but which is of irrelevant specificity. Usually, the staining with the isotype is
compared to the staining with the antibody, to detect the real expression of the
antigen of interest.
Isotypes Fluorochrome Correspondent
antibody
Clone Company
IgG2b PE CD4 A95-1 BD Bioscences
IgG2a FITC GR1 R 35-95 BD Bioscences
IgG2a APC B220 RTK 2758 Biolegend
IgG2a APC/ Cy 7 CD8 10 797 BD Bioscences
IgG2c*° SA-PerCP/Cy5.5 Ly-6C RTK 4174 Biolegend
IgG2b PE/ Cy 7 CD11b A95-1 BD bioscences
IgG1 PE/ Cy 7 INF-γ MOPC-21 BD bioscences
Table 3: Isotypes. In the table, control isotypes used in this experimental work are displayed. The
correspondent antibodies are also shown. (*) this antibody was biotinilated. All antibodies were
from rat, except (°) from mouse.
If intracellular staining is required, it is performed after the surface
staining. For intracellular staining, cells are fixed and secretion of molecules such
as interferon and chemokines is usually inhibited using monensin, an antibiotic
which blocks intracellular protein transport. Importantly, cell permeabilization is
required to permit antibody penetration into the cells. Antibodies have to be
prepared in permeabilization buffer to ensure the cells remains permeable.

38
2.2.2. Principles of flow cytometry
Flow cytometry is a technique which detects several parameters of a cell
population after immunofluorescence staining. In this experimental study, cells
were analysed using GalliosTM (Beckman Coulter) flow cytometer and results were
processed with Flowjo 7.2.5 software (Treestar Inc.) or with Kaluza Flow
Cytometry analysis 1.0 software (Beckman Coulter).
Flow cytometer permits to measure individual cell fluorescence and to
acquire data from thousands of cells per second. The instrument is composed of
different parts: fluidics, optics, electronics and computer. Samples are injected
into a sheath flow and each cell is forced to pass through different laser beams
that have passed through optical filters. Once fluorochromes are excited, the
emission light is direct to optical detectors (in this work, named FL). The
electronic system is constituted by photomultiplier tubes that convert the
incidence light into electronic pulses. The signal is finally amplified and digitized
for computer analysis. Flow cytometers can be equipped with more than two
lasers; consequently, several fluorochromes are used at the same time to obtain
diverse cell parameters from one sample. Importantly, most fluorochromes do not
have a tight emission spectrum, thus compensation is needed to correct overlaps
in the emission spectra. Compensation is usually established by software
programs.
Data acquired by the flow cytometer are displayed in different types of
graph, which can show one or two parameters at the same time. Usually, a
logarithmic scale is adopted and the unit of measure corresponds to the voltage
generated in the photomultiplier tube by light emitted from excited cells. Graphs
which show two parameters simultaneously are utilised to identify cell
subpopulations. In particular, in dot plot graphs, each dot plot represents a single
cell. To initially identify the cell subpopulation investigated and to gate one
specific subset, the dot plot with forward scatter (FS) on x-axis and side scatter
(SS) on y-axis is visualised. FS correlates with size of cells, SS with cellular
granularity. Double-positive cell dots are situated in the upper right region of the
plot, whereas double negative dots on the lower left region. Single positive for the
parameter on x-axis are situated in lower right region, for the parameter on y-axis
in the upper left region. Other kind of two parameter graphs can be used, such as
Density, Pseudocolour, Zebra and Contour plots according to the analysis to
perform. Another type of graph is histogram which measures only one parameter
on x-axis and the respective count of cells on y-axis. Stainings with the same
fluorochrome from the same or from different samples can be overlayed on this
kind of graph.

39
Figure 8: Dot plot and histogram. A) Example of dot plot graph in which SS and FS scatter is
shown. Gating on different populations is possible, according to size and granularity. B) and C)
Examples of histogram. Two distinct populations are represented in both graphs: the population
with higher fluorescence is CD8 positive and it is represented by the peak on the right.
2.2.3. Surface staining protocol
Mice were killed with isoflurane inhalation. The two groups of mice
sacrificed for both Carboxyfluorescein diacetate succinimidyl ester (CFSE)
proliferation assay and for spleen and LN cells staining were transcardially
perfused with Ringer’s solution for 15 minutes. The perfusion was performed in
order to remove blood cells from the brain vasculature. Brains were frozen in
isopentane chilled in liquid nitrogen and kept at -80°C. For further analysis, brains
can be cut at the microtome and sections analyse by immunohistochemistry at the
microscope. Bilateral inguinal lymph nodes and spleen were taken. Cells from
spleen and LN were dissociated by forcing through 70 μm sterile cell strainer (BD
Falcon) using HBSS (Hanks Balanced Salt Solution 1x) containing 5% of
complement-inactivated FCS (Fetal Calf Serum, Invitrogen). They were
centrifuged at 1300 rpm for 5 minutes, the supernatant was discarded. Red blood
cells in spleen were lysed with 3 ml ACK (lysing buffer), resuspended in 12 ml
HBSS 10% FCS and centrifuged. LN and spleen cells were resuspended in 5 ml
and in 10 ml HBSS 5% FCS respectively. Live cells were discriminated by
exclusion of Trypan Blue dye and they were counted with improved Neubauer
counting chamber. Cells were used for this protocol and also for the CFSE
proliferation assay (section 2.3.2.). They transferred to conical 3 ml tubes (106
cells/ tube). They were washed with FACS® FWB (flow cytometer wash buffer),
centrifuged and supernatant discarded. Cells were resuspended in 15 μl Fc-block
(antibody which binds Fc-receptors, to prevent nonspecific bidings of monoclonal
antibodies). Cell were then incubated at 4°C for 10 minutes. 15 μl of antibody mix
was then added, cells were incubated 4°C for 20 minutes. Cells were washed with
FWB, centrifuged and supernatant was discarded. 30 μl of secondary antibody

40
mix was added if necessary, cells were incubated 20 minutes at 4°C. Two
repeated washes with FWB were finally performed. Cells were resuspended in
300 μl FWB and transferred into round-bottom tubes, read on a Gallios flow
cytometer or kept at 4°C until their analysis.
2.2.4. Intracellular staining protocol
After surface staining, an intracellular staining to analyse the INF-γ
production was performed in the experiment discussed in section 2.4. The BD
Cytofix/CytopermTM
Plus Fixation/Permeabilization kit was used. Supernatant was
discarded and pellet was resuspended in 250 μl BD Fix/Perm solution. Cells were
incubated 4°C for 20 minutes. Cells were then washed twice with 1 ml 1x BD
Perm/Wash Buffer, centrifuged and supernatant was then discarded. Pellet was
resuspended in 50 μl of intracellular antibody prepared in BD Perm/Wash Buffer,
samples were incubated 30 minutes at 4°C. Cells were then washed twice with 1
ml 1x BD Fix/Perm solution, centrifuged and supernatant was discarded. Cells
were then resuspended in 200 μl FWB and transferred into round-bottom tubes,
read on a Gallios flow cytometer or kept at 4°C until their analysis.
2.2.5. Determination of cell numbers and viability by Trypan Blue exclusion
Trypan blue is a vital stain used to discriminate live cells from dead ones.
Live cells with intact cell membrane are not coloured and are bright, whereas the
stain traverses the damaged membranes of dead cells and they appear blue at the
microscope. Trypan Blue exclusion was adopted to identify live cells and cell
counting was performed using improved NeuBauer counting chamber.
2.3. CFSE PROLIFERATION ASSAY
2.3.1. General principles of the technique
CFSE has the ability to passively diffuse into cells, owing to the presence
of two acetate groups that make the compound highly membrane permeable. Once
inside the cell, the acetate groups are removed by intracellular esterases; the
compound become fluorescent and it is trapped inside the cell owing to reduced
membrane permeability. CFSE is not transferred to adjacent cells. The staining
persists in daughter cells and the fluorescence is diluted at each division.
Approximately 8 cell divisions can be identified before the CFSE fluorescence is
too low for detection. In this experiment, proliferative ability of splenocytes from

41
RasB8 transgenic and non-transgenic mice was tested. Cells were labeled with
CFSE and then were cultured with Concanavalin A (ConA) a T lymphocyte
mitogen extracted from the jack-bean Canavalia ensiformis. ConA was used to
non-specifically stimulate the proliferation of CFSE-labeled lymphocytes.
Figure 9: CFSE fluorescence is diluted at each cell division. In this figure, the principles of
CFSE proliferation assay are illustrated. At each cell division, CFSE fluorescence is diluted to
daughter cells. In this case, four cell divisions are shown and labeled with numbers from 0 to 4.
Cells which divided more are represented in yellow in the cartoon above; in the histogram, they
are represented by the less fluorescent peak.

42
2.3.2. CFSE proliferation assay protocol
As described in section 2.2.3, cells were counted for this experiment and
for spleen and LN staining. 2x10⁷ spleen cells were harvested in a 15 ml falcon
tube and washed twice with RPMI 1640 (Roswell Park Memorial Institute
medium 1640 1x) without FCS. Then they were resuspended in 1 ml RPMI 0%
FCS containing CFSE (Molecular Probes) 5 μM. They were incubated 10 minutes
at 37°C 8% CO2 and shaken once after 5 minutes. Then they were washed twice
with RPMI 10% FCS and resuspended in 5 ml T cell medium. Then cell
concentration was adjusted to 1.33x10⁶ cell/ml. Then they were plated in a 96-
well plate (150 μl/ well). 50 μl of medium containing Concanavalin A (Sigma)
was added to the wells to obtain two different final concentrations (2.5 μg/ml or
0.5 μg/ml). The cells were incubated at 37°C 8% CO2 for 4 days. The cells were
harvested and transferred to 96-well plates with conical wells. They were
centrifuged at 1000 rpm for 5 minutes and then washed with FWB. After
discarding supernatant, cell were resuspended in 15 μl Fc-block and incubated for
10 minutes at 4°C. Then 15 μl of antibody mix was added, cells were incubated
4°C for 20 minutes. The cells were washed twice with FWB, lastly resuspended in
200 μl FWB and transferred into round-bottom tubes. They were read on a
GalliosTM (Beckman Coulter) flow cytometer. Every sample was analyzed in
quadruplicate. CD4-PE and CD8-APC antibodies were used.
2.3.2. Data analysis
Using Flowjo 7.2.5 software, the percentages of divided T cells after ConA
stimulation were counted. Cells were gated on live lymphocytes according to size
and granularity. In figure 10 are shown two different representative examples of
graphs used to calculate the number of divided and not divided cells.

43
Figure 10: CFSE proliferation data analysis. Two pseudo colour graphs representative of CFSE
proliferation assay data analysis. In FL1, CFSE fluorescence is displayed, whereas in FL6 and in
FL2 fluorescence of CD8 and CD4 antibodies respectively are observed. In figure A and B,
proliferation of CD8 and CD4 T respectively is shown after 2.5 μg/ml ConA stimulation. Each cell
population was gated according to the different level of CFSE fluorescence, from R0 to R4.
On the X axis FL1 is displayed, which shows the read out of the CFSE
fluorescence. FL6 and FL2, on the Y axis, correspond to CD8 and CD4 staining,
respectively. Cells were gated in five different groups: R0 (not divided cells) and
R1, R2, R3, R4 (divided cells). Only CD8 or CD4 positive cells were considered
(upper region of the plot). The non divided cells (R0) are on the right side of
graphs and have higher CFSE fluorescence. The cells which have proliferated
more (R4), show decreased CFSE fluorescence (on the left side of the graphs).
The percentage of divided cells was calculated as follow:
Where:
Total dividing cells = R1 + R2 + R3 + R4
Total cells = total dividing cells + R0

44
2.4. DETECTION OF SPECIFIC ANTIGEN RESPONSE
2.4.1. LacZ-recombinant vaccinia virus
Vaccinia virus (VV) was commonly used to vaccinate against smallpox
(caused by variola virus) and it is a useful expression vector. In this experiment,
LacZ-recombinant VV virus (VV-LacZ) (kindly provided by D. Pinschewer,
University of Geneva, Switzerland) was used. LacZ is the gene which encodes for
β-galactosidase (βgal), an enzyme which catalyses the hydrolysis of β-
galactosides into monosaccharides. As previously explained, in the RasB8 mouse
model, transformed astrocytes express this protein under GFAP promoter control
(see figure 5). Thus βgal is considered an antigen specifically expressed on glial
cells and potentially presented on MHC class I. In this experimental work, two
βgal peptides (Biomatik, USA) were used: DAPIYTNV (βgal96-103) and
ICPMYARV (βgal497-504), corresponding to two proposed immunodominant
epitopes able to bind to the MHC class I allele H-2Kb.
2.4.2. Resume of the experiment
In this experiment, RasB8-129 mice were used. The aim of the experiment
was to determine if a tumour Ag-specific T cell response can be detected
peripherally after VV-LacZ vaccination and subsequent in vitro cell stimulation.
The following figure clarifies the experimental procedure:
Mice were sacrificed one week after VV-LacZ vaccination, the expected
peak of immunological response. Ex-vivo staining was performed in order to
verify T cell activation; mice were selected according to the proportion of
activated cells and cell growth observation performed at the microscope.

45
Stimulation of cells was performed with DAPIYTNV and ICPMYARV peptides.
In order to confirm an immunological response against the virus, vaccinia virus
peptide (VV peptide, TSYKFESV, B8R20–27) stimulation was performed. Cells
grown without antigen were used as negative control. Cells were also cultured
with ConA to assess their capacity to proliferate under mitogen non-specific
stimulus. For cell re-stimulation, peptides and irradiated C57BL/6 mice spleen
cells were used. Irradiation was performed to prevent cell proliferation. As
control, irradiated cells were plated and no proliferation was observed. For the
final 6 hour of incubation, before INF-γ staining, ionomycin (iono) (Sigma) and
phorbol 12-myristate 13-acetate (PMA) (Sigma) incubation was performed.
Iono/PMA incubation activates lymphocytes. In particular, ionomycin is an
ionophore produced by the bacterium Streptomyces conglobatus; it raises the
intracellular levels of calcium (Ca2+). PMA is diester of phorbol and activates
protein kinase C (PKC).
2.4.3. Mice vaccination, sacrifice and cell culture
Mice were vaccinated intraperitoneally with 2x10⁶ plaque-forming units
(PFu) of VV-LacZ. After one week, they were sacrificed by isoflurane inhalation.
Spleens were taken and cells were dissociated by forcing through a 70 μm sterile
cell strainer using HBSS containing 5% of complement-inactivated FCS. Cells
were centrifuged at 1300 rpm for 5 minutes, the supernatant was discarded. Red
blood cells were lysed for one minute with 2 ml ACK, then resuspended in 10 ml
HBBS 5% FCS. Cells were then counted. 106 cells were harvested in one conical
tube and used for ex-vivo staining (section 2.4.4.). For each spleen, 5x10⁶
cells/well and 2.5x10⁶ cells/well were plated in 24-well plates at five different
conditions: T cell medium only (final volume of 1 ml), ConA (1 μg/ml), VV
peptide (10 μg/ml), ICPMYARV peptide (10 μg/ml), DAPIYTNV peptide (10
μg/ml). To each well, 30 U/ml of IL-2 were added, in order to stimulate T cells
expansion. Cells were kept on culture at 37°C, 5% CO2 for one week. At day 4,
500 μl of medium were removed and 500 μl of fresh T cell medium supplied with
30 U/ml IL-2 were added.
2.4.4. Ex-vivo staining
Ex-vivo splenocyte staining was performed on day of sacrifice to
determine the activation of CD8+ and CD4
+ T cells one week after VV-LacZ
vaccination, using surface staining. All procedures were performed in a P2
laboratory and cells were fixed after antibody staining using FWB fix buffer

46
(Flow cytometer Wash Buffer with Fixative) for the last two washes. Antibodies
used were: CD4 APC/Cy7, CD8 APC, CD44 FITC and CD62L PE.
2.4.5. Cell re-stimulation
Splenocytes were re-stimulated with the three different peptides previously
mentioned after one week-culture. Re-stimulation was performed using C57BL/6
spleen cells. C57BL/6 mice were sacrificed; spleen cells were taken and counted
as previously described. The cell number required in each well for re-stimulation
was 5x10⁶ cells. Cells were centrifuged and divided in three 15 ml falcon tubes
according to the cell number required. Then they were resuspended in 10 ml T
cell medium. VV, ICPMYARV, DAPIYTNV peptides were added to the tubes at
a final concentration of 10 μg/ml. Cells were then incubated for 90 minutes at
37°C 5% CO2 and then irradiated at 100 Gy. Cells were then washed twice with
HBSS medium 5% FCS. They were finally re-suspended at the required volume
in 90 U/ml IL-2 CTL medium. 500 μl of medium was removed from each culture
well and 500 μl of prepared cell suspension for re-stimulation was then added to
each well. Fresh 90 U/ml IL-2 CTL medium was added to wells not stimulated
with peptides.
2.4.6. INF-γ staining
Seven days after re-stimulation, cells underwent 5-hour peptide or
iono/PMA stimulation before intracellular INF-γ staining. Wells were carefully
washed twice and cells were collected and re-suspended in T cell medium. Cells
which were stimulated with peptides were split in two different tubes to
performed peptide or iono/PMA stimulation. Cells stimulated with ConA were not
analysed, but their growth was observed at the microscope as a positive control.
Cells were centrifuged at 1500 rpm for 6 minutes and supernatant was discarded.
1 ml of T cell medium containing different peptides at the established
concentrations was then added; in iono/PMA stimulation tubes ionomycin was
added at 1 μg/ml and PMA at 100 ng/ml. Cells were incubated for 1 hour at 37°C
5% CO2. BD Golgi Stop™ was then added to each sample (1:1000 diluition) and
then 4 hour incubation was performed. After incubation, surface staining was
performed using the following antibodies: CD8 APC, CD4 PE and CD44 FITC.
Then INF-γ intracellular staining (INF-γ PE/ Cy7) and isotype (IgG1 PE /Cy7)
control staining were performed.

47
2.5. STATISTICAL ANALYSIS
Statistical analyses were performed using Sigma STAT® software. P-
values were considered statistically significant if < 0.05.

48
3. RESULTS
In this experimental work, we investigated the peripheral immune status of
RasB8 astrocytoma mouse model, functionally and phenotypically. We analysed
in vitro responsiveness of T cells to mitogen and we performed surface staining of
splenocytes and LN cells. Furthermore, we analysed peripheral responsiveness to
a tumour-associated antigen. This chapter is divided according to the two different
experimental approaches.
3.1. SPLENOCYTES AND LN ANALYSIS
In this experiment, we used RasB8-CD1 mice. We tested two different
groups of mice with their corresponding control groups. The first group was
constituted by six 4-6 week-old (wo), asymptomatic transgenic mice whereas six
non-transgenic, littermate mice composed the control group. The second group
was formed of six ill, older mice (> 12 weeks old) and its control group by six
non-transgenic, age-matched mice. We performed surface staining of splenocytes
and LN cells and CFSE proliferation assay.
3.1.1. Surface staining of splenocytes and LN cells
We sacrificed mice and we took spleen and inguinal lymph nodes. We
isolated cells and then we lysed red blood cells from spleen. After that, we
performed surface staining to analyse leucocyte subpopulations, using the
following markers: Gr-1, CD4, Ly-6C, CD11b, B220 and CD8.
3.1.2. Quantitative analysis of T and B cells in spleen and LN
We calculated percentages of B cells (B220+), CD4 T cells and CD8 T
cells related to the total live leucocytes in spleen and in lymph nodes. We also
calculated the ratio of CD4/CD8 T cells. With respect to B cells (figure 11A),
there were always higher cell percentages in spleen than in LN (in spleen the
mean of all groups is 42.4 ± 5, in LN 12 ± 2). No significant differences were
observed between groups. CD4 T cells (figure 11C) are more represent in LN than
in spleen. A significant difference was observed only in LN, between ill RasB8
mice and littermate group. As for CD4 T cells, CD8 T cells (figure 11B) are
presented at higher percentages in LN. No significant differences were observed
between groups for both organs. The ratio CD4/CD8 (figure 12) is significantly

49
different between ill RasB8 mice and littermates in LN. In spleen, the
corresponding percentages follow the same trend.
Figure 11: CD4 T cells are significantly diminished in ill RasB8 mice LN. Spleens and LNs
were taken from the indicated groups. Cells were prepared from individual mice; they were surface
stained with antibody to B220 (A), antibody to CD8 (B) and antibody to CD4 (C) and analysed by
flow cytometry. Cell percentages in the leucocyte gate are shown. Group means ± standard
deviation (SD) are displayed. P-value was calculated with unpaired Student t-test.
Figure 12: LN cells of ill RasB8 mice have a decreased CD4/CD8 ratio. Proportions of CD4
and CD8 cells in lymphoid tissues and spleens of the indicate groups of mice were obtained from
flow cytometry analysis and ratios were calculated. Bars indicate means ± SD of mouse groups. P-
value was calculated using an unpaired Student t-test.

50
3.1.3. Memory CD4 and CD8 T cells: Ly-6C marker
We analysed the expression of the Ly-6C marker, proposed to be
associated with memory function, in CD4 and CD8 T cells. We gated cells
according to their positive expression of CD4 or CD8, then we detected
subpopulations expressing high level of the memory marker using histograms. We
analysed cells from both LN and spleen. With respect to CD4+ cells in the LN,
two distinctive cell subpopulations which differently express Ly-6C were not
observed in the majority of samples (data not shown). For this reason, no graph
showing LN CD4+ Ly-6C
high cells are displayed in this section. In all graphs,
100% is equal to the total number of cells in CD4+ or CD8+ population.
There were no significant differences between groups for CD4+ Ly-6Chigh
cells (figure 13). Concerning CD8+ cells, there was a trend towards higher Ly-6C
expression on CD8+ cells in older mice, but this was not statistically significant
(figure 14).
Figure 13: No differences in CD4+ Ly-6C
high splenocyte percentages between RasB8 and
control groups. Cell percentages were obtained from flow cytometry analysis; lymphocytes were
gated according to positive expression of CD4. CD4 T cells from LN are not displayed because a
CD4 positive subpopulation expressing high level of Ly-6C was not detected in all samples.
Means of different groups ± SD are displayed.
0
2
4
6
8
10
12
14
16
18
20
% o
f L
y-6
Ch
igh
C
ELLS
Spleen: CD4+ Ly-6Chigh cells
4-6 wo RasB8
4-6 wo ntg
ill RasB8
ntg littermare

51
Figure 14: A trend towards higher percentages of CD8+ Ly-6Chigh cells is observed in older
rather than in younger mice. Means ± SD of mouse groups are shown. A flow cytometry
analysis was performed; splenocytes and LN cells were gated according to their CD8 positive
expression.
3.1.4. Myeloid-derived suppressor cells
The MDSCs are a group of myeloid cells including precursors of
macrophages, granulocytes, dendritic cells and myeloid cells at earlier stages of
differentiation (Youn et al., 2008).
Figure 15: Myeloid-derived suppressor cells are detected in all mice. Gr-1+ CD11b
+ cells
(MDSCs) were identified by flow cytometry of surface stained splenocytes. Percentages were
calculated in the total large granular cell (FCShigh
SSChigh
) gate. Means of defined groups are
displayed; error bars represent SD.
0
10
20
30
40
50
60
70
80
spleen LN
% o
f L
y-6
Ch
igh
CEL
LS
CD8+ Ly-6Chigh cells
4-6 wo RasB8
4-6 wo ntg
ill RasB8 mice
ntg littermate
0
2
4
6
8
10
% o
f la
rge
gra
nu
lar
ce
lls
Gr-1+ CD11b+ cells
4-6 wo RasB8
4-6 wo ntg
ill RasB8 mice
ntg littermate

52
MDSCs are able to suppress T cell responses and circulating MDSCs are
found to be increased in cancer patients. In mice, they are generally defined as Gr-
1+ CD11b+ cells (Youn et al., 2008). We detected Gr-1+ CD11b+ splenocytes
(figure 15) but there were no significant differences between tumour-bearing, ill
and control mice.
3.1.5. CFSE dilution assay for in vitro T cells proliferative response
To determine the proliferative capability of peripheral T cells, we used a
CFSE proliferation assay. Lymphocytes that were employed for spleen and LN
staining were also utilised in this test. We labelled the cells with CFSE, a
fluorescent compound which is incorporated in cells and is diluted in daughter
cells at each cell division (see section 2.3.1.), and we stimulated the CFSE-
labelled cells in vitro for 4 days with the polyclonal mitogen ConA. We tested two
different concentrations of the mitogen. At day 5, we harvested the cells and
stained them for CD4 and CD8. Percentages of dividing cells were calculated as
explained in section 2.3.3.
3.1.6. Results of proliferation assay
We analysed both CD4 and CD8 T cell response to ConA at low (0.5
µg/ml) and high (2.5 µg/ml) concentration.
Figure 16: ConA dose-dependent proliferation of CD4 and CD8 T cells. Spleen cells from
indicated mouse groups were CFSE labelled and stimulated in vitro for 4 days with low (0.5
µg/ml) and high (2.5 µg/ml) concentration of the mitogen ConA. Dividing cell percentages were
calculated as explained in section 2.3.3. Means SD are shown.
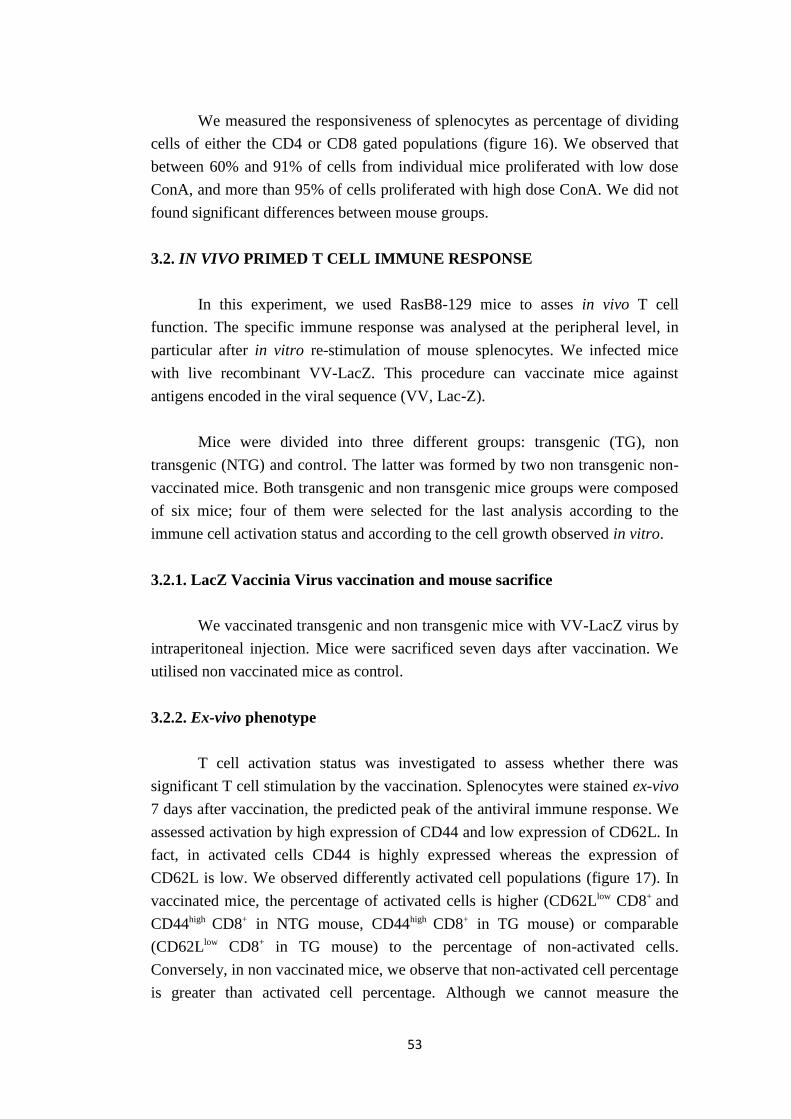
53
We measured the responsiveness of splenocytes as percentage of dividing
cells of either the CD4 or CD8 gated populations (figure 16). We observed that
between 60% and 91% of cells from individual mice proliferated with low dose
ConA, and more than 95% of cells proliferated with high dose ConA. We did not
found significant differences between mouse groups.
3.2. IN VIVO PRIMED T CELL IMMUNE RESPONSE
In this experiment, we used RasB8-129 mice to asses in vivo T cell
function. The specific immune response was analysed at the peripheral level, in
particular after in vitro re-stimulation of mouse splenocytes. We infected mice
with live recombinant VV-LacZ. This procedure can vaccinate mice against
antigens encoded in the viral sequence (VV, Lac-Z).
Mice were divided into three different groups: transgenic (TG), non
transgenic (NTG) and control. The latter was formed by two non transgenic non-
vaccinated mice. Both transgenic and non transgenic mice groups were composed
of six mice; four of them were selected for the last analysis according to the
immune cell activation status and according to the cell growth observed in vitro.
3.2.1. LacZ Vaccinia Virus vaccination and mouse sacrifice
We vaccinated transgenic and non transgenic mice with VV-LacZ virus by
intraperitoneal injection. Mice were sacrificed seven days after vaccination. We
utilised non vaccinated mice as control.
3.2.2. Ex-vivo phenotype
T cell activation status was investigated to assess whether there was
significant T cell stimulation by the vaccination. Splenocytes were stained ex-vivo
7 days after vaccination, the predicted peak of the antiviral immune response. We
assessed activation by high expression of CD44 and low expression of CD62L. In
fact, in activated cells CD44 is highly expressed whereas the expression of
CD62L is low. We observed differently activated cell populations (figure 17). In
vaccinated mice, the percentage of activated cells is higher (CD62Llow CD8+ and
CD44high CD8+ in NTG mouse, CD44high CD8+ in TG mouse) or comparable
(CD62Llow CD8+ in TG mouse) to the percentage of non-activated cells.
Conversely, in non vaccinated mice, we observe that non-activated cell percentage
is greater than activated cell percentage. Although we cannot measure the

54
activation status of splenocytes of the same mice before vaccination, all
vaccinated mice had higher proportions of activated CD8 T cells than the non-
vaccinated controls.

55
Figure 17: Differently activated CD8 T cell subpopulations after VV vaccination. Activation
status of CD8 T cells was tested 7 days after recombinant VV vaccination in transgenic and non
transgenic RasB8 mice. Different dot plots show representative examples of ex-vivo splenocyte
staining. Cell activation was determined using CD44 and CD62L markers. Activated CD8 T cell
subpopulations are highlighted with red rectangle. Non vaccinated mice were used as negative
control.
Furthermore, we used the absolute number of cells to compare activated
cells from different mouse groups. The absolute number was calculated referring
to the amount of cells counted before the surface staining. We gated the cells
according to the positive expression of CD4 or CD8; then we obtained proportions
of these cells which were CD62Llow and CD44high. In figure 18, the number of
activated CD8 T cells is shown. There was a high standard deviation above all for
NTG mouse group. We observed a statistically significant difference only
between the TG and the control group; the high SD in the NTG mouse group may
influence the lack of statistical power for CD8 activated cells. We focused our
attention on CD8+ cells rather than CD4+ cells because the former is the principle
cellular type involved in the specific response we investigated. Moreover, we did
not obtain statistically significant differences in the percentages of activated CD4
cells between groups (data not shown).
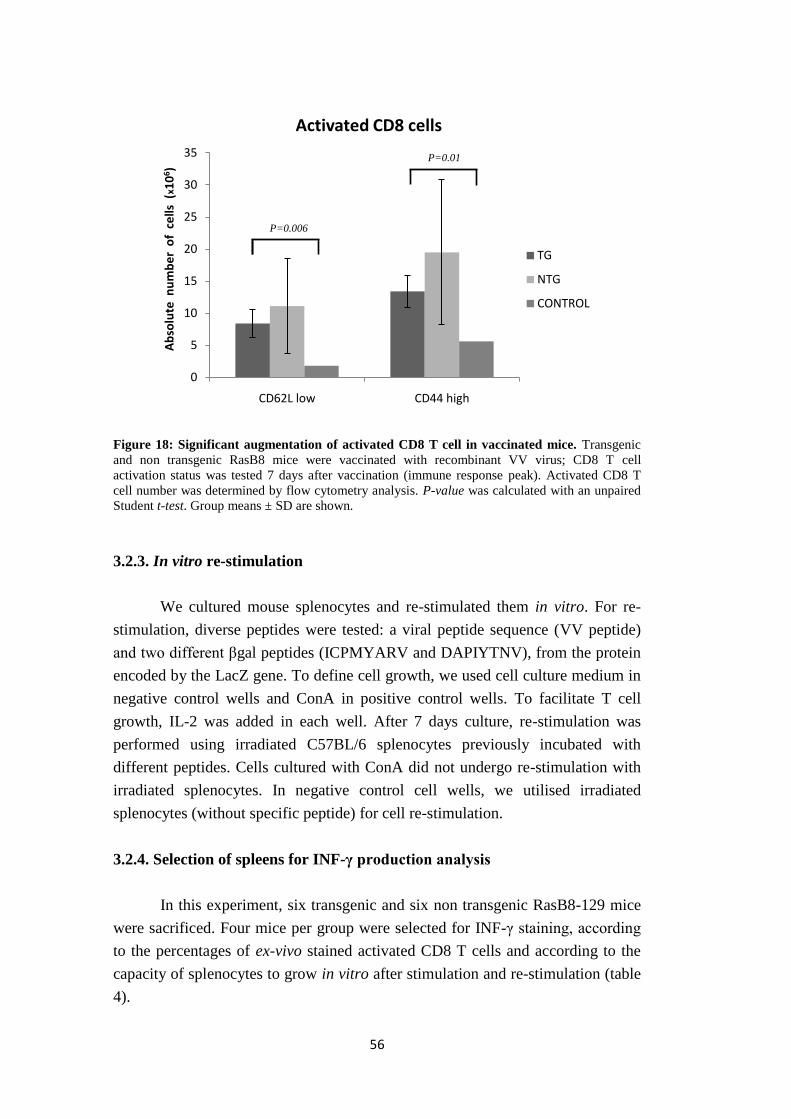
56
Figure 18: Significant augmentation of activated CD8 T cell in vaccinated mice. Transgenic
and non transgenic RasB8 mice were vaccinated with recombinant VV virus; CD8 T cell
activation status was tested 7 days after vaccination (immune response peak). Activated CD8 T
cell number was determined by flow cytometry analysis. P-value was calculated with an unpaired
Student t-test. Group means ± SD are shown.
3.2.3. In vitro re-stimulation
We cultured mouse splenocytes and re-stimulated them in vitro. For re-
stimulation, diverse peptides were tested: a viral peptide sequence (VV peptide)
and two different βgal peptides (ICPMYARV and DAPIYTNV), from the protein
encoded by the LacZ gene. To define cell growth, we used cell culture medium in
negative control wells and ConA in positive control wells. To facilitate T cell
growth, IL-2 was added in each well. After 7 days culture, re-stimulation was
performed using irradiated C57BL/6 splenocytes previously incubated with
different peptides. Cells cultured with ConA did not undergo re-stimulation with
irradiated splenocytes. In negative control cell wells, we utilised irradiated
splenocytes (without specific peptide) for cell re-stimulation.
3.2.4. Selection of spleens for INF-γ production analysis
In this experiment, six transgenic and six non transgenic RasB8-129 mice
were sacrificed. Four mice per group were selected for INF-γ staining, according
to the percentages of ex-vivo stained activated CD8 T cells and according to the
capacity of splenocytes to grow in vitro after stimulation and re-stimulation (table
4).
0
5
10
15
20
25
30
35
CD62L low CD44 high
Ab
solu
te n
um
be
r o
f c
ells
(x1
06)
Activated CD8 cells
TG
NTG
CONTROL
P=0.01
P=0.006

57
Mice
Number of
cells / spleen
( x 106 )
%
CD62low
cells in
CD8+
%
CD44high
cells in
CD8+
In vitro
growth
(day 6)
In vitro
growth
(day 11)
1 TG 59 28 65 ++ +
2 TG 72 31 51 ++ +
3 TG 92 26 36 + -
4 TG 70 42 65 + +/-
5 TG 62 46 70 +/- +/-
6 TG 81 49 72 +/- +/-
7 NTG 93 34 77 +/- +
8 NTG 114 54 85 + +/-
9 NTG 75 33 54 +/- +/-
10 NTG 90 33 68 +/- +/-
11 NTG 54 41 67 + -
12 NTG 70 44 72 +/- +/-
13 control 92 12 41 +/- +/-
14 control 49 11 29 +/- +/-
Table 4: Selection of activated splenocytes for INF-γ production analysis. Transgenic and non
transgenic RasB8 mice were vaccinated with Lac-VV and sacrificed after 7 days. Spleen cells
were isolated and stimulated in vitro. Splenocytes were selected for INF-γ production analysis
according to CD8 T cell activation status and to growth in vitro of VV peptide-stimulated cells.
Cell growth was evaluated as follows: (++) number of lymphocytes higher than in negative
control, activated lymphocytes; (+) number of lymphocytes comparable to the control, only few
cells activated; (+/-) number of cells comparable to cells in control wells, no activated
lymphocytes; (-) lower amount of cells than in control wells. Selected mice are displayed in red;
the cell absolute number is based on the cell count performed before the ex-vivo surface staining.
A vigorous anti-viral immune response may result in major clonal
expansion of lymphocytes in the spleen. We therefore preferentially selected
spleens with high cell yield for further analysis. Both CD44 and CD62L markers
were considered in the selection. With respect to cell growth in vitro, there was no
clear correlation of cell number or activation status (scored as in vitro growth in
table 4) with the different peptide stimulations. The transgenic and non transgenic
selected mice are visible in red in table 4.
3.2.5. INF-γ production
After in vitro βgal peptides stimulation, we re-stimulated splenocytes with
the two respective βgal peptides; then we performed the intracellular INF-γ
staining. Cells from non vaccinated mice were used as negative control. Re-
stimulation with ionomycin and PMA was also performed in order to prove the
lymphocyte ability to become activated and to secret INF-γ.
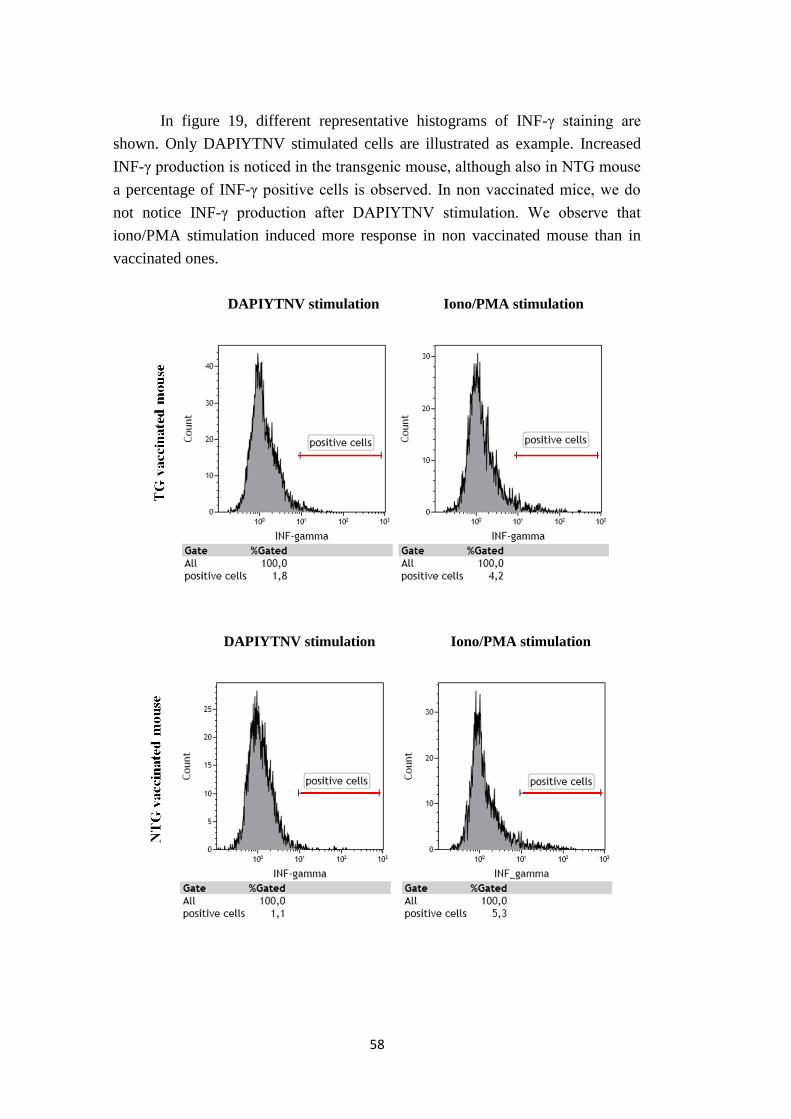
58
In figure 19, different representative histograms of INF-γ staining are
shown. Only DAPIYTNV stimulated cells are illustrated as example. Increased
INF-γ production is noticed in the transgenic mouse, although also in NTG mouse
a percentage of INF-γ positive cells is observed. In non vaccinated mice, we do
not notice INF-γ production after DAPIYTNV stimulation. We observe that
iono/PMA stimulation induced more response in non vaccinated mouse than in
vaccinated ones.
DAPIYTNV stimulation Iono/PMA stimulation
DAPIYTNV stimulation Iono/PMA stimulation

59
DAPIYTNV stimulation Iono/PMA stimulation
Figure 19: INF-γ production after peptide stimulation is observed only in vaccinated mice.
RasB8 mice were vaccinated with VV-LacZ and isolated splenocytes were stimulated in vitro.
Selected CD8+ CD44
high splenocytes from transgenic, non transgenic and control (non vaccinated)
mice were analysed after DAPIYTNV and iono/PMA re-stimulation for INF-γ production.
Illustrative histograms obtained with flow cytometry analysis are shown. Only the antibody
staining is illustrated. INF-γ positive cells (red line) are displayed.
Figure 20: Trend towards higher INF-γ production in transgenic rather than non transgenic
mice after peptide stimulation. INF-γ production was measured in stimulated splenocytes from
both RasB8 transgenic and non transgenic mice. Lymphocytes were gated and CD8+ CD44
high
stained cells were analysed with flow cytometer. Percentages were calculated subtracting INF-γ
isotype staining values. Means of different groups (n=4) ± SD are shown.
0 0,5 1 1,5 2 2,5 3
DAPI
ICPM
% of CD44+ CD8+ cells
INF-γ production
NTG
TG

60
The two different βgal peptides we used for splenocyte stimulation to INF-
γ production are DAPIYTNV and ICPMYARV. INF-γ production was measured
in CD8+ CD44
high cells from both transgenic and non transgenic mice (figure 20).
A modest trend to have more production of INF-γ in transgenic mice is noticed,
although no significant differences were calculated between groups. Overall, the
percentages of positive cells that we obtained are at the limit of detection for both
transgenic and non transgenic mice.

61
4. DISCUSSION
4.1. PERIPHERAL IMMUNE BALANCE IN GLIOMA
Defects in immune cellular function of glioma patients have been
documented, demonstrating that a solid tumour arising in brain is able to influence
peripheral immune functions through soluble factors (Fecci et al., 2006; Dix et al.,
1999). In glioma patients there is evidence of cutaneous anergy to common
bacterial antigens, T cell hyporesponsiveness and lymphopenia (Morford et al.,
1997). With respect to a quantitative analysis of different types of cells, it has
been demonstrated that relative number of peripheral blood CD4 and CD8 T cells
in patients is shifted from normal: CD4 T cells are greatly diminished in glioma-
bearing individuals (Waziri, 2010).
The RasB8 astrocytoma model was used in this study, to investigate the
balance of different types of leucocytes at the peripheral level, in particular in
spleen and in inguinal lymph nodes.
4.1.1. Glioma does not have a major impact on B cell proportions
A study on the percentage and on the absolute number of B cells in blood,
showed similarities between glioma patients and healthy donors. Furthermore,
immune defects in glioma patients were demonstrated to involved T cell subsets
rather than B cells (reviewed by Dix et al., 1999).
Our data showed no significant differences in B cell proportions between
RasB8 and control mouse groups, in both spleen and LN (figure 11 A). B cell
proportions in transgenic ill mice are characterised by the highest standard
deviation; this may be due to the different disease status of the mice that are only
crudely graded as “ill”.
Overall, from the literature and our study, B cells do not appear to be a
major target of glioma-mediated immunosuppression. However, to fully exclude
this, we could also need to examine the bone marrow as another major site for B
cells, and antibody titres as indicator of B cell function.
4.1.2. The proportion of CD4 T cells can be reduced in RasB8 glioma
As previously discussed, it is demonstrated that peripheral blood CD4 T
cells in glioma patients are diminished in comparison to healthy donors and,
consequently, the ratio CD4/CD8 T cell is altered (Waziri, 2010).

62
Indeed, with respect to CD4 T cell proportion, we observed a significant
difference in LN T cells of ill RasB8 mice in comparison to control group (P=
0.003), demonstrating the fact that CD4 T cells proportion is diminished in old,
symptomatic mice. However, in younger, asymptomatic mice, no significant
differences were found. Differently to LN, in spleen CD4 T cell proportion is not
significantly altered between groups.
Concerning CD4/CD8 T cell ratio, we observed a significant difference
(P= 0.02) between ill RasB8 mice and littermate group in LN; in spleen, the same
trend is observed (P= 0.06), although this is not statistically significant. To
explain the differences observed between lymph nodes and spleen cell
proportions, it can be hypothesized that in ill mice the lymphocyte recirculation
can be perturbed due to the impaired muscle tone, essential for efficient
lymphocyte recirculation through lymphatics. Ill mice are in fact visibly weak and
their capacity of movement is limited. Indeed, lymphocyte trafficking from lymph
nodes depends up on the lymphatics and requires muscular movement and
tonicity. In contrast, lymphocytes enter and exit spleen by means of venous
circulation, which may be preserved even in ill mice.
Overall, significant differences between CD4 T cell proportions are shown
only if mice exhibit symptoms and are at the latest stages of the disease. We did
not observe alterations in younger mice. In conclusion, RasB8 mice immune
balance is unpaired only at later stages of the disease, differently to local immune
balance, altered from early stages (Tran Thang et al., 2010). Moreover, alteration
in T cell proportion is manifested within the CD4 T cell compartment rather than
CD8, comparable to what is described in human glioma (reviewed in Fecci et al.,
2006).
4.1.3. Memory phenotype T cells remain intact in RasB8 glioma
One of the most relevant characteristics of adaptive immunity is the
capacity to provide long-term immunological memory (Parham, The immune
system, 2009). Memory cells play an important role in immune responses; they
rapidly respond to antigen and have an extended lifespan (Tokoyoda et al., 2009).
To investigate if glioma influences memory T cell proportion, we analysed
Ly-6C expression in RasB8 CD4+ and CD8+ spleen and LN T cells. Ly-6C
belongs to the Ly-6C family of surface glycoproteins and it is a
glycosylphosphatidylinositol-anchored molecule. Ly-6C is expressed on
peripheral T cells in mice bone marrow and spleen after immunization (Tokoyoda
et al., 2009), suggesting that Ly-6C might be associated with differentiation and
activation of T cells. Indeed, Ly-6C is considered a memory marker of CD8 T

63
cells (Walunas et al., 1995) and of CD4 T cells (Tokoyoda et al., 2009); in both
cases it is expressed at high level.
With respect to CD4 T cells, there were no significant differences between
groups. Furthermore, in lymph nodes the CD4+ Ly-6Chigh T cell subpopulation was
not detected (data not shown). Our data are in line with previous studies, in which
memory CD4 T lymphocytes were demonstrated to be represented by a higher
number in spleen than in lymph nodes (Tokoyoda et al., 2009).
Additionally, we observed that memory phenotype CD8 T cells are not
statistically altered in transgenic mice, both in spleen and LN. However, to
completely investigate proportions of this cell subset, we would also need to
utilise the activation marker CD44. In fact, it was demonstrated that Ly-6C is
expressed on previously activated cells and its expression is acquired only after
CD44 expression (Walunas et al., 2005).
In conclusion, we demonstrated that glioma does not impact memory T
cell proportions. However, to perform a complete study on memory cells it would
be also interesting to analyse bone marrow cells, since it is well-established that
many memory T cells reside in that tissue.
4.1.4. Myeloid-derived suppressor cell proportion is not increased in RasB8
glioma
Diverse mechanisms are implicated in glioma immune suppression; an
important role is played by immunosuppressive cells: myeloid-derived suppressor
cells (MDSCs), regulatory T cells and mesenchymal stem cells (Walker et al.,
2009). Circulating MDSCs were found to be significantly increased in patients
bearing different cancers of all stages, relative to healthy volunteers (reviewed by
Youn et al., 2008). MDSCs suppress T cell responses in a specific or non-specific
manner (reviewed by Youn et al., 2008).
We investigated if tumour induces a peripheral increase in RasB8 spleen
MDSCs: we did not observe statistically significant differences between glioma-
bearing mice and control group. Our results are discordant with another study in
which increased MDSC proportions in spleen were observed in ten different mice
tumour models (Youn et al., 2008), however in this study brain tumours were not
examined.
In conclusion, it cannot be state that MDSCs play an important role in
glioma peripheral immunosuprression. Moreover, at the local level the
contribution of MDSCs to the brain tumour infiltrate was not significant in most
mice (Tran Thang et al., 2010).

64
4.2. T CELLS DO NOT EXHIBIT IMPAIRED IN VITRO
FUNCTIONALITY IN RASB GLIOMA
It is well-established that patients with glioma exhibit T cell
hyporesponsiveness (reviewed in Morford et al., 1997). Indeed, in vitro studies
showed that peripheral blood lymphocytes obtained from glioma patients
proliferated poorly in response to mitogen or antigen stimulation (reviewed by
Dix et al., 1999). Defects of T cell responsiveness may depend on defects in early
transmembrane signalling (Morford et al., 1997) and on Treg activity (Fecci et al.,
2006).
We performed splenocyte Concanavalin A in vitro stimulation to
determine if T cells in RasB8 mice are hyporesponsive in vitro, as in patients. We
observed that the T cell response is mitogen dose-dependent. There were no
significant differences between dividing T cell proportions in different mouse
groups, even in the CD4 subset in which T cell hyporesponsiveness was observed
in patients (reviewed in Fecci et al., 2006).
It is noteworthy that we performed an in vitro test: we indeed measured T
cell responsiveness once cells were removed from the in vivo environment. This
study did not reproduce immunosuppressive molecules and soluble factors which
in vivo may influence cell proliferative capacity. Importantly, a correlation
between the presence of the tumour and T-cell abnormalities has been discussed
(reviewed by Waziri, 2010).
Overall, these data suggest that glioma peripheral T lymphocytes do not
show defective proliferation capability in vitro. However, the lack of influence by
the immunosuppressive environment has to be considered.
4.3. ACTIVATED T CELLS DO NOT RESPOND TO GLIOMA ANTIGEN
It is demonstrated that glioma patient T cells exhibit anergy in vitro
(Morford et al., 1997). Furthermore, diverse peripheral immune defects suggest
that immune responses at the peripheral level are impaired rather than functional
(reviewed in Dix et al., 1999).
We investigated T cell capacity of activation and peripheral tumour-
antigen specific immune response in RasB8 mice. In order to enhance or elicit a
peripheral immune response, we performed a recombinant virus-mediated
vaccination, using VV-LacZ. It encoded the β-galactosidase gene, which is also
present in the mouse transgenic construct. Effects of this immonuotherapeutic
approach were previously tested at the local level in RasB8 mice: after

65
vaccination, T cells infiltrated more the brains of transgenic mice and had
enhanced capacity to express INF-γ (Tran Thang et al., 2010).
We observed that T cell in vivo capacity of activation is not affected in
transgenic mice. To determine the efficacy of the VV vaccination, we investigated
the activation status of CD8 T cells. There were significant differences between
transgenic vaccinated and non transgenic non vaccinated mice. Non transgenic
mice also show an activated T cell phenotype, but there was no statistically
difference with transgenic mice. However, we did not use aged-matched mice and
high variability (due to diverse immune conditions of individual mice) may have
limited the sensitivity of our test to detect minor defects..
With respect to antigen specific immune response, we measured the
expression of INF-γ in β-galactosidase peptide stimulated transgenic and non
transgenic RasB8 splenocytes. We tested CD8+ CD44+ T cells only, in order to
accurately identify the cell population completely activated and specific for the
peptide of interest. We obtained positive stained cells, but this was at the limit of
detection, in both transgenic and non transgenic mice. There were no significant
differences between groups, although a trend to have more INF-γ production was
observed in transgenic mice.
Overall, a specific immune response was not observed in RasB8 transgenic
mice, although the capacity of T cells to become activated is comparable to
control mice. Two different aspects have to be taken in consideration to consider
these results. i) The specific immune response elicited by the recombinant VV
backbone compared to that directed against the inserted gene was demonstrated to
be 20-fold greater (Harrington et al., 2002). However, the response to the foreign
gene is coordinately regulated with response to the vector. It can be hypothesised
that the greater immune response elicited specifically against virus backbone
epitopes might have prevented the boosting of the specific response for the
inserted gene. Indeed, although we did not measure INF-γ stimulated by VV
peptides in these experiments, a parallel study of brain infiltrating T cells did
detect VV-specific T cells that had infiltrated the brain of transgenic mice (Tran
Thang et al., 2010). It could be interesting to adopt another approach for mouse
vaccination in order to determine if VV vaccination is appropriate to elicit both a
VV and a βgal specific response, or if peripheral tolerance to the tumour
associated antigens is present in RasB8 mice. ii) We used two different βgal
peptides; both of them can be hypothesised to be insufficiently immunogenic to
elicit a strong specific response. To verify their immunogenicity, it would be
interesting to analyse specific immune response to other different βgal epitopes.

66
In conclusion, although RasB8 T cells are not able to exhibit functional
βgal specific immune response after recombinant virus vaccination, this may
reflect an inefficient vaccine, as their capacity to become activated was unaltered.

67
5. CONCLUSIONS
The aim of this thesis was to analyse the peripheral immune status in
transgenic RasB8 mouse astrocytoma model. We did not found a significant
imbalance in spleen and LN immune cell proportions, except at terminal stages of
the disease when the CD4/CD8 T cell ratio was significantly decreased. We
performed a test in vitro to assess T cell responsiveness to mitogen and there were
no differences between transgenic and control mice. We also demonstrated that
transgenic mouse T cells are able to become activated after vaccination, but we
did not detect a specific tumour-associated antigen response.
In conclusion, RasB8 glioma does not significantly influence RasB8
peripheral immune status, except at later stages when CD4 T cell proportion is
compromised. Furthermore, there were no alterations in cell responsiveness and
activation. If these results can be extrapolated to glioma patients, they may
indicate that peripheral vaccination as part of an immunotherapy may be efficient
if undertaken at early stages of disease development, or perhaps in patients with
low grade tumours. However, anti-glioma immune function will still have to
occur locally at the tumour site in the brain, and this may be a limiting factor for
clinical efficacy of a single modality therapy involving vaccination.

68
APPENDIX
Media and buffers
ACK buffer Lysis buffer (FULKA); NH4Cl 8.26 g/l, KHCO3 1 g/l,
EDTA 37 mg/l.
FCS Fetal Calf Serum (GIBCO, Invitrogen); complement-
inactivated (56°C for 30 minutes).
Fix/Perm Solution fixation/permeabilization solution (BD Cytofix/CytopermTM
Plus Fixation/Permeabilization kit).
FWB Flow cytometer Wash Buffer (PBS 1x supplemented with
sodium azide 0.05%, FCS 5%).
FWB fix Flow cytometer Wash Buffer with Fixative (PBS 1x
supplemented with BSA 0.5%, sodium azide 0.05%,
formaldehyde 1%).
Golgi Stop protein transport inihibitor containing monensin (BD
Cytofix/CytopermTM
Plus Fixation/Permeabilization kit).
HBSS medium Hanks Balanced Salt Solution 1x (Invitrogen), containing
Hepes 10mM, Penicillin 100 μg/ml, Streptomycin 100
U/ml.
Perm/Wash Buffer stock 10x, (diluited at 1x in distillated autoclaved water for
use); containing Fetal Bovine Serum and saponin (BD
Cytofix/CytopermTM
Plus Fixation/Permeabilization kit).
RPMI medium (Invitrogen), Roswell Park Memorial Institute medium 1640
(1x).
TBE buffer GIBCO (Invitrogen). Containing Tris 1M, Boric Acid 0.9
M, EDTA 0.01 M. Stock at 10x, diluted in distillated
autoclaved water to prepare TBE 1x.

69
T cell medium 500 ml DMEM (Dulbecco’s Modified Eagle’s Medium)
high glucose (4500 mg/ml) containing Glutamax and
Pyruvate + FCS 6% + Hepes 10 mM + Penicillin 100
μg/ml, Streptomycin 100 U/ml, L-Glu 2 mM, L-arg 116
mg/l, Asp 36 mg/l + β-ME 2x10⁻⁵
M.
Fluorochromes
APC Allophycocyanin
APC/ Cy 7 APC and cyanine dye Cy 7
FITC Fluorescein isothiocyanate
PE Phycoerythrin
PE/ Cy 7 PE and cyanine dye Cy 7
Per CP/Cy 5.5 Peridinin chlorophyll protein and cyanine dye Cy 5.5
SA Streptavidin

70
BIBLIOGRAPHY
• Okezie O. Kanu, Ankit Mehta, Chunhui Di, Ningjing Lin, Kathy Bortoff, Darell
D. Bigner, Hai Yan and David Cory Adamson; Glioblastoma multiforme: a
review of therapeutic targets; Expert Opinion on Therapeutic Targets (2009),
13(6):701-718.
• David N. Louis, Hiroko Ohgaki, Otmar D. Wiestler, Webster K. Cavenee, Peter
C. Burger, Anne Jouvet, Bernd W. Scheithauer and Paul Kleihue; The 2007
WHO Classification of Tumours of the Central Nervous System; Acta
Neuropathologica (2007), 114:97–109.
• Patrick Y. Wen and Santosh Kesari; Malignant glioma in adults; The New
England Journal of Medicine (2009), 359:492-507.
• Nienke A. De Vries, Jos H. Beijnen and Olaf van Tellingen; High-grade glioma
mouse models and their applicability for preclinical testing; Cancer Treatment
Review (2009), 35(8):714-723.
• Angelo L. Vescovi, Rossella Galli and Brent A. Reynolds; Brain tumour stem
cells; Nature Reviews Cancer (2006), 6:425-436.
• Virginie Clément, Valérie Dutoit, Denis Marino, Pierre-Yves Dietrich and Ivan
Radovanovic; Limits of CD133 as a marker of glioma self-renewing cells;
International Journal of Cancer (2009), 125:244–248.
• Roger Stupp, Hegi ME, Mason WP, van den Bent MJ, Taphoorn MJ, Janzer RC,
Ludwin SK, Allgeier A, Fisher B, Belanger K, Hau P, Brandes AA, Gijtenbeek J,
Marosi C, Vecht CJ, Mokhtari K, Wesseling P, Villa S, Eisenhauer E, Gorlia T,
Weller M, Lacombe D, Cairncross JG and Mirimanoff RO; Effects of
radiotherapy with concomitant and adjuvant temozolomide versus
radiotherapy alone on survival in glioblastoma in a randomised phase III
study: 5-year analysis of the EORTC-NCIC trail; The Lancet Oncology
(2009), 10:459-66.
• Hiroko Ohgaki and Paul Kleihues; Genetic alterations and signaling
pathways in the evolution of glioma; Cancer Sci (2009), 100(12):2235-41.

71
• Ramon Martinez and Manel Esteller; The DNA methylome of glioblastoma
multiforme; Neurobiology of Disease (2010), 39(1):40-46.
• Diana Munoz, Sameer Agnihotri and Abhijit Guha; Transgenic mouse models
of CNS tumors: using genetically engineered murine models to study the role
of p21-Ras in glioblastoma multiforme; CNS cancer (2009), Humana Press, 61-
76.
• Tao Xu, Juxiang Chen, Yicheng Lu and Johannes EA Wolff; Effects of
bevacizumab plus irinotecan on response and survival in patients with
recurrent malignant glioma: a systematic review and survival-gain analysis;
BMC Cancer (2010), 10:252.
• Jeremy B. Swann and Mark J. Smyth; Immune surveillance of tumors; The
Journal of Clinical Investigation (2007), 117(5):1137–1146.
• Jack D. Bui and Robert D. Schreiber; Cancer immunosurveillance,
immunoediting and inflammation: independent or interdependent
processes?; Current Opinion in Immunology (2007), 19(2):203-208.
• Monica J. Carson, Jonathan M. Doose, Benoit Melchior, Christoph D. Schmid
and Corinne C. Ploix; CNS immune privilege: hiding in plain sight;
Immunological Reviews (2006), 213:48–65.
• Oliver M. Grauer, Pieter Wesseling and Gosse J. Adema; Immunotherapy of
diffuse glioma: biological background, current status and future
developments; Brain Pathology (2009), 19:674-693.
• Paul R. Walker, Robert M. Prins, Pierre-Yves Dietrich and Linda M. Liau;
Harnessing T-cell immunity to target brain tumors; CNS Cancer (2009),
Humana Press, 1165-1217.
• Hideho Okada, Gary Kohanbash, Xinmei Zhu, Edward R. Kastenhuber, Aki
Hoji, Ryo Ueda and Mitsugu Fujita; Immunotherapeutic approaches for
glioma; Critical Reviews in Immunology (2009), 29(1):1–42.
• Robert M. Prins and Linda M. Liau; Cellular immunity and immunotherapy
of brain tumors; Frontiers in Bioscience (2004), 9:3124-3136.

72
• Eric J. Kunkel and Eugene C. Butcher; Chemokines and the tissue-specific
migration of lymphocytes; Immunity (2002), 16:1–4.
• Peter Parham; The immune system (2009), Third Edition, Garland Science.
• Thomas Calzascia, Frédérick Masson, Wilma Di Berardino-Besson, Emmanuel
Contassot, Rick Wilmotte, Michel Aurrand-Lions, Curzio Rüegg Pierre-Yves
Dietrich and Paul R. Walker; Homing phenotypes of tumor-specific CD8 T
cells are predetermined at the tumor site by crosspresenting APCs; Immunity
(2005), 22:175–184.
• Frédérick Masson, Thomas Calzascia, Wilma Di Berardino-Besson, Nicolas de
Tribolet, Pierre-Yves Dietrich and Paul R. Walker; Brain microenvironment
promotes the final functional maturation of tumor-specific effector CD8+ T
cells; The Journal of Immunology (2007), 179:845-853.
• Xuefang Cao; Regulatory T cells and immune tolerance to tumors;
Immunologic Research (2010), 46:79-93.
• Nhu Nam Tran Thang, Madiha Derouazi, Géraldine Philippin, Séverine
Arcidiaco,Wilma Di Berardino-Besson, Frédérick Masson, Sabine Hoepner,
Cristina Riccadonna, Karim Burkhardt, Abhijit Guha, Pierre-Yves Dietrich and
Paul R. Walker; Immune infiltration of spontaneous mouse astrocytoma is
dominated by immunosuppressive cells from early stages of tumor
development; Cancer Research (2010), 70(12):4829-39.
• Paul R. Walker, Thomas Calzascia and Pierre-Yves Dietrich; All in the head:
obstacles for immune rejection of brain tumours; Immunology (2002), 107:28–
38.
• Amy R. Dix, William H. Brooks, Thomas L. Roszman and Lorri A. Morford;
Immune defects observed in patients with primary malignant brain tumors;
Journal of Neuroimmunology (1999), 100:216-232.
• Peter E. Fecci, Duane A. Mitchell, John F. Whitesides, Weihua Xie, Allan H.
Friedman, Gary E. Archer, James E. Herndon, Darell D. Bigner, Glenn Dranoff
and John H. Sampson; Increased regulatory T-cell fraction amidst a
diminished CD4 compartment explains cellular immune defects in patients
with malignant glioma; Cancer Research (2006), 66:3294-3302.

73
• Allen Waziri; Glioblastoma-derived mechanisms of systemic
immunosuppression; Neurosurgery Clinics of North America (2010), 21:31-42.
• Lorri A. Morford, Lucinda H. Elliott, Sonia L. Carlson, William H. Brooks and
Thomas L. Roszman; T cell receptor-mediated signaling is defective in T cells
obtained from patients with primary intracranial tumors; The Journal of
Immunology (1997), 159:4415-4425.
• Patrick Shannon, Nesrin Sabha, Nelson Lau, Deepak Kamnasaran, David H.
Gutmann and Abhijit Guha; Pathological and molecular progression of
astrocytoma in a GFAP:12
V-Ha-ras mouse astrocytoma model; American
Journal of Pathology (2005), 167:859-867.
• Hao Ding, Luba Roncari, Patrick Shannon, Xiaoli Wu, Nelson Lau, Jana
Karaskova, David H. Gutmann, Jeremy A. Squire, Andras Nagy and Abhijit Guha;
Astrocyte-specific expression of activated p21-ras results in malignant
astrocytoma formation in a transgenic mouse model of human glioma; Cancer
Research (2001), 61:3826-3836.
• Koji Tokoyoda, Sandra Zehentmeier, Ahmed N. Hegazy, Inka Albrecht, Joachim
R. Grün, Max Löhning and Andreas Radbruch; Professional memory CD4+ T
lymphocytes preferentially reside and rest in the bone marrow; Immunity
(2009), 30:721-730.
• Theresa L. Walunas, David S. Bruce, Lynn Dustin, Dennis Y. Lob and Jeffrey A.
Bluestone; Ly-6C is a marker of memory CD8+ T cells; The journal of
Immunology (1995), 155:1873-1883.
• Je-In Youn, Srinivas Nagaraj, Michelle Collazo and Dmitry I. Gabrilovich;
Subsets of myeloid-derived suppressor cells in tumor-bearing mice; The
journal of Immunology (2008), 181:5791-5802.
• Laurie E. Harrington, Robbert van der Most, J. Lindsay Whitton and Rafi
Ahmed; Recombinant vaccinia virus-induced T-cell immunity: quantitation of
the response to the virus vector and the foreign epitope; Journal of Virology
(2002), 76:3329–3337.

74

75
Acknowledges / Ringraziamenti
• I would like to thank all the people who have worked with me during this year,
for their kindness and helpfulness...
Madiha Derouazi
Sabine Hoepner
Valerie Dutoit
Géraldine Philippin
Muriel Urwyler
Pierre-Yves Dietrich
I am indebted to all of you, because you have inspired and exceptionally enriched
my professional growth.
Many thanks go in particular to Nhu Nam Tran Thang, who did her best to help
me from the very beginning.
A special thank to Paul R. Walker, who taught me how good experimental
biology is done and helped me with his advice and essential supervision.
• Ringrazio di cuore tutti i miei amici, vicini e lontani, per essere sempre stati al
mio fianco in ogni situazione durante questi anni: la vostra amicizia è una tra le
cose più preziose che possiedo, vi voglio bene!
Grazie a Giulia, Beatrice, Eleonora, Marta, Alessandra, Michele, Giorgio,
Roberto, Barbara... amici veri ed insostituibili!
Maddalena, Silvana, Valeria e Cristiana...coinquiline fantastiche!
Ilaria, Annachiara, Giulia, Laura, Anna, Chiara e Giulia... che hanno
condiviso con me le gioie ed i dolori della biologia!

76