UNIVERSITA’ DEGLI STUDI DI PADOVA - core.ac.uk · In a complex and advanced competitive...
150
UNIVERSITA’ DEGLI STUDI DI PADOVA DIPARTIMENTO DI SCIENZE ECONOMICHE ED AZIENDALI “M.FANNO” CORSO DI LAUREA MAGISTRALE IN BUSINESS ADMINISTRATION TESI DI LAUREA “STRATEGIC PLAN AND FINANCIAL COMMUNICATION. THEORETICAL AND EMPIRICAL ANALYSIS” RELATORE: CH.MO PROF. GIACOMO BOESSO LAUREANDO: ANTONINO MARTINO MATRICOLA N. 1083807 ANNO ACCADEMICO 2016 – 2017
Transcript of UNIVERSITA’ DEGLI STUDI DI PADOVA - core.ac.uk · In a complex and advanced competitive...

UNIVERSITA’ DEGLI STUDI DI PADOVA
DIPARTIMENTO DI SCIENZE ECONOMICHE ED AZIENDALI
“M.FANNO”
CORSO DI LAUREA MAGISTRALE IN
BUSINESS ADMINISTRATION
TESI DI LAUREA
“STRATEGIC PLAN AND FINANCIAL COMMUNICATION.
THEORETICAL AND EMPIRICAL ANALYSIS”
RELATORE:
CH.MO PROF. GIACOMO BOESSO
LAUREANDO: ANTONINO MARTINO
MATRICOLA N. 1083807
ANNO ACCADEMICO 2016 – 2017

2
Il candidato dichiara che il presente lavoro è originale e non è già stato sottoposto, in tutto o in
parte, per il conseguimento di un titolo accademico in altre Università italiane o straniere.
Il candidato dichiara altresì che tutti i materiali utilizzati durante la preparazione dell’elaborato
sono stati indicati nel testo e nella sezione “Riferimenti bibliografici” e che le eventuali citazioni
testuali sono individuabili attraverso l’esplicito richiamo alla pubblicazione originale.
Firma dello studente
_________________
3
Summary
Introduction ............................................................................................................................................. 4
Chapter 1: Theoretical analysis ............................................................................................................... 8
1.1 Business Strategy ........................................................................................................................ 8
1.2 The Strategic Plan ........................................................................................................................... 11
1.2.1 Strategic Plan: Introduction ...................................................................................................... 11
1.2.2 Strategic Plan: Definition and functions .................................................................................. 12
1.2.3 Requisites of the Strategic Plan ................................................................................................ 16
1.2.4 The qualitative part................................................................................................................... 19
1.2.5 The quantitative part................................................................................................................. 27
1.3 CPM ................................................................................................................................................ 35
1.3.1 The Corporate Performance Management and the Strategic Plan ............................................ 35
1.3.2 CPM tool approach to the Strategic Plan ................................................................................. 38
Chapter 2: Method and purpose of the research .................................................................................... 40
2.1 Economic section ............................................................................................................................ 50
2.1.1 Sales Planning .......................................................................................................................... 51
2.1.2 COGS and Marginality............................................................................................................. 73
2.1.3 Logistics Costs ......................................................................................................................... 95
2.2 Financial section ............................................................................................................................ 101
2.2.1 Investment Plan ...................................................................................................................... 102
2.2.2 Funding .................................................................................................................................. 107
2.2.3 Working Capital Management ............................................................................................... 111
2.2.4 Financial Statements .............................................................................................................. 115
Discussion of main results................................................................................................................... 132
Conclusion........................................................................................................................................... 142
Appendix ............................................................................................................................................. 148
Bibliography ........................................................................................................................................ 149
4
Introduction
The evolution of management studies during the 80’s took to an important turning point in the
view of strategic planning.
Initially planning activities were entrusted to specific departments, the planning process was
too intricate, and not enough linked with the daily activities of the company.
Considered the criticism of the theory and, more important, the recurring failures of these
processes, companies have reallocated this function letting the Strategic Plan assume his central
role in the company management1.
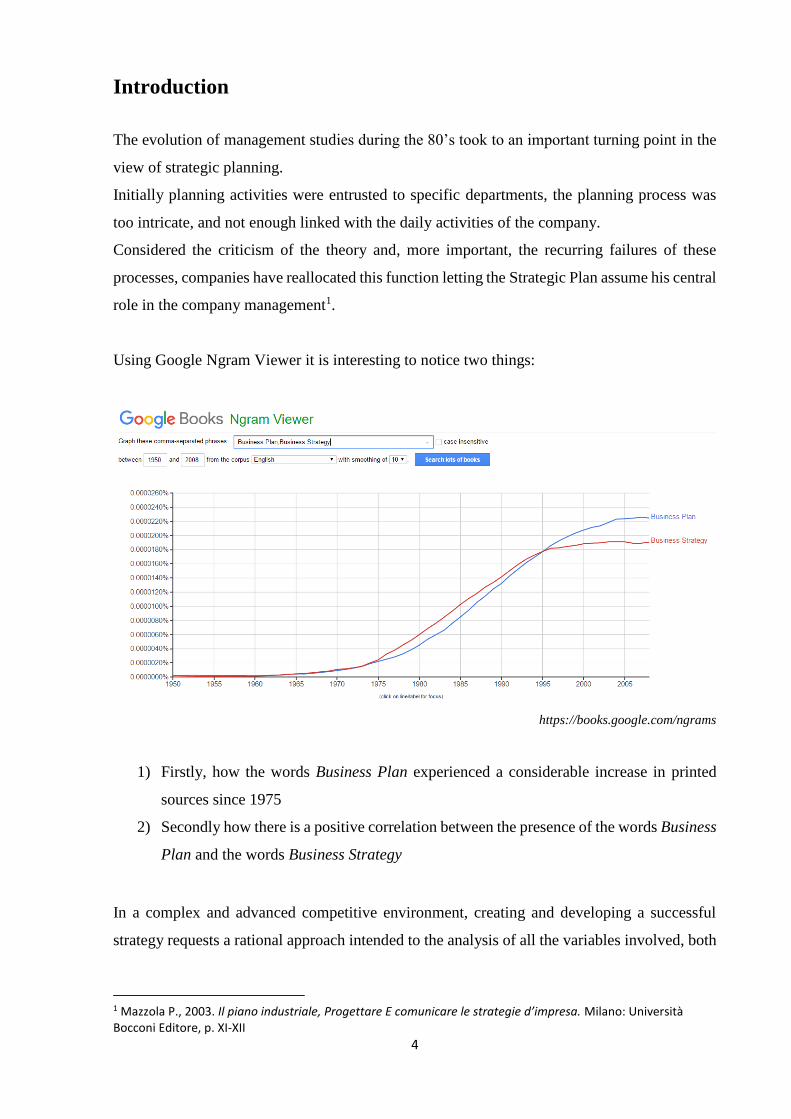
Using Google Ngram Viewer it is interesting to notice two things:
https://books.google.com/ngrams
1) Firstly, how the words Business Plan experienced a considerable increase in printed
sources since 1975
2) Secondly how there is a positive correlation between the presence of the words Business
Plan and the words Business Strategy
In a complex and advanced competitive environment, creating and developing a successful
strategy requests a rational approach intended to the analysis of all the variables involved, both
1 Mazzola P., 2003. Il piano industriale, Progettare E comunicare le strategie d’impresa. Milano: Università Bocconi Editore, p. XI-XII
5
internal and external, in order to catch and foresee market evolution.
To obtain this result the planning activity reveals itself essential not just from a strategical point
of view but also from an operational one.
The only strategic activity, even if fundamental, risks not to communicate concretely the targets
and results that a company means to reach both to internal and external stakeholders.
The planning activity needs also to find its concrete dimension: which kind of historical data
does it rely on? Where is it possible to find this data? What level of detail is it necessary to
consider for plan? Which kind of metrics and indicators are important to build, and using which
kind of levers?
Most of the literature examined for this work (Guatri Marinelli, 2001; Borello, 2009; Guzzetti,
2002 etc.) does not answer directly to these questions. It mainly focuses on theory, on the
fundamental steps necessary to draft a complete Plan (the majority of the literature is about
Business Plan and not Strategic Plan) and it is largely addressed to entrepreneurs.
On the other hand, papers that are not included in this category such as the Strategic Plan Guide
by Borsa Italiana2, very important document for this argument, are more intended as a series
of instruction and rules for the draft of a Strategic Plan without facing directly concrete issues.
The aim of this research is to understand how the activity of drafting a Strategic Plan can be
carried out tangibly with a technological support suggesting different uses of it. Moreover, it
wants to examine how it is possible to link all the qualitative inputs of a forward-looking
strategy to the concrete variables of planning using specific and precise indicators. This can
permit to:
1. Create approval around the proposed strategy through the presentation of
challenging objectives
2. Control the gap between results and declared objectives
3. Verify the consistence between the expected performance improvements, strategic
choices and planning levers3
The research is divided in two main parts.
The first chapter is a theoretical dissertation about the strategy, as a starting point of every
planning activity, and the main elements that a Strategic Plan needs to cover in order to be
2 Borsa italiana, 2003. Strategic Plan Guide, www.borsaitaliana.it. 3 Mazzola P., 2003. Il piano industriale, Progettare E comunicare le strategie d’impresa. Milano: Università Bocconi Editore, p. 139-140
6
complete and reliable.
The second chapter is the empirical analysis of an actual Strategic Plan drafted with the use of
a Corporate Performance Management Tool in order to face concretely most of the points
touched in the first chapter.
This analysis aims to present two aspects of the planning process.
Firstly, the actual process of planning, also from a technical point of view, in order to understand
what actually means to use a CPM tool and which are the possibilities, the levers available and
the level of detail that can be reached.
Secondly, the output of the process is analysed: management and planners use indicators to
achieve strategic objectives and goals. They define driver KPIs and correlate them with
outcomes. They know what behaviours drive desired outcomes and set targets accordingly. That
is why it is important to build a complete and traceable information that is possible to rely on
in order to deploy an effective Strategic Plan.
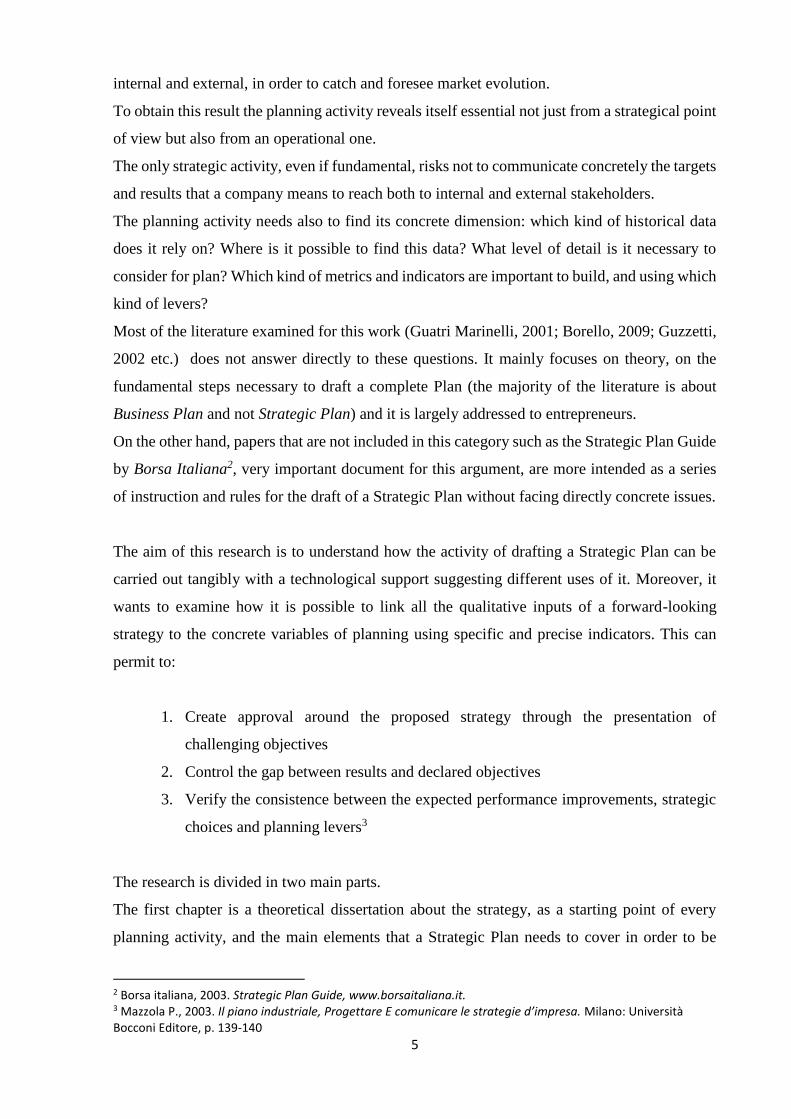
A research of TDWI4 issued in September 2008 based on a sample of 678 people (mostly
corporate IT professionals or consultants who work at large organizations in the U.S.) shows
that almost one-third (31%) of survey respondents whose organizations have fully or partially
deployed KPI initiatives say their KPIs have “changed behaviour and improved performance”
to a very high or high degree. Almost half (47%) said the impact of the KPIs has been moderate,
while 8% said the impact has been low or very low.
Eckerson W. (2009), PERFORMANCE MANAGEMENT STRATEGIES How to Create and Deploy Effective Metrics, P.18
4 Eckerson W. (2009), PERFORMANCE MANAGEMENT STRATEGIES How to Create and Deploy Effective Metrics,
TDWI. www.tdwi.org
7
The method used for this part is the Content Analysis based mainly on the procedure illustrated
by Krippendorf (1989), White and Marsh (2006) and Weber (1990) .
The indicators developed during the planning process described are evaluated using a codebook
based on a coding framework that considers the main quality dimensions of a KPI according to
the literature (Marr, 2006; Eckerson, 2009).
Despite the limits and the simplifications, this research aims to approach the topics related to
the Strategic Plan from another point of view with respect to most of the current literature, a
more practical one.
Starting from the theoretical basis it wants to illustrate a model that is scalable and can reach
different level of details according to the needs of the business linking the qualitative dimension
of the Strategic Plan to the quantitative one.
8
Chapter 1: Theoretical analysis
1.1 Business Strategy
The Business Strategy is the system of decision and activities that defines the company
positioning in the market and the relationships with the economic, social, political and cultural
environment.
It is aimed to reach a sustainable and long lasting competitive advantage in the long term.
To guarantee the survival of the company it is necessary to achieve an equilibrium in all the
markets involved and to meet the expectations of the stakeholders. Hence, the company needs
develop a set of tangible, intangible and human resources shaped to satisfy the needs of a
particular target of customers.
More precisely the strategy should define:
• the value proposition that the company intends to deliver
• the target of the offer and how to reach it
• the procurement markets where to find all the necessary resources
• how to cope with competitors5
“If you ask managers what they do, they will most like tell you that they plan, organize,
coordinate and control. Then watch what they do. Don’t be surprised if you can’t relate what
you see to these words. […]
The pressures of the job drive the manager to take on too much work, encourage interruption,
respond quickly to every stimulus, seek the tangible and avoid the abstract, make decision in
small increments and do everything abruptly.”6
Henry Mintzberg underlines how the strategy cannot be something casual or related with
particular or unexpected events but a rational and studied planning process that creates the
pattern of every decision took in the daily operations.
In fact, Plan and Pattern are two of the five P’s that determine his definition of strategy7:
• Plan: it is a set of consciously intended course of action. This gives to the strategy two
5 Sciarelli S.,2008. Elementi di economia e gestione delle imprese. Padova: CEDAM, p.: 178-185 6 Mintzberg H.,1990. The Manager’s job: Folklore and Fact, Harvard Business Review. https://hbr.org/1990/03/the-managers-job-folklore-and-fact 7 Mintzberg H., 1987. 5 Ps of Strategy in the strategy process. California Management review

9
important characteristics: it is made in advance of the actions to which it applies and it
is developed after proper analysis.
• Ploy: it is a scheme addressed at coping with the competitors
• Pattern: it is the concrete part of a strategy, the one made by actions. If the plan is the
intended strategy, the pattern is the realised one. A pattern makes a strategy consistent
in behaviour both in the case of expected situation and in the case of unexpected ones
as reaction to contingent situations.
• Position: it is not only the position in the marketplace with respect to other players but
also the position in the different kind of environments (social, political, etc.) in which
the organisation is placed.
• Perspective: it is the way in which the company perceives the world. A set of
behaviours and beliefs shared by the members of the organization that drive all its
activities.
Focusing on the first P, it is intuitive that a Plan is chosen among the alternatives because of
the expected goals. These goals are the direct result of a particular operation management so to
reach an equilibrium is important so that the direct activities are linked with the desired
outcome. It is necessary a coherence between all the different decisions undertaken in the
company: the segment where to operate, the particular need to satisfy, the channel to reach the
customer and the necessary resources to develop the core business. These elements their selves
are not sufficient to explain the success of an organisation; they are a real value added only
together.
However, it is important not to confuse strategy with operational effectiveness.
It is widespread practice to improve the latter through programs like Total Quality Management,
Outsourcing and Benchmarking in order to achieve a best practice and over perform toward the
competitors. A constant improvement of operational effectiveness is necessary for the
company’s growth of profitability but, to reach a long lasting competitive advantage, is not
sufficient.
The first reason is that all the practises above are moderately easy to imitate and competitors
can soon fill the gap.
The second reason is that following the same programs and the same behaviours, companies
tend to look alike more and more; a meaningful example can be having the same supplier of an
outsourced activity. This is harmful for the competition because erodes the margin considered
the declining prices and the insufficient differentiation of the offer.

10
Competitive strategy is about being different. It means deliberately choosing a different set of
activities to deliver a unique mix of value. 8
8Porter M., 1996. What is strategy. Harvard Business Review. p. 3-4

11
1.2 The Strategic Plan
1.2.1 Strategic Plan: Introduction
Before starting, it is necessary to make a clarification about the difference between the concepts
Business Plan and Strategic Plan, often considered, wrongly, synonyms.
A Business Plan is a document written by a team of entrepreneurs, before the Start-up of a
company, often to receive the approval of investors or financial institutions. It is characterized
by an accurate description of the activities and of forecasted scenarios in which the company
means to operate. There is a pronounced focus on the Break-Even Analysis and the Payback
Period.
A Strategic Plan is instead conceived for companies of bigger dimension, already settled in the
market, with a focus mainly based on the strategic intentions and actions to undertake during
the planning period. It is drafted every 3 years if the company is listed or when it is facing
extraordinary events.
The planning approach is also a discriminating factor: Business Plan has mainly a direct
approach: it considers all the variables to calculate the necessary information whereas the
Strategic Plan has mainly an indirect approach focusing on the historical data and forecasting
changes. This allows simpler decisions.
The first method is surely more complicated because needs a lot of sources so, usually, it is
better to apply it only to relevant Key Value Drivers.
12
1.2.2 Strategic Plan: Definition and functions
The Strategic Plan is the document that illustrates the strategic aims of management relating to
the company’s competitive strategies, the action which will be carried out for the achievement
of the strategic objectives, the evolution of the Key Value Drivers9 and the expected results10.
To do this it relies on qualitative elements to describe the main characteristics of the strategic
actions and the cause-effect relations with the performance. It resorts instead to quantitative
elements to illustrate the possible evolution of the environmental variables, weakly affected by
the company strategy, and the financial-economic projections related to plan timeline.
The Strategic Plan performs an essential role with regards to:
• management: it is useful for the portrayal of the business outlook
• member of the Board of Directors: it allows them to perform their role of guiding and
supervising the company
• company: to attract all the necessary resources, human and financial, in order to carry
out the strategy and to get other companies involved in strategic alliances. It is also
very useful to get the market’s endorsement.
The objectives to prepare a Strategic Plan are external and internal.
The external ones are obtaining approval and consequently necessary financial resources from
investors when the company is facing a turnaround or is about to undertake a particular action
(entering a new market, launching a new product etc.). In fact, a Strategic Plan is fundamental
for all the financial communications requested for the IPO11.
However, there are also important internal objectives: the Strategic Plan allows the management
to have the direction where to go clear and to stay focus on it to meet the expected goals.
Furthermore, it is an important internal channel of communication to spread the vision, the
mission and the values of the organization among the stakeholders.
9 Indicators which drive the company profitability by increasing the revenues or reducing costs 10 Borsa italiana, 2003. Strategic Plan Guide, www.borsaitaliana.it. p. 4 11 Borsa italiana, 2003. Strategic Plan Guide, www.borsaitaliana.it. p. 2

13
The Strategic Plan has different functions12.
Opportunity to reflect for the Management
The preparation of a Strategic Plan encourages a dedicated focus on the future. Time dedicated
by management to the evolution of environmental trend, the study of competitors and the
evaluation of threats and opportunities is often limited by daily operations.
Secondly, it is a big opportunity to write down ideas that were only in the mind of managers
but never examined in depth and enacted.
The development of these ideas gives the possibility to share all the tacit knowledge of the
management gained with the experience and to combine it with the information collected by
analyst and planning specialists after specific studies.
Moreover, the draft of the Strategic Plan puts together knowledge of different company’s
functions allowing the advancement of cross-functional synergies and the spread of the
company’s know-how.
Guiding Instrument for the Board of Directors
The strategic Plan is functional to a direct and full involvement of the Board of Directors in the
company’s strategic activities.
It is not just about the decision of the intended strategy together with the management; the
contribution can be more relevant from different points of view. The Board of Directors is
essential in the definition of Mission, Vision and company’s set of values to give the right
direction to the business.
The Mission is the real driver that should lead all the business decision and it should be
supported choosing the most aligned strategic solutions among the different proposals of the
management.
The heterogeneous composition of the Board of Directors is also an opportunity for the
company, which has the possibility to have different perspectives of the environment and to
sense important trends not grasped from the internal management. In addition, the experience
of the members can help the company to adopt winning solution of other business realities and
to cope with crisis situations.
Through its activity, the Board of Directors can significantly influence the characteristics of the
12 International Federation of Accountants, Malaysian Institute of Accountants, 2006. Business Planning Guide: Practical Application for SMEs. p. 4
14
organizational context and therefore the development of emergent strategies beyond the
realisation of sanctioned ones.
Action Plan and Performance Tool
The Strategic Plan defines the actions that implement the strategy, the timetable and
responsibilities for each of them. It enables a greater focus in dealing with issues in an
organized, coherent and systematic manner and considers all the necessary resources for the
implementation of the strategic objectives.
The Strategic Plan requires setting quantitative and qualitative goals, which can be measured
and kept under control with the relative KPIs, to perform decided actions13. The same setting
process of the KPIs allows a preliminary critical examination by management that can reduce
the risks and lead to a more sophisticated planning.
In this way, a constant evaluation of the activities is possible. This allows individuating the
erroneous assumptions and the biggest criticalities promoting a continuous learning process.
Furthermore, the financial and competitive objectives linked to the corporate performance are
the basis for defining the incentive plan of the employees and the management.
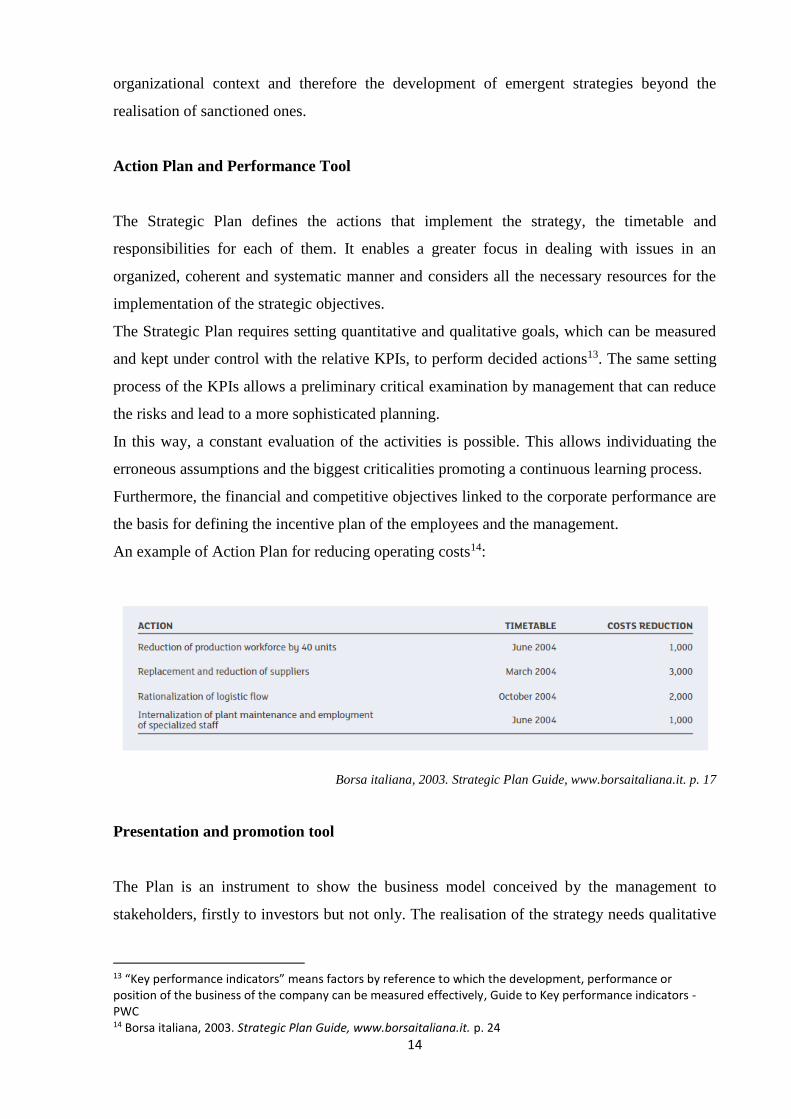
An example of Action Plan for reducing operating costs14:
Borsa italiana, 2003. Strategic Plan Guide, www.borsaitaliana.it. p. 17
Presentation and promotion tool
The Plan is an instrument to show the business model conceived by the management to
stakeholders, firstly to investors but not only. The realisation of the strategy needs qualitative
13 “Key performance indicators” means factors by reference to which the development, performance or position of the business of the company can be measured effectively, Guide to Key performance indicators - PWC 14 Borsa italiana, 2003. Strategic Plan Guide, www.borsaitaliana.it. p. 24
15
resources of professional and entrepreneurial nature and the Strategic Plan should be something
attractive for this kind of resources. Moreover, for particular kind of projects it is mandatory
the approval of particular control and vigilance institutions.
That is why it should be clear and valiant; it is also a way to be prepared for the comparison
with financial market. Its correct structure and the explication of the Key Value Drivers is
fundamental for an effective financial communication both at the time of a possible IPO and
for the on-going disclosure of a listed company.
The Strategic Plan is an important guideline that should not remain static. It should change in
accordance with the variability of external environment and internal situations, always
remaining focused on the mission established15.
15 International Federation of Accountants, Malaysian Institute of Accountants, 2006. Business Planning Guide: Practical Application for SMEs. p. 5
16
1.2.3 Requisites of the Strategic Plan
Considered the lack of specific principles generally used, the editing of Strategic Plan is usually
based on intuitive and individual considerations of management or consultants.
This is the reason why it is necessary to find at least some cardinal principles that should be
complied with to obtain an effective and complete communication with stakeholders16.
Borsa Italiana established the minimum requisites that must be observed when drafting the
strategic plan for the admission to listing. “It is given primary attention to the presence of
serious disequilibria in the issuer’s financial structure, a critical competitive position in its
main sectors of activity, evidence of serious incongruences in its forecasts and the absence of
elements substantiating the assumptions made therein”. 17
Hence, the three fundamental requisites for a Strategic Plan according to Borsa Italiana
(Strategic Plan Guide, 2003) are:
1 Financial Sustainability
2 Consistency
2 Reliability
Financial Sustainability
The analysis of the financial sustainability of a company starts with an accurate cash flow
analysis. All the cash outflows should be covered with the appropriate source to make reaching
the strategic objectives possible.
There must be an equilibrium between inflows generated by operations and outflows caused by
investments. The external financial resources should be used to finance activities addressed to
the growth of the company, the daily operation cash flows should be sufficient for the working
capital and the conservation investments.
For all investments, it is important to pay attention to the value to spend, timing of cash flows
and the impact of potential subsidies or financial leasing.
In case of a particular use of the debt capital, it is important to assess the borrowing capacity of
the company and the relationships with the financial institutions.
Finally, the due diligence should not neglect the intercompany situation: every possible impact
on the financial situation of the company because of financial movements and guarantees
16 Tamborrino A., 2003. Principi di redazione del Business Plan. Roma: Aristeia. p. 4-9 17 Borsa italiana, 2003. Strategic Plan Guide, www.borsaitaliana.it. p. 6
17
should be kept into consideration.
Consistency
The consistency of the Strategic Plan should be considered from two different points of view:
internal and external.
Internal consistency means that it is necessary a clear connection between the strategic aims
and the operations of the Action Plan adopted to realise them. All the actions (investments,
financial operations, resource acquisitions etc.) are translated in the forecast data and there must
be a correlation between the assumptions and the quantitative results present in the provisional
financial statements. Hence, if a substantial revenue growth is predicted, it is necessary to
consider consequently a proportional growth in the cost of goods sold. The external market
situation should also be taken into consideration and all the macro-economic variables should
be considered in the projection of the financial results.
The external consistency is related with actual feasibility of the Strategic Plan.
All the actions planned should be considered in relation with the current and future different
kinds of resource: human, financial and technological. The way in which these resources should
be obtained must be explained to make the project more reliable.
In addition, the timing of the actions should be realistic and commensurate to their impact; it is
not feasible for example to reach significant performances and results in a new geographical
market or in a new Strategic Business Unit in the short run.
The Completeness principle is strictly related to the consistency one. It entails the inclusion in
the Strategic Plan of all the relevant information to a complete and aware understanding of the
forecast document. The partial representation of single Business Units without the identification
of their reciprocal interaction or a lacking analysis of the company’s market would not allow
appreciating the quality of the Plan’s assumptions and solutions. 18
Reliability
The reliability of the strategic plan comes from the comparison between dynamic simulations
suggested by the plan itself and quantitative confirmation on the single elements shown.
A Strategic Plan is considered reliable when its contents are compatible, coherent and
reasonable. The analysis should refer to the competitive arena, the historical trends the visibility
18 Tamborrino A., 2003. Principi di redazione del Business Plan. Roma: Aristeia. p. 5
18
of the data and the sensitivity analysis.
The first element of reliability of a Strategic Plan is the comparison of the forecast data with
the industry. It is important to take into consideration all the environmental dynamics and the
technological and legal context, paying special attention to the barriers and the possible bonds
that the company can face. The consideration of competitors is fundamental: for example, every
assumption related to the growth (market share, revenue growth, acquisition of new customers)
should be made contemplating their reaction.
More generally, the Porter’s Five Forces Model19 is a useful reference point to conduct the
proper analysis and give reliability to the Plan.
Historical trends of the company should be the starting point for every additional projection. It
is always useful to compare the results of the Strategic Plan’s forecast data with the actual one
to verify a continuity. The revenue growth rate, the working capital and other financial ratios
like ROE are examples of indicators that cannot change excessively from one period to another.
Another important factor is the possibility of foreseeing the formation of the estimated data, or
the elevated probability that the projections relating to these will really manifest. The more the
company bases its assumptions on the actual data (for example the revenue of the first quarter,
the order portfolio, good relationships with some customers) the more it will be easy to consider
the revenue inflows are probable. Basing all the forecast data only on assumptions could not be
so reliable if there is no evidence of what is asserted20.
To make the projections of the plan more reliable and complete, it is useful to develop a
sensitivity analysis to show the data under different assumptions and variables capable of
exercising an influence on the creation of Value. The different forecast scenarios show all the
situations the company can face, from the most pessimistic one to the most optimistic, making
the prevision more accurate.
An interesting consideration is related to the concept of trustworthiness and its differences with
the one of reliability. The trustworthiness is evaluated considering the process that has led to a
particular forecast result whereas the reliability of a plan is evaluated considering the results.
This is important because apart from the forecast data it is important to understand how a
particular result is achieved and which is the process adopted, in this way the Plan turns out to
be easier to interpret and appreciate.
19 Porter M. 2008. The Five Competitive Forces That Shape Strategy, Harvard Business Review. 20 Borsa italiana, 2003. Strategic Plan Guide, www.borsaitaliana.it. p. 15
19
1.2.4 The qualitative part
The qualitative part of a Strategic Plan includes the presentation of the intended strategy, the
analysis of industry and main competitors and the necessary Critical Success Factors to reach
a sustainable competitive advantage.
The introduction of a Strategic Plan21 should explain the history of the company, its foundation
and its legal form. In addition, the economic/financial situation and the most important
milestones reached are fundamental to give an all-around overview of the company.
A brief focus on the set of values of the organization is very important as well. The illustration
of Vision and Mission helps the understanding of the purposes of the company, specifying the
fundamental reasons for its existence, establishing the scope of its business activities and
providing the overall direction that it means to follow.
The Strategic Profile
A company works in the market following strategic principles at the base of every action. There
is always an entrepreneurial behaviour behind the activities, and all the undertaken decisions,
from the strategic ones to the actionable ones, create a sort of “strategic profile” that can be
split in:
• Organizational setting: the importance of the human resources, the definition of the
roles inside the organization and the incentive schemes
• Administrative philosophy: all the ideas, attitudes and behaviours which guide the
workers’ relationships with the internal and external environment
• Final objectives: the ambition of the company in terms of qualitative and quantitative
performance. The balance between social recognition and economic success.
The illustration of the corporate and SBU strategy
Analysis and planning of competitive strategy are complicated steps because all the Strategic
Business Units of the company and their role inside of it should be considered. The management
21 Borello A., 2009. Il business plan,dalla valutazione dell’investimento alla misurazione dell’attività d’impresa, McGraw-Hill Education. p. 12-35
20
needs to prepare not just a competitive strategy for each SBU but also an integrated vision of
all of them to generate value for the company as a whole22.
To do this, it is necessary to satisfy the following conditions:
- Appropriate attractiveness of each individual SBU: it is not just about profitability,
the utility of a SBU can be the ability of enhancing the value of the others and their
potential growth.
- Synergies between the SBUs: the reduction of the risk cannot be the only reason to
undertake a diversification strategy. This strategy, in fact, entails coordination costs that
should be balanced by an improvement of the company performance and the
achievement of an advantage position not reachable from the competitors.
- Capability of taking advantage of the synergies: to realize particular synergies the
company needs to have the necessary capabilities and structure. In addition, the attitude
of parent company and the incentive scheme of management are fundamental variables
for this process.
Hence, the Strategic Plan should show the map of all the Strategic Business Units of the
company and explain their consistence with the organizational structure.
A business unit is identified by a combination of Product/Market/Technology: analysing these
combinations helps to understand the possible synergies and mergers between the SBUs.
The contribution of each SBU should be disclosed in static and dynamic terms and it is
evaluated considering its actual/future profitability and structural growth.
The variables to take into consideration during the evaluation process are:
- The capital employed
- The Return on Assets (ROA)
- The Weighted Average Cost of Capital (WACC)
- The growth rate
22 Mazzola P., 2003. Il piano industriale, Progettare E comunicare le strategie d’impresa. Milano: Università Bocconi Editore, p. 51
21
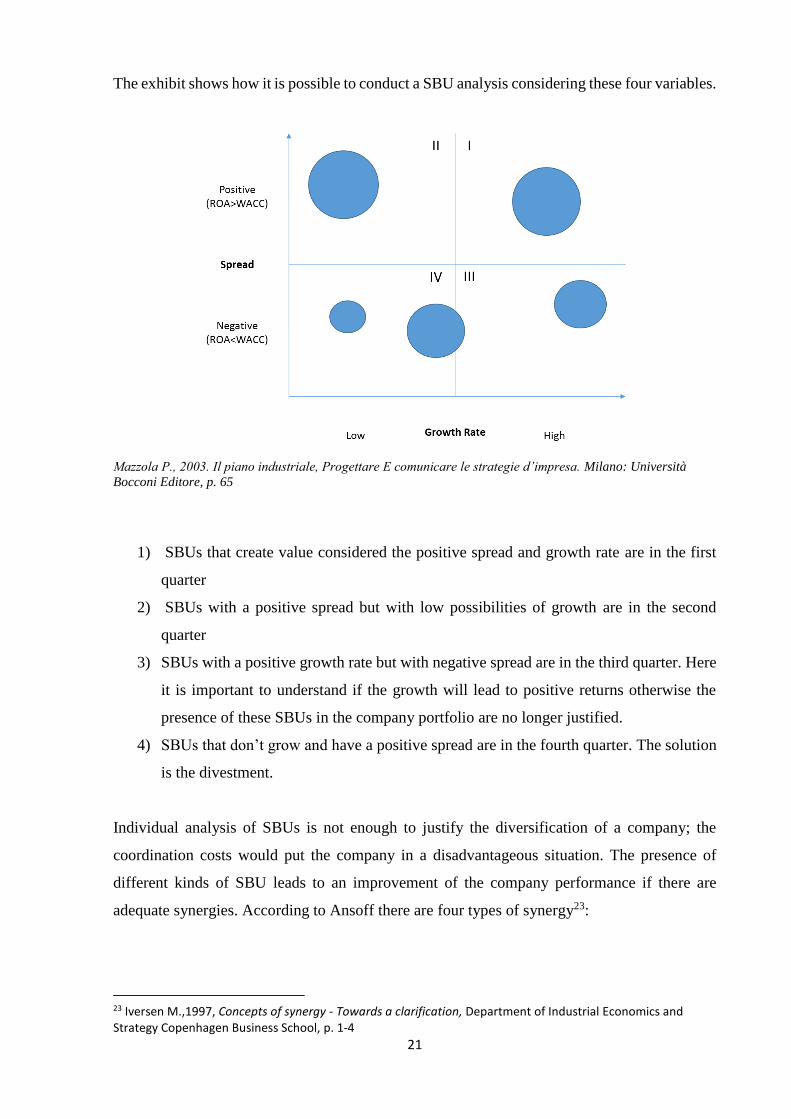
The exhibit shows how it is possible to conduct a SBU analysis considering these four variables.
Mazzola P., 2003. Il piano industriale, Progettare E comunicare le strategie d’impresa. Milano: Università
Bocconi Editore, p. 65
1) SBUs that create value considered the positive spread and growth rate are in the first
quarter
2) SBUs with a positive spread but with low possibilities of growth are in the second
quarter
3) SBUs with a positive growth rate but with negative spread are in the third quarter. Here
it is important to understand if the growth will lead to positive returns otherwise the
presence of these SBUs in the company portfolio are no longer justified.
4) SBUs that don’t grow and have a positive spread are in the fourth quarter. The solution
is the divestment.
Individual analysis of SBUs is not enough to justify the diversification of a company; the
coordination costs would put the company in a disadvantageous situation. The presence of
different kinds of SBU leads to an improvement of the company performance if there are
adequate synergies. According to Ansoff there are four types of synergy23:
23 Iversen M.,1997, Concepts of synergy - Towards a clarification, Department of Industrial Economics and Strategy Copenhagen Business School, p. 1-4
22
1) Sales synergy: which occurs when different products use common distribution
channels, sales administration or warehousing.
2) Operating synergy: which includes higher utilization of facilities and personnel,
spreading of overhead, advantages of common learning curves, and large-lot
purchasing.
3) Investment synergy: is the result of joint use of plant, common raw materials,
inventories, transfer of R&D from one product to another, common tooling and
machinery.
4) Managerial synergy: is possible when a new business venture faces strategic,
organizational or operating problems that are similar to problems that the management
has dealt with in the past.
To get the best out of these synergies it is necessary to consider the conditions of the
organizational context and the role of the parent company.
The organizational context should offer structures that allow sharing and conveyance of
competences and resources.
The competitive environment
For each SBU the Strategic Plan should specify all the characteristics of competitive
environment. The group of companies that run the same kind of business, or more generally
satisfy the same kind of need, in a specific geographic location composes this environment.
Environmental analysis is particularly useful to better understand the characteristics of the
supply, study the actual and potential competitors and individuate the distribution and provision
channels. Furthermore, it is important to assess the company’s revenues in relation to the total
revenues earned by the industry and the projected growth of the industry itself.
The analysis of the environment should be also extended to all the social, political and
technological forces that could affect the business activity in order to be able to react to every
kind of situation.
23
The choice about the competitive position that a company means to have involves the decision
about different standards:
- Needs it wants to satisfy
- Vertical integration
- Marketing policies
- Target customers
- Category of products
- Channels used24
These standards characterize the competitive scope of the company and hence its main features:
a company with a large scope can take advantage from economies of scale, scope and
experience; its customer base is larger and its product more adaptable.
A company with more focused scope has instead a tighter customer base but it can satisfy the
need of a market niche better than competitors can.
Definition of the competitive environment defines the behaviour of the companies that operates
there in relation with these variables. Knowledge of competitors’ characteristics is fundamental
to understand the disposition of the industry.
Defined the market and environment analysis and the competitive strategy, the Strategic Plan
should show an Action Plan that underlines the differences between the path the company
means to follow with respect to the one of competitors.
Studying the situation of competitors has an important strategic meaning: the management
needs to know both the demand side of the market and the supply side. This gives the possibility
to determine not only the efficacy or the inappropriateness of a particular strategy but also the
presence of hidden market opportunities.
The first step of competitor analysis is the identification of competitors, their value proposition
and the marketing segments where their products or services are in. Each competitor should be
analysed considering its market share and all its strengths and weaknesses. The cost structure
of each rivals, its culture and management style, organization system and strategies are useful
for the business management to know how to cope with them25.
24 Borello A., 2009. Il business plan,dalla valutazione dell’investimento alla misurazione dell’attività d’impresa, McGraw-Hill Education. p. 48 25 International Federation of Accountants, Malaysian Institute of Accountants, 2006. Business Planning Guide: Practical Application for SMEs. p. 35
24
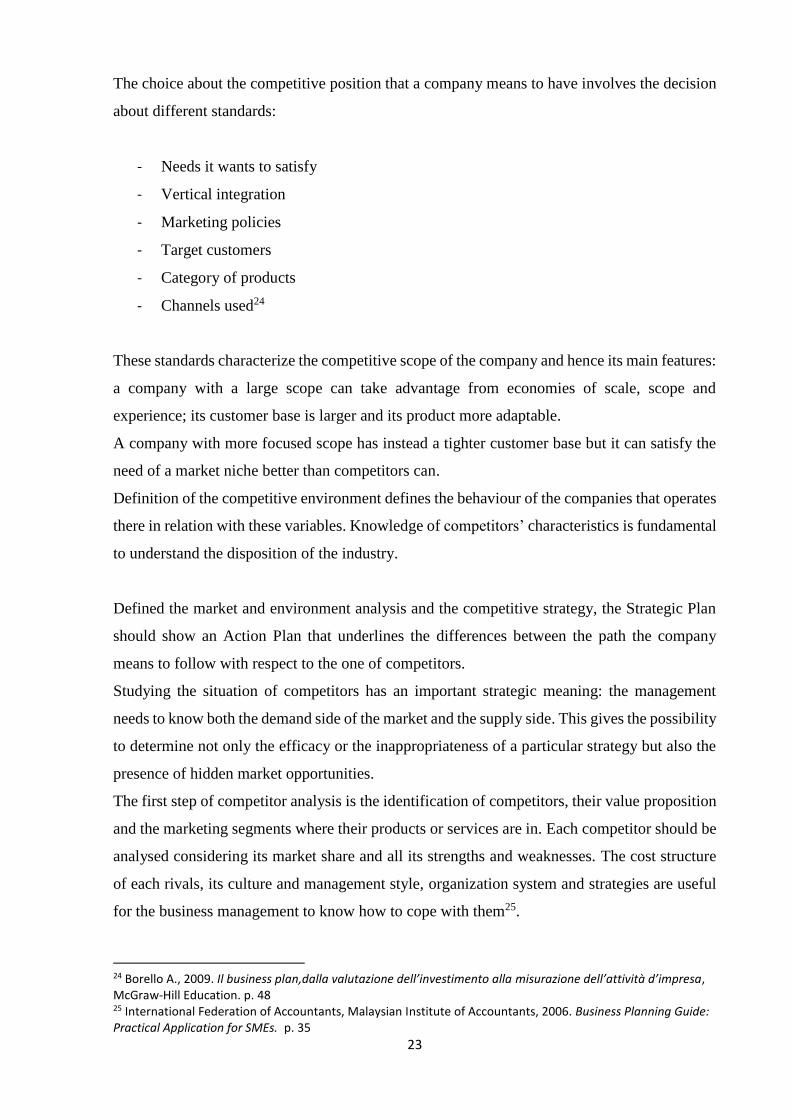
An effective tool to represent the competitive situation in the Strategic Plan is the Competitive
array. It allows, defining a list of competitors, individuating the Critical Success Factors of the
industry and giving them a weight, to rate each competitor obtaining an exhaustive mapping of
the market.
http://themasterdebator.blogspot.it/2006/08/competitive-position-evaluation.html
In this example, four Critical success factors are listed and weighted. The extensive distribution
is considered the most important CSF of the industry and has a weight of 4. This figure
multiplied by a rate for each company (6 and 3) gives the weighted rate of the CSF (2.4, 1.2).
Adding up all the weighted rates it is possible to obtain a total rate, useful for an effective
comparison among the companies.
25
Critical Success Factors
D. Ronald Daniel discussed the problem of inadequate management information for setting
objectives, shaping strategies, making decisions, and measuring results against goals.
He asserted that strategic planning information should focus on “success factors” which he
described as “key jobs that must be done exceedingly well for a company to be successful”
Success factors are considered at industry level, and they are shared across organizations within
an industry. They are not relevant for any company in a particular industry and could differ
from company to company and from manager to manager: this introduces the concepts of
managerial-level CSFs and organizationally unique CSFs.
There are different types of operating environments and thus different levels of CSFs: industry,
organizational, division, and individual.26
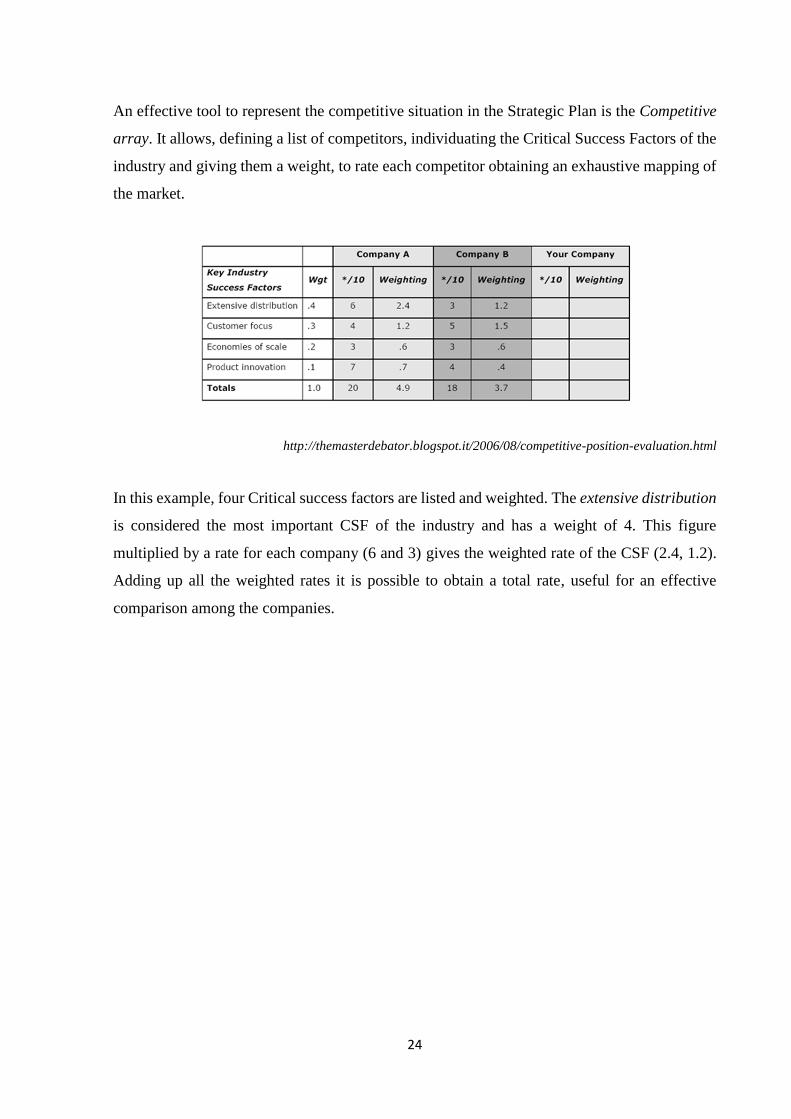
CSF have direct relationship with mission and goals of a company: they affect strategy through
their impact on the organization’s achievement of its goals and their ability to enable the success
of the mission.
The exhibit shows the CSF relationship with strategic planning elements.
Parker Gates L., 2010. Strategic Planning with Critical Success Factors and Future Scenarios: An Integrated
Strategic Planning Framework, Carnegie Mellon University. p. 27
26 Parker Gates L., 2010. Strategic Planning with Critical Success Factors and Future Scenarios: An Integrated Strategic Planning Framework, Carnegie Mellon University. p. 25
26
It is important not to confuse CSFs and goals. Goals are broad, high-level aims that support the
accomplishment of the mission. They are often derived from performance management
exercises rather than strategic planning, and are set considering the feasibility rather than
organizational success or contribution to accomplishment of the mission. CSFs refer to ongoing
operational activities that must be sustained for the organization to function successfully.
“Goals represent the end points that an organization hopes to reach. Critical success factors,
however, are the areas in which good performance is necessary to ensure attainment of those
goals”27
27 Rockart j. F., 1979, Chief Executives Define Their Own Data Needs, Harvard Business Review. URL: https://hbr.org/1979/03/chief-executives-define-their-own-data-needs%20Rockart%20-%20Chief%20Executives%20Define%20Their%20Own%20Data%20Needs
27
1.2.5 The quantitative part
To elaborate a complete Strategic Plan it is important to develop economic and financial
prospects related to the realisation of business strategy.
The Plan must include a set of financial, economic and patrimonial statements capable of
explaining, in a consistent and reliable way, the future of chosen economic model and giving
the right information to calculate the expected performance.
Every kind of quantitative analysis is always conditioned by uncertainty. This could put off the
management drafting a quantitative dimension of the Strategic Plan focusing only on the
qualitative aspects.
Actually, together with the proper qualitative studies, elaboration of economic and financial
prospects gives a fundamental contribution to examine strategic intentions of management and
their feasibility in depth. Furthermore, as explained before, it gives to the management itself an
important measurement tool useful to improve the learning process.
A way to control the uncertainty of quantitative analysis is to consider different scenarios for
the financial prospects using a what if approach; in this way it is possible to contemplate all the
relevant variables which can affect the final outcomes.
Investment Plan
The aim of Investment Plan is to describe and analyse all the planning activities for the
acquisition of long-term investments. This is important in a strategic planning view because it
helps to assess the financial requirements of the business’s key projects.
Investment Plan should show the main technical features and the duration of each investment.
The aspects that should be kept into consideration are the following:
• technical and economic reason of the investment;
• qualification of the investment depending on its function (substitution, strategic,
expansion);
• consistency with the whole design of the Strategic Plan;
• description of the technology of the investment in a comparative view with respect to
the previously used and to the ones adopted by the competitor: emphasis on the
competitive advantage achievable with the innovation;
• qualification of the supplier, in case of external acquisition, or of the necessary resources
in case of internal development;
28
• presence of the technical know-how necessary to develop internally the investment or to
take the best advantage of it. If this know-how is not present in the company it is
necessary to show the initiatives aimed to get it (training, acquisition of external human
resources);
• consideration of the legal authorisation and relative burdens;
• ecological and work safety aspects;
• degree of flexibility of the investment related to the production volume and market
demand;
• scalability of the investment and possibility to reconvert or dismiss it.
Another important perspective to consider in explaining the investment plan is the one related
with the financial requirements such as:
• acquisition cost of tangible assets, considering also transportation, installation and test
cost;
• cost of intangible assets: both for technical-productive assets like software and for
brands, licenses and goodwill
• all the requirements coming from an increase of the working capital.
For each investment it is necessary to determine the useful life of the asset and what is its impact
on the income statement during the established period. The depreciation policy should be
clarified and justified.
The terms of payment should also be presented together with the consequent outflows, with
particular focus on their timing.
The Strategic Plan should lastly contemplate a disposal program for every investment at the end
of its useful life calculating the residual earnings.
In presenting this information, the Investment Plan should present the methodology adopted to
obtain the cost estimates. This is done considering the historical data and the passed
investments. In the case of innovative projects, the presentation of similar initiatives, maybe
undertaken by the competitor or in other industries, could be a reliable way. 28
28 Tamborrino A., 2003. Principi di redazione del Business Plan. Roma: Aristeia. p. 31-34
29
Funding
The financial sustainability analysis of a Strategic Plan starts from the correct estimate of the
cash outflows and the fitting coverage of them with the appropriate funding sources.
The choice about the necessary financial resources to realize the Strategic Plan can be made in
a successful way only taking into consideration all the characteristics of the business, the
projects to be realised and the actual capital structure of the company29.
This choice regards firstly the quantity of financial resources: an underestimated need could
undermine the project. On the other hand, if overestimated, the financial resources in excess
could reduce the profitability of the investment.
Secondly, it is important to understand the quality of the financial resources necessary to better
pursue the objectives of the Plan: debt or equity capital, internal or external resources.
The internal funding sources are often the most important: an increase of capital coming from
the shareholders or the retained earnings can help to improve the liquidity of the company and
to be more attractive for the external sources, especially new equity investors.
The equity investors can be classified in several categories, each one with different investment
goals and peculiarities: Business Angels, Venture Capitalists, Merchant Banks and Hedge
Funds.
The first two are involved at the early stage of a company, when the risk and the uncertainty
are high. On the other hand, Merchant Banks and Hedge Funds are institutes specialised in
providing financial resources to big companies to make them grow as soon as possible and exit
the investment after a short period of time.
The equity of the business is the value of all the assets less all liabilities plus the future value
that the business will generate (discounted future cash flows). Equity partners are often
interested in businesses with high potential for growth so it is important to show meaningful
projections30. In addition, the management team and the strategies linked with the business idea
are very important in their decision. Moreover, the return on capital and the dividend policy of
the company should be made clear in the Strategic Plan taking into account the two parts of the
earnings of an investor:
- the projection of the net income and its distribution as dividend
29 Borello A., 2009. Il business plan,dalla valutazione dell’investimento alla misurazione dell’attività d’impresa, McGraw-Hill Education. p. 131 30 International Federation of Accountants, Malaysian Institute of Accountants, 2006. Business Planning Guide: Practical Application for SMEs. p. 48

30
- the increase of value of the shares of the company
Another way to get the necessary resources is the listing of the company in the stock exchange
issuing stocks and/or bonds depending on the kind of capital the company needs to collect. The
Strategic Plan is extremely useful for all the financial communications requested for the IPO;
its correct structuring, and hence the identification and the clarification of the trend of the Key
Value Drivers, is the condition for tackling the preparation of the listing particular and the
structuring of the analyst presentation and the roadshow31.
Debt financing companies are interested in the stability of the cash flows of the company both
in the past and in the future. Borrowing from the bankers relies on two variables, the collateral
that secures the loan, and the ability to repay the loan based on the historical financial health of
the company.
The Strategic Plan should always consider the borrowing capacity of the company in deciding
the financial strategy to undertake. The borrowing capacity is based on indicators as the
revenues or the monthly cash flows and this is linked with an accurate forecasting of the future
performance of the company too. Some useful indicators are for example the Net Debt to
EBITDA Ratio32 and the Interest Coverage Ratio33.
The recourse to the debt is considered a positive element for the potential equity investors
because makes it possible to take advantage from the financial leverage.
The preparation of different perspective of the Strategic Plan is important to suit the
requirements of each reader. A banker’s or financer’s interest lies in stability, security and cash
flows coverage whereas an Hedge Fund or a venture capitalist is more interested in high
leverage resulting in high returns.
Financial Statements
The assessment of economic and financial perspective supposes the elaboration of provisional
financial statements: the provisional income statement, balance sheet and cash flow statement.
For this purpose, and to better explain the economic logic of the company linked with the impact
of the actions of the Strategic Plan, specific reclassification methods can be used. They show
flow and stock data of financial statements under different functional or organizational
31 Borsa italiana, 2003. Strategic Plan Guide, www.borsaitaliana.it. p. 2 32 Measurement of leverage, calculated as a company’s interest-bearing liabilities minus cash divided by its EBITDA. It shows how many years it would take for a company to pay back its debt considering stable earnings. 33 Debt and profitability ratio. It is calculated by dividing a company EBIT during a given period by the amount of passive interest a company must pay in the same period.
31
perspectives, allowing a better interpretation of them. A multidimensional approach helps the
planning process to be more accurate and to consider different scenarios.
The Income Statement
The Income Statement describes, represents and quantifies all the revenues and expenses that
contribute to the creation of the net income during the planning period.
It is fundamental for the financiers, both equity and debt, because for the former it is an
important indicator for the possibility of dividend distribution and for the latter the possibility
of refunding the debt within the negotiated time. Moreover, the economic performance of the
company gives important indications about the cash flows, useful for the financial planning and
under a taxation point of view.
The Strategic Plan presents different provisional Income Statements for each fiscal year. It is
important to consider the inflation rate in the projection and make clear the exogenous variables.
The forecasts, as explained above, need to show a continuity with the historical data considering
the elements in common (technological, environmental, organizational, and productive). This
information can be strengthened through comparison with competitors used as benchmark or
average data of the industry. 34
To represent accurately the provisional economic performance the Income Statement should35:
- underline all the adjustments to the gross revenues (discounts and restitutions). Their
trend has an important impact on the company profitability and a warning value too: the
discounts are an indicator of the degree of negotiation power of the company and the
number of restitution due to delay or product defect measures the production and
delivery efficiency;
- classify costs by function (cost center). This is a relevant criterion to quantify the
strategic guidelines because it allows recognizing on time the proposed changes in the
organizational structure;
- indicate separately non-monetary costs to calculate the EBITDA for the different fiscal
year of the Strategic Plan;
- consider the financial income as non-operating income to understand effectively what
the profitability of the company without extraordinary income is.
34 Tamborrino A., 2003. Principi di redazione del Business Plan. Roma: Aristeia. p. 36-37 35 Mazzola P., 2003. Il piano industriale, Progettare E comunicare le strategie d’impresa. Milano: Università Bocconi Editore, p. 166
32
The Cash Flow Statement
The cash flow statement is the document that explains the funding sources necessary for the
realization of the Strategic Plan.
It should be written considering the results and the assumptions of the Investment Plan and the
provisional income statement. From the reclassification, under a financial point of view, of the
latter it is possible to quantify the cash flows generated from the operating activities inferring
the self-financing capacity of the company. If the cash flows are positive they are a financial
source, otherwise they are a financial requirement.
The cash flow statement allows to identify the cash flow of the operating activities and therefore
to observe the consequences of the pursued strategy and of the Strategic Plan on the financial
side of the company.
The most important thing to consider is the timing of the cash outflows to be prepared with a
suitable coverage. The lack of an appropriate coverage could give rise to solvency problems
even if the economic performance of the company are positive.36
Balance Sheet
The provisional Balance Sheet specifies all the assets and liabilities of the company for each
fiscal year of the planning period. It also illustrates the amount of the equity and its composition.
The actual Balance Sheet before the planning period is an important starting point to underline
the improvements that the plan could bring.
Its figures come from the assumptions and the elaboration of the other documents like the
Investment Plan, the Income Statement and the cash flow statement. All the interrelations
among the different company areas are considered:
- the Investment Plan gives the data about the tangible, intangible and financial assets;
- the Income Statement illustrates important elements for the composition of the Working
capital and the depreciations
- the cash flow statement shows the evolution of the liquidity and the liabilities.37
36 Tamborrino A., 2003. Principi di redazione del Business Plan. Roma: Aristeia. p. 42-43 37 Tamborrino A., 2003. Principi di redazione del Business Plan. Roma: Aristeia. p. 46-47
33
This information is an important element of knowledge for both the equity and the debt
investors because it summarizes the effects that the management creates from the assets of the
company and the possibility of a future sustainability.
The reclassification of the balance sheet to discern operating and non-operating assets is used
not only to have a better understanding of the composition of invested capital but also to
formulate more precisely the perspectives linked to the chosen strategy.
The data that show the variations of the figures in the provisional financial documents facilitate
the assessment of the company growth allowing the inference of:
• growth rate of the company during the planning period through the revenue growth;
• quality of the company growth. A growth is considered positive if the revenues and the
net income grow proportionally. If the revenues increase and the profitability does not
it is a pathological growth;
• financial needs as a consequence of the company growth. In particular, it is interesting
the link between the revenue growth and the invested capital and if the former goes
with an increase or a decrease of latter;
• financial sustainability, which can be measured from the relationship between the
increase of invested capital and the increase of equity in the capital structure 38
Sensitivity analysis
As explained above, a business operates in an uncertain environment and the planning process
is based on a series of assumptions. Given the intense competition and the instability of the
social, political and technological context, forecasting alone is not sufficient in view of the rapid
changes and their unpredictable nature. Therefore it is advisable a sensitivity analysis on the
main qualitative and quantitative variables which can substantially affect the creation of value.
Considering that the projections contained in the Strategic Plan are linked to the most realistic
scenario, the sensitivity analysis should be presented with respect to more optimistic and more
pessimistic scenarios, showing the effect on the main financial data
The variables that affect the sensitivity analysis are different depending on the kind of approach
adopted by the Strategic Plan. If the underlying logic is top-down the analysis is carried out
38 Mazzola P., 2003. Il piano industriale, Progettare E comunicare le strategie d’impresa. Milano: Università Bocconi Editore, p. 169-174

34
considering the trend of the market demand and the market share of the company with respect
to the competitors. The companies that follow a bottom-up approach should focus instead on
operating parameters39.
The sensitivity analysis is a method used to develop flexible long term Strategic Plans. It is a
way to prepare the company to manage the risks and opportunities that it could face and to make
it as responsive as possible.
39 Borsa italiana, 2003. Strategic Plan Guide, www.borsaitaliana.it. P. 37
35
1.3 CPM
1.3.1 The Corporate Performance Management and the Strategic Plan
The Strategic Planning process is, as explained, a complex procedure that involves several areas
of the company, different competences and kinds of data.
These studies and analysis should not be disconnected from real-world decisions and corporate
actions and it is likewise important not to have a duplication of effort and systems to support
these activities.
The role of Corporate Performance Management is to bring together these processes and
technologies into an integrated system and unified way of managing the Strategic Planning
Process that is more powerful of its individual parts. The scope is to integrate all the areas of
the business from a common strategy and vision, through a common business language40.
To be able to face a rapidly changing, increasingly complex and global business environment,
the management needs a flexible technology and a new idea of plan, a changeable and adaptable
plan.
There are some sections of the Strategic Plan that are particularly dynamic, and some that
remain static41. In order for the Plan to be accurate and remain sensible, it is necessary to review
it periodically, and this process cannot be slow and intricate. The management must be agile;
therefore, CPM is a valuable place to start.
40 Price Waterhouse Coopers, 2008. Corporate Performance Management: Achieving value by effectively anticipating and managing change. 41 International Federation of Accountants, Malaysian Institute of Accountants, 2006. Business Planning Guide: Practical Application for SMEs. p. 5
36
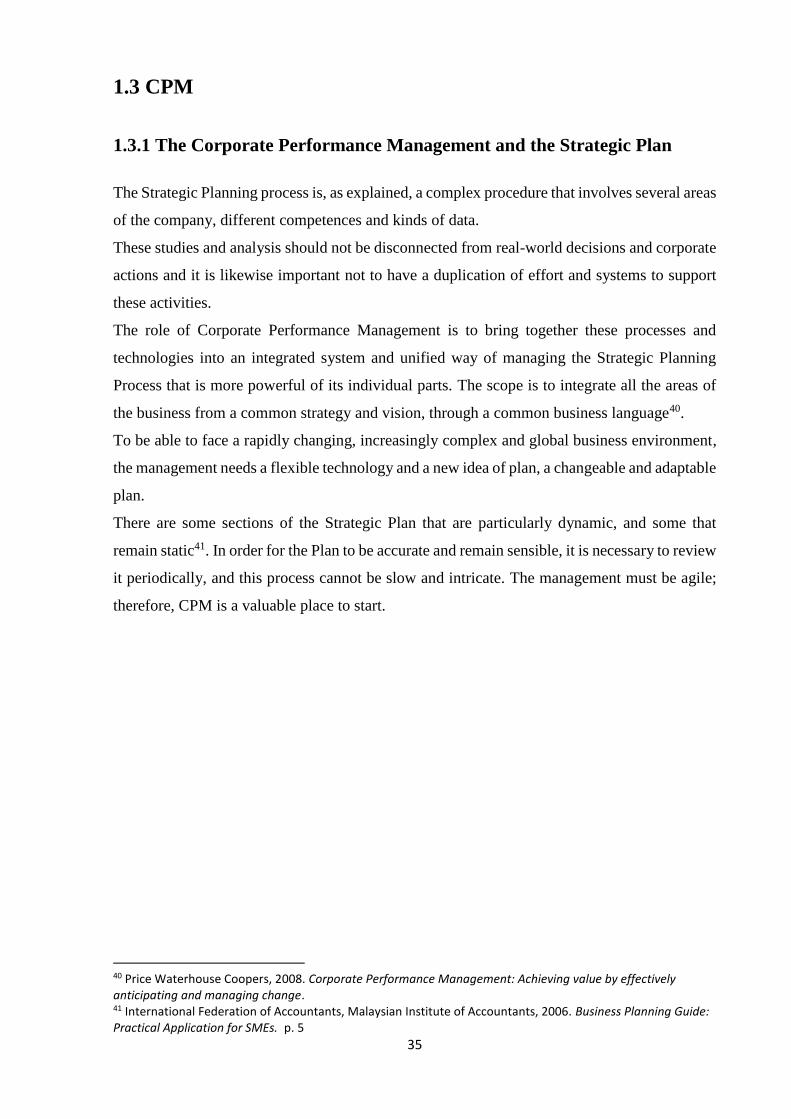
Managing a business depends on the processes being aligned to deliver the right mix of
standardization and flexibility, it is important to:
1. Believe in the numbers and report with confidence
2. Set accurate expectations and anticipate results
3. Deliver the right visibility to the right people and hold them accountable for results; in
this way, it is easier to enlarge the planning process and involve all the people necessary
to it
4. Spend less time on non-value-added activities
CPM enables fact-based forecasting and support increased speed and flexibility of planning
process.
Price Waterhouse Coopers, 2008. Corporate Performance Management: Achieving value by effectively
anticipating and managing change.
The corporate performance management can be approached with an enterprise-wide view,
considering finance, operations, HR, IT, Sales and marketing both functionally and at the
operating level.
An effective CPM tool can connect the management strategy through planning to sustained
execution. It also connects people, process, technology and data with an interrelation between
different activities of the company (budgeting, planning and forecasting, consolidation).

37
Furthermore, it can offer a modern Integrated Business Planning platform that enables the
integration of strategic, financial and operational planning, enabling full control of
performances across the organization.
Unlike spreadsheets, a multidimensional planning environment is based on a single shared data
repository and offers data validation, workflow, enterprise-class security, audit trail and
versioning capabilities.
This enhances the controllability and efficiency of the entire planning process, making it fully
reliable in terms of results and significantly less onerous in terms of time and resources.
Advanced functions of what-if analysis are combined with the capability to create and manage
scenarios, allowing multidimensional simulations in which the impact of future events is
automatically spread to every level of data aggregation, from the broadest outline to the lowest
level of detail 42.
Example of Board Software Planning Dashboard
42 Introduction to the multidimensional planning databases from: http://www.board.com/
38
1.3.2 CPM tool approach to the Strategic Plan
Considered the main functions and objectives of the Strategic Plan and the potentialities of a
CPM Tool it is important to understand where to focus the attention of the analysis and which
metrics to highlight to address the right issues.
The main topics related to the Strategic Plan which should be measured with the appropriate
KPIs and KVDs according to Borsa Italiana43 are:
1. Value creation and growth: the main aim of a Strategic Plan is to permit management
to define in what way the company intends to increase the value created for the
shareholders. This is strongly related with the growth of the company and the creation
of a sustainable competitive advantage.
2. CAPEX and OPEX Control: Strategic Plan should provide indications concerning the
levers which management intends to activate to reduce the cost structure: reduction of
the degree of vertical integration, changes in technologies, outsourcing policies.
Moreover, it is important to consider all the choices which aim at improving the
efficiency of the manufacturing processes and therefore a reduction of operative costs
3. Performance monitoring and improving: the structuring process of the Strategic Plan
becomes a learning instrument which makes it possible to verify the quality of
managerial insights. Furthermore, it is an occasion of comparison with the past
understanding where the major criticalities are in order to implement corrective
solutions for the planning period.
4. Corporate activities management: the Strategic Plan represents an instrument which
guides the main operating choices and in particular the entry into new markets, the
introduction of new products or services and the use of new distribution channels.
Furthermore, it helps defining the targets of potential customers, the products/services/
brands portfolio one intends to satisfy consumers’ expectations, and the price strategy
for the main products, services and/or brands
43 Borsa italiana, 2003. Strategic Plan Guide, www.borsaitaliana.it. P. 11-12, 35

39
5. Financial sustainability and administration: the Strategic Plan should consider the
sustainability of its strategy and the correct management of the financial resources. This
means taking into account the quantity and the quality of the sources of funding and the
correct estimate of the cash flow hypothesized. Moreover, in case of considerable use
of lending, it is important to carefully address the borrowing capacity of the company.
The end objective is to verify that the financial dynamics support the achievement of
the strategic objectives anticipated by the plan.

40
Chapter 2: Method and purpose of the research
This research adopts a Content Analysis approach to analyse a sample of Key Performance
Indicators developed in the CPM Tool in order to make replicable and valid inferences from
data to their context.
As a technique, content analysis involves specialized procedures and allows to provide new
insights and increase the researcher’s understanding of phenomena44.
This research method is a systematic, rigorous approach to analyse data obtained or generated
during research. Everything that constitutes data that can be used for content analysis studies,
the important thing is that the data provide useful evidence for testing hypotheses or answering
research questions.
According to Krippendorf (1989)45, White and Marsh (2006)46 and Weber (1990)47, the steps
for a study using content analysis can be summarized as follows:
1. Establish hypothesis and research question
2. Determine sampling unit and establish the unit of analysis
3. Establish coding scheme that allows for testing hypothesis
4. Code data
5. Write up results
Establish hypothesis and Research Question
In the light of what explained in the first chapter, the Strategic Plan is not just a form of
communication, but also an important performance tool useful to measure the achievements of
the company through the main KPIs and an opportunity to reflect for the management.
The importance of a comparison with the actual data was underlined: the historical dimension
may highly influence the reliability of the Strategic Plan and the visibility and traceability of
44 Krippendorff, K. (1989). Content analysis. In E. Barnouw, G. Gerbner, W. Schramm, T. L. Worth, & L. Gross (Eds.), International encyclopedia of communication (Vol. 1, pp. 403-407). New York, NY: Oxford University Press. 45 Krippendorff, K. (2004). Content analysis: An introduction to its methodology. SAGE, London 46 White M. , Marsh E. (2006). Content Analysis: A Flexible Methodology. 47 Weber, (1990). Basic Content Analysis. SAGE, London. p.22-24
41
the data too.
For all these reasons, the draft of a Strategic Plan should be done with an instrument that allows
dynamic, multi perspective analysis, and a complete integration with all the data available in
the company as starting point for future projections.
The purpose of this paper is to analyse how a Corporate Performance Management model with
multidimensional structure can foster the development of an integrated planning, the extent to
which it covers all the qualitative Critical Success Factors individuated by Management and
through which kind of metrics.
The empirical analysis aims to analyse the main outcomes of a Strategic Plan and explain the
process necessary to achieve them using a CPM tool.
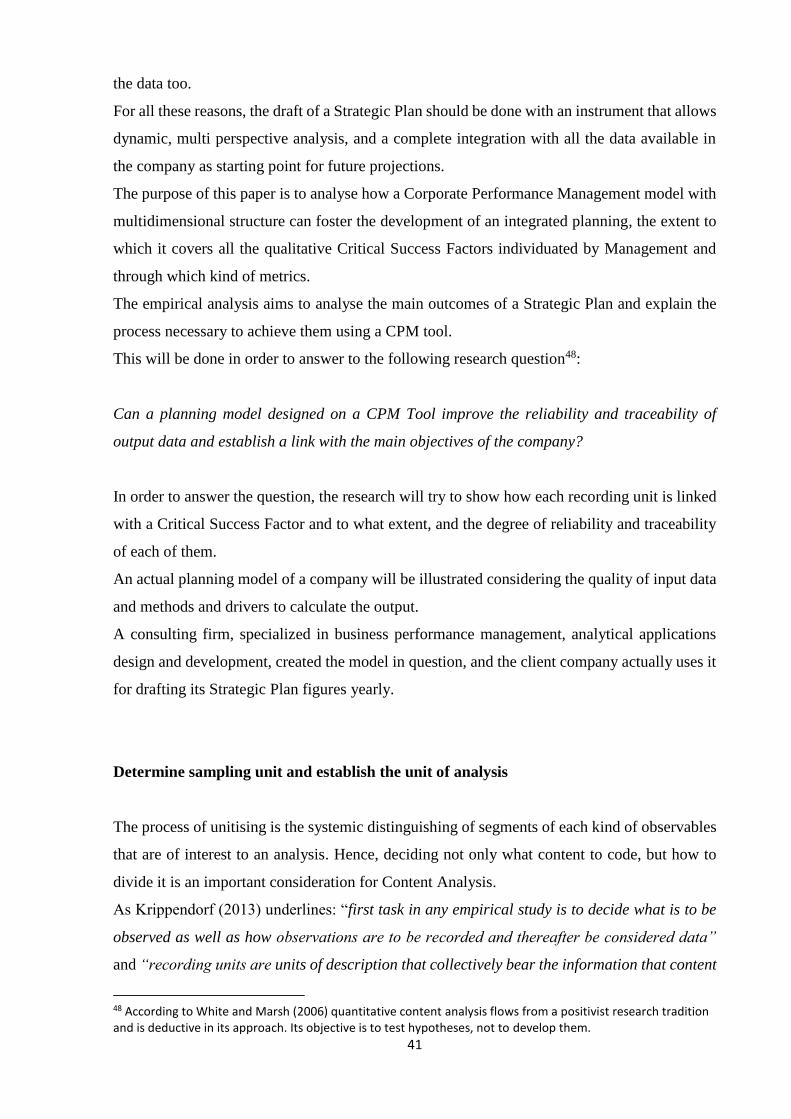
This will be done in order to answer to the following research question48:
Can a planning model designed on a CPM Tool improve the reliability and traceability of
output data and establish a link with the main objectives of the company?
In order to answer the question, the research will try to show how each recording unit is linked
with a Critical Success Factor and to what extent, and the degree of reliability and traceability
of each of them.
An actual planning model of a company will be illustrated considering the quality of input data
and methods and drivers to calculate the output.
A consulting firm, specialized in business performance management, analytical applications
design and development, created the model in question, and the client company actually uses it
for drafting its Strategic Plan figures yearly.
Determine sampling unit and establish the unit of analysis
The process of unitising is the systemic distinguishing of segments of each kind of observables
that are of interest to an analysis. Hence, deciding not only what content to code, but how to
divide it is an important consideration for Content Analysis.
As Krippendorf (2013) underlines: “first task in any empirical study is to decide what is to be
observed as well as how observations are to be recorded and thereafter be considered data”
and “recording units are units of description that collectively bear the information that content
48 According to White and Marsh (2006) quantitative content analysis flows from a positivist research tradition and is deductive in its approach. Its objective is to test hypotheses, not to develop them.
42
analysts process and provide the basis for statistical accounts”49.
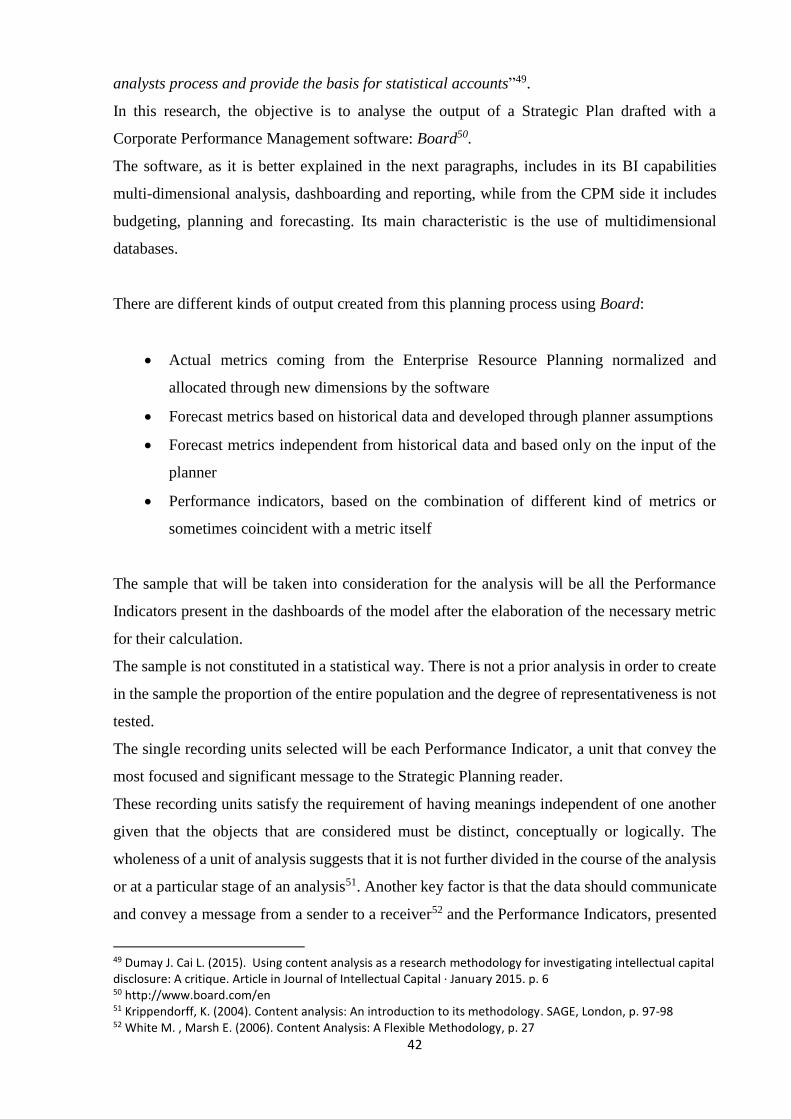
In this research, the objective is to analyse the output of a Strategic Plan drafted with a
Corporate Performance Management software: Board50.
The software, as it is better explained in the next paragraphs, includes in its BI capabilities
multi-dimensional analysis, dashboarding and reporting, while from the CPM side it includes
budgeting, planning and forecasting. Its main characteristic is the use of multidimensional
databases.
There are different kinds of output created from this planning process using Board:
• Actual metrics coming from the Enterprise Resource Planning normalized and
allocated through new dimensions by the software
• Forecast metrics based on historical data and developed through planner assumptions
• Forecast metrics independent from historical data and based only on the input of the
planner
• Performance indicators, based on the combination of different kind of metrics or
sometimes coincident with a metric itself
The sample that will be taken into consideration for the analysis will be all the Performance
Indicators present in the dashboards of the model after the elaboration of the necessary metric
for their calculation.
The sample is not constituted in a statistical way. There is not a prior analysis in order to create
in the sample the proportion of the entire population and the degree of representativeness is not
tested.
The single recording units selected will be each Performance Indicator, a unit that convey the
most focused and significant message to the Strategic Planning reader.
These recording units satisfy the requirement of having meanings independent of one another
given that the objects that are considered must be distinct, conceptually or logically. The
wholeness of a unit of analysis suggests that it is not further divided in the course of the analysis
or at a particular stage of an analysis51. Another key factor is that the data should communicate
and convey a message from a sender to a receiver52 and the Performance Indicators, presented
49 Dumay J. Cai L. (2015). Using content analysis as a research methodology for investigating intellectual capital disclosure: A critique. Article in Journal of Intellectual Capital · January 2015. p. 6 50 http://www.board.com/en 51 Krippendorff, K. (2004). Content analysis: An introduction to its methodology. SAGE, London, p. 97-98 52 White M. , Marsh E. (2006). Content Analysis: A Flexible Methodology, p. 27
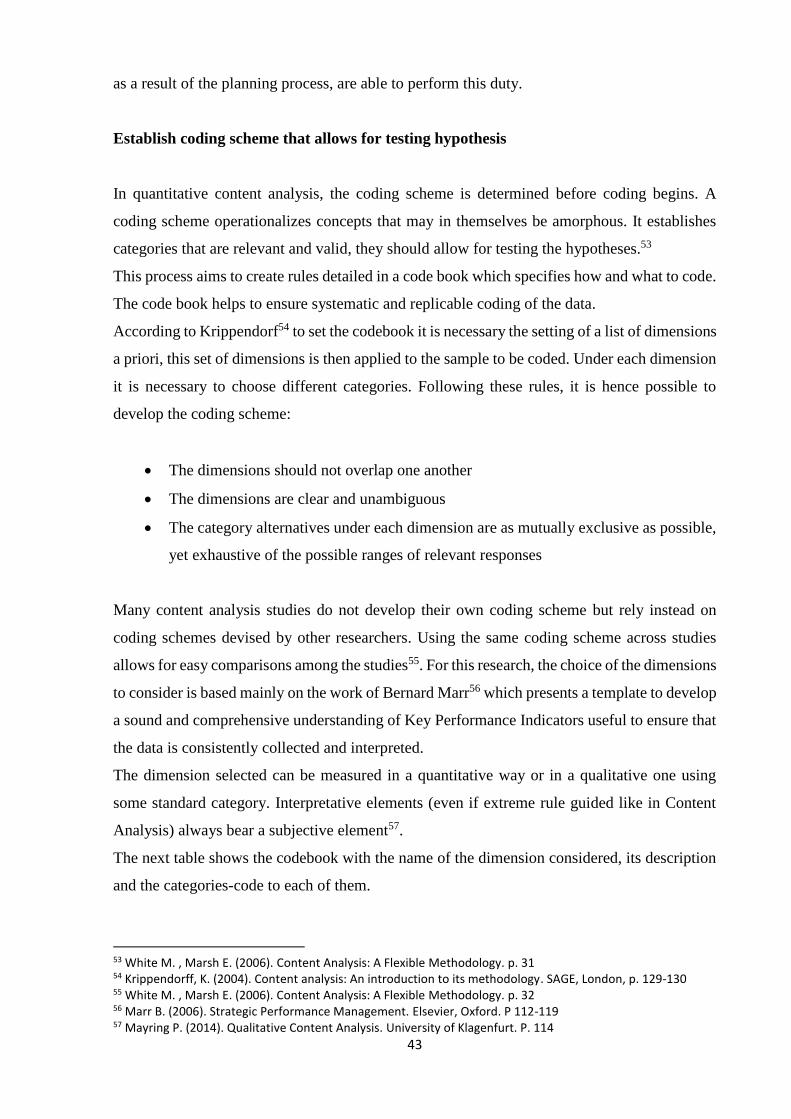
43
as a result of the planning process, are able to perform this duty.
Establish coding scheme that allows for testing hypothesis
In quantitative content analysis, the coding scheme is determined before coding begins. A
coding scheme operationalizes concepts that may in themselves be amorphous. It establishes
categories that are relevant and valid, they should allow for testing the hypotheses.53
This process aims to create rules detailed in a code book which specifies how and what to code.
The code book helps to ensure systematic and replicable coding of the data.
According to Krippendorf54 to set the codebook it is necessary the setting of a list of dimensions
a priori, this set of dimensions is then applied to the sample to be coded. Under each dimension
it is necessary to choose different categories. Following these rules, it is hence possible to
develop the coding scheme:
• The dimensions should not overlap one another
• The dimensions are clear and unambiguous
• The category alternatives under each dimension are as mutually exclusive as possible,
yet exhaustive of the possible ranges of relevant responses
Many content analysis studies do not develop their own coding scheme but rely instead on
coding schemes devised by other researchers. Using the same coding scheme across studies
allows for easy comparisons among the studies55. For this research, the choice of the dimensions
to consider is based mainly on the work of Bernard Marr56 which presents a template to develop
a sound and comprehensive understanding of Key Performance Indicators useful to ensure that
the data is consistently collected and interpreted.
The dimension selected can be measured in a quantitative way or in a qualitative one using
some standard category. Interpretative elements (even if extreme rule guided like in Content
Analysis) always bear a subjective element57.
The next table shows the codebook with the name of the dimension considered, its description
and the categories-code to each of them.
53 White M. , Marsh E. (2006). Content Analysis: A Flexible Methodology. p. 31 54 Krippendorff, K. (2004). Content analysis: An introduction to its methodology. SAGE, London, p. 129-130 55 White M. , Marsh E. (2006). Content Analysis: A Flexible Methodology. p. 32 56 Marr B. (2006). Strategic Performance Management. Elsevier, Oxford. P 112-119 57 Mayring P. (2014). Qualitative Content Analysis. University of Klagenfurt. P. 114
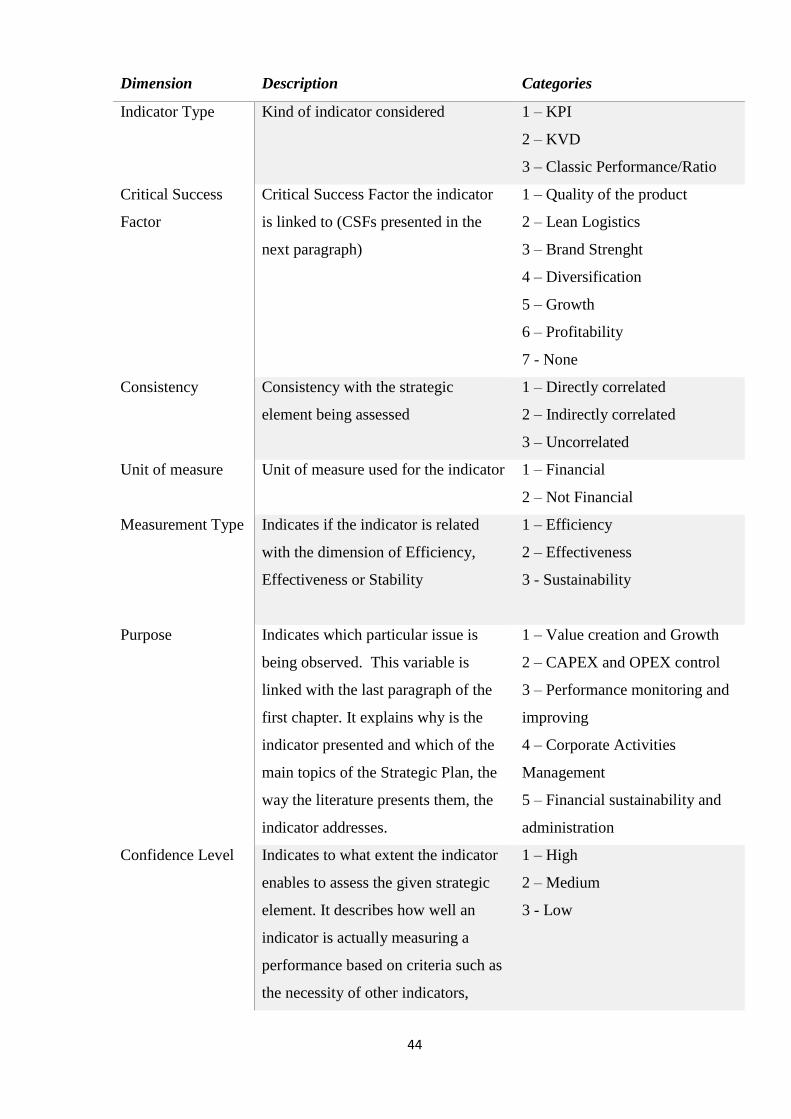
44
Dimension Description Categories
Indicator Type Kind of indicator considered 1 – KPI
2 – KVD
3 – Classic Performance/Ratio
Critical Success
Factor
Critical Success Factor the indicator
is linked to (CSFs presented in the
next paragraph)
1 – Quality of the product
2 – Lean Logistics
3 – Brand Strenght
4 – Diversification
5 – Growth
6 – Profitability
7 - None
Consistency Consistency with the strategic
element being assessed
1 – Directly correlated
2 – Indirectly correlated
3 – Uncorrelated
Unit of measure Unit of measure used for the indicator 1 – Financial
2 – Not Financial
Measurement Type Indicates if the indicator is related
with the dimension of Efficiency,
Effectiveness or Stability
1 – Efficiency
2 – Effectiveness
3 - Sustainability
Purpose Indicates which particular issue is
being observed. This variable is
linked with the last paragraph of the
first chapter. It explains why is the
indicator presented and which of the
main topics of the Strategic Plan, the
way the literature presents them, the
indicator addresses.
1 – Value creation and Growth
2 – CAPEX and OPEX control
3 – Performance monitoring and
improving
4 – Corporate Activities
Management
5 – Financial sustainability and
administration
Confidence Level Indicates to what extent the indicator
enables to assess the given strategic
element. It describes how well an
indicator is actually measuring a
performance based on criteria such as
the necessity of other indicators,
1 – High
2 – Medium
3 - Low
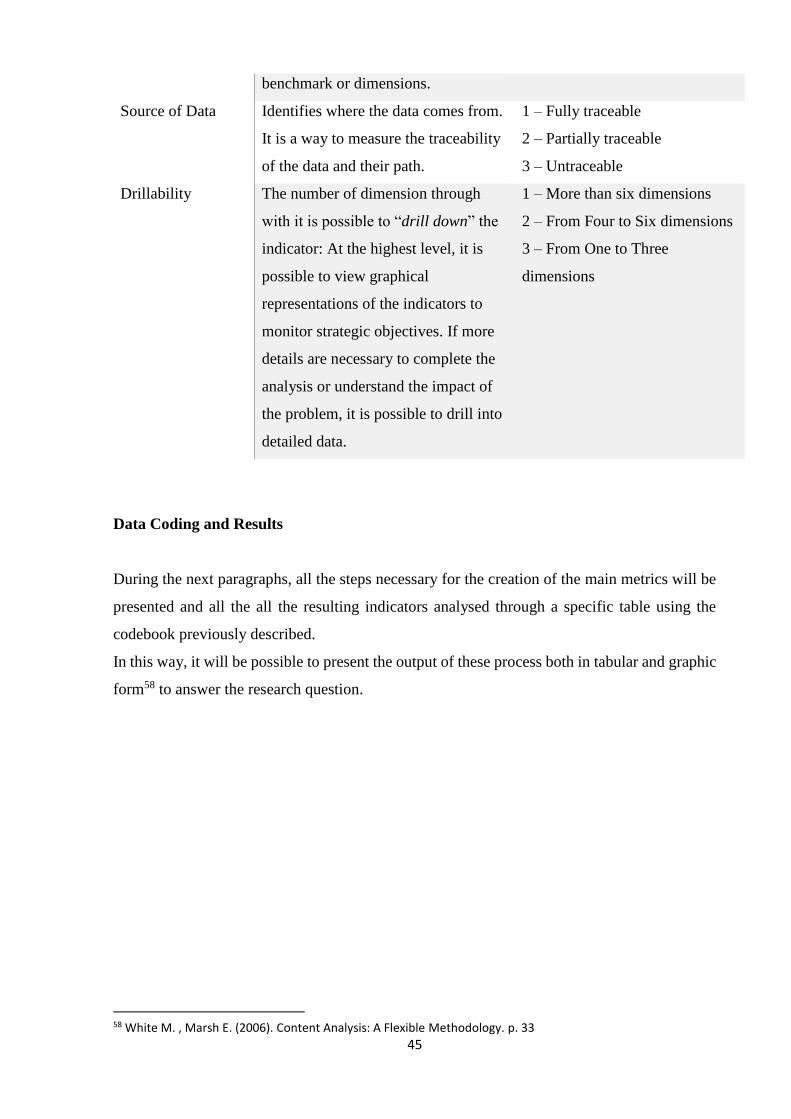
45
benchmark or dimensions.
Source of Data Identifies where the data comes from.
It is a way to measure the traceability
of the data and their path.
1 – Fully traceable
2 – Partially traceable
3 – Untraceable
Drillability The number of dimension through
with it is possible to “drill down” the
indicator: At the highest level, it is
possible to view graphical
representations of the indicators to
monitor strategic objectives. If more
details are necessary to complete the
analysis or understand the impact of
the problem, it is possible to drill into
detailed data.
1 – More than six dimensions
2 – From Four to Six dimensions
3 – From One to Three
dimensions
Data Coding and Results
During the next paragraphs, all the steps necessary for the creation of the main metrics will be
presented and all the all the resulting indicators analysed through a specific table using the
codebook previously described.
In this way, it will be possible to present the output of these process both in tabular and graphic
form58 to answer the research question.
58 White M. , Marsh E. (2006). Content Analysis: A Flexible Methodology. p. 33
46
Assumptions: The Company
The company considered for this analysis will be called Alfa from now on.
Alfa is an industrial company operating in the food and beverage industry. It is mainly focused
in the EMEA market even though it is present also in other countries. The firm is undertaking
an inorganic growth path diversifying its offer from both the market side and the product side.
To implement a successful strategy Alfa individuated the following Critical Success Factors:
1. Quality of the product: guarantee of the vertical value chain that delivers a premium
product
2. Lean Logistics: control of the logistics to optimize the cost structure and improve the
service
3. Brand Strength: awareness of a Brand that allows the possibility to charge a premium
price
4. Diversification: development of new Business Lines and interaction with new markets
5. Growth: increase of the revenue growth both through acquisition of new companies and
pushing the sales in the actual markets
6. Profitability: link with the growth and diversification to take advantage of economies
of scale and scope and attention to the product unit margin.
These CSFs are the drivers of every data and business analysis, and they will be measured using
particular KPIs.
The model that will be shown represents the preparatory works for the draft of the Strategic
Plan’s quantitative part with a planning horizon of 4 years.
However, the process was designed to be dynamic and subject to different simulations and
variations. These characteristics are necessary in order to adapt the model to the uncertainty of
business environment and to allow periodic review of the Strategic Plan itself.
The planning process should allow Alfa to satisfy the following business needs:
• Manage the economic forecasts for each market
• Calculate the cash flows coming from the different Strategic Business Units
• Confirm the brands value over time
• Meet the auditors requests in terms of traceability and reliability
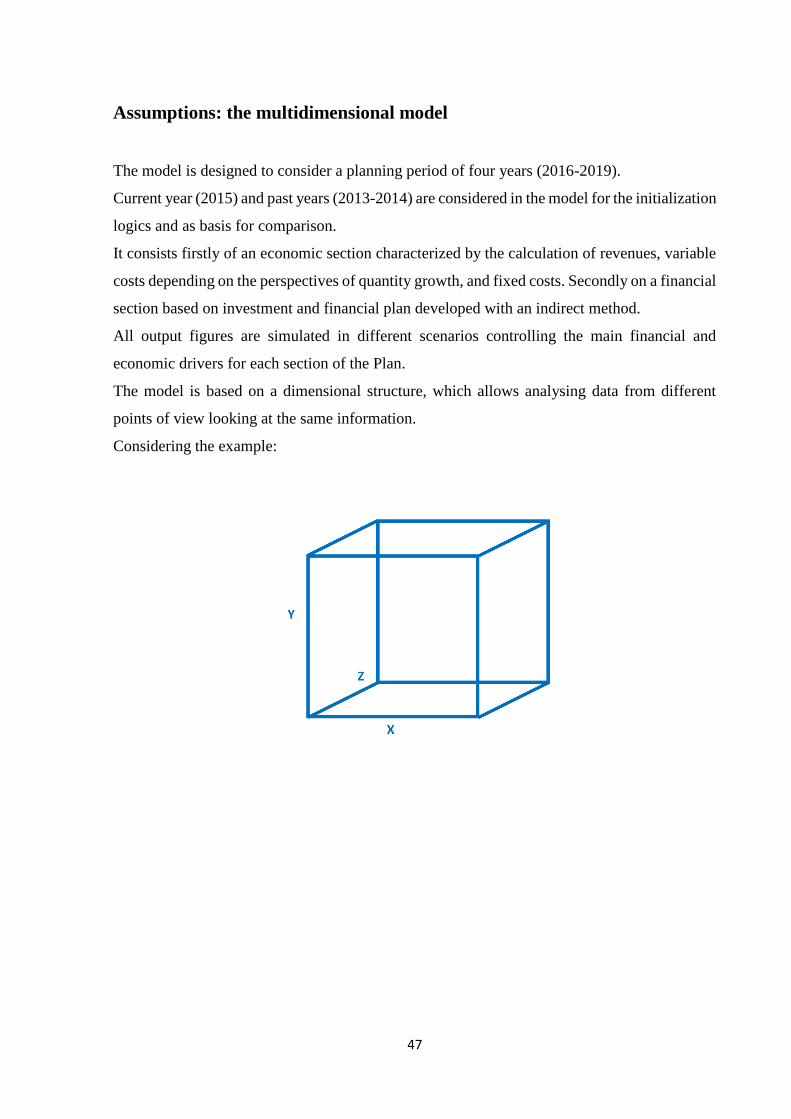
47
Assumptions: the multidimensional model
The model is designed to consider a planning period of four years (2016-2019).
Current year (2015) and past years (2013-2014) are considered in the model for the initialization
logics and as basis for comparison.
It consists firstly of an economic section characterized by the calculation of revenues, variable
costs depending on the perspectives of quantity growth, and fixed costs. Secondly on a financial
section based on investment and financial plan developed with an indirect method.
All output figures are simulated in different scenarios controlling the main financial and
economic drivers for each section of the Plan.
The model is based on a dimensional structure, which allows analysing data from different
points of view looking at the same information.
Considering the example:
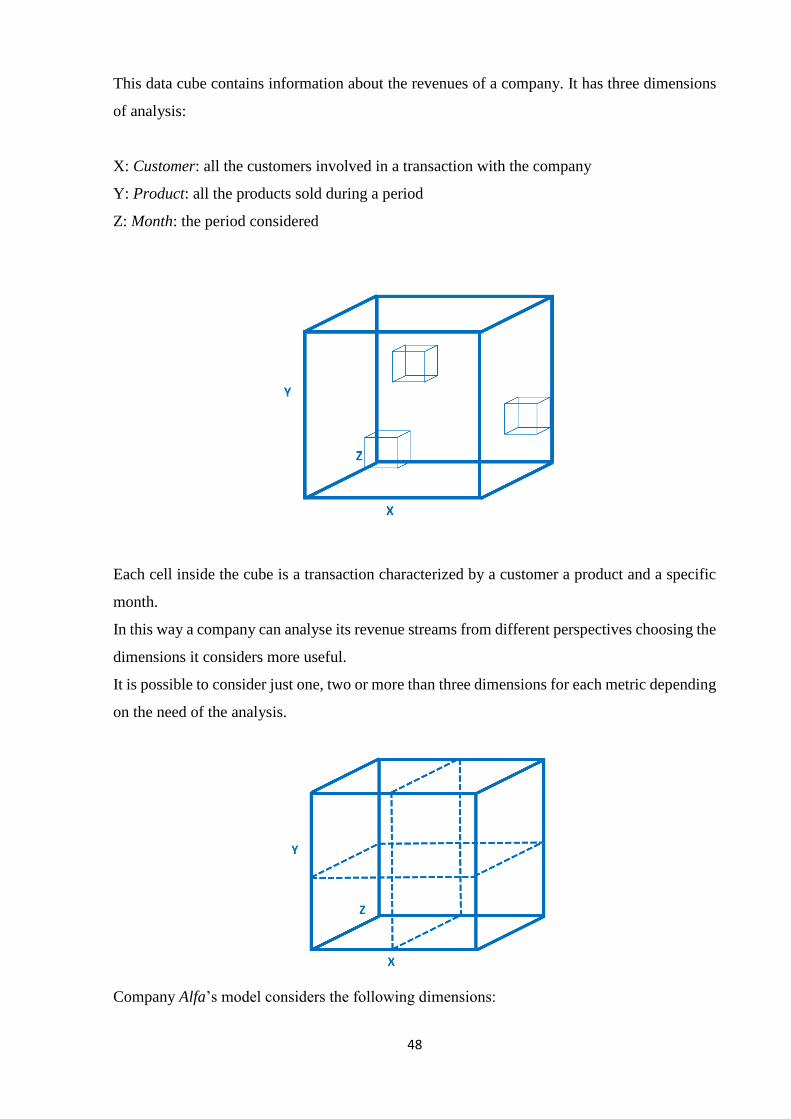
48
This data cube contains information about the revenues of a company. It has three dimensions
of analysis:
X: Customer: all the customers involved in a transaction with the company
Y: Product: all the products sold during a period
Z: Month: the period considered
Each cell inside the cube is a transaction characterized by a customer a product and a specific
month.
In this way a company can analyse its revenue streams from different perspectives choosing the
dimensions it considers more useful.
It is possible to consider just one, two or more than three dimensions for each metric depending
on the need of the analysis.
Company Alfa’s model considers the following dimensions:
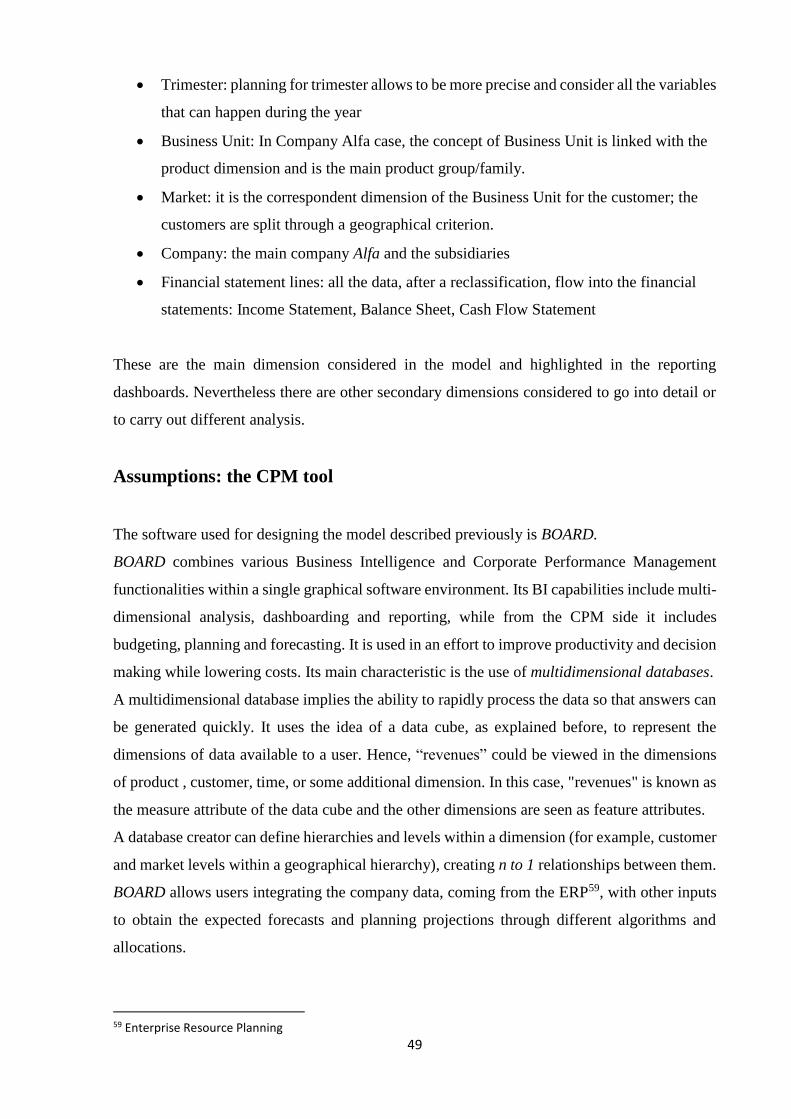
49
• Trimester: planning for trimester allows to be more precise and consider all the variables
that can happen during the year
• Business Unit: In Company Alfa case, the concept of Business Unit is linked with the
product dimension and is the main product group/family.
• Market: it is the correspondent dimension of the Business Unit for the customer; the
customers are split through a geographical criterion.
• Company: the main company Alfa and the subsidiaries
• Financial statement lines: all the data, after a reclassification, flow into the financial
statements: Income Statement, Balance Sheet, Cash Flow Statement
These are the main dimension considered in the model and highlighted in the reporting
dashboards. Nevertheless there are other secondary dimensions considered to go into detail or
to carry out different analysis.
Assumptions: the CPM tool
The software used for designing the model described previously is BOARD.
BOARD combines various Business Intelligence and Corporate Performance Management
functionalities within a single graphical software environment. Its BI capabilities include multi-
dimensional analysis, dashboarding and reporting, while from the CPM side it includes
budgeting, planning and forecasting. It is used in an effort to improve productivity and decision
making while lowering costs. Its main characteristic is the use of multidimensional databases.
A multidimensional database implies the ability to rapidly process the data so that answers can
be generated quickly. It uses the idea of a data cube, as explained before, to represent the
dimensions of data available to a user. Hence, “revenues” could be viewed in the dimensions
of product , customer, time, or some additional dimension. In this case, "revenues" is known as
the measure attribute of the data cube and the other dimensions are seen as feature attributes.
A database creator can define hierarchies and levels within a dimension (for example, customer
and market levels within a geographical hierarchy), creating n to 1 relationships between them.
BOARD allows users integrating the company data, coming from the ERP59, with other inputs
to obtain the expected forecasts and planning projections through different algorithms and
allocations.
59 Enterprise Resource Planning
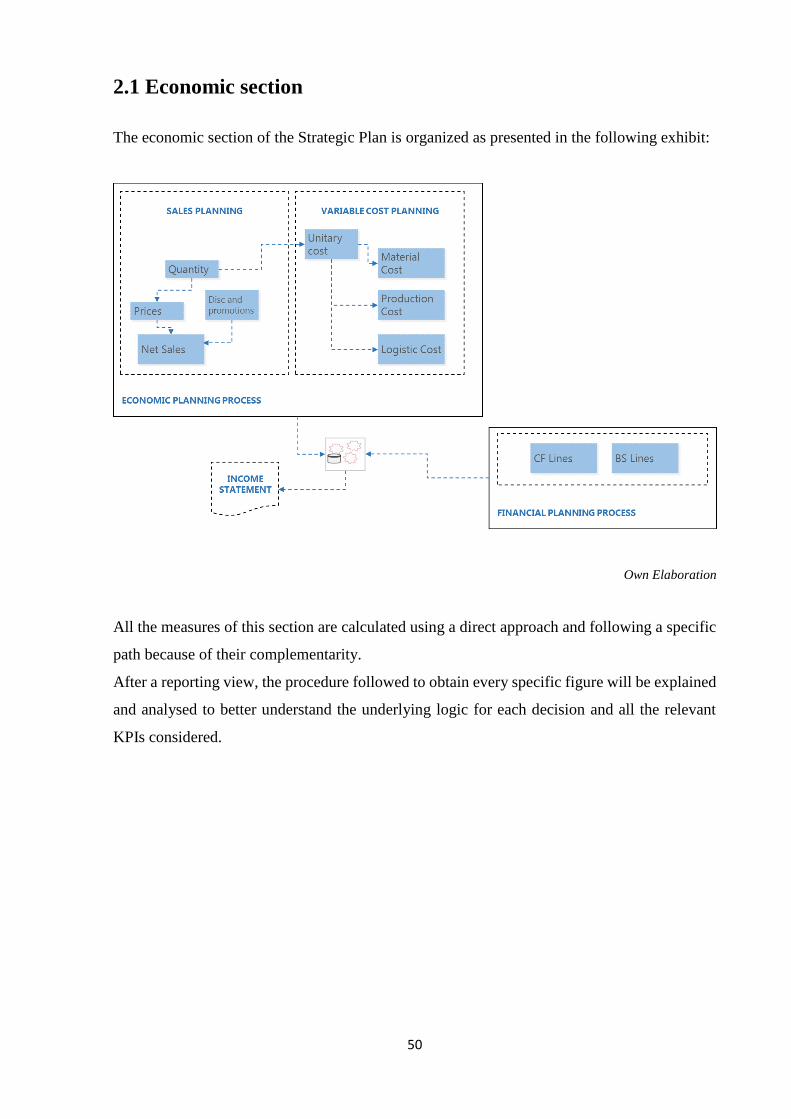
50
2.1 Economic section
The economic section of the Strategic Plan is organized as presented in the following exhibit:
Own Elaboration
All the measures of this section are calculated using a direct approach and following a specific
path because of their complementarity.
After a reporting view, the procedure followed to obtain every specific figure will be explained
and analysed to better understand the underlying logic for each decision and all the relevant
KPIs considered.

51
2.1.1 Sales Planning
The analysis of the revenues through a CPM tool allows monitoring their trend over time both
as a whole and for each single company.
Moreover, the multidimensional model allows considering the different perspectives of this
trend examining the development from a market point of view and from a product one. The
control of specific KPIs allows an effective Critical Success Factors analysis.
The first step to analyse the revenues is examine the Sales Dashboard, the final report that
represents the growth of the Net Net Sales60 over time and all the product and market analysis.
Net Net Sales and EBITDA in this case were chosen as KVD and KPI to measure the actual
growth of Alfa. They consider both the Sales of existing companies and the Sales of the new
acquisitions.
The evaluation of these KPIs requires a deeper analysis and further calculation of other metrics
as Discounts, Promotion and Listing for Net Net Sales, and all other necessary costs for the
calculation of EBITDA. The simultaneous use of these KPIs allows also understanding if the
company growth is healthy and profitable or pathological.
Exhibit 1: Exhibit from BOARD Strategic Plan Model
The first graph (Exhibit 1) of the report shows these KPIs in order to analyse the expected
60 Amounts of sales generated by a company after the deduction of discounts and promotion. The calculation of the latter will be discussed in the next paragraphs
52
performance of Alfa in the planning period: the increase of absolute value of Net Net Sales and
the growth of EBITDA percentage.
The comparison of forecast data (2016-2019) with the historical (2013-2015) is important to
underline the continuity of projections according to the Reliability principle of Borsa Italiana.
The revenue growth rate is an indicator that cannot change excessively from one period to
another, unless justified, and the lacking exposure of this comparison would reduce the utility
of the forecast data considered that it would not facilitate the understanding of the company
trend over time.
Especially in the first year of plan, the growth of the figures is relatively restrained:
Net Net Sales 2015 vs 2016: 1.078 1.196 (+10,9%)
EBITDA 2015 vs 2016: 6,47 6,59 (+1,9%)
It is extremely important to understand how the company is structured from an organizational
point of view and how the information flow is conveyed to the management.
Through this information the management can measure the performance of a specific significant
segment or the one of the company as whole.
IAS 1461 suggests preferring the business segment and geographical segment analysis.
The mapping of the organizational structure by Business Unit or Market is the instrument that
allows to reach an all-around understanding of the risks and opportunities of a diversified
company.
The standard explains how to classify a business or geographical segment using a list of drivers
as following62:
Business segment:
• Product characteristics
• Productive process
• Customer cluster
• Sales channel to reach the market
61 Deloitte, IAS 14 — Segment Reporting (Superseded), URL: https://www.iasplus.com/en/standards/ias/ias14 62 Angiola N., 2007, La comunicazione economico-finanziaria dei gruppi italiani quotati. Un’indagine empirica sull’informativa settoriale. Milano: Franco Angeli. P.: 21-30

53
Geographical segment:
• Economic and political environment
• Risks of specific geographical areas
• Activities performed in particular areas
• Currency equality
These are the main segments indicated by IAS 14. Anyhow, there are no limits to the selection
of other kinds of segment to represent company data.
Company Alfa, as explained in the previous paragraph, considers as main segments the Business
Unit and the Market: a business segment and a geographical segment.
The former is based on the similarity of product characteristic. The latter is based on the location
of the destination customers that are involved in company transactions.
The second graph of the report is a Bubble Chart and represents the Sales analysis by Business
Unit.
As explained in the previous chapter, Management needs to prepare a competitive strategy for
each Business Unit together with an integrated vision of all of them to generate an effective
value.
The contribution of each BU should be disclosed in static and dynamic terms and it is evaluated
considering its actual and future profitability and growth.
This kind of analysis is just another perspective of the previous one and considers the same
KPIs (Net Net Sales and EBITDA) but allows to measure and to simulate the impact of the
strategy on another Critical Success Factor: Product diversification.
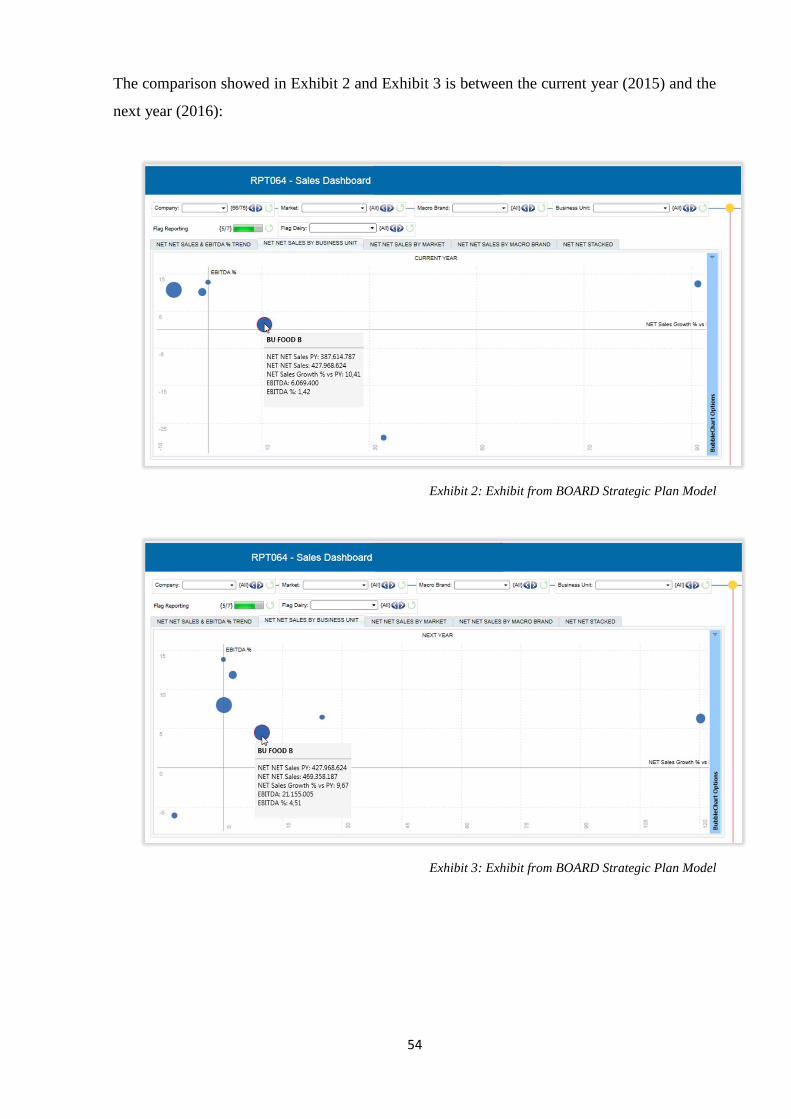
54
The comparison showed in Exhibit 2 and Exhibit 3 is between the current year (2015) and the
next year (2016):
Exhibit 2: Exhibit from BOARD Strategic Plan Model
Exhibit 3: Exhibit from BOARD Strategic Plan Model
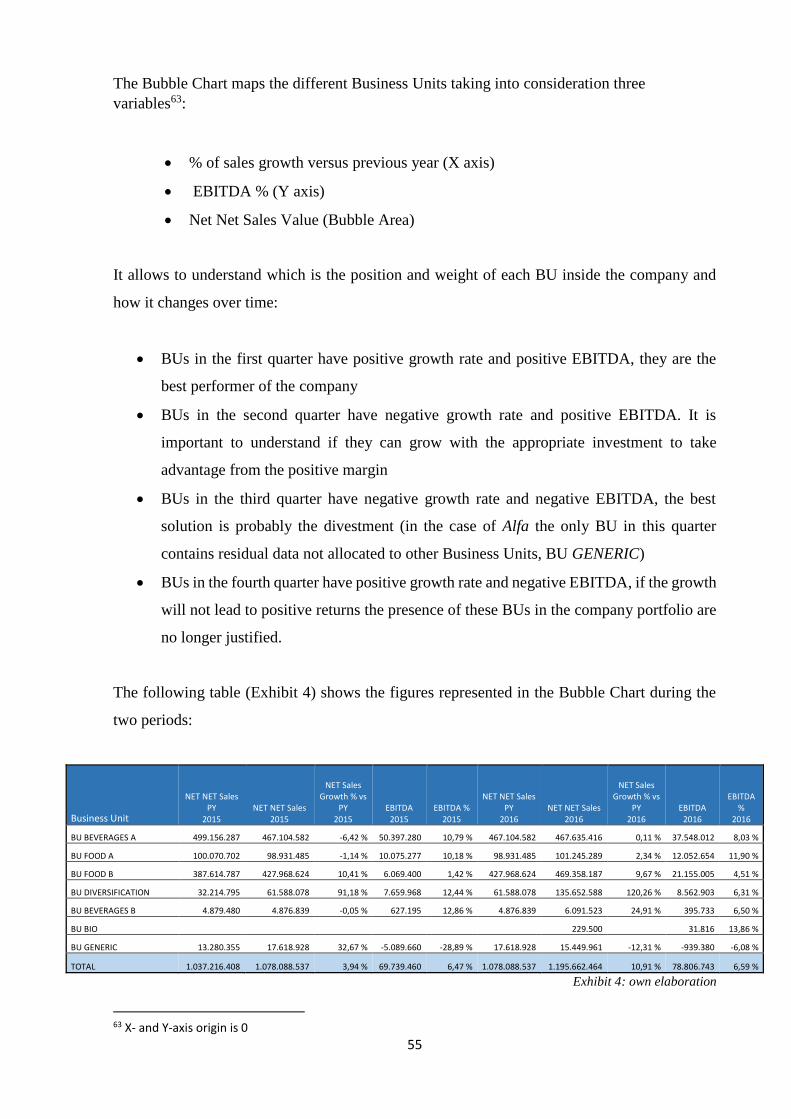
55
The Bubble Chart maps the different Business Units taking into consideration three
variables63:
• % of sales growth versus previous year (X axis)
• EBITDA % (Y axis)
• Net Net Sales Value (Bubble Area)
It allows to understand which is the position and weight of each BU inside the company and
how it changes over time:
• BUs in the first quarter have positive growth rate and positive EBITDA, they are the
best performer of the company
• BUs in the second quarter have negative growth rate and positive EBITDA. It is
important to understand if they can grow with the appropriate investment to take
advantage from the positive margin
• BUs in the third quarter have negative growth rate and negative EBITDA, the best
solution is probably the divestment (in the case of Alfa the only BU in this quarter
contains residual data not allocated to other Business Units, BU GENERIC)
• BUs in the fourth quarter have positive growth rate and negative EBITDA, if the growth
will not lead to positive returns the presence of these BUs in the company portfolio are
no longer justified.
The following table (Exhibit 4) shows the figures represented in the Bubble Chart during the
two periods:
Business Unit
NET NET Sales PY
2015 NET NET Sales
2015
NET Sales Growth % vs
PY 2015
EBITDA 2015
EBITDA % 2015
NET NET Sales PY
2016 NET NET Sales
2016
NET Sales Growth % vs
PY 2016
EBITDA 2016
EBITDA %
2016
BU BEVERAGES A 499.156.287 467.104.582 -6,42 % 50.397.280 10,79 % 467.104.582 467.635.416 0,11 % 37.548.012 8,03 %
BU FOOD A 100.070.702 98.931.485 -1,14 % 10.075.277 10,18 % 98.931.485 101.245.289 2,34 % 12.052.654 11,90 %
BU FOOD B 387.614.787 427.968.624 10,41 % 6.069.400 1,42 % 427.968.624 469.358.187 9,67 % 21.155.005 4,51 %
BU DIVERSIFICATION 32.214.795 61.588.078 91,18 % 7.659.968 12,44 % 61.588.078 135.652.588 120,26 % 8.562.903 6,31 %
BU BEVERAGES B 4.879.480 4.876.839 -0,05 % 627.195 12,86 % 4.876.839 6.091.523 24,91 % 395.733 6,50 %
BU BIO 229.500 31.816 13,86 %
BU GENERIC 13.280.355 17.618.928 32,67 % -5.089.660 -28,89 % 17.618.928 15.449.961 -12,31 % -939.380 -6,08 %
TOTAL 1.037.216.408 1.078.088.537 3,94 % 69.739.460 6,47 % 1.078.088.537 1.195.662.464 10,91 % 78.806.743 6,59 %
Exhibit 4: own elaboration
63 X- and Y-axis origin is 0
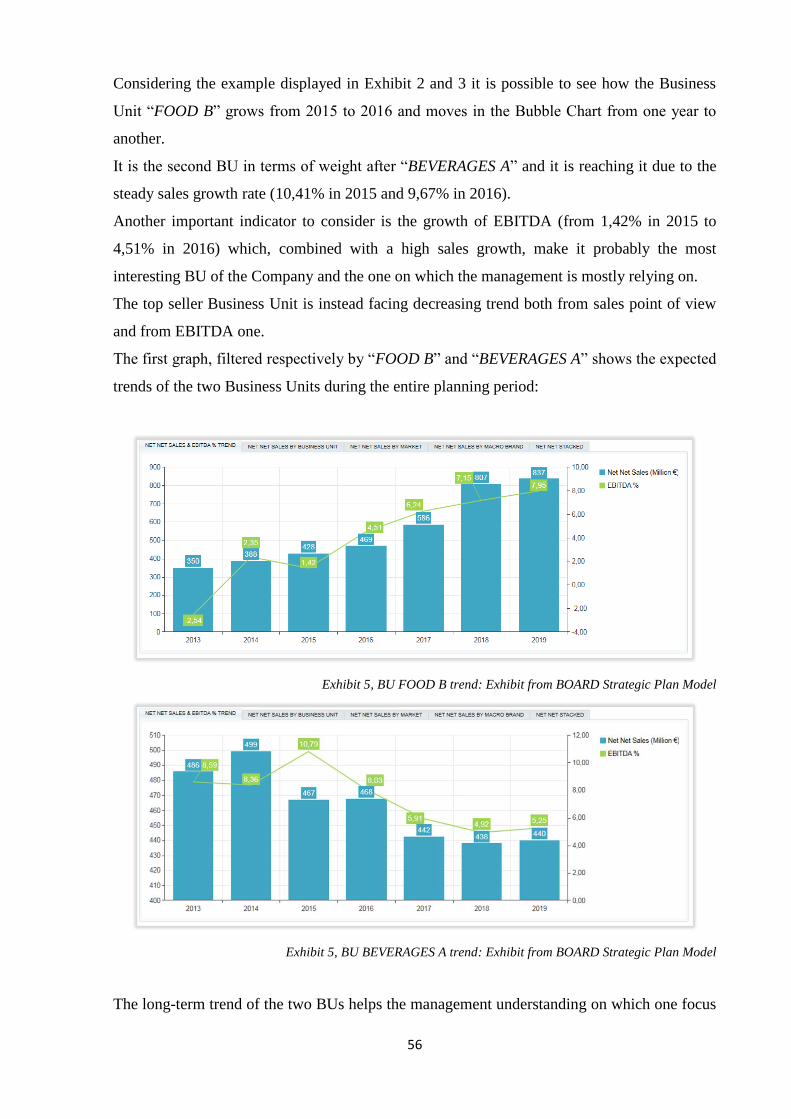
56
Considering the example displayed in Exhibit 2 and 3 it is possible to see how the Business
Unit “FOOD B” grows from 2015 to 2016 and moves in the Bubble Chart from one year to
another.
It is the second BU in terms of weight after “BEVERAGES A” and it is reaching it due to the
steady sales growth rate (10,41% in 2015 and 9,67% in 2016).
Another important indicator to consider is the growth of EBITDA (from 1,42% in 2015 to
4,51% in 2016) which, combined with a high sales growth, make it probably the most
interesting BU of the Company and the one on which the management is mostly relying on.
The top seller Business Unit is instead facing decreasing trend both from sales point of view
and from EBITDA one.
The first graph, filtered respectively by “FOOD B” and “BEVERAGES A” shows the expected
trends of the two Business Units during the entire planning period:
Exhibit 5, BU FOOD B trend: Exhibit from BOARD Strategic Plan Model
Exhibit 5, BU BEVERAGES A trend: Exhibit from BOARD Strategic Plan Model
The long-term trend of the two BUs helps the management understanding on which one focus
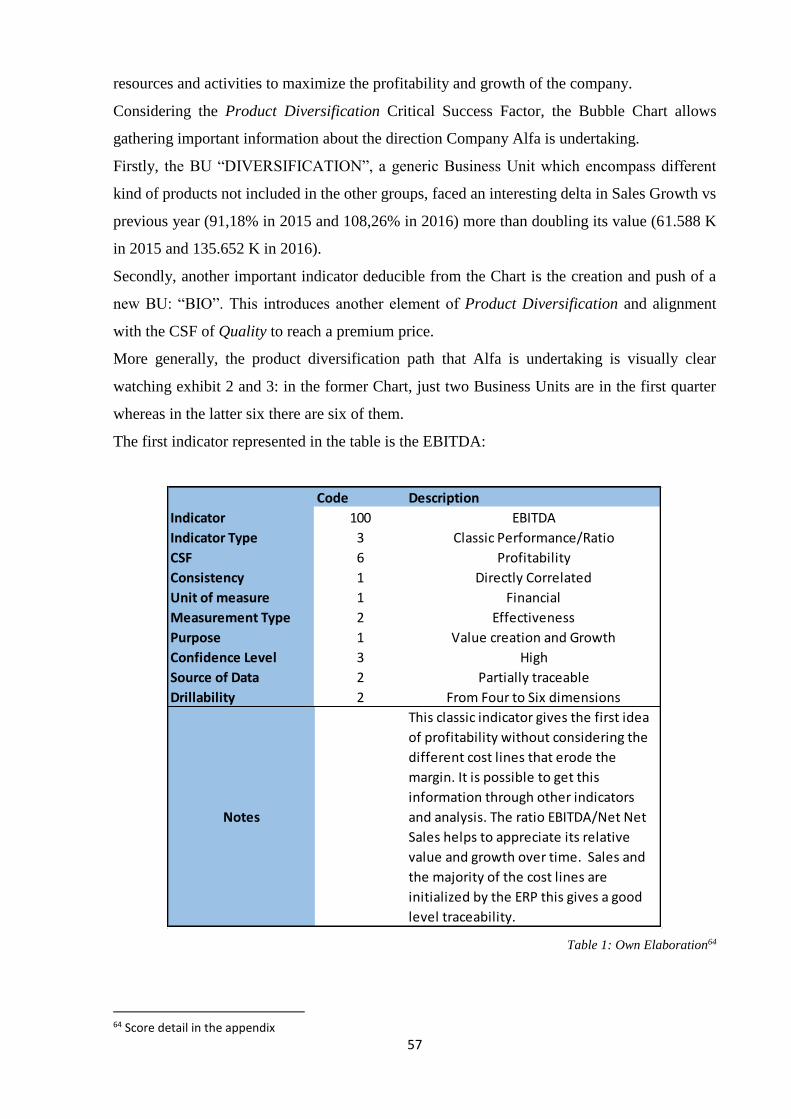
57
resources and activities to maximize the profitability and growth of the company.
Considering the Product Diversification Critical Success Factor, the Bubble Chart allows
gathering important information about the direction Company Alfa is undertaking.
Firstly, the BU “DIVERSIFICATION”, a generic Business Unit which encompass different
kind of products not included in the other groups, faced an interesting delta in Sales Growth vs
previous year (91,18% in 2015 and 108,26% in 2016) more than doubling its value (61.588 K
in 2015 and 135.652 K in 2016).
Secondly, another important indicator deducible from the Chart is the creation and push of a
new BU: “BIO”. This introduces another element of Product Diversification and alignment
with the CSF of Quality to reach a premium price.
More generally, the product diversification path that Alfa is undertaking is visually clear
watching exhibit 2 and 3: in the former Chart, just two Business Units are in the first quarter
whereas in the latter six there are six of them.
The first indicator represented in the table is the EBITDA:
Table 1: Own Elaboration64
64 Score detail in the appendix
Code Description
Indicator 100 EBITDA
Indicator Type 3 Classic Performance/Ratio
CSF 6 Profitability
Consistency 1 Directly Correlated
Unit of measure 1 Financial
Measurement Type 2 Effectiveness
Purpose 1 Value creation and Growth
Confidence Level 3 High
Source of Data 2 Partially traceable
Drillability 2 From Four to Six dimensions
Notes
This classic indicator gives the first idea
of profitability without considering the
different cost lines that erode the
margin. It is possible to get this
information through other indicators
and analysis. The ratio EBITDA/Net Net
Sales helps to appreciate its relative
value and growth over time. Sales and
the majority of the cost lines are
initialized by the ERP this gives a good
level traceability.
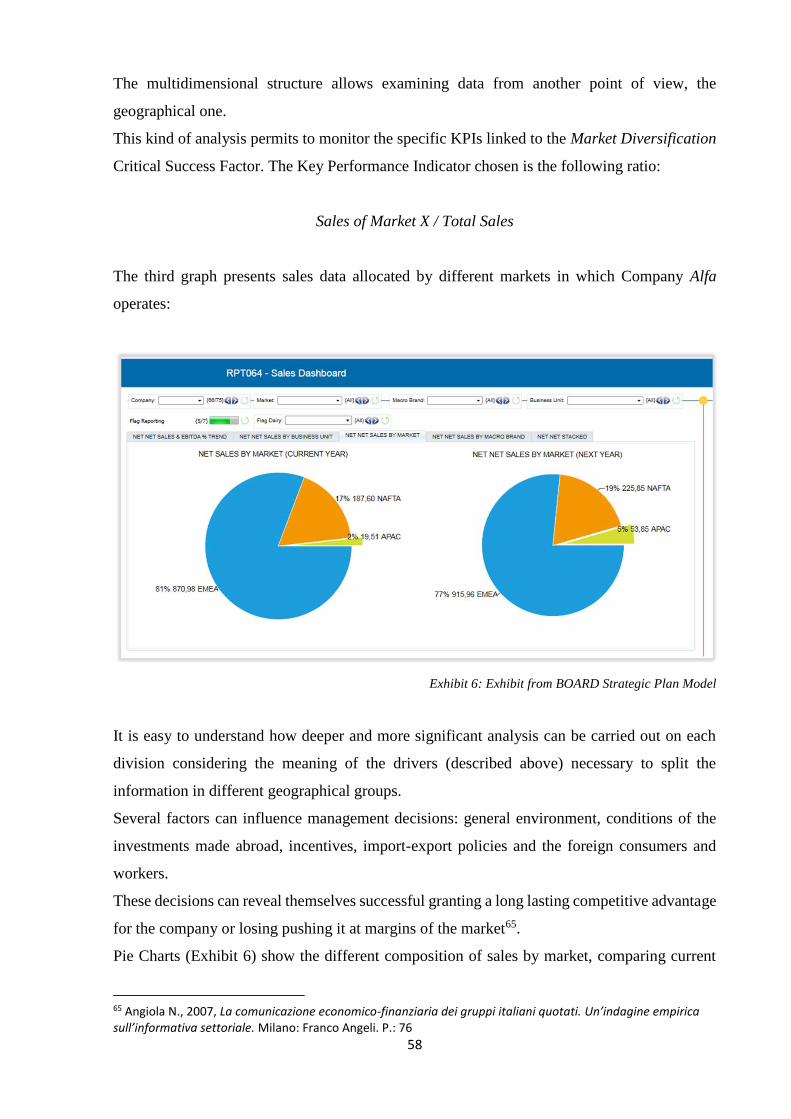
58
The multidimensional structure allows examining data from another point of view, the
geographical one.
This kind of analysis permits to monitor the specific KPIs linked to the Market Diversification
Critical Success Factor. The Key Performance Indicator chosen is the following ratio:
Sales of Market X / Total Sales
The third graph presents sales data allocated by different markets in which Company Alfa
operates:
Exhibit 6: Exhibit from BOARD Strategic Plan Model
It is easy to understand how deeper and more significant analysis can be carried out on each
division considering the meaning of the drivers (described above) necessary to split the
information in different geographical groups.
Several factors can influence management decisions: general environment, conditions of the
investments made abroad, incentives, import-export policies and the foreign consumers and
workers.
These decisions can reveal themselves successful granting a long lasting competitive advantage
for the company or losing pushing it at margins of the market65.
Pie Charts (Exhibit 6) show the different composition of sales by market, comparing current
65 Angiola N., 2007, La comunicazione economico-finanziaria dei gruppi italiani quotati. Un’indagine empirica sull’informativa settoriale. Milano: Franco Angeli. P.: 76

59
year (2015) with next year (2016).
In current year the large majority of sales are in EMEA market (81%) followed by NAFTA
(17%) and APAC (2%).
Figures prove the market diversification strategy that the company means to pursue.
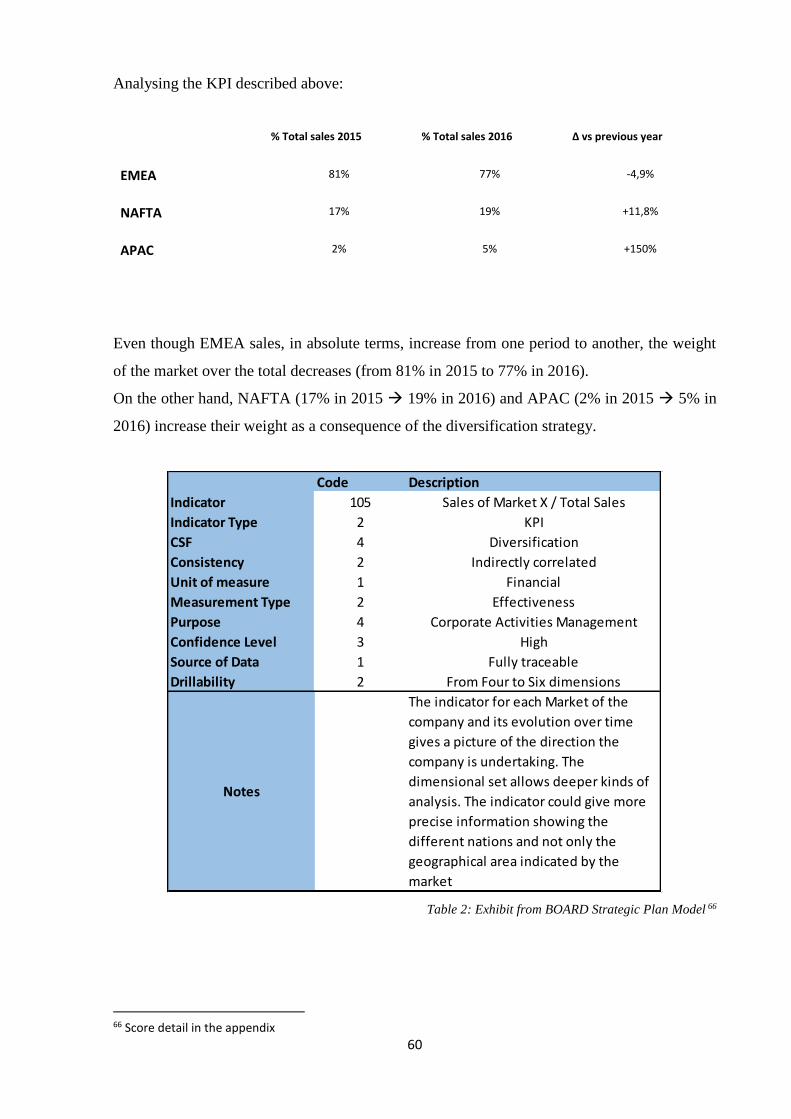
60
Analysing the KPI described above:
% Total sales 2015 % Total sales 2016 Δ vs previous year
EMEA 81% 77% -4,9%
NAFTA 17% 19% +11,8%
APAC 2% 5% +150%
Even though EMEA sales, in absolute terms, increase from one period to another, the weight
of the market over the total decreases (from 81% in 2015 to 77% in 2016).
On the other hand, NAFTA (17% in 2015 19% in 2016) and APAC (2% in 2015 5% in
2016) increase their weight as a consequence of the diversification strategy.
Table 2: Exhibit from BOARD Strategic Plan Model 66
66 Score detail in the appendix
Code Description
Indicator 105 Sales of Market X / Total Sales
Indicator Type 2 KPI
CSF 4 Diversification
Consistency 2 Indirectly correlated
Unit of measure 1 Financial
Measurement Type 2 Effectiveness
Purpose 4 Corporate Activities Management
Confidence Level 3 High
Source of Data 1 Fully traceable
Drillability 2 From Four to Six dimensions
Notes
The indicator for each Market of the
company and its evolution over time
gives a picture of the direction the
company is undertaking. The
dimensional set allows deeper kinds of
analysis. The indicator could give more
precise information showing the
different nations and not only the
geographical area indicated by the
market
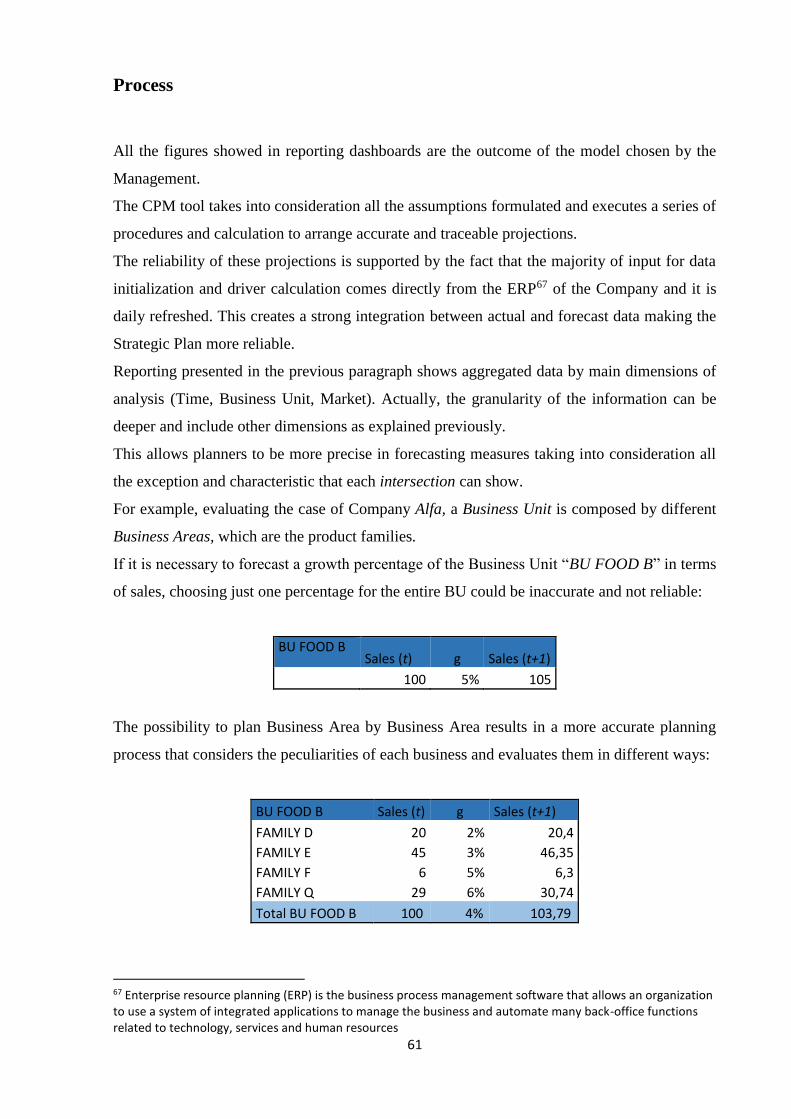
61
Process
All the figures showed in reporting dashboards are the outcome of the model chosen by the
Management.
The CPM tool takes into consideration all the assumptions formulated and executes a series of
procedures and calculation to arrange accurate and traceable projections.
The reliability of these projections is supported by the fact that the majority of input for data
initialization and driver calculation comes directly from the ERP67 of the Company and it is
daily refreshed. This creates a strong integration between actual and forecast data making the
Strategic Plan more reliable.
Reporting presented in the previous paragraph shows aggregated data by main dimensions of
analysis (Time, Business Unit, Market). Actually, the granularity of the information can be
deeper and include other dimensions as explained previously.
This allows planners to be more precise in forecasting measures taking into consideration all
the exception and characteristic that each intersection can show.
For example, evaluating the case of Company Alfa, a Business Unit is composed by different
Business Areas, which are the product families.
If it is necessary to forecast a growth percentage of the Business Unit “BU FOOD B” in terms
of sales, choosing just one percentage for the entire BU could be inaccurate and not reliable:
BU FOOD B Sales (t) g Sales (t+1)
100 5% 105
The possibility to plan Business Area by Business Area results in a more accurate planning
process that considers the peculiarities of each business and evaluates them in different ways:
BU FOOD B Sales (t) g Sales (t+1)
FAMILY D 20 2% 20,4
FAMILY E 45 3% 46,35
FAMILY F 6 5% 6,3
FAMILY Q 29 6% 30,74
Total BU FOOD B 100 4% 103,79
67 Enterprise resource planning (ERP) is the business process management software that allows an organization to use a system of integrated applications to manage the business and automate many back-office functions related to technology, services and human resources
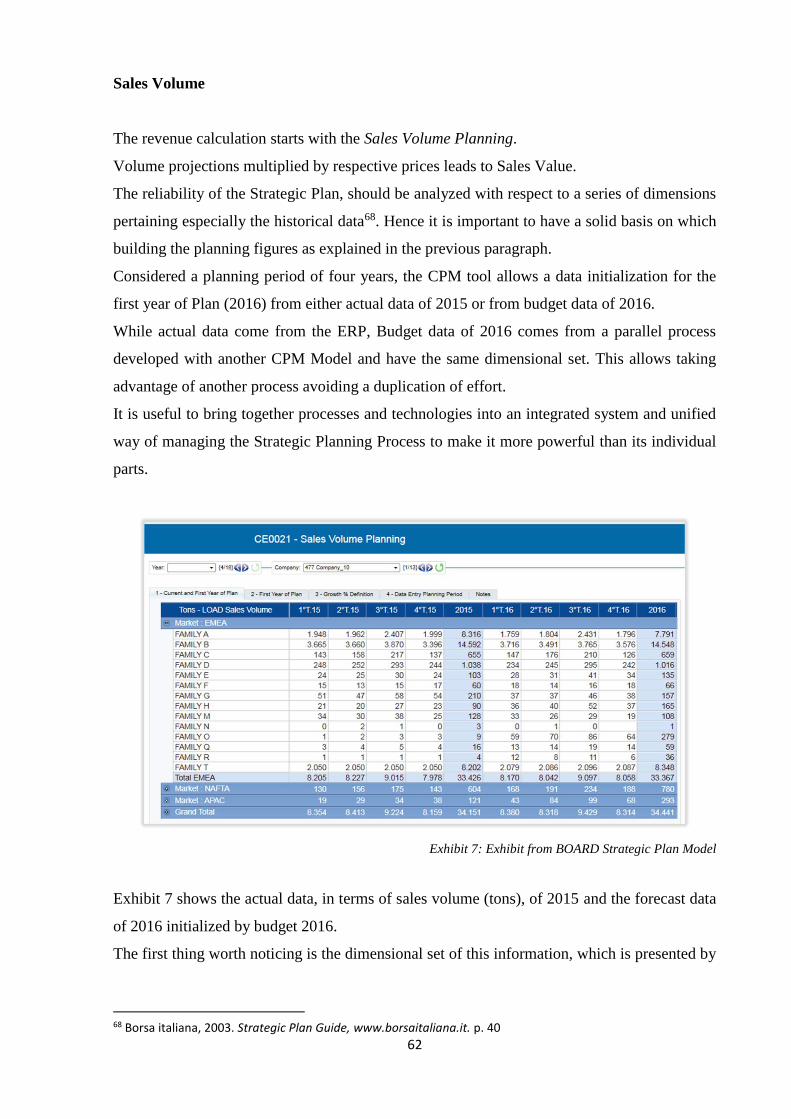
62
Sales Volume
The revenue calculation starts with the Sales Volume Planning.
Volume projections multiplied by respective prices leads to Sales Value.
The reliability of the Strategic Plan, should be analyzed with respect to a series of dimensions
pertaining especially the historical data68. Hence it is important to have a solid basis on which
building the planning figures as explained in the previous paragraph.
Considered a planning period of four years, the CPM tool allows a data initialization for the
first year of Plan (2016) from either actual data of 2015 or from budget data of 2016.
While actual data come from the ERP, Budget data of 2016 comes from a parallel process
developed with another CPM Model and have the same dimensional set. This allows taking
advantage of another process avoiding a duplication of effort.
It is useful to bring together processes and technologies into an integrated system and unified
way of managing the Strategic Planning Process to make it more powerful than its individual
parts.
Exhibit 7: Exhibit from BOARD Strategic Plan Model
Exhibit 7 shows the actual data, in terms of sales volume (tons), of 2015 and the forecast data
of 2016 initialized by budget 2016.
The first thing worth noticing is the dimensional set of this information, which is presented by
68 Borsa italiana, 2003. Strategic Plan Guide, www.borsaitaliana.it. p. 40
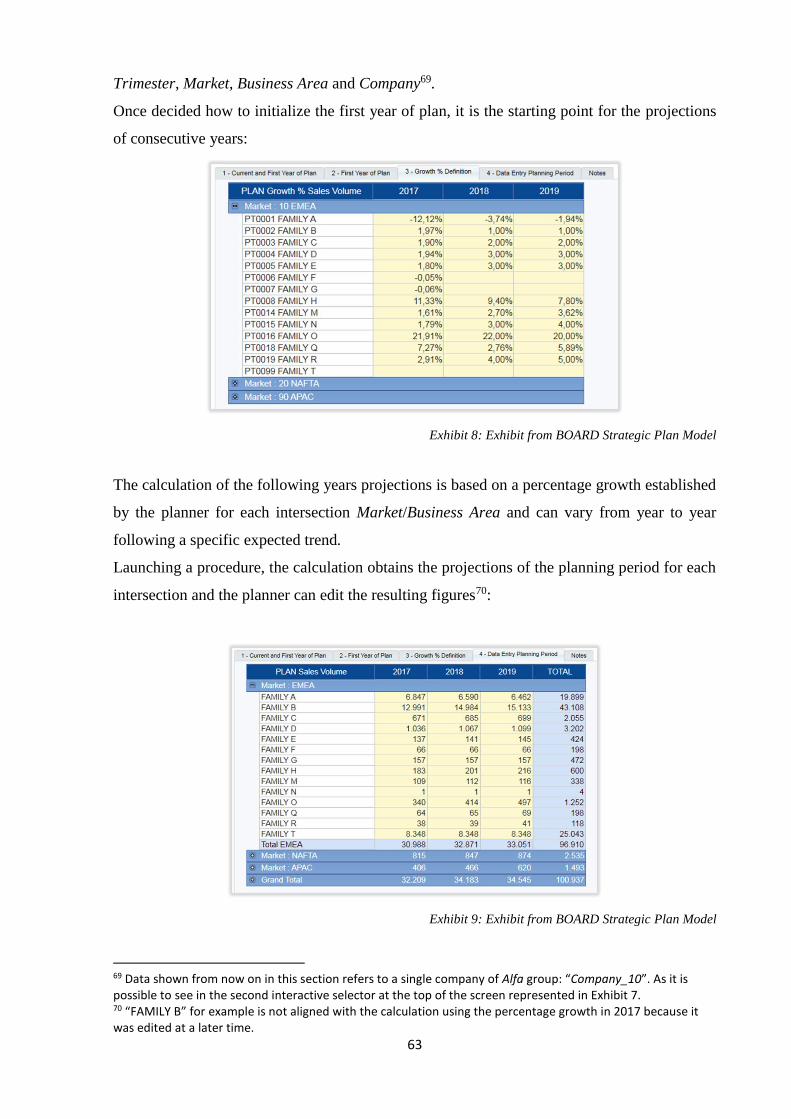
63
Trimester, Market, Business Area and Company69.
Once decided how to initialize the first year of plan, it is the starting point for the projections
of consecutive years:
Exhibit 8: Exhibit from BOARD Strategic Plan Model
The calculation of the following years projections is based on a percentage growth established
by the planner for each intersection Market/Business Area and can vary from year to year
following a specific expected trend.
Launching a procedure, the calculation obtains the projections of the planning period for each
intersection and the planner can edit the resulting figures70:
Exhibit 9: Exhibit from BOARD Strategic Plan Model
69 Data shown from now on in this section refers to a single company of Alfa group: “Company_10”. As it is possible to see in the second interactive selector at the top of the screen represented in Exhibit 7. 70 “FAMILY B” for example is not aligned with the calculation using the percentage growth in 2017 because it was edited at a later time.
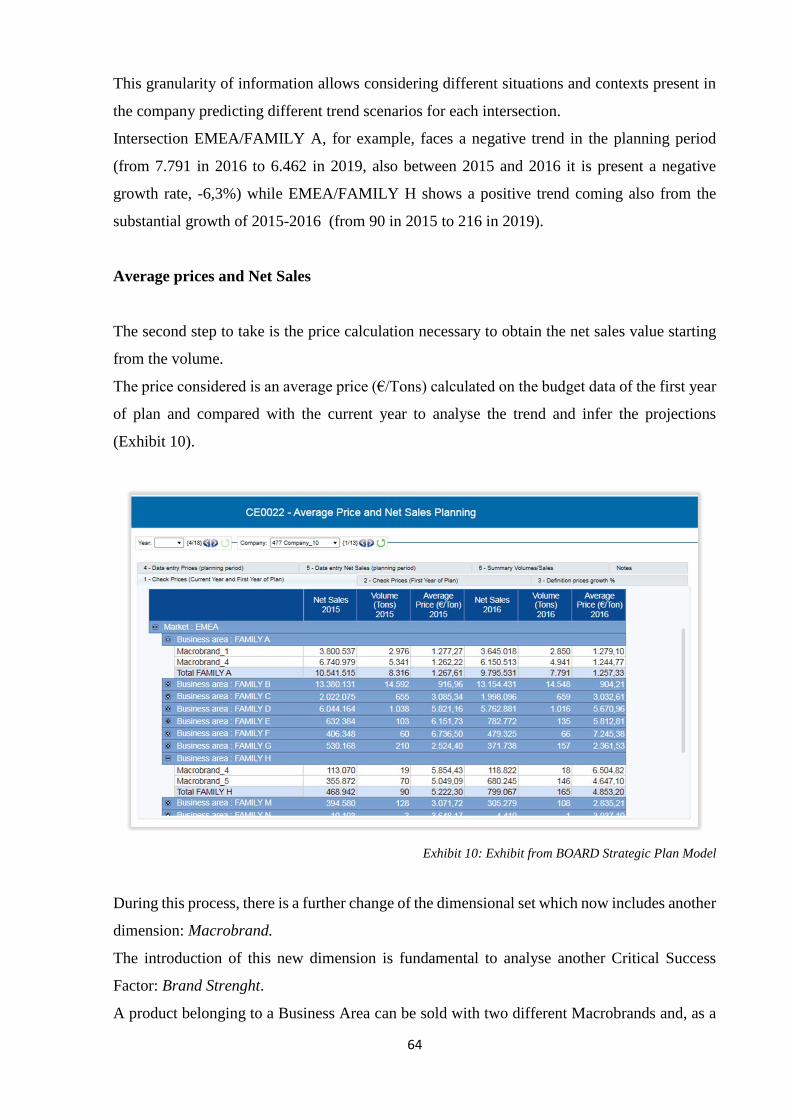
64
This granularity of information allows considering different situations and contexts present in
the company predicting different trend scenarios for each intersection.
Intersection EMEA/FAMILY A, for example, faces a negative trend in the planning period
(from 7.791 in 2016 to 6.462 in 2019, also between 2015 and 2016 it is present a negative
growth rate, -6,3%) while EMEA/FAMILY H shows a positive trend coming also from the
substantial growth of 2015-2016 (from 90 in 2015 to 216 in 2019).
Average prices and Net Sales
The second step to take is the price calculation necessary to obtain the net sales value starting
from the volume.
The price considered is an average price (€/Tons) calculated on the budget data of the first year
of plan and compared with the current year to analyse the trend and infer the projections
(Exhibit 10).
Exhibit 10: Exhibit from BOARD Strategic Plan Model
During this process, there is a further change of the dimensional set which now includes another
dimension: Macrobrand.
The introduction of this new dimension is fundamental to analyse another Critical Success
Factor: Brand Strenght.
A product belonging to a Business Area can be sold with two different Macrobrands and, as a
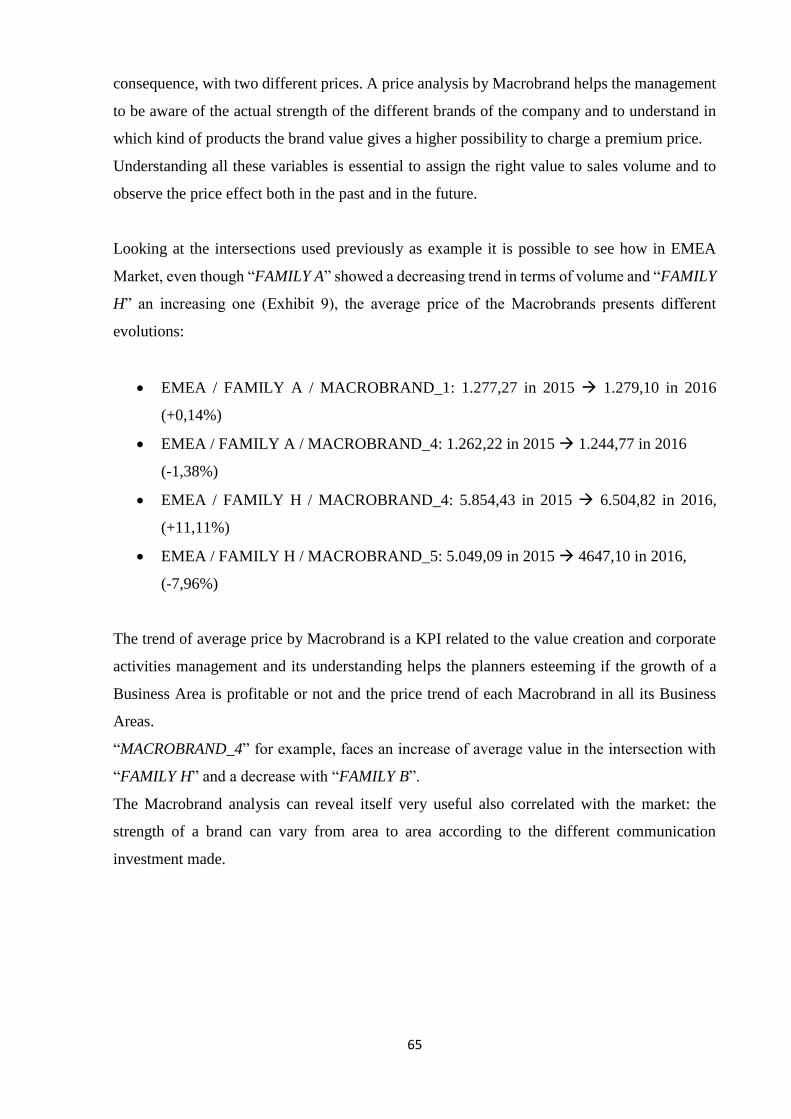
65
consequence, with two different prices. A price analysis by Macrobrand helps the management
to be aware of the actual strength of the different brands of the company and to understand in
which kind of products the brand value gives a higher possibility to charge a premium price.
Understanding all these variables is essential to assign the right value to sales volume and to
observe the price effect both in the past and in the future.
Looking at the intersections used previously as example it is possible to see how in EMEA
Market, even though “FAMILY A” showed a decreasing trend in terms of volume and “FAMILY
H” an increasing one (Exhibit 9), the average price of the Macrobrands presents different
evolutions:
• EMEA / FAMILY A / MACROBRAND_1: 1.277,27 in 2015 1.279,10 in 2016
(+0,14%)
• EMEA / FAMILY A / MACROBRAND_4: 1.262,22 in 2015 1.244,77 in 2016
(-1,38%)
• EMEA / FAMILY H / MACROBRAND_4: 5.854,43 in 2015 6.504,82 in 2016,
(+11,11%)
• EMEA / FAMILY H / MACROBRAND_5: 5.049,09 in 2015 4647,10 in 2016,
(-7,96%)
The trend of average price by Macrobrand is a KPI related to the value creation and corporate
activities management and its understanding helps the planners esteeming if the growth of a
Business Area is profitable or not and the price trend of each Macrobrand in all its Business
Areas.
“MACROBRAND_4” for example, faces an increase of average value in the intersection with
“FAMILY H” and a decrease with “FAMILY B”.
The Macrobrand analysis can reveal itself very useful also correlated with the market: the
strength of a brand can vary from area to area according to the different communication
investment made.
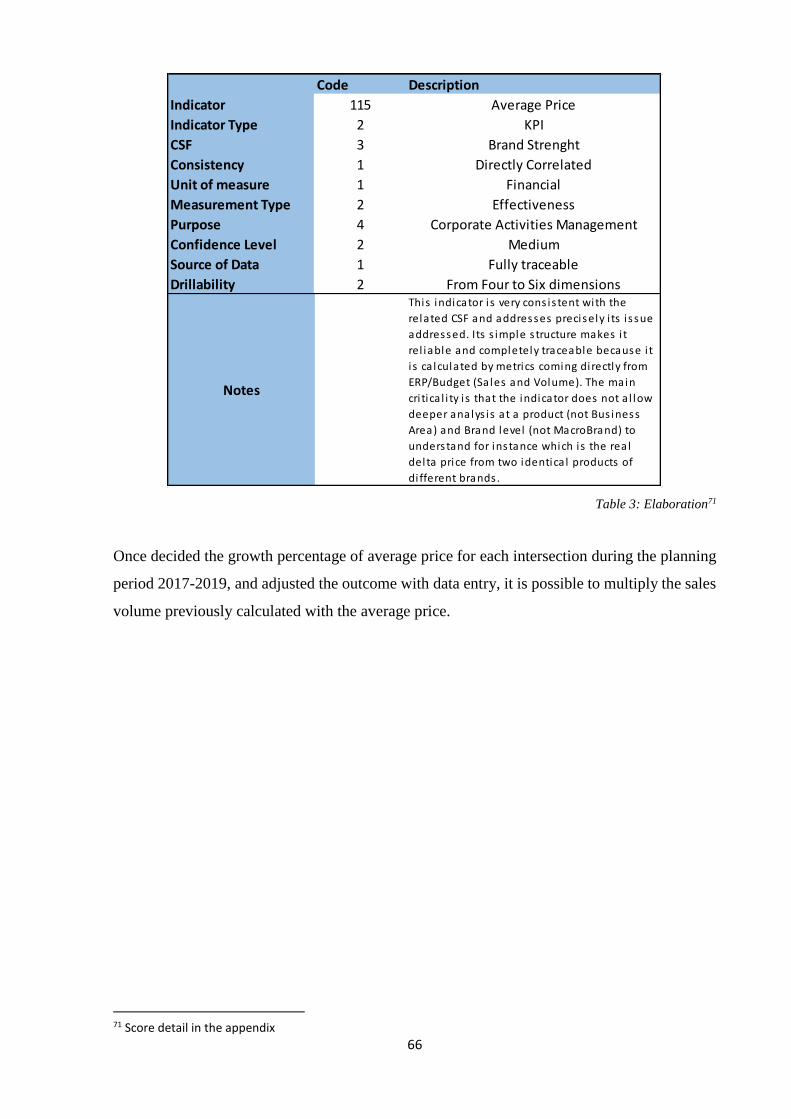
66
Table 3: Elaboration71
Once decided the growth percentage of average price for each intersection during the planning
period 2017-2019, and adjusted the outcome with data entry, it is possible to multiply the sales
volume previously calculated with the average price.
71 Score detail in the appendix
Code Description
Indicator 115 Average Price
Indicator Type 2 KPI
CSF 3 Brand Strenght
Consistency 1 Directly Correlated
Unit of measure 1 Financial
Measurement Type 2 Effectiveness
Purpose 4 Corporate Activities Management
Confidence Level 2 Medium
Source of Data 1 Fully traceable
Drillability 2 From Four to Six dimensions
Notes
This indicator i s very cons is tent with the
related CSF and addresses precisely i ts i ssue
addressed. Its s imple s tructure makes i t
rel iable and completely traceable because i t
i s ca lculated by metrics coming directly from
ERP/Budget (Sa les and Volume). The main
cri tica l i ty i s that the indicator does not a l low
deeper analys is at a product (not Bus iness
Area) and Brand level (not MacroBrand) to
understand for instance which is the real
delta price from two identica l products of
di fferent brands .

67
Exhibit 11 shows the summary of volumes and net sales, as a result of the procedure, using a
coherent dimensional set:
Exhibit 11: Exhibit from BOARD Strategic Plan Model 72 73
The following reworked versions of the same table shows the utility of analysing data from
different points of view paying attention to the volume effect and price effect in the delta of
Net Sales from 2015 to 2019.
Sales Volume
2015
Average Price 2015
Net Sales 2015
Sales Volume
2019
Average Price 2019
Net Sales 2019
CAGR Volume
CAGR Average
Price CAGR
Net Sales
EMEA 33.426 1.056,70 35.320.720 33.051 1.064,94 35.197.287 -0,28% 0,19% -0,09%
NAFTA 605 5.010,42 3.029.478 874 4.704,66 4.110.313 9,64% -1,56% 7,93%
APAC 121 2.659,84 321.390 620 2.026,81 1.257.271 50,53% -6,57% 40,64%
TOTAL 34.151 1.132,37 38.671.587 34.545 1.174,27 40.564.872 0,29% 0,91% 1,20%
Table by Market, own elaboration
Sales Volume
2015
Average Price 2015
Net Sales 2015
Sales Volume
2019
Average Price 2019
Net Sales 2019
CAGR Volume
CAGR Average
Price CAGR Net
Sales
BU BEVERAGES A 22.985 1.043,71 23.989.983 21.880 1.003,84 21.964.000 -1,22% -0,97% -2,18%
BU FOOD A 658 3.066,65 2.018.158 732 3.020,09 2.209.266 2,68% -0,38% 2,29%
BU FOOD B 1.823 5.695,55 10.384.545 2.216 5.615,64 12.445.524 5,00% -0,35% 4,63%
BU DIVERSIFICATION 341 3.417,85 1.165.454 989 2.826,97 2.794.522 30,49% -4,63% 24,44%
BU BEVERAGES B 142 2.921,01 414.357 381 2.006,18 764.596 28,03% -8,96% 16,55%
BU GENERIC 8.202 85,24 699.090 8.348 46,36 386.963 0,44% -14,12% -13,75%
TOTAL 34.151 1.132,37 38.671.587 34.545 1.174,27 40.564.872 0,29% 0,91% 1,20%
Table by Business Unit, own elaboration
72 Data about “Company_10” 73 Net Sales calculation considers decimals in Sales Volume

68
The table by Market, for instance, shows how the compound annual growth rates of “NAFTA”
and “APAC” are the only reasons of the +1,20% in total Net Sales and their growth is pushed
by the volume growth (+9,64% NAFTA, + 50,53% APAC) considered that the average price
decreases.
From the table by Business Unit, on the other hand, it is easy to notice the decreasing trend of
the main BU “BU BEVERAGES A” (CAGR Net Sales -2,18%) and the increasing one of “BU
FOOD B” (CAGR Net Sales +4,63%) and “BU DIVERSIFICATION” (CAGR Net Sales
+24,44%) mainly due to a volume effect.
All these considerations are aligned with what showed in the main sales dashboard.
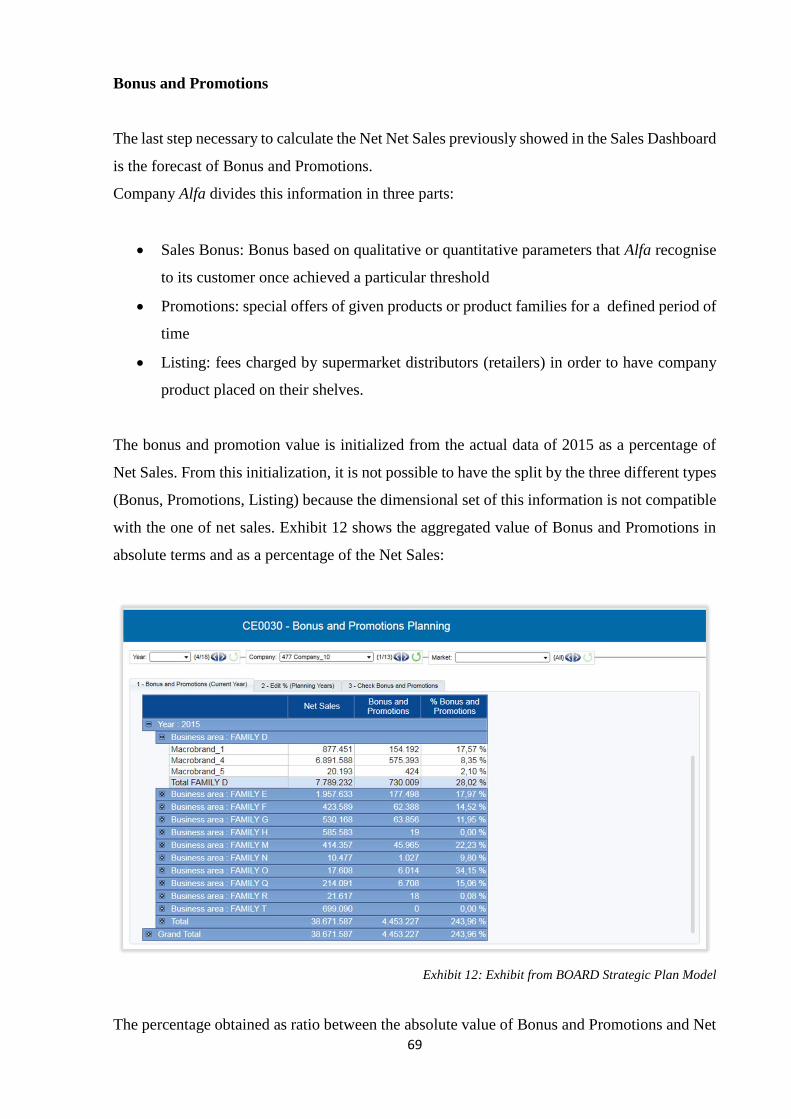
69
Bonus and Promotions
The last step necessary to calculate the Net Net Sales previously showed in the Sales Dashboard
is the forecast of Bonus and Promotions.
Company Alfa divides this information in three parts:
• Sales Bonus: Bonus based on qualitative or quantitative parameters that Alfa recognise
to its customer once achieved a particular threshold
• Promotions: special offers of given products or product families for a defined period of
time
• Listing: fees charged by supermarket distributors (retailers) in order to have company
product placed on their shelves.
The bonus and promotion value is initialized from the actual data of 2015 as a percentage of
Net Sales. From this initialization, it is not possible to have the split by the three different types
(Bonus, Promotions, Listing) because the dimensional set of this information is not compatible
with the one of net sales. Exhibit 12 shows the aggregated value of Bonus and Promotions in
absolute terms and as a percentage of the Net Sales:
Exhibit 12: Exhibit from BOARD Strategic Plan Model
The percentage obtained as ratio between the absolute value of Bonus and Promotions and Net
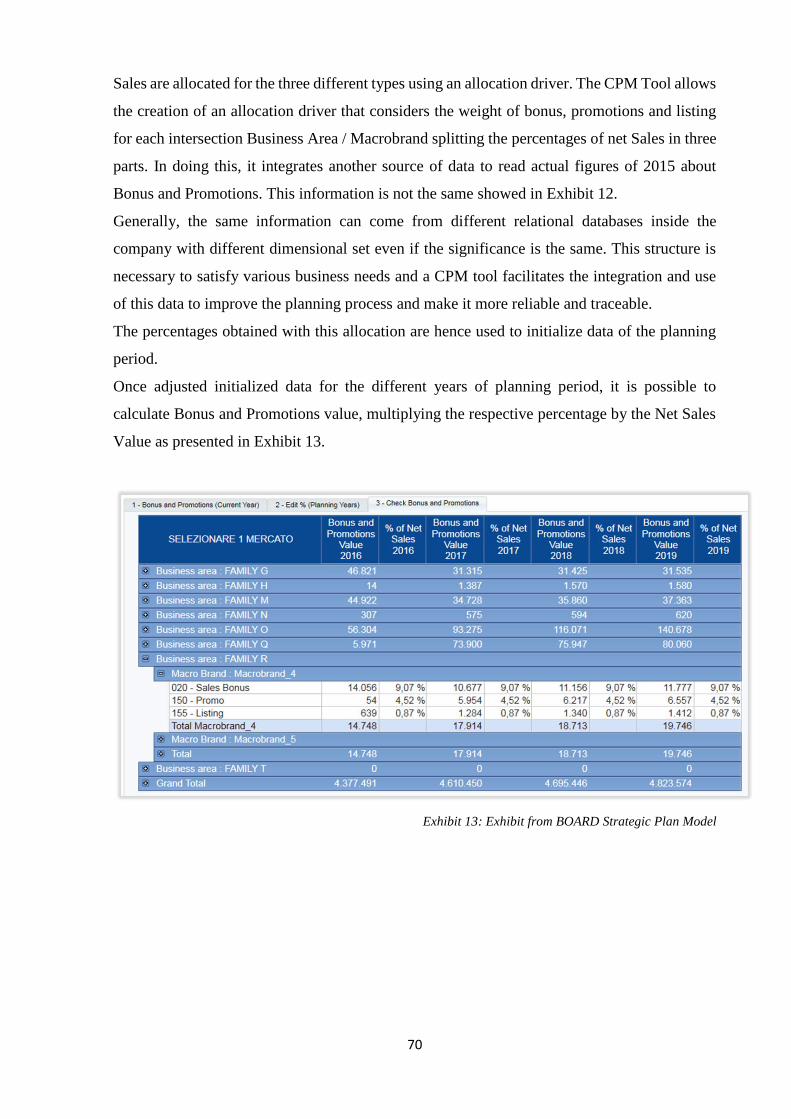
70
Sales are allocated for the three different types using an allocation driver. The CPM Tool allows
the creation of an allocation driver that considers the weight of bonus, promotions and listing
for each intersection Business Area / Macrobrand splitting the percentages of net Sales in three
parts. In doing this, it integrates another source of data to read actual figures of 2015 about
Bonus and Promotions. This information is not the same showed in Exhibit 12.
Generally, the same information can come from different relational databases inside the
company with different dimensional set even if the significance is the same. This structure is
necessary to satisfy various business needs and a CPM tool facilitates the integration and use
of this data to improve the planning process and make it more reliable and traceable.
The percentages obtained with this allocation are hence used to initialize data of the planning
period.
Once adjusted initialized data for the different years of planning period, it is possible to
calculate Bonus and Promotions value, multiplying the respective percentage by the Net Sales
Value as presented in Exhibit 13.
Exhibit 13: Exhibit from BOARD Strategic Plan Model
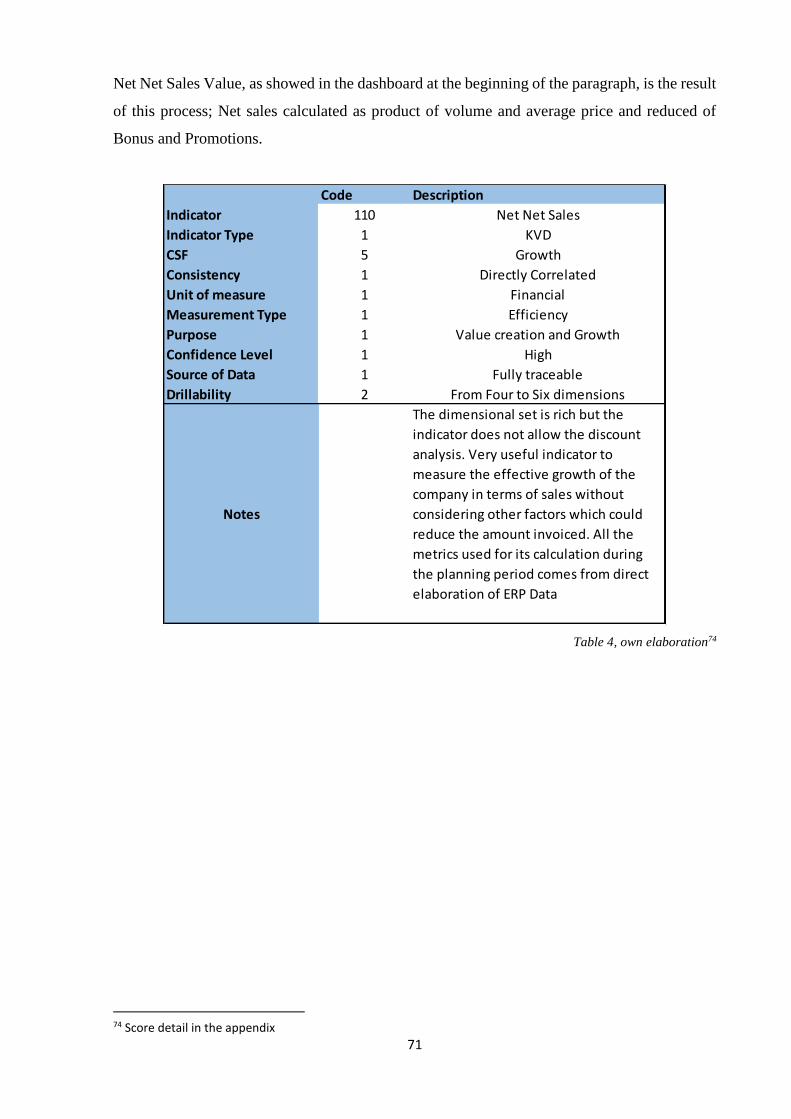
71
Net Net Sales Value, as showed in the dashboard at the beginning of the paragraph, is the result
of this process; Net sales calculated as product of volume and average price and reduced of
Bonus and Promotions.
Table 4, own elaboration74
74 Score detail in the appendix
Code Description
Indicator 110 Net Net Sales
Indicator Type 1 KVD
CSF 5 Growth
Consistency 1 Directly Correlated
Unit of measure 1 Financial
Measurement Type 1 Efficiency
Purpose 1 Value creation and Growth
Confidence Level 1 High
Source of Data 1 Fully traceable
Drillability 2 From Four to Six dimensions
Notes
The dimensional set is rich but the
indicator does not allow the discount
analysis. Very useful indicator to
measure the effective growth of the
company in terms of sales without
considering other factors which could
reduce the amount invoiced. All the
metrics used for its calculation during
the planning period comes from direct
elaboration of ERP Data
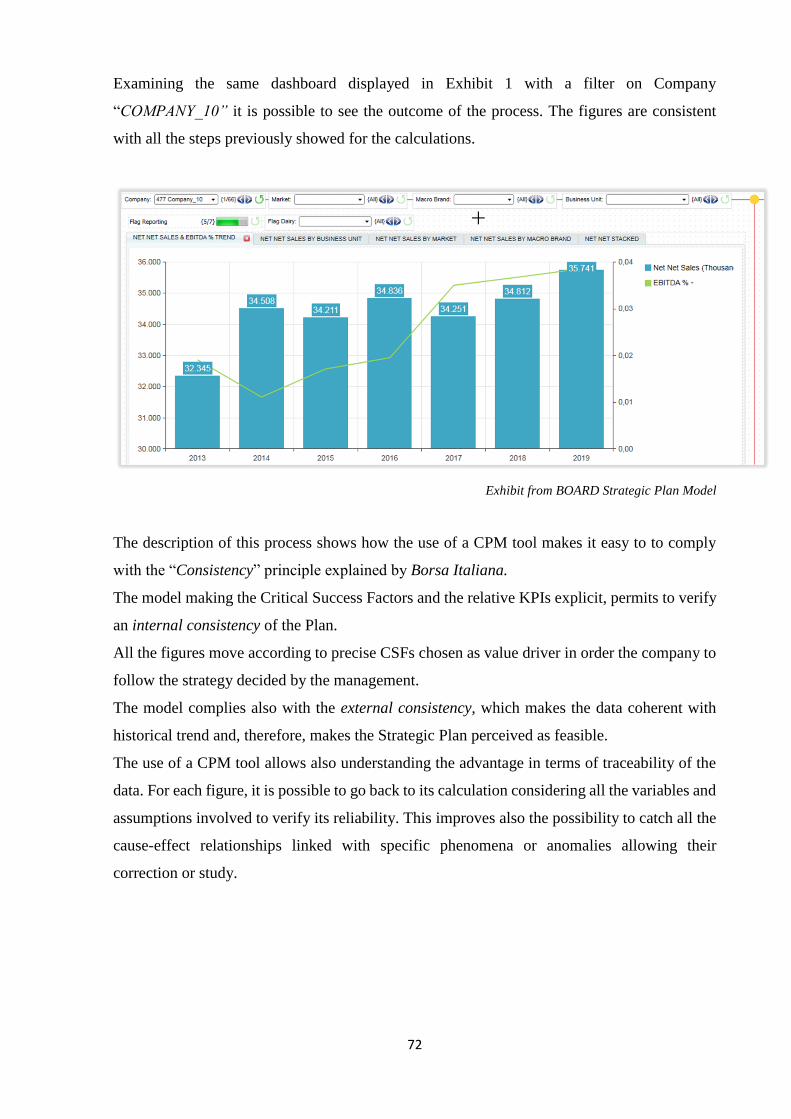
72
Examining the same dashboard displayed in Exhibit 1 with a filter on Company
“COMPANY_10” it is possible to see the outcome of the process. The figures are consistent
with all the steps previously showed for the calculations.
Exhibit from BOARD Strategic Plan Model
The description of this process shows how the use of a CPM tool makes it easy to to comply
with the “Consistency” principle explained by Borsa Italiana.
The model making the Critical Success Factors and the relative KPIs explicit, permits to verify
an internal consistency of the Plan.
All the figures move according to precise CSFs chosen as value driver in order the company to
follow the strategy decided by the management.
The model complies also with the external consistency, which makes the data coherent with
historical trend and, therefore, makes the Strategic Plan perceived as feasible.
The use of a CPM tool allows also understanding the advantage in terms of traceability of the
data. For each figure, it is possible to go back to its calculation considering all the variables and
assumptions involved to verify its reliability. This improves also the possibility to catch all the
cause-effect relationships linked with specific phenomena or anomalies allowing their
correction or study.

73
2.1.2 COGS and Marginality
Once analysed the Net Net Sales Report considering all the different dimensional perspectives,
the second step of the economic section is the consideration of costs in order to examine the
various marginalities of the company.
Measurement of the company’s marginality is linked with Profitability Critical Success Factor
and this analysis, developed with a CPM Tool, allows the understanding of main variables
affecting it.
BOARD Margin Dashboard shows the evolution of marginality of Company Alfa using as Key
Value Driver the Contribution Margin, as presented in Exhibit 14:
Exhibit 14: Exhibit from BOARD Strategic Plan Model 75
The two perspectives adopted present the Contribution Margin trend of entire group in absolute
value (green columns) and another KPI consisting of the ratio between Contribution Margin
itself and Net Net Sales (blue line, as percentage).
In the lower part of the screen, there is a comparison of the same Contribution Margin Value
by Business Unit between current year and first year of plan.
75 Figures in Million €
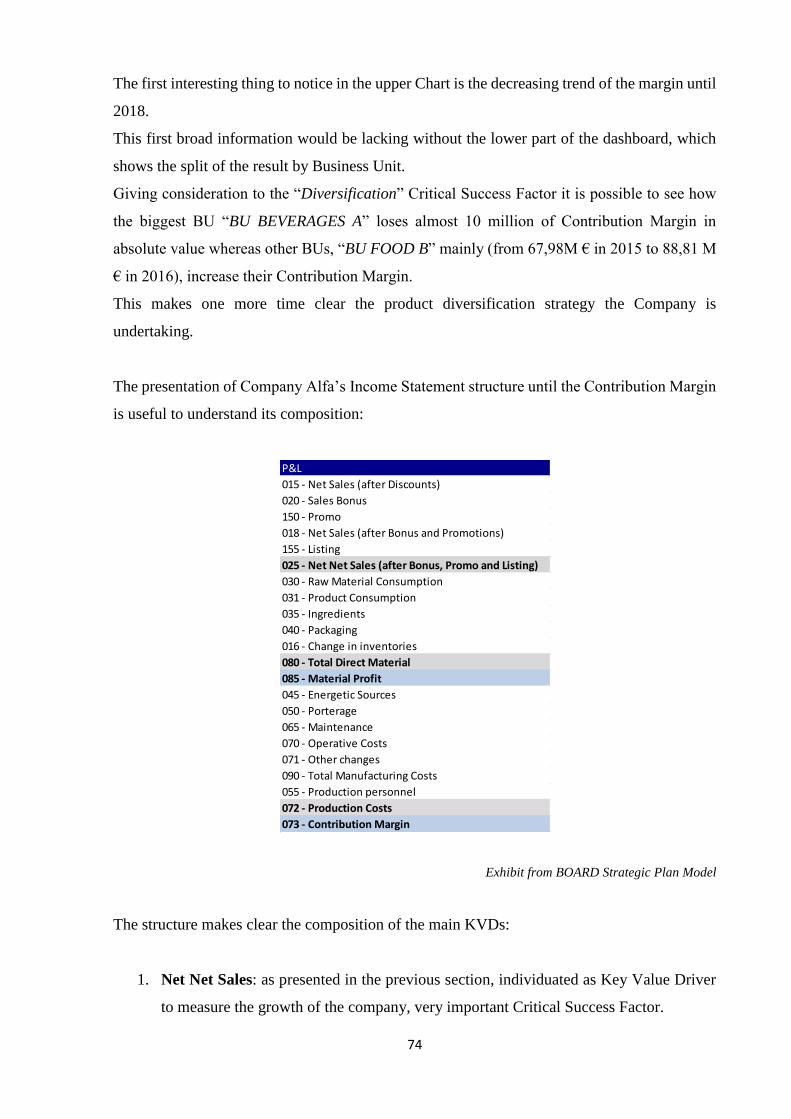
74
The first interesting thing to notice in the upper Chart is the decreasing trend of the margin until
2018.
This first broad information would be lacking without the lower part of the dashboard, which
shows the split of the result by Business Unit.
Giving consideration to the “Diversification” Critical Success Factor it is possible to see how
the biggest BU “BU BEVERAGES A” loses almost 10 million of Contribution Margin in
absolute value whereas other BUs, “BU FOOD B” mainly (from 67,98M € in 2015 to 88,81 M
€ in 2016), increase their Contribution Margin.
This makes one more time clear the product diversification strategy the Company is
undertaking.
The presentation of Company Alfa’s Income Statement structure until the Contribution Margin
is useful to understand its composition:
Exhibit from BOARD Strategic Plan Model
The structure makes clear the composition of the main KVDs:
1. Net Net Sales: as presented in the previous section, individuated as Key Value Driver
to measure the growth of the company, very important Critical Success Factor.
P&L
015 - Net Sales (after Discounts)
020 - Sales Bonus
150 - Promo
018 - Net Sales (after Bonus and Promotions)
155 - Listing
025 - Net Net Sales (after Bonus, Promo and Listing)
030 - Raw Material Consumption
031 - Product Consumption
035 - Ingredients
040 - Packaging
016 - Change in inventories
080 - Total Direct Material
085 - Material Profit
045 - Energetic Sources
050 - Porterage
065 - Maintenance
070 - Operative Costs
071 - Other changes
090 - Total Manufacturing Costs
055 - Production personnel
072 - Production Costs
073 - Contribution Margin
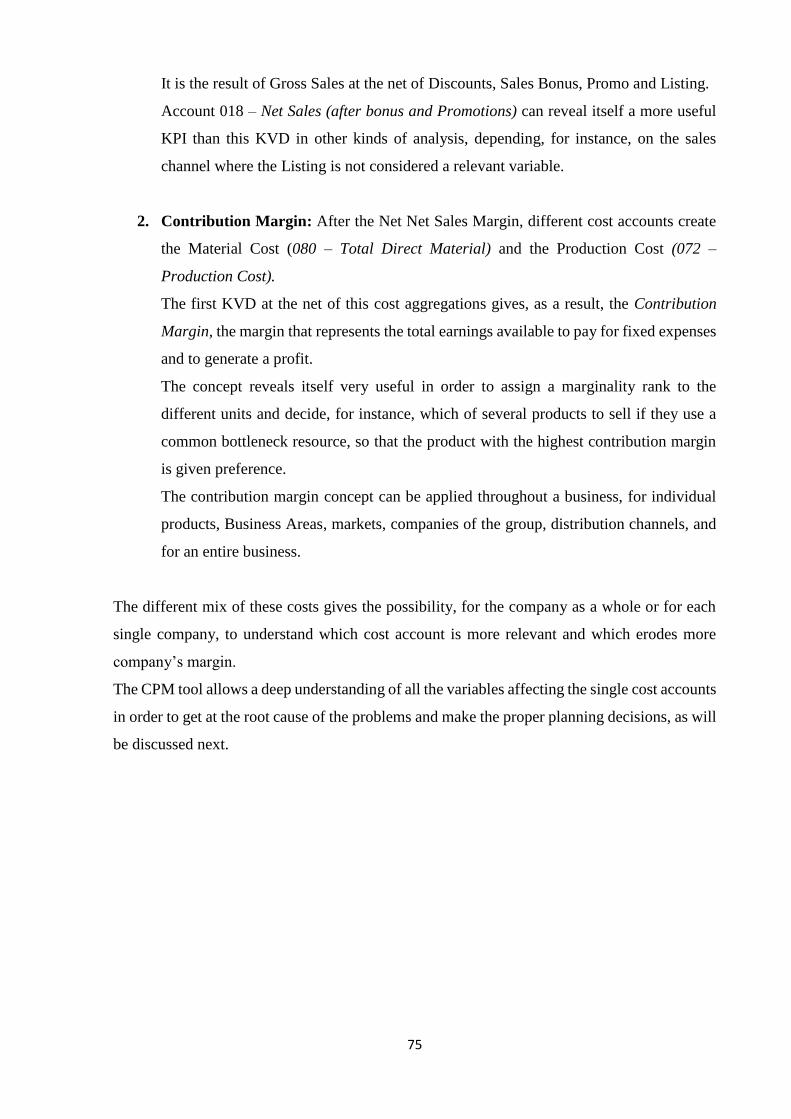
75
It is the result of Gross Sales at the net of Discounts, Sales Bonus, Promo and Listing.
Account 018 – Net Sales (after bonus and Promotions) can reveal itself a more useful
KPI than this KVD in other kinds of analysis, depending, for instance, on the sales
channel where the Listing is not considered a relevant variable.
2. Contribution Margin: After the Net Net Sales Margin, different cost accounts create
the Material Cost (080 – Total Direct Material) and the Production Cost (072 –
Production Cost).
The first KVD at the net of this cost aggregations gives, as a result, the Contribution
Margin, the margin that represents the total earnings available to pay for fixed expenses
and to generate a profit.
The concept reveals itself very useful in order to assign a marginality rank to the
different units and decide, for instance, which of several products to sell if they use a
common bottleneck resource, so that the product with the highest contribution margin
is given preference.
The contribution margin concept can be applied throughout a business, for individual
products, Business Areas, markets, companies of the group, distribution channels, and
for an entire business.
The different mix of these costs gives the possibility, for the company as a whole or for each
single company, to understand which cost account is more relevant and which erodes more
company’s margin.
The CPM tool allows a deep understanding of all the variables affecting the single cost accounts
in order to get at the root cause of the problems and make the proper planning decisions, as will
be discussed next.
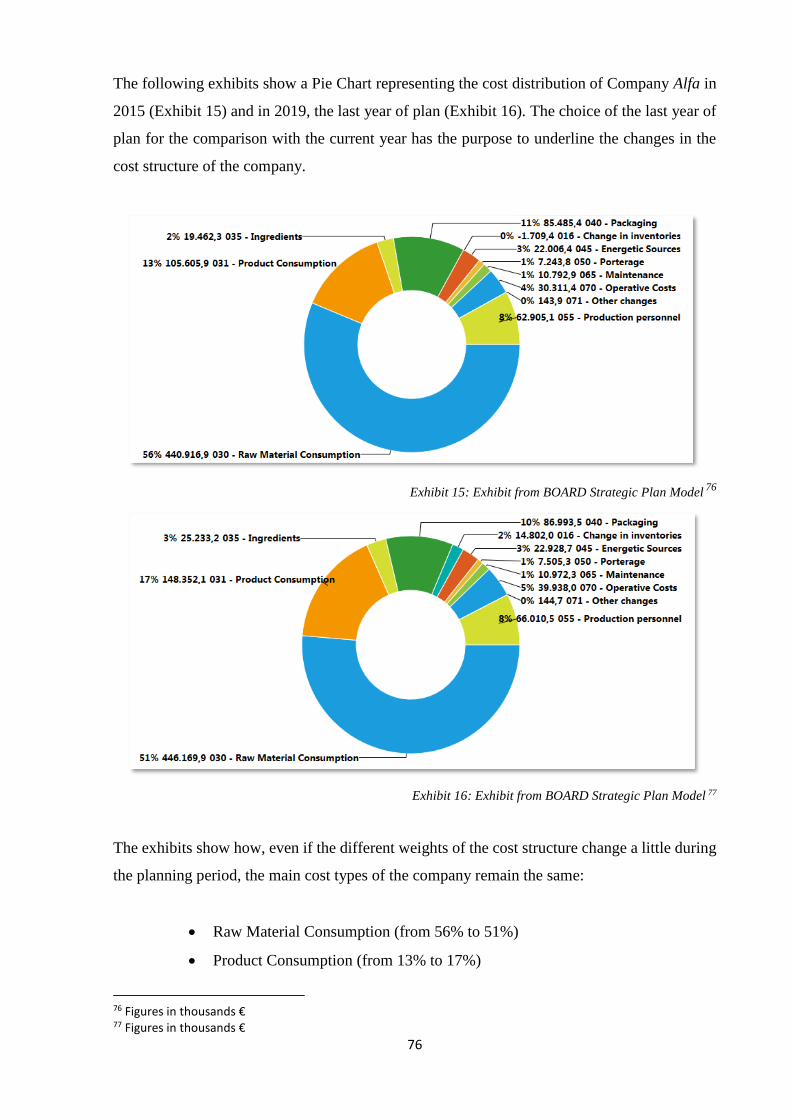
76
The following exhibits show a Pie Chart representing the cost distribution of Company Alfa in
2015 (Exhibit 15) and in 2019, the last year of plan (Exhibit 16). The choice of the last year of
plan for the comparison with the current year has the purpose to underline the changes in the
cost structure of the company.
Exhibit 15: Exhibit from BOARD Strategic Plan Model 76
Exhibit 16: Exhibit from BOARD Strategic Plan Model 77
The exhibits show how, even if the different weights of the cost structure change a little during
the planning period, the main cost types of the company remain the same:
• Raw Material Consumption (from 56% to 51%)
• Product Consumption (from 13% to 17%)
76 Figures in thousands € 77 Figures in thousands €
77
• Production Personnel (8%)
• Packaging (from 11% to 10%)
• Ingredients (from 2% to 3%)
The Profitability Critical Success Factor should be used as key to read this data.
The understanding of which kind of cost affects more the cost structure allows the preparation
of a specific strategy to take advantage of economies of scale and scope.
Moreover, given that the cost structure is highly influenced by procurement market this analysis
permits the simulation of different scenarios to cope, for instance, with an increase of raw
material or finished products price.
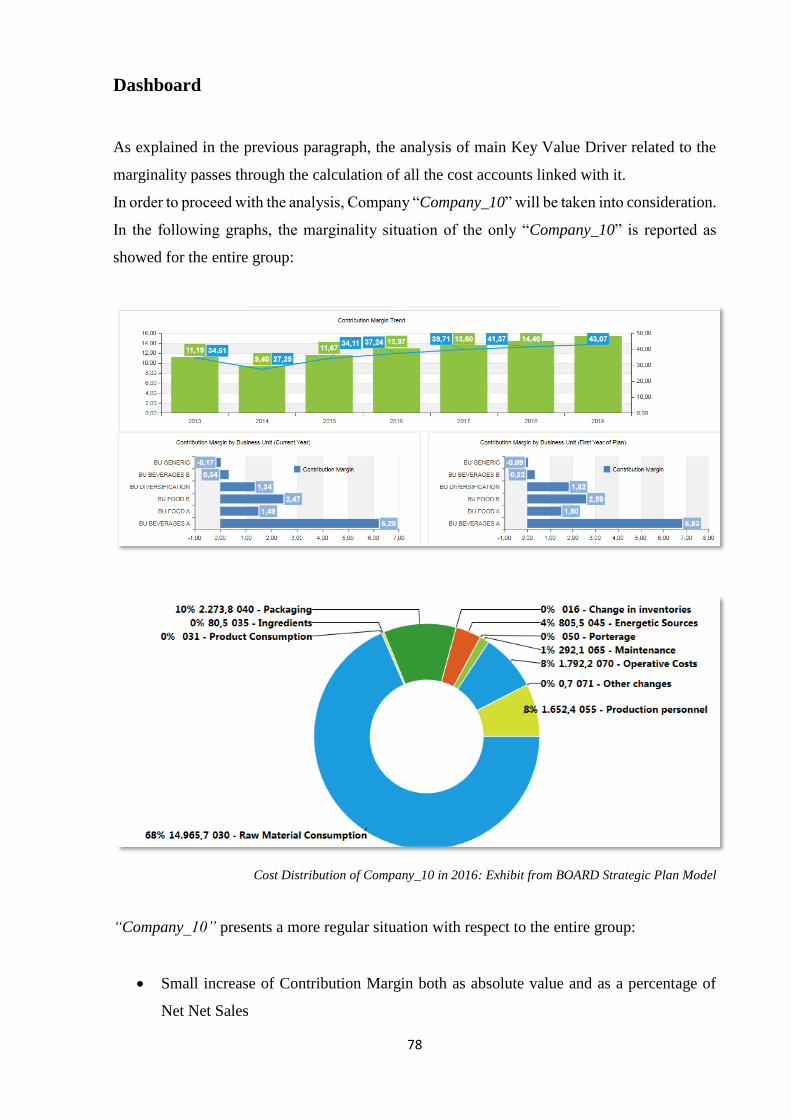
78
Dashboard
As explained in the previous paragraph, the analysis of main Key Value Driver related to the
marginality passes through the calculation of all the cost accounts linked with it.
In order to proceed with the analysis, Company “Company_10” will be taken into consideration.
In the following graphs, the marginality situation of the only “Company_10” is reported as
showed for the entire group:
Cost Distribution of Company_10 in 2016: Exhibit from BOARD Strategic Plan Model
“Company_10” presents a more regular situation with respect to the entire group:
• Small increase of Contribution Margin both as absolute value and as a percentage of
Net Net Sales

79
• Almost uniform increase at Business Unit level of the Contribution Margin
• The cost structure is simpler than the one at a group level. Raw Material Consumption,
Packaging, Production Personnel and Operative Costs accounts for more than the 94%
of the total.
80
Process
As presented above, it is necessary to calculate a sequence of different costs to arrive to the
Contribution Margin.
All cost lines of the Income Statement have to be taken into consideration and their composition
have to be justified by clear and traceable assumptions as demanded from the consistency and
reliability principles of Borsa Italiana.
The CPM tool allows also in this section to start from the first components to get to the final
cost calculation.
Purchased Volume and Cost
The first step to take in order to make the right analysis and cost calculation is the consideration
of the volume, as in the previous paragraph regarding the sales.
The volume considered in the revenue calculation was the sales volume, obtained as a
projection of the Company Sales with a growth percentage. This figure is important and it is
the starting point to understand which quantity should be produced and which one should be
bought from outside.
Make or buy decisions play a fundamental role considered the increasing pressure to cut
expenses and improve the profitability, one of the Critical Success Factor of Company Alfa.
The dilemma of whether to keep key functions in-house or outsource them has taken center
stage. Manufacturing units are identified most often with “make or buy” decisions because
third-party suppliers hold out the promise of significant advantages and a company must
objectively assess its core competencies and measure them against world-class standards in
order to take this kind of decisions.
Hence, Management should lead business units in conducting detailed analysis that thoroughly
evaluate the costs, benefits, risks, and rewards of outsourcing and the implications of keeping
the activity in-house78. This analysis can be supported by the use of proper KPIs both from a
“buy” point of view and from a “make” one.
The profitability analysis examined with a CPM Tool allows this type of deep evaluation at
different dimensional levels in order to understand which branches of the company are aligned
with the objectives of the firm and which ones should be dismissed. Moreover, it permits to
recognize the most important profitability variables.
78 Schwartzing D., Weissbarth R. , 2011, Three Pillars of sound decision making
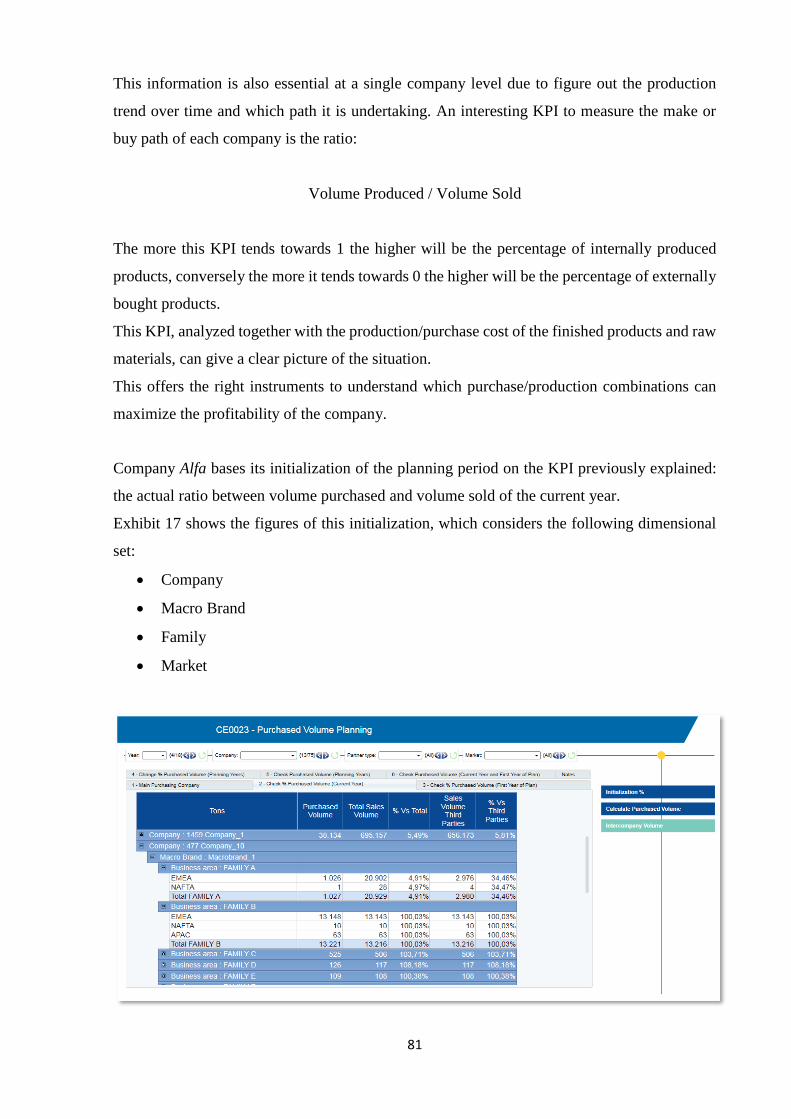
81
This information is also essential at a single company level due to figure out the production
trend over time and which path it is undertaking. An interesting KPI to measure the make or
buy path of each company is the ratio:
Volume Produced / Volume Sold
The more this KPI tends towards 1 the higher will be the percentage of internally produced
products, conversely the more it tends towards 0 the higher will be the percentage of externally
bought products.
This KPI, analyzed together with the production/purchase cost of the finished products and raw
materials, can give a clear picture of the situation.
This offers the right instruments to understand which purchase/production combinations can
maximize the profitability of the company.
Company Alfa bases its initialization of the planning period on the KPI previously explained:
the actual ratio between volume purchased and volume sold of the current year.
Exhibit 17 shows the figures of this initialization, which considers the following dimensional
set:
• Company
• Macro Brand
• Family
• Market
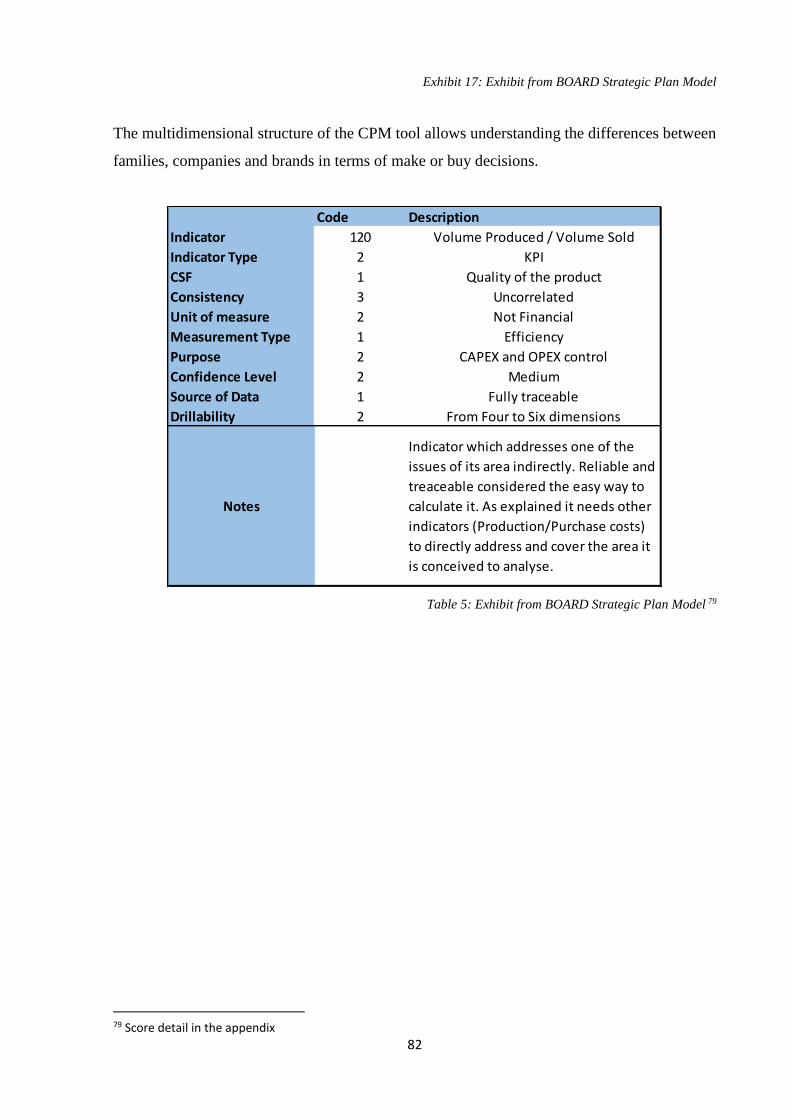
82
Exhibit 17: Exhibit from BOARD Strategic Plan Model
The multidimensional structure of the CPM tool allows understanding the differences between
families, companies and brands in terms of make or buy decisions.
Table 5: Exhibit from BOARD Strategic Plan Model 79
79 Score detail in the appendix
Code Description
Indicator 120 Volume Produced / Volume Sold
Indicator Type 2 KPI
CSF 1 Quality of the product
Consistency 3 Uncorrelated
Unit of measure 2 Not Financial
Measurement Type 1 Efficiency
Purpose 2 CAPEX and OPEX control
Confidence Level 2 Medium
Source of Data 1 Fully traceable
Drillability 2 From Four to Six dimensions
Notes
Indicator which addresses one of the
issues of its area indirectly. Reliable and
treaceable considered the easy way to
calculate it. As explained it needs other
indicators (Production/Purchase costs)
to directly address and cover the area it
is conceived to analyse.
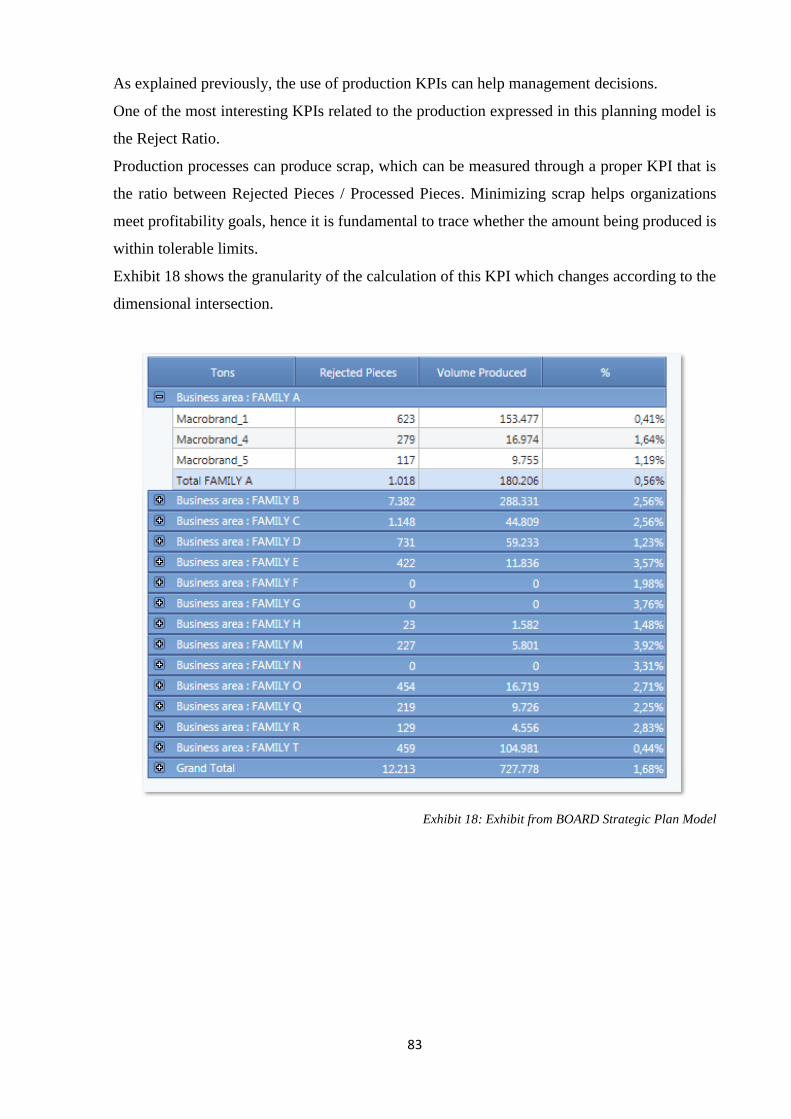
83
As explained previously, the use of production KPIs can help management decisions.
One of the most interesting KPIs related to the production expressed in this planning model is
the Reject Ratio.
Production processes can produce scrap, which can be measured through a proper KPI that is
the ratio between Rejected Pieces / Processed Pieces. Minimizing scrap helps organizations
meet profitability goals, hence it is fundamental to trace whether the amount being produced is
within tolerable limits.
Exhibit 18 shows the granularity of the calculation of this KPI which changes according to the
dimensional intersection.
Exhibit 18: Exhibit from BOARD Strategic Plan Model
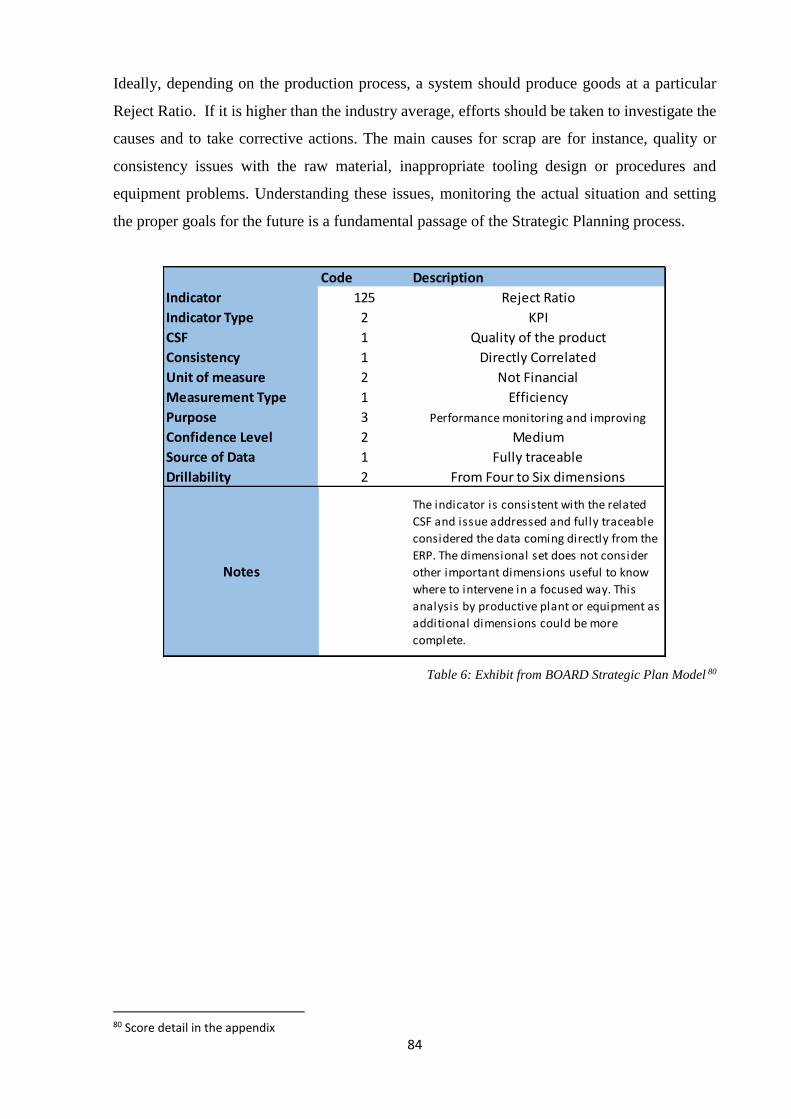
84
Ideally, depending on the production process, a system should produce goods at a particular
Reject Ratio. If it is higher than the industry average, efforts should be taken to investigate the
causes and to take corrective actions. The main causes for scrap are for instance, quality or
consistency issues with the raw material, inappropriate tooling design or procedures and
equipment problems. Understanding these issues, monitoring the actual situation and setting
the proper goals for the future is a fundamental passage of the Strategic Planning process.
Table 6: Exhibit from BOARD Strategic Plan Model 80
80 Score detail in the appendix
Code Description
Indicator 125 Reject Ratio
Indicator Type 2 KPI
CSF 1 Quality of the product
Consistency 1 Directly Correlated
Unit of measure 2 Not Financial
Measurement Type 1 Efficiency
Purpose 3 Performance monitoring and improving
Confidence Level 2 Medium
Source of Data 1 Fully traceable
Drillability 2 From Four to Six dimensions
Notes
The indicator is consistent with the related
CSF and issue addressed and fully traceable
considered the data coming directly from the
ERP. The dimensional set does not consider
other important dimensions useful to know
where to intervene in a focused way. This
analysis by productive plant or equipment as
additional dimensions could be more
complete.
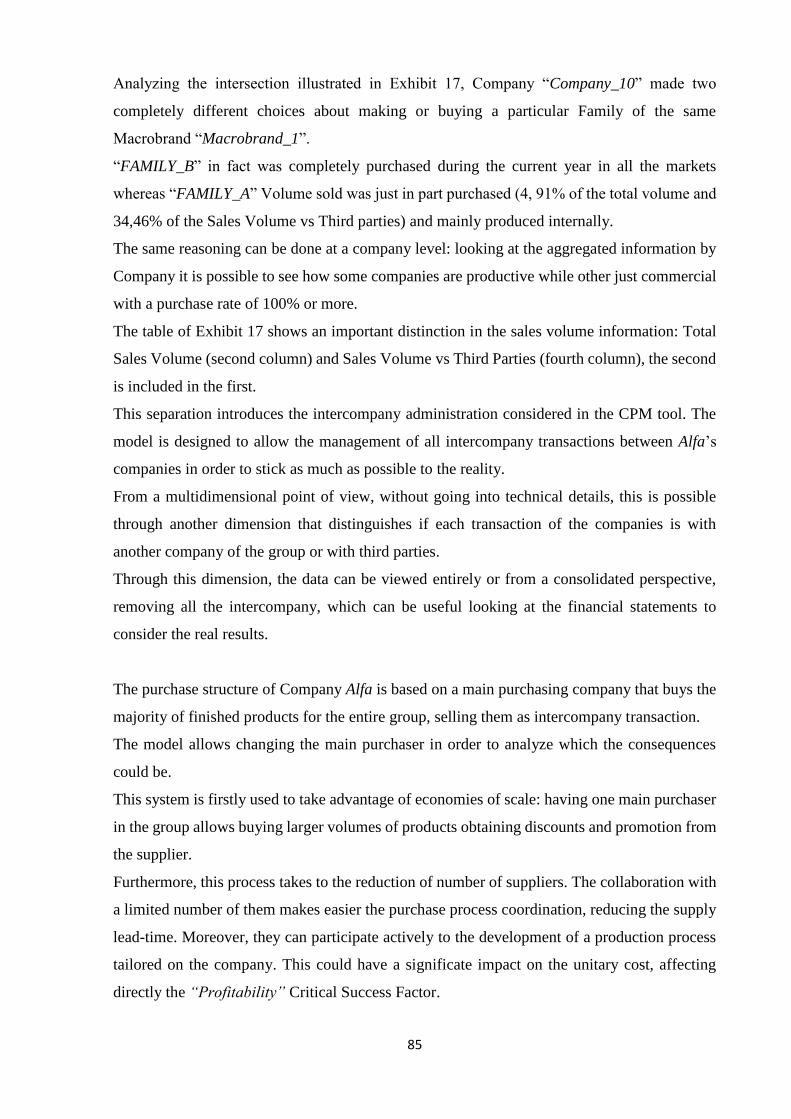
85
Analyzing the intersection illustrated in Exhibit 17, Company “Company_10” made two
completely different choices about making or buying a particular Family of the same
Macrobrand “Macrobrand_1”.
“FAMILY_B” in fact was completely purchased during the current year in all the markets
whereas “FAMILY_A” Volume sold was just in part purchased (4, 91% of the total volume and
34,46% of the Sales Volume vs Third parties) and mainly produced internally.
The same reasoning can be done at a company level: looking at the aggregated information by
Company it is possible to see how some companies are productive while other just commercial
with a purchase rate of 100% or more.
The table of Exhibit 17 shows an important distinction in the sales volume information: Total
Sales Volume (second column) and Sales Volume vs Third Parties (fourth column), the second
is included in the first.
This separation introduces the intercompany administration considered in the CPM tool. The
model is designed to allow the management of all intercompany transactions between Alfa’s
companies in order to stick as much as possible to the reality.
From a multidimensional point of view, without going into technical details, this is possible
through another dimension that distinguishes if each transaction of the companies is with
another company of the group or with third parties.
Through this dimension, the data can be viewed entirely or from a consolidated perspective,
removing all the intercompany, which can be useful looking at the financial statements to
consider the real results.
The purchase structure of Company Alfa is based on a main purchasing company that buys the
majority of finished products for the entire group, selling them as intercompany transaction.
The model allows changing the main purchaser in order to analyze which the consequences
could be.
This system is firstly used to take advantage of economies of scale: having one main purchaser
in the group allows buying larger volumes of products obtaining discounts and promotion from
the supplier.
Furthermore, this process takes to the reduction of number of suppliers. The collaboration with
a limited number of them makes easier the purchase process coordination, reducing the supply
lead-time. Moreover, they can participate actively to the development of a production process
tailored on the company. This could have a significate impact on the unitary cost, affecting
directly the “Profitability” Critical Success Factor.
86
At last, it is important to consider the cost savings related to the quality control system in the
case of a long-lasting collaboration with a restricted number of suppliers.81
Once initialized the different percentages of purchased volume by company and the
intercompany net of transactions, it is possible to modify it year by year considering all the
possible modification that could happen during the planning period.
This includes the choice of a company to change the make or buy decisions, the possibility to
start to produce in a particular company or stopping it, to change the main purchaser and take
less advantage of economies of scale and so on.
At the end of this process it is possible to have all purchased volume of each company with the
dimensional set aforementioned and with the possibility to know if the interaction comes from
an intercompany transaction or not.
Exhibit 19: Exhibit from BOARD Strategic Plan Model
Given the purchased volume initialized and set the yearly average product cost it is possible to
obtain the cost of finished product as first income statement line.
81 Sciarelli S.,2008. Elementi di economia e gestione delle imprese. Padova: CEDAM, p. 303
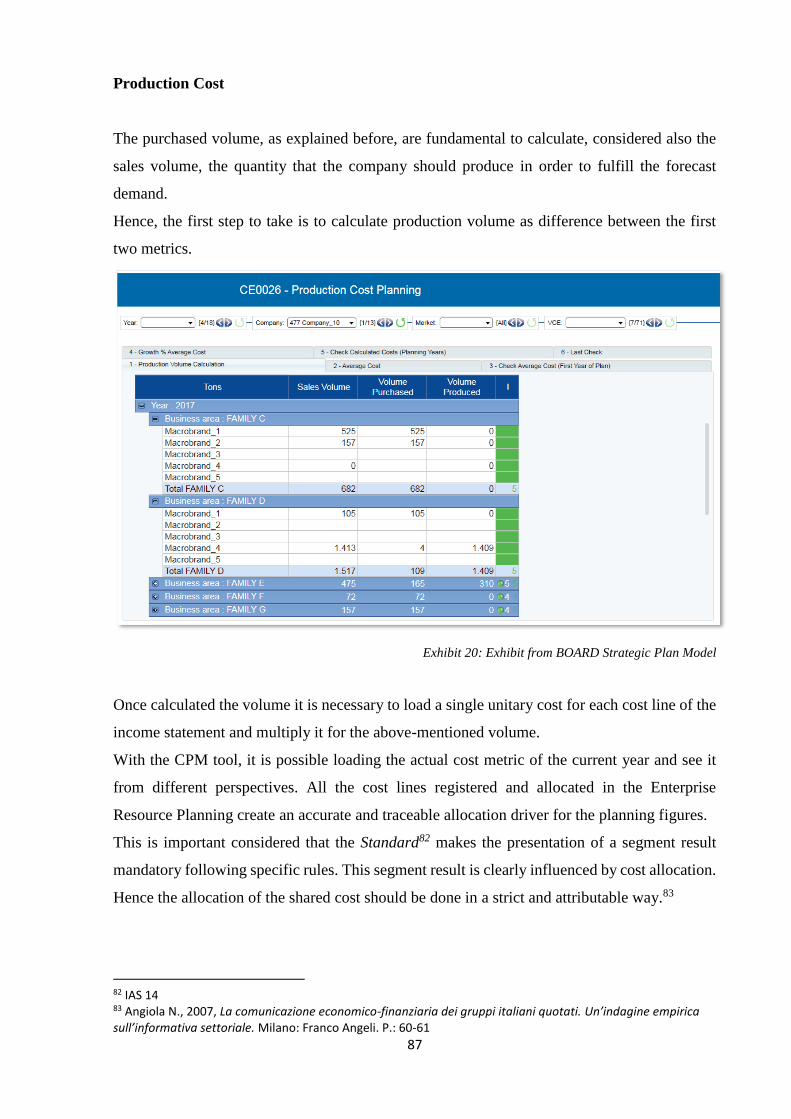
87
Production Cost
The purchased volume, as explained before, are fundamental to calculate, considered also the
sales volume, the quantity that the company should produce in order to fulfill the forecast
demand.
Hence, the first step to take is to calculate production volume as difference between the first
two metrics.
Exhibit 20: Exhibit from BOARD Strategic Plan Model
Once calculated the volume it is necessary to load a single unitary cost for each cost line of the
income statement and multiply it for the above-mentioned volume.
With the CPM tool, it is possible loading the actual cost metric of the current year and see it
from different perspectives. All the cost lines registered and allocated in the Enterprise
Resource Planning create an accurate and traceable allocation driver for the planning figures.
This is important considered that the Standard82 makes the presentation of a segment result
mandatory following specific rules. This segment result is clearly influenced by cost allocation.
Hence the allocation of the shared cost should be done in a strict and attributable way.83
82 IAS 14 83 Angiola N., 2007, La comunicazione economico-finanziaria dei gruppi italiani quotati. Un’indagine empirica sull’informativa settoriale. Milano: Franco Angeli. P.: 60-61
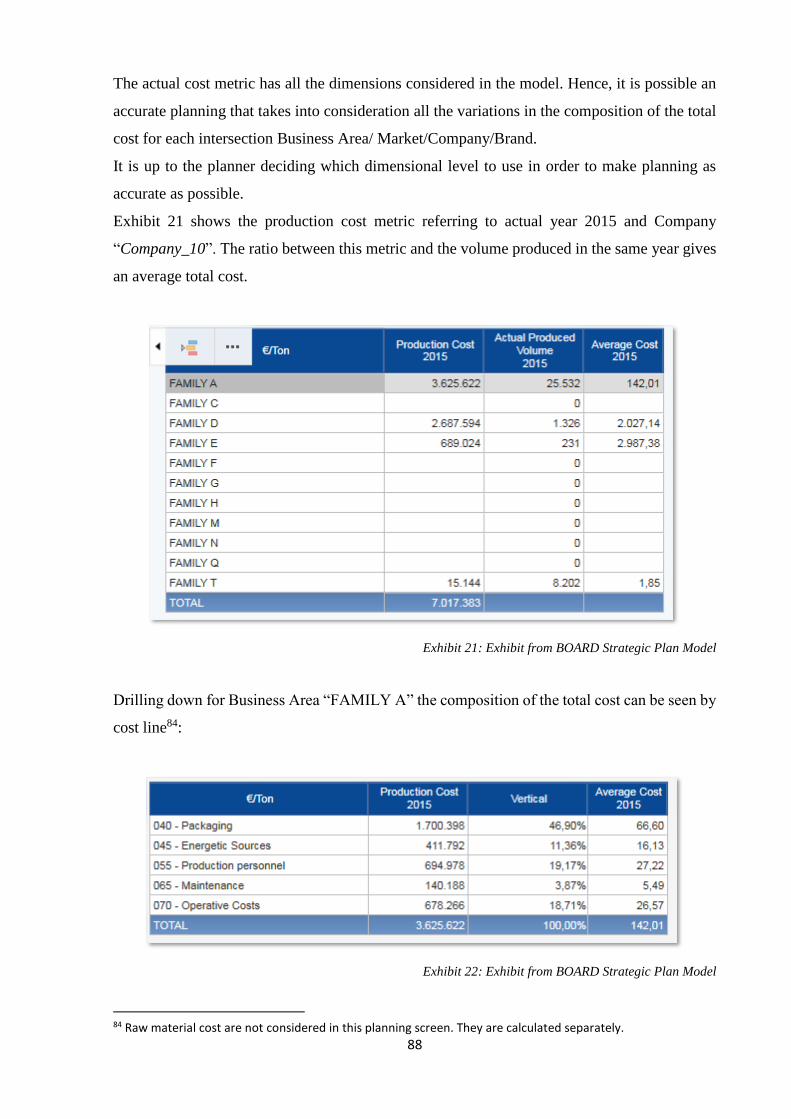
88
The actual cost metric has all the dimensions considered in the model. Hence, it is possible an
accurate planning that takes into consideration all the variations in the composition of the total
cost for each intersection Business Area/ Market/Company/Brand.
It is up to the planner deciding which dimensional level to use in order to make planning as
accurate as possible.
Exhibit 21 shows the production cost metric referring to actual year 2015 and Company
“Company_10”. The ratio between this metric and the volume produced in the same year gives
an average total cost.
Exhibit 21: Exhibit from BOARD Strategic Plan Model
Drilling down for Business Area “FAMILY A” the composition of the total cost can be seen by
cost line84:
Exhibit 22: Exhibit from BOARD Strategic Plan Model
84 Raw material cost are not considered in this planning screen. They are calculated separately.
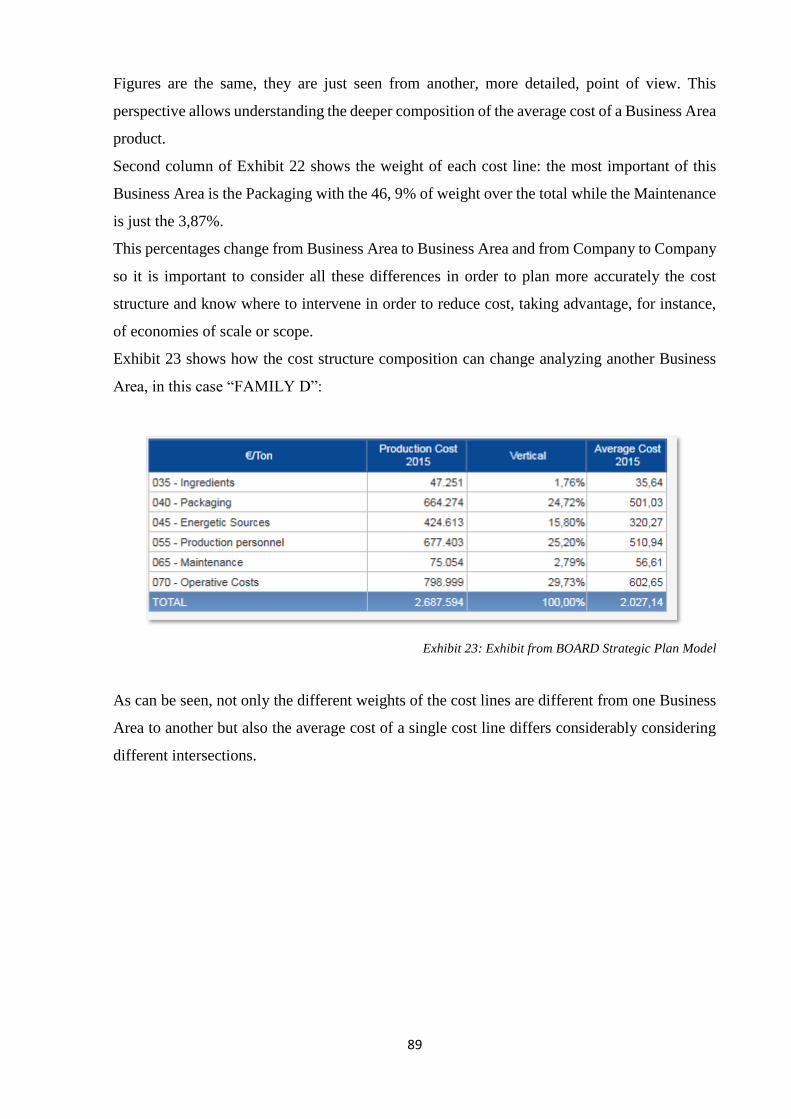
89
Figures are the same, they are just seen from another, more detailed, point of view. This
perspective allows understanding the deeper composition of the average cost of a Business Area
product.
Second column of Exhibit 22 shows the weight of each cost line: the most important of this
Business Area is the Packaging with the 46, 9% of weight over the total while the Maintenance
is just the 3,87%.
This percentages change from Business Area to Business Area and from Company to Company
so it is important to consider all these differences in order to plan more accurately the cost
structure and know where to intervene in order to reduce cost, taking advantage, for instance,
of economies of scale or scope.
Exhibit 23 shows how the cost structure composition can change analyzing another Business
Area, in this case “FAMILY D”:
Exhibit 23: Exhibit from BOARD Strategic Plan Model
As can be seen, not only the different weights of the cost lines are different from one Business
Area to another but also the average cost of a single cost line differs considerably considering
different intersections.
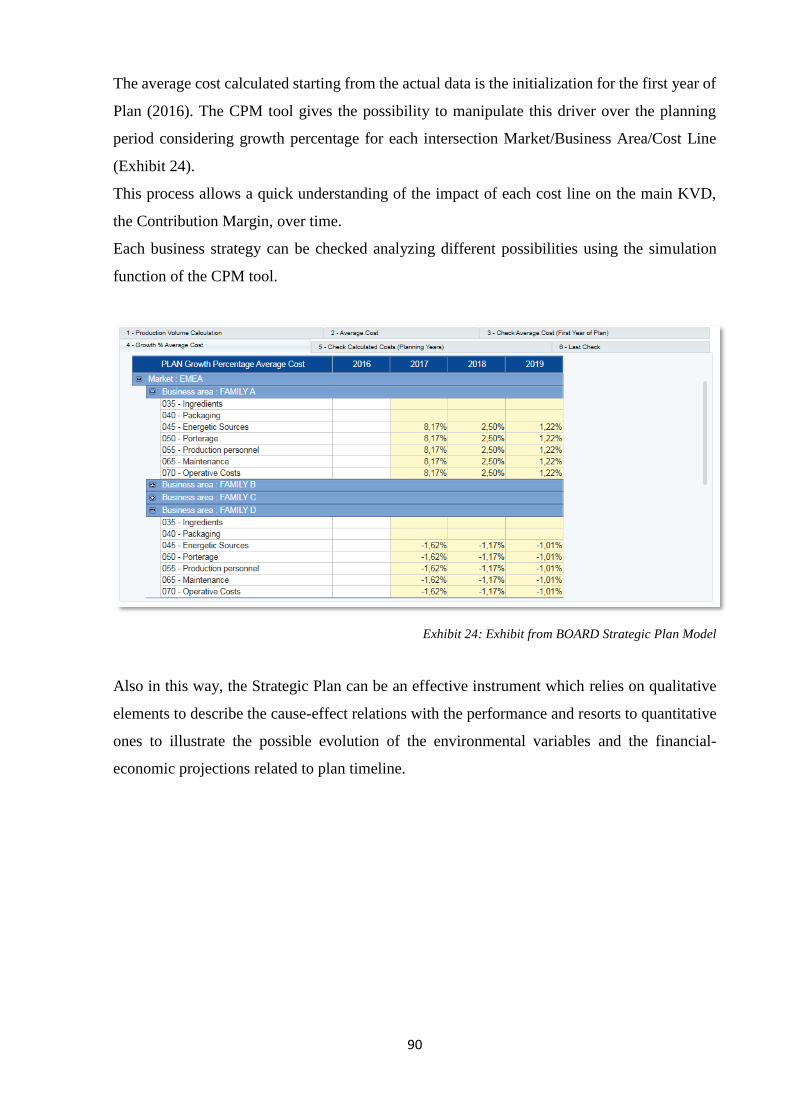
90
The average cost calculated starting from the actual data is the initialization for the first year of
Plan (2016). The CPM tool gives the possibility to manipulate this driver over the planning
period considering growth percentage for each intersection Market/Business Area/Cost Line
(Exhibit 24).
This process allows a quick understanding of the impact of each cost line on the main KVD,
the Contribution Margin, over time.
Each business strategy can be checked analyzing different possibilities using the simulation
function of the CPM tool.
Exhibit 24: Exhibit from BOARD Strategic Plan Model
Also in this way, the Strategic Plan can be an effective instrument which relies on qualitative
elements to describe the cause-effect relations with the performance and resorts to quantitative
ones to illustrate the possible evolution of the environmental variables and the financial-
economic projections related to plan timeline.
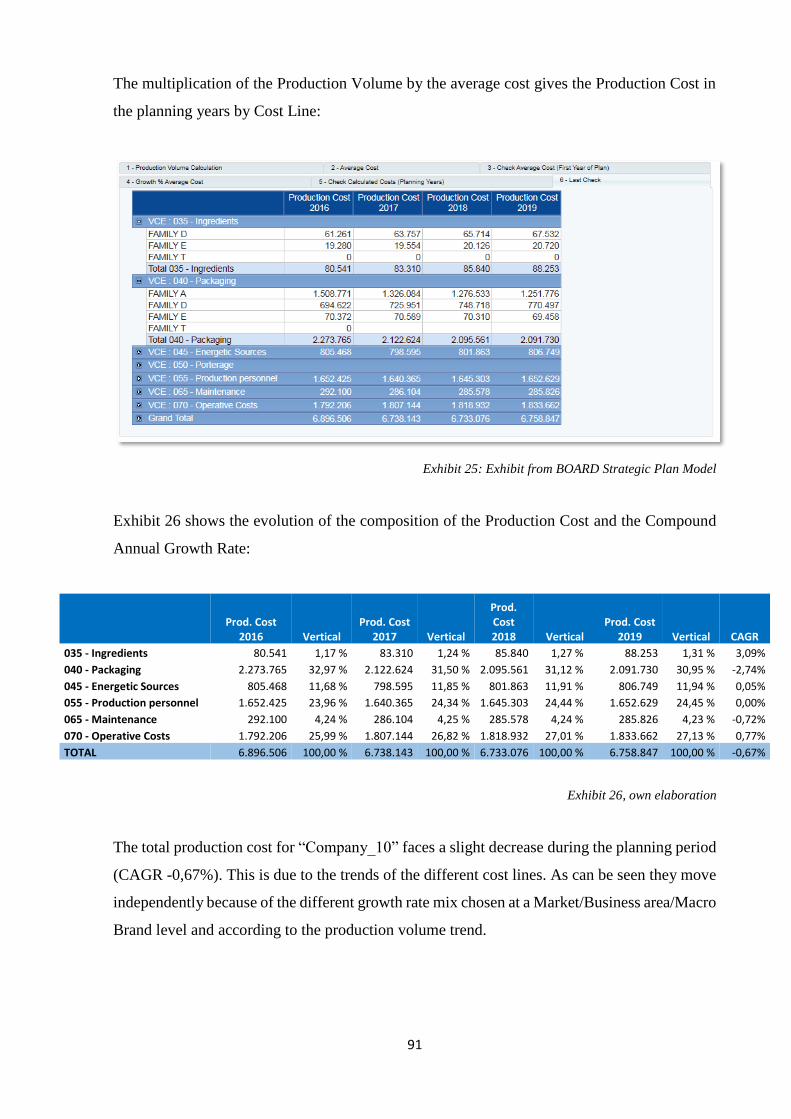
91
The multiplication of the Production Volume by the average cost gives the Production Cost in
the planning years by Cost Line:
Exhibit 25: Exhibit from BOARD Strategic Plan Model
Exhibit 26 shows the evolution of the composition of the Production Cost and the Compound
Annual Growth Rate:
Prod. Cost
2016 Vertical Prod. Cost
2017 Vertical
Prod. Cost 2018 Vertical
Prod. Cost 2019 Vertical CAGR
035 - Ingredients 80.541 1,17 % 83.310 1,24 % 85.840 1,27 % 88.253 1,31 % 3,09%
040 - Packaging 2.273.765 32,97 % 2.122.624 31,50 % 2.095.561 31,12 % 2.091.730 30,95 % -2,74%
045 - Energetic Sources 805.468 11,68 % 798.595 11,85 % 801.863 11,91 % 806.749 11,94 % 0,05%
055 - Production personnel 1.652.425 23,96 % 1.640.365 24,34 % 1.645.303 24,44 % 1.652.629 24,45 % 0,00%
065 - Maintenance 292.100 4,24 % 286.104 4,25 % 285.578 4,24 % 285.826 4,23 % -0,72%
070 - Operative Costs 1.792.206 25,99 % 1.807.144 26,82 % 1.818.932 27,01 % 1.833.662 27,13 % 0,77%
TOTAL 6.896.506 100,00 % 6.738.143 100,00 % 6.733.076 100,00 % 6.758.847 100,00 % -0,67%
Exhibit 26, own elaboration
The total production cost for “Company_10” faces a slight decrease during the planning period
(CAGR -0,67%). This is due to the trends of the different cost lines. As can be seen they move
independently because of the different growth rate mix chosen at a Market/Business area/Macro
Brand level and according to the production volume trend.
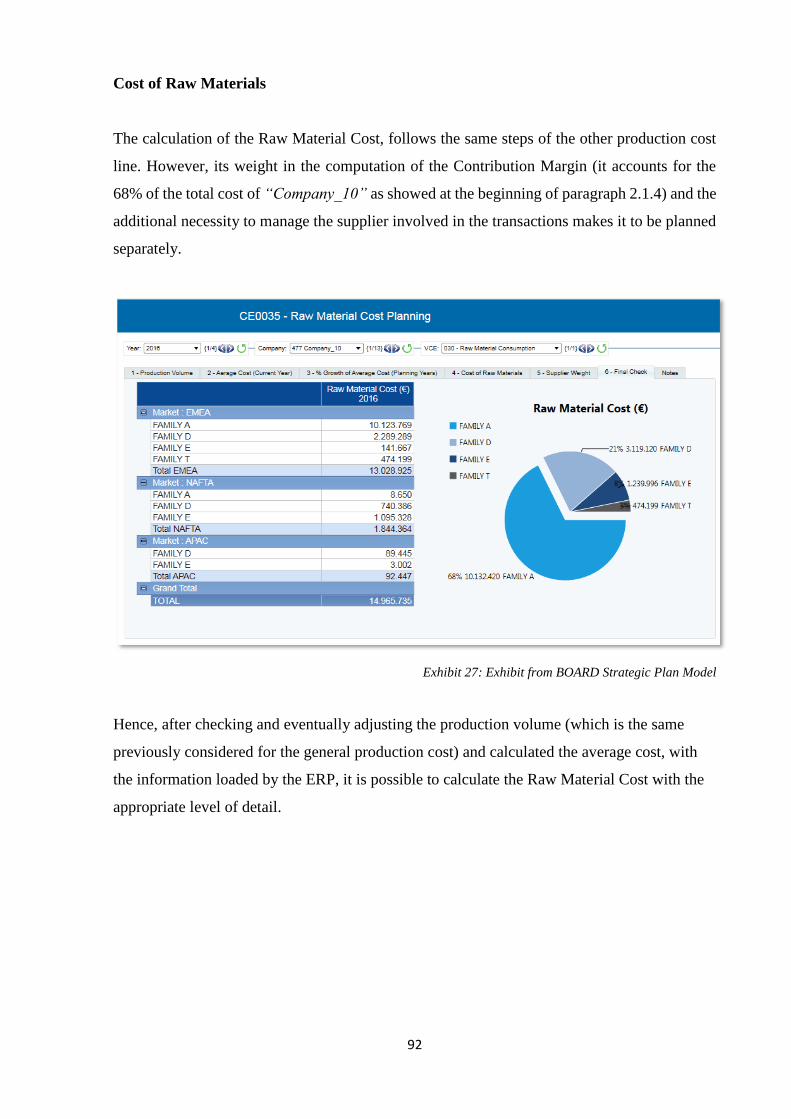
92
Cost of Raw Materials
The calculation of the Raw Material Cost, follows the same steps of the other production cost
line. However, its weight in the computation of the Contribution Margin (it accounts for the
68% of the total cost of “Company_10” as showed at the beginning of paragraph 2.1.4) and the
additional necessity to manage the supplier involved in the transactions makes it to be planned
separately.
Exhibit 27: Exhibit from BOARD Strategic Plan Model
Hence, after checking and eventually adjusting the production volume (which is the same
previously considered for the general production cost) and calculated the average cost, with
the information loaded by the ERP, it is possible to calculate the Raw Material Cost with the
appropriate level of detail.
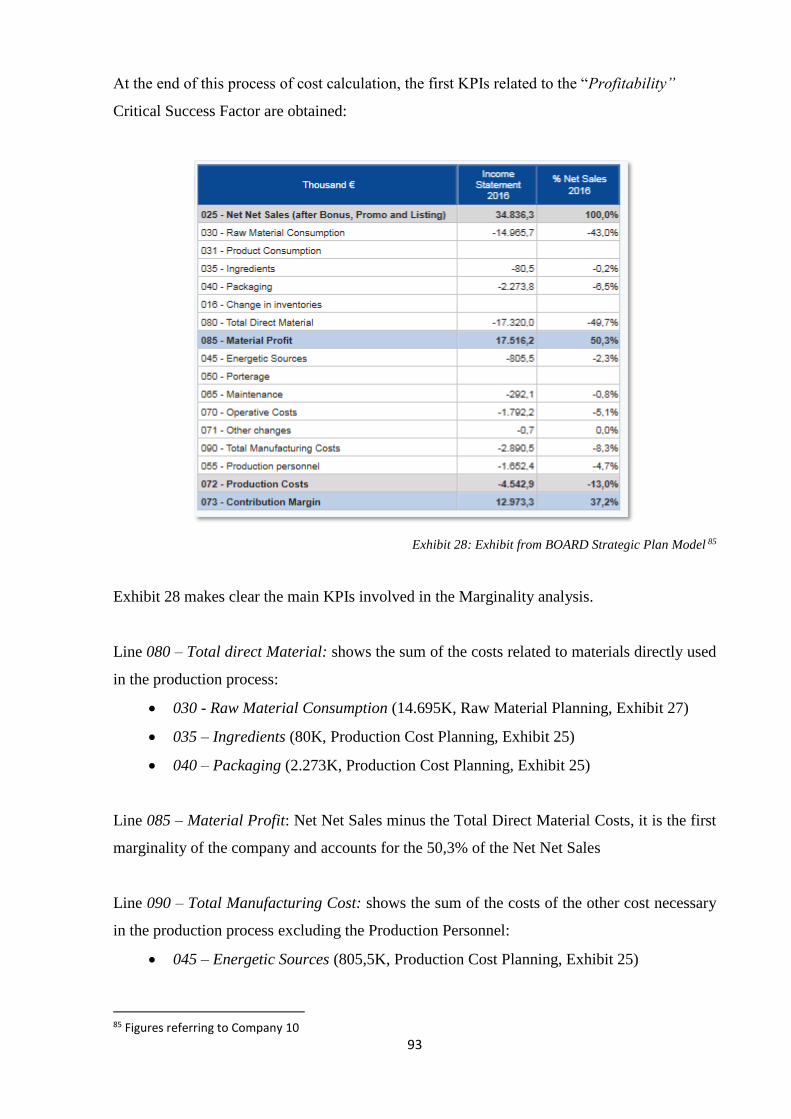
93
At the end of this process of cost calculation, the first KPIs related to the “Profitability”
Critical Success Factor are obtained:
Exhibit 28: Exhibit from BOARD Strategic Plan Model 85
Exhibit 28 makes clear the main KPIs involved in the Marginality analysis.
Line 080 – Total direct Material: shows the sum of the costs related to materials directly used
in the production process:
• 030 - Raw Material Consumption (14.695K, Raw Material Planning, Exhibit 27)
• 035 – Ingredients (80K, Production Cost Planning, Exhibit 25)
• 040 – Packaging (2.273K, Production Cost Planning, Exhibit 25)
Line 085 – Material Profit: Net Net Sales minus the Total Direct Material Costs, it is the first
marginality of the company and accounts for the 50,3% of the Net Net Sales
Line 090 – Total Manufacturing Cost: shows the sum of the costs of the other cost necessary
in the production process excluding the Production Personnel:
• 045 – Energetic Sources (805,5K, Production Cost Planning, Exhibit 25)
85 Figures referring to Company 10
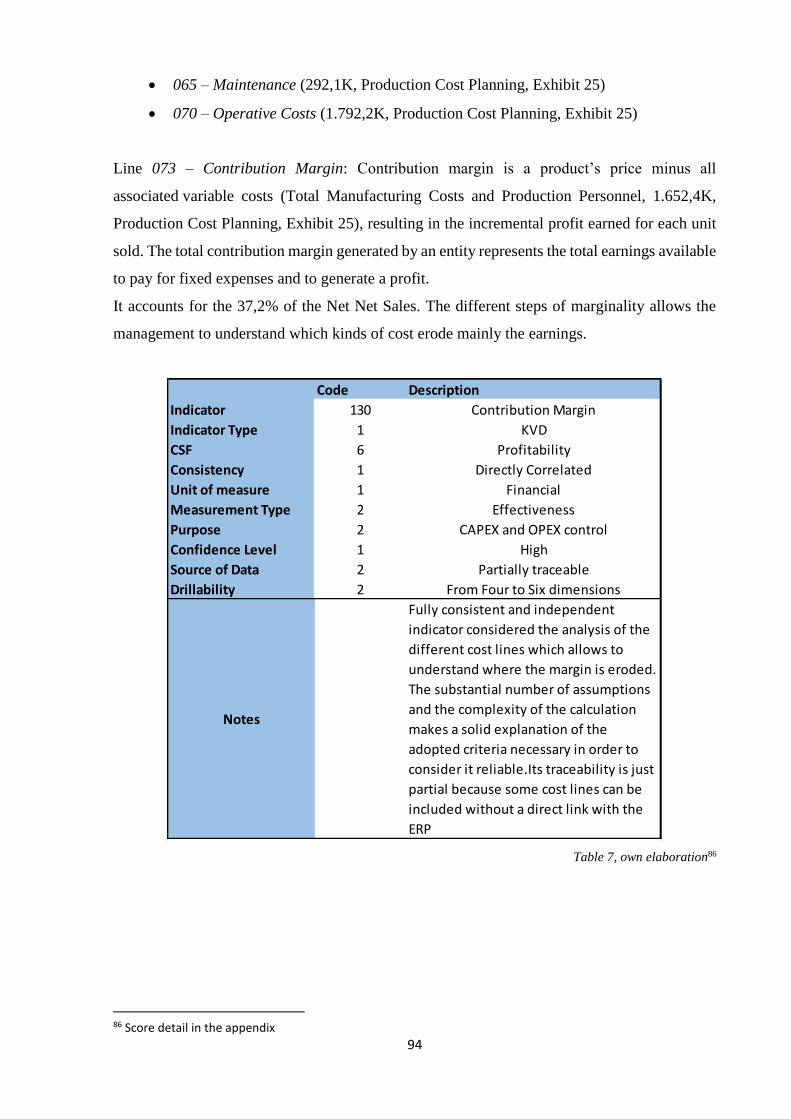
94
• 065 – Maintenance (292,1K, Production Cost Planning, Exhibit 25)
• 070 – Operative Costs (1.792,2K, Production Cost Planning, Exhibit 25)
Line 073 – Contribution Margin: Contribution margin is a product’s price minus all
associated variable costs (Total Manufacturing Costs and Production Personnel, 1.652,4K,
Production Cost Planning, Exhibit 25), resulting in the incremental profit earned for each unit
sold. The total contribution margin generated by an entity represents the total earnings available
to pay for fixed expenses and to generate a profit.
It accounts for the 37,2% of the Net Net Sales. The different steps of marginality allows the
management to understand which kinds of cost erode mainly the earnings.
Table 7, own elaboration86
86 Score detail in the appendix
Code Description
Indicator 130 Contribution Margin
Indicator Type 1 KVD
CSF 6 Profitability
Consistency 1 Directly Correlated
Unit of measure 1 Financial
Measurement Type 2 Effectiveness
Purpose 2 CAPEX and OPEX control
Confidence Level 1 High
Source of Data 2 Partially traceable
Drillability 2 From Four to Six dimensions
Notes
Fully consistent and independent
indicator considered the analysis of the
different cost lines which allows to
understand where the margin is eroded.
The substantial number of assumptions
and the complexity of the calculation
makes a solid explanation of the
adopted criteria necessary in order to
consider it reliable.Its traceability is just
partial because some cost lines can be
included without a direct link with the
ERP
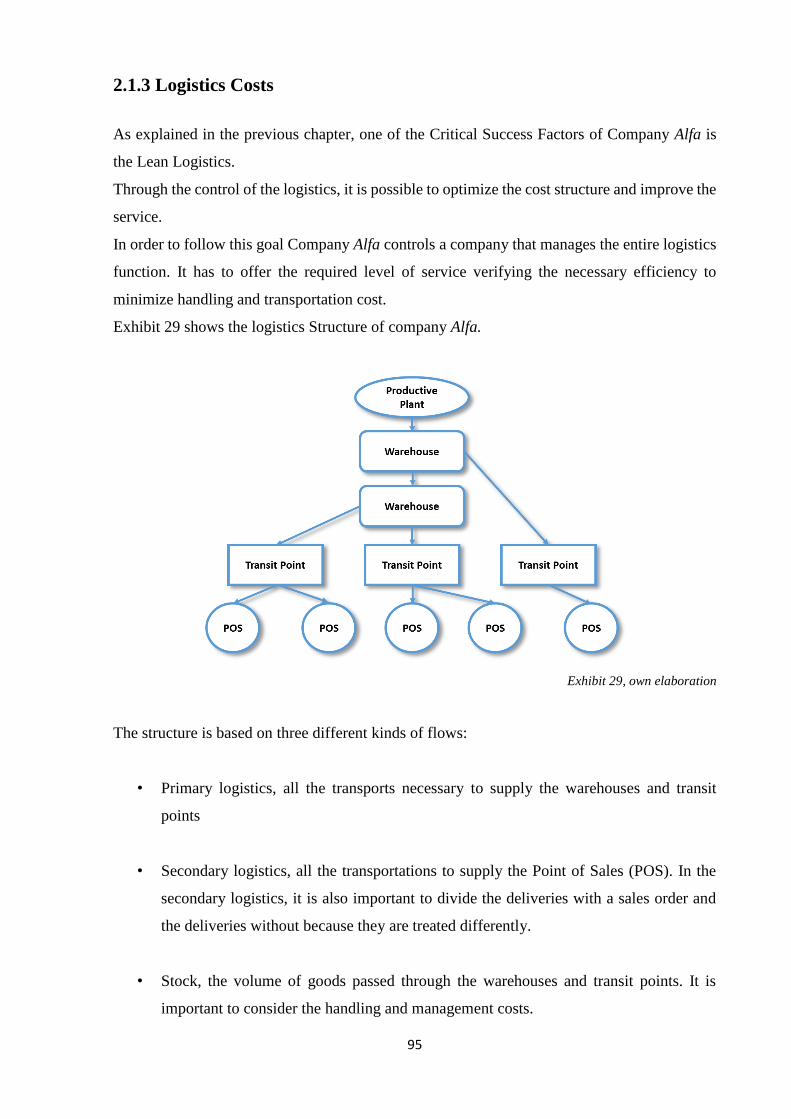
95
2.1.3 Logistics Costs
As explained in the previous chapter, one of the Critical Success Factors of Company Alfa is
the Lean Logistics.
Through the control of the logistics, it is possible to optimize the cost structure and improve the
service.
In order to follow this goal Company Alfa controls a company that manages the entire logistics
function. It has to offer the required level of service verifying the necessary efficiency to
minimize handling and transportation cost.
Exhibit 29 shows the logistics Structure of company Alfa.
Exhibit 29, own elaboration
The structure is based on three different kinds of flows:
• Primary logistics, all the transports necessary to supply the warehouses and transit
points
• Secondary logistics, all the transportations to supply the Point of Sales (POS). In the
secondary logistics, it is also important to divide the deliveries with a sales order and
the deliveries without because they are treated differently.
• Stock, the volume of goods passed through the warehouses and transit points. It is
important to consider the handling and management costs.
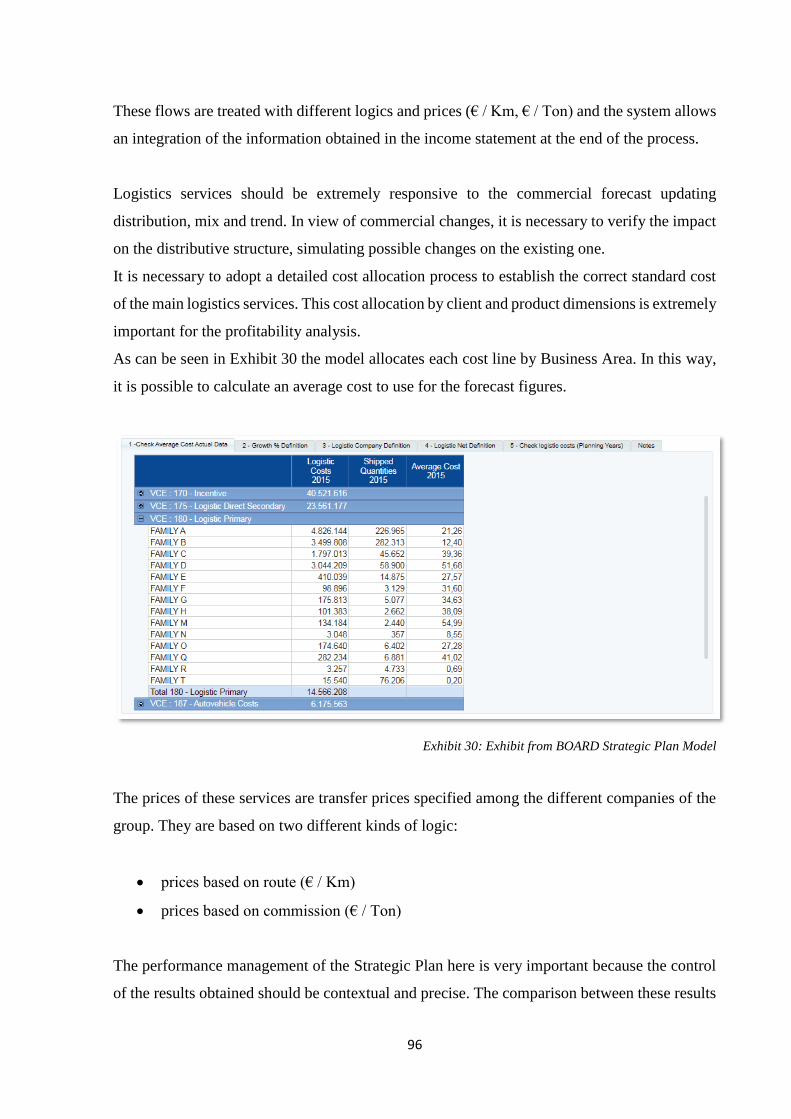
96
These flows are treated with different logics and prices (€ / Km, € / Ton) and the system allows
an integration of the information obtained in the income statement at the end of the process.
Logistics services should be extremely responsive to the commercial forecast updating
distribution, mix and trend. In view of commercial changes, it is necessary to verify the impact
on the distributive structure, simulating possible changes on the existing one.
It is necessary to adopt a detailed cost allocation process to establish the correct standard cost
of the main logistics services. This cost allocation by client and product dimensions is extremely
important for the profitability analysis.
As can be seen in Exhibit 30 the model allocates each cost line by Business Area. In this way,
it is possible to calculate an average cost to use for the forecast figures.
Exhibit 30: Exhibit from BOARD Strategic Plan Model
The prices of these services are transfer prices specified among the different companies of the
group. They are based on two different kinds of logic:
• prices based on route (€ / Km)
• prices based on commission (€ / Ton)
The performance management of the Strategic Plan here is very important because the control
of the results obtained should be contextual and precise. The comparison between these results
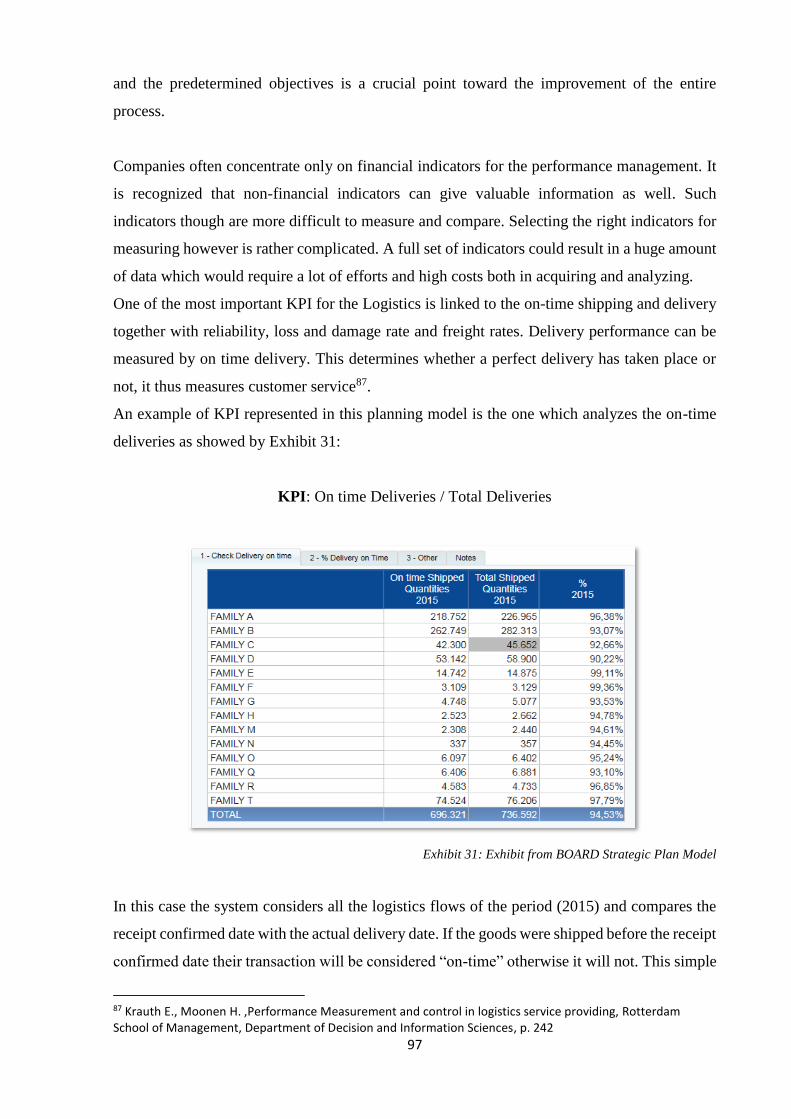
97
and the predetermined objectives is a crucial point toward the improvement of the entire
process.
Companies often concentrate only on financial indicators for the performance management. It
is recognized that non-financial indicators can give valuable information as well. Such
indicators though are more difficult to measure and compare. Selecting the right indicators for
measuring however is rather complicated. A full set of indicators could result in a huge amount
of data which would require a lot of efforts and high costs both in acquiring and analyzing.
One of the most important KPI for the Logistics is linked to the on-time shipping and delivery
together with reliability, loss and damage rate and freight rates. Delivery performance can be
measured by on time delivery. This determines whether a perfect delivery has taken place or
not, it thus measures customer service87.
An example of KPI represented in this planning model is the one which analyzes the on-time
deliveries as showed by Exhibit 31:
KPI: On time Deliveries / Total Deliveries
Exhibit 31: Exhibit from BOARD Strategic Plan Model
In this case the system considers all the logistics flows of the period (2015) and compares the
receipt confirmed date with the actual delivery date. If the goods were shipped before the receipt
confirmed date their transaction will be considered “on-time” otherwise it will not. This simple
87 Krauth E., Moonen H. ,Performance Measurement and control in logistics service providing, Rotterdam School of Management, Department of Decision and Information Sciences, p. 242
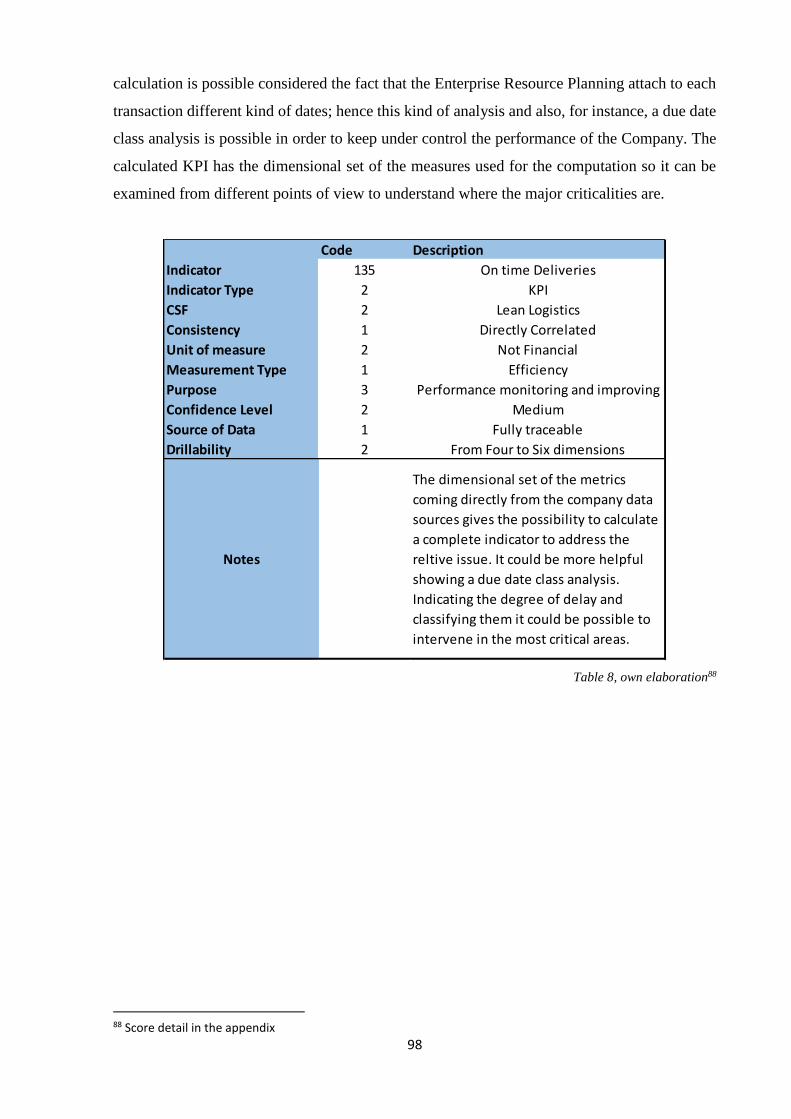
98
calculation is possible considered the fact that the Enterprise Resource Planning attach to each
transaction different kind of dates; hence this kind of analysis and also, for instance, a due date
class analysis is possible in order to keep under control the performance of the Company. The
calculated KPI has the dimensional set of the measures used for the computation so it can be
examined from different points of view to understand where the major criticalities are.
Table 8, own elaboration88
88 Score detail in the appendix
Code Description
Indicator 135 On time Deliveries
Indicator Type 2 KPI
CSF 2 Lean Logistics
Consistency 1 Directly Correlated
Unit of measure 2 Not Financial
Measurement Type 1 Efficiency
Purpose 3 Performance monitoring and improving
Confidence Level 2 Medium
Source of Data 1 Fully traceable
Drillability 2 From Four to Six dimensions
Notes
The dimensional set of the metrics
coming directly from the company data
sources gives the possibility to calculate
a complete indicator to address the
reltive issue. It could be more helpful
showing a due date class analysis.
Indicating the degree of delay and
classifying them it could be possible to
intervene in the most critical areas.
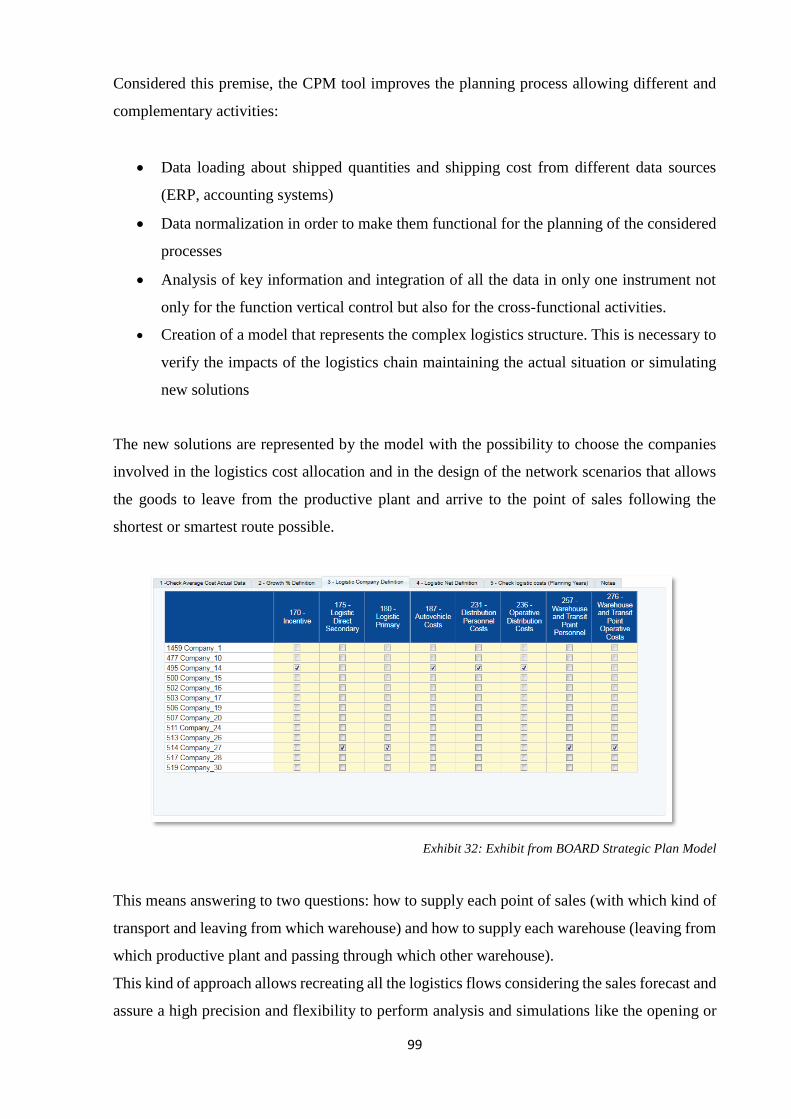
99
Considered this premise, the CPM tool improves the planning process allowing different and
complementary activities:
• Data loading about shipped quantities and shipping cost from different data sources
(ERP, accounting systems)
• Data normalization in order to make them functional for the planning of the considered
processes
• Analysis of key information and integration of all the data in only one instrument not
only for the function vertical control but also for the cross-functional activities.
• Creation of a model that represents the complex logistics structure. This is necessary to
verify the impacts of the logistics chain maintaining the actual situation or simulating
new solutions
The new solutions are represented by the model with the possibility to choose the companies
involved in the logistics cost allocation and in the design of the network scenarios that allows
the goods to leave from the productive plant and arrive to the point of sales following the
shortest or smartest route possible.
Exhibit 32: Exhibit from BOARD Strategic Plan Model
This means answering to two questions: how to supply each point of sales (with which kind of
transport and leaving from which warehouse) and how to supply each warehouse (leaving from
which productive plant and passing through which other warehouse).
This kind of approach allows recreating all the logistics flows considering the sales forecast and
assure a high precision and flexibility to perform analysis and simulations like the opening or
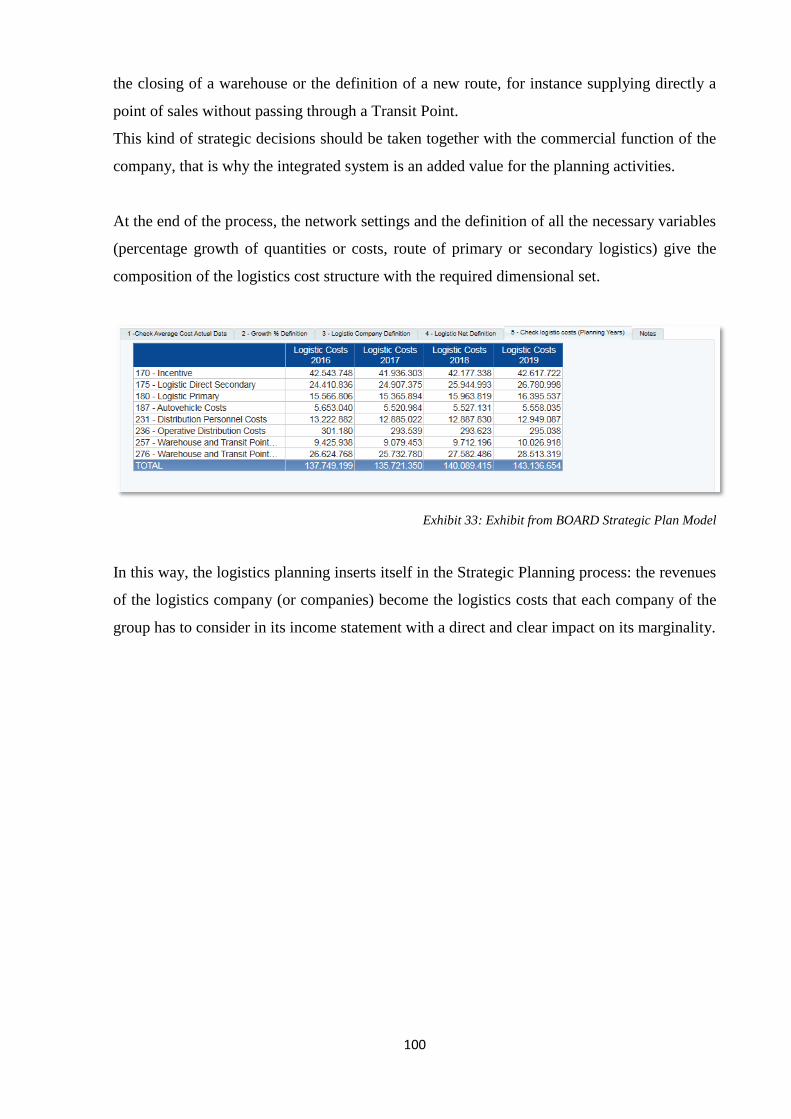
100
the closing of a warehouse or the definition of a new route, for instance supplying directly a
point of sales without passing through a Transit Point.
This kind of strategic decisions should be taken together with the commercial function of the
company, that is why the integrated system is an added value for the planning activities.
At the end of the process, the network settings and the definition of all the necessary variables
(percentage growth of quantities or costs, route of primary or secondary logistics) give the
composition of the logistics cost structure with the required dimensional set.
Exhibit 33: Exhibit from BOARD Strategic Plan Model
In this way, the logistics planning inserts itself in the Strategic Planning process: the revenues
of the logistics company (or companies) become the logistics costs that each company of the
group has to consider in its income statement with a direct and clear impact on its marginality.
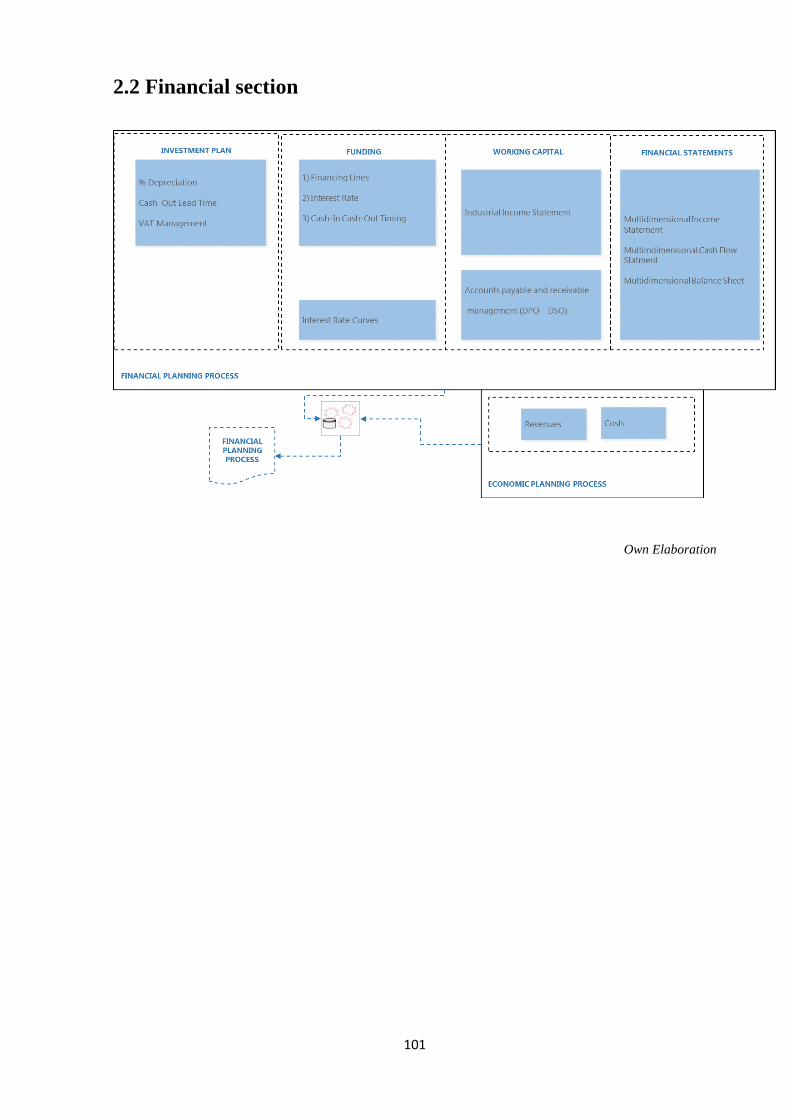
101
2.2 Financial section
Own Elaboration
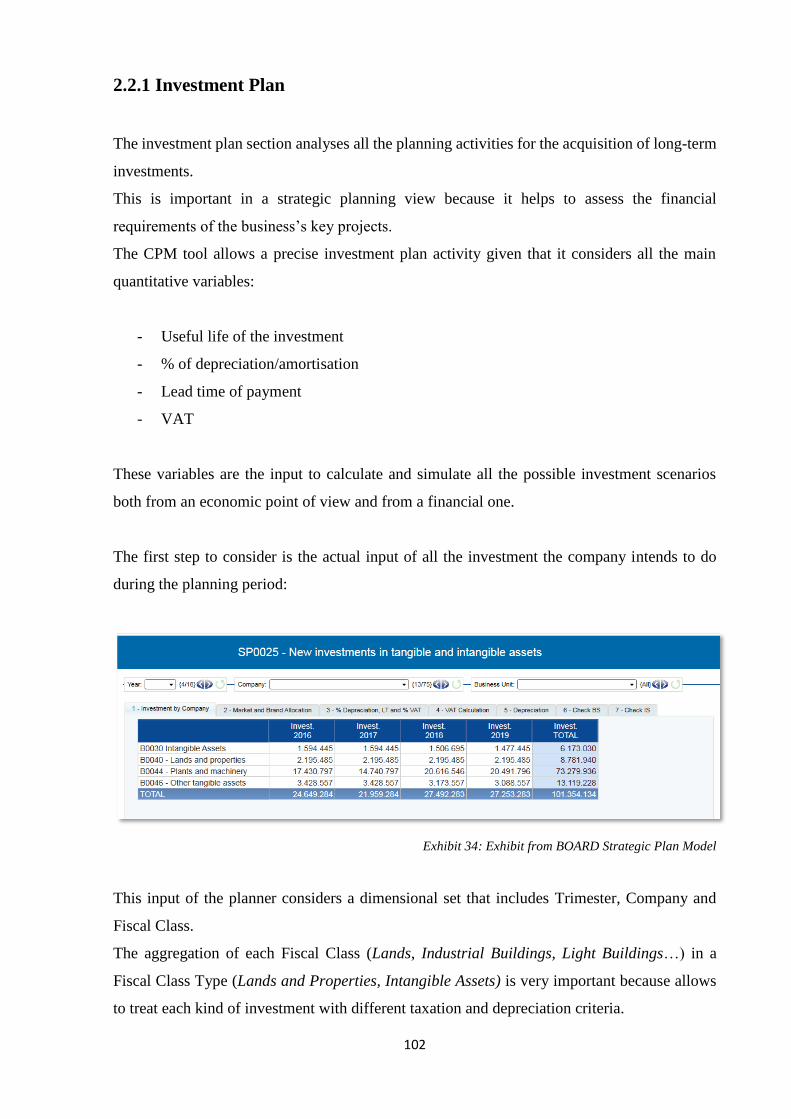
102
2.2.1 Investment Plan
The investment plan section analyses all the planning activities for the acquisition of long-term
investments.
This is important in a strategic planning view because it helps to assess the financial
requirements of the business’s key projects.
The CPM tool allows a precise investment plan activity given that it considers all the main
quantitative variables:
- Useful life of the investment
- % of depreciation/amortisation
- Lead time of payment
- VAT
These variables are the input to calculate and simulate all the possible investment scenarios
both from an economic point of view and from a financial one.
The first step to consider is the actual input of all the investment the company intends to do
during the planning period:
Exhibit 34: Exhibit from BOARD Strategic Plan Model
This input of the planner considers a dimensional set that includes Trimester, Company and
Fiscal Class.
The aggregation of each Fiscal Class (Lands, Industrial Buildings, Light Buildings…) in a
Fiscal Class Type (Lands and Properties, Intangible Assets) is very important because allows
to treat each kind of investment with different taxation and depreciation criteria.
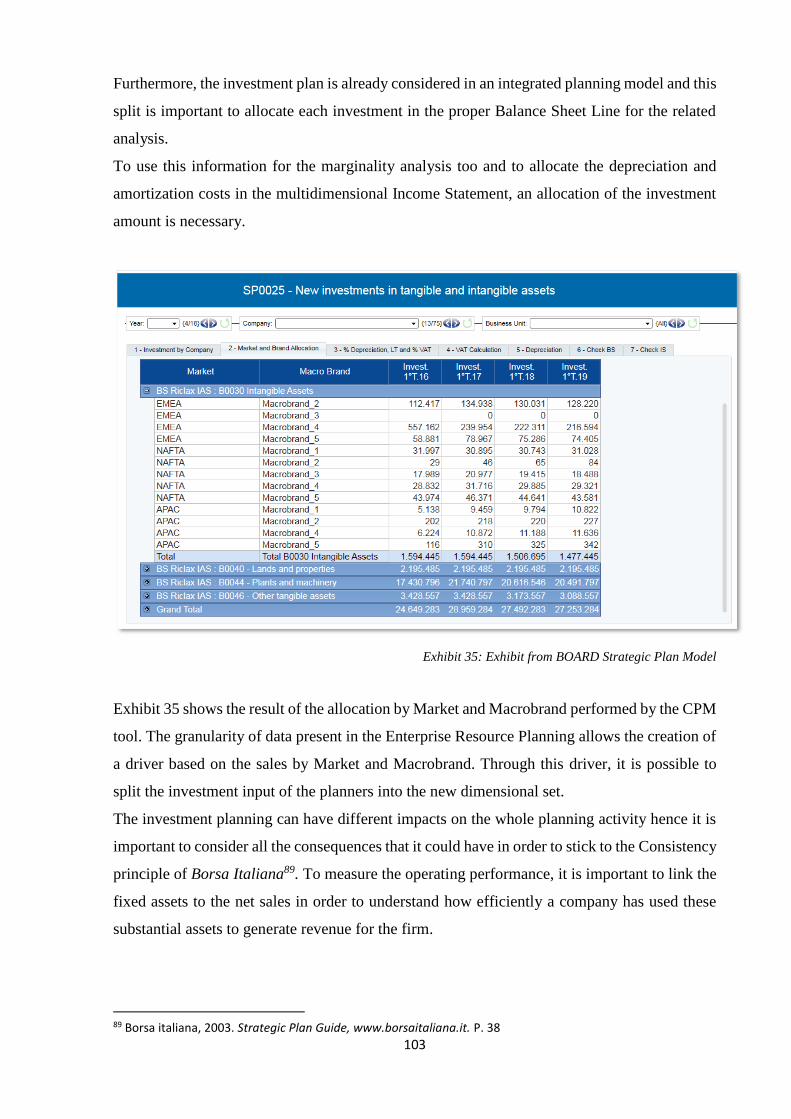
103
Furthermore, the investment plan is already considered in an integrated planning model and this
split is important to allocate each investment in the proper Balance Sheet Line for the related
analysis.
To use this information for the marginality analysis too and to allocate the depreciation and
amortization costs in the multidimensional Income Statement, an allocation of the investment
amount is necessary.
Exhibit 35: Exhibit from BOARD Strategic Plan Model
Exhibit 35 shows the result of the allocation by Market and Macrobrand performed by the CPM
tool. The granularity of data present in the Enterprise Resource Planning allows the creation of
a driver based on the sales by Market and Macrobrand. Through this driver, it is possible to
split the investment input of the planners into the new dimensional set.
The investment planning can have different impacts on the whole planning activity hence it is
important to consider all the consequences that it could have in order to stick to the Consistency
principle of Borsa Italiana89. To measure the operating performance, it is important to link the
fixed assets to the net sales in order to understand how efficiently a company has used these
substantial assets to generate revenue for the firm.
89 Borsa italiana, 2003. Strategic Plan Guide, www.borsaitaliana.it. P. 38
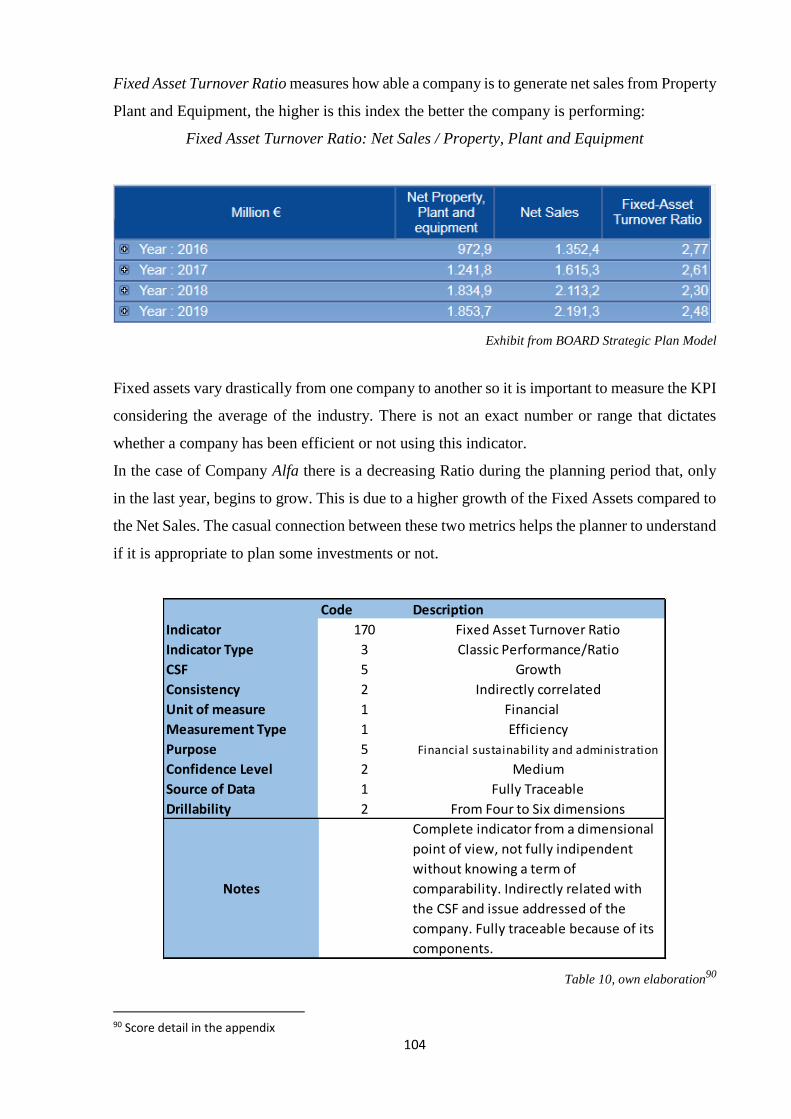
104
Fixed Asset Turnover Ratio measures how able a company is to generate net sales from Property
Plant and Equipment, the higher is this index the better the company is performing:
Fixed Asset Turnover Ratio: Net Sales / Property, Plant and Equipment
Exhibit from BOARD Strategic Plan Model
Fixed assets vary drastically from one company to another so it is important to measure the KPI
considering the average of the industry. There is not an exact number or range that dictates
whether a company has been efficient or not using this indicator.
In the case of Company Alfa there is a decreasing Ratio during the planning period that, only
in the last year, begins to grow. This is due to a higher growth of the Fixed Assets compared to
the Net Sales. The casual connection between these two metrics helps the planner to understand
if it is appropriate to plan some investments or not.
Table 10, own elaboration90
90 Score detail in the appendix
Code Description
Indicator 170 Fixed Asset Turnover Ratio
Indicator Type 3 Classic Performance/Ratio
CSF 5 Growth
Consistency 2 Indirectly correlated
Unit of measure 1 Financial
Measurement Type 1 Efficiency
Purpose 5 Financial sustainability and administration
Confidence Level 2 Medium
Source of Data 1 Fully Traceable
Drillability 2 From Four to Six dimensions
Notes
Complete indicator from a dimensional
point of view, not fully indipendent
without knowing a term of
comparability. Indirectly related with
the CSF and issue addressed of the
company. Fully traceable because of its
components.
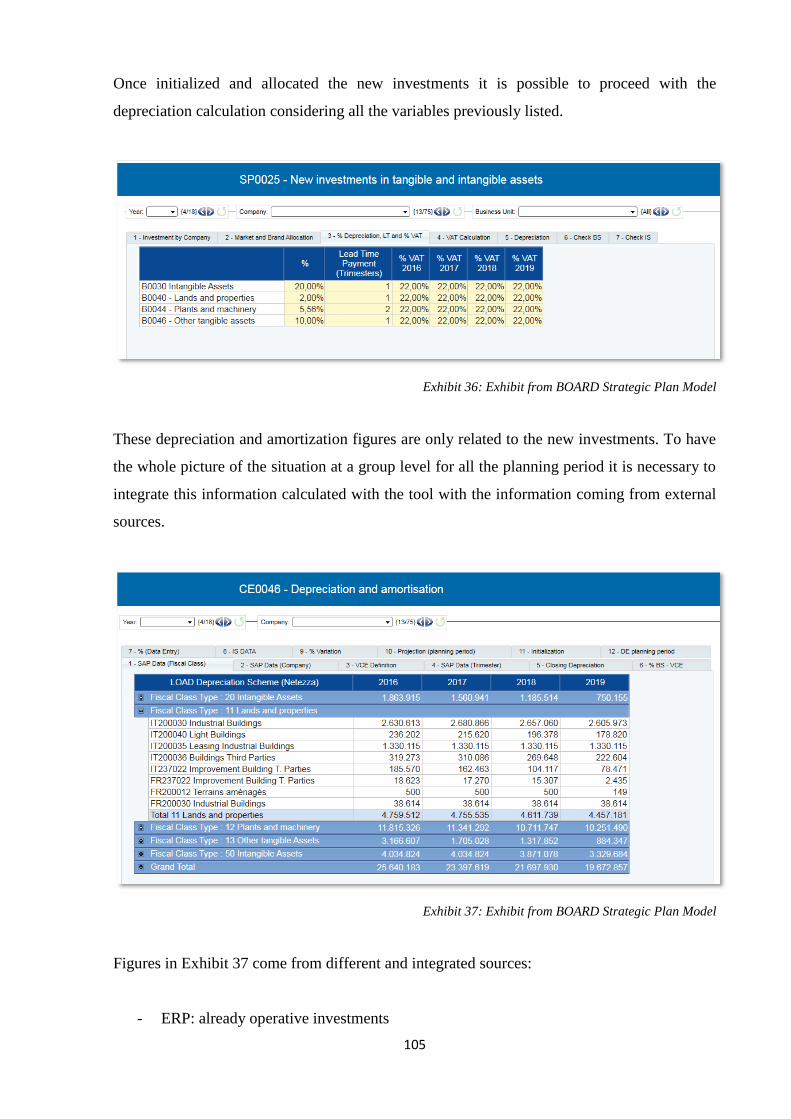
105
Once initialized and allocated the new investments it is possible to proceed with the
depreciation calculation considering all the variables previously listed.
Exhibit 36: Exhibit from BOARD Strategic Plan Model
These depreciation and amortization figures are only related to the new investments. To have
the whole picture of the situation at a group level for all the planning period it is necessary to
integrate this information calculated with the tool with the information coming from external
sources.
Exhibit 37: Exhibit from BOARD Strategic Plan Model
Figures in Exhibit 37 come from different and integrated sources:
- ERP: already operative investments
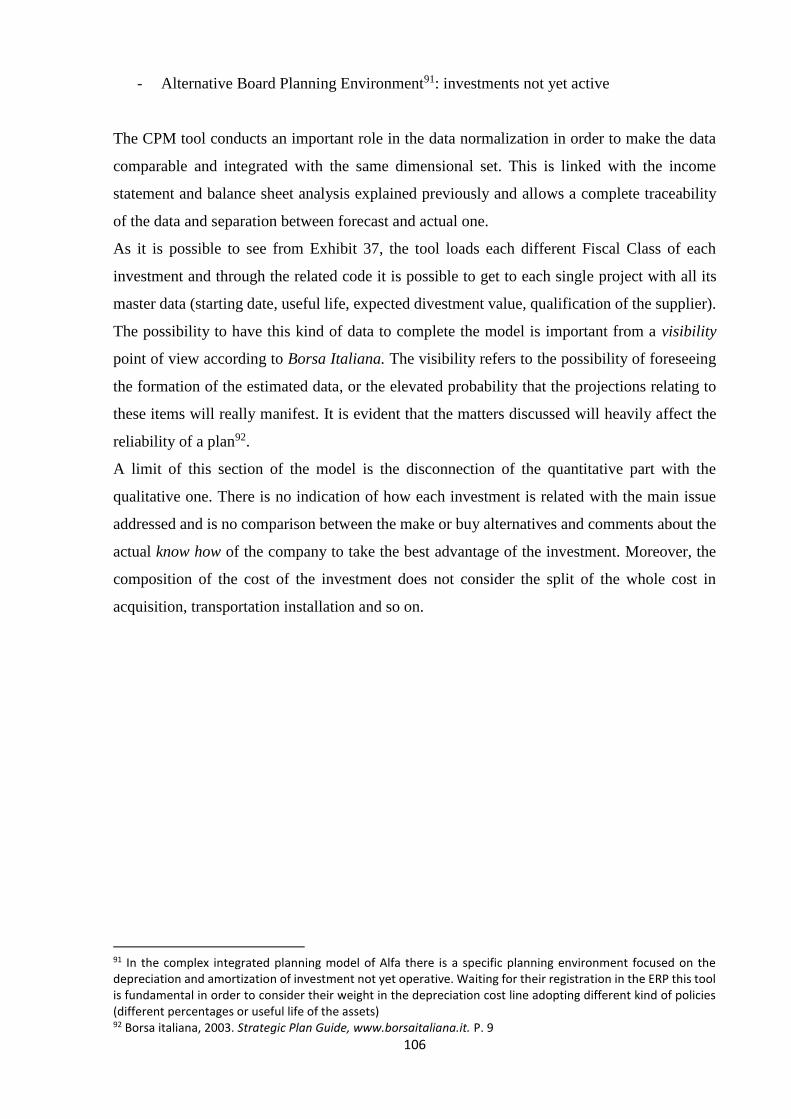
106
- Alternative Board Planning Environment91: investments not yet active
The CPM tool conducts an important role in the data normalization in order to make the data
comparable and integrated with the same dimensional set. This is linked with the income
statement and balance sheet analysis explained previously and allows a complete traceability
of the data and separation between forecast and actual one.
As it is possible to see from Exhibit 37, the tool loads each different Fiscal Class of each
investment and through the related code it is possible to get to each single project with all its
master data (starting date, useful life, expected divestment value, qualification of the supplier).
The possibility to have this kind of data to complete the model is important from a visibility
point of view according to Borsa Italiana. The visibility refers to the possibility of foreseeing
the formation of the estimated data, or the elevated probability that the projections relating to
these items will really manifest. It is evident that the matters discussed will heavily affect the
reliability of a plan92.
A limit of this section of the model is the disconnection of the quantitative part with the
qualitative one. There is no indication of how each investment is related with the main issue
addressed and is no comparison between the make or buy alternatives and comments about the
actual know how of the company to take the best advantage of the investment. Moreover, the
composition of the cost of the investment does not consider the split of the whole cost in
acquisition, transportation installation and so on.
91 In the complex integrated planning model of Alfa there is a specific planning environment focused on the depreciation and amortization of investment not yet operative. Waiting for their registration in the ERP this tool is fundamental in order to consider their weight in the depreciation cost line adopting different kind of policies (different percentages or useful life of the assets) 92 Borsa italiana, 2003. Strategic Plan Guide, www.borsaitaliana.it. P. 9
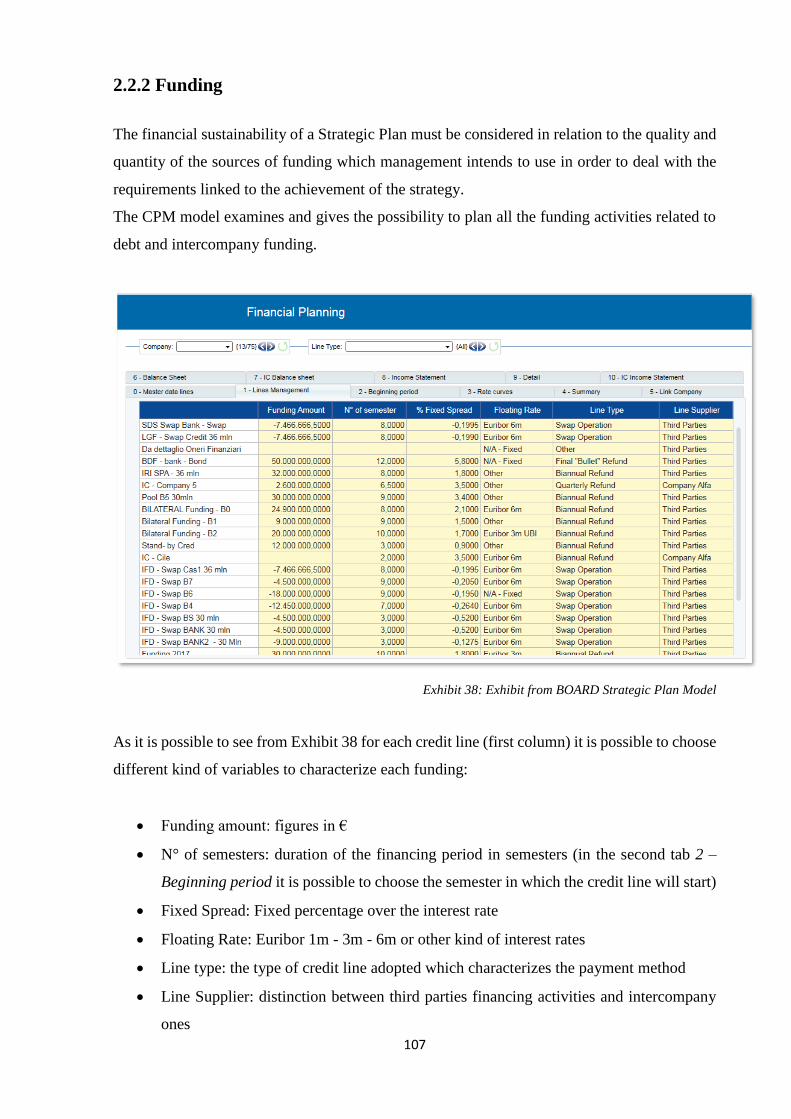
107
2.2.2 Funding
The financial sustainability of a Strategic Plan must be considered in relation to the quality and
quantity of the sources of funding which management intends to use in order to deal with the
requirements linked to the achievement of the strategy.
The CPM model examines and gives the possibility to plan all the funding activities related to
debt and intercompany funding.
Exhibit 38: Exhibit from BOARD Strategic Plan Model
As it is possible to see from Exhibit 38 for each credit line (first column) it is possible to choose
different kind of variables to characterize each funding:
• Funding amount: figures in €
• N° of semesters: duration of the financing period in semesters (in the second tab 2 –
Beginning period it is possible to choose the semester in which the credit line will start)
• Fixed Spread: Fixed percentage over the interest rate
• Floating Rate: Euribor 1m - 3m - 6m or other kind of interest rates
• Line type: the type of credit line adopted which characterizes the payment method
• Line Supplier: distinction between third parties financing activities and intercompany
ones
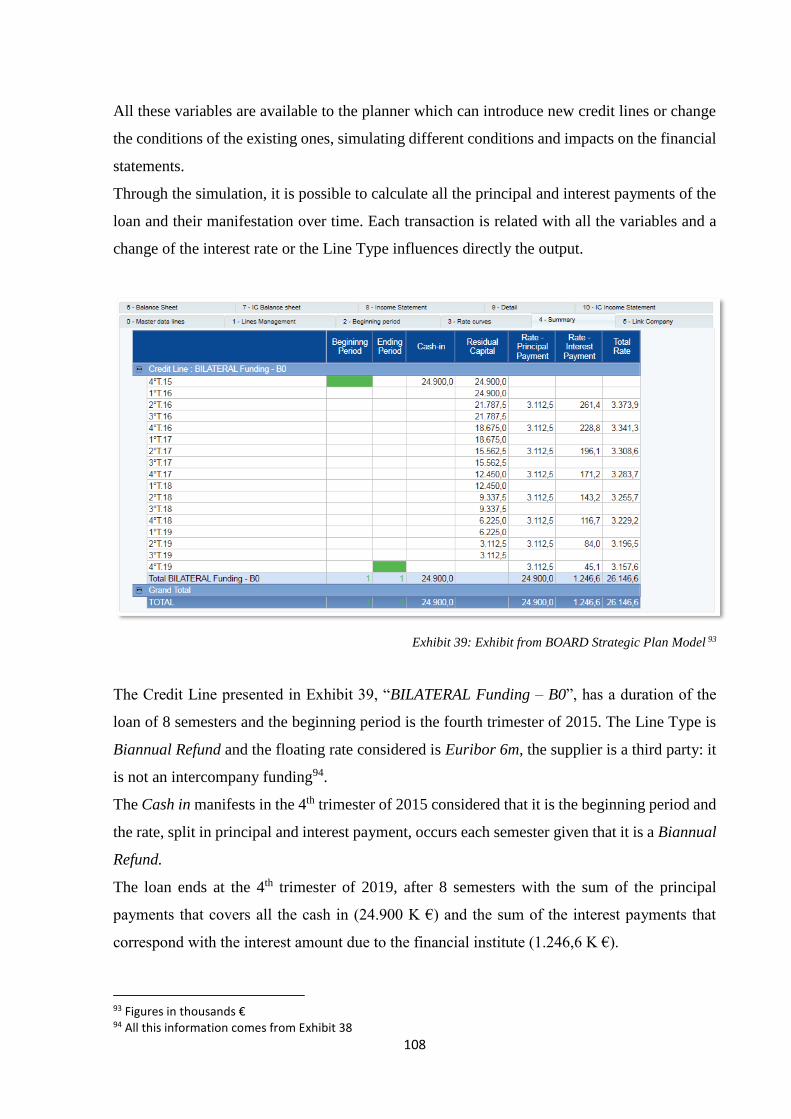
108
All these variables are available to the planner which can introduce new credit lines or change
the conditions of the existing ones, simulating different conditions and impacts on the financial
statements.
Through the simulation, it is possible to calculate all the principal and interest payments of the
loan and their manifestation over time. Each transaction is related with all the variables and a
change of the interest rate or the Line Type influences directly the output.
Exhibit 39: Exhibit from BOARD Strategic Plan Model 93
The Credit Line presented in Exhibit 39, “BILATERAL Funding – B0”, has a duration of the
loan of 8 semesters and the beginning period is the fourth trimester of 2015. The Line Type is
Biannual Refund and the floating rate considered is Euribor 6m, the supplier is a third party: it
is not an intercompany funding94.
The Cash in manifests in the 4th trimester of 2015 considered that it is the beginning period and
the rate, split in principal and interest payment, occurs each semester given that it is a Biannual
Refund.
The loan ends at the 4th trimester of 2019, after 8 semesters with the sum of the principal
payments that covers all the cash in (24.900 K €) and the sum of the interest payments that
correspond with the interest amount due to the financial institute (1.246,6 K €).
93 Figures in thousands € 94 All this information comes from Exhibit 38
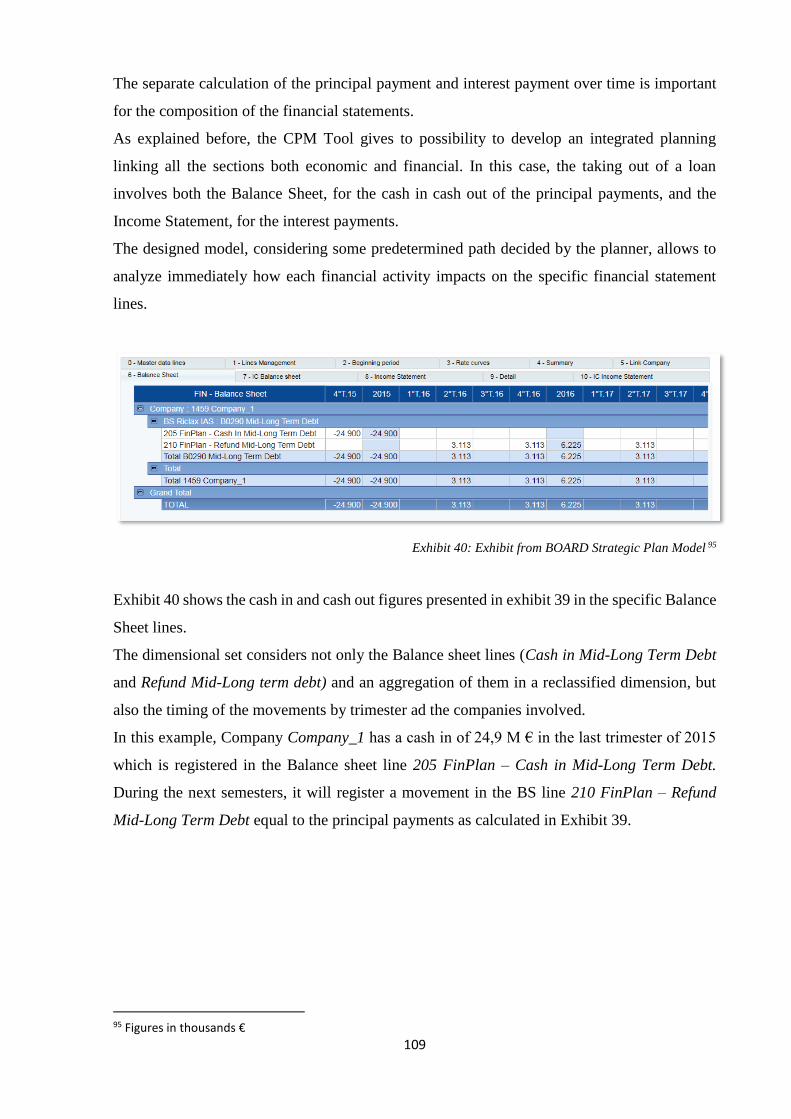
109
The separate calculation of the principal payment and interest payment over time is important
for the composition of the financial statements.
As explained before, the CPM Tool gives to possibility to develop an integrated planning
linking all the sections both economic and financial. In this case, the taking out of a loan
involves both the Balance Sheet, for the cash in cash out of the principal payments, and the
Income Statement, for the interest payments.
The designed model, considering some predetermined path decided by the planner, allows to
analyze immediately how each financial activity impacts on the specific financial statement
lines.
Exhibit 40: Exhibit from BOARD Strategic Plan Model 95
Exhibit 40 shows the cash in and cash out figures presented in exhibit 39 in the specific Balance
Sheet lines.
The dimensional set considers not only the Balance sheet lines (Cash in Mid-Long Term Debt
and Refund Mid-Long term debt) and an aggregation of them in a reclassified dimension, but
also the timing of the movements by trimester ad the companies involved.
In this example, Company Company_1 has a cash in of 24,9 M € in the last trimester of 2015
which is registered in the Balance sheet line 205 FinPlan – Cash in Mid-Long Term Debt.
During the next semesters, it will register a movement in the BS line 210 FinPlan – Refund
Mid-Long Term Debt equal to the principal payments as calculated in Exhibit 39.
95 Figures in thousands €
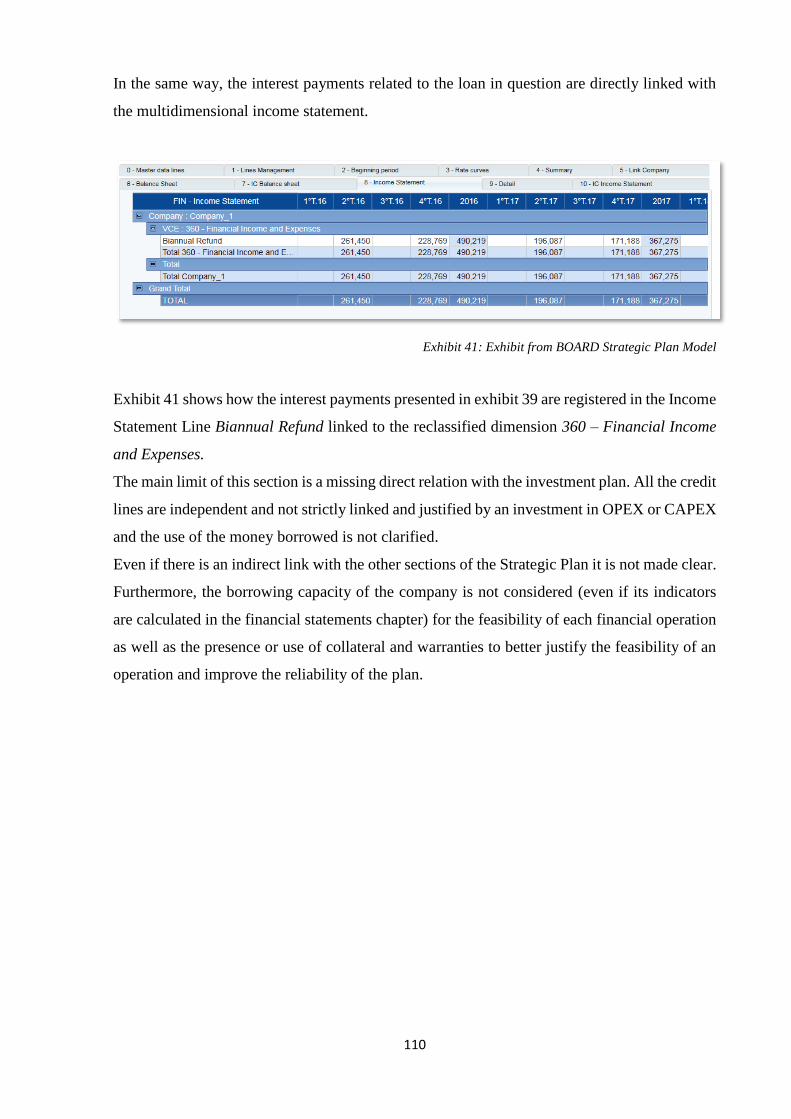
110
In the same way, the interest payments related to the loan in question are directly linked with
the multidimensional income statement.
Exhibit 41: Exhibit from BOARD Strategic Plan Model
Exhibit 41 shows how the interest payments presented in exhibit 39 are registered in the Income
Statement Line Biannual Refund linked to the reclassified dimension 360 – Financial Income
and Expenses.
The main limit of this section is a missing direct relation with the investment plan. All the credit
lines are independent and not strictly linked and justified by an investment in OPEX or CAPEX
and the use of the money borrowed is not clarified.
Even if there is an indirect link with the other sections of the Strategic Plan it is not made clear.
Furthermore, the borrowing capacity of the company is not considered (even if its indicators
are calculated in the financial statements chapter) for the feasibility of each financial operation
as well as the presence or use of collateral and warranties to better justify the feasibility of an
operation and improve the reliability of the plan.
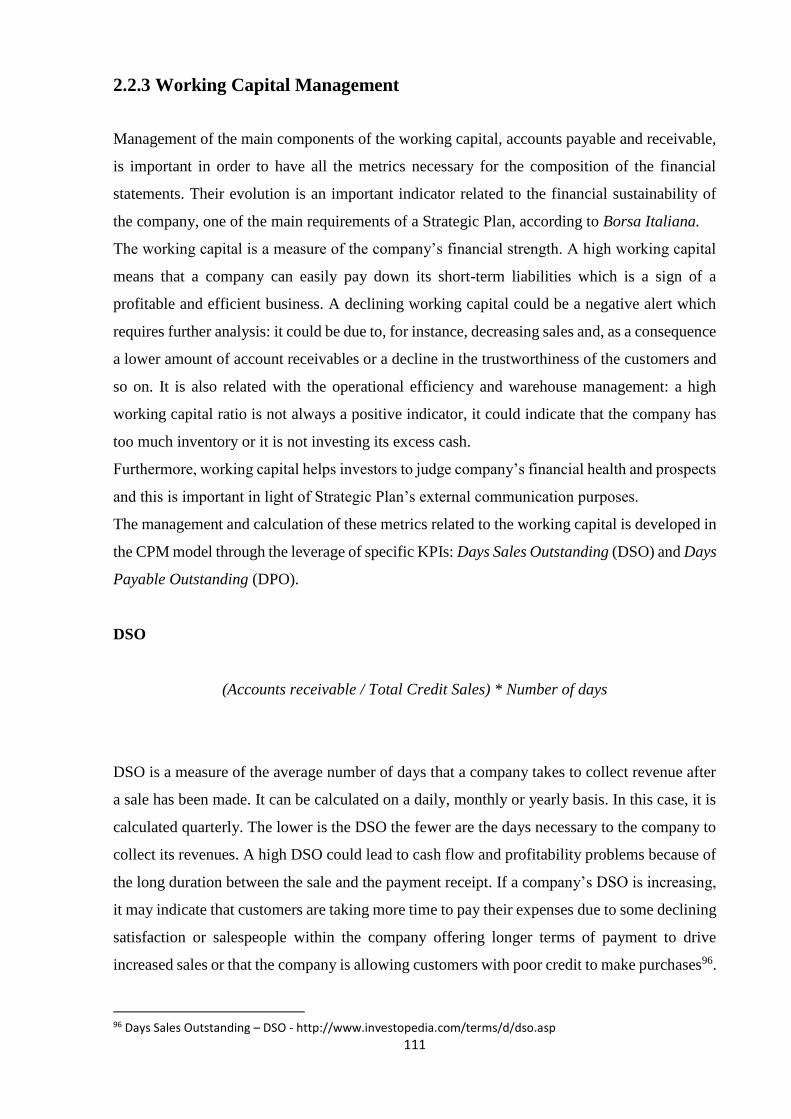
111
2.2.3 Working Capital Management
Management of the main components of the working capital, accounts payable and receivable,
is important in order to have all the metrics necessary for the composition of the financial
statements. Their evolution is an important indicator related to the financial sustainability of
the company, one of the main requirements of a Strategic Plan, according to Borsa Italiana.
The working capital is a measure of the company’s financial strength. A high working capital
means that a company can easily pay down its short-term liabilities which is a sign of a
profitable and efficient business. A declining working capital could be a negative alert which
requires further analysis: it could be due to, for instance, decreasing sales and, as a consequence
a lower amount of account receivables or a decline in the trustworthiness of the customers and
so on. It is also related with the operational efficiency and warehouse management: a high
working capital ratio is not always a positive indicator, it could indicate that the company has
too much inventory or it is not investing its excess cash.
Furthermore, working capital helps investors to judge company’s financial health and prospects
and this is important in light of Strategic Plan’s external communication purposes.
The management and calculation of these metrics related to the working capital is developed in
the CPM model through the leverage of specific KPIs: Days Sales Outstanding (DSO) and Days
Payable Outstanding (DPO).
DSO
(Accounts receivable / Total Credit Sales) * Number of days
DSO is a measure of the average number of days that a company takes to collect revenue after
a sale has been made. It can be calculated on a daily, monthly or yearly basis. In this case, it is
calculated quarterly. The lower is the DSO the fewer are the days necessary to the company to
collect its revenues. A high DSO could lead to cash flow and profitability problems because of
the long duration between the sale and the payment receipt. If a company’s DSO is increasing,
it may indicate that customers are taking more time to pay their expenses due to some declining
satisfaction or salespeople within the company offering longer terms of payment to drive
increased sales or that the company is allowing customers with poor credit to make purchases96.
96 Days Sales Outstanding – DSO - http://www.investopedia.com/terms/d/dso.asp
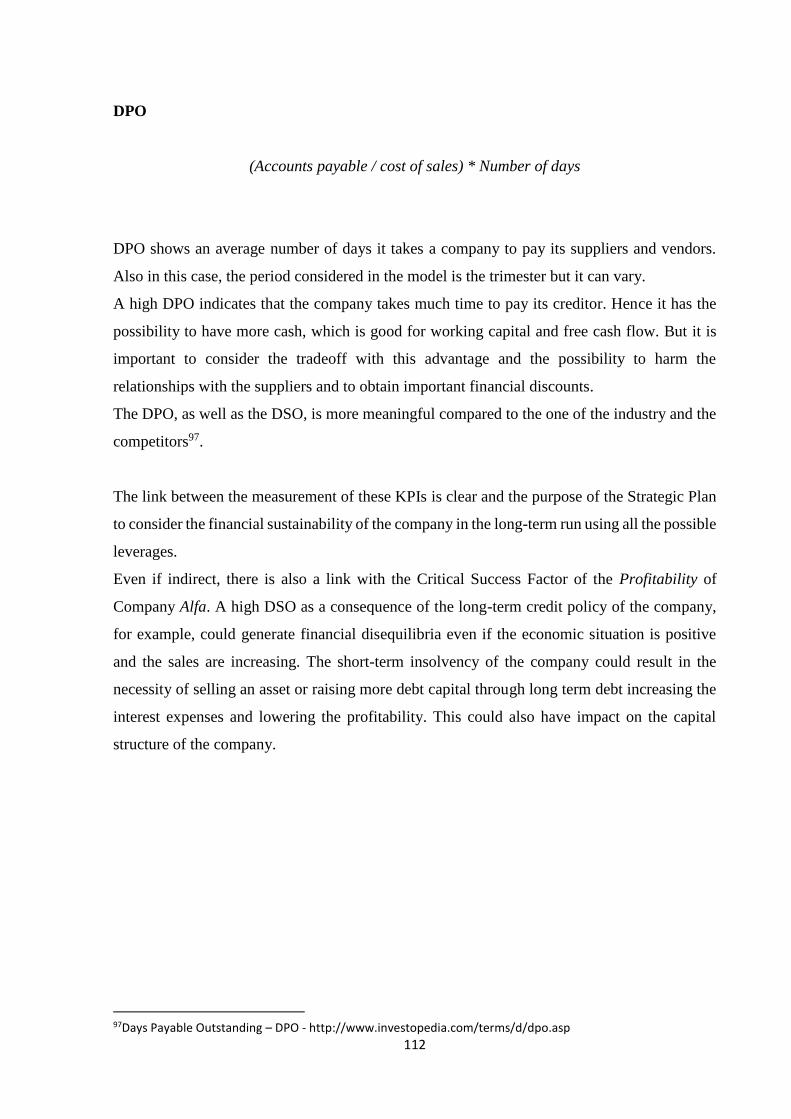
112
DPO
(Accounts payable / cost of sales) * Number of days
DPO shows an average number of days it takes a company to pay its suppliers and vendors.
Also in this case, the period considered in the model is the trimester but it can vary.
A high DPO indicates that the company takes much time to pay its creditor. Hence it has the
possibility to have more cash, which is good for working capital and free cash flow. But it is
important to consider the tradeoff with this advantage and the possibility to harm the
relationships with the suppliers and to obtain important financial discounts.
The DPO, as well as the DSO, is more meaningful compared to the one of the industry and the
competitors97.
The link between the measurement of these KPIs is clear and the purpose of the Strategic Plan
to consider the financial sustainability of the company in the long-term run using all the possible
leverages.
Even if indirect, there is also a link with the Critical Success Factor of the Profitability of
Company Alfa. A high DSO as a consequence of the long-term credit policy of the company,
for example, could generate financial disequilibria even if the economic situation is positive
and the sales are increasing. The short-term insolvency of the company could result in the
necessity of selling an asset or raising more debt capital through long term debt increasing the
interest expenses and lowering the profitability. This could also have impact on the capital
structure of the company.
97Days Payable Outstanding – DPO - http://www.investopedia.com/terms/d/dpo.asp
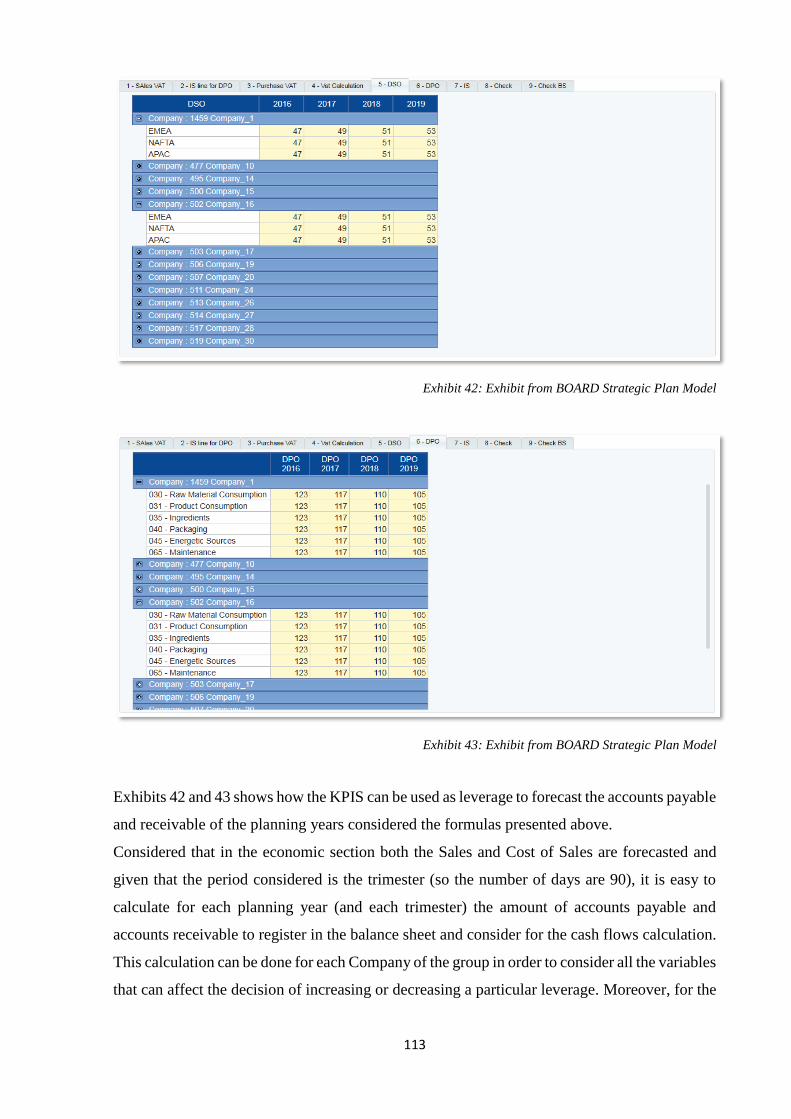
113
Exhibit 42: Exhibit from BOARD Strategic Plan Model
Exhibit 43: Exhibit from BOARD Strategic Plan Model
Exhibits 42 and 43 shows how the KPIS can be used as leverage to forecast the accounts payable
and receivable of the planning years considered the formulas presented above.
Considered that in the economic section both the Sales and Cost of Sales are forecasted and
given that the period considered is the trimester (so the number of days are 90), it is easy to
calculate for each planning year (and each trimester) the amount of accounts payable and
accounts receivable to register in the balance sheet and consider for the cash flows calculation.
This calculation can be done for each Company of the group in order to consider all the variables
that can affect the decision of increasing or decreasing a particular leverage. Moreover, for the
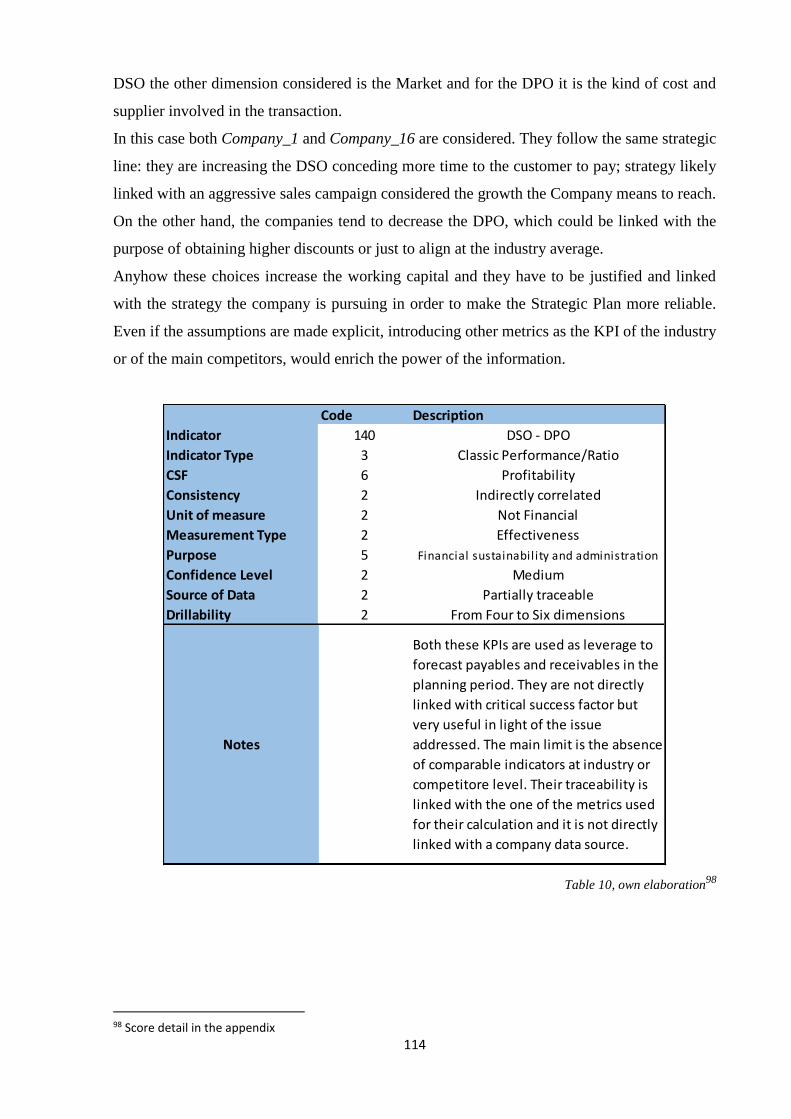
114
DSO the other dimension considered is the Market and for the DPO it is the kind of cost and
supplier involved in the transaction.
In this case both Company_1 and Company_16 are considered. They follow the same strategic
line: they are increasing the DSO conceding more time to the customer to pay; strategy likely
linked with an aggressive sales campaign considered the growth the Company means to reach.
On the other hand, the companies tend to decrease the DPO, which could be linked with the
purpose of obtaining higher discounts or just to align at the industry average.
Anyhow these choices increase the working capital and they have to be justified and linked
with the strategy the company is pursuing in order to make the Strategic Plan more reliable.
Even if the assumptions are made explicit, introducing other metrics as the KPI of the industry
or of the main competitors, would enrich the power of the information.
Table 10, own elaboration98
98 Score detail in the appendix
Code Description
Indicator 140 DSO - DPO
Indicator Type 3 Classic Performance/Ratio
CSF 6 Profitability
Consistency 2 Indirectly correlated
Unit of measure 2 Not Financial
Measurement Type 2 Effectiveness
Purpose 5 Financial sustainability and administration
Confidence Level 2 Medium
Source of Data 2 Partially traceable
Drillability 2 From Four to Six dimensions
Notes
Both these KPIs are used as leverage to
forecast payables and receivables in the
planning period. They are not directly
linked with critical success factor but
very useful in light of the issue
addressed. The main limit is the absence
of comparable indicators at industry or
competitore level. Their traceability is
linked with the one of the metrics used
for their calculation and it is not directly
linked with a company data source.

115
2.2.4 Financial Statements
Once completed the process it is possible to analyze all the results flowed into the financial
statements.
As already explained and shown, each section of the plan, both economic and financial, has a
direct link with the accounts of the Income statement and the Balance Sheet. This makes the
CPM tool a valid instrument for an integrated Strategic Planning activity and to have a holistic
view of the company. The Consistency principle of Borsa Italiana explains that all the actions
(investments, financial operations, resource acquisitions etc.) are translated in the forecast data
and there must be a correlation between the assumptions and the quantitative results present in
the provisional financial statements. Hence, knowing how each decision or assumption impacts
on the economic and financial situation of the group is essential.
The approach used with the CPM Tool is, as specified, a direct approach. Each line of the
financial statements is calculated or inserted individually, considering all the variables affecting
it in order to have a more accurate planning process. This kind of approach is different and
more accurate from the one suggested by a part of the literature, which considers an indirect
approach.
According to Koller, Goedarth and Wessels99 to forecast a financial statement line it is
necessary a three-step process100:
1. Decide what economic relationships drive the line item: most them will be tied directly
to the revenues, some other to specific assets
2. Estimate the forecast ratio: For each line item, it is necessary to compute historical
values for each ratio, followed by estimates for each of the forecast periods
3. Multiply the forecast ratio by an estimate of its driver
99 Koller T., Goedhart M., Wessels D., 2010. Valuation. Measuring and Managing the value of Companies.
Hoboken: JOHN WILEY & SONS, INC.
100Koller T., Goedhart M., Wessels D., 2010. Valuation. Measuring and Managing the value of Companies.
Hoboken: JOHN WILEY & SONS, INC. P.194-195

116
A limit of this approach is the fact that, given a limited number of considered drivers, any error
in their forecast will be carried out through the entire model. Furthermore, this indirect approach
does not take into consideration other important variables to forecast suitably each item line.
Furthermore, all the data calculated using this approach are not directly related to specific
variables (if not their driver) and this undermine their traceability and reliability.
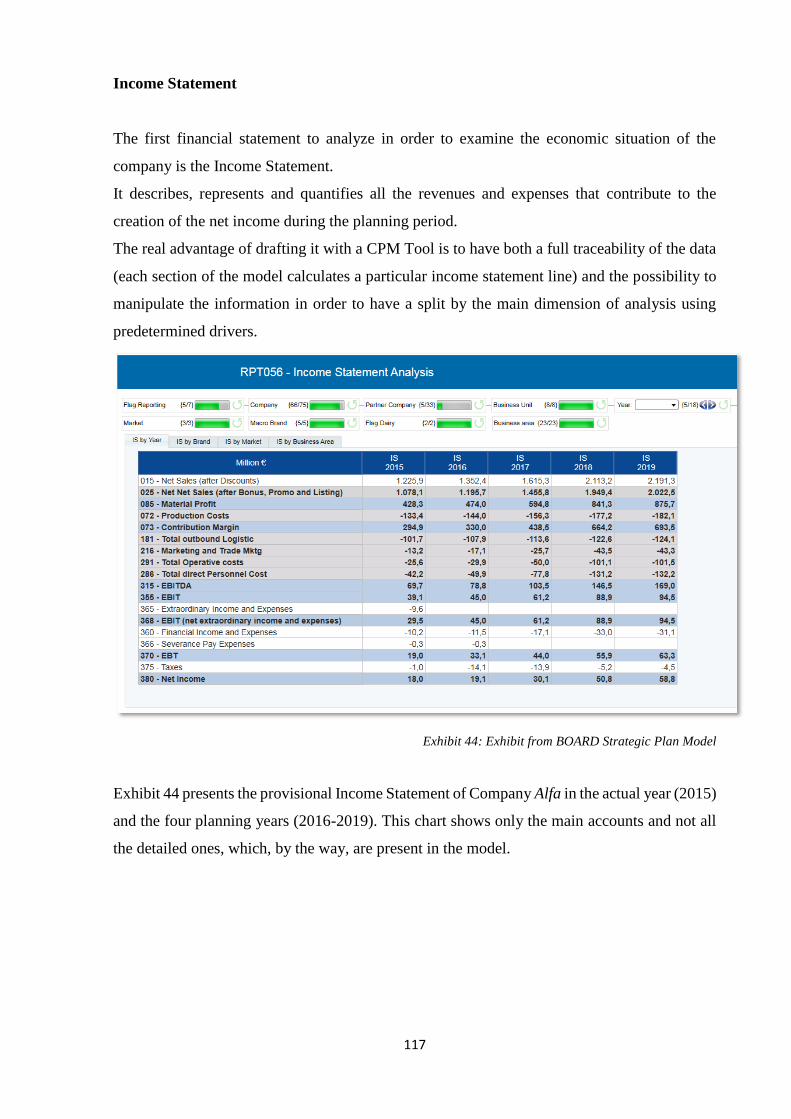
117
Income Statement
The first financial statement to analyze in order to examine the economic situation of the
company is the Income Statement.
It describes, represents and quantifies all the revenues and expenses that contribute to the
creation of the net income during the planning period.
The real advantage of drafting it with a CPM Tool is to have both a full traceability of the data
(each section of the model calculates a particular income statement line) and the possibility to
manipulate the information in order to have a split by the main dimension of analysis using
predetermined drivers.
Exhibit 44: Exhibit from BOARD Strategic Plan Model
Exhibit 44 presents the provisional Income Statement of Company Alfa in the actual year (2015)
and the four planning years (2016-2019). This chart shows only the main accounts and not all
the detailed ones, which, by the way, are present in the model.
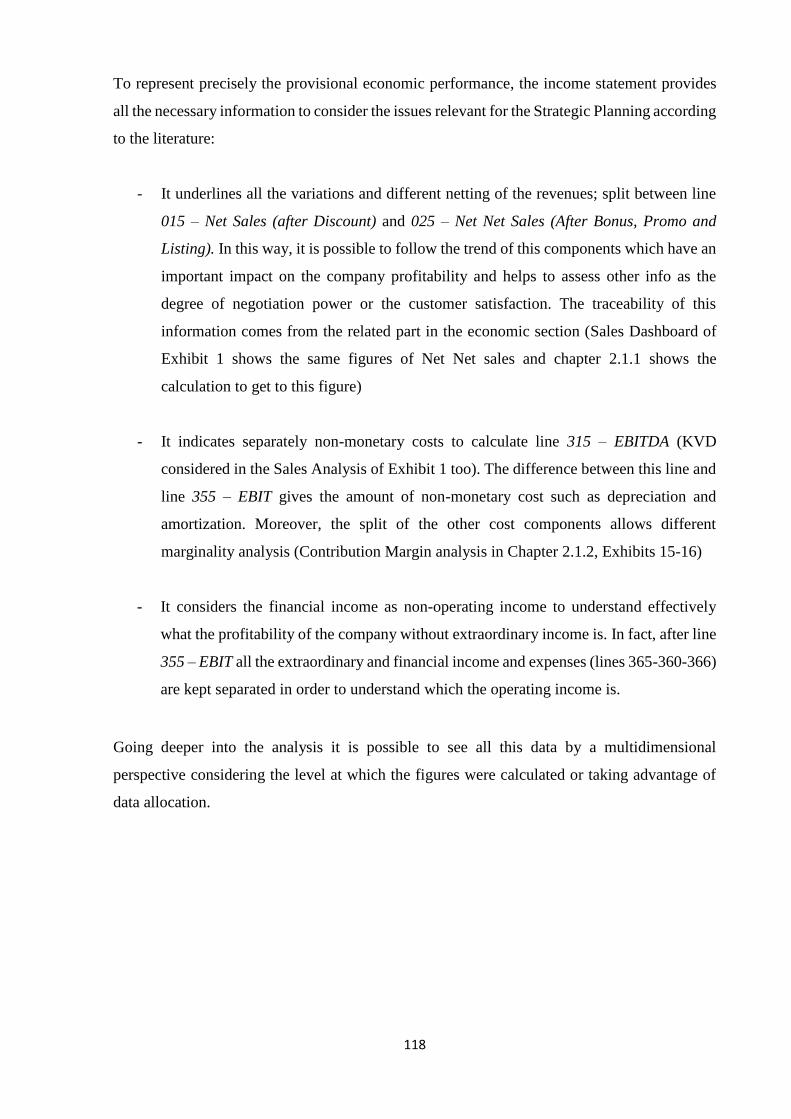
118
To represent precisely the provisional economic performance, the income statement provides
all the necessary information to consider the issues relevant for the Strategic Planning according
to the literature:
- It underlines all the variations and different netting of the revenues; split between line
015 – Net Sales (after Discount) and 025 – Net Net Sales (After Bonus, Promo and
Listing). In this way, it is possible to follow the trend of this components which have an
important impact on the company profitability and helps to assess other info as the
degree of negotiation power or the customer satisfaction. The traceability of this
information comes from the related part in the economic section (Sales Dashboard of
Exhibit 1 shows the same figures of Net Net sales and chapter 2.1.1 shows the
calculation to get to this figure)
- It indicates separately non-monetary costs to calculate line 315 – EBITDA (KVD
considered in the Sales Analysis of Exhibit 1 too). The difference between this line and
line 355 – EBIT gives the amount of non-monetary cost such as depreciation and
amortization. Moreover, the split of the other cost components allows different
marginality analysis (Contribution Margin analysis in Chapter 2.1.2, Exhibits 15-16)
- It considers the financial income as non-operating income to understand effectively
what the profitability of the company without extraordinary income is. In fact, after line
355 – EBIT all the extraordinary and financial income and expenses (lines 365-360-366)
are kept separated in order to understand which the operating income is.
Going deeper into the analysis it is possible to see all this data by a multidimensional
perspective considering the level at which the figures were calculated or taking advantage of
data allocation.
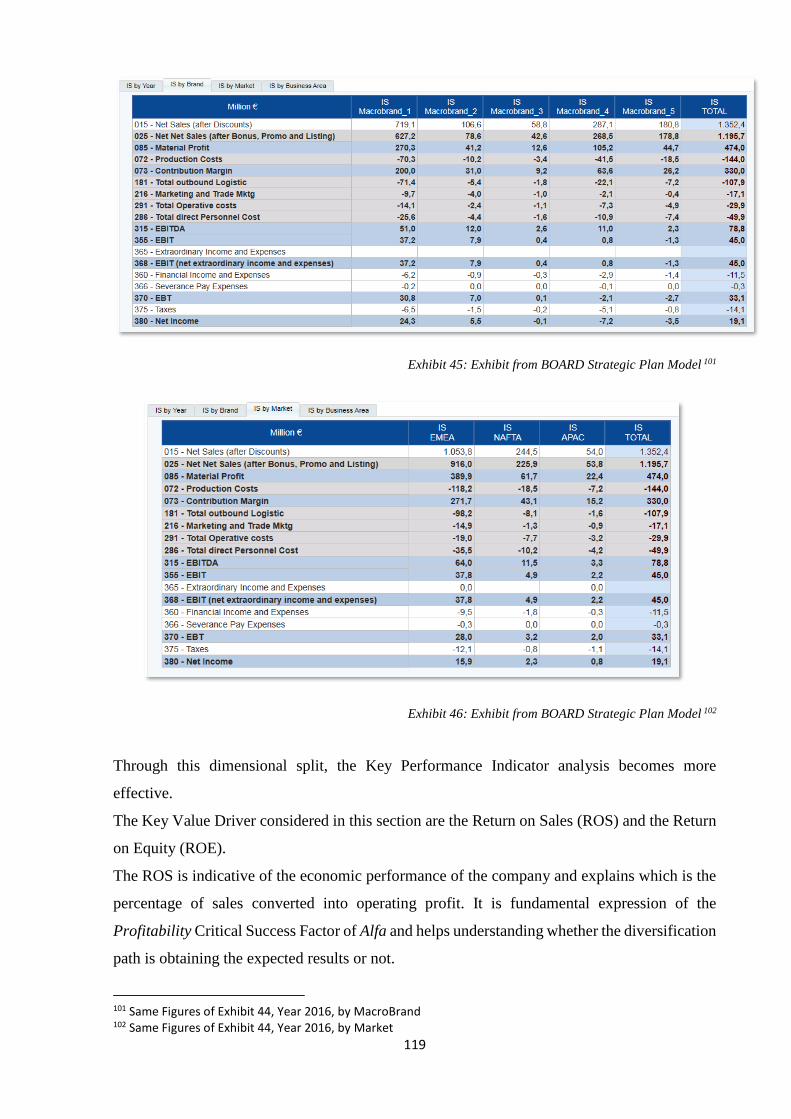
119
Exhibit 45: Exhibit from BOARD Strategic Plan Model 101
Exhibit 46: Exhibit from BOARD Strategic Plan Model 102
Through this dimensional split, the Key Performance Indicator analysis becomes more
effective.
The Key Value Driver considered in this section are the Return on Sales (ROS) and the Return
on Equity (ROE).
The ROS is indicative of the economic performance of the company and explains which is the
percentage of sales converted into operating profit. It is fundamental expression of the
Profitability Critical Success Factor of Alfa and helps understanding whether the diversification
path is obtaining the expected results or not.
101 Same Figures of Exhibit 44, Year 2016, by MacroBrand 102 Same Figures of Exhibit 44, Year 2016, by Market
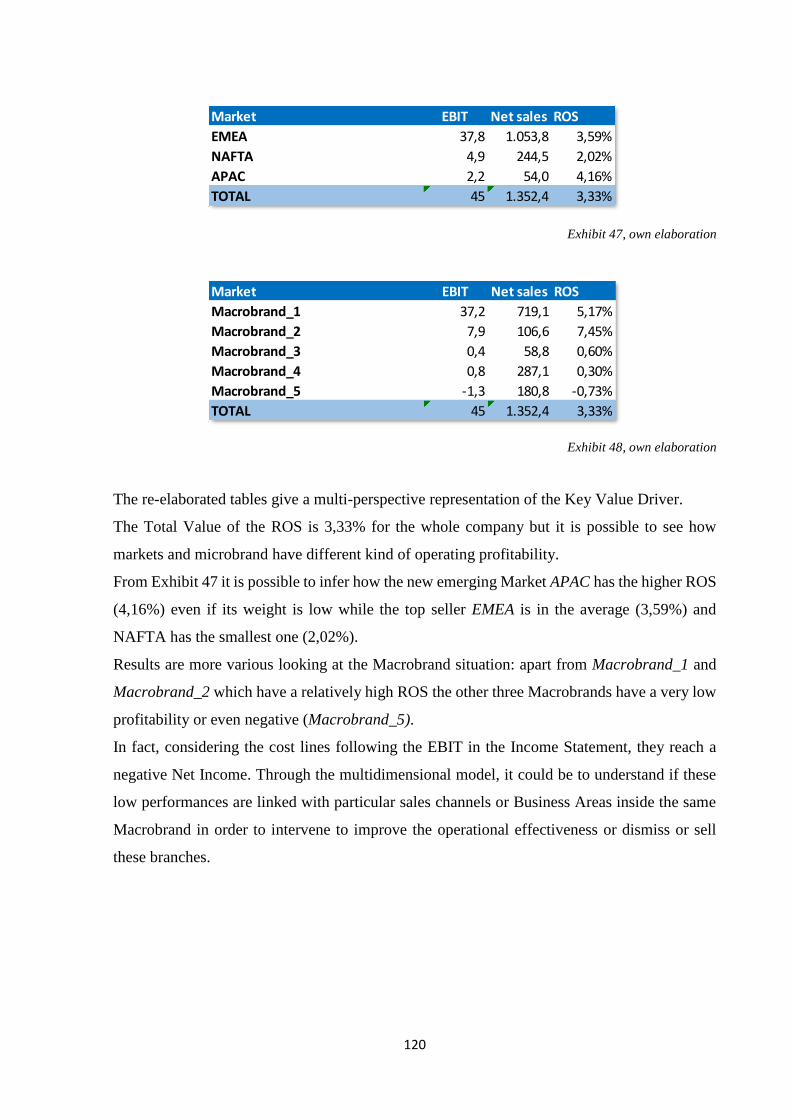
120
Exhibit 47, own elaboration
Exhibit 48, own elaboration
The re-elaborated tables give a multi-perspective representation of the Key Value Driver.
The Total Value of the ROS is 3,33% for the whole company but it is possible to see how
markets and microbrand have different kind of operating profitability.
From Exhibit 47 it is possible to infer how the new emerging Market APAC has the higher ROS
(4,16%) even if its weight is low while the top seller EMEA is in the average (3,59%) and
NAFTA has the smallest one (2,02%).
Results are more various looking at the Macrobrand situation: apart from Macrobrand_1 and
Macrobrand_2 which have a relatively high ROS the other three Macrobrands have a very low
profitability or even negative (Macrobrand_5).
In fact, considering the cost lines following the EBIT in the Income Statement, they reach a
negative Net Income. Through the multidimensional model, it could be to understand if these
low performances are linked with particular sales channels or Business Areas inside the same
Macrobrand in order to intervene to improve the operational effectiveness or dismiss or sell
these branches.
Market EBIT Net sales ROS
EMEA 37,8 1.053,8 3,59%
NAFTA 4,9 244,5 2,02%
APAC 2,2 54,0 4,16%
TOTAL 45 1.352,4 3,33%
Market EBIT Net sales ROS
Macrobrand_1 37,2 719,1 5,17%
Macrobrand_2 7,9 106,6 7,45%
Macrobrand_3 0,4 58,8 0,60%
Macrobrand_4 0,8 287,1 0,30%
Macrobrand_5 -1,3 180,8 -0,73%
TOTAL 45 1.352,4 3,33%
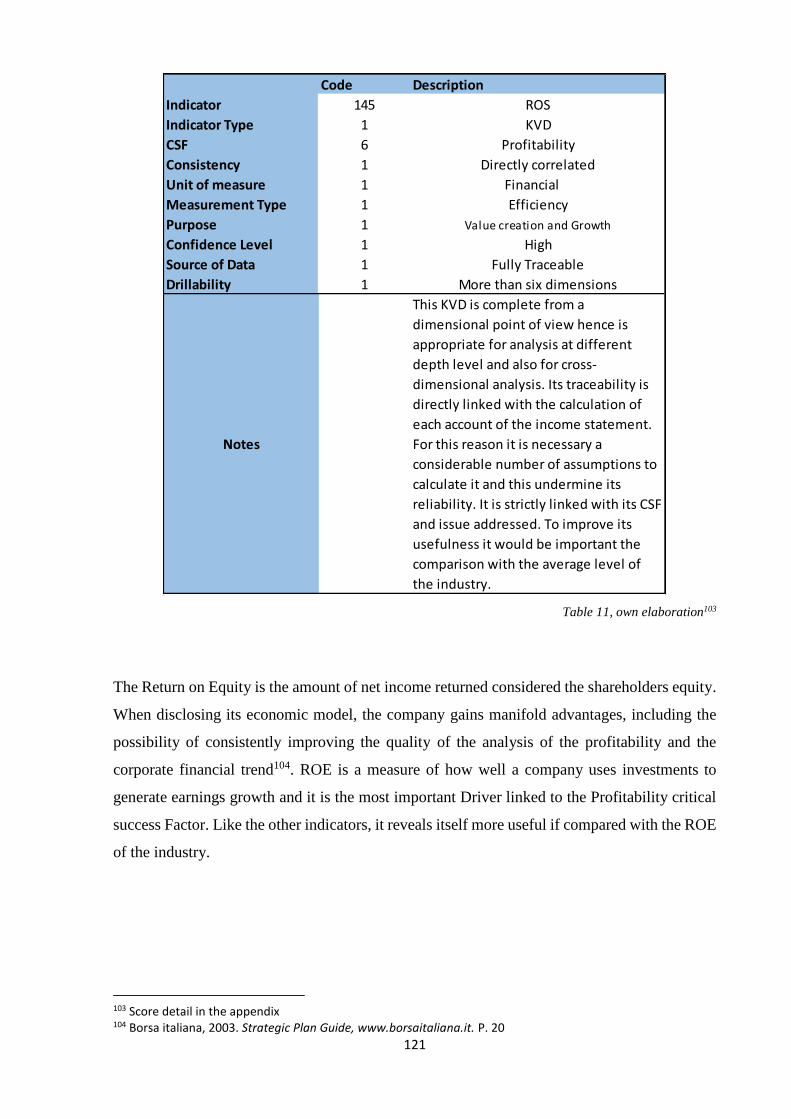
121
Table 11, own elaboration103
The Return on Equity is the amount of net income returned considered the shareholders equity.
When disclosing its economic model, the company gains manifold advantages, including the
possibility of consistently improving the quality of the analysis of the profitability and the
corporate financial trend104. ROE is a measure of how well a company uses investments to
generate earnings growth and it is the most important Driver linked to the Profitability critical
success Factor. Like the other indicators, it reveals itself more useful if compared with the ROE
of the industry.
103 Score detail in the appendix 104 Borsa italiana, 2003. Strategic Plan Guide, www.borsaitaliana.it. P. 20
Code Description
Indicator 145 ROS
Indicator Type 1 KVD
CSF 6 Profitability
Consistency 1 Directly correlated
Unit of measure 1 Financial
Measurement Type 1 Efficiency
Purpose 1 Value creation and Growth
Confidence Level 1 High
Source of Data 1 Fully Traceable
Drillability 1 More than six dimensions
Notes
This KVD is complete from a
dimensional point of view hence is
appropriate for analysis at different
depth level and also for cross-
dimensional analysis. Its traceability is
directly linked with the calculation of
each account of the income statement.
For this reason it is necessary a
considerable number of assumptions to
calculate it and this undermine its
reliability. It is strictly linked with its CSF
and issue addressed. To improve its
usefulness it would be important the
comparison with the average level of
the industry.
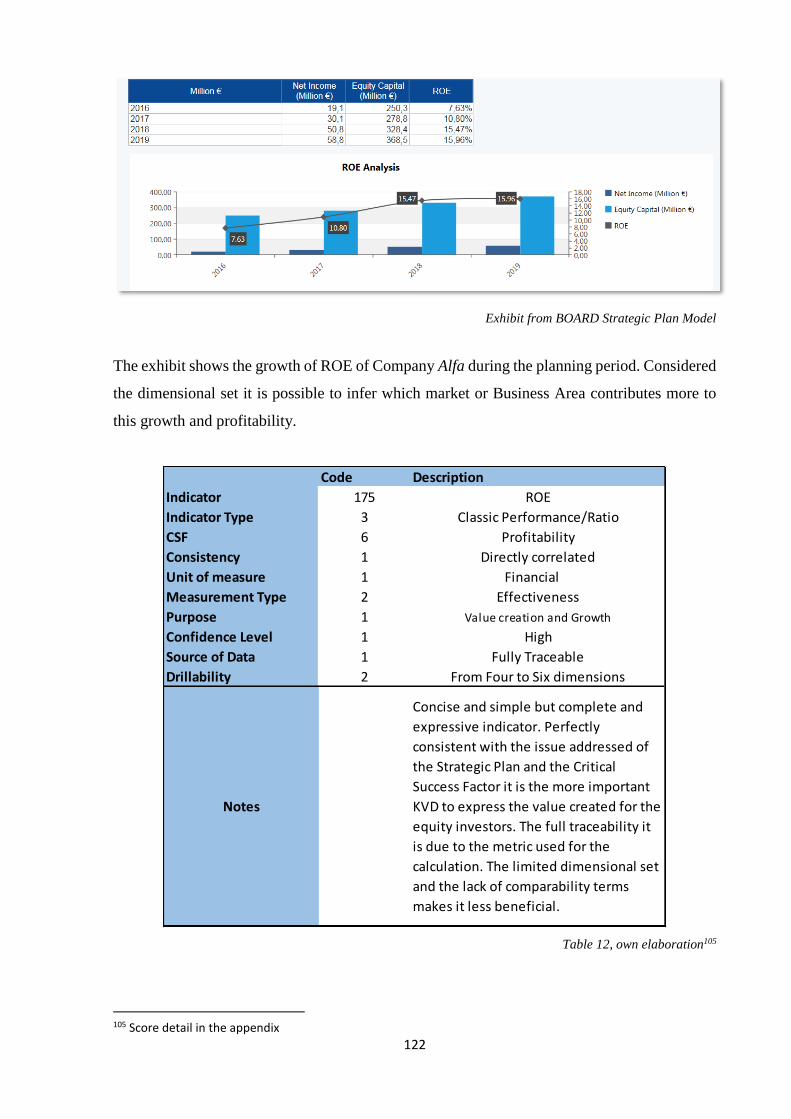
122
Exhibit from BOARD Strategic Plan Model
The exhibit shows the growth of ROE of Company Alfa during the planning period. Considered
the dimensional set it is possible to infer which market or Business Area contributes more to
this growth and profitability.
Table 12, own elaboration105
105 Score detail in the appendix
Code Description
Indicator 175 ROE
Indicator Type 3 Classic Performance/Ratio
CSF 6 Profitability
Consistency 1 Directly correlated
Unit of measure 1 Financial
Measurement Type 2 Effectiveness
Purpose 1 Value creation and Growth
Confidence Level 1 High
Source of Data 1 Fully Traceable
Drillability 2 From Four to Six dimensions
Notes
Concise and simple but complete and
expressive indicator. Perfectly
consistent with the issue addressed of
the Strategic Plan and the Critical
Success Factor it is the more important
KVD to express the value created for the
equity investors. The full traceability it
is due to the metric used for the
calculation. The limited dimensional set
and the lack of comparability terms
makes it less beneficial.
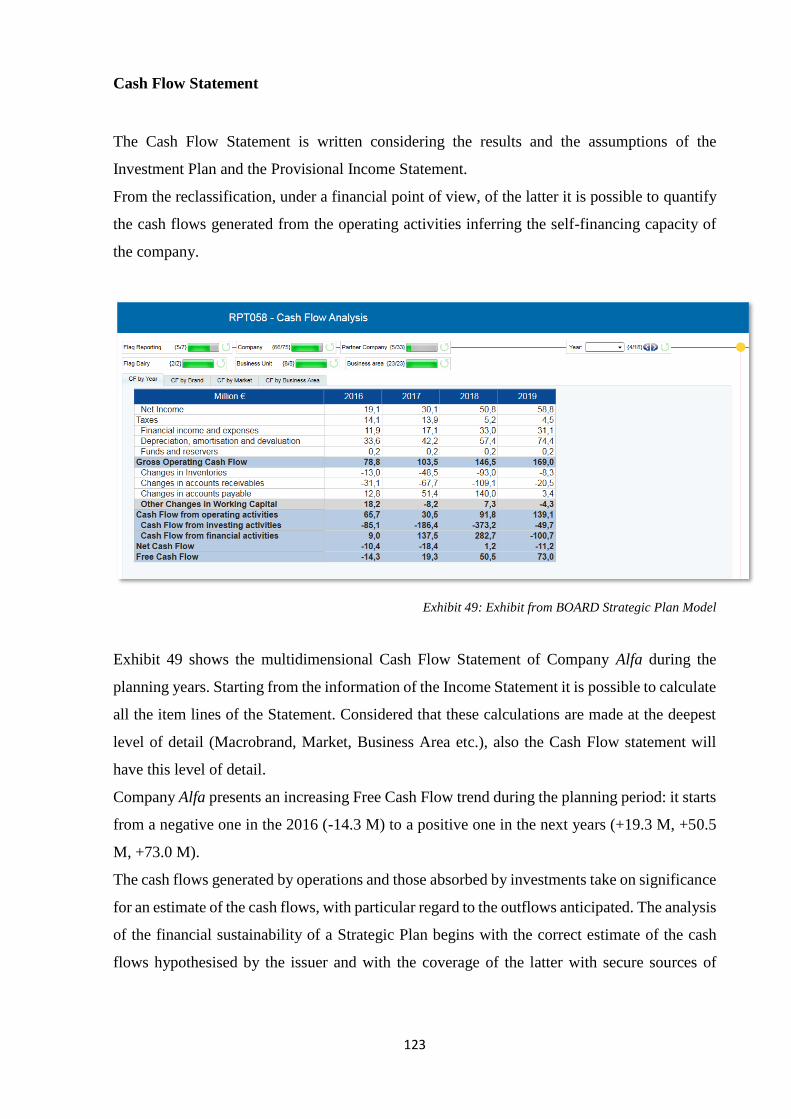
123
Cash Flow Statement
The Cash Flow Statement is written considering the results and the assumptions of the
Investment Plan and the Provisional Income Statement.
From the reclassification, under a financial point of view, of the latter it is possible to quantify
the cash flows generated from the operating activities inferring the self-financing capacity of
the company.
Exhibit 49: Exhibit from BOARD Strategic Plan Model
Exhibit 49 shows the multidimensional Cash Flow Statement of Company Alfa during the
planning years. Starting from the information of the Income Statement it is possible to calculate
all the item lines of the Statement. Considered that these calculations are made at the deepest
level of detail (Macrobrand, Market, Business Area etc.), also the Cash Flow statement will
have this level of detail.
Company Alfa presents an increasing Free Cash Flow trend during the planning period: it starts
from a negative one in the 2016 (-14.3 M) to a positive one in the next years (+19.3 M, +50.5
M, +73.0 M).
The cash flows generated by operations and those absorbed by investments take on significance
for an estimate of the cash flows, with particular regard to the outflows anticipated. The analysis
of the financial sustainability of a Strategic Plan begins with the correct estimate of the cash
flows hypothesised by the issuer and with the coverage of the latter with secure sources of
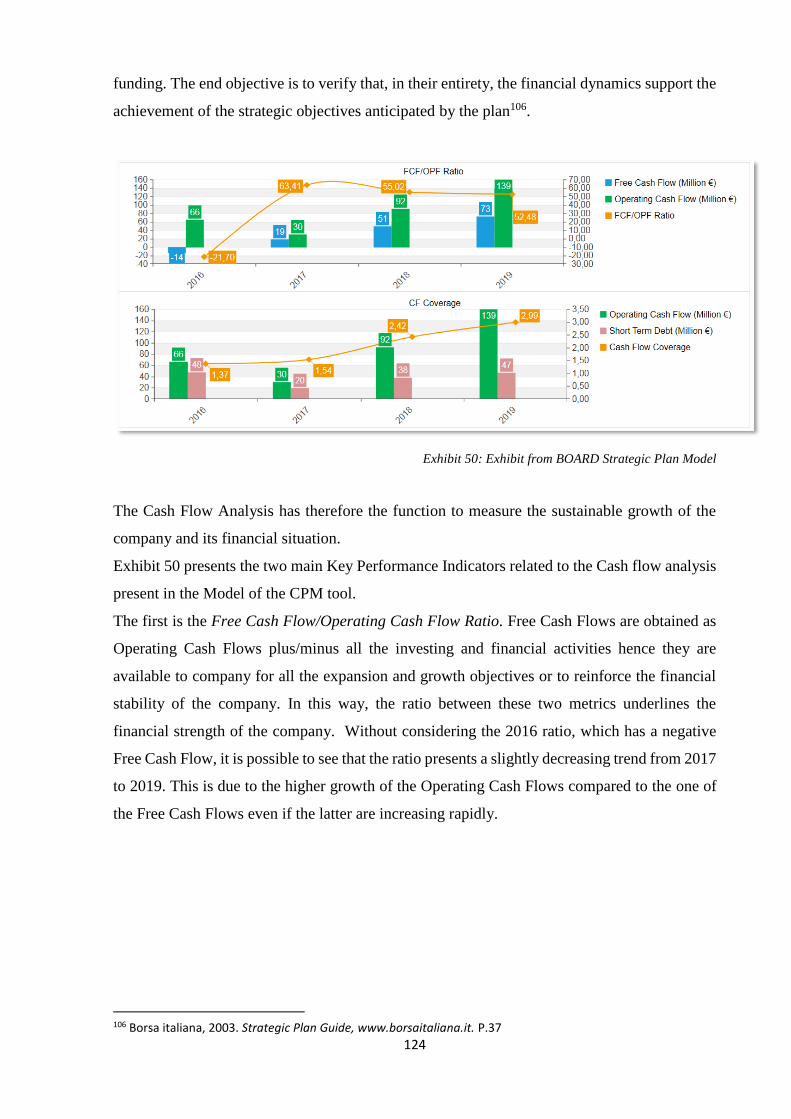
124
funding. The end objective is to verify that, in their entirety, the financial dynamics support the
achievement of the strategic objectives anticipated by the plan106.
Exhibit 50: Exhibit from BOARD Strategic Plan Model
The Cash Flow Analysis has therefore the function to measure the sustainable growth of the
company and its financial situation.
Exhibit 50 presents the two main Key Performance Indicators related to the Cash flow analysis
present in the Model of the CPM tool.
The first is the Free Cash Flow/Operating Cash Flow Ratio. Free Cash Flows are obtained as
Operating Cash Flows plus/minus all the investing and financial activities hence they are
available to company for all the expansion and growth objectives or to reinforce the financial
stability of the company. In this way, the ratio between these two metrics underlines the
financial strength of the company. Without considering the 2016 ratio, which has a negative
Free Cash Flow, it is possible to see that the ratio presents a slightly decreasing trend from 2017
to 2019. This is due to the higher growth of the Operating Cash Flows compared to the one of
the Free Cash Flows even if the latter are increasing rapidly.
106 Borsa italiana, 2003. Strategic Plan Guide, www.borsaitaliana.it. P.37
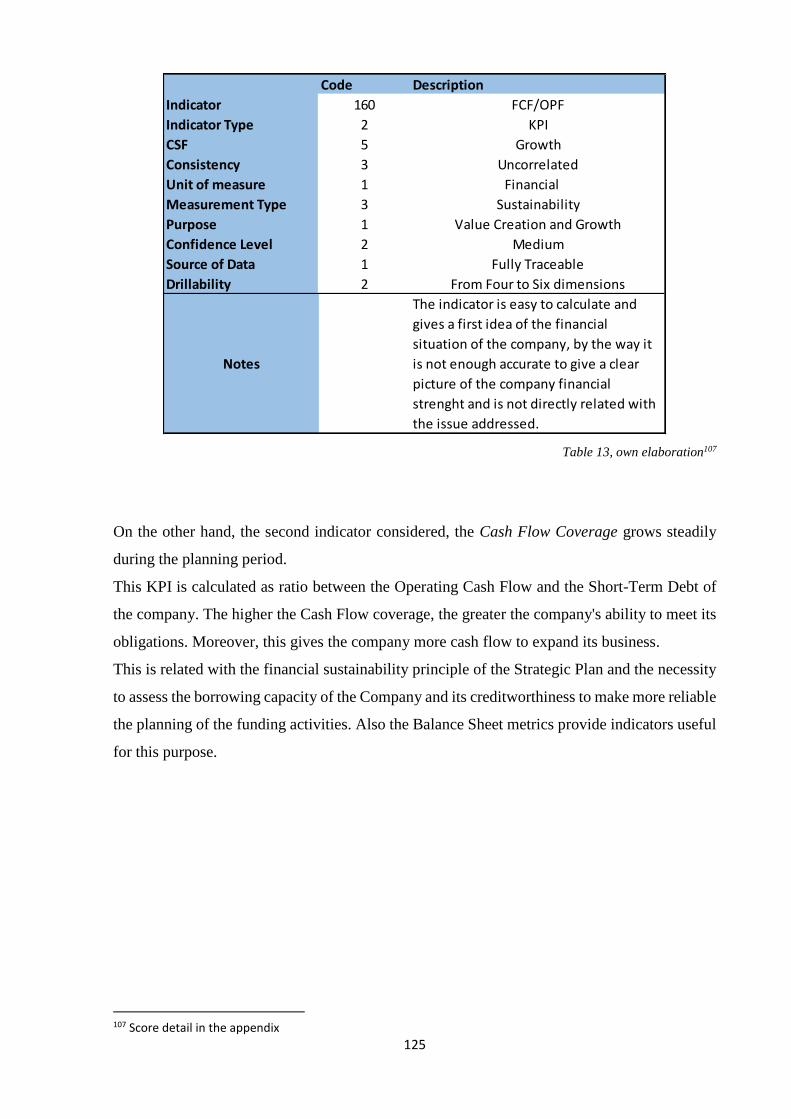
125
Table 13, own elaboration107
On the other hand, the second indicator considered, the Cash Flow Coverage grows steadily
during the planning period.
This KPI is calculated as ratio between the Operating Cash Flow and the Short-Term Debt of
the company. The higher the Cash Flow coverage, the greater the company's ability to meet its
obligations. Moreover, this gives the company more cash flow to expand its business.
This is related with the financial sustainability principle of the Strategic Plan and the necessity
to assess the borrowing capacity of the Company and its creditworthiness to make more reliable
the planning of the funding activities. Also the Balance Sheet metrics provide indicators useful
for this purpose.
107 Score detail in the appendix
Code Description
Indicator 160 FCF/OPF
Indicator Type 2 KPI
CSF 5 Growth
Consistency 3 Uncorrelated
Unit of measure 1 Financial
Measurement Type 3 Sustainability
Purpose 1 Value Creation and Growth
Confidence Level 2 Medium
Source of Data 1 Fully Traceable
Drillability 2 From Four to Six dimensions
Notes
The indicator is easy to calculate and
gives a first idea of the financial
situation of the company, by the way it
is not enough accurate to give a clear
picture of the company financial
strenght and is not directly related with
the issue addressed.
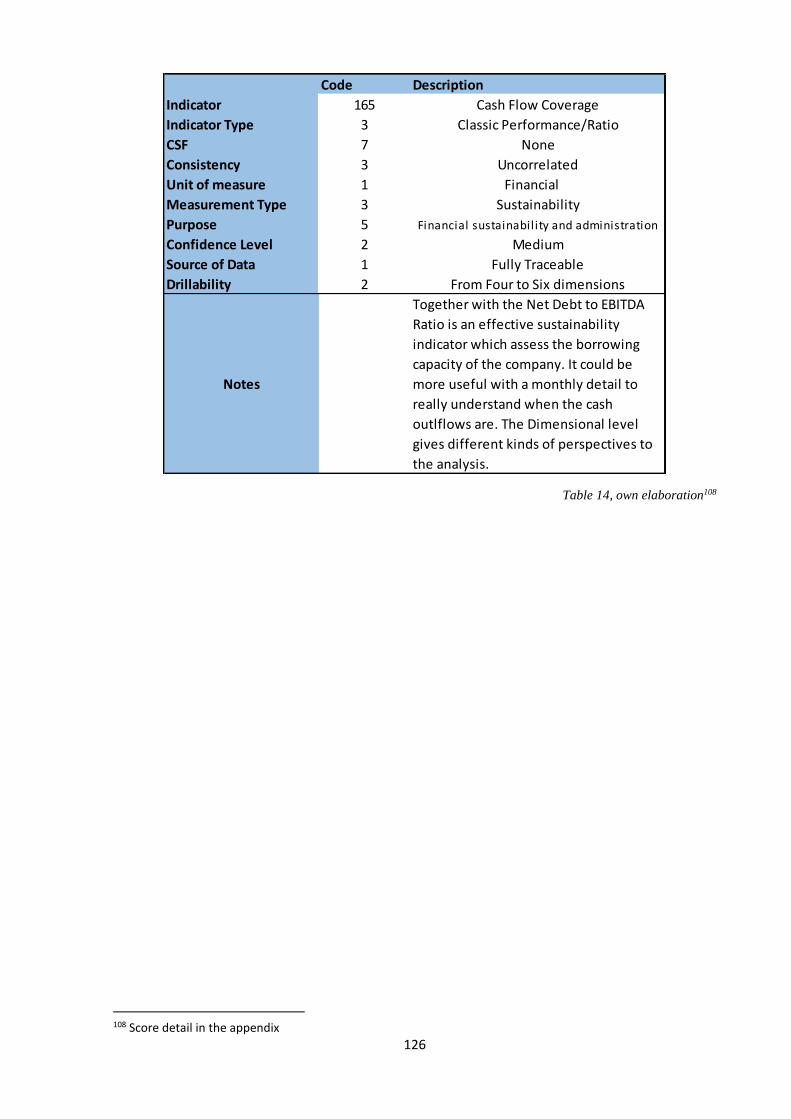
126
Table 14, own elaboration108
108 Score detail in the appendix
Code Description
Indicator 165 Cash Flow Coverage
Indicator Type 3 Classic Performance/Ratio
CSF 7 None
Consistency 3 Uncorrelated
Unit of measure 1 Financial
Measurement Type 3 Sustainability
Purpose 5 Financial sustainability and administration
Confidence Level 2 Medium
Source of Data 1 Fully Traceable
Drillability 2 From Four to Six dimensions
Notes
Together with the Net Debt to EBITDA
Ratio is an effective sustainability
indicator which assess the borrowing
capacity of the company. It could be
more useful with a monthly detail to
really understand when the cash
outlflows are. The Dimensional level
gives different kinds of perspectives to
the analysis.
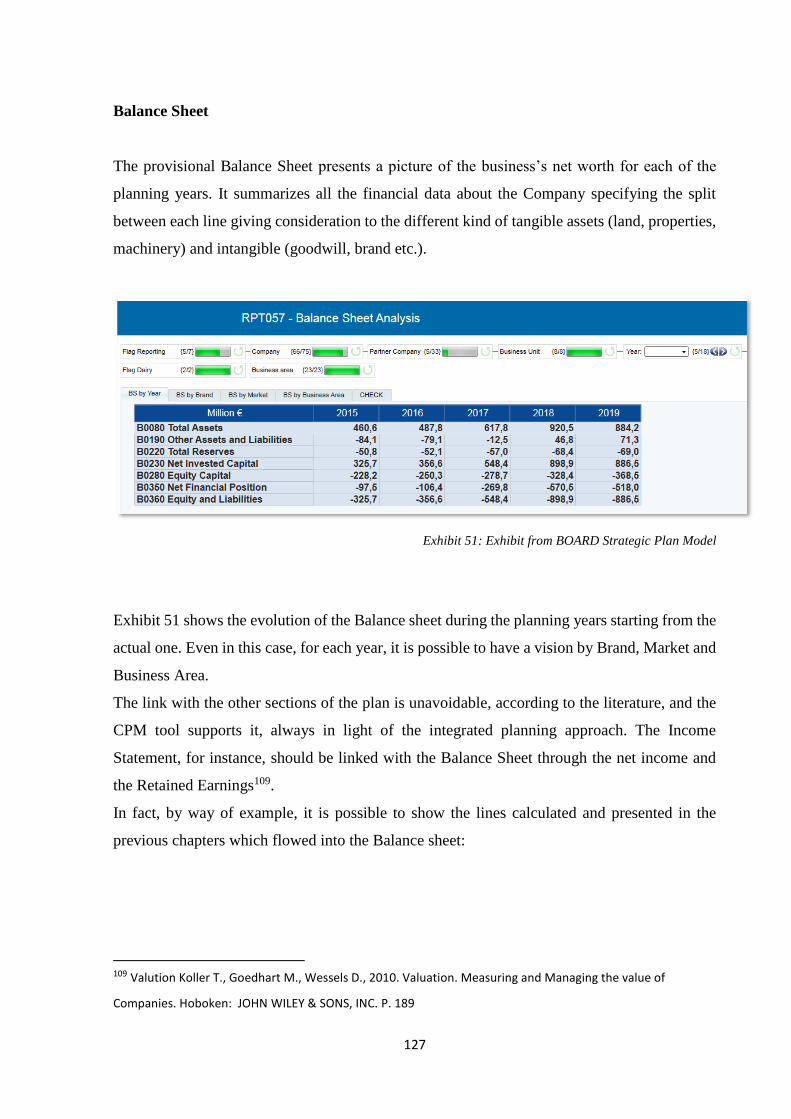
127
Balance Sheet
The provisional Balance Sheet presents a picture of the business’s net worth for each of the
planning years. It summarizes all the financial data about the Company specifying the split
between each line giving consideration to the different kind of tangible assets (land, properties,
machinery) and intangible (goodwill, brand etc.).
Exhibit 51: Exhibit from BOARD Strategic Plan Model
Exhibit 51 shows the evolution of the Balance sheet during the planning years starting from the
actual one. Even in this case, for each year, it is possible to have a vision by Brand, Market and
Business Area.
The link with the other sections of the plan is unavoidable, according to the literature, and the
CPM tool supports it, always in light of the integrated planning approach. The Income
Statement, for instance, should be linked with the Balance Sheet through the net income and
the Retained Earnings109.
In fact, by way of example, it is possible to show the lines calculated and presented in the
previous chapters which flowed into the Balance sheet:
109 Valution Koller T., Goedhart M., Wessels D., 2010. Valuation. Measuring and Managing the value of
Companies. Hoboken: JOHN WILEY & SONS, INC. P. 189

128
Exhibit 52: Exhibit from BOARD Strategic Plan Model
- Lines B0040 – Lands and properties, B0044 – Plants and machinery, B0046 – Other
tangible assets are considered in the new investment calculation (Chapter 2.2.1)
- Lines B0120 - Accounts receivable and B0125 – Accounts Payable, are calculated in the
Working capital management through DSO and DPO (Chapter 2.2.3)
- B0270 – Net income is calculated in the previous paragraph in the income statement
- All the item lines that compose Line B0350 – Net Financial Position are considered in
the funding chapter (Chapter 2.2.2)
Through the Patrimonial Dashboard of the CPM Tool it is possible to see the trend of the main
figures and KPIs related to the Balance Sheet:
Exhibit 53: Exhibit from BOARD Strategic Plan Model
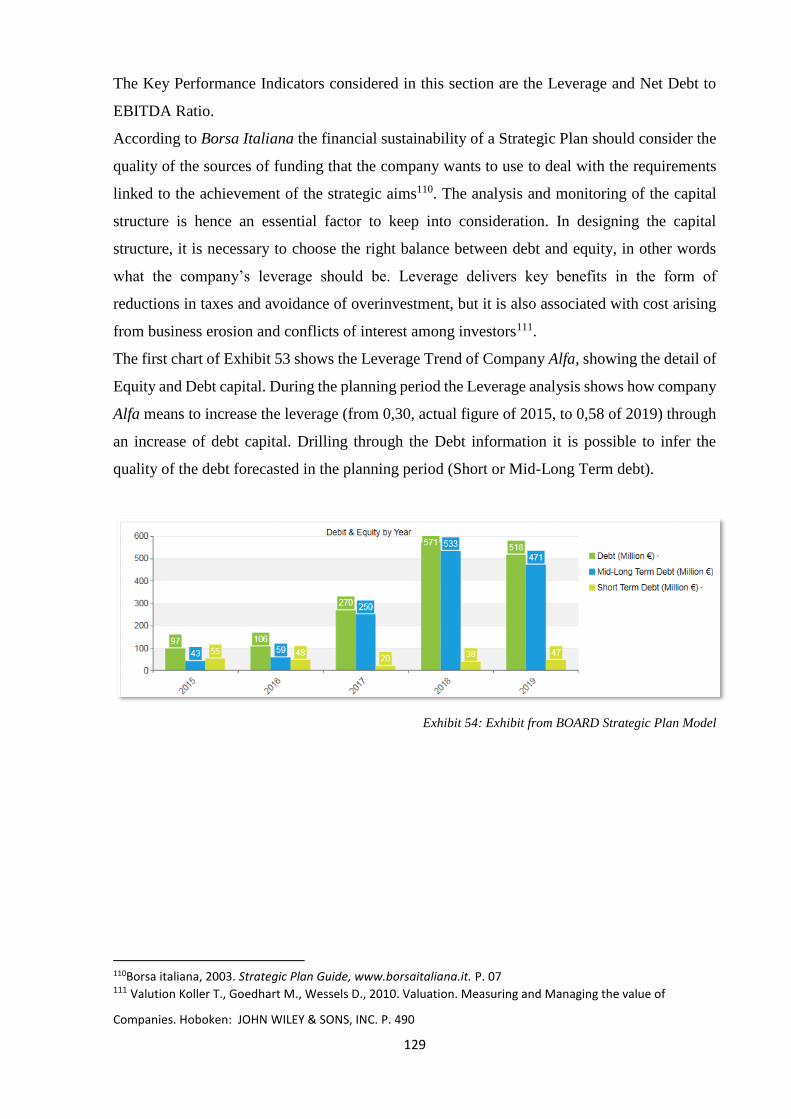
129
The Key Performance Indicators considered in this section are the Leverage and Net Debt to
EBITDA Ratio.
According to Borsa Italiana the financial sustainability of a Strategic Plan should consider the
quality of the sources of funding that the company wants to use to deal with the requirements
linked to the achievement of the strategic aims110. The analysis and monitoring of the capital
structure is hence an essential factor to keep into consideration. In designing the capital
structure, it is necessary to choose the right balance between debt and equity, in other words
what the company’s leverage should be. Leverage delivers key benefits in the form of
reductions in taxes and avoidance of overinvestment, but it is also associated with cost arising
from business erosion and conflicts of interest among investors111.
The first chart of Exhibit 53 shows the Leverage Trend of Company Alfa, showing the detail of
Equity and Debt capital. During the planning period the Leverage analysis shows how company
Alfa means to increase the leverage (from 0,30, actual figure of 2015, to 0,58 of 2019) through
an increase of debt capital. Drilling through the Debt information it is possible to infer the
quality of the debt forecasted in the planning period (Short or Mid-Long Term debt).
Exhibit 54: Exhibit from BOARD Strategic Plan Model
110Borsa italiana, 2003. Strategic Plan Guide, www.borsaitaliana.it. P. 07 111 Valution Koller T., Goedhart M., Wessels D., 2010. Valuation. Measuring and Managing the value of
Companies. Hoboken: JOHN WILEY & SONS, INC. P. 490
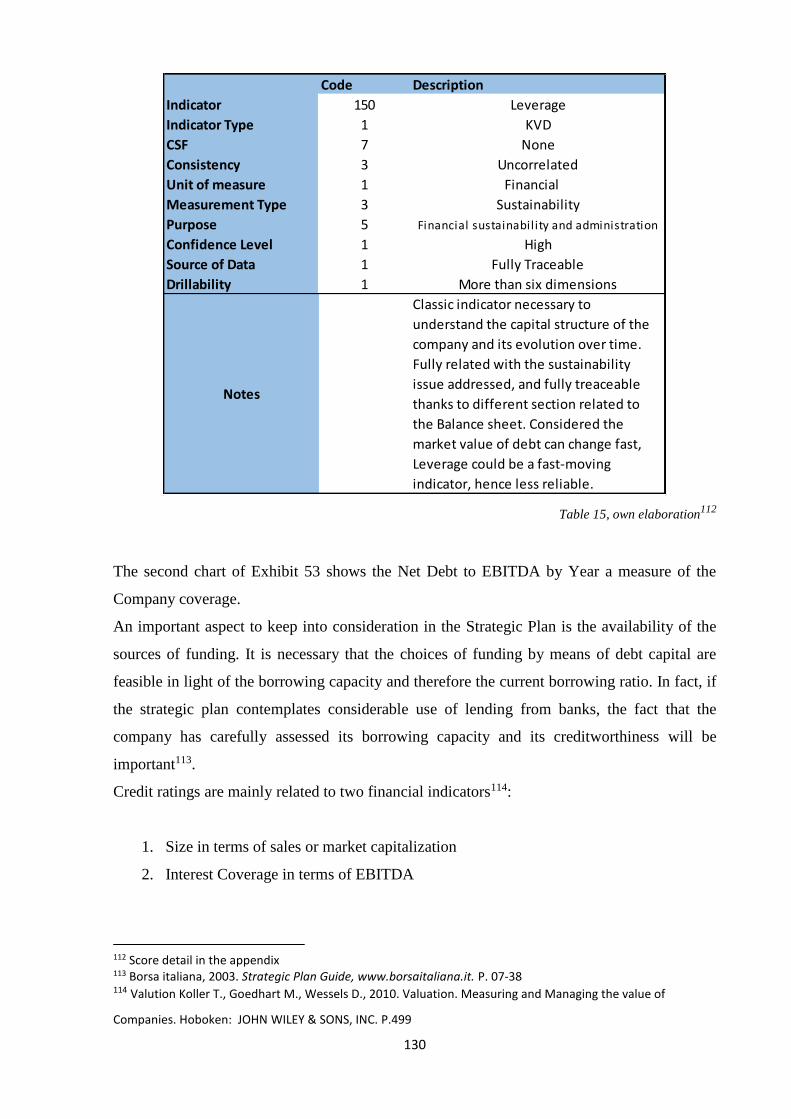
130
Table 15, own elaboration112
The second chart of Exhibit 53 shows the Net Debt to EBITDA by Year a measure of the
Company coverage.
An important aspect to keep into consideration in the Strategic Plan is the availability of the
sources of funding. It is necessary that the choices of funding by means of debt capital are
feasible in light of the borrowing capacity and therefore the current borrowing ratio. In fact, if
the strategic plan contemplates considerable use of lending from banks, the fact that the
company has carefully assessed its borrowing capacity and its creditworthiness will be
important113.
Credit ratings are mainly related to two financial indicators114:
1. Size in terms of sales or market capitalization
2. Interest Coverage in terms of EBITDA
112 Score detail in the appendix 113 Borsa italiana, 2003. Strategic Plan Guide, www.borsaitaliana.it. P. 07-38 114 Valution Koller T., Goedhart M., Wessels D., 2010. Valuation. Measuring and Managing the value of
Companies. Hoboken: JOHN WILEY & SONS, INC. P.499
Code Description
Indicator 150 Leverage
Indicator Type 1 KVD
CSF 7 None
Consistency 3 Uncorrelated
Unit of measure 1 Financial
Measurement Type 3 Sustainability
Purpose 5 Financial sustainability and administration
Confidence Level 1 High
Source of Data 1 Fully Traceable
Drillability 1 More than six dimensions
Notes
Classic indicator necessary to
understand the capital structure of the
company and its evolution over time.
Fully related with the sustainability
issue addressed, and fully treaceable
thanks to different section related to
the Balance sheet. Considered the
market value of debt can change fast,
Leverage could be a fast-moving
indicator, hence less reliable.
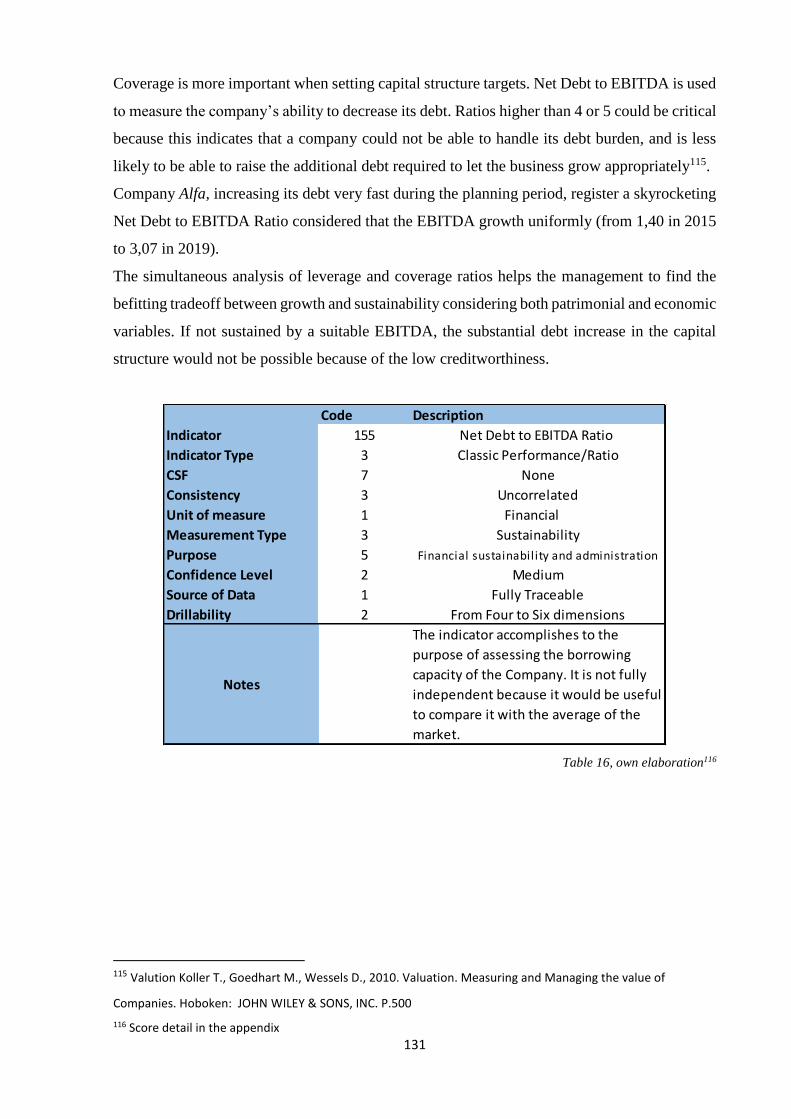
131
Coverage is more important when setting capital structure targets. Net Debt to EBITDA is used
to measure the company’s ability to decrease its debt. Ratios higher than 4 or 5 could be critical
because this indicates that a company could not be able to handle its debt burden, and is less
likely to be able to raise the additional debt required to let the business grow appropriately115.
Company Alfa, increasing its debt very fast during the planning period, register a skyrocketing
Net Debt to EBITDA Ratio considered that the EBITDA growth uniformly (from 1,40 in 2015
to 3,07 in 2019).
The simultaneous analysis of leverage and coverage ratios helps the management to find the
befitting tradeoff between growth and sustainability considering both patrimonial and economic
variables. If not sustained by a suitable EBITDA, the substantial debt increase in the capital
structure would not be possible because of the low creditworthiness.
Table 16, own elaboration116
115 Valution Koller T., Goedhart M., Wessels D., 2010. Valuation. Measuring and Managing the value of
Companies. Hoboken: JOHN WILEY & SONS, INC. P.500
116 Score detail in the appendix
Code Description
Indicator 155 Net Debt to EBITDA Ratio
Indicator Type 3 Classic Performance/Ratio
CSF 7 None
Consistency 3 Uncorrelated
Unit of measure 1 Financial
Measurement Type 3 Sustainability
Purpose 5 Financial sustainability and administration
Confidence Level 2 Medium
Source of Data 1 Fully Traceable
Drillability 2 From Four to Six dimensions
Notes
The indicator accomplishes to the
purpose of assessing the borrowing
capacity of the Company. It is not fully
independent because it would be useful
to compare it with the average of the
market.
132
Discussion of main results
In this paragraph, a general discussion about the main results obtained after the description of
the model and coding process will be realized. This will be done in order to analyze the main
characteristics of the indicators considered and to answer to the research question.
During the analysis of the planning model 16 indicators were considered: 8 developed in the
Economic Section of the Strategic Plan and 8 in the Financial Section.
Here the list of the indicators considered:
1. EBITDA
2. Sales of Market X / Total Sales
3. Net Net Sales
4. Average Price
5. Volume Produced %
6. Reject Ratio
7. Contribution Margin
8. On time Deliveries
9. DSO/DPO
10. ROS
11. Leverage
12. Net Debt to EBITDA Ratio
13. FCF/OPF
14. CF Coverage
15. Fixed Asset Turnover Ratio
16. ROE
All of them were coded using the codebook illustrated in the Method paragraph of the paper
considering all the necessary dimensions.
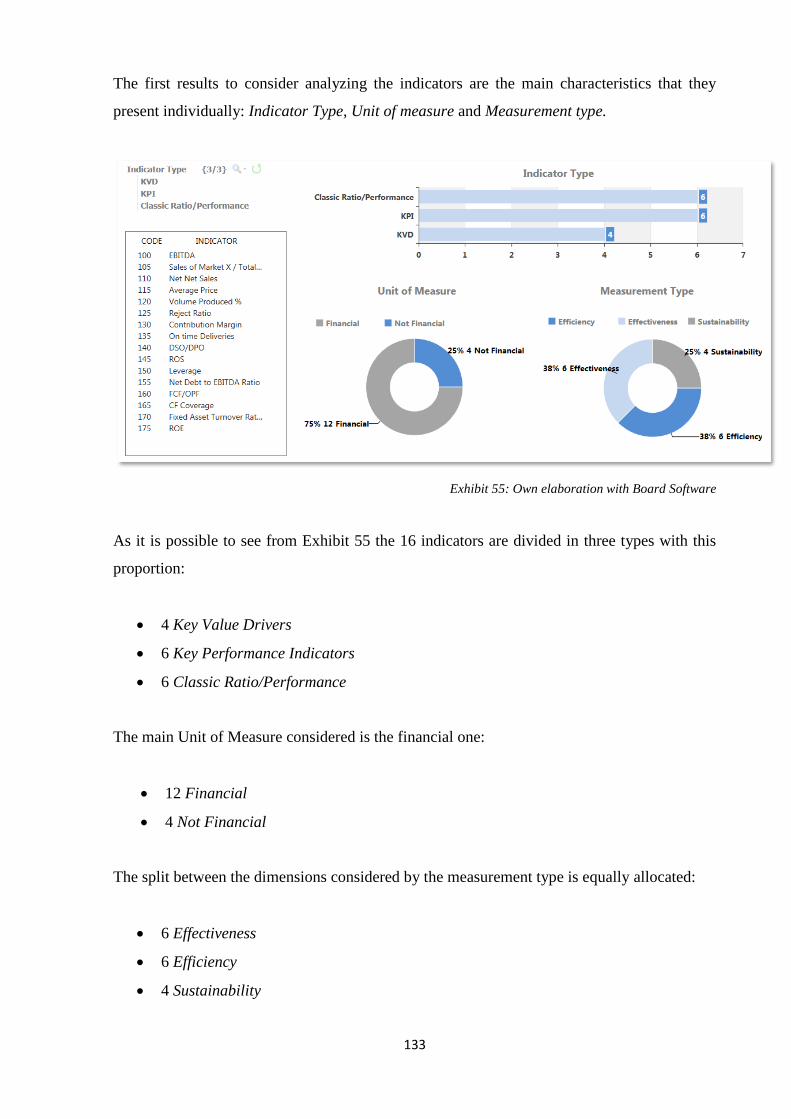
133
The first results to consider analyzing the indicators are the main characteristics that they
present individually: Indicator Type, Unit of measure and Measurement type.
Exhibit 55: Own elaboration with Board Software
As it is possible to see from Exhibit 55 the 16 indicators are divided in three types with this
proportion:
• 4 Key Value Drivers
• 6 Key Performance Indicators
• 6 Classic Ratio/Performance
The main Unit of Measure considered is the financial one:
• 12 Financial
• 4 Not Financial
The split between the dimensions considered by the measurement type is equally allocated:
• 6 Effectiveness
• 6 Efficiency
• 4 Sustainability
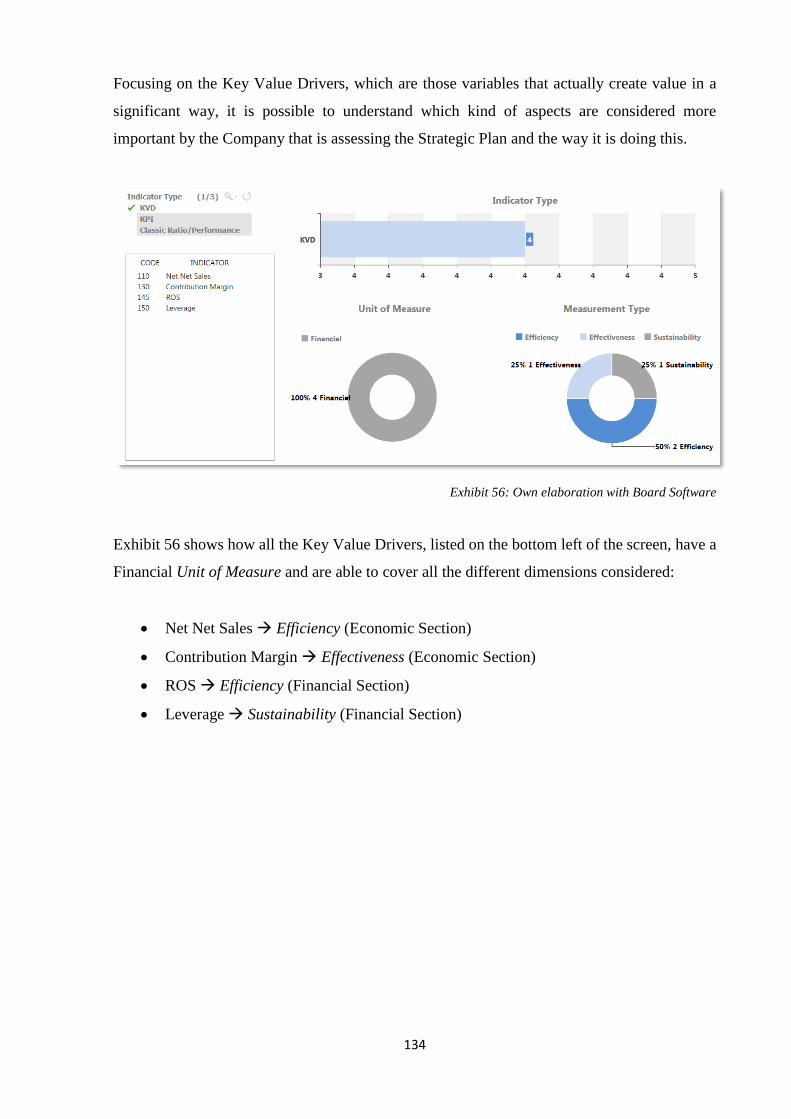
134
Focusing on the Key Value Drivers, which are those variables that actually create value in a
significant way, it is possible to understand which kind of aspects are considered more
important by the Company that is assessing the Strategic Plan and the way it is doing this.
Exhibit 56: Own elaboration with Board Software
Exhibit 56 shows how all the Key Value Drivers, listed on the bottom left of the screen, have a
Financial Unit of Measure and are able to cover all the different dimensions considered:
• Net Net Sales Efficiency (Economic Section)
• Contribution Margin Effectiveness (Economic Section)
• ROS Efficiency (Financial Section)
• Leverage Sustainability (Financial Section)
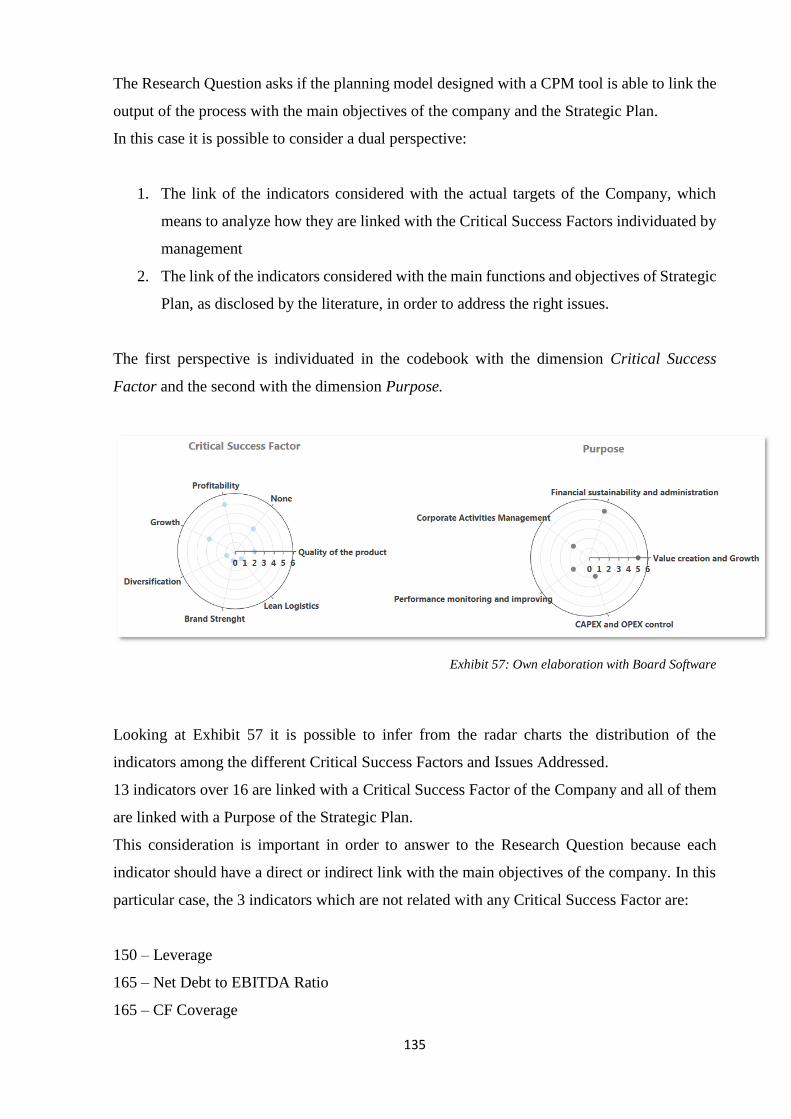
135
The Research Question asks if the planning model designed with a CPM tool is able to link the
output of the process with the main objectives of the company and the Strategic Plan.
In this case it is possible to consider a dual perspective:
1. The link of the indicators considered with the actual targets of the Company, which
means to analyze how they are linked with the Critical Success Factors individuated by
management
2. The link of the indicators considered with the main functions and objectives of Strategic
Plan, as disclosed by the literature, in order to address the right issues.
The first perspective is individuated in the codebook with the dimension Critical Success
Factor and the second with the dimension Purpose.
Exhibit 57: Own elaboration with Board Software
Looking at Exhibit 57 it is possible to infer from the radar charts the distribution of the
indicators among the different Critical Success Factors and Issues Addressed.
13 indicators over 16 are linked with a Critical Success Factor of the Company and all of them
are linked with a Purpose of the Strategic Plan.
This consideration is important in order to answer to the Research Question because each
indicator should have a direct or indirect link with the main objectives of the company. In this
particular case, the 3 indicators which are not related with any Critical Success Factor are:
150 – Leverage
165 – Net Debt to EBITDA Ratio
165 – CF Coverage
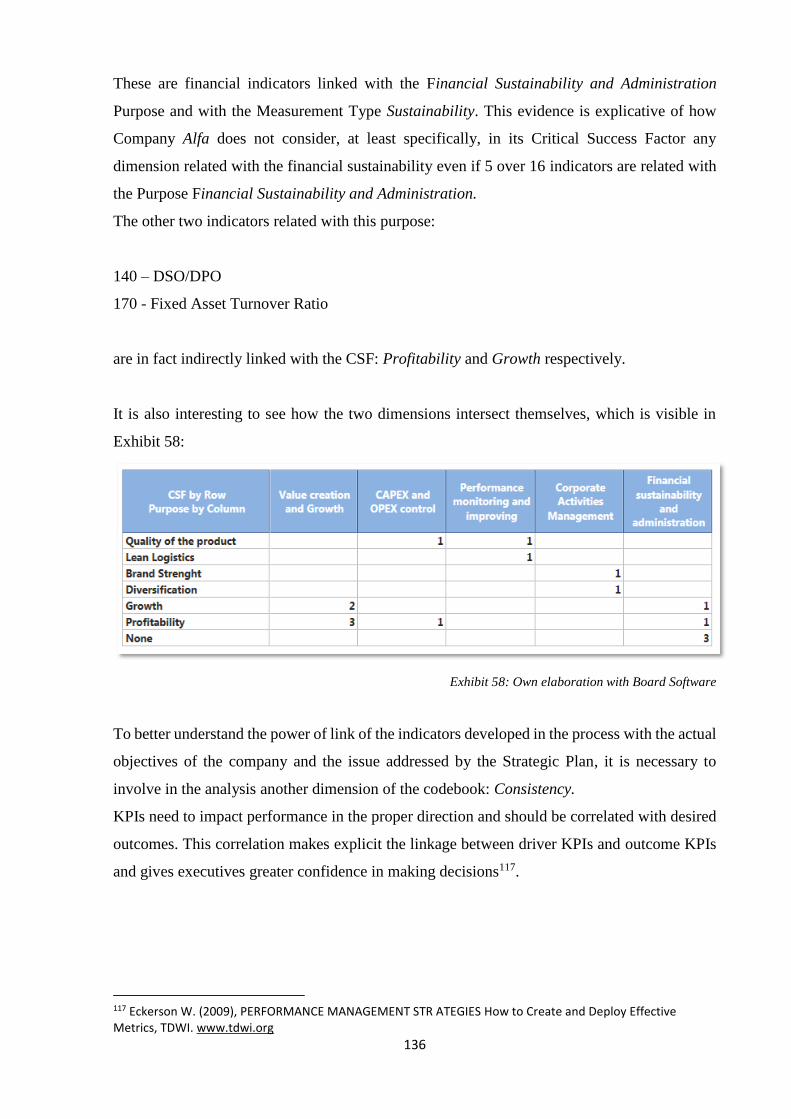
136
These are financial indicators linked with the Financial Sustainability and Administration
Purpose and with the Measurement Type Sustainability. This evidence is explicative of how
Company Alfa does not consider, at least specifically, in its Critical Success Factor any
dimension related with the financial sustainability even if 5 over 16 indicators are related with
the Purpose Financial Sustainability and Administration.
The other two indicators related with this purpose:
140 – DSO/DPO
170 - Fixed Asset Turnover Ratio
are in fact indirectly linked with the CSF: Profitability and Growth respectively.
It is also interesting to see how the two dimensions intersect themselves, which is visible in
Exhibit 58:
Exhibit 58: Own elaboration with Board Software
To better understand the power of link of the indicators developed in the process with the actual
objectives of the company and the issue addressed by the Strategic Plan, it is necessary to
involve in the analysis another dimension of the codebook: Consistency.
KPIs need to impact performance in the proper direction and should be correlated with desired
outcomes. This correlation makes explicit the linkage between driver KPIs and outcome KPIs
and gives executives greater confidence in making decisions117.
117 Eckerson W. (2009), PERFORMANCE MANAGEMENT STR ATEGIES How to Create and Deploy Effective Metrics, TDWI. www.tdwi.org
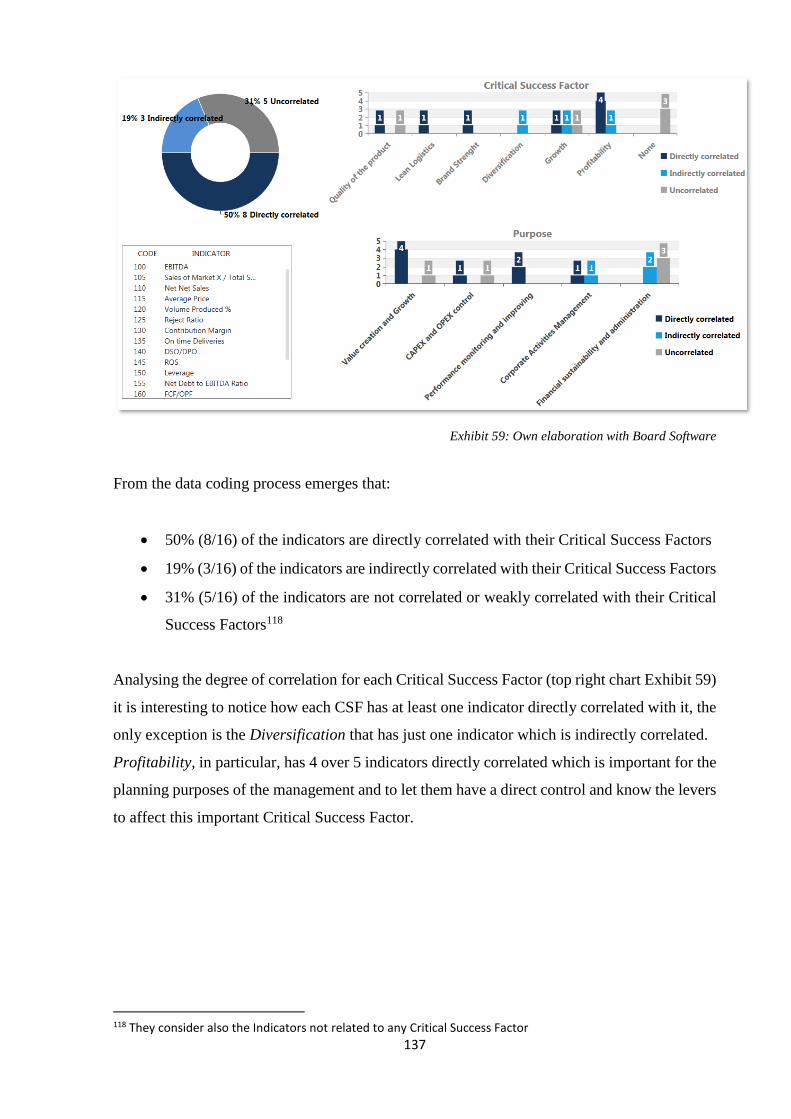
137
Exhibit 59: Own elaboration with Board Software
From the data coding process emerges that:
• 50% (8/16) of the indicators are directly correlated with their Critical Success Factors
• 19% (3/16) of the indicators are indirectly correlated with their Critical Success Factors
• 31% (5/16) of the indicators are not correlated or weakly correlated with their Critical
Success Factors118
Analysing the degree of correlation for each Critical Success Factor (top right chart Exhibit 59)
it is interesting to notice how each CSF has at least one indicator directly correlated with it, the
only exception is the Diversification that has just one indicator which is indirectly correlated.
Profitability, in particular, has 4 over 5 indicators directly correlated which is important for the
planning purposes of the management and to let them have a direct control and know the levers
to affect this important Critical Success Factor.
118 They consider also the Indicators not related to any Critical Success Factor
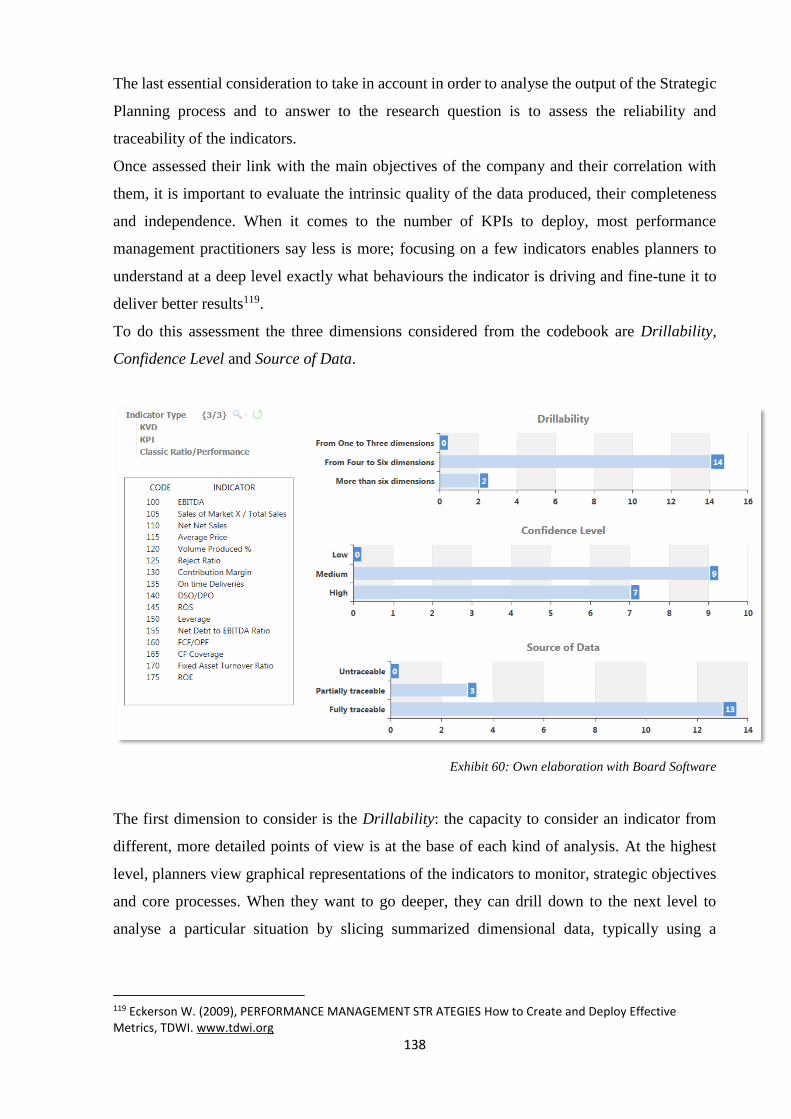
138
The last essential consideration to take in account in order to analyse the output of the Strategic
Planning process and to answer to the research question is to assess the reliability and
traceability of the indicators.
Once assessed their link with the main objectives of the company and their correlation with
them, it is important to evaluate the intrinsic quality of the data produced, their completeness
and independence. When it comes to the number of KPIs to deploy, most performance
management practitioners say less is more; focusing on a few indicators enables planners to
understand at a deep level exactly what behaviours the indicator is driving and fine-tune it to
deliver better results119.
To do this assessment the three dimensions considered from the codebook are Drillability,
Confidence Level and Source of Data.
Exhibit 60: Own elaboration with Board Software
The first dimension to consider is the Drillability: the capacity to consider an indicator from
different, more detailed points of view is at the base of each kind of analysis. At the highest
level, planners view graphical representations of the indicators to monitor, strategic objectives
and core processes. When they want to go deeper, they can drill down to the next level to
analyse a particular situation by slicing summarized dimensional data, typically using a
119 Eckerson W. (2009), PERFORMANCE MANAGEMENT STR ATEGIES How to Create and Deploy Effective Metrics, TDWI. www.tdwi.org
139
ROLAP120 or MOLAP121 tool. If they need more detail to complete the analysis or understand
the impact of a problem, they can drill into detailed data in operational reports that run against
the data warehouse or operational systems122 123.
That is why it is important for a set of KPIs to have a complete dimensional set, and, even if
the higher the number of dimensions the better, it is possible to say that the number of
dimensions present in a metric has a marginal utility. Usually the most important dimensions
are related with the Customer, Product and Time.
As it is possible to see from Exhibit 60:
• 14 indicators have a number of dimensions between 4 and 6
• 2 indicators have more than 6 dimensions in its dimensional set.
• 0 indicators have 3 or less dimensions
This implies that the model can reach a good level of drillability and allow different kinds of
analysis to the planners.
This is due to direct loading and initialization of metrics from ERP, which has a rich
dimensional set, and because of the allocation and normalization of data in order to split some
information to a deeper level through specific drivers.
Addressing directly the Traceability issue of the Research Question, Exhibit 60 shows that:
• 13 indicators are considered fully traceable
• 3 indicators are considered partially traceable
• 0 indicators are considered untraceable
Source of data identifies where the data comes from. This ensures that the designer of an
indicator thinks about the access to data, its reliability and update. If users don’t trust the data,
they won’t use it. The data has to be clean, accurate, and most importantly, perceived as
accurate. That is why it is important to provide reference data about them and specify their
source.
120 Relational online analytical processing 121 Multidimensional online analytical processing 122 Eckerson W. (2009), PERFORMANCE MANAGEMENT STR ATEGIES How to Create and Deploy Effective Metrics, TDWI. www.tdwi.org 123 Board Software can adopt both MOLAP and ROLAP structures
140
The classification of the sample indicators of this research is based on the assumption that an
indicator is fully traceable if its figures comes directly or indirectly from a company data source
such as the ERP, data warehouse or other planning or reporting tool used for Business
Intelligence purposes, even if manipulated with growth percentage or other kind of justified
variables in order to make projections.
Indicators which are considered partially traceable are, on the other hand, composed in part by
metrics without any kind of initialization, for example a data entry of the planner.
Once the above aspects of an indicator have been addressed, it is time to think about the validity
of the indicators, the Confidence Level.
To what extent do the indicators enable the planners to assess the given strategic element is an
essential point to consider in measuring its utility.
This assessment is subjective but forces anyone who designs an indicator to think about how
well it is actually measuring what it was that it set out to measure124.
The Confidence Level was evaluated considering a mix of traceability, number of dimensions,
completeness of the indicator and independence from other kind of information.
From this point of view the coding process revealed that over a total of 16 indicators:
• 9 Indicators have a Medium Confidence Level
• 7 Indicators have a High Confidence Level
The reason at the base of these results, which classify the majority of the indicators as Medium
confidence level, is linked to the fact that often they are presented as single indicators, not
enough integrated in a more holistic view or compared to suitable benchmarks. Moreover, the
cases of partial traceability of data or uncomplete dimensional set contribute to this result.
124 Marr B. (2006). Strategic Performance Management. Elsevier, Oxford. P. 117
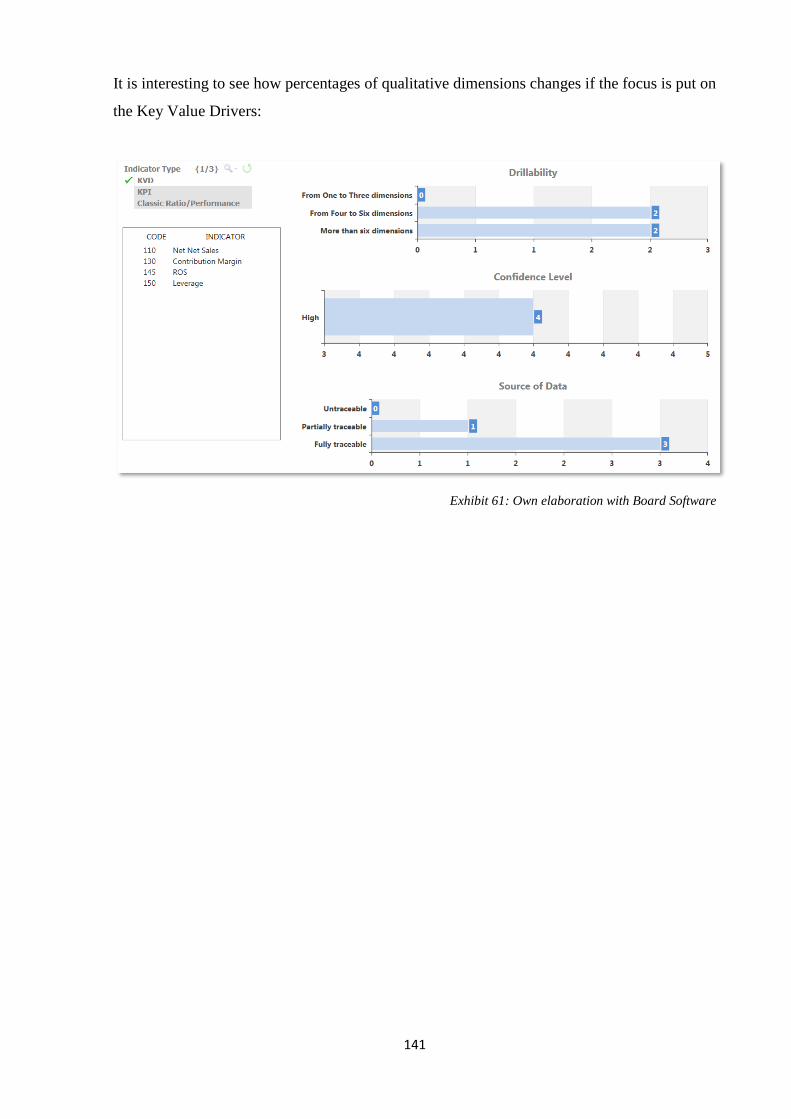
141
It is interesting to see how percentages of qualitative dimensions changes if the focus is put on
the Key Value Drivers:
Exhibit 61: Own elaboration with Board Software
142
Conclusion
This paper meant to analyse the concept of Strategic Plan from a practical and technical point
of view in order to show how an instrument of Corporate Performance Management could be
determinant in the planning process through the use of algorithms and data to support decisions.
The first step was to examine the literature around the Strategic and Business Plan to understand
which are the main levers, the expected results and the reasons why it is an essential instrument
for the application of the business strategy and the performance monitoring of a company.
In fact, the drawing up of the Strategic Plan, as part of systematic strategic planning initiatives,
contributes towards improving the quality of management’s strategic aims and directing the
subsequent implementation actions, improving, in conclusion, the corporate performances125.
The theoretical analysis allowed to understand the direct and unavoidable link between the
concept of Strategy and the one Planning as Porter states126 and how the qualitative dimension
and the quantitative one should be developed together to draw up an effective and useful
Strategic Plan.
Moreover, another important matter that this paper wants to underline is the dynamic nature of
the Plan, which should be an instrument to follow and review periodically, for example when
deciding on a particular action to undertake or situation to cope with127. This is strictly related
with the decision of examining a CPM tool for its draft.
The Business Case considered for the empirical analysis was the one of a manufacturing
company which draft its planning figures yearly taking advantage from a CPM Tool.
The empirical analysis had two main objectives.
The first one was to go into the logics of the planner and the CPM tool, intentionally in a
technical way, in order to understand really which could be the needs of a user that deals with
these activities and to show the potentialities and solutions of the instrument.
125 Borsa italiana, 2003. Strategic Plan Guide, www.borsaitaliana.it. p. 02 126 Porter M., 1996. What is strategy. Harvard Business Review. 127 International Federation of Accountants, Malaysian Institute of Accountants, 2006. Business Planning Guide: Practical Application for SMEs. p. 5
143
The second one was to examine the output of this Strategic Planning Process in order to answer
to the Research Question exposed in the Method paragraph:
Can a planning model designed on a CPM Tool improve the reliability and traceability of
output data and establish a link with the main objectives of the company?
The definition of the Research Question was based on the characteristics and issues that the
Strategic Plan should address according to the literature, especially Borsa italiana128: the link
between planning and strategy, as underlined before, the data traceability and the data
reliability, one of the explicit requisites of the Strategic Planning Guide of Borsa Italiana129.
To answer to the research question, a Content Analysis method was applied considering mainly
the guidelines of Krippendorf130 and the consideration about KPIs and Strategic Performance
Management of Marr131.
The results of the research show that, with the use of a CPM tool, creating a link between the
Success Factors that the management considers Critical and some quantitative indicators it is
possible to directly address particular issues and understand the main variables that affect it.
The model presented links 13 indicators over 16 with a CSF of the company and 11 over 16 of
them are directly (8) or indirectly (3) correlated.
The building of a metric/indicator follows particular steps with specific variables: following a
reverse path and knowing the degree of correlation between each metric and CSF the planner
can directly intervene using the right levers. Without knowing precisely the process followed
and the relation between the strategic elements and the planning ones it would be hard to make
reliable projections.
From the point of view of the reliability and completeness of the information the research
showed how the multidimensional structure of a CPM tool is important to improve the degree
of completeness of the metrics and enhance the power of information presented.
All the indicators illustrated have more than 4 dimensions as presented in the discussion of the
results.
This is the outcome of an allocating process driven from the CPM tool that allows a
normalization of the data coming from external sources and of a planning workflow that
128 Borsa italiana, 2003. Strategic Plan Guide, www.borsaitaliana.it. 129 Borsa italiana, 2003. Strategic Plan Guide, www.borsaitaliana.it. P.8 130 Krippendorff, K. (2004). Content analysis: An introduction to its methodology. SAGE, London 131 Marr B. (2006). Strategic Performance Management. Elsevier, Oxford.
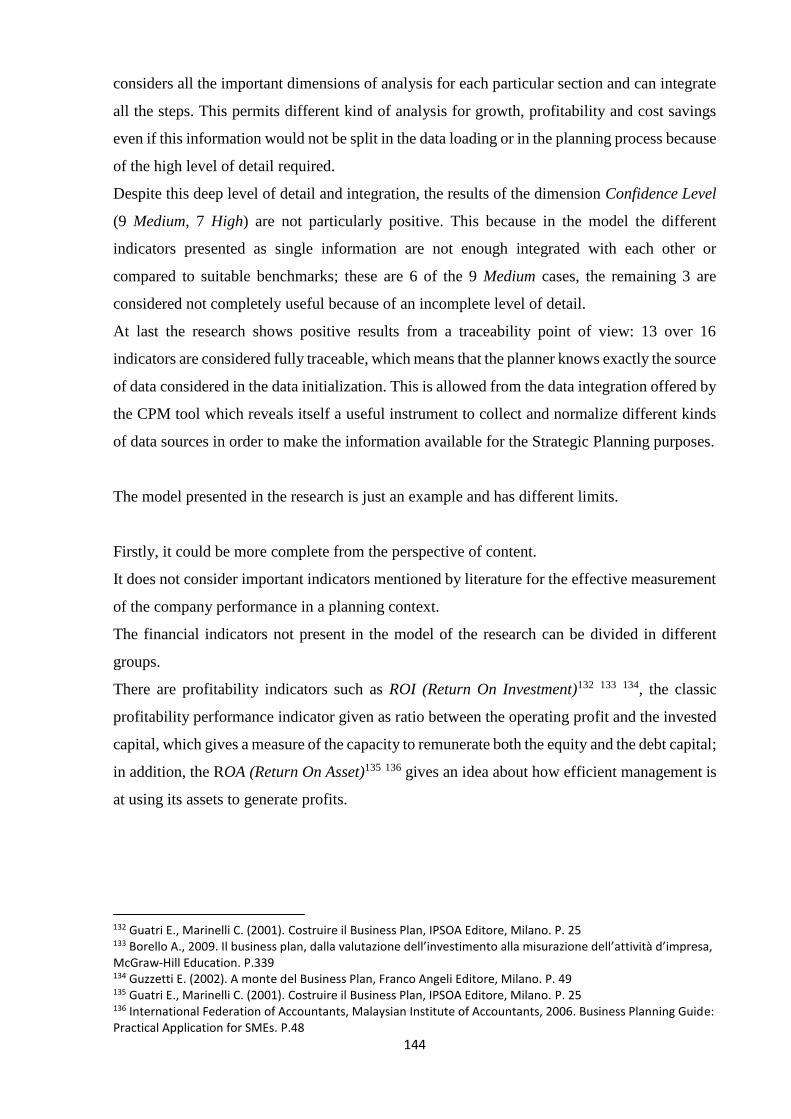
144
considers all the important dimensions of analysis for each particular section and can integrate
all the steps. This permits different kind of analysis for growth, profitability and cost savings
even if this information would not be split in the data loading or in the planning process because
of the high level of detail required.
Despite this deep level of detail and integration, the results of the dimension Confidence Level
(9 Medium, 7 High) are not particularly positive. This because in the model the different
indicators presented as single information are not enough integrated with each other or
compared to suitable benchmarks; these are 6 of the 9 Medium cases, the remaining 3 are
considered not completely useful because of an incomplete level of detail.
At last the research shows positive results from a traceability point of view: 13 over 16
indicators are considered fully traceable, which means that the planner knows exactly the source
of data considered in the data initialization. This is allowed from the data integration offered by
the CPM tool which reveals itself a useful instrument to collect and normalize different kinds
of data sources in order to make the information available for the Strategic Planning purposes.
The model presented in the research is just an example and has different limits.
Firstly, it could be more complete from the perspective of content.
It does not consider important indicators mentioned by literature for the effective measurement
of the company performance in a planning context.
The financial indicators not present in the model of the research can be divided in different
groups.
There are profitability indicators such as ROI (Return On Investment)132 133 134, the classic
profitability performance indicator given as ratio between the operating profit and the invested
capital, which gives a measure of the capacity to remunerate both the equity and the debt capital;
in addition, the ROA (Return On Asset)135 136 gives an idea about how efficient management is
at using its assets to generate profits.
132 Guatri E., Marinelli C. (2001). Costruire il Business Plan, IPSOA Editore, Milano. P. 25 133 Borello A., 2009. Il business plan, dalla valutazione dell’investimento alla misurazione dell’attività d’impresa, McGraw-Hill Education. P.339 134 Guzzetti E. (2002). A monte del Business Plan, Franco Angeli Editore, Milano. P. 49 135 Guatri E., Marinelli C. (2001). Costruire il Business Plan, IPSOA Editore, Milano. P. 25 136 International Federation of Accountants, Malaysian Institute of Accountants, 2006. Business Planning Guide: Practical Application for SMEs. P.48

145
The efficiency indicators not considered are the Inventory Turnover137 138 139 which measures a
company’s efficiency in terms of inventory management and generation of sales, and the
Trading Ratio140 that measures if the sales volume is compatible with the equity capital and it
is the ratio between these two metrics.
Other important metrics are the liquidity indicators such as the Current Ratio141 142 143, ratio
between current assets and current liabilities that shows if the company is able to use its current
assets to repay its current liabilities, and the Quick Ratio144 145, an indicator of a company’s
short-term liquidity that measures a company’s ability to meet its short-term obligations with
its most liquid assets, for this reason it excludes inventories from current assets.
At last, to measure the indebtment of a company an indicator considered by literature is the
Long-term debt ratio146: it is a measurement representing the percentage of a company’s assets
financed with loans lasting more than one year, it provides a general measure of the long-term
financial position of a company.
From a strategical point of view the model is not considering other operational Key
Performance Indicators and Key Value Drivers important to let management assess the value
generation of the company considered the industry in which it is operating.
From the point of view of the sell out for example it is not considered any method for the
Forecast Accuracy147 calculation and the use of MAPE148 in order to assess over time the quality
of the prediction and understand how to fine-tune the metrics analyzed. Other important
indicators are the Expected Sales and the Sales Risk that allow to understand if the coverage of
the stores and warehouses is appropriate or if there is a stock out risk.
137 Guzzetti E. (2002). A monte del Business Plan, Franco Angeli Editore, Milano. P. 42 138 Guatri E., Marinelli C. (2001). Costruire il Business Plan, IPSOA Editore, Milano. P. 20 139 Borello A., 2009. Il business plan, dalla valutazione dell’investimento alla misurazione dell’attività d’impresa, McGraw-Hill Education. P.337 140 Guzzetti E. (2002). A monte del Business Plan, Franco Angeli Editore, Milano. P. 43 141 Guzzetti E. (2002). A monte del Business Plan, Franco Angeli Editore, Milano. P. 42 142 Borello A., 2009. Il business plan, dalla valutazione dell’investimento alla misurazione dell’attività d’impresa, McGraw-Hill Education. P.336 143 International Federation of Accountants, Malaysian Institute of Accountants, 2006. Business Planning Guide: Practical Application for SMEs. P.48 144 Guzzetti E. (2002). A monte del Business Plan, Franco Angeli Editore, Milano. P. 149 145 Borello A., 2009. Il business plan, dalla valutazione dell’investimento alla misurazione dell’attività d’impresa, McGraw-Hill Education. P.336 146 Borello A., 2009. Il business plan, dalla valutazione dell’investimento alla misurazione dell’attività d’impresa, McGraw-Hill Education. P.337 147 Chen Z. (2004), Assessing Forecast Accuracy Measures. Iowa State University, Iowa 148 The mean absolute percentage error

146
A Sales and Operational Planning (S&OP) approach has a role of balancing demand and supply
plans at an aggregate level. It means considering a process to develop tactical plans that
provides management the ability to strategically direct its businesses to achieve competitive
advantage on a continuous basis by integrating customer-focused marketing plans for new and
existing products with the management of the supply chain149. That is why integration is the
essential part of a successful planning process. To monitor the performance related to these
dimensions, indicators such as Weeks of Coverage of the warehouses, based on the forecast
week by week, or Target Stock Level assume a central role in the logistic management of the
supply chain. They allow to really understand which are the needs of each single geographic
area in terms of quantity to sell and can be used as effective planning levers. These concepts
are also useful in the light of a Netting and Reorder planning in which the Extra Stock is an
important KPI to consider to net all the purchase reorders from the production, managing in an
efficient way the inventory through the geographical areas. The trade-off between Extra Stock
and Sales Risk should be evaluated from industry to industry to understand which is the
inventory policy that a company means to follow.
In this sense, the model described in this paper does not consider all these planning variables
and follow a different path to build the metrics. By the way, this is not a limit of the Software
considered, that actually have the tools to develop more complex environments and is fully
customizable according to the Business needs.
Another limit, as discussed mainly in the Financial Section, is that the model does not consider
in a proper way the qualitative dimension of the Strategic Plan and it is too focused into an
internal point of view.
A CPM tool could be a beneficial instrument to develop competitor analysis based on
quantitative metrics. Considering external sources of data, it would be possible to load useful
metrics to use as benchmark and be continually updated on the market trends. Moreover, the
multidimensional structure, as in the case of the CSF case presented, helps to link each
quantitative measure to a qualitative variable and in this way, it is possible to close the gap
between strategy and planning and create an effective Action Plan monitoring the performance
over time.
In conclusion, considered the remarkable potentialities of this kind of instruments and the
complete flexibility that this research tried to present, it is advisable a new approach to the
149 Wikner J. (2017), Sales and operations planning in the process industry. Linköping University, Linköping, Sweden

147
Strategic Plan, a multidimensional and dynamic approach that can go into level of details and
precision hardly achievable without the use of particular softwares.
The aware mix of forward-looking strategy and accurate planning method can help companies
to reach reliable projections useful for a sustainable competitive advantage.
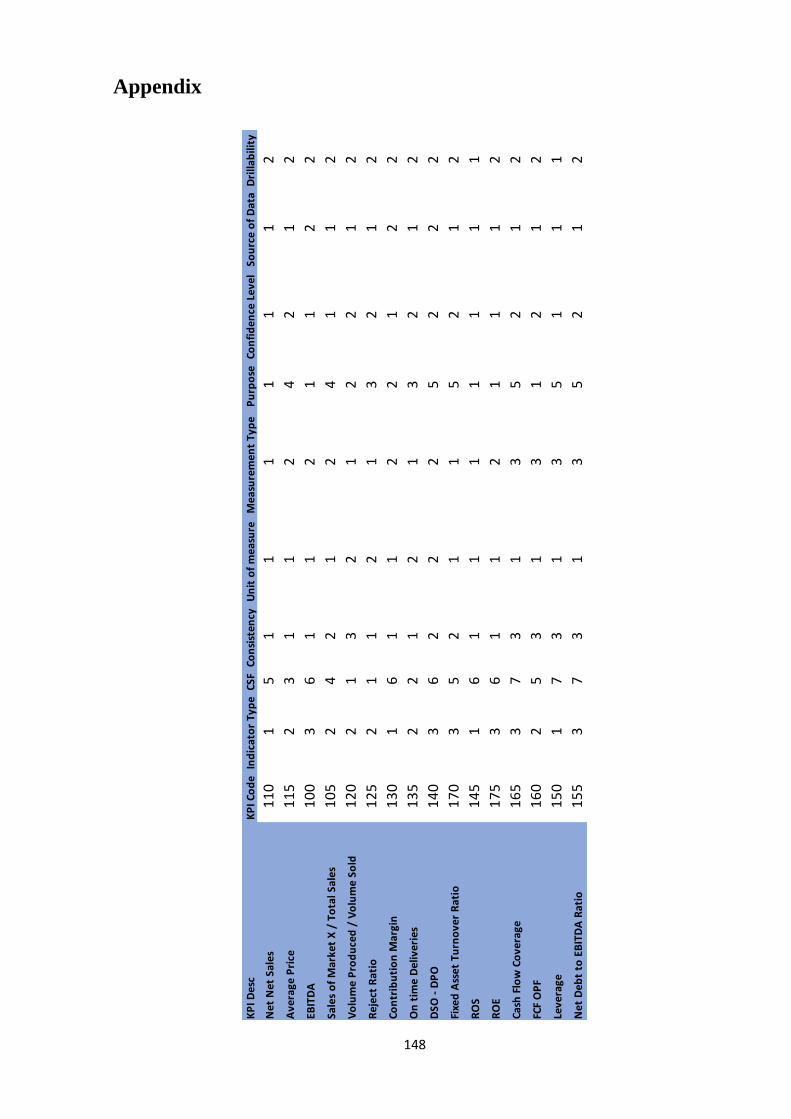
148
Appendix
KP
I Des
cK
PI C
od
eIn
dic
ato
r Ty
pe
CSF
Con
sist
ency
Un
it o
f m
easu
reM
easu
rem
ent
Typ
eP
urp
ose
Con
fid
ence
Lev
elSo
urc
e o
f D
ata
Dri
llab
ility
Net
Net
Sal
es1
10
15
11
11
11
2
Ave
rage
Pri
ce1
15
23
11
24
21
2
EBIT
DA
10
03
61
12
11
22
Sale
s o
f M
arke
t X
/ T
ota
l Sal
es1
05
24
21
24
11
2
Vo
lum
e P
rod
uce
d /
Vo
lum
e So
ld1
20
21
32
12
21
2
Rej
ect
Rat
io1
25
21
12
13
21
2
Con
trib
uti
on
Mar
gin
13
01
61
12
21
22
On
tim
e D
eliv
erie
s1
35
22
12
13
21
2
DSO
- D
PO
14
03
62
22
52
22
Fixe
d A
sset
Tu
rno
ver
Rat
io1
70
35
21
15
21
2
RO
S1
45
16
11
11
11
1
RO
E1
75
36
11
21
11
2
Cash
Flo
w C
ove
rage
16
53
73
13
52
12
FCF
OP
F1
60
25
31
31
21
2
Leve
rage
15
01
73
13
51
11
Net
Deb
t to
EB
ITD
A R
atio
1
55
37
31
35
21
2
149
Bibliography
• Mazzola P., 2003. Il piano industriale, Progettare E comunicare le strategie
d’impresa. Milano: Università Bocconi Editore
• Sciarelli S.,2008. Elementi di economia e gestione delle imprese. Padova:
CEDAM
• Mintzberg H.,1990. The Manager’s job: Folklore and Fact, Harvard Business
Review. https://hbr.org/1990/03/the-managers-job-folklore-and-fact
• Mintzberg H., 1987. 5 Ps of Strategy in the strategy process. California
Management review
• Porter M., 1996. What is strategy. Harvard Business Review.
• Borsa italiana, 2003. Strategic Plan Guide, www.borsaitaliana.it.
• International Federation of Accountants, Malaysian Institute of Accountants, 2006.
Business Planning Guide: Practical Application for SMEs.
• Tamborrino A., 2003. Principi di redazione del Business Plan. Roma: Aristeia.
• Porter M. 2008. The Five Competitive Forces That Shape Strategy, Harvard
Business Review
• Borello A., 2009. Il business plan, dalla valutazione dell’investimento alla
misurazione dell’attività d’impresa, McGraw-Hill Education.
• Iversen M.,1997, Concepts of synergy - Towards a clarification, Department of
Industrial Economics and Strategy Copenhagen Business School
• Parker Gates L., 2010. Strategic Planning with Critical Success Factors and Future
Scenarios: An Integrated Strategic Planning Framework, Carnegie Mellon
University
• Rockart j. F., 1979, Chief Executives Define Their Own Data Needs, Harvard
Business Review. URL: https://hbr.org/1979/03/chief-executives-define-their-
own-data-needs%20Rockart%20-
%20Chief%20Executives%20Define%20Their%20Own%20Data%20Needs
• Price Waterhouse Coopers, 2008. Corporate Performance Management: Achieving
value by effectively anticipating and managing change.
• Koller T., Goedhart M., Wessels D., 2010. Valuation. Measuring and Managing
the value of Companies. Hoboken: JOHN WILEY & SONS, INC.
• Schwartzing D., Weissbarth R. , 2011, Three Pillars of sound decision making
150
• Deloitte, IAS 14 — Segment Reporting (Superseded), URL:
https://www.iasplus.com/en/standards/ias/ias14
• Angiola N., 2007, La comunicazione economico-finanziaria dei gruppi italiani
quotati. Un’indagine empirica sull’informativa settoriale. Milano: Franco Angeli.
• Krauth E., Moonen H. ,Performance Measurement and control in logistics service
providing, Rotterdam School of Management, Department of Decision and
Information Sciences
• Eckerson W. (2009), PERFORMANCE MANAGEMENT STRATEGIES How to
Create and Deploy Effective Metrics, TDWI. www.tdwi.org
• Marr B. (2006). Strategic Performance Management. Elsevier, Oxford
• Krippendorff, K. (1989). Content analysis. In E. Barnouw, G. Gerbner, W.
Schramm, T. L. Worth, & L. Gross (Eds.), International encyclopedia of
communication (Vol. 1, pp. 403-407). New York, NY: Oxford University Press.
• Krippendorff, K. (2004). Content analysis: An introduction to its methodology.
SAGE, London
• White M. , Marsh E. (2006). Content Analysis: A Flexible Methodology
• Weber, (1990). Basic Content Analysis. SAGE, London
• Dumay J. Cai L. (2015). Using content analysis as a research methodology for
investigating intellectual capital disclosure: A critique. Article in Journal of
Intellectual Capital · January 2015.
• Mayring P. (2014). Qualitative Content Analysis. University of Klagenfurt
• Colangelo R. 2005, Spend Management e Procurement Management, la gestione
della domanda interna e degli acquisti per migliorare i risultati aziendali. Milano:
Franco Angeli
• Fantuzzi N. Corporate Performance Management, realizzare un sistema
informativo direzionale a metriche complete e bilanciate, 2007. Milano: Hoepli
• Guerrini A. Strumenti per la valutazione delle performance aziendali, modelli
contabili ed indicatori chiave, 2012. Milano: Giuffrè Editore.
• Guatri E., Marinelli C. (2001). Costruire il Business Plan, IPSOA Editore, Milano.
• Guzzetti E. (2002). A monte del Business Plan, Franco Angeli Editore, Milano
• Chen Z. (2004), Assessing Forecast Accuracy Measures. Iowa State University,
Iowa
• Wikner J. (2017), Sales and operations planning in the process industry. Linköping
University, Linköping, Sweden