UNIVERSITÀ DEGLI STUDI DI TRIESTE - openstarts.units.it PhD... · DRG – Dorsal Root ......
86
UNIVERSITÀ DEGLI STUDI DI TRIESTE XXIV CICLO DEL DOTTORATO DI RICERCA IN NANOTECNOLOGIE BIO-SAMPLE ENVIRONMENT MANIPULATION USING ADVANCED MICROSCOPY TECHNIQUES Settore scientifico-disciplinare: FIS/01 FISICA SPERIMENTALE Dottoranda: Elisa D’ESTE Coordinatore Dottorato di Ricerca: Prof. Maurizio FERMEGLIA Supervisore: Prof. Alberto MORGANTE Università degli Studi di Trieste Tutore: Dott. Dan COJOC CNR - IOM Laboratorio TASC Correlatore: Prof. Enrico TONGIORGI Università degli Studi di Trieste ANNO ACCADEMICO 2010/2011
Transcript of UNIVERSITÀ DEGLI STUDI DI TRIESTE - openstarts.units.it PhD... · DRG – Dorsal Root ......

UNIVERSITÀ DEGLI STUDI DI TRIESTE
XXIV CICLO DEL DOTTORATO DI RICERCA IN NANOTECNOLOGIE
BIO-SAMPLE ENVIRONMENT MANIPULATION USING
ADVANCED MICROSCOPY TECHNIQUES
Settore scientifico-disciplinare: FIS/01 FISICA SPERIMENTALE
Dottoranda:
Elisa D’ESTE
Coordinatore Dottorato di Ricerca:
Prof. Maurizio FERMEGLIA
Supervisore:
Prof. Alberto MORGANTE
Università degli Studi di Trieste
Tutore:
Dott. Dan COJOC
CNR - IOM Laboratorio TASC
Correlatore:
Prof. Enrico TONGIORGI
Università degli Studi di Trieste
ANNO ACCADEMICO 2010/2011


“And sometimes is seen a strange spot in the sky
A human being that was given to fly”
Eddie Vedder
“Le' inutil insegna' al mus, si piart timp. In plui si infastidis la bestie.”
(Teaching to the donkey: useless. And you bother it)
Common saying from Friuli

Table of Contents
4
TABLE OF CONTENTS
TABLE OF CONTENTS ................................................................................................................. 4
ACRONYMS ................................................................................................................................... 6
ABSTRACT ..................................................................................................................................... 8
1. INTRODUCTION ............................................................................................................... 10
LOCAL ENVIRONMENT MANIPULATION AND IMAGING OF CULTURED CELLS ....... 10
1.1 Optical tweezers .............................................................................................................. 10
1.1.1 Historical introduction................................................................................................ 10
1.1.2 Basic Principles .......................................................................................................... 10
1.1.3 Photodamage induced by optical tweezers on biological samples ............................. 12
1.1.4 Biological applications of optical tweezers ................................................................ 13
1.2 Microenvironment manipulation of biological samples .................................................. 14
1.2.1 Microfluidics .............................................................................................................. 15
1.2.2 Ejection ...................................................................................................................... 16
1.2.3 Microbeads (bulk application) ................................................................................... 16
1.2.4 Uncaging .................................................................................................................... 17
1.2.5 AFM ........................................................................................................................... 18
1.2.6 Phototransfection ........................................................................................................ 18
1.2.7 Optical tweezers for microenvironment manipulation ............................................... 19
1.3 Diffraction limited imaging ............................................................................................. 19
GOAL OF THE THESIS ............................................................................................................... 22
2. RESULTS............................................................................................................................ 23
HIGH RESOLUTION OPTICAL MANIPULATION OF MICRO AND NANO-VECTORS FOR
MICRO-ENVIRONMENT CONTROL ........................................................................................ 23
2.1 Functionalized microbeads .............................................................................................. 23
2.1.1 Functions and importance of focal delivery of BDNF ............................................... 23
2.1.2 Localized delivery of BDNF ...................................................................................... 26
2.1.3 Materials and methods ............................................................................................... 26
2.1.4 Results ........................................................................................................................ 29
2.1.5 Discussion .................................................................................................................. 35

Table of Contents
5
2.2 Liposomes ....................................................................................................................... 38
2.2.1 Growth cones ............................................................................................................. 38
2.2.2 Semaphorin 3A ........................................................................................................... 40
2.2.3 Netrin-1 ...................................................................................................................... 40
2.2.4 Localized stimulation of growth cones ...................................................................... 41
2.2.5 Materials and methods ............................................................................................... 41
2.2.6 Results ........................................................................................................................ 43
2.2.7 Discussion .................................................................................................................. 48
2.3 Nanosized vectors ........................................................................................................... 52
2.3.1 Quantum dots: biological applications & toxicity ...................................................... 52
2.3.2 Trk receptor retrograde transport ............................................................................... 54
2.3.3 Materials and methods ............................................................................................... 56
2.3.4 Results ........................................................................................................................ 56
2.3.5 Discussion .................................................................................................................. 60
2.4 SUPER-RESOLUTION IMAGING OF GROWTH CONES ......................................... 62
2.4.1 Super-resolution optical microscopy: novel techniques and perspectives for bio-
samples imaging ..................................................................................................................... 62
2.4.2 STimulated Emission Depletion (STED) Microscopy: principle and application to
cell imaging ............................................................................................................................ 63
2.4.3 Materials and methods ............................................................................................... 65
2.4.4 Results ........................................................................................................................ 67
2.4.5 Discussion .................................................................................................................. 68
3. FINAL REMARKS AND CONCLUSIONS ...................................................................... 72
ACKNOWLEDGMENTS .............................................................................................................. 74
BIBLIOGRAPHY .......................................................................................................................... 75
APPENDIX .................................................................................................................................... 86
Acronyms
6
ACRONYMS
AFM – Atomic Force Microscopy
ATP – Adenosine-5'-TriPhosphate
BDNF – Brain Derived Neurotrophic Factor
BLP – Biotinylated-Lipid Particles
BSA – Bovine Serum Albumin
Ca2+
– Calcium
cAMP – Cyclic Adenosine Monophosphate
CCD – Charge Coupled Device
C domain – Central domain
cGMP – Cyclic Guanosine Monophosphate
COOH – Carboxylic group
CW – Continuous Wave
D – Distance
DCC – Deleted in Colorectal Cancer
DIC – Differential Interference Contrast
DIV – Days In Vitro
DNA – Deoxyribonucleic acid
DRG – Dorsal Root Ganglion
E. coli – Escherichia coli
ECM – Extra Cellular Matrix
EDAC – 1-Ethyl-3-[3-dimethylaminopropyl]carbodiimide hydrochloride
EGF – Epidermal Growth Factor
fL – Focal Lenght
GABA – Gamma-Aminobutyric Acid
GC – Growth Cone
GSD – Ground State Depletion microscopy
IL-8 – Interleukin-8
IP3 – Inositol trisphosphate
IR – InfraRed
LTD – Long-Term Depression

Acronyms
7
LTP – Long-Term Potentiation
MAPK – Mitogen-Activated Protein Kinase
MNPs – superparaMagnetic NanoParticles
NA – Numerical Aperture
NGF – Nerve Growth Factor
Nmol – Number of molecules encapsulated within a liposome
P domain – Peripherial domain
PALM/STORM – PhotoActivation Localization Microscopy, STochastic Optical Reconstruction
Microscopy
PI3K – Phosphatidylinositol 3-Kinase
PLC-γ – Phospholipase Cγ
PSF – Point Spread Function
Qdots or QD – Quantum Dots
RESOLFT – REversible Saturable OpticaL Fluorescence Transitions
RNA – Ribonucleic acid
RT – Room Temperature
Sema3A – Semaphorin 3A
SPEM/SSIM – Saturated Pattern Excitation Microscopy or Saturated Structured Illumination Microscopy
SQT – Single Quantum dot Tracking
STED – STimulate Emission Depletion
T zone – Transition zone
Trk – Tropomyosin-Related tyrosine Kinases receptors
TRPC – Transient receptor potential channels
VB – Vesicle Breaking
WD – Working Distance

Abstract
8
ABSTRACT
Under physiological conditions in the brain, molecules are released with high spatial and
temporal resolution. A lot of efforts have been done in the last years in order to develop techniques that
mimic this situation. Among them, we mention the use of micropipettes for the ejection of fluids, the use
of AFM (Atomic Force Microscopy), microfluidic devices and optical manipulation. The latter approach
exploits light to manipulate the samples, e.g. to create transient pores in the cell membrane or to move
small objects carrying a stimulus.
This Thesis concerns with the development of new techniques for the local delivery of molecules
based on optical manipulation technologies, and in particular on optical tweezers. Sub-micrometer
particles in a compact trap, such as the single-beam gradient or optical tweezers, can be localized within a
small fraction of a wavelength of light or moved over long distances of many centimeters without any
mechanical contact. A three-dimensional trap is simply created by focusing a laser beam through a
microscope objective with high numerical aperture. We studied three types of vectors for local delivery of
molecules, which can be optically manipulated: microbeads, micron-sized liposomes and Quantum dots
(Qdots).
Silica microbeads can be covalently functionalized on their surface with the protein of interest
and placed in contact with the desired part of a cell. In order to validate the technique, we functionalized
beads with a secretory molecule, the neurotrophin Brain-derived neurotrophic factor (BDNF). BDNF is a
key regulator of neuronal development and plasticity. We showed that single BDNF-coated microbeads
can be extracted with optical tweezers from small reservoirs and positioned with submicrometric
precision to specific sites on the dendrites of cultured hippocampal neurons. Localized contact of
microbeads functionalized with BDNF induced focal increase of Calcium signaling in the stimulated
dendrite, specific activation of the TrkB receptor pathway and influenced the development of growth
cones. Remarkably, a single BDNF-coated bead positioned on a dendrite was found to be enough for
TrkB phosphorylation, an efficient and long-lasting activation of Calcium signaling in the soma, and c-
Fos signaling in the nucleus, comparable to bath stimulation conditions. Moreover, since BDNF is
covalently cross-linked to the bead surface we could demonstrate that activation of some of the TrkB
receptor pathway does not necessarily require BDNF endocytosis.
In the case of liposomes, the molecules of interest were encapsulated within their lumen. Single
liposomes were trapped and transported by means of optical tweezers to the site of stimulation on
cultured neurons. Finally, the release of liposome content was induced by application of UV-pulses that
broke the liposome membrane. In order to test the effect of the UV-induced release, liposomes with a
diameter ranging from 1 to 10 μm (fL to pL volumes), were filled with KCl and tested on neuronal cells.
Neuronal cultures, loaded with Ca2+
dye, were monitored by imaging intracellular Ca2+
. An efficient
release from the liposomes was demonstrated by detectable Calcium signals, indicating induced
depolarization of the neuronal cells by KCl. Afterwards, this technique was used to address a biological
issue, that is the effect of two proteins (Semaphorin 3A and Netrin-1) on growth cones. The growth cone
is an intracellular apparatus located at the tip of the neurite of developing neurons. Its motility governs
axonal path-finding and the construction of neuronal networks. Growth cones are highly dynamic
structures that respond to external stimuli turning towards or away from the chemical gradient. We were
able to demonstrate an attractive effect of Netrin-1 on the growth cones of primary hippocampal neurons.
On the contrary, Semaphorin 3A showed a repellant behavior.

Abstract
9
To correlate the high resolution of vector manipulation with high resolution of imaging we used
STimulated Emission Depletion (STED) to investigate the intimate organization of two main cytoskeleton
components: actin and tubulin filaments. STED microscopy allowed imaging of actin bundles in the
filopodia and organized network in lamellipodia with un-precedent resolution, beyond the diffraction
barrier.
Lastly, we used liposomes to encapsulate Quantum dots. Qdots are bright and photostable
nanocrystals. Due to their small size, similar to that of proteins, Qdots may be endocyted along the
receptor-mediated endocytosis pathway, when they are functionalized with the appropriate ligand. As
case study we considered the BDNF-TrkB endocytotic pathway. We optimized the protocol for the direct
binding of BDNF to Qdots and we demonstrated the possibility of encapsulating and releasing them from
liposomes.
Concluding, two different approaches for local stimulation of neurons, based on optical
manipulation of microvectors, were presented and validated in this thesis. Indirect optical manipulation of
nanovectors (Qdots) encapsulated in liposomes has been demonstrated as well. The techniques were then
successfully applied to address some biological issues, that in turn required the optimization of other
imaging tools (super resolution microscopy and Qdots).
The results of the research have been published in three papers and make the subject of other two
papers in preparation:
D'Este, E., Baj, G., Beuzer, P., Ferrari, E., Pinato, G., Tongiorgi, E., and Cojoc, D. (2011). Use
of optical tweezers technology for long-term, focal stimulation of specific subcellular neuronal
compartments. Integr Biol (Camb) 3, 568-577;
Pinato, G., Lien, L. T., D'Este, E., Torre, V., and Cojoc, D. (2011a). Neuronal chemotaxis by
optically manipulated liposomes. Journal of the European Optical Society Rapid Publications 6,
11042;
Pinato, G., Raffaelli, T., D'Este, E., Tavano, F., and Cojoc, D. (2011b). Optical delivery of
liposome encapsulated chemical stimuli to neuronal cells. J Biomed Opt 16, 095001.

Introduction
10
1. INTRODUCTION
LOCAL ENVIRONMENT MANIPULATION AND
IMAGING OF CULTURED CELLS
1.1 OPTICAL TWEEZERS
1.1.1 HISTORICAL INTRODUCTION
In the 17th century Johannes Kepler noticed that the tails of the comets were always directed
opposite to the sun (Kepler, 1619). This observation suggested that the sun was exerting a sort of “radiant
pressure” that shaped the tail of the comet. Two centuries later James Clerk Maxwell proved theoretically
that light can exert force on matter (Maxell, 1873) but only in 1968 Letokhov proposed the use of light
beams to trap atoms (Letokhov, 1968). One year later Arthur Ashkin proved experimentally that micron-
sized particles could be accelerated and trapped in stable optical potential wells using only the force of
radiation pressure from a continuous laser (Ashkin, 1970). Ashkin used two counter-propagating
Gaussian beams to confine the particles: only particles with a high refractive index were attracted into
regions of high light intensity, while low index particles were always pushed out of the light beam. Up-to-
date optical tweezers were born in 1986, when three dimensional trapping of dielectric particles was
achieved with a single-beam gradient force optical trap (Ashkin et al., 1986).
Shortly after, laser tweezers started to be used for the manipulation of biological samples (Ashkin
and Dziedzic, 1987). Since then a lot of uses have evolved and the interest in optical tweezers has grown
exponentially (for reviews see Ashkin, 2006; Dholakia et al., 2007; Grier, 2003; Moffitt et al., 2008;
Neuman and Block, 2004; Snook et al., 2009; Stevenson et al., 2010a).
1.1.2 BASIC PRINCIPLES
A single beam gradient optical trap is formed by tightly focusing a continuous-wave laser beam
through an objective lens with a high numerical aperture (NA). The basic principle behind optical
tweezers is related to radiation pressure forces that arise from the momentum of light itself. An easy
explanation can be given for micron-sized dielectric particles. If an object bends the light, changing its
momentum, conservation of momentum requires that the object must undergo an equal and opposite
momentum change. This gives rise to a force acting on the object.
According to the size of the trapped particles, two different regimes describe the forces acting
within optical tweezers:
the Mie regime, when the diameter of the particle is large compared to the wavelength (d>λ);
the Rayleigh regime, when the diameter of the particle is much smaller compared to the
wavelength (d<< λ).

Introduction
11
Figure 1.1: Simplified illustration of the principle of optical trapping. (Left) The ray-optics diagram.
Rays coming from different parts of the Gaussian laser beam have different intensities. When they are
focused through a high numerical aperture objective, they hit a particle that is in the neighbourhood of
the focus with different angles. These rays undergo different refraction (see right part of the figure),
generating a net force on the particle, that pulls it in the focus of the objective. (Right) Qualitative
view of the trapping in of dielectric spheres. The refraction of a typical pair of rays (a and b) of the
trapping beam gives forces Fa and Fb whose vector sum F is always restoring for axial and transverse
displacements of the sphere from the trap focus f. Modified from Ashkin, 1992.
For Mie regime, ray optics analysis of the deviated light path gives the change in momentum flow
and hence the reaction force acting on the object (Figure 1.1). A dielectric particle in a focused laser
beam experiences a force called the gradient force that tends to bring the particle towards the focus. This
force arises from the momentum imparted to the bead as it scatters the laser light. As depicted in
Figure 1.1, two components are essential for a three dimensional trapping to occur: a high
numerical aperture objective and a Gaussian laser beam. The combination of these two elements has some
advantages:
rays coming from the inner parts of the Gaussian laser beam are more intense then rays coming
from the outer parts. As a result, the force they exert on the particle is higher, and they tend to
push the particle away from the focus (Figure 1.1A) along the optical axis. These forces are
counterbalanced by the outer and less intense rays, that are more divergent and pull the object
toward the focus (Figure 1.1B);
the beam is symmetric and thus forces on the right and on the left of the beam are equal. As a
result, particles always tend to align to the optical axis of the system (Figure 1.1C);
once the particle is in the focus of the objective, the net sum of all the forces is null and the
particle is confined in along the three axis x, y and z (Ashkin, 1992; Shaevitz, 2006).
The forces of a single-beam gradient radiation pressure optical trap on micron-sized dielectric
spheres were first described quantitatively by Ashkin (Ashkin, 1992). These forces can be discussed in
terms of scattering and gradient forces on a sphere. As they are derived considering the refraction of the
light rays though the sphere, they are functions of the power of the incident light ray, the angles of
incidence and refraction, and the Fresnel reflection and transmission coefficients. The total force can be
described as

Introduction
12
Where Q is the dimensionless efficiency, nm the index of refraction of the suspending medium, P
is the incident laser power at the specimen plane, and c is the speed of light. Q depends on the numerical
aperture of the objective (NA), on the laser (wavelength, polarization state and mode structure) and on the
particle (relative index of refraction and geometry) (Ashkin, 1992; Ashkin et al., 1986). Considering
standard parameters (Q=0,3 and a nm=1,33) the force acting on the particle can thus be estimate to be in
the pN range.
For the Rayleigh regime, a simple dipole model can be used (Harada and Asakura, 1996). In this
case, the scattering force, which arises from the absorbed or reflected light, points towards the
propagation of the laser beam. The gradient force is caused by the laser beam, which polarized the object.
This force points in the direction of the intensity gradient. Also in the Rayleigh regime, the key
parameters influencing the force of the trap are the light intensity, the refractive indexes of both particle
and medium, the cross-section of the sphere and its radius.
For particles in between the Mie and Rayleigh regime, the previous calculations are not consistent
with experimental data. Indeed, when the beam is highly localized, the electromagnetic field is essentially
constant over the diffraction-limited spot (Tlusty et al., 1998) and the interactions arise from steep
variations in amplitude of the electromagnetic fields. The dipole approximation can thus be used. The
optical gradient force is given by dipole interaction energy as the coordinates of the particle change and
the localized electromagnetic fields near the focal point can be approximated by a three-dimensional
Gaussian beam. The interactions of the polarization form a potential well in which there is a restoring
force that pulls the particle to the centre of the beam.
Finally, also particles with a low refractive index (e.g. air bubbles) or made from strongly
scattering materials (e.g. metallic particles) can be trapped. In these cases the gradient force is reversed
and more complex beam arrangements are required. For instance, the annular intensity distribution
Laguerre-Gaussian was used to trap objects with lower refractive index than their surroundings (Cahagan
and Swartzlander, 1998).
1.1.3 PHOTODAMAGE INDUCED BY OPTICAL TWEEZERS ON BIOLOGICAL SAMPLES
Optical tweezers are widely used for biological applications on living samples. Since the power
of laser used can be quite high, the issue of photodamage should be considered. If one looks at the
absorption coefficient of important organic molecules, such as hemoglobin and oxyhemoglobin, a large
drop in the infrared (IR) region can be noticed (Figure 1.2). There is a window of relative transparency
around 750 – 1200 nm, between the absorption of proteins in the visible and the increasing absorption of
water towards the infrared which can be exploited. Several papers analyzed the effects of the wavelength
within this window on the lethal dose and cloning efficiency of both prokaryotic and eukaryotic cells
(Ashkin et al., 1990; Liang et al., 1996; Neuman et al., 1999).
Ashkin and colleagues demonstrated that using 1064 nm wavelength, trapped cells (Escherichia
coli and yeast cells) could duplicate (Ashkin et al., 1987). Trapping of other cell types, such as red blood
cells, plant cells, protozoa, diatoms, algae, was successfully tested at this wavelength.
For this reason many optical tweezers setups for biological application use IR lasers, such as
Nd:YAG (Neodymium:ytterbium-aluminium-garnet, 1064 nm), Nd:YVO4 (Neodymium:ytterbium-
orthovanadate, 1064 nm) or Nd:YLF (Neodymium:ytterbium-lithium-fluoride, 1047 or 1053 nm). At
these wavelengths the damage caused by the light is relatively low, even if an increase in the expression
of heat shock proteins (chaperone molecules) was observed in trapped cells (Leitz et al., 2002).

Introduction
13
Besides the wavelength, cell survival during optical manipulation depends on other factors:
power and duration of manipulation, oxygen (in anaerobic conditions or in the presence of oxygen-
scavenging molecules cells had a increased viability) and particular treatment performed prior to the
manipulation (Neuman et al., 1999).
Finally different tolerances to optical tweezers were observed between both different bacterial
species and intraspecies.
Figure 1.2: Plot of the optical absorption coefficients of hemoglobin (Hb), oxyhemoglobin (HbO2)
and water versus wavelength. Nd:YAG emission at 1064 nm is indicated. From Ashkin, 2006.
1.1.4 BIOLOGICAL APPLICATIONS OF OPTICAL TWEEZERS
The main applications of optical tweezers in the biological field are force measurements, studies
on the dynamics of single molecules, and manipulation at the cellular level (Ashok and Dholakia, 2011;
Grier, 2003; Moffitt et al., 2008; Stevenson et al., 2010a).
The first two applications arise from the possibility of converting the trap into a true force
measurement apparatus. A trapped object in optical tweezers works rather like a calibrated microscopic
spring: the tightly focused laser beam, indeed, creates a parabolic potential energy well for the trapped
object. Thus, small displacements away from trap center correspond in a directly proportional way to the
force. Hence, a simple accurate evaluation of the position of the object allows absolute force
measurements (Ashkin, 1992; Ashkin et al., 1990; Block et al., 1990).
In single molecule studies, rather than trap a molecule directly, the molecule of interest is
chemically attached to a micro- or nanosphere. Forces are measured on the terminal using optical
tweezers and are in the range of pN, meaning that optical tweezers are unable to sever covalent bonds but
are sufficient to analyze protein-protein interactions. With this technique, the activity of many different
enzymes was unraveled (RNA- and DNA-polymerase, helicases, exonuclease, DNA restriction enzymes),
the transport of DNA through a nanopore was measured, as well as the translation of RNA into protein,
the dynamics of rotary and linear molecular motors (e.g. actin-myosin, kinesin motion on microtubules),
and the folding of proteins (Bustamante et al., 2003; Fazal and Block, 2011; Perkins, 2009; Stevenson et
al., 2010a).
Optical traps are not restricted to the world of single molecules. Indeed, they can be used to trap
and organize cells, allowing us the understanding of numerous facets of cell biology. This application
field takes strong advantage on the development of multiple trapping systems, that permit generation of
arrays of planar or three dimensional traps in space. 2D and 3D pattern may have a strong effect on tissue

Introduction
14
engineering, since it is well established that the microenvironment of a cell influences its differentiation
and activity. The control of cell-cell contacts is thus a highly important topic and it can help to elucidate
the mechanisms of phenotype maintenance. So far, arrays of cells have been demonstrated for the creation
of artificial neural networks (Townes-Anderson et al., 1998) or to deliver single cells to microfabricated
sensors or wells (Luo et al., 2007; Pine and Chow, 2009). Patterns of live cells (both bacteria and
mammal cells) were created in a photopolymerizable hydrogel. Cells could be subsequently fixed into
defined positions inducing the polymerization of the gel (Akselrod et al., 2006). Optical tweezers were
also used to guide the development of the axon of growing neurons (Carnegie et al., 2009; Ehrlicher et al.,
2002) and other mammalian cells (Ehrlicher et al., 2007).
Another major application of optical tweezers at the single-cell level is the sorting of cell types,
particularly in microfluidics environment. By means of optical manipulation, biologically tagged cells can
be actively drag from a flow stream. Cells can also be sorted on a potential energy landscape by relying
on differing physical attributes (e.g. size) of one cell type compared to another (Dholakia et al., 2007;
Stevenson et al., 2010a). Optical chromatography achieves microscale optical manipulation through the
balance of optical and hydrodynamic forces acting on micron sized particles, which are in microfluidic
flow travelling counter to the propagation of a mildly focused laser beam. The optical pressure force on a
particle is specific to each particle‟s size, shape and refractive index and hence allows the separation
according to physical characteristics of the particle itself (Hart et al., 2006).
In the last decade optical trapping was combined with other optical methods, such as
spectroscopy. In particular Raman spectroscopy was combined with optical tweezers for a variety of
studies of lymphocytes and erythrocytes (Bankapur et al., 2010; Dasgupta et al., 2011; Ramser et al.,
2004; Rao et al., 2009; Snook et al., 2009). The advantages of this approach are several: the cell can be
separated from any local surface and can be exposed to different buffer media. Moreover the cell can be
rotated and oriented and Raman signal can be recorded from different subcellular regions.
Cell tweezers can also be combined with other light fields that are designed to perform very
precise cutting or controlled transient perforation with submicrometric resolution. “Optical scissors” and
nanosurgery were employed to study intracellular organelles (mitotic spindle, chromosomes,
mitochondria) (Kohli and Elezzabi, 2009), to fuse cells (Steubing et al., 1991) or for transfection,
transiently permeabilizing the cell membrane (Barrett et al., 2006).
The use of optical tweezers for local delivery of molecules and for cell stimulation will be
discussed specifically in section 1.2.7.
1.2 MICROENVIRONMENT MANIPULATION OF BIOLOGICAL SAMPLES
In physiological conditions, molecules are released at low concentrations and in a spatially
restricted fashion. Moreover polarized cells usually interact with a polarized environment and it may be
very useful having the possibility to study reactions promoted by stimuli in different and definite parts of
the cells. Different techniques have been developed to reach a good efficiency of localized delivery but
they all have some drawbacks. Thus, obtaining a cheap, reliable and repeatable technique could have a
great impact in modern research, where bath stimulation is still the method of choice.
The now-a-day available local stimulation techniques will be reviewed in the following
paragraphs, namely: microfluidics, ejection, uncaging, AFM, phototransfection and optical tweezers.

Introduction
15
1.2.1 MICROFLUIDICS
Microfluidic systems represent a new kind of cell culture vessel that expands our capacity to
control the local cellular environment. They enable patterning of molecules and cells, as well as both
passive and active cell handling and environmental control. This is possible because the flow conditions
at low Reynolds numbers (where inertial forces are minimal) provide unprecedented spatial and temporal
control over fluids entering and leaving an experimental system (Meyvantsson and Beebe, 2008).
Microfluidic systems allow a fine control of the biochemical and physical environment in which
cells are growing. First of all they permit spatially defined treatments, often impossible to achieve with
conventional means. By simply controlling the stream, the concentration of soluble factors can be
modified. For instance, laminar flows were used to expose only a small part of a cell to a epidermal
growth factor and to observe the intracellular propagation of cell signaling (Sawano et al., 2002). Laminar
streams were also used to stimulate different regions of rat brain slices and then analyze the effect of the
treatments on the electrical activity (Blake et al., 2007).
In microfluidic devices gradients of molecules can be generated as well. This opportunity is
fundamental when studying soluble factors involved in chemotaxis. Several approaches have been used to
achieve this goal. In a simple cross-shaped device, growing neurites were exposed to guidance cue
gradients orthogonal to the direction of growth (Kothapalli et al., 2010). Jeon et al. generated gradients of
interleukin-8 (IL-8) by successive splitting and mixing of flows and observed different migration
sensitivity of neutrophils (Li Jeon et al., 2002). To address the same topic, Irimia et al. used a gradient-
switching device. They studied the response of neutrophils to time-dependent step-up, step-down, and
reversal of IL-8 gradients (Irimia et al., 2006). Laminar flow-based gradients have been used to separate
wild-type and chemotactic mutant strains of E. coli bacteria. In this assay cells were collected in different
channels downstream depending on their position within the laminar flow (Mao et al., 2003). Recently,
a single-cell assay platform that allows quantitative analysis of single cell chemotaxis by dynamic
morphogenetic gradients was also proposed and applied to the study of molecular regulatory mechanism
of chemotaxis in yeast (Lee et al., 2012). Multi-channel microfluidic perfusion platform for culturing
living animals (zebrafish embryos) is also possible. In this device the development of up to 8 embryos
stressed with gradients of different drugs can be monitored (Choudhury et al., 2012).
Within microfluidic devices extra cellular matrix (ECM) can be mimicked. This aspect is
primary, since cell attachments to the ECM are not merely mechanical anchors, but receptors that sense
the biochemistry and mechanics of the environment. The response of cells to gradients of ECM proteins
can be analyzed. For instance, the orientation of the axons of rat hippocampal neurons grown on a
gradient of laminin was analyzed. This gradient was produced using a flow-based gradient (Dertinger et
al., 2002). Three-dimensional photopatterned hydrogels in which cell-adhesive peptides were
incorporated, were used to produce 3D hepatic tissues (Liu Tsang et al., 2007). By means of
microchannels and chambers the migration of cancer stem cells through the interstitial spaces of the brain
can also be mimicked (Huang et al., 2011).
In microfluidic systems the control of gas concentration, a crucial parameter for cells, is possible.
These systems offer a rapid response even if the supply strongly depends on the device geometry,
material, and perfusion conditions. This issue was tackled creating a perfusion bioreactor system that
forms steady-state oxygen gradients (Allen and Bhatia, 2003) or producing multicompartment devices
(Park and Shuler, 2003).
Finally, microfluidic devices allow the precise control of physical parameters (e.g. forces, flow,
temperature, geometry) of the cell microenvironment. In particular, the shear stress acting on bone tissue

Introduction
16
can be mimicked (Leclerc et al., 2006), as well as the leukocyte interaction with a biological substrate
under flow conditions (Schaff et al., 2007).
In special types of microfluidic systems the compartmentalization is possible.
Compartmentalization can be employed to specifically manipulate or analyze different parts of a single
cell. For instance, two-compartment microfluidic system were used to culture polarized neurons with cell
bodies and axons in separate compartments and to study region-specific gene expression after injury
(Taylor et al., 2005). Using a similar device, in which cell bodies and from axons were in two distinct
compartments, the death of axons following chemical insult that mimics neuropathology was analyzed
(Ravula et al., 2007).
Another advantage of these devices is the possibility of coupling them with analytical methods,
such as microscopy, PCR, capillary electrophoresis or biosensors.
All in all, microfluidic devices, even though they are very powerful and precise, require a
different tailor for every specific issue and facilities for their fabrication.
1.2.2 EJECTION
Delivery of small volumes (nanoliters to picoliters) of solutions can be achieved releasing soluble
molecules from glass pipettes by pressure pulses.
In 1992 the use of repetitive pulsatile ejection method was developed to produce microscopic
chemical gradients near the growth cone of embryonic neurons in culture. Micropipettes have a inner
diameter of the tip of 1-2 µm. They are filled with test solution and connected to an electrically gated
pressure application system that controls the delivery. The released volume can be down to 0,3pL (Lohof
et al., 1992). Usually, pipettes are positioned tens-hundreds of micron away from the target cell and hence
the gradient that is generated is broad and not localized on a particular cell structure.
In hydraulically coupled microejection systems, a solution-filled glass micropipette is connected
to a motor-driven, liquid-filled syringe. The volume ejected from the micropipette is the same as the
volume displaced by movement of the syringe plunger. In this way the ejection rate and duration can be
precisely controlled (Pakhomov et al., 2006). Puffer pipettes have a small, sharp tip, which makes them
suitable for applying a small quantity of a compound to a well-defined location. This system has two
shortcomings: solution leaking from the tip of the pipette can contaminate the signal, and it is difficult to
apply more than one test solution exactly to the same local area of the specimen. Due to its relatively easy
handle, the ejection systems are still the most popular in neurosciences (Henle et al., 2011; Thompson et
al., 2011).
Another application system is the “U-tube” system, that has a pressure head of the test solution
applied to one end, and a vacuum head applied to the other end. There is a hole at the base of the U. At
rest, the vacuum and pressure heads are nearly balanced to prevent flow out of the hole. When a switch
blocks the vacuum, the solution in the U-tube flows out of the hole. This out flow can rapidly apply a
compound to a cell positioned next to the hole. A major limitation for neurons stimulation is that the U-
tube hole has a relatively large diameter (Pidoplichko and Dani, 2005) and hence single synapse
stimulation is not possible.
1.2.3 MICROBEADS (BULK APPLICATION)
Pioneer experiments of focal stimulation of cells using functionalized microbeads were
performed by Fan, who coupled an enriched collapsin-containing preparation made from chick brains to
1µm large beads (Fan and Raper, 1995). Later on, Nerve growth factor (NGF) was covalently bound to

Introduction
17
polystyrene beads (Gallo et al., 1997). The diameter of the beads was 10 µm in this case. Functionalized
beads were then added to the cell culture in bath and the effect of a localized source of neurotrophins on
growth cone guidance was studied.
Afterwards, 10 µm large Brain-Derived Neurotrophic Factor-coated beads were used by Zhang in
Xenopus nerve-muscle cultures to show that a single bead in contact with the pre-synaptic axon resulted
in potentiation of transmitter secretion and in a persistent local elevation of Calcium (Zhang and Poo,
2002). In these experiments, beads were manipulated using a micropipette.
The use of microbeads coated with neurotrophins became then popular. Beads were not only used
to locally stimulate dendrites (Yoshii and Constantine-Paton, 2007) but also to analyse the effect of the
protein of interest at the membrane level (MacInnis and Campenot, 2002). The retrograde transport of the
neurotrophin, when this is covalently bound to a bead, is indeed prohibited.
Larger beads (75-300 µm) heparin-coated beads soaked with the molecule of interest have been
proposed for single cell chemotaxis assays. A gradient of diffusing molecules is generated around the
bead and cell movement can be analyzed (Theveneau and Mayor, 2011). The large dimension of the
beads allows their manipulation with tweezers or eyebrow knife.
1.2.4 UNCAGING
The idea behind the caging technique is that a molecule of interest can be rendered biologically
inert (or caged) by chemical modification with a photoremovable protecting group. Illumination with the
appropriate light, results in a concentration jump of the biologically active molecule that can bind to its
cellular receptor, switching on (or off) the targeted process (Ellis-Davies, 2007). Uncaging, in particular
when coupled with two-photon microscopy, can be temporally and spatially defined, intracellular or
extracellular, and controlled by chancing the amplitude or the frequency of the stimulus (Berridge et al.,
1998; Ellis-Davies, 2011). Stimulation with this technique can activate neurons at a single dendritic spine
level in a way that closely resembles synaptic activity.
Many different compounds are commercially available. They can be divided into four main
categories: Calcium chelators, neurotransmitters (Glutamate, GABA, carbamoylcholine), phosphates (IP3,
cAMP, ATP) and fluorophores (fluorescein) (Ellis-Davies, 2007). A drawback is that most of the caged
compounds turned out to produce undesired effects, being able to block both glycine and GABA
receptors (Canepari et al., 2001).
Moreover the caging of peptides and macromolecules is not so straightforward. There are no
general schemes that can be adopted for their design and the activity of the compound should be tested for
every specific situation. As a result, the applications of protein caging are still limited. Among the
strategies that have been adopted for the caging of proteins there are:
Single amino acid mutagenesis (Mendel, 1991);
Protein ligation to assemble a caged semi-synthetic protein (Muralidharan and Muir, 2006);
Site-specific crucial modification with a small caging molecule (Walker et al., 1998);
Addition of a peptide at the N- or C-terminus via a photocleavable cross-linker (Bosques and
Imperiali, 2003);
Genetically encoded fusion protein that can be reversibly activated (Wu et al., 2009);
Antibody caging (Kossel et al., 2001).

Introduction
18
In this latter case, in particular, an antibody against BDNF (see paragraph 2.1.2) was caged. The
authors, were able to demonstrate an effect of the protein in the range of hundreds of microns from the
uncaging point. Thus, the spatial resolution achieved was really low.
Concluding, the use of caged compounds is powerful but it has strong limitations due to the
limited availability of tailored molecules and to the low flexibility. Moreover the instrumentation required
is highly expensive.
1.2.5 AFM
Atomic force microscope (AFM) can be used for the local delivery of molecules in different
ways. The first and simplest approach is to use the AFM tip for delivering and patterning molecules
extremely locally on a surface by means of the so-called Dip-pen lithography (Piner et al., 1999).
More elaborated techniques allow the intracellular delivery of molecules into cells. For instance a
transfection procedure was proposed, in which the AFM tip was decorated with the DNA of interest. The
approach relies on the possibility to reversibly penetrate through the cell membrane with an AFM tip and
without causing permanent damages to the cell or provoking leakage of intracellular fluid, which could
irreversibly alter the cell integrity (Cuerrier et al., 2007).
A less invasive method uses “nanoneedles” placed on the top of the AFM tip. Chen proposed the
use of carbon nanotubes as needles. Nanotubes were functionalized with cargo via a disulfide-based
linker. Penetration of cell membranes with this “nanoneedle” was controlled by the AFM. The following
reductive cleavage of the disulfide bonds within the cells interior resulted in the release of cargo inside
the cells, after which the nanoneedle was retracted by AFM control (Chen et al., 2007). The needle can
also be a etched on the top of the AFM tip, and the molecule of interest adsorbed on the surface (Han et
al., 2008).
Finally, in a recent paper “fluidFM” (fluid force microscopy) was proposed (Meister et al., 2009).
FluidFM has a nanofluidic channel in the cantilever, that allows soluble molecules to be dispensed
through a submicrometer aperture in the AFM tip. An advantage of this technique, is that the delivery can
be both intracellular and at the cell surface.
1.2.6 PHOTOTRANSFECTION
By using ultrashort (femtosecond), high-intensity and tightly focused laser beam, the plasma
membrane of cells can be locally perforated, allowing foreign molecules to enter the cell (Tirlapur and
Konig, 2002). Many different laser wavelength, repetition rate and power have been tested, having as a
readout the synthesis of fluorescent proteins, whose DNA was phototransfected (Stevenson et al., 2010b).
A brilliant application of phototransfection in the local delivery field was proposed by Barrett (2006). She
used this focal transfection procedure to introduce the mRNA of a transcription factor (Elk-1) into
specific regions (dendrites or cell bodies) of live, intact primary rat neurons. The authors demonstrated
that introduction and translation of Elk-1 mRNA in dendrites produced cell death, whereas introduction
and translation of the very same mRNA in cell bodies did not produce cell death (Barrett et al., 2006).
Beside DNA and RNA, also nanoparticles can be introduced inside cells. This nanoparticles can
both carry proteins and be exploited as sensors that permit spectroscopic analyses in real time of different
regions of a living cell (McDougall et al., 2009).

Introduction
19
1.2.7 OPTICAL TWEEZERS FOR MICROENVIRONMENT MANIPULATION
By means of optical tweezers, micrometric objects placed in the focus of the objective can be
transported in a cell culture dish over hundreds of microns and positioned at the desired site with high
spatial resolution.
At the beginning, optical tweezers were used to put a single bead in contact with a specific part of
cell. Usually the aim of these experiments was the investigation of the mechanical properties of the cell
(Dai and Sheetz, 1995; Raucher, 2008; Valero et al., 2008) or the measurement of forces exerted by the
cell (Cojoc et al., 2007; Galbraith and Sheetz, 1999). Positioning of more beads on the same cell is
possible as well. To tackle this issue, however, the use of microreservoir to stock beads is suggested. The
desired number of beads can then be extracted with optical tweezers from the reservoir and positioned on
the target cell (Monneret et al., 2007).
Delivering defined packages of stimuli to single cells with both high spatial and temporal
resolutions exploiting optical tweezers was first proposed by Sun: optical trapping was used to manipulate
individual vesicles that encapsulate the bioactive molecules of interest. Once a selected vesicle is placed
adjacent to the target cell, a single UV-laser pulse, which is aligned with the trapping laser, is used to
photolyze the optically trapped vesicle and to release the encapsulated molecules (Sun and Chiu, 2003).
In their brief communication, the authors released carbachol from single 0.6 µm large vesicle and showed
the response it induced on Calcium levels in epithelial cells overexpressing muscarinic acetylcholine
receptor.
Optical tweezers allow also the setting up of molecular concentration patterns that are
chemically, spatially and temporally flexible by using optically manipulated microsources, which steadily
release molecules. The technique enables the control of molecular concentrations over length scales down
to about 1 µm and timescales from fractions of a second to an hour. The authors demonstrated this
technique by manipulating the motility of single human neutrophils. They induced directed cell
polarization and migration with microsources loaded with a chemoattractant stimulus. Furthermore, they
triggered highly localized retraction of lamellipodia and redirection of polarization and migration with
microsources releasing cytochalasin D, an inhibitor of actin polymerization (Kress et al., 2009).
1.3 DIFFRACTION LIMITED IMAGING
Until not very long ago, it was widely accepted that lens-based (far-field) optical microscopes
cannot visualize details much finer than about half the wavelength of light because of diffraction (Figure
1.3). This limit was revealed by Ernst Abbe in 1873 (Abbe, 1873), who stated:
r= λ/2n sinα= λ/2NA
where “r” is the resolution (minimum distance between two point objects which can be resolved
by the microscope), “λ” is the wavelength of the illuminating light, “n” is refractive index of the medium
between the specimen and the objective, “sinα” is the semi-angle aperture of the objective lens, and “NA”
is the numerical aperture. Along the optic axis, the maximum achievable resolution is even poorer, being
it related to the square of sinα.
Spatial resolution could be improved by employing shorter wavelengths (for live cells imaging
the minimum is around 400 nm, which is in the spectrum of near-UV light) and objectives with a higher
numerical aperture. As a result, the maximum resolution in the focal plane would be 200 nm in x, y and
500 nm along the z axis (Figure 1.3).

Introduction
20
In the Fifties, when fluorescence staining techniques were developed, light microscopy became a
powerful biological tool. Nowadays specific molecules (proteins, DNA, RNA, etc.) can be marked and
imaged using fluorophores. The dimension of cellular organelles is in the range of hundreds of
nanometers – few microns. It can be easily understood why conventional optical microscopy does not
provide a satisfying resolution. Moreover, when looking at proteins, their size is in the range of tens of
nanometers, far smaller than our imaging capabilities.
Figure 1.3: Abbe diffraction limit. The resolution of an optical system is related to the wavelength
used for the illumination (λ), the refraction index of the medium (n) and the semi-angle aperture of the
objective lens (α). The maximum achievable lateral resolution (200 nm) is given by the formula in the
box. In the z-dimension is scales up with the square of sinα and thus it is poorer (500 nm). Modified
from Stefan Hell‟s presentation available at the link
www.biop.dk/biophotonics09/After/Hell/Handout_StefanHell.pdf.
Electron microscopy overcomes these limitations by changing the illumination source
wavelength. Although the achievable resolution is really high (it can be less than 1 nm), electron
microscopy requires a complicated sample preparation. Indeed, specimens should be fixed, dehydrated
and cut in thin sections. It is thus impossible to use this type of microscopy for living cells.
For all these reasons, big efforts have been done in optical microscopy since 60‟s to break the
resolution limit imposed by diffraction.
A first improvement was achieved with confocal microscopy. With respect to normal wide-field
fluorescence microscopy, in which the entire specimen is illuminated, confocal microscope uses a focused
laser beam to illuminate a small part of the sample being observed (Figure 1.4 left) and two optically-
conjugated pinholes. The first one restricts the illumination spot, and the second one is placed in front of
the detector, in a way so that only the light that comes from the focal plane can pass through it (Figure
1.4 right). As only one point in the sample is illuminated at a time, image acquisition requires scanning
of the specimen, both in 2D and 3D.
An alternative to confocal microscopy is two-photon microscopy (Denk et al., 1990), which
provides distinct advantages for three-dimensional imaging, especially within thick tissues such as brain
slices, embryos, and even entire animals.
Two-photon microscopy employs two-photon excitation process, according to which
two photons of comparably lower energy than needed for one photon excitation can excite
a fluorophore in one quantum event (Goeppert-Mayer, 1931). Each photon carries approximately half the
energy necessary to excite the molecule. The probability of the near-simultaneous absorption of two
photons is extremely low and hence a high flux of exciting photons is typically required.
Even if confocal and two-photon microscopy significantly improved the quality of fluorescence
imaging, they are still limited by Abbe‟s resolution equation.

Introduction
21
In the last decades super-resolution techniques that break this limit have been developed. These
techniques will be described in section 2.4.
Figure 1.4: General scheme of a confocal microscope. (Left) In widefield microscopy the whole
specimen is illuminated, while in scanning microscopy only a spot of the sample is exited. From
www.microscopyu.com. (Right) Scheme of a confocal microscope. The exiting laser beam (0-green)
passes through a first pinhole and is focused by the lens. Only emission coming from the focal plane
(0-red) can pass through the pinhole in front of the detection camera. Rays coming from upper (1-
violet) or lower (2-blue) planes are blocked by the pinhole.

Goal of the Thesis
22
GOAL OF THE THESIS
The goal of this Thesis is the development of new techniques to locally change the
microenvironment of biological samples. These techniques should improve the limitations of the currently
available systems and thus should have a high spatial resolution, a high flexibility and handiness, and
finally should be affordable.
The techniques will be validated by tackling different biological issues related to neurobiology.
More in details, two different kind of vectors carrying the molecules of interest will be
developed: microbeads, that allow the focal and prolonged stimulation of cells, and micron-sized
liposomes, through which a gradient of molecules can be generated. A high spatial precision of
stimulation will be achieved using optical tweezers, an instrument that allows the manipulation and
movement of such vectors.
Since optical tweezers allow the manipulation of a sample and its imaging at the same time, a lot
of efforts have been placed also in the development of new live imaging tools (functionalized Quantum
dots) or in the use of innovative imaging techniques, such as far –field optical nanoscopy.
The next part of the Thesis will be organized as follows: the development and the use of beads
and then liposomes will be presented within the appropriate biological frame. Finally, the preparation of
tool to better the imaging will be presented.
Figure 1.5: Goal of the Thesis. Local stimulation of specific neuronal compartments with different
vectors. Both beads with different coatings and micron-sized liposomes are depicted. In the case of
liposomes, the release is achieved by breaking the vesicle with a UV pulse.

Results
23
2. RESULTS
HIGH RESOLUTION OPTICAL MANIPULATION OF
MICRO AND NANO-VECTORS FOR MICRO-
ENVIRONMENT CONTROL
2.1 FUNCTIONALIZED MICROBEADS
Dielectric microbeads are widely used in optical tweezers since they are easy to fabricate and
trap. The main characteristics that make these particles suitable for trapping are: the refractive index and
the symmetric shape. Moreover, beads of almost any dimension and surface functionalization are
commercially available. This means that a molecule of interest can be covalently attached to their surface.
Then, beads can be manipulated at will and put in contact with a cell. The questions are: is this molecule
attached to the surface of the bead still biological active, being it cross-linked and manipulated with an IR
laser? Is it able to bind and activate its cognate receptor present on a cell membrane even if the ligand
cannot be internalized? To answer these questions we used Brain-Derived Neurotrophic Factor (BDNF)
as model system.
2.1.1 FUNCTIONS AND IMPORTANCE OF FOCAL DELIVERY OF BDNF
Brain-Derived neurotrophic factor is a member of the neurotrophins‟ family of proteins (Barde et
al., 1982). Neurotrophins are small secreted proteins that play key roles in the development of nervous
system, since they control survival, differentiation, synaptogenesis, and activity-dependent forms of
synaptic plasticity (Chao, 2003; Chao et al., 2006; Reichardt, 2006). They also mediate additional higher-
order activities, such as learning, memory and behavior.
The importance of BDNF is demonstrated by the fact that knockout mice display severe
abnormalities in the nervous system (Ernfors et al., 1995; Linnarsson et al., 2000) and usually die soon
after birth. Heterozygote mutants have an impaired learning caused by a reduction of LTP (Korte et al.,
1995). Alterations in BDNF levels have been implicated in neurodegenerative disorders, such as
Alzheimer's disease and Huntington's disease, as well as psychiatric disorders, including depression and
substance abuse (Chao et al., 2006).
Neurotrophins are produced as propeptides, with a prodomain followed by the mature
neurotrophins. Thus, each gene product must be processed by proteolysis to form the mature protein
(Mowla et al., 2001). Mature neurotrophin proteins are non-covalently associated homodimers.
The neurotrophins interact with two entirely distinct classes of receptors Figure 2.1:
p75 neurotrophin receptor (p75), which is a low-affinity receptor for mature neurotrophins but
has a stronger affinity for all the proneurotrophins (Frade and Barde, 1998; Rodriguez-Tebar et
al., 1990). Mainly it promotes apoptosis and growth inhibition (Underwood and Coulson, 2008);

Results
24
tropomyosin-related tyrosine kinases receptors (Trk). Three different Trk receptors exist (TrkA,
TrkB, TrkC) and each of them has a different affinity for the mature neurotrophins. Trk receptors
mediate several processes, such as survival, neurite outgrowth and long term potentiation (Chao,
2003; Huang and Reichardt, 2003);
The affinity of Trk receptors for neurotrophins can be regulated by receptor dimerization,
structural changes or association with the p75 receptor (Arevalo et al., 2000; Esposito et al., 2001;
Schecterson and Bothwell, 2010), that can act as a co-receptor for Trk receptors.
Upon ligand binding, Trks dimerize and become catalytically active, resulting in trans-
autophosphorylation. Activated receptors initiate several signal transduction cascades, including mitogen-
activated protein kinase (MAPK) pathways (which promotes neuronal differentiation), the
phosphatidylinositol 3-kinase (PI3K) pathway (which promotes survival and growth of neurons and other
cells), and the phospholipase Cγ(PLC-γ) pathway (which promotes synaptic plasticity) (Kaplan and
Miller, 2000; Patapoutian and Reichardt, 2001). These signaling pathways culminate in the activation of
transcription factors that alter gene expression (Figure 2.1).
The signals generated by the two neurotrophins receptors can either augment or oppose each
other, regulating almost all aspects of neuronal development and function, including precursor
proliferation and commitment, cell survival, axon and dendrite growth, membrane trafficking, synapse
formation and function, as well as glial differentiation and interaction with neurons.
The responsiveness and specificity of responses are determined by the ability of Trk and p75 to
present different binding sites and affinities to particular neurotrophins. The ratio of receptors is important
in dictating the numbers of surviving cells, and interactions between them provide another level of
regulation (Chao, 2003).
The effects of neurotrophins can be also modulated by the subcellular location of the
neurotrophin-receptor complex. Signaling locally was shown to regulate growth cone motility, while
signaling in the cell soma controlled cell survival and gene expression (Reichardt, 2006). In this latter
case, neurotrophins can be internalized by the target cell into vesicles, the so-called “signaling
endosomes” (Grimes et al., 1996), which are transported to the cell body. Activated Trks initiate signaling
throughout the transport process, both in the axons and at the cell body and hence signaling endosomes
should be capable of engaging multiple second messenger cascades. Difference in the gradient of these
molecules along the axons may thus activate different pathways, which in turn lead to different outcomes
(Heerssen and Segal, 2002).
A further level of complexity is given by the kinetics of activation of the receptors. A receptor
may be acutely activated by an immediate increase in ligand concentration as a result of its regulated
secretion or it may experience a gradual increase in the concentration, when the ligand is secreted from a
distant source. The control of the kinetics of signal transduction may be an important mechanism to
ensure the functional specificity of extracellular factors. Since BDNF is secreted through both constitutive
and regulated secretory pathways (Canossa et al., 1997; Lessmann et al., 2003), Ji and colleagues used it
as a model to study the effects of different delivery kinetics. In cultured rat hippocampal neurons, acute
and gradual increases in BDNF elicited transient and sustained activation of TrkB receptor and its
downstream signaling, respectively, leading to differential expression of two downstream target genes
(Homer1 and Arc). Transient TrkB activation promoted neurite elongation and spine head enlargement,
whereas sustained TrkB activation facilitated neurite branch and spine neck elongation. In hippocampal
slices, fast and slow increases in BDNF enhanced basal synaptic transmission and LTP, respectively.
Thus, the kinetics of TrkB activation is critical for cell signaling and functions (Ji et al., 2010).

Results
25
Figure 2.1: Neurotrophins' receptors and signaling pathways. Upper panel: Neurotrophin binding
results in dimerization of each receptor. Neurotrophin binds selectively to specific Trk receptors,
whereas all neurotrophins bind to p75. Each receptor activates several signal transduction pathways.
Interactions between Trk and p75 receptors can lead to changes in the binding affinity for
neurotrophins. Lower panel: intracellular signaling pathways and their responses. Trk receptors
mediate differentiation and survival through extracellular signal-regulated kinase (ERK),
phosphatidylinositol 3-kinase (PI3K) and phospholipase Cγ (PLCγ). p75 signals to active NF-κB and
Jun N-terminal kinase (JNK) and affects apoptosis, survival, neurite elongation and growth arrest.
From Chao, 2003.
Finally, neurotrophins have different effects on specific cellular compartments. In visual cortex,
not only each layer responds in a different way to a specific neurotrophin, but also within the same layer,
neurons respond with a distinct constellation of dendritic changes (McAllister et al., 1995). For instance,
the effect of BDNF on layer 6 of visual cortex changes between basal and apical dendrites. More in detail,
BDNF increases dendritic growth in layers 4 and 5, and decreases it in layer 6. In this latter layer,
however, the negative effect is observed only on basal dendrites. On apical dendrites BDNF has weak
Results
26
positive effect. This distinction can be explained with structural and functional differences between apical
and basal dendrites, that lead to diverse responses to the same extracellular signal.
Overall, the development of techniques that allow the delivery of neurotrophins and BDNF in
particular in a spatially and temporally defined way may help the understanding of the complex cellular
responses. In many occasions, indeed, bath application of molecules led to different experimental
outcomes and does not unveil the signaling pathway that are effectively activated in physiological
conditions in a specific subcellular compartment, with its peculiar characteristics.
2.1.2 LOCALIZED DELIVERY OF BDNF
Several attempts to achieve local control of neurotrophins concentration have been proposed. The
use of caged antibody against BDNF, through which a decrease in potentiation for several synapses has
been obtained in the range of hundreds of microns from the uncaging point (Kossel et al., 2001), was
previously mentioned in section 1.2.4.
Another method that uses of neurotrophin donor-recipient pairs of neurons (Horch and Katz,
2002) was proposed. Authors produced “donor neurons” in ferret cortex brain slices that co-expressed
BDNF and red fluorescent protein (RFP). Using two-photon microscopy, they analyzed their effects on
“recipient neurons” that expressed green fluorescent protein (GFP) alone and demonstrated that BDNF
release from dendrites and cell bodies acts directly on nearby recipient neurons to increase dendritic
branching in a distance-dependent manner.
The approach that exploits micropipettes and Picospritzer delivery was also considered for
BDNF. Li and colleagues (Li et al., 2005) produced a microscopic gradient of BDNF by pulsatile
application of BDNF-containing solution with a micropipette near growth cones of cerebellar granule
cells. This system permitted to demonstrate that the chemoattractive turning effect of BDNF on growth
cones requires Calcium elevation and TRPC (transient receptor potential canonical) channel.
Micropipettes delivery was used also to demonstrate that in developing hippocampal neurons focal
application of BDNF evoked fast and local dendritic Calcium transients. These transients required
activation of TrkB receptors as well as activation of voltage-gated sodium and Calcium channels (Lang et
al., 2007).
As we already mentioned, also coated beads (Naka et al., 2004; Yoshii and Constantine-Paton,
2007; Zhang and Poo, 2002) were used to deliver BDNF and potentiate the nearby synapses (Yoshii and
Constantine-Paton, 2007; Zhang and Poo, 2002). Beads, however, were simply dropped in the culture
dish or manipulated with pipettes.
2.1.3 MATERIALS AND METHODS
2.1.3.1 CELL CULTURES
Primary hippocampal neurons were prepared from P0-P1 rats as described before (Tongiorgi et
al., 1997) with slight modifications. Cells were plated on Poly-Ornithine and 2% Matrigel (BD
Biosciences) coated homemade glass bottom Petri dishes at a density of 105cells/mL per dish. Neurons
were cultured for at least 5 days in a 5% CO2-humidified incubator, in Minimum Essential Medium with
Earle‟s salts and Glutamax I (MEM, Life Technologies, Invitrogen) with 10% FBS (Gibco), 35 mM D-
glucose (Lancaster), 14 mM Hepes (Sigma), 1 mM vitamin B12 (Sigma), 0.36 mM d-Biotin (Sigma), 30
μg/mL insulin (Sigma), 100 μg/mL bovine transferrin (Sigma), and antibiotics (Euroclone). The medium
was changed every 2 days from the second day in culture onwards.

Results
27
2.1.3.2 BEADS FUNCTIONALIZATION
1,5 μm large silica beads coated with COOH groups (Kisker-biotech, cat. PSi-1.5COOH) were
functionalized using PolyLink Protein Coupling Kit (Bangs Laboratories Inc., cat. PL01N) following the
manufacturer‟s protocol. Briefly, about 1,4 x 10⁵ beads were incubated with 500 ng of BSA or BDNF in
presence of 20 μg/μL EDAC for 1 hour at room temperature and stored in Storage Buffer at 4°C.
2.1.3.3 ELISA
ELISA test was performed using BDNF Emax® ImmunoAssay Systems (Promega, cat. G7611) and
following the manufacturer‟s protocol. Supernatants diluted 1/10 obtained after beads functionalization
and three washes were analyzed. Release of BDNF was tested also after treatment of beads in different
conditions, i.e. normal storage at 4°C, 1 hour at 37°C or 5 min at 100°C. This latter condition was also
used to test whether the immunoassay was able to detect the protein after it was boiled.
2.1.3.4 IMMUNOHISTOCHEMISTRY
Coated microspheres were washed in PBS and incubated for 1 hr at room temperature with anti-
BDNF or anti-BSA (both 1:50, Sigma). Beads were then centrifuged, washed and incubated for 30 min at
room temperature with anti-rabbit Alexa 488 (Invitrogen) and finally analyzed using confocal microscopy
(Nikon C1-Si).
For pTrkB and c-Fos analysis, neurons were incubated either with functionalized beads, BDNF
50ng/mL or K252a 200nM for 15min. Neurons were then washed in PBS, fixed in PFA 4% for 15 min,
permeabilized with Triton X-100 0,1% for other 15 min and then incubated with primary antibodies (anti-
c-Fos antibody 1:50, Lab Vision; and anti-BDNF 1:50, Sigma; anti-BSA 1:50, Sigma; anti-pTrkB 1:250,
kind gift of M.V. Chao) in PBS in presence of 2% NGS for 2 hr at room temperature. After washing them
in PBS, they were incubated for 1 hr at room temperature with anti-rabbit Alexa (488 or 568) or anti-
mouse Alexa (568 or 647) (Invitrogen), 5 min with Hoechst and mounted in Mowiol. In the pTrkB
experiments actin was marked using phalloidin FITC (Sigma cat. P8252) 15min. For data analysis of the
c-Fos experiments, the neurons touched by the beads and the neurons un-touched (untreated) were
classified in c-Fos positive and c-Fos negative, according to the nuclear staining. The percentage of c-Fos
positive untreated neurons was normalized to 1.
2.1.3.5 OPTICAL MANIPULATION
A custom optical tweezers setup was built on a mini breadboard MS12B (Thorlabs, USA) and
coupled to the lateral port of an inverted microscope Nikon TE-300 (Figure 2.2) in the Molecular and
Cellular Neuroanatomy Laboratory at the University of Trieste. The setup could be easily implemented to
all inverted microscopes with more output ports and quickly removed or mounted if necessary. The laser
trapping beam (1064 nm) from an Ytterbium fiber laser YLM-5 (IPG Photonics, USA) was focused by a
convergent lens (L1, fL= 200 mm) into the lateral port (LP) plane of the microscope. The trapping beam
was then collimated by the microscope tube lens (TL) and focused by the microscope objective (60X, 1.4
NA, Nikon) onto the sample. The sample imaging before and during trapping was accomplished on an
external camera (WAT1000, Watec LTD, Japan) using a relay lens (L2, fL= 60 mm). The vectors were
loaded in square capillaries with 50 μm inner size (VitroCom, US, cat. 8505), which were used as
reservoirs. They were pre-treated with 1% BSA to reduce beads binding to the walls.

Results
28
Figure 2.2: Optical manipulation and Calcium imaging experimental setup. A custom optical
tweezers setup (red box) is coupled to the lateral port (LP) of the inverted microscope Nikon Eclipse
TE300 (blue box). The colors indicate the different optical paths: trapping beam in red, transmission
in yellow, fluorescence in green. During trapping the sample is imaged on CCD-1 camera, using the
relay optics (L2). Calcium imaging is recorded on CCD-2 camera, turning out the microscope mirror
(M). L1, L2 - Lenses; M - Mirror; DM - Dichroic Mirror; TL - Tube Lens; OB - Objective (60x
PlanApo NA 1.4); CCD - Charge Coupled Device; IR-F - Infrared filter; Fex - Excitation Filter. Inset:
Layout of beads manipulation. Two reservoirs, one with BSA beads (blue) and the other with BDNF
beads (red) are laid on the bottom of the cells chamber. A BSA-bead is trapped inside the reservoir
and then pulled out and positioned at the desired site of the cell by moving the stage of the
microscope. The same sequence is repeated to trap and position the BDNF-bead from the second
reservoir. From D'Este et al., 2011.
To bring a single functionalized bead to the desired sites on a neuron, we used the custom optical
tweezers setup described previously (Figure 2.2). The laser beam of 1064 nm wavelength was focused by
a lens and reflected by a mirror and a dichroic mirror into the lateral port of the microscope. The tube lens
of the microscope collimated the beam which was then focused on the sample by the objective 60x (NA
1.4, oil immersion). During trapping, the sample was imaged using a first camera (CCD-1). After beads
positioning on the cells, achieved by optical manipulation, the mirror inside the microscope was switched
vertically to allow fluorescence and transmission imaging through the direct port below the microscope,
on a second more sensitive CCD camera (CCD-2).
Since the optical trap remained fixed, its relative position to the sample-cell could be changed by
moving the stage of the microscope (Figure 2.2 inset). BSA- and BDNF-coated beads were prepared and
stored separately in small reservoirs (square capillaries, 50μm inner size). The capillaries were laid on the
bottom of the cell culture dish. Single beads were optically trapped inside the reservoirs, pulled out and
then positioned with sub-micrometric resolution to desired sites on the neurons selected for stimulation
(Figure 2.2 inset).

Results
29
2.1.3.6 GROWTH CONE MOBILITY
The experiments on growth cones were performed on 1 DIV (day in vitro) hippocampal neurons
using a 100x 1.4 NA oil immersion objective (Nikon) equipped with DIC (differential interference
contrast) imaging. Images were collected for 5 minutes every 20 seconds before the stimulation and 40
min at the same frame rate after stimulation.
2.1.3.7 CALCIUM IMAGING
Fluorescence and transmission images were recorded by a second cooled video camera (CCD-2)
(Sensicam, PCO Imaging, Germany) located at the bottom port of the microscope. Fluorescent dye used
was Fluo-3, AM Ester (Biotium, Inc, USA). Neurons were incubated for 40 min with 7mM Fluo-3 prior
to use. Images were acquired every 2min with the Sensicam camera. Analysis was performed using NIH
Software ImageJ (http://rsbweb.nih.gov/ij/index.html). Every stack was normalized by its background and
then all values were normalized to the first stack after bead placement. For the analysis of dendrites,
measurements were taken on segments of 20 μm length, centered on the bead position.
2.1.4 RESULTS
We tested the possibility of using functionalized, optically manipulated microbeads for the local
stimulation of cultured hippocampal neurons. First of all, the coating and the biological activity of our
vectors was tested following bulk application. Subsequently, we demonstrated the possibility of
extracting a single bead from a reservoir, position it on the desired cellular compartment and induce a
response. In particular, the effects of manipulated microbeads on growth cone navigation and on Calcium
levels were studied.
2.1.4.1 BIOLOGICAL ACTIVITY OF FUNCTIONALIZED BEADS
Microspheres are most frequently used in biology and beads of different materials with different
sizes and functionalizations are commercially available. For our experiments we chose silica beads coated
with carboxylic groups, because they can be cross-linked with a variety of proteins and have a refractive
index (1.45 against 1.33 of water) that makes them suitable for optical trapping. The dimension selected
was 1.5 μm in diameter, which is similar to the width of dendrites and can be easily visualized in
transmission microscopy. We cross-linked either BDNF or BSA as a control to the spheres. The
carboxylic groups present on the beads surface formed an amide bond with the amine of the proteins in
presence of the coupling reagent EDAC (1-Ethyl-3-(3-dimethylaminopropyl) carbodiimide). The reaction
was performed in a large excess of protein in solution and thus we can assume that the coating has a high
density of proteins. In this way the effect observed is not dependent of the number of ligands but of the
number of receptors present on the cell surface. Coating of the bead surface was tested by
immunofluorescence with anti-BDNF or anti-BSA antibodies (Figure 2.3a). Neither primary nor
secondary antibodies attached on untreated beads, confirming that the signal observed on the
functionalized beads was specific. Since the amide bond between BDNF and silica is very strong, the
only possible source of BDNF leakage is due to molecules adsorbed but not covalently linked to the bead
surface. To rule out this possibility of leakage from the beads, we also performed an ELISA assay. Free
BDNF was found at the end of the functionalization process and in the first wash but was absent in the
following washes. BDNF-functionalized vectors were also stored at 4°C for a week or kept 1 hour at
37°C to mimic the conditions that will be used in the experiments. The protein was undetectable in the
supernatants of these samples, showing the absence of protein leak from the beads (Figure 2.3a). Since
BDNF occurs as a dimer, we finally tried to separate the monomers by boiling beads for 5 min. In these
conditions the dimers in which only one molecule is covalently bound to the bead should separate and

Results
30
thus be detected. We again did not detect any signal. We can thus state that BDNF never detaches from
the surface of microspheres during the in vitro experiments.
Figure 2.3: BDNF-coated beads trigger TrkB signaling pathway. (a) ELISA assay on the supernatants
(1/10 dilution) of beads collected right after the functionalization, the washes or the indicated
conditions. Dashed line indicates the threshold of sensitivity on the test (ND – not detectable).
Immunofluorescence images of BSA- and BDNF- beads (left) and of non-functionalized beads (NF)
(right) incubated with the corresponding primary antibodies are shown at the up-right corner. Scale
bar 1 μm. (b) Confocal microscopy images showing that no activation of the TrkB (pTrkB) is
detectable for the control (untreated neurons) or BSA-coated beads (images on the left, scale bar 15
μm) while TrkB is phosphorylated (red dots) for the neurons incubated with BDNF 50ng/mL or
BDNF-beads (images on the right). Magnified images at the bottom show the difference between the
pTrkB induced by BSA and BDNF coated beads. The actin is marked by phalloidin (green) while the
BSA and BDNF in blue. (c) Neurons touched by BSA (left) and BDNF (right) beads have negative
and respectively positive nuclear staining for c-Fos. Enlarged images of the region surrounding the
beads are shown in insets. Rat hippocampal neurons P0-1, 6 days in vitro, prepared as described in
methods have been used. Scale bars 10μm. (d) c-Fos positive neurons for different treatments were
counted. Untreated cells mean of the counts per experiment, nmean=705. BSA-beads (control) nmean=91,
BDNF-beads nmean=94, BDNF-beads+K252a nmean=68. The last three bars refer to bath experiments:
vehicle nmean=414, BDNF 50 ng/mL nmean= 463, K252a 200nM nmean=779. P-value: *<0.05. Analysis
performed with one-way ANOVA. From D'Este et al., 2011.
Since the amide bond between BDNF and silica is very strong, the only possible source of BDNF
leakage is due to molecules adsorbed but not covalently linked to the bead surface. To rule out this
possibility of molecules release from the beads, we performed an ELISA assay. Free BDNF was found at

Results
31
the end of the functionalization process and in the first wash but was absent in the following washes.
BDNF-functionalized vectors were also stored at 4°C for a week or kept 1 hour at 37°C to mimic the
conditions that will be used in the experiments. The protein was undetectable in the supernatants of these
samples, showing the absence of protein leak (Figure 2.3a). Since BDNF acts most of the times as a
dimer, we finally tried to separate the monomers by boiling beads for 5 min. In these conditions the
dimers in which only one molecule is covalently bound to the bead should separate and thus be detected.
We again did not detect any signal. We can thus state that BDNF never detaches from the surface of
microspheres during the in vitro experiments.
Figure 2.4: Growth cone motility. DIC images showing different effect induced by BSA- and BDNF-
coated beads respectively. (Upper panel) A BSA coated bead positioned by optical manipulation on
the filopodia does not affect the motility of the growth cone. (Lower panel) The BDNF coated bead
stimulates the neurite development. The first image for each case shows the neuron 5 min before the
bead placement. Scale bar 2 μm. From D'Este et al., 2011.
In 1986, Rosenberg et al. reported loss of biological activity of neurotrophins if their surface
lysines residues were modified (Rosenberg et al., 1986). More recent works, however, used COOH-beads
functionalized with BDNF or Nerve Growth Factor (NGF) and reported a biological effect (Gallo et al.,
1997; Yoshii and Constantine-Paton, 2007; Zhang and Poo, 2002). Hence, we used the same reaction to
couple BDNF on the COOH-beads and we tested whether after immobilization, BDNF maintained its
biological function, i.e. it was able to activate TrkB receptor. TrkB activation was first demonstrated by
incubating neurons with beads and visualizing TrkB phosphorylation by immunofluorescence (Figure
2.3b). pTrkB dots were barely visualized in control cultures (untreated or incubated with BSA-beads)
while a strong activation of the receptor was observed for the stimulated cells with BDNF (bath applied or
bound to the microspheres). A particularly striking finding, was the observation of spatially restricted
activation of pTrkB on the dendrites right under the beads (Figure 2.3b) which supports the effectiveness
of this methodology in inducing a local stimulation of BDNF signaling. Since in our system we assume
no neurotrophins internalization and TrkB phosphorylation alone is not sufficient to demonstrate the
activation of the intracellular signaling pathway (Du et al., 2003), we analyzed the levels of c-Fos within
the nucleus by immunofluorescence (Finkbeiner et al., 1997)(Figure 2.3c). Neurotrophins, are known to
induce the immediate-early gene c-Fos by pathways that do not require new protein synthesis (Sheng et
al., 1990). The amount of cells not in contact with beads (untreated) was normalized to 1. Neurons

Results
32
contacted by BSA-beads showed nuclear levels of c-Fos similar to untreated neurons (0,98±0,23 s.e.),
while BDNF-beads induced a marked increase in nuclear c-Fos with respect to untreated neurons
(1,38±0,07; p-value 0,008) and with respect to BSA-beads (p-value 0,019) similarly to the effect induced
by bath-applied BDNF (1,72±0,02)(Figure 2.3d). Incubation of neurons with the Trk inhibitor K252a
abolished the effect observed (0,96±0,17), indicating a specific TrkB involvement. These results
demonstrated the possibility to use BDNF-coated beads as microvectors for local stimulation of neurons,
since even a single bead was able to activate BDNF receptor and induce a cellular response.
Finally we analyzed the effect of our vectors on the growth cone development since BDNF is a
key mediator of axonal guidance (for a review Shen and Cowan, 2010). Bead manipulation was achieved
as previously explained (paragraph 2.1.3.5). While BSA-beads did not influence the growth of these
structures (Figure 2.4), BDNF-beads were able to affect the development of the growth cones guiding the
migration of lamellipodia and filopodia (Figure 2.4).
2.1.4.2 EFFECT OF BATH APPLIED BDNF
TrkB is known to activate PLCγ1 which produces IP3, leading to Ca2+
release from internal stores
(Reichardt, 2006). Hence, to obtain the experimental evidence that stimulation of the BDNF/TrkB
pathway after bead manipulation with optical tweezers had occurred, we measured Calcium levels in
neuronal soma and dendrites. To make sure that stimulation with BDNF could produce measurable
Calcium signals in our experimental system, we carried out a first experiment with bath application of
BDNF 50 ng/mL. Basal fluorescence of neurons loaded with Fluo-3 dye was monitored for 10 minutes,
acquiring images every 2 minutes. BDNF was then bath-applied and fluorescence was recorded for 40
minutes. A rapid raise of the Calcium signal both in soma and dendrites was observed after the
stimulation (Figure 2.5a). A plot of the normalized fluorescence values showed this progressive increase
in Calcium signal which reached a plateau at about 15 minutes after BDNF stimulation in both soma and
dendrites (Figure 2.5b).
2.1.4.3 DENDRITES STIMULATION WITH SUB-MICROMETRIC RESOLUTION
For focal stimulation experiments, we first placed a BSA-bead on a dendrite and recorded basal
Fluo-3 fluorescence for 10 minutes, acquiring images every 2 minutes. A BDNF-coated bead was then
positioned on another dendrite of the same neuron, at the same distance from the soma, and fluorescence
images were acquired every 2 min for a period of 40 min, as done for bath application. An example of the
stimulation of Ca2+
signaling induced in a pyramidal neuron is illustrated in Figure 2.6. To assure that the
contact between the beads and dendrites had occurred, transmission images in phase contrast were
acquired immediately after positioning the beads (Figure 2.6, t= -10‟ and t=0‟). Only a low Ca2+
signal
fluctuation was observed after BSA-bead positioning (t= -9‟; t= -5‟; t= -1‟). On the contrary, the
fluorescence signal clearly increased in the cell body after positioning the BDNF-bead. Moreover, a
difference in the signal obtained from the two stimulated dendrites was recognized, indicating a selective
activation of the BDNF-stimulated neurite (Figure 2.6, inset).
To rule out the possibility that the effect observed with BDNF-beads could be due to the
mechanical stimulation of the dendrites, we ran a set of control experiments in which a pair of BSA-beads
was positioned on two different dendrites of the same neuron. An example of time lapse analysis of
Calcium fluorescence is illustrated in Figure 2.7, showing an almost constant Calcium level, and hence
non-activation of the TrkB receptor for a pair of BSA-beads. After positioning the first BSA-bead (BSA-
1), the curves of the control and experimental groups of cells were overlapping (Figure 2.8a). When the
second bead was coated with BSA (BSA-2) there was no increase in Calcium levels in the soma, but

Results
33
Figure 2.5: The effect of BDNF bath administration. BDNF 50ng/mL induced an increase of Calcium
levels. (a) Transmission image of a neuron and its fluorescence levels in false colors. BDNF
application is indicated by the arrow. (b) Normalized Calcium levels in soma (n=10) and dendrites
(n=16). Scale bar 10 μm. From D'Este et al., 2011.
Figure 2.6: Focal stimulation of primary rat hippocampal neurons by optically manipulated
functionalized beads. Activation of BDNF-dependent Calcium signaling pathway. A BSA-bead was
placed at 35,5 µm from soma (first transmission image), as schematically depicted on the left (t=-10‟).
Raw Calcium levels detected by Fluo-3 fluorescence are visualized in false colors at the indicated

Results
34
times (selection from the image sequence acquired every 2 min). A BDNF-bead was then placed at the
same distance from the cell body (t=0‟). The fluorescence images show a clear increase in Calcium
levels within the cell body. In the inset, enlargement of dendrites 9 and 30 min after stimulation
clearly showing a difference between the two stimulated dendrites. Arrows indicate high Calcium
concentration. Scale bar 15µm. From D'Este et al., 2011.
when the second bead was coated with BDNF, the curves began to split showing a sudden increase in
somatic Calcium levels (Figure 2.8a). A binning of values between -10 to 0, 1 to 10, 15-25 and 30 to
40minutes outlines this difference, having a significant p-value (<0,001) for the last two sets of times
(Figure 2.8b). The effect on Calcium levels obtained with local application of BDNF, was similar to that
observed after bath application of 50ng/mL BDNF (Figure 2.8b). These results suggest that there was a
strong activation of neurons induced by BDNF-functionalized beads, further confirming that BDNF
immobilized on the bead surface was active and able to stimulate an intracellular signaling cascade.
Figure 2.7: Focal stimulation with two BSA-coated beads. Similar to Figure 2.6 except that two BSA
beads were placed instead of a BSA- followed by BDNF-bead. Calcium levels, represented in false
colors, remain almost constant showing non-activation of the TrkB receptor. Scale bar 15μm. From
D'Este et al., 2011.
To determine if this method allows for local stimulation of TrkB-signaling in the cell periphery,
we carried out a semi-quantitative analysis of Calcium levels in dendrites. BSA-beads did not alter
Calcium concentration and the curves of the two dendrites in control experiments were superimposed at
all times, demonstrating that there was no activation due to the mechanical stimulation of neurons or
effects produced by BSA itself (Figure 2.8c, d). On the contrary, dendrites stimulated with BDNF-beads
showed increased Calcium levels and, at 15 and 25 min after placement of the second bead, a statistically
significant difference with respect to dendrites in contact with the BSA-bead, (Figure 2.8e, f; p=0.002).
These results indicate selective TrkB activation only in dendrites in contact with BDNF-beads. In
dendrites, Calcium signals showed a different kinetic behavior with respect to soma, starting about 10
minutes after the stimulation with the neurotrophin-coated bead, but like in the soma, were prolonged in
time. Interestingly, in the last 10 minutes of the experiment a rise in Calcium concentration, probably
caused by ion diffusion, was observed also in the first dendrite stimulated with BSA. This was not

Results
35
surprising since the whole cell (and thus also the control dendrite) was activated, as indicated by the large
increase of Ca2+
in the soma.
Figure 2.8: Neurons stimulation with BDNF- beads increase Ca2+
levels while BSA- beads do not.
(a,b) Normalized values of Calcium levels measured in the cell body of the neurons stimulated with
two subsequent BSA-beads (BSA-1+BSA-2) (n=5) or with a BSA- and then a BDNF-bead (BSA-
1+BDNF) (n=4). Arrows indicate the moment of second bead placement. A clear divergence is
observed immediately after placing the second bead. (b) Binning of values represented in (a) at the
indicated time gaps underlies the differences observed. (c, d) Normalized values of Calcium levels
measured along the two dendrites (10μm before and after each bead) both stimulated with BSA beads
and (d) binning of data. The two curves are almost identical for all the times. (e, f) Same as (c, d) but
for dendrites stimulated with BSA and then BDNF. Calcium levels increased in dendrite-2 about 10
min after stimulation and values are statistically different between 15 and 25 min. P-value: **<0.005;
***<0.001. Analysis performed with one-way ANOVA. From D'Este et al., 2011.
2.1.5 DISCUSSION
Since neurons are morphologically and functionally complex cells and the cellular response to a
particular stimulus, critically depends on how and where it is delivered (Reichardt and Mobley, 2004),
local stimulation has always been an objective in neuroscience. Already in the „70s Campenot noticed a
specific local effect of the neurotrophin NGF on distal neurites causing their growth while local NGF was
not required at the somas and proximal portions of the neurites (Campenot, 1977). Later, a different
response of basal and apical dendrites to the same bath applied neurotrophin was demonstrated
(McAllister et al., 1995). More recently, also the effect induced by different kinetics in neurotrophins
administration was explored (Ji et al., 2010; MacInnis and Campenot, 2002) and differences in the
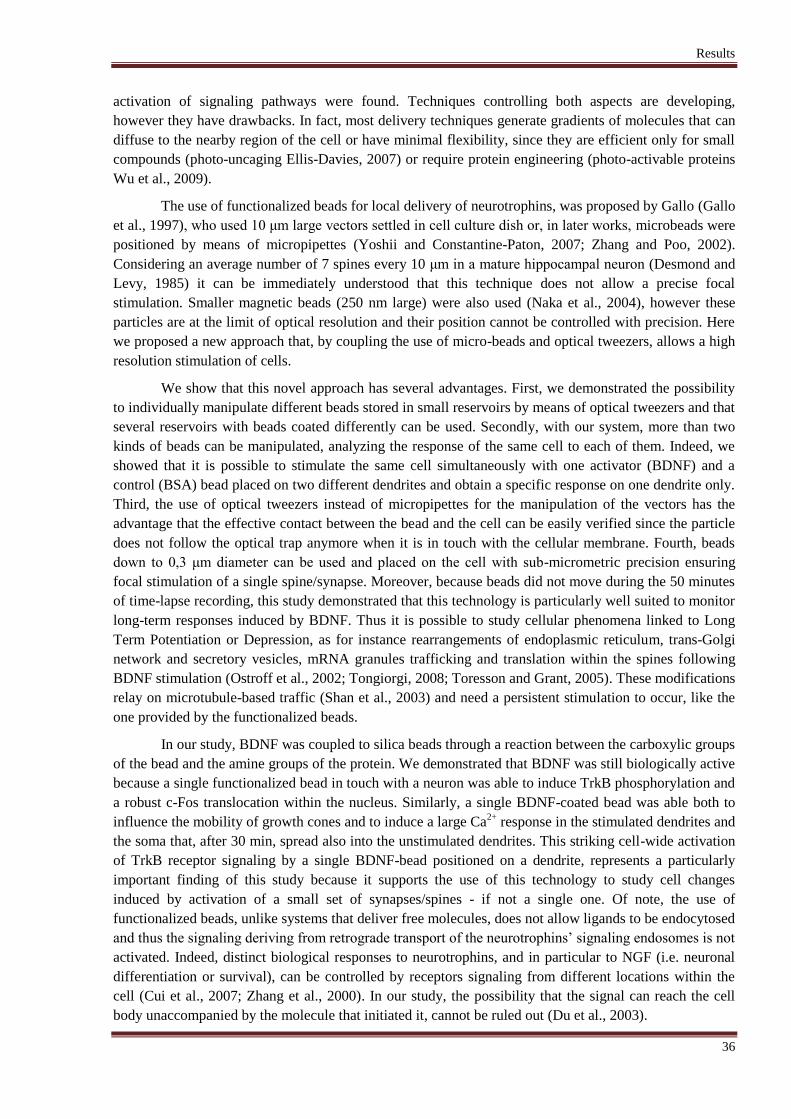
Results
36
activation of signaling pathways were found. Techniques controlling both aspects are developing,
however they have drawbacks. In fact, most delivery techniques generate gradients of molecules that can
diffuse to the nearby region of the cell or have minimal flexibility, since they are efficient only for small
compounds (photo-uncaging Ellis-Davies, 2007) or require protein engineering (photo-activable proteins
Wu et al., 2009).
The use of functionalized beads for local delivery of neurotrophins, was proposed by Gallo (Gallo
et al., 1997), who used 10 μm large vectors settled in cell culture dish or, in later works, microbeads were
positioned by means of micropipettes (Yoshii and Constantine-Paton, 2007; Zhang and Poo, 2002).
Considering an average number of 7 spines every 10 μm in a mature hippocampal neuron (Desmond and
Levy, 1985) it can be immediately understood that this technique does not allow a precise focal
stimulation. Smaller magnetic beads (250 nm large) were also used (Naka et al., 2004), however these
particles are at the limit of optical resolution and their position cannot be controlled with precision. Here
we proposed a new approach that, by coupling the use of micro-beads and optical tweezers, allows a high
resolution stimulation of cells.
We show that this novel approach has several advantages. First, we demonstrated the possibility
to individually manipulate different beads stored in small reservoirs by means of optical tweezers and that
several reservoirs with beads coated differently can be used. Secondly, with our system, more than two
kinds of beads can be manipulated, analyzing the response of the same cell to each of them. Indeed, we
showed that it is possible to stimulate the same cell simultaneously with one activator (BDNF) and a
control (BSA) bead placed on two different dendrites and obtain a specific response on one dendrite only.
Third, the use of optical tweezers instead of micropipettes for the manipulation of the vectors has the
advantage that the effective contact between the bead and the cell can be easily verified since the particle
does not follow the optical trap anymore when it is in touch with the cellular membrane. Fourth, beads
down to 0,3 μm diameter can be used and placed on the cell with sub-micrometric precision ensuring
focal stimulation of a single spine/synapse. Moreover, because beads did not move during the 50 minutes
of time-lapse recording, this study demonstrated that this technology is particularly well suited to monitor
long-term responses induced by BDNF. Thus it is possible to study cellular phenomena linked to Long
Term Potentiation or Depression, as for instance rearrangements of endoplasmic reticulum, trans-Golgi
network and secretory vesicles, mRNA granules trafficking and translation within the spines following
BDNF stimulation (Ostroff et al., 2002; Tongiorgi, 2008; Toresson and Grant, 2005). These modifications
relay on microtubule-based traffic (Shan et al., 2003) and need a persistent stimulation to occur, like the
one provided by the functionalized beads.
In our study, BDNF was coupled to silica beads through a reaction between the carboxylic groups
of the bead and the amine groups of the protein. We demonstrated that BDNF was still biologically active
because a single functionalized bead in touch with a neuron was able to induce TrkB phosphorylation and
a robust c-Fos translocation within the nucleus. Similarly, a single BDNF-coated bead was able both to
influence the mobility of growth cones and to induce a large Ca2+
response in the stimulated dendrites and
the soma that, after 30 min, spread also into the unstimulated dendrites. This striking cell-wide activation
of TrkB receptor signaling by a single BDNF-bead positioned on a dendrite, represents a particularly
important finding of this study because it supports the use of this technology to study cell changes
induced by activation of a small set of synapses/spines - if not a single one. Of note, the use of
functionalized beads, unlike systems that deliver free molecules, does not allow ligands to be endocytosed
and thus the signaling deriving from retrograde transport of the neurotrophins‟ signaling endosomes is not
activated. Indeed, distinct biological responses to neurotrophins, and in particular to NGF (i.e. neuronal
differentiation or survival), can be controlled by receptors signaling from different locations within the
cell (Cui et al., 2007; Zhang et al., 2000). In our study, the possibility that the signal can reach the cell
body unaccompanied by the molecule that initiated it, cannot be ruled out (Du et al., 2003).

Results
37
A local Calcium transient caused by local stimulation with BDNF has been reported in literature
(Lang et al., 2007), and it has been demonstrated to be independent from internal stores. This transient is
fast and can be observed only in the first seconds after stimulation. Since in our setup we need to switch
from the camera used for trapping to another camera used for fluorescence imaging, we could not
investigate these events. Indeed we have a time lag of 30 second between the actual bead deposition and
the first frame of live Calcium imaging. Amaral and Pozzo-Miller (Amaral et al., 2007; Amaral and
Pozzo-Miller, 2007) however showed that this signal is able to reach the soma and it induces the
activation of the Calcium-dependent cationic current IBDNF mediated by TRPC3 channels. This current
causes a further increase of Ca2+
also in dendrites in a internal stores dependent manner.
We can speculate a mechanism similar to that described by Amaral and Miller for the effect we
observe, since also the timing is comparable. To explore this hypothesis, our setup needs a further
modification, to allow simultaneous optical manipulation of the microbeads and fluorescence imaging of
neurons. The reported experiments seem to prove no mechanical stimulation of neurons caused by the
beads. However we cannot exclude that a fast, immediate signal was induced by beads (both BSA and
BDNF coated).
In conclusion, here we propose the use of optical tweezers as an approach to stimulate defined
neuronal compartments by manipulating functionalized beads. This technique can be useful to study any
growth factor, hormone or peptide signaling at sub-cellular levels and has several advantages:
it overcomes problems related to other local delivery methods, such as unwanted diffusion of
soluble compounds;
it has a high flexibility since beads of any dimension can be functionalized with any desired
protein or molecule;
its high resolution allows studies of neural processes at single dendrite level, having the desired
controls within the same neuron and thus reducing the variability of the system;
it is a simple-to-implement setup, which can be easily applied in bio-laboratories not specialized
in optical tweezers;
the technique might be of interest not only for neurobiology, but also for molecular oncology,
immunology and any other field in which single cell response to a specific and localized stimulus
is studied.

Results
38
2.2 LIPOSOMES
Many relevant biological events are sensitive to gradients of molecules, which influence the
cellular response and morphology. In particular, during chemotaxis, cells move in the same or in the
opposite direction of a given gradient. With beads, the stimulus is fixed and cannot diffuse, and the study
of these events is not possible. Hence, we thought about using micron-sized liposomes filled with
molecules. Their breaking should allow the generation of spatial and temporal gradients. As in the case of
beads, however, this hypothesis should be tested. In particular the main questions about this kind of
vector are: are we able to encapsulate the desired molecules inside liposomes? Can we trap and
manipulate them? Can an UV pulse induce the photolysis of a trapped liposome? Do the molecules
encapsulated inside it diffuse outside during the photolysis? Are they damaged by the UV pulse or do
they preserve their biological activity? Do they reach surrounding cells and stimulated them? Does the
UV pulse have an effect on the cell? To answer all these questions, we started by encapsulating and
releasing a simple chemical compound (KCl) and then we turned to more complex systems, encapsulating
proteins. In this case, the readout was the navigation of growth cones, extremely dynamic structures with
a high sensitivity to small changes in the environment.
2.2.1 GROWTH CONES
During development of the nervous system, each neuron extends an axon through a complex and
changing environment to reach its final destination. At the tip of each axon there is the growth cone. Its
motility and highly dynamic behavior governs axonal path-finding and the construction of neuronal
networks.
Figure 2.9: Structure of a growth cone with its cytoskeletal features. C domain is the central domain,
T zone is the transition zone while P domain is the peripheral domain. From Lowery and Van Vactor,
2009.
Growth cones have a finger-like shape. Fingers are the filopodia, dynamic structures that have the
function of antennas, since they explore the environment. Filopodia are connected through sheets of
membrane, called lamellipodia. The shape of growth cones is determined by its cytoskeletal structure.
The central domain (C domain) corresponds to the end of the axon shaft. It contains mainly stable

Results
39
bundled microtubules, organelles and vesicles. Within this region also central actin bundles can be found.
The peripheral domain (P domain) is it outer part of the growth cone. It has two main actin structures:
actin bundles, that are inserted within filopodia, and mesh-like branched actin networks, that sustain
lamellipodia. “Pioneer” microtubules may be linked to actin bundles inside filopodia. C domain and P
domain are connected by the transition zone (T zone). In this region actin arcs are present. They are
actomyosin contractile structures that are perpendicular to actin bundles of P domain and form a hemi-
circumferential ring (Lowery and Van Vactor, 2009).
Navigation of the growth cone is affected by several cues and in particular by adhesive cues (that
can be attached to the extracellular matrix or cell surface) or diffusible chemotropic factor. These factors
activate specific signaling pathways that act locally to modulate the cytoskeletal dynamics and promote
attraction, repulsion, growth cone collapse, or influence the rate of axon extension. Signals can thus foster
the adhesion and migration of the cell in that direction or repel it, prohibiting this adhesion. Examples of
attractive adhesive cues are laminin and fibronectin, while slit, ephrins and chondroitin sulphate
proteoglycans are repellent. Diffusible molecules can be divided into three main families: Netrins,
Semaphorins and trophic factors. Generally, trophic factors (such as BDNF) are attractive, Semaphorins
are repellant, while Netrins can be both attractive and repellant (Tojima et al., 2011). However, it should
be considered that response to attraction or repulsion is not due to intrinsic properties of the cue, rather
than to specific receptors that are engaged in the growth cone and to the signaling pathway activated (for
reviews see Bashaw and Klein, 2010; Conde and Caceres, 2009; Lin and Holt, 2007; Lowery and Van
Vactor, 2009).
When a positive cue binds its receptor, an intracellular pathway is activated so that the actin
cytoskeleton is stronger linked to the substrate. Actin polymerization continues in front of the adhesion
site and lamellipodia and filopodia move forward, thus extending the leading edge (Mogilner, 2006).
Engorgement occurs after actin clears from the corridor between the adhesion and the C domain. Actin
arcs reorientate from the C domain towards the site of new growth and C domain is occupied by
microtubules. Finally, the proximal part of the growth cone compacts at the growth cone neck to form a
new segment of the neurite shaft.
Microtubules have two different roles in the outgrowth process: C domain microtubules guide the
growth cone advance by fixing axonal direction, while individual pioneer microtubules in P domain act as
sensors. These ladder microtubules generally follow actin bundles (Letourneau, 1983), which are thought
to guide them within the P domain (Zhou and Cohan, 2004). This interaction has a major control in the
regulation of the structure of growth cones. Indeed, positive guidance cues, increase the frequency of
microtubule-actin uncoupling, leading to and increased exploration at the sites of cue binding by the
microtubules. Repellant cues, on the contrary, foster this coupling, reduce microtubule exploration and
promotes the formation on microtubule loops (Lowery and Van Vactor, 2009).
In vitro studies indicate that Calcium signals are most of the times required for growth cone
guidance (Tojima et al., 2011). Higher Ca2+
levels are observed on the side of the growth cone facing the
source of the cues, regardless of whether the cues are attractive or repulsive. Thus, localized Ca2+
elevations on one side of the growth cone can act as both attractive and repulsive signals (Gomez and
Zheng, 2006; Zheng, 2000). The diverse spatiotemporal patterns of Ca2+
and cyclic nucleotide signals
contribute to the response, together with the different subcellular localization of the effectors. In the case
of repulsion, cGMP levels increase and Ca2+
influx only through plasma membrane channels occurs. This
source of Ca2+
activates repulsive effectors and not attractive effectors. Conversely, attractive cues induce
an increase of cAMP and the activation of attractive effectors by means of Ca2+
release from the
endoplasmic reticulum and/or abundant Ca2+
influx across the plasma membrane (Tojima et al., 2011).

Results
40
Growth cones may also undergo a fast desensitization, which is dependent on receptor
endocytosis, and a slow resensitization, which is dependent on protein synthesis. If background levels of a
particular guidance cue increase, growth cones make use of this adaptation mechanism to tune their
responsiveness appropriately to higher levels of the guidance cue riding on top of the background levels
(Bashaw and Klein, 2010; Piper et al., 2005).
It is thus evident that soluble cues should be released through the generation of gradients of
molecules at really low levels and with an appropriate temporal pattern.
2.2.2 SEMAPHORIN 3A
Semaphorins are a family of proteins with more than 20 items. They have diverse functions in
many physiological processes, such as cardiogenesis, angiogenesis, tumor metastasis and immune
regulation (Kumanogoh and Kikutani, 2010). Semaphorin 3A (Sema3A) is a member of this family and is
one of the best characterized axonal chemorepellents. It acts through the neuropili-1(NP1)/plexin-
A(PlexA) receptor complexes. NP1 serves as a high-affinity ligand binding partner, while PlexA
transduces the signal into the cell via its large intracellular domain. In the absence of ligand, NP-
1stabilizes an inactive conformation of NP1-PlexA receptors. Binding of Sema3A to NP1 induces a
conformational chance in this complex. The effects on cytoskeleton are given by the regulation of actin
dynamics through the phosphorylation of the actin-binding protein cofilin. Phosphorylated cofilin is
inactive and thus its ability to promote actin filament turnover is reduced, and ultimately, F-actin
filaments dissolute. As a result, a redistribution of the F-actin cytoskeleton occurs and the growth cone
membrane is endocyted (Fan et al., 1993; Fournier et al., 2000). These events lead to a dramatic collapse
of the growth cone lamellipodium (Castellani et al., 2004; Jurney et al., 2002) (for reviews on the
Sema3A pathway Bashaw and Klein, 2010; Huber et al., 2003).
In the hippocampus the repellent role of Sema3A was demonstrated by Chèdotal using mouse
embryo extracts (Chedotal et al., 1998).
2.2.3 NETRIN-1
Netrins are a small family of highly conserved guidance cues (molecular weight 70–80 kDa).
They can function as both neural chemoattractants and repellents depending on the cellular context in
which the cue is encountered (Chisholm and Tessier-Lavigne, 1999). These opposing neuronal responses
to netrins may depend in part upon activation of different receptor complexes, and they suggest that
differential activation of intracellular signaling cascades defines netrin function.
One factor that determines the response of an axon to Netrin-1 is the composition of the receptor
on the surface of growth cones, and in particular on the association between DCC (deleted in colorectal
cancer) and Unc-5 family. The attractive effects of Netrin-1 are mediated by homodimers of DCC
proteins. By contrast, Unc-5 proteins mediate repulsion, in the presence of DCC, in the absence of DCC
and/or with recruitment of a distinct co-receptors (Round and Stein, 2007).
Furthermore the response depends on the internal state of the growth cone, and in particular on
Ca2+
influx and on the ratio between cAMP e cGMP (Nishiyama et al., 2003). More in detail, The Netrin-
1-induced turning response depends on Ca2+
influx through plasma membrane Ca2+
channels, as well as
Ca2+
-induced Ca2+
release from cytoplasmic stores. Reduction of Ca2+
signals by blocking either of these
two Ca2+
sources converted the Netrin-1-induced response from attraction to repulsion (Hong et al.,
2000).
Signaling through both DCC and Unc-5 receptors affects growth cone cytoskeleton by
modulating the activity of Rho GTPases (Li et al., 2002; Shekarabi and Kennedy, 2002). Rho GTPases

Results
41
integrate the responses of upstream pathways and coordinate downstream effectors by modifying the
function of cytoskeletal effectors. Activation or inactivation of cytoskeletal effectors leads to responses
such as actomyosin contraction, filamentous (F)-actin disassembly or F-actin polymerization. The
resulting growth cone turning response depends on the localization of the guidance signaling inside the
growth cone (Lowery and Van Vactor, 2009).
2.2.4 LOCALIZED STIMULATION OF GROWTH CONES
The study of growth cone dynamics and turning obviously requires a gradient of molecules for
the stimulation. Only being able to localize the source of stimulus, indeed, it is possible to see whether it
affects the turning angle. The repetitive pulsatile ejection method (presented in section 1.2.2) is still the
method of choice when performing growth cone turning assays (Han et al., 2011; Thompson et al., 2011)
even if microfluidics platforms have been proposed (Kothapalli et al., 2010; Wang et al., 2008).
Chemical stimuli, encapsulated in optically manipulated liposomes and delivered by breaking the
liposome with a pulsed UV laser were proposed as local delivery with precise temporal switch-on control
(Sun and Chiu, 2003). A submicrometric diameter liposome (0.6 µm) was loaded with a Carbachol
solution (0.1 M) and positioned at 0.5 µm from a CHO cell transfected with muscarinic acetylcholine
receptor, stained with the fluorescent Calcium indicator Fluo-3. The content was then delivered by
liposome photolysis with an UV laser pulse and the increase of the intracellular Calcium level monitored
by fluorescence. This method has the advantage that any membrane impermeable molecules, including
peptides and proteins, can be easily encapsulated into liposomes and delivered to cells. Moreover, the
amount of released molecules can be varied easily by controlling either the size of the liposome or the
concentration of the encapsulated compound (Walde and Ichikawa, 2001). Therefore, we wanted to
extend this technique to investigate cultured neurons and in particular growth cones.
2.2.5 MATERIALS AND METHODS
2.2.5.1 OPTICAL SETUP
The optical setup was built in the Optical Manipulation lab at CNR-IOM. It was composed by
three main modules (Figure 2.10):
custom built IR optical tweezers;
commercial UV micro-dissection system (MMI-CellCut Plus, MMI, Zurich, Switzerland);
commercial inverted microscope Nikon Eclipse TE-2000-E.
The trapping laser beam was generated by a 1064 nm continuous wave single mode Yb fiber laser
(YLM-5, IPG Photonics GmbH, Burbach, Germany). The laser head had a built-in collimator providing a
TEM00 collimated beam. The direction of the trapping IR beam was aligned with the direction of the
micro-dissection UV beam by two mirrors (M1 and M2 in Figure 2.10). A convergent lens, L, with the
focal length, fL = 150 mm was placed just before the entrance aperture of the micro-dissection system to
adjust the convergence of the trapping IR beam to the convergence of the UV micro-dissection beam.
Different objectives have been used: 100x water immersion NA=1, WD=1mm, Olympus; 60x water
immersion, NA=1.2; WD=0.4, Nikon; 60x oil immersion NA=1.4, WD=0.13.
The alignment of the IR trapping beam was facilitated by a red guide laser beam (660 nm, 0.5
mW), emitted by the same source. Powers between 10 to 20mW were necessary at the sample location to
stably trap the liposomes. Typically, the IR laser power at the output of the collimation head was
regulated from 150 to 300 mW. The micro-dissection system was equipped with a solid-state pulsed UV

Results
42
laser (355 nm, max 1 µJ / pulse, pulse duration < 0.5 ns, repetition rate < 5 kHz). The beam was
collimated by internal optics and directed toward the microscope objective by two dichroic mirrors (D1,
D2). The number of required pulses may vary with liposome morphology (single or multi-lamellar).
Figure 2.10: Optical manipulation approach. (a) Setup: the IR laser trapping beam direction is
adjusted by two mirrors, M1 and M2, and its convergence by the convergent lens, L, to be aligned
with the UV laser micro-dissection beam. Both laser beams are then directed into the entrance pupil of
the microscope objective (100 X) by the dichroic mirrors D1 and D2. The sample is illuminated by a
white light source (WI) and the image is formed through the tube lens (TL) on the CCD camera. (b)
Optical manipulation and dissection of a single liposome. A selected liposome inside the capillary is
first fixed in the optical trap (top) and then placed to the specific site near the cells by moving the
stage and microscope objective (black arrows). A short train of UV pulses breaks the liposome to
deliver the content to the surrounding environment (bottom) (adapted from Pinato et al., 2011a and
Pinato et al., 2011b).
Short series of less than 50 pulses were usually enough to break the liposomes wall and deliver
their content. The power and the focus of the UV laser beam were controlled by the MMI software, which
controls also the XY motorized sample stage and the image recording on the CCD camera. The sample
chamber on which the neuronal cell were cultured is a glass-bottom Petri-dish. Since the experiments last
for tens of minutes, the Petri-dish was settled on a heating insert and kept at 37°C by a digital temperature
controller (PeCon GmbH, Erback, Germany) to maintain physiological conditions.
2.2.5.2 LIPOSOME PREPARATION
For the preparation of liposomes, phospholipids were dissolved at the concentration of 10 mg/mL
in a solvent composed of chloroform:methanol (2:1, v/v). The phospholipid composition was the
following: Cholesterol: 9 μmol, L-α- Phosphatidylcholine: 63 μmol, Stearylamine: 18 μmol (Sigma-
Aldrich, cat. L4395). Liposomes were obtained using the lipid film hydration method (Hub et al., 1982).
Aliquots of the phospholipid solution were dried in vacuum overnight. The obtained lipid films were
finally hydrated with the solution to be encapsulated. The ion concentration of the encapsulated solution
was estimated to be the same as that of the rehydration solution in bulk. After a brief incubation,
liposomes were formed. They were then gently centrifuged (5000 rpm x 3 min) and rinsed three times
with an isotonic solution (100mM glucose in physiological buffered saline, PBS). Sucrose 100 mM was
added to the hydration solution to improve liposome wash and to help the trapping of large liposomes as
previously reported (Ichikawa and Yoshikawa, 2001). The size distribution of the liposomes was

Results
43
6.30±4.04 μm. We could observe the presence of both multi- and mono/oligo-lamellar vesicles, based on
qualitative optical criteria, i.e., shape and rim size. The stability was tested by filling the liposomes with
fluorescein and maintained for days. Liposomes were finally charged in rectangular capillaries
(Vitrotubes, #5005, VitroCom, New Jersey) and subsequently transferred to the recording chamber. This
allows selection of a single liposome from the capillary and positioning it at the site of interest.
2.2.5.3 CELL CULTURE
Cell cultures were obtained as described in paragraph 2.1.3.1.
Before starting the experiment cultures were bathed in Ringer's solution (145 mM NaCl, 3 mM
KCl, 1.5 mM CaCl2, 1 mM MgCl2, 5 mM Glucose, 10 mM HEPES, adjusted to pH 7.4 with NaOH).
2.2.5.4 CALCIUM IMAGING
Ca2+
imaging experiments were performed in epi-fluorescence using a blue excitation filter block
(B-2A, Nikon). The fluorescence images were recorded with a CCD camera DVC-1412AM (DVC
Company, Austin, TX, US). Frames (174x130 pixels in 8x8 binning mode) were collected at the rate of
22 Hz at 12-bits. Stock solution of the Calcium dye Oregon Green 488 BAPTA-1-AM (OGB-1-AM,
Molecular Probes O-6807) was prepared in DMSO. Cell cultures were then incubated for 30 min with 1.5
µM of the Ca2+
dye. After incubation neuronal cultures were washed and transferred on the stage of the
microscope. Measurements were performed at 37 °C. Data were analyzed with software ImageJ and
Matlab (Mathworks, Natick, MA). Increases of Ca2+
are expressed in relative fluorescence changes
(DF/F) as described in (Pinato et al., 2009).
2.2.6 RESULTS
There are several questions related to the use of micron-sized liposomes as vectors for the
delivery of molecules, since two highly focused laser beams (UV and IR) should be used at the same
time. Hence, they might damage encapsulated molecules or the cells. Moreover, the UV pulse causes only
a transitional rearrangement in the liposome, during which molecules are supposed to escape from the
lumen of the vesicle. Initially, we validated the technique by delivering a small chemical compound (KCl)
and analyzing its effects on Calcium levels in neurons. Afterwards we encapsulated two chemotactic
proteins (Netrin-1 and Semaphorin 3A) and studied their outcomes on growth cones.
2.2.6.1 PRELIMINARY STUDY WITH KCL AND CALCIUM
The technique was first tested by molecules encapsulation and subsequent release by breaking the
liposome membrane with UV laser pulses. Liposomes with dimension ranging from 1 to 10 µm were
produced. The efficiency of encapsulation and subsequent release induced by the UV pulse, was first
qualitatively evaluated (Figure 2.11).
Liposomes were encapsulated with 1 mM fluorescein and collected in a reservoir consisting of a
rectangular glass capillary. The reservoir was introduced in the recording chamber and a single liposome
was optically trapped, positioned and visualized both in bright field and epi-fluorescence (Figure 2.11a).
The fluorescence signal originated from the liposome allowed to check the correct encapsulation (Figure
2.11a left). After UV-pulse delivery, fluorescence disappeared from the liposome demonstrating
complete depletion of fluorescein and a shape rearrangement of the vesicle induced by the
microdissection occurred (Figure 2.11a right). The fluorescence signal from a large vesicle in close
proximity was not influenced by the UV pulse (Figure 2.11a), demonstrating single vesicle photolysis.
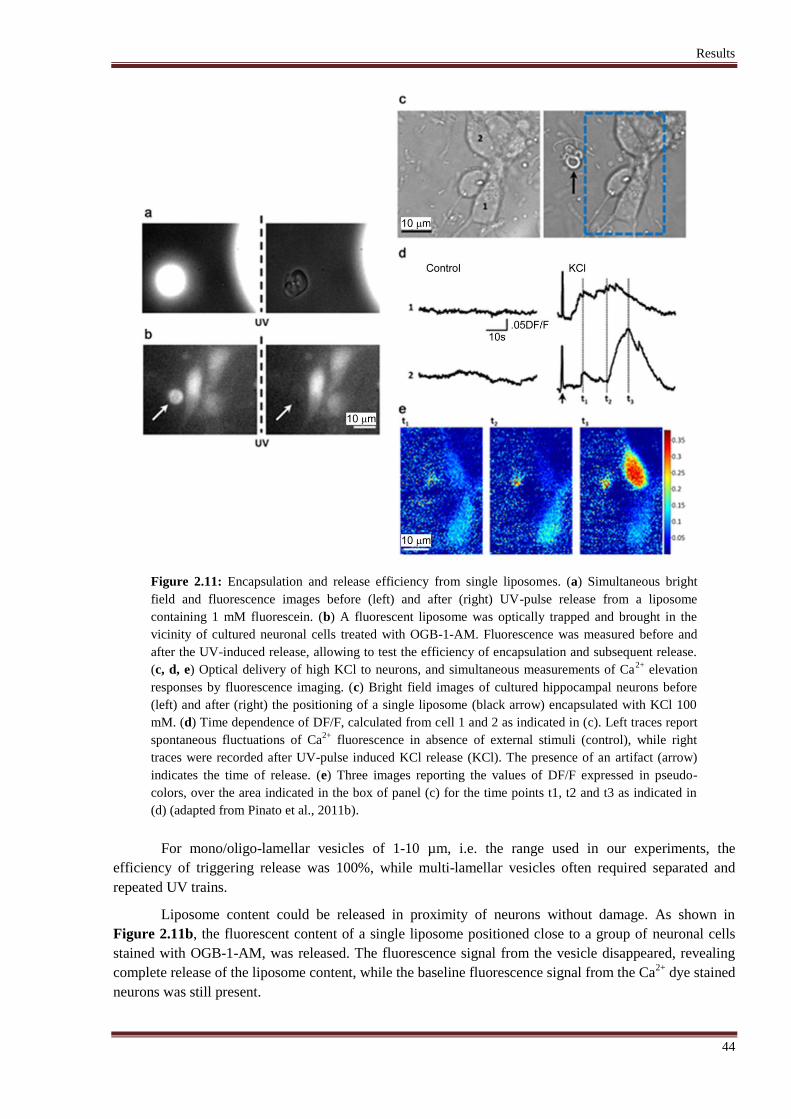
Results
44
Figure 2.11: Encapsulation and release efficiency from single liposomes. (a) Simultaneous bright
field and fluorescence images before (left) and after (right) UV-pulse release from a liposome
containing 1 mM fluorescein. (b) A fluorescent liposome was optically trapped and brought in the
vicinity of cultured neuronal cells treated with OGB-1-AM. Fluorescence was measured before and
after the UV-induced release, allowing to test the efficiency of encapsulation and subsequent release.
(c, d, e) Optical delivery of high KCl to neurons, and simultaneous measurements of Ca2+
elevation
responses by fluorescence imaging. (c) Bright field images of cultured hippocampal neurons before
(left) and after (right) the positioning of a single liposome (black arrow) encapsulated with KCl 100
mM. (d) Time dependence of DF/F, calculated from cell 1 and 2 as indicated in (c). Left traces report
spontaneous fluctuations of Ca2+
fluorescence in absence of external stimuli (control), while right
traces were recorded after UV-pulse induced KCl release (KCl). The presence of an artifact (arrow)
indicates the time of release. (e) Three images reporting the values of DF/F expressed in pseudo-
colors, over the area indicated in the box of panel (c) for the time points t1, t2 and t3 as indicated in
(d) (adapted from Pinato et al., 2011b).
For mono/oligo-lamellar vesicles of 1-10 µm, i.e. the range used in our experiments, the
efficiency of triggering release was 100%, while multi-lamellar vesicles often required separated and
repeated UV trains.
Liposome content could be released in proximity of neurons without damage. As shown in
Figure 2.11b, the fluorescent content of a single liposome positioned close to a group of neuronal cells
stained with OGB-1-AM, was released. The fluorescence signal from the vesicle disappeared, revealing
complete release of the liposome content, while the baseline fluorescence signal from the Ca2+
dye stained
neurons was still present.

Results
45
Figure 2.12: Photolysis of control liposomes containing PBS. (a) Bright field image of a neuronal
culture treated with a control liposome containing PBS (indicated by the black arrow). (b) Time
dependence of DF/F, calculated from cell 1 and 2 and 3 as indicated in (a). Left traces report
spontaneous fluctuations of Ca2+
fluorescence in absence of external stimuli, while right traces were
recorded after UV-laser photolysis of a control liposome (a, arrow). The artifacts indicate the time of
release (arrow)(from Pinato et al., 2011b).
Subsequently, the effect of release from liposomes was tested on neuronal cells in culture (Figure
2.11c), by releasing encapsulated KCl. Neuronal responses were monitored with Ca2+
imaging technique,
by loading the cells with OGB-1-AM. From the baseline fluorescence (not shown) it was possible to
identify the contribution of single neurons and associate them to different regions of interest. The activity
was monitored by calculating the value of DF/F over time. Cells were first monitored for few minutes
before the stimulation in order to obtain a control of the spontaneous activity (Figure 2.11d, left traces,
numbers 1 and 2 refers to the cells indicated in Figure 2.11c, left). After this period, a single liposome
with a suitable volume was selected in the reservoir by visual inspection. The liposome could be trapped
with the optical tweezers, and by moving the microscope stage it could be positioned at the location of
interest as indicated by the arrow in Figure 2.10c. The liposome was then cut by UV dissection while
monitoring fluorescence signals from the neuronal culture. In order to avoid any disturbance on the
measurements of fluorescence emission from the Ca2+
dye, fluorescein was not included in these
experiments. Following the dissection of the liposome, the time dependence of DF/F mediated over the
different cells showed a large increase, followed by a return on the baseline level (Figure 2.11d, right)
denoting a depolarization induced Ca2+
influx originated by the release of KCl. DF/F images (Figure
2.11e) were also calculated at different time points (t1, t2, t3, indicated in Figure 2.11d, right). These
data show the distribution of activation within the area corresponding to the neuronal cells. Differences in
cell responses (Figure 2.11d, e) can be ascribed to the heterogeneity of the intrinsic electrical properties
of the neurons present in the cultures and to the presence of both inhibitory and excitatory synaptic
connections that influence the electrical activity. Altogether these results confirm the possibility of focal
delivering chemical stimuli to neuronal cells through release from liposomes. In order to exclude artifacts
from the UV photolysis of the liposomes, control experiments were done by delivering PBS from
liposomes. No response was observed after the PBS release, induced by UV pulse (Figure 2.12). This

Results
46
control also excluded the possibility of any effect of the specific lipid composition of the liposomes on
neurons, as membrane-distorting effects.
The possibility of using liposomes as vectors for local stimulation of hippocampal primary
neuronal cultures, was thus assessed. A main advantage of the method is the possibility to accurately
measure the volume of the liposome, that scales from femtoliters to picoliters for liposomes ranging from
1 to 10 µm, and consequently to estimate the amount of molecules released, given the concentration. The
time precision of delivery is sub-milliseconds, although it must be taken into account the distance from
the delivery point to provide a correction of both the actual concentration and precise occurrence of the
stimulus.
Another advantage consists in the procedure of liposome production and encapsulation that is
very simple and does not require expensive equipment and heating. Thus, proteins can be easily
encapsulated within liposomes without affecting their structure and biological activity.
2.2.6.2 EFFECTS OF NETRIN-1 AND SEMAPHORIN 3A ON GROWTH CONES
We probed chemotaxis of single neurons, induced by signaling molecules which were optically
delivered from liposomes in the neighborhood of growth cones. Two proteins were tested in our
experiments: Netrin-1 and Semaphorin 3A (Sema3A).
To preclude potential leakage/diffusion of molecules out of the liposome, with the subsequent
effect on the neuron morphology, we performed a second type of control experiments. The liposome
filled with the protein of interest was positioned and held near the growth cone for more than 5 minutes
before the liposome photolysis. Examining visually the neuron, we controlled that no significant changes
of the neuron morphology occurred. Afterwards, we studied the guidance effect of the Netrin-1 molecules
released from the liposomes. The liposome was positioned near a neurite, as shown in Figure 2.13, and
its content released by laser photolysis. To see the effect induced by the Netrin-1 molecules, the neurite‟s
growth cone was monitored for 5 minutes after the molecules release, recording images every 30 seconds.
From Figure 2.13 a neat activation of the growth cone movement and the neurite progression toward the
liposome location can be observe, demonstrating the chemotaxis effect. The growth of the neurite was
about 10 μm after 5 minutes.
In order to replicate the same experimental conditions we tried to select liposomes with the same
diameter and position them at the same distance from the neurite. The behavior observed was similar and
reproducible in all the different experiments (Figure 2.14a). The neurite movement was clearly
accentuated after the release of Netrin-1 molecules and it was directed toward the liposome location. A
plot of the edges of growth cones before and after the delivery of the stimulus highlights this effect. In
particular, in Figure 2.14b in green the shape of the structure at the beginning of the time laps is drawn,
and it is superimposed to the shape of the growth cone (in red) at the end of the period. Movements before
the photolysis of the vesicle (-60s and -10s) are compared to movements after the breakage of the
liposome (-10s and 240s). In the presented case, small rearrangements are observed before the
stimulation, while after it occurred, a difference in the growth cone shape can clearly be noticed.
The effect of Netrin-1 is even more evident when we plot the distance (D) between the vesicle
and the nearest tip of the growth cone over time (Figure 2.14c). Although only small oscillations are
visible before the photolysis of the liposome, after the delivery of the stimulus a clear trend can be
noticed: D decreases, indicating that filopodia of the growth cones are closer to the point of release. The
effect of Netrin-1 on growth cones is really fast, since the navigation is affected starting from the very
first seconds after the photolysis and it lasts for the following four minutes. Afterwards, in some cases
(Figure 2.14c blue and green lines) it looks like the effect disappears and the growth cone start to develop

Results
47
also in the opposite site with respect to the releasing point. This is not surprising, since it is highly
possible that after such a long time no more diffusing molecules are present in the area of interest. While
some of them could have been kicked out by diffusion processes, other ones could have been endocyted
by the stimulated cell.
Figure 2.13: Neurite guidance by Netrin-1 released from a micrometric size liposome. Netrin-1
concentration was 5µg/mL. (a) A liposome (indicated by the black arrow) is positioned near the
neurite of a neuron. The image was taken 30 seconds before liposome photolysis. (b) Neurite
development 5 minutes after the release of the Netrin-1 molecules from the liposome. The progression
of the region marked by the rectangle is shown below (from Pinato et al., 2011a).
Sets of experiments using Sema3A were performed in the same conditions as Netrin-1. In this
way, a further control of the technique is provided, since Sema3A has opposite effects with respect to
Netrin-1. As expected from literature, Sema3A was repellent and it induced both collapse (Figure 2.16a)
and turning on the opposite side with respect to the releasing point (Figure 2.15 and Figure 2.16c). In the
case of collapse, the number of filopodia diminished and the lamellipodia retracted. In the second case an
(
a) (
b)

Results
48
expansion was observed, but in a direction different from that pointing towards the location of the vesicle
(Figure 2.15 and Figure 2.16c). Also in this case, the edges of the growth cones have been drawn, in
order to compare the shape before and after the stimulation (Figure 2.16b and d). As in the case of
Netrin-1, small differences are observed before stimulation, while after the delivery of Sema3A the cells
are clearly departing from the liposome. The plot of the distance (D) from the vesicle to the nearest tip of
the growth cone over time (Figure 2.16e) shows again only small oscillations before the photolysis of the
liposome. After the release of Sema3A, D increases indicating a departure from the source of the gradient.
As in the case of Netrin-1, the effect starts soon after the UV pulse and lasts for at least 4 minutes. Only
in one case (Figure 2.16e red line) the cellular response is delayed of about 1 minute.
Figure 2.14: The release of Netrin-1 from vesicles induces attractive turning. (a) DIC images of a GC
before Vesicle breaking (VB) (-60 s and -10 s) and after VB (60 s and 240 s). (b) Profiles before VB
of the GC at -60 s (green) and at -10 s (red) (left). The GC before VB explored the environment, but
after VB grew clearly towards the vesicle, as shown by its profile at -10 s (green) and 240 s (red)
(right). In this experiment the laser pulse completely broke the lipid vesicle. The estimated number of
molecules (Nmol) released was 1750. (c) Time evolution of the distance between liposome and the
nearest tip of the GC for 5 different experiments. The vertical broken line indicated the time of VB.
Following VB the GC started to grow with a delay varying from 20 to 60 s. From Pinato et al., paper
in preparation.
The chemotactic effects of the two proteins are really fast. Thus, they can be mediated only by
local signaling triggered by the two proteins, and caused by changes in the cytoskeletal structure. Indeed,
the time scale of the events is not compatible with gene expression and they are fast also for the de novo
protein synthesis to take place.
It should be considered that the number of molecules released in the experiments was between
thousands and hundreds thousand. This number depends on the concentration of the rehydrating solution
and on the size of the liposome. The huge range of molecules used in the experiments is due to this last
parameter, since the choice of vesicles with even slightly different dimensions has a big difference on the
number of molecules encapsulated, as this scales with the cube of the diameter.
2.2.7 DISCUSSION
In the field of chemotaxis, the generation of gradients of stimuli has always been a big issue.
Many different approaches to tackle this technical limitation have been proposed, but they all require
micro- and nano-fabrication facilities, a strong know-how in chemistry or do not allow an easy control of
the positioning of the stimulus.
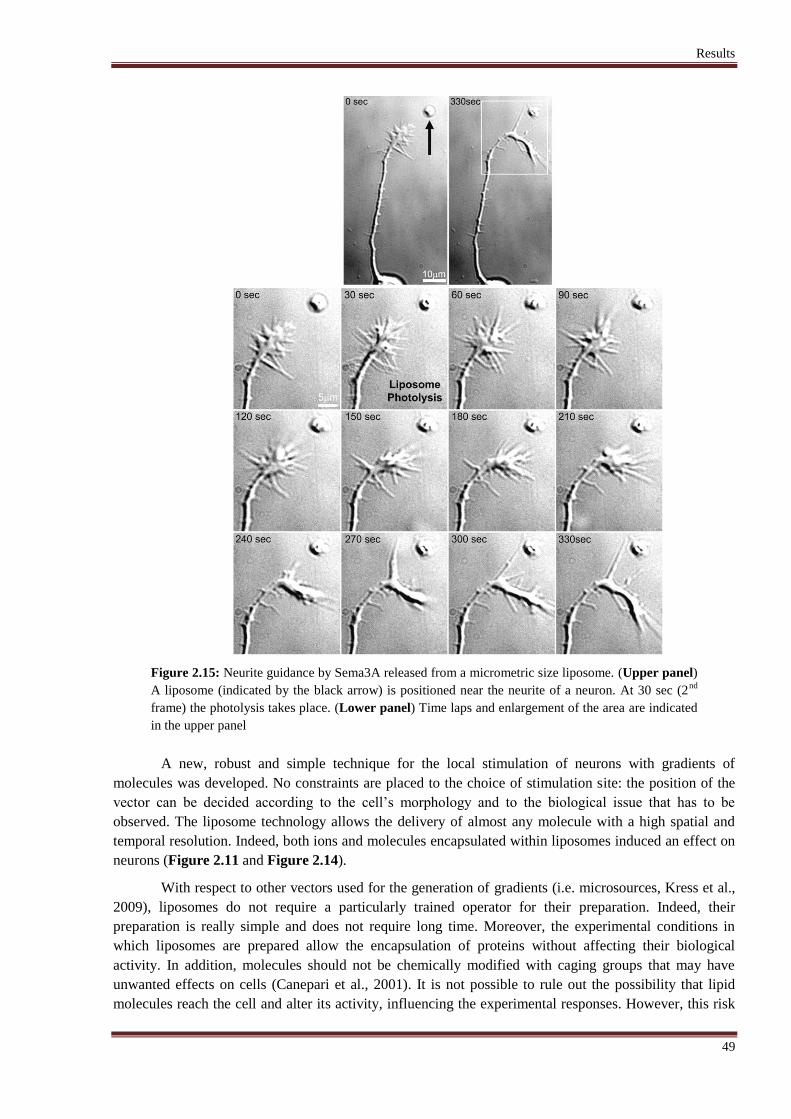
Results
49
Figure 2.15: Neurite guidance by Sema3A released from a micrometric size liposome. (Upper panel)
A liposome (indicated by the black arrow) is positioned near the neurite of a neuron. At 30 sec (2nd
frame) the photolysis takes place. (Lower panel) Time laps and enlargement of the area are indicated
in the upper panel
A new, robust and simple technique for the local stimulation of neurons with gradients of
molecules was developed. No constraints are placed to the choice of stimulation site: the position of the
vector can be decided according to the cell‟s morphology and to the biological issue that has to be
observed. The liposome technology allows the delivery of almost any molecule with a high spatial and
temporal resolution. Indeed, both ions and molecules encapsulated within liposomes induced an effect on
neurons (Figure 2.11 and Figure 2.14).
With respect to other vectors used for the generation of gradients (i.e. microsources, Kress et al.,
2009), liposomes do not require a particularly trained operator for their preparation. Indeed, their
preparation is really simple and does not require long time. Moreover, the experimental conditions in
which liposomes are prepared allow the encapsulation of proteins without affecting their biological
activity. In addition, molecules should not be chemically modified with caging groups that may have
unwanted effects on cells (Canepari et al., 2001). It is not possible to rule out the possibility that lipid
molecules reach the cell and alter its activity, influencing the experimental responses. However, this risk
(
b)

Results
50
is low since the photolysis of the liposomes does not destroy them but it rather creates temporary holes
that close shortly after the end of the UV pulse. We can thus assume that there is no leakage of lipids.
Figure 2.16: The release of Sema3A from vesicles induces either retraction or turning. (a) DIC
images of a GC before VB (-60 s and -10 s) and after VB (60 s and 220 s). (b) Profiles of the GC at -
60 s (green) and at -10 s (red) before VB (right). The GC before VB explored the environment, but
after VB retracted significantly as shown by its profile at -10 (green) and 220 s (red) (left). The
estimated average number of Sema3A molecules inside the vesicle (Nmol) was 2500. (c) The same as
a, but in this case the GC 2 minutes after VB turned away from vesicle. (d) As in b but profiles
obtained from the GC shown in c. In this experiment Nmol was 540. (e) Time evolution of the distance
(Dist) between liposome and the nearest tip of the GC for 5 different experiments. The vertical broken
line indicated the time of VB. Following VB the GC started to retract with a delay varying from 20 to
120 s. From Pinato et al., paper in preparation.
The spatial resolution that can be achieved with the proposed approach is really high with respect
to that of ejection systems or microfluidics platforms. The former may allow a higher temporal control
but the diffusion of the molecules occurs over large areas. The diffusion of the molecules, moreover, is
present both in front and on the back of the target. Hence, the readout of the experiments can be unclear.
The main drawback of microfluidic platforms is flexibility: the geometry of the system cannot be changed
in real time according to the shape of the cell. The position of the cells can be guided treating the surface
but direction and exact location of the stimulus cannot be chosen.
Lastly, the instrumentation required (i.e pulsed UV laser and continuous wave IR laser for the
trapping) is cheaper that the systems with similar characteristics (2 photon uncaging).
The proposed technique was initially validated with KCl, that causes a strong depolarization in
neurons and an increase in Calcium levels (Figure 2.11). In this first step the goal was not a high
resolution delivery, but the evaluation of the releasing efficiency. Molecules were able to travel in the
medium and stimulate cells about 10 µm distant. This can also explain the delayed (5-10 seconds) cellular
response observed in the Calcium dynamics. Moreover, we could not evaluate the encapsulation

Results
51
efficiency of KCl. We assumed that the concentration of the molecule within liposomes is the same of the
hydration solution but it likely is slightly lower.
The steric volume occupied by proteins is, obviously, larger than the one occupied by KCl. Thus,
the fact that also proteins can be encapsulated within liposomes is not straightforward. The experiments
with Netrin-1 and Semaphorin 3A demonstrated that also large molecules can be used and their biological
activity is not affected by both the protocol for the preparation of vesicles and the optical manipulation
(Figure 2.13 and Figure 2.15). The high resolution of the technique was proven in these experiments, by
placing the liposomes exactly in the desired position with respect to hippocampal growth cones and
namely about 45° away from the direction of development of the structure. As expected from literature,
Sema3A showed a repellant behavior while Netrin-1 was attractant. In the case of Netrin-1, we can
assume that the receptors which were activated, were dimers of DCC. However, further experiments are
necessary to confirm this hypothesis.
It should be noticed that Netrin-1 had attractive effects in all the experiments that were
performed. We cannot exclude that this positive response is influenced by the dynamics of Netrin-1
release. Indeed, when stimulated with high amounts of proteins, growth cones can desensitize endocyting
the receptors (Piper et al., 2005). The number of molecules released with liposomes is probably lower that
the other approaches and this fact may be an explanation for the different observed outcomes.
In conclusion, we demonstrated that, beside beads, also liposomes can be used as vectors for the
local delivery of molecules, being them small molecules or entire proteins. This technique shows a high
flexibility both in terms of molecules that can be used and in terms of positioning of the stimulus.
Liposomes permit also the use of different concentrations of stimulus by simply changing the
concentration of the hydration solution or choosing larger vesicles.

Results
52
2.3 NANOSIZED VECTORS
Vectors developed in the previous chapters are micron-sized vectors, which can be used for the
delivery of molecules. However, the fate of these molecules cannot be investigated, since we cannot
image them. Indeed, ligands may remain at a surface level or be endocyted and ultimately transported to
different cellular compartments. Visualization of these processes requires single molecule sensitivity,
which cannot be provided by organic dyes. On the contrary, quantum dots are bright, photostables
nanoparticles, which can be bound to a molecule of interest, allowing its visualization in live imaging
experiments. For this reasons we decided to use quantum dots nanovectors to track the retrograde
transport of BDNF, that undergoes endocytosis through its receptor TrkB but whose transport dynamics
are unknown.
2.3.1 QUANTUM DOTS: BIOLOGICAL APPLICATIONS & TOXICITY
Quantum dots (Qdots) are nanocrystals with peculiar properties, which are given by their small
dimensions in all the three dimensions and that change with their size. Qdots have a core of
semiconductor material (cadmium mixed with selenium, tellurium or sulfur) and semiconductor shell, that
protect the core against surface oxidation and leaching of toxic ions. Moreover, the shell serves as
platform for ligand exchange and bioconjugate reactions. Finally, a coating of the surface with
amphiphilic or hydrophilic molecules is possible. This coating makes Qdots biocompatible and allows
their functionalization, which can be achieved by conjugating reactive biomolecules (Figure 2.17a).
One of the most valuable properties of Qdots is their fluorescence spectrum, which renders them
as optimal fluorophores. The energy of the emitted photon is determined by the size of the quantum dot
due to quantum confinement effects. This means that they have a size-dependent tunable absorption and
emission in visible and near IR regions.
Other peculiarities that make Qdots such an useful tool in biology are the brightness, the
photostability, the narrow emission and broad absorption bands, the large one- and multi-photon
absorption cross-section and their dimensions, that allow the precise localization of single crystals (for
reviews see Biju et al., 2010; Pinaud et al., 2010).
Qdots can be covalently or non-covalently linked to the molecule of interest (antibodies, proteins,
nucleic acids), allowing the labeling of proteins, cellular structures and organelles and providing a high
signal-to-noise ratio.
The simplest application of Qdots in biology is their use in immunohistochemistry experiments
on fixed samples. This application was proposed by Burchez (Bruchez et al., 1998), who used Qdots to
detect actin filaments in cultured fibroblast. Later on, not only single- but also multiple staining have been
performed. Indeed, different sizes of nanocrystals may be excited with monochromatic light, resulting in
many emission colors that may be detected simultaneously (Zahavy et al., 2005)(for reviews see Byers
and Hitchman, 2010; Chan et al., 2002). Immunohistochemistry experiments rely on the combination of
biotinylated primary/secondary antibodies and streptavidin coated Qdots. The same approach can be used
in flow cytometry (Wu et al., 2007). Qdots–labeled oligonucleotide probes were used in fluorescence in
situ hybridization (Pathak et al., 2001) not only for qualitative experiments but also for quantification
(Xiao and Barker, 2004), and were used to detect both DNA or RNA.
Beside their applications on fixed samples, Qdots provide a powerful tool for live imaging
experiments (Michalet et al., 2005). Qdots have been used in animals for long-term experiments. Large
amounts of Qdots can be transferred into live mammalian cells, either by non-specific pinocytosis,
microinjection or peptide-induced transport. Labelled cells have been used to study embryogenesis,
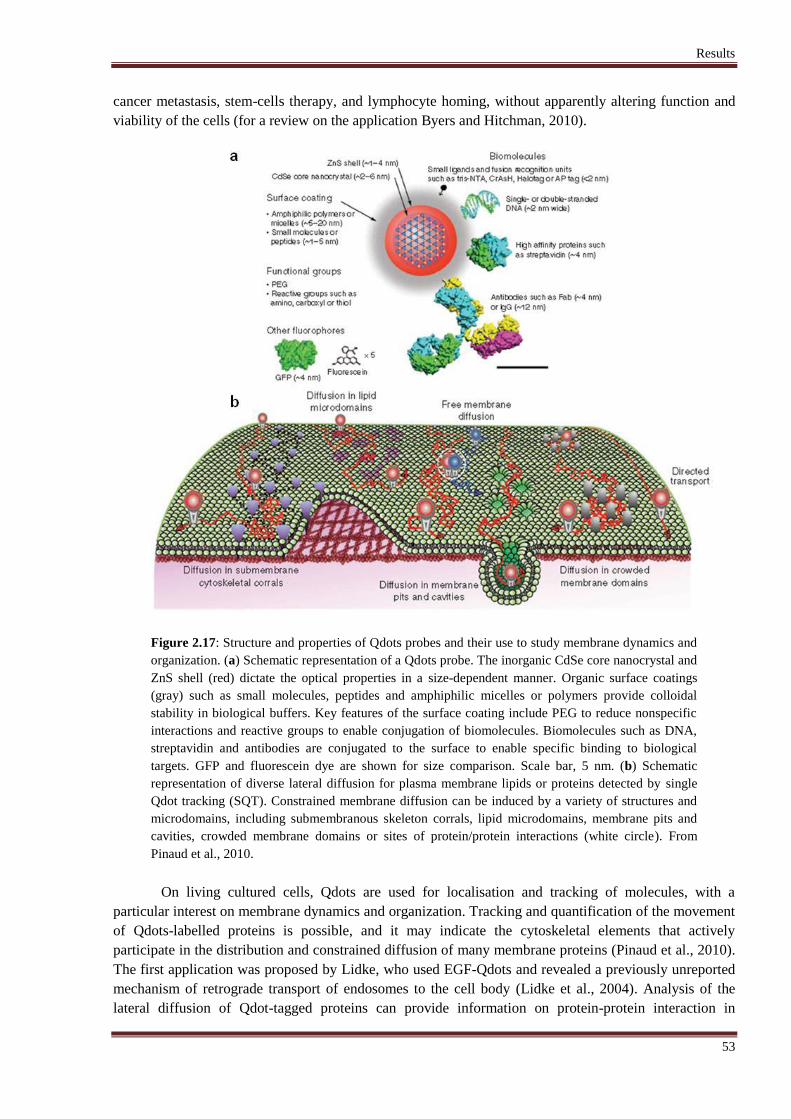
Results
53
cancer metastasis, stem-cells therapy, and lymphocyte homing, without apparently altering function and
viability of the cells (for a review on the application Byers and Hitchman, 2010).
Figure 2.17: Structure and properties of Qdots probes and their use to study membrane dynamics and
organization. (a) Schematic representation of a Qdots probe. The inorganic CdSe core nanocrystal and
ZnS shell (red) dictate the optical properties in a size-dependent manner. Organic surface coatings
(gray) such as small molecules, peptides and amphiphilic micelles or polymers provide colloidal
stability in biological buffers. Key features of the surface coating include PEG to reduce nonspecific
interactions and reactive groups to enable conjugation of biomolecules. Biomolecules such as DNA,
streptavidin and antibodies are conjugated to the surface to enable specific binding to biological
targets. GFP and fluorescein dye are shown for size comparison. Scale bar, 5 nm. (b) Schematic
representation of diverse lateral diffusion for plasma membrane lipids or proteins detected by single
Qdot tracking (SQT). Constrained membrane diffusion can be induced by a variety of structures and
microdomains, including submembranous skeleton corrals, lipid microdomains, membrane pits and
cavities, crowded membrane domains or sites of protein/protein interactions (white circle). From
Pinaud et al., 2010.
On living cultured cells, Qdots are used for localisation and tracking of molecules, with a
particular interest on membrane dynamics and organization. Tracking and quantification of the movement
of Qdots-labelled proteins is possible, and it may indicate the cytoskeletal elements that actively
participate in the distribution and constrained diffusion of many membrane proteins (Pinaud et al., 2010).
The first application was proposed by Lidke, who used EGF-Qdots and revealed a previously unreported
mechanism of retrograde transport of endosomes to the cell body (Lidke et al., 2004). Analysis of the
lateral diffusion of Qdot-tagged proteins can provide information on protein-protein interaction in
Results
54
membrane or on structures such as microdomains and membrane cavities (Pinaud et al., 2009) and the
entry-exit kinetics of receptors (for a review Triller and Choquet, 2008) (Figure 2.17b). In particular,
lateral diffusion of surface neurotransmitter receptors is a key pathway to regulate receptor trafficking to
and from synapses. Indeed, receptors enter and exit synapses mainly by lateral diffusion within the plane
of the membrane while their retrieval and addition from and to the plasma membrane by endo- and
exocytotic processes occur largely at extrasynaptic sites. Quantum dots are a useful tool for the labeling
and tracking of surface receptors, with an appropriate spatial and temporal resolution (Groc and Choquet,
2008; Groc et al., 2007).
Beside the dynamics at the membrane level, Qdots probes allow real-time visualization of cellular
internalization pathways and long-term tracking of molecules directly inside cells. In particular, Qdots
functionalized with receptor ligands provide means to both activate membrane receptors and follow their
intracellular fate. Endosomal retrograde transport of EGF (Lidke et al., 2005; Lidke et al., 2004) and NGF
(Cui et al., 2007; Echarte et al., 2007; Rajan et al., 2008; Zhang et al., 2010) were investigated through
this approach.
Given their applications for live experiments and their heavy metal core, the issue of toxicity of
Qdots should be taken into account. Many studies indicated that they can be delivered into cells without
any detectable effect on cellular viability, morphology or functions, even with long exposure times. As an
example, Qdots were injected in mice tail veins and 4 month later there was no evident necrosis in the
tissues where they had deposited (liver, skin, bone marrow and other organs) (Ballou et al., 2004).
However, their stability may be compromised via photolysis or oxidation. Indeed, extended UV
illumination may cause photolysis and release of cadmium ions (Derfus et al., 2004). Another important
issue that should be considered when using Qdots is the surface modification: it changes not only the
physicochemical properties but also the cytotoxicity (Hoshino et al., 2004). These and other results
suggested that there is a dependency on the surface coating in determining the toxicity experienced by the
cells, which affects both the level of toxic material released from the nanoparticles and their localisation.
Indeed, non-functionalised Qdots often end up in the cytoplasm because of non-specific entry, while
functionalised ones reach different organelles, according to the moiety attached (for a review on Qdots
toxicity Bottrill and Green, 2011). Overall, it is better to keep the concentration of Qdots as low as
possible and to carefully choose their capping.
2.3.2 TRK RECEPTOR RETROGRADE TRANSPORT
Ligand binding stimulates receptors in nerve terminals. Receptors are packed into discrete
membrane-bound vesicles that are internalized to form signaling endosomes, with the active domain
exposed to the cell cytosol (Beattie et al., 1996). Thus, receptors within endosomes remain catalytically
active. These vesicles are then loaded onto microtubule motor transport highways within the cell and
continue signaling as they travel through axons to cell bodies. This mechanism works to propagate
biochemical signaling cascades within cells and in neurons. Thus, intracellular responses to target-derived
neurotrophins can be divided into two categories based on location. The first group constitutes the local
signaling that takes place within axons, which might or might not require the formation of signaling
endosomes. The second group of responses occurs at the cell bodies, and represents signaling events that
emanate from transported, activated receptors within signaling endosomes (Heerssen and Segal, 2002;
Segal, 2003). The importance of signaling endosomes is given by the evidence that an aberrant retrograde
transport of BDNF is observed in some models of amyotrophic lateral sclerosis (Devon et al., 2006).
The dynamics and kinetics of the trafficking of Nerve growth factor (NGF) and its receptor TrkA
have been extensively dissected, using also Qdots. The first paper reporting NGF coupled to Qdots
appeared in 2005 and demonstrated that biotinylated NGF bound to streptatividin-Qdots retain

Results
55
bioactivity, activate TrkA receptors, and initiate neuronal differentiation in PC12 cells (Vu et al., 2005).
The same group observed that 15min after treatment Qdots-NGF bind to PC12 cell membranes in a
punctuate pattern. At longer times, a majority of membrane-bound Qdots-NGF are rapidly internalized
into the cell cytosol (Rajan et al., 2008). Internalized Qdots are contained in microtubule-associated
vesicles and possess transport properties that reflect TrkA receptor dynamics (Sundara Rajan and Vu,
2006).
The dynamics of the retrograde transport of NGF in the processes of differentiated PC12 cells
were analyzed by Echarte and colleagues using streptavidin-Qdots coupled to monobiotin-NGF (Echarte
et al., 2007). Authors demonstrated that 10-35% of the Qdot-NGF-receptor complexes were mobile and
had a bidirectional step-like motion. This trafficking requires intact microtubules and has a mean velocity
of 0,15 µm/s on individual runs and a net retrograde speed of 0,054 µm/s.
At the same time Cui et al. investigated the retrograde transport of NGF in compartmentalized
cultures of rat dorsal root ganglion (DRG) (Cui et al., 2007). Streptavidin-Qdots coupled to NGF with 3
biotin monomers were used. They saw a “stop-and-go”, unidirectional retrograde motion, even if short-
distance anterograde movements were occasionally observed. The average speed was 1,31 µm/s. The
authors also saw that the majority of NGF-endosomes contain only a single NGF dimer and have 50-
150nm diameter.
Later on, the same tool was used on microfluidic devices to analyze the effect of the temperature
on the retrograde transport (Zhang et al., 2010). In these devices, cell bodies and axon termini of DRG
cells can be controlled separately and Qdot-NGF showed again a movement exclusively toward the cell
body with a characteristic stop-and-go motion. The rate of retrograde transport decreased exponentially
with temperature.
Although the dynamics of TrkA trafficking have been so exhaustively studied, little information
is available on the TrkB dynamics. Recently superparamagnetic nanoparticles (MNPs) functionalized
with TrkB agonist antibodies were used. MNPs were endocytosed into signaling endosomes by primary
retinal ganglion cells that activate TrkB-dependent signaling, gene expression and promote neurite
growth. These MNP signaling endosomes are trafficked into nascent and existing neurites bidirectionally
(Steketee et al., 2011).
Thus, we want to study the transport of the TrkB-BDNF complex in hippocampal neurons
exploiting the Qdots technology, since it might be different from the one observed in DRG and it would
unveil new aspects of the cellular response to BDNF.
In order to be as similar as possible with the experiments performed using beads as vectors for
local delivery, in which the protein BDNF was covalently attached to carboxylic groups present on the
surface of beads, we decided to use carboxylated Qdots.
These Qdots have been used to study the kiss-and-run process, a nonclassical mode of fusion
wherein vesicles fuse transiently with plasma membrane to release neurotransmitter and are quickly
recaptured on site without loss of shape and possibly other aspects of their identity (Zhang et al., 2007;
Zhang et al., 2009). Qdots with carboxyl-exposed coating were seen to bind to neuronal processes in
strong preference to neighbouring glia. Moreover no significant effect was observed in EPSC (evoked
post-synaptic current) amplitude at synapses loaded with Qdots or sham-treated (Zhang et al., 2007).

Results
56
2.3.3 MATERIALS AND METHODS
2.3.3.1 QUANTUM DOTS FUNCTIONALIZATION
Qdot® 655 ITK™ carboxyl quantum dots were purchased from Invitrogen (cat. Q21321MP).
EDAC, BDNF, and BSA were the same as the one used for beads functionalization (see paragraph
2.1.3.2). Coupling was performed in borate buffer 10mM pH 7.4 in glass vials, at room temperature (RT)
and under shaking. After the reaction of the protein with Qdots (details will be described in paragraph
2.3.4.1) the conjugates were filtered through ultrafiltration units with 100 kDa cutoff (Millipore, Amicon
Ultra-2 Centrifugal Filter Unit with Ultracel-100 membrane, cat. UFC210024PL). Qdots were washed 5
times with 500 µL borate buffer 50 mM pH 8.3 (boric acid and borax, 50 mM each) and centrifuged 5
min at 25°C and 4000 rpm. Elution was performed by inverting the ultrafiltration units and spinning 2
min at 1000 rpm.
Borate buffers were prepared starting from 200 mM sodium borate and 200 mM boric acid stock
solutions. The two solutions were mixed together until the desired pH was reached. Stock solutions,
which were 200 mM, were then diluted to 10mM or 50 mM with de-ionized water.
The reaction was controlled in 0,5% agarose gel electrophoresis, run at 80 V. For dot blot
experiments, a drop of solution was placed on a nitrocellulose membrane. Membrane was hydrated 30
min in PBS. Then 45 min at RT with 2% blocking solution (Amersham ECL™ Advance Western
Blotting Detection Kit) were performed, followed by 1h incubation with primary antibodies in the same
buffer (anti-BSA Sigma 1:2000; anti-BDNF N20 SantaCruz 1:1000). After 3 washes 10 min each in 2%
blocking solution, incubation with secondary antibodies conjugated to HRP (1:10000) was performed.
Subsequently, membrane was washed 3 times in blocking solution and once in PBS. For the detection
ECL or ECL Advanced (both Amersham) were used.
2.3.3.2 CELL CULTURE AND TRANSFECTION
Primary hippocampal neurons were prepared as previously described (paragraph 2.1.3.1).
SHSY-5Y cells were grown in DMEM medium supplemented with 10% FBS and 5%
Penicillin/Streptomycin (all reagents from Euroclone). Cultures were grown in a 5% CO2-humidified
incubator at 37°C.
For transfection experiments, cells were plated in 24-well plates. Growing medium was replaced
just before the transfection with a medium without antibiotics. Transfection was performed using
Lipofectamine 2000 (Invitrogen, cat 11668-019) (2 µL in 50 µL MEM) and 1 µg DNA (diluted in 50 µL
MEM). After 5 min incubation at RT, the two solutions with Lipofectamin and DNA were mixed and
added to the cell culture 20 min later. Medium was replaced with complete DMEM 2-5h after
transfection.
2.3.3.3 LIPOSOME PREPARATION, MANIPULATION AND IMAGING
Liposomes with Qdots encapsulated inside were prepared according to the protocol described in
paragraph 2.2.5.2. Manipulation and imaging were performed on the same setup described in
paragraph 2.2.5.2.
2.3.4 RESULTS
Several issues should be considered when using Qdots as nanovectors for tracking of BDNF
retrograde transport. First of all, BDNF coupling to Qdots should be optimized, using a reaction that does

Results
57
not alter the biological activity of the protein. Later on, our imaging capacity of single Qdot should be
tested, as well as the possibility of delivering small amounts of nanocrystals, in order to reduce their toxic
effects.
2.3.4.1 OPTIMIZATION OF QDOTS FUNCTIONALIZATION
In order to use Qdots for the tracking of single molecules, it is necessary to generate a
bioconjugate, in which the molecule of interest is linked to the reporter (the Qdot). Usually, streptavidin-
Qdots are bound to biotinylated proteins. The use of this approach has two main drawbacks: firstly, even
if the binding of streptavidin to biotin is strong, the protein is not covalently bound to the Qdot so it may
detach from it under certain conditions. Secondly, the dimension of the bioconjugate becomes larger and
this feature may interfere with the endocytotic process.
Thus, the first goal was the direct coupling of the desired proteins (BSA and BDNF) to the
carboxyl-Qdots. The chemistry used for the binding is the same used for silica beads, since we
demonstrated that it does not alter the biological activity of BDNF (Figure 2.3). Hence, the carboxylic
groups present on the surface of Qdots should form amide bonds with the amines of proteins. This
reaction was performed in presence of the coupling reagent EDAC. A strong scale-down of the reagents‟
quantities with respect to the manufacturers‟ protocol was required given the small amounts of BDNF
available (1 µg) and thus new experimental conditions were tested. To be sure that every Qdot had at least
one molecule crosslinked to its surface, we used a ratio 1:3 between Qdots and protein.
First of all different EDAC concentration were tested and the best one was 200 µg/mL (data not
shown). Then, different incubation times were tested, namely 30 min, 60 min, 90 min, and 120 min. This
test was performed using 1 µg of BSA (which corresponds to 9 x 10¹²
molecules) and 0,6 µL of Qdots
stock solution (3 x 10¹²
nanocrystals) in a total volume of about 120 µL. The reaction was performed as
follows:
0,6µL Qdots stock solution 8µM;
10µL BSA 100ng/µL diluted in borate buffer 10mM pH 7,4;
90µL borate buffer 10mM pH 7,4;
18µL EDAC 10mg/mL (in water).
Figure 2.18: Qdots functionalization. (a) Test of different functionalization times. QD NF: Qdots
non-functionalized. QD BSA: Qdots functionalized with BSA. (b) Successful functionalization of
Qdots with both BSA and BDNF (QD BDNF) proven in agarose gel electrophoresis. (c) Dot blot of
Qdots functionalized with BDNF.
Following the reaction, bioconjugates were washed on ultracentrifugation units, recovered in
borate buffer 50 mM pH 8,3 and analyzed using agarose gel electrophoresis. As depicted in Figure 2.18a,
at all the times tested the electrophoretic mobility of treated Qdots was different from non-functionalized

Results
58
ones, indicating that the coupling occurred. However, while at 30min a smeared band can be seen, at
longer times, the mobility of the bioconjugates decreases, indicating that larger aggregates are forming.
After 2 hr of incubation, most of Qdots cannot even enter the agarose gel matrix and remain in the well,
indicating that their dimension is too large. Thus, 30 min of incubation with EDAC was chosen as the
best condition.
2.3.4.2 BIOLOGICAL ACTIVITY
We then tested the ability of functionalized Qdots to bind the BDNF receptor TrkB and to be
endocyted together with it. To this aim we transfected SHSY-5Y cells (a human
derived neuroblastoma cell line) with a TrkB-GFP fusion protein. Cells were incubated 30 min with
Qdots before being fixed. Indeed, after half an hour Qdots should be already endocyted (Rajan et al.,
2008). Non-functionalized Qdots and BSA-Qdots did not colocalize with TrkB-GFP (Figure 2.19), while
BDNF-Qdots colocalize with the receptor. This indicates that BDNF-Qdots were endocyted together with
the receptor, along the specific receptor-mediated endocytotic pathway. Indeed, Qdots may be brought
inside a cell also through other non specific mechanisms, such as phagocytosis. Thus, this images
demonstrate the possibility of using Qdots for the tracking of BDNF-endocyted molecules, and hence to
study the trafficking of BDNF signaling endosomes.
Figure 2.19: BDNF Qdots colocalize with TrkB. SHSY-5Y cells were transfected with TrkB-GFP
and incubated 30min with Qdots. Confocal images show colocalization between TrkB and Qdots
functionalized with BDNF. On the contrary, no colocalization was observed for non functionalized
Qdots or for BSA-Qdots. Scalebar 5µm.
When applied to rat primary hippocampal neurons, functionalized Qdots immediately sticked to
the membrane of cells. Most of them exhibited a Brownian motion probably caused by the
rearrangements of the membrane (Figure 2.20). BDNF-Qdots may attach to TrkB receptors on the
surface of cells and thus indicate the dynamics of the receptor, but at the moment we cannot exclude an
unspecific binding to the membrane. However, among all these Qdots that do not show a clear trafficking,
there are some that travel along the neuronal processes with a well established direction (Figure 2.20).
Considering their velocity (about 4 µm/s), this particle can only be actively transported inside the cell by
cargos that shuttle vesicles. Hence, it is reliable that these Qdots have been endocyted and are within

Results
59
signaling endosomes. Further experiments are necessary to prove this hypothesis and to study the
dynamics of Qdots endocytosis.
Figure 2.20: Qdots trafficking. BDNF-Qdots bath applied to hippocampal neurons deposit on their
membrane and show a confined motion. 10 seconds-long time lapse sequence of the indicated area, in
which a BDNF-Qdot is moving along a neuronal process. The position of the Qdot is indicated by the
yellow lines.
2.3.4.3 QDOTS DELIVERY WITH LIPOSOMES
Considering the toxic effects that Qdots may have and the fact that they can interfere with the
cellular responses, we decided to encapsulate them within liposomes. Indeed, with the technique
described in the previous section (2.2), we should be able to locally deliver small number (tens) of Qdots.
This would allow us to study the retrograde transport from specific cellular compartments of neurons and
to reduce the side effects of Qdots. Moreover, delivery of small numbers of nanocrystals would
significantly reduce the background of the images acquired and allow an easier analysis of the
experiments.
Qdots have already been encapsulated inside liposomes (Sigot et al., 2010). These liposomes
were biotinylated-lipid particles (BLP) produced by a detergent dialysis technique, where the inclusion of
a small amount of PEG-lipids allowed the self-assembly of stable BLPs. The lipid vesicles produced were
100 nm large and contain 2-5 Qdots. Since BLPs are smaller than the diffraction limit, they cannot be
visualized when manipulated in conventional transmission microscopy. Thus, they are not suitable for our
purpose, in which micrometric vesicles are needed.
The possibility of encapsulation of nanocrystals in large unilamellar vesicles was successfully
tested, as shown in Figure 2.21. Liposomes were prepared in the same conditions that were used for
Sema3A and Netrin-1 (see section 2.2 for details). Lipidic films were hydrated with the desired solution
(in this case Qdots at the desired concentration, sucrose 100mM and PBS) and shaken. According to the

Results
60
Qdots concentration and size of liposome, different numbers of Qdots can be placed inside the vesicle.
For instance, on average a single Qdot could be encapsulated in a liposome of 1 µm diameter using a
Qdot solution of 1 nM concentration. Encapsulation was successful for both non-functionalized
nanocrystals (Figure 2.21A, D) and functionalized ones (data not shown). Qdots can freely move inside
the lumen of the vesicle, as demonstrated in Figure 2.21D by the trajectory obtained from Qdot tracking.
This free movement supports the hypothesis of an effective delivery by liposome photolysis.
Qdots delivery by photolysis was effectively tested for manipulated liposomes. A liposome was
positioned in the proximity of a neuron with optical tweezers (Figure 2.21E). It contained several Qdots
moving inside its lumen (Figure 2.21F, G). The vector was broken by a UV-pulse. Membrane
rearrangements occurred (Figure 2.21H), suggesting a successful photolysis. Indeed, fluorescence images
demonstrated that there were no Qdots left in the vector (Figure 2.21I). Bleaching or damaging of Qdots
due to the UV-pulse can be ruled out, since some aggregates of crystals attached to the outer membrane of
the liposome were still visible.
Figure 2.21: Encapsulation of Qdots within liposomes and their release. (A-D) A single non-
functionalized Qdot is encapsulated in a liposome and it freely moves inside its lumen. Rehydrating
solution had a Qdots concentration of 80 nM. (A) transmission image of the liposome. (B)
Fluorescence image of the Qdot. (C) Merging of the transmission and fluorescence images. (D)
Trajectory of the Qdot moving inside the liposome imaged 1 frame every 50 msec for about 15 sec.
(E-I) Manipulation and release of Qdots from a liposome (250nM). (E) Liposome was manipulated
with optical tweezers and position at the site of interest. The liposome is indicated with the arrow. (F,
G) Transmission and fluorescence image of the liposome before the photolysis. Several Qdots can be
seen inside the vesicle (G). (H, I) Liposome after the photolysis. Some rearrangements in the shape of
the liposome occurred, indicating that it was hit by the UV pulse. Moreover no Qdots are detected
inside the lumen of the liposome (I).
2.3.5 DISCUSSION
Quantum dots are nanocrystals with exceptional optical properties which are becoming a
powerful tool for the study of cellular events at a single molecule level. Qdots brightness, in particular,
allows their visualization also with conventional epi-fluorescence microscopy (Pinaud et al., 2010).
Moreover, thanks to surface modifications, the coupling of almost any desired chemical group or
molecule to their surface is Nowadays possible. These properties make Qdots an extraordinary alternative
to organic fluorescence dyes. and permit experiments that were impossible before, such as the tracking of
single receptors dynamics.
In the case of neurotrophins, tracking of receptors trafficking may unveil new signaling
mechanisms related to the so-called “signaling endosomes”, a cellular mechanism for long distance

Results
61
communication. These signals are intended to transmit information from the pre-synaptic terminal
receiving the secreted factors to its corresponding cell body. These signaling factors are packed into a
discrete, coherent, membrane-bounded organelle that moves along the length of the axon via a
cytoskeleton-based transport machine (Howe and Mobley, 2004). Among the factors that use the
signaling endosomes mechanism, the family of neurotrophins is one of the most interesting, since the
signals should travel along the neurites for long distances. While trafficking of TrkA (the NGF receptor)
has been characterized in different cell types (Cui et al., 2007; Echarte et al., 2007; Howe and Mobley,
2004; Vu et al., 2005), to our knowledge the retrograde transport of TrkB/BDNF has never been
dissected. Therefore, we decided to use the approaches employed for the experiments on NGF (i.e. Qdots)
to tackle this questions.
With respect to the papers on NGF, in which the biotinylated protein was coupled to steptavidin-
coated Qdots, we decided to directly bind BDNF to Qdots through the formation of amide bonds. In this
way, the complex BDNF-Qdots is smaller, and hence its internalization in signaling endosomes should be
easier. The ability of our bioconjugates to be internalized together with TrkB receptor was successfully
tested in transfected SHSY-5Y cells. However, further experiments should be done in order to study the
dynamics of this process and to define the best time point at which specific endocytosis occurs not only in
cell lines but also in primary cultures.
Considering the toxic effects that Qdots may have on cells (Bottrill and Green, 2011), the
delivery of small amounts of nanocrystals was also investigated. Optical trapping of single Qdots was
already demonstrated (Jauffred and Oddershede, 2010) but for our purpose it is not feasible for two
reasons: first trapping of a single Qdot is not easy (usually more Qdots are attracted in the trap), second if
one wants to visualize the Qdot, only fluorescence light should be turned on. However, without
transmission imaging the precise delivery at the desired cellular compartment is not possible. Finally,
considering the fact that not every BDNF-Qdot undergoes internalization, the delivery of more
bioconjugates is preferable, in order to increase the chances of success. For all these reasons, we decided
to encapsulate Qdots inside the liposome, a well-established technology. In this way, tens of Qdots can be
released at the site of interest. The possibility to manipulate Qdots-filled liposomes was experimented, as
well as their delivery after the photolysis of the vector with a UV-pulse. Interesting, UV pulses do not
affect Qdots fluorescence and therefore this method of delivery can be used.
Concluding, we developed a tool to study the trafficking of BDNF signaling endosomes in
primary neurons and minimized the side effects related to the use of Qdots. Additional experiments
should be performed for the optimization of the technique. In particular the kinetic of internalization
should be studied and the efficiency of neuronal stimulation should be improved. Indeed, sometimes
Qdots are released from liposomes following photolysis but they cannot be seen on the neighbor cells.
This problem can be related both to the control of the direction of release and to imaging limitations.
Indeed, the objectives that were used during the experiments had a small depth of focus and the signal
that was coming from parts of the specimen which is out of focus could not be detected. If the Qdot
reaches the cell on its top, it might not be detected. However, after the addressing of these problems the
technique will be efficiently used for the study of all the different aspects of the biological question
proposed. Moreover, the proposed approach can be applied also to microfluidic devices in which cell
bodies are physically separated by the axon and hence a better imaging will be possible.

Results
62
2.4 SUPER-RESOLUTION IMAGING OF GROWTH CONES
Super-resolution fluorescence microscopy was designated as the method of the year 2008 by
Nature Methods for its extraordinary impact in biological research. Indeed, it allows the visualization of
structures that before could be seen only with electron microscopy. This method is unique in providing
enough resolution to highlight features that would otherwise be impossible to distinguish with
conventional microscopy. An interesting field of application of super-resolution microscopy is imaging of
the cytoskeleton of cells, considering the density and complexity of its network. Within neuronal growth
cones, in particular, actin networks or bundles are fundamental, since they establish the shape and
morphology of these structures. Hence, super-resolution imaging of growth cones will help researchers to
unveil new aspects of their dynamics.
2.4.1 SUPER-RESOLUTION OPTICAL MICROSCOPY: NOVEL TECHNIQUES AND PERSPECTIVES
FOR BIO-SAMPLES IMAGING
Fluorescence microscopy is currently one of the more powerful and versatile techniques available
for biological studies (Lichtman and Conchello, 2005). Taking advantage of the optical transparency of
cells, light microscopy uniquely provides non invasive imaging of the interior of cells in three dimensions
(3D). Moreover, it allows the detection of specific cellular constituents through fluorescence tagging
(Hell, 2007).
Although the most specifically labelled cellular constituents can readily be detected in a
conventional light microscope, the resolution of light microscopy (hundreds of nanometers, see
paragraph 1.3) is approximately the size of an intracellular organelle. Thus, it is inadequate for
dissecting the inner architecture of many subcellular structures. Super-resolution fluorescence microscopy
techniques that break the diffraction barrier, improving lateral resolution, have been developed starting
from the middle of „90.
The most popular super-resolution techniques are SPEM/SSIM (Saturated Pattern Excitation
Microscopy or Saturated Structured Illumination Microscopy), STED (STimulated Emission Depletion
microscopy), PALM/STORM (PhotoActivation Localization Microscopy, STochastic Optical
Reconstruction Microscopy), GSD (Ground State Depletion microscopy) and RESOLFT (REversible
Saturable/Switchable Optical Linear Fluorescence Transition) (for reviews on the super-resolution
microscopy techniques see Hell, 2007; Hell, 2009; Huang et al., 2010; Leung and Chou, 2011).
The common characteristic of all these super-resolution techniques is the use of reversible
switching on and off mechanisms in order to discern objects that are closer than 200 nm. The switching of
a fluorescent molecule on or off requires two states: a fluorescent (on) state and a dark (off) state,
connected by a transition representing the actual switch (Hell, 2009).
The aforementioned super-resolution techniques can be divided into groups according to the
approach used for the illumination and readout. In the ensemble, targeted readout mode, one of the two
states (on or off) is established by patterned illumination, which generates a subdiffraction-sized spot at
the position of a zero to read out an unknown number of fluorophore molecules. The image is assembled
by deliberate translation of the zero. In the stochastic readout mode, a single switchable fluorophore from
a random position within the diffraction zone is switched to a stable activated state, while the other
molecules remain in dark state. The coordinate is calculated from the centroid of the diffraction
fluorescence spot measured by a pixelated detector. The coordinate pops up stochastically depending on
where the interrogated marker molecule is located (Hell, 2007). Among super-resolution techniques, only
PALM/STORM uses a stochastic read-out. All the other ones have a targeted read-out.

Results
63
The nature of the switching mechanism is another feature that can be used to classify super-
resolution techniques. STED, GSD and SPEM utilize photophysical transitions, while in RESOLFT and
PALM/STORM the transition is photochemical. Photophysical transitions are transitions between the
different states of the fluorophore, which can be the ground state S0, the singlet state S1 or the metastable
triplet state T1. On the contrary, photochemistry transitions, rely on isomerisation processes, in which
atoms are relocated or bonds formed and broken.
The maximum achievable resolution can be improved by a factor of ~2 for SPEM/SSIM, while it
can be reduced down to few tens of nanometers with the other types of nanoscopy.
The advantages and application fields of super-resolution techniques are evident in particular in
the cell biology, microbiology and neurobiology areas, where they helped to solve several biological
questions related to colocalization issues or regarding subcellular structures.
2.4.2 STIMULATED EMISSION DEPLETION (STED) MICROSCOPY: PRINCIPLE AND
APPLICATION TO CELL IMAGING
The STED principle was proposed in 1994 (Hell and Wichmann, 1994). The basic idea behind
scanning STED microscopy is to confine the emission of fluorescent markers to a region that is much
smaller than that covered by the diffraction-limited excitation spot. Beside the canonical excitation laser,
a second, red-shifted beam (called the STED beam) is applied. This laser has the ability to annihilate the
molecular excitation and thereby prevents the molecules from fluorescing. Indeed, it brings an excited
fluorophore down to the lowest energy state before it can emit fluorescence signal. The depletion light is
applied as doughnut surrounding the excitation laser, in order to de-excite molecules only in the outer
region of the excitation spot (Figure 2.22). The STED photons act primarily on the excited state S1,
inducing stimulated emission down to a vibrational sublevel of the ground state S0vib
(Figure 2.22).
Subpicosecond vibrational decay empties S0vib
, so repumping into S1 is largely ineffective (Willig et al.,
2009). STED microscopy has been implemented mostly with pulsed beams, whereby the STED pulses of
typical 0.1–1.0 ns duration have followed (shorter) excitation pulses. By the time the STED pulse has
vanished, the population of the S1 is N(hSTED) = N0 exp(–σhSTED), where N0 is the initial population, σ10–
16cm
2 the cross-section for stimulated emission, and hSTED is the point-spread function (PSF) of the STED
pulse in photons per area per pulse. This formula assumes that the STED pulse is shorter than the
fluorescence lifetime, which is a few nanoseconds for organic dyes. Hence, the fluorescence is reduced by
a factor η(hSTED) = exp(–σ hSTED).
Using a doughnut-shaped STED pulse with a local zero (hSTED(0) = 0) implies that the
fluorescence emission is unaffected at r = 0 but is increasingly suppressed with increasing r (Figure 2.22,
right). Thus, the STED PSF confines the fluorescence emission to a region that is much narrower than the
excitation spot. The effective PSF heff can be shown to scale with the STED intensity according to the
following formula:
where the intensity I is given as the “saturation factor” z = I/Is. That is, it is given in multiples of
the saturation intensity Is at which the fluorescence drops to 1/e of its initial value. Is is characteristic of
the dye used. Scanning this reduced focal spot through the sample yields images of subdiffraction
resolution (Willig et al., 2009).

Results
64
Figure 2.22: STED principle. The STED beam is red-shifted with respect to the excitation beam
specific for a certain fluorophore. The detection windows is chosen so that both the excitation and the
STED wavelengths are avoided. The shape of the two beams is shown (upper left) as well as the
transition between the different energy states they induce. Right: breaking the diffraction limit using
STED. Normalized intensity profiles of the excitation PSF (exc), STED PSF (STED), De-excitation
probability (1-η) and effective PSF. Adapted from Willig et al., 2009; Willig et al., 2006.
STED microscopes can be built using both pulsed or continuous wave (CW) lasers. STED
microscopy with pulsed lasers relies on tightly synchronized trains of pulses: excitation pulses of <80 ps
duration are typically followed by 250-ps pulses for STED. The 200-fs pulses originating from the laser
system have to be stretched by 1,000 folds using optical fibers or gratings and should be synchronized
with their excitation counterparts (Willig et al., 2007). CW STED microscopes are easier to implement
since no synchronization is required. Indeed, temporal separation between excitation and STED is not
crucial as long as the rate of population of the excited state is much lower than the depletion rate (Willig
et al., 2007). CW STED, however, needs greater average power than pulsed-STED, since the dye is
continuously illuminated.
A reduction in the required power of lasers (Hofmann et al., 2005) can be obtained with
REversible Saturable Optically Linear Fluorescence Transition microscopy, which exploits the property
of some proteins to be switched on and off at the appropriate wavelength. During illumination with light
these proteins change their conformation. In this process they gain or lose their ability to emit
fluorescence. Relatively low power intensities are required to induce this conformational changes in
proteins (Hofmann et al., 2005).
STED microscopy has been applied in many biological fields. For instance it was used to
demonstrate that the native lipid environment is not sufficient for correct Syntaxin 1 (a proteins that
defines sites at which secretory granules fuse with the membrane) clustering and that additional
cytoplasmic protein-protein interactions are required (Sieber et al., 2006). With STED the diffusion of
single lipid molecules in nanosized areas in the plasma membrane of living cells can be detected,
allowing the study of lipid rafts (Eggeling et al., 2009). Several are applications of STED in the
neurobiology field. For example, STED allowed the mapping and description of the vesicle mobility
within the highly confined space of synaptic buttons (Westphal et al., 2008). Actin remodeling in the
spines of living brain slices was observed (Urban et al., 2011) as well as living synapses re-shaping
(Nagerl and Bonhoeffer, 2010). Finally, very recently STED on living mice was also demonstrated
(Berning et al., 2012).

Results
65
To our knowledge, no super-resolution fluorescence images of cytoskeleton in growth cones are
available. Considering the limitation of conventional optical microscopy, two approaches were used to
study this structure: electron microscopy (Gordon-Weeks, 1989; Letourneau, 1983; Lewis and Bridgman,
1992) or model organisms which have large growth cones. In particular Aplysia californica, a sea slug,
has growth cones that are five to ten times larger than growth cones from other species, making them
suitable for quantitative high-resolution imaging of cytoskeletal protein dynamics and biophysical
properties (Suter, 2011).
Considering our interest in growth cones and the lack of real fluorescence super-resolution
images of these structures, we collected STED image of both actin and tubulin. The final goal would be to
understand the cytoskeletal rearrangements induces by chemotactic stimuli. However, at the beginning
images of fixed samples are required.
2.4.3 MATERIALS AND METHODS
2.4.3.1 GROWTH CONES PREPARATION AND STAINING
Rat hippocampal neurons were kindly provided by the lab of Prof. Dr. Professor Emeritus Erwin
Neher (Max-Planck-Institut für biophysikalische Chemie, Göttingen). 10-15 x 103 cells were plated on
each coverslip.
Neurons were then washed in PBS, fixed in PFA 3% and 0.1% Glutaraldehyde for 15 min,
quenched with NH4Cl 100 mM for 15 min and permeabilized with Triton X-100 0,1% for other 5 min.
Then, neurons were incubated with primary antibody (anti-β-Tubulin 1:100, Sigma cat. T5201) in PBS 1
hr at RT. After washing them in PBS, they were incubated for 1 hr at RT with secondary antibody (sheep
anti-mouse Atto- 647N 1:100) and phalloidin Atto-590 (1:50, Attotec cat. AD590-81). Samples were then
washed three times in PBS, once in H20 and mounted using Mowiol.
2.4.3.2 STED SETUP
The setup used (described by Bückers et al., 2011) was a STED microscope optimized for
colocalization experiments with up to three colors, located at the Max-Planck-Institut für biophysikalische
Chemie, Department of Nanobiophotonics, Göttingen (Germany).
The images were recorded with a custom-built STED microscope combining two pairs of
excitation and STED laser beams, all stemming from a single supercontinuum laser source. Whereas the
excitation wavelengths (570±2 nm and 650±2 nm) were selected from the supercontinuum source using
an acousto-optical tunable filter (AOTF, AA Opto-Electronic, Orsay Cedex, France) the STED
wavelengths (720±10 nm, 755±15 nm) were extracted using prism monochromators ensuring strict
wavelength selections. After filtering the appropriate wavelength ranges, the four beams were coupled
into separate polarization-maintaining single mode fibers. At the fiber outputs the beams were collimated
and sent to the objective lens. The corresponding excitation and STED beams were combined using
dichroic mirrors to give two pairs of beams with orthogonal polarization. The beam pairs were then
combined with a polarizing beam splitter cube and coupled into the objective lens (PL APO 100×/1.40–
0.7 oil, Leica Microsystems, Wetzlar, Germany). Two vortex phase plates (RPC Photonics, Rochester,
NY, USA.) placed into the STED beams followed by a superachromatic quarterwave plate (600–2700
nm, B. Halle GmbH, Berlin, Germany) placed at the back of the objective lens afforded ring-shaped
STED foci with a zero-intensity minimum in their centre.
To ensure spatial overlap of the excitation and the STED foci, the diffraction patterns (“point
spread functions”) of the four beams were measured sequentially by recording scattered light from gold

Results
66
nanoparticles (80 nm) as they were scanned through the focal region. The alignment precision was on the
order of 5 nm, i.e. below the resolution achievable with the setup.
Since all four laser beams originated from a single source, no pulse synchronization was
necessary. Still, the simultaneous arrival of the excitation and the respective STED beam in the sample
had to be adjusted by matching the optical path lengths for each pair of beams. On the contrary, the pairs
of excitation and STED beams for the two color channels were time-shifted by about 40 ns using optical
fibers of different lengths. This pulse-interleaved acquisition scheme enabled the (quasi-)simultaneous
recording of both color channels: in addition to the spectral separation photons were assigned to a dye
according to their arrival time at the detector. Due to the simultaneous recording of both color channels
hardly any shift of the sample was possible during the recording time.
Figure 2.23: Setup of the multi-color STED microscope. From Bückers et al., 2011.
The fluorescence from the two fluorophores was separated from the laser beams with a custom
made multiband dichroic mirror (Chroma Technology, Rockingham, VT, USA). It was subsequently split
up with a second dichroic mirror (Z635RDC, Chroma Technology) according to the emission maxima of
the different dyes, and was finally cleaned up with bandpass and longpass filters (M620/40, M670/40 nm
and Z660LP, all from Chroma Technology). The fluorescence was then focused into separate multimode
optical fibers (Ø = 62.5 μm, Thorlabs, Dachau, Germany) which served as confocal pinholes. The fibers
were attached to single-photon counting modules (SPC-AQRH-13-FC, Perkin Elmer, Salem, MA) which
were connected to custom time gating electronics extracting the fluorescence signals following each of
the excitation/STED pulse pairs. Optionally, for the acquisition of fluorescence lifetime data, the time

Results
67
trace of the fluorescent signals was measured by a time-correlated single-photon counting (TCSPC)
module (SPC-730, Becker & Hickl GmbH, Berlin, Germany). Typically, images were acquired with pixel
sizes of 20 nm × 20 nm and a pixel dwell-time of 1 ms (Bückers et al., 2011).
2.4.4 RESULTS
STED images of cultured hippocampal neurons were acquired in order to unveil features of the
cytoskeleton, that are not visible with diffraction-limited microscopy. In particular, we focused our
attention on actin a tubulin, the two proteins that determine the morphology of growth cones (see section
2.2.1 for details on the cytoskeleton of growth cones).
2.4.4.1 ACTIN IMAGING
Actin has two different kind of organization in growth cones: bundles or network (see paragraph
2.2.1). Bundles are present within filopodia and actin network in lamellipodia. Actin was stained using
phalloidin in primary rat hippocampal neurons the day after plating. At this time point cells haven‟t yet
established a well connected network and hence growth cones are present.
Phalloidin was conjugated to Atto590 dye, which can be used for STED at 690 nm wavelength
(Wildanger et al., 2009) and at 720 nm (Bückers et al., 2011). Examples of STED and confocal images
can be seen in Figure 2.24. Confocal and STED images were acquired subsequently on the same region
of interest by simply turning on and off the STED beams. The improvement of resolution given by the
STED beam can be immediately appreciated. The resolution achieved with STED imaging was about 70
nm. While in most of the cases with confocal microscopy it is not possible to discern actin bundles within
filopodia, STED allows the discrimination of the single bundles. Striking examples are provided in the
close-up images (Figure 2.24C, E, I, K). In confocal images only a blurred line is present, which turns
out to be the signal coming from three (Figure 2.24C) or four (Figure 2.24I) different bundles when
using STED. These bundles can be clearly seen in line scan profile: separate picks can be distinguished in
the STED images (Figure 2.24D, J), while basically a single pick is observed in confocal images (Figure
2.24F, L).
It is however not possible to determine whether actin bundles are composed by a single filament
or more than one. However, in some cases, at the base of filopodia, more bundles can be distinguished,
even if on the tip of the structure they cannot be seen as separated (Figure 2.24A, G, indicated by the
solid wedges). In the corresponding confocal images a single, blurry filament is visualized (Figure 2.24B,
H).
In the growth cone depicted in Figure 2.24G the different regions characterizing the structure of
the cytoskeleton can be recognized (Figure 2.24). In particular, the central domain, can be seen where no
signal from phalloidin is present (Figure 2.24G, indicated with the asterisk). Close to the C domain, actin
arcs of the transition zone (T zone) can be observed (Figure 2.24G, indicated with empty wedge).
Differently to what was expected from literature, not all the actin bundles seem to originate from the
transition zone (Figure 2.24A, G). This fact may be due to a lack of sensitivity of the technique, to a
larger and less defined T zone or simply to the morphology of the two growth ones, since they have many
and closely packed filopodia and almost no actin network. A nice actin network is evident in Figure
2.26E, in which a growth cone with a large lamellipodia and almost no filopodia is shown. It should be
noticed how, with confocal imaging, the actin network can be appreciated as well. However, the image is
not so clear and sharp as the STED one.

Results
68
2.4.4.2 ACTIN AND TUBULIN IMAGING
STED allows also multicolor imaging. In particular, the setup previously described (paragraph
2.4.3.2) has two excitation beams at 570 nm and 650 nm respectively. Hence, we exploited the possibility
of using two staining. Besides actin, we marked tubulin, the other key element of the growth cone
cytoskeleton. Tubulin was stained according to immunofluorescence protocols with Atto647N, a dye
which is highly suitable for STED imaging (Willig et al., 2007). In both Figure 2.25C and Figure 2.26C
tubulin is present in thick fiber (stable microtubules) in the axon shaft and in the C domain. They form
dense, parallel arrays, characteristic of axon. Stable microtubules end where the T zone begins. However,
in the presented images, the distinction between C domain, T zone and periphery domain (P domain) is
not so evident as in the previous case (Figure 2.24G). Indeed, even if increasing levels of actin can be
observed towards the tip of the growth cones, no actin arcs are visible.
Nevertheless an interesting feature can be noticed in the P domain: thin, dynamic pioneer
microtubules are departing from the C domain and pointing towards the tip of growth cones (Figure
2.25C and Figure 2.26C, indicated with the solid wedges). As expected, colocalization between dynamic
microtubules and actin can be observed in some instances (Figure 2.26E).
In Figure 2.25C another interesting feature is present, and namely branched microtubules.
Branched microtubule array is indicative of an actively growing terminal (Conde and Caceres, 2009).
Curiously, in this growth cone the C domain is large compared to the P domain and no evident actin
organization is present. These signs may indicate the “engorgement”, that is the phase in with actin arcs
re-orient and T zone is invaded by microtubules of the C domain. In the confocal image of the same
structure (Figure 2.25D) it is not even possible to see these branching and actin structure appears noisy.
On the contrary, STED resolves that actin simply doesn‟t have an organized structure.
2.4.5 DISCUSSION
Actin and microtubules are highly organized in growth cones and have always attracted the
interest of scientists for their complex regulation and dynamics. Fluorescence microscopy provided
fundamental hints for their understanding but electron microscopy was necessary for a deeper structural
analyses. However, with respect to electron microscopy, far-field nanoscopy requires an easier sample
preparation and permits also live imaging experiments. The use of fluorescence imaging is hence
preferable.
Structure of the both actin and microtubules in rat hippocampal growth cones was analyzed using
STED microscopy. The STED beam allowed an improvement of the resolution, which dropped down to
70 nm. In this way details which were not discernible with confocal microscopy were visualized. The, in
particular regarding actin bundles in filopodia and branching of microtubules. Is should be noticed that
the actual dimension of actin filaments is of 7 nm, while microtubules are 25 nm large. Hence, an
improvement in the resolution in still possible.
To our knowledge these STED images are the first super-resolution images of actin and tubulin
structures within growth cones. These data confirmed the possibility of using STED microscopy for the
study of cytoskeleton of growth cones. Future experiments will be done on living, stimulated growth
cones to analyze the response of actin and microtubules to a defined and localized chemical cue.
However, to achieve this goal a different and faster setup for imaging is required.

Results
69
Figure 2.24: STED imaging of actin in growth cones. STED (A, C and G, I) and confocal (B, E and
H, K) images of two different hippocampal growth cones are compared. Squares in A, B, G and H
indicate the region that is enlarged respectively in C, E, I and K. (D, F, J and L) Plot profile of the
linescans indicated by the dashed lines in close-up images. Solid wedges in A and G indicate filopodia
at whose base more actin bundles can be seen. In G, * indicates the C domain. Empty wedge indicates

Results
70
the T zone. Images are shown in pseudocolors, according to the number of photon counts for each
pixel.
Figure 2.25: Double staining of tubulin and actin imaged with STED microscopy. (A, C, E) STED
images. (B, D, F) Corresponding confocal images. (A, B, C, D) Single staining, and (E, F) merging of
the two channels. Solid wedges indicate pioneer microtubules. Empty wedges indicate branching
microtubules.

Results
71
Figure 2.26: Double staining of tubulin and actin imaged with STED microscopy. (A, C, E) STED
images. (B, D, F) Corresponding confocal images. (A, B, C, D) Single staining and (E, F) merging of
the two channels. Solid wedges indicate pioneer microtubules.
Final Remarks and Conclusions
72
3. FINAL REMARKS AND CONCLUSIONS
Polarized cells are those in which a spatial asymmetry in their organization causes the plasma
membrane to be divided into discrete domains. Each domain has specific functions, characteristics, and
receptors. This means that the same stimulus applied to different domains may have different readouts.
Neurons are extremely polarized cells and in the last decades several techniques for the stimulation of
specific neuronal compartments were proposed. However, they have limitations (e.g. low handiness, low
spatial and temporal resolution) or are optimized only for few, well-established molecules. As a result,
most of the experiments are still being performed by bath application of the molecule of interest.
Therefore, the effects observed are not specific and correspond to the response of the whole cell to the
stimulus. However, in physiological conditions molecules are released mainly in a spatially and
temporally confined fashion.
In this Thesis we developed novel techniques for the local delivery of molecules based on optical
manipulation, as well as imaging tools. Indeed, it is important to see what you are manipulating and vice
versa. We focused our attention on two different kind of vectors (i.e. silica beads and liposomes), which
can carry the molecules to the site of interest. Their common characteristic is that they can be easily
trapped and manipulated with optical tweezers.
The first tested vectors were silica beads, which can be functionalized on their surface with the
molecule of interest. Through optical tweezers, single functionalized beads can be placed in contact with
the domain of interest of a cell. In this way, the proteins that coat the bead may bind their corresponding
receptor present on the cell membrane. Interestingly, internalization of the ligand is avoided with beads.
Indeed, since molecules are covalently linked to the vector, endocytosis is prevented. Beads system was
validated with the neurotrophin BDNF, a protein which exerts its functions by binding a receptor on cell
surface. We demonstrated that a single BDNF-coated bead is sufficient to activate different intracellular
signaling pathways and induce a cellular response.
Beads allow focal stimulation of cells and mimic systems in which a protein is either bound to the
extra cellular matrix or exposed on the membrane to stimulate the neighbour cell, or systems in which
molecules should travel along short distances. At synaptic level, for instance, neurotransmitters and
trophic factors are released from pre-synaptic sites and act on post-synaptic sites, which are few tens of
nanometers away.
However, in physiological conditions molecules can be released also by sources that are distant
from the target cell, which therefore senses a gradient. For instance, chemotactic stimuli influence the
movements of cells according to their concentration in the environment. Chemotaxis is a key mechanism
exploited by nature during development but it plays an important role also in other functions, such as
immune response or metastatic process. With beads, gradients of molecules cannot be generated.
Therefore, we decided to develop a second kind of vectors, which allowed the formation of a gradient of
molecules. These vectors are micron-sized liposomes, i.e. vesicles with a lipid bilayer and a lumen within
which almost any soluble molecule can be encapsulated. The release from liposomes is achieved by
temporary breaking the liposome membrane with a UV-pulse. In this way, molecules that are restrained in
the lumen can diffuse outside and generate a gradient. Liposomes have some advantages with respect to
beads: first, ligand can be endocyted and signaling endosomes can form. Second, the number of
molecules inside the liposome can be finely tuned, by simply changing the concentration of the

Final Remarks and Conclusions
73
rehydrating solution or the dimension of liposomes. Third, liposomes can be bath applied in the medium
and then a single vesicle can be chosen. Fourth, molecules are not chemically modified since they should
not be crosslinked to the vector. Indeed, stimuli are encapsulated inside the lumen and there confined.
Hence, there is no undesired leakage of molecules. On the other hand, only small amount of molecules
can be delivered with liposomes and the spatial resolution of the stimulation is poorer with respect to
beads.
The liposome technique was initially validated with KCl-filled vesicles. In the experimental setup
adopted, a depolarization in cultured hippocampal neurons was observed. Subsequently, the technique
was used to study the effect of two chemotactic proteins (Netrin-1 and Semaphorin-3A) on growth cone
motility. Netrin-1 showed an attractive behaviour, while Sema-3A was repellent. The fast morphological
changes in responses to these cues are due to rapid rearrangements of the cytoskeleton, and in particular
to actin and tubulin dynamics, which would be interesting to investigate. A first step in this direction was
done with the acquisition of super-resolution fluorescence (STED) images of actin and tubulin structures
in growth cones. Comparing to Abbe-limited microscopy, with STED we were able to outline much more
details, see single actin bundles, branching of microtubules and pioneer microtubules. These results
demonstrate that, thanks to its resolution, live imaging of actin and tubulin dynamics with STED
microscopy may allow the solution of many biological problems related to this topic.
Finally, nanovectors have been developed as well. In particular, functionalized quantum dots may
be used for the intracellular tracking of the endosomes. Indeed, given their small size and their brightness
Qdots are suitable for single molecule dynamic studies. In this Thesis we prepared BDNF-functionalized
Qdots, which were able to bind BDNF receptor and to be endocyted. Considering the toxic effects they
may have, we delivered Qdots with liposomes. This tool might now be used in two distinct ways: first of
all the dynamics of endocytosis and retrograde transport of signaling endosomes will be analyzed.
Second, it would be interesting to evaluate the differences in the biological response due to different
location of the signaling endosomes along the axon. Lastly, a comparison between the different delivery
techniques (i.e. beads, liposomes, Qdots) may unveil mechanisms or parts of signaling pathways which
are still unclear.
Concluding, different tools that respond to different experimental needs have been developed.
The best vector should be chosen according to each specific biological problem. Both beads and
liposomes are highly flexible as vectors, meaning that they can be exploited for different biological
problems and are not restricted only to the biological questions presented in this Thesis. In particular, the
presented technique may have several applications not only in neurobiology, but also in all the fields in
which gradients of molecules or a spatially restricted stimulation are required.

Acknowledgments
74
ACKNOWLEDGMENTS
The very first person I would like to thank is Dan Cojoc, who has been more than a supervisor
and more than a mentor for me. A warm thank you for the fundamental teamwork goes also to all the
other members of the OM lab: Giulietta Pinato, Sara Finaurini, Enrico Ferrari, Federica Tavano, Tiziano
Raffaelli, and Paolo Beuzer.
I would like to acknowledge also the other labs that took part to my PhD project. In particular,
prof. Enrico Tongiorgi‟s lab at the University of Trieste for hosting me during the experiments on beads
and on Qdots; prof. Vincent Torre‟s lab at SISSA for the collaboration during the experiments on growth
cones with Semaphorin and Netrin; Prof. Dr. rer. nat. Dr. med. h. c. Stefan Hell‟s lab at the Max Planck
Institute in Göttingen for the part on STED images.
Thanks to Stefania, Anna, and Andriy for the critical reading of this work.
Viva l‟A e po‟ bon!
Vorrei ringraziare tutte le persone che mi sono state vicino psicologicamente, fisicamente e a
suon di spritz e/o birrini in questi 3 anni. Premetto che l‟ordine è puramente CASUALE!!! Un infinito a
Svampi per aver portato una ventata di ottimismo, positività e festa festa nella mia vita. Fagiana! Sei il
mio orgoglio! Un grazie infinito va anche alla Comelliiiiii per tutte le sue perle di saggezza di ogni
mattina e per tutte le cose che solo lei riesce a dire in faccia schiettamente (la mia autostima ringrazia).
Grazie alla Migliorins, mia gemella di vita degli ultimi 5 anni per aver potuto sempre e comunque contare
su di te. Grazie a Fra: dopo 7 anni di convivenza è difficile stare senza di te! Ma tranquilla che imparerò
la strada per arrivare a Flaibano.
Grazie a coloro che mi hanno fatto divertire nei vari lab, rendendo gli esperimenti un po‟ meno
pesanti, e che ora sono da altre parti del mondo: ValeVaghi, Beuzeeeeeeer, Tiz. Quando vi penso, sorrido!
Grazie a tutti i compagni di dottorato, molto più di semplici colleghi. Un enorme in bocca al lupo
a tutti voi! Viva il XXIV ciclo! Firmato: la maestra. Un pensiero anche a tutti i compagni dell‟MCA:
l‟esperienza con voi segnerà di sicuro la mia vita! Grazie ai soci Allergenius per la pazienza in questi due
mesi con il loro project manager…
Thanks to the “german” guys. Dirk for your never-ending patience when “I think I have a
problem with the setup” and for your “mandiiii”, which makes me so proud of you; Andriy and Ila for
introducing me to the life in Göttingen and to Feuerzangebowle...and for the “unforgettable” concerts.
See you very soon guys!!
Last but not least, grazie alla mia famiglia. Ai miei genitori per avermi sempre sostenuto, pur non
facendo domande. Grazie a Francesca ed Enrico, per la comprensione umano/scientifica e per quello
spettacolo che è Davide.

Bibliography
75
BIBLIOGRAPHY
Abbe, E. (1873). Beiträge zur Theorie des Mikroskops und der mikroskopischen Wahrnehmung. Archiv für
Mikroskopische Anatomie 9, 413-468.
Akselrod, G. M., Timp, W., Mirsaidov, U., Zhao, Q., Li, C., Timp, R., Timp, K., Matsudaira, P., and Timp, G.
(2006). Laser-guided assembly of heterotypic three-dimensional living cell microarrays. Biophys J 91, 3465-
3473.
Allen, J. W., and Bhatia, S. N. (2003). Formation of steady-state oxygen gradients in vitro: application to liver
zonation. Biotechnol Bioeng 82, 253-262.
Amaral, M. D., Chapleau, C. A., and Pozzo-Miller, L. (2007). Transient receptor potential channels as novel
effectors of brain-derived neurotrophic factor signaling: potential implications for Rett syndrome. Pharmacol
Ther 113, 394-409.
Amaral, M. D., and Pozzo-Miller, L. (2007). BDNF induces calcium elevations associated with IBDNF, a
nonselective cationic current mediated by TRPC channels. J Neurophysiol 98, 2476-2482.
Arevalo, J. C., Conde, B., Hempstead, B. L., Chao, M. V., Martin-Zanca, D., and Perez, P. (2000). TrkA
immunoglobulin-like ligand binding domains inhibit spontaneous activation of the receptor. Mol Cell Biol 20,
5908-5916.
Ashkin, A. (1970). Acceleration and Trapping of Particles by Radiation Pressure. Physical Review Letters 24, 156-
159.
Ashkin, A. (1992). Forces of a single-beam gradient laser trap on a dielectric sphere in the ray optics regime.
Biophys J 61, 569-582.
Ashkin, A. (2006). Optical trapping and manipulation of neutral particles using lasers: a reprint volume with
commentaries (Singapore: World Scientific Publishing Co. Pte. Ltd.).
Ashkin, A., and Dziedzic, J. M. (1987). Optical trapping and manipulation of viruses and bacteria. Science 235,
1517-1520.
Ashkin, A., Dziedzic, J. M., Bjorkholm, J. E., and Chu, S. (1986). Observation of a single-beam gradient force
optical trap for dielectric particles. Opt Lett 11, 288.
Ashkin, A., Dziedzic, J. M., and Yamane, T. (1987). Optical trapping and manipulation of single cells using infrared
laser beams. Nature 330, 769-771.
Ashkin, A., Schutze, K., Dziedzic, J. M., Euteneuer, U., and Schliwa, M. (1990). Force generation of organelle
transport measured in vivo by an infrared laser trap. Nature 348, 346-348.
Ashok, P. C., and Dholakia, K. (2011). Optical trapping for analytical biotechnology. Curr Opin Biotechnol 23, 1-6.
Ballou, B., Lagerholm, B. C., Ernst, L. A., Bruchez, M. P., and Waggoner, A. S. (2004). Noninvasive imaging of
quantum dots in mice. Bioconjug Chem 15, 79-86.
Bankapur, A., Zachariah, E., Chidangil, S., Valiathan, M., and Mathur, D. (2010). Raman tweezers spectroscopy of
live, single red and white blood cells. PLoS One 5, e10427.
Barde, Y. A., Edgar, D., and Thoenen, H. (1982). Purification of a new neurotrophic factor from mammalian brain.
Embo J 1, 549-553.
Barrett, L. E., Sul, J. Y., Takano, H., Van Bockstaele, E. J., Haydon, P. G., and Eberwine, J. H. (2006). Region-
directed phototransfection reveals the functional significance of a dendritically synthesized transcription factor.
Nat Methods 3, 455-460.
Bashaw, G. J., and Klein, R. (2010). Signaling from axon guidance receptors. Cold Spring Harb Perspect Biol 2,
a001941.

Bibliography
76
Beattie, E. C., Zhou, J., Grimes, M. L., Bunnett, N. W., Howe, C. L., and Mobley, W. C. (1996). A signaling
endosome hypothesis to explain NGF actions: potential implications for neurodegeneration. Cold Spring Harb
Symp Quant Biol 61, 389-406.
Berning, S., Willig, K. I., Steffens, H., Dibaj, P., and Hell, S. W. (2012). Nanoscopy in a living mouse brain.
Science 335, 551.
Berridge, M. J., Bootman, M. D., and Lipp, P. (1998). Calcium--a life and death signal. Nature 395, 645-648.
Biju, V., Itoh, T., and Ishikawa, M. (2010). Delivering quantum dots to cells: bioconjugated quantum dots for
targeted and nonspecific extracellular and intracellular imaging. Chem Soc Rev 39, 3031-3056.
Blake, A. J., Pearce, T. M., Rao, N. S., Johnson, S. M., and Williams, J. C. (2007). Multilayer PDMS microfluidic
chamber for controlling brain slice microenvironment. Lab Chip 7, 842-849.
Block, S. M., Goldstein, L. S., and Schnapp, B. J. (1990). Bead movement by single kinesin molecules studied with
optical tweezers. Nature 348, 348-352.
Bosques, C. J., and Imperiali, B. (2003). Photolytic control of peptide self-assembly. J Am Chem Soc 125, 7530-
7531.
Bottrill, M., and Green, M. (2011). Some aspects of quantum dot toxicity. Chem Commun (Camb) 47, 7039-7050.
Bruchez, M., Jr., Moronne, M., Gin, P., Weiss, S., and Alivisatos, A. P. (1998). Semiconductor nanocrystals as
fluorescent biological labels. Science 281, 2013-2016.
Bückers, J., Wildanger, D., Vicidomini, G., Kastrup, L., and Hell, S. W. (2011). Simultaneous multi-lifetime multi-
color STED imaging for colocalization analyses. Opt Express 19, 3130-3143.
Bustamante, C., Bryant, Z., and Smith, S. B. (2003). Ten years of tension: single-molecule DNA mechanics. Nature
421, 423-427.
Byers, R. J., and Hitchman, E. R. (2010). Quantum dots brighten biological imaging. Prog Histochem Cytochem 45,
201-237.
Cahagan, K. T., and Swartzlander, G. A. (1998). Trapping of low-index microparticles in an optical vortex. Journal
of the Optical Society of America B 15, 524-534.
Campenot, R. B. (1977). Local control of neurite development by nerve growth factor. Proc Natl Acad Sci U S A
74, 4516-4519.
Canepari, M., Nelson, L., Papageorgiou, G., Corrie, J. E., and Ogden, D. (2001). Photochemical and
pharmacological evaluation of 7-nitroindolinyl-and 4-methoxy-7-nitroindolinyl-amino acids as novel, fast
caged neurotransmitters. J Neurosci Methods 112, 29-42.
Canossa, M., Griesbeck, O., Berninger, B., Campana, G., Kolbeck, R., and Thoenen, H. (1997). Neurotrophin
release by neurotrophins: implications for activity-dependent neuronal plasticity. Proc Natl Acad Sci U S A 94,
13279-13286.
Carnegie, D. J., Cizmar, T., Baumgartl, J., Gunn-Moore, F. J., and Dholakia, K. (2009). Automated laser guidance
of neuronal growth cones using a spatial light modulator. J Biophotonics 2, 682-692.
Castellani, V., Falk, J., and Rougon, G. (2004). Semaphorin3A-induced receptor endocytosis during axon guidance
responses is mediated by L1 CAM. Mol Cell Neurosci 26, 89-100.
Chan, W. C., Maxwell, D. J., Gao, X., Bailey, R. E., Han, M., and Nie, S. (2002). Luminescent quantum dots for
multiplexed biological detection and imaging. Curr Opin Biotechnol 13, 40-46.
Chao, M. V. (2003). Neurotrophins and their receptors: a convergence point for many signalling pathways. Nat Rev
Neurosci 4, 299-309.
Chao, M. V., Rajagopal, R., and Lee, F. S. (2006). Neurotrophin signalling in health and disease. Clin Sci (Lond)
110, 167-173.
Chedotal, A., Del Rio, J. A., Ruiz, M., He, Z., Borrell, V., de Castro, F., Ezan, F., Goodman, C. S., Tessier-Lavigne,
M., Sotelo, C., and Soriano, E. (1998). Semaphorins III and IV repel hippocampal axons via two distinct
receptors. Development 125, 4313-4323.
Chen, X., Kis, A., Zettl, A., and Bertozzi, C. R. (2007). A cell nanoinjector based on carbon nanotubes. Proc Natl
Acad Sci U S A 104, 8218-8222.

Bibliography
77
Chisholm, A., and Tessier-Lavigne, M. (1999). Conservation and divergence of axon guidance mechanisms. Curr
Opin Neurobiol 9, 603-615.
Choudhury, D., van Noort, D., Iliescu, C., Zheng, B., Poon, K. L., Korzh, S., Korzh, V., and Yu, H. (2012). Fish and
Chips: a microfluidic perfusion platform for monitoring zebrafish development. Lab Chip.
Cojoc, D., Difato, F., Ferrari, E., Shahapure, R. B., Laishram, J., Righi, M., Di Fabrizio, E. M., and Torre, V.
(2007). Properties of the force exerted by filopodia and lamellipodia and the involvement of cytoskeletal
components. PLoS One 2, e1072.
Conde, C., and Caceres, A. (2009). Microtubule assembly, organization and dynamics in axons and dendrites. Nat
Rev Neurosci 10, 319-332.
Cuerrier, C. M., Lebel, R., and Grandbois, M. (2007). Single cell transfection using plasmid decorated AFM probes.
Biochem Biophys Res Commun 355, 632-636.
Cui, B., Wu, C., Chen, L., Ramirez, A., Bearer, E. L., Li, W. P., Mobley, W. C., and Chu, S. (2007). One at a time,
live tracking of NGF axonal transport using quantum dots. Proc Natl Acad Sci U S A 104, 13666-13671.
D'Este, E., Baj, G., Beuzer, P., Ferrari, E., Pinato, G., Tongiorgi, E., and Cojoc, D. (2011). Use of optical tweezers
technology for long-term, focal stimulation of specific subcellular neuronal compartments. Integr Biol (Camb)
3, 568-577.
Dai, J., and Sheetz, M. P. (1995). Mechanical properties of neuronal growth cone membranes studied by tether
formation with laser optical tweezers. Biophys J 68, 988-996.
Dasgupta, R., Verma, R. S., Ahlawat, S., Uppal, A., and Gupta, P. K. (2011). Studies on erythrocytes in malaria
infected blood sample with Raman optical tweezers. J Biomed Opt 16, 077009.
Denk, W., Strickler, J. H., and Webb, W. W. (1990). Two-photon laser scanning fluorescence microscopy. Science
248, 73-76.
Derfus, A. M., Chan, W., and Bhatia, S. N. (2004). Probing the Cytotoxicity of Semiconductor Quantum Dots. Nano
Lett 4, 11-18.
Dertinger, S. K., Jiang, X., Li, Z., Murthy, V. N., and Whitesides, G. M. (2002). Gradients of substrate-bound
laminin orient axonal specification of neurons. Proc Natl Acad Sci U S A 99, 12542-12547.
Desmond, N. L., and Levy, W. B. (1985). Granule cell dendritic spine density in the rat hippocampus varies with
spine shape and location. Neurosci Lett 54, 219-224.
Devon, R. S., Orban, P. C., Gerrow, K., Barbieri, M. A., Schwab, C., Cao, L. P., Helm, J. R., Bissada, N., Cruz-
Aguado, R., Davidson, T. L., et al. (2006). Als2-deficient mice exhibit disturbances in endosome trafficking
associated with motor behavioral abnormalities. Proc Natl Acad Sci U S A 103, 9595-9600.
Dholakia, K., MacDonald, M. P., Zemanek, P., and Cizmar, T. (2007). Cellular and colloidal separation using
optical forces. Methods Cell Biol 82, 467-495.
Du, J., Feng, L., Zaitsev, E., Je, H. S., Liu, X. W., and Lu, B. (2003). Regulation of TrkB receptor tyrosine kinase
and its internalization by neuronal activity and Ca2+ influx. J Cell Biol 163, 385-395.
Echarte, M. M., Bruno, L., Arndt-Jovin, D. J., Jovin, T. M., and Pietrasanta, L. I. (2007). Quantitative single particle
tracking of NGF-receptor complexes: transport is bidirectional but biased by longer retrograde run lengths.
FEBS Lett 581, 2905-2913.
Eggeling, C., Ringemann, C., Medda, R., Schwarzmann, G., Sandhoff, K., Polyakova, S., Belov, V. N., Hein, B.,
von Middendorff, C., Schonle, A., and Hell, S. W. (2009). Direct observation of the nanoscale dynamics of
membrane lipids in a living cell. Nature 457, 1159-1162.
Ehrlicher, A., Betz, T., Stuhrmann, B., Gogler, M., Koch, D., Franze, K., Lu, Y., and Kas, J. (2007). Optical
neuronal guidance. Methods Cell Biol 83, 495-520.
Ehrlicher, A., Betz, T., Stuhrmann, B., Koch, D., Milner, V., Raizen, M. G., and Kas, J. (2002). Guiding neuronal
growth with light. Proc Natl Acad Sci U S A 99, 16024-16028.
Ellis-Davies, G. C. (2007). Caged compounds: photorelease technology for control of cellular chemistry and
physiology. Nat Methods 4, 619-628.
Ellis-Davies, G. C. (2011). Two-photon microscopy for chemical neuroscience. ACS Chem Neurosci 2, 185-197.

Bibliography
78
Ernfors, P., Kucera, J., Lee, K. F., Loring, J., and Jaenisch, R. (1995). Studies on the physiological role of brain-
derived neurotrophic factor and neurotrophin-3 in knockout mice. Int J Dev Biol 39, 799-807.
Esposito, D., Patel, P., Stephens, R. M., Perez, P., Chao, M. V., Kaplan, D. R., and Hempstead, B. L. (2001). The
cytoplasmic and transmembrane domains of the p75 and Trk A receptors regulate high affinity binding to nerve
growth factor. J Biol Chem 276, 32687-32695.
Fan, J., Mansfield, S. G., Redmond, T., Gordon-Weeks, P. R., and Raper, J. A. (1993). The organization of F-actin
and microtubules in growth cones exposed to a brain-derived collapsing factor. J Cell Biol 121, 867-878.
Fan, J., and Raper, J. A. (1995). Localized collapsing cues can steer growth cones without inducing their full
collapse. Neuron 14, 263-274.
Fazal, F. M., and Block, S. M. (2011). Optical tweezers study life under tension. Nat Photonics 5, 318-321.
Finkbeiner, S., Tavazoie, S. F., Maloratsky, A., Jacobs, K. M., Harris, K. M., and Greenberg, M. E. (1997). CREB: a
major mediator of neuronal neurotrophin responses. Neuron 19, 1031-1047.
Fournier, A. E., Nakamura, F., Kawamoto, S., Goshima, Y., Kalb, R. G., and Strittmatter, S. M. (2000).
Semaphorin3A enhances endocytosis at sites of receptor-F-actin colocalization during growth cone collapse. J
Cell Biol 149, 411-422.
Frade, J. M., and Barde, Y. A. (1998). Nerve growth factor: two receptors, multiple functions. Bioessays 20, 137-
145.
Galbraith, C. G., and Sheetz, M. P. (1999). Keratocytes pull with similar forces on their dorsal and ventral surfaces.
J Cell Biol 147, 1313-1324.
Gallo, G., Lefcort, F. B., and Letourneau, P. C. (1997). The trkA receptor mediates growth cone turning toward a
localized source of nerve growth factor. J Neurosci 17, 5445-5454.
Goeppert-Mayer, M. (1931). Uber Elementarakte mit zwei Quantensprungen. Ann Phys 9, 273-295.
Gomez, T. M., and Zheng, J. Q. (2006). The molecular basis for calcium-dependent axon pathfinding. Nat Rev
Neurosci 7, 115-125.
Gordon-Weeks, P. R. (1989). Growth at the growth cone. Trends Neurosci 12, 238-240.
Grier, D. G. (2003). A revolution in optical manipulation. Nature 424, 810-816.
Grimes, M. L., Zhou, J., Beattie, E. C., Yuen, E. C., Hall, D. E., Valletta, J. S., Topp, K. S., LaVail, J. H., Bunnett,
N. W., and Mobley, W. C. (1996). Endocytosis of activated TrkA: evidence that nerve growth factor induces
formation of signaling endosomes. J Neurosci 16, 7950-7964.
Groc, L., and Choquet, D. (2008). Measurement and characteristics of neurotransmitter receptor surface trafficking
(Review). Mol Membr Biol 25, 344-352.
Groc, L., Lafourcade, M., Heine, M., Renner, M., Racine, V., Sibarita, J. B., Lounis, B., Choquet, D., and Cognet, L.
(2007). Surface trafficking of neurotransmitter receptor: comparison between single-molecule/quantum dot
strategies. J Neurosci 27, 12433-12437.
Han, L., Wen, Z., Lynn, R. C., Baudet, M. L., Holt, C. E., Sasaki, Y., Bassell, G. J., and Zheng, J. Q. (2011).
Regulation of chemotropic guidance of nerve growth cones by microRNA. Mol Brain 4, 40.
Han, S. W., Nakamura, C., Kotobuki, N., Obataya, I., Ohgushi, H., Nagamune, T., and Miyake, J. (2008). High-
efficiency DNA injection into a single human mesenchymal stem cell using a nanoneedle and atomic force
microscopy. Nanomedicine 4, 215-225.
Harada, A., and Asakura, T. (1996). Radiation forces on a dielectric sphere in the Rayleigh scattering regime. Optics
Communications 124, 529-541.
Hart, S. J., Terray, A., Leski, T. A., Arnold, J., and Stroud, R. (2006). Discovery of a significant optical
chromatographic difference between spores of Bacillus anthracis and its close relative, Bacillus thuringiensis.
Anal Chem 78, 3221-3225.
Heerssen, H. M., and Segal, R. A. (2002). Location, location, location: a spatial view of neurotrophin signal
transduction. Trends Neurosci 25, 160-165.
Hell, S. W. (2007). Far-field optical nanoscopy. Science 316, 1153-1158.
Hell, S. W. (2009). Microscopy and its focal switch. Nat Methods 6, 24-32.

Bibliography
79
Hell, S. W., and Wichmann, J. (1994). Breaking the diffraction resolution limit by stimulated emission: stimulated-
emission-depletion fluorescence microscopy. Opt Lett 19, 780-782.
Henle, S. J., Wang, G., Liang, E., Wu, M., Poo, M. M., and Henley, J. R. (2011). Asymmetric PI(3,4,5)P3 and Akt
signaling mediates chemotaxis of axonal growth cones. J Neurosci 31, 7016-7027.
Hofmann, M., Eggeling, C., Jakobs, S., and Hell, S. W. (2005). Breaking the diffraction barrier in fluorescence
microscopy at low light intensities by using reversibly photoswitchable proteins. Proc Natl Acad Sci U S A
102, 17565-17569.
Hong, K., Nishiyama, M., Henley, J., Tessier-Lavigne, M., and Poo, M. (2000). Calcium signalling in the guidance
of nerve growth by netrin-1. Nature 403, 93-98.
Horch, H. W., and Katz, L. C. (2002). BDNF release from single cells elicits local dendritic growth in nearby
neurons. Nat Neurosci 5, 1177-1184.
Hoshino, A., Fujioka, K., Oku, T., Suga, M., Sasaki, Y. F., Ohta, T., Yasuhara, M., Suzuki, K., and Yamamoto, K.
(2004). Physicochemical Properties and Cellular Toxicity of Nanocrystal Quantum Dots Depend on Their
Surface Modification. Nano Lett 4, 2163-2169.
Howe, C. L., and Mobley, W. C. (2004). Signaling endosome hypothesis: A cellular mechanism for long distance
communication. J Neurobiol 58, 207-216.
Huang, B., Babcock, H., and Zhuang, X. (2010). Breaking the diffraction barrier: super-resolution imaging of cells.
Cell 143, 1047-1058.
Huang, E. J., and Reichardt, L. F. (2003). Trk receptors: roles in neuronal signal transduction. Annu Rev Biochem
72, 609-642.
Huang, Y., Agrawal, B., Clark, P. A., Williams, J. C., and Kuo, J. S. (2011). Evaluation of cancer stem cell
migration using compartmentalizing microfluidic devices and live cell imaging. J Vis Exp.
Hub, H. H., Zimmermann, U., and Ringsdorf, H. (1982). Preparation of large unilamellar vesicles FEBS Letters 140,
254-256.
Huber, A. B., Kolodkin, A. L., Ginty, D. D., and Cloutier, J. F. (2003). Signaling at the growth cone: ligand-receptor
complexes and the control of axon growth and guidance. Annu Rev Neurosci 26, 509-563.
Ichikawa, M., and Yoshikawa, K. (2001). Optical transport of a single cell-sized liposome. Applied Physics Letters
79, 4598.
Irimia, D., Liu, S. Y., Tharp, W. G., Samadani, A., Toner, M., and Poznansky, M. C. (2006). Microfluidic system
for measuring neutrophil migratory responses to fast switches of chemical gradients. Lab Chip 6, 191-198.
Jauffred, L., and Oddershede, L. B. (2010). Two-photon quantum dot excitation during optical trapping. Nano Lett
10, 1927-1930.
Ji, Y., Lu, Y., Yang, F., Shen, W., Tang, T. T., Feng, L., Duan, S., and Lu, B. (2010). Acute and gradual increases in
BDNF concentration elicit distinct signaling and functions in neurons. Nat Neurosci 13, 302-309.
Jurney, W. M., Gallo, G., Letourneau, P. C., and McLoon, S. C. (2002). Rac1-mediated endocytosis during ephrin-
A2- and semaphorin 3A-induced growth cone collapse. J Neurosci 22, 6019-6028.
Kaplan, D. R., and Miller, F. D. (2000). Neurotrophin signal transduction in the nervous system. Curr Opin
Neurobiol 10, 381-391.
Kepler, J. (1619). De cometis libelli tres, typis Andreae Apergeri, sumptibus Sebastiani Mylii bibliopolae augustani.
Avgvstae Vindelicorum.
Kohli, V., and Elezzabi, A. Y. (2009). Prospects and developments in cell and embryo laser nanosurgery. Wiley
Interdiscip Rev Nanomed Nanobiotechnol 1, 11-25.
Korte, M., Carroll, P., Wolf, E., Brem, G., Thoenen, H., and Bonhoeffer, T. (1995). Hippocampal long-term
potentiation is impaired in mice lacking brain-derived neurotrophic factor. Proc Natl Acad Sci U S A 92, 8856-
8860.
Kossel, A. H., Cambridge, S. B., Wagner, U., and Bonhoeffer, T. (2001). A caged Ab reveals an
immediate/instructive effect of BDNF during hippocampal synaptic potentiation. Proc Natl Acad Sci U S A 98,
14702-14707.

Bibliography
80
Kothapalli, C. R., van Veen, E., de Valence, S., Chung, S., Zervantonakis, I. K., Gertler, F. B., and Kamm, R. D.
(2010). A high-throughput microfluidic assay to study neurite response to growth factor gradients. Lab Chip
11, 497-507.
Kress, H., Park, J. G., Mejean, C. O., Forster, J. D., Park, J., Walse, S. S., Zhang, Y., Wu, D., Weiner, O. D., Fahmy,
T. M., and Dufresne, E. R. (2009). Cell stimulation with optically manipulated microsources. Nat Methods 6,
905-909.
Kumanogoh, A., and Kikutani, H. (2010). Semaphorins and their receptors: novel features of neural guidance
molecules. Proc Jpn Acad Ser B Phys Biol Sci 86, 611-620.
Lang, S. B., Stein, V., Bonhoeffer, T., and Lohmann, C. (2007). Endogenous brain-derived neurotrophic factor
triggers fast calcium transients at synapses in developing dendrites. J Neurosci 27, 1097-1105.
Leclerc, E., David, B., Griscom, L., Lepioufle, B., Fujii, T., Layrolle, P., and Legallaisa, C. (2006). Study of
osteoblastic cells in a microfluidic environment. Biomaterials 27, 586-595.
Lee, S. S., Horvath, P., Pelet, S., Hegemann, B., Lee, L. P., and Peter, M. (2012). Quantitative and dynamic assay of
single cell chemotaxis. Integr Biol (Camb).
Leitz, G., Fallman, E., Tuck, S., and Axner, O. (2002). Stress response in Caenorhabditis elegans caused by optical
tweezers: wavelength, power, and time dependence. Biophys J 82, 2224-2231.
Lessmann, V., Gottmann, K., and Malcangio, M. (2003). Neurotrophin secretion: current facts and future prospects.
Prog Neurobiol 69, 341-374.
Letokhov, V. S. (1968). Narrowing of the Doppler width in a standing light wave. JETP Letters 7, 272-274.
Letourneau, P. C. (1983). Differences in the organization of actin in the growth cones compared with the neurites of
cultured neurons from chick embryos. J Cell Biol 97, 963-973.
Leung, B. O., and Chou, K. C. (2011). Review of super-resolution fluorescence microscopy for biology. Appl
Spectrosc 65, 967-980.
Lewis, A. K., and Bridgman, P. C. (1992). Nerve growth cone lamellipodia contain two populations of actin
filaments that differ in organization and polarity. J Cell Biol 119, 1219-1243.
Li Jeon, N., Baskaran, H., Dertinger, S. K., Whitesides, G. M., Van de Water, L., and Toner, M. (2002). Neutrophil
chemotaxis in linear and complex gradients of interleukin-8 formed in a microfabricated device. Nat
Biotechnol 20, 826-830.
Li, X., Saint-Cyr-Proulx, E., Aktories, K., and Lamarche-Vane, N. (2002). Rac1 and Cdc42 but not RhoA or Rho
kinase activities are required for neurite outgrowth induced by the Netrin-1 receptor DCC (deleted in colorectal
cancer) in N1E-115 neuroblastoma cells. J Biol Chem 277, 15207-15214.
Li, Y., Jia, Y. C., Cui, K., Li, N., Zheng, Z. Y., Wang, Y. Z., and Yuan, X. B. (2005). Essential role of TRPC
channels in the guidance of nerve growth cones by brain-derived neurotrophic factor. Nature 434, 894-898.
Liang, H., Vu, K. T., Krishnan, P., Trang, T. C., Shin, D., Kimel, S., and Berns, M. W. (1996). Wavelength
dependence of cell cloning efficiency after optical trapping. Biophys J 70, 1529-1533.
Lichtman, J. W., and Conchello, J. A. (2005). Fluorescence microscopy. Nat Methods 2, 910-919.
Lidke, D. S., Lidke, K. A., Rieger, B., Jovin, T. M., and Arndt-Jovin, D. J. (2005). Reaching out for signals:
filopodia sense EGF and respond by directed retrograde transport of activated receptors. J Cell Biol 170, 619-
626.
Lidke, D. S., Nagy, P., Heintzmann, R., Arndt-Jovin, D. J., Post, J. N., Grecco, H. E., Jares-Erijman, E. A., and
Jovin, T. M. (2004). Quantum dot ligands provide new insights into erbB/HER receptor-mediated signal
transduction. Nat Biotechnol 22, 198-203.
Lin, A. C., and Holt, C. E. (2007). Local translation and directional steering in axons. Embo J 26, 3729-3736.
Linnarsson, S., Willson, C. A., and Ernfors, P. (2000). Cell death in regenerating populations of neurons in BDNF
mutant mice. Brain Res Mol Brain Res 75, 61-69.
Liu Tsang, V., Chen, A. A., Cho, L. M., Jadin, K. D., Sah, R. L., DeLong, S., West, J. L., and Bhatia, S. N. (2007).
Fabrication of 3D hepatic tissues by additive photopatterning of cellular hydrogels. Faseb J 21, 790-801.
Lohof, A. M., Quillan, M., Dan, Y., and Poo, M. M. (1992). Asymmetric modulation of cytosolic cAMP activity
induces growth cone turning. J Neurosci 12, 1253-1261.

Bibliography
81
Lowery, L. A., and Van Vactor, D. (2009). The trip of the tip: understanding the growth cone machinery. Nat Rev
Mol Cell Biol 10, 332-343.
Luo, C., Li, H., Xiong, C., Peng, X., Kou, Q., Chen, Y., Ji, H., and Ouyang, Q. (2007). The combination of optical
tweezers and microwell array for cells physical manipulation and localization in microfluidic device. Biomed
Microdevices 9, 573-578.
MacInnis, B. L., and Campenot, R. B. (2002). Retrograde support of neuronal survival without retrograde transport
of nerve growth factor. Science 295, 1536-1539.
Mao, H., Cremer, P. S., and Manson, M. D. (2003). A sensitive, versatile microfluidic assay for bacterial
chemotaxis. Proc Natl Acad Sci U S A 100, 5449-5454.
Maxell, J. C. (1873). Treatise On Electricity And Magnetism).
McAllister, A. K., Lo, D. C., and Katz, L. C. (1995). Neurotrophins regulate dendritic growth in developing visual
cortex. Neuron 15, 791-803.
McDougall, C., Stevenson, D. J., Brown, C. T., Gunn-Moore, F., and Dholakia, K. (2009). Targeted optical injection
of gold nanoparticles into single mammalian cells. J Biophotonics 2, 736-743.
Meister, A., Gabi, M., Behr, P., Studer, P., Voros, J., Niedermann, P., Bitterli, J., Polesel-Maris, J., Liley, M.,
Heinzelmann, H., and Zambelli, T. (2009). FluidFM: combining atomic force microscopy and nanofluidics in a
universal liquid delivery system for single cell applications and beyond. Nano Lett 9, 2501-2507.
Mendel, E. (1991). Friendly communication is key to effective client interactions. J Am Vet Med Assoc 198, 1707-
1708.
Meyvantsson, I., and Beebe, D. J. (2008). Cell culture models in microfluidic systems. Annu Rev Anal Chem (Palo
Alto Calif) 1, 423-449.
Michalet, X., Pinaud, F. F., Bentolila, L. A., Tsay, J. M., Doose, S., Li, J. J., Sundaresan, G., Wu, A. M., Gambhir,
S. S., and Weiss, S. (2005). Quantum dots for live cells, in vivo imaging, and diagnostics. Science 307, 538-
544.
Moffitt, J. R., Chemla, Y. R., Smith, S. B., and Bustamante, C. (2008). Recent advances in optical tweezers. Annu
Rev Biochem 77, 205-228.
Mogilner, A. (2006). On the edge: modeling protrusion. Curr Opin Cell Biol 18, 32-39.
Monneret, S., Belloni, F., and Soppera, O. (2007). Combining fluidic reservoirs and optical tweezers to control
beads/living cells contacts. Microfluid Nanofluid 3, 645-652.
Mowla, S. J., Farhadi, H. F., Pareek, S., Atwal, J. K., Morris, S. J., Seidah, N. G., and Murphy, R. A. (2001).
Biosynthesis and post-translational processing of the precursor to brain-derived neurotrophic factor. J Biol
Chem 276, 12660-12666.
Muralidharan, V., and Muir, T. W. (2006). Protein ligation: an enabling technology for the biophysical analysis of
proteins. Nat Methods 3, 429-438.
Nagerl, U. V., and Bonhoeffer, T. (2010). Imaging living synapses at the nanoscale by STED microscopy. J
Neurosci 30, 9341-9346.
Naka, Y., Kitazawa, A., Akaishi, Y., and Shimizu, N. (2004). Neurite outgrowths of neurons using neurotrophin-
coated nanoscale magnetic beads. J Biosci Bioeng 98, 348-352.
Neuman, K. C., and Block, S. M. (2004). Optical trapping. Rev Sci Instrum 75, 2787-2809.
Neuman, K. C., Chadd, E. H., Liou, G. F., Bergman, K., and Block, S. M. (1999). Characterization of photodamage
to Escherichia coli in optical traps. Biophys J 77, 2856-2863.
Nishiyama, M., Hoshino, A., Tsai, L., Henley, J. R., Goshima, Y., Tessier-Lavigne, M., Poo, M. M., and Hong, K.
(2003). Cyclic AMP/GMP-dependent modulation of Ca2+ channels sets the polarity of nerve growth-cone
turning. Nature 423, 990-995.
Ostroff, L. E., Fiala, J. C., Allwardt, B., and Harris, K. M. (2002). Polyribosomes redistribute from dendritic shafts
into spines with enlarged synapses during LTP in developing rat hippocampal slices. Neuron 35, 535-545.
Pakhomov, A. G., Semenov, I., Brenner, R., and Toney, G. M. (2006). Hydraulically coupled microejection
technique for precise local solution delivery in tissues. J Neurosci Methods 155, 231-240.

Bibliography
82
Park, T. H., and Shuler, M. L. (2003). Integration of cell culture and microfabrication technology. Biotechnol Prog
19, 243-253.
Patapoutian, A., and Reichardt, L. F. (2001). Trk receptors: mediators of neurotrophin action. Curr Opin Neurobiol
11, 272-280.
Pathak, S., Choi, S. K., Arnheim, N., and Thompson, M. E. (2001). Hydroxylated quantum dots as luminescent
probes for in situ hybridization. J Am Chem Soc 123, 4103-4104.
Perkins, T. T. (2009). Optical traps for single molecule biophysics: a primer. Laser & Photonics Reviews 3, 203-
220.
Pidoplichko, V. I., and Dani, J. A. (2005). Applying small quantities of multiple compounds to defined locations of
in vitro brain slices. J Neurosci Methods 142, 55-66.
Pinato, G., Lien, L. T., D'Este, E., Torre, V., and Cojoc, D. (2011a). Neuronal chemotaxis by optically manipulated
liposomes. Journal of the European Optical Society Rapid Publications 6, 11042.
Pinato, G., Pegoraro, S., Iacono, G., Ruaro, M. E., and Torre, V. (2009). Calcium control of gene regulation in rat
hippocampal neuronal cultures. J Cell Physiol 220, 727-747.
Pinato, G., Raffaelli, T., D'Este, E., Tavano, F., and Cojoc, D. (2011b). Optical delivery of liposome encapsulated
chemical stimuli to neuronal cells. J Biomed Opt 16, 095001.
Pinaud, F., Clarke, S., Sittner, A., and Dahan, M. (2010). Probing cellular events, one quantum dot at a time. Nat
Methods 7, 275-285.
Pinaud, F., Michalet, X., Iyer, G., Margeat, E., Moore, H. P., and Weiss, S. (2009). Dynamic partitioning of a
glycosyl-phosphatidylinositol-anchored protein in glycosphingolipid-rich microdomains imaged by single-
quantum dot tracking. Traffic 10, 691-712.
Pine, J., and Chow, G. (2009). Moving live dissociated neurons with an optical tweezer. IEEE Trans Biomed Eng
56, 1184-1188.
Piner, R. D., Zhu, J., Xu, F., Hong, S., and Mirkin, C. A. (1999). "Dip-Pen" nanolithography. Science 283, 661-663.
Piper, M., Salih, S., Weinl, C., Holt, C. E., and Harris, W. A. (2005). Endocytosis-dependent desensitization and
protein synthesis-dependent resensitization in retinal growth cone adaptation. Nat Neurosci 8, 179-186.
Rajan, S. S., Liu, H. Y., and Vu, T. Q. (2008). Ligand-bound quantum dot probes for studying the molecular scale
dynamics of receptor endocytic trafficking in live cells. ACS Nano 2, 1153-1166.
Ramser, K., Logg, K., Goksor, M., Enger, J., Kall, M., and Hanstorp, D. (2004). Resonance Raman spectroscopy of
optically trapped functional erythrocytes. J Biomed Opt 9, 593-600.
Rao, S., Balint, S., Cossins, B., Guallar, V., and Petrov, D. (2009). Raman study of mechanically induced
oxygenation state transition of red blood cells using optical tweezers. Biophys J 96, 209-216.
Raucher, D. (2008). Chapter 17: Application of laser tweezers to studies of membrane-cytoskeleton adhesion.
Methods Cell Biol 89, 451-466.
Ravula, S. K., Wang, M. S., McClain, M. A., Asress, S. A., Frazier, B., and Glass, J. D. (2007). Spatiotemporal
localization of injury potentials in DRG neurons during vincristine-induced axonal degeneration. Neurosci Lett
415, 34-39.
Reichardt, L. F. (2006). Neurotrophin-regulated signalling pathways. Philos Trans R Soc Lond B Biol Sci 361,
1545-1564.
Reichardt, L. F., and Mobley, W. C. (2004). Going the distance, or not, with neurotrophin signals. Cell 118, 141-
143.
Rittweger, E., Young Han, K., Irvine, S. E., Eggeling, C., and Hell, S. W. (2009). STED microscopy reveals crystal
colour centres with nanometric resolution. Nature Photonics 3, 144-147.
Rodriguez-Tebar, A., Dechant, G., and Barde, Y. A. (1990). Binding of brain-derived neurotrophic factor to the
nerve growth factor receptor. Neuron 4, 487-492.
Rosenberg, M. B., Hawrot, E., and Breakefield, X. O. (1986). Receptor binding activities of biotinylated derivatives
of beta-nerve growth factor. J Neurochem 46, 641-648.

Bibliography
83
Round, J., and Stein, E. (2007). Netrin signaling leading to directed growth cone steering. Curr Opin Neurobiol 17,
15-21.
Sawano, A., Takayama, S., Matsuda, M., and Miyawaki, A. (2002). Lateral propagation of EGF signaling after local
stimulation is dependent on receptor density. Dev Cell 3, 245-257.
Schaff, U. Y., Xing, M. M., Lin, K. K., Pan, N., Jeon, N. L., and Simon, S. I. (2007). Vascular mimetics based on
microfluidics for imaging the leukocyte--endothelial inflammatory response. Lab Chip 7, 448-456.
Schecterson, L. C., and Bothwell, M. (2010). Neurotrophin receptors: Old friends with new partners. Dev Neurobiol
70, 332-338.
Segal, R. A. (2003). Selectivity in neurotrophin signaling: theme and variations. Annu Rev Neurosci 26, 299-330.
Shaevitz, J. W. (2006). A Practical Guide to Optical Trapping.
Shan, J., Munro, T. P., Barbarese, E., Carson, J. H., and Smith, R. (2003). A molecular mechanism for mRNA
trafficking in neuronal dendrites. J Neurosci 23, 8859-8866.
Shekarabi, M., and Kennedy, T. E. (2002). The netrin-1 receptor DCC promotes filopodia formation and cell
spreading by activating Cdc42 and Rac1. Mol Cell Neurosci 19, 1-17.
Shen, K., and Cowan, C. W. (2010). Guidance molecules in synapse formation and plasticity. Cold Spring Harb
Perspect Biol 2, a001842.
Sheng, M., McFadden, G., and Greenberg, M. E. (1990). Membrane depolarization and calcium induce c-fos
transcription via phosphorylation of transcription factor CREB. Neuron 4, 571-582.
Sieber, J. J., Willig, K. I., Heintzmann, R., Hell, S. W., and Lang, T. (2006). The SNARE motif is essential for the
formation of syntaxin clusters in the plasma membrane. Biophys J 90, 2843-2851.
Sigot, V., Arndt-Jovin, D. J., and Jovin, T. M. (2010). Targeted cellular delivery of quantum dots loaded on and in
biotinylated liposomes. Bioconjug Chem 21, 1465-1472.
Snook, R. D., Harvey, T. J., Correia Faria, E., and Gardner, P. (2009). Raman tweezers and their application to the
study of singly trapped eukaryotic cells. Integr Biol (Camb) 1, 43-52.
Steketee, M. B., Moysidis, S. N., Jin, X. L., Weinstein, J. E., Pita-Thomas, W., Raju, H. B., Iqbal, S., and Goldberg,
J. L. (2011). Nanoparticle-mediated signaling endosome localization regulates growth cone motility and neurite
growth. Proc Natl Acad Sci U S A 108, 19042-19047.
Steubing, R. W., Cheng, S., Wright, W. H., Numajiri, Y., and Berns, M. W. (1991). Laser induced cell fusion in
combination with optical tweezers: the laser cell fusion trap. Cytometry 12, 505-510.
Stevenson, D. J., Gunn-Moore, F., and Dholakia, K. (2010a). Light forces the pace: optical manipulation for
biophotonics. J Biomed Opt 15, 041503.
Stevenson, D. J., Gunn-Moore, F. J., Campbell, P., and Dholakia, K. (2010b). Single cell optical transfection. J R
Soc Interface 7, 863-871.
Sun, B., and Chiu, D. T. (2003). Spatially and temporally resolved delivery of stimuli to single cells. J Am Chem
Soc 125, 3702-3703.
Sundara Rajan, S., and Vu, T. Q. (2006). Quantum dots monitor TrkA receptor dynamics in the interior of neural
PC12 cells. Nano Lett 6, 2049-2059.
Suter, D. M. (2011). Live cell imaging of neuronal growth cone motility and guidance in vitro. Methods Mol Biol
769, 65-86.
Taylor, A. M., Blurton-Jones, M., Rhee, S. W., Cribbs, D. H., Cotman, C. W., and Jeon, N. L. (2005). A
microfluidic culture platform for CNS axonal injury, regeneration and transport. Nat Methods 2, 599-605.
Theveneau, E., and Mayor, R. (2011). Beads on the run: beads as alternative tools for chemotaxis assays. Methods
Mol Biol 769, 449-460.
Thompson, A. W., Pujic, Z., Richards, L. J., and Goodhill, G. J. (2011). Cyclic nucleotide-dependent switching of
mammalian axon guidance depends on gradient steepness. Mol Cell Neurosci 47, 45-52.
Tirlapur, U. K., and Konig, K. (2002). Targeted transfection by femtosecond laser. Nature 418, 290-291.
Tlusty, T., Meller, A., and Bar-Ziv, R. (1998). Optical gradient forces of the strongly localized fields. Phys Rev Lett
81, 1738-1741.

Bibliography
84
Tojima, T., Hines, J. H., Henley, J. R., and Kamiguchi, H. (2011). Second messengers and membrane trafficking
direct and organize growth cone steering. Nat Rev Neurosci 12, 191-203.
Tongiorgi, E. (2008). Activity-dependent expression of brain-derived neurotrophic factor in dendrites: facts and
open questions. Neurosci Res 61, 335-346.
Tongiorgi, E., Righi, M., and Cattaneo, A. (1997). Activity-dependent dendritic targeting of BDNF and TrkB
mRNAs in hippocampal neurons. J Neurosci 17, 9492-9505.
Toresson, H., and Grant, S. G. (2005). Dynamic distribution of endoplasmic reticulum in hippocampal neuron
dendritic spines. Eur J Neurosci 22, 1793-1798.
Townes-Anderson, E., St Jules, R. S., Sherry, D. M., Lichtenberger, J., and Hassanain, M. (1998).
Micromanipulation of retinal neurons by optical tweezers. Mol Vis 4, 12.
Triller, A., and Choquet, D. (2008). New concepts in synaptic biology derived from single-molecule imaging.
Neuron 59, 359-374.
Underwood, C. K., and Coulson, E. J. (2008). The p75 neurotrophin receptor. Int J Biochem Cell Biol 40, 1664-
1668.
Urban, N. T., Willig, K. I., Hell, S. W., and Nagerl, U. V. (2011). STED nanoscopy of actin dynamics in synapses
deep inside living brain slices. Biophys J 101, 1277-1284.
Valero, V., Nevian, T., Ho, D., and Lindau, M. (2008). Tethering forces of secretory granules measured with optical
tweezers. Biophys J 95, 4972-4978.
Vu, T. Q., Maddipati, R., Blute, T. A., Nehilla, B. J., Nusblat, L., and Desai, T. A. (2005). Peptide-conjugated
quantum dots activate neuronal receptors and initiate downstream signaling of neurite growth. Nano Lett 5,
603-607.
Walde, P., and Ichikawa, S. (2001). Enzymes inside lipid vesicles: preparation, reactivity and applications. Biomol
Eng 18, 143-177.
Walker, J. W., Gilbert, S. H., Drummond, R. M., Yamada, M., Sreekumar, R., Carraway, R. E., Ikebe, M., and Fay,
F. S. (1998). Signaling pathways underlying eosinophil cell motility revealed by using caged peptides. Proc
Natl Acad Sci U S A 95, 1568-1573.
Wang, X., Boreiko, A., Schlossmacher, U., Brandt, D., Schroder, H. C., Li, J., Kaandorp, J. A., Gotz, H., Duschner,
H., and Muller, W. E. (2008). Axial growth of hexactinellid spicules: formation of cone-like structural units in
the giant basal spicules of the hexactinellid Monorhaphis. J Struct Biol 164, 270-280.
Westphal, V., Rizzoli, S. O., Lauterbach, M. A., Kamin, D., Jahn, R., and Hell, S. W. (2008). Video-rate far-field
optical nanoscopy dissects synaptic vesicle movement. Science 320, 246-249.
Wildanger, D., Medda, R., Kastrup, L., and Hell, S. W. (2009). A compact STED microscope providing 3D
nanoscale resolution. J Microsc 236, 35-43.
Willig, K. I., Harke, B., Medda, R., and Hell, S. W. (2007). STED microscopy with continuous wave beams. Nat
Methods 4, 915-918.
Willig, K. I., Kastrup, L., Nägerl, V., and Hell, S. W. (2009). STED Microscopy: Different Approaches and
Applications: Washington, DC: Society for Neuroscience).
Willig, K. I., Kellner, R. R., Medda, R., Hein, B., Jakobs, S., and Hell, S. W. (2006). Nanoscale resolution in GFP-
based microscopy. Nat Methods 3, 721-723.
Wu, Y., Campos, S. K., Lopez, G. P., Ozbun, M. A., Sklar, L. A., and Buranda, T. (2007). The development of
quantum dot calibration beads and quantitative multicolor bioassays in flow cytometry and microscopy. Anal
Biochem 364, 180-192.
Wu, Y. I., Frey, D., Lungu, O. I., Jaehrig, A., Schlichting, I., Kuhlman, B., and Hahn, K. M. (2009). A genetically
encoded photoactivatable Rac controls the motility of living cells. Nature 461, 104-108.
Xiao, Y., and Barker, P. E. (2004). Semiconductor nanocrystal probes for human metaphase chromosomes. Nucleic
Acids Res 32, e28.
Yoshii, A., and Constantine-Paton, M. (2007). BDNF induces transport of PSD-95 to dendrites through PI3K-AKT
signaling after NMDA receptor activation. Nat Neurosci 10, 702-711.
Bibliography
85
Zahavy, E., Freeman, E., Lustig, S., Keysary, A., and Yitzhaki, S. (2005). Double labeling and simultaneous
detection of B- and T cells using fluorescent nano-crystal (q-dots) in paraffin-embedded tissues. J Fluoresc 15,
661-665.
Zhang, K., Osakada, Y., Vrljic, M., Chen, L., Mudrakola, H. V., and Cui, B. (2010). Single-molecule imaging of
NGF axonal transport in microfluidic devices. Lab Chip 10, 2566-2573.
Zhang, Q., Cao, Y. Q., and Tsien, R. W. (2007). Quantum dots provide an optical signal specific to full collapse
fusion of synaptic vesicles. Proc Natl Acad Sci U S A 104, 17843-17848.
Zhang, Q., Li, Y., and Tsien, R. W. (2009). The dynamic control of kiss-and-run and vesicular reuse probed with
single nanoparticles. Science 323, 1448-1453.
Zhang, X., and Poo, M. M. (2002). Localized synaptic potentiation by BDNF requires local protein synthesis in the
developing axon. Neuron 36, 675-688.
Zhang, Y., Moheban, D. B., Conway, B. R., Bhattacharyya, A., and Segal, R. A. (2000). Cell surface Trk receptors
mediate NGF-induced survival while internalized receptors regulate NGF-induced differentiation. J Neurosci
20, 5671-5678.
Zheng, J. Q. (2000). Turning of nerve growth cones induced by localized increases in intracellular calcium ions.
Nature 403, 89-93.
Zhou, F. Q., and Cohan, C. S. (2004). How actin filaments and microtubules steer growth cones to their targets. J
Neurobiol 58, 84-91.

Appendix
86
APPENDIX
Papers published:
D'Este, E., Baj, G., Beuzer, P., Ferrari, E., Pinato, G., Tongiorgi, E., and Cojoc, D. (2011). Use of
optical tweezers technology for long-term, focal stimulation of specific subcellular neuronal
compartments. Integr Biol (Camb) 3, 568-577;
Pinato, G., Lien, L. T., D'Este, E., Torre, V., and Cojoc, D. (2011). Neuronal chemotaxis by
optically manipulated liposomes. Journal of the European Optical Society Rapid Publications 6,
11042;
Pinato, G., Raffaelli, T., D'Este, E., Tavano, F., and Cojoc, D. (2011). Optical delivery of
liposome encapsulated chemical stimuli to neuronal cells. J Biomed Opt 16, 095001.