Universal GeoGebra Astrolabe - … · Revista Digital Sociedad de la Informacion´ Universal...
30
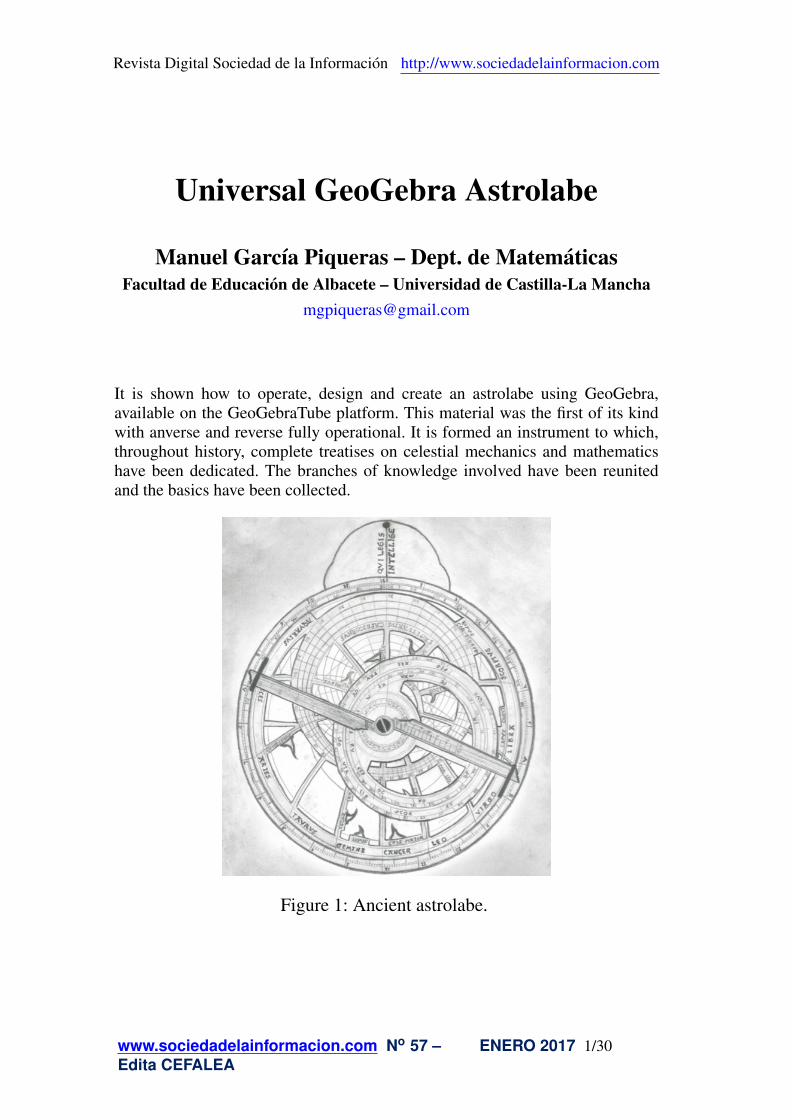
Revista Digital Sociedad de la Informaci´ on http://www.sociedadelainformacion.com Universal GeoGebra Astrolabe Manuel Garc´ ıa Piqueras – Dept. de Matem ´ aticas Facultad de Educaci´ on de Albacete – Universidad de Castilla-La Mancha [email protected] It is shown how to operate, design and create an astrolabe using GeoGebra, available on the GeoGebraTube platform. This material was the first of its kind with anverse and reverse fully operational. It is formed an instrument to which, throughout history, complete treatises on celestial mechanics and mathematics have been dedicated. The branches of knowledge involved have been reunited and the basics have been collected. Figure 1: Ancient astrolabe. www.sociedadelainformacion.com N o 57 – ENERO 2017 1/30 Edita CEFALEA
Transcript of Universal GeoGebra Astrolabe - … · Revista Digital Sociedad de la Informacion´ Universal...
Revista Digital Sociedad de la Informacion http://www.sociedadelainformacion.com
Universal GeoGebra Astrolabe
Manuel Garcıa Piqueras – Dept. de MatematicasFacultad de Educacion de Albacete – Universidad de Castilla-La Mancha
It is shown how to operate, design and create an astrolabe using GeoGebra,available on the GeoGebraTube platform. This material was the first of its kindwith anverse and reverse fully operational. It is formed an instrument to which,throughout history, complete treatises on celestial mechanics and mathematicshave been dedicated. The branches of knowledge involved have been reunitedand the basics have been collected.
Figure 1: Ancient astrolabe.
www.sociedadelainformacion.com No 57 – ENERO 2017 1/30Edita CEFALEA

Revista Digital Sociedad de la Informacion http://www.sociedadelainformacion.com
1. Case study: how to calculate the time withthe Universal GeoGebra AstrolabeAn astrolabe can perform hundreds of astronomical operations and, to illustratethem all, would require several treaties. Our objective, in this section, is to showits basic operation. The instrument can be adapted to any latitude and is made inits entirety through GeoGebra, hence its name: Universal GeoGebra Astrolabe.We will calculate the civil hour from the observation of the height of a star, in-formation that we will process through the archives available in [1], fifth section(figures 2, 3 and 4).
Figure 2: GeoGebra Book El Astrolabio Universal GeoGebra.
Figure 3: Astrolabe Back (Madrid).
www.sociedadelainformacion.com No 57 – ENERO 2017 2/30Edita CEFALEA

Revista Digital Sociedad de la Informacion http://www.sociedadelainformacion.com
Figure 4: Astrolabe Front (Madrid).
Let’s calculate the time in Madrid, with latitude 40.4165◦ North and longitude3◦42′9” West, let’s see:
On the night of February 27, 2016, Rigel is placed in the Southwest sky, leavingSirio to his left, with an apparent altitude of about 34.28575◦.
We point an almucantar a = 34.2858◦, that is, the parallel on the celestial sphereof height a.
On the reverse of the astrolabe we move the alidade so that the Day of the Ca-lendar is 58 (days elapsed), that is, February 27; as we are very close to day 28we chose to choose 58.9◦. This marks, by extension, an angle of 338.8◦ in theZodiac (Pisces 8.8◦).
We go to the obverse of the astrolabe, we locate Rigel and we are moving the spi-der until Rigel is placed in the almucantar a = 34.2858◦ (falls in the Southwestsky). The spider rotates about 19◦.
Once fixed the spider we marked the 338.8o in the Ecliptic and aligned the Hour,that gives about 129◦. If we consider the equivalence 1hour = 15◦, we have129◦ : 15◦ = 8.6, that is, 8 h. 36’ in the evening local time.
To adjust it with the civil hour in which we need the latitude of our locality:
www.sociedadelainformacion.com No 57 – ENERO 2017 3/30Edita CEFALEA
Revista Digital Sociedad de la Informacion http://www.sociedadelainformacion.com
3◦42′9.22” = 3.7025◦ West (Madrid).
The equivalence 60′ = 15◦ gives us a Time Correction:
CH = 3.7025◦×60′/15◦ = 14.81′ = 14′48”
Therefore, the set time is 8 h. 36’ - (-14’ 48”) = 8 h. 50’ 48.and, as our time zoneis +01:00 UTC hours, it would be 9:50”.
Taking data from the Stellarium program it would be 22 h 00’ 00”, ie 9’12”below,which is an order error:
552/603 ·100% = 0.002555 . . . ·100% = 0.2555 . . . % < 0.26%
If we do not need to put any satellite or other space craft into orbit, it seems morethan assumeable.
A simple look at our clock would be enough to know the time, but the obverse ofthe astrolabe gives us a snapshot of the universe as well. Thus we can know whencertain stars will be placed or others will come out... In short, a classic astrolabeallows to hold the universe in the palm of the hand. Today we would need specialsoftware to achieve the same effect.
2. The soul of the astrolabe: the stereographicprojectionOnce we have shown, very above, the basic management of the instrument, wewill try to explain its construction and, to a lesser extent, the reason for its design.
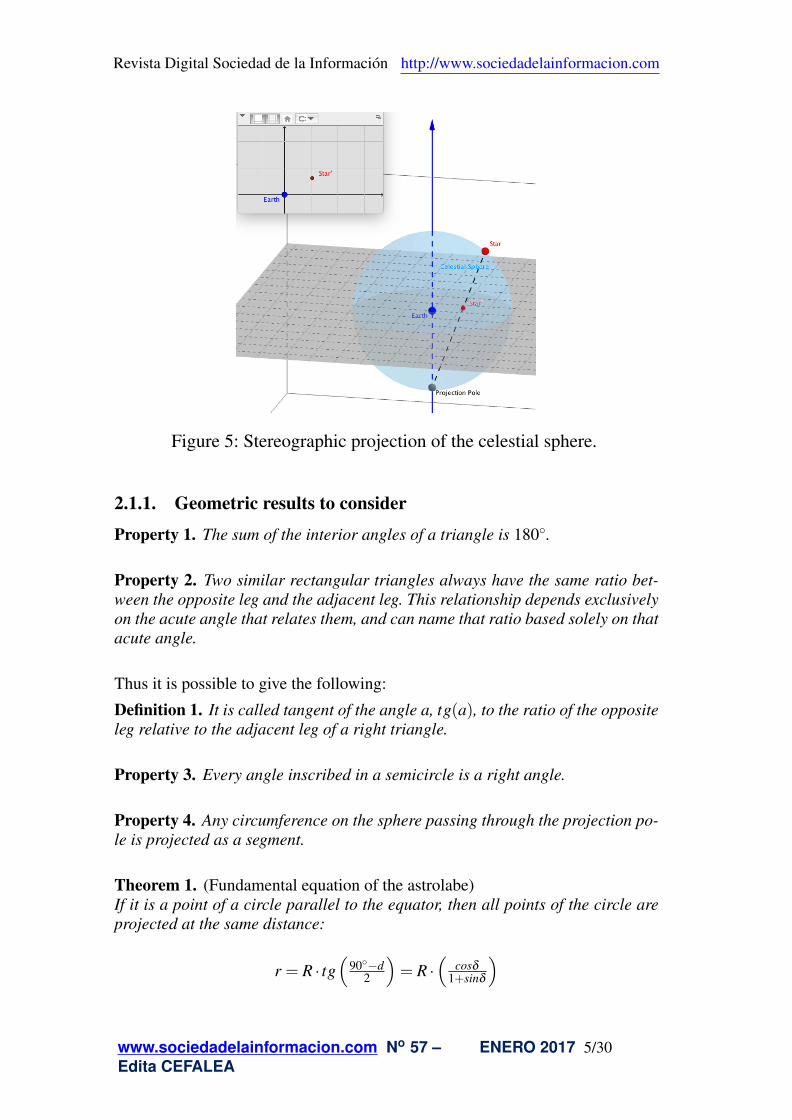
The celestial bodies are so far apart that we agree to place them all at the samedistance. The celestial sphere contains these objects and we occupy them right atits center ([1]). If we project the content of that sphere over the celestial SouthPole (projection pole) and imagine that the celestial equator is contained in a pla-ne (projection plane), the marks that leave the rays of projection on this planewill be the image of the firmament that we are looking for (Fig. 5).
We can project stars, parallel and meridian celestial, planets... any object of thefirmament. An astrolabe concentrates on the same plane the whole known uni-verse.
2.1. PropertiesAt the theoretical level, to project the basic elements of the celestial sphere (me-ridians, parallels...) would require the following properties.
www.sociedadelainformacion.com No 57 – ENERO 2017 4/30Edita CEFALEA
Revista Digital Sociedad de la Informacion http://www.sociedadelainformacion.com
Figure 5: Stereographic projection of the celestial sphere.
2.1.1. Geometric results to consider
Property 1. The sum of the interior angles of a triangle is 180◦.
Property 2. Two similar rectangular triangles always have the same ratio bet-ween the opposite leg and the adjacent leg. This relationship depends exclusivelyon the acute angle that relates them, and can name that ratio based solely on thatacute angle.
Thus it is possible to give the following:
Definition 1. It is called tangent of the angle a, tg(a), to the ratio of the oppositeleg relative to the adjacent leg of a right triangle.
Property 3. Every angle inscribed in a semicircle is a right angle.
Property 4. Any circumference on the sphere passing through the projection po-le is projected as a segment.
Theorem 1. (Fundamental equation of the astrolabe)If it is a point of a circle parallel to the equator, then all points of the circle areprojected at the same distance:
r = R · tg(
90◦−d2
)= R ·
(cosδ
1+sinδ
)
www.sociedadelainformacion.com No 57 – ENERO 2017 5/30Edita CEFALEA

Revista Digital Sociedad de la Informacion http://www.sociedadelainformacion.com
where δ is the declination of X and R (Fig. 6).
Figure 6: Fundamental equation of the astrolabe.
Note: Given a point on the celestial sphere, if the working context is the space wewill denote by the stereographic projection of that point.
It is convenient to know the main characteristics of the stereographic projectionpresented below and whose demonstration can find the interested reader in [3].
2.1.2. Positive aspects: preservation of circles and angles
Property 5. The stereographic projection transforms circumferences that do notpass through the projection pole in circumferences (Fig. 7).
Figure 7: Preservation of circumferences.
www.sociedadelainformacion.com No 57 – ENERO 2017 6/30Edita CEFALEA
Revista Digital Sociedad de la Informacion http://www.sociedadelainformacion.com
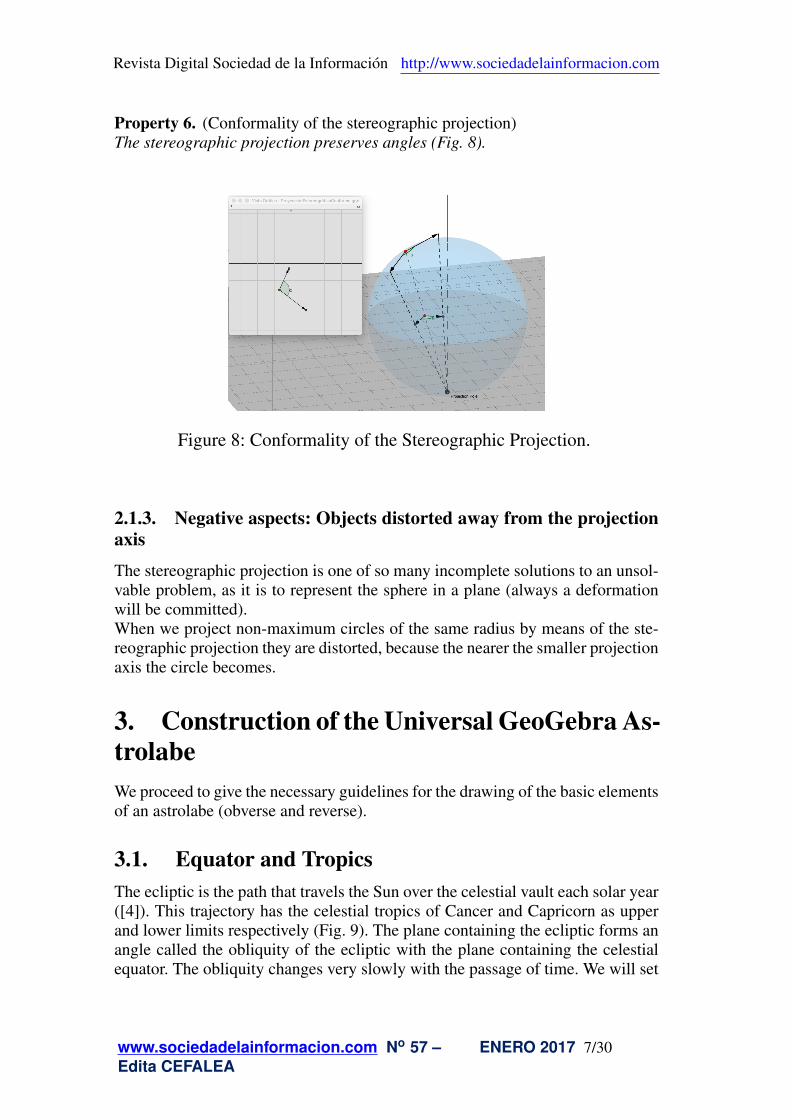
Property 6. (Conformality of the stereographic projection)The stereographic projection preserves angles (Fig. 8).
Figure 8: Conformality of the Stereographic Projection.
2.1.3. Negative aspects: Objects distorted away from the projectionaxis
The stereographic projection is one of so many incomplete solutions to an unsol-vable problem, as it is to represent the sphere in a plane (always a deformationwill be committed).When we project non-maximum circles of the same radius by means of the ste-reographic projection they are distorted, because the nearer the smaller projectionaxis the circle becomes.
3. Construction of the Universal GeoGebra As-trolabeWe proceed to give the necessary guidelines for the drawing of the basic elementsof an astrolabe (obverse and reverse).
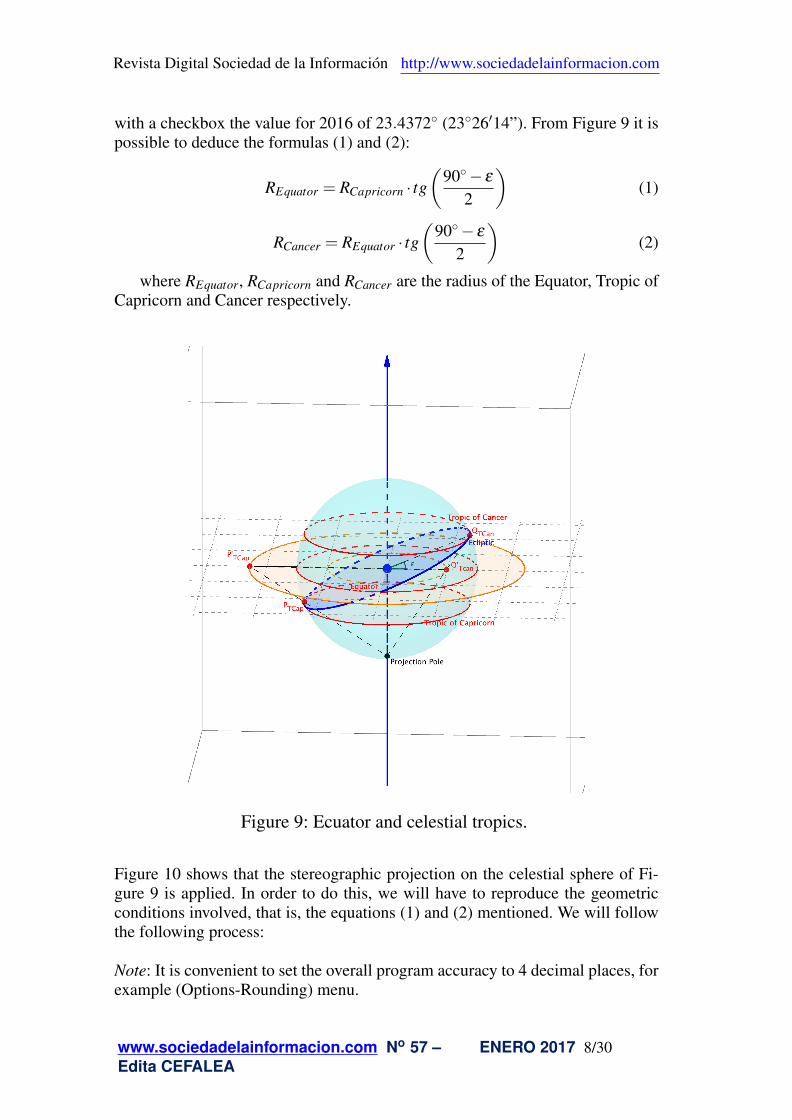
3.1. Equator and TropicsThe ecliptic is the path that travels the Sun over the celestial vault each solar year([4]). This trajectory has the celestial tropics of Cancer and Capricorn as upperand lower limits respectively (Fig. 9). The plane containing the ecliptic forms anangle called the obliquity of the ecliptic with the plane containing the celestialequator. The obliquity changes very slowly with the passage of time. We will set
www.sociedadelainformacion.com No 57 – ENERO 2017 7/30Edita CEFALEA
Revista Digital Sociedad de la Informacion http://www.sociedadelainformacion.com
with a checkbox the value for 2016 of 23.4372◦ (23◦26′14”). From Figure 9 it ispossible to deduce the formulas (1) and (2):
REquator = RCapricorn · tg(
90◦− ε
2
)(1)
RCancer = REquator · tg(
90◦− ε
2
)(2)
where REquator, RCapricorn and RCancer are the radius of the Equator, Tropic ofCapricorn and Cancer respectively.
Figure 9: Ecuator and celestial tropics.
Figure 10 shows that the stereographic projection on the celestial sphere of Fi-gure 9 is applied. In order to do this, we will have to reproduce the geometricconditions involved, that is, the equations (1) and (2) mentioned. We will followthe following process:
Note: It is convenient to set the overall program accuracy to 4 decimal places, forexample (Options-Rounding) menu.
www.sociedadelainformacion.com No 57 – ENERO 2017 8/30Edita CEFALEA

Revista Digital Sociedad de la Informacion http://www.sociedadelainformacion.com
Figure 10: Equator and celestial Tropics projection.
1) Let O be the Cartesian coordinate origin.
2) With center in O and radio RCap a circumference is traced (Tropic of Capri-corn) that gives us a point A on the positive axis OY (Fig. 11). We take a numericslider between 1 and 20 for RCap.
3) Draw an angle ε = 23.4372◦ from the ordinate axis clockwise to mark pointB on the Tropic of Capricorn. We associate angle ε with a slider and an input box.
4) We join point B with the intersection of the Tropic of Capricorn and the nega-tive OX axis; We obtain point C (Fig. 11).
5) We trace the segment BC, obtaining in intersection with the axis OY the pointP. The length of the segment OP gives us the radius of the Equator.
6) If we proceed with the equator instead of the Tropic of Capricorn as we havedone in the previous steps, we will get the Tropic of Cancer.
Figure 9 justifies the construction made from the fundamental equation of theastrolabe. This fact is very useful for finding the radius of the projected circles.
www.sociedadelainformacion.com No 57 – ENERO 2017 9/30Edita CEFALEA

Revista Digital Sociedad de la Informacion http://www.sociedadelainformacion.com
Figure 11: Construction of the Equator and the celestial Tropics.
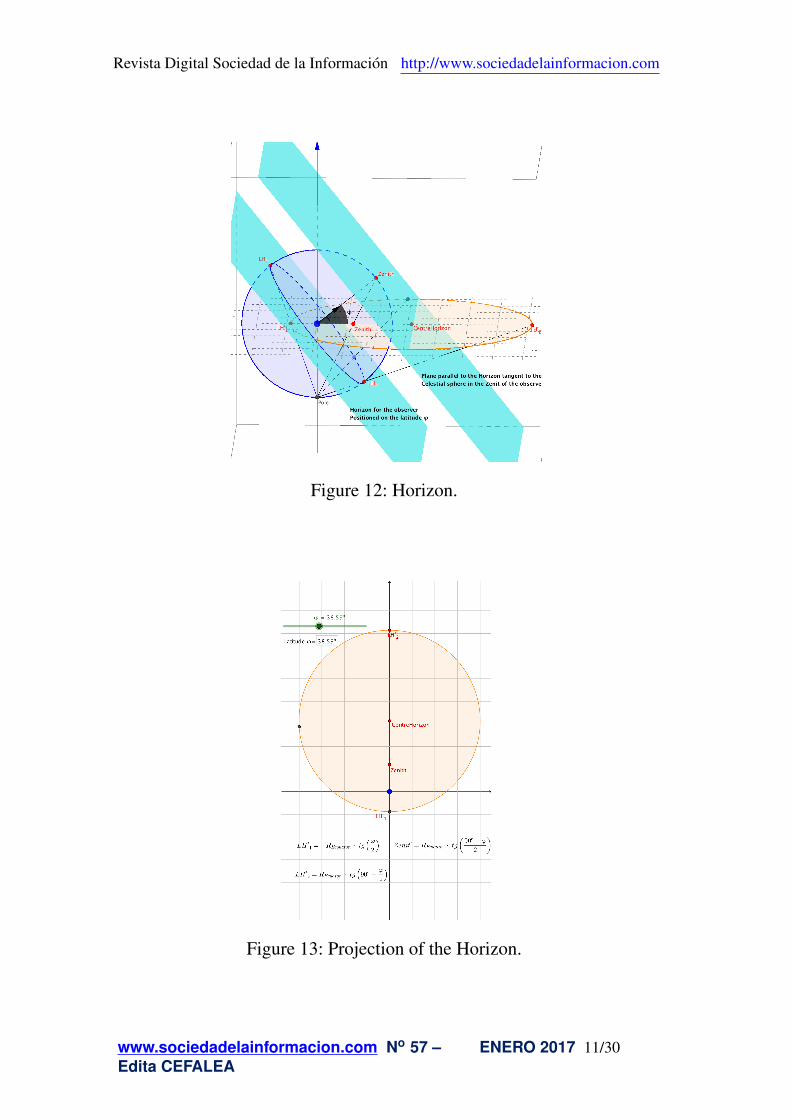
3.2. HorizonAs in the previous section, we compare figures 12 (3D) and 13 (2D), that is, thecelestial sphere and its projection. From both figures the projections of the boun-daries of the horizon are obtained by relations (3) and (4):
LH ′1 =−REcquator · tg(
ϕ
2
)(3)
Zenit ′ = REquator · tg(
90◦−ϕ
2
)(4)
The projection of the Zenith, the point on the head of the observer on the celestialsphere, would be established by (5):
Zenit ′ = REquator · tg(
90◦−ϕ
2
)(5)
We impose the above relations to reproduce the geometric conditions that cha-racterize the projection of the Horizon of the observer.
www.sociedadelainformacion.com No 57 – ENERO 2017 10/30Edita CEFALEA
Revista Digital Sociedad de la Informacion http://www.sociedadelainformacion.com
Figure 12: Horizon.
Figure 13: Projection of the Horizon.
www.sociedadelainformacion.com No 57 – ENERO 2017 11/30Edita CEFALEA
Revista Digital Sociedad de la Informacion http://www.sociedadelainformacion.com
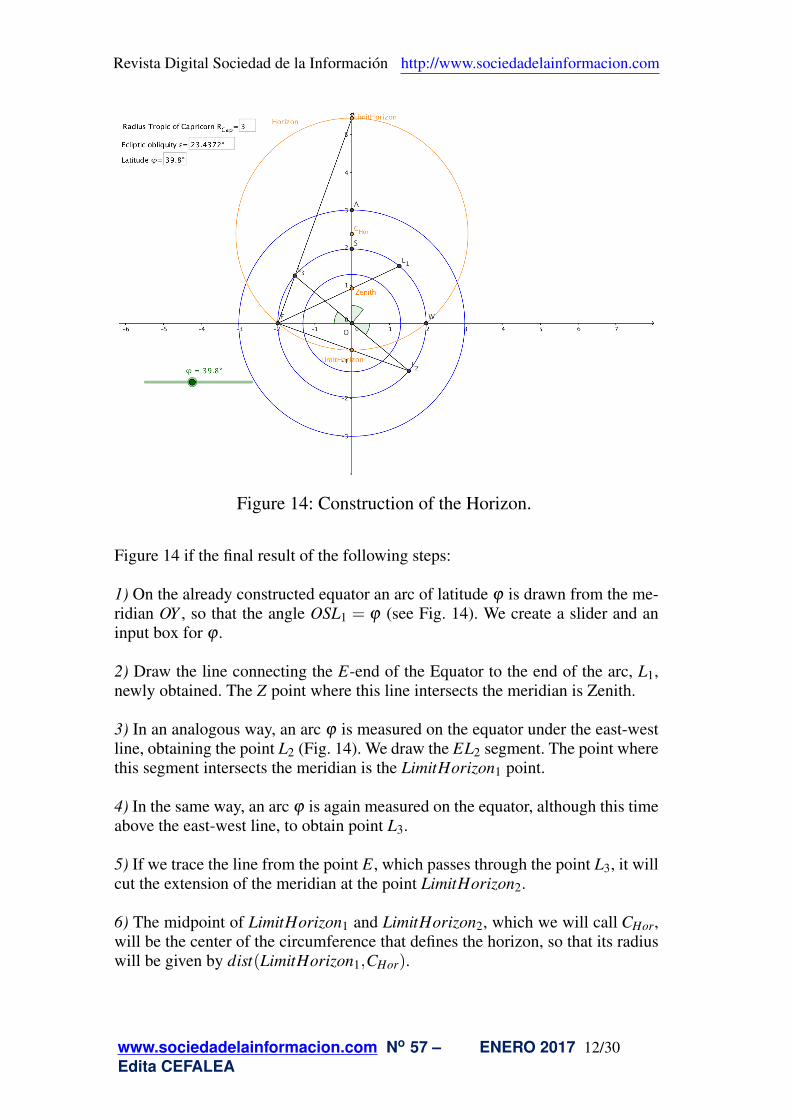
Figure 14: Construction of the Horizon.
Figure 14 if the final result of the following steps:
1) On the already constructed equator an arc of latitude ϕ is drawn from the me-ridian OY , so that the angle OSL1 = ϕ (see Fig. 14). We create a slider and aninput box for ϕ .
2) Draw the line connecting the E-end of the Equator to the end of the arc, L1,newly obtained. The Z point where this line intersects the meridian is Zenith.
3) In an analogous way, an arc ϕ is measured on the equator under the east-westline, obtaining the point L2 (Fig. 14). We draw the EL2 segment. The point wherethis segment intersects the meridian is the LimitHorizon1 point.
4) In the same way, an arc ϕ is again measured on the equator, although this timeabove the east-west line, to obtain point L3.
5) If we trace the line from the point E, which passes through the point L3, it willcut the extension of the meridian at the point LimitHorizon2.
6) The midpoint of LimitHorizon1 and LimitHorizon2, which we will call CHor,will be the center of the circumference that defines the horizon, so that its radiuswill be given by dist(LimitHorizon1,CHor).
www.sociedadelainformacion.com No 57 – ENERO 2017 12/30Edita CEFALEA

Revista Digital Sociedad de la Informacion http://www.sociedadelainformacion.com
Note: In an astrolabe only the part of the inner horizon to the Tropic of Capricornwould be seen.
3.3. AlmucantarAn almucantar is the locus of celestial sphere’s points which are at the sameheight to the plane of the horizon; in fact, the horizon is an almucantar of height0◦, that’s why the following process is similar to the previous one.
Figure 15: Almucantar.
Figures 15 and 16 establish the following ratios (6) and (7):
LA′1 =−REquator · tg(
ϕ−a2
)(6)
LA′2 = REquator · tg(
90◦−(
ϕ−a2
))(7)
Next, we construct the almucantar by imposing the geometric conditions identi-fied in the relations (6) and (7).
Note: Construction can be done on either side of the meridian.
The east-west straight line is normally called right horizon.
www.sociedadelainformacion.com No 57 – ENERO 2017 13/30Edita CEFALEA

Revista Digital Sociedad de la Informacion http://www.sociedadelainformacion.com
Figure 16: Projection of the Almucantar.
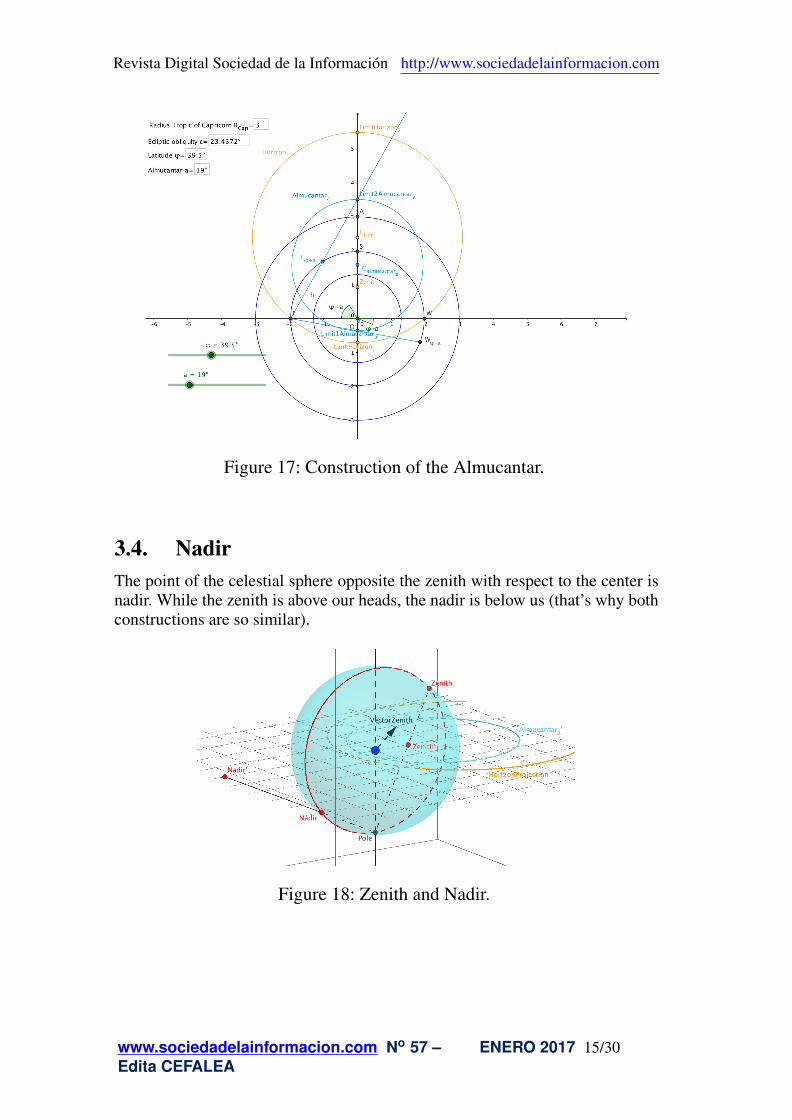
1) To find out the intersection of the almucantar a with the meridian, we shouldmeasure an angle (ϕ−a) under the right horizon on the equator.There wil be obtained a point that we will call Wϕ−a (Fig. 17).
Note: the resulting point will be under the right horizon if a < ϕ , otherwise it willbe on it.
2) Draw the segment by joining the points Wϕ−a and E.The intersection of this segment with the meridian gives us the lower limit ofalmucantar a (Fig. 17).
3) In order to find out the upper limit we should measure ϕ + a upwards; thismust be done from the right horizon (Fig. 17).Once the angle measure has been taken into account, we should draw the segmentEEϕ+a whose extension cuts the meridian at the limit superior to the almucantara (Fig. 17).
www.sociedadelainformacion.com No 57 – ENERO 2017 14/30Edita CEFALEA
Revista Digital Sociedad de la Informacion http://www.sociedadelainformacion.com
Figure 17: Construction of the Almucantar.
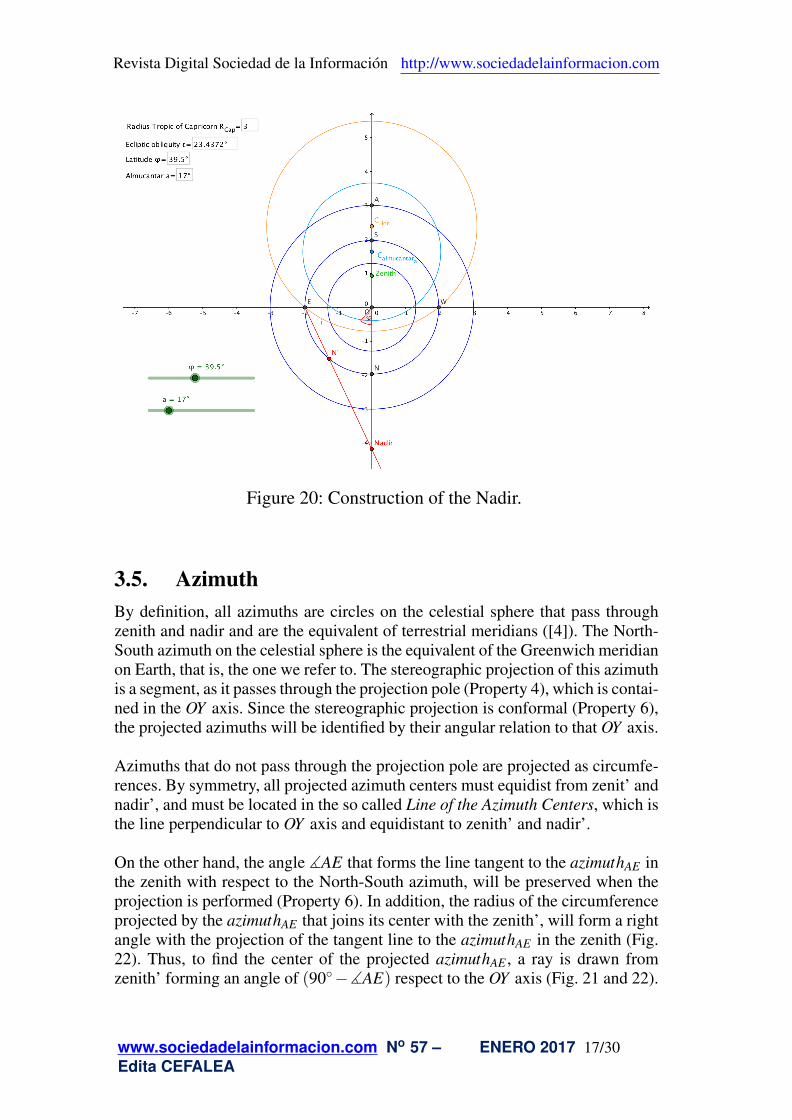
3.4. NadirThe point of the celestial sphere opposite the zenith with respect to the center isnadir. While the zenith is above our heads, the nadir is below us (that’s why bothconstructions are so similar).
Figure 18: Zenith and Nadir.
www.sociedadelainformacion.com No 57 – ENERO 2017 15/30Edita CEFALEA

Revista Digital Sociedad de la Informacion http://www.sociedadelainformacion.com
Figure 19: Projection of the Zenith and Nadir.
From the figures 18 and 19 we can deduce relations (8) and (9):
Zenith′ = REcuador · tg(
90◦−ϕ
2
)(8)
Nadir′ =−REcuador · tg(
90◦+ϕ
2
)(9)
The following construction is adjusted to the conditions established by equations(8) and (9):
1) We draw a ray whose origin is O from the negative axis OY with an angle ϕj inthe clockwise direction. The isosceles triangle OEN′ is obtained (Fig. 20) whoseangle at the unequal vertex is (90◦−ϕ) and the equal angles are about
(90◦+ϕ
2
).
2) Draw a ray from the point E passing through N′. The extension of this linecuts the meridian in the nadir.
www.sociedadelainformacion.com No 57 – ENERO 2017 16/30Edita CEFALEA
Revista Digital Sociedad de la Informacion http://www.sociedadelainformacion.com
Figure 20: Construction of the Nadir.
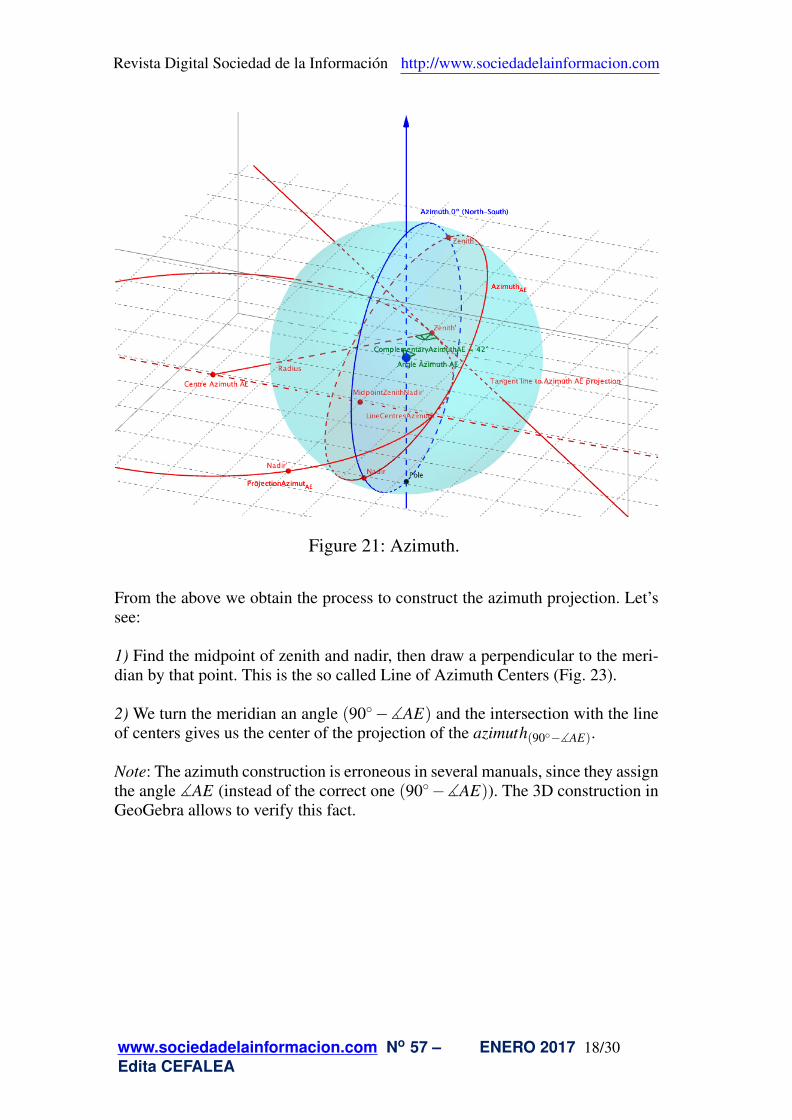
3.5. AzimuthBy definition, all azimuths are circles on the celestial sphere that pass throughzenith and nadir and are the equivalent of terrestrial meridians ([4]). The North-South azimuth on the celestial sphere is the equivalent of the Greenwich meridianon Earth, that is, the one we refer to. The stereographic projection of this azimuthis a segment, as it passes through the projection pole (Property 4), which is contai-ned in the OY axis. Since the stereographic projection is conformal (Property 6),the projected azimuths will be identified by their angular relation to that OY axis.
Azimuths that do not pass through the projection pole are projected as circumfe-rences. By symmetry, all projected azimuth centers must equidist from zenit’ andnadir’, and must be located in the so called Line of the Azimuth Centers, which isthe line perpendicular to OY axis and equidistant to zenith’ and nadir’.
On the other hand, the angle ]AE that forms the line tangent to the azimuthAE inthe zenith with respect to the North-South azimuth, will be preserved when theprojection is performed (Property 6). In addition, the radius of the circumferenceprojected by the azimuthAE that joins its center with the zenith’, will form a rightangle with the projection of the tangent line to the azimuthAE in the zenith (Fig.22). Thus, to find the center of the projected azimuthAE , a ray is drawn fromzenith’ forming an angle of (90◦−]AE) respect to the OY axis (Fig. 21 and 22).
www.sociedadelainformacion.com No 57 – ENERO 2017 17/30Edita CEFALEA
Revista Digital Sociedad de la Informacion http://www.sociedadelainformacion.com
Figure 21: Azimuth.
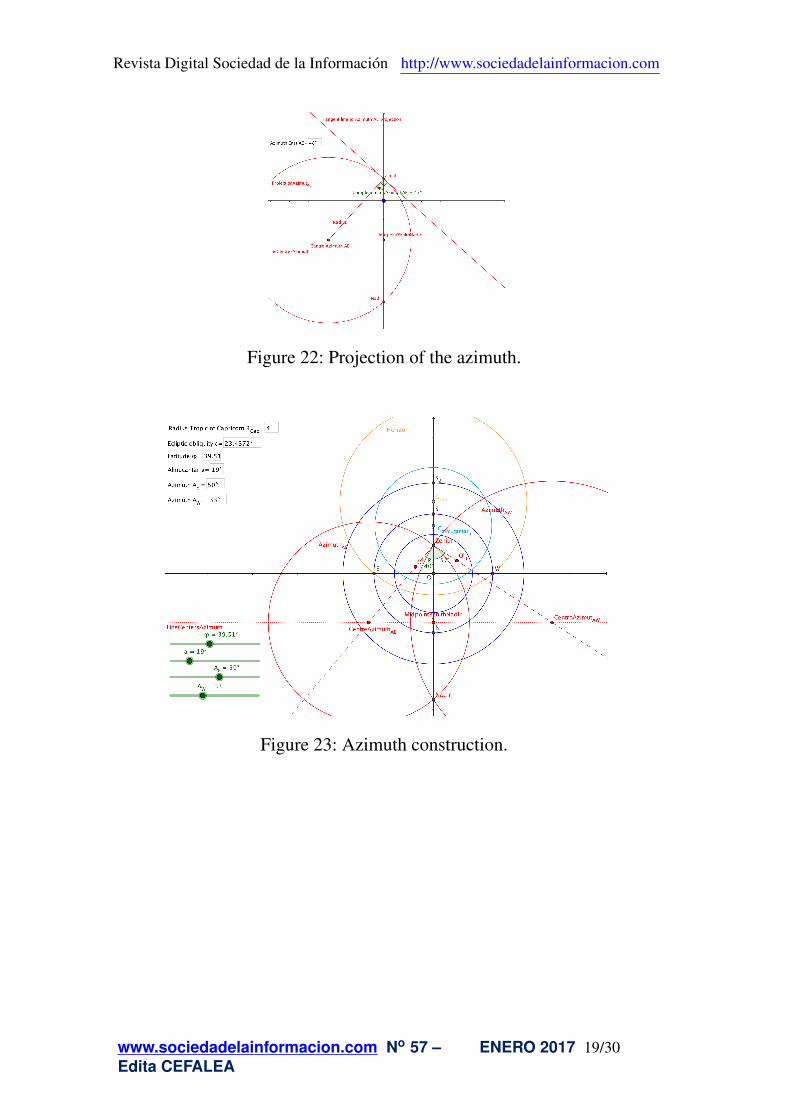
From the above we obtain the process to construct the azimuth projection. Let’ssee:
1) Find the midpoint of zenith and nadir, then draw a perpendicular to the meri-dian by that point. This is the so called Line of Azimuth Centers (Fig. 23).
2) We turn the meridian an angle (90◦−]AE) and the intersection with the lineof centers gives us the center of the projection of the azimuth(90◦−]AE).
Note: The azimuth construction is erroneous in several manuals, since they assignthe angle ]AE (instead of the correct one (90◦−]AE)). The 3D construction inGeoGebra allows to verify this fact.
www.sociedadelainformacion.com No 57 – ENERO 2017 18/30Edita CEFALEA
Revista Digital Sociedad de la Informacion http://www.sociedadelainformacion.com
Figure 22: Projection of the azimuth.
Figure 23: Azimuth construction.
www.sociedadelainformacion.com No 57 – ENERO 2017 19/30Edita CEFALEA
Revista Digital Sociedad de la Informacion http://www.sociedadelainformacion.com
3.6. Ecliptic
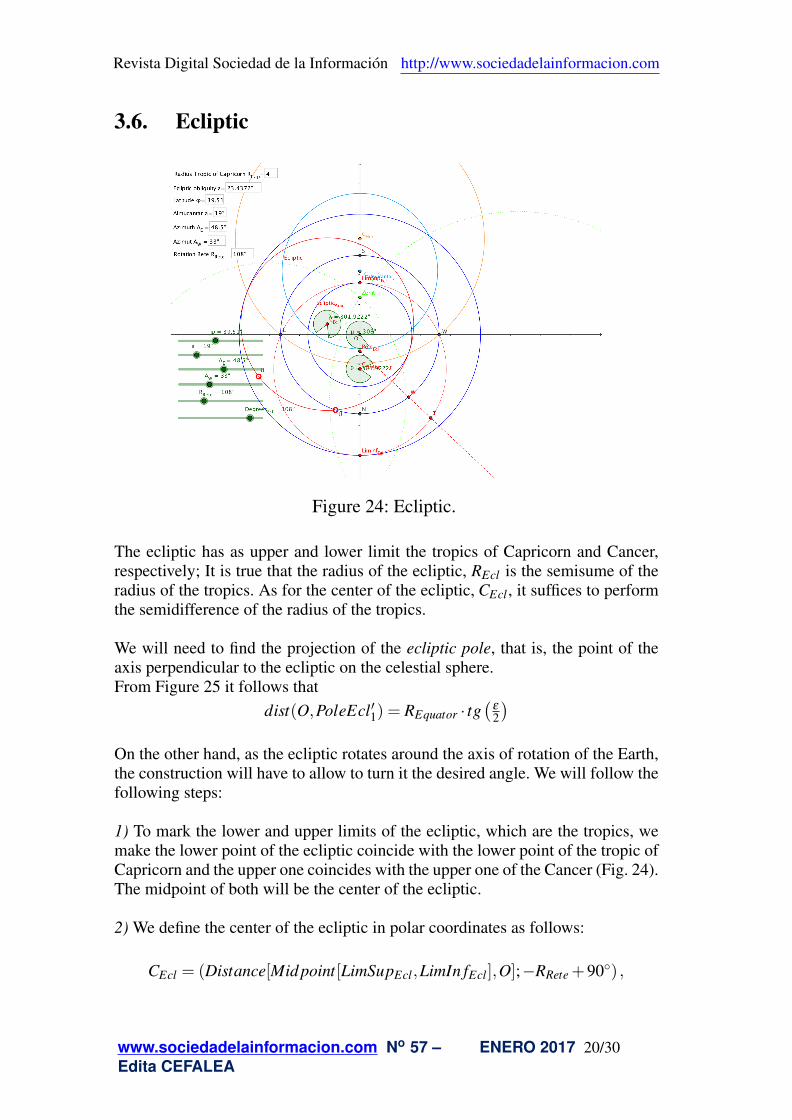
Figure 24: Ecliptic.
The ecliptic has as upper and lower limit the tropics of Capricorn and Cancer,respectively; It is true that the radius of the ecliptic, REcl is the semisume of theradius of the tropics. As for the center of the ecliptic, CEcl , it suffices to performthe semidifference of the radius of the tropics.
We will need to find the projection of the ecliptic pole, that is, the point of theaxis perpendicular to the ecliptic on the celestial sphere.From Figure 25 it follows that
dist(O,PoleEcl′1) = REquator · tg(
ε
2
)On the other hand, as the ecliptic rotates around the axis of rotation of the Earth,the construction will have to allow to turn it the desired angle. We will follow thefollowing steps:
1) To mark the lower and upper limits of the ecliptic, which are the tropics, wemake the lower point of the ecliptic coincide with the lower point of the tropic ofCapricorn and the upper one coincides with the upper one of the Cancer (Fig. 24).The midpoint of both will be the center of the ecliptic.
2) We define the center of the ecliptic in polar coordinates as follows:
CEcl = (Distance[Mid point[LimSupEcl,LimIn fEcl],O];−RRete +90◦) ,
www.sociedadelainformacion.com No 57 – ENERO 2017 20/30Edita CEFALEA

Revista Digital Sociedad de la Informacion http://www.sociedadelainformacion.com
Figure 25: Ecliptic poles.
where RRete is an angle slider between 0◦ and 360◦ to rotate the ecliptic clock-wise. We will consider as a starting point for the ecliptic the place where its centeris right in the meridian that is under the straight horizon (axis OX).
3) We define the ecliptic as the circumference with center in CEcl and as radiusthe half of the segment that links LimIn fEcl and LimSupEcl , that is to say,
Ecliptic =Circun f erence[CEcl,
Distance[LimIn fEcl ,LimSupEcl ]2
]4) We define the pole of the Ecliptic as:
PoleEcl =(0,−Distance[O,S] · tg
(ε
2
)),
This point will be one of the two fixed reference points on the ecliptic to measureangles on it.
5) To graduate the ecliptic we will make an auxiliary ecliptic. We take a circum-ference whose center is the center of the ecliptic on the meridian, that is, themidpoint of the upper and lower limits of the ecliptic.
With center at the midpoint
CEclAux = Mid point [LimSupEcl,LimSupEcl],
www.sociedadelainformacion.com No 57 – ENERO 2017 21/30Edita CEFALEA
Revista Digital Sociedad de la Informacion http://www.sociedadelainformacion.com
we draw a circumference that passes said upper and lower limits of the eclip-tic
EclipticAux =Circum f erence [CEclAux,LimSupEcl],
6) We create the angle slider DegreesEcl between 0◦ and 360◦. On the equator wemeasure, from the point W (lateral point) and centered on O, using the tool Anglegiven its amplitude, a counterclockwise angle according to the DegreesEcl value;it will give us the point W ′ on the equator (Fig. 24).
7) Draw a ray from the ecliptic pole and pass through W ′, this will cut the auxi-liary ecliptic at a point T (we will hide the rotating ecliptic so as not to confuseus).
8) Now we mark the angle that forms, on the auxiliary ecliptic, W with its centerCEclAux and the point we have just discovered T ; we will call θ at that angle.
9) It is now when we mark on the rotating ecliptic the angle θ (it is convenient tohide the auxiliary ecliptic, that is, the fixed ecliptic).
We place a point U on the rotating ecliptic, which occupies the same position asthe point W when both ecliptic, rotary and rigid match. To do this last, place theEcliptic in its lowest position and put a point U on it. We set coordinate y(U) = 0(this must be done because of the precision).
Finally, using the tool Angle given its amplitude we measure an angle θ in anti-clockwise on the rotating ecliptic with U as lateral point and CEcl as center; theselast are the two points that we will have as fixed reference in the ecliptic. Thisangle θ will give the point U ′ on the movable ecliptic that will correspond withthe desired graduation DegreesEcl .
Note: The point U marks 0◦ Aries, ie the start of the Zodiac. Every 30◦ a newsign of the Zodiac appears: Taurus, Gemini, Cancer, Leo, Virgo, Libra, Scorpio,Sagittarius, Capricorn, Aquarius and Pisces.As a curiosity, it is possible to say that all constellations that crossed the ecliptic,although they forgot to include Ofiuco, so that the horoscopes always have beendesigned obviate this constellation.
3.7. Stars and constellationsThe rotation of the rete simulates the rotation of the celestial sphere and allowsto position the positions of the stars at any instant. The set of stars rotates com-pletely in a sidereal day, about 23 h. 56’ 4”. This period is about 3’ 56”less thana average solar day, because the Earth has to rotate a little further until the Sun
www.sociedadelainformacion.com No 57 – ENERO 2017 22/30Edita CEFALEA

Revista Digital Sociedad de la Informacion http://www.sociedadelainformacion.com
reaches the desired meridian by having also moved in its orbit ([3]).
The position of a star on the arches of azimuth and almucantar shows its coordi-nates in the celestial sphere. When the spider is placed at a certain sidereal hourit shows us a snapshot of the sky at that moment.
The stars of the spider are usually grouped in constellations superimposed onsome figures to identify them better. These groupings (asterisms) are preservedwhen projected, however, the sizes of the constellations near the South Pole andthe Tropic of Capricorn are smaller than those located near the equator.
Star charts are made to hold them over our heads, imitating the image we seefrom the sky. However, the astrolabe is a representation of the celestial sphereseen from the outside, not from within. This orientation alters, for example, theimage of the Ursa Major, whose shape is reversed.
Choosing the stars to include in the spider is a trivial exercise. Bright stars likeRegulus, Sirius, Rigel..., are included almost always.
A list of stars, with their coordinates of the time J2000.0, is available in [6] or inStellarium.
Note: The precession of the equinoxes causes the stars to change their position,although it is perceptible only with the passage of several decades.
Example: from [6] we are going to place Rigel on the rete; write down the nameof the star in the search engine and press Submit. The fields that are going tointerest us are the last two columns, that is, -RA.icrs and -DE.icrs.
-RA.icrs: value of right ascension in time J2000.0 given in hours: minutes: se-conds (h: m: s).
Note: 1 hour is equivalent to 15◦.
-DE.icrs: value of the decline of the period J2000.0 given in degrees: arcminutes:arcseconds (d: m: s), that is, d: arcmin: arcsec.Note: 1 arcmin = 1/60 degree.
In our case, Rigel’s properties are:
Right ascension α = 5 h. 14’ 32.2”≈ 5.2423h.·(15)−→ 78.6345◦
Declination δ =−8◦ 12 arcmin. 6.08 arcsec. ≈−8.2017◦
A star is represented in polar coordinates as rα , where α is the right ascension of? the star counterclockwise from the vernal equinox W (intersection of the posi-tive axis OX with the equator), while r = R · tg
(90◦−δ
2
)
www.sociedadelainformacion.com No 57 – ENERO 2017 23/30Edita CEFALEA
Revista Digital Sociedad de la Informacion http://www.sociedadelainformacion.com
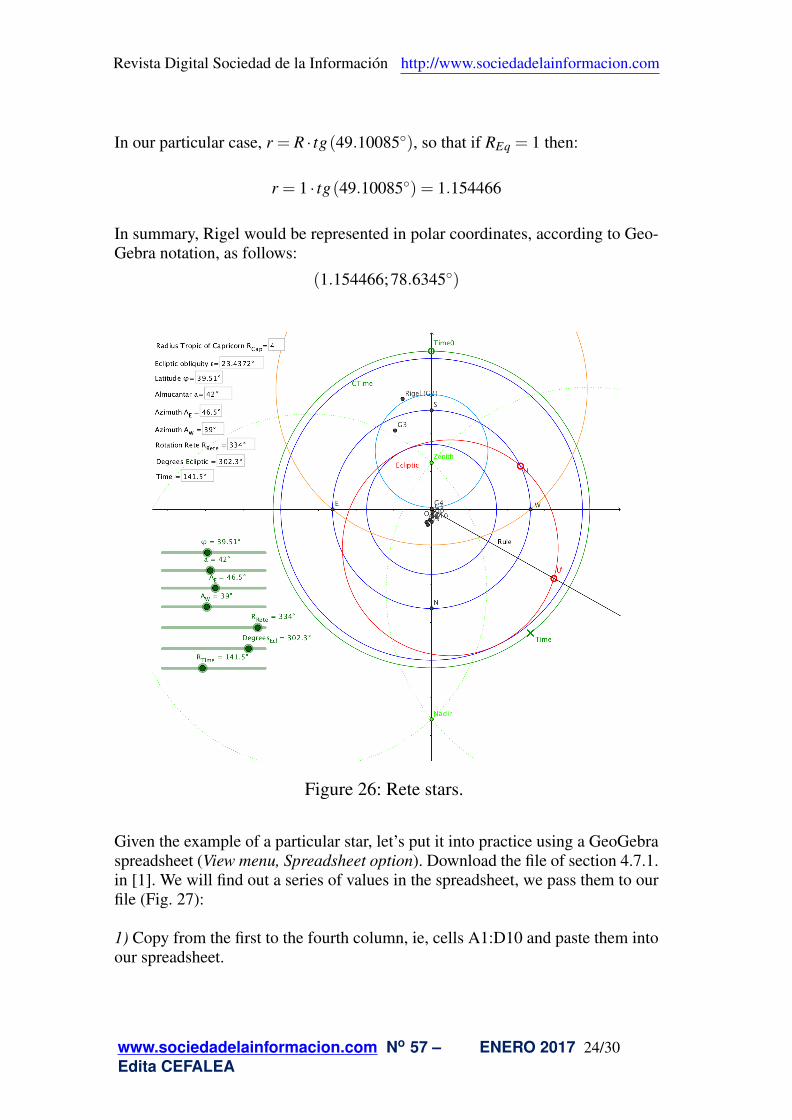
In our particular case, r = R · tg(49.10085◦), so that if REq = 1 then:
r = 1 · tg(49.10085◦) = 1.154466
In summary, Rigel would be represented in polar coordinates, according to Geo-Gebra notation, as follows:
(1.154466;78.6345◦)
Figure 26: Rete stars.
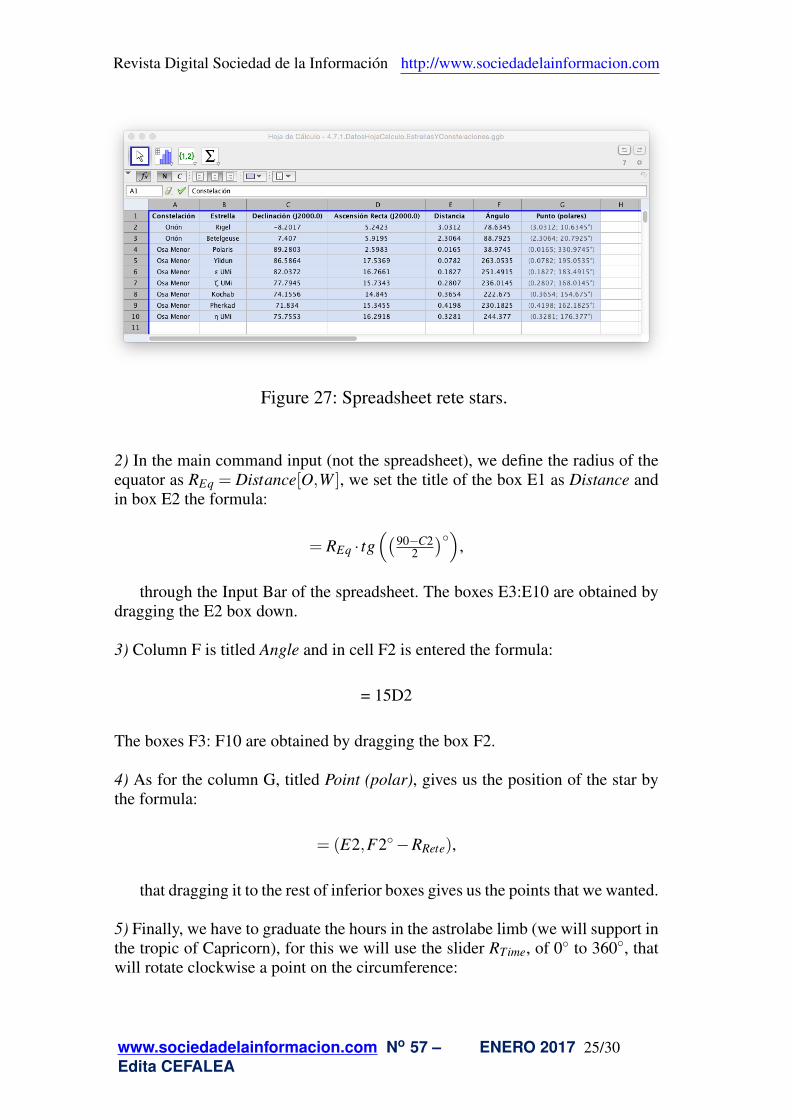
Given the example of a particular star, let’s put it into practice using a GeoGebraspreadsheet (View menu, Spreadsheet option). Download the file of section 4.7.1.in [1]. We will find out a series of values in the spreadsheet, we pass them to ourfile (Fig. 27):
1) Copy from the first to the fourth column, ie, cells A1:D10 and paste them intoour spreadsheet.
www.sociedadelainformacion.com No 57 – ENERO 2017 24/30Edita CEFALEA
Revista Digital Sociedad de la Informacion http://www.sociedadelainformacion.com
Figure 27: Spreadsheet rete stars.
2) In the main command input (not the spreadsheet), we define the radius of theequator as REq = Distance[O,W ], we set the title of the box E1 as Distance andin box E2 the formula:
= REq · tg((90−C2
2
)◦),
through the Input Bar of the spreadsheet. The boxes E3:E10 are obtained bydragging the E2 box down.
3) Column F is titled Angle and in cell F2 is entered the formula:
= 15D2
The boxes F3: F10 are obtained by dragging the box F2.
4) As for the column G, titled Point (polar), gives us the position of the star bythe formula:
= (E2,F2◦−RRete),
that dragging it to the rest of inferior boxes gives us the points that we wanted.
5) Finally, we have to graduate the hours in the astrolabe limb (we will support inthe tropic of Capricorn), for this we will use the slider RTime, of 0◦ to 360◦, thatwill rotate clockwise a point on the circumference:
www.sociedadelainformacion.com No 57 – ENERO 2017 25/30Edita CEFALEA

Revista Digital Sociedad de la Informacion http://www.sociedadelainformacion.com
CTime =Circum f erence [O,1.05 ·RCap]
Now we define the point Time0 at the intersection of the positive axis OY withthe circumference CHora, and we rotated this point with center in O and anglethe defined by the slider RTime clockwise:
Time = Rotate [Time0,−RTime,O]
The Hour point will give us the local time from the equivalence 1hour = 15◦. Inthe end the obverse would look like Figure 4.
3.8. CalendarThe obverse of the astrolabe can be designed following the eccentric or con-centric model, for the center of the calendar. The eccentric model was the mostpopular ([3]) and is the one we are going to explain. There are two circumferen-ces, one inside for the calendar and another outside for the solar length (value ofthe Zodiac). The alidade relates a calendar date to a Zodiac point in its extension(Fig. 3).In this case we have two fundamental centers, the center of the calendar and thecenter of the instrument (where the coordinate axes are cut). Both centers belongto the line that joins aphelion and perihelion, the first is the point farthest fromthe center of the instrument, while the second is the nearest.
The distance between both instruments is given by the formula:
∆ = 2 · e · rc,
where e is the eccentricity of the sun’s elliptical orbit, while rc is the radiusof the calendar.
Thus, if ω is the angle that forms the axis with the line that joins aphelion andperihelion counterclockwise, then the coordinates of the center of the calendar,rcwould be given as:
CCal = (xc,yc) = (∆ · cos(ω) ,∆ · sin(ω))
The eccentric calendar is a recreation of the model of the Sun, from the Ptolemaicastronomy, which satisfied the medieval needs; at least until Copernicus, Galileoand, fundamentally Kepler, made their discoveries ([2]). The Ptolemaic modelwas sufficient in medieval times and more than meets the precision required foran astrolabe.
The Sun moves at a constant speed around the calendar circle in this model (asrepresented by the astrolabe) and is observed from the Earth in the center of the
www.sociedadelainformacion.com No 57 – ENERO 2017 26/30Edita CEFALEA
Revista Digital Sociedad de la Informacion http://www.sociedadelainformacion.com
instrument (although in fact it’s just the opposite). The length for a date is displa-yed in the Zodiac when the alidade is set to a calendar scale date.
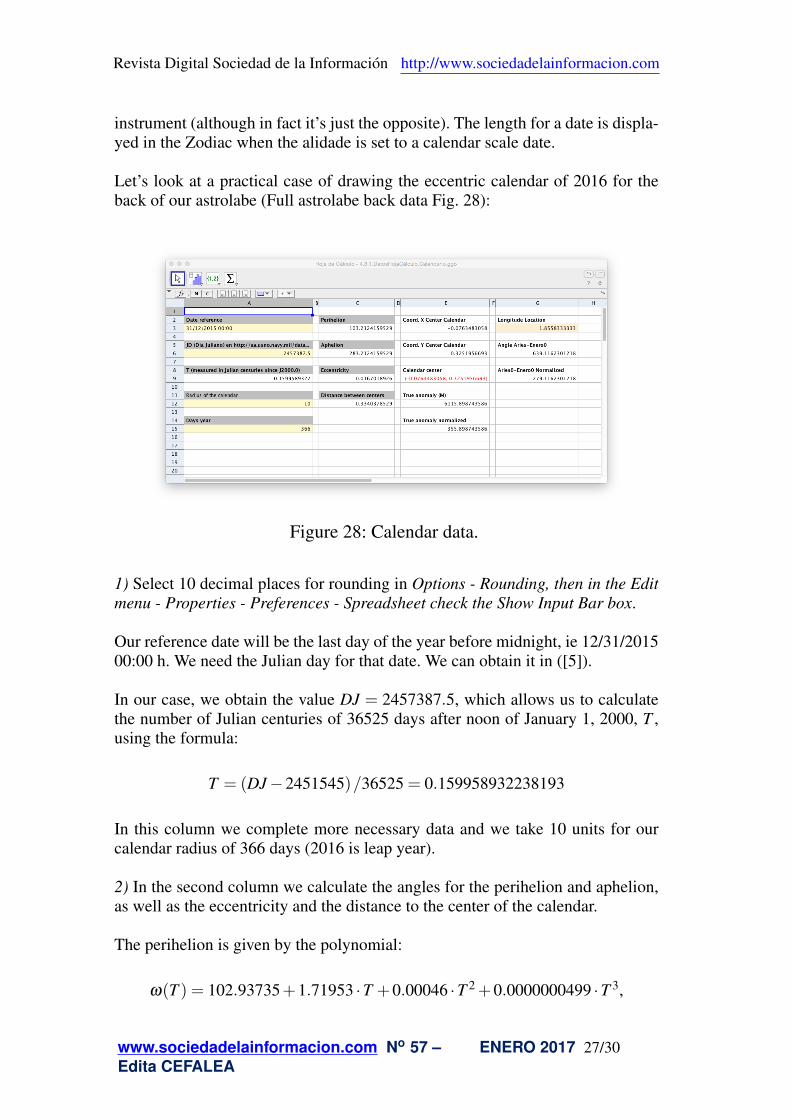
Let’s look at a practical case of drawing the eccentric calendar of 2016 for theback of our astrolabe (Full astrolabe back data Fig. 28):
Figure 28: Calendar data.
1) Select 10 decimal places for rounding in Options - Rounding, then in the Editmenu - Properties - Preferences - Spreadsheet check the Show Input Bar box.
Our reference date will be the last day of the year before midnight, ie 12/31/201500:00 h. We need the Julian day for that date. We can obtain it in ([5]).
In our case, we obtain the value DJ = 2457387.5, which allows us to calculatethe number of Julian centuries of 36525 days after noon of January 1, 2000, T ,using the formula:
T = (DJ−2451545)/36525 = 0.159958932238193
In this column we complete more necessary data and we take 10 units for ourcalendar radius of 366 days (2016 is leap year).
2) In the second column we calculate the angles for the perihelion and aphelion,as well as the eccentricity and the distance to the center of the calendar.
The perihelion is given by the polynomial:
ω(T ) = 102.93735+1.71953 ·T +0.00046 ·T 2 +0.0000000499 ·T 3,
www.sociedadelainformacion.com No 57 – ENERO 2017 27/30Edita CEFALEA

Revista Digital Sociedad de la Informacion http://www.sociedadelainformacion.com
which in our case yields the value ω = 103.212415952911◦.
As far as aphelion is concerned and, although it is not exact, we can assume wit-hout valuable loss that it will be ω +180◦ = 283.212415952912◦
The eccentricity is calculated by:
E(T ) =0.01670862−0.000042037 ·T −0.0000001236 ·T 2 +0.00000000004 ·T 3,
which for our calendar has the value e = 0.0167018926439933Once the eccentricity is calculated, we can find out the distance between thecenters of the calendar and the instrument, using the relation ∆ = 2 · e · rc, whosevalue in our example is ∆ = 0.3340378528798673) We are now in a position to find the coordinates of the center of the calendar:
CCal = (xc,yc) = (∆ · cos(ω◦),∆ · sin(ω◦)) =(−0.0763483058073402,−0.0763483058073402),
It is compulsory to express the symbol ◦ for the perihelion to find out cosine andsine.
To complete the data in this column we are missing the true anomaly; with itthe point of the calendar can be located the beginning of counting days, that is,January 0, January 1, January 2...The true anomaly, M, is obtained by the formula:
M(T ) = 357.5291◦+35999.0503◦ ·T −0.0001559◦ ·T 2−0.00000048◦ ·T 3,
which yields the value M = 6115.89874358605, normalized between 0◦ and360◦ by means of the formula:
= M− f loor( M
360
)·360,
where the command floor(arg) is the largest integer less than or equal to arg.Thus,
M = 355.898743586046
4) Now we need to enter the length of our reference location. For example, if wedecide to do it for Albacete 1◦51′21” West we take
www.sociedadelainformacion.com No 57 – ENERO 2017 28/30Edita CEFALEA

Revista Digital Sociedad de la Informacion http://www.sociedadelainformacion.com
λ = 1+ 5160 +
21602 = 1.85583333333334
The clockwise angle α , between Aries 0◦ (intersection of the Zodiac with thepositive OX axis) and January 0, is calculated by the following formula:
α = Aphelion◦+M◦+ λ
Days o f the year
We take 366 because 2016 is a leap year, so α = 639.116230121835◦, which isnormalized as
= α− f loor(
α
360
)·360 = 279.116230121835◦
5) All the values recorded in the spreadsheet must be transferred to the GraphicsView. First, as in the algebraic view we have left a lot of text references, we selectthem all and in Properties - Basic we marked the option Auxiliary Object so thatthey disappear from the Algebra View.
We define the EquinoxVernal = (A12,0) and plot the circumference correspon-ding to the calendar: Circum f erence = [E9,A12].
Points Aries0 = (A12+2,0) and O = (0,0) are defined and we draw a circumfe-rence for the Zodiac: Circum f erence = [O,Aries0].
Now we define the Perihelion=Rotate [EquinoxVernal,C3◦,O] and we draw theray: RayPerihelionAphelion = Ray [Perihelion,E9]
The aphelion is obtained by doing:
Aphelion = Intersect [RayPerihelionAphelion,Calendar]
We define January0Aries0 = Rotate [EquinoxVernal,G9◦,O]; which will give usthe start of the calendar if we do
Aries0 = Intersect [Calendar,Ray [O,January0Aries0]]
6) We establish the two main measurements of angles that we must make for thecalendar and the Zodiac. We define the slider for the calendar, RCal , that goesfrom 0◦ to 366◦ in counter-clock wise; it will move the defined point accordingto the instruction:
DateCalendar = Rotate [Enero0,RCal ·360,E9],
www.sociedadelainformacion.com No 57 – ENERO 2017 29/30Edita CEFALEA

Revista Digital Sociedad de la Informacion http://www.sociedadelainformacion.com
where E9 is the center of the calendar. The slider, RZod , between 0◦ and 360◦counterclockwise, will rotate PointZodiac = Rotate [Aries0,GZod,O]
4. ConclusionAstronomy is an inexhaustible source of resources for mathematics and vicever-sa. Knowing how the astrolabe works provides an implicit knowledge of basiccelestial mechanics and, on the other hand, can be designed from fundamentalmathematical properties. We believe that the construction of an astrolabe is avery enriching work, since several disciplines are involved.
References[1] GARCIA PIQUERAS, Manuel (2016) El Astrolabio Universal GeoGebra,
GeoGebra Book,http://www.geogebra.org/b/2471627, Albacete (Espana).
[2] HOURCADE, J. L. (2009) Copernico y Kepler. La rebelion de los astrono-mos, Nivola.
[3] MORRISON, J.E. (2007) The astrolabe, Janus, Rehoboth Beach (UnitedStates).
[4] RIGUTTI, A. (2010) Observar el cielo. Un viaje entre estrellas y planetaspara conocer el Universo, Enciclopedia Universal. Editorial Tikal, Madrid(Espana).
[5] USNO (2015) Julian Date Converter, GeoGebra Book,http://aa.usno.navy.mil/data/docs/JulianDate.php, U.S. Naval Ob-servatory, Washington (Estados Unidos).
[6] VIZIER (2016) (2016) Catalogue access tool, GeoGebra Book,http://vizier.u-strasbg.fr/viz-bin/VizieR?- source%3DI/131A ,Centre de Donnees de Strasbourg (CDS), Strasbourg (France).
www.sociedadelainformacion.com No 57 – ENERO 2017 30/30Edita CEFALEA


![Yantraraja [the Astrolabe in Sanskrit], 1999](https://static.fdocuments.net/doc/165x107/55cf994d550346d0339ca97e/yantraraja-the-astrolabe-in-sanskrit-1999.jpg)