Uniting Agriculture Through Education Brent Searle Oregon Department of Agriculture.
42
Uniting Agriculture Through Education Brent Searle Oregon Department of Agriculture
-
Upload
maude-willis -
Category
Documents
-
view
218 -
download
0
Transcript of Uniting Agriculture Through Education Brent Searle Oregon Department of Agriculture.
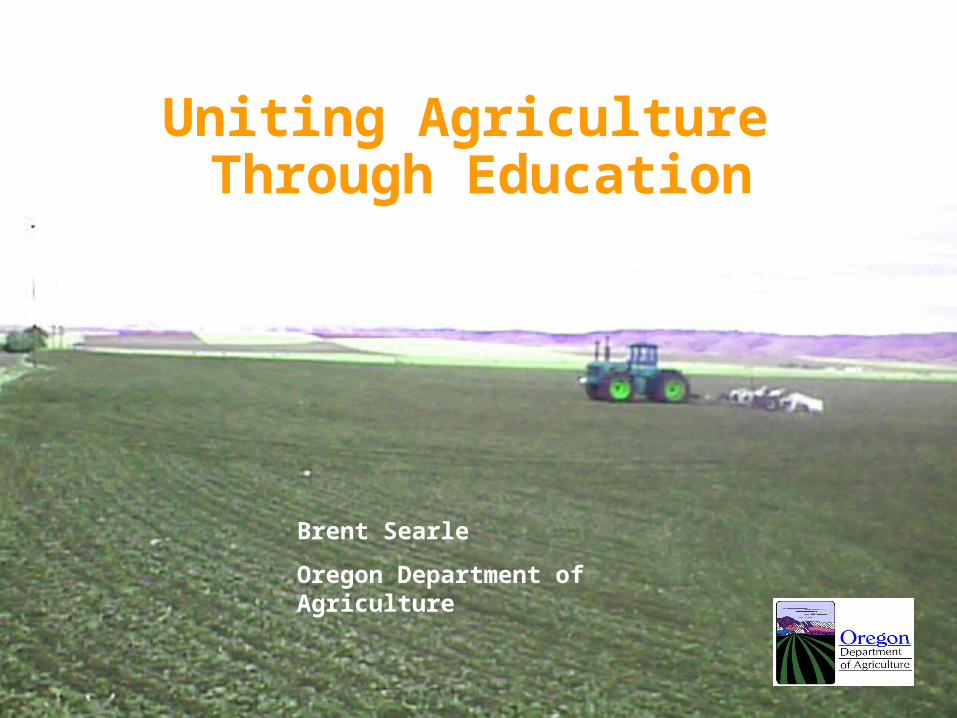
Uniting Agriculture Through Education
Brent Searle
Oregon Department of Agriculture
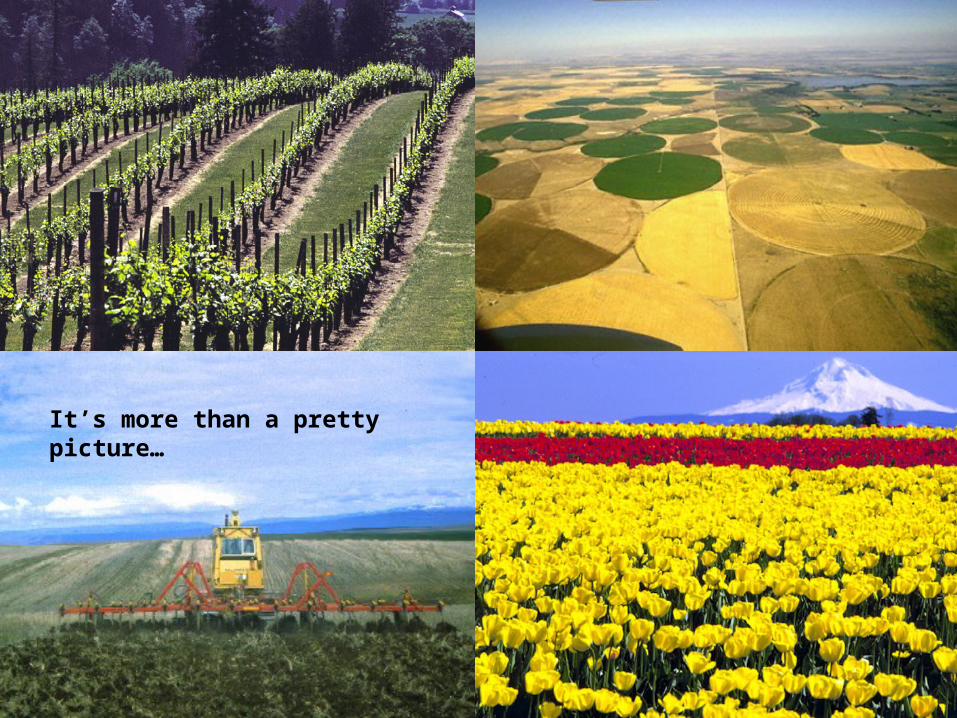
It’s more than a pretty picture…
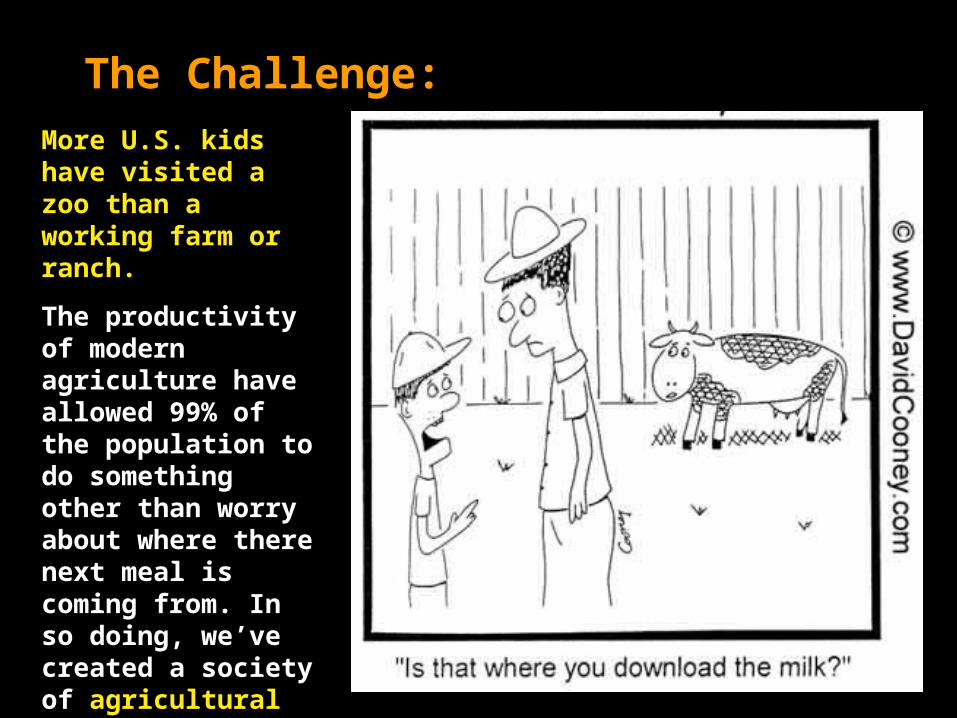
The Challenge:More U.S. kids have visited a zoo than a working farm or ranch.
The productivity of modern agriculture have allowed 99% of the population to do something other than worry about where there next meal is coming from. In so doing, we’ve created a society of agricultural illiterates.
OWA Support for AITC - THANK YOU!
Agriculture in the Classroom is reaching over 28,000 students in 2003/04, up from 3,000 in 1999/2000;
Over 1,000 teachers are utilizing AITC materials.
AITC works in tandem with 4-H Extension Programs and FFA in High School.
http://aitc.oregonstate.edu/
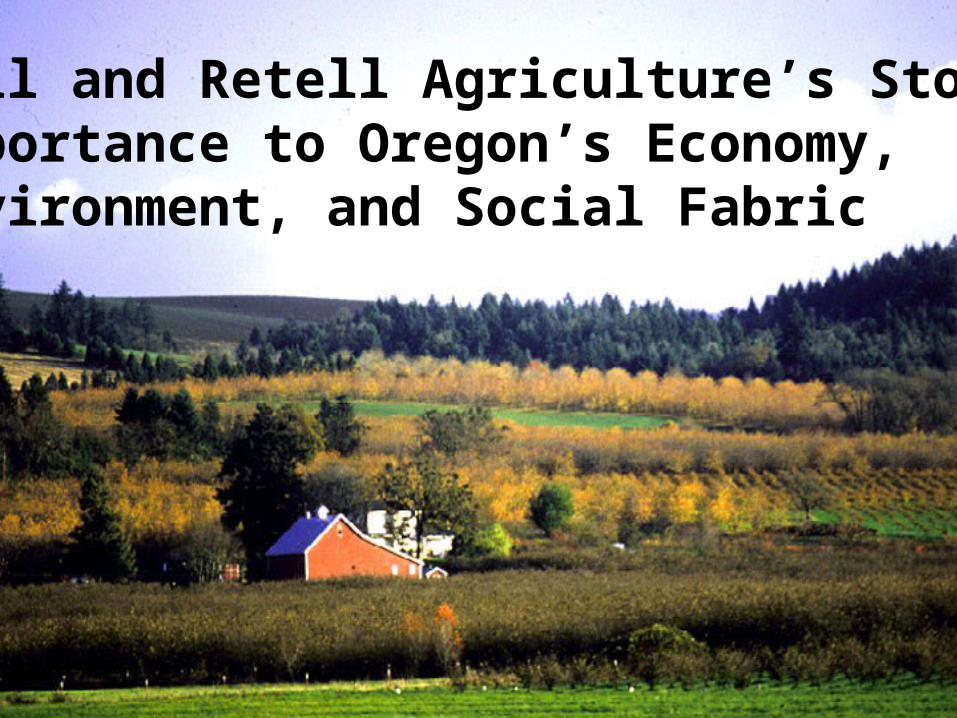
Tell and Retell Agriculture’s Story:Importance to Oregon’s Economy,Environment, and Social Fabric
Director Coba’s Mantra:
It’s ALL about agriculture!
QuickTime™ and aTIFF (Uncompressed) decompressor
are needed to see this p icture.
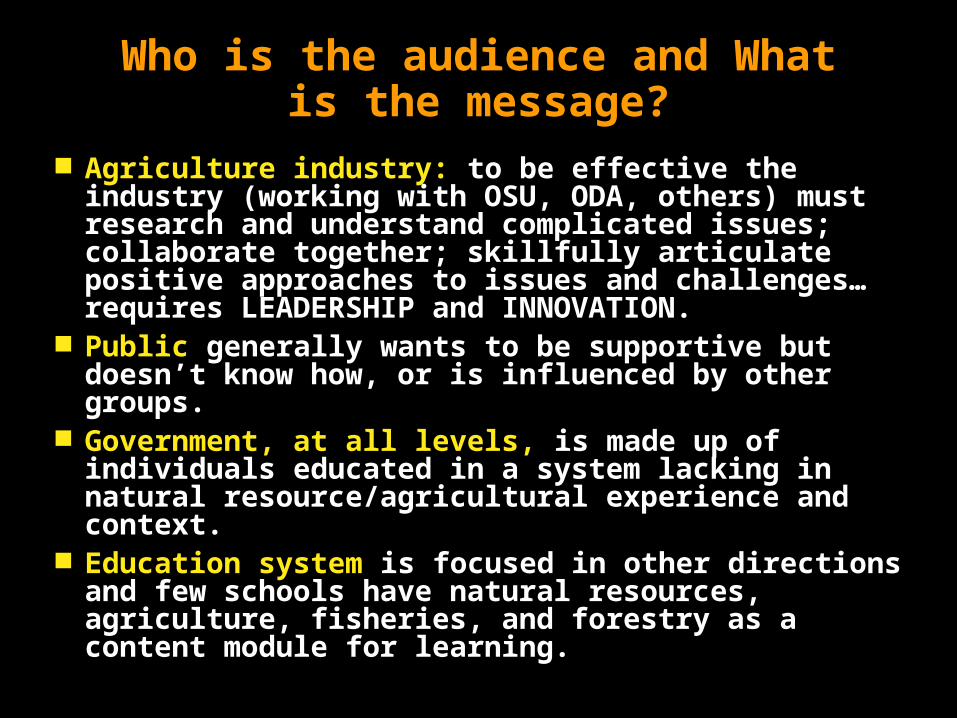
Who is the audience and What is the message?
Agriculture industry: to be effective the industry (working with OSU, ODA, others) must research and understand complicated issues; collaborate together; skillfully articulate positive approaches to issues and challenges… requires LEADERSHIP and INNOVATION.
Public generally wants to be supportive but doesn’t know how, or is influenced by other groups.
Government, at all levels, is made up of individuals educated in a system lacking in natural resource/agricultural experience and context.
Education system is focused in other directions and few schools have natural resources, agriculture, fisheries, and forestry as a content module for learning.
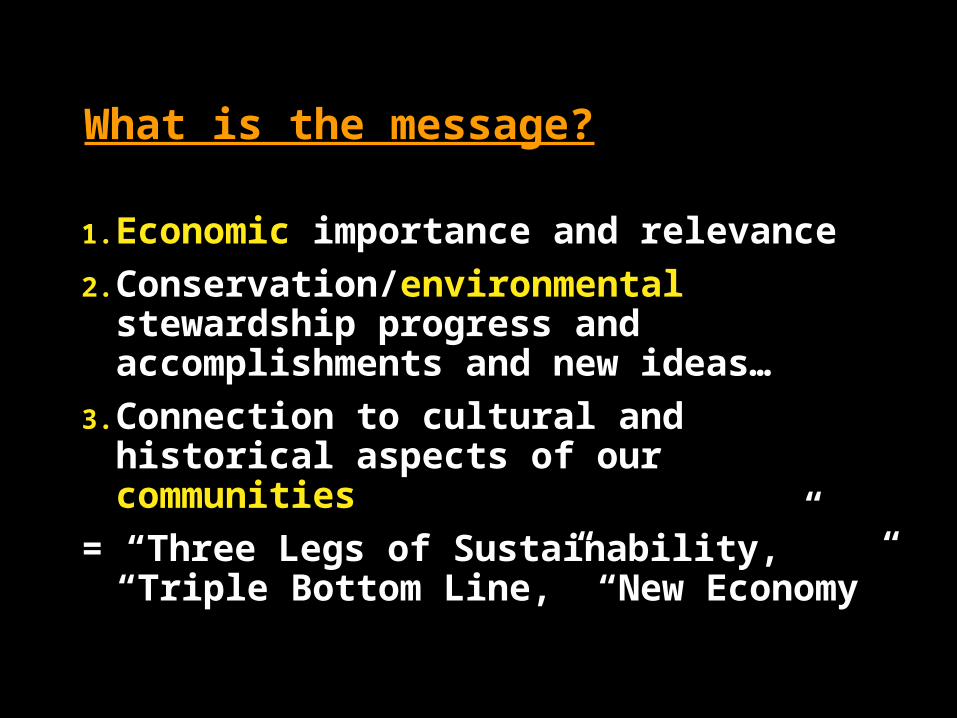
What is the message?
1. Economic importance and relevance
2. Conservation/environmental stewardship progress and accomplishments and new ideas…
3. Connection to cultural and historical aspects of our communities
= “Three Legs of Sustainability,” “Triple Bottom Line,” “New Economy”

How Does ODA fit in?
Mission Statement:
1. to promote economic development and expand market opportunities for Oregon agricultural products.
2. to protect the natural resource base for present and future generations of farmers and ranchers.
3. to ensure food safety and provide consumer protection;
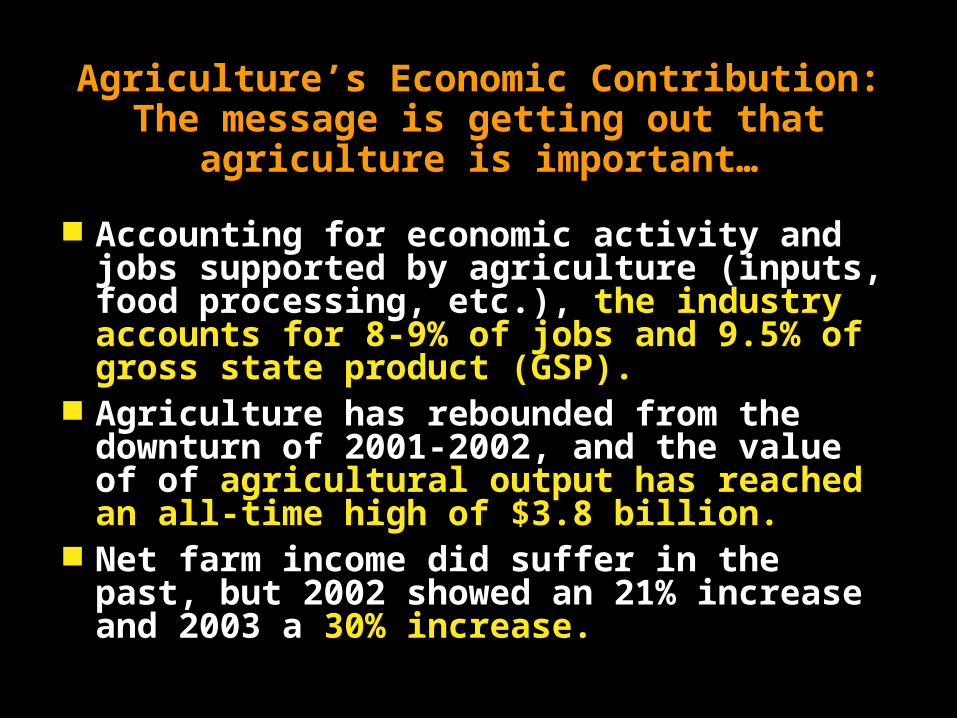
Agriculture’s Economic Contribution:The message is getting out that agriculture
is important…
Accounting for economic activity and jobs supported by agriculture (inputs, food processing, etc.), the industry accounts for 8-9% of jobs and 9.5% of gross state product (GSP).
Agriculture has rebounded from the downturn of 2001-2002, and the value of of agricultural output has reached an all-time high of $3.8 billion.
Net farm income did suffer in the past, but 2002 showed an 21% increase and 2003 a 30% increase.
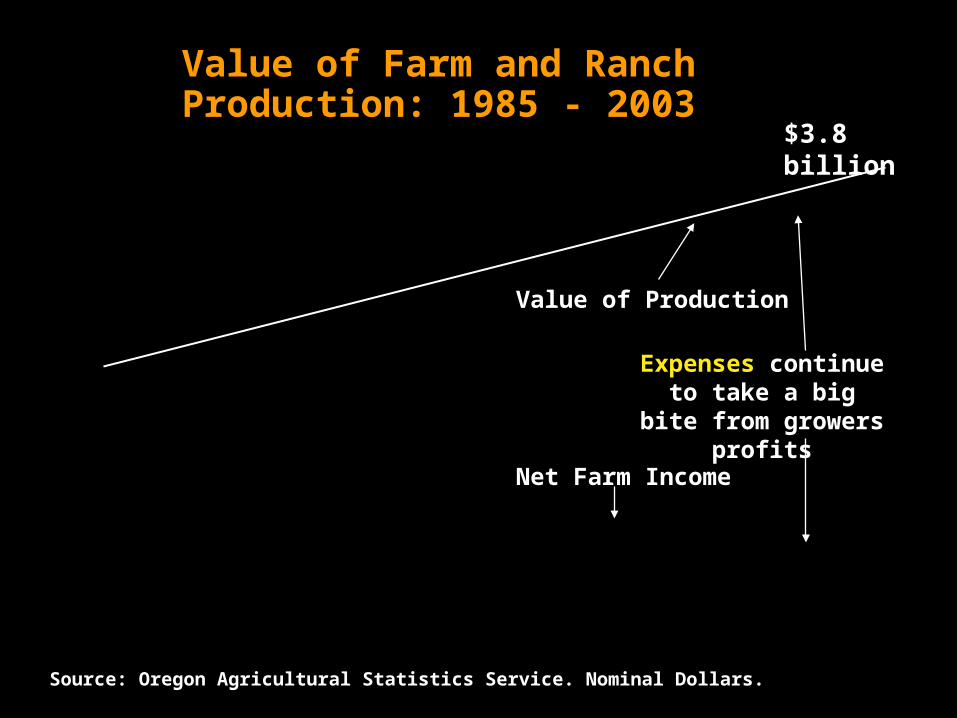
Value of Farm and Ranch Production: 1985 - 2003
Source: Oregon Agricultural Statistics Service. Nominal Dollars.
$3.8 billion
Value of Production
Net Farm Income
Expenses continue to take a big bite
from growers profits
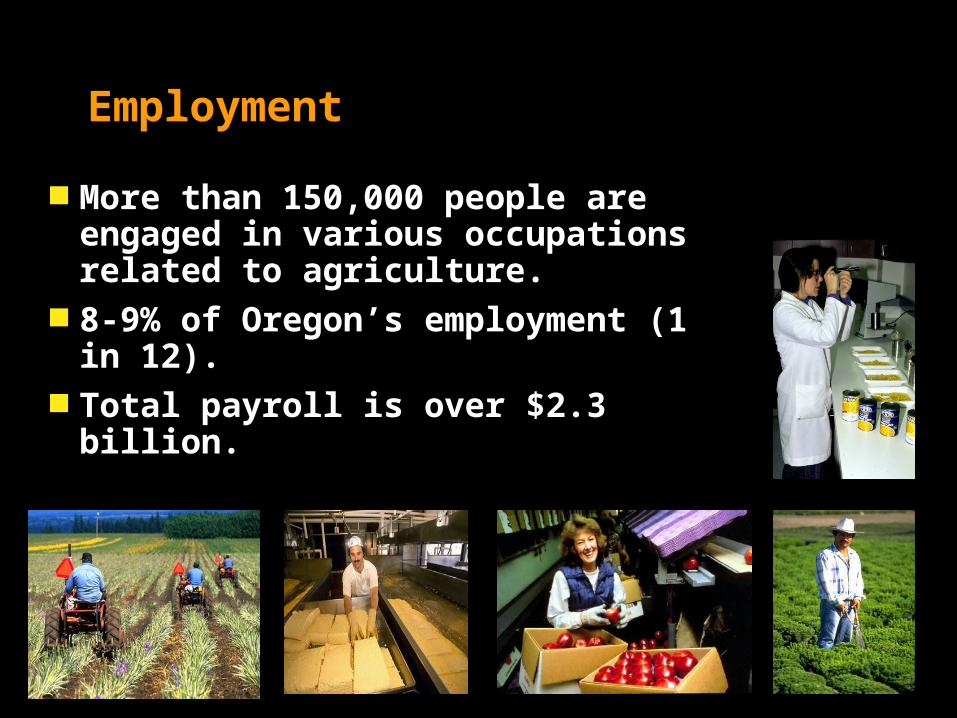
Employment
More than 150,000 people are engaged in various occupations related to agriculture.
8-9% of Oregon’s employment (1 in 12).
Total payroll is over $2.3 billion.
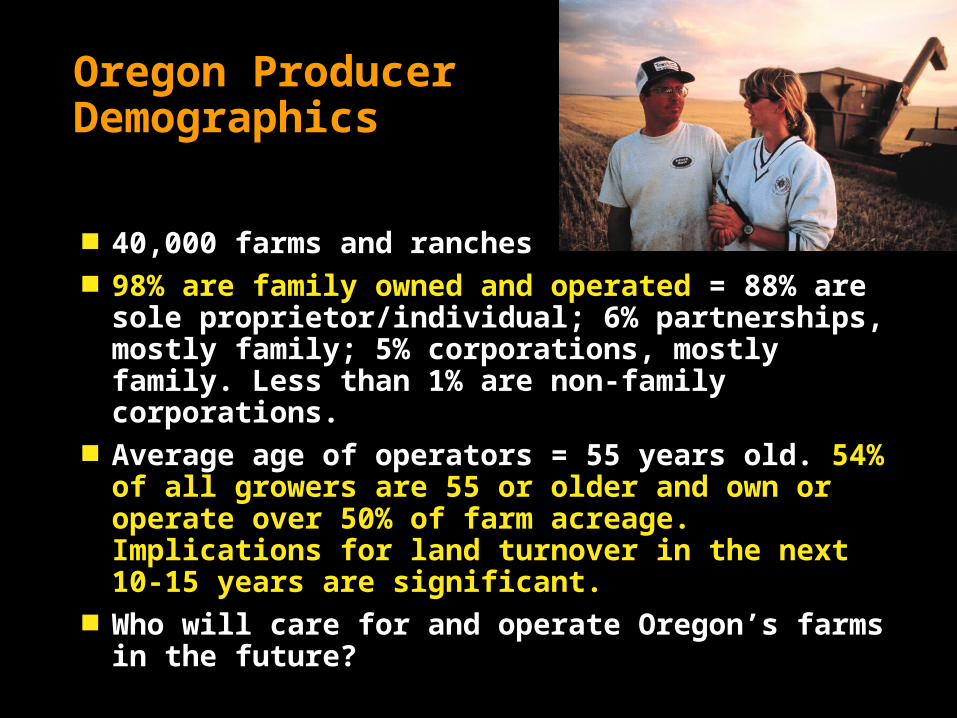
Oregon Producer Demographics
40,000 farms and ranches 98% are family owned and operated = 88% are
sole proprietor/individual; 6% partnerships, mostly family; 5% corporations, mostly family. Less than 1% are non-family corporations.
Average age of operators = 55 years old. 54% of all growers are 55 or older and own or operate over 50% of farm acreage. Implications for land turnover in the next 10-15 years are significant.
Who will care for and operate Oregon’s farms in the future?
Oregon’s Farm/Ranch Demographics
Full-time Operators Today’s economics require at least $250,000 in sales in order to
operate full-time and provide for family living expenses. 2,250 Oregon farms meet this criteria (6%). These farms produce 80% of Oregon’s agricultural output.Caught in the Middle: Work off-farm to support household. Squeezed by costs and not
enough volume. 25% (10,000) of farms, produce 18% of output, control 35% of
acres.Small-time operators: 69% (27,600) of Oregon farms have less than $10,000 in sales.
62% of farms are less than 50 acres. Many part-time, hobby, and life-style farms.
Those with sales under $10,000 control about 10% of farm acres -- so they are critical to resource management. They often serve local markets and are more labor intensive, tend to focus on organic and other niche markets -- get a lot of press!

Diversity of Production
Over 220 commodities produced in Oregon.
Helps create greater stability throughout the industry over time.
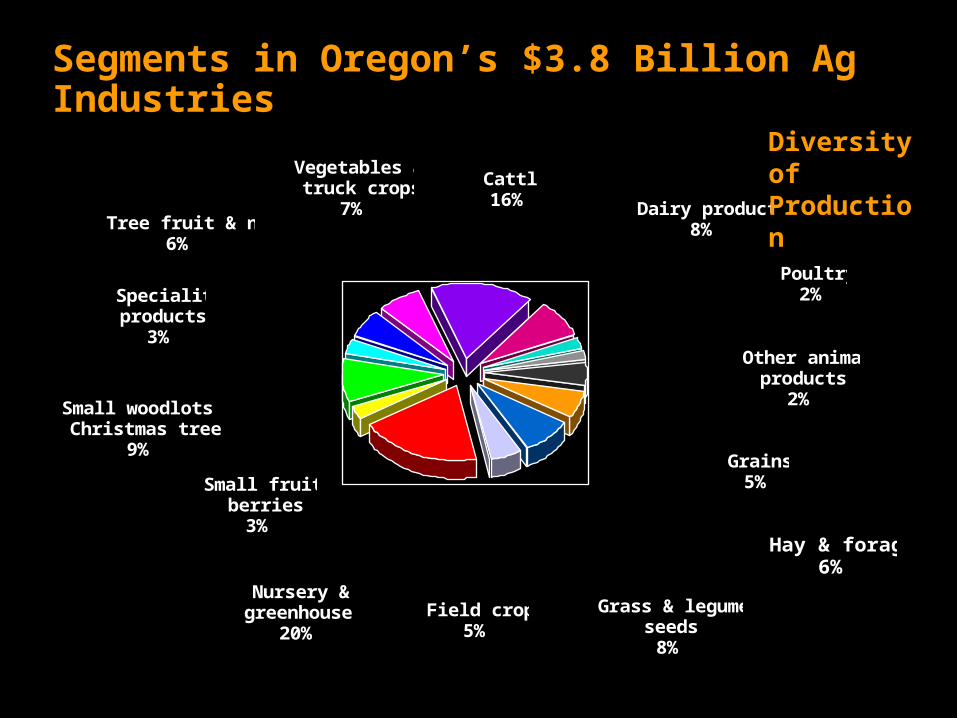
Segments in Oregon’s $3.8 Billion Ag Industries
Speciality products
3%Other animal
products2%
Dairy products8%
Cattle16%
Vegetables & truck crops
7%Tree fruit & nuts
6%
Small fruit & berries
3%
Nursery & greenhouse
20%
Poultry2%
Grains5%
Hay & forage6%
Grass & legume seeds
8%
Field crops5%
Small woodlots & Christmas trees
9%
Diversity of Production
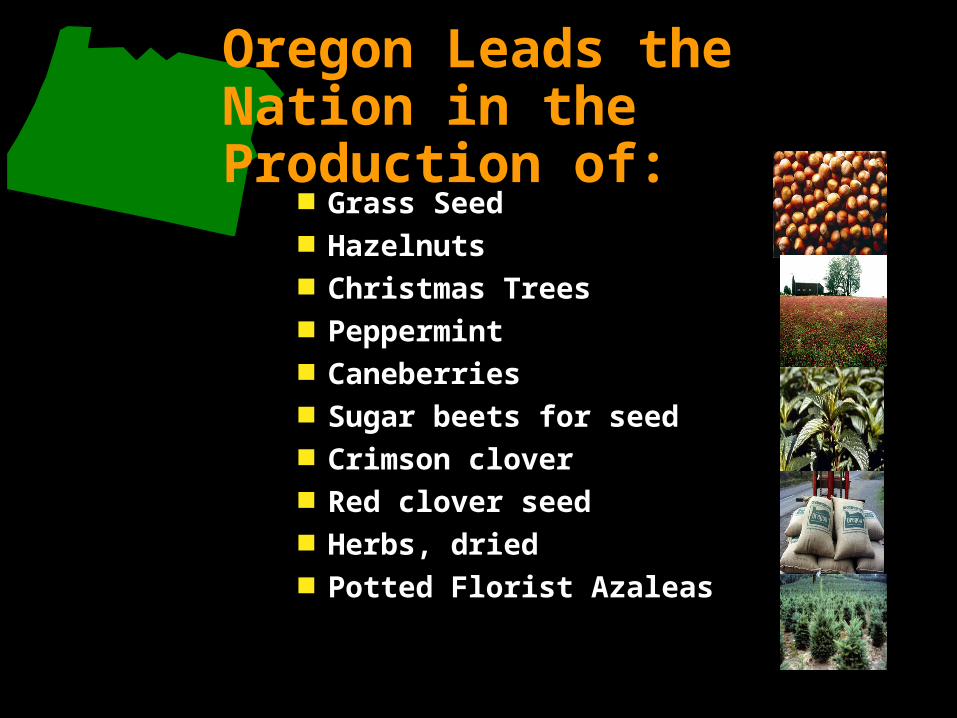
Oregon Leads the Nation in the Production of:
Grass Seed Hazelnuts Christmas Trees Peppermint Caneberries Sugar beets for seed Crimson clover Red clover seed Herbs, dried Potted Florist Azaleas
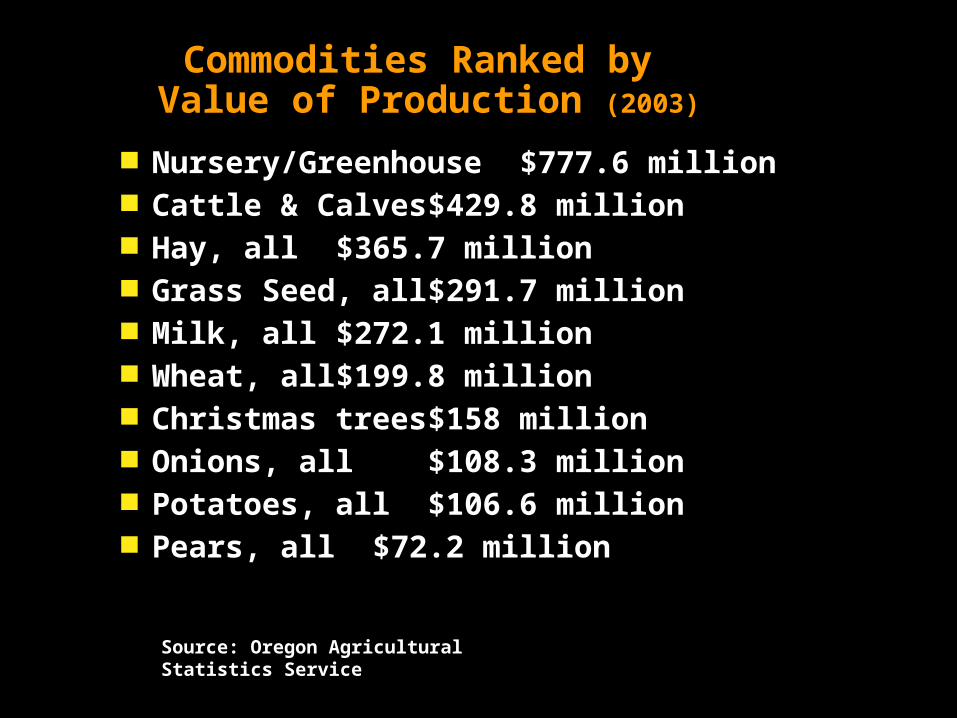
Commodities Ranked by Value of Production (2003)
Nursery/Greenhouse $777.6 million Cattle & Calves $429.8 million Hay, all $365.7 million Grass Seed, all $291.7 million Milk, all $272.1 million Wheat, all $199.8 million Christmas trees $158 million Onions, all $108.3 million Potatoes, all $106.6 million Pears, all $72.2 million
Source: Oregon Agricultural Statistics Service
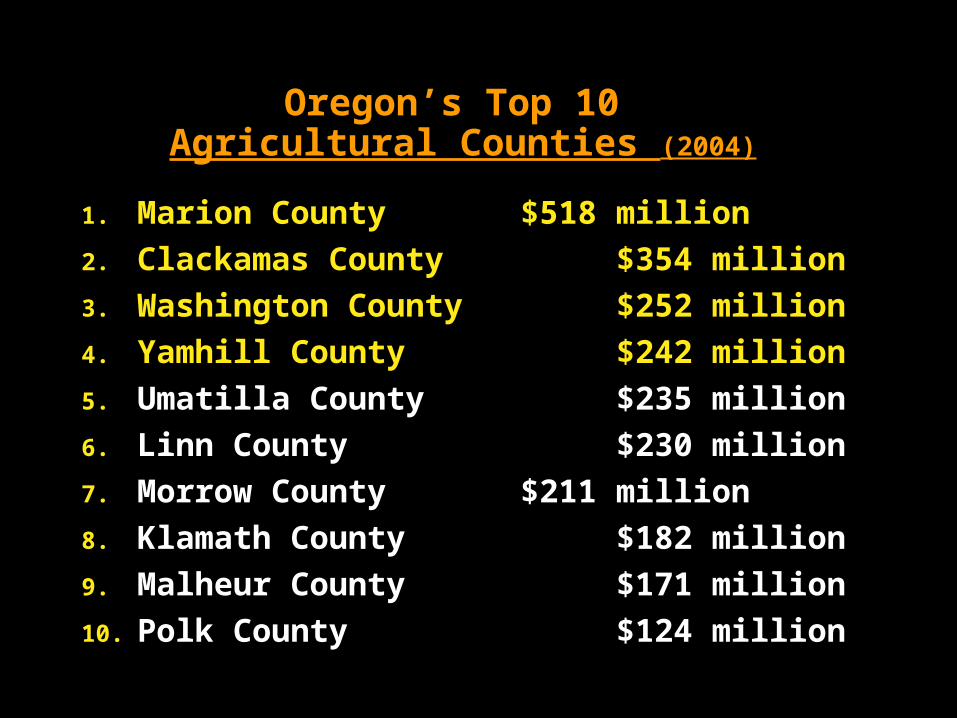
Oregon’s Top 10 Agricultural Counties (2004)
1. Marion County $518 million
2. Clackamas County $354 million
3. Washington County $252 million
4. Yamhill County $242 million
5. Umatilla County $235 million
6. Linn County $230 million
7. Morrow County $211 million
8. Klamath County $182 million
9. Malheur County $171 million
10. Polk County $124 million
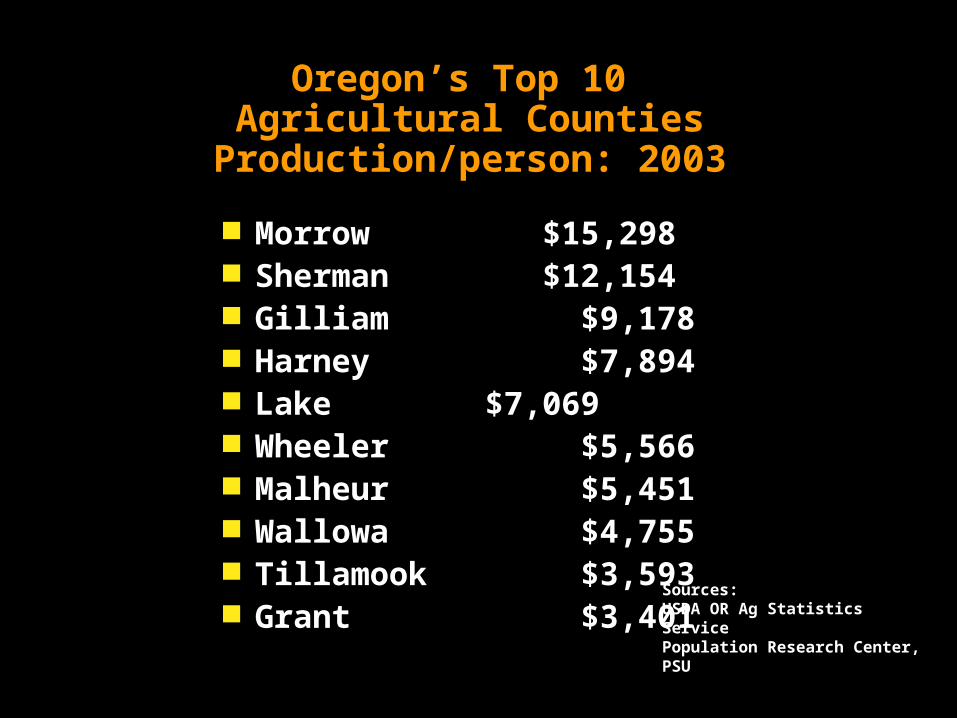
Oregon’s Top 10 Agricultural Counties
Production/person: 2003
Morrow $15,298 Sherman $12,154 Gilliam $9,178 Harney $7,894 Lake $7,069 Wheeler $5,566 Malheur $5,451 Wallowa $4,755 Tillamook $3,593 Grant $3,401
Sources: USDA OR Ag Statistics Service Population Research Center, PSU
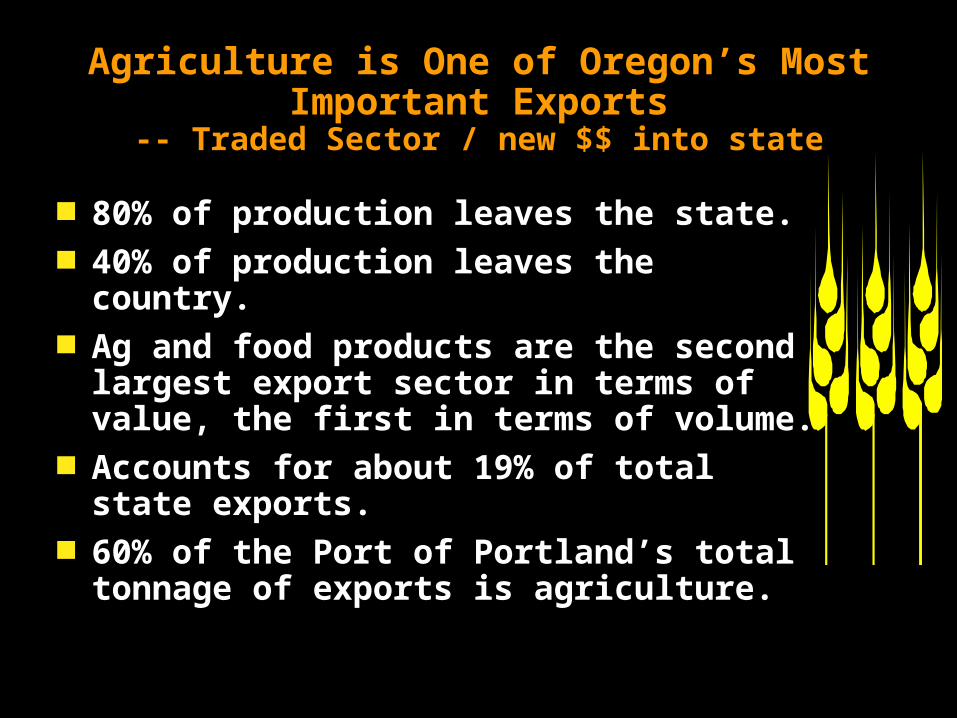
Agriculture is One of Oregon’s Most Important Exports
-- Traded Sector / new $$ into state
80% of production leaves the state. 40% of production leaves the country. Ag and food products are the second
largest export sector in terms of value, the first in terms of volume.
Accounts for about 19% of total state exports.
60% of the Port of Portland’s total tonnage of exports is agriculture.
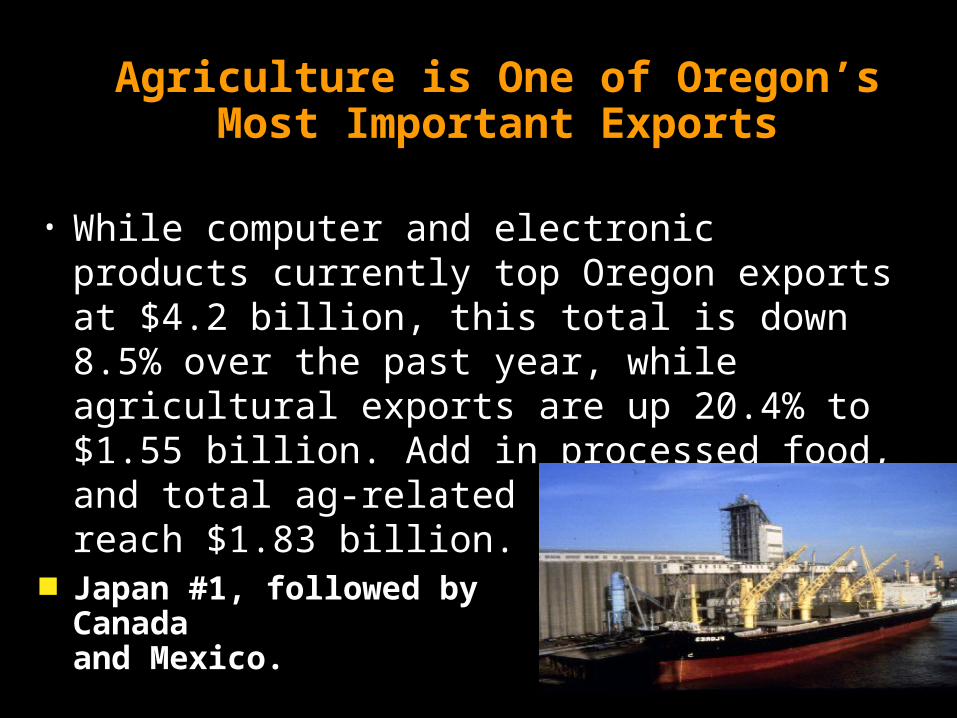
Agriculture is One of Oregon’s Most Important Exports
• While computer and electronic products currently top Oregon exports at $4.2 billion, this total is down 8.5% over the past year, while agricultural exports are up 20.4% to $1.55 billion. Add in processed food, and total ag-related exportsreach $1.83 billion.
Japan #1, followed by Korea, China, Canada and Mexico.
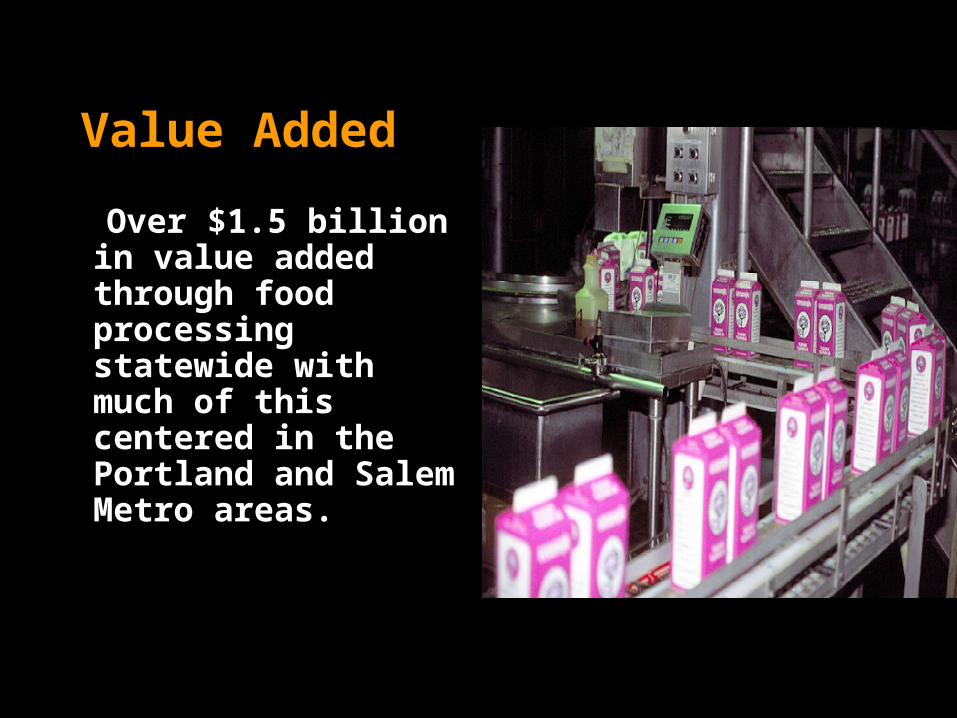
Value Added
Over $1.5 billion in value added through food processing statewide with much of this centered in the Portland and Salem Metro areas.
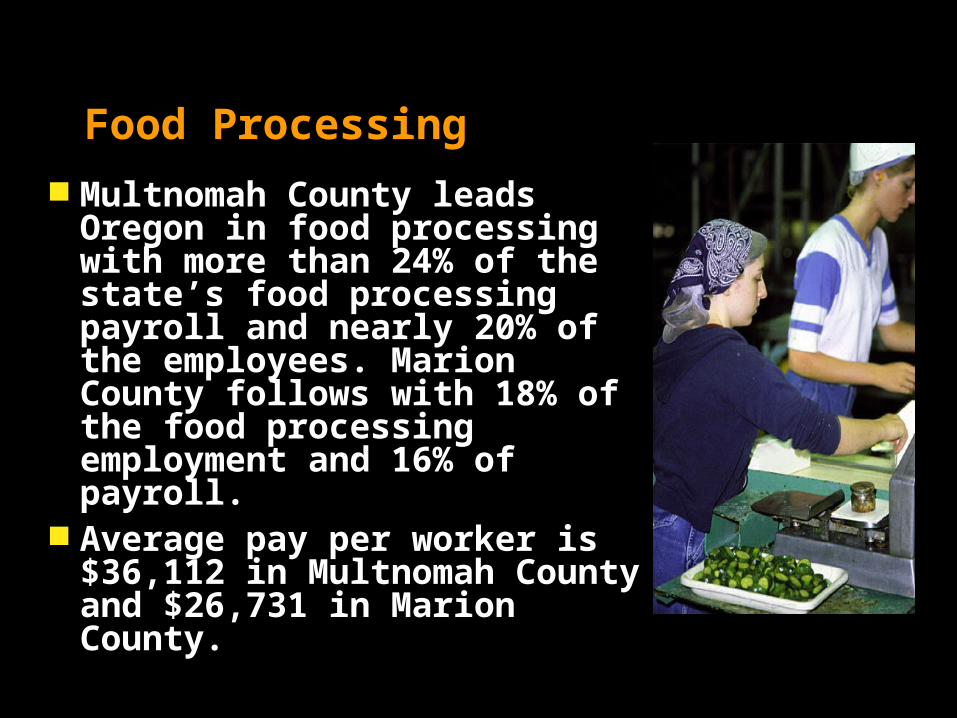
Food Processing Multnomah County leads
Oregon in food processing with more than 24% of the state’s food processing payroll and nearly 20% of the employees. Marion County follows with 18% of the food processing employment and 16% of payroll.
Average pay per worker is $36,112 in Multnomah County and $26,731 in Marion County.
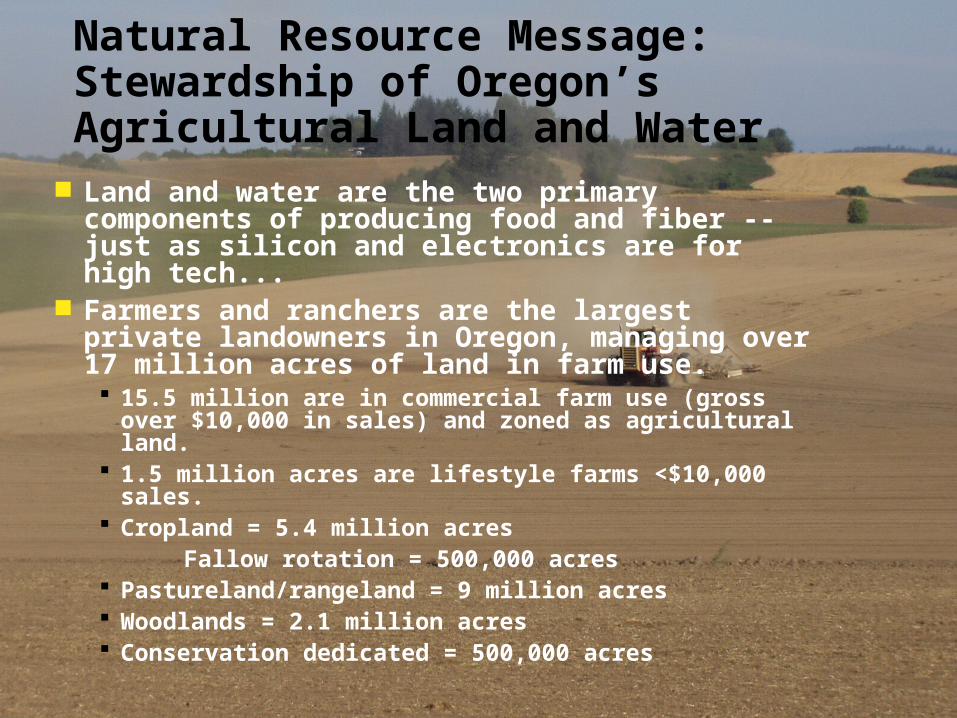
Natural Resource Message: Stewardship of Oregon’s Agricultural Land and Water
Land and water are the two primary components of producing food and fiber -- just as silicon and electronics are for high tech...
Farmers and ranchers are the largest private landowners in Oregon, managing over 17 million acres of land in farm use. 15.5 million are in commercial farm use (gross over
$10,000 in sales) and zoned as agricultural land. 1.5 million acres are lifestyle farms <$10,000 sales. Cropland = 5.4 million acres Fallow rotation = 500,000 acres Pastureland/rangeland = 9 million acres Woodlands = 2.1 million acres Conservation dedicated = 500,000 acres
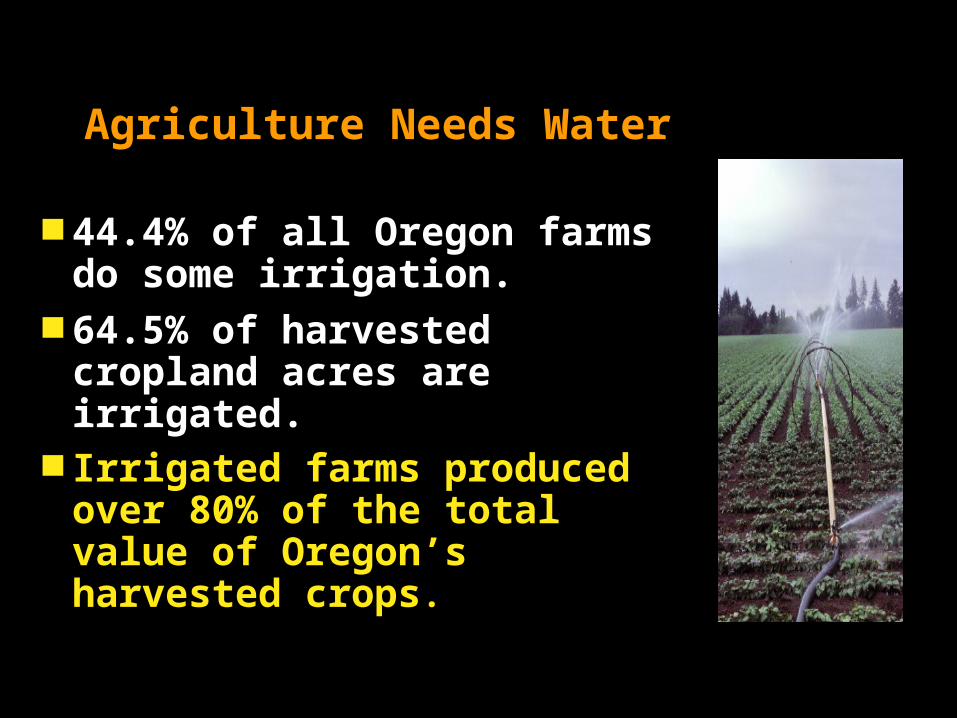
Agriculture Needs Water
44.4% of all Oregon farms do some irrigation.
64.5% of harvested cropland acres are irrigated.
Irrigated farms produced over 80% of the total value of Oregon’s harvested crops.
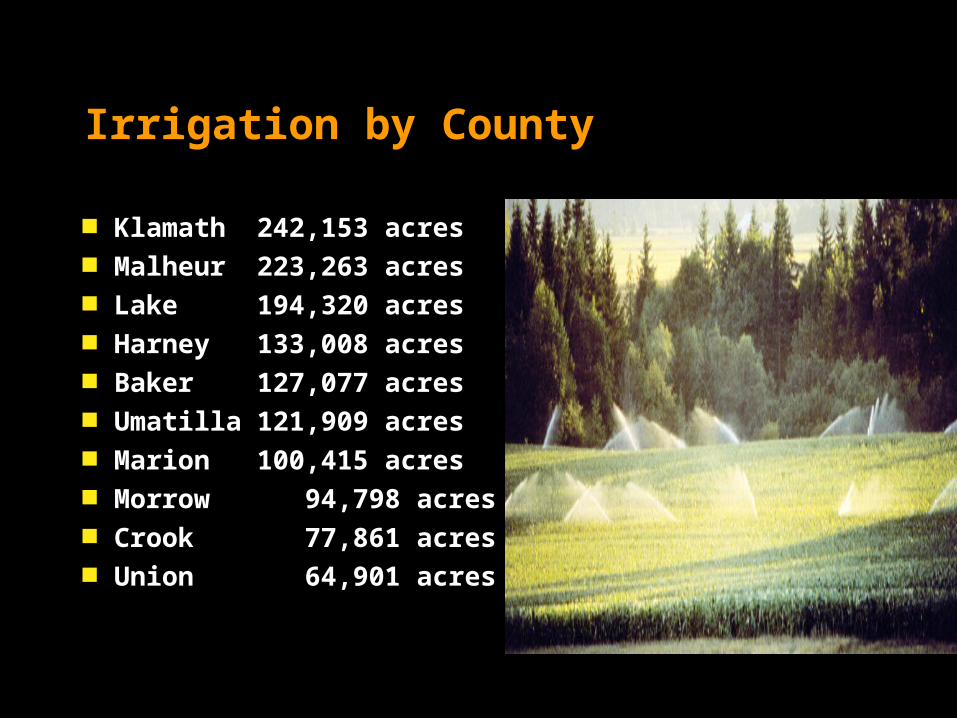
Irrigation by County
Klamath Malheur Lake Harney Baker Umatilla Marion Morrow Crook Union
242,153 acres
223,263 acres
194,320 acres
133,008 acres
127,077 acres
121,909 acres
100,415 acres
94,798 acres
77,861 acres
64,901 acres
Natural Resource Management Tough requirements for environmental stewardship has
earned Oregon a reputation for being a national leader in natural resource management.
Oregon farmers and ranchers have nearly 500,000 acres enrolled in conservation programs.
Oregon leads the nation in the number of water transfers and amount used for conservation and wildlife.
Oregon has implemented a state-wide agricultural water quality management plan (SB1010), including livestock operation waste handling (CAFO).
Agriculture can use this experience to market its products (and even services) -- the public is increasingly demanding information about how and where food comes from.
Certification and documentation can also assist growers with “green” payments -- CSP, carbon sequestration, etc.

Identifying the real
consumer trend can be
difficult.
QuickTime™ and aTIFF (LZW) decompressor
are needed to see this picture.
What do consumers want?
Consumer Trends1. One year ago, approximately 10% of the U.S. population was on a low-
carb diet, affecting products made with wheat, potatoes... Today, about 5% of the population on a low-carb diet.
2. “Functional foods” are taking the lead. This includes foods containing probiotics, energy-boosters, vitamin and mineral supplements, cholesterol-lowering foods, and "diabetes-friendly" foods.
3. Another 10-15% of the US population makes some food purchases based on specific production or processing traits, be it organic, kosher, sustainable, location of production, or other preference.
4. About 10% of consumers are doing some amount of grocery and specialty food purchasing online, affecting how products are displayed, packaged, and distributed.
5. More U.S. households now have pets than children.... the implications are significant.
6. 30 of the U.S.’s 100 largest cities now have a “minority” as the “majority” population. Increasing numbers of ethnic groups are seeking foods that fit their culture and tastes.
7. The baby boomers are now gray-haired and wanting smaller portions, more convenience, and more variety in the foods they buy.
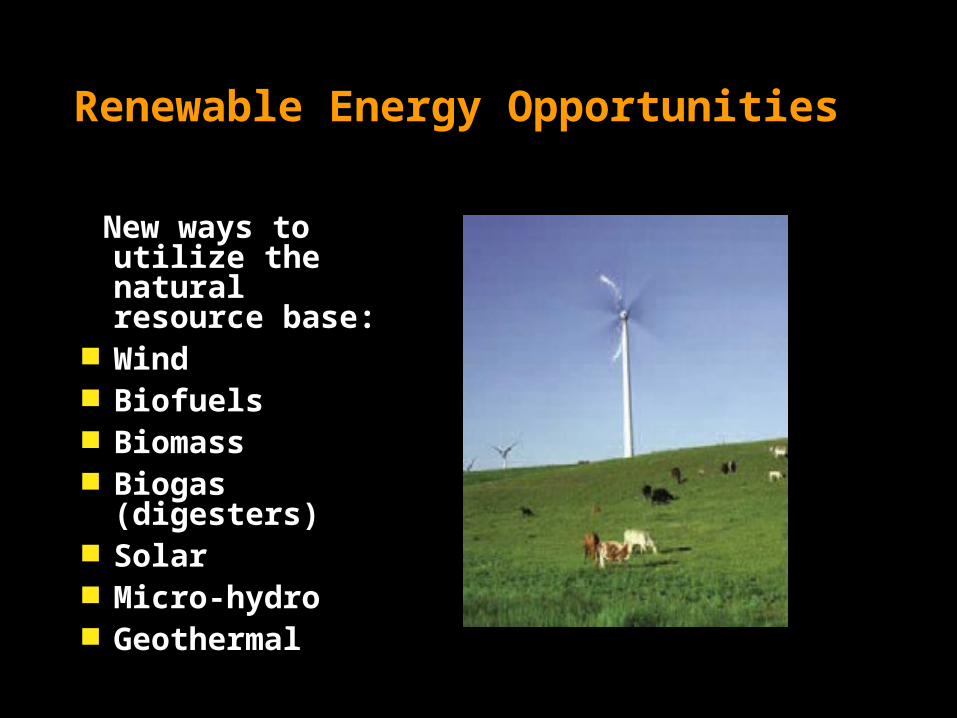
Renewable Energy Opportunities
New ways to utilize the natural resource base:
Wind Biofuels Biomass Biogas
(digesters) Solar Micro-hydro Geothermal
Renewable Energy Benefits
Locally produced, helps local economies Biobased, less impact on environment -- land,
water and air Reduces reliance/dependence on foreign
supplies of oil and power Diversifies economic base and creates more
stability Provides potential rotational crops and other
opportunities for growers Builds bridges over the “urban-rural” divide
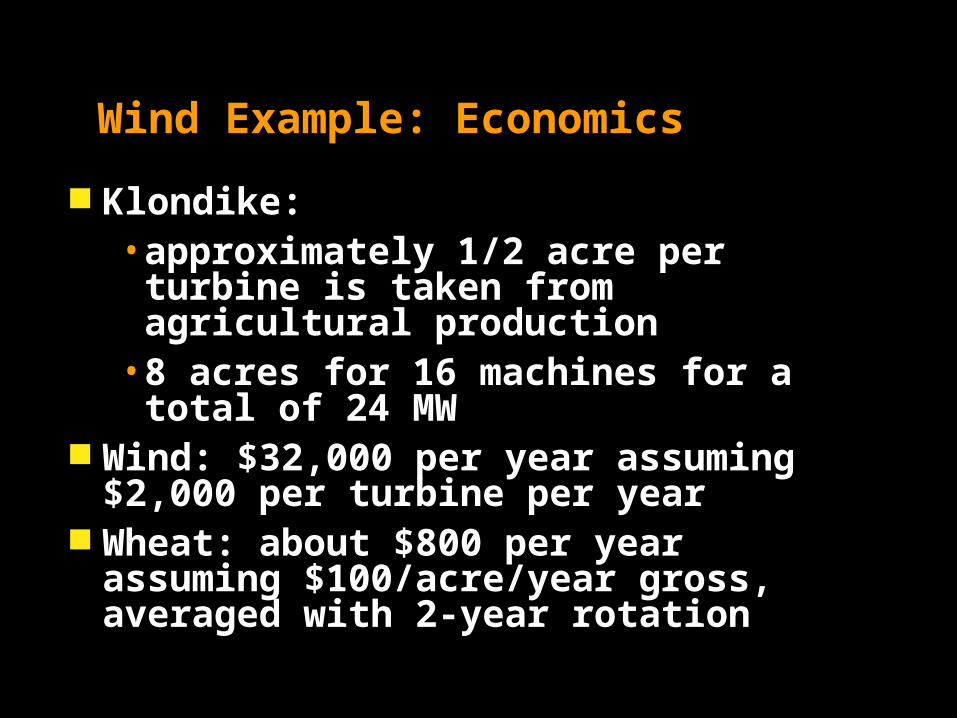
Wind Example: Economics
Klondike:• approximately 1/2 acre per turbine is
taken from agricultural production• 8 acres for 16 machines for a total of 24
MW Wind: $32,000 per year assuming $2,000
per turbine per year Wheat: about $800 per year assuming
$100/acre/year gross, averaged with 2-year rotation
State-level Initiatives Renewable Energy Action Plan, led by OR
Dept. of Energy, targets all renewable energy technologies, sets out goals, and recommends legislative action.http://www.energy.state.or.us/renew/RenewPlan.htm
Governor is supporting legislative proposals that create incentives, fuel blends, and research.
Rep. Kropf and Dingfelder will be introducing renewable energy bills…
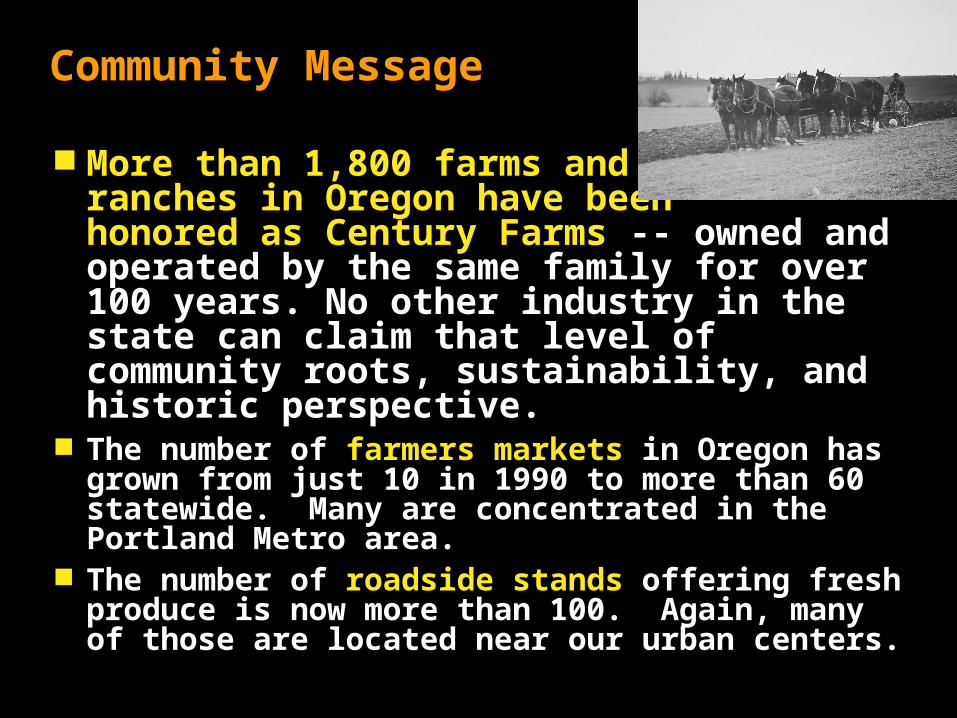
Community Message
More than 1,800 farms and ranches in Oregon have been honored as Century Farms -- owned and operated by the same family for over 100 years. No other industry in the state can claim that level of community roots, sustainability, and historic perspective.
The number of farmers markets in Oregon has grown from just 10 in 1990 to more than 60 statewide. Many are concentrated in the Portland Metro area.
The number of roadside stands offering fresh produce is now more than 100. Again, many of those are located near our urban centers.
Community Message
Oregon’s food industry (growers and processors) is the largest provider of donations to the Oregon Food Bank network, and provides 60% of all direct donations. Another 18% of what is received by the Food Bank comes from USDA food assistance programs – nearly 80% of the volume of foods distributed by the Food Bank comes directly from donations by growers and food processors in Oregon, or the USDA surplus food products.
Building on Community
How does the industry build on the significant contributions and historical community resources that are associated with agriculture?
Collaborate with local museums, historical societies, seasonal tourism attractions…
Invite local papers to Century Farms to hear the history and write local stories…
More on-farm tours and educational outreach…
Research and Higher Ed
Support for OSU Extension and Research
Focus on innovative solutions to current issues
Identify and capitalize on collaboration of high tech, higher ed, and natural resource advantages in Oregon.
QuickTime™ and aTIFF (LZW) decompressor
are needed to see this picture.
OECDD Workgroup on Innovations in Natural Resources
Purpose: to “develop a technology-based economic roadmap
that identifies economic opportunities for the state’s core research competencies related to innovation in natural resources and sustainable technologies.” The roadmap must focus on the four industry sub-clusters: 1) green building (including high-value wood products and engineered materials) and urban planning; 2) natural resources (including agricultural and forestry products and processes); 3) renewable energy and clean transportation; and 4) sustainable technologies for high-tech and manufacturing.”
Examples of technology in agriculture… tell the story:
Nanobiosensors and Milking: An array of nanobiosensors are being developed for use directly at
the inlet of the milking maching to monitor for the presence of bacteria in the milk of each cow and other health diagnostics. This enables direct quality control of milk for each cow being milked, rapid detection in seconds if there are problems, remote sensing capabilities.
Photosensing: Chemical application equipment in Eastern Oregon wheat fields and
Western Oreogn vineyards are being outfitted with infrared color sensors that can detect weeds or unwanted vegetation, enabling spot spraying of chemicals on very specific areas. This reduces the cost of application and the amount of the chemical in the environment.
Micro-monitoring in Vineyards: Intel recently installed small sensors in a vineyard in Oregon to
monitor microclimates. The sensors measured temperature, humidity, and other factors to monitor the growing cycle of the grapes, then transmitted the data to be interpreted and used to help prevent frostbite, mold, and other agricultural problems.
Uniting Agriculture Through Education
AUDIENCES: Industry, Public, Government,
Education System/Teachers
MESSAGES: Economic, Environment, Community
Oregon Agriculture:
Education is the Key to Industry Unity and a
Prosperous and Viable Future