Monitoimi- tulkki · Monitoimi-tulkki 29 kieltä Tuotenro Malli 38-1590 29L Ver. 200811

ASX Release 5 November 2008
ADELAIDE MANAGED FUNDS ASSET BACKED YIELD TRUST UNITHOLDER BRIEFING PRESENTATION
The Board and Management of Adelaide Managed Funds, responsible entity for the Adelaide Managed Funds Asset Backed Yield Trust (ASX: AYT), are today briefing Unitholders on the AYT’s annual results for the period ending 30 June 2008 and on the prospects for the current year (refer attached). Those Unitholders who are unable to attend the briefing in Adelaide can listen to the presentation from 12:00pm (AEST) today via the following link: http://www.brr.com.au/event/52721 For further information, please contact: Mr Bruce Speirs Mr Kym Masters Chief Executive Officer Chief Investment Officer Adelaide Managed Funds Adelaide Managed Funds 08 8300 6194 08 8220 7258 -------------------------------------------------- About Adelaide Managed Funds Adelaide Managed Funds, a wholly owned subsidiary of the Bendigo and Adelaide Bank Group, is the responsible entity of the Adelaide Managed Funds Asset Backed Yield Trust. For further information about Adelaide Managed Funds and the Asset Backed Yield Trust, please visit: www.adelaidemanagedfunds.com.au

November 2008

> This presentation has been prepared by Adelaide Managed Funds Limited (Adelaide Managed Funds) as the responsible entity for theAdelaide Managed Funds Asset Backed Yield Trust (the Fund). The information contained in this presentation is provided for information purposes only and is subject to change without notice. Nothing contained in this presentation constitutes investment, legal, tax or other advice.
> This document is provided to you on the basis that you keep this presentation and the information contained within it confidential and do not copy or circulate it in whole or in part.
> The information in this presentation has been prepared without taking into account your particular investment objectives, financial circumstances or needs. You should consider all of the risk factors that could affect the performance of the Fund and which are associated with investing in the Fund in light of your own particular investment objectives, financial circumstances and needs. If you have any questions, you should contact your independent financial or other professional adviser for advice.
> Any forward looking statements included in this presentation involve subjective judgment and analysis and are subject to significant uncertainties, risks and contingencies, many of which are outside the control of, and are unknown to Adelaide Managed Funds, and its officers, employees, agents or associates. Actual future events may vary materially from any forward looking statements and the assumptions on which those statements are based. Given these uncertainties, you are cautioned to not place undue reliance on any such forward looking statements. Past performance is not a reliable indicator of future performance.
> Adelaide Managed Funds has prepared this document based on information available to it. Adelaide Managed Funds has no obligation to update, modify or amend this presentation or otherwise notify you that a matter, opinion, projection or forecast stated in the presentation changes or subsequently becomes inaccurate. Although all reasonable care has been taken to ensure that the facts stated and opinions given in this presentation are fair and accurate, the information provided in this presentation has not been verified. Accordingly, no representation or warranty, expressed or implied is made as to the fairness, accuracy, completeness or correctness of the information and opinions contained in this presentation. To the fullest extent permitted by law, none of Adelaide Bank Limited, Bendigo and Adelaide Bank Limited, Adelaide Managed Funds, their agents, directors, or officers, or any other party named in this presentation, accept any liability for any loss or damage (including any direct, indirect, incidental or consequential loss or damage) whatsoever arising from any use of the information in this presentation, or otherwise arising in connection therewith.
> Adelaide Bank Limited, Bendigo and Adelaide Bank Limited, Adelaide Managed Funds, and their respective, officers, employees, agents and associates may, from time to time, hold interests in the securities of, or fees or other benefits from the Fund and corporations and investment vehicles in which the Fund holds interests.
DISCLAIMER

CONTENTS1. Current Environment
2. Overview of the Fund
3. Investment Portfolio Update
4. Fund Outlook
APPENDICESI. Additional Details on the Investment Portfolio
II. Peer TSR Comparison

1. CURRENT ENVIRONMENT
5
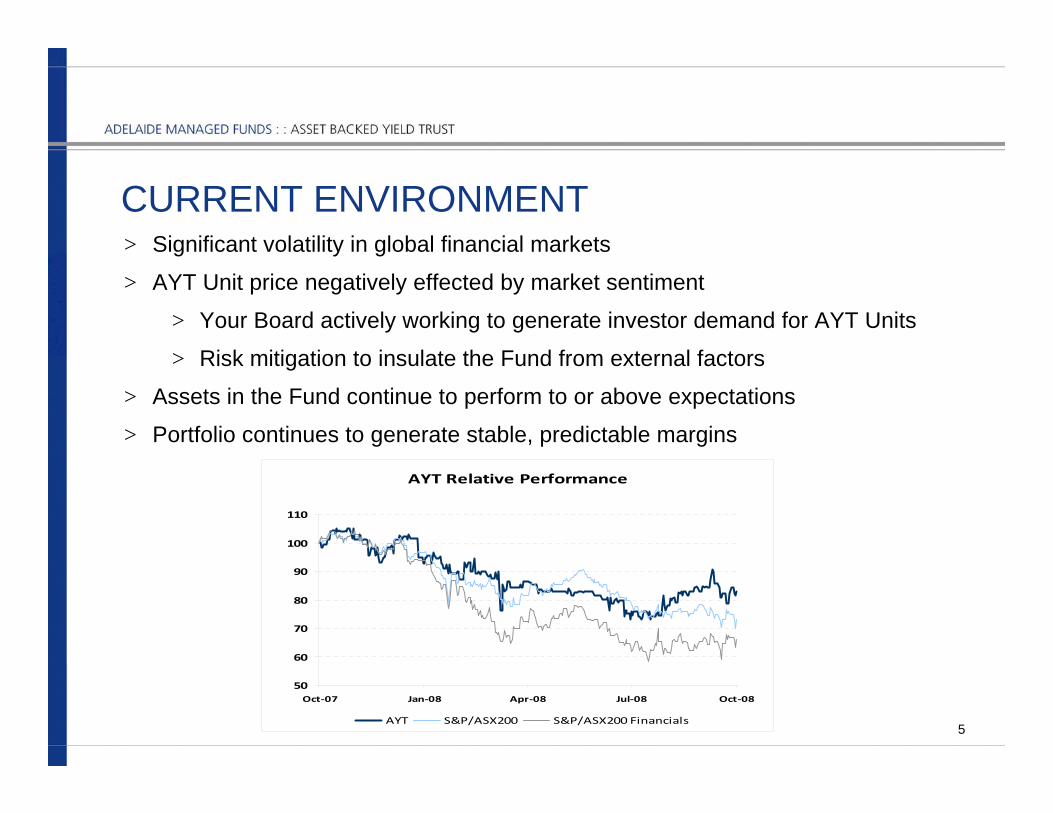
CURRENT ENVIRONMENT> Significant volatility in global financial markets
> AYT Unit price negatively effected by market sentiment
> Your Board actively working to generate investor demand for AYT Units
> Risk mitigation to insulate the Fund from external factors
> Assets in the Fund continue to perform to or above expectations
> Portfolio continues to generate stable, predictable margins
AYT Relative Performance
50
60
70
80
90
100
110
Oct‐07 Jan‐08 Apr‐08 Jul‐08 Oct‐08
AYT S&P/ASX200 S&P/ASX200 Financials

2. OVERVIEW OF THE FUND

> Portfolio of investments not generally publicly available> Investment in predominantly high yielding assets> Investments backed by pools of loan and lease assets
Unique Investment
> Invests in high yielding assets > Focused on investments that maximise Unitholder return for
associated risk> Investments sourced from Bendigo and Adelaide Bank
and from third parties
Investment Mandate
> FY2009 forecast return of BBSW + 4.0% to BBSW + 4.5% on Issue Price> Equivalent Investor Yield equal to 9.9% to 10.4% at 31 October 2008 (1)
> Running yield at current Unit price of 13.8% to 14.5%(2)
> This forecast return compares favourably with similar investments
AttractiveFloating Yield
> ASX Listed (ASX: AYT) with issued capital of $200 million> NTA per Unit equal to $1.95 as at 30 September 2008 after paying
a quarterly distribution of 5.5 cents per UnitDescription
7
UNIQUE INVESTMENT
(1) 30-Day BBSW at 31 October 2008 was 5.93%(2) Unit Price at 31 October 2008 was $1.44

> Balance sheet will be ungeared at expiry of debt facility in August 2009> Fund has no other outstanding liabilities or funding commitments> All distributions are paid in cash from interest earned by the Fund’s
Investment Portfolio
Strong Capital Position
> Buyback to continue while purchase of Units represents best use of funds> Clear focus on achieving an appropriate Unitholder return > Investments will continue to be maintained on a ‘held-to-maturity’ basis
and not required to be marked-to-market
Clear Investment Strategy
> Quality of underlying investments remains high and Investment Portfolio continues to generate stable, predictable margins
> Investments remain sound, despite international credit events and the volatility of the Australian equity market
High Quality Investment Portfolio
> Delivered a cash yield for investors of 11.54%(1), which was at the upper end of forecast range
> FY2008 Unitholder distribution of 21.1 cents per Unit> Portfolio arrears and losses considerably lower than originally forecast
Strong FY2008 Financial Performance
8
DELIVERING FOR INVESTORS
(1) Average 30-Day BBSW for the 12 months to 30 June 2008 was 7.13%

3. INVESTMENT PORTFOLIO UPDATE

> Assets under management total $196 million at 30 September 2008> New originations were deliberately slowed in FY2008 as management took a
conservative approach to new investments and reduced the debt facility
> Credit quality of Investment Portfolio remains high and performance of assets has been better than forecast
10
HIGH QUALITY PORTFOLIO
117.2M132.9M
196.3M 201.1M 197.3M 196.3M
0
50.0M
100.0M
150.0M
200.0M
250.0M
Aug 06 Dec 06 Jun 07 Dec 07 Jun 08 Sep 08
Assets Under Management
Margin Lending67%
Non‐conforming Mortgages
12%
Medical Financing
7%
MIS Investor Loans14%
ABYT Portfolio (30 Sep 08)

> Arrears and cumulative losses to date are lower than originally forecast
> Investments are only impacted if losses are substantially higher than original loss assumptions
11
CONTINUED STRONG PERFORMANCE
Investment
Actual LossesRecorded to30 Sep 2008
Original Loss Assumptions
Losses where Fund Investment
is Impacted
Loss Buffer Multiple
Margin Lending 0.07% 0.35% > 1.75% 25 x
Non-Conforming Mortgages 0.16% 0.74% > 1.30% 8 x
Medical Financing Program #1 0.82% 1.02% > 1.87% 2 x
Medical Financing Program #2 0.30% 0.49% > 4.15% 13 x
MIS Investor Loans 1.74% 1.88% > 2.60% 1 x

4. FUND OUTLOOK

> FY2009 forecast yield of between BBSW + 4.0% to BBSW + 4.5% > Equivalent to annual distribution of between 19.9 and 20.9 cents per Unit> Floating rate yield of between 9.93% and 10.43% at the current BBSW
(based on weighted average Units on issue and par value)(1)
> Equivalent to a yield of 13.80% to 14.49% at a $1.44 Unit price(2)
13
(1) 30-day BBSW at 31 October 2008 is 5.93%
(2) As at 31 October 2008
SUSTAINABLE YIELD
> Arrears and losses expected to remain within original forecasts

> Conducting on-market Unit buyback
> Have purchased 5.1 million Units (5.1% of original issue of 100.0 million Units) as at 31 October 2008
> Board approval to purchase up to 10 million Units utilising available free cash and debt facility without incurring unnecessary refinance risk
> Quarterly distributions paid in cash
> Commissioned research
> Regular communication to investors
14
INITIATIVES TO ENHANCE INVESTOR RETURNS

APPENDIX IAdditional Details on the Investment Portfolio

2.60%
2.60%
1.10%
0.30%
1.30%
1.30%
1.75%
1.75%
ExcessSpread(1)
8.3
18.3
13.2
0.9
11.0
11.0
50.1
75.0
Value ($M)
4.4%
9.7%
7.0%
0.5%
5.9%
5.9%
26.7%
40.0%
% of Portfolio
12.50%
4.50%
6.00%
3.75%
6.00%
3.75%
12.50%
1.25%
Margin Over BBSW (%)
2.9
11.2
14.1
1.0(3)
13.0
24.0
48.0
98.1
TotalSupport(2)
($M)
9.05%MIS Investor LoansMIS Program 1 C Note
0.00%MIS Investor LoansMIS Program 1 D Note
4.47%Medical FinancingProgram No. 2 D Note
2.48%Medical FinancingProgram No. 1 B Note
0.00%Mortgage PortfolioQ10 Trust F Note
4.09%Mortgage PortfolioQ10 Trust E Note
0.00%Margin LendingLighthouse No. 4 Trust
2.04%Margin LendingLighthouse No. 4 Trust
Funded Subordination
(%)Asset CategoryName
ADDITIONAL DETAILS ON THE INVESTMENT PORTFOLIO
(1) Cumulative over the life of the Program, noting that only the Q10 Program “traps” excess spread
(2) Funded subordination and cumulative excess spread based on investment as at 30 September 2008
(3) Function of amortised portfolio and expected December 2008 repayment

ADDITIONAL DETAILS ON THE INVESTMENT PORTFOLIO
4.3 years8.3
18.3
13.2
0.9
11.0
11.0
50.1
75.0
Value ($M)
3.5 years
0.3 years
2.5 years
3.0 years
Forecast Maturity
Program called at 10% of initial pool balance. Call at the discretion of the Trust Manager (AB Management).
MIS Investor LoansMIS Program 1 C Note
MIS Investor LoansMIS Program 1 D Note
Issuer (Perpetual) has the option to redeem all Notes on the 6th anniversary of the initial distribution date, 10 February 2012.
Medical FinancingProgram No. 2 D Note
Program called at 10% of initial pool balance. Call at the discretion of the Trust Manager (National Australia Managers Limited).
Medical FinancingProgram No. 1 B Note
Mortgage PortfolioQ10 Trust F Note
Program called on 16 June 2011 or at 5% of initial pool balance. Call at the discretion of the Trust Manager (Perpetual).
Mortgage PortfolioQ10 Trust E Note
Margin LendingLighthouse No. 4 Trust
Program maturity on 30 September 2010. Subordinated Notes are to be repaid within 13 months of this date but only if the Senior Notes have been repaid or the repayment can be funded by the issue of new Subordinated Notes.
Margin LendingLighthouse No. 4 Trust
MechanismAsset CategoryName

18
MARGIN LENDING (67%)
MANAGED INVESTMENT SCHEMES (14%)
0.00%
0.50%
1.00%
1.50%
2.00%
2.50%
3.00%
3.50%
4.00%
Oct‐07 Nov‐07 Dec‐07 Jan‐08 Feb‐08 Mar‐08 Apr‐08 May‐08 Jun‐08 Jul‐08 Aug‐08 Sep‐08
Managed Investment Scheme Arrears Data
31 to 60 days 61 to 90 days +90 days
0.00%
0.50%
1.00%
1.50%
2.00%
2.50%
3.00%
Oct‐07 Nov‐07 Dec‐07 Jan‐08 Feb‐08 Mar‐08 Apr‐08 May‐08 Jun‐08 Jul‐08 Aug‐08 Sep‐08
Managed Investment Scheme Loss Data
Cumulative Losses Buffer Original Loss Assumption
0
25
50
75
100
0
500
1,000
1,500
2,000
2,500
3,000
3,500
Jul‐07 Sep‐07 Nov‐07 Jan‐08 Mar‐08 May‐08 Jul‐08 Sep‐08
Margin Lending Margin Calls
Margin Calls (LHS) Forced Sales (RHS)
0.00%
0.50%
1.00%
1.50%
2.00%
Oct‐07 Nov‐07 Dec‐07 Jan‐08 Feb‐08 Mar‐08 Apr‐08 May‐08 Jun‐08 Jul‐08 Aug‐08 Sep‐08
Margin Lending Loss Data
Cumulative Losses Buffer Original Loss Assumption

19
NON-CONFORMING MORTGAGES (12%)
MEDICAL EQUIPMENT FINANCING (7%)
0.00%
0.25%
0.50%
0.75%
1.00%
Oct‐07 Nov‐07 Dec‐07 Jan‐08 Feb‐08 Mar‐08 Apr‐08 May‐08 Jun‐08 Jul‐08 Aug‐08 Sep‐08
Medical Equipment Financing Arrears Data
31 to 60 days 61 to 90 days +90 days
0.00%
3.00%
6.00%
9.00%
12.00%
15.00%
Oct‐07 Nov‐07 Dec‐07 Jan‐08 Feb‐08 Mar‐08 Apr‐08 May‐08 Jun‐08 Jul‐08 Aug‐08 Sep‐08
Non‐conforming Mortgage Arrears Data
31 to 60 days 61 to 90 days +90 days
0.00%
0.50%
1.00%
1.50%
Oct‐07 Nov‐07 Dec‐07 Jan‐08 Feb‐08 Mar‐08 Apr‐08 May‐08 Jun‐08 Jul‐08 Aug‐08 Sep‐08
Non‐confroming Mortgage Loss Data
Cumulative Losses Buffer Original Loss Assumption
0.00%
1.00%
2.00%
3.00%
4.00%
5.00%
Oct‐07 Nov‐07 Dec‐07 Jan‐08 Feb‐08 Mar‐08 Apr‐08 May‐08 Jun‐08 Jul‐08 Aug‐08 Sep‐08
Medical Equipment Financing Loss Data
Cumulative Losses Buffer Original Loss Assumption

APPENDIX IIPeer TSR Comparison

Comparable Total Shareholder Return
01 Oct 2007 to 30 Sep 2008
AMF Asset Backed Yield Trust (ASX:AYT) -1.85%
Elstree Australian Enhanced Income Fund (ASX:AYF) -21.43%
S&P/ASX200 Accumulation Index -26.76%
Hastings High Yield Fund (ASX: HHY) -26.86%
S&P/ASX200 Financial Accumulation Index -32.93%
Allco Max Securities and Mortgage Trust (ASX: AXQ) -86.77%
PEER TSR COMPARISON