UNITED STATES SECURITIES AND EXCHANGE … · Berkshire Hathaway Energy Company and its subsidiaries...
191
UNITED STATES SECURITIES AND EXCHANGE COMMISSION Washington, D.C. 20549 FORM 10-Q [X] Quarterly Report Pursuant to Section 13 or 15(d) of the Securities Exchange Act of 1934 For the quarterly period ended September 30, 2017 or [ ] Transition Report Pursuant to Section 13 or 15(d) of the Securities Exchange Act of 1934 For the transition period from ______ to _______ Commission File Number Exact name of registrant as specified in its charter; State or other jurisdiction of incorporation or organization IRS Employer Identification No. 001-14881 BERKSHIRE HATHAWAY ENERGY COMPANY 94-2213782 (An Iowa Corporation) 666 Grand Avenue, Suite 500 Des Moines, Iowa 50309-2580 515-242-4300 001-05152 PACIFICORP 93-0246090 (An Oregon Corporation) 825 N.E. Multnomah Street Portland, Oregon 97232 888-221-7070 333-90553 MIDAMERICAN FUNDING, LLC 47-0819200 (An Iowa Limited Liability Company) 666 Grand Avenue, Suite 500 Des Moines, Iowa 50309-2580 515-242-4300 333-15387 MIDAMERICAN ENERGY COMPANY 42-1425214 (An Iowa Corporation) 666 Grand Avenue, Suite 500 Des Moines, Iowa 50309-2580 515-242-4300 000-52378 NEVADA POWER COMPANY 88-0420104 (A Nevada Corporation) 6226 West Sahara Avenue Las Vegas, Nevada 89146 702-402-5000 000-00508 SIERRA PACIFIC POWER COMPANY 88-0044418 (A Nevada Corporation) 6100 Neil Road Reno, Nevada 89511 775-834-4011 N/A (Former name or former address, if changed from last report)
-
Upload
duongkhanh -
Category
Documents
-
view
217 -
download
2
Transcript of UNITED STATES SECURITIES AND EXCHANGE … · Berkshire Hathaway Energy Company and its subsidiaries...

UNITED STATESSECURITIES AND EXCHANGE COMMISSION
Washington, D.C. 20549
FORM 10-Q[X] Quarterly Report Pursuant to Section 13 or 15(d) of the Securities Exchange Act of 1934
For the quarterly period ended September 30, 2017 or
[ ] Transition Report Pursuant to Section 13 or 15(d) of the Securities Exchange Act of 1934For the transition period from ______ to _______
Commission File Number
Exact name of registrant as specified in its charter; State or other jurisdiction of incorporation or organization
IRS EmployerIdentification No.
001-14881 BERKSHIRE HATHAWAY ENERGY COMPANY 94-2213782(An Iowa Corporation)
666 Grand Avenue, Suite 500Des Moines, Iowa 50309-2580
515-242-4300
001-05152 PACIFICORP 93-0246090(An Oregon Corporation)
825 N.E. Multnomah StreetPortland, Oregon 97232
888-221-7070
333-90553 MIDAMERICAN FUNDING, LLC 47-0819200(An Iowa Limited Liability Company)
666 Grand Avenue, Suite 500Des Moines, Iowa 50309-2580
515-242-4300
333-15387 MIDAMERICAN ENERGY COMPANY 42-1425214(An Iowa Corporation)
666 Grand Avenue, Suite 500Des Moines, Iowa 50309-2580
515-242-4300
000-52378 NEVADA POWER COMPANY 88-0420104(A Nevada Corporation)
6226 West Sahara AvenueLas Vegas, Nevada 89146
702-402-5000
000-00508 SIERRA PACIFIC POWER COMPANY 88-0044418(A Nevada Corporation)
6100 Neil RoadReno, Nevada 89511
775-834-4011
N/A(Former name or former address, if changed from last report)

Indicate by check mark whether the registrant (1) has filed all reports required to be filed by Section 13 or 15(d) of the SecuritiesExchange Act of 1934 during the preceding 12 months (or for such shorter period that the registrant was required to file suchreports), and (2) has been subject to such filing requirements for the past 90 days.
Registrant Yes NoBERKSHIRE HATHAWAY ENERGY COMPANY XPACIFICORP XMIDAMERICAN FUNDING, LLC XMIDAMERICAN ENERGY COMPANY XNEVADA POWER COMPANY XSIERRA PACIFIC POWER COMPANY X
Indicate by check mark whether the registrants have submitted electronically and posted on their corporate Web sites, if any, everyInteractive Data File required to be submitted and posted pursuant to Rule 405 of Regulation S-T (§232.405 of this chapter) duringthe preceding 12 months (or for such shorter period that the registrants were required to submit and post such files). Yes x No o
Indicate by check mark whether the registrant is a large accelerated filer, an accelerated filer, a non-accelerated filer, a smallerreporting company, or an emerging growth company. See the definitions of "large accelerated filer," "accelerated filer," "smallerreporting company," and "emerging growth company" in Rule 12b-2 of the Exchange Act.
Registrant
LargeAccelerated
FilerAccelerated
filer
Non-accelerated
Filer
SmallerReportingCompany
EmergingGrowth
CompanyBERKSHIRE HATHAWAY ENERGY COMPANY XPACIFICORP XMIDAMERICAN FUNDING, LLC XMIDAMERICAN ENERGY COMPANY XNEVADA POWER COMPANY XSIERRA PACIFIC POWER COMPANY X
If an emerging growth company, indicate by check mark if the registrants have elected not to use the extended transition periodfor complying with any new or revised financial accounting standards provided pursuant to Section 13(a) of the Exchange Act. o
Indicate by check mark whether the registrants are a shell company (as defined in Rule 12b-2 of the Exchange Act).Yes o No x
All shares of outstanding common stock of Berkshire Hathaway Energy Company are privately held by a limited group of investors.As of October 31, 2017, 77,174,325 shares of common stock, no par value, were outstanding.
All shares of outstanding common stock of PacifiCorp are indirectly owned by Berkshire Hathaway Energy Company. As ofOctober 31, 2017, 357,060,915 shares of common stock, no par value, were outstanding.
All of the member's equity of MidAmerican Funding, LLC is held by its parent company, Berkshire Hathaway Energy Company,as of October 31, 2017.
All shares of outstanding common stock of MidAmerican Energy Company are owned by its parent company, MHC Inc., whichis a direct, wholly owned subsidiary of MidAmerican Funding, LLC. As of October 31, 2017, 70,980,203 shares of common stock,no par value, were outstanding.
All shares of outstanding common stock of Nevada Power Company are owned by its parent company, NV Energy, Inc., whichis an indirect, wholly owned subsidiary of Berkshire Hathaway Energy Company. As of October 31, 2017, 1,000 shares ofcommon stock, $1.00 stated value, were outstanding.
All shares of outstanding common stock of Sierra Pacific Power Company are owned by its parent company, NV Energy, Inc.As of October 31, 2017, 1,000 shares of common stock, $3.75 par value, were outstanding.
This combined Form 10-Q is separately filed by Berkshire Hathaway Energy Company, PacifiCorp, MidAmerican Funding, LLC,MidAmerican Energy Company, Nevada Power Company and Sierra Pacific Power Company. Information contained hereinrelating to any individual company is filed by such company on its own behalf. Each company makes no representation as toinformation relating to the other companies.

TABLE OF CONTENTS
PART I
Item 1. Financial Statements 1Item 2. Management's Discussion and Analysis of Financial Condition and Results of Operations 2Item 3. Quantitative and Qualitative Disclosures About Market Risk 151Item 4. Controls and Procedures 151
PART II
Item 1. Legal Proceedings 152Item 1A. Risk Factors 152Item 2. Unregistered Sales of Equity Securities and Use of Proceeds 152Item 3. Defaults Upon Senior Securities 152Item 4. Mine Safety Disclosures 152Item 5. Other Information 152Item 6. Exhibits 152Signatures 153Exhibit Index 154
i

Definition of Abbreviations and Industry Terms
When used in Forward-Looking Statements, Part I - Items 2 through 3, and Part II - Items 1 through 6, the following terms havethe definitions indicated.
Berkshire Hathaway Energy Company and Related EntitiesBHE Berkshire Hathaway Energy CompanyBerkshire Hathaway Energy or
the CompanyBerkshire Hathaway Energy Company and its subsidiaries
PacifiCorp PacifiCorp and its subsidiariesMidAmerican Funding MidAmerican Funding, LLC and its subsidiariesMidAmerican Energy MidAmerican Energy CompanyNV Energy NV Energy, Inc. and its subsidiariesNevada Power Nevada Power Company and its subsidiariesSierra Pacific Sierra Pacific Power Company and its subsidiariesNevada Utilities Nevada Power Company and Sierra Pacific Power CompanyRegistrants Berkshire Hathaway Energy Company, PacifiCorp, MidAmerican Funding,
MidAmerican Energy, Nevada Power and Sierra PacificSubsidiary Registrants PacifiCorp, MidAmerican Funding, MidAmerican Energy, Nevada Power and Sierra
PacificNorthern Powergrid Northern Powergrid Holdings CompanyNorthern Natural Gas Northern Natural Gas CompanyKern River Kern River Gas Transmission CompanyAltaLink BHE Canada Holdings CorporationALP AltaLink, L.P.BHE U.S. Transmission BHE U.S. Transmission, LLCHomeServices HomeServices of America, Inc. and its subsidiariesBHE Pipeline Group or
Pipeline CompaniesConsists of Northern Natural Gas and Kern River
BHE Transmission Consists of AltaLink and BHE U.S. TransmissionBHE Renewables Consists of BHE Renewables, LLC and CalEnergy PhilippinesUtilities PacifiCorp, MidAmerican Energy Company, Nevada Power Company and Sierra Pacific
Power CompanyBerkshire Hathaway Berkshire Hathaway Inc.
Certain Industry TermsAESO Alberta Electric System OperatorAFUDC Allowance for Funds Used During ConstructionAUC Alberta Utilities CommissionCPUC California Public Utilities CommissionDth DecathermsEPA United States Environmental Protection AgencyFERC Federal Energy Regulatory CommissionGHG Greenhouse GasesGWh Gigawatt HoursGTA General Tariff ApplicationIPUC Idaho Public Utilities CommissionIUB Iowa Utilities BoardkV KilovoltMW Megawatts
ii

MWh Megawatt HoursOPUC Oregon Public Utility CommissionPUCN Public Utilities Commission of NevadaREC Renewable Energy CreditRPS Renewable Portfolio StandardsSEC United States Securities and Exchange CommissionSIP State Implementation PlanUPSC Utah Public Service CommissionWPSC Wyoming Public Service CommissionWUTC Washington Utilities and Transportation Commission
iii
Forward-Looking Statements
This report contains statements that do not directly or exclusively relate to historical facts. These statements are "forward-lookingstatements" within the meaning of Section 27A of the Securities Act of 1933, as amended, and Section 21E of the SecuritiesExchange Act of 1934, as amended. Forward-looking statements can typically be identified by the use of forward-looking words,such as "will," "may," "could," "project," "believe," "anticipate," "expect," "estimate," "continue," "intend," "potential," "plan,""forecast" and similar terms. These statements are based upon the relevant Registrant's current intentions, assumptions, expectationsand beliefs and are subject to risks, uncertainties and other important factors. Many of these factors are outside the control of eachRegistrant and could cause actual results to differ materially from those expressed or implied by such forward-looking statements.These factors include, among others:
• general economic, political and business conditions, as well as changes in, and compliance with, laws and regulations,including income tax reform, initiatives regarding deregulation and restructuring of the utility industry, and reliabilityand safety standards, affecting the respective Registrant's operations or related industries;
• changes in, and compliance with, environmental laws, regulations, decisions and policies that could, among other items,increase operating and capital costs, reduce facility output, accelerate facility retirements or delay facility constructionor acquisition;
• the outcome of regulatory rate reviews and other proceedings conducted by regulatory agencies or other governmentaland legal bodies and the respective Registrant's ability to recover costs through rates in a timely manner;
• changes in economic, industry, competition or weather conditions, as well as demographic trends, new technologies andvarious conservation, energy efficiency and private generation measures and programs, that could affect customer growthand usage, electricity and natural gas supply or the respective Registrant's ability to obtain long-term contracts withcustomers and suppliers;
• performance, availability and ongoing operation of the respective Registrant's facilities, including facilities not operatedby the Registrants, due to the impacts of market conditions, outages and repairs, transmission constraints, weather,including wind, solar and hydroelectric conditions, and operating conditions;
• the effects of catastrophic and other unforeseen events, which may be caused by factors beyond the control of eachrespective Registrant or by a breakdown or failure of the Registrants' operating assets, including storms, floods, fires,earthquakes, explosions, landslides, mining accidents, litigation, wars, terrorism, embargoes, and cyber security attacks,data security breaches, disruptions, or other malicious acts;
• a high degree of variance between actual and forecasted load or generation that could impact a Registrant's hedgingstrategy and the cost of balancing its generation resources with its retail load obligations;
• changes in prices, availability and demand for wholesale electricity, coal, natural gas, other fuel sources and fueltransportation that could have a significant impact on generating capacity and energy costs;
• the financial condition and creditworthiness of the respective Registrant's significant customers and suppliers;
• changes in business strategy or development plans;
• availability, terms and deployment of capital, including reductions in demand for investment-grade commercial paper,debt securities and other sources of debt financing and volatility in interest rates;
• changes in the respective Registrant's credit ratings;
• risks relating to nuclear generation, including unique operational, closure and decommissioning risks;

• hydroelectric conditions and the cost, feasibility and eventual outcome of hydroelectric relicensing proceedings;
• the impact of certain contracts used to mitigate or manage volume, price and interest rate risk, including increased collateralrequirements, and changes in commodity prices, interest rates and other conditions that affect the fair value of certaincontracts;
• the impact of inflation on costs and the ability of the respective Registrants to recover such costs in regulated rates;
• fluctuations in foreign currency exchange rates, primarily the British pound and the Canadian dollar;
• increases in employee healthcare costs;
• the impact of investment performance and changes in interest rates, legislation, healthcare cost trends, mortality andmorbidity on pension and other postretirement benefits expense and funding requirements;
• changes in the residential real estate brokerage and mortgage industries and regulations that could affect brokerage andmortgage transactions;
• unanticipated construction delays, changes in costs, receipt of required permits and authorizations, ability to fund capitalprojects and other factors that could affect future facilities and infrastructure additions;
• the availability and price of natural gas in applicable geographic regions and demand for natural gas supply;
• the impact of new accounting guidance or changes in current accounting estimates and assumptions on the consolidatedfinancial results of the respective Registrants;
• the ability to successfully integrate future acquired operations into a Registrant's business; and
• other business or investment considerations that may be disclosed from time to time in the Registrants' filings with theSEC or in other publicly disseminated written documents.
Further details of the potential risks and uncertainties affecting the Registrants are described in the Registrants' filings with theSEC, including Part II, Item 1A and other discussions contained in this Form 10-Q. Each Registrant undertakes no obligation topublicly update or revise any forward-looking statements, whether as a result of new information, future events or otherwise. Theforegoing factors should not be construed as exclusive.
iv

Item 1. Financial Statements
Berkshire Hathaway Energy Company and its subsidiariesReport of Independent Registered Public Accounting Firm 4Consolidated Balance Sheets 5Consolidated Statements of Operations 7Consolidated Statements of Comprehensive Income 8Consolidated Statements of Changes in Equity 9Consolidated Statements of Cash Flows 10Notes to Consolidated Financial Statements 11
PacifiCorp and its subsidiariesReport of Independent Registered Public Accounting Firm 54Consolidated Balance Sheets 55Consolidated Statements of Operations 57Consolidated Statements of Changes in Shareholders' Equity 58Consolidated Statements of Cash Flows 59Notes to Consolidated Financial Statements 60
MidAmerican Energy CompanyReport of Independent Registered Public Accounting Firm 76Balance Sheets 77Statements of Operations 79Statements of Changes in Equity 80Statements of Cash Flows 81Notes to Financial Statements 82
MidAmerican Funding, LLC and its subsidiariesReport of Independent Registered Public Accounting Firm 91Consolidated Balance Sheets 92Consolidated Statements of Operations 94Consolidated Statements of Changes in Equity 95Consolidated Statements of Cash Flows 96Notes to Consolidated Financial Statements 97
Nevada Power Company and its subsidiariesReport of Independent Registered Public Accounting Firm 111Consolidated Balance Sheets 112Consolidated Statements of Operations 113Consolidated Statements of Changes in Shareholder's Equity 114Consolidated Statements of Cash Flows 115Notes to Consolidated Financial Statements 116
Sierra Pacific Power Company and its subsidiariesReport of Independent Registered Public Accounting Firm 132Consolidated Balance Sheets 133Consolidated Statements of Operations 134Consolidated Statements of Changes in Shareholder's Equity 135Consolidated Statements of Cash Flows 136Notes to Consolidated Financial Statements 137
1

Item 2. Management's Discussion and Analysis of Financial Condition and Results of Operations
Berkshire Hathaway Energy Company and its subsidiaries 30PacifiCorp and its subsidiaries 68MidAmerican Funding, LLC and its subsidiaries and MidAmerican Energy Company 100Nevada Power Company and its subsidiaries 125Sierra Pacific Power Company and its subsidiaries 145
2

Berkshire Hathaway Energy Company and its subsidiaries Consolidated Financial Section
3

4
PART IItem 1. Financial Statements
REPORT OF INDEPENDENT REGISTERED PUBLIC ACCOUNTING FIRM
To the Board of Directors and Shareholders ofBerkshire Hathaway Energy Company Des Moines, Iowa
We have reviewed the accompanying consolidated balance sheet of Berkshire Hathaway Energy Company and subsidiaries (the"Company") as of September 30, 2017, and the related consolidated statements of operations and comprehensive income for thethree-month and nine-month periods ended September 30, 2017 and 2016, and of changes in equity and cash flows for the nine-month periods ended September 30, 2017 and 2016. These interim financial statements are the responsibility of the Company'smanagement.
We conducted our reviews in accordance with the standards of the Public Company Accounting Oversight Board (United States).A review of interim financial information consists principally of applying analytical procedures and making inquiries of personsresponsible for financial and accounting matters. It is substantially less in scope than an audit conducted in accordance with thestandards of the Public Company Accounting Oversight Board (United States), the objective of which is the expression of anopinion regarding the financial statements taken as a whole. Accordingly, we do not express such an opinion.
Based on our reviews, we are not aware of any material modifications that should be made to such consolidated interim financialstatements for them to be in conformity with accounting principles generally accepted in the United States of America.
We have previously audited, in accordance with the standards of the Public Company Accounting Oversight Board (United States),the consolidated balance sheet of Berkshire Hathaway Energy Company and subsidiaries as of December 31, 2016, and the relatedconsolidated statements of operations, comprehensive income, changes in equity, and cash flows for the year then ended (notpresented herein); and in our report dated February 24, 2017, we expressed an unqualified opinion on those consolidated financialstatements. In our opinion, the information set forth in the accompanying consolidated balance sheet as of December 31, 2016 isfairly stated, in all material respects, in relation to the consolidated balance sheet from which it has been derived.
/s/ Deloitte & Touche LLP
Des Moines, IowaNovember 3, 2017

BERKSHIRE HATHAWAY ENERGY COMPANY AND SUBSIDIARIESCONSOLIDATED BALANCE SHEETS (Unaudited)
(Amounts in millions)
As ofSeptember 30, December 31,
2017 2016ASSETS
Current assets:Cash and cash equivalents $ 1,142 $ 721Trade receivables, net 1,994 1,751Inventories 887 925Mortgage loans held for sale 534 359Other current assets 1,095 917
Total current assets 5,652 4,673
Property, plant and equipment, net 64,979 62,509Goodwill 9,700 9,010Regulatory assets 4,582 4,307Investments and restricted cash and investments 4,987 3,945Other assets 1,154 996
Total assets $ 91,054 $ 85,440
The accompanying notes are an integral part of these consolidated financial statements.
5

BERKSHIRE HATHAWAY ENERGY COMPANY AND SUBSIDIARIESCONSOLIDATED BALANCE SHEETS (Unaudited) (continued)
(Amounts in millions)
As ofSeptember 30, December 31,
2017 2016LIABILITIES AND EQUITY
Current liabilities:Accounts payable $ 1,303 $ 1,317Accrued interest 523 454Accrued property, income and other taxes 780 389Accrued employee expenses 392 261Short-term debt 2,493 1,869Current portion of long-term debt 3,070 1,006Other current liabilities 1,034 1,017
Total current liabilities 9,595 6,313
Regulatory liabilities 3,086 2,933BHE senior debt 6,771 7,418BHE junior subordinated debentures 100 944Subsidiary debt 26,183 26,748Deferred income taxes 14,832 13,879Other long-term liabilities 2,883 2,742
Total liabilities 63,450 60,977
Commitments and contingencies (Note 11)
Equity:BHE shareholders' equity:
Common stock - 115 shares authorized, no par value, 77 shares issued and outstanding — —Additional paid-in capital 6,362 6,390Retained earnings 21,534 19,448Accumulated other comprehensive loss, net (423) (1,511)
Total BHE shareholders' equity 27,473 24,327Noncontrolling interests 131 136
Total equity 27,604 24,463
Total liabilities and equity $ 91,054 $ 85,440
The accompanying notes are an integral part of these consolidated financial statements.
6

BERKSHIRE HATHAWAY ENERGY COMPANY AND SUBSIDIARIESCONSOLIDATED STATEMENTS OF OPERATIONS (Unaudited)
(Amounts in millions)
Three-Month Periods Nine-Month PeriodsEnded September 30, Ended September 30,
2017 2016 2017 2016Operating revenue:
Energy $ 4,322 $ 4,272 $ 11,501 $ 11,102Real estate 961 820 2,502 2,152
Total operating revenue 5,283 5,092 14,003 13,254
Operating costs and expenses:Energy:
Cost of sales 1,212 1,187 3,380 3,252Operating expense 930 948 2,763 2,739Depreciation and amortization 635 639 1,905 1,898
Real estate 882 733 2,311 1,973Total operating costs and expenses 3,659 3,507 10,359 9,862
Operating income 1,624 1,585 3,644 3,392
Other income (expense):Interest expense (464) (460) (1,379) (1,401)Capitalized interest 14 14 34 128Allowance for equity funds 24 17 59 147Interest and dividend income 32 39 85 93Other, net 2 15 24 26
Total other income (expense) (392) (375) (1,177) (1,007)
Income before income tax expense and equity income 1,232 1,210 2,467 2,385Income tax expense 184 199 319 394Equity income 30 36 80 96
Net income 1,078 1,047 2,228 2,087Net income attributable to noncontrolling interests 10 11 30 25
Net income attributable to BHE shareholders $ 1,068 $ 1,036 $ 2,198 $ 2,062
The accompanying notes are an integral part of these consolidated financial statements.
7

BERKSHIRE HATHAWAY ENERGY COMPANY AND SUBSIDIARIESCONSOLIDATED STATEMENTS OF COMPREHENSIVE INCOME (Unaudited)
(Amounts in millions)
Three-Month Periods Nine-Month PeriodsEnded September 30, Ended September 30,
2017 2016 2017 2016
Net income $ 1,078 $ 1,047 $ 2,228 $ 2,087
Other comprehensive income, net of tax:Unrecognized amounts on retirement benefits, net of tax of $1, $7,
$(3), and $26 15 18 16 80Foreign currency translation adjustment 227 (134) 535 (339)Unrealized gains on available-for-sale securities, net of tax of
$284, $53, $355 and $89 423 80 542 151Unrealized gains (losses) on cash flow hedges, net of tax of $1,
$(3), $(3) and $(1) 1 (3) (5) (2)Total other comprehensive income, net of tax 666 (39) 1,088 (110)
Comprehensive income 1,744 1,008 3,316 1,977Comprehensive income attributable to noncontrolling interests 10 11 30 25
Comprehensive income attributable to BHE shareholders $ 1,734 $ 997 $ 3,286 $ 1,952
The accompanying notes are an integral part of these consolidated financial statements.
8

BERKSHIRE HATHAWAY ENERGY COMPANY AND SUBSIDIARIESCONSOLIDATED STATEMENTS OF CHANGES IN EQUITY (Unaudited)
(Amounts in millions)
BHE Shareholders' EquityAccumulated
Additional OtherCommon Paid-in Retained Comprehensive Noncontrolling Total
Shares Stock Capital Earnings Loss, Net Interests Equity
Balance, December 31, 2015 77 $ — $ 6,403 $ 16,906 $ (908) $ 134 $ 22,535
Net income — — — 2,062 — 14 2,076
Other comprehensive loss — — — — (110) — (110)
Distributions — — — — — (14) (14)
Other equity transactions — — 1 — — 8 9
Balance, September 30, 2016 77 $ — $ 6,404 $ 18,968 $ (1,018) $ 142 $ 24,496
Balance, December 31, 2016 77 $ — $ 6,390 $ 19,448 $ (1,511) $ 136 $ 24,463
Net income — — — 2,198 — 14 2,212
Other comprehensive income — — — — 1,088 — 1,088
Distributions — — — — — (16) (16)
Common stock purchases — — (1) (18) — — (19)
Common stock exchange — — (6) (94) — — (100)
Other equity transactions — — (21) — — (3) (24)
Balance, September 30, 2017 77 $ — $ 6,362 $ 21,534 $ (423) $ 131 $ 27,604
The accompanying notes are an integral part of these consolidated financial statements.
9

BERKSHIRE HATHAWAY ENERGY COMPANY AND SUBSIDIARIESCONSOLIDATED STATEMENTS OF CASH FLOWS (Unaudited)
(Amounts in millions)
Nine-Month PeriodsEnded September 30,
2017 2016Cash flows from operating activities:
Net income $ 2,228 $ 2,087Adjustments to reconcile net income to net cash flows from operating activities:
Depreciation and amortization 1,943 1,922Allowance for equity funds (59) (147)Equity income, net of distributions (14) (62)Changes in regulatory assets and liabilities 17 41Deferred income taxes and amortization of investment tax credits 573 546Other, net 13 (60)Changes in other operating assets and liabilities, net of effects from acquisitions:
Trade receivables and other assets (98) (348)Derivative collateral, net (16) 22Pension and other postretirement benefit plans (29) (73)Accrued property, income and other taxes 390 713Accounts payable and other liabilities 170 183
Net cash flows from operating activities 5,118 4,824
Cash flows from investing activities:Capital expenditures (3,179) (3,521)Acquisitions, net of cash acquired (1,102) (66)Increase in restricted cash and investments (45) (48)Purchases of available-for-sale securities (167) (98)Proceeds from sales of available-for-sale securities 186 125Equity method investments (54) (462)Other, net (12) (47)
Net cash flows from investing activities (4,373) (4,117)
Cash flows from financing activities:Repayments of BHE senior debt and junior subordinated debentures (1,344) (1,500)Common stock purchases (19) —Proceeds from subsidiary debt 1,562 1,484Repayments of subsidiary debt (834) (1,613)Net proceeds from short-term debt 365 887Other, net (60) (50)
Net cash flows from financing activities (330) (792)
Effect of exchange rate changes 6 (5)
Net change in cash and cash equivalents 421 (90)Cash and cash equivalents at beginning of period 721 1,108Cash and cash equivalents at end of period $ 1,142 $ 1,018
The accompanying notes are an integral part of these consolidated financial statements.
10

BERKSHIRE HATHAWAY ENERGY COMPANY AND SUBSIDIARIESNOTES TO CONSOLIDATED FINANCIAL STATEMENTS
(Unaudited)
11
(1) General
Berkshire Hathaway Energy Company ("BHE") is a holding company that owns a highly diversified portfolio of locally-managedbusinesses principally engaged in the energy industry (collectively with its subsidiaries, the "Company") and is a consolidatedsubsidiary of Berkshire Hathaway Inc. ("Berkshire Hathaway").
The Company is organized as eight business segments: PacifiCorp, MidAmerican Funding, LLC ("MidAmerican Funding") (whichprimarily consists of MidAmerican Energy Company ("MidAmerican Energy")), NV Energy, Inc. ("NV Energy") (which primarilyconsists of Nevada Power Company ("Nevada Power") and Sierra Pacific Power Company ("Sierra Pacific")), Northern PowergridHoldings Company ("Northern Powergrid") (which primarily consists of Northern Powergrid (Northeast) Limited and NorthernPowergrid (Yorkshire) plc), BHE Pipeline Group (which consists of Northern Natural Gas Company ("Northern Natural Gas")and Kern River Gas Transmission Company ("Kern River")), BHE Transmission (which consists of BHE Canada HoldingsCorporation ("AltaLink") (which primarily consists of AltaLink, L.P. ("ALP")) and BHE U.S. Transmission, LLC), BHERenewables (which primarily consists of BHE Renewables, LLC and CalEnergy Philippines) and HomeServices of America, Inc.(collectively with its subsidiaries, "HomeServices"). The Company, through these locally managed and operated businesses, ownsfour utility companies in the United States serving customers in 11 states, two electricity distribution companies in Great Britain,two interstate natural gas pipeline companies in the United States, an electric transmission business in Canada, interests in electrictransmission businesses in the United States, a renewable energy business primarily selling power generated from solar, wind,geothermal and hydroelectric sources under long-term contracts, the second largest residential real estate brokerage firm in theUnited States and one of the largest residential real estate brokerage franchise networks in the United States.
The unaudited Consolidated Financial Statements have been prepared in accordance with accounting principles generally acceptedin the United States of America ("GAAP") for interim financial information and the United States Securities and ExchangeCommission's rules and regulations for Form 10-Q and Article 10 of Regulation S-X. Accordingly, they do not include all of thedisclosures required by GAAP for annual financial statements. Management believes the unaudited Consolidated FinancialStatements contain all adjustments (consisting only of normal recurring adjustments) considered necessary for the fair presentationof the unaudited Consolidated Financial Statements as of September 30, 2017 and for the three- and nine-month periods endedSeptember 30, 2017 and 2016. The results of operations for the three- and nine-month periods ended September 30, 2017 are notnecessarily indicative of the results to be expected for the full year.
The preparation of the unaudited Consolidated Financial Statements in conformity with GAAP requires management to makeestimates and assumptions that affect the reported amounts of assets and liabilities at the date of the unaudited ConsolidatedFinancial Statements and the reported amounts of revenue and expenses during the period. Actual results may differ from theestimates used in preparing the unaudited Consolidated Financial Statements. Note 2 of Notes to Consolidated Financial Statementsincluded in the Company's Annual Report on Form 10-K for the year ended December 31, 2016 describes the most significantaccounting policies used in the preparation of the unaudited Consolidated Financial Statements. There have been no significantchanges in the Company's assumptions regarding significant accounting estimates and policies during the nine-month period endedSeptember 30, 2017.
(2) New Accounting Pronouncements
In August 2017, the Financial Accounting Standards Board ("FASB") issued Accounting Standards Update ("ASU") No. 2017-12,which amends FASB Accounting Standards Codification ("ASC") Topic 815, "Derivatives and Hedging." The amendments in thisguidance update the hedge accounting model to enable entities to better portray the economics of their risk management activitiesin the financial statements, expands an entity’s ability to hedge non-financial and financial risk components and reduces complexityin fair value hedges of interest rate risk. In addition, it eliminates the requirement to separately measure and report hedgeineffectiveness and generally requires the entire change in fair value of a hedging instrument to be presented in the same incomestatement line as the hedged item and also eases certain documentation and assessment requirements. This guidance is effectivefor interim and annual reporting periods beginning after December 15, 2018, with early adoption permitted, and is required to beadopted using a modified retrospective approach by means of a cumulative-effect adjustment to retained earnings as of the beginningof the fiscal year of adoption. The Company is currently evaluating the impact of adopting this guidance on its ConsolidatedFinancial Statements and disclosures included within Notes to Consolidated Financial Statements.

In March 2017, the FASB issued ASU No. 2017-07, which amends FASB ASC Topic 715, "Compensation - Retirement Benefits."The amendments in this guidance require that an employer disaggregate the service cost component from the other componentsof net benefit cost and report the service cost component in the same line item as other compensation costs arising from servicesrendered by the pertinent employees during the period. The other components of net benefit cost are required to be presented inthe statement of operations separately from the service cost component and outside the subtotal of operating income. Additionally,the guidance only allows the service cost component to be eligible for capitalization when applicable. This guidance is effectivefor interim and annual reporting periods beginning after December 15, 2017, with early adoption permitted. This guidance mustbe adopted retrospectively for the presentation of the service cost component and the other components of net benefit cost in thestatement of operations and prospectively for the capitalization of the service cost component in the balance sheet. The Companyplans to adopt this guidance effective January 1, 2018. The Company does not believe this will have a material impact on itsConsolidated Financial Statements and disclosures included within Notes to Consolidated Financial Statements.
In November 2016, the FASB issued ASU No. 2016-18, which amends FASB ASC Subtopic 230-10, "Statement of Cash Flows- Overall." The amendments in this guidance require that a statement of cash flows explain the change during the period in thetotal of cash, cash equivalents, and amounts generally described as restricted cash or restricted cash equivalents. Amounts generallydescribed as restricted cash and restricted cash equivalents should be included with cash and cash equivalents when reconcilingthe beginning-of-period and end-of-period total amounts shown on the statement of cash flows. This guidance is effective forinterim and annual reporting periods beginning after December 15, 2017, with early adoption permitted, and is required to beadopted retrospectively. The Company plans to adopt this guidance effective January 1, 2018 and does not believe the adoptionof this guidance will have a material impact on its Consolidated Financial Statements and disclosures included within Notes toConsolidated Financial Statements.
In August 2016, the FASB issued ASU No. 2016-15, which amends FASB ASC Topic 230, "Statement of Cash Flows." Theamendments in this guidance address the classification of eight specific cash flow issues within the statement of cash flows withthe objective of reducing the existing diversity in practice. This guidance is effective for interim and annual reporting periodsbeginning after December 15, 2017, with early adoption permitted, and is required to be adopted retrospectively. The Companyplans to adopt this guidance effective January 1, 2018 and does not believe the adoption of this guidance will have a materialimpact on its Consolidated Financial Statements.
In February 2016, the FASB issued ASU No. 2016-02, which creates FASB ASC Topic 842, "Leases" and supersedes Topic 840"Leases." This guidance increases transparency and comparability among entities by recording lease assets and lease liabilitieson the balance sheet and disclosing key information about leasing arrangements. A lessee should recognize in the balance sheet aliability to make lease payments (the lease liability) and a right-of-use asset representing its right to use the underlying asset forthe lease term. The recognition, measurement, and presentation of expenses and cash flows arising from a lease by a lessee havenot significantly changed from previous guidance. This guidance is effective for interim and annual reporting periods beginningafter December 15, 2018, with early adoption permitted, and is required to be adopted using a modified retrospective approach.The Company plans to adopt this guidance effective January 1, 2019 and is currently evaluating the impact on its ConsolidatedFinancial Statements and disclosures included within Notes to Consolidated Financial Statements.
In January 2016, the FASB issued ASU No. 2016-01, which amends FASB ASC Subtopic 825-10, "Financial Instruments - Overall."The amendments in this guidance address certain aspects of recognition, measurement, presentation and disclosure of financialinstruments including a requirement that all investments in equity securities that do not qualify for equity method accounting orresult in consolidation of the investee be measured at fair value with changes in fair value recognized in net income. This guidanceis effective for interim and annual reporting periods beginning after December 15, 2017, with early adoption not permitted, andis required to be adopted prospectively by means of a cumulative-effect adjustment to the balance sheet as of the beginning of thefiscal year of adoption. The Company is currently evaluating the impact of adopting this guidance on its Consolidated FinancialStatements and disclosures included within Notes to Consolidated Financial Statements. The material impacts currently identifiedinclude recording the unrealized gains and losses on available-for-sale securities in the Consolidated Statements of Operations asopposed to other comprehensive income ("OCI"). For the nine-month periods ended September 30, 2017 and 2016, these amounts,net of tax, were 542 million and 151 million, respectively.
12

In May 2014, the FASB issued ASU No. 2014-09, which creates FASB ASC Topic 606, "Revenue from Contracts with Customers"and supersedes ASC Topic 605, "Revenue Recognition." The guidance replaces industry-specific guidance and establishes a singlefive-step model to identify and recognize revenue. The core principle of the guidance is that an entity should recognize revenueupon transfer of control of promised goods or services to customers in an amount that reflects the consideration to which an entityexpects to be entitled in exchange for those goods or services. Additionally, the guidance requires the entity to disclose furtherquantitative and qualitative information regarding the nature and amount of revenues arising from contracts with customers, aswell as other information about the significant judgments and estimates used in recognizing revenues from contracts with customers.In August 2015, the FASB issued ASU No. 2015-14, which defers the effective date of ASU No. 2014-09 one year to interim andannual reporting periods beginning after December 15, 2017. During 2016 and 2017, the FASB issued several ASUs that clarifythe implementation guidance for ASU No. 2014-09 but do not change the core principle of the guidance. This guidance may beadopted retrospectively or under a modified retrospective method where the cumulative effect is recognized at the date of initialapplication. The Company plans to adopt this guidance effective January 1, 2018 under the modified retrospective method and iscurrently evaluating the impact on its Consolidated Financial Statements and disclosures included within Notes to ConsolidatedFinancial Statements. The Company currently does not expect the timing and amount of revenue currently recognized to bematerially different after adoption of the new guidance as a majority of revenue is recognized when the Company has the right toinvoice as it corresponds directly with the value to the customer of the Company’s performance to date. The Company's currentplan is to quantitatively disaggregate revenue in the required financial statement footnote by regulated energy, nonregulated energyand real estate, with further disaggregation of regulated energy by jurisdiction and real estate by line of business.
13
(3) Business Acquisitions
The Company completed various acquisitions totaling $1.1 billion, net of cash acquired, for the nine-month period endedSeptember 30, 2017. The purchase price for each acquisition was allocated to the assets acquired and liabilities assumed, whichprimarily related to residential real estate brokerage businesses, development and construction costs for the 110-megawatt Alamo6 solar project and the 50-megawatt Pearl solar project, and the remaining 25% interest in the Silverhawk natural gas-fueledgeneration facility at Nevada Power. As a result of the various acquisitions, the Company acquired assets of $1.1 billion, assumedliabilities of $476 million and recognized goodwill of $522 million.
(4) Property, Plant and Equipment, Net
Property, plant and equipment, net consists of the following (in millions):
As ofDepreciable September 30, December 31,
Life 2017 2016Regulated assets:
Utility generation, transmission and distribution systems 5-80 years $ 73,138 $ 71,536Interstate natural gas pipeline assets 3-80 years 6,991 6,942
80,129 78,478Accumulated depreciation and amortization (24,525) (23,603)
Regulated assets, net 55,604 54,875
Nonregulated assets:Independent power plants 5-30 years 5,911 5,594Other assets 3-30 years 1,265 1,002
7,176 6,596Accumulated depreciation and amortization (1,304) (1,060)
Nonregulated assets, net 5,872 5,536
Net operating assets 61,476 60,411Construction work-in-progress 3,503 2,098
Property, plant and equipment, net $ 64,979 $ 62,509

Construction work-in-progress includes $3.1 billion as of September 30, 2017 and $1.8 billion as of December 31, 2016, relatedto the construction of regulated assets.
During the fourth quarter of 2016, MidAmerican Energy revised its electric and gas depreciation rates based on the results of anew depreciation study, the most significant impact of which was longer estimated useful lives for certain wind-powered generatingfacilities. The effect of this change was to reduce depreciation and amortization expense by $34 million annually, or $9 millionand $26 million for the three- and nine-month periods ended September 30, 2017, based on depreciable plant balances at the timeof the change.
14
(5) Investments and Restricted Cash and Investments
Investments and restricted cash and investments consists of the following (in millions):
As ofSeptember 30, December 31,
2017 2016Investments:
BYD Company Limited common stock $ 2,087 $ 1,185Rabbi trusts 431 403Other 132 106
Total investments 2,650 1,694
Equity method investments:BHE Renewables tax equity investments 804 741Electric Transmission Texas, LLC 693 672Bridger Coal Company 140 165Other 158 142
Total equity method investments 1,795 1,720
Restricted cash and investments:Quad Cities Station nuclear decommissioning trust funds 498 460Other 317 282
Total restricted cash and investments 815 742
Total investments and restricted cash and investments $ 5,260 $ 4,156
Reflected as:Other current assets $ 273 $ 211Noncurrent assets 4,987 3,945
Total investments and restricted cash and investments $ 5,260 $ 4,156
Investments
BHE's investment in BYD Company Limited common stock is accounted for as an available-for-sale security with changes in fairvalue recognized in accumulated other comprehensive income (loss) ("AOCI"). The fair value of BHE's investment in BYDCompany Limited common stock reflects a pre-tax unrealized gain of $1,855 million and $953 million as of September 30, 2017and December 31, 2016, respectively.
(6) Recent Financing Transactions
Long-Term Debt
In the first nine months of 2017, BHE repaid at par value a total of $944 million, plus accrued interest, of its junior subordinateddebentures due December 2044.
In September 2017, HomeServices entered into a $250 million unsecured amortizing term loan due September 2022. The amortizingterm loan has an underlying variable interest rate based on the London Interbank Offered Rate ("LIBOR") plus a spread that variesbased on HomeServices' total net leverage ratio as of the last day of each quarter. The net proceeds were used to fund the repaymentor reimbursement of amounts provided by BHE for the costs related to acquisitions.
In July 2017, Northern Powergrid Metering Limited entered into a £200 million secured amortizing corporate facility with a statedmaturity of June 2026. The amortizing facility has a variable interest rate based on the LIBOR plus a spread that varies based onan agreed-upon schedule. In July 2017, Northern Powergrid Metering Limited received proceeds of £120 million under the facilityto repay amounts provided by Yorkshire Electricity Group plc which provides internal funds for the continuing smart meterdeployment program of Northern Powergrid Metering Limited. Northern Powergrid Metering Limited has entered into interestrate swaps that fix the underlying interest rate on 85% of the outstanding debt.
In July 2017, Cordova Funding Corporation redeemed the remaining $89 million of its 8.48% to 9.07% Series A Senior SecuredBonds due December 2019, CE Generation, LLC redeemed the remaining $51 million of its 7.416% Senior Secured Bonds dueDecember 2018, and Salton Sea Funding Corporation redeemed the remaining $20 million of its 7.475% Senior Secured SeriesF Bonds due November 2018, each at redemption prices determined in accordance with the terms of the respective indentures.
In June 2017, BHE issued $100 million of its 5.0% junior subordinated debentures due June 2057 in exchange for 181,819 sharesof BHE no par value common stock held by a minority shareholder. The junior subordinated debentures are redeemable at BHE'soption at any time from and after June 15, 2037, at par plus accrued and unpaid interest.
In May 2017, Alamo 6, LLC issued $232 million of its 4.17% Senior Secured Notes due March 2042. The principal of the notesamortizes beginning March 2018 with a final maturity in March 2042. The net proceeds were used to fund the repayment orreimbursement of amounts provided by BHE for the costs related to the development, construction and financing of a 110-megawattsolar project in Texas.
In April 2017, Kern River redeemed the remaining $175 million of its 4.893% Senior Notes due April 2018 at a redemption pricedetermined in accordance with the terms of the indenture.
In February 2017, MidAmerican Energy issued $375 million of its 3.10% First Mortgage Bonds due May 2027 and $475 millionof its 3.95% First Mortgage Bonds due August 2047. An amount equal to the net proceeds was used to finance capital expenditures,disbursed during the period from February 2, 2016 to February 1, 2017, with respect to investments in MidAmerican Energy's551-megawatt Wind X and 2,000-megawatt Wind XI projects, which were previously financed with MidAmerican Energy's generalfunds.
In February 2017, MidAmerican Energy redeemed in full through optional redemption its $250 million of 5.95% Senior Notesdue July 2017.
Credit Facilities
In September 2017, HomeServices terminated its $350 million unsecured credit facility expiring July 2018 and entered into a $600million unsecured credit facility expiring September 2022. The credit facility, which is for general corporate purposes and providesfor the issuance of letters of credit, has a variable interest rate based on the LIBOR or a base rate, at HomeServices' option, plusa spread that varies based on HomeServices' total net leverage ratio as of the last day of each quarter.
In June 2017, BHE extended, with lender consent, the maturity date to June 2020 for its $2.0 billion unsecured credit facility andPacifiCorp extended, with lender consent, the maturity date to June 2020 for its $400 million unsecured credit facility, each byexercising the first of two available one-year extensions.
15

In June 2017, PacifiCorp terminated its $600 million unsecured credit facility expiring March 2018 and entered into a $600 millionunsecured credit facility expiring June 2020 with two one-year extension options subject to lender consent. The credit facility,which supports PacifiCorp's commercial paper program and certain series of its tax-exempt bond obligations and provides for theissuance of letters of credit, has a variable interest rate based on the Eurodollar rate or a base rate, at PacifiCorp's option, plus aspread that varies based on PacifiCorp's credit ratings for its senior unsecured long-term debt securities. The credit facility requiresPacifiCorp's ratio of consolidated debt, including current maturities, to total capitalization not exceed 0.65 to 1.0 as of the last dayof each quarter.
In June 2017, MidAmerican Energy terminated its $600 million unsecured credit facility expiring March 2018 and entered into a$900 million unsecured credit facility expiring June 2020 with two one-year extension options subject to lender consent. The creditfacility, which supports MidAmerican Energy's commercial paper program and its variable-rate tax-exempt bond obligations andprovides for the issuance of letters of credit, has a variable interest rate based on the Eurodollar rate or a base rate, at MidAmericanEnergy's option, plus a spread that varies based on MidAmerican Energy's credit ratings for senior unsecured long-term debtsecurities. The credit facility requires MidAmerican Energy's ratio of consolidated debt, including current maturities, to totalcapitalization not exceed 0.65 to 1.0 as of the last day of each quarter.
In June 2017, Nevada Power amended its $400 million secured credit facility, extending the maturity date to June 2020 with twoone-year extension options subject to lender consent. The amended credit facility, which is for general corporate purposes andprovides for the issuance of letters of credit, has a variable interest rate based on the Eurodollar rate or a base rate, at NevadaPower's option, plus a spread that varies based on Nevada Power's credit ratings for its senior secured long-term debt securities.The amended credit facility requires Nevada Power's ratio of consolidated debt, including current maturities, to totalcapitalization not to exceed 0.65 to 1.0 as of the last day of each quarter.
In June 2017, Sierra Pacific amended its $250 million secured credit facility, extending the maturity date to June 2020 with twoone-year extension options subject to lender consent. The amended credit facility, which is for general corporate purposes andprovides for the issuance of letters of credit, has a variable interest rate based on the Eurodollar rate or a base rate, at Sierra Pacific'soption, plus a spread that varies based on Sierra Pacific's credit ratings for its senior secured long-term debt securities. The amendedcredit facility requires Sierra Pacific's ratio of consolidated debt, including current maturities, to total capitalization not exceed0.65 to 1.0 as of the last day of each quarter.
In May 2017, BHE entered into a $1.0 billion unsecured credit facility expiring May 2018. The credit facility, which is for generalcorporate purposes and also supports BHE's commercial paper program and provides for the issuance of letters of credit, has avariable interest rate based on the Eurodollar rate or a base rate, at BHE's option, plus a spread that varies based on BHE's creditratings for its senior unsecured long-term debt securities. The credit facility requires BHE's ratio of consolidated debt, includingcurrent maturities, to total capitalization not exceed 0.70 to 1.0 as of the last day of each quarter.
16
(7) Income Taxes
A reconciliation of the federal statutory income tax rate to the effective income tax rate applicable to income before income taxexpense is as follows:
Three-Month Periods Nine-Month PeriodsEnded September 30, Ended September 30,
2017 2016 2017 2016
Federal statutory income tax rate 35% 35% 35% 35%Income tax credits (19) (16) (18) (15)State income tax, net of federal income tax benefit — — (1) —Income tax effect of foreign income (3) (3) (4) (4)Equity income 1 1 1 1Other, net 1 (1) — —
Effective income tax rate 15% 16% 13% 17%

Income tax credits relate primarily to production tax credits from wind-powered generating facilities owned by MidAmericanEnergy, PacifiCorp and BHE Renewables. Federal renewable electricity production tax credits are earned as energy from qualifyingwind-powered generating facilities is produced and sold and are based on a per-kilowatt hour rate pursuant to the applicable federalincome tax law. Wind-powered generating facilities are eligible for the credits for 10 years from the date the qualifying generatingfacilities are placed in-service.
Berkshire Hathaway includes the Company in its United States federal income tax return. The Company's provision for incometaxes has been computed on a stand-alone basis, and substantially all of its currently payable or receivable federal income taxesare remitted to or received from Berkshire Hathaway. For the nine-month periods ended September 30, 2017 and 2016, the Companyreceived net cash payments for federal income taxes from Berkshire Hathaway totaling $659 million and $860 million, respectively.
17
(8) Employee Benefit Plans
Domestic Operations
Net periodic benefit cost (credit) for the domestic pension and other postretirement benefit plans included the following components(in millions):
Three-Month Periods Nine-Month PeriodsEnded September 30, Ended September 30,
2017 2016 2017 2016Pension:
Service cost $ 6 $ 7 $ 18 $ 22Interest cost 29 31 87 94Expected return on plan assets (40) (39) (120) (120)Net amortization 7 12 22 36
Net periodic benefit cost $ 2 $ 11 $ 7 $ 32
Other postretirement:Service cost $ 3 $ 2 $ 7 $ 7Interest cost 7 7 21 23Expected return on plan assets (9) (10) (30) (31)Net amortization (3) (2) (10) (9)
Net periodic benefit credit $ (2) $ (3) $ (12) $ (10)
Employer contributions to the domestic pension and other postretirement benefit plans are expected to be $15 million and $5million, respectively, during 2017. As of September 30, 2017, $9 million and $5 million of contributions had been made to thedomestic pension and other postretirement benefit plans, respectively.

Foreign Operations
Net periodic benefit cost for the United Kingdom pension plan included the following components (in millions):
Three-Month Periods Nine-Month PeriodsEnded September 30, Ended September 30,
2017 2016 2017 2016
Service cost $ 6 $ 5 $ 19 $ 16Interest cost 15 17 44 55Expected return on plan assets (25) (27) (74) (85)Settlement 18 — 18 —Net amortization 17 11 50 34
Net periodic benefit cost $ 31 $ 6 $ 57 $ 20
Employer contributions to the United Kingdom pension plan are expected to be £45 million during 2017. As of September 30,2017, £34 million, or $43 million, of contributions had been made to the United Kingdom pension plan.
18
(9) Risk Management and Hedging Activities
The Company is exposed to the impact of market fluctuations in commodity prices, interest rates and foreign currency exchangerates. The Company is principally exposed to electricity, natural gas, coal and fuel oil commodity price risk primarily throughBHE's ownership of PacifiCorp, MidAmerican Energy, Nevada Power and Sierra Pacific (the "Utilities") as they have an obligationto serve retail customer load in their regulated service territories. The Company also provides nonregulated retail electricity andnatural gas services in competitive markets. The Utilities' load and generating facilities represent substantial underlying commoditypositions. Exposures to commodity prices consist mainly of variations in the price of fuel required to generate electricity, wholesaleelectricity that is purchased and sold, and natural gas supply for retail customers. Commodity prices are subject to wide priceswings as supply and demand are impacted by, among many other unpredictable items, weather, market liquidity, generatingfacility availability, customer usage, storage, and transmission and transportation constraints. Interest rate risk exists on variable-rate debt, future debt issuances and mortgage commitments. Additionally, the Company is exposed to foreign currency exchangerate risk from its business operations and investments in Great Britain and Canada. The Company does not engage in a materialamount of proprietary trading activities.
Each of the Company's business platforms has established a risk management process that is designed to identify, assess, manage,monitor and report each of the various types of risk involved in its business. To mitigate a portion of its commodity price risk,the Company uses commodity derivative contracts, which may include forwards, futures, options, swaps and other agreements,to effectively secure future supply or sell future production generally at fixed prices. The Company manages its interest rate riskby limiting its exposure to variable interest rates primarily through the issuance of fixed-rate long-term debt and by monitoringmarket changes in interest rates. Additionally, the Company may from time to time enter into interest rate derivative contracts,such as interest rate swaps or locks, forward sale commitments, or mortgage interest rate lock commitments, to mitigate theCompany's exposure to interest rate risk. The Company does not hedge all of its commodity price, interest rate and foreigncurrency exchange rate risks, thereby exposing the unhedged portion to changes in market prices.
There have been no significant changes in the Company's accounting policies related to derivatives. Refer to Note 10 for additionalinformation on derivative contracts.
The following table, which reflects master netting arrangements and excludes contracts that have been designated as normal underthe normal purchases or normal sales exception afforded by GAAP, summarizes the fair value of the Company's derivative contracts,on a gross basis, and reconciles those amounts to the amounts presented on a net basis on the Consolidated Balance Sheets(in millions):

Other Other OtherCurrent Other Current Long-termAssets Assets Liabilities Liabilities Total
As of September 30, 2017Not designated as hedging contracts:
Commodity assets(1) $ 16 $ 93 $ 7 $ 3 $ 119Commodity liabilities(1) (1) — (60) (135) (196)Interest rate assets 22 — — — 22Interest rate liabilities — — (3) (7) (10)
Total 37 93 (56) (139) (65)
Designated as hedging contracts:Commodity assets — — 2 6 8Commodity liabilities — — (11) (17) (28)Interest rate assets — 6 — — 6Interest rate liabilities — — (1) — (1)
Total — 6 (10) (11) (15)
Total derivatives 37 99 (66) (150) (80)Cash collateral receivable — — 21 64 85
Total derivatives - net basis $ 37 $ 99 $ (45) $ (86) $ 5
Other Other OtherCurrent Other Current Long-termAssets Assets Liabilities Liabilities Total
As of December 31, 2016Not designated as hedging contracts:
Commodity assets(1) $ 42 $ 86 $ 5 $ 2 $ 135Commodity liabilities(1) (10) — (46) (150) (206)Interest rate assets 15 — — — 15Interest rate liabilities — — (4) (6) (10)
Total 47 86 (45) (154) (66)
Designated as hedging contracts:Commodity assets 1 — 2 3 6Commodity liabilities — — (14) (8) (22)Interest rate assets — 8 — — 8Interest rate liabilities — — (3) — (3)
Total 1 8 (15) (5) (11)
Total derivatives 48 94 (60) (159) (77)Cash collateral receivable — — 13 61 74
Total derivatives - net basis $ 48 $ 94 $ (47) $ (98) $ (3) (1) The Company's commodity derivatives not designated as hedging contracts are generally included in regulated rates, and as of September 30, 2017
and December 31, 2016, a net regulatory asset of $162 million and $148 million, respectively, was recorded related to the net derivative liability of$77 million and $71 million, respectively. The difference between the net regulatory asset and the net derivative liability relates primarily to a powerpurchase agreement derivative at BHE Renewables.
19

Not Designated as Hedging Contracts
The following table reconciles the beginning and ending balances of the Company's net regulatory assets and summarizes the pre-tax gains and losses on commodity derivative contracts recognized in net regulatory assets, as well as amounts reclassified toearnings (in millions):
Three-Month Periods Nine-Month PeriodsEnded September 30, Ended September 30,
2017 2016 2017 2016
Beginning balance $ 162 $ 185 $ 148 $ 250Changes in fair value recognized in net regulatory assets 10 18 43 5Net (losses) gains reclassified to operating revenue (5) (3) 9 (6)Net losses reclassified to cost of sales (5) (5) (38) (54)Ending balance $ 162 $ 195 $ 162 $ 195
Designated as Hedging Contracts
The Company uses commodity derivative contracts accounted for as cash flow hedges to hedge electricity and natural gascommodity prices for delivery to nonregulated customers, spring operational sales, natural gas storage and other transactions.Certain commodity derivative contracts have settled and the fair value at the date of settlement remains in AOCI and is recognizedin earnings when the forecasted transactions impact earnings. The following table reconciles the beginning and ending balancesof the Company's accumulated other comprehensive (income) loss (pre-tax) and summarizes pre-tax gains and losses on commodityderivative contracts designated and qualifying as cash flow hedges recognized in OCI, as well as amounts reclassified to earnings(in millions):
Three-Month Periods Nine-Month PeriodsEnded September 30, Ended September 30,
2017 2016 2017 2016
Beginning balance $ 21 $ 26 $ 16 $ 46Changes in fair value recognized in OCI 5 15 28 35Net gains reclassified to operating revenue — 1 — 1Net losses reclassified to cost of sales (7) (7) (25) (47)Ending balance $ 19 $ 35 $ 19 $ 35 Realized gains and losses on hedges and hedge ineffectiveness are recognized in income as operating revenue, cost of sales,operating expense or interest expense depending upon the nature of the item being hedged. For the three- and nine-month periodsended September 30, 2017 and 2016, hedge ineffectiveness was insignificant. As of September 30, 2017, the Company had cashflow hedges with expiration dates extending through June 2026 and $10 million of pre-tax unrealized losses are forecasted to bereclassified from AOCI into earnings over the next twelve months as contracts settle.
20

Derivative Contract Volumes
The following table summarizes the net notional amounts of outstanding derivative contracts with fixed price terms that comprisethe mark-to-market values as of (in millions):
Unit of September 30, December 31,Measure 2017 2016
Electricity purchases Megawatt hours 9 5Natural gas purchases Decatherms 339 271Fuel purchases Gallons 2 11Interest rate swaps US$ 694 714Interest rate swaps £ 102 —Mortgage sale commitments, net US$ (442) (309)
Credit Risk
The Utilities are exposed to counterparty credit risk associated with wholesale energy supply and marketing activities with otherutilities, energy marketing companies, financial institutions and other market participants. Credit risk may be concentrated to theextent the Utilities' counterparties have similar economic, industry or other characteristics and due to direct or indirect relationshipsamong the counterparties. Before entering into a transaction, the Utilities analyze the financial condition of each significantwholesale counterparty, establish limits on the amount of unsecured credit to be extended to each counterparty and evaluate theappropriateness of unsecured credit limits on an ongoing basis. To further mitigate wholesale counterparty credit risk, the Utilitiesenter into netting and collateral arrangements that may include margining and cross-product netting agreements and obtain third-party guarantees, letters of credit and cash deposits. If required, the Utilities exercise rights under these arrangements, includingcalling on the counterparty's credit support arrangement.
Collateral and Contingent Features
In accordance with industry practice, certain wholesale derivative contracts contain credit support provisions that in part basecertain collateral requirements on credit ratings for senior unsecured debt as reported by one or more of the three recognized creditrating agencies. These derivative contracts may either specifically provide bilateral rights to demand cash or other security if creditexposures on a net basis exceed specified rating-dependent threshold levels ("credit-risk-related contingent features") or providethe right for counterparties to demand "adequate assurance," or in some cases terminate the contract, in the event of a materialadverse change in creditworthiness. These rights can vary by contract and by counterparty. As of September 30, 2017, the applicablecredit ratings from the three recognized credit rating agencies were investment grade.
The aggregate fair value of the Company's derivative contracts in liability positions with specific credit-risk-related contingentfeatures totaled $190 million and $190 million as of September 30, 2017 and December 31, 2016, respectively, for which theCompany had posted collateral of $73 million and $69 million, respectively, in the form of cash deposits. If all credit-risk-relatedcontingent features for derivative contracts in liability positions had been triggered as of September 30, 2017 and December 31,2016, the Company would have been required to post $105 million and $110 million, respectively, of additional collateral. TheCompany's collateral requirements could fluctuate considerably due to market price volatility, changes in credit ratings, changesin legislation or regulation, or other factors.
21

(10) Fair Value Measurements
The carrying value of the Company's cash, certain cash equivalents, receivables, payables, accrued liabilities and short-termborrowings approximates fair value because of the short-term maturity of these instruments. The Company has various financialassets and liabilities that are measured at fair value on the Consolidated Financial Statements using inputs from the three levelsof the fair value hierarchy. A financial asset or liability classification within the hierarchy is determined based on the lowest levelinput that is significant to the fair value measurement. The three levels are as follows:
• Level 1 — Inputs are unadjusted quoted prices in active markets for identical assets or liabilities that the Company hasthe ability to access at the measurement date.
• Level 2 — Inputs include quoted prices for similar assets or liabilities in active markets, quoted prices for identical orsimilar assets or liabilities in markets that are not active, inputs other than quoted prices that are observable for the assetor liability and inputs that are derived principally from or corroborated by observable market data by correlation or othermeans (market corroborated inputs).
• Level 3 — Unobservable inputs reflect the Company's judgments about the assumptions market participants would usein pricing the asset or liability since limited market data exists. The Company develops these inputs based on the bestinformation available, including its own data.
The following table presents the Company's financial assets and liabilities recognized on the Consolidated Balance Sheets andmeasured at fair value on a recurring basis (in millions):
Input Levels for Fair Value MeasurementsLevel 1 Level 2 Level 3 Other(1) Total
As of September 30, 2017Assets:Commodity derivatives $ 1 $ 24 $ 102 $ (19) $ 108Interest rate derivatives — 14 14 — 28Mortgage loans held for sale — 534 — — 534Money market mutual funds(2) 855 — — — 855Debt securities:
United States government obligations 168 — — — 168International government obligations — 5 — — 5Corporate obligations — 37 — — 37Municipal obligations — 2 — — 2Agency, asset and mortgage-backed obligations — 1 — — 1
Equity securities:United States companies 270 — — — 270International companies 2,094 — — — 2,094Investment funds 182 — — — 182
$ 3,570 $ 617 $ 116 $ (19) $ 4,284Liabilities:
Commodity derivatives $ (1) $ (207) $ (16) $ 104 $ (120)Interest rate derivatives — (10) (1) — (11)
$ (1) $ (217) $ (17) $ 104 $ (131)
22

As of December 31, 2016Assets:Commodity derivatives $ 5 $ 49 $ 87 $ (22) $ 119Interest rate derivatives — 16 7 — 23Mortgage loans held for sale — 359 — — 359Money market mutual funds(2) 586 — — — 586Debt securities:
United States government obligations 161 — — — 161International government obligations — 3 — — 3Corporate obligations — 36 — — 36Municipal obligations — 2 — — 2Agency, asset and mortgage-backed obligations — 2 — — 2
Equity securities:United States companies 250 — — — 250International companies 1,190 — — — 1,190Investment funds 147 — — — 147
$ 2,339 $ 467 $ 94 $ (22) $ 2,878Liabilities:
Commodity derivatives $ (2) $ (199) $ (27) $ 96 $ (132)Interest rate derivatives (1) (11) (1) — (13)
$ (3) $ (210) $ (28) $ 96 $ (145)
(1) Represents netting under master netting arrangements and a net cash collateral receivable of $85 million and $74 million as of September 30, 2017 andDecember 31, 2016, respectively.
(2) Amounts are included in cash and cash equivalents; other current assets; and noncurrent investments and restricted cash and investments on theConsolidated Balance Sheets. The fair value of these money market mutual funds approximates cost.
Derivative contracts are recorded on the Consolidated Balance Sheets as either assets or liabilities and are stated at estimated fairvalue unless they are designated as normal purchases or normal sales and qualify for the exception afforded by GAAP. Whenavailable, the fair value of derivative contracts is estimated using unadjusted quoted prices for identical contracts in the market inwhich the Company transacts. When quoted prices for identical contracts are not available, the Company uses forward price curves.Forward price curves represent the Company's estimates of the prices at which a buyer or seller could contract today for deliveryor settlement at future dates. The Company bases its forward price curves upon market price quotations, when available, or internallydeveloped and commercial models, with internal and external fundamental data inputs. Market price quotations are obtained fromindependent brokers, exchanges, direct communication with market participants and actual transactions executed by the Company.Market price quotations are generally readily obtainable for the applicable term of the Company's outstanding derivative contracts;therefore, the Company's forward price curves reflect observable market quotes. Market price quotations for certain electricityand natural gas trading hubs are not as readily obtainable due to the length of the contract. Given that limited market data existsfor these contracts, as well as for those contracts that are not actively traded, the Company uses forward price curves derived frominternal models based on perceived pricing relationships to major trading hubs that are based on unobservable inputs. The estimatedfair value of these derivative contracts is a function of underlying forward commodity prices, interest rates, currency rates, relatedvolatility, counterparty creditworthiness and duration of contracts. Refer to Note 9 for further discussion regarding the Company'srisk management and hedging activities.
The Company's mortgage loans held for sale are valued based on independent quoted market prices, where available, or the pricesof other mortgage whole loans with similar characteristics. As necessary, these prices are adjusted for typical securitization activities,including servicing value, portfolio composition, market conditions and liquidity.
The Company's investments in money market mutual funds and debt and equity securities are stated at fair value and are primarilyaccounted for as available-for-sale securities. When available, a readily observable quoted market price or net asset value of anidentical security in an active market is used to record the fair value. In the absence of a quoted market price or net asset value ofan identical security, the fair value is determined using pricing models or net asset values based on observable market inputs andquoted market prices of securities with similar characteristics.
23

The following table reconciles the beginning and ending balances of the Company's assets and liabilities measured at fair valueon a recurring basis using significant Level 3 inputs (in millions):
Three-Month Periods Nine-Month PeriodsEnded September 30, Ended September 30,
Interest Auction Interest AuctionCommodity Rate Rate Commodity Rate RateDerivatives Derivatives Securities Derivatives Derivatives Securities
2017:Beginning balance $ 81 $ 8 $ — $ 60 $ 6 $ —Changes included in earnings 7 34 — 19 100 —Changes in fair value recognized in
OCI (1) — — (3) — —Changes in fair value recognized in
net regulatory assets (3) — — (5) — —Purchases — 8 — 1 6 —Settlements 2 (37) — 14 (99) —Ending balance $ 86 $ 13 $ — $ 86 $ 13 $ —
Three-Month Periods Nine-Month PeriodsEnded September 30, Ended September 30,
Interest Auction Interest AuctionCommodity Rate Rate Commodity Rate RateDerivatives Derivatives Securities Derivatives Derivatives Securities
2016:Beginning balance $ 44 $ 14 $ 18 $ 47 $ 4 $ 44Changes included in earnings 9 49 — 8 103 —Changes in fair value recognized in
OCI (2) — — (2) — 6Changes in fair value recognized in
net regulatory assets (1) — — (12) — —Purchases 1 — — 1 — —Redemptions — — — — — (32)Settlements 5 (52) — 14 (96) —Ending balance $ 56 $ 11 $ 18 $ 56 $ 11 $ 18
The Company's long-term debt is carried at cost on the Consolidated Balance Sheets. The fair value of the Company's long-termdebt is a Level 2 fair value measurement and has been estimated based upon quoted market prices, where available, or at the presentvalue of future cash flows discounted at rates consistent with comparable maturities with similar credit risks. The carrying valueof the Company's variable-rate long-term debt approximates fair value because of the frequent repricing of these instruments atmarket rates. The following table presents the carrying value and estimated fair value of the Company's long-term debt (in millions):
As of September 30, 2017 As of December 31, 2016Carrying Fair Carrying Fair
Value Value Value Value
Long-term debt $ 36,124 $ 41,197 $ 36,116 $ 40,718
24

(11) Commitments and Contingencies
Fuel, Capacity and Transmission Contract Commitments
During the nine-month period ended September 30, 2017, MidAmerican Energy amended certain of its natural gas supply andtransportation contracts increasing minimum payments by $247 million through 2021 and $70 million for 2022 through 2037.
Construction Commitments
During the nine-month period ended September 30, 2017, MidAmerican Energy entered into contracts totaling $675 million forthe construction of wind-powered generating facilities in 2017 through 2019, with remaining payments totaling $84 million forthe fourth quarter of 2017, $340 million in 2018 and $8 million in 2019.
Operating Leases and Easements
During the nine-month period ended September 30, 2017, MidAmerican Energy entered into non-cancelable easements withminimum payments totaling $114 million through 2057 for land in Iowa on which some of its wind-powered generating facilitieswill be located.
Legal Matters
The Company is party to a variety of legal actions arising out of the normal course of business. Plaintiffs occasionally seek punitiveor exemplary damages. The Company does not believe that such normal and routine litigation will have a material impact on itsconsolidated financial results. The Company is also involved in other kinds of legal actions, some of which assert or may assertclaims or seek to impose fines, penalties and other costs in substantial amounts and are described below.
Environmental Laws and Regulations
The Company is subject to federal, state, local and foreign laws and regulations regarding air and water quality, renewable portfoliostandards, emissions performance standards, climate change, coal combustion byproduct disposal, hazardous and solid wastedisposal, protected species and other environmental matters that have the potential to impact the Company's current and futureoperations. The Company believes it is in material compliance with all applicable laws and regulations.
Hydroelectric Relicensing
PacifiCorp's Klamath hydroelectric system is currently operating under annual licenses with the FERC. In February 2010,PacifiCorp, the United States Department of the Interior, the United States Department of Commerce, the state of California, thestate of Oregon and various other governmental and non-governmental settlement parties signed the Klamath HydroelectricSettlement Agreement ("KHSA").
Congress failed to pass legislation needed to implement the original KHSA. On April 6, 2016, PacifiCorp, the states of Californiaand Oregon and the United States Departments of the Interior and Commerce and other stakeholders executed an amendment tothe KHSA. Consistent with the terms of the amended KHSA, on September 23, 2016, PacifiCorp and the Klamath River RenewalCorporation ("KRRC") jointly filed an application with the FERC to transfer the license for the four mainstem Klamath Riverhydroelectric generating facilities from PacifiCorp to the KRRC. Also on September 23, 2016, the KRRC filed an application withthe FERC to surrender the license and decommission the facilities. The KRRC's license surrender application included a requestfor the FERC to refrain from acting on the surrender application until after the transfer of the license to the KRRC is effective.
Under the amended KHSA, PacifiCorp and its customers are protected from uncapped dam removal costs and liabilities. TheKRRC must indemnify PacifiCorp from liabilities associated with dam removal. The amended KHSA also limits PacifiCorp'scontribution to facilities removal costs to no more than $200 million, of which up to $184 million would be collected fromPacifiCorp's Oregon customers with the remainder to be collected from PacifiCorp's California customers. California votersapproved a water bond measure in November 2014 from which the state of California's contribution towards facilities removalcosts are being drawn. In accordance with this bond measure, additional funding of up to $250 million for facilities removal costswas included in the California state budget in 2016, with the funding effective for at least five years. If facilities removal costsexceed the combined funding that will be available from PacifiCorp's Oregon and California customers and the state of California,sufficient funds would need to be provided by the KRRC or an entity other than PacifiCorp for removal to proceed.
25

If certain conditions in the amended KHSA are not satisfied and the license does not transfer to the KRRC, PacifiCorp will resumerelicensing with the FERC.
Guarantees
The Company has entered into guarantees as part of the normal course of business and the sale of certain assets. These guaranteesare not expected to have a material impact on the Company's consolidated financial results.
26
(12) Components of Other Comprehensive Income (Loss), Net
The following table shows the change in AOCI attributable to BHE shareholders by each component of OCI, net of applicableincome taxes (in millions):
UnrealizedUnrecognized Foreign Gains on Unrealized AOCIAmounts on Currency Available- Gains (Losses) AttributableRetirement Translation For-Sale on Cash To BHE
Benefits Adjustment Securities Flow Hedges Shareholders, Net
Balance, December 31, 2015 $ (438) $ (1,092) $ 615 $ 7 $ (908)Other comprehensive income (loss) 80 (339) 151 (2) (110)Balance, September 30, 2016 $ (358) $ (1,431) $ 766 $ 5 $ (1,018)
Balance, December 31, 2016 $ (447) $ (1,675) $ 585 $ 26 $ (1,511)Other comprehensive income (loss) 16 535 542 (5) 1,088Balance, September 30, 2017 $ (431) $ (1,140) $ 1,127 $ 21 $ (423)
Reclassifications from AOCI to net income for the periods ended September 30, 2017 and 2016 were insignificant. For informationregarding cash flow hedge reclassifications from AOCI to net income in their entirety, refer to Note 9. Additionally, refer to the"Foreign Operations" discussion in Note 8 for information about unrecognized amounts on retirement benefits reclassificationsfrom AOCI that do not impact net income in their entirety.

(13) Segment Information
The Company's reportable segments with foreign operations include Northern Powergrid, whose business is principally in theUnited Kingdom, BHE Transmission, whose business includes operations in Canada, and BHE Renewables, whose businessincludes operations in the Philippines. Intersegment eliminations and adjustments, including the allocation of goodwill, have beenmade. Information related to the Company's reportable segments is shown below (in millions):
Three-Month Periods Nine-Month PeriodsEnded September 30, Ended September 30,
2017 2016 2017 2016Operating revenue:
PacifiCorp $ 1,430 $ 1,434 $ 3,956 $ 3,919MidAmerican Funding 815 797 2,170 2,008NV Energy 1,047 987 2,384 2,309Northern Powergrid 221 220 685 748BHE Pipeline Group 193 201 700 704BHE Transmission 182 169 506 309BHE Renewables 283 273 647 582HomeServices 961 820 2,502 2,152BHE and Other(1) 151 191 453 523
Total operating revenue $ 5,283 $ 5,092 $ 14,003 $ 13,254
Depreciation and amortization:PacifiCorp $ 200 $ 193 $ 598 $ 589MidAmerican Funding 112 118 370 338NV Energy 105 106 315 315Northern Powergrid 55 49 156 149BHE Pipeline Group 42 53 115 160BHE Transmission 58 61 165 177BHE Renewables 63 57 187 169HomeServices 16 9 38 24BHE and Other(1) — 2 (1) 1
Total depreciation and amortization $ 651 $ 648 $ 1,943 $ 1,922
27

Three-Month Periods Nine-Month PeriodsEnded September 30, Ended September 30,
2017 2016 2017 2016Operating income:
PacifiCorp $ 467 $ 445 $ 1,150 $ 1,108MidAmerican Funding 288 284 531 524NV Energy 393 394 682 656Northern Powergrid 81 90 308 373BHE Pipeline Group 65 68 328 320BHE Transmission 86 81 236 35BHE Renewables 157 157 256 233HomeServices 79 87 191 179BHE and Other(1) 8 (21) (38) (36)
Total operating income 1,624 1,585 3,644 3,392Interest expense (464) (460) (1,379) (1,401)Capitalized interest 14 14 34 128Allowance for equity funds 24 17 59 147Interest and dividend income 32 39 85 93Other, net 2 15 24 26
Total income before income tax expense and equity income $ 1,232 $ 1,210 $ 2,467 $ 2,385
Interest expense:PacifiCorp $ 95 $ 95 $ 285 $ 286MidAmerican Funding 59 55 177 164NV Energy 57 60 173 190Northern Powergrid 34 33 98 105BHE Pipeline Group 11 13 33 39BHE Transmission 45 40 125 114BHE Renewables 51 51 153 148HomeServices 1 1 3 2BHE and Other(1) 111 112 332 353
Total interest expense $ 464 $ 460 $ 1,379 $ 1,401
Operating revenue by country:United States $ 4,869 $ 4,697 $ 12,793 $ 12,185United Kingdom 221 220 685 748Canada 182 170 506 313Philippines and other 11 5 19 8
Total operating revenue by country $ 5,283 $ 5,092 $ 14,003 $ 13,254
Income before income tax expense and equity income bycountry:
United States $ 1,113 $ 1,089 $ 2,065 $ 1,945United Kingdom 49 74 213 284Canada 47 43 127 114Philippines and other 23 4 62 42
Total income before income tax expense and equity income bycountry $ 1,232 $ 1,210 $ 2,467 $ 2,385
28
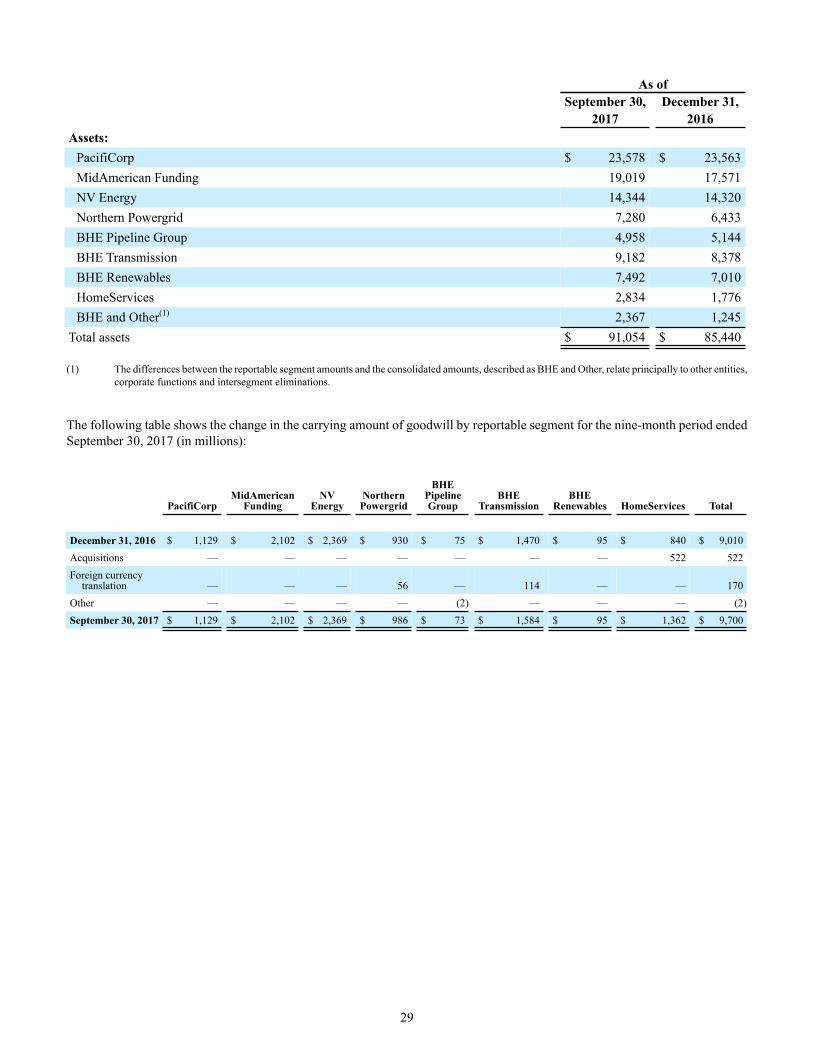
As ofSeptember 30, December 31,
2017 2016Assets:
PacifiCorp $ 23,578 $ 23,563MidAmerican Funding 19,019 17,571NV Energy 14,344 14,320Northern Powergrid 7,280 6,433BHE Pipeline Group 4,958 5,144BHE Transmission 9,182 8,378BHE Renewables 7,492 7,010HomeServices 2,834 1,776BHE and Other(1) 2,367 1,245
Total assets $ 91,054 $ 85,440
(1) The differences between the reportable segment amounts and the consolidated amounts, described as BHE and Other, relate principally to other entities,corporate functions and intersegment eliminations.
The following table shows the change in the carrying amount of goodwill by reportable segment for the nine-month period endedSeptember 30, 2017 (in millions):
BHEPipelineGroup
MidAmericanFunding
NVEnergy
NorthernPowergrid
BHETransmission
BHERenewables HomeServicesPacifiCorp Total
December 31, 2016 $ 1,129 $ 2,102 $ 2,369 $ 930 $ 75 $ 1,470 $ 95 $ 840 $ 9,010Acquisitions — — — — — — — 522 522Foreign currency
translation — — — 56 — 114 — — 170Other — — — — (2) — — — (2)September 30, 2017 $ 1,129 $ 2,102 $ 2,369 $ 986 $ 73 $ 1,584 $ 95 $ 1,362 $ 9,700
29

Item 2. Management's Discussion and Analysis of Financial Condition and Results of Operations
The following is management's discussion and analysis of certain significant factors that have affected the consolidated financialcondition and results of operations of the Company during the periods included herein. Explanations include management's bestestimate of the impact of weather, customer growth and other factors. This discussion should be read in conjunction with theCompany's historical unaudited Consolidated Financial Statements and Notes to Consolidated Financial Statements in Part I,Item 1 of this Form 10-Q. The Company's actual results in the future could differ significantly from the historical results.
The Company is organized as eight business segments: PacifiCorp, MidAmerican Funding (which primarily consists ofMidAmerican Energy), NV Energy (which primarily consists of Nevada Power and Sierra Pacific), Northern Powergrid (whichprimarily consists of Northern Powergrid (Northeast) Limited and Northern Powergrid (Yorkshire) plc), BHE Pipeline Group(which consists of Northern Natural Gas and Kern River), BHE Transmission (which consists of AltaLink and BHE U.S.Transmission), BHE Renewables and HomeServices. BHE, through these locally managed and operated businesses, owns fourutility companies in the United States serving customers in 11 states, two electricity distribution companies in Great Britain, twointerstate natural gas pipeline companies in the United States, an electric transmission business in Canada, interests in electrictransmission businesses in the United States, a renewable energy business primarily selling power generated from solar, wind,geothermal and hydroelectric sources under long-term contracts, the second largest residential real estate brokerage firm in theUnited States and one of the largest residential real estate brokerage franchise networks in the United States. The reportable segmentfinancial information includes all necessary adjustments and eliminations needed to conform to the Company's significantaccounting policies. The differences between the reportable segment amounts and the consolidated amounts, described as BHEand Other, relate principally to other entities, corporate functions and intersegment eliminations.
30
Results of Operations for the Third Quarter and First Nine Months of 2017 and 2016
Overview
Net income for the Company's reportable segments is summarized as follows (in millions):
Third Quarter First Nine Months2017 2016 Change 2017 2016 Change
Net income attributable to BHEshareholders:
PacifiCorp $ 263 $ 254 $ 9 4% $ 618 $ 596 $ 22 4%MidAmerican Funding 383 318 65 20 616 518 98 19NV Energy 223 222 1 — 347 319 28 9Northern Powergrid 39 60 (21) (35) 174 228 (54) (24)BHE Pipeline Group 35 36 (1) (3) 183 175 8 5BHE Transmission 58 57 1 2 171 173 (2) (1)BHE Renewables 89 98 (9) (9) 194 142 52 37HomeServices 45 49 (4) (8) 107 105 2 2BHE and Other (67) (58) (9) (16) (212) (194) (18) (9)
Total net income attributable to BHEshareholders $ 1,068 $ 1,036 $ 32 3 $ 2,198 $ 2,062 $ 136 7
Net income attributable to BHE shareholders increased $32 million for the third quarter of 2017 compared to 2016 due to thefollowing:
• PacifiCorp's net income increased $9 million primarily due to higher gross margins of $30 million, excluding the impactof demand side management program revenue (offset in operating expense), partially offset by higher depreciation andamortization of $7 million, primarily from additional plant placed in-service. Gross margins increased due to higher retailcustomer volumes, lower coal costs, lower natural gas-fueled generation, and higher wheeling revenue, partially offsetby higher purchased electricity costs, lower average retail rates and lower wholesale revenue from lower volumes. Retailcustomer volumes increased 2.1% due to impacts of weather on residential customers primarily in Utah and Oregon,higher commercial usage primarily in Oregon and Utah and an increase in the average number of residential andcommercial customers in Utah, partially offset by lower irrigation usage in Idaho and Oregon and lower industrial usagein Utah and Oregon.

• MidAmerican Funding's net income increased $65 million primarily due to higher recognized production tax credits of$45 million due to higher generation from wind-powered facilities placed in-service in the second half of 2016, higherelectric gross margins of $7 million, excluding the impact of demand side management program revenue (offset inoperating expense), and lower depreciation and amortization of $7 million substantially from changes in accruals forIowa regulatory arrangements. Electric gross margins increased due to higher recoveries through bill riders and highertransmission revenue, partially offset by lower wholesale revenue from lower sales volumes and prices.
• Northern Powergrid's net income decreased $21 million largely due to $17 million of deferred income tax benefits reflectedin the third quarter of 2016 due to a 1% reduction in the United Kingdom corporate income tax rate, higher pensionexpense of $13 million and lower distribution revenue of $7 million, partially offset by $19 million of asset provisionsrecognized in the third quarter of 2016 at the CE Gas business. Distribution revenue decreased mainly due to lower tariffrates and units distributed.
• BHE Renewables' net income decreased $9 million mainly due to make-whole payments associated with the earlyredemptions of certain project debt.
• HomeServices' net income decreased $4 million primarily due to lower earnings from brokerage and mortgage businesses.
• BHE and Other net loss increased $9 million primarily due to lower federal income tax credits recognized on a consolidatedbasis, higher consolidated deferred state income tax expense due to an increase in the Illinois enacted tax rate andunfavorable results of $8 million at MidAmerican Energy Services, LLC, partially offset by lower other operating costs.
Net income attributable to BHE shareholders increased $136 million for the first nine months of 2017 compared to 2016 due tothe following:
• PacifiCorp's net income increased $22 million primarily due to higher gross margins of $71 million, excluding the impactof demand side management program revenue (offset in operating expense), partially offset by higher depreciation andamortization of $22 million from additional plant placed in-service and higher property and other taxes. Gross marginsincreased due to higher retail customer volumes, lower natural gas-fueled generation, higher wholesale revenue fromhigher short-term market prices and volumes and higher wheeling revenue, partially offset by higher purchased electricitycosts and lower average retail rates. Retail customer volumes increased 2.4% due to impacts of weather primarily onresidential customers in Oregon, Washington and Utah, higher commercial usage primarily in Utah and Oregon, anincrease in the average number of residential and commercial customers primarily in Utah and Oregon and higher industrialusage in the eastern service territory, partially offset by lower residential usage across the service territory, lower industrialusage in Oregon and lower irrigation usage primarily in Oregon and Idaho.
• MidAmerican Funding's net income increased $98 million primarily due to higher recognized production tax credits of$71 million due to higher generation from wind-powered facilities placed in-service in the second half of 2016 and higherelectric gross margins of $60 million, excluding the impact of demand side management program revenue (offset inoperating expense), partially offset by higher depreciation and amortization of $31 million, primarily due to accruals forIowa regulatory arrangements and the increase in wind-powered generating facilities, and higher operating expenses.Electric gross margins increased due to higher wholesale revenue from higher sales volumes and prices, higher recoveriesthrough bill riders, higher retail customer volumes and higher transmission revenue, partially offset by higher coal-fueledgeneration and purchased power costs. Retail customer volumes increased 1.5% due to industrial growth net of lowerresidential and commercial volumes from milder temperatures.
• NV Energy's net income increased $28 million for the first nine months of 2017 compared to 2016 primarily due to higherelectric gross margins of $25 million, excluding the impact of energy efficiency program revenue (offset in operatingexpense), and lower interest expense of $17 million on lower deferred charges and from lower rates on outstanding debtbalances. Electric gross margins increased due to higher customer usage from the impacts of weather, an increase in theaverage number of customers, customer usage patterns and an increase in transmission revenues.
• Northern Powergrid's net income decreased $54 million largely due to the stronger United States dollar of $19 million,higher pension expense of $21 million, lower distribution revenue of $17 million and $17 million of deferred income taxbenefits reflected in the third quarter of 2016 due to a 1% reduction in the United Kingdom corporate income tax rate,partially offset by $19 million of asset provisions recognized in the third quarter of 2016 at the CE Gas business.Distribution revenue decreased due to lower units distributed, the recovery in 2016 of the December 2013 customer rebateand unfavorable movements in regulatory provisions, partially offset by higher tariff rates.
• BHE Pipeline Group’s net income increased $8 million due to a reduction in expenses and regulatory liabilities relatedto the impact of an alternative rate structure approved by the FERC at Kern River and higher transportation revenues atNorthern Natural Gas, partially offset by lower transportation revenues at Kern River and higher operating expenses atNorthern Natural Gas.
31

• BHE Transmission's net income decreased $2 million from lower earnings at BHE U.S. Transmission of $4 million fromlower equity earnings at Electric Transmission Texas, LLC due to the impacts of new rates effective in March 2017,partially offset by higher earnings at AltaLink of $2 million primarily due to the impacts of additional assets placed in-service partially offset by lower recoveries and decreases in contingent liabilities.
• BHE Renewables' net income increased $52 million mainly due to favorable earnings from tax equity investments reachingcommercial operation, additional wind and solar capacity placed in-service, higher generation at the Solar Star projectsdue to transformer related forced outages in 2016 and higher production at the Casecnan project due to higher rainfall,partially offset by make-whole payments associated with the early redemptions of certain project debt.
• HomeServices' net income increased $2 million primarily due to higher earnings at franchise businesses, partially offsetby lower earnings at brokerage and mortgage businesses.
• BHE and Other net loss increased $18 million primarily due to lower federal income tax credits recognized on aconsolidated basis, higher consolidated deferred state income tax expense due to an increase in the Illinois enacted taxrate and unfavorable results of $8 million at MidAmerican Energy Services, LLC, partially offset by lower interest expensedue to redemptions of junior subordinated debentures and lower consolidated deferred state income tax expense due tochanges in the tax status of certain subsidiaries.
Reportable Segment Results
Operating revenue and operating income for the Company's reportable segments are summarized as follows (in millions):
Third Quarter First Nine Months2017 2016 Change 2017 2016 Change
Operating revenue:PacifiCorp $ 1,430 $ 1,434 $ (4) — % $ 3,956 $ 3,919 $ 37 1%MidAmerican Funding 815 797 18 2 2,170 2,008 162 8NV Energy 1,047 987 60 6 2,384 2,309 75 3Northern Powergrid 221 220 1 — 685 748 (63) (8)BHE Pipeline Group 193 201 (8) (4) 700 704 (4) (1)BHE Transmission 182 169 13 8 506 309 197 64BHE Renewables 283 273 10 4 647 582 65 11HomeServices 961 820 141 17 2,502 2,152 350 16BHE and Other 151 191 (40) (21) 453 523 (70) (13)
Total operating revenue $ 5,283 $ 5,092 $ 191 4 $14,003 $13,254 $ 749 6
Operating income:PacifiCorp $ 467 $ 445 $ 22 5% $ 1,150 $ 1,108 $ 42 4%MidAmerican Funding 288 284 4 1 531 524 7 1NV Energy 393 394 (1) — 682 656 26 4Northern Powergrid 81 90 (9) (10) 308 373 (65) (17)BHE Pipeline Group 65 68 (3) (4) 328 320 8 3BHE Transmission 86 81 5 6 236 35 201 *BHE Renewables 157 157 — — 256 233 23 10HomeServices 79 87 (8) (9) 191 179 12 7BHE and Other 8 (21) 29 * (38) (36) (2) (6)
Total operating income $ 1,624 $ 1,585 $ 39 2 $ 3,644 $ 3,392 $ 252 7
* Not meaningful
32

PacifiCorp
Operating revenue decreased $4 million for the third quarter of 2017 compared to 2016 due to lower retail revenue of $8 million,partially offset by higher wholesale and other revenue of $4 million. Retail revenue decreased due to lower average rates and lowerdemand side management program revenue (offset in operating expense), primarily driven by the establishment of the UtahSustainable Transportation and Energy Plan program, partially offset by higher customer volumes. Retail customer volumesincreased 2.1% due to impacts of weather on residential customers, primarily in Utah and Oregon, higher commercial usageprimarily in Oregon and Utah, and an increase in the average number of residential and commercial customers in Utah, partiallyoffset by lower irrigation usage in Idaho and Oregon, and lower industrial usage in Utah and Oregon. Wholesale and other revenueincreased due to higher wheeling and REC revenues, partially offset by lower wholesale sales volumes.
Operating income increased $22 million for the third quarter of 2017 compared to 2016 due to lower operating expenses of $23million, higher gross margins of $9 million, partially offset by higher depreciation and amortization of $7 million from additionalplant placed in-service. Operating expenses decreased due to a decrease in demand side management program expense (offset inoperating revenue) of $21 million and lower pension expense. Gross margins increased due to higher net deferrals of incurred netpower costs in accordance with established adjustment mechanisms, lower coal costs and lower natural gas-fueled generation,partially offset by higher purchased electricity costs from higher prices and volumes.
Operating revenue increased $37 million for the first nine months of 2017 compared to 2016 due to higher wholesale and otherrevenue of $31 million and higher retail revenue of $6 million. Wholesale and other revenue increased due to higher wholesalerevenue from higher short-term market prices and sales volumes and higher wheeling and REC revenues. Retail revenue increaseddue to higher customer volumes, partially offset by lower average rates and lower demand side management program revenue(offset in operating expense), primarily driven by the establishment of the Utah Sustainable Transportation and Energy Planprogram. Retail customer volumes increased 2.4% due to impacts of weather, primarily on residential customers in Oregon,Washington and Utah, higher commercial usage primarily in Utah and Oregon, an increase in the average number of residentialand commercial customers, primarily in Utah and Oregon, and higher industrial usage in the eastern service territory, partiallyoffset by lower residential usage across the service territory, lower industrial usage in Oregon and lower irrigation usage primarilyin Oregon and Idaho.
Operating income increased $42 million for the first nine months of 2017 compared to 2016 due to lower operating expenses of$45 million and higher gross margins of $26 million, partially offset by higher depreciation and amortization of $22 million fromadditional plant placed in-service and higher property taxes. Operating expenses decreased due to a decrease in demand sidemanagement program expense (offset in operating revenue) of $44 million and lower pension expense, partially offset by higherinjury and damage expenses, primarily due to a prior year accrual for insurance proceeds and current year settlements, and higherlabor costs related to storm damage restoration. Gross margins were higher due to the increase in operating revenue, higher netdeferrals of incurred net power costs in accordance with established adjustment mechanisms, lower natural gas-fueled generationand lower coal costs, partially offset by higher purchased electricity costs from higher volumes and prices.
MidAmerican Funding
Operating revenue increased $18 million for the third quarter of 2017 compared to 2016 primarily due to higher electric operatingrevenue of $15 million from higher retail revenue of $29 million and lower wholesale and other revenue of $14 million. Electricretail revenue increased $38 million from higher recoveries through bill riders (substantially offset in cost of sales, operatingexpense and income tax expense) and $5 million from non-weather usage and rate factors, including higher industrial sales volumes,partially offset by $14 million from the impact of milder temperatures in 2017. Electric retail customer volumes increased 0.4%from industrial growth, partially offset by the unfavorable impact of temperatures. Electric wholesale and other revenue decreaseddue to lower wholesale volumes of $14 million and lower wholesale prices of $6 million, partially offset by higher transmissionrevenue of $6 million.
Operating income increased $4 million for the third quarter of 2017 compared to 2016 due to higher electric gross margins of$15 million due to the increase in operating revenue and lower depreciation and amortization of $7 million, partially offset byhigher operating expenses. The decrease in depreciation and amortization reflects lower accruals for Iowa regulatory arrangementsand a reduction of $9 million from lower depreciation rates implemented in December 2016, partially offset by wind generationand other plant placed in-service. Operating expenses increased primarily due to higher demand side management program expense(offset in operating revenue) of $8 million and higher generation maintenance costs.
33

Operating revenue increased $162 million for the first nine months of 2017 compared to 2016 due to higher electric operatingrevenue of $105 million and higher natural gas operating revenue of $55 million. Electric operating revenue increased due tohigher wholesale and other revenue of $53 million and higher retail revenue of $52 million. Electric wholesale and other revenueincreased due primarily to higher wholesale volumes of $34 million, higher transmission revenue of $11 million and higherwholesale prices of $6 million. Electric retail revenue increased $47 million from higher recoveries through bill riders (substantiallyoffset in cost of sales, operating expense and income tax expense) and $33 million from non-weather usage and rate factors,including higher industrial sales volumes, partially offset by $28 million from the impact of milder temperatures in 2017. Electricretail customer volumes increased 1.5% from industrial growth, partially offset by the unfavorable impact of temperatures. Naturalgas operating revenue increased due to a higher average per-unit cost of gas sold of $59 million (offset in cost of sales), higherdemand side management program revenue (offset in operating expense) of $3 million and 1.7% higher wholesale sales volumes,partially offset by 6.2% lower retail sales volumes.
Operating income increased $7 million for the first nine months of 2017 compared to 2016 due to higher electric gross marginsof $75 million and higher natural gas gross margins of $3 million, partially offset by higher depreciation and amortization of$31 million, higher property and other taxes of $6 million and higher operating expenses. Electric gross margins were higher dueto the increase in operating revenue, partially offset by higher coal-fueled generation and higher purchased power costs. Theincrease in depreciation and amortization reflects wind generation and other plant placed in-service and higher accruals for Iowaregulatory arrangements, partially offset by a reduction of $26 million from lower depreciation rates implemented in December2016. Operating expenses increased primarily due to higher demand side management program expense (offset in operatingrevenue) of $17 million and higher generation maintenance costs.
NV Energy
Operating revenue increased $60 million for the third quarter of 2017 compared to 2016 due to higher electric operating revenueprimarily due to higher retail revenue of $58 million and higher transmission revenue of $4 million. Electric retail revenue increaseddue to $115 million from higher rates primarily from energy costs (offset in cost of sales), $25 million from higher distributiononly service revenue and impact fees received due to customers purchasing energy from alternative providers and becomingdistribution only service customers, $5 million from an increase in the average number of customers and $4 million higher customerusage mainly from the impacts of weather, partially offset by $73 million from lower commercial and industrial revenue, mainlyfrom customers purchasing energy from alternative providers, $10 million of lower energy efficiency program revenue (offset inoperating expense) and $9 million from a refinement of the unbilled revenue estimate. Electric retail customer volumes, includingdistribution only service customers, increased 3.8% compared to 2016.
Operating income decreased $1 million for the third quarter of 2017 compared to 2016 due to lower electric gross margins of$9 million offset by lower operating expenses of $8 million primarily due to lower energy efficiency program expense (offset inelectric operating revenue). Electric gross margins were lower due to higher energy costs of $69 million primarily due to lowernet deferred power costs, partially offset by the increase in electric operating revenue.
Operating revenue increased $75 million for the first nine months of 2017 compared to 2016 due to higher electric operatingrevenue of $89 million, partially offset by lower natural gas operating revenue of $15 million. Electric operating revenue increaseddue to higher retail revenue of $81 million and higher transmission revenue of $9 million. Electric retail revenue increased dueto $130 million from higher rates primarily from energy costs (offset in cost of sales), $36 million from higher distribution onlyservice revenue and impact fees received due to customers purchasing energy from alternative providers and becoming distributiononly service customers, $18 million from an increase in the average number customers and $11 million higher customer usagemainly from the impacts of weather, partially offset by $93 million from lower commercial and industrial revenue, mainly fromcustomers purchasing energy from alternative providers, and $23 million of lower energy efficiency program revenue (offset inoperating expense). Electric retail customer volumes, including distribution only service customers, increased 2.4% compared to2016. Natural gas operating revenue decreased due to lower energy rates, partially offset by higher customer usage.
Operating income increased $26 million for the first nine months of 2017 compared to 2016 due to lower operating expenses of$23 million primarily due to lower energy efficiency program expense (offset in electric operating revenue) and higher electricgross margins of $2 million. Electric gross margins were higher due to the increase in electric operating revenue, partially offsetby higher energy costs of $87 million. Energy costs increased due to a higher average cost of fuel for generation of $62 million,lower net deferred power costs of $23 million and higher purchased power costs of $3 million.
34

Northern Powergrid
Operating revenue increased $1 million for the third quarter of 2017 compared to 2016 due to lower distribution revenue of$7 million, partially offset by higher smart metering revenue of $6 million. Distribution revenue decreased mainly due to lowertariff rates of $4 million and lower units distributed of $2 million. Operating income decreased $9 million for the third quarter of2017 compared to 2016 due to higher pension expense of $13 million, mainly due to a settlement loss recognized in the thirdquarter as a result of the level of lump sum plan withdrawals, higher depreciation of $7 million from additional assets placed in-service and higher distribution costs of $4 million, partially offset by $19 million of asset provisions recognized in the third quarterof 2016 at the CE Gas business.
Operating revenue decreased $63 million for the first nine months of 2017 compared to 2016 due to the stronger United Statesdollar of $66 million and lower distribution revenue of $17 million, partially offset by higher smart metering revenue of $18 million.Distribution revenue decreased due to lower units distributed of $14 million, the recovery in 2016 of the December 2013 customerrebate of $11 million and unfavorable movements in regulatory provisions of $5 million, partially offset by higher tariff rates of$11 million. Operating income decreased $65 million for the first nine months of 2017 compared to 2016 due to the strongerUnited States dollar of $33 million, higher pension expense of $23 million, mainly due to the 2017 settlement loss recognized,higher depreciation of $21 million from additional assets placed in service and higher distribution costs of $7 million, partiallyoffset by $19 million of asset provisions recognized in the third quarter of 2016 at the CE Gas business.
BHE Pipeline Group
Operating revenue decreased $8 million for the third quarter of 2017 compared to 2016 due to lower transportation revenues atKern River, partially offset by higher transportation revenues at Northern Natural Gas. Operating income decreased $3 millionfor the third quarter of 2017 compared to 2016 primarily due to lower transportation revenues at Kern River and higher operatingexpenses at Northern Natural Gas, partially offset by lower depreciation expense and higher transportation revenues at NorthernNatural Gas.
Operating revenue decreased $4 million for the first nine months of 2017 compared to 2016 due lower transportation revenues atKern River, partially offset by higher gas sales of $15 million related to system balancing activities (largely offset in cost of sales)and higher transportation revenues at Northern Natural Gas. Operating income increased $8 million for the first nine months of2017 compared to 2016 primarily due to a reduction in expenses and regulatory liabilities related to the impact of an alternativerate structure approved by the FERC at Kern River and higher transportation revenues at Northern Natural Gas, partially offsetby higher operating expenses at Northern Natural Gas and lower transportation revenues at Kern River.
BHE Transmission
Operating revenue increased $13 million for the third quarter of 2017 compared to 2016 primarily due to the weaker United Statesdollar of $7 million and higher costs recovered in operating revenue. Operating income increased $5 million for the third quarterof 2017 compared to 2016 primarily due to the weaker United States dollar of $4 million.
Operating revenue increased $197 million for the first nine months of 2017 compared to 2016 primarily due to a one-time reductionof $200 million from the 2015-2016 GTA decision received in May 2016 at AltaLink, $10 million from additional assets placedin service and the weaker United States dollar of $9 million, partially offset by lower costs recovered in operating revenue. Operatingincome increased $201 million for the first nine months of 2017 compared to 2016 primarily due to the higher operating revenuefrom the 2015-2016 GTA decision that required AltaLink to refund $200 million to customers in 2016 through reduced monthlybillings for the change from receiving cash during construction for the return on construction work-in-progress in rate base torecording allowance for borrowed and equity funds used during construction related to construction expenditures during the 2011to 2014 time period. The refund was offset with higher capitalized interest and allowance for equity funds. Operating income wasalso favorably impacted $6 million by the weaker United States dollar.
BHE Renewables
Operating revenue increased $10 million for the third quarter of 2017 compared to 2016 due to additional wind and solar capacityplaced in-service of $17 million, partially offset by lower geothermal revenues of $6 million due to unfavorable pricing and lowercapacity revenues. Operating income was unchanged for the third quarter of 2017 compared to 2016 as higher costs associatedwith the additional capacity placed in-service offset the increased revenues.
35

Operating revenue increased $65 million for the first nine months of 2017 compared to 2016 due to additional wind and solarcapacity placed in-service of $45 million, higher generation at the Solar Star projects of $29 million due to transformer relatedforced outages in 2016 and higher production at the Casecnan project of $10 million due to higher rainfall, partially offset bylower generation at the Topaz project of $11 million mainly due to a scheduled maintenance outage and lower generation of$7 million at the existing wind projects due to a lower wind resource. Operating income increased $23 million for the first ninemonths of 2017 compared to 2016 due to the increase in operating revenue, partially offset by higher operating expense of$24 million and higher depreciation and amortization of $17 million, each primarily due to the additional wind and solar capacityplaced in-service. Operating expense also increased from the scope and timing of maintenance at certain geothermal plants. Thechange in depreciation and amortization reflects a reduction of $6 million from the extension of the useful life of certain wind-generating facilities from 25 years to 30 years effective January 2017.
HomeServices
Operating revenue increased $141 million for the third quarter of 2017 compared to 2016 due to an increase from acquiredbusinesses totaling $139 million. Operating income decreased $8 million for the third quarter of 2017 compared to 2016 primarilydue to lower earnings from brokerage businesses, mainly due to higher operating expenses, and lower mortgage revenue.
Operating revenue increased $350 million for the first nine months of 2017 compared to 2016 primarily due to an increase fromacquired businesses totaling $279 million and a 3.8% increase in average home sales prices for existing businesses. Operatingincome increased $12 million for the first nine months of 2017 compared to 2016 primarily due to higher earnings from franchisebusinesses, mainly due to a favorable settlement and a gain on the collection of notes receivable, partially offset by lower earningsfrom brokerage businesses, mainly due to higher operating expenses, and lower mortgage revenue.
BHE and Other
Operating revenue decreased $40 million for the third quarter of 2017 compared to 2016 due to lower electricity and natural gasvolumes and rates at MidAmerican Energy Services, LLC. Operating income improved $29 million for the third quarter of 2017compared to 2016 due to lower operating expenses, partially offset by lower margins of $8 million at MidAmerican EnergyServices, LLC.
Operating revenue decreased $70 million for the first nine months of 2017 compared to 2016 due to lower electricity and naturalgas volumes and rates at MidAmerican Energy Services, LLC. Operating loss increased $2 million for the first nine months of2017 compared to 2016 due to lower margins of $9 million at MidAmerican Energy Services, LLC, partially offset by loweroperating expenses.
Consolidated Other Income and Expense Items
Interest Expense
Interest expense is summarized as follows (in millions):
Third Quarter First Nine Months2017 2016 Change 2017 2016 Change
Subsidiary debt $ 354 $ 345 $ 9 3% $ 1,045 $ 1,042 $ 3 —%BHE senior debt and other 106 101 5 5 317 305 12 4BHE junior subordinated debentures 4 14 (10) (71) 17 54 (37) (69)
Total interest expense $ 464 $ 460 $ 4 1 $ 1,379 $ 1,401 $ (22) (2)
Interest expense increased $4 million for the third quarter of 2017 compared to 2016 and decreased $22 million for the first ninemonths of 2017 compared to 2016 due to repayments of BHE junior subordinated debentures of $944 million in 2017 and$2.0 billion in 2016, scheduled maturities and principal payments, early redemptions and the impact of foreign currency exchangerate movements of $8 million in the first nine months, partially offset by debt issuances at MidAmerican Funding, NorthernPowergrid, AltaLink and BHE Renewables.
36

Capitalized Interest
Capitalized interest decreased $94 million for the first nine months of 2017 compared to 2016 primarily due to $96 million recordedin the second quarter of 2016 from the 2015-2016 GTA decision received in May 2016 at AltaLink, which was offset in operatingrevenue, partially offset by higher construction work-in-progress balances at MidAmerican Energy.
Allowance for Equity Funds
Allowance for equity funds increased $7 million for the third quarter of 2017 compared to 2016 and decreased $88 million forthe first nine months of 2017 compared to 2016 primarily due to $104 million recorded in the second quarter of 2016 from the2015-2016 GTA decision received in May 2016 at AltaLink, which was offset in operating revenue, partially offset by higherconstruction work-in-progress balances at MidAmerican Energy.
Interest and Dividend Income
Interest and dividend income decreased $7 million for the third quarter of 2017 compared to 2016 and $8 million for the first ninemonths of 2017 compared to 2016 primarily due to lower dividends received from BYD Company Limited.
Other, net
Other, net decreased $13 million for the third quarter of 2017 compared to 2016 primarily due to costs associated with the earlyredemption of subsidiary long-term debt in 2017.
Other, net decreased $2 million for the first nine months of 2017 compared to 2016 mainly due to costs associated with the earlyredemption of subsidiary long-term debt in 2017 and an impairment of certain energy management assets at MidAmerican EnergyServices, LLC, partially offset by higher investment returns and favorable changes in the valuations of interest rate swap derivatives.
Income Tax Expense
Income tax expense decreased $15 million for the third quarter of 2017 compared to 2016 and the effective tax rate was 15% for2017 and 16% for 2016. The effective tax rate decreased due to higher production tax credits recognized of $34 million and thefavorable impacts of rate making of $10 million, partially offset by deferred income tax benefits of $16 million reflected in thethird quarter of 2016 due to a 1% reduction in the United Kingdom corporate income tax rate.
Income tax expense decreased $75 million for the first nine months of 2017 compared to 2016 and the effective tax rate was 13%for 2017 and 17% for 2016. The effective tax rate decreased due to higher production tax credits recognized of $96 million andthe favorable impacts of rate making of $14 million, partially offset by higher income tax expense on higher pre-tax income anddeferred income tax benefits of $16 million reflected in the third quarter of 2016 due to a 1% reduction in the United Kingdomcorporate income tax rate.
Production tax credits are recognized in earnings for interim periods based on the application of an estimated annual effective taxrate to pretax earnings. Federal renewable electricity production tax credits are earned as energy from qualifying wind-poweredgenerating facilities is produced and sold based on a per-kilowatt rate pursuant to the applicable federal income tax law and areeligible for the credit for 10 years from the date the qualifying generating facilities are placed in-service. Production tax creditsrecognized in 2017 were $432 million, or $96 million higher than 2016, while production tax credits earned in 2017 were$346 million, or $79 million higher than 2016. The difference between production tax credits recognized and earned of $86 millionas of September 30, 2017, primarily at MidAmerican Energy, will be reflected in earnings over the remainder of 2017.
Equity Income
Equity income decreased $6 million for the third quarter of 2017 compared to 2016 and $16 million for the first nine months of2017 compared to 2016 due to lower pre-tax equity earnings from tax equity investments at BHE Renewables and lower equityearnings at Electric Transmission Texas, LLC, primarily due to the impacts of new rates effective in March 2017.
Net Income Attributable to Noncontrolling Interests
Net income attributable to noncontrolling interests increased $5 million for the first nine months of 2017 compared to 2016 dueto higher earnings at HomeServices' franchise business.
37

Liquidity and Capital Resources
Each of BHE's direct and indirect subsidiaries is organized as a legal entity separate and apart from BHE and its other subsidiaries.It should not be assumed that the assets of any subsidiary will be available to satisfy BHE's obligations or the obligations of itsother subsidiaries. However, unrestricted cash or other assets that are available for distribution may, subject to applicable law,regulatory commitments and the terms of financing and ring-fencing arrangements for such parties, be advanced, loaned, paid asdividends or otherwise distributed or contributed to BHE or affiliates thereof. The Company's long-term debt may include provisionsthat allow BHE or its subsidiaries to redeem such debt in whole or in part at any time. These provisions generally include make-whole premiums. Refer to Note 17 of Notes to Consolidated Financial Statements in Item 8 of the Company's Annual Report onForm 10-K for the year ended December 31, 2016 for further discussion regarding the limitation of distributions from BHE'ssubsidiaries.
As of September 30, 2017, the Company's total net liquidity was as follows (in millions):
MidAmerican NV NorthernBHE PacifiCorp Funding Energy Powergrid AltaLink Other Total
Cash and cashequivalents $ 75 $ 104 $ 512 $ 109 $ 62 $ 9 $ 271 $ 1,142
Credit facilities 3,000 1,000 909 650 201 1,062 1,660 8,482Less:
Short-term debt (1,405) — — — — (286) (802) (2,493)
Tax-exempt bondsupport and lettersof credit (7) (130) (220) (80) — (7) — (444)
Net credit facilities 1,588 870 689 570 201 769 858 5,545
Total net liquidity $ 1,663 $ 974 $ 1,201 $ 679 $ 263 $ 778 $ 1,129 $ 6,687Credit facilities:
Maturity dates2018,2020 2020 2018, 2020 2020 2020
2017, 2018,2021
2017, 2018,2022
Operating Activities
Net cash flows from operating activities for the nine-month periods ended September 30, 2017 and 2016 were $5.1 billion and$4.8 billion, respectively. The change was primarily due to improved operating results, changes in working capital and the paymentfor USA Power final judgment and post-judgment interest in the prior year, partially offset by a reduction in income tax receiptsand higher cash payments for interest.
In December 2015, the Protecting Americans from Tax Hikes Act of 2015 ("PATH") was signed into law, extending bonusdepreciation for qualifying property acquired and placed in-service before January 1, 2020 (bonus depreciation rates will be 50%in 2015-2017, 40% in 2018, and 30% in 2019), with an additional year for certain longer lived assets. Production tax credits wereextended and phased-out for wind power and other forms of non-solar renewable energy projects that begin construction beforethe end of 2019. Production tax credits are maintained at full value through 2016, at 80% of value in 2017, at 60% of value in2018, and 40% of value in 2019. Investment tax credits were extended and phased-down for solar projects that are under constructionbefore the end of 2021 (investment tax credit rates are 30% through 2019, 26% in 2020 and 22% in 2021; they revert to the statutoryrate of 10% thereafter). As a result of PATH, the Company's cash flows from operations are expected to benefit due to bonusdepreciation on qualifying assets placed in-service through 2019, production tax credits through 2029 and investment tax creditsearned on qualifying wind and solar projects through 2021, respectively.
The timing of the Company's income tax cash flows from period to period can be significantly affected by the estimated federalincome tax payment methods and assumptions used for each payment date.
38

Investing Activities
Net cash flows from investing activities for the nine-month periods ended September 30, 2017 and 2016 were $(4.4) billion and$(4.1) billion, respectively. The change was primarily due to higher cash paid for acquisitions of $1.0 billion, partially offset bylower capital expenditures of $342 million and lower funding of tax equity investments.
Financing Activities
Net cash flows from financing activities for the nine-month period ended September 30, 2017 was $(330) million. Uses of cashtotaled $2.3 billion and consisted mainly of repayments of BHE senior debt and junior subordinated debentures totaling $1.3 billionand repayments of subsidiary debt totaling $834 million. Sources of cash totaled $1.9 billion and consisted of $1.6 billion ofproceeds from subsidiary debt issuances and $365 million of net proceeds from short-term debt.
For a discussion of recent financing transactions, refer to Note 6 of Notes to Consolidated Financial Statements in Part I, Item 1of this Form 10-Q.
Net cash flows from financing activities for the nine-month period ended September 30, 2016 was $(792) million. Uses of cashtotaled $3.2 billion and consisted mainly of repayments of subsidiary debt totaling $1.6 billion and repayments of BHE juniorsubordinated debentures of $1.5 billion. Sources of cash totaled $2.4 billion and consisted of $1.5 billion of proceeds fromsubsidiary debt issuances and $887 million net proceeds from short-term debt.
The Company may from time to time seek to acquire its outstanding debt securities through cash purchases in the open market,privately negotiated transactions or otherwise. Any debt securities repurchased by the Company may be reissued or resold by theCompany from time to time and will depend on prevailing market conditions, the Company's liquidity requirements, contractualrestrictions and other factors. The amounts involved may be material.
Future Uses of Cash
The Company has available a variety of sources of liquidity and capital resources, both internal and external, including net cashflows from operating activities, public and private debt offerings, the issuance of commercial paper, the use of unsecured revolvingcredit facilities, the issuance of equity and other sources. These sources are expected to provide funds required for current operations,capital expenditures, acquisitions, investments, debt retirements and other capital requirements. The availability and terms underwhich BHE and each subsidiary has access to external financing depends on a variety of factors, including its credit ratings,investors' judgment of risk and conditions in the overall capital markets, including the condition of the utility industry and projectfinance markets, among other items.
Capital Expenditures
The Company has significant future capital requirements. Capital expenditure needs are reviewed regularly by management andmay change significantly as a result of these reviews, which may consider, among other factors, changes in environmental andother rules and regulations; impacts to customers' rates; outcomes of regulatory proceedings; changes in income tax laws; generalbusiness conditions; load projections; system reliability standards; the cost and efficiency of construction labor, equipment andmaterials; commodity prices; and the cost and availability of capital. Expenditures for certain assets may ultimately includeacquisitions of existing assets.
39

The Company's historical and forecast capital expenditures, each of which exclude amounts for non-cash equity AFUDC and othernon-cash items, are as follows (in millions):
Nine-Month Periods AnnualEnded September 30, Forecast
2016 2017 2017Capital expenditures by business:
PacifiCorp $ 586 $ 553 $ 798MidAmerican Funding 1,129 1,165 2,006NV Energy 386 333 433Northern Powergrid 435 434 616BHE Pipeline Group 150 174 309BHE Transmission 386 255 343BHE Renewables 430 239 315HomeServices 13 18 34BHE and Other 6 8 13
Total $ 3,521 $ 3,179 $ 4,867
Capital expenditures by type:Wind generation $ 1,110 $ 804 $ 1,292Solar generation 15 95 125Electric transmission 339 267 330Environmental 52 56 111Other growth 302 400 560Operating 1,703 1,557 2,449
Total $ 3,521 $ 3,179 $ 4,867
The Company's historical and forecast capital expenditures consisted mainly of the following:
• Wind generation includes the following:
◦ Construction of wind-powered generating facilities at MidAmerican Energy totaling $455 million and $732 millionfor the nine-month periods ended September 30, 2017 and 2016, respectively. MidAmerican Energy anticipates costsfor wind-powered generating facilities will total an additional $254 million for 2017. In August 2016, the IUB issuedan order approving ratemaking principles related to MidAmerican Energy's construction of up to 2,000 MW (nominalratings) of wind-powered generating facilities expected to be placed in-service in 2017 through 2019. The ratemakingprinciples establish a cost cap of $3.6 billion, including AFUDC, and a fixed rate of return on equity of 11.0% overthe proposed 40-year useful lives of those facilities in any future Iowa rate proceeding. The cost cap ensures that aslong as total costs are below the cap, the investment will be deemed prudent in any future Iowa rate proceeding.Additionally, the ratemaking principles modify the revenue sharing mechanism currently in effect. The revised sharingmechanism will be effective in 2018 and will be triggered each year by actual equity returns if they are above theweighted average return on equity for MidAmerican Energy calculated annually. Pursuant to the change in revenuesharing, MidAmerican Energy will share 100% of the revenue in excess of this trigger with customers. Such revenuesharing will reduce coal and nuclear generation rate base, which is intended to mitigate future base rate increases.Each of these projects is expected to qualify for 100% of production tax credits currently available.
◦ Repowering certain existing wind-powered generating facilities at PacifiCorp and MidAmerican Energy and theconstruction of new wind-powered generating facilities at PacifiCorp totaling $280 million for the nine-month periodended September 30, 2017. PacifiCorp and MidAmerican Energy anticipate costs for these activities will total anadditional $221 million for 2017. The repowering projects entail the replacement of significant components of olderturbines. The energy production from the repowered and the new facilities is expected to qualify for 100% of thefederal renewable electricity production tax credits available for ten years once the equipment is placed in-service.
40

◦ Construction of wind-powered generating facilities at BHE Renewables totaling $69 million and $378 million forthe nine-month periods ended September 30, 2017 and 2016, respectively. BHE Renewables anticipates costs forwind-powered generating facilities will total an additional $11 million in 2017 and $263 million in 2018. BHERenewables is developing and constructing up to 212 MW of wind-powered generating facilities in the state ofIllinois.
• Solar generation includes the construction of the community solar gardens project in Minnesota at BHE Renewablestotaling $92 million for the nine-month period ended September 30, 2017. BHE Renewables anticipates costs for thecommunity solar gardens project will total an additional $27 million in 2017 and $26 million in 2018.
• Electric transmission includes PacifiCorp's costs associated with main grid reinforcement and the Energy GatewayTransmission Expansion Program, MidAmerican Energy's Multi-Value Projects approved by the MidcontinentIndependent System Operator, Inc. for the construction of approximately 250 miles of 345 kV transmission line locatedin Iowa and Illinois and AltaLink's directly assigned projects from the AESO.
• Environmental includes the installation of new or the replacement of existing emissions control equipment at certaingenerating facilities at the Utilities, including installation or upgrade of selective catalytic reduction control systems andlow nitrogen oxide burners to reduce nitrogen oxides, particulate matter control systems, sulfur dioxide emissions controlsystems and mercury emissions control systems, as well as expenditures for the management of coal combustion residuals.
• Other growth includes projects to deliver power and services to new markets, new customer connections and enhancementsto existing customer connections.
• Operating includes ongoing distribution systems infrastructure needed at the Utilities and Northern Powergrid andinvestments in routine expenditures for generation, transmission, distribution and other infrastructure needed to serveexisting and expected demand.
Acquisitions
The Company completed various acquisitions totaling $1.1 billion for the nine-month period ended September 30, 2017. Thepurchase price for each acquisition was allocated to the assets acquired and liabilities assumed, which related primarily to residentialreal estate brokerage businesses, development and construction costs for the 110-megawatt Alamo 6 solar project and the 50-megawatt Pearl solar project, and the remaining 25% interest in the Silverhawk natural gas-fueled generation facility at NevadaPower. As a result of the acquisitions, the Company acquired assets of $1.1 billion, assumed liabilities of $476 million andrecognized goodwill of $522 million.
Integrated Resource Plan
In April 2017, PacifiCorp filed its 2017 Integrated Resource Plan ("IRP") with its state commissions. The IRP includes investmentsin renewable energy resources, upgrades to the existing wind fleet, and energy efficiency measures to meet future customer needs.Implementation of wind upgrades, new transmission, and new wind renewable resources will require an estimated $3 billion incapital investment from 2017 through 2020. PacifiCorp's forecast capital expenditures for 2018 through 2019 increased$723 million from the forecast included in BHE's 2016 Annual Report on Form 10-K as a result of its 2017 IRP.
Other Renewable Investments
The Company has invested in projects sponsored by third parties, commonly referred to as tax equity investments. Under the termsof these tax equity investments, the Company has entered into equity capital contribution agreements with the project sponsorsthat require contributions. The Company has made contributions of $170 million in 2015, $584 million in 2016 and $85 millionthrough September 30, 2017, and expects to contribute $317 million for the remainder of 2017 and $254 million in 2018 pursuantto these equity capital contribution agreements as the various projects achieve commercial operation. Once a project achievescommercial operation, the Company enters into a partnership agreement with the project sponsor that directs and allocates theoperating profits and tax benefits from the project.
Contractual Obligations
As of September 30, 2017, there have been no material changes outside the normal course of business in contractual obligationsfrom the information provided in Item 7 of the Company's Annual Report on Form 10-K for the year ended December 31, 2016other than the recent financing transactions and the renewable tax equity investments previously discussed.
41

Quad Cities Generating Station Operating Status
Exelon Generation Company, LLC ("Exelon Generation"), the operator of Quad Cities Generating Station Units 1 and 2 ("QuadCities Station") of which MidAmerican Energy has a 25% ownership interest, announced on June 2, 2016, its intention to shutdown Quad Cities Station on June 1, 2018, as a result of Illinois not passing adequate legislation and Quad Cities Station notclearing the 2019-2020 PJM Interconnection, L.L.C. capacity auction. MidAmerican Energy expressed to Exelon Generation itsdesire for the continued operation of the facility through the end of its operating license in 2032 and worked with Exelon Generationon solutions to that end. In December 2016, Illinois passed legislation creating a zero emission standard, which went into effectJune 1, 2017. The zero emission standard requires the Illinois Power Agency to purchase zero emission credits and recover thecosts from certain ratepayers in Illinois, subject to certain limitations. The proceeds from the zero emission credits will provideExelon Generation additional revenue through 2027 as an incentive for continued operation of Quad Cities Station. For the nuclearassets already in rate base, MidAmerican Energy's customers will not be charged for the subsidy, and MidAmerican Energy willnot receive additional revenue from the subsidy.
On February 14, 2017, two lawsuits were filed with the United States District Court for the Northern District of Illinois ("NorthernDistrict of Illinois") against the Illinois Power Agency alleging that the state’s zero emission credit program violates certainprovisions of the U.S. Constitution. Both complaints argue that the Illinois zero emission credit program will distort the FERC’senergy and capacity market auction system of setting wholesale prices. As majority owner and operator of Quad Cities Station,Exelon Generation intervened in both suits and filed motions to dismiss in both matters. On July 14, 2017, the Northern Districtof Illinois granted the motions to dismiss. On July 17, 2017, the plaintiffs filed appeals with the United States Court of Appealsfor the Seventh Circuit. The procedural schedule has been established for the appeals. MidAmerican Energy cannot predict theoutcome of these lawsuits.
On January 9, 2017, the Electric Power Supply Association filed two requests with the FERC seeking to expand Minimum PriceOffer Rule ("MOPR") provisions to apply to existing resources receiving zero emission credit compensation. If successful, anexpanded MOPR could result in an increased risk of Quad Cities Station not clearing in future capacity auctions and ExelonGeneration no longer receiving capacity revenues for the facility. As majority owner and operator of Quad Cities Station, ExelonGeneration has filed protests at the FERC in response to each filing. The timing of the FERC’s decision with respect to bothproceedings is currently unknown and the outcome of these matters is currently uncertain.
42
Regulatory Matters
BHE's regulated subsidiaries and certain affiliates are subject to comprehensive regulation. The discussion below contains materialdevelopments to those matters disclosed in Item 1 of each Registrant's Annual Report on Form 10-K for the year endedDecember 31, 2016, and new regulatory matters occurring in 2017.
PacifiCorp
In June 2017, PacifiCorp filed two applications each with the UPSC, IPUC and the WPSC for the Energy Vision 2020 project.The first application seeks approvals to construct or procure four new Wyoming wind resources with a total capacity of 860 MWsidentified as benchmark resources and certain transmission facilities. A request for proposals was issued in September 2017 seekingup to 1,270 MWs to compete against PacifiCorp's benchmark resources in the final resource selection process for the project.PacifiCorp estimates the combined wind and transmission projects will cost approximately $2 billion. The WPSC, UPSC, andIPUC have set procedural schedules with hearings to occur in the first quarter of 2018. The second application seeks approval ofPacifiCorp's resource decision to upgrade or "repower" existing wind resources, as prudent and in the public interest. PacifiCorpestimates the wind repowering project will cost approximately $1 billion. The hearings on repowering in Utah, Idaho and Wyomingwill occur in November 2017, December 2017, and January 2018, respectively. Applications filed in Utah, Idaho and Wyomingseek approval for the proposed ratemaking treatment associated with the projects.
Utah
In March 2017, PacifiCorp filed its annual Energy Balancing Account ("EBA") with the UPSC seeking approval to refund tocustomers $7 million in deferred net power costs for the period January 1, 2016 through December 31, 2016, reflecting thedifference between base and actual net power costs in the 2016 deferral period. In April 2017, PacifiCorp revised its recommendationand requested approval to refund an additional $7 million to customers resulting in an interim rate reduction of $14 million. Therate change became effective on an interim basis May 1, 2017.

In March 2017, PacifiCorp filed its annual REC balancing account application with the UPSC seeking to refund to customers$1 million for the period January 1, 2016 through December 31, 2016 for the difference in base and actual RECs. The rate changebecame effective on an interim basis June 1, 2017.
As a result of the Utah Sustainable Transportation and Energy Plan legislation that was signed into law in March 2016, PacifiCorpfiled an application in September 2016 seeking approval of a proposed five-year pilot program with an annual budget of $10 millionauthorized under the legislation to address clean-coal technology programs, commercial line extension programs, an electricvehicle incentive program and associated residential time of use rate pilot and other programs authorized in legislation. The UPSCissued orders approving PacifiCorp's application in phases in December 2016, May 2017 and June 2017.
In November 2016, PacifiCorp filed cost of service analyses, as ordered by the UPSC, to quantify the cost shifting due to netmetering. The UPSC ordered the analyses to comply with a 2014 law requiring the examination of whether the costs of net meteringexceed the benefits to PacifiCorp and other customers. The filing includes a proposal for a new rate schedule for residentialcustomer generators with a three-part rate based on the cost of serving this class of customer, which will mitigate future costshifting. PacifiCorp proposed that the new rate schedule only apply to new net metering customers that submit applications afterDecember 9, 2016. On December 9, 2016, PacifiCorp requested that the effective date for the start of a transitional tariff besuspended while it works with stakeholders on a collaborative process to resolve net metering rate design issues. The filing alsorequests an increase in the application fees for net metering. In February 2017, the UPSC ruled on motions to dismiss and requestsfor a show cause order for a regulatory rate review filed by various parties to the docket and denied the motions. On August 28, 2017,PacifiCorp filed a settlement stipulation in the net metering proceeding. The stipulation provides for the closure of the net meteringprogram to new entrants on November 15, 2017, with a transition to a new program that provides a separate compensation ratefor exported power. All net metering customers, including those with a submitted application, as of November 15, 2017, will begrandfathered into the current program until January 1, 2036. A new proceeding will be initiated to establish a methodology forthe determination of the export credit for new customers. During this period, a transition program for new customers will commenceNovember 15, 2017, for a limited number of customers. Beginning December 1, 2017, PacifiCorp will start accepting applicationsfor the new transition program for private generation customers. Residential and non-residential private generation customers willbe compensated for exported energy at 90% and 92.5% of the current average energy rates, respectively. The rates for the exportedenergy will be fixed through January 1, 2033 for these transition program customers. The new residential and non-residentialtransition program customers’ compensation will be only available for the first 170 MW and 70 MW, respectively. The stipulationalso includes an agreement to support a two-year extension on the state tax credit for residential solar installations. A hearing onthe stipulation was held on September 18, 2017, and an order approving it was issued September 29, 2017.
Oregon
In March 2017, PacifiCorp submitted its filing for the annual Transitional Adjustment Mechanism ("TAM") filing in Oregonrequesting an annual increase of $18 million, or an average price increase of 1.5%, based on forecasted net power costs and loadsfor calendar year 2018. Consistent with Oregon Senate Bill 1547, the filing includes an update of the impact of expiring productiontax credits, which accounts for $6 million of the total rate adjustment. The filing was updated in July to reflect changes in contractsand market conditions. The updated filing is requesting an annual increase of $8 million, or an average price increase of 0.6%.The filing will be updated for changes in contracts and market conditions again in November 2017, before final rates becomeeffective in January 2018.
Wyoming
In April 2017, PacifiCorp filed its annual Energy Cost Adjustment Mechanism ("ECAM") and REC and Sulfur Dioxide RevenueAdjustment Mechanism ("RRA") applications with the WPSC. The ECAM filing requests approval to refund to customers$5 million in deferred net power costs for the period January 1, 2016 through December 31, 2016, and the RRA application requestsapproval to refund to customers $1 million. In June 2017, the WPSC approved the ECAM and RRA rates on an interim basis untila final order is issued by the WPSC, which is expected in the first quarter of 2018.
Washington
In August 2017, PacifiCorp submitted a compliance filing to implement the second-year rate increase approved as part of the two-year rate plan in the 2015 regulatory rate review. The compliance filing included rates based on the $8 million, or 2.3%, increaseordered by the WUTC in September 2016. The compliance filing was approved by the WUTC on September 14, 2017, with rateseffective September 15, 2017.
43

Idaho
In January 2017, a $1 million, or 0.4%, decrease in base rates became effective as a result of a filing made with the IPUC to updatenet power costs in base rates in compliance with a prior rate plan stipulation.
In March 2017, PacifiCorp filed its annual ECAM application with the IPUC requesting recovery of $8 million for deferred costsin 2016. This filing includes recovery of the difference in actual net power costs to the base level in rates, an adder for recoveryof the Lake Side 2 resource, recovery of Deer Creek longwall mine investment and changes in production tax credits and renewableenergy credits. The IPUC approved the ECAM application with rates effective June 1, 2017.
California
In April 2017, PacifiCorp filed an application with the CPUC for an overall rate increase of 1.3% to recover $3 million of costsrecorded in the catastrophic events memorandum account over a two-year period effective April 1, 2018. The catastrophic eventsmemorandum account includes costs for implementing drought-related fire hazard mitigation measures and storm damage andrecovery efforts associated with the December 2016 and January 2017 winter storms.
In August 2017, PacifiCorp filed for a rate decrease of $1 million, or 1.1%, through its annual Energy Cost Adjustment Clause.If approved by the CPUC, the rates would be effective January 2018.
NV Energy (Nevada Power and Sierra Pacific)
Regulatory Rate Reviews
In June 2017, Nevada Power filed an electric regulatory rate review with the PUCN. The filing supported an annual revenueincrease of $29 million, or 2%, but requested no incremental annual revenue relief. The hearings are scheduled in the last quarterof 2017. The PUCN is expected to complete the hearings by the end of 2017, but the PUCN has not indicated when they will issuea final order or when that order would become effective.
In June 2016, Sierra Pacific filed an electric regulatory rate review with the PUCN. The filing requested no incremental annualrevenue relief. In October 2016, Sierra Pacific filed with the PUCN a settlement agreement resolving most, but not all, issues inthe proceeding and reduced Sierra Pacific's electric revenue requirement by $3 million spread evenly to all rate classes. In December2016, the PUCN approved the settlement agreement and established an additional six MW of net metering capacity under thegrandfathered rates, which are those net metering rates that were in effect prior to January 2016; the order establishes cost-basedrates and a value-based excess energy credit for customers who choose to install private generation after the six MW limitation isreached. The new rates were effective January 1, 2017. In January 2017, Sierra Pacific filed a petition for reconsideration relatingto the creation of the additional six MWs of net metering at the grandfathered rates. Sierra Pacific believes the effects of the PUCNdecision result in additional cost shifting to non-net metering customers and reduces the stipulated rate reduction for other customerclasses. In June 2017, the PUCN denied the petition for reconsideration.
In June 2016, Sierra Pacific filed a gas regulatory rate review with the PUCN. The filing requested a slight decrease in its incrementalannual revenue requirement. In October 2016, Sierra Pacific filed with the PUCN a settlement agreement resolving all issues inthe proceeding and reduced Sierra Pacific's gas revenue requirement by $2 million. In December 2016, the PUCN approved thesettlement agreement. The new rates were effective January 1, 2017.
Chapter 704B Applications
Chapter 704B of the Nevada Revised Statutes allows retail electric customers with an average annual load of one MW or more tofile with the PUCN an application to purchase energy from alternative providers of a new electric resource and become distributiononly service customers. On a case-by-case basis, the PUCN will assess the application and may deny or grant the applicationsubject to conditions, including paying an impact fee, paying on-going charges and receiving approval for specific alternativeenergy providers and terms. The impact fee and on-going charges are assessed to alleviate the burden on other Nevada customersfor the applicant's share of previously committed investments and long-term renewable contracts and are set at a level designedsuch that the remaining customers are not subjected to increased costs.
44

In May 2015, MGM Resorts International ("MGM") and Wynn Las Vegas, LLC ("Wynn"), filed applications with the PUCN topurchase energy from alternative providers of a new electric resource and become distribution only service customers of NevadaPower. In December 2015, the PUCN granted the applications subject to conditions, including paying an impact fee, on-goingcharges and receiving approval for specific alternative energy providers and terms. In December 2015, the applicants filed petitionsfor reconsideration. In January 2016, the PUCN granted reconsideration and updated some of the terms, including removing alimitation related to energy purchased indirectly from NV Energy. In September 2016, MGM and Wynn paid impact fees of$82 million and $15 million, respectively. In October 2016, MGM and Wynn became distribution only service customers andstarted procuring energy from another energy supplier. In April 2017, Wynn filed a motion with the PUCN seeking relief from theJanuary 2016 order and requested the PUCN adopt an alternative impact fee and revise on-going charges associated with retirementof assets and high cost renewable contracts. In May 2017, a stipulation reached between MGM, Regulatory Operations Staff andthe Bureau of Consumer Protection was filed requiring Nevada Power to credit $16 million as an offset against MGM's remainingimpact fee obligation and, in June 2017, the PUCN approved the stipulation as filed.
In September 2016, Switch, Ltd. ("Switch"), a customer of the Nevada Utilities, filed an application with the PUCN to purchaseenergy from alternative providers of a new electric resource and become a distribution only service customer of Nevada Powerand Sierra Pacific. In December 2016, the PUCN approved a stipulation agreement that allows Switch to purchase energy fromalternative providers subject to conditions, including paying an impact fee to Nevada Power. In May 2017, Switch paid impactfees of $27 million and, in June 2017, Switch became a distribution only service customer and started procuring energy fromanother energy supplier.
In November 2016, Caesars Enterprise Service ("Caesars"), a customer of the Nevada Utilities, filed an application with the PUCNto purchase energy from alternative providers of a new electric resource and become a distribution only service customer of NevadaPower and Sierra Pacific. In March 2017, the PUCN approved the application allowing Caesars to purchase energy from alternativeproviders subject to conditions, including paying an impact fee. In March 2017, Caesars provided notice that it intends to pay theimpact fee and proceed with purchasing energy from alternative providers. In July 2017, Caesars made the required compliancefilings and, in September 2017, the PUCN issued an order allowing Caesars to acquire electric energy and ancillary services fromanother energy supplier and become a distribution only service customer of the Nevada Utilities.
In May 2017, Peppermill Resort Spa Casino ("Peppermill"), a customer of Sierra Pacific, filed an application with the PUCN topurchase energy from alternative providers of a new electric resource and become a distribution only service customer of SierraPacific. In August 2017, the PUCN approved a stipulation allowing Peppermill to purchase energy from alternative providerssubject to conditions, including paying an impact fee. In September 2017, Peppermill provided notice that it intends to pay theimpact fee and proceed with purchasing energy from alternative providers.
Net Metering
Nevada enacted Senate Bill 374 ("SB 374") on June 5, 2015. The legislation required the Nevada Utilities to prepare cost-of-service studies and propose new rules and rates for customers who install distributed, renewable generating resources. In July 2015,the Nevada Utilities made filings in compliance with SB 374 and the PUCN issued final orders December 23, 2015.
The final orders issued by the PUCN establish separate rate classes for customers who install distributed, renewable generatingfacilities. The establishment of separate rate classes recognizes the unique characteristics, costs and services received by thesepartial requirements customers. The PUCN also established new, cost-based rates or prices for these new customer classes, includingincreases in the basic service charge and related reductions in energy charges. Finally, the PUCN established a separate value forcompensating customers who produce and deliver excess energy to the Nevada Utilities. The valuation will consider eleven factors,including alternatives available to the Nevada Utilities. The PUCN established a gradual, five-step process for transition over fouryears to the new, cost-based rates.
45

In January 2016, the PUCN denied requests to stay the order issued December 23, 2015. The PUCN also voted to reopen theevidentiary proceeding to address the application of new net metering rules for customers who applied for net metering servicebefore the issuance of the final order. In February 2016, the PUCN affirmed most of the provisions of the December 23, 2015order and adopted a twelve-year transition plan for changing rates for net metering customers to cost-based rates for utility servicesand value-based pricing for excess energy. Subsequently, two solar industry interest groups filed petitions for judicial review ofthe PUCN order issued in February 2016. The petitions request that the court either modify the PUCN order or direct the PUCNto modify its decision in a manner that would maintain rates and rules of service applicable to net metering as existed prior to theDecember 23, 2015 order of the PUCN. Two of the three petitions filed by the solar industry interest groups have been dismissed.In September 2016, the state district court issued an order in the third petition. The court concluded that the PUCN failed to provideexisting net metering customers adequate legal notice of the proceeding. The court affirmed the PUCN's decision to establish newnet energy metering rates and apply those to new net metering customers. The Nevada state district court decision was appealedto the Nevada Supreme Court.
In July 2016, the Nevada Utilities filed applications with the PUCN to revert back to the original net metering rates for a periodof twenty years for customers who installed or had an active application for distributed, renewable generating facilities as ofDecember 31, 2015. In September 2016, the PUCN issued an order accepting the stipulation and approved the applications asmodified by the stipulation. In December 2016, as a part of Sierra Pacific's regulatory rate review, the PUCN issued an orderestablishing an additional six MWs of net metering under the grandfathered rates in the Sierra Pacific service territory; the orderestablishes cost-based rates and a value-based excess energy credit for customers who choose to install private generation afterthe six MW limitation is reached. As mentioned above, Sierra Pacific filed a petition for reconsideration relating to the additionalsix MWs of net metering, which was denied in June 2017.
In March 2017, the Nevada Utilities filed a joint application with several solar companies to extend the period for eligible customersto opt into the grandfathered net metering rates. The PUCN voted to approve the application and gave qualifying customers untilJuly 2017 to make this election.
Nevada enacted Assembly Bill 405 ("AB 405") on June 15, 2017. The legislation, among other things, established net meteringcrediting rates for private generation customers with installed net metering systems less than 25 kilowatts. Under AB 405, privategeneration customers will be compensated at 95% of the rate the customer would have paid for a kilowatt-hour of electricitysupplied by the Nevada Utilities for the first 80 MWs of cumulative installed capacity of all net metering systems in Nevada, 88%of the rate the customer would have paid for a kilowatt-hour of electricity supplied by the Nevada Utilities for the next 80 MWsof cumulative installed capacity in Nevada, 81% of the rate the customer would have paid for a kilowatt-hour of electricity suppliedby the Nevada Utilities for the next 80 MWs of cumulative installed capacity in Nevada and 75% of the rate the customer wouldhave paid for a kilowatt-hour of electricity supplied by the Nevada Utilities for any additional private generation capacity. InJuly 2017, the Nevada Utilities filed with the PUCN proposed amendments to their tariffs necessary to comply with the provisionsof AB 405. The filing in July 2017 also included a proposed optional time of use rate tariff for both Nevada Power and SierraPacific, which has not yet been set for procedural review. In September 2017, the PUCN issued an order directing the NevadaUtilities to place all new private generation customers who have submitted applications after June 15, 2017, into a new rate classwith rates equal to the rate class they would be in if they were not private generation customers. Private generation customers withinstalled net metering systems less than 25 kilowatts prior to June 15, 2017, may elect to migrate to the new rate class createdunder AB 405 or stay in their otherwise-applicable rate class.
Energy Choice Initiative
In November 2016, a majority of Nevada voters supported a ballot measure to amend Article 1 of the Nevada Constitution. Ifapproved again in the general election of 2018, the proposed constitutional amendment would require the Nevada Legislature tocreate, on or before July 2023, an open and competitive retail electric market that includes provisions to reduce costs to customers,protect against service disconnections and unfair practices and prohibit the granting of monopolies and exclusive franchises forthe generation of electricity. The outcome of any customer choice initiative could have broad implications to the Nevada Utilities.The Governor issued an executive order establishing the Governor’s Committee on Energy Choice in which the Nevada Utilitieshave representation. The Nevada Utilities are engaged in the initiative process and with the Governor's Committee on EnergyChoice but cannot assess or predict the outcome of the potential constitutional amendment or the financial impact, if any, at thistime. The uncertainty created by the ballot initiative complicates both the short-term allocation of resources and long-term resourceplanning for the Nevada Utilities, including the ability to forecast load growth and the timing of resource additions. This uncertaintyin planning is evidenced by a recent decision the PUCN issued denying Nevada Power’s proposed purchase of the South PointEnergy Center, citing the unknown outcomes of the energy choice initiative as one of the factors considered in their decision.
46
ALP
General Tariff Applications
In November 2014, ALP filed a GTA requesting the AUC approve revenue requirements of C$811 million for 2015 and C$1.0 billionfor 2016, primarily due to continued investment in capital projects as directed by the AESO. ALP amended the GTA in June 2015and in October 2015. In May 2016, the AUC issued its decision pertaining to the 2015-2016 GTA. ALP filed its 2015-2016 GTAcompliance filing in July 2016 to comply with the AUC's decision and to provide customers with tariff relief through: (i) thediscontinuance of construction work-in-progress ("CWIP") in rate base and the return to AFUDC accounting effectiveJanuary 1, 2015, and (ii) the refund of previously collected CWIP in rate base as part of ALP's transmission tariffs during 2011-2014less related returns. In October 2016, ALP amended its 2015-2016 GTA compliance filing made in July 2016 to reflect the impactsof the generic cost of capital decision issued in October 2016.
In December 2016, the AUC issued its decision with respect to ALP’s 2015-2016 GTA compliance filing made in July 2016, asamended. The AUC found that ALP has either complied with or the AUC has otherwise relieved ALP from its compliance withall its directions in its decision except for Directive 47, which dealt with the determination of the refund for previously collectedCWIP-in-rate base and all related amounts. In January 2017, ALP filed its second compliance filing as directed by the AUC andrequested a technical conference to explain the technical aspects of the filing.
In March 2017, the technical conference was held, and all key aspects of ALP’s approach and methodologies used in its secondcompliance filing to comply with AUC directives were reviewed and discussed. In April 2017, ALP filed with the AUC anamendment to its second compliance filing asking to remove C$7 million of recapitalized AFUDC associated with canceled projectsthat were not capitalized to rate base, and to increase the amount of income tax refund related to previously collected CWIP-in-rate base by C$4 million. As a result of this amendment, ALP’s forecast transmission tariffs were reduced from C$679 million toC$675 million for 2016, and remained unchanged at C$599 million for 2015, compared to the January 2017 second compliancefiling, as amended.
During the second quarter 2017, ALP responded to information requests from the AUC with respect to its second compliancefiling amendment filed in April 2017. In August 2017, the AUC issued a decision with respect to ALP's second compliance filingamendment filed in April 2017. The AUC denied ALP's proposal to remove C$7 million of recapitalized AFUDC associated withcanceled projects on the basis that the amount would more appropriately be recovered through ALP's deferral account reconciliationprocess. In addition, the AUC reaffirmed ALP's 2016 refund of C$267 million of previously collected CWIP-in-rate base, alongwith C$45 million of cumulative return thereon. The AUC also directed the recalculation of the amount of related income taxesusing typical direct assigned project schedules filed in the general tariff applications, and to adjust its funded future income taxliability only for the change in timing differences.
In September 2017, ALP filed with the AUC its third compliance filing, which proposes a one-time payment to the AESO of C$7million to settle the 2015-2016 final transmission tariffs. Further direction or a final decision from the AUC is expected in thefourth quarter 2017. Once the AUC approves ALP’s third compliance filing, final transmission tariff rates for the 2015 and 2016test years will be set, subject to further adjustment through the deferral account reconciliation process.
ALP updated and refiled its 2017-2018 GTA in August 2016 to reflect the findings and conclusions of the AUC in its 2015-2016GTA decision issued in May 2016. In October 2016, ALP amended its 2017-2018 GTA to reflect the impacts of the generic costof capital decision issued in October 2016 and other updates and revisions. The amendment requests the AUC to approve ALP'srevenue requirement of C$891 million for 2017 and C$919 million for 2018. In November 2016, the AUC approved the 2017interim refundable transmission tariff at C$70 million per month effective January 2017. In December 2016, the AUC approvedALP's request to enter into a negotiated settlement process. In January 2017, the parties successfully reached a negotiated settlementon all aspects of ALP’s 2017-2018 GTA and in February 2017, ALP filed with the AUC the 2017-2018 negotiated settlementapplication for approval. The application consists of negotiated reductions of C$16 million of operating expenses and C$40 millionof transmission maintenance and information technology capital expenditures over the two years, as well as an increase tomiscellaneous revenue of C$3 million. These reductions resulted in a C$24 million, or 1.3%, net decrease to the two-year totalrevenue requirement applied for in ALP’s 2017-2018 GTA amendment filed in October 2016. In addition, ALP proposed to providesignificant tariff relief through the refund of previously collected accumulated depreciation surplus of C$130 million (C$125million net of other related impacts). The negotiated settlement agreement also provides for additional potential reductions overthe two years through a 50/50 cost savings sharing mechanism.
47

During the second quarter 2017, ALP responded to information requests from the AUC with respect to its 2017-2018 negotiatedsettlement agreement application filed in February 2017. In August 2017, the AUC issued a decision approving ALP's negotiatedsettlement agreement for the 2017-2018 GTA, as filed. Also, the AUC approved a C$31 million refund of accumulated depreciationsurplus as opposed to the C$130 million refund proposed in the original application. In November 2017, ALP filed a compliancefiling with the AUC to reflect the reduction of the accumulated depreciation surplus refund and related adjustments.
2018 Generic Cost of Capital Proceeding
In July 2017, the AUC denied the utilities’ request that the interim determinations of 8.5% return on equity and deemed capitalstructures for 2018 be made final, by stating that it is not prepared to finalize 2018 values in the absence of an evidentiary processand its intention to issue the generic cost of capital decision for 2018, 2019 and 2020 by the end of 2018 to reduce regulatory lag.The AUC also confirmed the process timelines with an oral hearing scheduled for March 2018.
Deferral Account Reconciliation Application
In April 2017, ALP filed its application with the AUC with respect to ALP’s 2014 projects and deferral accounts and specific 2015projects. The application includes approximately C$2.0 billion in net capital additions. In June 2017, the AUC ruled that the scopeof the deferral account proceeding would not be extended to consider the utilization of assets for which final cost approval issought. However, the AUC will initiate a separate proceeding to address the issue of transmission asset utilization and how thecorporate and property law principles applied in the Utility Asset Disposition ("UAD") decision may relate.
In June 2017, the AUC also suspended the process in order to address a conflict of interest issue related to the provision ofconfidential documents.
48
Environmental Laws and Regulations
Each Registrant is subject to federal, state, local and foreign laws and regulations regarding air and water quality, renewableportfolio standards, emissions performance standards, climate change, coal combustion byproduct disposal, hazardous and solidwaste disposal, protected species and other environmental matters that have the potential to impact each Registrant's current andfuture operations. In addition to imposing continuing compliance obligations, these laws and regulations provide regulators withthe authority to levy substantial penalties for noncompliance, including fines, injunctive relief and other sanctions. These lawsand regulations are administered by the EPA and various state, local and international agencies. Each Registrant believes it is inmaterial compliance with all applicable laws and regulations, although many laws and regulations are subject to interpretationthat may ultimately be resolved by the courts. Refer to "Liquidity and Capital Resources" of each respective Registrant in Part I,Item 2 of this Form 10-Q for discussion of each Registrant's forecast environmental-related capital expenditures. The discussionbelow contains material developments to those matters disclosed in Item 1 of each Registrant's Annual Report on Form 10-K forthe year ended December 31, 2016, and new environmental matters occurring in 2017.
Clean Air Act Regulations
The Clean Air Act is a federal law administered by the EPA that provides a framework for protecting and improving the nation'sair quality and controlling sources of air emissions. The implementation of new standards is generally outlined in SIPs, which area collection of regulations, programs and policies to be followed. SIPs vary by state and are subject to public hearings and EPAapproval. Some states may adopt additional or more stringent requirements than those implemented by the EPA. The major CleanAir Act programs most directly affecting the Registrants' operations are described below.
Regional Haze
The EPA's Regional Haze Rule, finalized in 1999, requires states to develop and implement plans to improve visibility in designatedfederally protected areas ("Class I areas"). Some of PacifiCorp's coal-fueled generating facilities in Utah, Wyoming, Arizona andColorado and certain of Nevada Power's and Sierra Pacific's fossil-fueled generating facilities are subject to the Clean Air VisibilityRules. In accordance with the federal requirements, states are required to submit SIPs that address emissions from sources subjectto best available retrofit technology ("BART") requirements and demonstrate progress towards achieving natural visibilityrequirements in Class I areas by 2064.
The state of Utah issued a regional haze SIP requiring the installation of sulfur dioxide, nitrogen oxides and particulate mattercontrols on Hunter Units 1 and 2, and Huntington Units 1 and 2. In December 2012, the EPA approved the sulfur dioxide portionof the Utah regional haze SIP and disapproved the nitrogen oxides and particulate matter portions. Certain groups appealed theEPA's approval of the sulfur dioxide portion and oral argument was heard before the United States Court of Appeals for the TenthCircuit ("Tenth Circuit") in March 2014. In October 2014, the Tenth Circuit upheld the EPA's approval of the sulfur dioxide portionof the SIP. The state of Utah and PacifiCorp filed petitions for administrative and judicial review of the EPA's final rule on theBART determinations for the nitrogen oxides and particulate matter portions of Utah's regional haze SIP in March 2013. InMay 2014, the Tenth Circuit dismissed the petition on jurisdictional grounds. In addition, and separate from the EPA's approvalprocess and related litigation, the Utah Division of Air Quality completed an alternative BART analysis for Hunter Units 1 and 2,and Huntington Units 1 and 2. The alternative BART analysis and revised regional haze SIP were submitted in June 2015 to theEPA for review and proposed action after a public comment period. The revised regional haze SIP included a state-enforceablerequirement to cease operation of the Carbon Facility by August 15, 2015. PacifiCorp retired the Carbon Facility in December 2015.In January 2016, the EPA published two alternative proposals to either approve the Utah SIP as written or reject the Utah SIPrelating to nitrogen oxides controls and require the installation of selective catalytic reduction ("SCR") controls at Hunter Units 1and 2 and Huntington Units 1 and 2 within five years. EPA's final action on the Utah regional haze SIP was effective August 4,2016. The EPA approved in part and disapproved in part the Utah regional haze SIP and issued a federal implementation plan("FIP") requiring the installation of SCR controls at Hunter Units 1 and 2 and Huntington Units 1 and 2 within five years of theeffective date of the rule. PacifiCorp and other parties have filed requests with the EPA to reconsider and stay that decision, andhave also filed motions for stay and petitions for review with the Tenth Circuit asking the court to overturn the EPA’s actions. InJune 2017, the state of Utah and PacifiCorp issued requests to the EPA to reconsider its decision in issuing the FIP. By letter datedJuly 14, 2017, from Administrator Scott Pruitt, the EPA indicated that based on existing and new evidence potentially relevant tothe EPA’s evaluation of Utah’s 2015 SIP, the agency would reconsider its final rule and prepare a notice of proposed rulemakingand take public comment on its proposed action. On July 18, 2017, the EPA filed with the Tenth Circuit a motion to hold thepending appeals in abeyance pending agency reconsideration of the final rule. The Tenth Circuit initially requested that all partiesfile a response setting forth their opposition or nonopposition to the EPA’s motion to hold the cases in abeyance by July 28, 2017.However, on July 18, 2017, PacifiCorp asked the Tenth Circuit to take judicial notice of the EPA’s request to hold the appeals inabeyance and reaffirmed its request to stay the FIP. The Tenth Circuit ordered all parties to respond to both the EPA's motion forabeyance and the motions by PacifiCorp and others to take judicial notice of EPA's reconsideration by August 4, 2017. OnSeptember 11, 2017, the Tenth Circuit issued an order granting both the motion to hold the case in abeyance and the motions forstay. The stay tolls the compliance requirements of the federal implementation plan for the number of days the stay is in effectwhile the EPA reconsiders the basis for the issuance of the federal plan.
The state of Arizona issued a regional haze SIP requiring, among other things, the installation of sulfur dioxide, nitrogen oxidesand particulate matter controls on Cholla Unit 4. The EPA approved in part, and disapproved in part, the Arizona SIP and issueda FIP for the disapproved portions requiring SCR controls on Cholla Unit 4. In January 2015, permit applications and studies weresubmitted to amend the Cholla Title V permit, and subsequently the Arizona SIP to convert Cholla Unit 4 to a natural gas-fueledunit in 2025; after notice and comment, the Arizona Department of Environmental Quality submitted the amended Arizona SIPto the EPA, which approved the amendments to the Arizona regional haze SIP with an effective date of April 26, 2017.
The Navajo Generating Station, in which Nevada Power is a joint owner with an 11.3% ownership share, is also a source that issubject to the regional haze BART requirements. In January 2013, the EPA announced a proposed FIP addressing BART and analternative for the Navajo Generating Station that includes a flexible timeline for reducing nitrogen oxides emissions. NevadaPower, along with the other owners of the facility, have been reviewing the EPA's proposal to determine its impact on the viabilityof the facility's future operations. The land lease for the Navajo Generating Station is subject to renewal in 2019. In the spring2017, the owners of the Navajo Generating Station voted to shut down and demolish the plant on or before December 23, 2019;however, the owners agreed to continue operating the plant through 2019 with demolition to follow if the tribe approved a newlease by July 1, 2017. Subsequently, the Navajo Council approved the requested lease extension June 26, 2017, and on July 1,2017, the Navajo Nation signed the replacement lease with the utility owners of the Navajo Generating Station. Two remainingowners, the U.S. Bureau of Reclamation and the City of Los Angeles, must approve the lease by December 1, 2017, to enablecontinued operations through 2019. The Navajo Nation, along with the U.S. Bureau of Reclamation and Peabody Energy havefurther indicated a desire to keep the plant and coal mine operating through at least 2030, which would require a new ownershipstructure for the facility. The utility owners have specified that a new ownership proposal must be put forward by October 1, 2017,in order to complete the transition prior to December 23, 2019. Nevada Power filed the Emissions Reduction and CapacityReplacement Plan in May 2014 that proposed to eliminate its ownership participation in the Navajo Generating Station in 2019,which was approved by the PUCN. Bids to sell the facility were due to Salt River Project on October 1, 2017; however, none weretendered by that date. The owners were subsequently informed that several interested parties are preparing bids which are expectedfor submittal and review in late October. Any potential new owner, along with the Navajo Nation has until November 1, 2017, toreach an agreement in principle and one year from that date to reach a new ownership agreement and lease. In light of the tighttime frames involved, it is expected that any bid received at this time will be highly conditioned.
49

Climate Change
In December 2015, an international agreement was negotiated by 195 nations to create a universal framework for coordinatedaction on climate change in what is referred to as the Paris Agreement. The Paris Agreement reaffirms the goal of limiting globaltemperature increase well below 2 degrees Celsius, while urging efforts to limit the increase to 1.5 degrees Celsius; establishescommitments by all parties to make nationally determined contributions and pursue domestic measures aimed at achieving thecommitments; commits all countries to submit emissions inventories and report regularly on their emissions and progress madein implementing and achieving their nationally determined commitments; and commits all countries to submit new commitmentsevery five years, with the expectation that the commitments will get more aggressive. In the context of the Paris Agreement, theUnited States agreed to reduce greenhouse gas emissions 26% to 28% by 2025 from 2005 levels. After more than 55 countriesrepresenting more than 55% of global greenhouse gas emissions submitted their ratification documents, the Paris Agreementbecame effective November 4, 2016. Under the terms of the Paris Agreement, ratifying countries are bound for a three-year periodand must provide one-year's notice of their intent to withdraw. The Clean Power Plan, which was finalized by the EPA in 2015and is currently under review, was the primary basis for the United States' commitment under the Paris Agreement. On June 1,2017, President Trump announced the United States would begin the four-year process of withdrawing from the Paris Agreement.
GHG Performance Standards
Under the Clean Air Act, the EPA may establish emissions standards that reflect the degree of emissions reductions achievablethrough the best technology that has been demonstrated, taking into consideration the cost of achieving those reductions and anynon-air quality health and environmental impact and energy requirements. On August 3, 2015, the EPA issued final new sourceperformance standards, establishing a standard of 1,000 pounds of carbon dioxide per MWh for large natural gas-fueled generatingfacilities and 1,400 pounds of carbon dioxide per MWh for new coal-fueled generating facilities with the "Best System of EmissionReduction" reflecting highly efficient supercritical pulverized coal facilities with partial carbon capture and sequestration orintegrated gasification combined-cycle units that are co-fired with natural gas or pre-combustion slipstream capture of carbondioxide. The new source performance standards have been appealed to the D.C. Circuit and oral argument was scheduled to beheard April 17, 2017; however, the court canceled the oral arguments March 30, 2017, and, on April 28, 2017, ordered that thecases be held in abeyance for 60 days, with supplemental briefs required to be filed May 15, 2017, regarding whether the casesshould be remanded to the EPA rather than held in abeyance. On August 10, 2017, the court placed the case in abeyance pendingfurther order of the court. Until such time as the court renders a final determination regarding the validity of the standards or theEPA rescinds the standards, any new fossil-fueled generating facilities constructed by the relevant Registrants will be required tomeet the GHG new source performance standards.
Clean Power Plan
In June 2014, the EPA released proposed regulations to address GHG emissions from existing fossil-fueled generating facilities,referred to as the Clean Power Plan, under Section 111(d) of the Clean Air Act. The EPA's proposal calculated state-specificemission rate targets to be achieved based on the "Best System of Emission Reduction." In August 2015, the final Clean PowerPlan was released, which established the Best System of Emission Reduction as including: (a) heat rate improvements; (b) increasedutilization of existing combined-cycle natural gas-fueled generating facilities; and (c) increased deployment of new and incrementalnon-carbon generation placed in-service after 2012. The EPA also changed the compliance period to begin in 2022, with threeinterim periods of compliance and with the final goal to be achieved by 2030. Based on changes to the state emission reductiontargets, which are now all between 771 pounds per MWh and 1,305 pounds per MWh, the Clean Power Plan, when fullyimplemented, is expected to reduce carbon dioxide emissions in the power sector to 32% below 2005 levels by 2030. On February 9,2016, the United States Supreme Court ordered that the EPA's emission guidelines for existing sources be stayed pending thedisposition of the challenges to the rule in the D.C. Circuit and any action on a writ of certiorari before the U.S. Supreme Court.Oral argument was heard before the full D.C. Circuit (with the exception of Chief Judge Merrick Garland) on September 27, 2016,and the court has not yet issued its decision. The case has been held in abeyance pending underlying action by the EPA. On October10, 2017, the EPA issued a proposal to repeal the Clean Power Plan and the public comment period closes on the proposal December15, 2017. EPA has not determined whether it will issue a replacement rule. Until such time as the EPA takes final action on therepeal and determines whether there will be a replacement rule, the impact of EPA’s actions on the Registrants cannot be determined.PacifiCorp, MidAmerican Energy, Nevada Power and Sierra Pacific have historically pursued cost-effective projects, includingplant efficiency improvements, increased diversification of their generating fleets to include deployment of renewable and lowercarbon generating resources, and advancement of customer energy efficiency programs.
50
Water Quality Standards
The federal Water Pollution Control Act ("Clean Water Act") establishes the framework for maintaining and improving waterquality in the United States through a program that regulates, among other things, discharges to and withdrawals from waterways.The Clean Water Act requires that cooling water intake structures reflect the "best technology available for minimizing adverseenvironmental impact" to aquatic organisms. After significant litigation, the EPA released a proposed rule under §316(b) of theClean Water Act to regulate cooling water intakes at existing facilities. The final rule was released in May 2014, and becameeffective in October 2014. Under the final rule, existing facilities that withdraw at least 25% of their water exclusively for coolingpurposes and have a design intake flow of greater than two million gallons per day are required to reduce fish impingement (i.e.,when fish and other aquatic organisms are trapped against screens when water is drawn into a facility's cooling system) by choosingone of seven options. Facilities that withdraw at least 125 million gallons of water per day from waters of the United States mustalso conduct studies to help their permitting authority determine what site-specific controls, if any, would be required to reduceentrainment of aquatic organisms (i.e., when organisms are drawn into the facility). PacifiCorp and MidAmerican Energy areassessing the options for compliance at their generating facilities impacted by the final rule and will complete impingement andentrainment studies. PacifiCorp's Dave Johnston generating facility and all of MidAmerican Energy's coal-fueled generatingfacilities, except Louisa, Ottumwa and Walter Scott, Jr. Unit 4, which have water cooling towers, withdraw more than 125 milliongallons per day of water from waters of the United States for once-through cooling applications. PacifiCorp's Jim Bridger, Naughton,Gadsby, Hunter and Huntington generating facilities currently utilize closed cycle cooling towers but are designed to withdrawmore than two million gallons of water per day. The standards are required to be met as soon as possible after the effective dateof the final rule, but no later than eight years thereafter. The costs of compliance with the cooling water intake structure rule cannotbe fully determined until the prescribed studies are conducted. In the event that PacifiCorp's or MidAmerican Energy's existingintake structures require modification, the costs are not anticipated to be significant to the consolidated financial statements. NevadaPower and Sierra Pacific do not utilize once-through cooling water intake or discharge structures at any of their generating facilities.All of the Nevada Power and Sierra Pacific generating stations are designed to have either minimal or zero discharge; therefore,they are not impacted by the §316(b) final rule.
In November 2015, the EPA published final effluent limitation guidelines and standards for the steam electric power generatingsector which, among other things, regulate the discharge of bottom ash transport water, fly ash transport water, combustion residualleachate and non-chemical metal cleaning wastes. These guidelines, which had not been revised since 1982, were revised inresponse to the EPA's concerns that the addition of controls for air emissions has changed the effluent discharged from coal- andnatural gas-fueled generating facilities. Under the guidelines, permitting authorities were required to include the new limits ineach impacted facility's discharge permit upon renewal; the new limits were to have been met as soon as possible, beginningNovember 1, 2018 and implemented by December 31, 2023. On April 5, 2017, a request for reconsideration and administrativestay of the guidelines was filed with the EPA. The EPA granted the request for reconsideration on April 12, 2017, imposed animmediate administrative stay of compliance dates in the rule that had not passed judicial review, and requested that the court staythe pending litigation over the rule until September 12, 2017. On June 6, 2017, the EPA proposed to extend many of the compliancedeadlines that would otherwise occur in 2018. On September 18, 2017, the EPA issued a final rule extending certain compliancedates for flue gas desulfurization wastewater and bottom ash transport water limits until November 1, 2020. While most of theissues raised by this rule are already being addressed through the coal combustion residuals rule and are not expected to imposesignificant additional requirements on the facilities, the impact of the rule cannot be fully determined until the reconsiderationaction is complete and any judicial review is concluded.
In April 2014, the EPA and the United States Army Corps of Engineers issued a joint proposal to address "waters of the UnitedStates" to clarify protection under the Clean Water Act for streams and wetlands. The proposed rule comes as a result of UnitedStates Supreme Court decisions in 2001 and 2006 that created confusion regarding jurisdictional waters that were subject topermitting under either nationwide or individual permitting requirements. The final rule was released in May 2015 but is currentlyunder appeal in multiple courts and a nationwide stay on the implementation of the rule was issued in October 2015. On January 13,2017, the U.S. Supreme Court granted a petition to address jurisdictional challenges to the rule. On June 27, 2017, the EPA initiatedthe repeal of the "waters of the United States" rule. The EPA plans to undertake a two-step process, with the first step to repealthe 2015 rule and the second step to carry out a notice-and-comment rulemaking in which a substantive re-evaluation of thedefinition of the "waters of the United States" will be undertaken. The proposed repeal of the rule has not yet been published inthe Federal Register. Depending on the outcome of the appeal(s) and intended rulemaking, a variety of projects that otherwisewould have qualified for streamlined permitting processes under nationwide or regional general permits would have been requiredto undergo more lengthy and costly individual permit procedures based on an extension of waters that will be deemed jurisdictional.On February 28, 2017, President Trump signed an Executive Order directing the EPA to review and rescind or revise the rule. OnJuly 27, 2017, the EPA and the Corps of Engineers issued a proposal to repeal the final rule and recodify the pre-existing rulespending issuance of a new rule. Until the outcome of the pending actions and any litigation is known, the Registrants cannotdetermine whether projects that include construction and demolition will face more complex permitting issues, higher costs orincreased requirements for compensatory mitigation.
51

Coal Combustion Byproduct Disposal
In May 2010, the EPA released a proposed rule to regulate the management and disposal of coal combustion byproducts, presentingtwo alternatives to regulation under the RCRA. The public comment period closed in November 2010. The final rule was releasedby the EPA on December 19, 2014, was published in the Federal Register on April 17, 2015 and became effective on October 19,2015. The final rule regulates coal combustion byproducts as non-hazardous waste under RCRA Subtitle D and establishes minimumnationwide standards for the disposal of coal combustion residuals. Under the final rule, surface impoundments and landfillsutilized for coal combustion byproducts may need to be closed unless they can meet the more stringent regulatory requirements.On August 10, 2017, the EPA issued proposed permitting guidance on how states’ coal combustion residuals permit programsshould comply with the requirements of the final rule as authorized under the December 2016 Water Infrastructure Improvementsfor the Nation Act. The public comment period on the permitting guidance closed on September 14, 2017. Also, on September14, 2017, the EPA granted reconsideration on aspects of the final rule. On September 18, 2017, the EPA filed a motion to hold thepending litigation on the final rule in abeyance; however, the D.C. Circuit has not made a final ruling on the motion. The D.C.Circuit requested additional briefing on the abeyance motion and directed the EPA to identify, by November 15, 2017, which issuesit intends to reconsider and the timeframe for completion of the reconsideration process. Oral argument on the motion for abeyanceis scheduled for November 20, 2017.
At the time the rule was published in April 2015, PacifiCorp operated 18 surface impoundments and seven landfills that containedcoal combustion byproducts. Prior to the effective date of the rule in October 2015, nine surface impoundments and three landfillswere either closed or repurposed to no longer receive coal combustion byproducts and hence are not subject to the final rule. Atthe time the rule was published in April 2015, MidAmerican Energy owned or operated nine surface impoundments andfour landfills that contained coal combustion byproducts. Prior to the effective date of the rule in October 2015, MidAmericanEnergy closed or repurposed six surface impoundments to no longer receive coal combustion byproducts. These six impoundmentsare subject to closure on or before April 2018. At the time the rule was published in April 2015, the Nevada Utilities operated tenevaporative surface impoundments and two landfills that contained coal combustion byproducts. Prior to the effective date of therule in October 2015, the Nevada Utilities closed four of the surface impoundments, four impoundments discontinued receipt ofcoal combustion byproducts and are subject to final closure on or before April 2018, and two surface impoundments remain activeand subject to the final rule. The two landfills remain active and subject to the final rule. Refer to Note 13 of the Notes to ConsolidatedFinancial Statements of Berkshire Hathaway Energy in Item 8 of the Company's Annual Report on Form 10-K for the year endedDecember 31, 2016 and Note 10 of the Notes to Consolidated Financial Statements of PacifiCorp in Item 8 of the Company'sAnnual Report on Form 10-K for the year ended December 31, 2016 for discussion of the impacts on asset retirement obligationsas a result of the final rule.
52
New Accounting Pronouncements
For a discussion of new accounting pronouncements affecting the Company, refer to Note 2 of Notes to Consolidated FinancialStatements in Part I, Item 1 of this Form 10-Q.
Critical Accounting Estimates
Certain accounting measurements require management to make estimates and judgments concerning transactions that will besettled several years in the future. Amounts recognized on the Consolidated Financial Statements based on such estimates involvenumerous assumptions subject to varying and potentially significant degrees of judgment and uncertainty and will likely changein the future as additional information becomes available. Estimates are used for, but not limited to, the accounting for the effectsof certain types of regulation, derivatives, impairment of goodwill and long-lived assets, pension and other postretirement benefits,income taxes and revenue recognition - unbilled revenue. For additional discussion of the Company's critical accounting estimates,see Item 7 of the Company's Annual Report on Form 10-K for the year ended December 31, 2016. There have been no significantchanges in the Company's assumptions regarding critical accounting estimates since December 31, 2016.

PacifiCorp and its subsidiaries Consolidated Financial Section
53

PART IItem 1. Financial Statements
54
REPORT OF INDEPENDENT REGISTERED PUBLIC ACCOUNTING FIRM
To the Board of Directors and Shareholders ofPacifiCorp Portland, Oregon
We have reviewed the accompanying consolidated balance sheet of PacifiCorp and subsidiaries ("PacifiCorp") as ofSeptember 30, 2017, and the related consolidated statements of operations for the three-month and nine-month periods endedSeptember 30, 2017 and 2016, and of changes in shareholders' equity and cash flows for the nine-month periods endedSeptember 30, 2017 and 2016. These interim financial statements are the responsibility of PacifiCorp's management.
We conducted our reviews in accordance with the standards of the Public Company Accounting Oversight Board (United States).A review of interim financial information consists principally of applying analytical procedures and making inquiries of personsresponsible for financial and accounting matters. It is substantially less in scope than an audit conducted in accordance with thestandards of the Public Company Accounting Oversight Board (United States), the objective of which is the expression of anopinion regarding the financial statements taken as a whole. Accordingly, we do not express such an opinion. Based on our reviews, we are not aware of any material modifications that should be made to such consolidated interim financialstatements for them to be in conformity with accounting principles generally accepted in the United States of America. We have previously audited, in accordance with the standards of the Public Company Accounting Oversight Board (United States),the consolidated balance sheet of PacifiCorp and subsidiaries as of December 31, 2016, and the related consolidated statementsof operations, comprehensive income, changes in shareholders' equity, and cash flows for the year then ended (not presentedherein); and in our report dated February 24, 2017, we expressed an unqualified opinion on those consolidated financial statements.In our opinion, the information set forth in the accompanying consolidated balance sheet as of December 31, 2016 is fairly stated,in all material respects, in relation to the consolidated balance sheet from which it has been derived. /s/ Deloitte & Touche LLP
Portland, OregonNovember 3, 2017

PACIFICORP AND SUBSIDIARIESCONSOLIDATED BALANCE SHEETS (Unaudited)
(Amounts in millions)
As ofSeptember 30, December 31,
2017 2016ASSETS
Current assets:Cash and cash equivalents $ 104 $ 17Accounts receivable, net 722 728Income taxes receivable — 17Inventories:
Materials and supplies 237 228Fuel 207 215
Regulatory assets 30 53Other current assets 72 96
Total current assets 1,372 1,354
Property, plant and equipment, net 19,135 19,162Regulatory assets 1,518 1,490Other assets 388 388
Total assets $ 22,413 $ 22,394
The accompanying notes are an integral part of these consolidated financial statements.
55

PACIFICORP AND SUBSIDIARIESCONSOLIDATED BALANCE SHEETS (Unaudited) (continued)
(Amounts in millions)
As ofSeptember 30, December 31,
2017 2016LIABILITIES AND SHAREHOLDERS' EQUITY
Current liabilities:Accounts payable $ 398 $ 408Income taxes payable 64 —Accrued employee expenses 115 67Accrued interest 106 115Accrued property and other taxes 136 63Short-term debt — 270Current portion of long-term debt and capital lease obligations 591 58Regulatory liabilities 67 54Other current liabilities 164 164
Total current liabilities 1,641 1,199
Regulatory liabilities 1,032 978Long-term debt and capital lease obligations 6,436 7,021Deferred income taxes 4,884 4,880Other long-term liabilities 913 926
Total liabilities 14,906 15,004
Commitments and contingencies (Note 8)
Shareholders' equity:Preferred stock 2 2
Common stock - 750 shares authorized, no par value, 357 shares issued and outstanding — —Additional paid-in capital 4,479 4,479Retained earnings 3,038 2,921Accumulated other comprehensive loss, net (12) (12)
Total shareholders' equity 7,507 7,390
Total liabilities and shareholders' equity $ 22,413 $ 22,394
The accompanying notes are an integral part of these consolidated financial statements.
56

PACIFICORP AND SUBSIDIARIESCONSOLIDATED STATEMENTS OF OPERATIONS (Unaudited)
(Amounts in millions)
Three-Month Periods Nine-Month PeriodsEnded September 30, Ended September 30,
2017 2016 2017 2016
Operating revenue $ 1,430 $ 1,434 $ 3,956 $ 3,919
Operating costs and expenses:Energy costs 465 478 1,305 1,295Operations and maintenance 248 272 754 800Depreciation and amortization 200 193 598 576Taxes, other than income taxes 50 47 149 141
Total operating costs and expenses 963 990 2,806 2,812
Operating income 467 444 1,150 1,107
Other income (expense):Interest expense (95) (95) (285) (285)Allowance for borrowed funds 4 4 12 12Allowance for equity funds 7 7 21 21Other, net 6 3 13 9
Total other income (expense) (78) (81) (239) (243)
Income before income tax expense 389 363 911 864Income tax expense 126 110 294 270
Net income $ 263 $ 253 $ 617 $ 594
The accompanying notes are an integral part of these consolidated financial statements.
57

PACIFICORP AND SUBSIDIARIESCONSOLIDATED STATEMENTS OF CHANGES IN SHAREHOLDERS' EQUITY (Unaudited)
(Amounts in millions)
AccumulatedAdditional Other Total
Preferred Common Paid-in Retained Comprehensive Shareholders'Stock Stock Capital Earnings Loss, Net Equity
Balance, December 31, 2015 $ 2 $ — $ 4,479 $ 3,033 $ (11) $ 7,503Net income — — — 594 — 594Common stock dividends declared — — — (550) — (550)Balance, September 30, 2016 $ 2 $ — $ 4,479 $ 3,077 $ (11) $ 7,547
Balance, December 31, 2016 $ 2 $ — $ 4,479 $ 2,921 $ (12) $ 7,390Net income — — — 617 — 617Common stock dividends declared — — — (500) — (500)Balance, September 30, 2017 $ 2 $ — $ 4,479 $ 3,038 $ (12) $ 7,507
The accompanying notes are an integral part of these consolidated financial statements.
58

PACIFICORP AND SUBSIDIARIESCONSOLIDATED STATEMENTS OF CASH FLOWS (Unaudited)
(Amounts in millions)
Nine-Month PeriodsEnded September 30,2017 2016
Cash flows from operating activities:Net income $ 617 $ 594Adjustments to reconcile net income to net cash flows from operating activities:
Depreciation and amortization 598 576Allowance for equity funds (21) (21)Deferred income taxes and amortization of investment tax credits 14 76Changes in regulatory assets and liabilities 21 85Other, net 1 6Changes in other operating assets and liabilities:
Accounts receivable and other assets 25 19Derivative collateral, net (4) 2Inventories (1) (32)Income taxes 75 133Accounts payable and other liabilities 110 (66)
Net cash flows from operating activities 1,435 1,372
Cash flows from investing activities:Capital expenditures (553) (586)Other, net 32 26
Net cash flows from investing activities (521) (560)
Cash flows from financing activities:Repayments of long-term debt and capital lease obligations (54) (56)Net repayments of short-term debt (270) (20)Common stock dividends (500) (550)Other, net (3) —
Net cash flows from financing activities (827) (626)
Net change in cash and cash equivalents 87 186Cash and cash equivalents at beginning of period 17 12Cash and cash equivalents at end of period $ 104 $ 198
The accompanying notes are an integral part of these consolidated financial statements.
59
PACIFICORP AND SUBSIDIARIESNOTES TO CONSOLIDATED FINANCIAL STATEMENTS
(Unaudited)
60
(1) General
PacifiCorp, which includes PacifiCorp and its subsidiaries, is a United States regulated electric utility company serving retailcustomers, including residential, commercial, industrial, irrigation and other customers in portions of Utah, Oregon, Wyoming,Washington, Idaho and California. PacifiCorp owns, or has interests in, a number of thermal, hydroelectric, wind-powered andgeothermal generating facilities, as well as electric transmission and distribution assets. PacifiCorp also buys and sells electricityon the wholesale market with other utilities, energy marketing companies, financial institutions and other market participants.PacifiCorp is subject to comprehensive state and federal regulation. PacifiCorp's subsidiaries support its electric utility operationsby providing coal mining services. PacifiCorp is an indirect subsidiary of Berkshire Hathaway Energy Company ("BHE"), aholding company based in Des Moines, Iowa that owns subsidiaries principally engaged in energy businesses. BHE is a consolidatedsubsidiary of Berkshire Hathaway Inc. ("Berkshire Hathaway").
The unaudited Consolidated Financial Statements have been prepared in accordance with accounting principles generally acceptedin the United States of America ("GAAP") for interim financial information and the United States Securities and ExchangeCommission's rules and regulations for Form 10-Q and Article 10 of Regulation S-X. Accordingly, they do not include all of thedisclosures required by GAAP for annual financial statements. Management believes the unaudited Consolidated FinancialStatements contain all adjustments (consisting only of normal recurring adjustments) considered necessary for the fair presentationof the unaudited Consolidated Financial Statements as of September 30, 2017 and for the three- and nine-month periods endedSeptember 30, 2017 and 2016. The Consolidated Statements of Comprehensive Income have been omitted as net income equalscomprehensive income for the three- and nine-month periods ended September 30, 2017 and 2016. The results of operations forthe three- and nine-month periods ended September 30, 2017 and 2016 are not necessarily indicative of the results to be expectedfor the full year.
The preparation of the unaudited Consolidated Financial Statements in conformity with GAAP requires management to makeestimates and assumptions that affect the reported amounts of assets and liabilities at the date of the unaudited ConsolidatedFinancial Statements and the reported amounts of revenue and expenses during the period. Actual results may differ from theestimates used in preparing the unaudited Consolidated Financial Statements. Note 2 of Notes to Consolidated Financial Statementsincluded in PacifiCorp's Annual Report on Form 10-K for the year ended December 31, 2016 describes the most significantaccounting policies used in the preparation of the unaudited Consolidated Financial Statements. There have been no significantchanges in PacifiCorp's assumptions regarding significant accounting estimates and policies during the nine-month period endedSeptember 30, 2017.
(2) New Accounting Pronouncements
In March 2017, the Financial Accounting Standards Board ("FASB") issued Accounting Standards Update ("ASU") No. 2017-07,which amends FASB Accounting Standards Codification ("ASC") Topic 715, "Compensation - Retirement Benefits." Theamendments in this guidance require that an employer disaggregate the service cost component from the other components of netbenefit cost and report the service cost component in the same line item as other compensation costs arising from services renderedby the pertinent employees during the period. The other components of net benefit cost are required to be presented in the statementof operations separately from the service cost component and outside the subtotal of operating income. Additionally, the guidanceonly allows the service cost component to be eligible for capitalization when applicable. This guidance is effective for interim andannual reporting periods beginning after December 15, 2017, with early adoption permitted. This guidance must be adoptedretrospectively for the presentation of the service cost component and the other components of net benefit cost in the statementof operations and prospectively for the capitalization of the service cost component in the balance sheet. PacifiCorp plans to adoptthis guidance effective January 1, 2018. PacifiCorp does not believe this will have a material impact on its Consolidated FinancialStatements and disclosures included within Notes to Consolidated Financial Statements.

In November 2016, the FASB issued ASU No. 2016-18, which amends FASB ASC Subtopic 230-10, "Statement of Cash Flows- Overall." The amendments in this guidance require that a statement of cash flows explain the change during the period in thetotal of cash, cash equivalents, and amounts generally described as restricted cash or restricted cash equivalents. Amounts generallydescribed as restricted cash and restricted cash equivalents should be included with cash and cash equivalents when reconcilingthe beginning-of-period and end-of-period total amounts shown on the statement of cash flows. This guidance is effective forinterim and annual reporting periods beginning after December 15, 2017, with early adoption permitted, and is required to beadopted retrospectively. PacifiCorp plans to adopt this guidance effective January 1, 2018 and does not believe the adoption ofthis guidance will have a material impact on its Consolidated Financial Statements and disclosures included within Notes toConsolidated Financial Statements.
In August 2016, the FASB issued ASU No. 2016-15, which amends FASB ASC Topic 230, "Statement of Cash Flows." Theamendments in this guidance address the classification of eight specific cash flow issues within the statement of cash flows withthe objective of reducing the existing diversity in practice. This guidance is effective for interim and annual reporting periodsbeginning after December 15, 2017, with early adoption permitted, and is required to be adopted retrospectively. PacifiCorp plansto adopt this guidance effective January 1, 2018 and does not believe the adoption of this guidance will have a material impact onits Consolidated Financial Statements.
In February 2016, the FASB issued ASU No. 2016-02, which creates FASB ASC Topic 842, "Leases" and supersedes Topic 840"Leases." This guidance increases transparency and comparability among entities by recording lease assets and lease liabilitieson the balance sheet and disclosing key information about leasing arrangements. A lessee should recognize in the balance sheet aliability to make lease payments (the lease liability) and a right-of-use asset representing its right to use the underlying asset forthe lease term. The recognition, measurement, and presentation of expenses and cash flows arising from a lease by a lessee havenot significantly changed from previous guidance. This guidance is effective for interim and annual reporting periods beginningafter December 15, 2018, with early adoption permitted, and is required to be adopted using a modified retrospective approach.PacifiCorp plans to adopt this guidance effective January 1, 2019 and is currently evaluating the impact on its ConsolidatedFinancial Statements and disclosures included within Notes to Consolidated Financial Statements.
In January 2016, the FASB issued ASU No. 2016-01, which amends FASB ASC Subtopic 825-10, "Financial Instruments - Overall."The amendments in this guidance address certain aspects of recognition, measurement, presentation and disclosure of financialinstruments including a requirement that all investments in equity securities that do not qualify for equity method accounting orresult in consolidation of the investee be measured at fair value with changes in fair value recognized in net income. This guidanceis effective for interim and annual reporting periods beginning after December 15, 2017, with early adoption not permitted, andis required to be adopted prospectively by means of a cumulative-effect adjustment to the balance sheet as of the beginning of thefiscal year of adoption. PacifiCorp is currently evaluating the impact of adopting this guidance on its Consolidated FinancialStatements and disclosures included within Notes to Consolidated Financial Statements. PacifiCorp does not believe this will havea material impact on its Consolidated Financial Statements and disclosures included within Notes to Consolidated FinancialStatements.
In May 2014, the FASB issued ASU No. 2014-09, which creates FASB ASC Topic 606, "Revenue from Contracts with Customers"and supersedes ASC Topic 605, "Revenue Recognition." The guidance replaces industry-specific guidance and establishes a singlefive-step model to identify and recognize revenue. The core principle of the guidance is that an entity should recognize revenueupon transfer of control of promised goods or services to customers in an amount that reflects the consideration to which an entityexpects to be entitled in exchange for those goods or services. Additionally, the guidance requires the entity to disclose furtherquantitative and qualitative information regarding the nature and amount of revenues arising from contracts with customers, aswell as other information about the significant judgments and estimates used in recognizing revenues from contracts with customers.In August 2015, the FASB issued ASU No. 2015-14, which defers the effective date of ASU No. 2014-09 one year to interim andannual reporting periods beginning after December 15, 2017. During 2016 and 2017, the FASB issued several ASUs that clarifythe implementation guidance for ASU No. 2014-09 but do not change the core principle of the guidance. This guidance may beadopted retrospectively or under a modified retrospective method where the cumulative effect is recognized at the date of initialapplication. PacifiCorp plans to adopt this guidance effective January 1, 2018 under the modified retrospective method and iscurrently evaluating the impact on its Consolidated Financial Statements and disclosures included within Notes to ConsolidatedFinancial Statements. PacifiCorp currently does not expect the timing and amount of revenue currently recognized to be materiallydifferent after adoption of the new guidance as a majority of revenue is recognized when PacifiCorp has the right to invoice as itcorresponds directly with the value to the customer of PacifiCorp’s performance to date. PacifiCorp plans to quantitativelydisaggregate revenue in the required financial statement footnote by customer class.
61

(3) Property, Plant and Equipment, Net
Property, plant and equipment, net consists of the following (in millions):
As ofSeptember 30, December 31,
Depreciable Life 2017 2016
Property, plant and equipment in-service 5-75 years $ 27,599 $ 27,298Accumulated depreciation and amortization (9,222) (8,793)
Net property, plant and equipment in-service 18,377 18,505Construction work-in-progress 758 657
Total property, plant and equipment, net $ 19,135 $ 19,162
62
(4) Recent Financing Transactions
In June 2017, PacifiCorp extended, with lender consent, the maturity date to June 2020 for its $400 million unsecured credit facilityby exercising the first of two available one-year extensions.
In June 2017, PacifiCorp terminated its $600 million unsecured credit facility expiring March 2018 and entered into a $600 millionunsecured credit facility expiring June 2020 with two one-year extension options subject to lender consent.
These credit facilities, which support PacifiCorp's commercial paper program and certain series of its tax-exempt bond obligationsand provide for the issuance of letters of credit, have a variable interest rate based on the Eurodollar rate or a base rate, at PacifiCorp'soption, plus a spread that varies based on PacifiCorp's credit ratings for its senior unsecured long-term debt securities. These creditfacilities require PacifiCorp's ratio of consolidated debt, including current maturities, to total capitalization not exceed 0.65 to 1.0as of the last day of each quarter.
(5) Employee Benefit Plans
Net periodic benefit (credit) cost for the pension and other postretirement benefit plans included the following components(in millions):
Three-Month Periods Nine-Month PeriodsEnded September 30, Ended September 30,
2017 2016 2017 2016Pension:
Service cost $ — $ 1 $ — $ 3Interest cost 12 14 37 41Expected return on plan assets (18) (18) (54) (56)Net amortization 3 8 10 25
Net periodic benefit (credit) cost $ (3) $ 5 $ (7) $ 13
Other postretirement:Service cost $ 1 $ 1 $ 2 $ 2Interest cost 3 3 10 11Expected return on plan assets (5) (5) (16) (16)Net amortization (1) (1) (4) (4)
Net periodic benefit credit $ (2) $ (2) $ (8) $ (7)
Employer contributions to the pension and other postretirement benefit plans are expected to be $5 million and $- million,respectively, during 2017. As of September 30, 2017, $3 million and $- million of contributions had been made to the pension andother postretirement benefit plans, respectively.

(6) Risk Management and Hedging Activities
PacifiCorp is exposed to the impact of market fluctuations in commodity prices and interest rates. PacifiCorp is principally exposedto electricity, natural gas, coal and fuel oil commodity price risk as it has an obligation to serve retail customer load in its regulatedservice territories. PacifiCorp's load and generating facilities represent substantial underlying commodity positions. Exposures tocommodity prices consist mainly of variations in the price of fuel required to generate electricity and wholesale electricity that ispurchased and sold. Commodity prices are subject to wide price swings as supply and demand are impacted by, among many otherunpredictable items, weather, market liquidity, generating facility availability, customer usage, storage, and transmission andtransportation constraints. Interest rate risk exists on variable-rate debt and future debt issuances. PacifiCorp does not engage ina material amount of proprietary trading activities.
PacifiCorp has established a risk management process that is designed to identify, assess, manage, monitor and report each of thevarious types of risk involved in its business. To mitigate a portion of its commodity price risk, PacifiCorp uses commodityderivative contracts, which may include forwards, options, swaps and other agreements, to effectively secure future supply or sellfuture production generally at fixed prices. PacifiCorp manages its interest rate risk by limiting its exposure to variable interestrates primarily through the issuance of fixed-rate long-term debt and by monitoring market changes in interest rates. Additionally,PacifiCorp may from time to time enter into interest rate derivative contracts, such as interest rate swaps or locks, to mitigatePacifiCorp's exposure to interest rate risk. No interest rate derivatives were in place during the periods presented. PacifiCorp doesnot hedge all of its commodity price and interest rate risks, thereby exposing the unhedged portion to changes in market prices.
There have been no significant changes in PacifiCorp's accounting policies related to derivatives. Refer to Note 7 for additionalinformation on derivative contracts.
The following table, which reflects master netting arrangements and excludes contracts that have been designated as normal underthe normal purchases or normal sales exception afforded by GAAP, summarizes the fair value of PacifiCorp's derivative contracts,on a gross basis, and reconciles those amounts to the amounts presented on a net basis on the Consolidated Balance Sheets(in millions):
Other Other OtherCurrent Other Current Long-termAssets Assets Liabilities Liabilities Total
As of September 30, 2017Not designated as hedging contracts(1):
Commodity assets $ 4 $ 1 $ 2 $ — $ 7Commodity liabilities (1) — (24) (82) (107)
Total 3 1 (22) (82) (100)
Total derivatives 3 1 (22) (82) (100)Cash collateral receivable — — 16 57 73
Total derivatives - net basis $ 3 $ 1 $ (6) $ (25) $ (27)
As of December 31, 2016Not designated as hedging contracts(1):
Commodity assets $ 24 $ 2 $ 1 $ — $ 27Commodity liabilities (6) — (14) (84) (104)
Total 18 2 (13) (84) (77)
Total derivatives 18 2 (13) (84) (77)Cash collateral receivable — — 10 59 69
Total derivatives - net basis $ 18 $ 2 $ (3) $ (25) $ (8)
(1) PacifiCorp's commodity derivatives are generally included in rates and as of September 30, 2017 and December 31, 2016, a regulatory asset of$97 million and $73 million, respectively, was recorded related to the net derivative liability of $100 million and $77 million, respectively.
63

Not Designated as Hedging Contracts
The following table reconciles the beginning and ending balances of PacifiCorp's net regulatory assets and summarizes the pre-tax gains and losses on commodity derivative contracts recognized in net regulatory assets, as well as amounts reclassified toearnings (in millions):
Three-Month Periods Nine-Month PeriodsEnded September 30, Ended September 30,
2017 2016 2017 2016
Beginning balance $ 95 $ 89 $ 73 $ 133Changes in fair value recognized in net regulatory assets 6 15 36 (4)Net (losses) gains reclassified to operating revenue (5) (2) 8 8Net gains (losses) reclassified to energy costs 1 — (20) (35)Ending balance $ 97 $ 102 $ 97 $ 102
Derivative Contract Volumes
The following table summarizes the net notional amounts of outstanding commodity derivative contracts with fixed price termsthat comprise the mark-to-market values as of (in millions):
Unit of September 30, December 31,Measure 2017 2016
Electricity sales Megawatt hours (3) (3)Natural gas purchases Decatherms 97 84Fuel oil purchases Gallons 2 11
Credit Risk
PacifiCorp is exposed to counterparty credit risk associated with wholesale energy supply and marketing activities with otherutilities, energy marketing companies, financial institutions and other market participants. Credit risk may be concentrated to theextent PacifiCorp's counterparties have similar economic, industry or other characteristics and due to direct or indirect relationshipsamong the counterparties. Before entering into a transaction, PacifiCorp analyzes the financial condition of each significantwholesale counterparty, establishes limits on the amount of unsecured credit to be extended to each counterparty and evaluatesthe appropriateness of unsecured credit limits on an ongoing basis. To further mitigate wholesale counterparty credit risk, PacifiCorpenters into netting and collateral arrangements that may include margining and cross-product netting agreements and obtains third-party guarantees, letters of credit and cash deposits. If required, PacifiCorp exercises rights under these arrangements, includingcalling on the counterparty's credit support arrangement.
Collateral and Contingent Features
In accordance with industry practice, certain wholesale derivative contracts contain credit support provisions that in part basecertain collateral requirements on credit ratings for senior unsecured debt as reported by one or more of the three recognized creditrating agencies. These derivative contracts may either specifically provide bilateral rights to demand cash or other security if creditexposures on a net basis exceed specified rating-dependent threshold levels ("credit-risk-related contingent features") or providethe right for counterparties to demand "adequate assurance," or in some cases terminate the contract, in the event of a materialadverse change in PacifiCorp's creditworthiness. These rights can vary by contract and by counterparty. As of September 30, 2017,PacifiCorp's credit ratings from the three recognized credit rating agencies were investment grade.
The aggregate fair value of PacifiCorp's derivative contracts in liability positions with specific credit-risk-related contingentfeatures totaled $102 million and $97 million as of September 30, 2017 and December 31, 2016, respectively, for which PacifiCorphad posted collateral of $73 million and $69 million, respectively, in the form of cash deposits. If all credit-risk-related contingentfeatures for derivative contracts in liability positions had been triggered as of September 30, 2017 and December 31, 2016,PacifiCorp would have been required to post $26 million and $22 million, respectively, of additional collateral. PacifiCorp'scollateral requirements could fluctuate considerably due to market price volatility, changes in credit ratings, changes in legislationor regulation, or other factors.
64

65
(7) Fair Value Measurements
The carrying value of PacifiCorp's cash, certain cash equivalents, receivables, payables, accrued liabilities and short-termborrowings approximates fair value because of the short-term maturity of these instruments. PacifiCorp has various financial assetsand liabilities that are measured at fair value on the Consolidated Financial Statements using inputs from the three levels of thefair value hierarchy. A financial asset or liability classification within the hierarchy is determined based on the lowest level inputthat is significant to the fair value measurement. The three levels are as follows:
• Level 1 — Inputs are unadjusted quoted prices in active markets for identical assets or liabilities that PacifiCorp has theability to access at the measurement date.
• Level 2 — Inputs include quoted prices for similar assets or liabilities in active markets, quoted prices for identical orsimilar assets or liabilities in markets that are not active, inputs other than quoted prices that are observable for the assetor liability and inputs that are derived principally from or corroborated by observable market data by correlation or othermeans (market corroborated inputs).
• Level 3 — Unobservable inputs reflect PacifiCorp's judgments about the assumptions market participants would use inpricing the asset or liability since limited market data exists. PacifiCorp develops these inputs based on the best informationavailable, including its own data.
The following table presents PacifiCorp's financial assets and liabilities recognized on the Consolidated Balance Sheets andmeasured at fair value on a recurring basis (in millions):
Input Levels for Fair Value MeasurementsLevel 1 Level 2 Level 3 Other(1) Total
As of September 30, 2017Assets:Commodity derivatives $ — $ 7 $ — $ (3) $ 4Money market mutual funds(2) 100 — — — 100Investment funds 20 — — — 20
$ 120 $ 7 $ — $ (3) $ 124
Liabilities - Commodity derivatives $ — $ (107) $ — $ 76 $ (31)
As of December 31, 2016Assets:Commodity derivatives $ — $ 27 $ — $ (7) $ 20Money market mutual funds(2) 13 — — — 13Investment funds 17 — — — 17
$ 30 $ 27 $ — $ (7) $ 50
Liabilities - Commodity derivatives $ — $ (104) $ — $ 76 $ (28)
(1) Represents netting under master netting arrangements and a net cash collateral receivable of $73 million and $69 million as of September 30, 2017and December 31, 2016, respectively.
(2) Amounts are included in cash and cash equivalents, other current assets and other assets on the Consolidated Balance Sheets. The fair value of thesemoney market mutual funds approximates cost.

Derivative contracts are recorded on the Consolidated Balance Sheets as either assets or liabilities and are stated at estimated fairvalue unless they are designated as normal purchases or normal sales and qualify for the exception afforded by GAAP. Whenavailable, the fair value of derivative contracts is estimated using unadjusted quoted prices for identical contracts in the market inwhich PacifiCorp transacts. When quoted prices for identical contracts are not available, PacifiCorp uses forward price curves.Forward price curves represent PacifiCorp's estimates of the prices at which a buyer or seller could contract today for delivery orsettlement at future dates. PacifiCorp bases its forward price curves upon market price quotations, when available, or internallydeveloped and commercial models, with internal and external fundamental data inputs. Market price quotations are obtained fromindependent energy brokers, exchanges, direct communication with market participants and actual transactions executed byPacifiCorp. Market price quotations for certain major electricity and natural gas trading hubs are generally readily obtainable forthe first six years; therefore, PacifiCorp's forward price curves for those locations and periods reflect observable market quotes.Market price quotations for other electricity and natural gas trading hubs are not as readily obtainable for the first six years. Giventhat limited market data exists for these contracts, as well as for those contracts that are not actively traded, PacifiCorp uses forwardprice curves derived from internal models based on perceived pricing relationships to major trading hubs that are based onunobservable inputs. The estimated fair value of these derivative contracts is a function of underlying forward commodity prices,interest rates, currency rates, related volatility, counterparty creditworthiness and duration of contracts. Refer to Note 6 for furtherdiscussion regarding PacifiCorp's risk management and hedging activities.
PacifiCorp's investments in money market mutual funds and investment funds are stated at fair value and are primarily accountedfor as available-for-sale securities. When available, PacifiCorp uses a readily observable quoted market price or net asset valueof an identical security in an active market to record the fair value. In the absence of a quoted market price or net asset value ofan identical security, the fair value is determined using pricing models or net asset values based on observable market inputs andquoted market prices of securities with similar characteristics.
PacifiCorp's long-term debt is carried at cost on the Consolidated Balance Sheets. The fair value of PacifiCorp's long-term debtis a Level 2 fair value measurement and has been estimated based upon quoted market prices, where available, or at the presentvalue of future cash flows discounted at rates consistent with comparable maturities with similar credit risks. The carrying valueof PacifiCorp's variable-rate long-term debt approximates fair value because of the frequent repricing of these instruments atmarket rates. The following table presents the carrying value and estimated fair value of PacifiCorp's long-term debt (in millions):
As of September 30, 2017 As of December 31, 2016Carrying Fair Carrying Fair
Value Value Value Value
Long-term debt $ 7,005 $ 8,277 $ 7,052 $ 8,204
66
(8) Commitments and Contingencies
Legal Matters
PacifiCorp is party to a variety of legal actions arising out of the normal course of business. Plaintiffs occasionally seek punitiveor exemplary damages. PacifiCorp does not believe that such normal and routine litigation will have a material impact on itsconsolidated financial results.
Environmental Laws and Regulations
PacifiCorp is subject to federal, state and local laws and regulations regarding air and water quality, renewable portfolio standards,emissions performance standards, climate change, coal combustion byproduct disposal, hazardous and solid waste disposal,protected species and other environmental matters that have the potential to impact PacifiCorp's current and future operations.PacifiCorp believes it is in material compliance with all applicable laws and regulations.
Hydroelectric Relicensing
PacifiCorp's Klamath hydroelectric system is currently operating under annual licenses with the Federal Energy RegulatoryCommission ("FERC"). In February 2010, PacifiCorp, the United States Department of the Interior, the United States Departmentof Commerce, the state of California, the state of Oregon and various other governmental and non-governmental settlement partiessigned the Klamath Hydroelectric Settlement Agreement ("KHSA").

Congress failed to pass legislation needed to implement the original KHSA. On April 6, 2016, PacifiCorp, the states of Californiaand Oregon, and the United States Departments of the Interior and Commerce and other stakeholders executed an amendment tothe KHSA. Consistent with the terms of the amended KHSA, on September 23, 2016, PacifiCorp and the Klamath River RenewalCorporation ("KRRC") jointly filed an application with the FERC to transfer the license for the four mainstem Klamath Riverhydroelectric generating facilities from PacifiCorp to the KRRC. Also on September 23, 2016, the KRRC filed an application withthe FERC to surrender the license and decommission the facilities. The KRRC's license surrender application included a requestfor the FERC to refrain from acting on the surrender application until after the transfer of the license to the KRRC is effective.
Under the amended KHSA, PacifiCorp and its customers are protected from uncapped dam removal costs and liabilities. TheKRRC must indemnify PacifiCorp from liabilities associated with dam removal. The amended KHSA also limits PacifiCorp'scontribution to facilities removal costs to no more than $200 million, of which up to $184 million would be collected fromPacifiCorp's Oregon customers with the remainder to be collected from PacifiCorp's California customers. California votersapproved a water bond measure in November 2014 from which the state of California's contribution toward facilities removalcosts are being drawn. In accordance with this bond measure, additional funding of up to $250 million for facilities removal costswas included in the California state budget in 2016, with the funding effective for at least five years. If facilities removal costsexceed the combined funding that will be available from PacifiCorp's Oregon and California customers and the state of California,sufficient funds would need to be provided by the KRRC or an entity other than PacifiCorp for removal to proceed.
If certain conditions in the amended KHSA are not satisfied and the license does not transfer to the KRRC, PacifiCorp will resumerelicensing with the FERC.
Guarantees
PacifiCorp has entered into guarantees as part of the normal course of business and the sale of certain assets. These guaranteesare not expected to have a material impact on PacifiCorp's consolidated financial results.
67
(9) Related Party Transactions
Berkshire Hathaway includes BHE and its subsidiaries in its United States federal income tax return. Consistent with establishedregulatory practice, PacifiCorp's provision for income taxes has been computed on a stand-alone basis, and substantially all of itscurrently payable or receivable income taxes are remitted to or received from BHE. For the nine-month periods endedSeptember 30, 2017 and 2016, PacifiCorp made net cash payments for federal and state income taxes to BHE totaling $205 millionand $61 million, respectively.

Item 2. Management's Discussion and Analysis of Financial Condition and Results of Operations
The following is management's discussion and analysis of certain significant factors that have affected the consolidated financialcondition and results of operations of PacifiCorp during the periods included herein. Explanations include management's bestestimate of the impact of weather, customer growth and other factors. This discussion should be read in conjunction with PacifiCorp'shistorical unaudited Consolidated Financial Statements and Notes to Consolidated Financial Statements in Part I, Item 1 of thisForm 10‑Q. PacifiCorp's actual results in the future could differ significantly from the historical results.
68
Results of Operations for the Third Quarter and First Nine Months of 2017 and 2016 Overview
Net income for the third quarter of 2017 was $263 million, an increase of $10 million, or 4%, compared to 2016. Net incomeincreased primarily due to higher gross margins of $30 million, excluding the impact of demand side management program revenue(offset in operations and maintenance expense) of $21 million, partially offset by higher depreciation and amortization of $7million, primarily from additional plant placed in-service. Gross margins increased due to higher retail customer volumes, lowercoal costs, lower natural gas-fueled generation, and higher wheeling revenue, partially offset by higher purchased electricity costs,lower average retail rates and lower wholesale revenue, primarily due to lower volumes. Retail customer volumes increased 2.1%due to impacts of weather on residential customers, primarily in Utah and Oregon, higher commercial usage primarily in Oregonand Utah, and an increase in the average number of residential and commercial customers in Utah, partially offset by lowerirrigation usage in Idaho and Oregon, and lower industrial usage in Utah and Oregon. Energy generated decreased 2% for the thirdquarter of 2017 compared to 2016 primarily due to lower natural gas-fueled and wind-powered generation, partially offset byhigher hydroelectric generation. Wholesale electricity sales volumes decreased 11% and purchased electricity volumes increased19%.
Net income for the first nine months of 2017 was $617 million, an increase of $23 million, or 4%, compared to 2016. Net incomeincreased primarily due to higher gross margins of $71 million, excluding the impact of demand side management program revenue(offset in operations and maintenance expense) of $44 million, partially offset by higher depreciation and amortization of$22 million from additional plant placed in-service and higher property taxes of $6 million. Gross margins increased due to higherretail customer volumes, lower natural gas-fueled generation, higher wholesale revenue from higher short-term market prices andvolumes, and higher wheeling revenue, partially offset by higher purchased electricity costs from higher volumes and prices, andlower average retail rates. Retail customer volumes increased 2.4% due to impacts of weather, primarily on residential customersin Oregon, Washington and Utah, higher commercial usage primarily in Oregon, an increase in the average number of residentialand commercial customers, primarily in Utah and Oregon, and higher industrial usage in the eastern service territory, partiallyoffset by lower residential usage across the service territory, lower industrial usage in Oregon and lower irrigation usage primarilyin Oregon and Idaho. Energy generated decreased 2% for the first nine months of 2017 compared to 2016 primarily due to lowernatural gas-fueled and wind-powered generation, partially offset by higher hydroelectric and coal generation. Wholesale electricitysales volumes decreased 3% and purchased electricity volumes increased 20%.
Operating revenue and energy costs are the key drivers of PacifiCorp's results of operations as they encompass retail and wholesaleelectricity revenue and the direct costs associated with providing electricity to customers. PacifiCorp believes that a discussionof gross margin, representing operating revenue less energy costs, is therefore meaningful.

A comparison of PacifiCorp's key operating results is as follows:
Third Quarter First Nine Months2017 2016 Change 2017 2016 Change
Gross margin (in millions):Operating revenue $ 1,430 $ 1,434 $ (4) — % $ 3,956 $ 3,919 $ 37 1 %Energy costs 465 478 (13) (3)% 1,305 1,295 10 1 %
Gross margin $ 965 $ 956 $ 9 1 % $ 2,651 $ 2,624 $ 27 1 %
Sales (GWh):Residential 4,372 4,147 225 5 % 12,410 11,909 501 4 %Commercial(1) 4,783 4,544 239 5 % 13,303 12,863 440 3 %Industrial, irrigation and other(1) 5,683 5,839 (156) (3)% 16,061 16,004 57 — %
Total retail 14,838 14,530 308 2 % 41,774 40,776 998 2 %Wholesale 1,350 1,513 (163) (11)% 4,362 4,493 (131) (3)%
Total sales 16,188 16,043 145 1 % 46,136 45,269 867 2 %
Average number of retail customers(in thousands) 1,868 1,842 26 1 % 1,863 1,837 26 1 %
Average revenue per MWh:Retail $ 90.58 $ 93.10 $ (2.52) (3)% $ 88.41 $ 90.44 $ (2.03) (2)%Wholesale $ 28.74 $ 28.32 $ 0.42 1 % $ 29.55 $ 25.41 $ 4.14 16 %
Heating degree days 304 236 68 29 % 6,472 5,726 746 13 %Cooling degree days 1,804 1,494 310 21 % 2,342 2,051 291 14 %
Sources of energy (GWh)(2):Coal 10,764 10,775 (11) — % 27,120 26,637 483 2 %Natural gas 2,486 2,743 (257) (9)% 5,647 7,642 (1,995) (26)%Hydroelectric(3) 641 488 153 31 % 3,598 2,719 879 32 %Wind and other(3) 460 647 (187) (29)% 2,030 2,337 (307) (13)%
Total energy generated 14,351 14,653 (302) (2)% 38,395 39,335 (940) (2)%Energy purchased 3,023 2,542 481 19 % 10,845 9,031 1,814 20 %
Total 17,374 17,195 179 1 % 49,240 48,366 874 2 %
Average cost of energy per MWh:Energy generated(4) $ 19.89 $ 20.86 $ (0.97) (5)% $ 19.21 $ 19.36 $ (0.15) (1)%Energy purchased $ 53.34 $ 49.68 $ 3.66 7 % $ 42.20 $ 43.02 $ (0.82) (2)%
(1) Prior period GWh amounts have been reclassified for consistency with the current period presentation.
(2) GWh amounts are net of energy used by the related generating facilities.
(3) All or some of the renewable energy attributes associated with generation from these generating facilities may be: (a) used in future years to complywith RPS or other regulatory requirements or (b) sold to third parties in the form of RECs or other environmental commodities.
(4) The average cost per MWh of energy generated includes only the cost of fuel associated with the generating facilities.
69

Gross margin increased $9 million, or 1%, for the third quarter of 2017 compared to 2016 primarily due to:
• $38 million of higher retail revenues due to increased volumes of 2.1% due to impacts of weather and higher usage,primarily in Utah and Oregon;
• $28 million of higher net deferrals of incurred net power costs in accordance with established adjustment mechanisms;
• $22 million of lower coal costs due to prior year charges related to damaged longwall mining equipment, and currentquarter lower volumes; and
• $7 million of lower natural gas costs primarily due to lower gas-fueled generation as gas prices were higher in 2017.
The increases above were partially offset by:
• $35 million of higher purchased electricity costs due to higher prices and volumes;
• $22 million of lower average retail rates;
• $21 million of lower demand side management program revenue (offset in operations and maintenance expense), primarilydriven by the recently implemented Utah Sustainable Transportation and Energy Plan ("STEP") program; and
• $9 million of higher coal prices.
Operations and maintenance decreased $24 million, or 9%, for the third quarter of 2017 compared to 2016 primarily due to adecrease in demand side management program expense (offset in operating revenue) driven by the establishment of the Utah STEPprogram and a decrease in pension expense primarily due to a current year plan change.
Depreciation and amortization increased $7 million, or 4%, for the third quarter of 2017 compared to 2016 primarily due to higherplant-in-service.
Income tax expense increased $16 million, or 15%, for the third quarter of 2017 compared to 2016. The effective tax rate was 32%for 2017 and 30% for 2016. The effective tax rate increased primarily due to lower production tax credits associated with PacifiCorp'swind-powered generating facilities as a result of the expiration of the 10-year production tax credit period for certain wind-poweredgenerating facilities.
Gross margin increased $27 million, or 1%, for the first nine months of 2017 compared to 2016 primarily due to:
• $102 million of higher retail revenues due to increased customer volumes of 2.4% due to impacts of weather, primarilyon residential customers in Oregon, Washington and Utah, higher commercial usage primarily in Oregon, an increase inthe average number of residential and commercial customers, primarily in Utah and Oregon, and higher industrial usagein the eastern service territory, partially offset by lower residential usage across the service territory, lower industrialusage in Oregon and lower irrigation usage primarily in Oregon and Idaho;
• $36 million of higher net deferrals of incurred net power costs in accordance with established adjustment mechanisms;
• $28 million of lower natural gas costs primarily due to lower gas-fueled generation due to higher gas prices in 2017;
• $20 million of lower coal costs due to prior year charges related to damaged longwall mining equipment;
• $15 million of higher wholesale revenue due to higher short-term market prices and higher volumes; and
• $13 million due to higher wheeling revenue, primarily due to higher volumes and short-term prices.
70

The increases above were partially offset by:
• $69 million of higher purchased electricity costs due to volumes and prices;
• $49 million of lower average retail rates;
• $44 million of lower demand side management program revenue (offset in operations and maintenance expense), primarilydriven by the recently implemented Utah STEP program; and
• $24 million of higher coal costs due to higher prices and volumes.
Operations and maintenance decreased $46 million, or 6%, for the first nine months of 2017 compared to 2016 primarily due toa decrease in demand side management program expense (offset in operating revenue) driven by the establishment of the UtahSTEP program, and a decrease in pension expense primarily due to a current year plan change. These decreases were partiallyoffset by higher injury and damage expenses, primarily due to a prior year accrual for insurance proceeds, and higher labor costsrelated to storm damage restoration.
Depreciation and amortization increased $22 million, or 4%, for the first nine months of 2017 compared to 2016 primarily dueto higher plant-in-service.
Taxes, other than income taxes increased $8 million, or 6% for the first nine months of 2017 compared to 2016 due to higherassessed property values.
Income tax expense increased $24 million, or 9%, for the first nine months of 2017 compared to 2016 and the effective tax ratewas 32% and 31% for 2017 and 2016, respectively. The effective tax rate increased primarily due to lower production tax creditsassociated with PacifiCorp's wind-powered generating facilities as a result of the expiration of the 10-year production tax creditperiod for certain wind-powered generating facilities.
71
Liquidity and Capital Resources As of September 30, 2017, PacifiCorp's total net liquidity was as follows (in millions):
Cash and cash equivalents $ 104
Credit facilities 1,000Less:
Short-term debt —Tax-exempt bond support (130)
Net credit facilities 870
Total net liquidity $ 974
Credit facilities:Maturity dates 2020
Operating Activities
Net cash flows from operating activities for the nine-month periods ended September 30, 2017 and 2016 were $1,435 million and$1,372 million, respectively. The change was primarily due to the payment for USA Power final judgment and post-judgmentinterest in the prior year, higher receipts from wholesale and retail customers and lower fuel payments, partially offset by currentyear higher cash payments for income taxes and purchased power.
In December 2015, the Protecting Americans from Tax Hikes Act of 2015 ("PATH") was signed into law, extending bonusdepreciation for qualifying property acquired and placed in-service before January 1, 2020 (bonus depreciation rates will be 50%in 2015-2017, 40% in 2018, and 30% in 2019), with an additional year for certain longer lived assets. As a result of PATH,PacifiCorp's cash flows from operations are expected to benefit due to bonus depreciation on qualifying assets placed in-servicethrough 2019.
The timing of PacifiCorp's income tax cash flows from period to period can be significantly affected by the estimated federalincome tax payment methods and assumptions for each payment date.
Investing Activities
Net cash flows from investing activities for the nine-month periods ended September 30, 2017 and 2016 were $(521) million and$(560) million, respectively. The change mainly reflects a current year decrease in capital expenditures of $33 million. Refer to"Future Uses of Cash" for discussion of capital expenditures.
Financing Activities
Net cash flows from financing activities for the nine-month period ended September 30, 2017 was $(827) million. Uses of cashconsisted substantially of $500 million for common stock dividends paid to PPW Holdings LLC, $270 million for the repaymentof short-term debt and $50 million for the repayment of long-term debt.
Net cash flows from financing activities for the nine-month period ended September 30, 2016 was $(626) million. Uses of cashconsisted substantially of $550 million for common stock dividends paid to PPW Holdings LLC, $54 million for the repaymentof long-term debt and $20 million for the repayment of short-term debt.
Short-term Debt
Regulatory authorities limit PacifiCorp to $1.5 billion of short-term debt. As of September 30, 2017, PacifiCorp had no short-termdebt outstanding. As of December 31, 2016, PacifiCorp had $270 million of short-term debt outstanding at a weighted averageinterest rate of 0.96%.
Long-term Debt
PacifiCorp currently has regulatory authority from the OPUC and the IPUC to issue an additional $1.3 billion of long-term debt.PacifiCorp must make a notice filing with the WUTC prior to any future issuance.
As of September 30, 2017, PacifiCorp had $216 million of letters of credit providing credit enhancement and liquidity supportfor variable-rate tax-exempt bond obligations totaling $213 million plus interest. These letters of credit were fully available as ofSeptember 30, 2017 and expire periodically through March 2019.
Future Uses of Cash
PacifiCorp has available a variety of sources of liquidity and capital resources, both internal and external, including net cash flowsfrom operating activities, public and private debt offerings, the issuance of commercial paper, the use of unsecured revolvingcredit facilities, capital contributions and other sources. These sources are expected to provide funds required for current operations,capital expenditures, debt retirements and other capital requirements. The availability and terms under which PacifiCorp has accessto external financing depends on a variety of factors, including PacifiCorp's credit ratings, investors' judgment of risk and conditionsin the overall capital markets, including the condition of the utility industry.
Capital Expenditures
PacifiCorp has significant future capital requirements. Capital expenditure needs are reviewed regularly by management and maychange significantly as a result of these reviews, which may consider, among other factors, changes in environmental and otherrules and regulations; impacts to customers' rates; outcomes of regulatory proceedings; changes in income tax laws; generalbusiness conditions; load projections; system reliability standards; the cost and efficiency of construction labor, equipment andmaterials; commodity prices; and the cost and availability of capital.
72

Historical and forecast capital expenditures, each of which exclude amounts for non-cash equity AFUDC and other non-cash items,are as follows (in millions):
Nine-Month Periods AnnualEnded September 30, Forecast
2016 2017 2017
Transmission system investment $ 68 $ 75 $ 118Environmental 42 18 28Wind investment — 8 8Operating and other 476 452 644
Total $ 586 $ 553 $ 798
PacifiCorp's historical and forecast capital expenditures include the following:
• Transmission system investment primarily reflects main grid reinforcement costs and initial costs for the 140-mile 500 kVAeolus-Bridger/Anticline transmission line, a major segment of PacifiCorp’s Energy Gateway Transmission expansionprogram expected to be placed in-service in 2020. Planned spending for the Aeolus-Bridger/Anticline line totals$16 million in 2017.
• Environmental includes the installation of new or the replacement of existing emissions control equipment at certaingenerating facilities, including installation or upgrade of selective catalytic reduction control systems and low nitrogenoxide burners to reduce nitrogen oxides, particulate matter control systems, sulfur dioxide emissions control systems andmercury emissions control systems, as well as expenditures for the management of coal combustion residuals.
• Remaining investments relate to operating projects that consist of routine expenditures for generation, transmission,distribution and other infrastructure needed to serve existing and expected demand, including upgrades to customer metersin Oregon, California and Idaho.
Integrated Resource Plan
In April 2017, PacifiCorp filed its 2017 Integrated Resource Plan ("IRP") with its state commissions. The IRP includes investmentsin renewable energy resources, upgrades to the existing wind fleet, and energy efficiency measures to meet future customer needs.Implementation of wind upgrades, new transmission and new wind renewable resources will require an estimated $3 billion incapital investment from 2017 through 2020. PacifiCorp's forecast capital expenditures for 2018 through 2019 increased$723 million from the forecast included in PacifiCorp's 2016 Annual Report on Form 10-K as a result of its 2017 IRP.
Request for Proposals
As required by applicable laws and regulations, PacifiCorp filed its draft 2017R Request for Proposals ("RFP") with the UPSCin June 2017 and with the OPUC in August 2017. The UPSC and the OPUC approved PacifiCorp’s 2017R RFP in September2017. The 2017R RFP was subsequently released to the market on September 27, 2017. The 2017R RFP is seeking up to 1,270MW of new wind resources that can interconnect to PacifiCorp’s transmission system in Wyoming once a proposed high-voltagetransmission line is constructed. The 2017R RFP is also seeking proposals for wind resources located outside of Wyoming capableof delivering all-in economic benefits for PacifiCorp's customers. The proposed high-voltage transmission line and new windresources must be placed in service by December 31, 2020, to maximize potential federal production tax credit benefits forPacifiCorp's customers. Bids were due in October 2017.
Contractual Obligations
As of September 30, 2017, there have been no material changes outside the normal course of business in contractual obligationsfrom the information provided in Item 7 of PacifiCorp's Annual Report on Form 10-K for the year ended December 31, 2016.
73
Regulatory Matters
PacifiCorp is subject to comprehensive regulation. Refer to "Regulatory Matters" in Berkshire Hathaway Energy's Part I, Item 2of this Form 10-Q for discussion regarding PacifiCorp's current regulatory matters.

74
Environmental Laws and Regulations
PacifiCorp is subject to federal, state, local and foreign laws and regulations regarding air and water quality, RPS, emissionsperformance standards, climate change, coal combustion byproduct disposal, hazardous and solid waste disposal, protected speciesand other environmental matters that have the potential to impact PacifiCorp's current and future operations. In addition to imposingcontinuing compliance obligations, these laws and regulations provide regulators with the authority to levy substantial penaltiesfor noncompliance including fines, injunctive relief and other sanctions. These laws and regulations are administered by the EPAand various state, local and international agencies. PacifiCorp believes it is in material compliance with all applicable laws andregulations, although many are subject to interpretation that may ultimately be resolved by the courts. Environmental laws andregulations continue to evolve, and PacifiCorp is unable to predict the impact of the changing laws and regulations on its operationsand financial results. Refer to "Liquidity and Capital Resources" for discussion of PacifiCorp's forecast environmental-relatedcapital expenditures.
Refer to "Environmental Laws and Regulations" in Berkshire Hathaway Energy's Part I, Item 2 of this Form 10-Q for additionalinformation regarding environmental laws.
New Accounting Pronouncements
For a discussion of new accounting pronouncements affecting PacifiCorp, refer to Note 2 of Notes to Consolidated FinancialStatements in Part I, Item 1 of the Form 10-Q.
Critical Accounting Estimates
Certain accounting measurements require management to make estimates and judgments concerning transactions that will besettled several years in the future. Amounts recognized on the Consolidated Financial Statements based on such estimates involvenumerous assumptions subject to varying and potentially significant degrees of judgment and uncertainty and will likely changein the future as additional information becomes available. Estimates are used for, but not limited to, the accounting for the effectsof certain types of regulation, derivatives, pension and other postretirement benefits, income taxes and revenue recognition-unbilledrevenue. For additional discussion of PacifiCorp's critical accounting estimates, see Item 7 of PacifiCorp's Annual Report onForm 10-K for the year ended December 31, 2016. There have been no significant changes in PacifiCorp's assumptions regardingcritical accounting estimates since December 31, 2016.

MidAmerican Funding, LLC and its subsidiaries and MidAmerican Energy Company Consolidated Financial Section
75

PART IItem 1. Financial Statements
76
REPORT OF INDEPENDENT REGISTERED PUBLIC ACCOUNTING FIRM
To the Board of Directors and Shareholder ofMidAmerican Energy Company Des Moines, Iowa
We have reviewed the accompanying balance sheet of MidAmerican Energy Company ("MidAmerican Energy") as ofSeptember 30, 2017, and the related statements of operations for the three-month and nine-month periods ended September 30,2017 and 2016, and of changes in equity and cash flows for the nine-month periods ended September 30, 2017 and 2016. Theseinterim financial statements are the responsibility of MidAmerican Energy's management.
We conducted our reviews in accordance with the standards of the Public Company Accounting Oversight Board (United States).A review of interim financial information consists principally of applying analytical procedures and making inquiries of personsresponsible for financial and accounting matters. It is substantially less in scope than an audit conducted in accordance with thestandards of the Public Company Accounting Oversight Board (United States), the objective of which is the expression of anopinion regarding the financial statements taken as a whole. Accordingly, we do not express such an opinion.
Based on our reviews, we are not aware of any material modifications that should be made to such interim financial statementsfor them to be in conformity with accounting principles generally accepted in the United States of America.
We have previously audited, in accordance with the standards of the Public Company Accounting Oversight Board (United States),the balance sheet of MidAmerican Energy Company as of December 31, 2016, and the related statements of operations,comprehensive income, changes in equity, and cash flows for the year then ended (not presented herein); and in our report datedFebruary 24, 2017, we expressed an unqualified opinion on those financial statements. In our opinion, the information set forthin the accompanying balance sheet as of December 31, 2016 is fairly stated, in all material respects, in relation to the balance sheetfrom which it has been derived.
/s/ Deloitte & Touche LLP
Des Moines, IowaNovember 3, 2017

MIDAMERICAN ENERGY COMPANYBALANCE SHEETS (Unaudited)
(Amounts in millions)
As ofSeptember 30, December 31,
2017 2016ASSETS
Current assets:Cash and cash equivalents $ 512 $ 14Receivables, net 312 285Income taxes receivable — 9Inventories 235 264Other current assets 21 35
Total current assets 1,080 607
Property, plant and equipment, net 13,587 12,821Regulatory assets 1,335 1,161Investments and restricted cash and investments 707 653Other assets 193 217
Total assets $ 16,902 $ 15,459
The accompanying notes are an integral part of these financial statements.
77

MIDAMERICAN ENERGY COMPANYBALANCE SHEETS (Unaudited) (continued)
(Amounts in millions)
As ofSeptember 30, December 31,
2017 2016LIABILITIES AND SHAREHOLDER'S EQUITY
Current liabilities:Accounts payable $ 256 $ 303Accrued interest 52 45Accrued property, income and other taxes 228 137Short-term debt — 99Current portion of long-term debt 350 250Other current liabilities 158 159
Total current liabilities 1,044 993
Long-term debt 4,544 4,051Deferred income taxes 3,781 3,572Regulatory liabilities 927 883Asset retirement obligations 515 510Other long-term liabilities 307 290
Total liabilities 11,118 10,299
Commitments and contingencies (Note 8)
Shareholder's equity:Common stock - 350 shares authorized, no par value, 71 shares issued and outstanding — —Additional paid-in capital 561 561Retained earnings 5,223 4,599
Total shareholder's equity 5,784 5,160
Total liabilities and shareholder's equity $ 16,902 $ 15,459
The accompanying notes are an integral part of these financial statements.
78

MIDAMERICAN ENERGY COMPANYSTATEMENTS OF OPERATIONS (Unaudited)
(Amounts in millions)
Three-Month Periods Nine-Month PeriodsEnded September 30, Ended September 30,2017 2016 2017 2016
Operating revenue:Regulated electric $ 707 $ 692 $ 1,677 $ 1,572Regulated gas and other 106 103 489 432
Total operating revenue 813 795 2,166 2,004
Operating costs and expenses:Cost of fuel, energy and capacity 130 130 342 312Cost of gas sold and other 54 55 288 237Operations and maintenance 200 180 547 510Depreciation and amortization 111 118 369 338Property and other taxes 30 28 90 84
Total operating costs and expenses 525 511 1,636 1,481
Operating income 288 284 530 523
Other income (expense):Interest expense (54) (50) (160) (147)Allowance for borrowed funds 4 3 9 6Allowance for equity funds 11 6 25 14Other, net 5 3 13 8
Total other income (expense) (34) (38) (113) (119)
Income before income tax benefit 254 246 417 404Income tax benefit (131) (74) (207) (123)
Net income $ 385 $ 320 $ 624 $ 527
The accompanying notes are an integral part of these financial statements.
79

MIDAMERICAN ENERGY COMPANYSTATEMENTS OF CHANGES IN EQUITY (Unaudited)
(Amounts in millions)
CommonStock
RetainedEarnings
AccumulatedOther
ComprehensiveLoss, Net
TotalEquity
Balance, December 31, 2015 $ 561 $ 4,174 $ (30) $ 4,705Net income — 527 — 527Other comprehensive income — — 2 2Dividend — (117) 27 (90)Other equity transactions — (1) — (1)Balance, September 30, 2016 $ 561 $ 4,583 $ (1) $ 5,143
Balance, December 31, 2016 $ 561 $ 4,599 $ — $ 5,160Net income — 624 — 624Balance, September 30, 2017 $ 561 $ 5,223 $ — $ 5,784
The accompanying notes are an integral part of these financial statements.
80

MIDAMERICAN ENERGY COMPANYSTATEMENTS OF CASH FLOWS (Unaudited)
(Amounts in millions)
Nine-Month PeriodsEnded September 30,2017 2016
Cash flows from operating activities:Net income $ 624 $ 527Adjustments to reconcile net income to net cash flows from operating activities:
Depreciation and amortization 369 338Deferred income taxes and amortization of investment tax credits 64 113Changes in other assets and liabilities 28 34Other, net (23) (42)Changes in other operating assets and liabilities:
Receivables, net (28) (67)Inventories 29 (26)Derivative collateral, net 3 4Contributions to pension and other postretirement benefit plans, net (8) (5)Accounts payable (5) 14Accrued property, income and other taxes, net 98 160Other current assets and liabilities 20 30
Net cash flows from operating activities 1,171 1,080
Cash flows from investing activities:Utility construction expenditures (1,162) (1,129)Purchases of available-for-sale securities (126) (96)Proceeds from sales of available-for-sale securities 127 92Other, net — 5
Net cash flows from investing activities (1,161) (1,128)
Cash flows from financing activities:Proceeds from long-term debt 842 33Repayments of long-term debt (255) (38)Net repayments of short-term debt (99) —
Net cash flows from financing activities 488 (5)
Net change in cash and cash equivalents 498 (53)Cash and cash equivalents at beginning of period 14 103Cash and cash equivalents at end of period $ 512 $ 50
The accompanying notes are an integral part of these financial statements.
81

MIDAMERICAN ENERGY COMPANYNOTES TO FINANCIAL STATEMENTS
(Unaudited)
82
(1) General
MidAmerican Energy Company ("MidAmerican Energy") is a public utility with electric and natural gas operations and is theprincipal subsidiary of MHC Inc. ("MHC"). MHC is a holding company that conducts no business other than the ownership of itssubsidiaries and related corporate services. MHC's nonregulated subsidiaries include Midwest Capital Group, Inc. and MECConstruction Services Co. MHC is the direct, wholly owned subsidiary of MidAmerican Funding, LLC ("MidAmerican Funding"),which is an Iowa limited liability company with Berkshire Hathaway Energy Company ("BHE") as its sole member. BHE is aconsolidated subsidiary of Berkshire Hathaway Inc. ("Berkshire Hathaway").
The unaudited Financial Statements have been prepared in accordance with accounting principles generally accepted in the UnitedStates of America ("GAAP") for interim financial information and the United States Securities and Exchange Commission's rulesand regulations for Form 10-Q and Article 10 of Regulation S-X. Accordingly, they do not include all of the disclosures requiredby GAAP for annual financial statements. Management believes the unaudited Financial Statements contain all adjustments(consisting only of normal recurring adjustments) considered necessary for the fair presentation of the unaudited FinancialStatements as of September 30, 2017, and for the three- and nine-month periods ended September 30, 2017 and 2016. The resultsof operations for the three- and nine-month periods ended September 30, 2017, are not necessarily indicative of the results to beexpected for the full year.
The preparation of the unaudited Financial Statements in conformity with GAAP requires management to make estimates andassumptions that affect the reported amounts of assets and liabilities at the date of the unaudited Financial Statements and thereported amounts of revenue and expenses during the period. Actual results may differ from the estimates used in preparing theunaudited Financial Statements. Note 2 of Notes to Financial Statements included in MidAmerican Energy's Annual Report onForm 10-K for the year ended December 31, 2016, describes the most significant accounting policies used in the preparation ofthe unaudited Financial Statements. There have been no significant changes in MidAmerican Energy's assumptions regardingsignificant accounting estimates and policies during the nine-month period ended September 30, 2017.
(2) New Accounting Pronouncements
In March 2017, the Financial Accounting Standards Board ("FASB") issued Accounting Standards Update ("ASU") No. 2017-07,which amends FASB Accounting Standards Codification ("ASC") Topic 715, "Compensation - Retirement Benefits." Theamendments in this guidance require that an employer disaggregate the service cost component from the other components of netbenefit cost and report the service cost component in the same line item as other compensation costs arising from services renderedby the pertinent employees during the period. The other components of net benefit cost are required to be presented in the statementof operations separately from the service cost component and outside the subtotal of operating income. Additionally, the guidanceonly allows the service cost component to be eligible for capitalization when applicable. This guidance is effective for interim andannual reporting periods beginning after December 15, 2017, with early adoption permitted. This guidance must be adoptedretrospectively for the presentation of the service cost component and the other components of net benefit cost in the statementof operations and prospectively for the capitalization of the service cost component in the balance sheet. MidAmerican Energyplans to adopt this guidance effective January 1, 2018. MidAmerican Energy does not believe this will have a material impact onits Financial Statements and disclosures included within Notes to Financial Statements.
In November 2016, the FASB issued ASU No. 2016-18, which amends FASB ASC Subtopic 230-10, "Statement of Cash Flows- Overall." The amendments in this guidance require that a statement of cash flows explain the change during the period in thetotal of cash, cash equivalents, and amounts generally described as restricted cash or restricted cash equivalents. Amounts generallydescribed as restricted cash and restricted cash equivalents must be included with cash and cash equivalents when reconciling thebeginning-of-period and end-of-period total amounts shown on the statement of cash flows. This guidance is effective for interimand annual reporting periods beginning after December 15, 2017, with early adoption permitted, and is required to be adoptedretrospectively. MidAmerican Energy plans to adopt this guidance effective January 1, 2018, and does not believe the adoptionof this guidance will have a material impact on its Financial Statements and disclosures included within Notes to FinancialStatements. In August 2016, the FASB issued ASU No. 2016-15, which amends FASB ASC Topic 230, "Statement of Cash Flows."The amendments in this guidance address the classification of eight specific cash flow issues within the statement of cash flowswith the objective of reducing the existing diversity in practice. This guidance is effective for interim and annual reporting periodsbeginning after December 15, 2017, with early adoption permitted, and is required to be adopted retrospectively. MidAmericanEnergy plans to adopt this guidance effective January 1, 2018, and does not believe the adoption of this guidance will have amaterial impact on its Financial Statements.

In February 2016, the FASB issued ASU No. 2016-02, which creates FASB ASC Topic 842, "Leases" and supersedes Topic 840"Leases." This guidance increases transparency and comparability among entities by recording lease assets and lease liabilitieson the balance sheet and disclosing key information about leasing arrangements. A lessee should recognize in the balance sheet aliability to make lease payments (the lease liability) and a right-of-use asset representing its right to use the underlying asset forthe lease term. The recognition, measurement, and presentation of expenses and cash flows arising from a lease by a lessee havenot significantly changed from previous guidance. This guidance is effective for interim and annual reporting periods beginningafter December 15, 2018, with early adoption permitted, and is required to be adopted using a modified retrospective approach.MidAmerican Energy plans to adopt this guidance effective January 1, 2019, and is currently evaluating the impact on its FinancialStatements and disclosures included within Notes to Financial Statements.
In January 2016, the FASB issued ASU No. 2016-01, which amends FASB ASC Subtopic 825-10, "Financial Instruments - Overall."The amendments in this guidance address certain aspects of recognition, measurement, presentation and disclosure of financialinstruments including a requirement that all investments in equity securities that do not qualify for equity method accounting orresult in consolidation of the investee be measured at fair value with changes in fair value recognized in net income. This guidanceis effective for interim and annual reporting periods beginning after December 15, 2017, with early adoption not permitted, andis required to be adopted prospectively by means of a cumulative-effect adjustment to the balance sheet as of the beginning of thefiscal year of adoption. MidAmerican Energy is currently evaluating the impact of adopting this guidance on its Financial Statementsand disclosures included within Notes to Financial Statements. MidAmerican Energy does not believe this guidance will have amaterial impact on its Financial Statements and disclosures included within Notes to Financial Statements.
In May 2014, the FASB issued ASU No. 2014-09, which creates FASB ASC Topic 606, "Revenue from Contracts with Customers"and supersedes ASC Topic 605, "Revenue Recognition." The guidance replaces industry-specific guidance and establishes a singlefive-step model to identify and recognize revenue. The core principle of the guidance is that an entity should recognize revenueupon transfer of control of promised goods or services to customers in an amount that reflects the consideration to which an entityexpects to be entitled in exchange for those goods or services. Additionally, the guidance requires the entity to disclose furtherquantitative and qualitative information regarding the nature and amount of revenues arising from contracts with customers, aswell as other information about the significant judgments and estimates used in recognizing revenues from contracts with customers.In August 2015, the FASB issued ASU No. 2015-14, which defers the effective date of ASU No. 2014-09 one year to interim andannual reporting periods beginning after December 15, 2017. During 2016 and 2017, the FASB issued several ASUs that clarifythe implementation guidance for ASU No. 2014-09 but do not change the core principle of the guidance. This guidance may beadopted retrospectively or under a modified retrospective method where the cumulative effect is recognized at the date of initialapplication. MidAmerican Energy plans to adopt this guidance effective January 1, 2018 under the modified retrospective methodand is currently evaluating the impact on its Financial Statements and disclosures included within Notes to Financial Statements.MidAmerican Energy currently does not expect the timing and amount of revenue currently recognized to be materially differentafter adoption of the new guidance as a majority of revenue is recognized when MidAmerican Energy has the right to invoice asit corresponds directly with the value to the customer of MidAmerican Energy’s performance to date. MidAmerican Energy'scurrent plan is to quantitatively disaggregate revenue in the required financial statement footnote by jurisdiction for each segment.
83

(3) Property, Plant and Equipment, Net
Property, plant and equipment, net consists of the following (in millions):
As ofSeptember 30, December 31,
Depreciable Life 2017 2016Utility plant in service, net:
Generation 20-70 years $ 11,339 $ 11,282Transmission 52-75 years 1,802 1,726Electric distribution 20-75 years 3,297 3,197Gas distribution 29-75 years 1,606 1,565
Utility plant in service 18,044 17,770Accumulated depreciation and amortization (5,765) (5,448)
Utility plant in service, net 12,279 12,322Nonregulated property, net:
Nonregulated property gross 20-50 years 7 7Accumulated depreciation and amortization (1) (1)
Nonregulated property, net 6 612,285 12,328
Construction work-in-progress 1,302 493Property, plant and equipment, net $ 13,587 $ 12,821
During the fourth quarter of 2016, MidAmerican Energy revised its electric and gas depreciation rates based on the results of anew depreciation study, the most significant impact of which was longer estimated useful lives for certain wind-powered generatingfacilities. The effect of this change was to reduce depreciation and amortization expense by $34 million annually, or $9 millionand $26 million for the three- and nine-month periods ended September 30, 2017, based on depreciable plant balances at the timeof the change.
84
(4) Recent Financing Transactions
Long-Term Debt
In February 2017, MidAmerican Energy issued $375 million of its 3.10% First Mortgage Bonds due May 2027 and $475 millionof its 3.95% First Mortgage Bonds due August 2047. An amount equal to the net proceeds was used to finance capital expenditures,disbursed during the period from February 2, 2016 to February 1, 2017, with respect to investments in MidAmerican Energy's551-megawatt Wind X and 2,000-megawatt Wind XI projects, which were previously financed with MidAmerican Energy's generalfunds.
In February 2017, MidAmerican Energy redeemed in full through optional redemption its $250 million of 5.95% Senior Notesdue July 2017.
Credit Facilities
In June 2017, MidAmerican Energy terminated its $600 million unsecured credit facility expiring March 2018 and entered into a$900 million unsecured credit facility expiring June 2020 with two one-year extension options subject to lender consent. The creditfacility, which supports MidAmerican Energy's commercial paper program and its variable-rate tax-exempt bond obligations andprovides for the issuance of letters of credit, has a variable interest rate based on the Eurodollar rate or a base rate, at MidAmericanEnergy's option, plus a spread that varies based on MidAmerican Energy's credit ratings for senior unsecured long-term debtsecurities. The credit facility requires MidAmerican Energy's ratio of consolidated debt, including current maturities, to totalcapitalization not exceed 0.65 to 1.0 as of the last day of each quarter.

(5) Income Taxes
A reconciliation of the federal statutory income tax rate to MidAmerican Energy's effective income tax rate applicable to incomebefore income tax benefit is as follows:
Three-Month Periods Nine-Month PeriodsEnded September 30, Ended September 30,2017 2016 2017 2016
Federal statutory income tax rate 35 % 35 % 35 % 35 %Income tax credits (74) (58) (74) (58)State income tax, net of federal income tax benefit (10) (6) (7) (4)Effects of ratemaking (2) (1) (4) (3)Other, net (1) — — —
Effective income tax rate (52)% (30)% (50)% (30)%
Income tax credits relate primarily to production tax credits from MidAmerican Energy's wind-powered generating facilities.Federal renewable electricity production tax credits are earned as energy from qualifying wind-powered generating facilities isproduced and sold and are based on a per-kilowatt hour rate pursuant to the applicable federal income tax law. Wind-poweredgenerating facilities are eligible for the credits for 10 years from the date the qualifying generating facilities are placed in-service.
Berkshire Hathaway includes BHE and subsidiaries in its United States federal income tax return. Consistent with establishedregulatory practice, MidAmerican Energy's provision for income taxes has been computed on a stand-alone basis, and substantiallyall of its currently payable or receivable income taxes are remitted to or received from BHE. MidAmerican Energy received netcash payments for income taxes from BHE totaling $381 million and $416 million for the nine-month periods ended September 30,2017 and 2016, respectively.
85
(6) Employee Benefit Plans
MidAmerican Energy sponsors a noncontributory defined benefit pension plan covering a majority of all employees of BHE andits domestic energy subsidiaries other than PacifiCorp and NV Energy, Inc. MidAmerican Energy also sponsors certainpostretirement healthcare and life insurance benefits covering substantially all retired employees of BHE and its domestic energysubsidiaries other than PacifiCorp and NV Energy, Inc.
Net periodic benefit (credit) cost for the plans of MidAmerican Energy and the aforementioned affiliates included the followingcomponents (in millions):
Three-Month Periods Nine-Month PeriodsEnded September 30, Ended September 30,2017 2016 2017 2016
Pension:Service cost $ 2 $ 3 $ 7 $ 8Interest cost 8 8 23 25Expected return on plan assets (11) (11) (33) (33)Net amortization — — 1 1
Net periodic benefit (credit) cost $ (1) $ — $ (2) $ 1
Other postretirement:Service cost $ 2 $ 1 $ 4 $ 4Interest cost 3 2 7 7Expected return on plan assets (3) (3) (10) (10)Net amortization (1) (1) (3) (3)
Net periodic benefit cost (credit) $ 1 $ (1) $ (2) $ (2)

Employer contributions to the pension and other postretirement benefit plans are expected to be $8 million and $1 million,respectively, during 2017. As of September 30, 2017, $5 million and $1 million of contributions had been made to the pensionand other postretirement benefit plans, respectively.
86
(7) Fair Value Measurements
The carrying value of MidAmerican Energy's cash, certain cash equivalents, receivables, payables, accrued liabilities and short-term borrowings approximates fair value because of the short-term maturity of these instruments. MidAmerican Energy has variousfinancial assets and liabilities that are measured at fair value on the Financial Statements using inputs from the three levels of thefair value hierarchy. A financial asset or liability classification within the hierarchy is determined based on the lowest level inputthat is significant to the fair value measurement. The three levels are as follows:
• Level 1 — Inputs are unadjusted quoted prices in active markets for identical assets or liabilities that MidAmericanEnergy has the ability to access at the measurement date.
• Level 2 — Inputs include quoted prices for similar assets or liabilities in active markets, quoted prices for identical orsimilar assets or liabilities in markets that are not active, inputs other than quoted prices that are observable for the assetor liability and inputs that are derived principally from or corroborated by observable market data by correlation or othermeans (market corroborated inputs).
• Level 3 — Unobservable inputs reflect MidAmerican Energy's judgments about the assumptions market participantswould use in pricing the asset or liability since limited market data exists. MidAmerican Energy develops these inputsbased on the best information available, including its own data.
The following table presents MidAmerican Energy's financial assets and liabilities recognized on the Balance Sheets and measuredat fair value on a recurring basis (in millions):
Input Levels for Fair Value MeasurementsLevel 1 Level 2 Level 3 Other(1) Total
As of September 30, 2017:Assets:Commodity derivatives $ — $ 2 $ 2 $ (2) $ 2Money market mutual funds(2) 520 — — — 520Debt securities:
United States government obligations 168 — — — 168International government obligations — 5 — — 5Corporate obligations — 37 — — 37Municipal obligations — 2 — — 2Agency, asset and mortgage-backed obligations — 1 — — 1
Equity securities:United States companies 270 — — — 270International companies 7 — — — 7Investment funds 15 — — — 15
$ 980 $ 47 $ 2 $ (2) $ 1,027
Liabilities - commodity derivatives $ — $ (6) $ (4) $ 2 $ (8)

Input Levels for Fair Value MeasurementsLevel 1 Level 2 Level 3 Other(1) Total
As of December 31, 2016:Assets:Commodity derivatives $ — $ 9 $ 1 $ (2) $ 8Money market mutual funds(2) 1 — — — 1Debt securities:
United States government obligations 161 — — — 161International government obligations — 3 — — 3Corporate obligations — 36 — — 36Municipal obligations — 2 — — 2Agency, asset and mortgage-backed obligations — 2 — — 2
Equity securities:United States companies 250 — — — 250International companies 5 — — — 5Investment funds 9 — — — 9
$ 426 $ 52 $ 1 $ (2) $ 477
Liabilities - commodity derivatives $ — $ (3) $ (3) $ 3 $ (3)
(1) Represents netting under master netting arrangements and a net cash collateral receivable of $- million and $1 million as of September 30, 2017 andDecember 31, 2016, respectively.
(2) Amounts are included in cash and cash equivalents and investments and restricted cash and investments on the Balance Sheets. The fair value of thesemoney market mutual funds approximates cost.
Derivative contracts are recorded on the Balance Sheets as either assets or liabilities and are stated at estimated fair value unlessthey are designated as normal purchases or normal sales and qualify for the exception afforded by GAAP. When available, thefair value of derivative contracts is estimated using unadjusted quoted prices for identical contracts in the market in whichMidAmerican Energy transacts. When quoted prices for identical contracts are not available, MidAmerican Energy uses forwardprice curves. Forward price curves represent MidAmerican Energy's estimates of the prices at which a buyer or seller could contracttoday for delivery or settlement at future dates. MidAmerican Energy bases its forward price curves upon market price quotations,when available, or internally developed and commercial models, with internal and external fundamental data inputs. Market pricequotations are obtained from independent brokers, exchanges, direct communication with market participants and actualtransactions executed by MidAmerican Energy. Market price quotations are generally readily obtainable for the applicable termof MidAmerican Energy's outstanding derivative contracts; therefore, MidAmerican Energy's forward price curves reflectobservable market quotes. Market price quotations for certain electricity and natural gas trading hubs are not as readily obtainabledue to the length of the contract. Given that limited market data exists for these contracts, as well as for those contracts that arenot actively traded, MidAmerican Energy uses forward price curves derived from internal models based on perceived pricingrelationships to major trading hubs that are based on unobservable inputs. The estimated fair value of these derivative contractsis a function of underlying forward commodity prices, interest rates, related volatility, counterparty creditworthiness and durationof contracts.
MidAmerican Energy's investments in money market mutual funds and debt and equity securities are stated at fair value and areprimarily accounted for as available-for-sale securities. When available, a readily observable quoted market price or net assetvalue of an identical security in an active market is used to record the fair value. In the absence of a quoted market price or netasset value of an identical security, the fair value is determined using pricing models or net asset values based on observable marketinputs and quoted market prices of securities with similar characteristics.
87
The following table reconciles the beginning and ending balances of MidAmerican Energy's assets and liabilities measured at fairvalue on a recurring basis using significant Level 3 inputs (in millions):
Three-Month Periods Nine-Month PeriodsEnded September 30, Ended September 30,
CommodityDerivatives
AuctionRate
SecuritiesCommodityDerivatives
AuctionRate
Securities2017:Beginning balance $ (1) $ — $ (2) $ —Changes in fair value recognized in net regulatory assets (2) — (2) —Settlements 1 — 2 —Ending balance $ (2) $ — $ (2) $ —
2016:Beginning balance $ (2) $ 18 $ (6) $ 26Transfer to affiliate — — (4) —Changes in fair value recognized in OCI — — — 3Changes in fair value recognized in net regulatory assets (1) — (5) —Redemptions — — — (11)Settlements 1 — 13 —Ending balance $ (2) $ 18 $ (2) $ 18
MidAmerican Energy's long-term debt is carried at cost on the Balance Sheets. The fair value of MidAmerican Energy's long-term debt is a Level 2 fair value measurement and has been estimated based upon quoted market prices, where available, or at thepresent value of future cash flows discounted at rates consistent with comparable maturities with similar credit risks. The carryingvalue of MidAmerican Energy's variable-rate long-term debt approximates fair value because of the frequent repricing of theseinstruments at market rates. The following table presents the carrying value and estimated fair value of MidAmerican Energy'slong-term debt (in millions):
As of September 30, 2017 As of December 31, 2016Carrying
ValueFair
ValueCarrying
ValueFair
Value
Long-term debt $ 4,894 $ 5,446 $ 4,301 $ 4,735
88
(8) Commitments and Contingencies
Natural Gas Commitments
During the nine-month period ended September 30, 2017, MidAmerican Energy amended certain of its natural gas supply andtransportation contracts increasing minimum payments by $247 million through 2021 and $70 million for 2022 through 2037.
Construction Commitments
During the nine-month period ended September 30, 2017, MidAmerican Energy entered into contracts totaling $675 million forthe construction of wind-powered generating facilities in 2017 through 2019, with remaining payments totaling $84 million forthe fourth quarter of 2017, $340 million in 2018 and $8 million in 2019.
Easements
During the nine-month period ended September 30, 2017, MidAmerican Energy entered into non-cancelable easements withminimum payments totaling $114 million through 2057 for land in Iowa on which some of its wind-powered generating facilitieswill be located.

Legal Matters
MidAmerican Energy is party to a variety of legal actions arising out of the normal course of business. Plaintiffs occasionally seekpunitive or exemplary damages. MidAmerican Energy does not believe that such normal and routine litigation will have a materialimpact on its financial results.
Environmental Laws and Regulations
MidAmerican Energy is subject to federal, state and local laws and regulations regarding air and water quality, emissionsperformance standards, climate change, coal combustion byproduct disposal, hazardous and solid waste disposal, protected speciesand other environmental matters that have the potential to impact its current and future operations. MidAmerican Energy believesit is in material compliance with all applicable laws and regulations.
Transmission Rates
MidAmerican Energy's wholesale transmission rates are set annually using FERC-approved formula rates subject to true-up foractual cost of service. Prior to September 2016, the rates in effect were based on a 12.38% return on equity ("ROE"). In November2013 and February 2015, a coalition of intervenors filed successive complaints with the FERC requesting that the 12.38% ROEno longer be found just and reasonable and sought to reduce the base ROE to 9.15% and 8.67%, respectively. MidAmerican Energyis authorized by the FERC to include a 0.50% adder beyond the base ROE effective January 2015. In September 2016, the FERCissued an order for the first complaint, which reduces the base ROE to 10.32% and requires refunds, plus interest, for the periodfrom November 2013 through February 2015. Customer refunds relative to the first complaint occurred in February 2017. It isuncertain when the FERC will rule on the second complaint, covering the period from February 2015 through May 2016.MidAmerican Energy believes it is probable that the FERC will order a base ROE lower than 12.38% in the second complaintand, as of September 30, 2017, has accrued a $9 million liability for refunds under the second complaint of amounts collectedunder the higher ROE from February 2015 through May 2016.
89
(9) Components of Accumulated Other Comprehensive Income (Loss), Net
The following table shows the change in accumulated other comprehensive income (loss), net by each component of othercomprehensive income, net of applicable income taxes (in millions):
Unrealized Unrealized AccumulatedLosses on Losses Other
Available-For-Sale on Cash Flow ComprehensiveSecurities Hedges Loss, Net
Balance, December 31, 2015 $ (3) $ (27) $ (30)Other comprehensive income 2 — 2Dividend — 27 27Balance at September 30, 2016 $ (1) $ — $ (1)
(10) Segment Information
MidAmerican Energy has identified two reportable segments: regulated electric and regulated gas. The regulated electric segmentderives most of its revenue from regulated retail sales of electricity to residential, commercial, and industrial customers and fromwholesale sales. The regulated gas segment derives most of its revenue from regulated retail sales of natural gas to residential,commercial, and industrial customers and also obtains revenue by transporting gas owned by others through its distribution system.Pricing for regulated electric and regulated gas sales are established separately by regulatory agencies; therefore, managementalso reviews each segment separately to make decisions regarding allocation of resources and in evaluating performance. Commonoperating costs, interest income, interest expense and income tax expense are allocated to each segment based on certain factors,which primarily relate to the nature of the cost.

The following tables provide information on a reportable segment basis (in millions):
Three-Month Periods Nine-Month PeriodsEnded September 30, Ended September 30,2017 2016 2017 2016
Operating revenue:Regulated electric $ 707 $ 692 $ 1,677 $ 1,572Regulated gas 103 102 485 430Other 3 1 4 2
Total operating revenue $ 813 $ 795 $ 2,166 $ 2,004
Depreciation and amortization:Regulated electric $ 101 $ 107 $ 338 $ 306Regulated gas 10 11 31 32
Total depreciation and amortization $ 111 $ 118 $ 369 $ 338
Operating income:Regulated electric $ 290 $ 289 $ 485 $ 481Regulated gas (2) (5) 45 42
Total operating income $ 288 $ 284 $ 530 $ 523
As of
September 30, 2017
December 31, 2016
Assets:Regulated electric $ 15,556 $ 14,113Regulated gas 1,339 1,345Other 7 1
Total assets $ 16,902 $ 15,459
90

91
REPORT OF INDEPENDENT REGISTERED PUBLIC ACCOUNTING FIRM
To the Board of Managers and Member ofMidAmerican Funding, LLC Des Moines, Iowa
We have reviewed the accompanying consolidated balance sheet of MidAmerican Funding, LLC and subsidiaries ("MidAmericanFunding") as of September 30, 2017, and the related consolidated statements of operations for the three-month and nine-monthperiods ended September 30, 2017 and 2016, and of changes in equity and cash flows for the nine-month periods endedSeptember 30, 2017 and 2016. These interim financial statements are the responsibility of MidAmerican Funding's management.
We conducted our reviews in accordance with the standards of the Public Company Accounting Oversight Board (United States)and with auditing standards generally accepted in the United States of America applicable to reviews of interim financialinformation. A review of interim financial information consists principally of applying analytical procedures and making inquiriesof persons responsible for financial and accounting matters. It is substantially less in scope than an audit conducted in accordancewith the standards of the Public Company Accounting Oversight Board (United States) and with auditing standards generallyaccepted in the United States of America, the objective of which is the expression of an opinion regarding the financial statementstaken as a whole. Accordingly, we do not express such an opinion.
Based on our reviews, we are not aware of any material modifications that should be made to such consolidated interim financialstatements for them to be in conformity with accounting principles generally accepted in the United States of America.
We have previously audited, in accordance with the standards of the Public Company Accounting Oversight Board (United States)and in accordance with auditing standards generally accepted in the United States of America, the consolidated balance sheet ofMidAmerican Funding, LLC and subsidiaries as of December 31, 2016, and the related consolidated statements of operations,comprehensive income, changes in equity, and cash flows for the year then ended (not presented herein); and in our report datedFebruary 24, 2017, we expressed an unqualified opinion on those consolidated financial statements. In our opinion, the informationset forth in the accompanying consolidated balance sheet as of December 31, 2016 is fairly stated, in all material respects, inrelation to the consolidated balance sheet from which it has been derived.
/s/ Deloitte & Touche LLP
Des Moines, IowaNovember 3, 2017

MIDAMERICAN FUNDING, LLC AND SUBSIDIARIESCONSOLIDATED BALANCE SHEETS (Unaudited)
(Amounts in millions)
As ofSeptember 30, December 31,
2017 2016ASSETS
Current assets:Cash and cash equivalents $ 512 $ 15Receivables, net 318 287Income taxes receivable — 9Inventories 235 264Other current assets 21 35
Total current assets 1,086 610
Property, plant and equipment, net 13,602 12,835Goodwill 1,270 1,270Regulatory assets 1,335 1,161Investments and restricted cash and investments 709 655Other assets 194 216
Total assets $ 18,196 $ 16,747
The accompanying notes are an integral part of these consolidated financial statements.
92

MIDAMERICAN FUNDING, LLC AND SUBSIDIARIESCONSOLIDATED BALANCE SHEETS (Unaudited) (continued)
(Amounts in millions)
As ofSeptember 30, December 31,
2017 2016LIABILITIES AND MEMBER'S EQUITY
Current liabilities:Accounts payable $ 256 $ 302Accrued interest 54 52Accrued property, income and other taxes 227 138Note payable to affiliate 52 31Short-term debt — 99Current portion of long-term debt 350 250Other current liabilities 159 160
Total current liabilities 1,098 1,032
Long-term debt 4,870 4,377Deferred income taxes 3,777 3,568Regulatory liabilities 927 883Asset retirement obligations 515 510Other long-term liabilities 307 291
Total liabilities 11,494 10,661
Commitments and contingencies (Note 8)
Member's equity:Paid-in capital 1,679 1,679Retained earnings 5,023 4,407
Total member's equity 6,702 6,086
Total liabilities and member's equity $ 18,196 $ 16,747
The accompanying notes are an integral part of these consolidated financial statements.
93

MIDAMERICAN FUNDING, LLC AND SUBSIDIARIESCONSOLIDATED STATEMENTS OF OPERATIONS (Unaudited)
(Amounts in millions)
Three-Month Periods Nine-Month PeriodsEnded September 30, Ended September 30,2017 2016 2017 2016
Operating revenue:Regulated electric $ 707 $ 692 $ 1,677 $ 1,572Regulated gas and other 108 105 493 436
Total operating revenue 815 797 2,170 2,008
Operating costs and expenses:Cost of fuel, energy and capacity 130 130 342 312Cost of gas sold and other 54 56 289 239Operations and maintenance 202 181 549 511Depreciation and amortization 111 118 369 338Property and other taxes 30 28 90 84
Total operating costs and expenses 527 513 1,639 1,484
Operating income 288 284 531 524
Other income (expense):Interest expense (59) (55) (177) (164)Allowance for borrowed funds 4 3 9 6Allowance for equity funds 11 6 25 14Other, net 6 3 14 9
Total other income (expense) (38) (43) (129) (135)
Income before income tax benefit 250 241 402 389Income tax benefit (133) (77) (214) (129)
Net income $ 383 $ 318 $ 616 $ 518
The accompanying notes are an integral part of these consolidated financial statements.
94

MIDAMERICAN FUNDING, LLC AND SUBSIDIARIESCONSOLIDATED STATEMENTS OF CHANGES IN EQUITY (Unaudited)
(Amounts in millions)
Paid-inCapital
RetainedEarnings
AccumulatedOther
ComprehensiveLoss, Net
TotalEquity
Balance, December 31, 2015 $ 1,679 $ 3,876 $ (30) $ 5,525Net income — 518 — 518Other comprehensive income — — 2 2Transfer to affiliate — — 27 27Other equity transactions — (1) — (1)Balance, September 30, 2016 $ 1,679 $ 4,393 $ (1) $ 6,071
Balance, December 31, 2016 $ 1,679 $ 4,407 $ — $ 6,086Net income — 616 — 616Balance, September 30, 2017 $ 1,679 $ 5,023 $ — $ 6,702
The accompanying notes are an integral part of these consolidated financial statements.
95

MIDAMERICAN FUNDING, LLC AND SUBSIDIARIESCONSOLIDATED STATEMENTS OF CASH FLOWS (Unaudited)
(Amounts in millions)
Nine-Month PeriodsEnded September 30,2017 2016
Cash flows from operating activities:Net income $ 616 $ 518Adjustments to reconcile net income to net cash flows from operating activities:
Depreciation and amortization 369 338Deferred income taxes and amortization of investment tax credits 64 113Changes in other assets and liabilities 28 34Other, net (24) (42)Changes in other operating assets and liabilities:
Receivables, net (31) (67)Inventories 29 (26)Derivative collateral, net 3 4Contributions to pension and other postretirement benefit plans, net (8) (5)Accounts payable (4) 14Accrued property, income and other taxes, net 96 160Other current assets and liabilities 14 24
Net cash flows from operating activities 1,152 1,065
Cash flows from investing activities:Utility construction expenditures (1,162) (1,129)Purchases of available-for-sale securities (126) (96)Proceeds from sales of available-for-sale securities 127 92Other, net (3) 5
Net cash flows from investing activities (1,164) (1,128)
Cash flows from financing activities:Proceeds from long-term debt 842 33Repayments of long-term debt (255) (38)Net change in note payable to affiliate 21 16Net repayments of short-term debt (99) —
Net cash flows from financing activities 509 11
Net change in cash and cash equivalents 497 (52)Cash and cash equivalents at beginning of period 15 103Cash and cash equivalents at end of period $ 512 $ 51
The accompanying notes are an integral part of these consolidated financial statements.
96

MIDAMERICAN FUNDING, LLC AND SUBSIDIARIESNOTES TO CONSOLIDATED FINANCIAL STATEMENTS
(Unaudited)
97
(1) General
MidAmerican Funding, LLC ("MidAmerican Funding") is an Iowa limited liability company with Berkshire Hathaway EnergyCompany ("BHE") as its sole member. BHE is a consolidated subsidiary of Berkshire Hathaway Inc. ("Berkshire Hathaway").MidAmerican Funding's direct, wholly owned subsidiary is MHC Inc. ("MHC"), which constitutes substantially all of MidAmericanFunding's assets, liabilities and business activities except those related to MidAmerican Funding's long-term debt securities. MHCconducts no business other than the ownership of its subsidiaries and related corporate services. MHC's principal subsidiary isMidAmerican Energy Company ("MidAmerican Energy"), a public utility with electric and natural gas operations. Direct, whollyowned nonregulated subsidiaries of MHC are Midwest Capital Group, Inc. and MEC Construction Services Co.
The unaudited Consolidated Financial Statements have been prepared in accordance with accounting principles generally acceptedin the United States of America ("GAAP") for interim financial information and the United States Securities and ExchangeCommission's rules and regulations for Form 10-Q and Article 10 of Regulation S-X. Accordingly, they do not include all of thedisclosures required by GAAP for annual financial statements. Management believes the unaudited Consolidated FinancialStatements contain all adjustments (consisting only of normal recurring adjustments) considered necessary for the fair presentationof the unaudited Consolidated Financial Statements as of September 30, 2017, and for the three- and nine-month periods endedSeptember 30, 2017 and 2016. The results of operations for the three- and nine-month periods ended September 30, 2017, are notnecessarily indicative of the results to be expected for the full year.
The preparation of the unaudited Consolidated Financial Statements in conformity with GAAP requires management to makeestimates and assumptions that affect the reported amounts of assets and liabilities at the date of the unaudited ConsolidatedFinancial Statements and the reported amounts of revenue and expenses during the period. Actual results may differ from theestimates used in preparing the unaudited Consolidated Financial Statements. Note 2 of Notes to Consolidated Financial Statementsincluded in MidAmerican Funding's Annual Report on Form 10-K for the year ended December 31, 2016, describes the mostsignificant accounting policies used in the preparation of the unaudited Consolidated Financial Statements. There have been nosignificant changes in MidAmerican Funding's assumptions regarding significant accounting estimates and policies during thenine-month period ended September 30, 2017.
(2) New Accounting Pronouncements
Refer to Note 2 of MidAmerican Energy's Notes to Financial Statements.
(3) Property, Plant and Equipment, Net
Refer to Note 3 of MidAmerican Energy's Notes to Financial Statements. In addition to MidAmerican Energy's property, plantand equipment, net, MidAmerican Funding had as of September 30, 2017 and December 31, 2016, nonregulated property grossof $25 million and $22 million, respectively, related accumulated depreciation and amortization of $10 million and $9 million,respectively, and construction work-in-progress of $- million and $1 million, respectively, which consisted primarily of a corporateaircraft owned by MHC.
(4) Recent Financing Transactions
Refer to Note 4 of MidAmerican Energy's Notes to Financial Statements.

(5) Income Taxes
A reconciliation of the federal statutory income tax rate to MidAmerican Funding's effective income tax rate applicable to incomebefore income tax benefit is as follows:
Three-Month Periods Nine-Month PeriodsEnded September 30, Ended September 30,2017 2016 2017 2016
Federal statutory income tax rate 35 % 35 % 35 % 35 %Income tax credits (76) (60) (76) (61)State income tax, net of federal income tax benefit (10) (7) (8) (4)Effects of ratemaking (2) — (4) (3)
Effective income tax rate (53)% (32)% (53)% (33)%
Income tax credits relate primarily to production tax credits from MidAmerican Energy's wind-powered generating facilities.Federal renewable electricity production tax credits are earned as energy from qualifying wind-powered generating facilities isproduced and sold and are based on a per-kilowatt hour rate pursuant to the applicable federal income tax law. Wind-poweredgenerating facilities are eligible for the credits for 10 years from the date the qualifying generating facilities are placed in-service.
Berkshire Hathaway includes BHE and subsidiaries in its United States federal income tax return. Consistent with establishedregulatory practice, MidAmerican Funding's and MidAmerican Energy's provisions for income taxes have been computed on astand-alone basis, and substantially all of their currently payable or receivable income taxes are remitted to or received from BHE.MidAmerican Funding received net cash payments for income taxes from BHE totaling $386 million and $422 million for thenine-month periods ended September 30, 2017 and 2016, respectively.
98
(6) Employee Benefit Plans
Refer to Note 6 of MidAmerican Energy's Notes to Financial Statements.
(7) Fair Value Measurements
Refer to Note 7 of MidAmerican Energy's Notes to Financial Statements. MidAmerican Funding's long-term debt is carried atcost on the Consolidated Financial Statements. The fair value of MidAmerican Funding's long-term debt is a Level 2 fair valuemeasurement and has been estimated based upon quoted market prices, where available, or at the present value of future cashflows discounted at rates consistent with comparable maturities with similar credit risks. The carrying value of MidAmericanFunding's variable-rate long-term debt approximates fair value because of the frequent repricing of these instruments at marketrates. The following table presents the carrying value and estimated fair value of MidAmerican Funding's long-term debt(in millions):
As of September 30, 2017 As of December 31, 2016Carrying
ValueFair
ValueCarrying
ValueFair
Value
Long-term debt $ 5,220 $ 5,873 $ 4,627 $ 5,164
(8) Commitments and Contingencies
MidAmerican Funding is party to a variety of legal actions arising out of the normal course of business. Plaintiffs occasionallyseek punitive or exemplary damages. MidAmerican Funding does not believe that such normal and routine litigation will have amaterial impact on its consolidated financial results.
Refer to Note 8 of MidAmerican Energy's Notes to Financial Statements.
(9) Components of Accumulated Other Comprehensive Income (Loss), Net
Refer to Note 9 of MidAmerican Energy's Notes to Financial Statements.
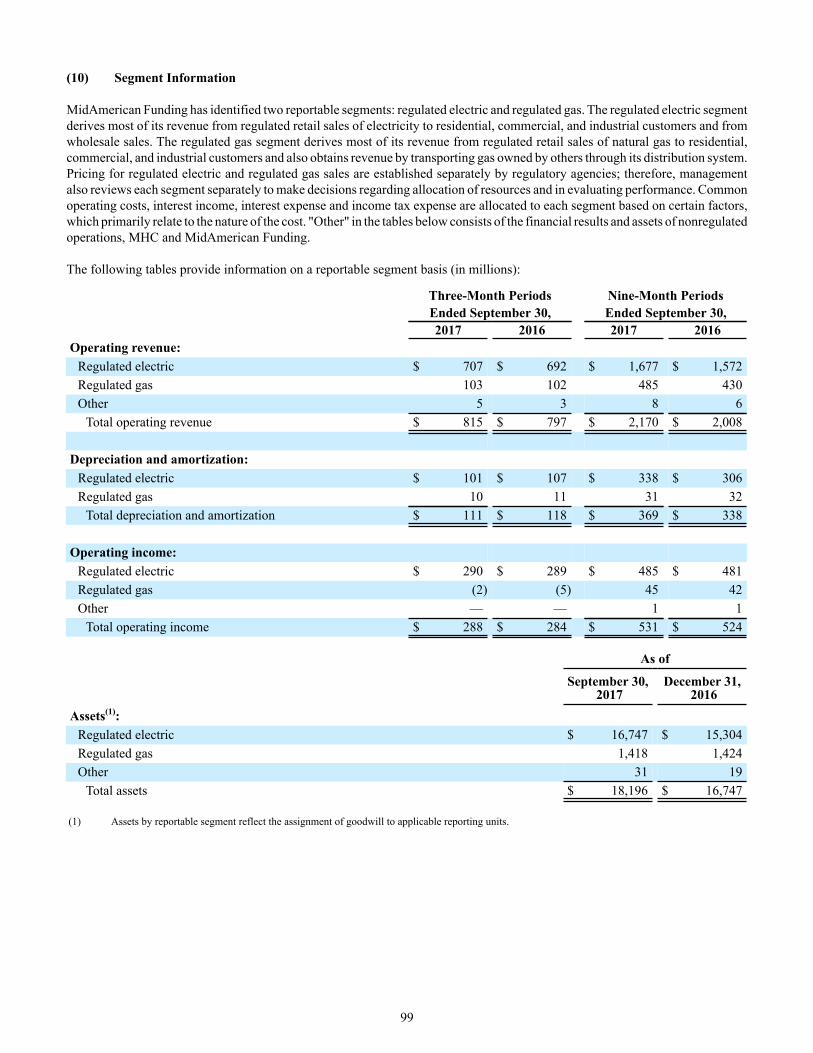
99
(10) Segment Information
MidAmerican Funding has identified two reportable segments: regulated electric and regulated gas. The regulated electric segmentderives most of its revenue from regulated retail sales of electricity to residential, commercial, and industrial customers and fromwholesale sales. The regulated gas segment derives most of its revenue from regulated retail sales of natural gas to residential,commercial, and industrial customers and also obtains revenue by transporting gas owned by others through its distribution system.Pricing for regulated electric and regulated gas sales are established separately by regulatory agencies; therefore, managementalso reviews each segment separately to make decisions regarding allocation of resources and in evaluating performance. Commonoperating costs, interest income, interest expense and income tax expense are allocated to each segment based on certain factors,which primarily relate to the nature of the cost. "Other" in the tables below consists of the financial results and assets of nonregulatedoperations, MHC and MidAmerican Funding.
The following tables provide information on a reportable segment basis (in millions):
Three-Month Periods Nine-Month PeriodsEnded September 30, Ended September 30,2017 2016 2017 2016
Operating revenue:Regulated electric $ 707 $ 692 $ 1,677 $ 1,572Regulated gas 103 102 485 430Other 5 3 8 6
Total operating revenue $ 815 $ 797 $ 2,170 $ 2,008
Depreciation and amortization:Regulated electric $ 101 $ 107 $ 338 $ 306Regulated gas 10 11 31 32
Total depreciation and amortization $ 111 $ 118 $ 369 $ 338
Operating income:Regulated electric $ 290 $ 289 $ 485 $ 481Regulated gas (2) (5) 45 42Other — — 1 1
Total operating income $ 288 $ 284 $ 531 $ 524
As of
September 30, 2017
December 31, 2016
Assets(1):Regulated electric $ 16,747 $ 15,304Regulated gas 1,418 1,424Other 31 19
Total assets $ 18,196 $ 16,747
(1) Assets by reportable segment reflect the assignment of goodwill to applicable reporting units.

Item 2. Management's Discussion and Analysis of Financial Condition and Results of Operations
MidAmerican Funding is an Iowa limited liability company whose sole member is BHE. MidAmerican Funding owns all of theoutstanding common stock of MHC Inc., which owns all of the common stock of MidAmerican Energy, Midwest Capital Group,Inc. and MEC Construction Services Co. MidAmerican Energy is a public utility company headquartered in Des Moines, Iowa.MHC Inc., MidAmerican Funding and BHE are also headquartered in Des Moines, Iowa.
The following is management's discussion and analysis of certain significant factors that have affected the consolidated financialcondition and results of operations of MidAmerican Funding and its subsidiaries and MidAmerican Energy as presented in thisjoint filing. Information in Management's Discussion and Analysis related to MidAmerican Energy, whether or not segregated,also relates to MidAmerican Funding. Information related to other subsidiaries of MidAmerican Funding pertains only to thediscussion of the financial condition and results of operations of MidAmerican Funding. Where necessary, discussions have beensegregated under the heading "MidAmerican Funding" to allow the reader to identify information applicable only to MidAmericanFunding. Explanations include management's best estimate of the impact of weather, customer growth and other factors. Thisdiscussion should be read in conjunction with the historical unaudited Financial Statements and Notes to Financial Statements inPart I, Item 1 of this Form 10-Q. MidAmerican Energy's and MidAmerican Funding's actual results in the future could differsignificantly from the historical results.
100
Results of Operations for the Third Quarter and First Nine Months of 2017 and 2016
Overview
MidAmerican Energy -
MidAmerican Energy's net income for the third quarter of 2017 was $385 million, an increase of $65 million, or 20%, comparedto 2016 due to higher recognized production tax credits of $45 million, higher margins of $11 million, excluding the impact ofdemand side management program revenue (offset in operations and maintenance expense), lower depreciation and amortizationof $7 million, substantially from changes in accruals for Iowa regulatory arrangements, and higher allowance for borrowed andequity funds of $6 million, partially offset by higher operations and maintenance expenses, primarily from higher generatingfacility maintenance, including additional wind turbines. The increase in electric margins of $7 million, excluding the impact ofdemand side management program revenue (offset in operations and maintenance expense), reflects higher recoveries throughbill riders, higher transmission revenue and higher retail customer volumes from industrial growth net of lower residential andcommercial volumes due to milder temperatures, partially offset by lower wholesale revenue from lower sales volumes and prices.
MidAmerican Energy's net income for the first nine months of 2017 was $624 million, an increase of $97 million, or 18%, comparedto 2016 primarily due to higher margins of $64 million, excluding the impact of demand side management program revenue (offsetin operations and maintenance expense), higher recognized production tax credits of $71 million and higher allowance for borrowedand equity funds of $14 million, partially offset by higher operations and maintenance expenses of $21 million, primarily fromhigher maintenance from additional wind turbines, and higher depreciation and amortization of $31 million from accruals for Iowaregulatory arrangements and wind-powered generating facilities placed in-service in the second half of 2016, net of a reductionin depreciation rates in December 2016. The increase in electric margins of $60 million, excluding the impact of demand sidemanagement program revenue (offset in operations and maintenance expense), reflects higher recoveries through bill riders, higherwholesale revenue from higher sales volumes and prices, higher transmission revenue and higher retail customer volumes fromindustrial growth, net of lower residential and commercial volumes due to milder temperatures, partially offset by higher coal-fueled generation and purchased power costs.
MidAmerican Funding -
MidAmerican Funding's net income for the third quarter of 2017 was $383 million, an increase of $65 million, or 20%, comparedto 2016. MidAmerican Funding's net income for the first nine months of 2017 was $616 million, an increase of $98 million, or19%, compared to 2016.The increases were primarily due to the changes in MidAmerican Energy's earnings discussed above.

Regulated Electric Gross Margin
A comparison of key operating results related to regulated electric gross margin is as follows:
Third Quarter First Nine Months2017 2016 Change 2017 2016 Change
Gross margin (in millions):Operating revenue $ 707 $ 692 $ 15 2 % $ 1,677 $ 1,572 $ 105 7 %Cost of fuel, energy and capacity 130 130 — — 342 312 30 10
Gross margin $ 577 $ 562 $ 15 3 $ 1,335 $ 1,260 $ 75 6
Electricity Sales (GWh):Residential 1,790 1,969 (179) (9)% 4,753 5,018 (265) (5)%Commercial 987 1,023 (36) (4) 2,796 2,859 (63) (2)Industrial 3,366 3,106 260 8 9,621 8,999 622 7Other 411 427 (16) (4) 1,185 1,213 (28) (2)
Total retail 6,554 6,525 29 — 18,355 18,089 266 1Wholesale 1,571 2,037 (466) (23) 7,162 5,620 1,542 27
Total sales 8,125 8,562 (437) (5) 25,517 23,709 1,808 8
Average number of retail customers (inthousands) 771 761 10 1 % 769 759 10 1 %
Average revenue per MWh:Retail $ 98.15 $ 94.02 $ 4.13 4 % $ 78.62 $ 76.75 $ 1.87 2 %Wholesale $ 25.57 $ 28.13 $ (2.56) (9)% $ 23.90 $ 22.84 $ 1.06 5 %
Heating degree days 44 27 17 63 % 3,203 3,388 (185) (5)%Cooling degree days 752 855 (103) (12)% 1,098 1,284 (186) (14)%
Sources of energy (GWh)(1):Coal 4,354 4,618 (264) (6)% 11,019 9,907 1,112 11 %Nuclear 961 1,003 (42) (4) 2,820 2,887 (67) (2)Natural gas 257 307 (50) (16) 274 515 (241) (47)Wind and other(2) 1,929 1,950 (21) (1) 9,129 7,981 1,148 14
Total energy generated 7,501 7,878 (377) (5) 23,242 21,290 1,952 9Energy purchased 812 916 (104) (11) 2,756 3,030 (274) (9)
Total 8,313 8,794 (481) (5) 25,998 24,320 1,678 7
(1) GWh amounts are net of energy used by the related generating facilities.
(2) All or some of the renewable energy attributes associated with generation from these generating facilities may be: (a) used in future years to complywith renewable portfolio standards or other regulatory requirements or (b) sold to third parties in the form of renewable energy credits or otherenvironmental commodities.
101

Regulated electric gross margin increased $15 million for the third quarter of 2017 compared to 2016 primarily due to:
(1) Higher retail gross margin of $16 million due to -
• an increase of $38 million from higher recoveries through bill riders; • an increase of $3 million from non-weather-related usage factors, including higher industrial sales volumes;• a decrease of $12 million from the impact of milder temperatures; and• a decrease of $13 million from higher retail energy costs primarily due to higher coal-fueled generation and higher
purchased power costs;
(2) Higher Multi-Value Projects ("MVPs") transmission revenue of $6 million due to continued capital additions; and
(3) Lower wholesale gross margin of $7 million due to lower margins per unit from lower market prices and lower sales volumes.
Regulated electric gross margin increased $75 million for the first nine months of 2017 compared to 2016 primarily due to:
(1) Higher wholesale gross margin of $37 million primarily due to higher margins per unit from higher market prices and highersales volumes enabled by greater availability of lower cost generation;
(2) Higher retail gross margin of $25 million due to -
• an increase of $47 million from higher recoveries through bill riders; • an increase of $28 million from non-weather-related usage factors, including higher industrial sales volumes;• a decrease of $25 million from higher retail energy costs primarily due to higher coal-fueled generation and higher
purchased power costs; and• a decrease of $25 million from the impact of milder temperatures; and
(3) Higher MVPs transmission revenue of $11 million due to continued capital additions.
102

Regulated Gas Gross Margin
A comparison of key operating results related to regulated gas gross margin is as follows:
Third Quarter First Nine Months2017 2016 Change 2017 2016 Change
Gross margin (in millions):Operating revenue $ 103 $ 102 $ 1 1 % $ 485 $ 430 $ 55 13 %Cost of gas sold 54 54 — — 288 236 52 22
Gross margin $ 49 $ 48 $ 1 2 $ 197 $ 194 $ 3 2
Natural gas throughput (000's Dth):Residential 2,773 2,820 (47) (2) % 29,442 31,121 (1,679) (5) %Commercial 1,788 1,840 (52) (3) 14,797 15,729 (932) (6)Industrial 717 922 (205) (22) 3,070 3,574 (504) (14)Other 2 1 1 100 29 26 3 12
Total retail sales 5,280 5,583 (303) (5) 47,338 50,450 (3,112) (6)Wholesale sales 8,815 8,568 247 3 29,111 28,615 496 2
Total sales 14,095 14,151 (56) — 76,449 79,065 (2,616) (3)Gas transportation service 19,784 18,087 1,697 9 65,431 60,117 5,314 9
Total gas throughput 33,879 32,238 1,641 5 141,880 139,182 2,698 2
Average number of retail customers (inthousands) 746 738 8 1 % 747 738 9 1 %
Average revenue per retail Dth sold $ 13.33 $ 12.77 $ 0.56 4 % $ 7.93 $ 6.80 $ 1.13 17 %Average cost of natural gas per retail Dth
sold $ 5.56 $ 5.49 $ 0.07 1 % $ 4.33 $ 3.45 $ 0.88 26 %
Combined retail and wholesale averagecost of natural gas per Dth sold $ 3.82 $ 3.82 $ — — % $ 3.76 $ 2.99 $ 0.77 26 %
Heating degree days 45 27 18 67 % 3,406 3,572 (166) (5) %
Regulated gas revenue includes purchased gas adjustment clauses through which MidAmerican Energy is allowed to recover thecost of gas sold from its retail gas utility customers. Consequently, fluctuations in the cost of gas sold do not directly affect grossmargin or net income because regulated gas revenue reflects comparable fluctuations through the purchased gas adjustment clauses.For the first nine months of 2017, MidAmerican Energy's combined retail and wholesale average per-unit cost of gas sold increased26%, resulting in an increase of $59 million in gas revenue and cost of gas sold compared to 2016, partially offset by lower gassales volumes.
Regulated gas gross margin increased $1 million for the third quarter of 2017 compared to 2016 due to higher recoveries of demandside management program revenue (offset in operations and maintenance expense).
Regulated gas gross margin increased $3 million for the first nine months of 2017 compared to 2016 primarily due to -
(1) higher recoveries of demand side management program revenue (offset in operations and maintenance expense) of$2 million;
(2) a higher average per-unit margin of $2 million;
(3) higher gas transportation throughput of $1 million, and
(4) lower retail sales volumes of $3 million from warmer winter temperatures.
103

Operating Costs and Expenses
MidAmerican Energy -
Operations and maintenance increased $20 million for the third quarter of 2017 compared to 2016 primarily due to higher demandside management program expense (offset in operating revenue) of $8 million, higher wind-powered generation maintenance fromadditional wind turbines of $6 million and higher coal-fueled and nuclear generation maintenance of $4 million.
Operations and maintenance increased $37 million for the first nine months of 2017 compared to 2016 primarily due to higherdemand side management program expense (offset in operating revenue) of $17 million, higher wind-powered generationmaintenance from additional wind turbines of $13 million and higher coal-fueled and nuclear generation maintenance of $4 million.
Depreciation and amortization decreased $7 million for the third quarter of 2017 compared to 2016 due to lower accruals for Iowaregulatory arrangements of $9 million and $9 million from lower depreciation rates implemented in December 2016, partiallyoffset by utility plant additions, including wind-powered generating facilities placed in-service in the second half of 2016.
Depreciation and amortization increased $31 million for the first nine months of 2017 compared to 2016 due to utility plantadditions, including wind-powered generating facilities placed in-service in the second half of 2016, accruals for Iowa regulatoryarrangements of $26 million, partially offset by $26 million from lower depreciation rates implemented in December 2016.
Property and other taxes increased $2 million and $6 million for the third quarter and first nine months of 2017 compared to 2016primarily due to higher Iowa utility property replacement taxes.
Other Income (Expense)
MidAmerican Energy -
Interest expense increased $4 million and $13 million for the third quarter and first nine months of 2017, respectively, comparedto 2016 due to higher interest expense from the issuance of $850 million of first mortgage bonds in February 2017, partially offsetby the redemption of a $250 million of 5.95% Senior Notes in February 2017.
Allowance for borrowed and equity funds increased $6 million and $14 million for the third quarter and first nine months of 2017,respectively, compared to 2016 primarily due to higher construction work-in-progress balances related to wind-powered generation.
Other, net increased $2 million and $5 million for the third quarter and first nine months of 2017, respectively, compared to 2016primarily due to higher returns on corporate-owned life insurance policies.
Income Tax Benefit
MidAmerican Energy -
MidAmerican Energy's income tax benefit increased $57 million for the third quarter of 2017 compared to 2016, and the effectivetax rate was (52)% for 2017 and (30)% for 2016. For the first nine months of 2017 compared to 2016, MidAmerican Energy'sincome tax benefit increased $84 million, and the effective tax rate was (50)% for 2017 and (30)% for 2016. The changes in theeffective tax rates for 2017 compared to 2016 were substantially due to an increase in recognized production tax credits and theeffects of ratemaking.
Production tax credits are recognized in earnings for interim periods based on the application of an estimated annual effective taxrate to pretax earnings. Federal renewable electricity production tax credits are earned as energy from qualifying wind-poweredgenerating facilities is produced and sold and are based on a per-kilowatt hour rate pursuant to the applicable federal income taxlaw. Wind-powered generating facilities are eligible for the credits for 10 years from the date the qualifying generating facilitieswere placed in service. Production tax credits recognized in the first nine months of 2017 were $306 million, or $71 million higherthan the first nine months of 2016, while production tax credits earned in the first nine months of 2017 were $200 million, or$29 million higher than the first nine months of 2016 primarily due to wind-powered generation placed in-service in late 2016.The excess of production tax credits recognized over earned of $106 million as of September 30, 2017, will reduce earnings overthe remainder of 2017.
104

MidAmerican Funding -
MidAmerican Funding's income tax benefit increased $56 million for the third quarter of 2017 compared to 2016, and the effectivetax rate was (53)% for 2017 and (32)% for 2016. MidAmerican Funding's income tax benefit increased $85 million for the firstnine months of 2017 compared to 2016, and the effective tax rate was (53)% for 2017 and (33)% for 2016.The changes in theeffective tax rates were principally due to the factors discussed for MidAmerican Energy.
105
Liquidity and Capital Resources
As of September 30, 2017, MidAmerican Energy's total net liquidity was $1,197 million consisting of $512 million of cash andcash equivalents and $905 million of credit facilities reduced by $220 million of the credit facilities reserved to supportMidAmerican Energy's variable-rate tax-exempt bond obligations. As of September 30, 2017, MidAmerican Funding's total netliquidity was $1,201 million, including MHC Inc.'s $4 million credit facility.
Operating Activities
MidAmerican Energy's net cash flows from operating activities for the nine-month periods ended September 30, 2017 and 2016,were $1,171 million and $1,080 million, respectively. MidAmerican Funding's net cash flows from operating activities for thenine-month periods ended September 30, 2017 and 2016, were $1,152 million and $1,065 million, respectively. Cash flows fromoperating activities increased primarily due to higher cash gross margins for MidAmerican Energy's regulated electric business,including fuel inventory reductions, partially offset by the timing of MidAmerican Energy's income tax cash flows with BHE.MidAmerican Energy's income tax cash flows with BHE totaled net cash receipts from BHE of $381 million and $416 million,respectively. Income tax cash flows for 2016 reflect the receipt of $106 million of income tax benefits generated in 2015. Thetiming of MidAmerican Energy's income tax cash flows from period to period can be significantly affected by the estimated federalincome tax payment methods and assumptions for each payment date.
In December 2015, the Protecting Americans from Tax Hikes Act of 2015 ("PATH") was signed into law, extending bonusdepreciation for qualifying property acquired and placed in service before January 1, 2020 (bonus depreciation rates will be 50%for 2015-2017, 40% in 2018, and 30% in 2019), with an additional year for certain longer lived assets. Production tax credits wereextended and phased-out for wind power and other forms of non-solar renewable energy projects that begin construction beforethe end of 2019. Production tax credits are maintained at the following levels for projects for which construction begins beforethe end of the respective year as follows: at full value for 2016, at 80% of value for 2017, at 60% of value for 2018, and 40% ofvalue for 2019. As a result of PATH, MidAmerican Energy's cash flows from operations are expected to benefit due to bonusdepreciation on qualifying assets placed in service through 2019 and production tax credits earned on qualifying wind projectsthrough 2029.
Investing Activities
MidAmerican Energy's net cash flows from investing activities for the nine-month periods ended September 30, 2017 and 2016,were $(1,161) million and $(1,128) million, respectively. MidAmerican Funding's net cash flows from investing activities for thenine-month periods ended September 30, 2017 and 2016, were $(1,164) million and $(1,128) million, respectively. Net cash flowsfrom investing activities consist almost entirely of utility construction expenditures, which increased due to higher environmentaland other operating construction expenditures. Purchases and proceeds related to available-for-sale securities primarily consist ofactivity within the Quad Cities Generating Station nuclear decommissioning trust.
Financing Activities
MidAmerican Energy's net cash flows from financing activities for the nine-month periods ended September 30, 2017 and 2016were $488 million and $(5) million, respectively. MidAmerican Funding's net cash flows from financing activities for the nine-month periods ended September 30, 2017 and 2016, were $509 million and $11 million, respectively. In February 2017,MidAmerican Energy issued $375 million of its 3.10% First Mortgage Bonds due May 2027 and $475 million of its 3.95% FirstMortgage Bonds due August 2047. An amount equal to the net proceeds was used to finance capital expenditures disbursed duringthe period from February 2, 2016 to February 1, 2017, with respect to investments in MidAmerican Energy's 551-megawatt Wind Xand 2,000-megawatt Wind XI projects, which were previously financed with MidAmerican Energy's general funds. InFebruary 2017, MidAmerican Energy redeemed in full through optional redemption its $250 million of 5.95% Senior Notes dueJuly 2017. In January 2016, MidAmerican Energy repaid $4 million of variable-rate tax-exempt pollution control refunding revenuebonds due January 2016. Through its commercial paper program, MidAmerican Energy made payments totaling $99 million in2017. MidAmerican Funding received $21 million and $16 million in 2017 and 2016, respectively, through its note payable withBHE.

Debt Authorizations and Related Matters
MidAmerican Energy has authority from the FERC to issue through February 28, 2019, commercial paper and bank notesaggregating $905 million at interest rates not to exceed the applicable London Interbank Offered Rate plus a spread of up to400 basis points. MidAmerican Energy has a $900 million unsecured credit facility expiring in June 2020. MidAmerican Energymay request that the banks extend the credit facility up to two years. The credit facility, which supports MidAmerican Energy'scommercial paper program and its variable-rate tax-exempt bond obligations and provides for the issuance of letters of credit, hasa variable interest rate based on the Eurodollar rate or a base rate, at MidAmerican Energy's option, plus a spread that varies basedon MidAmerican Energy's credit ratings for senior unsecured long-term debt securities. Additionally, MidAmerican Energy hasa $5 million unsecured credit facility for general corporate purposes.
MidAmerican Energy currently has an effective registration statement with the United States Securities and Exchange Commissionto issue an indeterminate amount of long-term debt securities through September 16, 2018. MidAmerican Energy has authorizationfrom the FERC to issue, through August 31, 2019, preferred stock up to an aggregate of $500 million and long-term debt securitiesup to an aggregate of $2.4 billion at interest rates not to exceed the applicable United States Treasury rate plus a spread of 175basis points. Additionally, MidAmerican Energy has authorization from the Illinois Commerce Commission to issue preferredstock up to an aggregate of $500 million through November 1, 2020 and additional long-term debt securities up to an aggregateof $2.4 billion of additional long-term debt securities, of which $350 million expires March 15, 2018, $150 million expiresSeptember 22, 2018, $500 million expires March 15, 2019 and $1.4 billion expires November 1, 2020.
In conjunction with the March 1999 merger, MidAmerican Energy committed to the IUB to use commercially reasonable effortsto maintain an investment grade rating on its long-term debt and to maintain its common equity level above 42% of totalcapitalization unless circumstances beyond its control result in the common equity level decreasing to below 39% of totalcapitalization. MidAmerican Energy must seek the approval of the IUB of a reasonable utility capital structure if MidAmericanEnergy's common equity level decreases below 42% of total capitalization, unless the decrease is beyond the control ofMidAmerican Energy. MidAmerican Energy is also required to seek the approval of the IUB if MidAmerican Energy's equitylevel decreases to below 39%, even if the decrease is due to circumstances beyond the control of MidAmerican Energy. IfMidAmerican Energy's common equity level were to drop below the required thresholds, MidAmerican Energy's ability to issuedebt could be restricted. As of September 30, 2017, MidAmerican Energy's common equity ratio was 53% computed on a basisconsistent with its commitment.
Future Uses of Cash
MidAmerican Energy and MidAmerican Funding have available a variety of sources of liquidity and capital resources, both internaland external, including net cash flows from operating activities, public and private debt offerings, the issuance of commercialpaper, the use of unsecured revolving credit facilities, and other sources. These sources are expected to provide funds required forcurrent operations, capital expenditures, debt retirements and other capital requirements. The availability and terms under whichMidAmerican Energy and MidAmerican Funding have access to external financing depends on a variety of factors, including theircredit ratings, investors' judgment of risk and conditions in the overall capital markets, including the condition of the utility industry.
Utility Construction Expenditures
MidAmerican Energy's primary need for capital is utility construction expenditures. Capital expenditure needs are reviewedregularly by management and may change significantly as a result of these reviews, which may consider, among other factors,changes in environmental and other rules and regulations; impacts to customers' rates; outcomes of regulatory proceedings; changesin income tax laws; general business conditions; load projections; system reliability standards; the cost and efficiency of constructionlabor, equipment and materials; commodity prices; and the cost and availability of capital.
106

MidAmerican Energy's historical and forecast capital expenditures, each of which exclude amounts for non-cash equity AFUDCand other non-cash items, are as follows (in millions):
Nine-Month Periods AnnualEnded September 30, Forecast
2016 2017 2017
Wind-powered generation $ 732 $ 455 $ 709Wind-powered generation repowering — 272 496Transmission Multi-Value Projects 73 18 25Other 324 417 773
Total $ 1,129 $ 1,162 $ 2,003
MidAmerican Energy's forecast utility construction expenditures for 2017 include the following:
• The construction of 2,000 MW (nominal ratings) of wind-powered generating facilities expected to be placed in-servicein 2017 through 2019. In August 2016, the IUB issued an order approving ratemaking principles related to MidAmericanEnergy's construction of up to 2,000 MW (nominal ratings) of additional wind-powered generating facilities expected tobe placed in service in 2017 through 2019. The ratemaking principles establish a cost cap of $3.6 billion, includingAFUDC, and a fixed rate of return on equity of 11.0% over the proposed 40-year useful lives of those facilities in anyfuture Iowa rate proceeding. The cost cap ensures that as long as total costs are below the cap, the investment will bedeemed prudent in any future Iowa rate proceeding. Additionally, the ratemaking principles modify the revenue sharingmechanism currently in effect. The revised sharing mechanism will be effective in 2018 and will be triggered each yearby actual equity returns above the weighted average return on equity for MidAmerican Energy calculated annually.Pursuant to the change in revenue sharing, MidAmerican Energy will share 100% of the revenue in excess of this triggerwith customers. Such revenue sharing will reduce coal and nuclear generation rate base, which is intended to mitigatefuture base rate increases. Each of these projects is expected to qualify for 100% of production tax credits currentlyavailable.
• The repowering of certain existing wind-powered generating facilities in Iowa. This project entails the replacement ofsignificant components of the oldest turbines in MidAmerican Energy’s fleet. The energy production from such repoweredfacilities is expected to qualify for 100% of the federal production tax credits available for ten years following completion.Under MidAmerican Energy's Iowa electric tariff, federal production tax credits related to facilities that were in-serviceprior to 2013 must be included in its Iowa energy adjustment clause. In August 2017, the IUB approved a tariff changethat excludes from MidAmerican Energy's Iowa energy adjustment clause any future federal production tax credits relatedto these repowered facilities.
• Transmission MVP investments. MidAmerican Energy has approval from the Midcontinent Independent System Operator,Inc. for the construction of four MVPs located in Iowa and Illinois, which, when complete, will have added approximately250 miles of 345 kV transmission line to MidAmerican Energy's transmission system since 2012.
• Remaining costs primarily relate to routine expenditures for generation, transmission, distribution and other infrastructureneeded to serve existing and expected demand.
Contractual Obligations
As of September 30, 2017, there have been no material changes outside the normal course of business in MidAmerican Energy'sand MidAmerican Funding's contractual obligations from the information provided in Item 7 of their Annual Report on Form 10-K for the year ended December 31, 2016.
107
Regulatory Matters
MidAmerican Energy is subject to comprehensive regulation. Refer to "Regulatory Matters" in Berkshire Hathaway Energy'sPart I, Item 2 of this Form 10-Q for discussion regarding MidAmerican Energy's current regulatory matters.

Quad Cities Generating Station Operating Status
Exelon Generation Company, LLC ("Exelon Generation"), the operator of Quad Cities Generating Station Units 1 and 2 ("QuadCities Station") of which MidAmerican Energy has a 25% ownership interest, announced on June 2, 2016, its intention to shutdown Quad Cities Station on June 1, 2018, as a result of Illinois not passing adequate legislation and Quad Cities Station notclearing the 2019-2020 PJM Interconnection, L.L.C. capacity auction. MidAmerican Energy expressed to Exelon Generation itsdesire for the continued operation of the facility through the end of its operating license in 2032 and worked with Exelon Generationon solutions to that end. In December 2016, Illinois passed legislation creating a zero emission standard, which went into effectJune 1, 2017. The zero emission standard requires the Illinois Power Agency to purchase zero emission credits and recover thecosts from certain ratepayers in Illinois, subject to certain limitations. The proceeds from the zero emission credits will provideExelon Generation additional revenue through 2027 as an incentive for continued operation of Quad Cities Station. For the nuclearassets already in rate base, MidAmerican Energy's customers will not be charged for the subsidy, and MidAmerican Energy willnot receive additional revenue from the subsidy.
On February 14, 2017, two lawsuits were filed with the United States District Court for the Northern District of Illinois ("NorthernDistrict of Illinois") against the Illinois Power Agency alleging that the state’s zero emission credit program violates certainprovisions of the U.S. Constitution. Both complaints argue that the Illinois zero emission credit program will distort the FERC’senergy and capacity market auction system of setting wholesale prices. As majority owner and operator of Quad Cities Station,Exelon Generation intervened in both suits and filed motions to dismiss in both matters. On July 14, 2017, the Northern Districtof Illinois granted the motions to dismiss. On July 17, 2017, the plaintiffs filed appeals with the United States Court of Appealsfor the Seventh Circuit. The procedural schedule has been established for the appeals. MidAmerican Energy cannot predict theoutcome of these lawsuits.
On January 9, 2017, the Electric Power Supply Association filed two requests with the FERC seeking to expand Minimum PriceOffer Rule ("MOPR") provisions to apply to existing resources receiving zero emission credit compensation. If successful, anexpanded MOPR could result in an increased risk of Quad Cities Station not clearing in future capacity auctions and ExelonGeneration no longer receiving capacity revenues for the facility. As majority owner and operator of Quad Cities Station, ExelonGeneration has filed protests at the FERC in response to each filing. The timing of the FERC’s decision with respect to bothproceedings is currently unknown and the outcome of these matters is currently uncertain.
Environmental Laws and Regulations
MidAmerican Energy is subject to federal, state and local laws and regulations regarding air and water quality, emissionsperformance standards, climate change, coal combustion byproduct disposal, hazardous and solid waste disposal, protected speciesand other environmental matters that have the potential to impact its current and future operations. In addition to imposing continuingcompliance obligations and capital expenditure requirements, these laws and regulations provide regulators with the authority tolevy substantial penalties for noncompliance including fines, injunctive relief and other sanctions. These laws and regulations areadministered by the EPA and various state and local agencies. All such laws and regulations are subject to a range of interpretation,which may ultimately be resolved by the courts. Environmental laws and regulations continue to evolve, and MidAmerican Energyis unable to predict the impact of the changing laws and regulations on its operations and consolidated financial results.MidAmerican Energy believes it is in material compliance with all applicable laws and regulations. Refer to "Liquidity and CapitalResources" for discussion of MidAmerican Energy's forecast environmental-related capital expenditures.
Refer to "Environmental Laws and Regulations" in Berkshire Hathaway Energy's Part I, Item 2 of this Form 10-Q for additionalinformation regarding environmental laws and regulations.
108
New Accounting Pronouncements
For a discussion of new accounting pronouncements affecting MidAmerican Energy and MidAmerican Funding, refer to Note 2of Notes to Consolidated Financial Statements in Part I, Item 1 of this Form 10-Q.

Critical Accounting Estimates
Certain accounting measurements require management to make estimates and judgments concerning transactions that will besettled several years in the future. Amounts recognized on the Financial Statements based on such estimates involve numerousassumptions subject to varying and potentially significant degrees of judgment and uncertainty and will likely change in the futureas additional information becomes available. Estimates are used for, but not limited to, the accounting for the effects of certaintypes of regulation, derivatives, impairment of goodwill and long-lived assets, pension and other postretirement benefits, incometaxes and revenue recognition - unbilled revenue. For additional discussion of MidAmerican Energy's and MidAmerican Funding'scritical accounting estimates, see Item 7 of their Annual Report on Form 10-K for the year ended December 31, 2016. There havebeen no significant changes in MidAmerican Energy's and MidAmerican Funding's assumptions regarding critical accountingestimates since December 31, 2016.
109

Nevada Power Company and its subsidiaries Consolidated Financial Section
110

PART IItem 1. Financial Statements
111
REPORT OF INDEPENDENT REGISTERED PUBLIC ACCOUNTING FIRM
To the Board of Directors and Shareholder ofNevada Power Company Las Vegas, Nevada
We have reviewed the accompanying consolidated balance sheet of Nevada Power Company and subsidiaries ("Nevada Power")as of September 30, 2017, and the related consolidated statements of operations for the three-month and nine-month periods endedSeptember 30, 2017 and 2016, and of changes in shareholder's equity and cash flows for the nine-month periods endedSeptember 30, 2017 and 2016. These interim financial statements are the responsibility of Nevada Power's management.
We conducted our reviews in accordance with the standards of the Public Company Accounting Oversight Board (United States).A review of interim financial information consists principally of applying analytical procedures and making inquiries of personsresponsible for financial and accounting matters. It is substantially less in scope than an audit conducted in accordance with thestandards of the Public Company Accounting Oversight Board (United States), the objective of which is the expression of anopinion regarding the financial statements taken as a whole. Accordingly, we do not express such an opinion.
Based on our reviews, we are not aware of any material modifications that should be made to such consolidated interim financialstatements for them to be in conformity with accounting principles generally accepted in the United States of America.
We have previously audited, in accordance with the standards of the Public Company Accounting Oversight Board (United States),the consolidated balance sheet of Nevada Power Company and subsidiaries as of December 31, 2016, and the related consolidatedstatements of operations, changes in shareholder's equity, and cash flows for the year then ended (not presented herein); and inour report dated February 24, 2017, we expressed an unqualified opinion on those consolidated financial statements. In our opinion,the information set forth in the accompanying consolidated balance sheet as of December 31, 2016 is fairly stated, in all materialrespects, in relation to the consolidated balance sheet from which it has been derived.
/s/ Deloitte & Touche LLP
Las Vegas, NevadaNovember 3, 2017

NEVADA POWER COMPANY AND SUBSIDIARIESCONSOLIDATED BALANCE SHEETS (Unaudited)
(Amounts in millions, except share data)
As ofSeptember 30, December 31,
2017 2016ASSETS
Current assets:Cash and cash equivalents $ 69 $ 279Accounts receivable, net 362 243Inventories 59 73Regulatory assets 34 20Other current assets 50 38
Total current assets 574 653
Property, plant and equipment, net 6,890 6,997Regulatory assets 1,110 1,000Other assets 39 39
Total assets $ 8,613 $ 8,689
LIABILITIES AND SHAREHOLDER'S EQUITYCurrent liabilities:
Accounts payable $ 192 $ 187Accrued interest 39 50Accrued property, income and other taxes 109 93Regulatory liabilities 35 37Current portion of long-term debt and financial and capital lease obligations 842 17Customer deposits 78 78Other current liabilities 31 39
Total current liabilities 1,326 501
Long-term debt and financial and capital lease obligations 2,231 3,049Regulatory liabilities 423 416Deferred income taxes 1,529 1,474Other long-term liabilities 281 277
Total liabilities 5,790 5,717
Commitments and contingencies (Note 9)
Shareholder's equity:Common stock - $1.00 stated value; 1,000 shares authorized, issued and outstanding — —Other paid-in capital 2,308 2,308Retained earnings 518 667Accumulated other comprehensive loss, net (3) (3)
Total shareholder's equity 2,823 2,972
Total liabilities and shareholder's equity $ 8,613 $ 8,689
The accompanying notes are an integral part of the consolidated financial statements.
112

NEVADA POWER COMPANY AND SUBSIDIARIESCONSOLIDATED STATEMENTS OF OPERATIONS (Unaudited)
(Amounts in millions)
Three-Month Periods Nine-Month PeriodsEnded September 30, Ended September 30,
2017 2016 2017 2016
Operating revenue $ 819 $ 766 $ 1,785 $ 1,690
Operating costs and expenses:Cost of fuel, energy and capacity 318 251 721 618Operating and maintenance 97 105 278 304Depreciation and amortization 77 76 231 227Property and other taxes 10 10 29 30
Total operating costs and expenses 502 442 1,259 1,179
Operating income 317 324 526 511
Other income (expense):Interest expense (44) (45) (132) (140)Allowance for borrowed funds 1 — 1 2Allowance for equity funds — — 1 3Other, net 5 7 18 17
Total other income (expense) (38) (38) (112) (118)
Income before income tax expense 279 286 414 393Income tax expense 103 98 151 136
Net income $ 176 $ 188 $ 263 $ 257
The accompanying notes are an integral part of these consolidated financial statements.
113

NEVADA POWER COMPANY AND SUBSIDIARIESCONSOLIDATED STATEMENTS OF CHANGES IN SHAREHOLDER'S EQUITY (Unaudited)
(Amounts in millions, except shares)
AccumulatedOther Other Total
Common Stock Paid-in Retained Comprehensive Shareholder'sShares Amount Capital Earnings Loss, Net Equity
Balance, December 31, 2015 1,000 $ — $ 2,308 $ 858 $ (3) $ 3,163Net income — — — 257 — 257Dividends declared — — — (365) — (365)Other equity transactions — — — (1) — (1)Balance, September 30, 2016 1,000 $ — $ 2,308 $ 749 $ (3) $ 3,054
Balance, December 31, 2016 1,000 $ — $ 2,308 $ 667 $ (3) $ 2,972Net income — — — 263 — 263Dividends declared — — — (412) — (412)Balance, September 30, 2017 1,000 $ — $ 2,308 $ 518 $ (3) $ 2,823
The accompanying notes are an integral part of these consolidated financial statements.
114

NEVADA POWER COMPANY AND SUBSIDIARIESCONSOLIDATED STATEMENTS OF CASH FLOWS (Unaudited)
(Amounts in millions)
Nine-Month PeriodsEnded September 30,
2017 2016Cash flows from operating activities:
Net income $ 263 $ 257Adjustments to reconcile net income to net cash flows from operating activities:
Gain on nonrecurring items (1) —Depreciation and amortization 231 227Deferred income taxes and amortization of investment tax credits 61 52Allowance for equity funds (1) (3)Changes in regulatory assets and liabilities 25 139Deferred energy (22) (3)Amortization of deferred energy 13 (87)Other, net (1) 3Changes in other operating assets and liabilities:
Accounts receivable and other assets (122) (96)Inventories 6 7Accrued property, income and other taxes 11 98Accounts payable and other liabilities 9 7
Net cash flows from operating activities 472 601
Cash flows from investing activities:Capital expenditures (202) (249)Acquisitions (77) —Other, net 4 —
Net cash flows from investing activities (275) (249)
Cash flows from financing activities:Proceeds from issuance of long-term debt 91 —Repayments of long-term debt and financial and capital lease obligations (86) (221)Dividends paid (412) (365)
Net cash flows from financing activities (407) (586)
Net change in cash and cash equivalents (210) (234)Cash and cash equivalents at beginning of period 279 536Cash and cash equivalents at end of period $ 69 $ 302
The accompanying notes are an integral part of these consolidated financial statements.
115

NEVADA POWER COMPANY AND SUBSIDIARIESNOTES TO CONSOLIDATED FINANCIAL STATEMENTS
(Unaudited)
116
(1) Organization and Operations
Nevada Power Company, together with its subsidiaries ("Nevada Power"), is a wholly owned subsidiary of NV Energy, Inc. ("NVEnergy"), a holding company that also owns Sierra Pacific Power Company ("Sierra Pacific") and certain other subsidiaries.Nevada Power is a United States regulated electric utility company serving retail customers, including residential, commercialand industrial customers, primarily in the Las Vegas, North Las Vegas, Henderson and adjoining areas. NV Energy is an indirectwholly owned subsidiary of Berkshire Hathaway Energy Company ("BHE"). BHE is a holding company based in Des Moines,Iowa that owns subsidiaries principally engaged in energy businesses. BHE is a consolidated subsidiary of Berkshire HathawayInc. ("Berkshire Hathaway").
The unaudited Consolidated Financial Statements have been prepared in accordance with accounting principles generally acceptedin the United States of America ("GAAP") for interim financial information and the United States Securities and ExchangeCommission's rules and regulations for Form 10-Q and Article 10 of Regulation S-X. Accordingly, they do not include all of thedisclosures required by GAAP for annual financial statements. Management believes the unaudited Consolidated FinancialStatements contain all adjustments (consisting only of normal recurring adjustments) considered necessary for the fair presentationof the unaudited Consolidated Financial Statements as of September 30, 2017 and for the three- and nine-month periods endedSeptember 30, 2017 and 2016. The Consolidated Statements of Comprehensive Income have been omitted as net income equalscomprehensive income for the three- and nine-month periods ended September 30, 2017 and 2016. The results of operations forthe three- and nine-month periods ended September 30, 2017 are not necessarily indicative of the results to be expected for thefull year.
The preparation of the unaudited Consolidated Financial Statements in conformity with GAAP requires management to makeestimates and assumptions that affect the reported amounts of assets and liabilities at the date of the unaudited ConsolidatedFinancial Statements and the reported amounts of revenue and expenses during the period. Actual results may differ from theestimates used in preparing the unaudited Consolidated Financial Statements. Note 2 of Notes to Consolidated Financial Statementsincluded in Nevada Power's Annual Report on Form 10-K for the year ended December 31, 2016 describes the most significantaccounting policies used in the preparation of the unaudited Consolidated Financial Statements. There have been no significantchanges in Nevada Power's assumptions regarding significant accounting estimates and policies during the nine-month periodended September 30, 2017.
(2) New Accounting Pronouncements
In March 2017, the Financial Accounting Standards Board ("FASB") issued Accounting Standards Update ("ASU") No. 2017-07,which amends FASB Accounting Standards Codification ("ASC") Topic 715, "Compensation - Retirement Benefits." Theamendments in this guidance require that an employer disaggregate the service cost component from the other components of netbenefit cost and report the service cost component in the same line item as other compensation costs arising from services renderedby the pertinent employees during the period. The other components of net benefit cost are required to be presented in the statementof operations separately from the service cost component and outside the subtotal of operating income. Additionally, the guidanceonly allows the service cost component to be eligible for capitalization when applicable. This guidance is effective for interim andannual reporting periods beginning after December 15, 2017, with early adoption permitted. This guidance must be adoptedretrospectively for the presentation of the service cost component and the other components of net benefit cost in the statementof operations and prospectively for the capitalization of the service cost component in the balance sheet. Nevada Power plans toadopt this guidance effective January 1, 2018. Nevada Power does not believe this will have a material impact on its ConsolidatedFinancial Statements and disclosures included within Notes to Consolidated Financial Statements.
In November 2016, the FASB issued ASU No. 2016-18, which amends FASB ASC Subtopic 230-10, "Statement of Cash Flows- Overall." The amendments in this guidance require that a statement of cash flows explain the change during the period in thetotal of cash, cash equivalents, and amounts generally described as restricted cash or restricted cash equivalents. Amounts generallydescribed as restricted cash and restricted cash equivalents should be included with cash and cash equivalents when reconcilingthe beginning-of-period and end-of-period total amounts shown on the statement of cash flows. This guidance is effective forinterim and annual reporting periods beginning after December 15, 2017, with early adoption permitted, and is required to beadopted retrospectively. Nevada Power plans to adopt this guidance effective January 1, 2018 and does not believe the adoptionof this guidance will have a material impact on its Consolidated Financial Statements and disclosures included within Notes toConsolidated Financial Statements.

In August 2016, the FASB issued ASU No. 2016-15, which amends FASB ASC Topic 230, "Statement of Cash Flows." Theamendments in this guidance address the classification of eight specific cash flow issues within the statement of cash flows withthe objective of reducing the existing diversity in practice. This guidance is effective for interim and annual reporting periodsbeginning after December 15, 2017, with early adoption permitted, and is required to be adopted retrospectively. Nevada Powerplans to adopt this guidance effective January 1, 2018 and does not believe the adoption of this guidance will have a materialimpact on its Consolidated Financial Statements.
In February 2016, the FASB issued ASU No. 2016-02, which creates FASB ASC Topic 842, "Leases" and supersedes Topic 840"Leases." This guidance increases transparency and comparability among entities by recording lease assets and lease liabilitieson the balance sheet and disclosing key information about leasing arrangements. A lessee should recognize in the balance sheet aliability to make lease payments (the lease liability) and a right-of-use asset representing its right to use the underlying asset forthe lease term. The recognition, measurement, and presentation of expenses and cash flows arising from a lease by a lessee havenot significantly changed from previous guidance. This guidance is effective for interim and annual reporting periods beginningafter December 15, 2018, with early adoption permitted, and is required to be adopted using a modified retrospective approach.Nevada Power plans to adopt this guidance effective January 1, 2019 and is currently evaluating the impact on its ConsolidatedFinancial Statements and disclosures included within Notes to Consolidated Financial Statements.
In May 2014, the FASB issued ASU No. 2014-09, which creates FASB ASC Topic 606, "Revenue from Contracts with Customers"and supersedes ASC Topic 605, "Revenue Recognition." The guidance replaces industry-specific guidance and establishes a singlefive-step model to identify and recognize revenue. The core principle of the guidance is that an entity should recognize revenueupon transfer of control of promised goods or services to customers in an amount that reflects the consideration to which an entityexpects to be entitled in exchange for those goods or services. Additionally, the guidance requires the entity to disclose furtherquantitative and qualitative information regarding the nature and amount of revenues arising from contracts with customers, aswell as other information about the significant judgments and estimates used in recognizing revenues from contracts with customers.In August 2015, the FASB issued ASU No. 2015-14, which defers the effective date of ASU No. 2014-09 one year to interim andannual reporting periods beginning after December 15, 2017. During 2016 and 2017, the FASB issued several ASUs that clarifythe implementation guidance for ASU No. 2014-09 but do not change the core principle of the guidance. This guidance may beadopted retrospectively or under a modified retrospective method where the cumulative effect is recognized at the date of initialapplication. Nevada Power plans to adopt this guidance effective January 1, 2018 under the modified retrospective method andis currently evaluating the impact on its Consolidated Financial Statements and disclosures included within Notes to ConsolidatedFinancial Statements. Nevada Power currently does not expect the timing and amount of revenue currently recognized to bematerially different after adoption of the new guidance as a majority of revenue is recognized when Nevada Power has the rightto invoice as it corresponds directly with the value to the customer of Nevada Power’s performance to date. Nevada Power's currentplan is to quantitatively disaggregate revenue in the required financial statement footnote by customer class.
117
(3) Property, Plant and Equipment, Net
Property, plant and equipment, net consists of the following (in millions):
As ofDepreciable
LifeSeptember 30, December 31,
2017 2016Utility plant:
Generation 30 - 55 years $ 3,725 $ 4,271Distribution 20 - 65 years 3,294 3,231Transmission 45 - 65 years 1,860 1,846General and intangible plant 5 - 65 years 784 738
Utility plant 9,663 10,086Accumulated depreciation and amortization (2,840) (3,205)
Utility plant, net 6,823 6,881Other non-regulated, net of accumulated depreciation and amortization 45 years 2 2
Plant, net 6,825 6,883Construction work-in-progress 65 114
Property, plant and equipment, net $ 6,890 $ 6,997

Acquisitions
In April 2017, Nevada Power purchased the remaining 25% interest in the Silverhawk natural gas-fueled generating facility for$77 million. The Public Utilities Commission of Nevada ("PUCN") approved the purchase of the facility in Nevada Power’striennial Integrated Resource Plan filing in December 2015. The purchase price was allocated to the assets acquired, consistingprimarily of generation utility plant, and no significant liabilities were assumed.
118
(4) Regulatory Matters
Deferred Energy
Nevada statutes permit regulated utilities to adopt deferred energy accounting procedures. The intent of these procedures is to easethe effect on customers of fluctuations in the cost of purchased natural gas, fuel and electricity and are subject to annual prudencyreview by the PUCN. Under deferred energy accounting, to the extent actual fuel and purchased power costs exceed fuel andpurchased power costs recoverable through current rates that excess is not recorded as a current expense on the ConsolidatedStatements of Operations but rather is deferred and recorded as a regulatory asset on the Consolidated Balance Sheets. Conversely,a regulatory liability is recorded to the extent fuel and purchased power costs recoverable through current rates exceed actual fueland purchased power costs. These excess amounts are reflected in quarterly adjustments to rates and recorded as cost of fuel,energy and capacity in future time periods.
Chapter 704B Applications
Chapter 704B of the Nevada Revised Statutes allows retail electric customers with an average annual load of one megawatt ("MW")or more to file with the PUCN an application to purchase energy from alternative providers of a new electric resource and becomedistribution only service customers. On a case-by-case basis, the PUCN will assess the application and may deny or grant theapplication subject to conditions, including paying an impact fee, paying on-going charges and receiving approval for specificalternative energy providers and terms. The impact fee and on-going charges are assessed to alleviate the burden on other Nevadacustomers for the applicant's share of previously committed investments and long-term renewable contracts and are set at a leveldesigned such that the remaining customers are not subjected to increased costs.
In May 2015, MGM Resorts International ("MGM") and Wynn Las Vegas, LLC ("Wynn"), filed applications with the PUCN topurchase energy from alternative providers of a new electric resource and become distribution only service customers of NevadaPower. In December 2015, the PUCN granted the applications subject to conditions, including paying an impact fee, on-goingcharges and receiving approval for specific alternative energy providers and terms. In December 2015, the applicants filed petitionsfor reconsideration. In January 2016, the PUCN granted reconsideration and updated some of the terms, including removing alimitation related to energy purchased indirectly from NV Energy. In September 2016, MGM and Wynn paid impact fees of$82 million and $15 million, respectively. In October 2016, MGM and Wynn became distribution only service customers andstarted procuring energy from another energy supplier. In April 2017, Wynn filed a motion with the PUCN seeking relief from theJanuary 2016 order and requested the PUCN adopt an alternative impact fee and revise on-going charges associated with retirementof assets and high cost renewable contracts. In May 2017, a stipulation reached between MGM, Regulatory Operations Staff andthe Bureau of Consumer Protection was filed requiring Nevada Power to credit $16 million as an offset against MGM's remainingimpact fee obligation and, in June 2017, the PUCN approved the stipulation as filed.
In September 2016, Switch, Ltd. ("Switch"), a customer of Nevada Power, filed an application with the PUCN to purchase energyfrom alternative providers of a new electric resource and become a distribution only service customer of Nevada Power. InDecember 2016, the PUCN approved a stipulation agreement that allows Switch to purchase energy from alternative providerssubject to conditions, including paying an impact fee to Nevada Power. In May 2017, Switch paid impact fees of $27 million and,in June 2017, Switch became a distribution only service customer and started procuring energy from another energy supplier.
In November 2016, Caesars Enterprise Service ("Caesars"), a customer of Nevada Power, filed an application with the PUCN topurchase energy from alternative providers of a new electric resource and become a distribution only service customer of NevadaPower. In March 2017, the PUCN approved the application allowing Caesars to purchase energy from alternative providers subjectto conditions, including paying an impact fee. In March 2017, Caesars provided notice that it intends to pay the impact fee andproceed with purchasing energy from alternative providers. In July 2017, Caesars made the required compliance filings and, inSeptember 2017, the PUCN issued an order allowing Caesars to acquire electric energy and ancillary services from another energysupplier and become a distribution only service customer of Nevada Power.

Emissions Reduction and Capacity Replacement Plan ("ERCR Plan")
In March 2017, Nevada Power retired Reid Gardner Unit 4, a 257-MW coal-fueled generating facility. The early retirement wasapproved by the PUCN in December 2016 as a part of Nevada Power's second amendment to the ERCR Plan. The remaining netbook value of $151 million was moved from property, plant and equipment, net to noncurrent regulatory assets on the ConsolidatedBalance Sheet in March 2017, in compliance with the ERCR Plan. Refer to Note 9 for additional information on the ERCR Plan.
119
(5) Recent Financing Transactions
In January 2017, Nevada Power (1) issued a notice to the bondholders for the repurchase of the remaining outstanding amountsof its $38 million Pollution Control Revenue Bonds, Series 2006 and $38 million Pollution Control Revenue Bonds, Series 2006Aand (2) redeemed the Pollution Control Revenue Bonds, Series 2006A, aggregate principal amount outstanding plus accruedinterest with the use of cash on hand. In February 2017, Nevada Power redeemed the Pollution Control Revenue Bonds, Series2006, aggregate principal amount outstanding plus accrued interest with the use of cash on hand.
In May 2017, Nevada Power entered into a Financing Agreement with Clark County, Nevada (the "Clark Issuer") whereby theClark Issuer loaned to Nevada Power the proceeds from the issuance, on behalf of Nevada Power, of $39.5 million of its 1.60%tax-exempt Pollution Control Refunding Revenue Bonds, Series 2017, due 2036 ("Series 2017 Bonds"). The Series 2017 Bondsare subject to mandatory purchase by Nevada Power in May 2020, and on and after the purchase date, the interest rate may beadjusted from time to time.
In May 2017, Nevada Power entered into a Financing Agreement with the Coconino County, Arizona Pollution Control Corporation(the "Coconino Issuer") whereby the Coconino Issuer loaned to Nevada Power the proceeds from the issuance, on behalf of NevadaPower, of $40 million of its 1.80% tax-exempt Pollution Control Refunding Revenue Bonds, Series 2017A, due 2032 and$13 million of its 1.60% tax-exempt Pollution Control Refunding Revenue Bonds, Series 2017B, due 2039 (collectively, the"Series 2017AB Bonds"). The Series 2017AB Bonds are subject to mandatory purchase by Nevada Power in May 2020, and onand after the purchase date, the interest rate may be adjusted from time to time.
To provide collateral security for its obligations, Nevada Power issued its General and Refunding Mortgage Notes, Series AA,No. AA-1 in the amount of $39.5 million and No. AA-2 in the amount of $53 million (collectively, the "Series AA Notes").Theobligation of Nevada Power to make any payment of the principal and interest on any Series AA Notes is discharged to the extentNevada Power has made payment on the Series 2017 Bonds and the Series 2017AB Bonds.
The collective proceeds from the tax-exempt bond issuances were used to refund at par value, plus accrued interest, the ClarkIssuer's $39.5 million of Pollution Control Refunding Revenue Bonds, Series 2006 and the Coconino Issuer's $40 million ofPollution Control Refunding Revenue Bonds, Series 2006A and $13 million of Pollution Control Refunding Revenue Bonds,Series 2006B, each previously issued on behalf of Nevada Power.
In June 2017, Nevada Power amended its $400 million secured credit facility, extending the maturity date to June 2020 with twoone-year extension options subject to lender consent. The amended credit facility, which is for general corporate purposes andprovides for the issuance of letters of credit, has a variable interest rate based on the Eurodollar rate or a base rate, at NevadaPower's option, plus a spread that varies based on Nevada Power's credit ratings for its senior secured long-term debt securities.The amended credit facility requires Nevada Power's ratio of consolidated debt, including current maturities, to totalcapitalization not to exceed 0.65 to 1.0 as of the last day of each quarter.
(6) Employee Benefit Plans
Nevada Power is a participant in benefit plans sponsored by NV Energy. The NV Energy Retirement Plan includes a qualifiedpension plan ("Qualified Pension Plan") and a supplemental executive retirement plan and a restoration plan (collectively,"Non‑Qualified Pension Plans") that provide pension benefits for eligible employees. The NV Energy Comprehensive WelfareBenefit and Cafeteria Plan provides certain postretirement health care and life insurance benefits for eligible retirees ("OtherPostretirement Plans") on behalf of Nevada Power. Nevada Power contributed $1 million to the Non-Qualified Pension Plans forthe nine-month period ended September 30, 2017. Amounts attributable to Nevada Power were allocated from NV Energy basedupon the current, or in the case of retirees, previous, employment location. Offsetting regulatory assets and liabilities have beenrecorded related to the amounts not yet recognized as a component of net periodic benefit costs that will be included in regulatedrates. Net periodic benefit costs not included in regulated rates are included in accumulated other comprehensive loss, net.

Amounts payable to NV Energy are included on the Consolidated Balance Sheets and consist of the following (in millions):
As ofSeptember 30, December 31,
2017 2016Qualified Pension Plan -
Other long-term liabilities $ (27) $ (24)
Non-Qualified Pension Plans:Other current liabilities (1) (1)Other long-term liabilities (9) (9)
Other Postretirement Plans -Other long-term liabilities (4) (4)
120
(7) Risk Management and Hedging Activities
Nevada Power is exposed to the impact of market fluctuations in commodity prices and interest rates. Nevada Power is principallyexposed to electricity, natural gas and coal market fluctuations primarily through Nevada Power's obligation to serve retail customerload in its regulated service territory. Nevada Power's load and generating facilities represent substantial underlying commoditypositions. Exposures to commodity prices consist mainly of variations in the price of fuel required to generate electricity andwholesale electricity that is purchased and sold. Commodity prices are subject to wide price swings as supply and demand areimpacted by, among many other unpredictable items, weather, market liquidity, generating facility availability, customer usage,storage, and transmission and transportation constraints. The actual cost of fuel and purchased power is recoverable through thedeferred energy mechanism. Interest rate risk exists on variable-rate debt and future debt issuances. Nevada Power does not engagein proprietary trading activities.
Nevada Power has established a risk management process that is designed to identify, assess, manage, monitor and report each ofthe various types of risk involved in its business. To mitigate a portion of its commodity price risk, Nevada Power uses commodityderivative contracts, which may include forwards, futures, options, swaps and other agreements, to effectively secure future supplyor sell future production generally at fixed prices. Nevada Power manages its interest rate risk by limiting its exposure to variableinterest rates primarily through the issuance of fixed-rate long-term debt and by monitoring market changes in interest rates.Additionally, Nevada Power may from time to time enter into interest rate derivative contracts, such as interest rate swaps or locks,to mitigate Nevada Power's exposure to interest rate risk. Nevada Power does not hedge all of its commodity price and interestrate risks, thereby exposing the unhedged portion to changes in market prices.
There have been no significant changes in Nevada Power's accounting policies related to derivatives. Refer to Note 8 for additionalinformation on derivative contracts.

The following table, which excludes contracts that have been designated as normal under the normal purchases or normal salesexception afforded by GAAP, summarizes the fair value of Nevada Power's derivative contracts, on a gross basis, and reconcilesthose amounts to the amounts presented on a net basis on the Consolidated Balance Sheets (in millions):
Other OtherCurrent Long-term
Liabilities Liabilities TotalAs of September 30, 2017Commodity liabilities(1) $ (3) $ (1) $ (4)
As of December 31, 2016Commodity liabilities(1) $ (7) $ (7) $ (14)
(1) Nevada Power's commodity derivatives not designated as hedging contracts are included in regulated rates and as of September 30, 2017 andDecember 31, 2016, a regulatory asset of $4 million and $14 million, respectively, was recorded related to the derivative liability of $4 million and$14 million, respectively.
Derivative Contract Volumes
The following table summarizes the net notional amounts of outstanding derivative contracts with indexed and fixed price termsthat comprise the mark-to-market values (in millions):
As ofUnit of September 30, December 31,
Measure 2017 2016
Electricity sales Megawatt hours — (2)Natural gas purchases Decatherms 149 114
Credit Risk
Nevada Power is exposed to counterparty credit risk associated with wholesale energy supply and marketing activities with otherutilities, energy marketing companies, financial institutions and other market participants. Credit risk may be concentrated to theextent Nevada Power's counterparties have similar economic, industry or other characteristics and due to direct and indirectrelationships among the counterparties. Before entering into a transaction, Nevada Power analyzes the financial condition of eachsignificant wholesale counterparty, establish limits on the amount of unsecured credit to be extended to each counterparty andevaluate the appropriateness of unsecured credit limits on an ongoing basis. To further mitigate wholesale counterparty credit risk,Nevada Power enters into netting and collateral arrangements that may include margining and cross-product netting agreementsand obtain third-party guarantees, letters of credit and cash deposits. If required, Nevada Power exercises rights under thesearrangements, including calling on the counterparty's credit support arrangement.
Collateral and Contingent Features
In accordance with industry practice, certain wholesale derivative contracts contain credit support provisions that in part basecertain collateral requirements on credit ratings for unsecured debt as reported by one or more of the three recognized credit ratingagencies. These derivative contracts may either specifically provide rights to demand cash or other security in the event of a creditrating downgrade ("credit-risk-related contingent features") or provide the right for counterparties to demand "adequate assurance,"in the event of a material adverse change in creditworthiness. These rights can vary by contract and by counterparty. As ofSeptember 30, 2017, credit ratings from the three recognized credit rating agencies were investment grade.
The aggregate fair value of Nevada Power's derivative contracts in liability positions with specific credit-risk-related contingentfeatures was $2 million as of September 30, 2017 and December 31, 2016, which represents the amount of collateral to be postedif all credit risk related contingent features for derivative contracts in liability positions had been triggered. Nevada Power'scollateral requirements could fluctuate considerably due to market price volatility, changes in credit ratings, changes in legislationor regulation or other factors.
121

(8) Fair Value Measurements
The carrying value of Nevada Power's cash, certain cash equivalents, receivables, payables, accrued liabilities and short-termborrowings approximates fair value because of the short-term maturity of these instruments. Nevada Power has various financialassets and liabilities that are measured at fair value on the Consolidated Balance Sheets using inputs from the three levels of thefair value hierarchy. A financial asset or liability classification within the hierarchy is determined based on the lowest level inputthat is significant to the fair value measurement. The three levels are as follows:
• Level 1 — Inputs are unadjusted quoted prices in active markets for identical assets or liabilities that Nevada Power hasthe ability to access at the measurement date.
• Level 2 — Inputs include quoted prices for similar assets or liabilities in active markets, quoted prices for identical orsimilar assets or liabilities in markets that are not active, inputs other than quoted prices that are observable for the assetor liability and inputs that are derived principally from or corroborated by observable market data by correlation or othermeans (market corroborated inputs).
• Level 3 — Unobservable inputs reflect Nevada Power's judgments about the assumptions market participants would usein pricing the asset or liability since limited market data exists. Nevada Power develops these inputs based on the bestinformation available, including its own data.
The following table presents Nevada Power's financial assets and liabilities recognized on the Consolidated Balance Sheets andmeasured at fair value on a recurring basis (in millions):
Input Levels for Fair Value MeasurementsLevel 1 Level 2 Level 3 Total
As of September 30, 2017Assets - investment funds $ 2 $ — $ — $ 2
Liabilities - commodity derivatives $ — $ — $ (4) $ (4)
As of December 31, 2016Assets:Money market mutual funds(1) $ 220 $ — $ — $ 220Investment funds 6 — — 6
$ 226 $ — $ — $ 226
Liabilities - commodity derivatives $ — $ — $ (14) $ (14)
(1) Amounts are included in cash and cash equivalents on the Consolidated Balance Sheets. The fair value of these money market mutual funds approximatescost.
Derivative contracts are recorded on the Consolidated Balance Sheets as either assets or liabilities and are stated at estimated fairvalue unless they are designated as normal purchases or normal sales and qualify for the exception afforded by GAAP. Whenavailable, the fair value of derivative contracts is estimated using unadjusted quoted prices for identical contracts in the market inwhich Nevada Power transacts. When quoted prices for identical contracts are not available, Nevada Power uses forward pricecurves. Forward price curves represent Nevada Power's estimates of the prices at which a buyer or seller could contract today fordelivery or settlement at future dates. Nevada Power bases its forward price curves upon internally developed models, with internaland external fundamental data inputs. Market price quotations for certain electricity and natural gas trading hubs are not as readilyobtainable due to markets that are not active. Given that limited market data exists for these contracts, Nevada Power uses forwardprice curves derived from internal models based on perceived pricing relationships to major trading hubs that are based onunobservable inputs. The model incorporates a mid-market pricing convention (the mid‑point price between bid and ask prices)as a practical expedient for valuing its assets and liabilities measured and reported at fair value. The determination of the fair valuefor derivative contracts not only includes counterparty risk, but also the impact of Nevada Power's nonperformance risk on itsliabilities, which as of September 30, 2017 and December 31, 2016, had an immaterial impact to the fair value of its derivativecontracts. As such, Nevada Power considers its derivative contracts to be valued using Level 3 inputs. Refer to Note 7 for furtherdiscussion regarding Nevada Power's risk management and hedging activities.
122

Nevada Power's investments in money market mutual funds and equity securities are accounted for as available-for-sale securitiesand are stated at fair value. When available, a readily observable quoted market price or net asset value of an identical security inan active market is used to record the fair value.
The following table reconciles the beginning and ending balances of Nevada Power's commodity derivative liabilities measuredat fair value on a recurring basis using significant Level 3 inputs (in millions):
Three-Month Periods Nine-Month PeriodsEnded September 30, Ended September 30,
2017 2016 2017 2016
Beginning balance $ (4) $ (22) $ (14) $ (22)Changes in fair value recognized in regulatory assets (1) (1) (3) (6)Settlements 1 4 13 9Ending balance $ (4) $ (19) $ (4) $ (19)
Nevada Power's long-term debt is carried at cost on the Consolidated Balance Sheets. The fair value of Nevada Power's long‑termdebt is a Level 2 fair value measurement and has been estimated based upon quoted market prices, where available, or at thepresent value of future cash flows discounted at rates consistent with comparable maturities with similar credit risks. The carryingvalue of Nevada Power's variable-rate long-term debt approximates fair value because of the frequent repricing of these instrumentsat market rates. The following table presents the carrying value and estimated fair value of Nevada Power's long‑term debt(in millions):
As of September 30, 2017 As of December 31, 2016Carrying Fair Carrying Fair
Value Value Value Value
Long-term debt $ 2,599 $ 3,055 $ 2,581 $ 3,040
123
(9) Commitments and Contingencies
Environmental Laws and Regulations
Nevada Power is subject to federal, state and local laws and regulations regarding air and water quality, renewable portfoliostandards, emissions performance standards, climate change, coal combustion byproduct disposal, hazardous and solid wastedisposal, protected species and other environmental matters that have the potential to impact Nevada Power's current and futureoperations. Nevada Power believes it is in material compliance with all applicable laws and regulations.

Senate Bill 123
In June 2013, the Nevada State Legislature passed Senate Bill No. 123 ("SB 123"), which included the retirement of coal plantsand replacing the capacity with renewable facilities and other generating facilities. In May 2014, Nevada Power filed its ERCR Planin compliance with SB 123. In July 2015, Nevada Power filed an amendment to its ERCR Plan with the PUCN which was approvedin September 2015. In June 2015, the Nevada State Legislature passed Assembly Bill No. 498, which modified the capacityreplacement components of SB 123.
Consistent with the ERCR Plan, Nevada Power acquired a 272-MW natural gas co-generating facility in 2014, acquired a 210-MW natural gas peaking facility in 2014, constructed a 15-MW solar photovoltaic facility in 2015, contracted two renewablepower purchase agreements with 100-MW solar photovoltaic generating facilities in 2015, contracted a renewable power purchaseagreement with 100-MW solar photovoltaic generating facility in 2016 and acquired the remaining 130 MW, 25%, of the Silverhawknatural gas-fueled generating facility in April 2017, of which 54 MW were approved as part of the ERCR Plan. Nevada Powerhas the option to acquire 35 MW of nameplate renewable energy capacity in the future under the ERCR Plan, subject to PUCNapproval. Nevada Power retired Reid Gardner Units 1, 2, and 3, 300 MW of coal-fueled generation, in 2014 and Reid GardnerUnit 4, 257 MW of coal-fueled generation, in March 2017. These transactions are related to Nevada Power's compliance with SB123, resulting in the retirement of 812 MW of coal-fueled generation by 2019.
Legal Matters
Nevada Power is party to a variety of legal actions arising out of the normal course of business. Plaintiffs occasionally seek punitiveor exemplary damages. Nevada Power does not believe that such normal and routine litigation will have a material impact on itsconsolidated financial results.
124

Item 2. Management's Discussion and Analysis of Financial Condition and Results of Operations
General
Nevada Power's revenues and operating income are subject to fluctuations during the year due to impacts that seasonal weather,rate changes, and customer usage patterns have on demand for electric energy and resources. Nevada Power is a summer peakingutility experiencing its highest retail energy sales in response to the demand for air conditioning. The variations in energy usagedue to varying weather, customer growth and other energy usage patterns, including energy efficiency and conservation measures,necessitates a continual balancing of loads and resources and purchases and sales of energy under short- and long-term energysupply contracts. As a result, the prudent management and optimization of available resources has a direct effect on the operatingand financial performance of Nevada Power. Additionally, the timely recovery of purchased power, fuel costs and other costs andthe ability to earn a fair return on investments through rates are essential to the operating and financial performance of NevadaPower.
The following is management's discussion and analysis of certain significant factors that have affected the consolidated financialcondition and results of operations of Nevada Power during the periods included herein. Explanations include management's bestestimate of the impact of weather, customer growth and other factors. This discussion should be read in conjunction with NevadaPower's historical unaudited Consolidated Financial Statements and Notes to Consolidated Financial Statements in Part I, Item 1of this Form 10-Q. Nevada Power's actual results in the future could differ significantly from the historical results.
125
Results of Operations for the Third Quarter and First Nine Months of 2017 and 2016
Net income for the third quarter of 2017 was $176 million, a decrease of $12 million, or 6%, compared to 2016 due to lowercommercial and industrial retail revenue from customers purchasing energy from alternative providers and becoming distributiononly service customers, refinement of the unbilled revenue estimate and increased other operating costs. The decrease in net incomewas partially offset by higher other retail revenue primarily from impact fees and revenue relating to customers becomingdistribution only service customers, customer usage patterns, higher transmission revenue and customer growth.
Net income for the first nine months of 2017 was $263 million, an increase of $6 million, or 2%, compared to 2016 due to higherother retail revenue primarily from impact fees and revenue relating to customers becoming distribution only service customers,lower interest on deferred charges and long-term debt, customer growth, higher transmission revenue, customer usage patternsand lower planned maintenance. The increase in net income was partially offset by lower commercial and industrial retail revenuefrom customers purchasing energy from alternative providers and becoming distribution only service customers, higher depreciationand amortization primarily due to higher plant placed in-service and increased other operating costs.
Operating revenue and cost of fuel, energy and capacity are key drivers of Nevada Power's results of operations as they encompassretail and wholesale electricity revenue and the direct costs associated with providing electricity to customers. Nevada Powerbelieves that a discussion of gross margin, representing operating revenue less cost of fuel, energy and capacity, is thereforemeaningful.

A comparison of Nevada Power's key operating results is as follows:
Third Quarter First Nine Months2017 2016 Change 2017 2016 Change
Gross margin (in millions):Operating revenue $ 819 $ 766 $ 53 7 % $ 1,785 $ 1,690 $ 95 6 %Cost of fuel, energy and capacity 318 251 67 27 721 618 103 17
Gross margin $ 501 $ 515 $ (14) (3) $ 1,064 $ 1,072 $ (8) (1)
GWh sold:Residential 3,899 3,814 85 2 % 7,899 7,802 97 1 %Commercial 1,517 1,440 77 5 3,669 3,600 69 2Industrial 1,783 2,149 (366) (17) 4,870 5,772 (902) (16)Other 60 59 1 2 154 155 (1) (1)
Total fully bundled(1) 7,259 7,462 (203) (3) 16,592 17,329 (737) (4)Distribution only service 617 119 498 * 1,367 305 1,062 *
Total retail 7,876 7,581 295 4 17,959 17,634 325 2Wholesale 59 76 (17) (22) 214 177 37 21
Total GWh sold 7,935 7,657 278 4 18,173 17,811 362 2
Average number of retailcustomers (in thousands):
Residential 813 799 14 2 % 809 795 14 2 %Commercial 106 105 1 1 106 105 1 1Industrial 2 2 — — 2 2 — —
Total 921 906 15 2 917 902 15 2
Average retail revenue per MWh:Fully bundled(1) $ 109.85 $ 101.22 $ 8.63 9 % $ 104.06 $ 95.69 $ 8.37 9 %
Heating degree days — — — — % 791 829 (38) (5) %Cooling degree days 2,319 2,295 24 1 % 3,808 3,674 134 4 %
Sources of energy (GWh)(2):Natural gas 4,592 4,657 (65) (1) % 10,338 11,569 (1,231) (11) %Coal 367 599 (232) (39) 1,182 1,140 42 4Renewables 19 26 (7) (27) 57 47 10 21
Total energy generated 4,978 5,282 (304) (6) 11,577 12,756 (1,179) (9)Energy purchased 2,500 2,471 29 1 5,665 5,410 255 5
Total 7,478 7,753 (275) (4) 17,242 18,166 (924) (5)
Average total cost of energy perMWh(3): $ 42.46 $ 32.30 $ 10.16 31 % $ 41.80 $ 34.01 $ 7.79 23 %
* Not meaningful(1) Fully bundled includes sales to customers for combined energy, transmission and distribution services.(2) GWh amounts are net of energy used by the related generating facilities.(3) The average total cost of energy per MWh includes the cost of fuel, purchased power and deferrals and does not include other costs.
126

Gross margin decreased $14 million, or 3%, for the third quarter of 2017 compared to 2016 due to:
• $15 million in lower commercial and industrial retail revenue from customers purchasing energy from alternative providersand becoming distribution only service customers;
• $10 million in lower energy efficiency program revenue (offset in operating and maintenance expense) and
• $9 million from a refinement of the unbilled revenue estimate.
The decrease in gross margin was offset by:
• $8 million in higher other retail revenue primarily from impact fees and revenue relating to customers becomingdistribution only service customers;
• $5 million from customer usage patterns;
• $3 million in higher transmission revenue primarily due to customers becoming distribution only service customers and
• $2 million due to customer growth.
Operating and maintenance decreased $8 million, or 8%, for the third quarter of 2017 compared to 2016 due to lower energyefficiency program expense (offset in operating revenue) of $8 million.
Income tax expense increased $5 million, or 5%, for the third quarter of 2017 compared to 2016. The effective tax rate was 37%in 2017 and 34% in 2016. The increase in the effective tax rate is primarily due to the qualified production activities deduction in2016.
Gross margin decreased $8 million, or 1%, for the first nine months of 2017 compared to 2016 due to:
• $24 million in lower commercial and industrial retail revenue from customers purchasing energy from alternative providersand becoming distribution only service customers and
• $22 million in lower energy efficiency program revenue (offset in operating and maintenance expense).
The decrease in gross margin was offset by:
• $19 million in higher other retail revenue primarily from impact fees and revenue relating to customers becomingdistribution only service customers;
• $7 million due to customer growth;
• $6 million in higher transmission revenue primarily due to customers becoming distribution only service customers and
• $5 million from customer usage patterns.
Operating and maintenance decreased $26 million, or 9%, for the first nine months of 2017 compared to 2016 due to lower energyefficiency program expense (offset in operating revenue); lower planned maintenance; and decreased expenses related touncollectible accounts. These decreases are partially offset by higher other operating costs.
Depreciation and amortization increased $4 million, or 2%, for the first nine months of 2017 compared to 2016 primarily due tohigher plant placed in-service.
Other income (expense) is favorable $6 million, or 5%, for the first nine months of 2017 compared to 2016 due to lower interestexpense on deferred charges and the redemption of $210 million Series M, 5.950% General and Refunding Mortgage Notes in2016, partially offset by lower allowance for funds used during construction.
Income tax expense increased $15 million, or 11%, for the first nine months of 2017 compared to 2016. The effective tax rate was36% in 2017 and 35% in 2016. The increase in the effective tax rate is primarily due to the qualified production activities deductionin 2016.
127

Liquidity and Capital Resources
As of September 30, 2017, Nevada Power's total net liquidity was $469 million consisting of $69 million in cash and cash equivalentsand $400 million of a credit facility.
Operating Activities
Net cash flows from operating activities for the nine-month periods ended September 30, 2017 and 2016 were $472 million and$601 million, respectively. The change was due to higher impact fees received in 2016 and higher intercompany tax payments,partially offset by a 2016 contribution to the pension plan.
In December 2015, the Protecting Americans from Tax Hikes Act of 2015 ("PATH") was signed into law, extending bonusdepreciation for qualifying property acquired and placed in-service before January 1, 2020 (bonus depreciation rates will be 50%for 2015-2017, 40% in 2018, and 30% in 2019), with an additional year for certain longer lived assets. Investment tax credits wereextended and phased-down for solar projects that are under construction before the end of 2021 (investment tax credit rates are30% through 2019, 26% in 2020 and 22% in 2021; they revert to the statutory rate of 10% thereafter). As a result of PATH, NevadaPower's cash flows from operations are expected to benefit due to bonus depreciation on qualifying assets placed in-service through2019 and investment tax credits (once the net operating loss is fully utilized) earned on qualifying projects through 2021.
The timing of Nevada Power's income tax cash flows from period to period can be significantly affected by the estimated federalincome tax payment methods and assumptions for each payment date.
Investing Activities
Net cash flows from investing activities for the nine-month periods ended September 30, 2017 and 2016 were $(275) million and$(249) million, respectively. The change was due to the acquisition of the remaining 25% in the Silverhawk generating station,partially offset by decreased capital expenditures.
Financing Activities
Net cash flows from financing activities for the nine-month periods ended September 30, 2017 and 2016 were $(407) million and$(586) million, respectively. The change was due to lower repayments of long‑term debt and proceeds from issuance of long‑termdebt, partially offset by higher dividends paid to NV Energy, Inc. in 2017.
Ability to Issue Debt
Nevada Power's ability to issue debt is primarily impacted by its financing authority from the PUCN. As of September 30, 2017,Nevada Power has financing authority from the PUCN consisting of the ability to: (1) issue new long-term debt securities of upto $1.3 billion; (2) refinance up to $1.2 billion of long-term debt securities; and (3) maintain a revolving credit facility of up to$1.3 billion. Nevada Power's revolving credit facility contains a financial maintenance covenant which Nevada Power was incompliance with as of September 30, 2017.
Future Uses of Cash
Nevada Power has available a variety of sources of liquidity and capital resources, both internal and external, including net cashflows from operating activities, public and private debt offerings, the use of its secured revolving credit facility, capital contributionsand other sources. These sources are expected to provide funds required for current operations, capital expenditures, debt retirementsand other capital requirements. The availability and terms under which Nevada Power has access to external financing dependson a variety of factors, including Nevada Power's credit ratings, investors' judgment of risk and conditions in the overall capitalmarkets, including the condition of the utility industry.
128

Capital Expenditures
Nevada Power has significant future capital requirements. Capital expenditure needs are reviewed regularly by management andmay change significantly as a result of these reviews, which may consider, among other factors, changes in environmental andother rules and regulations; impacts to customers' rates; outcomes of regulatory proceedings; changes in income tax laws; generalbusiness conditions; load projections; system reliability standards; the cost and efficiency of construction labor, equipment andmaterials; commodity prices; and the cost and availability of capital. Prudently incurred expenditures for compliance-related itemssuch as pollution control technologies, replacement generation and associated operating costs are generally incorporated intoNevada Power's regulated retail rates. Expenditures for certain assets may ultimately include acquisition of existing assets.
Nevada Power's historical and forecast capital expenditures, each of which exclude amounts for non-cash equity AFUDC andother non-cash items are as follows (in millions):
Nine-Month Periods AnnualEnded September 30, Forecast
2016 2017 2017
Generation development $ 1 $ — $ —Distribution 110 41 58Transmission system investment 29 6 10Other 109 155 180
Total $ 249 $ 202 $ 248
Nevada Power's approved forecast capital expenditures include investments related to operating projects that consist of routineexpenditures for transmission, distribution, generation and other infrastructure needed to serve existing and expected demand.
In April 2017, Nevada Power purchased the remaining 25% interest in the Silverhawk natural gas-fueled generating facility for$77 million. The Public Utilities Commission of Nevada ("PUCN") approved the purchase of the facility in Nevada Power’striennial Integrated Resource Plan filing in December 2015. The purchase price was allocated to the assets acquired, consistingprimarily of generation utility plant, and no significant liabilities were assumed.
Contractual Obligations
As of September 30, 2017, there have been no material changes outside the normal course of business in contractual obligationsfrom the information provided in Item 7 of Nevada Power's Annual Report on Form 10-K for the year ended December 31, 2016.
129
Regulatory Matters
Nevada Power is subject to comprehensive regulation. Refer to "Regulatory Matters" in Berkshire Hathaway Energy's Part I,Item 2 of this Form 10-Q for discussion regarding Nevada Power's current regulatory matters.
Environmental Laws and Regulations
Nevada Power is subject to federal, state and local laws and regulations regarding air and water quality, RPS, emissions performancestandards, climate change, coal combustion byproduct disposal, hazardous and solid waste disposal, protected species and otherenvironmental matters that have the potential to impact Nevada Power's current and future operations. In addition to imposingcontinuing compliance obligations and capital expenditure requirements, these laws and regulations provide regulators with theauthority to levy substantial penalties for noncompliance including fines, injunctive relief and other sanctions. These laws andregulations are administered by the EPA and various state and local agencies. All such laws and regulations are subject to a rangeof interpretation, which may ultimately be resolved by the courts. Environmental laws and regulations continue to evolve, andNevada Power is unable to predict the impact of the changing laws and regulations on its operations and consolidated financialresults. Nevada Power believes it is in material compliance with all applicable laws and regulations. Refer to "Liquidity and CapitalResources" for discussion of Nevada Power's forecasted environmental-related capital expenditures.
Refer to "Environmental Laws and Regulations" in Berkshire Hathaway Energy's Part I, Item 2 of this Form 10-Q for additionalinformation regarding environmental laws.

New Accounting Pronouncements
For a discussion of new accounting pronouncements affecting Nevada Power, refer to Note 2 of Notes to Consolidated FinancialStatements in Nevada Power's Part I, Item 1 of this Form 10-Q.
Critical Accounting Estimates
Certain accounting measurements require management to make estimates and judgments concerning transactions that will besettled several years in the future. Amounts recognized on the Consolidated Financial Statements based on such estimates involvenumerous assumptions subject to varying and potentially significant degrees of judgment and uncertainty and will likely changein the future as additional information becomes available. Estimates are used for, but not limited to, the accounting for the effectsof certain types of regulation, derivatives, impairment of long-lived assets, income taxes and revenue recognition - unbilled revenue.For additional discussion of Nevada Power's critical accounting estimates, see Item 7 of Nevada Power's Annual Report onForm 10‑K for the year ended December 31, 2016. There have been no significant changes in Nevada Power's assumptionsregarding critical accounting estimates since December 31, 2016.
130

Sierra Pacific Power Company and its subsidiaries Consolidated Financial Section
131

PART IItem 1. Financial Statements
132
REPORT OF INDEPENDENT REGISTERED PUBLIC ACCOUNTING FIRM
To the Board of Directors and Shareholder ofSierra Pacific Power Company Las Vegas, Nevada
We have reviewed the accompanying consolidated balance sheet of Sierra Pacific Power Company and subsidiaries ("SierraPacific") as of September 30, 2017, and the related consolidated statements of operations for the three-month and nine-monthperiods ended September 30, 2017 and 2016, and of changes in shareholder's equity and cash flows for the nine-month periodsended September 30, 2017 and 2016. These interim financial statements are the responsibility of Sierra Pacific's management.
We conducted our reviews in accordance with the standards of the Public Company Accounting Oversight Board (United States).A review of interim financial information consists principally of applying analytical procedures and making inquiries of personsresponsible for financial and accounting matters. It is substantially less in scope than an audit conducted in accordance with thestandards of the Public Company Accounting Oversight Board (United States), the objective of which is the expression of anopinion regarding the financial statements taken as a whole. Accordingly, we do not express such an opinion.
Based on our reviews, we are not aware of any material modifications that should be made to such consolidated interim financialstatements for them to be in conformity with accounting principles generally accepted in the United States of America.
We have previously audited, in accordance with the standards of the Public Company Accounting Oversight Board (United States),the consolidated balance sheet of Sierra Pacific Power Company and subsidiaries as of December 31, 2016, and the relatedconsolidated statements of operations, changes in shareholder's equity, and cash flows for the year then ended (not presentedherein); and in our report dated February 24, 2017, we expressed an unqualified opinion on those consolidated financial statements.In our opinion, the information set forth in the accompanying consolidated balance sheet as of December 31, 2016 is fairly stated,in all material respects, in relation to the consolidated balance sheet from which it has been derived.
/s/ Deloitte & Touche LLP
Las Vegas, NevadaNovember 3, 2017

SIERRA PACIFIC POWER COMPANY AND SUBSIDIARIESCONSOLIDATED BALANCE SHEETS (Unaudited)
(Amounts in millions, except share data)
As ofSeptember 30, December 31,
2017 2016ASSETS
Current assets:Cash and cash equivalents $ 30 $ 55Accounts receivable, net 102 117Inventories 47 45Regulatory assets 38 25Other current assets 20 13
Total current assets 237 255
Property, plant and equipment, net 2,862 2,822Regulatory assets 400 410Other assets 8 6
Total assets $ 3,507 $ 3,493
LIABILITIES AND SHAREHOLDER'S EQUITYCurrent liabilities:
Accounts payable $ 75 $ 146Accrued interest 11 14Accrued property, income and other taxes 11 10Regulatory liabilities 17 69Current portion of long-term debt and financial and capital lease obligations 1 1Customer deposits 15 16Other current liabilities 18 12
Total current liabilities 148 268
Long-term debt and financial and capital lease obligations 1,151 1,152Regulatory liabilities 223 221Deferred income taxes 663 617Other long-term liabilities 134 127
Total liabilities 2,319 2,385
Commitments and contingencies (Note 8)
Shareholder's equity:Common stock - $3.75 stated value, 20,000,000 shares authorized and 1,000 issued and
outstanding — —Other paid-in capital 1,111 1,111Retained earnings (deficit) 78 (2)Accumulated other comprehensive loss, net (1) (1)
Total shareholder's equity 1,188 1,108
Total liabilities and shareholder's equity $ 3,507 $ 3,493
The accompanying notes are an integral part of the consolidated financial statements.
133

SIERRA PACIFIC POWER COMPANY AND SUBSIDIARIESCONSOLIDATED STATEMENTS OF OPERATIONS (Unaudited)
(Amounts in millions)
Three-Month Periods Nine-Month PeriodsEnded September 30, Ended September 30,
2017 2016 2017 2016Operating revenue:
Electric $ 215 $ 207 $ 534 $ 539Natural gas 15 15 66 81
Total operating revenue 230 222 600 620
Operating costs and expenses:Cost of fuel, energy and capacity 76 73 193 208Natural gas purchased for resale 4 5 26 42Operating and maintenance 40 40 121 126Depreciation and amortization 29 30 85 88Property and other taxes 6 5 18 18
Total operating costs and expenses 155 153 443 482
Operating income 75 69 157 138
Other income (expense):Interest expense (11) (12) (33) (42)Allowance for borrowed funds 1 — 1 1Allowance for equity funds 1 1 2 2Other, net 2 2 4 3
Total other income (expense) (7) (9) (26) (36)
Income before income tax expense 68 60 131 102Income tax expense 24 22 46 37
Net income $ 44 $ 38 $ 85 $ 65
The accompanying notes are an integral part of these consolidated financial statements.
134

SIERRA PACIFIC POWER COMPANY AND SUBSIDIARIESCONSOLIDATED STATEMENTS OF CHANGES IN SHAREHOLDER'S EQUITY (Unaudited)
(Amounts in millions, except shares)
AccumulatedOther Retained Other Total
Common Stock Paid-in Earnings Comprehensive Shareholder'sShares Amount Capital (Deficit) Loss, Net Equity
Balance, December 31, 2015 1,000 $ — $ 1,111 $ (35) $ — $ 1,076Net income — — — 65 — 65Dividends declared — — — (45) — (45)Other equity transactions — — — — (1) (1)Balance, September 30, 2016 1,000 $ — $ 1,111 $ (15) $ (1) $ 1,095
Balance, December 31, 2016 1,000 $ — $ 1,111 $ (2) $ (1) $ 1,108Net income — — — 85 — 85Dividends declared — — — (5) — (5)Balance, September 30, 2017 1,000 $ — $ 1,111 $ 78 $ (1) $ 1,188
The accompanying notes are an integral part of these consolidated financial statements.
135
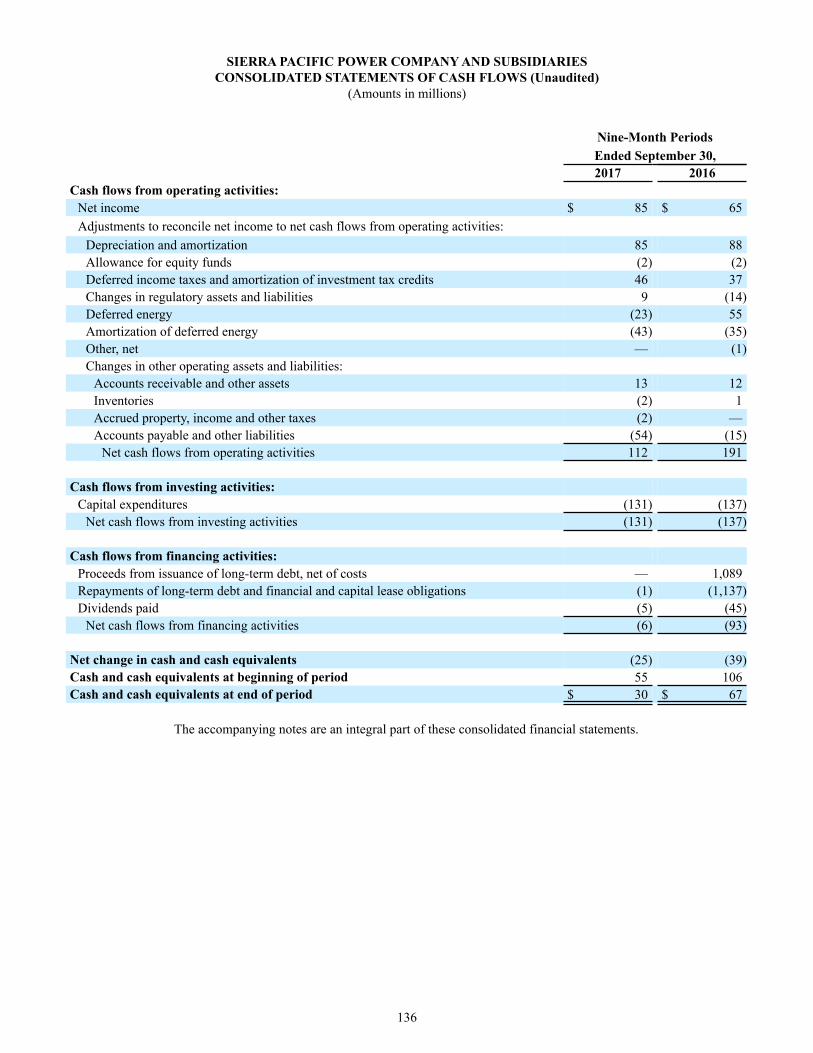
SIERRA PACIFIC POWER COMPANY AND SUBSIDIARIESCONSOLIDATED STATEMENTS OF CASH FLOWS (Unaudited)
(Amounts in millions)
Nine-Month PeriodsEnded September 30,2017 2016
Cash flows from operating activities:Net income $ 85 $ 65Adjustments to reconcile net income to net cash flows from operating activities:
Depreciation and amortization 85 88Allowance for equity funds (2) (2)Deferred income taxes and amortization of investment tax credits 46 37Changes in regulatory assets and liabilities 9 (14)Deferred energy (23) 55Amortization of deferred energy (43) (35)Other, net — (1)Changes in other operating assets and liabilities:
Accounts receivable and other assets 13 12Inventories (2) 1Accrued property, income and other taxes (2) —Accounts payable and other liabilities (54) (15)
Net cash flows from operating activities 112 191
Cash flows from investing activities:Capital expenditures (131) (137)
Net cash flows from investing activities (131) (137)
Cash flows from financing activities:Proceeds from issuance of long-term debt, net of costs — 1,089Repayments of long-term debt and financial and capital lease obligations (1) (1,137)Dividends paid (5) (45)
Net cash flows from financing activities (6) (93)
Net change in cash and cash equivalents (25) (39)Cash and cash equivalents at beginning of period 55 106Cash and cash equivalents at end of period $ 30 $ 67
The accompanying notes are an integral part of these consolidated financial statements.
136

SIERRA PACIFIC POWER COMPANY AND SUBSIDIARIESNOTES TO CONSOLIDATED FINANCIAL STATEMENTS
(Unaudited)
137
(1) Organization and Operations
Sierra Pacific Power Company, together with its subsidiaries ("Sierra Pacific"), is a wholly owned subsidiary of NV Energy, Inc.("NV Energy"), a holding company that also owns Nevada Power Company ("Nevada Power") and certain other subsidiaries.Sierra Pacific is a United States regulated electric utility company serving retail customers, including residential, commercial andindustrial customers and regulated retail natural gas customers primarily in northern Nevada. NV Energy is an indirect whollyowned subsidiary of Berkshire Hathaway Energy Company ("BHE"). BHE is a holding company based in Des Moines, Iowa thatowns subsidiaries principally engaged in energy businesses. BHE is a consolidated subsidiary of Berkshire Hathaway Inc.("Berkshire Hathaway").
The unaudited Consolidated Financial Statements have been prepared in accordance with accounting principles generally acceptedin the United States of America ("GAAP") for interim financial information and the United States Securities and ExchangeCommission's rules and regulations for Form 10-Q and Article 10 of Regulation S-X. Accordingly, they do not include all of thedisclosures required by GAAP for annual financial statements. Management believes the unaudited Consolidated FinancialStatements contain all adjustments (consisting only of normal recurring adjustments) considered necessary for the fair presentationof the unaudited Consolidated Financial Statements as of September 30, 2017 and for the three- and nine-month periods endedSeptember 30, 2017 and 2016. The Consolidated Statements of Comprehensive Income have been omitted as net income equalscomprehensive income for the three- and nine-month periods ended September 30, 2017 and 2016. The results of operations forthe three- and nine-month periods ended September 30, 2017 are not necessarily indicative of the results to be expected for thefull year.
The preparation of the unaudited Consolidated Financial Statements in conformity with GAAP requires management to makeestimates and assumptions that affect the reported amounts of assets and liabilities at the date of the unaudited ConsolidatedFinancial Statements and the reported amounts of revenue and expenses during the period. Actual results may differ from theestimates used in preparing the unaudited Consolidated Financial Statements. Note 2 of Notes to Consolidated Financial Statementsincluded in Sierra Pacific's Annual Report on Form 10-K for the year ended December 31, 2016 describes the most significantaccounting policies used in the preparation of the unaudited Consolidated Financial Statements. There have been no significantchanges in Sierra Pacific's assumptions regarding significant accounting estimates and policies during the nine-month period endedSeptember 30, 2017.
(2) New Accounting Pronouncements
In March 2017, the Financial Accounting Standards Board ("FASB") issued Accounting Standards Update ("ASU") No. 2017-07,which amends FASB Accounting Standards Codification ("ASC") Topic 715, "Compensation - Retirement Benefits." Theamendments in this guidance require that an employer disaggregate the service cost component from the other components of netbenefit cost and report the service cost component in the same line item as other compensation costs arising from services renderedby the pertinent employees during the period. The other components of net benefit cost are required to be presented in the statementof operations separately from the service cost component and outside the subtotal of operating income. Additionally, the guidanceonly allows the service cost component to be eligible for capitalization when applicable. This guidance is effective for interim andannual reporting periods beginning after December 15, 2017, with early adoption permitted. This guidance must be adoptedretrospectively for the presentation of the service cost component and the other components of net benefit cost in the statementof operations and prospectively for the capitalization of the service cost component in the balance sheet. Sierra Pacific plans toadopt this guidance effective January 1, 2018. Sierra Pacific does not believe this will have a material impact on its ConsolidatedFinancial Statements and disclosures included within Notes to Consolidated Financial Statements.
In November 2016, the FASB issued ASU No. 2016-18, which amends FASB ASC Subtopic 230-10, "Statement of Cash Flows- Overall." The amendments in this guidance require that a statement of cash flows explain the change during the period in thetotal of cash, cash equivalents, and amounts generally described as restricted cash or restricted cash equivalents. Amounts generallydescribed as restricted cash and restricted cash equivalents should be included with cash and cash equivalents when reconcilingthe beginning-of-period and end-of-period total amounts shown on the statement of cash flows. This guidance is effective forinterim and annual reporting periods beginning after December 15, 2017, with early adoption permitted, and is required to beadopted retrospectively. Sierra Pacific plans to adopt this guidance effective January 1, 2018 and does not believe the adoption ofthis guidance will have a material impact on its Consolidated Financial Statements and disclosures included within Notes toConsolidated Financial Statements.

In August 2016, the FASB issued ASU No. 2016-15, which amends FASB ASC Topic 230, "Statement of Cash Flows." Theamendments in this guidance address the classification of eight specific cash flow issues within the statement of cash flows withthe objective of reducing the existing diversity in practice. This guidance is effective for interim and annual reporting periodsbeginning after December 15, 2017, with early adoption permitted, and is required to be adopted retrospectively. Sierra Pacificplans to adopt this guidance effective January 1, 2018 and does not believe the adoption of this guidance will have a materialimpact on its Consolidated Financial Statements.
In February 2016, the FASB issued ASU No. 2016-02, which creates FASB ASC Topic 842, "Leases" and supersedes Topic 840"Leases." This guidance increases transparency and comparability among entities by recording lease assets and lease liabilitieson the balance sheet and disclosing key information about leasing arrangements. A lessee should recognize in the balance sheet aliability to make lease payments (the lease liability) and a right-of-use asset representing its right to use the underlying asset forthe lease term. The recognition, measurement, and presentation of expenses and cash flows arising from a lease by a lessee havenot significantly changed from previous guidance. This guidance is effective for interim and annual reporting periods beginningafter December 15, 2018, with early adoption permitted, and is required to be adopted using a modified retrospective approach.Sierra Pacific plans to adopt this guidance effective January 1, 2019 and is currently evaluating the impact on its ConsolidatedFinancial Statements and disclosures included within Notes to Consolidated Financial Statements.
In May 2014, the FASB issued ASU No. 2014-09, which creates FASB ASC Topic 606, "Revenue from Contracts with Customers"and supersedes ASC Topic 605, "Revenue Recognition." The guidance replaces industry-specific guidance and establishes a singlefive-step model to identify and recognize revenue. The core principle of the guidance is that an entity should recognize revenueupon transfer of control of promised goods or services to customers in an amount that reflects the consideration to which an entityexpects to be entitled in exchange for those goods or services. Additionally, the guidance requires the entity to disclose furtherquantitative and qualitative information regarding the nature and amount of revenues arising from contracts with customers, aswell as other information about the significant judgments and estimates used in recognizing revenues from contracts with customers.In August 2015, the FASB issued ASU No. 2015-14, which defers the effective date of ASU No. 2014-09 one year to interim andannual reporting periods beginning after December 15, 2017. During 2016 and 2017, the FASB issued several ASUs that clarifythe implementation guidance for ASU No. 2014-09 but do not change the core principle of the guidance. This guidance may beadopted retrospectively or under a modified retrospective method where the cumulative effect is recognized at the date of initialapplication. Sierra Pacific plans to adopt this guidance effective January 1, 2018 under the modified retrospective method and iscurrently evaluating the impact on its Consolidated Financial Statements and disclosures included within Notes to ConsolidatedFinancial Statements. Sierra Pacific currently does not expect the timing and amount of revenue currently recognized to be materiallydifferent after adoption of the new guidance as a majority of revenue is recognized when Sierra Pacific has the right to invoice asit corresponds directly with the value to the customer of Sierra Pacific’s performance to date. Sierra Pacific's current plan is toquantitatively disaggregate revenue in the required financial statement footnote by segment and customer class.
138

(3) Property, Plant and Equipment, Net
Property, plant and equipment, net consists of the following (in millions):
As ofDepreciable
LifeSeptember 30, December 31,
2017 2016Utility plant:
Electric generation 25 - 60 years $ 1,140 $ 1,137Electric distribution 20 - 100 years 1,445 1,417Electric transmission 50 - 100 years 782 771Electric general and intangible plant 5 - 70 years 182 164Natural gas distribution 35 - 70 years 388 381Natural gas general and intangible plant 5 - 70 years 14 15Common general 5 - 70 years 290 267
Utility plant 4,241 4,152Accumulated depreciation and amortization (1,496) (1,442)
Utility plant, net 2,745 2,710Other non-regulated, net of accumulated depreciation and amortization 70 years 5 5
Plant, net 2,750 2,715Construction work-in-progress 112 107
Property, plant and equipment, net $ 2,862 $ 2,822
During 2016, Sierra Pacific revised its electric and gas depreciation rates based on the results of a new depreciation study, themost significant impact of which was shorter estimated useful lives at the Valmy Generating Station. The effect of this changewill increase depreciation and amortization expense by $9 million annually based on depreciable plant balances at the time of thechange. However, the Public Utilities Commission of Nevada ("PUCN") ordered the change relating to the Valmy GeneratingStation of $7 million annually be deferred for future recovery through a regulatory asset.
139
(4) Regulatory Matters
Deferred Energy
Nevada statutes permit regulated utilities to adopt deferred energy accounting procedures. The intent of these procedures is to easethe effect on customers of fluctuations in the cost of purchased natural gas, fuel and electricity and are subject to annual prudencyreview by the PUCN. Under deferred energy accounting, to the extent actual fuel and purchased power costs exceed fuel andpurchased power costs recoverable through current rates that excess is not recorded as a current expense on the ConsolidatedStatements of Operations but rather is deferred and recorded as a regulatory asset on the Consolidated Balance Sheets. Conversely,a regulatory liability is recorded to the extent fuel and purchased power costs recoverable through current rates exceed actual fueland purchased power costs. These excess amounts are reflected in quarterly adjustments to rates and recorded as cost of fuel,energy and capacity in future time periods.
Regulatory Rate Review
In June 2016, Sierra Pacific filed an electric regulatory rate review with the PUCN. The filing requested no incremental annualrevenue relief. In October 2016, Sierra Pacific filed with the PUCN a settlement agreement resolving most, but not all, issues inthe proceeding and reduced Sierra Pacific's electric revenue requirement by $3 million spread evenly to all rate classes. In December2016, the PUCN approved the settlement agreement and established an additional six MW of net metering capacity under thegrandfathered rates, which are those net metering rates that were in effect prior to January 2016; the order establishes cost-basedrates and a value-based excess energy credit for customers who choose to install private generation after the six MW limitation isreached. The new rates were effective January 1, 2017. In January 2017, Sierra Pacific filed a petition for reconsideration relatingto the creation of the additional six megawatts ("MW") of net metering at the grandfathered rates. Sierra Pacific believes the effectsof the PUCN decision result in additional cost shifting to non-net metering customers and reduces the stipulated rate reductionfor other customer classes. In June 2017, the PUCN denied the petition for reconsideration.

In June 2016, Sierra Pacific filed a gas regulatory rate review with the PUCN. The filing requested a slight decrease in its incrementalannual revenue requirement. In October 2016, Sierra Pacific filed with the PUCN a settlement agreement resolving all issues inthe proceeding and reduced Sierra Pacific's gas revenue requirement by $2 million. In December 2016, the PUCN approved thesettlement agreement. The new rates were effective January 1, 2017.
Chapter 704B Applications
Chapter 704B of the Nevada Revised Statutes allows retail electric customers with an average annual load of one megawatt ("MW")or more to file with the PUCN an application to purchase energy from alternative providers of a new electric resource and becomedistribution only service customers. On a case-by-case basis, the PUCN will assess the application and may deny or grant theapplication subject to conditions, including paying an impact fee, paying on-going charges and receiving approval for specificalternative energy providers and terms. The impact fee and on-going charges are assessed to alleviate the burden on other Nevadacustomers for the applicant's share of previously committed investments and long-term renewable contracts and are set at a leveldesigned such that the remaining customers are not subjected to increased costs.
In September 2016, Switch, Ltd. ("Switch"), a customer of Sierra Pacific, filed an application with the PUCN to purchase energyfrom alternative providers of a new electric resource and become a distribution only service customer of Sierra Pacific. InDecember 2016, the PUCN approved a stipulation agreement that allows Switch to purchase energy from alternative providerssubject to conditions. In June 2017, Switch became a distribution only service customer and started procuring energy from anotherenergy supplier.
In November 2016, Caesars Enterprise Service ("Caesars"), a customer of Sierra Pacific, filed an application with the PUCN topurchase energy from alternative providers of a new electric resource and become a distribution only service customer of SierraPacific. In March 2017, the PUCN approved the application allowing Caesars to purchase energy from alternative providers subjectto conditions, including paying an impact fee. In March 2017, Caesars provided notice that it intends to pay the impact fee andproceed with purchasing energy from alternative providers. In July 2017, Caesars made the required compliance filings and, inSeptember 2017, the PUCN issued an order allowing Caesars to acquire electric energy and ancillary services from another energysupplier and become a distribution only service customer of Sierra Pacific.
In May 2017, Peppermill Resort Spa Casino ("Peppermill"), a customer of Sierra Pacific, filed an application with the PUCN topurchase energy from alternative providers of a new electric resource and become a distribution only service customer of SierraPacific. In August 2017, the PUCN approved a stipulation allowing Peppermill to purchase energy from alternative providerssubject to conditions, including paying an impact fee. In September 2017, Peppermill provided notice that it intends to pay theimpact fee and proceed with purchasing energy from alternative providers.
140
(5) Recent Financing Transactions
In June 2017, Sierra Pacific amended its $250 million secured credit facility, extending the maturity date to June 2020 with twoone-year extension options subject to lender consent. The amended credit facility, which is for general corporate purposes andprovides for the issuance of letters of credit, has a variable interest rate based on the Eurodollar rate or a base rate, at Sierra Pacific'soption, plus a spread that varies based on Sierra Pacific's credit ratings for its senior secured long-term debt securities. The amendedcredit facility requires Sierra Pacific's ratio of consolidated debt, including current maturities, to total capitalization not exceed0.65 to 1.0 as of the last day of each quarter.
(6) Employee Benefit Plans
Sierra Pacific is a participant in benefit plans sponsored by NV Energy. The NV Energy Retirement Plan includes a qualifiedpension plan ("Qualified Pension Plan") and a supplemental executive retirement plan and a restoration plan (collectively,"Non‑Qualified Pension Plans") that provide pension benefits for eligible employees. The NV Energy Comprehensive WelfareBenefit and Cafeteria Plan provides certain postretirement health care and life insurance benefits for eligible retirees ("OtherPostretirement Plans") on behalf of Sierra Pacific. Sierra Pacific contributed $4 million to the Other Postretirement Plans for thenine-month period ended September 30, 2017. Amounts attributable to Sierra Pacific were allocated from NV Energy based uponthe current, or in the case of retirees, previous, employment location. Offsetting regulatory assets and liabilities have been recordedrelated to the amounts not yet recognized as a component of net periodic benefit costs that will be included in regulated rates. Netperiodic benefit costs not included in regulated rates are included in accumulated other comprehensive loss, net.

Amounts payable to NV Energy are included on the Consolidated Balance Sheets and consist of the following (in millions):
As ofSeptember 30, December 31,
2017 2016Qualified Pension Plan -
Other long-term liabilities $ (13) $ (12)
Non-Qualified Pension Plans:Other current liabilities (1) (1)Other long-term liabilities (9) (9)
Other Postretirement Plans -Other long-term liabilities (25) (28)
141
(7) Fair Value Measurements
The carrying value of Sierra Pacific's cash, certain cash equivalents, receivables, payables, accrued liabilities and short-termborrowings approximates fair value because of the short-term maturity of these instruments. Sierra Pacific has various financialassets and liabilities that are measured at fair value on the Consolidated Balance Sheets using inputs from the three levels of thefair value hierarchy. A financial asset or liability classification within the hierarchy is determined based on the lowest level inputthat is significant to the fair value measurement. The three levels are as follows:
• Level 1 — Inputs are unadjusted quoted prices in active markets for identical assets or liabilities that Sierra Pacific hasthe ability to access at the measurement date.
• Level 2 — Inputs include quoted prices for similar assets or liabilities in active markets, quoted prices for identical orsimilar assets or liabilities in markets that are not active, inputs other than quoted prices that are observable for the assetor liability and inputs that are derived principally from or corroborated by observable market data by correlation or othermeans (market corroborated inputs).
• Level 3 — Unobservable inputs reflect Sierra Pacific's judgments about the assumptions market participants would usein pricing the asset or liability since limited market data exists. Sierra Pacific develops these inputs based on the bestinformation available, including its own data.
The following table presents Sierra Pacific's financial assets and liabilities recognized on the Consolidated Balance Sheets andmeasured at fair value on a recurring basis (in millions):
Input Levels for Fair Value MeasurementsLevel 1 Level 2 Level 3 Total
As of September 30, 2017Assets - investment funds $ — $ — $ — $ —
As of December 31, 2016Assets:Money market mutual funds(1) $ 35 $ — $ — $ 35Investment funds 1 — — 1
$ 36 $ — $ — $ 36
(1) Amounts are included in cash and cash equivalents on the Consolidated Balance Sheets. The fair value of these money market mutual funds approximatescost.

Sierra Pacific's investments in money market mutual funds and equity securities are accounted for as available-for-sale securitiesand are stated at fair value. When available, a readily observable quoted market price or net asset value of an identical security inan active market is used to record the fair value.
Sierra Pacific's long-term debt is carried at cost on the Consolidated Balance Sheets. The fair value of Sierra Pacific's long-termdebt is a Level 2 fair value measurement and has been estimated based upon quoted market prices, where available, or at thepresent value of future cash flows discounted at rates consistent with comparable maturities with similar credit risks. The carryingvalue of Sierra Pacific's variable-rate long-term debt approximates fair value because of the frequent repricing of these instrumentsat market rates. The following table presents the carrying value and estimated fair value of Sierra Pacific's long-term debt(in millions):
As of September 30, 2017 As of December 31, 2016Carrying Fair Carrying Fair
Value Value Value Value
Long-term debt $ 1,120 $ 1,201 $ 1,119 $ 1,191
142
(8) Commitments and Contingencies
Environmental Laws and Regulations
Sierra Pacific is subject to federal, state and local laws and regulations regarding air and water quality, renewable portfolio standards,emissions performance standards, climate change, coal combustion byproduct disposal, hazardous and solid waste disposal,protected species and other environmental matters that have the potential to impact Sierra Pacific's current and future operations.Sierra Pacific believes it is in material compliance with all applicable laws and regulations.
Legal Matters
Sierra Pacific is party to a variety of legal actions arising out of the normal course of business. Plaintiffs occasionally seek punitiveor exemplary damages. Sierra Pacific does not believe that such normal and routine litigation will have a material impact on itsconsolidated financial results.
(9) Segment Information
Sierra Pacific has identified two reportable operating segments: regulated electric and regulated natural gas. The regulated electricsegment derives most of its revenue from regulated retail sales of electricity to residential, commercial, and industrial customersand from wholesale sales. The regulated natural gas segment derives most of its revenue from regulated retail sales of natural gasto residential, commercial, and industrial customers and also obtains revenue by transporting natural gas owned by others throughits distribution system. Pricing for regulated electric and regulated natural gas sales are established separately by the PUCN;therefore, management also reviews each segment separately to make decisions regarding allocation of resources and in evaluatingperformance.
Sierra Pacific believes presenting gross margin allows the reader to assess the impact of Sierra Pacific's regulatory treatment andits overall regulatory environment on a consistent basis and is meaningful. Gross margin is calculated as operating revenue lesscost of fuel, energy and capacity and natural gas purchased for resale ("cost of sales").
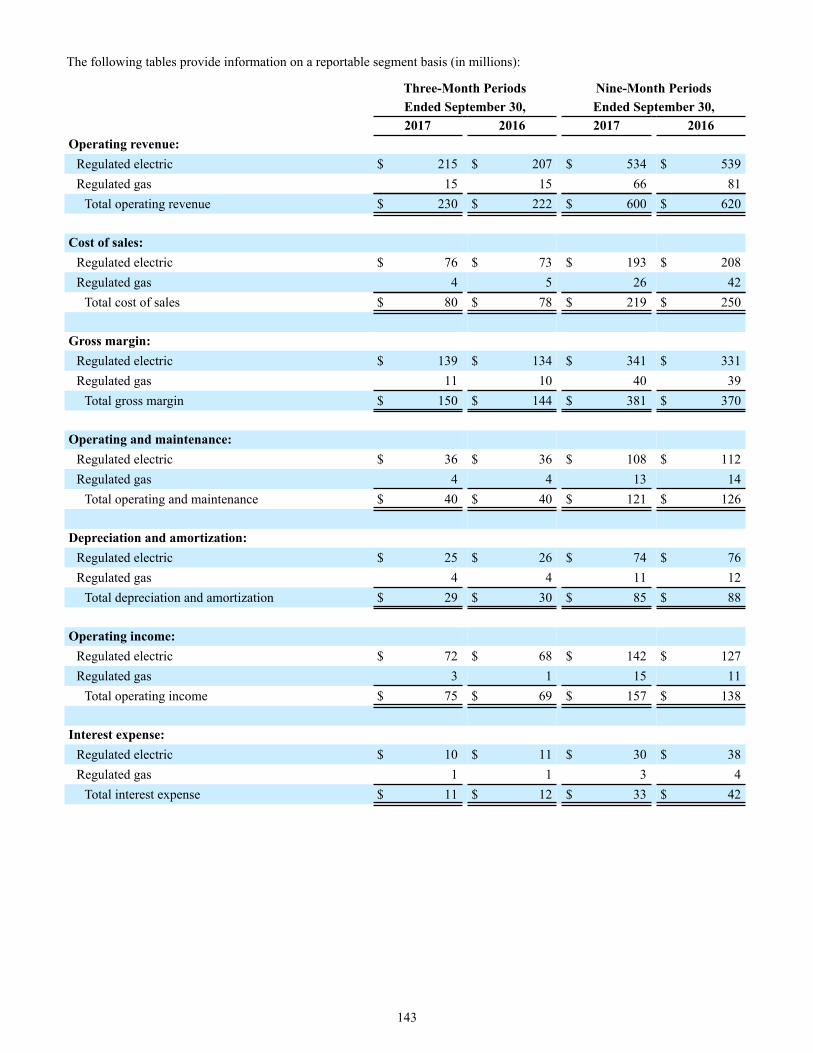
The following tables provide information on a reportable segment basis (in millions):
Three-Month Periods Nine-Month PeriodsEnded September 30, Ended September 30,2017 2016 2017 2016
Operating revenue:Regulated electric $ 215 $ 207 $ 534 $ 539Regulated gas 15 15 66 81
Total operating revenue $ 230 $ 222 $ 600 $ 620
Cost of sales:Regulated electric $ 76 $ 73 $ 193 $ 208Regulated gas 4 5 26 42
Total cost of sales $ 80 $ 78 $ 219 $ 250
Gross margin:Regulated electric $ 139 $ 134 $ 341 $ 331Regulated gas 11 10 40 39
Total gross margin $ 150 $ 144 $ 381 $ 370
Operating and maintenance:Regulated electric $ 36 $ 36 $ 108 $ 112Regulated gas 4 4 13 14
Total operating and maintenance $ 40 $ 40 $ 121 $ 126
Depreciation and amortization:Regulated electric $ 25 $ 26 $ 74 $ 76Regulated gas 4 4 11 12
Total depreciation and amortization $ 29 $ 30 $ 85 $ 88
Operating income:Regulated electric $ 72 $ 68 $ 142 $ 127Regulated gas 3 1 15 11
Total operating income $ 75 $ 69 $ 157 $ 138
Interest expense:Regulated electric $ 10 $ 11 $ 30 $ 38Regulated gas 1 1 3 4
Total interest expense $ 11 $ 12 $ 33 $ 42
143

As ofSeptember 30, December 31,
2017 2016Assets:
Regulated electric $ 3,165 $ 3,119Regulated gas 305 314Regulated common assets(1) 37 60
Total assets $ 3,507 $ 3,493
(1) Consists principally of cash and cash equivalents not included in either the regulated electric or regulated natural gas segments.
144
Item 2. Management's Discussion and Analysis of Financial Condition and Results of Operations
General
Sierra Pacific's revenues and operating income are subject to fluctuations during the year due to impacts that seasonal weather,rate changes, and customer usage patterns have on demand for electric energy and resources. Sierra Pacific is a summer peakingutility experiencing its highest retail energy sales in response to the demand for air conditioning. The variations in energy usagedue to varying weather, customer growth and other energy usage patterns, including energy efficiency and conservation measures,necessitates a continual balancing of loads and resources and purchases and sales of energy under short- and long-term energysupply contracts. As a result, the prudent management and optimization of available resources has a direct effect on the operatingand financial performance of Sierra Pacific. Additionally, the timely recovery of purchased power, fuel costs and other costs andthe ability to earn a fair return on investments through rates are essential to the operating and financial performance of SierraPacific.
The following is management's discussion and analysis of certain significant factors that have affected the consolidated financialcondition and results of operations of Sierra Pacific during the periods included herein. Explanations include management's bestestimate of the impact of weather, customer growth and other factors. This discussion should be read in conjunction with SierraPacific's historical unaudited Consolidated Financial Statements and Notes to Consolidated Financial Statements in Part I, Item 1of this Form 10-Q. Sierra Pacific's actual results in the future could differ significantly from the historical results.
145
Results of Operations for the Third Quarter and First Nine Months of 2017 and 2016
Overview
Net income for the third quarter of 2017 was $44 million, an increase of $6 million, or 16%, compared to 2016 due to a decreasein interest expense from lower rates on outstanding debt balances and on deferred charges, higher electric margins primarily fromincreased customer usage due to the impacts of weather and customer usage patterns and decreased other operating costs. Theincrease in net income was partially offset by lower wholesale revenue.
Net income for the first nine months of 2017 was $85 million, an increase of $20 million, or 31%, compared to 2016 due to adecrease in interest expense from lower rates on outstanding debt balances and on deferred charges, higher electric marginsprimarily from increased customer usage due to the impacts of weather and customer usage patterns, higher transmission revenueand lower other operating costs. The increase in net income was partially offset by lower wholesale revenue.
Operating revenue, cost of fuel, energy and capacity and natural gas purchased for resale are key drivers of Sierra Pacific's resultsof operations as they encompass retail and wholesale electricity and natural gas revenue and the direct costs associated withproviding electricity and natural gas to customers. Sierra Pacific believes that a discussion of gross margin, representing operatingrevenue less cost of fuel, energy and capacity and natural gas purchased for resale, is therefore meaningful.

A comparison of Sierra Pacific's key operating results is as follows:
Electric Gross Margin
Third Quarter First Nine Months2017 2016 Change 2017 2016 Change
Gross margin (in millions):Operating electric revenue $ 215 $ 207 $ 8 4 % $ 534 $ 539 $ (5) (1) %Cost of fuel, energy and capacity 76 73 3 4 193 208 (15) (7)
Gross margin $ 139 $ 134 $ 5 4 $ 341 $ 331 $ 10 3
GWh sold:Residential 736 694 42 6 % 1,904 1,798 106 6 %Commercial 850 854 (4) — 2,271 2,241 30 1Industrial 797 747 50 7 2,346 2,235 111 5Other 4 4 — — 12 12 — —
Total fully bundled(1) 2,387 2,299 88 4 6,533 6,286 247 4Distribution only service 348 346 2 1 1,041 1,019 22 2
Total retail 2,735 2,645 90 3 7,574 7,305 269 4Wholesale 103 147 (44) (30) 392 481 (89) (19)
Total GWh sold 2,838 2,792 46 2 7,966 7,786 180 2
Average number of retailcustomers (in thousands):
Residential 295 292 3 1 % 295 291 4 1 %Commercial 47 47 — — 47 47 — —
Total 342 339 3 1 342 338 4 1
Average revenue per MWh:Retail fully bundled(1) $ 85.07 $ 84.77 $ 0.30 — % $ 75.89 $ 79.90 $ (4.01) (5) %Wholesale $ 61.21 $ 52.33 $ 8.88 17 $ 52.92 $ 50.96 $ 1.96 4
Heating degree days 118 43 75 * % 2,823 2,487 336 14 %Cooling degree days 1,070 796 274 34 % 1,401 1,088 313 29 %
Sources of energy (GWh)(2):Natural gas 1,221 1,215 6 — % 3,227 3,195 32 1 %Coal 355 392 (37) (9) 457 691 (234) (34)Renewables 12 — 12 * 31 — 31 *
Total energy generated 1,588 1,607 (19) (1) 3,715 3,886 (171) (4)Energy purchased 1,074 878 196 22 3,698 3,111 587 19
Total 2,662 2,485 177 7 7,413 6,997 416 6
Average total cost of energy perMWh(3): $ 28.53 $ 29.67 $ (1.14) (4) % $ 26.07 $ 29.82 $ (3.75) (13) %
* Not meaningful(1) Fully bundled includes sales to customers for combined energy, transmission and distribution services.(2) GWh amounts are net of energy used by the related generating facilities.(3) The average total cost of energy per MWh includes the cost of fuel, purchased power and deferrals and does not include other costs.
146

Natural Gas Gross Margin
Third Quarter First Nine Months2017 2016 Change 2017 2016 Change
Gross margin (in millions):Operating natural gas revenue $ 15 $ 15 $ — — % $ 66 $ 81 $ (15) (19) %Natural gas purchased for resale 4 5 (1) (20) 26 42 (16) (38)
Gross margin $ 11 $ 10 $ 1 10 $ 40 $ 39 $ 1 3
Dth sold:Residential 835 727 108 15 % 6,866 5,958 908 15 %Commercial 494 459 35 8 3,522 3,182 340 11Industrial 244 216 28 13 1,255 1,080 175 16
Total retail 1,573 1,402 171 12 11,643 10,220 1,423 14
Average number of retailcustomers (in thousands) 164 162 2 1 % 164 161 3 2 %
Average revenue per retail Dthsold $ 8.59 $ 10.22 $ (1.63) (16) % $ 5.47 $ 7.68 $ (2.21) (29) %
Average cost of natural gas perretail Dth sold $ 2.53 $ 3.11 $ (0.58) (19) % $ 2.20 $ 4.09 $ (1.89) (46) %
Heating degree days 118 43 75 * % 2,823 2,487 336 14 %
Electric gross margin increased $5 million, or 4%, for the third quarter of 2017 compared to 2016 due to:
• $4 million higher customer usage primarily from the impacts of weather and
• $3 million from customer usage patterns.
The increase in electric gross margin was partially offset by:
• $2 million in decreased wholesale revenue due to lower volumes.
Other income (expense) is favorable $2 million, or 22%, for the third quarter of 2017 compared to 2016 primarily due to lowerinterest on deferred charges.
Income tax expense increased $2 million, or 9%, for the third quarter of 2017 compared to 2016. The effective tax rate was 35%in 2017 and 37% in 2016.
Electric gross margin increased $10 million, or 3%, for the first nine months of 2017 compared to 2016 due to:
• $8 million higher customer usage primarily from the impacts of weather;
• $3 million from customer usage patterns and
• $2 million in higher transmission revenue.
The increase in electric gross margin was partially offset by:
• $4 million in decreased wholesale revenue due to lower volumes.
Operating and maintenance decreased $5 million, or 4%, for the first nine months of 2017 compared to 2016 due to lower otheroperating costs, partially offset by lower operating and maintenance related regulatory credit amortizations.
Depreciation and amortization decreased $3 million, or 3%, for the first nine months of 2017 compared to 2016 primarily due toregulatory amortizations.
Other income (expense) is favorable $10 million, or 28%, for the first nine months of 2017 compared to 2016 due to a decreasein interest expense from lower rates on outstanding debt balances and lower interest on deferred charges.
147

Income tax expense increased $9 million, or 24%, for the first nine months of 2017 compared to 2016. The effective tax rate was35% in 2017 and 36% in 2016.
148
Liquidity and Capital Resources
As of September 30, 2017, Sierra Pacific's total net liquidity was as follows (in millions):
Cash and cash equivalents $ 30
Credit facility 250Less:
Tax-exempt bond support (80)Net credit facility 170
Total net liquidity $ 200
Operating Activities
Net cash flows from operating activities for the nine-month periods ended September 30, 2017 and 2016 were $112 million and$191 million, respectively. The change was due to higher payments for fuel costs, partially offset by lower contributions to thepension plan.
In December 2015, the Protecting Americans from Tax Hikes Act of 2015 ("PATH") was signed into law, extending bonusdepreciation for qualifying property acquired and placed in-service before January 1, 2020 (bonus depreciation rates will be 50%for 2015-2017, 40% in 2018, and 30% in 2019), with an additional year for certain longer lived assets. Investment tax credits wereextended and phased-down for solar projects that are under construction before the end of 2021 (investment tax credit rates are30% through 2019, 26% in 2020 and 22% in 2021; they revert to the statutory rate of 10% thereafter). As a result of PATH, SierraPacific's cash flows from operations are expected to benefit due to bonus depreciation on qualifying assets placed in-servicethrough 2019 and investment tax credits (once the net operating loss is fully utilized) earned on qualifying projects through 2021.
The timing of Sierra Pacific's income tax cash flows from period to period can be significantly affected by the estimated federalincome tax payment methods and assumptions for each payment date.
Investing Activities
Net cash flows from investing activities for the nine-month periods ended September 30, 2017 and 2016 were $(131) million and$(137) million, respectively. The change was due to decreased capital expenditures.
Financing Activities
Net cash flows from financing activities for the nine-month periods ended September 30, 2017 and 2016 were $(6) million and$(93) million, respectively. The change was due to lower repayments of long-term debt and lower dividends paid to NV Energy,Inc. in 2017, partially offset by lower proceeds from issuance of long-term debt.
Ability to Issue Debt
Sierra Pacific's ability to issue debt is primarily impacted by its financing authority from the PUCN. As of September 30, 2017,Sierra Pacific has financing authority from the PUCN consisting of the ability to: (1) issue additional long-term debt securities ofup to $350 million; (2) refinance up to $55 million of long-term debt securities; and (3) maintain a revolving credit facility of upto $600 million. Sierra Pacific's revolving credit facility contains a financial maintenance covenant which Sierra Pacific was incompliance with as of September 30, 2017.

Future Uses of Cash
Sierra Pacific has available a variety of sources of liquidity and capital resources, both internal and external, including net cashflows from operating activities, public and private debt offerings, the use of its secured revolving credit facility, capital contributionsand other sources. These sources are expected to provide funds required for current operations, capital expenditures, debt retirementsand other capital requirements. The availability and terms under which Sierra Pacific has access to external financing depends ona variety of factors, including Sierra Pacific's credit ratings, investors' judgment of risk and conditions in the overall capital markets,including the condition of the utility industry.
Capital Expenditures
Sierra Pacific has significant future capital requirements. Capital expenditure needs are reviewed regularly by management andmay change significantly as a result of these reviews, which may consider, among other factors, changes in environmental andother rules and regulations; impacts to customers' rates; outcomes of regulatory proceedings; changes in income tax laws; generalbusiness conditions; load projections; system reliability standards; the cost and efficiency of construction labor, equipment andmaterials; commodity prices; and the cost and availability of capital. Prudently incurred expenditures for compliance-related itemssuch as pollution-control technologies, replacement generation and associated operating costs are generally incorporated intoSierra Pacific's regulated retail rates. Expenditures for certain assets may ultimately include acquisition of existing assets.
Sierra Pacific's historical and forecast capital expenditures, each of which exclude amounts for non-cash equity AFUDC and othernon-cash items are as follows (in millions):
Nine-Month Periods AnnualEnded September 30, Forecast
2016 2017 2017
Distribution $ 73 $ 61 $ 91Transmission system investment 16 9 14Other 48 61 80
Total $ 137 $ 131 $ 185
Sierra Pacific's forecast capital expenditures include investments that relate to operating projects that consist of routine expendituresfor transmission, distribution, generation and other infrastructure needed to serve existing and expected demand.
Contractual Obligations
As of September 30, 2017, there have been no material changes outside the normal course of business in contractual obligationsfrom the information provided in Item 7 of Sierra Pacific's Annual Report on Form 10-K for the year ended December 31, 2016.
149
Regulatory Matters
Sierra Pacific is subject to comprehensive regulation. Refer to "Regulatory Matters" in Berkshire Hathaway Energy's Part I, Item 2of this Form 10-Q for discussion regarding Sierra Pacific's current regulatory matters.
Environmental Laws and Regulations
Sierra Pacific is subject to federal, state and local laws and regulations regarding air and water quality, RPS, emissions performancestandards, climate change, coal combustion byproduct disposal, hazardous and solid waste disposal, protected species and otherenvironmental matters that have the potential to impact Sierra Pacific's current and future operations. In addition to imposingcontinuing compliance obligations and capital expenditure requirements, these laws and regulations provide regulators with theauthority to levy substantial penalties for noncompliance including fines, injunctive relief and other sanctions. These laws andregulations are administered by the EPA and various state and local agencies. All such laws and regulations are subject to a rangeof interpretation, which may ultimately be resolved by the courts. Environmental laws and regulations continue to evolve, andSierra Pacific is unable to predict the impact of the changing laws and regulations on its operations and consolidated financialresults. Sierra Pacific believes it is in material compliance with all applicable laws and regulations. Refer to "Liquidity and CapitalResources" for discussion of Sierra Pacific's forecasted environmental-related capital expenditures.

Refer to "Environmental Laws and Regulations" in Berkshire Hathaway Energy's Part I, Item 2 of this Form 10-Q for additionalinformation regarding environmental laws and regulations.
150
New Accounting Pronouncements
For a discussion of new accounting pronouncements affecting Sierra Pacific, refer to Note 2 of Notes to Consolidated FinancialStatements in Sierra Pacific's Part I, Item 1 of this Form 10-Q.
Critical Accounting Estimates
Certain accounting measurements require management to make estimates and judgments concerning transactions that will besettled several years in the future. Amounts recognized on the Consolidated Financial Statements based on such estimates involvenumerous assumptions subject to varying and potentially significant degrees of judgment and uncertainty and will likely changein the future as additional information becomes available. Estimates are used for, but not limited to, the accounting for the effectsof certain types of regulation, derivatives, impairment of long-lived assets, income taxes and revenue recognition - unbilled revenue.For additional discussion of Sierra Pacific's critical accounting estimates, see Item 7 of Sierra Pacific's Annual Report on Form 10‑Kfor the year ended December 31, 2016. There have been no significant changes in Sierra Pacific's assumptions regarding criticalaccounting estimates since December 31, 2016.

Item 3. Quantitative and Qualitative Disclosures About Market Risk
For quantitative and qualitative disclosures about market risk affecting the Registrants, see Item 7A of each Registrant's AnnualReport on Form 10-K for the year ended December 31, 2016. Each Registrant's exposure to market risk and its management ofsuch risk has not changed materially since December 31, 2016. Refer to Note 9 of the Notes to Consolidated Financial Statementsof Berkshire Hathaway Energy in Part I, Item 1 of this Form 10-Q, Note 6 of the Notes to Consolidated Financial Statements ofPacifiCorp in Part I, Item 1 of this Form 10-Q and Note 7 of the Notes to Consolidated Financial Statements of Nevada Power inPart I, Item 1 of this Form 10-Q for disclosure of the respective Registrant's derivative positions as of September 30, 2017.
151
Item 4. Controls and Procedures
At the end of the period covered by this Quarterly Report on Form 10-Q, each of Berkshire Hathaway Energy Company, PacifiCorp,MidAmerican Funding, LLC, MidAmerican Energy Company, Nevada Power Company and Sierra Pacific Power Company carriedout separate evaluations, under the supervision and with the participation of each such entity's management, including its ChiefExecutive Officer (principal executive officer) and its Chief Financial Officer (principal financial officer), or persons performingsimilar functions, of the effectiveness of the design and operation of its disclosure controls and procedures (as defined in Rule13a-15(e) promulgated under the Securities Exchange Act of 1934, as amended). Based upon these evaluations, management ofeach such entity, including its Chief Executive Officer (principal executive officer) and its Chief Financial Officer (principalfinancial officer), or persons performing similar functions, in each case, concluded that the disclosure controls and procedures forsuch entity were effective to ensure that information required to be disclosed by such entity in the reports that it files or submitsunder the Securities Exchange Act of 1934, as amended, is recorded, processed, summarized and reported within the time periodsspecified in the United States Securities and Exchange Commission's rules and forms, and is accumulated and communicated toits management, including its Chief Executive Officer (principal executive officer) and its Chief Financial Officer (principalfinancial officer), or persons performing similar functions, in each case, as appropriate to allow timely decisions regarding requireddisclosure by it. Each such entity hereby states that there has been no change in its internal control over financial reporting duringthe quarter ended September 30, 2017 that has materially affected, or is reasonably likely to materially affect, its internal controlover financial reporting.

PART II
152
Item 1. Legal Proceedings
Not applicable.
Item 1A. Risk Factors
There has been no material change to each Registrant's risk factors from those disclosed in Item 1A of each Registrant's AnnualReport on Form 10-K for the year ended December 31, 2016.
Item 2. Unregistered Sales of Equity Securities and Use of Proceeds
Not applicable.
Item 3. Defaults Upon Senior Securities
Not applicable.
Item 4. Mine Safety Disclosures
Information regarding Berkshire Hathaway Energy's and PacifiCorp's mine safety violations and other legal matters disclosed inaccordance with Section 1503(a) of the Dodd-Frank Wall Street Reform and Consumer Protection Act is included in Exhibit 95to this Form 10-Q.
Item 5. Other Information
Not applicable.
Item 6. Exhibits
The exhibits listed on the accompanying Exhibit Index are filed as part of this Quarterly Report.
SIGNATURES
Pursuant to the requirements of the Securities Exchange Act of 1934, each registrant has duly caused this report to be signed onits behalf by the undersigned thereunto duly authorized.
BERKSHIRE HATHAWAY ENERGY COMPANY
Date: November 3, 2017 /s/ Patrick J. GoodmanPatrick J. Goodman
Executive Vice President and Chief Financial Officer(principal financial and accounting officer)
PACIFICORP
Date: November 3, 2017 /s/ Nikki L. KoblihaNikki L. Kobliha
Vice President, Chief Financial Officer and Treasurer(principal financial and accounting officer)
MIDAMERICAN FUNDING, LLCMIDAMERICAN ENERGY COMPANY
Date: November 3, 2017 /s/ Thomas B. SpecketerThomas B. Specketer
Vice President and Controllerof MidAmerican Funding, LLC
and Vice President and Chief Financial Officerof MidAmerican Energy Company
(principal financial and accounting officer)
NEVADA POWER COMPANY
Date: November 3, 2017 /s/ E. Kevin BethelE. Kevin Bethel
Senior Vice President and Chief Financial Officer(principal financial and accounting officer)
SIERRA PACIFIC POWER COMPANY
Date: November 3, 2017 /s/ E. Kevin BethelE. Kevin Bethel
Senior Vice President and Chief Financial Officer(principal financial and accounting officer)
153
EXHIBIT INDEX
Exhibit No. Description
BERKSHIRE HATHAWAY ENERGY
10.1 $1,000,000,000 Credit Agreement, dated as of May 11, 2017, among Berkshire Hathaway Energy Company, asBorrower, the Banks, Financial Institutions and Other Institutional Lenders, as Initial Lenders, and The Bank ofTokyo-Mitsubishi UFJ, LTD., as Administrative Agent (incorporated by reference to Exhibit 10.1 to the BerkshireHathaway Energy Company Quarterly Report on Form 10-Q for the quarter ended June 30, 2017).
15.1 Awareness Letter of Independent Registered Public Accounting Firm.
31.1 Principal Executive Officer Certification Pursuant to Section 302 of the Sarbanes-Oxley Act of 2002.
31.2 Principal Financial Officer Certification Pursuant to Section 302 of the Sarbanes-Oxley Act of 2002.
32.1 Principal Executive Officer Certification Pursuant to Section 906 of the Sarbanes-Oxley Act of 2002.
32.2 Principal Financial Officer Certification Pursuant to Section 906 of the Sarbanes-Oxley Act of 2002.
PACIFICORP
15.2 Awareness Letter of Independent Registered Public Accounting Firm.
31.3 Principal Executive Officer Certification Pursuant to Section 302 of the Sarbanes-Oxley Act of 2002.
31.4 Principal Financial Officer Certification Pursuant to Section 302 of the Sarbanes-Oxley Act of 2002.
32.3 Principal Executive Officer Certification Pursuant to Section 906 of the Sarbanes-Oxley Act of 2002.
32.4 Principal Financial Officer Certification Pursuant to Section 906 of the Sarbanes-Oxley Act of 2002.
BERKSHIRE HATHAWAY ENERGY AND PACIFICORP
10.2 $600,000,000 Credit Agreement, dated as of June 30, 2017, among PacifiCorp, as Borrower, the Banks, FinancialInstitutions and Other Institutional Lenders, as Initial Lenders, JPMorgan Chase Bank, N.A., as AdministrativeAgent, and the LC Issuing Banks (incorporated by reference to Exhibit 10.2 to the Berkshire Hathaway EnergyCompany Quarterly Report on Form 10-Q for the quarter ended June 30, 2017).
95 Mine Safety Disclosures Required by the Dodd-Frank Wall Street Reform and Consumer Protection Act.
MIDAMERICAN ENERGY
15.3 Awareness Letter of Independent Registered Public Accounting Firm.
31.5 Principal Executive Officer Certification Pursuant to Section 302 of the Sarbanes-Oxley Act of 2002.
31.6 Principal Financial Officer Certification Pursuant to Section 302 of the Sarbanes-Oxley Act of 2002.
32.5 Principal Executive Officer Certification Pursuant to Section 906 of the Sarbanes-Oxley Act of 2002.
32.6 Principal Financial Officer Certification Pursuant to Section 906 of the Sarbanes-Oxley Act of 2002.
BERKSHIRE HATHAWAY ENERGY AND MIDAMERICAN ENERGY
10.3 $900,000,000 Credit Agreement, dated as of June 30, 2017, among MidAmerican Energy Company, as Borrower,the Banks, Financial Institutions and Other Institutional Lenders, as Initial Lenders, Mizuho Bank, LTD., asAdministrative Agent, and the LC Issuing Banks (incorporated by reference to Exhibit 10.3 to the BerkshireHathaway Energy Company Quarterly Report on Form 10-Q for the quarter ended June 30, 2017).
154

Exhibit No. Description
MIDAMERICAN FUNDING
31.7 Principal Executive Officer Certification Pursuant to Section 302 of the Sarbanes-Oxley Act of 2002.
31.8 Principal Financial Officer Certification Pursuant to Section 302 of the Sarbanes-Oxley Act of 2002.
32.7 Principal Executive Officer Certification Pursuant to Section 906 of the Sarbanes-Oxley Act of 2002.
32.8 Principal Financial Officer Certification Pursuant to Section 906 of the Sarbanes-Oxley Act of 2002.
NEVADA POWER
15.4 Awareness Letter of Independent Registered Public Accounting Firm.
31.9 Principal Executive Officer Certification Pursuant to Section 302 of the Sarbanes-Oxley Act of 2002.
31.10 Principal Financial Officer Certification Pursuant to Section 302 of the Sarbanes-Oxley Act of 2002.
32.9 Principal Executive Officer Certification Pursuant to Section 906 of the Sarbanes-Oxley Act of 2002.
32.10 Principal Financial Officer Certification Pursuant to Section 906 of the Sarbanes-Oxley Act of 2002.
BERKSHIRE HATHAWAY ENERGY AND NEVADA POWER
4.1 Financing Agreement dated May 1, 2017 between Clark County, Nevada and Nevada Power Company (relatingto Clark County, Nevada's $39,500,000 Pollution Control Refunding Revenue Bonds (Nevada Power CompanyProject) Series 2017) (incorporated by reference to Exhibit 4.1 to the Nevada Power Company Current Reporton Form 8-K dated May 25, 2017).
4.2 Financing Agreement dated May 1, 2017 between the Coconino County, Arizona Pollution Control Corporationand Nevada Power Company (relating to the Coconino County, Arizona Pollution Control Corporation's$53,000,000 Pollution Control Refunding Revenue Bonds (Nevada Power Company Projects) Series 2017A and2017B) (incorporated by reference to Exhibit 4.2 to the Nevada Power Company Current Report on Form 8-Kdated May 25, 2017).
4.3 Officer’s Certificate establishing the terms of Nevada Power Company’s General and Refunding Mortgage Notes,Series AA (Nos. AA-1 and AA-2) (incorporated by reference to Exhibit 4.3 to the Nevada Power Company CurrentReport on Form 8-K dated May 25, 2017).
10.4 $400,000,000 Second Amended and Restated Credit Agreement, dated as of June 30, 2017, among Nevada PowerCompany, as Borrower, the Banks, Financial Institutions and Other Institutional Lenders, as Initial Lenders, WellsFargo Bank, National Association, as Administrative Agent, and the LC Issuing Banks (incorporated by referenceto Exhibit 10.4 to the Berkshire Hathaway Energy Company Quarterly Report on Form 10-Q for the quarter endedJune 30, 2017).
SIERRA PACIFIC
31.11 Principal Executive Officer Certification Pursuant to Section 302 of the Sarbanes-Oxley Act of 2002.
31.12 Principal Financial Officer Certification Pursuant to Section 302 of the Sarbanes-Oxley Act of 2002.
32.11 Principal Executive Officer Certification Pursuant to Section 906 of the Sarbanes-Oxley Act of 2002.
32.12 Principal Financial Officer Certification Pursuant to Section 906 of the Sarbanes-Oxley Act of 2002.
BERKSHIRE HATHAWAY ENERGY AND SIERRA PACIFIC
10.5 $250,000,000 Second Amended and Restated Credit Agreement, dated as of June 30, 2017, among Sierra PacificPower Company, as Borrower, the Banks, Financial Institutions and Other Institutional Lenders, as Initial Lenders,Wells Fargo Bank, National Association, as Administrative Agent, and the LC Issuing Banks (incorporated byreference to Exhibit 10.5 to the Berkshire Hathaway Energy Company Quarterly Report on Form 10-Q for thequarter ended June 30, 2017).
155

Exhibit No. Description
ALL REGISTRANTS
101 The following financial information from each respective Registrant's Quarterly Report on Form 10-Q for thequarter ended September 30, 2017, is formatted in XBRL (eXtensible Business Reporting Language) and includedherein: (i) the Consolidated Balance Sheets, (ii) the Consolidated Statements of Operations, (iii) the ConsolidatedStatements of Comprehensive Income, (iv) the Consolidated Statements of Changes in Equity, (v) theConsolidated Statements of Cash Flows, and (vi) the Notes to Consolidated Financial Statements, tagged insummary and detail.
156

EXHIBIT 15.1
November 3, 2017
To the Board of Directors and Shareholders ofBerkshire Hathaway Energy CompanyDes Moines, Iowa
We have reviewed, in accordance with the standards of the Public Company Accounting Oversight Board (United States), theunaudited consolidated interim financial information of Berkshire Hathaway Energy Company and subsidiaries for the periodsended September 30, 2017 and 2016, as indicated in our report dated November 3, 2017; because we did not perform an audit,we expressed no opinion on that information.
We are aware that our report referred to above, which is included in your Quarterly Report on Form 10-Q for the quarter endedSeptember 30, 2017, is incorporated by reference in Registration Statement No. 333-214946 on Form S-8.
We also are aware that the aforementioned report, pursuant to Rule 436(c) under the Securities Act of 1933, is not considered apart of the Registration Statement prepared or certified by an accountant or a report prepared or certified by an accountant withinthe meaning of Sections 7 and 11 of that Act.
/s/ Deloitte & Touche LLP
Des Moines, Iowa

EXHIBIT 15.2
November 3, 2017
To the Board of Directors and Shareholders ofPacifiCorpPortland, Oregon
We have reviewed, in accordance with the standards of the Public Company Accounting Oversight Board (United States), theunaudited consolidated interim financial information of PacifiCorp and subsidiaries for the periods ended September 30, 2017and 2016, as indicated in our report dated November 3, 2017; because we did not perform an audit, we expressed no opinion onthat information.
We are aware that our report referred to above, which is included in your Quarterly Report on Form 10-Q for the quarter endedSeptember 30, 2017, is incorporated by reference in Registration Statement No. 333-207687 on Form S-3.
We also are aware that the aforementioned report, pursuant to Rule 436(c) under the Securities Act of 1933, is not considered apart of the Registration Statement prepared or certified by an accountant or a report prepared or certified by an accountant withinthe meaning of Sections 7 and 11 of that Act.
/s/ Deloitte & Touche LLP
Portland, Oregon

EXHIBIT 15.3
November 3, 2017
To the Board of Directors and Shareholder ofMidAmerican Energy CompanyDes Moines, Iowa
We have reviewed, in accordance with the standards of the Public Company Accounting Oversight Board (United States), theunaudited interim financial information of MidAmerican Energy Company for the periods ended September 30, 2017 and 2016,as indicated in our report dated November 3, 2017; because we did not perform an audit, we expressed no opinion on thatinformation.
We are aware that our report referred to above, which is included in your Quarterly Report on Form 10-Q for the quarter endedSeptember 30, 2017, is incorporated by reference in the Registration Statement No. 333-206980 on Form S-3.
We also are aware that the aforementioned report, pursuant to Rule 436(c) under the Securities Act of 1933, is not considered apart of the Registration Statement prepared or certified by an accountant or a report prepared or certified by an accountant withinthe meaning of Sections 7 and 11 of that Act.
/s/ Deloitte & Touche LLP
Des Moines, Iowa

EXHIBIT 15.4
November 3, 2017
To the Board of Directors and Shareholder of Nevada Power CompanyLas Vegas, Nevada
We have reviewed, in accordance with the standards of the Public Company Accounting Oversight Board (United States), theunaudited consolidated interim financial information of Nevada Power Company and subsidiaries for the periods endedSeptember 30, 2017 and 2016, as indicated in our report dated November 3, 2017; because we did not perform an audit, weexpressed no opinion on that information.
We are aware that our report referred to above, which is included in your Quarterly Report on Form 10-Q for the quarter endedSeptember 30, 2017, is incorporated by reference in Registration Statement No. 333-213897 on Form S-3.
We also are aware that the aforementioned report, pursuant to Rule 436(c) under the Securities Act of 1933, is not considered apart of the Registration Statement prepared or certified by an accountant or a report prepared or certified by an accountant withinthe meaning of Sections 7 and 11 of that Act.
/s/ Deloitte & Touche LLP
Las Vegas, Nevada

EXHIBIT 31.1
CERTIFICATION PURSUANT TO SECTION 302 OF THE
SARBANES-OXLEY ACT OF 2002
I, Gregory E. Abel, certify that:
1. I have reviewed this Quarterly Report on Form 10-Q of Berkshire Hathaway Energy Company;
2. Based on my knowledge, this report does not contain any untrue statement of a material fact or omit to state amaterial fact necessary to make the statements made, in light of the circumstances under which such statementswere made, not misleading with respect to the period covered by this report;
3. Based on my knowledge, the financial statements, and other financial information included in this report, fairlypresent in all material respects the financial condition, results of operations and cash flows of the registrant as of,and for, the periods presented in this report;
4. The registrant’s other certifying officer(s) and I are responsible for establishing and maintaining disclosure controlsand procedures (as defined in Exchange Act Rules 13a-15(e) and 15d-15(e)) and internal control over financialreporting (as defined in Exchange Act Rules 13a-15(f) and 15d-15(f)) for the registrant and have:
(a) Designed such disclosure controls and procedures, or caused such disclosure controls and procedures tobe designed under our supervision, to ensure that material information relating to the registrant, includingits consolidated subsidiaries, is made known to us by others within those entities, particularly during theperiod in which this report is being prepared;
(b) Designed such internal control over financial reporting, or caused such internal control over financialreporting to be designed under our supervision, to provide reasonable assurance regarding the reliabilityof financial reporting and the preparation of financial statements for external purposes in accordance withgenerally accepted accounting principles;
(c) Evaluated the effectiveness of the registrant’s disclosure controls and procedures and presented in thisreport our conclusions about the effectiveness of the disclosure controls and procedures, as of the end ofthe period covered by this report based on such evaluation; and
(d) Disclosed in this report any change in the registrant’s internal control over financial reporting that occurredduring the registrant’s most recent fiscal quarter (the registrant’s fourth fiscal quarter in the case of anannual report) that has materially affected, or is reasonably likely to materially affect, the registrant’sinternal control over financial reporting; and
5. The registrant’s other certifying officer(s) and I have disclosed, based on our most recent evaluation of internalcontrol over financial reporting, to the registrant’s auditors and the audit committee of the registrant’s board ofdirectors (or persons performing the equivalent functions):
(a) All significant deficiencies and material weaknesses in the design or operation of internal control overfinancial reporting which are reasonably likely to adversely affect the registrant’s ability to record, process,summarize and report financial information; and
(b) Any fraud, whether or not material, that involves management or other employees who have a significantrole in the registrant’s internal control over financial reporting.
Date: November 3, 2017 /s/ Gregory E. AbelGregory E. Abel
Chairman, President and Chief Executive Officer(principal executive officer)

EXHIBIT 31.2
CERTIFICATION PURSUANT TO SECTION 302 OF THE
SARBANES-OXLEY ACT OF 2002
I, Patrick J. Goodman, certify that:
1. I have reviewed this Quarterly Report on Form 10-Q of Berkshire Hathaway Energy Company;
2. Based on my knowledge, this report does not contain any untrue statement of a material fact or omit to state amaterial fact necessary to make the statements made, in light of the circumstances under which such statementswere made, not misleading with respect to the period covered by this report;
3. Based on my knowledge, the financial statements, and other financial information included in this report, fairlypresent in all material respects the financial condition, results of operations and cash flows of the registrant as of,and for, the periods presented in this report;
4. The registrant’s other certifying officer(s) and I are responsible for establishing and maintaining disclosure controlsand procedures (as defined in Exchange Act Rules 13a-15(e) and 15d-15(e)) and internal control over financialreporting (as defined in Exchange Act Rules 13a-15(f) and 15d-15(f)) for the registrant and have:
(a) Designed such disclosure controls and procedures, or caused such disclosure controls and procedures tobe designed under our supervision, to ensure that material information relating to the registrant, includingits consolidated subsidiaries, is made known to us by others within those entities, particularly during theperiod in which this report is being prepared;
(b) Designed such internal control over financial reporting, or caused such internal control over financialreporting to be designed under our supervision, to provide reasonable assurance regarding the reliabilityof financial reporting and the preparation of financial statements for external purposes in accordance withgenerally accepted accounting principles;
(c) Evaluated the effectiveness of the registrant’s disclosure controls and procedures and presented in thisreport our conclusions about the effectiveness of the disclosure controls and procedures, as of the end ofthe period covered by this report based on such evaluation; and
(d) Disclosed in this report any change in the registrant’s internal control over financial reporting that occurredduring the registrant’s most recent fiscal quarter (the registrant’s fourth fiscal quarter in the case of anannual report) that has materially affected, or is reasonably likely to materially affect, the registrant’sinternal control over financial reporting; and
5. The registrant’s other certifying officer(s) and I have disclosed, based on our most recent evaluation of internalcontrol over financial reporting, to the registrant’s auditors and the audit committee of the registrant’s board ofdirectors (or persons performing the equivalent functions):
(a) All significant deficiencies and material weaknesses in the design or operation of internal control overfinancial reporting which are reasonably likely to adversely affect the registrant’s ability to record, process,summarize and report financial information; and
(b) Any fraud, whether or not material, that involves management or other employees who have a significantrole in the registrant’s internal control over financial reporting.
Date: November 3, 2017 /s/ Patrick J. GoodmanPatrick J. Goodman
Executive Vice President and Chief Financial Officer(principal financial officer)

EXHIBIT 31.3
CERTIFICATION PURSUANT TO SECTION 302 OF THE
SARBANES-OXLEY ACT OF 2002
I, Gregory E. Abel, certify that:
1. I have reviewed this Quarterly Report on Form 10-Q of PacifiCorp;
2. Based on my knowledge, this report does not contain any untrue statement of a material fact or omit to state amaterial fact necessary to make the statements made, in light of the circumstances under which such statementswere made, not misleading with respect to the period covered by this report;
3. Based on my knowledge, the financial statements, and other financial information included in this report, fairlypresent in all material respects the financial condition, results of operations and cash flows of the registrant as of,and for, the periods presented in this report;
4. The registrant’s other certifying officer(s) and I are responsible for establishing and maintaining disclosure controlsand procedures (as defined in Exchange Act Rules 13a-15(e) and 15d-15(e)) and internal control over financialreporting (as defined in Exchange Act Rules 13a-15(f) and 15d-15(f)) for the registrant and have:
(a) Designed such disclosure controls and procedures, or caused such disclosure controls and procedures tobe designed under our supervision, to ensure that material information relating to the registrant, includingits consolidated subsidiaries, is made known to us by others within those entities, particularly during theperiod in which this report is being prepared;
(b) Designed such internal control over financial reporting, or caused such internal control over financialreporting to be designed under our supervision, to provide reasonable assurance regarding the reliabilityof financial reporting and the preparation of financial statements for external purposes in accordance withgenerally accepted accounting principles;
(c) Evaluated the effectiveness of the registrant’s disclosure controls and procedures and presented in thisreport our conclusions about the effectiveness of the disclosure controls and procedures, as of the end ofthe period covered by this report based on such evaluation; and
(d) Disclosed in this report any change in the registrant’s internal control over financial reporting that occurredduring the registrant’s most recent fiscal quarter (the registrant’s fourth fiscal quarter in the case of anannual report) that has materially affected, or is reasonably likely to materially affect, the registrant’sinternal control over financial reporting; and
5. The registrant’s other certifying officer(s) and I have disclosed, based on our most recent evaluation of internalcontrol over financial reporting, to the registrant’s auditors and the audit committee of the registrant’s board ofdirectors (or persons performing the equivalent functions):
(a) All significant deficiencies and material weaknesses in the design or operation of internal control overfinancial reporting which are reasonably likely to adversely affect the registrant’s ability to record, process,summarize and report financial information; and
(b) Any fraud, whether or not material, that involves management or other employees who have a significantrole in the registrant’s internal control over financial reporting.
Date: November 3, 2017 /s/ Gregory E. AbelGregory E. Abel
Chairman of the Board of Directors and Chief Executive Officer(principal executive officer)

EXHIBIT 31.4
CERTIFICATION PURSUANT TO SECTION 302 OF THE
SARBANES-OXLEY ACT OF 2002
I, Nikki L. Kobliha, certify that:
1. I have reviewed this Quarterly Report on Form 10-Q of PacifiCorp;
2. Based on my knowledge, this report does not contain any untrue statement of a material fact or omit to state amaterial fact necessary to make the statements made, in light of the circumstances under which such statementswere made, not misleading with respect to the period covered by this report;
3. Based on my knowledge, the financial statements, and other financial information included in this report, fairlypresent in all material respects the financial condition, results of operations and cash flows of the registrant as of,and for, the periods presented in this report;
4. The registrant’s other certifying officer(s) and I are responsible for establishing and maintaining disclosure controlsand procedures (as defined in Exchange Act Rules 13a-15(e) and 15d-15(e)) and internal control over financialreporting (as defined in Exchange Act Rules 13a-15(f) and 15d-15(f)) for the registrant and have:
(a) Designed such disclosure controls and procedures, or caused such disclosure controls and procedures tobe designed under our supervision, to ensure that material information relating to the registrant, includingits consolidated subsidiaries, is made known to us by others within those entities, particularly during theperiod in which this report is being prepared;
(b) Designed such internal control over financial reporting, or caused such internal control over financialreporting to be designed under our supervision, to provide reasonable assurance regarding the reliabilityof financial reporting and the preparation of financial statements for external purposes in accordance withgenerally accepted accounting principles;
(c) Evaluated the effectiveness of the registrant’s disclosure controls and procedures and presented in thisreport our conclusions about the effectiveness of the disclosure controls and procedures, as of the end ofthe period covered by this report based on such evaluation; and
(d) Disclosed in this report any change in the registrant’s internal control over financial reporting that occurredduring the registrant’s most recent fiscal quarter (the registrant’s fourth fiscal quarter in the case of anannual report) that has materially affected, or is reasonably likely to materially affect, the registrant’sinternal control over financial reporting; and
5. The registrant’s other certifying officer(s) and I have disclosed, based on our most recent evaluation of internalcontrol over financial reporting, to the registrant’s auditors and the audit committee of the registrant’s board ofdirectors (or persons performing the equivalent functions):
(a) All significant deficiencies and material weaknesses in the design or operation of internal control overfinancial reporting which are reasonably likely to adversely affect the registrant’s ability to record, process,summarize and report financial information; and
(b) Any fraud, whether or not material, that involves management or other employees who have a significantrole in the registrant’s internal control over financial reporting.
Date: November 3, 2017 /s/ Nikki L. KoblihaNikki L. Kobliha
Vice President, Chief Financial Officer and Treasurer(principal financial officer)

EXHIBIT 31.5
CERTIFICATION PURSUANT TOSECTION 302 OF THE
SARBANES-OXLEY ACT OF 2002
I, William J. Fehrman, certify that:
1. I have reviewed this Quarterly Report on Form 10-Q of MidAmerican Energy Company;
2. Based on my knowledge, this report does not contain any untrue statement of a material fact or omit to state amaterial fact necessary to make the statements made, in light of the circumstances under which such statementswere made, not misleading with respect to the period covered by this report;
3. Based on my knowledge, the financial statements, and other financial information included in this report, fairlypresent in all material respects the financial condition, results of operations and cash flows of the registrant as of,and for, the periods presented in this report;
4. The registrant’s other certifying officer(s) and I are responsible for establishing and maintaining disclosure controlsand procedures (as defined in Exchange Act Rules 13a-15(e) and 15d-15(e)) and internal control over financialreporting (as defined in Exchange Act Rules 13a-15(f) and 15d-15(f)) for the registrant and have:
(a) Designed such disclosure controls and procedures, or caused such disclosure controls and procedures tobe designed under our supervision, to ensure that material information relating to the registrant, includingits consolidated subsidiaries, is made known to us by others within those entities, particularly during theperiod in which this report is being prepared;
(b) Designed such internal control over financial reporting, or caused such internal control over financialreporting to be designed under our supervision, to provide reasonable assurance regarding the reliabilityof financial reporting and the preparation of financial statements for external purposes in accordance withgenerally accepted accounting principles;
(c) Evaluated the effectiveness of the registrant’s disclosure controls and procedures and presented in thisreport our conclusions about the effectiveness of the disclosure controls and procedures, as of the end ofthe period covered by this report based on such evaluation; and
(d) Disclosed in this report any change in the registrant’s internal control over financial reporting that occurredduring the registrant’s most recent fiscal quarter (the registrant’s fourth fiscal quarter in the case of anannual report) that has materially affected, or is reasonably likely to materially affect, the registrant’sinternal control over financial reporting; and
5. The registrant’s other certifying officer(s) and I have disclosed, based on our most recent evaluation of internalcontrol over financial reporting, to the registrant’s auditors and the audit committee of the registrant’s board ofdirectors (or persons performing the equivalent functions):
(a) All significant deficiencies and material weaknesses in the design or operation of internal control overfinancial reporting which are reasonably likely to adversely affect the registrant’s ability to record, process,summarize and report financial information; and
(b) Any fraud, whether or not material, that involves management or other employees who have a significantrole in the registrant’s internal control over financial reporting.
Date: November 3, 2017 /s/ William J. FehrmanWilliam J. Fehrman
President and Chief Executive Officer(principal executive officer)

EXHIBIT 31.6
CERTIFICATION PURSUANT TOSECTION 302 OF THE
SARBANES-OXLEY ACT OF 2002
I, Thomas B. Specketer, certify that:
1. I have reviewed this Quarterly Report on Form 10-Q of MidAmerican Energy Company;
2. Based on my knowledge, this report does not contain any untrue statement of a material fact or omit to state amaterial fact necessary to make the statements made, in light of the circumstances under which such statementswere made, not misleading with respect to the period covered by this report;
3. Based on my knowledge, the financial statements, and other financial information included in this report, fairlypresent in all material respects the financial condition, results of operations and cash flows of the registrant as of,and for, the periods presented in this report;
4. The registrant’s other certifying officer(s) and I are responsible for establishing and maintaining disclosure controlsand procedures (as defined in Exchange Act Rules 13a-15(e) and 15d-15(e)) and internal control over financialreporting (as defined in Exchange Act Rules 13a-15(f) and 15d-15(f)) for the registrant and have:
(a) Designed such disclosure controls and procedures, or caused such disclosure controls and procedures tobe designed under our supervision, to ensure that material information relating to the registrant, includingits consolidated subsidiaries, is made known to us by others within those entities, particularly during theperiod in which this report is being prepared;
(b) Designed such internal control over financial reporting, or caused such internal control over financialreporting to be designed under our supervision, to provide reasonable assurance regarding the reliabilityof financial reporting and the preparation of financial statements for external purposes in accordance withgenerally accepted accounting principles;
(c) Evaluated the effectiveness of the registrant’s disclosure controls and procedures and presented in thisreport our conclusions about the effectiveness of the disclosure controls and procedures, as of the end ofthe period covered by this report based on such evaluation; and
(d) Disclosed in this report any change in the registrant’s internal control over financial reporting that occurredduring the registrant’s most recent fiscal quarter (the registrant’s fourth fiscal quarter in the case of anannual report) that has materially affected, or is reasonably likely to materially affect, the registrant’sinternal control over financial reporting; and
5. The registrant’s other certifying officer(s) and I have disclosed, based on our most recent evaluation of internalcontrol over financial reporting, to the registrant’s auditors and the audit committee of the registrant’s board ofdirectors (or persons performing the equivalent functions):
(a) All significant deficiencies and material weaknesses in the design or operation of internal control overfinancial reporting which are reasonably likely to adversely affect the registrant’s ability to record, process,summarize and report financial information; and
(b) Any fraud, whether or not material, that involves management or other employees who have a significantrole in the registrant’s internal control over financial reporting.
Date: November 3, 2017 /s/ Thomas B. SpecketerThomas B. Specketer
Vice President and Chief Financial Officer(principal financial officer)

EXHIBIT 31.7
CERTIFICATION PURSUANT TOSECTION 302 OF THE
SARBANES-OXLEY ACT OF 2002
I, William J. Fehrman, certify that:
1. I have reviewed this Quarterly Report on Form 10-Q of MidAmerican Funding, LLC;
2. Based on my knowledge, this report does not contain any untrue statement of a material fact or omit to state amaterial fact necessary to make the statements made, in light of the circumstances under which such statementswere made, not misleading with respect to the period covered by this report;
3. Based on my knowledge, the financial statements, and other financial information included in this report, fairlypresent in all material respects the financial condition, results of operations and cash flows of the registrant as of,and for, the periods presented in this report;
4. The registrant’s other certifying officer(s) and I are responsible for establishing and maintaining disclosure controlsand procedures (as defined in Exchange Act Rules 13a-15(e) and 15d-15(e)) and internal control over financialreporting (as defined in Exchange Act Rules 13a-15(f) and 15d-15(f)) for the registrant and have:
(a) Designed such disclosure controls and procedures, or caused such disclosure controls and procedures tobe designed under our supervision, to ensure that material information relating to the registrant, includingits consolidated subsidiaries, is made known to us by others within those entities, particularly during theperiod in which this report is being prepared;
(b) Designed such internal control over financial reporting, or caused such internal control over financialreporting to be designed under our supervision, to provide reasonable assurance regarding the reliabilityof financial reporting and the preparation of financial statements for external purposes in accordance withgenerally accepted accounting principles;
(c) Evaluated the effectiveness of the registrant’s disclosure controls and procedures and presented in thisreport our conclusions about the effectiveness of the disclosure controls and procedures, as of the end ofthe period covered by this report based on such evaluation; and
(d) Disclosed in this report any change in the registrant’s internal control over financial reporting that occurredduring the registrant’s most recent fiscal quarter (the registrant’s fourth fiscal quarter in the case of anannual report) that has materially affected, or is reasonably likely to materially affect, the registrant’sinternal control over financial reporting; and
5. The registrant’s other certifying officer(s) and I have disclosed, based on our most recent evaluation of internalcontrol over financial reporting, to the registrant’s auditors and the audit committee of the registrant’s board ofdirectors (or persons performing the equivalent functions):
(a) All significant deficiencies and material weaknesses in the design or operation of internal control overfinancial reporting which are reasonably likely to adversely affect the registrant’s ability to record, process,summarize and report financial information; and
(b) Any fraud, whether or not material, that involves management or other employees who have a significantrole in the registrant’s internal control over financial reporting.
Date: November 3, 2017 /s/ William J. FehrmanWilliam J. Fehrman
President(principal executive officer)

EXHIBIT 31.8
CERTIFICATION PURSUANT TOSECTION 302 OF THE
SARBANES-OXLEY ACT OF 2002
I, Thomas B. Specketer, certify that:
1. I have reviewed this Quarterly Report on Form 10-Q of MidAmerican Funding, LLC;
2. Based on my knowledge, this report does not contain any untrue statement of a material fact or omit to state amaterial fact necessary to make the statements made, in light of the circumstances under which such statementswere made, not misleading with respect to the period covered by this report;
3. Based on my knowledge, the financial statements, and other financial information included in this report, fairlypresent in all material respects the financial condition, results of operations and cash flows of the registrant as of,and for, the periods presented in this report;
4. The registrant’s other certifying officer(s) and I are responsible for establishing and maintaining disclosure controlsand procedures (as defined in Exchange Act Rules 13a-15(e) and 15d-15(e)) and internal control over financialreporting (as defined in Exchange Act Rules 13a-15(f) and 15d-15(f)) for the registrant and have:
(a) Designed such disclosure controls and procedures, or caused such disclosure controls and procedures tobe designed under our supervision, to ensure that material information relating to the registrant, includingits consolidated subsidiaries, is made known to us by others within those entities, particularly during theperiod in which this report is being prepared;
(b) Designed such internal control over financial reporting, or caused such internal control over financialreporting to be designed under our supervision, to provide reasonable assurance regarding the reliabilityof financial reporting and the preparation of financial statements for external purposes in accordance withgenerally accepted accounting principles;
(c) Evaluated the effectiveness of the registrant’s disclosure controls and procedures and presented in thisreport our conclusions about the effectiveness of the disclosure controls and procedures, as of the end ofthe period covered by this report based on such evaluation; and
(d) Disclosed in this report any change in the registrant’s internal control over financial reporting that occurredduring the registrant’s most recent fiscal quarter (the registrant’s fourth fiscal quarter in the case of anannual report) that has materially affected, or is reasonably likely to materially affect, the registrant’sinternal control over financial reporting; and
5. The registrant’s other certifying officer(s) and I have disclosed, based on our most recent evaluation of internalcontrol over financial reporting, to the registrant’s auditors and the audit committee of the registrant’s board ofdirectors (or persons performing the equivalent functions):
(a) All significant deficiencies and material weaknesses in the design or operation of internal control overfinancial reporting which are reasonably likely to adversely affect the registrant’s ability to record, process,summarize and report financial information; and
(b) Any fraud, whether or not material, that involves management or other employees who have a significantrole in the registrant’s internal control over financial reporting.
Date: November 3, 2017 /s/ Thomas B. SpecketerThomas B. Specketer
Vice President and Controller(principal financial officer)

EXHIBIT 31.9
CERTIFICATION PURSUANT TO SECTION 302 OF THE
SARBANES-OXLEY ACT OF 2002
I, Paul J. Caudill, certify that:
1. I have reviewed this Quarterly Report on Form 10-Q of Nevada Power Company;
2. Based on my knowledge, this report does not contain any untrue statement of a material fact or omit to state amaterial fact necessary to make the statements made, in light of the circumstances under which such statementswere made, not misleading with respect to the period covered by this report;
3. Based on my knowledge, the financial statements, and other financial information included in this report, fairlypresent in all material respects the financial condition, results of operations and cash flows of the registrant as of,and for, the periods presented in this report;
4. The registrant’s other certifying officer(s) and I are responsible for establishing and maintaining disclosure controlsand procedures (as defined in Exchange Act Rules 13a-15(e) and 15d-15(e)) and internal control over financialreporting (as defined in Exchange Act Rules 13a-15(f) and 15d-15(f)) for the registrant and have:
(a) Designed such disclosure controls and procedures, or caused such disclosure controls and procedures tobe designed under our supervision, to ensure that material information relating to the registrant, includingits consolidated subsidiaries, is made known to us by others within those entities, particularly during theperiod in which this report is being prepared;
(b) Designed such internal control over financial reporting, or caused such internal control over financialreporting to be designed under our supervision, to provide reasonable assurance regarding the reliabilityof financial reporting and the preparation of financial statements for external purposes in accordance withgenerally accepted accounting principles;
(c) Evaluated the effectiveness of the registrant’s disclosure controls and procedures and presented in thisreport our conclusions about the effectiveness of the disclosure controls and procedures, as of the end ofthe period covered by this report based on such evaluation; and
(d) Disclosed in this report any change in the registrant’s internal control over financial reporting that occurredduring the registrant’s most recent fiscal quarter (the registrant’s fourth fiscal quarter in the case of anannual report) that has materially affected, or is reasonably likely to materially affect, the registrant’sinternal control over financial reporting; and
5. The registrant’s other certifying officer(s) and I have disclosed, based on our most recent evaluation of internalcontrol over financial reporting, to the registrant’s auditors and the audit committee of the registrant’s board ofdirectors (or persons performing the equivalent functions):
(a) All significant deficiencies and material weaknesses in the design or operation of internal control overfinancial reporting which are reasonably likely to adversely affect the registrant’s ability to record, process,summarize and report financial information; and
(b) Any fraud, whether or not material, that involves management or other employees who have a significantrole in the registrant’s internal control over financial reporting.
Date: November 3, 2017 /s/ Paul J. CaudillPaul J. Caudill
President and Chief Executive Officer(principal executive officer)

EXHIBIT 31.10
CERTIFICATION PURSUANT TO SECTION 302 OF THE
SARBANES-OXLEY ACT OF 2002
I, E. Kevin Bethel, certify that:
1. I have reviewed this Quarterly Report on Form 10-Q of Nevada Power Company;
2. Based on my knowledge, this report does not contain any untrue statement of a material fact or omit to state amaterial fact necessary to make the statements made, in light of the circumstances under which such statementswere made, not misleading with respect to the period covered by this report;
3. Based on my knowledge, the financial statements, and other financial information included in this report, fairlypresent in all material respects the financial condition, results of operations and cash flows of the registrant as of,and for, the periods presented in this report;
4. The registrant’s other certifying officer(s) and I are responsible for establishing and maintaining disclosure controlsand procedures (as defined in Exchange Act Rules 13a-15(e) and 15d-15(e)) and internal control over financialreporting (as defined in Exchange Act Rules 13a-15(f) and 15d-15(f)) for the registrant and have:
(a) Designed such disclosure controls and procedures, or caused such disclosure controls and procedures tobe designed under our supervision, to ensure that material information relating to the registrant, includingits consolidated subsidiaries, is made known to us by others within those entities, particularly during theperiod in which this report is being prepared;
(b) Designed such internal control over financial reporting, or caused such internal control over financialreporting to be designed under our supervision, to provide reasonable assurance regarding the reliabilityof financial reporting and the preparation of financial statements for external purposes in accordance withgenerally accepted accounting principles;
(c) Evaluated the effectiveness of the registrant’s disclosure controls and procedures and presented in thisreport our conclusions about the effectiveness of the disclosure controls and procedures, as of the end ofthe period covered by this report based on such evaluation; and
(d) Disclosed in this report any change in the registrant’s internal control over financial reporting that occurredduring the registrant’s most recent fiscal quarter (the registrant’s fourth fiscal quarter in the case of anannual report) that has materially affected, or is reasonably likely to materially affect, the registrant’sinternal control over financial reporting; and
5. The registrant’s other certifying officer(s) and I have disclosed, based on our most recent evaluation of internalcontrol over financial reporting, to the registrant’s auditors and the audit committee of the registrant’s board ofdirectors (or persons performing the equivalent functions):
(a) All significant deficiencies and material weaknesses in the design or operation of internal control overfinancial reporting which are reasonably likely to adversely affect the registrant’s ability to record, process,summarize and report financial information; and
(b) Any fraud, whether or not material, that involves management or other employees who have a significantrole in the registrant’s internal control over financial reporting.
Date: November 3, 2017 /s/ E. Kevin BethelE. Kevin Bethel
Senior Vice President and Chief Financial Officer(principal financial officer)

EXHIBIT 31.11
CERTIFICATION PURSUANT TO SECTION 302 OF THE
SARBANES-OXLEY ACT OF 2002
I, Paul J. Caudill, certify that:
1. I have reviewed this Quarterly Report on Form 10-Q of Sierra Pacific Power Company;
2. Based on my knowledge, this report does not contain any untrue statement of a material fact or omit to state amaterial fact necessary to make the statements made, in light of the circumstances under which such statementswere made, not misleading with respect to the period covered by this report;
3. Based on my knowledge, the financial statements, and other financial information included in this report, fairlypresent in all material respects the financial condition, results of operations and cash flows of the registrant as of,and for, the periods presented in this report;
4. The registrant’s other certifying officer(s) and I are responsible for establishing and maintaining disclosure controlsand procedures (as defined in Exchange Act Rules 13a-15(e) and 15d-15(e)) and internal control over financialreporting (as defined in Exchange Act Rules 13a-15(f) and 15d-15(f)) for the registrant and have:
(a) Designed such disclosure controls and procedures, or caused such disclosure controls and procedures tobe designed under our supervision, to ensure that material information relating to the registrant, includingits consolidated subsidiaries, is made known to us by others within those entities, particularly during theperiod in which this report is being prepared;
(b) Designed such internal control over financial reporting, or caused such internal control over financialreporting to be designed under our supervision, to provide reasonable assurance regarding the reliabilityof financial reporting and the preparation of financial statements for external purposes in accordance withgenerally accepted accounting principles;
(c) Evaluated the effectiveness of the registrant’s disclosure controls and procedures and presented in thisreport our conclusions about the effectiveness of the disclosure controls and procedures, as of the end ofthe period covered by this report based on such evaluation; and
(d) Disclosed in this report any change in the registrant’s internal control over financial reporting that occurredduring the registrant’s most recent fiscal quarter (the registrant’s fourth fiscal quarter in the case of anannual report) that has materially affected, or is reasonably likely to materially affect, the registrant’sinternal control over financial reporting; and
5. The registrant’s other certifying officer(s) and I have disclosed, based on our most recent evaluation of internalcontrol over financial reporting, to the registrant’s auditors and the audit committee of the registrant’s board ofdirectors (or persons performing the equivalent functions):
(a) All significant deficiencies and material weaknesses in the design or operation of internal control overfinancial reporting which are reasonably likely to adversely affect the registrant’s ability to record, process,summarize and report financial information; and
(b) Any fraud, whether or not material, that involves management or other employees who have a significantrole in the registrant’s internal control over financial reporting.
Date: November 3, 2017 /s/ Paul J. CaudillPaul J. Caudill
President and Chief Executive Officer(principal executive officer)

EXHIBIT 31.12
CERTIFICATION PURSUANT TO SECTION 302 OF THE
SARBANES-OXLEY ACT OF 2002
I, E. Kevin Bethel, certify that:
1. I have reviewed this Quarterly Report on Form 10-Q of Sierra Pacific Power Company;
2. Based on my knowledge, this report does not contain any untrue statement of a material fact or omit to state amaterial fact necessary to make the statements made, in light of the circumstances under which such statementswere made, not misleading with respect to the period covered by this report;
3. Based on my knowledge, the financial statements, and other financial information included in this report, fairlypresent in all material respects the financial condition, results of operations and cash flows of the registrant as of,and for, the periods presented in this report;
4. The registrant’s other certifying officer(s) and I are responsible for establishing and maintaining disclosure controlsand procedures (as defined in Exchange Act Rules 13a-15(e) and 15d-15(e)) and internal control over financialreporting (as defined in Exchange Act Rules 13a-15(f) and 15d-15(f)) for the registrant and have:
(a) Designed such disclosure controls and procedures, or caused such disclosure controls and procedures tobe designed under our supervision, to ensure that material information relating to the registrant, includingits consolidated subsidiaries, is made known to us by others within those entities, particularly during theperiod in which this report is being prepared;
(b) Designed such internal control over financial reporting, or caused such internal control over financialreporting to be designed under our supervision, to provide reasonable assurance regarding the reliabilityof financial reporting and the preparation of financial statements for external purposes in accordance withgenerally accepted accounting principles;
(c) Evaluated the effectiveness of the registrant’s disclosure controls and procedures and presented in thisreport our conclusions about the effectiveness of the disclosure controls and procedures, as of the end ofthe period covered by this report based on such evaluation; and
(d) Disclosed in this report any change in the registrant’s internal control over financial reporting that occurredduring the registrant’s most recent fiscal quarter (the registrant’s fourth fiscal quarter in the case of anannual report) that has materially affected, or is reasonably likely to materially affect, the registrant’sinternal control over financial reporting; and
5. The registrant’s other certifying officer(s) and I have disclosed, based on our most recent evaluation of internalcontrol over financial reporting, to the registrant’s auditors and the audit committee of the registrant’s board ofdirectors (or persons performing the equivalent functions):
(a) All significant deficiencies and material weaknesses in the design or operation of internal control overfinancial reporting which are reasonably likely to adversely affect the registrant’s ability to record, process,summarize and report financial information; and
(b) Any fraud, whether or not material, that involves management or other employees who have a significantrole in the registrant’s internal control over financial reporting.
Date: November 3, 2017 /s/ E. Kevin BethelE. Kevin Bethel
Senior Vice President and Chief Financial Officer(principal financial officer)

EXHIBIT 32.1
CERTIFICATION PURSUANT TO SECTION 906 OF THE
SARBANES-OXLEY ACT OF 2002
I, Gregory E. Abel, Chairman, President and Chief Executive Officer of Berkshire Hathaway Energy Company (the "Company"),certify, pursuant to Section 906 of the Sarbanes-Oxley Act of 2002, 18 U.S.C. Section 1350, that to the best of my knowledge:
(1) the Quarterly Report on Form 10-Q of the Company for the quarterly period ended September 30, 2017 (the "Report")fully complies with the requirements of Section 13(a) or 15(d) of the Securities Exchange Act of 1934 (15 U.S.C. 78mor 78o(d)); and
(2) the information contained in the Report fairly presents, in all material respects, the financial condition and result ofoperations of the Company.
Date: November 3, 2017 /s/ Gregory E. AbelGregory E. Abel
Chairman, President and Chief Executive Officer(principal executive officer)

EXHIBIT 32.2
CERTIFICATION PURSUANT TO SECTION 906 OF THE
SARBANES-OXLEY ACT OF 2002
I, Patrick J. Goodman, Executive Vice President and Chief Financial Officer of Berkshire Hathaway Energy Company (the"Company"), certify, pursuant to Section 906 of the Sarbanes-Oxley Act of 2002, 18 U.S.C. Section 1350, that to the best of myknowledge:
(1) the Quarterly Report on Form 10-Q of the Company for the quarterly period ended September 30, 2017 (the "Report")fully complies with the requirements of Section 13(a) or 15(d) of the Securities Exchange Act of 1934 (15 U.S.C. 78mor 78o(d)); and
(2) the information contained in the Report fairly presents, in all material respects, the financial condition and result ofoperations of the Company.
Date: November 3, 2017 /s/ Patrick J. GoodmanPatrick J. Goodman
Executive Vice President and Chief Financial Officer(principal financial officer)

EXHIBIT 32.3
CERTIFICATION PURSUANT TO SECTION 906 OF THE
SARBANES-OXLEY ACT OF 2002
I, Gregory E. Abel, Chairman of the Board of Directors and Chief Executive Officer of PacifiCorp, certify, pursuant to Section 906of the Sarbanes-Oxley Act of 2002, 18 U.S.C. Section 1350, that to the best of my knowledge:
(1) the Quarterly Report on Form 10-Q of PacifiCorp for the quarterly period ended September 30, 2017 (the "Report") fullycomplies with the requirements of Section 13(a) or 15(d) of the Securities Exchange Act of 1934 (15 U.S.C. 78m or 78o(d)); and
(2) the information contained in the Report fairly presents, in all material respects, the financial condition and results ofoperations of PacifiCorp.
Date: November 3, 2017 /s/ Gregory E. AbelGregory E. Abel
Chairman of the Board of Directors and Chief Executive Officer(principal executive officer)

EXHIBIT 32.4
CERTIFICATION PURSUANT TO SECTION 906 OF THE
SARBANES-OXLEY ACT OF 2002
I, Nikki L. Kobliha, Vice President, Chief Financial Officer and Treasurer of PacifiCorp, certify, pursuant to Section 906 of theSarbanes-Oxley Act of 2002, 18 U.S.C. Section 1350, that to the best of my knowledge:
(1) the Quarterly Report on Form 10-Q of PacifiCorp for the quarterly period ended September 30, 2017 (the "Report") fullycomplies with the requirements of Section 13(a) or 15(d) of the Securities Exchange Act of 1934 (15 U.S.C. 78m or 78o(d)); and
(2) the information contained in the Report fairly presents, in all material respects, the financial condition and results ofoperations of PacifiCorp.
Date: November 3, 2017 /s/ Nikki L. KoblihaNikki L. Kobliha
Vice President, Chief Financial Officer and Treasurer(principal financial officer)

EXHIBIT 32.5
CERTIFICATION PURSUANT TOSECTION 906 OF THE
SARBANES-OXLEY ACT OF 2002
I, William J. Fehrman, President and Chief Executive Officer of MidAmerican Energy Company, certify, pursuant to Section 906of the Sarbanes-Oxley Act of 2002, 18 U.S.C. Section 1350, that to the best of my knowledge:
(1) the Quarterly Report on Form 10-Q of MidAmerican Energy Company for the quarterly period ended September 30,2017 (the “Report”) fully complies with the requirements of Section 13(a) or 15(d) of the Securities Exchange Act of1934 (15 U.S.C. 78m or 78o(d)); and
(2) the information contained in the Report fairly presents, in all material respects, the financial condition and result ofoperations of MidAmerican Energy Company.
Date: November 3, 2017 /s/ William J. FehrmanWilliam J. Fehrman
President and Chief Executive Officer(principal executive officer)

EXHIBIT 32.6
CERTIFICATION PURSUANT TOSECTION 906 OF THE
SARBANES-OXLEY ACT OF 2002
I, Thomas B. Specketer, Vice President and Chief Financial Officer of MidAmerican Energy Company, certify, pursuant to Section906 of the Sarbanes-Oxley Act of 2002, 18 U.S.C. Section 1350, that to the best of my knowledge:
(1) the Quarterly Report on Form 10-Q of MidAmerican Energy Company for the quarterly period ended September 30,2017 (the “Report”) fully complies with the requirements of Section 13(a) or 15(d) of the Securities Exchange Act of1934 (15 U.S.C. 78m or 78o(d)); and
(2) the information contained in the Report fairly presents, in all material respects, the financial condition and result ofoperations of MidAmerican Energy Company.
Date: November 3, 2017 /s/ Thomas B. SpecketerThomas B. Specketer
Vice President and Chief Financial Officer(principal financial officer)

EXHIBIT 32.7
CERTIFICATION PURSUANT TOSECTION 906 OF THE
SARBANES-OXLEY ACT OF 2002
I, William J. Fehrman, President of MidAmerican Funding, LLC, certify, pursuant to Section 906 of the Sarbanes-Oxley Act of2002, 18 U.S.C. Section 1350, that to the best of my knowledge:
(1) the Quarterly Report on Form 10-Q of MidAmerican Funding, LLC for the quarterly period ended September 30, 2017(the “Report”) fully complies with the requirements of Section 13(a) or 15(d) of the Securities Exchange Act of 1934 (15U.S.C. 78m or 78o(d)); and
(2) the information contained in the Report fairly presents, in all material respects, the financial condition and result ofoperations of MidAmerican Funding, LLC.
Date: November 3, 2017 /s/ William J. FehrmanWilliam J. Fehrman
President(principal executive officer)

EXHIBIT 32.8
CERTIFICATION PURSUANT TOSECTION 906 OF THE
SARBANES-OXLEY ACT OF 2002
I, Thomas B. Specketer, Vice President and Controller of MidAmerican Funding, LLC, certify, pursuant to Section 906 of theSarbanes-Oxley Act of 2002, 18 U.S.C. Section 1350, that to the best of my knowledge:
(1) the Quarterly Report on Form 10-Q of MidAmerican Funding, LLC for the quarterly period ended September 30, 2017(the “Report”) fully complies with the requirements of Section 13(a) or 15(d) of the Securities Exchange Act of 1934 (15U.S.C. 78m or 78o(d)); and
(2) the information contained in the Report fairly presents, in all material respects, the financial condition and result ofoperations of MidAmerican Funding, LLC.
Date: November 3, 2017 /s/ Thomas B. SpecketerThomas B. Specketer
Vice President and Controller(principal financial officer)

EXHIBIT 32.9
CERTIFICATION PURSUANT TO SECTION 906 OF THE
SARBANES-OXLEY ACT OF 2002
I, Paul J. Caudill, President and Chief Executive Officer of Nevada Power Company ("Nevada Power"), certify, pursuant to Section906 of the Sarbanes-Oxley Act of 2002, 18 U.S.C. Section 1350, that to the best of my knowledge:
(1) the Quarterly Report on Form 10-Q of Nevada Power for the quarterly period ended September 30, 2017 (the "Report")fully complies with the requirements of Section 13(a) or 15(d) of the Securities Exchange Act of 1934 (15 U.S.C. 78mor 78o(d)); and
(2) the information contained in the Report fairly presents, in all material respects, the financial condition and result ofoperations of Nevada Power.
Date: November 3, 2017 /s/ Paul J. CaudillPaul J. Caudill
President and Chief Executive Officer(principal executive officer)

EXHIBIT 32.10
CERTIFICATION PURSUANT TO SECTION 906 OF THE
SARBANES-OXLEY ACT OF 2002
I, E. Kevin Bethel, Senior Vice President and Chief Financial Officer of Nevada Power Company ("Nevada Power"), certify,pursuant to Section 906 of the Sarbanes-Oxley Act of 2002, 18 U.S.C. Section 1350, that to the best of my knowledge:
(1) the Quarterly Report on Form 10-Q of Nevada Power for the quarterly period ended September 30, 2017 (the "Report")fully complies with the requirements of Section 13(a) or 15(d) of the Securities Exchange Act of 1934 (15 U.S.C. 78mor 78o(d)); and
(2) the information contained in the Report fairly presents, in all material respects, the financial condition and result ofoperations of Nevada Power.
Date: November 3, 2017 /s/ E. Kevin BethelE. Kevin Bethel
Senior Vice President and Chief Financial Officer(principal financial officer)

EXHIBIT 32.11
CERTIFICATION PURSUANT TO SECTION 906 OF THE
SARBANES-OXLEY ACT OF 2002
I, Paul J. Caudill, President and Chief Executive Officer of Sierra Pacific Power Company ("Sierra Pacific"), certify, pursuant toSection 906 of the Sarbanes-Oxley Act of 2002, 18 U.S.C. Section 1350, that to the best of my knowledge:
(1) the Quarterly Report on Form 10-Q of Sierra Pacific for the quarterly period ended September 30, 2017 (the "Report")fully complies with the requirements of Section 13(a) or 15(d) of the Securities Exchange Act of 1934 (15 U.S.C. 78mor 78o(d)); and
(2) the information contained in the Report fairly presents, in all material respects, the financial condition and result ofoperations of Sierra Pacific.
Date: November 3, 2017 /s/ Paul J. CaudillPaul J. Caudill
President and Chief Executive Officer(principal executive officer)

EXHIBIT 32.12
CERTIFICATION PURSUANT TO SECTION 906 OF THE
SARBANES-OXLEY ACT OF 2002
I, E. Kevin Bethel, Senior Vice President and Chief Financial Officer of Sierra Pacific Power Company ("Sierra Pacific"), certify,pursuant to Section 906 of the Sarbanes-Oxley Act of 2002, 18 U.S.C. Section 1350, that to the best of my knowledge:
(1) the Quarterly Report on Form 10-Q of Sierra Pacific for the quarterly period ended September 30, 2017 (the "Report")fully complies with the requirements of Section 13(a) or 15(d) of the Securities Exchange Act of 1934 (15 U.S.C. 78mor 78o(d)); and
(2) the information contained in the Report fairly presents, in all material respects, the financial condition and result ofoperations of Sierra Pacific.
Date: November 3, 2017 /s/ E. Kevin BethelE. Kevin Bethel
Senior Vice President and Chief Financial Officer(principal financial officer)

EXHIBIT 95
MINE SAFETY VIOLATIONS AND OTHER LEGAL MATTER DISCLOSURESPURSUANT TO SECTION 1503(a) OF THE DODD-FRANK WALL STREET
REFORM AND CONSUMER PROTECTION ACT
PacifiCorp and its subsidiaries operate certain coal mines and coal processing facilities (collectively, the "mining facilities") thatare regulated by the Federal Mine Safety and Health Administration ("MSHA") under the Federal Mine Safety and Health Act of1977 (the "Mine Safety Act"). MSHA inspects PacifiCorp's mining facilities on a regular basis. The total number of reportableMine Safety Act citations, orders, assessments and legal actions for the three-month period ended September 30, 2017 aresummarized in the table below and are subject to contest and appeal. The severity and assessment of penalties may be reduced or,in some cases, dismissed through the contest and appeal process. Amounts are reported regardless of whether PacifiCorp haschallenged or appealed the matter. Mines that are closed or idled are not included in the information below if no reportable eventsoccurred at those locations during the three-month period ended September 30, 2017. PacifiCorp has not received any notice ofa pattern, or notice of the potential to have a pattern, of violations of mandatory health or safety standards that are of such natureas could have significantly and substantially contributed to the cause and effect of coal or other mine health or safety hazardsunder Section 104(e) of the Mine Safety Act during the three-month period ended September 30, 2017.
Mine Safety Act Legal ActionsTotal
Section 104 Section Value of TotalSignificant Section 107(a) Proposed Number of Pending
and Section 104(d) Section Imminent MSHA Mining as of Last Instituted ResolvedSubstantial 104(b) Citations/ 110(b)(2) Danger Assessments Related Day of During During
Mining Facilities Citations(1) Orders(2) Orders(3) Violations(4) Orders(5) (in thousands) Fatalities Period(6) Period Period
Bridger (surface) — — — — — $ 1 — 1 — —Bridger
(underground) 5 — — — — 4 1 1 1 7Wyodak Coal
CrushingFacility
— — — — — — — — — —
(1) Citations for alleged violations of mandatory health and safety standards that could significantly or substantially contribute to the cause and effect ofa safety or health hazard under Section 104 of the Mine Safety Act.
(2) For alleged failure to totally abate the subject matter of a Mine Safety Act Section 104(a) citation within the period specified in the citation.
(3) For alleged unwarrantable failure (i.e., aggravated conduct constituting more than ordinary negligence) to comply with a mandatory health or safetystandard.
(4) For alleged flagrant violations (i.e., reckless or repeated failure to make reasonable efforts to eliminate a known violation of a mandatory health orsafety standard that substantially and proximately caused, or reasonably could have been expected to cause, death or serious bodily injury).
(5) For the existence of any condition or practice in a coal or other mine which could reasonably be expected to cause death or serious physical harm beforesuch condition or practice can be abated.
(6) Amounts include two contests of proposed penalties under Subpart C of the Federal Mine Safety and Health Review Commission's procedural rules.The pending legal actions are not exclusive to citations, notices, orders and penalties assessed by MSHA during the reporting period.