UNITED STATES SECURITIES AND EXCHANGE...
176
As filed with the Securities and Exchange Commission on September 27, 2007 UNITED STATES SECURITIES AND EXCHANGE COMMISSION WASHINGTON, D.C. 20549 FORM 20-F OR For the fiscal year ended March 31, 2007 OR For the transition period from to Date of event requiring this shell company report Commission file number: 001-32294 TATA MOTORS LIMITED (Exact name of Registrant as specified in its charter) Not applicable (Translation of Registrant’s name into English) Securities registered or to be registered pursuant to Section 12(b) of the Act: Securities registered or to be registered pursuant to Section 12(g) of the Act: None (Title of Class) Securities for which there is a reporting obligation pursuant to Section 15(d) of the Act: None (Title of Class) REGISTRATION STATEMENT PURSUANT TO SECTION 12(b) OR 12(g) OF THE SECURITIES EXCHANGE ACT OF 1934 ANNUAL REPORT PURSUANT TO SECTION 13 OR 15(d) OF THE SECURITIES EXCHANGE ACT OF 1934 TRANSITION REPORT PURSUANT TO SECTION 13 OR 15(d) OF THE SECURITIES EXCHANGE ACT OF 1934 SHELL COMPANY REPORT PURSUANT TO SECTION 13 OR 15(d) OF THE SECURITIES EXCHANGE ACT OF 1934 Republic of India Bombay House 24, Homi Mody Street Mumbai 400 001, India (Jurisdiction of incorporation or organization) (Address of principal executive offices) Title of each class Name of each exchange on which registered Ordinary Shares, par value Rs.10 per share * The New York Stock Exchange, Inc
Transcript of UNITED STATES SECURITIES AND EXCHANGE...

As filed with the Securities and Exchange Commission on September 27, 2007
UNITED STATES SECURITIES AND EXCHANGE COMMISSION
WASHINGTON, D.C. 20549
FORM 20-F
OR
For the fiscal year ended March 31, 2007 OR
For the transition period from to
Date of event requiring this shell company report Commission file number: 001-32294
TATA MOTORS LIMITED (Exact name of Registrant as specified in its charter)
Not applicable (Translation of Registrant’s name into English)
Securities registered or to be registered pursuant to Section 12(b) of the Act:
Securities registered or to be registered pursuant to Section 12(g) of the Act: None
(Title of Class) Securities for which there is a reporting obligation pursuant to Section 15(d) of the Act:
None (Title of Class)
� REGISTRATION STATEMENT PURSUANT TO SECTION 12(b) OR 12(g) OF THE SECURITIES EXCHANGE ACT OF 1934
⌧ ANNUAL REPORT PURSUANT TO SECTION 13 OR 15(d) OF THE SECURITIES EXCHANGE ACT OF 1934
� TRANSITION REPORT PURSUANT TO SECTION 13 OR 15(d) OF THE SECURITIES EXCHANGE ACT OF 1934
� SHELL COMPANY REPORT PURSUANT TO SECTION 13 OR 15(d) OF THE SECURITIES EXCHANGE ACT OF 1934
Republic of India
Bombay House 24, Homi Mody Street Mumbai 400 001, India
(Jurisdiction of incorporation or organization) (Address of principal executive offices)
Title of each class Name of each exchange on which registered Ordinary Shares, par value Rs.10 per share * The New York Stock Exchange, Inc

Indicate the number of outstanding shares of each of the issuer’s classes of capital or common stock as of the close of the period covered by the annual report. - 385,373,885 Ordinary Shares, including 42,294,157 Ordinary Shares represented by 42,294,157 American Depositary Shares were outstanding as of March 31, 2007. Indicate by check mark if the registrant is a well-known seasoned issuer, as defined in Rule 405 of the Securities Act. ⌧ Yes � No If this report is an annual or transition report, indicate by check mark if the registrant is not required to file reports pursuant to Section 13 or 15(d) of the Securities Exchange Act of 1934. � Yes ⌧ No Indicate by check mark whether the registrant: (1) has filed all reports required to be filed by Section 13 or 15(d) of the Securities Exchange Act of 1934 during the preceding 12 months (or for such shorter period that the registrant was required to file such reports), and (2) has been subject to such filing requirements for the past 90 days. ⌧ Yes � No Indicate by check mark whether the registrant is a large accelerated filer, an accelerated filer, or a non-accelerated filer. See definition of “accelerated filer and large accelerated filer” in Rule 12b-2 of the Exchange Act. (Check one):
Large accelerated filer ⌧ Accelerated filer � Non-accelerated filer � Indicate by check mark which financial statement item the registrant has elected to follow: Item 17 � Item 18 ⌧ If this is an annual report, indicate by check mark whether the registrant is a shell company (as defined in Rule 12b-2 of the Exchange Act). Yes � No ⌧
* Not for trading, but only in connection with listed American Depositary Shares, each representing one share of common stock.

In this annual report
Special Note Regarding Forward-looking Statements All statements contained in this annual report that are not statements of historical fact constitute “forward-looking
statements”. Generally, these statements can be identified by the use of forward-looking terms such as “anticipate”, “believe”, “can”, “could”, “estimate”, “expect”, “intend”, “may”, “plan”, “seek”, “will” and “would” or similar words. However, these words are not the exclusive means of identifying forward-looking statements. All statements regarding our expected financial condition and results of operations, business, plans and prospects are forward-looking statements. These forward-looking statements include statements as to our business strategy, our revenue and profitability, planned projects and other matters discussed in this annual report regarding matters that are not historical fact. These forward-looking statements and any other projections contained in this annual report (whether made by us or any third party) involve known and unknown risks, uncertainties and other factors that may cause our actual results, performance or achievements to be materially different from any future results, performance or achievements expressed or implied by these forward-looking statements or other projections. Although we are a reporting company and will have ongoing disclosure obligations under U.S. federal securities laws, we are not undertaking to publicly update or revise any statements in this annual report, whether as a result of new information, future events or otherwise.
The risks and factors that could cause our actual results, performances and achievements to be materially different from the forward-looking statements set out in Item 3.D and elsewhere in this annual report include, among others:
• References to “we”, “our” and “us” are to Tata Motors Limited and its consolidated subsidiaries, except as the context otherwise requires;
• References to “dollar”, and “US$” are to the lawful currency of the United States of America, and references to “rupees” and “Rs.” are to the lawful currency of India;
• References to “US GAAP” are to accounting principles generally accepted in the United States, and references to “Indian GAAP” are to accounting principles generally accepted in India;
• References to an “ADS” are to an American Depositary Share, and references to an “ADR” are to an American Depositary Receipt;
• References to light commercial vehicles, or LCVs, medium commercial vehicles, or MCVs, and heavy commercial vehicles, or HCVs, refer to vehicles that have gross vehicle weight, or GVW, of up to 7.5 metric tonnes, between 7.5 and 16.2 metric tonnes, and over 16.2 metric tonnes, respectively;
• References to passenger cars refer to vehicles that have a seating capacity of up to six persons, excluding the driver, and is further classified into the following market segments: mini-cars – which have a length of up to 3,400 mm; compact cars – which have a length between 3,401mm and 4,000mm; mid-size cars – which have length of between 4,001mm and 4,500mm; executive cars – which have a length between 4,501mm and 4,700mm; and premium cars and luxury cars –which have a length between 4,701 and 5,000mm, and above 5,001mm, respectively.
• References to utility vehicles, or UVs, and multi-purpose vehicles, or MPVs, refer to vehicles that have a seating capacity of seven to twelve persons, excluding the driver, and van-type vehicles that have a seating capacity of seven to twelve persons, excluding the driver, respectively.
• Unless otherwise stated, comparative and empirical industry data in this annual report have been derived from published reports of the Society of Indian Automobile Manufacturers, or SIAM;
• References to a particular “fiscal” year, such as “fiscal 2006”, are to our fiscal year ended on March 31 of that year;
• Figures in tables may not add up to totals due to rounding;
• “Millimeters” or “mm” are equal to 1/1000 of a meter. A meter is equal to approximately 39.37 inches and a millimeter is equal to approximately 0.039 inch; and
• “Kilograms” or “kg” are each equal to approximately 2.2 pounds, and “metric tonnes” are equal to 1,000 kilograms or approximately 2,200 pounds.
• “Litres” are equivalent to 61.02 cubic inches of volume, or approximately 1.057 U.S. quarts of liquid measure. • “Revenues” refers to Total Revenue net of excise duty unless stated otherwise.
• general political, social and economic conditions, and the competitive environment in India and other markets in which we operate and sell our products;
• fluctuations in the currency exchange rate of the rupee to the dollar and other currencies;
• accidents and natural disasters;
i
• terms on which we finance our working capital and capital and product development expenditures and investment requirements;
• implementation of new projects, including mergers and acquisitions, planned by management; • contractual arrangements with suppliers; • government policies including those specifically regarding the automotive industry, including industrial licensing,
environmental regulations, safety regulations, import restrictions and duties, excise duties, sales taxes, value added taxes, product range restrictions, diesel and gasoline prices and road network enhancement projects;
• significant movements in the prices of key inputs such as steel, aluminum, rubber and plastics; and • other factors beyond our control.

TABLE OF CONTENTS
ii
Page
Part I
Item 1 Identity of Directors, Senior Management and Advisers 1Item 2 Offer Statistics and Expected Timetable 1Item 3 Key Information 1
A. Selected Financial Data 1 B. Capitalization and Indebtedness 3 C. Reason for the Offer and Use of Proceeds 3 D. Risk Factors 4
Item 4 Information on the Company 8 A. History and Development of the Company 8 B. Business Overview 10 C. Organizational Structure 19 D. Property, Plants and Equipment 21
Item 4A Unresolved Staff Comments 23Item 5 Operating and Financial Review and Prospects 23
A. Operating Results 23 B. Liquidity and Capital Resources 31 C. Research and Development, Patents and Licenses, etc. 37 D. Trend information 37 E. Off-Balance Sheet Arrangements 37 F. Tabular Disclosure of Contractual Obligations 37
Item 6 Directors, Senior Management and Employees 37 A. Directors and Senior Management 37 B. Compensation 39 C. Board Practices 40 D. Employees 42 E. Share ownership 43
Item 7 Major Shareholders and Related Party Transactions 43 A. Major shareholders 43 B. Related party transactions 45 C. Interests of Experts and Counsel 45
Item 8 Financial Information 45 A. Consolidated Statements and Other Financial Information 45 B. Significant Changes 45
Item 9 The Offer and Listing 45 A. The Offer and Listing Details 45 B. Plan of Distribution 46 C. Markets 46 D. Selling Shareholders 46 E. Dilution 46 F. Expenses of the Issue 46
Item 10 Additional Information 47 A. Share Capital 47 B. Memorandum and Article of Association 47 C. Material Contracts 51 D. Exchange Controls 51 E. Taxation 54 F. Dividends and Paying Agents 57 G. Statement by Experts 57 H. Documents on Display 57 I. Subsidiary Information 57
Item 11 Quantitative and Qualitative Disclosures about Market Risk 57Item 12 Description of Securities other than Equity Securities 58
iii
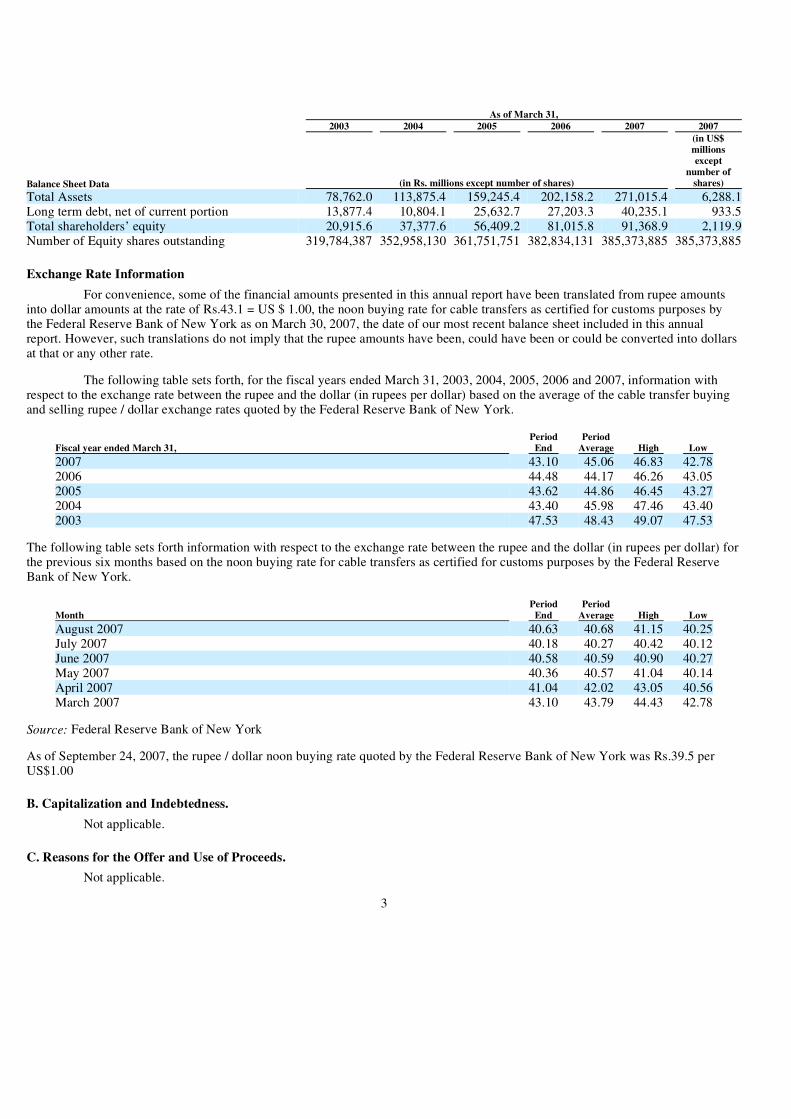
Part II
Item 13 Defaults, Dividend Arrearages and Delinquencies 59Item 14 Material Modifications to the Rights of Security Holders and Use of Proceeds 59Item 15 Controls and Procedures 59Item 16A Audit Committee Financial Expert 59Item 16B Code of Ethics 59Item 16C Principal Accountant Fees and Services 60Item 16D Exemptions from the Listing Standards for Audit Committees 60Item 16E Purchases of Equity Securities by the Issuer and Affiliated Purchasers 60
Part III
Item 17 Financial Statements 60Item 18 Financial Statements 60Item 19 Exhibits 61
Index to Consolidated Financial Statements F1

PART 1
Not applicable.
Not applicable.
A. Selected Financial Data. The following table sets forth selected financial data including selected historical financial information as of and for each
of the fiscal years ended March 31, 2003, 2004, 2005, 2006 and 2007 in accordance with accounting principles generally accepted in the United States, or US GAAP.
The selected US GAAP consolidated financial data as of March 31, 2006 and 2007 and for each of the fiscal years ended March 31, 2005, 2006 and 2007 are derived from our audited US GAAP consolidated financial statements included in this annual report together with the report of Deloitte Haskins & Sells, independent auditors, who have reported that they carried out their audit in accordance with standards of the Public Company Accounting Oversight Board (United States). The selected US GAAP consolidated financial data as of March 31, 2003, 2004 and 2005 and for the fiscal years ended March 31, 2003 and 2004 are derived from our audited US GAAP consolidated financial statements not included in this annual report.
You should read our selected financial data in conjunction with Item 5 “— Operating and Financial Review and Prospects”.
1
Item 1. Identity of Directors, Senior Management and Advisers.
Item 2. Offer Statistics and Expected Timetable.
Item 3. Key Information.

Selected Financial Data Prepared in Accordance with US GAAP
2
For the year ended March 31, 2003 2004 2005 2006 2007 2007
(in Rs. millions, except share and per share amounts)
(In US $ millions, except Share and
per share amounts)
Gross Sales 112,106.3 162,176.6 228,549.4 272,350.8 370,709.1 8,601.2Less: Excise Duty 17,352.5 23,883.2 31,771.0 35,465.0 46,227.9 1,072.6
Net sales 94,753.8 138,293.4 196,778.4 236,885.8 324,481.2 7,528.6Finance revenues 976.7 1,402.3 1,608.6 3,728.7 7,043.4 163.4
Total revenues 95,730.5 139,695.7 198,387.0 240,614.5 331,524.6 7,692.0Cost of sales 74,038.5 108,159.6 156,906.7 189,318.7 263,449.7 6,112.5
Operating Expenses Selling, general and administrative 13,040.9 15,276.9 20,144.9 26,586.2 35,623.3 826.5 Research and development 1,536.2 1,282.0 2,532.4 4,663.0 6,018.1 139.6Employee separation compensation 32.6 386.3 11.5 4.2 2.6 0.1
Total operating expenses 14,609.7 16,945.2 22,688.8 31,253.4 41,644.0 966.2
Operating income 7,082.3 14,590.9 18,791.5 20,042.4 26,430.9 613.3
Non-operating (expense) income Gain on shares issued by subsidiary — — — 86.5 30.4 0.7 Gain on sale of equity interest in a
subsidiary — — — 1,532.1 — — Other non-operating income, net 1,222.0 1,773.2 1,821.6 1,882.6 4,745.4 110.1Interest income 412.4 349.6 761.6 662.8 598.3 13.9Interest expense (4,090.4) (2,684.3) (2,993.3) (3,717.8) (5,413.8) (125.6)
Total non-operating (expense) income (2,456.0) (561.5) (410.1) 446.2 (39.7) (0.9)
Income before equity in affiliates, minority interest and income taxes 4,626.3 14,029.4 18,381.4 20,488.6 26,391.2 612.4
Income tax expense (1,888.4) (5,264.0) (5,099.9) (5,618.3) (8,113.0) (188.2)Minority interest, net of tax (14.7) (228.9) (365.7) (331.1) (718.5) (16.7)Equity in net income of affiliates, net
of tax 46.1 363.4 340.4 471.4 551.9 12.8
Net Income 2,769.3 8,899.9 13,256.2 15,010.6 18,111.6 420.3
Weighted average equity shares outstanding:
Basic 319,777,248 328,306,904 359,837,353 373,268,040 384,544,205 384,544,205Diluted 319,777,248 363,123,828 388,849,716 399,310,236 407,166,995 407,166,995 Earnings per share:
Basic Rs.8.7 Rs.27.1 Rs.36.8 Rs.40.2 Rs.47.1 US$ 1.1Diluted Rs.8.7 Rs.25.3 Rs.34.9 Rs.38.7 Rs.45.4 US$ 1.1
Cash dividend per Equity Share Rs. — Rs.8.0 Rs.4.0 Rs.12.5 Rs.13.0 US$ 0.3
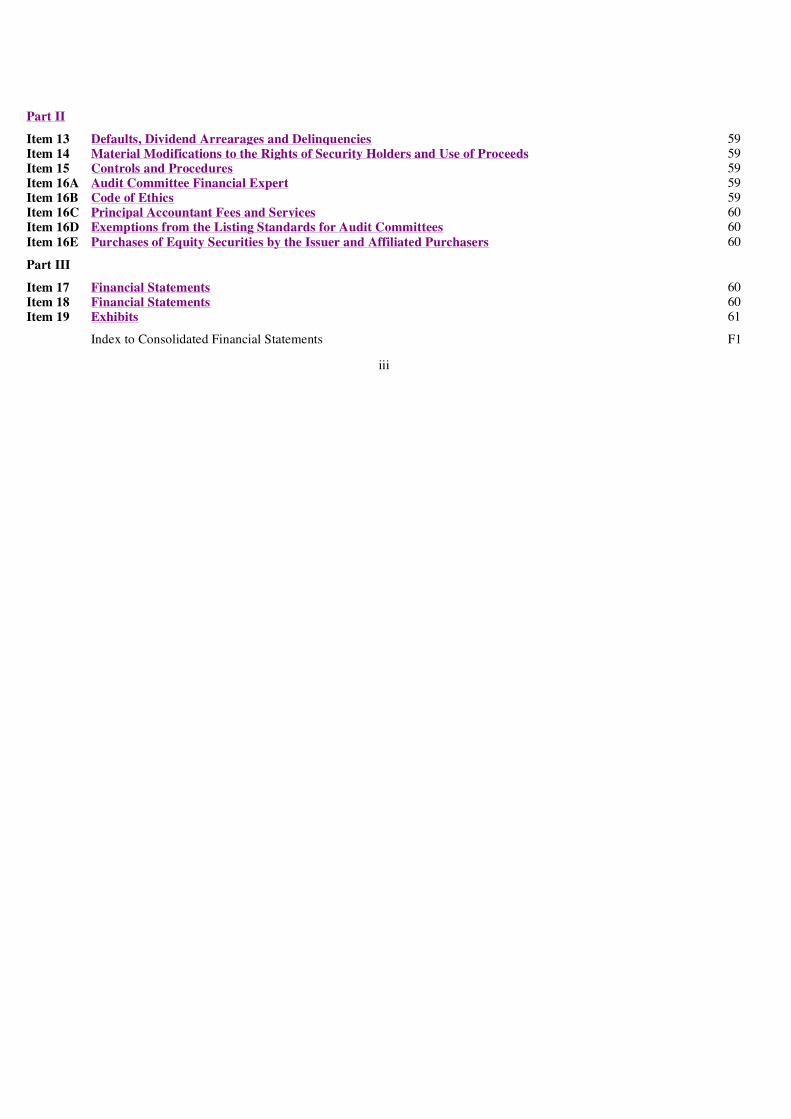
Exchange Rate Information For convenience, some of the financial amounts presented in this annual report have been translated from rupee amounts
into dollar amounts at the rate of Rs.43.1 = US $ 1.00, the noon buying rate for cable transfers as certified for customs purposes by the Federal Reserve Bank of New York as on March 30, 2007, the date of our most recent balance sheet included in this annual report. However, such translations do not imply that the rupee amounts have been, could have been or could be converted into dollars at that or any other rate.
The following table sets forth, for the fiscal years ended March 31, 2003, 2004, 2005, 2006 and 2007, information with respect to the exchange rate between the rupee and the dollar (in rupees per dollar) based on the average of the cable transfer buying and selling rupee / dollar exchange rates quoted by the Federal Reserve Bank of New York.
The following table sets forth information with respect to the exchange rate between the rupee and the dollar (in rupees per dollar) for the previous six months based on the noon buying rate for cable transfers as certified for customs purposes by the Federal Reserve Bank of New York.
Source: Federal Reserve Bank of New York
As of September 24, 2007, the rupee / dollar noon buying rate quoted by the Federal Reserve Bank of New York was Rs.39.5 per US$1.00
B. Capitalization and Indebtedness. Not applicable.
C. Reasons for the Offer and Use of Proceeds. Not applicable.
3
As of March 31, 2003 2004 2005 2006 2007 2007
Balance Sheet Data (in Rs. millions except number of shares)
(in US$ millions except
number of shares)
Total Assets 78,762.0 113,875.4 159,245.4 202,158.2 271,015.4 6,288.1Long term debt, net of current portion 13,877.4 10,804.1 25,632.7 27,203.3 40,235.1 933.5Total shareholders’ equity 20,915.6 37,377.6 56,409.2 81,015.8 91,368.9 2,119.9Number of Equity shares outstanding 319,784,387 352,958,130 361,751,751 382,834,131 385,373,885 385,373,885
Fiscal year ended March 31, Period
End Period
Average High Low
2007 43.10 45.06 46.83 42.782006 44.48 44.17 46.26 43.052005 43.62 44.86 46.45 43.272004 43.40 45.98 47.46 43.402003 47.53 48.43 49.07 47.53
Month Period
End Period
Average High Low
August 2007 40.63 40.68 41.15 40.25July 2007 40.18 40.27 40.42 40.12June 2007 40.58 40.59 40.90 40.27May 2007 40.36 40.57 41.04 40.14April 2007 41.04 42.02 43.05 40.56March 2007 43.10 43.79 44.43 42.78

D. Risk Factors. This section describes the risks that we currently believe may materially affect our business. The factors below should be
considered in connection with any forward-looking statements in this annual report and the cautionary statements on page 2. The risks below are not the only ones we face – some risks may be unknown to us, and some risks that we do not currently believe to be material could later turn out to be material. Although we will be making all reasonable efforts to mitigate or minimize these risks, one or more of a combination of these risks could materially impact our business, revenues, sales, net assets, results of operations, liquidity and capital resources.
Risk associated with Our Business and the Indian Automotive Industry. General economic conditions could have a significant adverse impact on our sales and results of operations.
The Indian automotive industry is substantially affected by general economic conditions in India. The demand for automobiles in the Indian market is influenced by factors including the growth rate of the Indian economy, increase in disposable income among Indian consumers, interest rates, freight rates and fuel prices. There can be no assurance that the Indian economy will not experience a downturn, and weakening of economic activity. An increase in interest rates and/or increases in fuel prices are examples of developments that could lead to a decline in the demand for automobiles in the Indian market, which could significantly affect our sales and future results of operations in an adverse manner.
Currency and exchange rate fluctuations could adversely affect our results of operations. We are sensitive to fluctuations in foreign currency exchange rates. Although we engage in currency hedging in order to
decrease our foreign exchange exposure, a weakening of the rupee against the dollar or other major foreign currencies may have an adverse effect on our cost of borrowing and consequently may increase our financing costs, which could have a significant adverse impact on our results of operations.
In addition, we have experienced and expect to continue to experience foreign exchange losses and gains on obligations denominated in foreign currencies in respect of our borrowings and foreign currency assets and liabilities due to currency fluctuations. While the rupee’s appreciation against the dollar in the last four months of fiscal 2007 has contributed positively to our financial condition and results of operations, any depreciation in the value of the rupee against the dollar may lead to adverse effects on our financial condition and results of operations during the current fiscal year and in the future periods, partly due to an increase in our dollar and/or Japanese Yen denominated debt.
Intensifying competition in the Indian market could materially and adversely affect our sales and results of operations. The Indian automobile industry is highly competitive. We face strong competition in the Indian market from domestic as
well as foreign automobile manufacturers, and competition from foreign competitors is likely to intensify further in the future. There can be no assurance that we will be able to implement our future strategies in a way that will mitigate the effects of increased competition in the Indian automotive industry.
Our future success depends on our ability to satisfy changing customer demands by offering innovative products in a timely manner and maintaining such products’ competitiveness.
In the competitive automotive industry, our competitors can gain significant advantage if they are able to offer products satisfying customer needs earlier than we are able to, which could adversely impact our sales and results of operations. Unanticipated delays in implementing the introduction of new products or expansion plans resulting in delays in capacity enhancements and / or new product launches could adversely impact our results of operations. In addition, there can be no assurance that the market acceptance of our future products will meet our expectations, in which case we could be unable to realize the intended economic benefits of our investments and our results of operations may be adversely affected.
We are subject to risks associated with product liability, warranty and recall. We are subject to risks and costs associated with product liability, warranty and recall should we supply defective products,
parts, or related after-sales services, which could generate adverse publicity and adversely affect our business, results of operations and financial condition.
We are subject to risk associated with our automobile financing business. We are subject to the risk associated with our automobile financing business. Any defaults by our customers or inability to
repay installments as due could adversely affect our business, results of operations and cash flows.
Underperformance of our distribution channels and supply chains may adversely affect our sales and results of operations. We have selected and developed exclusive dealers across India and a network of distributors and local dealers in select
international markets for distribution of our products and we believe that we provide adequate incentives and support to ensure that such dealers perform to our expectations. There can be no assurance, however, that our performance expectations will be met, which

could adversely affect our sales and results of operations. In addition, while we believe that we have a robust and efficient supply chain, we rely on some key vendors for some raw materials, parts and components used in the manufacture of our products. Our ability to procure these supplies in a cost effective and timely manner is subject to various factors, some of which are not always within our control. While we have not experienced significant problems with our supply chain in the past, that have materially affected our results of operations, any significant problems with our supply chain in the future could affect our results of operations in an adverse manner.
4
Increases in commodity prices may have a material adverse impact on our result of operations.
In fiscal 2005, 2006, and 2007, consumption of raw materials and components constituted approximately 81.2%, 79.3% and 78.8%, respectively, of our cost of sales. Prices of commodity items used in manufacturing automobiles, including steel, rubber, copper, and zinc, etc are on the rise. While we have been pursuing various cost reduction programs to partially offset these price increases, there can be no assurance that we will be able to recover any future cost increases in commodity products through cost-saving measures elsewhere or that we will be able to increase the selling prices of our products, which could materially and adversely impact our sales and results of operations.
The performance of our subsidiaries and affiliates may adversely affect our results of operations. We have made and may continue to make capital commitments to our subsidiaries and affiliates, and if the business and
operations of subsidiaries and affiliates, to whom we make capital commitments, deteriorate our results of operations may be adversely affected in the future.
We are subject to risks associated with growing our business through mergers and acquisitions. We continuously evaluate growth opportunities through suitable mergers and acquisitions. These involve business risks,
including unforeseen contingent risks or latent business liabilities that may only become apparent after the merger or acquisition is finalized, successful integration and management of the merged/acquired entity with us, retention of key personnel, joint sales and marketing efforts, management of a larger business and diversion of management’s attention from other ongoing business concerns. If we are not able to manage these risks successfully our results of operations could be adversely affected.
We may be adversely affected by labor unrest. All of our regular employees and those of some of our consolidated subsidiaries in India, other than officers and
management, are members of labor unions and are covered by our wage agreements with those labor unions which have different tenures (typically three years) at different locations. In general, we consider our labor relations with all of our employees to be good. However, we may in the future be subject to labor unrest, which may delay or disrupt our operations in the affected regions, including the acquisition of raw materials and parts, the manufacture, sales and distribution of products and the provision of services. If work stoppages or lock-outs at our facilities or at the facilities of our major vendors occur or continue for a long period of time, our business, financial condition or results of operations may be adversely affected.
Any inability to manage our growing international business may adversely affect our results of operations Our growth strategy relies on the expansion of our operations to other parts of the world, including Europe, Russia and
other parts of Asia. The costs involved in entering and establishing ourselves in new markets, and expanding such operations, may be higher than expected, and we may face significant competition in those regions. In addition, our international business is subject to many actual and potential risks, including:
Any of these risks may have a material adverse effect on our international operations, which could result in our failure to generate returns on our related investments and cause us to incur significant costs. Our inability to manage our expansion and related growth in those regions may have an adverse effect on our business, results of operations and financial condition.
Risk associated with Political and Regulatory Risks. India’s obligations under the World Trade Organisation Agreement.
India’s obligation under its World Trade Organization agreement could lower the present level of tariffs on import of components and vehicles particularly with respect to cars in completely built units and/or completely knocked down units, which could adversely affect, our sales and results of operations.
Environmental and Government regulations. As an automobile company, we are subjected to extensive governmental regulations regarding vehicle emission levels,
noise, safety and levels of pollutants generated by our production facilities. These regulations are likely to become more stringent and
• language barriers, cultural differences and other difficulties in staffing and managing overseas operations;
• inherent difficulties and delays in contract enforcement and the collection of receivables through the legal systems of some
foreign countries; • volatility in currency exchange rates; • the risk of non-tariff barriers or other restrictions on foreign trade;
• changes in the political, regulatory, or economic conditions in a foreign country or region, including political or economic
instability or social unrest; and
• the burdens of complying with a wide variety of foreign laws and regulations.

compliance costs may significantly impact our future results of operations. Imposition of any additional taxes and levies by the Indian government designed to limit the use of automobiles could adversely affect the demand for our products and our results of operations. Regulations in the areas of investments, taxes and levies may also have an impact on Indian securities, including our shares and ADSs.
5

We may be adversely impacted by political instability, wars, terrorism, multinational conflicts, natural disasters, fuel shortages/prices, epidemics and labor strikes.
Our products are exported to a number of geographical markets and we plan to expand our international operations further in the future. Consequently, we are subject to various risks associated with conducting our business outside India and our operations may be subject to political instability within and outside India, wars, terrorism, regional and/or multinational conflicts, natural disasters, fuel shortages, epidemics and labor strikes. Any significant or prolonged disruptions or delays in our operations related to these risks could adversely impact our results of operations.
Compliance with new and changing corporate governance and public disclosure requirements adds uncertainty to our compliance policies and increases our costs of compliance.
Changing laws, regulations and standards relating to accounting, corporate governance and public disclosure, including the Sarbanes-Oxley Act of 2002 and new Securities and Exchange Commission (SEC) regulations, Securities and Exchange Board of India (SEBI) regulations, New York Stock Exchange (NYSE) listing rules and Indian stock market listing regulations, have increased complexity for us. These new or changed laws, regulations and standards may lack specificity and are subject to varying interpretations. Their application in practice may evolve over time as new guidance is provided by regulatory and governing bodies. This could result in continuing uncertainty regarding compliance matters and higher costs of compliance as a result of ongoing revisions to such governance standards.
In connection with our Annual Report on Form 20-F for fiscal 2007, our management assessed our internal controls over financial reporting, and determined that our internal controls were effective as of March 31, 2007, and our auditors have issued an unqualified attestation with respect to our management’s assessment. We will undertake management assessments of our internal controls over financial reporting in connection with each annual report. We are committed to maintaining high standards of corporate governance and public disclosure. However, our efforts to comply with evolving laws, regulations and standards in this regard have resulted in, and are likely to continue to result in, increased general and administrative expenses and a diversion of management resources and time.
Risks associated with Investments in an Indian Company. Political changes in the Government in India could delay/affect the further liberalization of the Indian economy and adversely affect economic conditions in India generally and our business in particular.
Most of our manufacturing and sales and distribution facilities are located in India, and in fiscal 2007, 2006 and 2005, approximately 80.7%, 82.4% and 86.1% respectively, of our revenues were derived from sales within India. Our business, and the market price and liquidity of our ADSs and shares, may be affected by foreign exchange rates and controls, interest rates, changes in government policy, taxation, social and civil unrest and other political, economic or other developments in or affecting India.
Since 1991, successive Indian Governments have pursued policies of economic liberalization, including significantly relaxing restrictions on the private sector. Nevertheless, the roles of the Indian central and state governments in the Indian economy as producers, consumers and regulators have remained significant. Consequent to an election in April and May 2004, there was a change in government. While the current coalition government has already committed to a common minimum agenda, there can be no assurance that there will not be changes in the economic reform, and specific laws and policies affecting automotive companies, foreign investment, currency exchange and investment regulations governing India’s capital markets that could negatively affect us. Uncertainty regarding possible policy changes immediately after elections has in the past resulted in significant volatility in price and trading volumes of securities of Indian companies. A significant change in India’s economic liberalization and deregulation policies could adversely affect business and economic conditions in India generally, and our business in particular, if new restrictions on the private sector are introduced or if existing restrictions are increased.
Regional conflicts in Asia and other export markets could adversely affect the Indian economy and cause our business to suffer. The Asian region has from time to time experienced instances of civil unrest and hostilities among neighboring countries,
and military hostilities and civil unrest in other Asian countries. Events of this nature in the future could influence the Indian economy and could have a material adverse effect on the market for securities of Indian companies, including our ADSs and shares, and on the market for our vehicles.
Rights of shareholders under Indian law may be more limited than under the laws of other jurisdictions. Our Articles of Association, which include regulations applicable to our Board of Directors, and Indian law govern our
corporate affairs. Legal principles relating to these matters and the validity of corporate procedures, directors’ fiduciary duties and liabilities, and shareholders’ rights may differ from those that would apply to a company incorporated in another jurisdiction. Shareholders’ rights under Indian law may not be as extensive as shareholders’ rights under the laws of other countries or jurisdictions, including the United States. You may have more difficulty in asserting your rights as a shareholder than you would as a shareholder of a corporation organized in another jurisdiction.

6

The market value of your investment may fluctuate due to the volatility of the Indian securities market. The Indian stock exchanges have, in the past, experienced substantial fluctuations in the prices of their listed securities.
The Indian stock exchanges, including the Bombay Stock Exchange Limited (BSE), have experienced problems that, if they continue or recur, could affect the market price and liquidity of the securities of Indian companies, including our shares. These problems have included temporary exchange closures, broker defaults, settlement delays and strikes by brokers. In addition, the governing bodies of the Indian stock exchanges have from time to time imposed restrictions on trading in certain securities, limitations on price movements and margin requirements. Furthermore, from time to time disputes have occurred between listed companies and stock exchanges and other regulatory bodies, which in some cases may have had a negative effect on market sentiment.
There may be a different level of regulation and monitoring of the Indian securities markets and the activities of investors, brokers and other participants than in the United States. The SEBI received statutory powers in 1992 to assist it in carrying out its responsibility for improving disclosure and other regulatory standards for the Indian securities markets. Subsequently, SEBI has prescribed regulations and guidelines in relation to disclosure requirements, insider dealing and other matters relevant to the Indian securities market. There may, however, be less publicly available information about Indian companies than is regularly made available by public companies in the United States.
Investors may have difficulty enforcing judgments against us or our management. We are a limited liability company incorporated under the laws of India. Substantially all of our directors and executive
officers named in this annual report are residents of India and all or substantial portion of our assets and the assets of these directors and executive officers are located in India. As a result, investors may find it difficult to (i) effect service of process upon us or these directors and executive officers in jurisdictions outside of India, (ii) enforce court judgments obtained outside of India, including those based upon the civil liability provisions of the U.S. federal securities laws, against us or these directors and executive officers, (iii) enforce, in an Indian court, court judgments obtained outside of India, including those based upon the civil liability provisions of the U.S. federal securities laws, against us or these directors and executive officers, and (iv) obtain expeditious adjudication of an original action in an Indian court to enforce liabilities, including those based upon the U.S. federal securities laws, against us or these directors and executive officers.
India is not a party to any international treaty in relation to the recognition or enforcement of foreign judgments. Recognition and enforcement of foreign judgments is provided under Section 13 of the Code of Civil Procedure, 1908, or the Civil Code.
Section 13 and Section 44A of the Civil Code provide that a foreign judgment shall be conclusive as to any matter thereby directly adjudicated upon except (i) where it has not been pronounced by a court of competent jurisdiction, (ii) where it has not been given on the merits of the case, (iii) where it appears on the face of the proceedings to be founded on an incorrect view of international law or a refusal to recognize the law of India in cases where Indian law is applicable, (iv) where the proceedings in which the judgment was obtained were opposed to natural justice, (v) where it has been obtained by fraud or (vi) where it sustains a claim founded on a breach of any law in force in India.
Section 44A of the Civil Code provides that where a foreign judgment has been rendered by a superior court in any country or territory outside India which the Government has by notification declared to be a reciprocating territory, it may be enforced in India by proceedings in execution as if the judgment had been rendered by the relevant court in India. However, Section 44A of the Civil Code is applicable only to monetary decrees not being in the nature of any amounts payable in respect of taxes or other charges of a like nature or in respect of a fine or other penalty.
The United States has not been declared by the Government of India to be a reciprocating territory for the purpose of Section 44A of the Civil Code. Accordingly, a judgment of a court in the United States may be enforced only by a suit upon the judgment and not by proceedings in execution. The suit must be brought in India within three years from the date of the judgment in the same manner as any other suit filed to enforce a civil liability in India. It is unlikely that a court in India would award damages on the same basis as a foreign court if an action is brought in India. Furthermore, it is unlikely that an Indian court would enforce foreign judgments if it viewed the amount of damages awarded as excessive or inconsistent with public policy. A party seeking to enforce a foreign judgment in India is required to obtain approval from the Reserve Bank of India (RBI) to execute such a judgment or to repatriate outside India any amount recovered.
Risk associated with our Shares and ADSs. Fluctuations in the exchange rate between the rupee and the dollar may have a material adverse effect on the market value of the ADSs and the Shares, independent of our operating results.
Fluctuations in the exchange rate between the Rupee and the Dollar will affect, among others things, the Dollar equivalents of the price of the shares in Rupees as quoted on the Indian stock exchanges and, as a result, may affect the market price of the ADSs. Such fluctuations will also affect the Dollar equivalent of any cash dividends in Rupees received on the Shares represented by the ADSs and the Dollar equivalent of the proceeds in Rupees of a sale of shares in India.

7

The exchange rate between the rupee and the dollar has changed substantially in the last two decades and may substantially fluctuate in the future. On an annual average basis, the rupee has appreciated against the dollar since 2002. The value of the Rupee against the Dollar was Rs.39.5 = US$ 1.00 as of September 24, 2007.
Holders of ADSs have fewer rights than shareholders and must act through the depositary to exercise those rights. Although holders of ADSs have a right to receive any dividends declared in respect of Shares underlying the ADSs, they
cannot exercise voting or other direct rights as a shareholder with respect to the Shares underlying the ADSs evidenced by ADRs. Citibank, N.A., as depositary is the registered shareholder of the deposited shares underlying our ADSs, and therefore only Citibank, N.A. can exercise the rights of shareholders in connection with the deposited shares. Only if requested by us, the depositary will notify holders of ADSs of upcoming votes and arrange to deliver our voting materials to holders of ADSs. The depositary will try, in so far as practicable, subject to Indian laws and the provisions of our Articles of Association, to vote or have its agents vote the deposited securities as instructed by the holders of ADSs. If the depositary receives voting instructions in time from a holder of ADSs which fail to specify the manner in which the depositary is to vote the shares underlying such holder’s ADSs, such holder will be deemed to have instructed the depositary to vote in favor of the items set forth in such voting instructions. If the depositary has not received timely instructions from a holder of ADSs, the holder shall be deemed to have instructed the depositary to give a discretionary proxy to a person designated by us, subject to the conditions set forth in the deposit agreement. If requested by us, the depositary is required to represent all shares underlying ADSs, regardless whether timely instructions have been received from the holders of such ADSs, for the sole purpose of establishing a quorum at a meeting of shareholders. Additionally, in your capacity as an ADS holder, you will not be able to bring a derivative action, examine our accounting books and records, or exercise appraisal rights. Registered holders of our shares withdrawn from the depositary arrangements will be entitled to vote and exercise other direct shareholder rights in accordance with Indian law. However, a holder may not know about a meeting sufficiently in advance to withdraw the underlying shares in time. Furthermore, a holder of ADSs may not receive voting materials, if we do not instruct the depositary to distribute such materials, or may not receive such voting materials in time to instruct the depositary to vote.
Further, pursuant to Indian regulations, we are required to offer our shareholders pre-emptive rights to subscribe for proportionate number of shares to maintain their existing ownership percentages prior to the issue of new shares. These rights may be waived by a resolution passed by at least 75% of our shareholders present and voting at a general meeting. Holders of ADSs may be unable to exercise pre-emptive rights for subscribing to these new shares unless a registration statement under the Securities Act is effective or an exemption from the registration requirements is available to us. Our decision to file a registration statement would be based on the costs, timing, potential liabilities and the perceived benefits associated with any such registration statement and we do not commit that we would file such a registration statement. If any issue of securities is made to our shareholders in the future, such securities may also be issued to the Depositary, which may sell such securities in the Indian securities market for the benefit of the holders of ADSs. There can be no assurance as to the value, if any, the Depositary would receive upon the sale of these rights/securities. To the extent that holders of ADSs are unable to exercise pre-emptive rights, their proportionate interest in us would be reduced.
As a result of Indian Government regulation of foreign ownership the price of the ADSs could decline. Foreign ownership of Indian securities is regulated and is partially restricted. In addition, there are restrictions on the
deposit of Shares into our ADS facilities. ADSs issued by companies in certain emerging markets, including India, may trade at a discount to the underlying equity shares, in part because of the restrictions on foreign ownership of the underlying equity shares and in part because ADSs are sometimes perceived to offer less liquidity than underlying shares which can be traded freely in local markets by both local and international investors. See Item 10.D “— Exchange Controls”. The ADSs could trade at a discount to the market price of the underlying Shares.
A. History and Development of the Company. We were incorporated on September 1, 1945 as a public limited liability company under the Indian Companies Act VII of
1913 as Tata Locomotive and Engineering Company Limited. Our name was changed to Tata Engineering and Locomotive Company Limited on September 24, 1960 and to Tata Motors Limited on July 29, 2003. We commenced operations as a steam locomotive manufacturer. This business was discontinued in 1971. Since 1954, we have been manufacturing automotive vehicles. This business commenced with the manufacture of commercial vehicles under financial and technical collaboration with Daimler-Benz AG (now DaimlerChrysler AG) of Germany. This agreement ended in 1969. We produced only commercial vehicles until 1991, when we started producing passenger vehicles as well.
We are India’s largest automobile manufacturer and second largest passenger vehicle player in terms of units sold in India during fiscal 2007. We have a broad portfolio of automotive products, ranging from sub – 1 ton to 40 ton Gross Vehicle Weight trucks (including pick–ups) and from small, medium, and large buses and coaches to passenger cars and utility vehicles.
We have a substantial presence in India. We estimate that more than four million vehicles produced by us are currently being operated in India.
Item 4. Information on the Company.

We produce a wide range of automotive products, including:
8
• Passenger Cars. We manufacture passenger cars, including the Tata Indica, a compact car, first launched in 1998,
the Tata Indigo, an entry level mid-sized car launched in 2002, and the Indigo Marina, a station wagon version of the Indigo launched in 2004. These passenger cars are manufactured in gasoline and diesel engine versions.

Our manufacturing base is spread across Jamshedpur (in eastern India), Pune (in western India), Lucknow and Pantnagar (in northern India), supported by a nation-wide dealership, sales, services and spare parts network comprising over 2,000 individual locations. We are in the process of establishing another two facilities, one each at Singur (East) and Dharwad (South).
In September 2004, we became the first company from India’s engineering sector to be listed on the New York Stock Exchange.
We have also expanded our international operations through mergers and acquisitions involving non-Indian companies. In 2004, we acquired the Daewoo Commercial Vehicles Company (now renamed as Tata Daewoo Commercial Vehicle Company Limited), South Korea’s second largest truck maker. TDCV has launched several new products, such as the Tata Novus M&HCV. In fiscal 2005, we acquired a 21% stake in Hispano Carrocera S.A., or Hispano, a well-known Spanish bus and coach manufacturer with an option to acquire the remaining stake. Hispano’s operations are being expanded into other markets. In addition, in June 2006, we signed a memorandum of understanding with the Fiat group to establish an industrial joint venture in India to manufacture passenger vehicles, engines and transmissions for the Indian and overseas markets; we have also been distributing and marketing Fiat branded cars in India since March 2006. We also signed a Memorandum of Understanding with IVECO, a company of the Fiat Group to evaluate the feasibility of co-operation, across markets, in the area of commercial vehicles, which encompasses a number of potential developments in engineering, manufacturing, sourcing and distribution of products, aggregates and components. In May 2006, we entered into a joint venture agreement with Brazil-based Marcopolo S.A., or Marcopolo, a global leader in body-building for buses and coaches, to manufacture and assemble fully-built buses and coaches in India, wherein we have a 51% ownership, with the balance held by Marcopolo. In December 2006, we entered into a joint venture agreement with Thonburi Automotive Assembly Plant Co., Thailand, or Thonburi, to manufacture pick–ups in Thailand. We own 70% of the joint venture, while Thonburi owns the remaining 30%. The joint venture will facilitate our efforts to address the Thailand market, which is a major market for pick-ups, and other potential markets in that region. We also entered into an agreement with Fiat to enable Fiat to manufacture pick-ups at its Cordoba plant in Argentina from 2008 onwards under licence from us.
We are also expanding our international export operations, which have been ongoing since 1961. Our commercial and passenger vehicles are being marketed in several countries in Europe, Africa, the Middle East, Australia, South East Asia and South Asia.
We believe that the foundation of our growth over the last 50 years has been a deep understanding of economic stimuli and customer needs, and the ability to translate them into customer desired products though leading edge research and development. With 1,400 engineers and scientists, our Engineering Research Centre, established in 1966, has enabled us to successfully design, develop and produce our own range of vehicles, as well as a significant portion of our production facilities, assembly lines and machinery. In addition, we established a wholly-owned subsidiary under the name Tata Motors European Technical Centre PLC, or TMETC, in the United Kingdom, in the field of automobile research. We believe this research center will also facilitate the development of our products, in particular, our passenger cars. Our research and development network also includes the facilities of TDCV in South Korea, and those of Hispano in Spain, in addition to research and development centers in Pune, Jamshedpur and Lucknow in India.
Through our subsidiary and associate companies, we are engaged in engineering and automotive solutions, construction equipment manufacturing, automotive vehicle components manufacturing and supply chain activities, machine tools and factory automation solutions, high-precision tooling and plastic and electronic components for automotive and computer applications, and automotive retailing and service operations.
Tata Technologies Limited, or TTL, our 85.92% owned subsidiary, along with its subsidiaries, is engaged in the business of information technology, product lifecycle management, engineering and design services. During fiscal 2006, TTL, through its erstwhile subsidiary TTUS, acquired INCAT, a global provider of product lifecycle management and engineering and design
9
• Utility Vehicles. We manufacture a number of utility vehicles, or UV, including the Tata Sumo, launched in 1994,
and the sports utility vehicle or SUV, Tata Safari launched in 1998. Both the Tata Sumo and the Tata Safari have models to meet different consumer preferences.
• Light Commercial Vehicles. We manufacture a variety of light commercial vehicles, or LCV, including pick-ups
and trucks and buses with a gross vehicle weight, or GVW, between 0.7 ton and 7.5 tons. This also includes the Tata Ace, India’s first indigenously developed mini-truck with a 0.7 ton payload, launched in fiscal 2006.
• Medium and Heavy Commercial Vehicles. We manufacture a variety of medium and heavy commercial vehicles, M & HCVs, which include trucks, buses, dumpers and multi-axled vehicles with GVW between 9 tons to 49 tons. In addition, through Tata Daewoo Commercial Vehicle Company Limited, or TDCV, our wholly-owned subsidiary in South Korea, we manufacture a range of high horsepower trucks ranging from 220 horsepower to 400 horsepower, including dump trucks, tractor-trailers, mixers and cargo vehicles.

services primarily to manufacturers and their suppliers in the international automotive, aerospace and engineering markets. TTL, through its subsidiary companies, responds to customers’ needs through its operations in 45 cities across 12 countries in North America, Europe and Asia and through its delivery centers in India and Thailand.
Telco Construction Equipment Company Ltd, or Telcon, is engaged in the business of manufacturing and sale of construction equipment and related services. During fiscal 2006, we sold a 20% stake in Telcon to our joint venture partner, Hitachi Construction Machinery Company Ltd, or HCM, for a total consideration of approximately Rs.2 billion (US$ 44.25 million). Presently, we have a 60% stake in Telcon, with the remaining 40% being held by HCM.
Our subsidiary, Tata AutoComp Systems Limited, or TACO, is a holding company for promoting foreign joint ventures in automotive components and systems and is also engaged in engineering services, supply chain management and after-market operations. Beginning with one joint venture for seating equipment, with Johnson Controls of the United States, the TACO group now has 14 manufacturing joint ventures with well-known companies including Hendrickson International of the United States, Ficosa International of Spain and Yazaki Corporation of Japan. In August 2005, TACO acquired the business and assets of two German companies through its wholly-owned subsidiary TACO Holdings (Mauritius) Limited. TACO’s customers include leading domestic original equipment manufacturers and certain global original equipment manufacturers and suppliers.
Our wholly-owned subsidiary, TML Financial Services Limited, now known as Tata Motors Finance Limited, or TMFL, was incorporated on June 1, 2006 with the objective of becoming a preferred financing provider for our customers and our distributors by capturing customer spending over the vehicle life-cycle and by extending value added products, combining financing offerings with insurance, fleet management, operating leases, re-finance and other products related to vehicles sold by us. TMFL is registered with the RBI as a Systemically Important Non-Deposit Taking Non-Banking Financial Company and is classified as an Asset Finance Company under the RBI’s regulation on Non-Banking Finance Companies. TMFL commenced operations in September 2006, and for the period ended March 31, 2007, it made disbursements of approximately Rs.40,000 million.
We currently intend to use our wholly-owned subsidiary, Tata Motors Insurance Services Limited, or TMISL, to undertake the business of insurance and reinsurance broking. TMISL is currently in the process of receiving the requisite approval from the Insurance Regulatory and Development Authority in India to commence this business.
As of March 31, 2007, our operations included 39 consolidated subsidiaries and 19 equity method affiliates, in respect of which we exercise significant influence.
Tata Incorporated serves as our authorized United States representative. The address of Tata Incorporated is 3 Park Avenue, 27th Floor, New York, NY 10016, United States of America.
Our Registered Office is located at Bombay House, 24, Homi Mody Street, Mumbai 400 001, India and our telephone number is +91-22-6665-8282 and our website address is www.tatamotors.com. Our website does not constitute a part of this annual report.
B. Business Overview. Overview
Our business segments are (i) automotive operations and (ii) all other operations. Our automotive operations business segment includes the design, manufacture, assembly, sale and service of commercial and passenger vehicles, spare parts, components and accessories as well as financing our vehicles. Our other operations business segment includes Information Technology, or IT services, construction equipment manufacturing, machine tools and factory automation solutions, high-precision tooling and plastic and electronic components for certain applications and investment business.
We sold 454,129 and 580,280 vehicles in fiscal 2006 and 2007 respectively, of which 403,906 and 526,806 vehicles were sold in India. In addition, TDCV sold 5,734 vehicles in fiscal 2006 compared to 8,588 vehicles in fiscal 2007. Hispano sold 560 vehicles in fiscal 2007. Our share in the Indian four-wheeler automotive vehicle market (i.e. automobile vehicles other than two and three wheeler categories) progressively increased from 26.8% in fiscal 2005 to 27.0% in fiscal 2006 and to 28.5% in fiscal 2007. The following table sets forth our market share in various categories in the Indian market:
A geographical breakdown of our revenues is set forth in Item 5.A “— Operating Results — Geographical breakdown”.
Category Fiscal 2005 Fiscal 2006 Fiscal 2007
Passenger Cars 17.7% 17.1% 16.5%Utility Vehicles 19.4% 19.5% 21.7%Light Commercial Vehicles 50.7% 60.2% 65.4%Medium and Heavy Commercial Vehicles 65.1% 62.0% 62.7%
Total Four - Wheel Vehicles 26.8% 27.0% 28.5%

10

We had approximately 33,900 permanent employees, including approximately 11,688 permanent employees at our consolidated subsidiaries, as of March 31, 2007.
The Indian Automotive Market India’s 50-year old automotive industry has a prominent place in the Indian economy. With its integral relationship to
several key segments of the Indian economy, the Indian automobile industry affects many other important sectors of the Indian economy and is one of the main drivers of India’s economic growth. The Indian auto industry is one of the largest industrial sectors in India, with a turnover that contributes to roughly 5% of India’s gross domestic product. The Indian automobile industry contributes nearly 17% to total indirect taxes and provides direct and indirect employment to over two million and ten million people respectively.
Until the mid – 1990’s, the auto sector in India had been a relatively protected industry with limits on the entry of foreign companies through import tariffs. Today, as part of a broader move to liberalize its economy, India has opened up the sector to foreign direct investments and has since progressively relaxed trade barriers. Since the liberalization of the Indian auto sector the industry has experienced rapid development. Today, India is the world’s second largest manufacturer of two wheelers, fifth largest manufacturer of commercial vehicles and the largest manufacturer of tractors in the world. India is also among a few countries in the world that have indigenously developed a passenger car.
The Society of Indian Automobile Manufacturers, or SIAM, currently represents 38 leading vehicle and vehicular engine manufacturers. India’s auto market is one of the most competitive among the global markets, as comparatively lower costs have made it an attractive assembly ground for overseas manufacturers.
During fiscal 2007, the Indian automobile industry production grew by 13.6% to nearly 11 million vehicles. Of these, nearly 76% were two wheelers and over 5% were three wheelers. 1.5 million passenger vehicles, utility vehicles and multi purpose vans were produced in fiscal 2007, representing 14% of vehicles produced. In addition, nearly 0.5 million commercial vehicles were manufactured, constituting 4.7% of total vehicle production. Presently, car penetration in India is low at 7 cars per 1,000 persons, and that number is expected to increase in coming years.
During fiscal 2007, nearly 10 million automobiles were sold in India, an increase of 13.5% over the previous fiscal year, and 1 million automobiles were exported from India, an increase of 25.4% over the previous fiscal. The growth rate of the Indian automotive industry in terms of sales volume increased from 12.8% in fiscal 2006 to 21.4% in fiscal 2007. In fiscal 2007, the industry continued to experience rising input costs and retail incentives, which in turn put pressure on margins.
Domestic passenger vehicle sales reached an all time high of nearly 1.38 million units during fiscal 2007, with a growth of about 20.7% after the modest growth rate of 7.7% in the previous fiscal year. The segment was favorably impacted by a reduction of the excise duty on small cars in March 2006 (from 24% to 16% for cars of up to 4 meters in length and with engine displacement of less than 1200cc for gasoline and 1500cc for diesel engines) and increased consumer spending. Total passenger car exports of over 198,000 units were also at an all – time high with a growth rate of 13% over the previous fiscal year.
Domestic commercial vehicle sales also reached an all-time high of over 0.46 million units during fiscal 2007, representing a growth rate of 33% from fiscal 2006. This growth was attributable to increased industrial activity and continued investment in road infrastructure. Inflationary concerns during the year prompted an increase in interest rates, which adversely affected commercial vehicle sales since the third quarter of fiscal 2007.
Our Strategy We believe that we have established a strong position in the Indian automobile industry by launching new products, high
quality—low cost manufacturing, investing in research and development and maintaining our financial strength. We have also benefited from the expansion of our manufacturing and distribution network and creation of a highly talented workforce. Our goal is to continue to strengthen our position in the domestic market, maintain our operational excellence and grow our international business in select countries through organic as well as inorganic means. Our strategy to achieve these goals consists of the following elements:
Leveraging our capabilities: We have an extensive range of products in commercial vehicles (for both goods and passenger transport) as well as passenger vehicles. We have plans to leverage this broad product base further with our strong brand recognition in India, our superior understanding of local consumer preferences, well developed in-house engineering capabilities and extensive distribution network.
We believe that our in-house product development capability, our subsidiary TDCV in South Korea, our association with Hispano in Spain, our joint ventures with Marcopolo of Brazil in India and with Thonburi in Thailand and our relationship with Fiat will enable us to expand our product range and extend our geographical reach. For example, in fiscal 2006, we introduced the Tata Ace, a four wheeler mini-truck with a 0.7 ton payload that has created a new category in the Indian commercial vehicle market. We are currently developing a new truck platform.

11

In passenger vehicles, we entered the compact car segment with the Tata Indica in 1998. On the same platform, we developed a sedan version, the Tata Indigo, which was launched in 2002. We also launched an estate version in 2004. In 2006, we expanded the Tata Indigo range by launching the Tata Indigo XL—the country’s first stretched sedan concept. We are also developing a low cost car for the Indian market, as we believe that there will be a significant demand for such a passenger vehicle.
We are expanding our existing manufacturing facilities and are also establishing new manufacturing facilities to meet the growing demand for our products. We have signed an agreement with Fiat S.p.A., Italy, for the formation of a joint venture in Maharashtra, India, to produce cars as well as engines and transmissions for both Fiat and ourselves. We are also currently expanding the reach of our sales and service network.
Mitigating cyclicality: The automobile industry is impacted by cyclicality which is more pronounced in the medium and heavy truck business in the commercial vehicle category. To mitigate the impact of cyclicality, we plan to continue to strengthen our operations in the light commercial vehicle, bus and passenger car categories. We also plan to continue to strengthen our non-vehicle business, such as spare part sales, annual maintenance contracts, sales of aggregates for non-vehicle businesses, reconditioning of aggregates, sale of castings, forgings, production aids and tooling and fixtures to reduce the impact of cyclicality.
Expanding our international business: We believe that expanding our operations into other select geographic areas, both through organic and inorganic means, may also reduce the impact of cyclicality in the Indian market as the cyclicality of these markets may not coincide with the cyclicality of the Indian market. This strategy also provides us an opportunity to grow in markets with similar characteristics to the Indian market. Our international business strategy has already resulted in the continuous growth of our international operations over the previous three fiscal years. For example, in South Africa, within three years of a focused entry, we became the third largest seller in the commercial vehicle category.
Reducing costs and breakeven points: While expanding our business, we plan to continue to sustain and enhance our cost advantage. Since fiscal 2001, we have made significant reductions in our cost base which has had an impact on our results of operations and contributed to our return to profitability in the previous five fiscal years. We are working with Ariba Inc for e-sourcing and reverse auctions. We initiated the second phase of our cost reduction program in fiscal 2006, which we expect to complete over a period of three years. We continue to place an emphasis on the reduction of material costs, production costs, overheads and other general costs, by pursuing value engineering and manufacturing cycle time reduction and stringent working capital control. We plan to continue to adopt international and local operational and management best practices to achieve continued cost reductions and management efficiencies. We believe that productivity improvements and operational efficiencies will help us to lower our break-even levels and thus improve our results of operations.
Continuing focus on high quality and enhancing customer satisfaction: One of our principal goals is to achieve international quality standards for our products and services and we are pursuing various quality improvement programs, both internally and at our suppliers’ premises.
Our extensive sales and service network has also enabled us to provide quality and timely customer service. We are deploying a Siebel based customer relationship management system across our sales and service network and we expect to improve our responsiveness to market and customer service needs. Our combined online Customer Relationship Management – Dealer Management initiative, which has been implemented in phases since 2003, now supports over 15,000 users within our company and among our distributors in India and abroad.
Enhancing capabilities through the adoption of superior processes: Tata Sons Limited, or Tata Sons, and the entities promoted by Tata Sons, including us, aim at improving the quality of life through leadership in various sectors of national economic significance. In pursuit of this goal, Tata Sons and the Tata Sons promoted entities have institutionalized an approach, called the Tata Business Excellence Model or TBEM, which has been formulated on the lines of the Malcolm Baldridge National Quality Award to enable it to drive performance and attain higher levels of efficiency both in its businesses and in discharging its social responsibility. The model aims to nurture core values and concepts embodied in various focus areas such as leadership, strategic planning, customers, markets and human resources to be translated to operational performance. Our adoption and implementation of this model seeks to ensure that our business can be conducted through superior processes in the future. We have deployed a balance score card (BSC) management system, developed by Drs. Robert Kaplan, of the Harvard Business School and David Norton for measurement based management and feedback. We have also deployed a new product introduction (NPI) process for systematic product development and product lifecycle management system for effective product data management across our organization. On the human resources front, we have adopted various processes to enhance the skills and competencies of our employees. We have also enhanced our performance management system, with appropriate mechanisms to recognize talent and sustain our leadership base. We believe these will enhance our way of doing business, given the dynamic and demanding global business environment.
Customer financing: With financing increasingly becoming a critical factor in vehicle purchases and the rising aspirations of consumers in India, we intend to significantly expand our vehicle financing activities to enhance our vehicle sales. Our subsidiary TML Financial Services Ltd., or TMFL, now known as Tata Motors Finance Ltd., will lead our financing operations.

Continuing to invest in technology and technical skills: We believe we are one of the most technologically advanced indigenous vehicle manufacturers in India. Over the years, we have enhanced our technological strengths through extensive internal research and development activities as well as through the assistance of foreign research consultants from time to time. Our research and development resources, which include those at our subsidiaries, like TMETC, TDCV, TTL and Hispano Carrocera, further increase our capabilities in product design, manufacturing and quality control. We consider technological leadership to be a significant factor in continued success, and therefore intend to continue to devote significant resources to upgrade our technological base.
12

Maintaining financial strength: We have generated substantial cash flows since fiscal 2002 as a result of substantial volume growth, cost reduction and prudent working capital management. We have embarked on economic value addition measurement, and driven project evaluation and capital investments aiming to ensure that we will be able to recover portions of our cost of capital in the event of an economic downturn and to generate earnings in excess of our cost of capital during periods of economic growth.
Leveraging unified Tata brand equity: We recognize the need for enhancing our brand recognition in highly competitive markets in which we compete with internationally recognized brands. We believe the Tata brand name is associated by Indian customers with reliability, trust and value. The Tata brand is used and its benefits are leveraged by Tata companies to their mutual advantage. We, along with Tata Sons and other Tata companies, will continue to promote the Tata brand and leverage its use in India, as well as in various international markets where we plan to increase our presence.
Automotive Operations The revenues from our automotive operations were Rs.224,753 million and Rs.307,113 million in fiscal 2006 and 2007,
respectively. Our main market is the Indian market, which accounted for approximately 82.4% and 80.7% of our total revenues and 87.9% and 89.4% of our unit sales in fiscal 2006 and 2007, respectively.
Our total sales (including international business sales) for fiscal 2005, 2006 and 2007 are set forth in the table below:
Note:1. The table does not include the sale of 209 units and 1,328 units of Fiat vehicles during fiscal 2006 and 2007, respectively
Our performance in various categories of the Indian market is described below: Passenger cars: The small car category, which consists of mini and compact cars, constitutes nearly 60% of total domestic
passenger car sales. In fiscal 2007, the small car category grew by nearly 26% to 832,000 vehicles and had 10 competing models. The Tata Indica, which competes in this category, posted a 30% growth in sales to 144,690 units in fiscal 2007, which was the highest sales for any small car model during any year in the domestic market. The launch of new turbo-diesel and 1.2 litre gasoline versions of the Tata Indica in the latter half of fiscal 2006 helped us to grow our presence appreciably in the gasoline engine segment and defend our diesel segment leadership despite new offerings from our competitors. The new 1.2 litre gasoline version of the Indica range is eligible for excise duty concessions under the Government’s small car definition. The Tata Indica increased its market share from 16.9% in fiscal 2006 to 17.4% in fiscal 2007 in the small car category.
We are also present in the entry mid-size car category through our sedan, the Tata Indigo, and its station wagon version, the Tata Indigo Marina, which are both derived from the Indica platform. The entry mid-size car category continued to decline for the second year, posting a decline of 27% in fiscal 2007 compared to fiscal 2006. With sales of 34,310 vehicles, the Tata Indigo range continued to be the best seller in the entry mid-size car category with a 38% market share in fiscal 2007. During fiscal 2007, we introduced a new 1.4 litre, 101 horse power gasoline engine and a 70 horse power common rail diesel (DICOR family) engine on the Indigo range as well as a facelift. We also expanded the Indigo range and opened a new niche by launching a long wheel base Indigo XL — a premium stretch sedan with high-end features previously available only in very premium executive cars which is price positioned in the upper mid-size category.
The company’s sales and market share were slightly adversely affected due to a fire in September 2006, in the paint shop of the car plant at Pune. Such fire disrupted manufacturing operations. The company sought to minimize loss of production by taking various remedial steps and operations were gradually restored during the year. The company is fully insured against the loss due to the fire.
We have also been distributing Fiat branded cars through the Tata-Fiat dealer network since March 2006. During fiscal 2007, we sold 1,328 Fiat cars through 44 joint dealerships. In December 2006, we signed an agreement with Fiat Auto S.p.A., Italy, for the formation of a joint venture at Ranjangaon in Maharashtra to produce cars as well as engines and transmissions for both Fiat and ourselves. The new plant is expected to have an annual capacity of 100,000 cars and 200,000 engines and transmissions. We also entered into an agreement with Fiat to enable Fiat to manufacture pick-ups at its Cordoba plant in Argentina from 2008 onward under license from us.
Utility Vehicles: The utility vehicle category constitutes 16% of the Indian passenger vehicle market and various new
Fiscal 2005 Fiscal 2006 Fiscal 2007 Category Units % Units % Units %
Passenger Cars 152,943 37.8% 169,101 36.7% 195,405 33.2%Utility Vehicles 37,032 9.2% 39,797 8.7% 49,308 8.4%Light Commercial Vehicles 74,253 18.4% 108,020 23.5% 149,242 25.4%Medium and Heavy Commercial Vehicles 139,876 34.6% 142,736 31.1% 194,145 33.0%
Total Sales 404,104 100% 459,654 100% 588,100 100.0%

utility vehicles were launched in India in this category in fiscal 2007. The utility vehicle category posted a 13.2% growth to over 220,000 units sold in the Indian domestic market during fiscal 2007. Sales of our utility vehicles — the Tata Safari and the Tata Sumo — grew by 26.3% to 47,892 units in fiscal 2007 compared to fiscal 2006. Tata Safari sales grew by 237% over last year, reaching a record high of 15,816 units in fiscal 2007, based on price re-positioning of the range effected mainly through a focused cost reduction effort on the platform. We increased our overall market share in the utility vehicle category to 21.7% in fiscal 2007 from 19.5% in fiscal 2006.
Light Commercial Vehicles (including pick-ups): Our range of LCVs includes small commercial vehicles, pick-ups, trucks and buses up to 7.5 GVW. In the LCV segment, we recorded a 45.8% growth in sales and increased our market share by 5.3 percentage points to 65.4% in fiscal 2007. The overall growth in the LCV market was mainly due to sales of our mini truck, the Tata Ace. We rolled out the 100,000th Tata Ace in a record time of 22 months since its launch in May 2005. The Tata Ace also won the Business World – Marico’s “Business Innovation 2006” award.
13

Medium and Heavy Commercial Vehicles: Our M&HCVs have a wide range of applications and are generally configured as trucks, tippers, buses, tankers, tractors or concrete mixers. We outperformed the industry and strengthened our market leadership in fiscal 2007 with a 39% growth in domestic commercial vehicle sales as compared to fiscal 2006, reaching an all-time high of 298,586 units sold. In the M&HCV segment, we recorded a 34.4% growth in sales and increased our market share by 0.7 percentage points to 62.7% in fiscal 2007. The overall growth in the M&HCV market was mainly due to a growing shift towards higher tonnage vehicles like haulage tractors and multi axle vehicles and our buses and coaches finding greater acceptance. We also launched Bharat Stage III compliant (equivalent to Euro III norms) vehicles in the M&HCV category.
In the bus market, we launched a rear-engine, ultra-low floor bus, which was popular among our customers for ease of entry, ride comfort and attractive styling, as well as a high-capacity bus, which is designed to meet the transportation needs of densely populated Indian cities.
Sales and Distribution of Vehicles: Our sales and distribution network in India as of June 2007 is comprised of 1,200 sales outlets for our passenger and
commercial vehicles business. They are managed through our eight regional offices, 24 area offices and 19 regional sales offices. Most of our sales outlets are exclusive sales outlets. We have a presence at over 2,000 customer service outlets in India, including after sales outlets. We are in the process of deploying a Siebel customer relation management system at all of our dealerships and offices across the country, which is one of the largest deployments of that system in the Indian automotive sector. Being implemented in phases since 2003, the combined online Customer Relationship Management – Dealer Management initiative now supports over 15,000 users, within the Company and among our distributors in India and abroad. We believe that this will give us a significant advantage over our competitors.
We also provide financing services to our purchasers through our dealers, who act as our agents, and through our branch network. For fiscal 2006 and 2007, approximately 24% and 31%, respectively, of our vehicle unit sales in India, were made through financing arrangements where our vehicles financing divisions provided the credit. Total vehicle finance receivables outstanding as at March 31, 2006 and 2007 amounted to Rs.48,464 million and Rs.83,588 million, respectively.
We use a network of service centers on highways and a toll-free customer assistance center to provide 24-hour on-road maintenance (including replacement of parts) to vehicle owners. We believe that the reach of our sales, service and maintenance network provides us with a significant advantage over our competitors.
Competition: We face competition from various domestic and foreign automotive manufacturers in the Indian automotive market. Many
foreign automotive manufacturers have increased or are expected to increase their participation in the Indian market through technology transfers, joint ventures or subsidiaries.
We have designed our products to suit the specific requirements of the Indian market based on specific customer needs such as safety, driving comfort, fuel efficiency and durability. We believe that our vehicles are suited to the general conditions of Indian roads, local climate and they comply with applicable environmental regulations currently in effect. We also offer a wide range of optional configurations to meet the specific needs of our customers. We intend to revamp our product portfolio in order to meet the increasing customer expectation of owning “world class” products.
Seasonality: Demand for our vehicles in the Indian market is subject to seasonal variations. Demand generally peaks between January
and March, although there is a decrease in demand in February just before release of the Indian Fiscal Budget. Demand is usually lean from April to July and picks up again in the festival season from September onwards with a decline in December due to year end.
International Business: We are expanding our international export operations, which have been ongoing since 1961. Our exports of vehicles
manufactured in India increased by 6.5% in fiscal 2007 to 53,474 units from 50,223 units exported in fiscal 2006. We market our commercial and passenger vehicles in several countries in Europe, Africa, the Middle East, Australia, South East Asia and South Asia.
In fiscal 2007, our top five export destinations accounted for approximately 65% and 87% of our exports of commercial vehicles and passenger vehicles respectively. South Africa remained our largest export destination for the commercial vehicles as well as passenger vehicles. Other key markets were the Middle East, western Africa, Turkey and western Europe. We are strengthening our position in the geographic areas we are currently operating in and exploring possibilities of entering new markets with similar market characteristics to the Indian market.
14

Tata Daewoo Commercial Vehicle Co. Ltd., Korea: TDCV recorded 49% growth in its overall vehicle sales to 8,588 units. In the domestic market TDCV registered a market share of 24% in HCV and 28% in MCV. TDCV exported 2,715 units during the year , representing a growth of 47%.
In the domestic market TDCV uses Daewoo Motor Sales Corporation’s distribution network, the largest in Korea. After-sales service is made available through 61 service centers and over 100 parts outlets. Exports are carried out through its own international distribution channel.
The management initiatives and business processes of Tata Sons and the Tata Sons promoted entities have also been implemented at TDCV. Relations between the management and the labor union of TDCV continue to be cordial.
Hispano Carrocera, S.A. Spain: We believe that our subsidiary Hispano, with its design and development capabilities in manufacturing bodies for high-end buses, will complement our current range of light and medium commercial passenger carriers. We believe that this investment will also help to increase our presence in the international bus market. We own the brand rights of Hispano. Hispano reported a record sale of 560 units in fiscal 2007.
Research and Development: Our research and development activities focus on product development, environmental technologies and vehicle safety
through our Engineering Research Centre, or ERC, established in 1966, which is one of the few government recognized in-house automotive research and development centers in India.
One of the most significant achievements of ERC has been the design and development of our compact car the Tata Indica, which is India’s only indigenously developed compact car. ERC also designed our mid-size car the Tata Indigo, which was launched in 2002 and has been the market leader in the entry mid-size market category in India.
At present, we are working on developing a truck, which we expect would open various international markets for us. Our acquisition of TDCV is expected to provide us significant advantage in its development process. On similar lines, in our passenger vehicle business, we are developing a low cost car for the Indian market. We believe that there will be significant demand for such a passenger vehicle.
In addition, our research and development activities also focus on developing vehicles running on alternative fuels, including CNG, liquefied petroleum gas, and bio-diesel. We currently have over 40 staff buses running on bio-diesel at one of our manufacturing plants. We are pursuing alternatives fuel options such as ethanol blending for our products and development of vehicles fuelled by hydrogen. Initiatives in the area of vehicle electronics such as engine management systems, in-vehicle network architecture, tele-matics for communication and tracking and other emerging technological areas are also being pursued which could be deployed on our future range of vehicles.
During fiscal 2006, we established our wholly-owned subsidiary, TMETC, in the United Kingdom to augment the abilities of our Engineering Research Centre. We believe that TMETC will provide us with access to leading-edge technologies and can support the product development activities which we currently plan to undertake for the future in order to sustain and enhance our position in the increasingly competitive global markets.
We are also widening the scope of our research and development activities from in-house product and technology development to managing the research and development process across various internal and external agencies, including our research and development centers in Korea, Spain and the United Kingdom, as well as at various aggregate parts suppliers and outsourcing partners.
We are the only automotive company in India which has a modern crash test facility for testing its new products for passenger safety. We also have a hemi-anechoic chamber testing facility for developing vehicles with lower noise and vibration levels and an engine emissions testing facility to develop products meeting international standards.
Our product design and development center is equipped with computer-aided design, manufacture and engineering tools, with sophisticated hardware, software, and other information technology infrastructure, designed to create a digital product development environment and virtual testing and validation, resulting in faster product development cycle-time and data management. Rapid prototype development systems, testing cycle simulators, advanced emission test laboratories and styling studios are also a part of our product development infrastructure and are regularly used in product development.
Over the years, we have devoted significant resources towards our research and development activities. Our total expenditure on research and development during fiscal years 2005, 2006 and 2007 was Rs.2,532 million, Rs.4,663 million and Rs.6,018 million respectively.
Intellectual Property

We have 122 trademarks registered in India and approximately 93 trademark applications which are currently pending registration. In addition to this, our significant trademarks are registered, or are in the process of being registered, in nearly 117 countries. We currently hold approximately 1030 of these registrations worldwide. The registrations mainly include trademarks for each of our vehicle models. Further, we also use the “Tata” brand, which has been licensed to us by Tata Sons Limited. See Item
15
4.C “— Organizational Structure “. As part of our acquisition of TDCV, we have the perpetual and exclusive use of the “Daewoo” brand and trademarks in Korea and overseas markets for the product range of TDCV. TDCV holds South Korean trademark registrations for 14 utility models and 5 designs.
India is a member of the World Trade Organization. In compliance with its obligations under the Agreement on Trade Related Aspects of Intellectual Property, or TRIPS, India grants statutory protection to various forms of intellectual property, including patents, copyrights, industrial designs and trademarks. The Trade Marks Act, 1999 and the Copyright Act, 1957, as amended, which are currently in force in India, are TRIPS compliant. The Patents Act, 2002, as amended, to the extent that it relates to our business and operations, provides adequate product and process patent protection in India in accordance with its obligations under TRIPS. The United States has placed India on its “priority watch list” under Section 301 of TRIPS for failing to provide adequate levels of protection for intellectual property rights. Although we have never experienced any material difficulties in protecting our brands and other intellectual property in India, the protection and enforcement of intellectual property rights in India has not been and may not be as effective as in the United States.
We currently own 16 patents and have 52 patent applications pending registration in India and one in the United Kingdom. These patents are mostly in relation to devices which enable efficient functioning, such as energy saving devices. Our most significant patent, which is currently in the process of being registered, is a portable device for measurement of head impact points in a vehicle. In addition, TDCV holds 11 patents in South Korea.
In addition to the above, we also have various copyright and Internet domain name registrations.
In varying degrees, all of our trademarks, brands or patents are important to us. In particular, the expiration or termination of the Tata brand could materially affect our business.
Components and Raw Materials The principal raw materials and components required by us for use in our vehicles are steel sheets and plates, castings,
forgings and items such as tyres, batteries, electrical items and rubber and plastic parts. The raw materials, components and consumables that are domestically sourced, include steel (sheet-metal, forgings and castings), tyres and tubes, batteries, fuel injection systems, air-oil filters, consumables (paints, oils, thinner, welding consumables, chemicals, adhesives and sealants) and fuels. We also require aggregates like axles, engines, gear boxes and cabs for our vehicles, which are manufactured either by ourselves or by our subsidiaries and affiliates.
We have recently undertaken an e-commerce initiative through the development of a business-to-business site with the assistance of our subsidiary, TTL, for electronic interchange of data with our suppliers. This has enabled us to have real time information exchange and processing to manage our supply chain effectively. We use external agencies as third party logistic providers. This has resulted in space and cost saving by transferring a part of our inventory to a third party.
As part of our strategy to become a low-cost vehicle manufacturer, we have undertaken various initiatives to reduce our fixed and variable costs including an e-sourcing initiative started in 2002 through which we procure some supplies through reverse auctions. We have established a procedure for ensuring quality control of outsourced components. Products purchased from approved sources undergo a supplier quality improvement process. We also have a program for assisting vendors from whom we purchase raw materials or components to maintain quality. Each vendor is reviewed on a quarterly basis on parameters of quality, cost and delivery. Preference is given to vendors with QS-9000 certification. We also maintain a stringent quality assurance program that includes random testing of production samples, frequent re-calibration of production equipment and analysis of post-production vehicle performance and ongoing dialogue with workers to reduce production errors. Further, in April 2003, we established a Strategic Sourcing Group to consolidate, strategize and monitor our supply chain activities with respect to major items of purchase as well as major inputs of technology and services. The Strategic Sourcing Group is responsible for recommending for the approval by the Management Committee the long-term strategy and purchase decision for these items, negotiation and relationship with vendors with regard to these items, formulating and overseeing our purchasing policies, norms in respect of all items, evolving guidelines for vendor quality improvement, vendor rating and performance monitoring and undertaking company-wide initiatives such as e-sourcing and supply chain management/policies with respect to vehicle spare parts. We are also exploring opportunities for global sourcing of parts and components from lower cost countries, and have embarked on a vendor management program that includes vendor base rationalization, vendor quality improvement and vendor satisfaction surveys.
Suppliers We have an extensive supply chain for procuring various components. We are also outsourcing many of the manufacturing
processes and activities to various suppliers. In such cases, we provide training to outside suppliers who design and manufacture the required tooling and fixtures.
Our subsidiary, Tata AutoComp Systems Ltd., or TACO, manufactures auto components and encourages the entry of internationally acclaimed auto component manufacturers into India by setting up joint ventures with them. Some of these joint

ventures include: Tata Johnson Controls Limited for seats, Knorr Bremse CV Systems for commercial vehicle air brakes, Tata Yazaki Autocomp Limited for wiring harnesses, JBM Sangwoo Limited for pressed components and Tata Toyo Radiators Limited for radiator assemblies. These joint ventures supply components for our products.
16

We have embarked upon a vendor management program that includes vendor base rationalization, vendor quality improvement and vendor satisfaction surveys. As part of driving continuous improvement in procurement, we have integrated our system for electronic interchange of data with our suppliers with the ERP. This has facilitated real time information exchange and processing to manage our supply chain more effectively.
We import some components that are either not available in the domestic market or when equivalent domestically-available components do not meet our quality standards. We also import products to take advantage of lower prices in foreign markets, such as special steels, wheel rims and power steering assemblies. The following table shows the imported and indigenous raw material and components consumed by us:
Capital and Product Development Expenditures: Our capital expenditure aggregated to Rs.9,163 million, Rs.10,734 million and Rs.25,277 million during fiscal 2005, 2006
and 2007, respectively. Our capital expenditure during the past three years has been related mostly to capacity expansion for new and existing products to meet the market demand and investments towards improving quality, reliability and productivity that are aimed at operational efficiency.
We intend to continue to invest in our business units and research and development over the next several years for improving our existing product range and developing new products and platforms to build and expand our presence in the passenger vehicle and commercial vehicle categories. We believe this would strengthen our position in India and help us to grow our presence in the select international markets.
As a part of this future growth strategy, we plan to spend around Rs.120 billion in the next three to four fiscal years toward product development, capital expenditure in capacity enhancement, plant renewal and modernization and to pursue other growth opportunities. Our subsidiaries also have their separate growth plans and related capital expenditures. These expenditures are expected to be funded largely through cash generated from operations, existing investible surplus in the form of cash and cash equivalents, investment securities and other external financing sources. In fiscal 2006, we obtained a resolution from our shareholders permitting the Board to raise a maximum of Rs.30 billion in equity or equity-related instruments to fund capital expenditure. In fiscal 2007, we obtained our shareholders’ consent to a resolution to increase our borrowing limit from Rs.75 billion to Rs.120 billion.
Other Operations In addition to our automotive operations, we are also involved in various other business activities, of which information
technology services and construction equipment manufacturing are the main activities. Net revenues from these activities totaled to Rs.18,061 million and Rs.27,017 million in fiscal 2006 and 2007, respectively, representing nearly 7.4% and 8.1% of our total revenues, before inter segment elimination in these fiscal years.
Information Technology Services: Tata Technologies Limited, or TTL, is our 85.92% owned subsidiary as of March 31, 2007. Through its operating
companies, INCAT and Tata Technologies iKS, TTL provides specialized engineering and design services, product lifecycle management and product-centric IT services to leading manufacturers. It responds to customers’ needs through its subsidiary companies in three continents and through its development centers in India and Thailand. Its customers include automobile, aerospace and consumer durable manufacturers.
INCAT, founded in 1989 and acquired by Tata Technologies in October 2005, is a leading independent provider of engineering and design services, product and information lifecycle management, enterprise solutions and plant automation. INCAT’s services include product design, analysis and production engineering, Knowledge Based Engineering, PLM, Enterprise Resource Planning and Customer Relationship Management systems. INCAT also distributes, implements and supports PLM products from leading solution providers in the world such as Dassault Systèms, UGS and Autodesk. With a combined global work force of more than 3,000 employees, INCAT has operations in the United States (Novi, Michigan), Germany (Stuttgart) and India (Pune).
17
Value of Raw Material and Components Consumption
For the Fiscal Year Ended March 31, 2005 2006 2007Description Rs Millions % Rs millions % Rs millions %
Imported (at rupee cost) 7,268 5.7 11,418 7.6 14,769 7.1Indigenously obtained 120,179 94.3 138,682 92.4 192,756 92.9
Total 127,477 100.0 150,100 100.0 207,525 100.0

Tata Technologies iKS is a global leader in engineering knowledge transformation technology. For over 15 years, iKS has enabled engineering knowledge transformation through ‘i get it’, the only web application in the world offering 100,000 hours of engineering knowledge for AutoCAD, INVENTOR, Solid Works, Solid Edge, UG/NX, Teamcenter, COSMOS Works and CATIA on a single delivery platform application. Recently this company’s offerings have been re-branded and strategically repositioned to focus exclusively on executing a software as a service, or SaaS, business model for “ i.get.it”, a comprehensive online engineering learning application.
TTL had 17 subsidiary companies as at March 31, 2007 of which three were under liquidation in fiscal 2007 and of which two have since been liquidated. We undertake such restructuring initiatives to achieve operating and tax efficiencies by sharpening our business focus, assigning territorial responsibility for top and bottom line growth and establishing a global delivery centre supporting the overall business.
The consolidated revenue of the TTL Group was Rs.8,107 million in fiscal 2007, an increase of 97% as compared to Rs.4,110 million in the previous fiscal year due to augmented relationships with existing global automotive and aerospace customers and the acquisition of new customers.
Construction Equipment: Telco Construction Equipment Company Limited, or Telcon, is engaged in the business of manufacturing and sale of
construction equipment and providing related supporting services. We own 60% of Telcon, with the remaining 40% being held by Hitachi Construction Machinery Company Limited, Japan. With the increase in economic activity especially in the infrastructure sector, Telcon recorded its best performance to date having sold 5,360 machines in fiscal 2007 compared to 3,674 machines in fiscal 2006, with a net revenue of Rs.16,057.7 million in fiscal 2007 compared to Rs.11,483.5 in fiscal 2006, a profit after tax of Rs.1,771.8 million in fiscal 2007 compared to Rs.755.9 million in fiscal 2006 (representing an increase of 134%).
Government Regulations Emission and Safety:
In 1992, the government of India issued emission and safety standards, which were further tightened in April 1996 under the Indian Motor Vehicle Act. Currently Bharat Stage III norms (equivalent to Euro III norms) are in force for four wheelers in 11 cities in India and Bharat Stage II norms (equivalent to Euro II norms) are in force in rest of India. Our vehicles comply with these norms. The next change in emission regulations is currently expected to be implemented by fiscal 2010, when the 11 major cities currently subject to Bharat Stage III norms are expected to move to Bharat Stage IV norms (equivalent to Euro IV norms) and the rest of India to Bharat Stage III norms.
The vehicles manufactured by TDCV comply with the emission regulatory requirements in South Korea and also of countries where its vehicles are exported. Our vehicle exports to Europe comply with Euro IV norms, and we believe our vehicles also comply with the various safety regulations in effect in the other international markets we operate in. We are also working on meeting all the regulations which we believe are likely to come into force in various markets in future.
The Indian automobile industry is progressively harmonizing its safety regulations with international standards in order to facilitate sustained growth of the Indian automobile industry as well as to make India a large exporter of automobiles.
India has a well established regulatory framework administered by the Indian Ministry of Shipping, Road Transport and Highways. The ministry issues notifications under the Central Motor Vehicles Rules and the Motor Vehicles Act. Chapter V of the Central Motor Vehicles Rules, 1989 deals with construction, equipment and maintenance of vehicles. Vehicles being manufactured in the country have to comply with relevant Indian standards and automotive industry standards. The Indian Ministry of Shipping, Road Transport and Highways finalized a road map on automobile safety standards in January 2002. The road map is based on current traffic conditions, traffic density, driving habits and road user behavior in India and is generally aimed at increasing safety requirements for vehicles under consideration for Indian markets.
Our manufacturing plants have received the Indian government’s environmental clearances required for our operations. We are fully committed to our role as a responsible corporate citizen with respect to reducing environmental pollution. We treat the effluents at our plants and have made significant investments in lowering the emissions from our products.
18

Excise Duty: In the Indian Union Budget for fiscal 2007, the Government of India has reduced the Excise duty on small cars from 24%
to 16%. Small car are defined to mean cars of length not exceeding 4,000 mm and with an engine capacity not exceeding 1,500 cc for cars with diesel engines and not exceeding 1,200 cc for cars with gasoline engines.
Import Regulations and Duties: Automobiles and automotive components can, generally, be imported into India without a license from the Indian
government subject to their meeting Indian standards and regulations as specified by designated testing agencies. Recent government liberalization policies have led to a reduction in import duties on vehicles and certain automotive parts.
Valued Added Tax: Value Added Tax (VAT) was implemented throughout India, with the exception of a few states, on April 1, 2005. VAT
enables set-off from sales tax paid on inputs by traders and manufacturers against the sales tax collected by them on behalf of the government, thereby eliminating the cascading effect of taxation. Two main brackets of 4% and 12.5%, along with special brackets of 0%, 1% and 20%, have been announced for various categories of goods and commodities sold in the country. Central Sales Tax, however, continues to exist, although it is proposed to be abolished in a phased manner. Since its implementation, VAT has had a positive impact on us. Prior to the implementation of VAT, sales tax formed part of our total cost of material. However, following the implementation of VAT, because VAT paid on inputs can be set off against tax paid on outputs, a savings on our sales tax component results.
Insurance Coverage: The Indian insurance industry is predominantly state-owned and insurance tariffs are regulated by the Indian Insurance
Regulatory and Development Authority. We have insurance coverage which we consider reasonably sufficient to cover all normal risks associated with our operations and which we believe is in accordance with industry standards in India. We have obtained coverage for product liability for some of our vehicle models in several countries to which we export vehicles. TDCV has insurance coverage as is required and applicable to cover all normal risks in accordance with industry standards in South Korea, including product liability. We have also taken insurance coverage on directors and officers’ liability to minimize risks associated with product liability and international litigation.
Legal Proceedings In the normal course of business, we face claims and assertions by various parties. We assess such claims and assertions
and monitor the legal environment on an ongoing basis, with the assistance of external legal counsel wherever necessary. We record a liability for any claims where a potential loss is probable and capable of being estimated, and disclose such matters in our financial statements, if material. For potential losses which are considered reasonably possible, but not probable, we provide disclosure in the financial statements, but do not record a liability in our accounts unless the loss becomes probable. Certain claims that are above Rs. 50 million in value are described in Note 22 to our consolidated financial statements included in this annual report. In respect of claims against us below Rs. 50 million, the majority of cases pertain to motor accident claims (involving vehicles that were damaged in accidents while being transferred from our manufacturing plants to regional sales offices) and consumer complaints. Some of these cases relate to replacement of parts of vehicles and/or compensation for deficiency in the services by the Company or its dealers.
We believe that none of the contingencies, either individually or in the aggregate, would have a material adverse effect on the Company’s financial condition, results of operations or cash flows.
C. Organizational Structure. Tata Sons Limited , or Tata Sons, is a principal holding company that has equity holdings in a range of businesses. The
various companies promoted by Tata Sons, including us, are based substantially in India and had combined revenues of approximately US $ 29 billion for fiscal 2007.
The operations of Tata Sons promoted entities are highly diversified and can be categorized under seven business sectors, namely, engineering, materials, energy, chemicals, consumer products, services and communications and information systems. These companies do not constitute a ‘group’ under Indian Law.
Tata Sons has its origins in the trading business founded by Jamsetji Tata in 1874 that was developed and expanded in furtherance of his ideals by his two sons, Sir Dorabji Tata and Sir Ratan Tata, following their father’s death in 1904. The family interests subsequently vested largely in the Sir Ratan Tata Trust, the Sir Dorabji Tata Trust and other related trusts. These trusts were established for philanthropic and charitable purposes and together own a substantial majority of the shares of Tata Sons Limited.

By 1970, the operations of Tata Sons promoted entities had expanded to encompass a number of major industrial and commercial enterprises including The Indian Hotels Company Limited (1902), The Tata Steel Limited (Tata Steel) (1907), The Tata Power Company Limited (1910), Tata Chemicals Limited (1939), Tata Motors Limited (1945), Voltas Limited (1954), and Tata Tea Limited (1962). Tata Sons also promoted India’s first airline, Tata Airlines, which later became Air India (India’s national carrier), as well as India’s largest general insurance company, New India Assurance Company Limited, both of which were subsequently taken
19

over by the Government as part of the Government’s nationalization program. Tata Consultancy Services Limited (TCS) is Asia’s leading software services provider and the first Indian software firm to exceed sales of US$ 4 billion. In 1999, Tata Sons has also invested in several telephony and telecommunication ventures, including acquiring a portion of the Indian Government’s equity stake in the state owned Videsh Sanchar Nigam Limited (VSNL).
We have for many years been a licensed user of the “Tata” brand owned by Tata Sons Limited, and thus have both gained from the use of the Tata brand as well as helped to sustain its brand equity. Tata Sons along with the Tata Sons promoted entities instituted a new corporate identity program to re-position itself to compete in a global environment. A substantial ongoing investment is planned to develop and promote a strong, well-recognized and common brand equity, which is intended to represent for the consumer a level of quality, service and reliability associated with products and services offered by the Tata Sons promoted entities. To implement these plans, Tata Sons Limited has undertaken a program by which consenting the Tata Sons promoted entities are required to pay a subscription fee to participate in and gain from the new Tata brand identity. We believe that we benefit from the association with the new Tata Group identity and, accordingly, have agreed to pay an annual subscription fee to Tata Sons Limited from fiscal 1998 which is equal to 0.25% of our annual net income (defined as our net revenues exclusive of excise duties and other governmental taxes and non-operating income), provided that the subscription fee does not exceed 5% of our annual profit before tax (defined as our profit after interest and depreciation but before income tax). However, for the fiscal years ended March 31, 2005, 2006 and 2007, we paid an amount less than 0.25% of our annual net income, as described above, as mutually agreed between Tata Sons Limited and us. These calculations are made with reference to our non-consolidated Indian GAAP financial statements. Pursuant to our licensing agreement with Tata Sons Limited, we have also undertaken certain obligations for the promotion and protection of the new Tata brand identity licensed to us under the agreement. The agreement can be terminated by written agreement between the parties, by Tata Sons Limited upon our breach of the agreement and our failure to remedy the same, or by Tata Sons Limited upon providing six months notice for reasons to be recorded in writing. The agreement can also be terminated by Tata Sons Limited upon the occurrence of certain specified events, including liquidation. Because we are one of the largest companies promoted by Tata Sons and further because we believe that our growing international reputation brings benefits to the Tata brand, we consider it very unlikely that we would ever be unable to use the Tata brand in relation to our products and services.
The Tata Sons promoted entities have sought to continue to follow the ideals, values and principles of ethics, integrity and fair business practices originally established by the founder of Tata Sons, Mr Jamsetji Tata, and his successors. To further protect and enhance the Tata brand equity, these values and principles have been articulated in the Tata code of conduct, which has been adopted by most of the Tata companies that have access to the larger resources and services of the Tata Sons promoted entities. These companies have endeavored to maintain high standards of management efficiency and to promote the commercial success of Indian enterprises. The Tata Sons promoted entities have also made significant contributions towards national causes through promotion of public institutions in the field of science, such as the Indian Institute of Science and the Tata Institute of Fundamental Research, and in the field of social services through the Tata Institute of Social Sciences, the Tata Memorial Hospital and the National Center of the Performing Arts. Tata trusts are among the largest charitable foundations in the country.
A large number of the Tata Sons promoted entities hold shares in one another and some of our directors hold directorships on the boards of Tata Sons and/or Tata Sons promoted entities. However, there are no voting agreements, material supply or purchase agreements or any other relationships or agreements that have the effect of tying us together with other Tata Sons promoted entities at management, financial or operational levels. With the exception of Tata Steel Limited, which under our Articles of Association has the right to appoint one director to the Board, Tata Sons Limited and its subsidiaries do not have any special contractual or other power to appoint our directors or management beyond the voting power of their shareholdings in us. Except as set forth in the tables below under the heading “Subsidiaries and Affiliates” and except for an approximately 12.40% stake in Tata Industries Limited, our shareholdings in other the Tata Sons promoted entities are generally insignificant as a percentage of their respective outstanding shares or in terms of the amount of our investment or the market value of our shares of those companies.
Subsidiaries and Affiliates We have the following consolidated subsidiaries and equity method affiliates as of March 31, 2007.
Name of the Subsidiary Company Country of incorporation % of holding
1 Sheba Properties Ltd. India 100.002 Concorde Motors (India) Ltd. India 100.003 HV Axles Ltd. India 100.004 HV Transmissions Ltd. India 100.005 TAL Manufacturing Solutions Ltd. India 100.006 Tata Motors Insurance Services Ltd. India 100.00 7 Tata Daewoo Commercial Vehicle Co. Ltd. South Korea 100.008 Tata Motors European Technical Centre plc UK 100.009 Tata Technologies Ltd. and its 17 subsidiaries India1 85.922
10 Telco Construction Equipment Co. Ltd. India 60.0011 Tata AutoComp Systems Ltd. and its 8 subsidiaries India3 54.704

20
12
Tata Precision Industries Pte. Ltd., Singapore and its subsidiary
Singapore
51.07
13 TML Financial Services Ltd.5 India 100.0014 Tata Motors (Thailand) Ltd. Thailand 70.0015 Hispano Carrocera S.A. and its subsidiary6 Spain 21.00
1 The subsidiaries are based in many countries abroad. 2 The holdings in these subsidiaries range between 85.92 % to 86.03%, and three of the subsidiaries were under liquidation as at
March 31, 2007. Subsequently, two of these have been liquidated. 3 The subsidiaries are based in India, Mauritius, China and Germany. 4 The holdings in these subsidiaries range between 27.90 % to 54.71%.5 The name of the subsidiary has subsequently been changed to Tata Motors Finance Ltd.6 The subsidiary is based in Morocco.

Name of the Affiliate Company Country of incorporation % of holding
1 Tata Cummins Ltd. India 50.00 2 TSR Darashaw Ltd. India 26.003 Nita Co. Ltd. Bangladesh Bangladesh 40.004 Tata Securities Ltd. India 31.905 Affiliates of Tata AutoComp Systems Ltd. India 27.351
6 Telcon Ecoroad Resurfaces Pvt Ltd.2 India 21.607 Tata Marcopolo Motors Ltd. India 51.00
1 Except for an affiliate wherein the holding is 14.22%.
D. Property, Plants and Equipment. Facilities:
We currently operate four principal automotive manufacturing facilities. The first facility was established in 1945 at Jamshedpur in the State of Jharkhand in eastern India. We set up a second facility in 1966 (with production commencing in 1976) at Pune, in the State of Maharashtra in western India, and a third in 1985 (with production commencing in 1992) at Lucknow, in the State of Uttar Pradesh in northern India. During fiscal 2007, we commenced the construction of our fourth manufacturing plant in Uttarakhand and that has commenced operations in fiscal 2008. The Jamshedpur, Pune and Lucknow manufacturing facilities have been accredited with ISO/TS 16949:2000(E) certification. The passenger car business of Tata Motors has also received the Certificate of Approval for its quality management system for compliance with ISO/TS 16949:2002. We are in the process of setting up a plant in each of Singur in West Bengal and Dharwad in Karnataka. We have also set up research and development facilities in the United Kingdom.
Manufacturing facilities of TDCV are based in Gunsan, South Korea. TDCV has received the ISO/TS 16949 certification, an international quality systems specification given by SGS UK Ltd., an International Automotive Task Force (IATF) accredited certification body. It is the first Korean automobile original equipment manufacturer to be awarded the same. Manufacturing facilities of Tata AutoComp Systems Ltd. and its subsidiaries are located at various locations in and around the city of Pune in the State of Maharashtra in India and also in Germany. Manufacturing facilities of Telcon are located at Jamshedpur in the State of Jharkhand in eastern India and at Dharwad in the State of Karnataka in Southern India.
Installed Capacity: Our total vehicle production capacity in India as of March 31, 2007 determined on the basis of two production shifts per
day and including capacity for the manufacture of replacement parts, was 687,635 units annually. In addition, we also have vehicle production capacity of 20,000 units annually in South Korea.
The following table shows our installed capacity as of March 31, 2007, and production levels by plant and product type in fiscal 2005, 2006 and 2007:
21
2 Is an affiliate of Telco Construction Equipment Co. Ltd.
Fiscal Year ended March 31,
Installed Capacity(1)
Production (Units)
2005 2006 2007
Jamshedpur
Medium and Heavy Commercial Vehicles 96,000 71,023 69,891 98,227Construction Equipment 5,635 2,455 3,515 5,167Pune
Medium and Heavy Commercial Vehicles, Light Commercial Vehicles, Utility Vehicles, Passenger Cars 556,000 311,269 366,468 458,324Lucknow
Medium and Heavy Commercial Vehicles, Light Commercial Vehicles, Utility Vehicles 30,000 18,649 19,963 28,235Republic of Korea
Gunsan Medium & Heavy Commercial Vehicles 20,000 4,567 5,663 8,543
(1) On double shift basis including capacity for manufacture of replacement parts as of March 31, 2007.

Properties: We, along with our consolidated subsidiaries, produce vehicles and related components and carry out other businesses
through various manufacturing facilities. In addition to our manufacturing facilities, our properties include sales offices and other sales facilities in major cities, repair service facilities, and research and development facilities.
The following table sets forth information, with respect to our principal facilities, a substantial portion of which are owned by us or our consolidated subsidiaries as of March 31, 2007. The remaining facilities are on leased premises.
Substantially all of our owned properties are subject to mortgages in favor of secured lenders and debenture trustees for the benefit of secured debenture holders. A significant portion of our property, plant and equipment is pledged as collateral securing indebtedness incurred by us. We believe that there are no material environmental issues that may affect our utilization of these assets.
Location Facility or Subsidiary Name Principal Products or Functions
India
In the State of Maharashtra Pune (Pimpri, Chinchwad, Chikhali, Maval) Tata Motors Ltd. Factory/residentialPune (Chinchwad)
TAL Manufacturing Solutions Ltd
Factory automation equipment and services
Pune (Hinjewadi) Tata Technologies Limited Software consultancy and servicesMumbai Concorde Motors (India) Limited Automobile sales & servicePune (Damle Path, Hinjewadi, Bhosari, Chakan and Pirangut)
Tata AutoComp Systems Limited and its subsidiaries
Auto components and engineering design
In the State of Jharkhand
Jamshedpur Tata Motors Ltd. Factory/residentialJamshedpur HV Axles Ltd. Axles for M&HCVsJamshedpur HV Transmissions Ltd. Transmissions for M&HCVsJamshedpur
Telco Construction Equipment Company Limited
Construction equipment
In the State of Uttar Pradesh Lucknow Tata Motors Ltd. Factory
In the State of Karnataka
Dharwad
Telco Construction Equipment Company Limited
Construction equipment
Tata Motors Limited Spare parts and warehousingBangalore Concorde Motors (India) Ltd. Automobile sales and service
In the State of Uttaranchal Pantnagar Tata Motors Limited Factory
In the State of West Bengal
Singur Tata Motors Ltd. Small car
Rest of India
Gujarat (Halol, Village Khakharia)
Tata AutoComp Systems Limited and its Subsidiaries
Auto components and engineering design
Hyderabad & Chennai Concorde Motors (India) Ltd. Automobile sales and serviceVarious other properties in India Tata AutoComp Systems Ltd. Auto components
Tata Motors Limited
Vehicle financing business (office/ residential)
Outside India
Singapore
Tata Precision Industries Pte. Ltd. / Tata Engineering Services Pte. Ltd.
Precision equipment and computer and peripherals warehousing
Republic of Korea
Tata Daewoo Commercial Vehicle Co. Ltd.
Factory and residential apartments
Thailand
Tata Motors (Thailand) Ltd.Incat (Thailand) Ltd.
Pick-up trucks & Sprint Software consultancy and services
United Kingdom Tata Motors European Technical Centre Software consultancy and servicesSpain Hispano Carrocera S.A. Buses and bus body
Rest of the world INCAT Group of Companies Software consultancy and services

We consider all our principal manufacturing facilities and other significant properties to be in good condition and adequate to meet the needs of our operations.
22

None.
You should read the following discussion of our financial condition and results of operations together with our consolidated financial statements prepared in conformity with US GAAP and information included in this annual report. This discussion and analysis contains forward-looking statements that involve risks, uncertainties and assumptions. Our actual results may differ materially from those anticipated in these forward-looking statements as a result of various factors including, but not limited to, those set forth in Item 3.D and elsewhere in this annual report.
A. Operating Results. Overview
In fiscal 2007, total gross revenues including finance revenues increased by 36.8% to Rs.377,753 million from Rs.276,080 million in fiscal 2006. We recorded a net income of Rs.18,112 million in fiscal 2007, an increase of 20.7% compared to Rs.15,011 million in fiscal 2006.
Automotive operations. Automotive operations is our most significant segment, accounting for 91.9% and 92.6%, respectively, of our total
revenues before inter-segment eliminations and 89.5% and 94.7%, respectively, of our operating income before inter-segment eliminations for fiscal 2007 and 2006. India is the most significant market for us, accounting for 89.4% and 87.9% of vehicle unit sales for fiscal 2007 and 2006, respectively, though we continue to focus on increasing the importance of our international operations.
Our revenues from automotive operations increased 36.6% to Rs.307,113 million in fiscal 2007 compared to Rs.224,753 million in fiscal 2006, representing 91.9% and 92.6% of our total revenue before inter-segment eliminations in fiscal 2007 and 2006, respectively.
Our automotive operations includes :
The leading drivers of automotive business in India include GDP growth, industrial and infrastructure growth, increase in urbanization and personal disposable incomes. GDP growth, led by growth in industrial and agricultural sectors, is a key to freight generation in the economy, which in turn drives the demand for the commercial vehicles, especially the goods carriers. Also, the ongoing road development programs in India, such as golden quadrilateral and the cross country road corridors, which are designed to connect not only the major cities of the country, but also the rural and interior parts of the country, are expected to improve the efficiency of both goods and passenger movement across the country through improved turnaround time, better fuel efficiency and better logistic solutions. Also, the road development programs are expected to lead to a hub and spoke model of distribution, which in turn is expected to result in a structural shift in the commercial vehicle industry by moving the demand towards heavy and light commercial vehicles which cater to long-haul and end destination distribution respectively.
Government regulations relating to emission norms, safety standards, scrapping of vehicles beyond a specified age, overloading and private participation in passenger transport and other areas impact the demand for commercial vehicles in the country.
Our presence across the major four wheel auto product categories, our low cost manufacturing capabilities and our expansive distribution and service network facilitate our market leadership in the auto industry in the country. Also, we are working towards the development of new products, in all segments of commercial vehicles and development of new platforms to replace our current compact car, mid size car and utility vehicle platforms to compete effectively in the challenging competitive environment. The distribution of the Tata ACE, which has created a niche for itself in the below-1 ton category of the commercial vehicle industry since the launch in May 2005, was extended across the country during fiscal 2007. The successful introduction of such products has helped us to become the market leader in the LCV category in India.
Item 4A. Unresolved Staff Comments.
Item 5. Operating and Financial Review and Prospects.
• All activities relating to development, design, manufacture, assembly and sale of M&HCVs, LCVs, passenger cars
and utility vehicles as well as related spare parts and accessories,
• Automotive component business, both captive and non-captive,
• Distribution and service of vehicles, and • Financing of our vehicles.

Our subsidiary, TDCV, is not only helping us strengthen our position in the international markets but is also improving our technological capability in design and development of new products in commercial vehicle category. Further, the launch of MCVs in
23

the Korean market by TDCV has helped us to further consolidate our position in the domestic Korean market. Our joint venture with Marcopolo in Brazil, which we announced in May 2006, and our 21% stake in Hispano are expected to enhance our leadership position in the bus market through better technological capabilities in bus body building. Our proposed joint venture with Fiat to manufacture passenger cars, engines and transmissions would provide us with access to world class car engine technology and is expected to help us to further strengthen our position in the passenger vehicle category. Further, TMETC provides us with design engineering support and development services, complementing and strengthening our skill sets.
Capacity utilization of our automotive facilities in India increased marginally from 85.2% in fiscal 2006 to 85.7% in fiscal 2007. However, consequent to the increase of capacity utilization levels at TDCV from 28.3% in fiscal 2006 to 42.7% in fiscal 2007, the capacity utilisation of our total automotive operations, including TDCV operations, increased to 84.5% in fiscal 2007 from 83.2% in fiscal 2006.
Our vehicle sales (including TDCV, Fiat and, with respect to fiscal 2007 only, Hispano) increased 28.2% to 589,428 units in fiscal 2007 from 459,863 units in fiscal 2006. In fiscal 2007, our market share of all four-wheel vehicles sold in India increased marginally to 28.5% from 27% in fiscal 2006. During fiscal 2007, nearly 10 million automobiles were sold in India, an increase of 13.5% over the previous fiscal year, and 1 million automobiles were exported from India, an increase of 25.4% over the previous fiscal year. The Indian automotive industry, after experiencing a slowdown in growth rate in fiscal 2006, bounced back in fiscal 2007 with a growth of 21.4% to post strong volumes in all segments.
Our overall sales in international markets (including TDCV and Hispano sales) increased 11.9% to 62,622 units in fiscal 2007 as compared to 55,957 units in fiscal 2006. This was driven by sustained efforts towards a focused entry in to new export markets and also strengthening of our presence in existing markets. Key export markets for our automotive operations were south Africa, west Asia, Europe and south-east Asia.
The auto-component business, which caters to both captive and external demand is expected to benefit from the growth in the automobile business in the country. Our key auto component subsidiaries, HV Axles Ltd, HV Transmission Limited and TACO, are expected to improve their revenues and profitability through internal growth, and we may consider opportunities to grow through mergers and acquisitions.
Tata Motors Finance Limited, or TMFL, was incorporated on June 1, 2006 as a wholly-owned subsidiary to support our vehicle financing and related activities. We seek to offer complete vehicle financing solutions in line with global best practices in the auto industry and we believe this business will provide a hedge against the cyclicality of the automotive business in India.
Interest rate movements in the economy have a significant impact on vehicle financing operations. Despite an increase in interest rates during the latter half of fiscal 2007, our vehicle-financing registered a strong growth on the back of an increased focus in the business and strong vehicle demand during the fiscal year.
Other Operations. Our revenue from other operations was Rs.27,017 million in fiscal 2007, an increase of, 49.6% from Rs.18,061 million in
fiscal 2006. These revenues represent 8.1% and 7.4% of our total revenues, before inter-segment eliminations, in fiscal 2007 and 2006, respectively.
Geographical breakdown. On a geographical basis, revenues from sales in India increased by 34.9% to Rs.267,419 million in fiscal 2007 from
Rs.198,172 million in fiscal 2006.
Our share of revenues earned from outside India has increased steadily over the last five years from 5.4% in fiscal 2003 to 19.3% in fiscal 2007, mainly as a result of our strategy to increase exports of our vehicles to new and existing markets in significant numbers and improved performance of our subsidiary in South Korea, TDCV. Successful operations of INCAT and its subsidiaries following acquisition by TTL also facilitated a significant increase in our sales to international market.
The following table sets forth our revenue from our Indian and international operations:
The revenue from our exports has been steadily increasing in the last three years as our products are increasingly finding acceptance in key markets such as South Africa, Turkey, Sri Lanka and Russia. We have been pursuing growth in various geographic
Fiscal 2005 Fiscal 2006 Fiscal 2007 Revenue Rs in million Percentage Rs in million Percentage Rs in million Percentage
Within India 170,883 86.1% 198,172 82.4% 267,419 80.7%Outside India 27,504 13.9% 42,443 17.6% 64,106 19.3%
Total 198,387 240,615 331,525

areas through organic and inorganic means in our automotive and other business operations.
Vehicles manufactured by us, in India almost exclusively use components produced in India. Many of these components, including engines, transmissions and axles, are produced by us or our subsidiaries and affiliates, and the remaining parts are procured from various suppliers through our extensive supply chain. We import a limited number of specialized parts and components for our vehicles, as well as specialized grades of steel.
24

Our South Korean vehicles are assembled primarily from aggregates and components manufactured in South Korea. However, some major aggregates are sourced from the United States and various European component suppliers.
Significant Factors Influencing Our Results of Operations. Our results of operations are dependent on a number of factors, including:
Results of Operations. Strong economic growth, increased industrial activity and continued development of better road infrastructure contributed
to a robust growth of the Indian automobile industry in fiscal 2007.
In fiscal 2007, we sold 589,428 units (including 8,588 units sold by TDCV and 560 units sold by Hispano), as compared to 459,863 units (including 5,734 units by TDCV) sold in fiscal 2006, representing an increase of 28.2%. Our domestic market share in the four wheel vehicle market in India was 28.5% in fiscal 2007 as compared to 27% in fiscal 2006. The volumes in the international business grew 11.9% to 62,622 units sold in fiscal 2007 from 55,957 units sold in fiscal 2006.
• General economic conditions. We, similar to the rest of the domestic automotive industry, are substantially affected by general economic conditions in India. See Item 3.D “—Risk Factors—Risks associated with Our Business and the Indian Automotive Industry”. General economic conditions could have a significant adverse impact on our sales and results of operations. Economic conditions have improved since fiscal 2002, which has led to our strong growth in fiscal 2005,2006 and 2007.
• Interest rates and availability of credit for vehicle purchases. While interest rates steadily declined from the beginning of fiscal 2001 and credit finance for vehicle purchases became more widely available, interest rates began to increase during the second half of fiscal 2006 and increased further during the latter part of fiscal 2007. For further discussion of our credit support programs, see Item 4.B “—Business Overview—Automotive Operations—Sales and Distribution of Vehicles”.
• Excise duty and sales tax rates. For a detailed discussion regarding tax rates applicable to us, please see Item 4.B “—
Business Overview—Government Regulations—Excise Duty”.
• Our competitive position in the market. For a detailed discussion regarding our competitive position, see Item 4.B “—
Business Overview—Automotive Operations—Competition”.
• Cyclicality. Our results of operations are also dependent on the cyclicality in demand in the automotive market, new
government regulations, and, to a limited extent, to fluctuations in foreign currency rates.
• Environmental Regulations. There has been a greater emphasis by the government on the emission and safety norms for the automobile industry. Compliance with these norms will have a significant bearing on the costs and product life cycles in the Indian automotive industry. For further details with respect to these regulations, please see Item 4.B “—Business Overview—Government Regulations—Emission and Safety”.
• Foreign Currency Rates. We are sensitive to fluctuations in foreign currency rates with respect to our import and export activities. Our consolidated financial results are affected by foreign currency exchange fluctuations through both translation risk and transaction risk. Changes in foreign currency exchange rates may positively or negatively affect our revenues, results of operations and net income.
• To the extent that our financial results for a particular period will be affected by changes in the prevailing exchange
rates at the end of the period, such fluctuations may have a substantial impact on comparisons with prior periods. However, the translation effect is a reporting consideration and does not impact our underlying results of operations.
• Transaction risk is the risk that the currency structure of our costs and liabilities will deviate from the currency structure of sales proceeds and assets. Transaction risk relates primarily to sales proceeds from our automotive business segment exports sales produced in India. However, we enter into commercial borrowings and other hedging instruments to address some of these transaction risks. These instruments enable us to reduce, but not eliminate, the impact of fluctuations in foreign currency rates. Please see Item 11. “—Quantitative and Qualitative Disclosures About Market Risk” for further detail.

Restrictions on overloading and increased demand from construction and mining activities had a favorable impact on the MHCV category where we achieved a market share of 62.7%, the highest in the last 6 years, and the continued strong performance of the Tata Ace led us to outperform the LCV category and achieve a market share of 65.4%. Strong performance in passenger vehicles was facilitated by the lower excise duty on small cars announced in the Indian Union Budget of fiscal 2007 and the launch of new models/variants, where we have maintained our position as the second largest manufacturer in the Indian market. The performance of
25

the automobile industry however, was adversely impacted due to increased interest rates in the latter half of the year, which was caused by the Reserve Bank of India’s initiatives to contain the inflationary pressures in the economy. This impacted our borrowing costs and vehicle financing rates during fiscal 2007.
In June 2006, we signed a Memorandum of Understanding with the Fiat group to establish an industrial joint venture in India to manufacture passenger vehicles, engines and transmissions for the Indian and the overseas markets. We also distribute Fiat cars in India through select dealer outlets. We sold over 1,300 units of Fiat cars during fiscal 2007. We licensed our LCV pick-up manufacturing technology to Fiat for manufacture and sale of LCV pick-ups under the Fiat brand in South America. Also, we entered into a Memorandum of Understanding with Marcopolo, a leading bus body manufacturing company from Brazil, for setting up a joint venture company to manufacture and assemble fully-built buses and coaches in India which we currently expect will enable us to improve production and technological capabilities in bus body building. In December 2006, we entered into a joint venture agreement with Thonburi Automotive Assembly Plant Co., or Thonburi, Thailand, to manufacture pick-ups in Thailand. We own 70% of the joint venture, while Thonburi owns the remaining 30%. This joint venture will facilitate our efforts to address the Thailand market, which is a major market for pick-ups, and other potential markets in that region. In February 2007, we announced the signing of a Memorandum of Understanding with Iveco, a company of Fiat Group, to analyze the feasibility of cooperation, across markets, in the area of Commercial Vehicles. The Memorandum of Understanding would encompass a number of potential developments in engineering, manufacturing, sourcing and distribution of products, aggregates and components. Definitive agreements are anticipated to be entered into in the course of the coming months, if the venture is found feasible.
The following table sets forth selected items from our consolidated statements of income for the periods indicated and shows these items as a percentage of total revenues:
The following table sets forth selected data regarding our automotive operations for the periods indicated and the percentage change from period to period.
The following table sets forth selected data regarding our other operations for the periods indicated and the percentage change from period to period.
Percentage of Total Revenues Percentage Change Fiscal 2005 Fiscal 2006 Fiscal 2007 2005 to 2006 2006 to 2007
Total Revenues 100% 100% 100% 21.3 37.8Cost of sales 79.1 78.7 79.5 20.7 39.2Selling, general and administrative expenses 10.2 11.0 10.7 32.0 34.0Research and development expenses 1.3 1.9 1.8 84.1 29.1Total operating expenses 11.4 13.0 12.5 37.7 33.2Operating income 9.5 8.3 8.0 6.7 31.9Non-operating income 0.9 1.5 1.4 *92.2 *36.4Interest income 0.4 0.3 0.2 -13.0 -9.7Interest expense -1.5 -1.5 -1.6 24.2 45.6Income before tax 9.3 8.5 8.0 11.5 28.8Income tax expense -2.6 -2.3 -2.4 10.2 44.4Net income 6.7 6.2 5.5 13.2 20.7
* Includes gain on shares issued by subsidiary companies and gain on sale of holding in subsidiary companies with respect to fiscal 2006.
Percentage Change Fiscal 2005 Fiscal 2006 Fiscal 2007 2005 to 2006 2006 to 2007
Total Revenues (Rs. Millions) 188,980 224,753 307,113 18.9 36.6Net Income (Rs. Millions) 12,814 14,861 17,249 16.0 16.1Net margin (%) 6.8 6.6 5.6
India (Unit Sales) 369,069 403,906 526,806 9.4 30.4Outside India (Unit Sales) 35,035 55,957 62,622 59.7 11.9Market Share in India (%) 26.8 27 28.5
Percentage Change Fiscal 2005 Fiscal 2006 Fiscal 2007 2005 to 2006 2006 to 2007
Total Revenues (Rs. Millions) 11,014 18,061 27,017 64.0 49.6Net Income (Rs. Millions) 487 385 1,064 -20.9 176.4Net margin (%) 4.4 2.1 3.9

Cost Reduction: We have been maintaining our cost advantage vis-à-vis foreign manufacturers who have entered the Indian market, by
aggressively pursuing a number of cost reduction initiatives, including the following:-
26
• Outsourcing vehicle design, development and testing activities to third parties and procurement of major aggregates and
sub-assemblies from approved vendors.
In the coming years, the globalization of the auto component industry in India may give us an opportunity to get international quality components at local prices. The opening of the Indian economy may also give us an opportunity to establish a global supply chain for meeting our cost and quality targets.
Fiscal 2007 Compared to Fiscal 2006 Revenues.
Our total consolidated gross revenues including finance revenues increased to Rs.377,753 million in fiscal 2007 from Rs.276,080 million in fiscal 2006, an increase of Rs.101,673 million, or 36.8%. The growth was driven by an increase in total vehicle volumes of 28.2%, improved realization per vehicle, continued robust growth in our vehicle financing activity resulting in 36.6% increase in revenues from automotive operations. Further, growth in revenues of our key non-automotive subsidiaries, namely Telcon, which registered a 39.8% increase in its revenues during fiscal 2007 and TTL which registered a 97.0% increase in its revenues during fiscal 2007.
Revenues from the domestic market for fiscal 2007 increased by 34.9% to Rs.267,419 million from Rs.198,172 million while revenues from markets outside India increased by 51% to Rs.64,106 million from Rs.42,443 million in 2006. The proportion of total revenues from markets outside India has increased from 5.4% in fiscal 2003 to 19.3% in fiscal 2007. This has been driven by our continued focus on improving our presence in international markets, through expansion of both our automotive and non-automotive businesses. We seek to continue to grow the proportion of revenues we draw from international operations.
The following is a discussion of our revenues for each of our business segments.
Revenues from Automotive Operations. Automotive operations with revenue of Rs.307,113 million generate the largest proportion of our total revenues. Revenues from
this segment increased by Rs.82,360 million, or 36.6% from Rs.224,753 million in fiscal 2006. This increase was primarily due to:
Domestic sales of vehicles produced by us during fiscal 2007 grew by 30.4%, crossing the half million vehicle sales mark in a year for the first time in our history. The increase was largely due to the continuing success of the Tata Ace, the launch of Indica facelift, Indica Xeta (1.2 litre), Indigo XL and Indigo DICOR during the fiscal year and also due to the successful implementation of the ban on overloading of trucks in India. International sales continued to grow during fiscal 2007 as a result of our successful entry into South Africa and increased focus on other traditional export markets, as well as the launch of MCVs in the South Korean market by TDCV. Continued focus on the Auto Financing business, following the merger of TFL with us, facilitated increased growth of this business. As of the end of fiscal 2007, “TataMotorfinance” (“TMF”), the brand name under which our vehicle financing division and our wholly-owned subsidiary, Tata Motors Finance Limited, operate, financed 31.0% of our domestic sales compared to 24.0% of our vehicles sold in the domestic market in fiscal 2006.
Revenues from Other Operations. Revenues from our other operations increased by Rs.8,956 million or 49.6% to Rs.27,017 million in fiscal 2007 compared to the
previous fiscal year, mainly due to an increase in revenues of significant non-automotive subsidiaries. In fiscal 2007, revenues of TTL and Telcon increased by 97 % and 39.8%, respectively. During fiscal 2006, HCM increased its stake in Telcon from 20% to 40% facilitating access to improved technology, overseas markets and increased manufacturing and component outsourcing opportunities for Telcon. Similarly, efficiencies derived from the acquisition of INCAT during fiscal 2006 helped increase the revenue growth of TTL.
Cost of Sales and Operating Expenses. Cost of sales as a percentage of total revenues has increased to 79.5% from 78.7% The increase reflects primarily the combined
impact of an increase in input prices, partially offset by the impact of continued cost cutting efforts. Also, an increase in depreciation
• Procurement of parts and consumables by e-sourcing and reverse auctions.
• Sourcing of raw materials and components from global sources.
• Value engineering and the use of alternate and new materials.
• Adopting target costs, productivity and process improvements and rationalizing of our vendor base.
• 30.4% increase in domestic vehicle unit sales in India;
• 6.5% increase in international sales of vehicles; • 89% increase in automotive financing revenues and;
• Increase in revenues reported by automotive subsidiaries.

expenses relating to production equipment and factory overheads as a result of capacity expansion and ongoing product development program contributed to the increase in cost of sales.
27

Selling, general and administrative expenses increased by Rs.9,037 million to Rs.35,623 million in fiscal 2007 from Rs.26,586 million in fiscal 2006. This was partially due to an increase in outward shipping expenses of Rs.8,549 million during fiscal 2007 as compared to Rs.6,092 million during fiscal 2006. Selling, general and administrative expenses as a percentage of total revenues decreased to 10.7% during fiscal 2007 compared with 11.0% during fiscal 2006.
Research and development expenses increased by 29.1% to Rs.6,018 million in fiscal 2007 from Rs.4,663 million in fiscal 2006 as a result of our ongoing initiative towards design and development of new vehicle models across all product categories, including the small car. As a percentage of total revenues, research and development expenses was 1.8% in fiscal 2007 compared to 1.9% in fiscal 2006.
Operating Income. In fiscal 2007, our consolidated operating income increased by Rs.6,388 million to Rs.26,431 million from Rs.20,042 million in
fiscal 2006.
Operating income from our automotive operations was Rs.23,607 million in fiscal 2007, an increase of Rs.4,685 million or 24.8% from Rs.18,922 million in fiscal 2006. Growth in sales volume by 28.2% , growth in vehicle financing revenues, cost reduction efforts, partly offset by increase in selling and general administration expenses in line with increase in volume and increase in research and development expenses contributed to the increase in operating income for fiscal 2007.
Operating income from our other operations increased by Rs.1,720 million or 162.3% to Rs.2,779 million in fiscal 2007 from Rs.1,059 million in fiscal 2006. This increase was primarily due to an improvement in the revenues of our key subsidiaries, especially Telcon (posting a 39.8% increase) and TTL (posting a 97% increase).
Other Income and Expenses. We had total net non-operating expenses of Rs.40 million in fiscal 2007 as compared to a total net non-operating income of
Rs.446 million in fiscal 2006. The interest expense (net) increased from Rs.3,055 million to Rs.4,816 million mainly due to increased financing requirements and increase in interest rates during fiscal 2007. This increase was offset by foreign exchange gains (net) Rs.1,856 million and increase in other non-operating income of Rs.951 million. Non-operating income for fiscal 2006 included Rs.1,532 million on account of gain of sale of equity interest in subsidiary.
Income Taxes Income tax expense increased to Rs.8,113 million from Rs.5,618 million during fiscal 2007. The effective tax rate during fiscal
2007 was 30.7% compared to 27.4% in fiscal 2006. Increase in tax rate is primarily on account of tax on undistributed earnings of subsidiaries and a tax benefit recorded in fiscal 2006 on sale of shares of a subsidiary company. The increase was partially offset by higher tax benefit on research and development and tax free dividend income.
Minority Interest in Consolidated Subsidiaries and Equity in Earnings of Affiliates. Share of minority interest in profits of consolidated subsidiaries in fiscal 2007 increased to Rs.719 million compared to Rs.331
million in fiscal 2006. The increase is on account of profits attributable to minorities consequent to increased minority holding in Telcon from 20% to 40% in December 2005, coupled with higher profits of Telcon during the fiscal 2007.
Equity in the net income of affiliates was Rs.552 million during fiscal 2007, representing an increase of 17.2% from Rs.471 million during fiscal 2006. This change was primarily due to an increase in profits of our affiliate Tata Cummins Ltd.
Net Income. Our consolidated net income for fiscal 2007 was Rs.18,112 million, representing an increase of 20.7% from Rs.15,011 million
fiscal 2006. This increase was the result of:
Net income as a percentage of total revenues declined to 5.5% in fiscal 2007 from 6.2% in fiscal 2006.
• 28.2% increase in vehicle unit sales in fiscal 2007 compared to fiscal 2006.
• Continued cost reductions, which were partially offset by an increase in input commodity prices. Prices of commodity items, particularly steel, non-ferrous metals, rubber and engineering plastics, witnessed an upward movement, which was partially offset by the cost reduction initiatives pursued by the company. Consequently, our raw material cost as a proportion of our total revenues increased to 62.6% in fiscal 2007 from 62.4% in fiscal 2006.
• 31.9% increase in operating income from Rs. 20,042 million in fiscal 2006 to Rs.26,431 million in fiscal 2007, which was
the result of an increase of 24.8% and 162.3% of the operating income of our automotive operations and other operations, respectively.

28

Fiscal 2006 Compared to Fiscal 2005
Revenues. Our total consolidated gross revenues including finance revenues increased to Rs.276,080 million in fiscal 2006 from
Rs.230,158 million in fiscal 2005, an increase of Rs.45,922 million, or 20%. The growth was driven by an increase in total vehicle volumes of 13.8%, improved realization per vehicle and robust growth in our vehicle financing business following the amalgamation of the erstwhile Tata Finance Ltd. This has resulted in 30.9% increase in revenues of automotive segment. Further, growth in revenues of our key non-automotive subsidiaries, namely TTL, registered a 200% increase in its revenues and Telcon which registered a 39.3% increase in its revenues during fiscal 2007.
Revenues from the domestic market for fiscal 2006 increased by 16.0% to Rs.198,172 million from Rs.170,883 million and revenues from markets outside India increased by 54.3% to Rs.42,443 million from Rs.27,504 million in 2005. This was primarily due to our continued focus on improving our presence in international markets, through expansion of both our automotive and non-automotive business. The revenues from markets outside India accounted for approximately 17.6% and 13.9% respectively, of our total revenue in fiscal 2006 and 2005. International business has increased in importance to us in recent fiscal years and we seek to continue to grow the proportion of revenues we draw from international operations.
The following is a discussion of our revenues for each of our business segments.
Revenues from Automotive Operations. Automotive operations generate the largest portion of our revenues. Revenues from this segment increased by Rs.35,773
million, or 18.9%, to Rs.224,753 million in fiscal 2006 compared to fiscal 2005. This increase was primarily due to:
Domestic sales of vehicles produced by us during fiscal 2006 grew by 9.4% despite the uncertainties created by changes in automotive regulations. The increase was largely due to the successful launch of Tata Ace, Indica Turbo diesel, Indica Xeta and other variants during the fiscal year and also partially due to the successful implementation of the ban on overloading of trucks in the country towards the end of the fiscal year. International sales continued to grow during fiscal 2006 as a result of our successful entry into South Africa and increased focus on other traditional export markets. Continued focus on the Auto Financing business, following the merger TFL with us, facilitated increased growth of this business. As of the end of fiscal 2006, 23.8% of our vehicles sold in the domestic market were financed by this unit as against 18.3% in fiscal 2005.
Revenues from Other Operations. Revenues from our other operations increased by Rs.7,047 million or 64.0% to Rs.18,061 million in fiscal 2006 compared to the
previous fiscal year, mainly on account of an increase in revenues of significant non automotive subsidiaries. In fiscal 2006, revenues of TTL and Telcon increased by 200% and 39.3% respectively. During fiscal 2006, HCM increased its stake in Telcon from 20% to 40% facilitating access to improved technology, overseas markets and increased manufacturing and component outsourcing opportunities for Telcon. Similarly, efficiencies derived from the acquisition of INCAT during fiscal 2006 helped increase the revenue growth of TTL.
Cost of Sales and Operating Expenses. Cost of sales as a percentage of total revenues has increased to 78.7% from 79.1%. The increase reflects primarily the combined
impact of an increase in input prices, particularly for steel, rubber and engineering plastics, partially offset by the impact of continued cost cutting efforts. Also, an increase in depreciation expenses relating to production equipment and factory overheads as a result of capacity expansion contributed to the increase in cost of sales.
Selling, general and administrative expenses increased by Rs.6,441 million to Rs.26,586 million from Rs.20,145 million in fiscal 2005. This was partially due to an increase in outward shipping expenses of Rs.6,092 million during fiscal 2006 as compared to Rs.4,193 million during fiscal 2005. Selling, general and administrative expenses as a percentage of total revenues increased to 11.0% during fiscal 2006 from 10.2% during fiscal 2005.
Research and development expenses increased by 84.1% to Rs.4,663 million during fiscal 2006 from Rs.2,532 million as a result of our ongoing initiative towards design and development of new vehicle models across all product categories, including the small car. Research and development expenses as a percentage of total revenues increased to 1.9% during fiscal 2006 from 1.3% in fiscal 2005.
• 9.4% increase in domestic vehicle unit sales in India
• 59.7% increase in international sales of vehicles • 132% increase in automotive financing revenues to Rs.3,729 million
• increase in revenues reported by automotive subsidiaries during fiscal 2006.

29

Operating Income. Our consolidated operating income increased by Rs.1,251 million to Rs.20,042 million during fiscal 2006 from Rs.18,791
million in fiscal 2005.
Operating income from our automotive operations increased by Rs.1,004 million or 5.6% to Rs.18,922 million from Rs.17,918 million in fiscal 2005. 13.8% growth in volume sales, growth in vehicle financing revenues and cost reduction efforts offset by increase in operating expenses resulted in the growth in operating income for the fiscal year.
Operating income from our other operations increased by Rs.314 million or 42.1% to Rs.1,059 million from Rs.745 million in fiscal 2005. This increase was primarily due to an improvement in the revenues of our key subsidiaries, especially Telcon (39.3% increase) and TTL (200.0% increase).
Other Income and Expenses. We had a total net non-operating income of Rs.446 million during fiscal 2006 as compared to a total net non-operating expense
of Rs.410 million in fiscal 2005, representing an increase of Rs. 856 million.
Interest expense (net) increased to Rs.3,055 million in fiscal 2006 from Rs.2,232 million in fiscal 2005, primarily due to an increase in borrowings on account of the vehicle financing business and also due to an increase in our borrowing costs caused by an increase in interest rates in India during the fiscal year. This increase was offset by gain on sale of holding in subsidiaries of Rs. 1,532. The balance represents net increase in other non-operating revenue.
Income Taxes. Income tax expense increased to Rs.5,618 million during fiscal 2006 compared to Rs.5,100 million in fiscal 2005. The effective
tax rate during fiscal 2006 was 27.4% as compared to 27.7% in the fiscal 2005. During fiscal 2006, a reduction in permanent tax benefits on account of lower dividend income as well as higher tax provision on undistributed income of subsidiaries, were partly offset by permanent tax benefits on account of a weighted deduction of 150% on research and development expenses and long term capital gain benefits of the sale of stake in a subsidiary.
Minority Interest in Consolidated Subsidiaries and Equity in Earnings of Affiliates. Share of minority interest in profits of consolidated subsidiaries during fiscal 2006 was Rs.331 million as compared to Rs.366
million in fiscal 2005. The decline is mainly on account of the reduction in the rate of profit by TACO.
Equity in earnings of affiliates was Rs.471 million during fiscal 2006 as compared to Rs.340 million in fiscal 2005. This change was primarily due to an increase in profits of our affiliates, particularly Tata Cummins Ltd and Tata Holset Ltd.
Net Income. Our consolidated net income for fiscal 2006 was Rs.15,011 million, an increase of 13.2% from Rs.13,256 million in fiscal 2005.
The increase was the result of:
Net income as a percentage of total revenues was 6.2% for fiscal 2006 as compared to 6.7% for fiscal 2005.
30
• 13.8% increase in vehicle unit sales
• Continued cost reductions, which were partially offset by an increase in input commodity prices. While the prices of steel softened during fiscal 2006, the prices of non-ferrous commodities continued an upward trend during the year. Consequently, our raw material cost as a proportion of our total revenues decreased to 62.4% in fiscal 2006 from 64.2% in fiscal 2005. The other elements of cost of sales increased to 16.3% in fiscal 2006 from 14.8% in fiscal 2005
• 6.7% increase in operating income from Rs 18,791 million in fiscal 2005 to Rs. 20,042 million in fiscal 2006. The
operating income of our automotive operations increased 5.6% during fiscal 2006 to Rs.18,922 million, while operating income of our other operations increased by 42.1% to Rs.1,059 million in fiscal 2006.

Recent Accounting Pronouncements
In June 2006, the FASB issued FIN 48, Accounting for Uncertainty in Income Taxes an interpretation of FASB Statement No. 109. This Interpretation clarifies the accounting for uncertainty in income taxes recognized in an enterprise’s financial statements in accordance with FASB Statement No. 109, Accounting for Income Taxes. This Interpretation prescribes a recognition threshold and measurement attribute for the financial statement recognition and measurement of a tax position taken or expected to be taken in a tax return. This Interpretation also provides guidance on de-recognition, classification, interest and penalties, disclosure, etc. This interpretation is applicable from the fiscal year beginning after December 15, 2006. The impact, if any, on account of this interpretation is under evaluation.
In September 2006, FASB issued SFAS No. 158, Employers’ Accounting for Defined Benefit Pension and Other Postretirement Plans – an amendment of FASB Statements No. 87, 88, 106, and 132(R) (“SFAS 158”). FAS 158 requires employers to recognize the overfunded or underfunded status of their defined benefit postretirement plans as an asset or a liability on their balance sheets, and to recognize changes in that funded status in the year in which the changes occur through comprehensive income. The company adopted the provisions regarding recognition of funded status and disclosure under FAS 158 for the year ended March 31, 2007. See note 20 to the consolidated financial statements for the impact of the adoption of the provisions of SFAS 158.
In September 2006, the FASB issued SFAS 157 Fair Valuation Measurement which provides a definition of fair value, establishes a framework for measuring fair value and requires expanded disclosures about fair value measurements. SFAS 157 is effective for financial statements issued for fiscal years beginning after November 15, 2007 and interim periods within those fiscal years. The provisions of SFAS 157 should be applied prospectively. The company is evaluating the application of this statement.
In February 2007, the FASB issued SFAS 159, The Fair Value Option for Financial Assets and Financial Liabilities. SFAS 159 permits measurement of recognized financial assets and liabilities at fair value with some certain exceptions such as investments in subsidiaries, obligations for pension or other postretirement benefits, and financial assets and financial liabilities recognized under leases. Changes in the fair value of items for which the fair value option is elected should be recognized in income or loss. The election to measure eligible items at fair value is irrevocable and can only be made at defined election dates or events, generally on an instrument by instrument basis. Items for which the fair value option is elected should be separately presented or parenthetically be disclosed in the statement of financial position. SFAS 159 also requires significant new disclosures that apply for interim and annual financial statements. SFAS 159 shall be effective for fiscal years beginning after November 15, 2007 with earlier adoption permitted, if certain conditions are met. The company is evaluating the application of this statement.
Critical Accounting Policies. The preparation of our consolidated financial statements in conformity with US GAAP requires us to make estimates and
assumptions that affect the reported amounts of assets and liabilities and disclosure of contingent assets and liabilities at the date of the financial statements and the reported amounts of revenues and expenses during the reporting period. On an ongoing basis, we evaluate and reevaluate our estimates, which are based on historical experience, industry standards, economic conditions and various other assumptions that we believe are reasonable based on currently available information. The results of these evaluations and reevaluations form the basis for our judgments about the carrying values of our assets and liabilities and the reported amounts of our revenues and expenses that are not readily apparent from other sources. Actual results may differ from these estimates, and these estimates could differ under different assumptions. We believe the following accounting policies are important to our financial condition and results and require the most significant management judgments and estimates.
Property, plant and equipment. Property, plant and equipment is stated at cost of acquisition or construction less accumulated depreciation. Cost includes
the purchase price, taxes and duties, labor cost and direct overheads for self constructed assets, interest cost during the construction period and other direct costs incurred up to the date the asset is available for use.
Depreciation is charged on a straight line basis over the useful lives of the assets.
We review our estimated useful lives on an ongoing basis to ensure that they are appropriate. We test our long-lived assets for impairment using undiscounted cash flows whenever events or circumstances arise that may indicate impairment. If a long lived asset is impaired, it is written down to its estimated fair value. Any assets which relate to discontinued or obsolete vehicle models are written off.
Product Warranty Vehicle warranties are provided for a specified period of time. Our vehicle warranty obligations vary depending upon the
type of the product, geographical location of its sale and other factors.
The estimated liability for vehicle warranties is recorded at the time products are sold. These estimates are established using historical information on the nature, frequency, and average cost of warranty claims and our estimates regarding possible future

incidence based on actions on product failures.
Changes in warranty liability as a result of changes in estimated future warranty costs and any additional costs in excess of estimated costs can materially affect our net income. Determination of warranty liability is based on the estimated frequency and amount of future claims, which are inherently uncertain. Our policy is to continuously monitor warranty liabilities to determine the adequacy of our estimate of such liabilities. Actual claims incurred in the future may differ from our original estimates, which may materially affect warranty expense.
Employee Benefits. Employee benefit costs and obligations are dependent on assumptions used in calculating such amounts. These
assumptions include salary increase, discount rates, health care cost trend rates, benefits earned, interest cost, expected return on plan assets, mortality rates and other factors.
While we believe that the assumptions used are appropriate, differences in actual experience or changes in assumptions may affect our employee benefit costs and obligations.
Finance Receivables, deferred origination costs and allowance for credit losses. We finance vehicle sales with hire purchase and loan financing provided to our customers. Finance receivables are reported
at their outstanding unpaid principal balance reduced by a valuation allowance and net of any deferred origination costs.
Origination fees and certain direct origination costs are deferred and amortized as an adjustment to the yield of the related finance receivable.
We recognize specific and unallocated allowance for credit losses for finance receivables, based on our best estimate of losses inherent in the finance receivable portfolio.
The Company provides a specific allowance for credit losses for hire purchase and loan receivables that are in arrears for eleven months and six months or more, respectively, in an amount equivalent to the outstanding principal and interest balance.
B. Liquidity and Capital Resources. We finance our capital requirements by cash from operations, debt, capital market borrowings and sale of investments. As
of March 31, 2007 our borrowings (including short term debt) were Rs.79,137 million. We believe that we have sufficient resources available to us to meet our planned capital requirements. However, our sources of funding could be adversely affected by an economic slowdown or other macro economic factors in India, which are beyond our control. A decrease in the demand for our products and services could lead to an inability to obtain funds from external sources on acceptable terms or in a timely manner, or at all. For our loan maturity profile, See Item 5.B “— Liquidity and Capital Resources — Liabilities and Sources of Financing”.
31

Subsequent to March 31, 2007 our shareholders at the Annual General Meeting held on July 9, 2007, approved of the increase in borrowing limits (apart from temporary loans obtained or to be obtained from our bankers in the ordinary course of business) from Rs.75 billion to Rs.120 billion.
Cash Flow Data The following table sets forth selected items from our consolidated statements of cash flows for the periods indicated and
shows the percentage change between periods.
See consolidated statement of cash flows on Pages F-6 and F-7 for details.
Net cash provided by operating activities was Rs.23,627 million, Rs.5,666 million and Rs.17,498 million in fiscal 2005, 2006 and 2007, respectively. An increase in accounts payable was offset by an increase in inventories, accounts receivable and other current assets. Our accounts receivable increased by Rs.1,720 million, Rs.2,782 million and Rs. 4,993 million in fiscals 2005, 2006 and 2007, respectively.
Net cash used in investing activities was Rs.35,406 million, Rs.9,050 million and Rs.53,964 million in fiscal 2005, 2006 and 2007, respectively. During fiscal 2007, cash used in investing activities was primarily towards increase in finance receivables and capital expenditure relating mostly to a capacity expansion of our production facilities, introduction of new products, quality and reliability improvement aimed at operating cost reductions. Cash outflow on account of capital expenditures for property, plant and equipment were Rs.8,557 million, Rs.10,355 million and Rs.24,122 million in fiscal 2005, 2006 and 2007, respectively.
There was a net cash inflow from financing activities of Rs.9,987 million, Rs.4,450 million and Rs.38,474 million during fiscals 2005, 2006 and 2007, respectively. During fiscal 2007, we repaid long term debt of Rs.2,292 million, and Rs.21,667 million was received from proceeds related to the issue of long term debt.
Certain of our subsidiaries and equity method affiliates have contractual and other limitations in respect of their ability to transfer funds to us in the form of cash dividends, loans or advances. However this has not had and is not expected to have any impact on our ability to meet our cash obligations.
Balance Sheet Data. Total Assets were Rs.271,015 million and Rs.202,158 million as of March 31, 2007 and 2006, respectively. The increase in
the total assets during fiscal 2007 was primarily due to a significant increase in finance receivables following the robust growth in the vehicle financing business, increase in property, plant and equipment and other non-current assets.
Total shareholders’ equity was Rs.91,369 million and Rs.81,016 million as of March 31, 2007 and 2006, respectively. Share capital increased from Rs.3,829 million as of March 31, 2006 to Rs.3,854 million as of March 31, 2007 and additional paid-in-capital increased from Rs.38,774 million to Rs.39,711 million as of March 31, 2007. The increase was attributable to the conversion of outstanding convertible debt securities. As of March 31, 2007, an aggregate of 99.94% of our issued $100 million 1% Convertible Notes due 2008 and 93.89% of our issued $100 million Zero Coupon Convertible Notes due 2009 were converted into ADSs/ordinary shares. Retained earnings were Rs.32,135 million as of March 31, 2007 compared to Rs.20,401 million as of March 31, 2006.
Percentage Change 2005 2006 2007 2005 to 2006 2006 to 2007
Net Cash provided by Operating Activities: 23,627 5,666 17,498 -76.0% 208.9%Net Income 13,256 15,011 18,112
Adjustments 5,276 5,254 7,887
Changes in Operating Assets and Liabilities 5,095 (14,599) (8,501)
Net Cash used in Investing Activities 35,406 9,050 53,964 -74.4% 496.3%Purchase of Property,Plant and Equipment and Intangible
Assets (Net) 8,847 10,539 24,236
Net Investments, Short Term deposits and Loans given 15,704 (20,215) (6,155)
Acquisitions 187 4,304 —
Finance Receivables (net of proceeds from sale) 10,946 14,611 36,333
Others (278) (189) (450)
Net Cash provided by Financing Activities 9,987 4,450 38,474 -55.4% 764.5%Equity Issuance (Net of issue expenses) 756 259 (1)
Proceeds from issue of shares by a subsidiary to minority shareholders 739 415 162
Dividends Paid (including to minority shareholders of subsidiaries) (1,773) (5,275) (5,830)
Net Borrowings 10,265 9,051 44,143

32
Our total debt stood at Rs.79,137 million as of March 31, 2007 compared to Rs.36,641 million as of March 31, 2006. This increase was mainly on account of an increase in short term debt raised during the fiscal year to fund the growth in our vehicle financing activity and an increase in long term debt raised to support our on going capital expenditure program and our growing vehicle financing activity. The short term debt, excluding the current portion of the long-term debt, was Rs.33,145 million as of March 31, 2007 as compared to Rs.7,973 million as of March 31, 2006, while the long term debt, excluding the current portion, increased from Rs.27,203 million to Rs.40,235 million as of March 31, 2007. Including the current portion of long-term debt, the short term debt was Rs.38,902 million as of March 31, 2007 compared to Rs.9,438 million as of March 31, 2006, respectively.
As of March 31, 2007, we had cash and cash equivalents of Rs.7,653 million of which Rs. 997 million is held foreign currencies compared to Rs.6,316 million of which Rs. 1,678 million is held in foreign currencies as of March 31, 2006. Short-term bank deposits were Rs.173 million as of March 31, 2007 as compared to Rs.4,915 million as of March 31, 2006. This decline is attributable to utilization of such deposits.
Gross accounts receivables increased by 35.1% during fiscal 2007 by Rs.5,203 million to Rs.20,031 million as of March 31, 2007.
Gross finance receivables (excluding non-current receivables) stood at Rs.29,434 million as of March 31, 2007 as compared to Rs.21,300 million as of March 31, 2006. This increase was primarily due to a significant increase in vehicle financing driven by increased units financed.
As of March 31, 2007, inventories stood at Rs.33,923 million as compared to Rs. 26,304 million as of March 31, 2006, primarily reflecting the impact of increased unit production. Also, on account of an increase in prices of commodities, especially steel and non-ferrous metals, inventory of raw materials and components increased during the fiscal year. Inventory number of days decreased to 33 days in fiscal 2007, compared to 35 days in fiscal 2006.
Our investment portfolio decreased to Rs.22,258 million as of March 31, 2007 compared to Rs.24,851 million as of March 31, 2006. The decrease was primarily due to the sale of available-for-sale investments during the year.
As of March 31, 2007, goodwill and intangible assets stood at Rs.10,229 million compared to Rs.9,389 million as of March 31, 2006.
Capital Expenditure Capital expenditure aggregated Rs.25,277 million, Rs.10,734 million and Rs.9,163 million during fiscals 2007, 2006 and
2005, respectively. Our capital expenditures during the past three years have related mostly to capacity expansion of our production facilities, the introduction of new products like Tata Ace, quality and reliability improvements aimed at operating cost reductions.
We will continue to invest in our business units and research and development over the next several years, including committed capital expenditures for our ongoing projects, new projects, product development programs, mergers, acquisitions and strategic alliances. In particular, we have been implementing a program to build and expand our presence in the passenger vehicle market and to expand and enhance our leading position in the Indian commercial vehicle market, both by improving our existing product range and developing new products and platforms.
As a part of our future growth strategy for the domestic market and to seek a meaningful presence in the global markets, we plan to incur approximately Rs.120 billion in the next three to four fiscal years towards product development, capital expenditure in capacity enhancement, plant renewal and modernization and other meaningful growth opportunities. These expenditures are expected to be funded largely through cash generated from operations, existing investible surplus in the form of cash and cash equivalents, investment securities and other external financing sources
Liabilities and Sources of Financing We fund our short-term working capital requirements with cash generated from operations, overdraft facilities with banks,
short and medium term borrowings from lending institutions, banks and commercial paper. The maturities of these short and medium term borrowings and debentures are generally matched to particular cash flow requirements. We had short term borrowings (including the current portion of long-term debt) of Rs.38,902 million and Rs.9,438 million as of March 31, 2007 and 2006, respectively. We had unused short-term credit facilities of Rs.19,871 million and Rs.23,637 million as of March 31, 2007 and 2006, respectively.
In July 2003, we raised US$ 100 million through an offering of 1% convertible notes, due in 2008. The notes are convertible into ordinary shares or global depositary shares, at the option of the holder, at a price of Rs.250.745 per ordinary share. The notes are subject to redemption at our option any time after July 31, 2006. Unless previously converted, redeemed or purchased and cancelled, the Notes are redeemable on July 31, 2008 at 116.824% of the principal amount. US$ 0.06 million of these notes were outstanding as on March 31, 2007.

On April 27, 2004, we raised $400 million through a two-tranche offering of zero coupon and 1% convertible notes due in 2009 and 2011, respectively. The $100 million zero coupon notes, due in 2009, are convertible into ordinary shares or global depositary shares at a price of Rs.573.106 per share, subject to adjustment, from and including June 7, 2004 to and including March 28, 2009 and are subject to redemption at our option any time on or after April 27, 2005. The $300 million 1% notes, due in 2011, are convertible into ordinary shares or depositary shares at a price of Rs.780.400 per share, subject to adjustment, from and
33
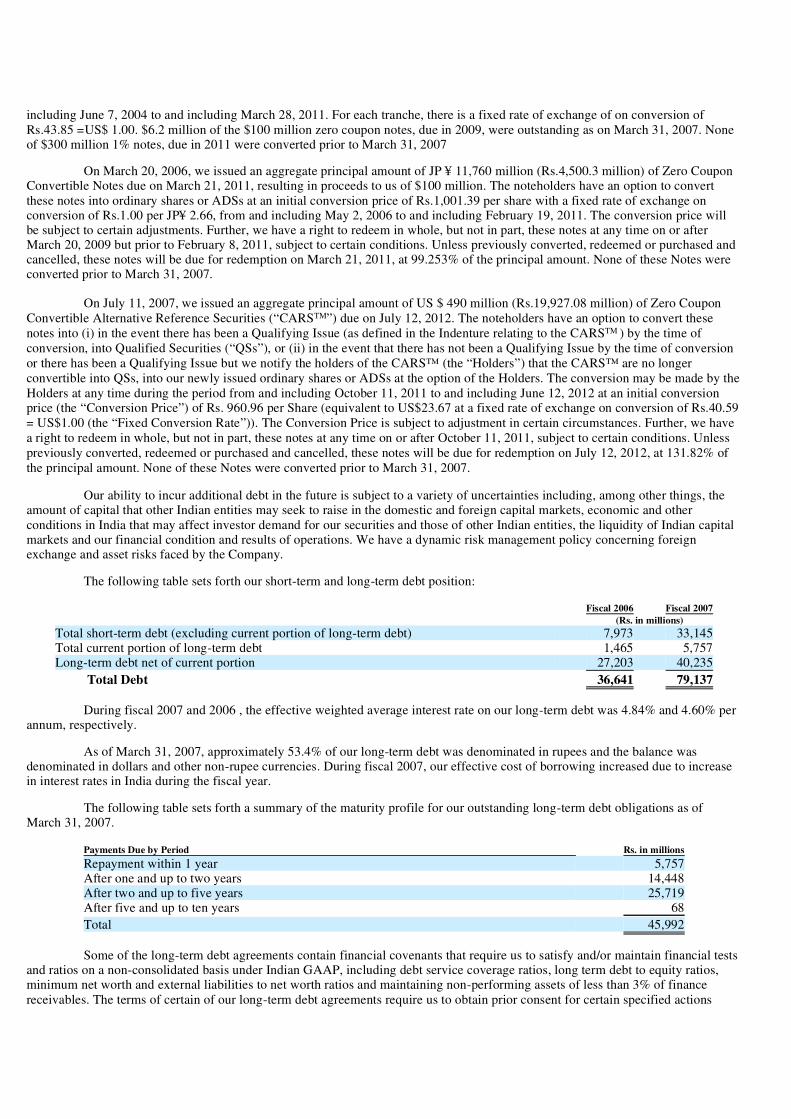
including June 7, 2004 to and including March 28, 2011. For each tranche, there is a fixed rate of exchange of on conversion of Rs.43.85 =US$ 1.00. $6.2 million of the $100 million zero coupon notes, due in 2009, were outstanding as on March 31, 2007. None of $300 million 1% notes, due in 2011 were converted prior to March 31, 2007
On March 20, 2006, we issued an aggregate principal amount of JP ¥ 11,760 million (Rs.4,500.3 million) of Zero Coupon Convertible Notes due on March 21, 2011, resulting in proceeds to us of $100 million. The noteholders have an option to convert these notes into ordinary shares or ADSs at an initial conversion price of Rs.1,001.39 per share with a fixed rate of exchange on conversion of Rs.1.00 per JP¥ 2.66, from and including May 2, 2006 to and including February 19, 2011. The conversion price will be subject to certain adjustments. Further, we have a right to redeem in whole, but not in part, these notes at any time on or after March 20, 2009 but prior to February 8, 2011, subject to certain conditions. Unless previously converted, redeemed or purchased and cancelled, these notes will be due for redemption on March 21, 2011, at 99.253% of the principal amount. None of these Notes were converted prior to March 31, 2007.
On July 11, 2007, we issued an aggregate principal amount of US $ 490 million (Rs.19,927.08 million) of Zero Coupon Convertible Alternative Reference Securities (“CARSTM”) due on July 12, 2012. The noteholders have an option to convert these notes into (i) in the event there has been a Qualifying Issue (as defined in the Indenture relating to the CARSTM ) by the time of conversion, into Qualified Securities (“QSs”), or (ii) in the event that there has not been a Qualifying Issue by the time of conversion or there has been a Qualifying Issue but we notify the holders of the CARS™ (the “Holders”) that the CARS™ are no longer convertible into QSs, into our newly issued ordinary shares or ADSs at the option of the Holders. The conversion may be made by the Holders at any time during the period from and including October 11, 2011 to and including June 12, 2012 at an initial conversion price (the “Conversion Price”) of Rs. 960.96 per Share (equivalent to US$23.67 at a fixed rate of exchange on conversion of Rs.40.59 = US$1.00 (the “Fixed Conversion Rate”)). The Conversion Price is subject to adjustment in certain circumstances. Further, we have a right to redeem in whole, but not in part, these notes at any time on or after October 11, 2011, subject to certain conditions. Unless previously converted, redeemed or purchased and cancelled, these notes will be due for redemption on July 12, 2012, at 131.82% of the principal amount. None of these Notes were converted prior to March 31, 2007.
Our ability to incur additional debt in the future is subject to a variety of uncertainties including, among other things, the amount of capital that other Indian entities may seek to raise in the domestic and foreign capital markets, economic and other conditions in India that may affect investor demand for our securities and those of other Indian entities, the liquidity of Indian capital markets and our financial condition and results of operations. We have a dynamic risk management policy concerning foreign exchange and asset risks faced by the Company.
The following table sets forth our short-term and long-term debt position:
During fiscal 2007 and 2006 , the effective weighted average interest rate on our long-term debt was 4.84% and 4.60% per annum, respectively.
As of March 31, 2007, approximately 53.4% of our long-term debt was denominated in rupees and the balance was denominated in dollars and other non-rupee currencies. During fiscal 2007, our effective cost of borrowing increased due to increase in interest rates in India during the fiscal year.
The following table sets forth a summary of the maturity profile for our outstanding long-term debt obligations as of March 31, 2007.
Some of the long-term debt agreements contain financial covenants that require us to satisfy and/or maintain financial tests and ratios on a non-consolidated basis under Indian GAAP, including debt service coverage ratios, long term debt to equity ratios, minimum net worth and external liabilities to net worth ratios and maintaining non-performing assets of less than 3% of finance receivables. The terms of certain of our long-term debt agreements require us to obtain prior consent for certain specified actions
Fiscal 2006 Fiscal 2007 (Rs. in millions)Total short-term debt (excluding current portion of long-term debt) 7,973 33,145Total current portion of long-term debt 1,465 5,757Long-term debt net of current portion 27,203 40,235
Total Debt 36,641 79,137
Payments Due by Period Rs. in millions
Repayment within 1 year 5,757After one and up to two years 14,448After two and up to five years 25,719After five and up to ten years 68
Total 45,992

including amendment of our charter documents and for creation of any lien on our properties other than for specified purposes.
As a result of our increase in our long term debt during fiscal 2007 as compared to fiscal 2006, the ratio of net debt to
34
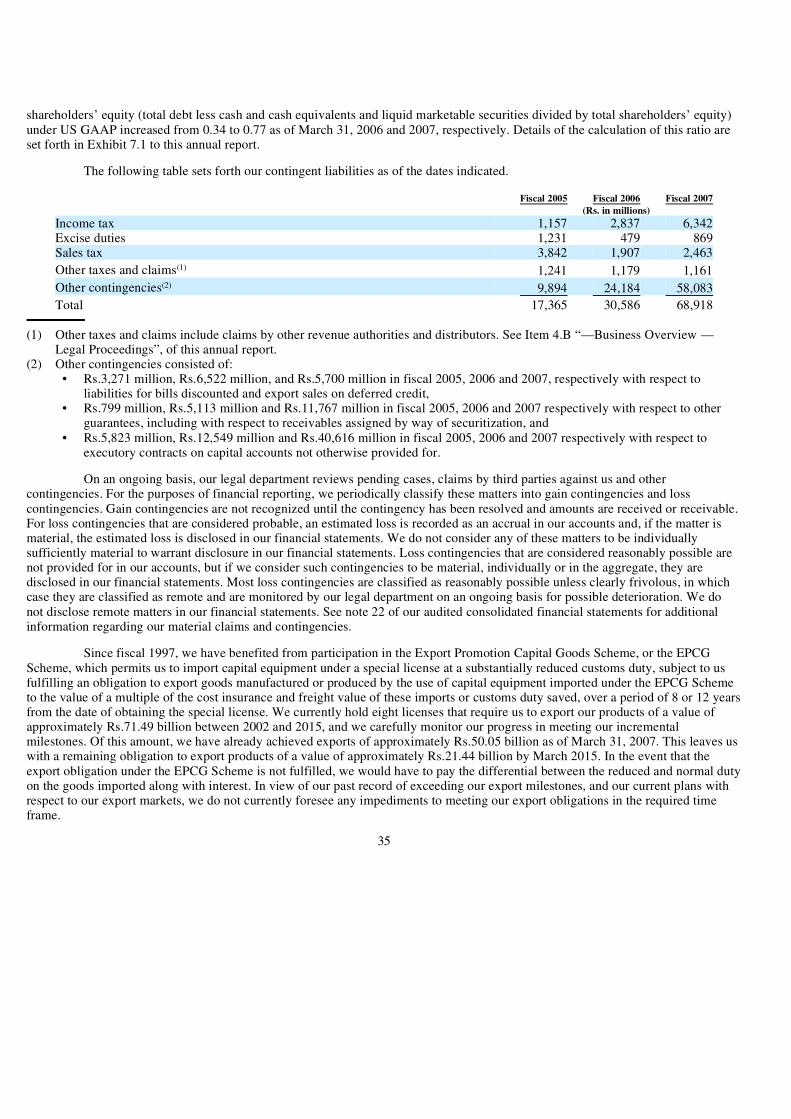
shareholders’ equity (total debt less cash and cash equivalents and liquid marketable securities divided by total shareholders’ equity) under US GAAP increased from 0.34 to 0.77 as of March 31, 2006 and 2007, respectively. Details of the calculation of this ratio are set forth in Exhibit 7.1 to this annual report.
The following table sets forth our contingent liabilities as of the dates indicated.
On an ongoing basis, our legal department reviews pending cases, claims by third parties against us and other contingencies. For the purposes of financial reporting, we periodically classify these matters into gain contingencies and loss contingencies. Gain contingencies are not recognized until the contingency has been resolved and amounts are received or receivable. For loss contingencies that are considered probable, an estimated loss is recorded as an accrual in our accounts and, if the matter is material, the estimated loss is disclosed in our financial statements. We do not consider any of these matters to be individually sufficiently material to warrant disclosure in our financial statements. Loss contingencies that are considered reasonably possible are not provided for in our accounts, but if we consider such contingencies to be material, individually or in the aggregate, they are disclosed in our financial statements. Most loss contingencies are classified as reasonably possible unless clearly frivolous, in which case they are classified as remote and are monitored by our legal department on an ongoing basis for possible deterioration. We do not disclose remote matters in our financial statements. See note 22 of our audited consolidated financial statements for additional information regarding our material claims and contingencies.
Since fiscal 1997, we have benefited from participation in the Export Promotion Capital Goods Scheme, or the EPCG Scheme, which permits us to import capital equipment under a special license at a substantially reduced customs duty, subject to us fulfilling an obligation to export goods manufactured or produced by the use of capital equipment imported under the EPCG Scheme to the value of a multiple of the cost insurance and freight value of these imports or customs duty saved, over a period of 8 or 12 years from the date of obtaining the special license. We currently hold eight licenses that require us to export our products of a value of approximately Rs.71.49 billion between 2002 and 2015, and we carefully monitor our progress in meeting our incremental milestones. Of this amount, we have already achieved exports of approximately Rs.50.05 billion as of March 31, 2007. This leaves us with a remaining obligation to export products of a value of approximately Rs.21.44 billion by March 2015. In the event that the export obligation under the EPCG Scheme is not fulfilled, we would have to pay the differential between the reduced and normal duty on the goods imported along with interest. In view of our past record of exceeding our export milestones, and our current plans with respect to our export markets, we do not currently foresee any impediments to meeting our export obligations in the required time frame.
35
Fiscal 2005 Fiscal 2006 Fiscal 2007 (Rs. in millions)Income tax 1,157 2,837 6,342Excise duties 1,231 479 869Sales tax 3,842 1,907 2,463Other taxes and claims(1) 1,241 1,179 1,161Other contingencies(2) 9,894 24,184 58,083
Total 17,365 30,586 68,918
(1) Other taxes and claims include claims by other revenue authorities and distributors. See Item 4.B “—Business Overview — Legal Proceedings”, of this annual report.
(2) Other contingencies consisted of:
• Rs.3,271 million, Rs.6,522 million, and Rs.5,700 million in fiscal 2005, 2006 and 2007, respectively with respect to
liabilities for bills discounted and export sales on deferred credit,
• Rs.799 million, Rs.5,113 million and Rs.11,767 million in fiscal 2005, 2006 and 2007 respectively with respect to other
guarantees, including with respect to receivables assigned by way of securitization, and
• Rs.5,823 million, Rs.12,549 million and Rs.40,616 million in fiscal 2005, 2006 and 2007 respectively with respect to
executory contracts on capital accounts not otherwise provided for.

Finance Receivables In fiscal 2007 and 2006, 31% and 24%, respectively, of our sales volumes were financed under hire-purchase/loan
contracts to our customers. As of March 31, 2007 and 2006, our customer finance receivable portfolio was comprised of 383,738 contracts and 228,838 contracts, respectively, with gross stock-on-hire of approximately Rs.157,330 million and Rs.90,167 million, respectively. We follow specified internal procedures including quantitative guidelines for selection of our finance customers to assist in managing default and repayment risk in our portfolio, and take security against loans extended. We originate all the contracts through our authorized dealers with whom we have long-term agreements. All our marketing and sales activity is undertaken through dealers, including our division known as Tata Motorfinance and our subsidiary company Tata Motor Finance Ltd., and collections are carried out by our authorized dealers.
We securitize or sell most of our finance receivables on a regular basis to monetize these assets. We undertake a sale of the receivables in respect of finance agreements due from pools of purchasers. The constitution of these pools is based on criteria that are decided by credit rating agencies and/or based on the advice that we receive as to the marketability of a pool. We undertake these securitizations of our receivables in either or both of the following forms:
We act as collection agent on behalf of the investors, representatives, special purpose vehicles or banks in whose favor the receivables are to be assigned, for the purpose of collecting receivables from the purchasers on the terms and conditions contained in the applicable deeds of securitization in respect of which pass-through certificates are issued to investors. We also secure the payments to be made by the purchasers of amounts constituting the receivables under the hire-purchase agreements to the extent specified by rating agencies by any one or all of the following methods:
The following table sets forth details of the securitization undertaken by us as of the periods indicated:
Recent Developments.
On July 11, 2007, we issued an aggregate principal amount of US $ 490 million (Rs.19,927.08 million) of Zero Coupon Convertible Alternative Reference Securities (“CARSTM”) due on July 12, 2012. The noteholders have an option to convert these notes into (i) in the event there has been a Qualifying Issue (as defined in the Indenture relating to the CARSTM ) by the time of conversion, into Qualified Securities (“QSs”), or (ii) in the event that there has not been a Qualifying Issue by the time of conversion or there has been a Qualifying Issue but we notify the holders of the CARS™ (the “Holders”) that the CARS™ are no longer convertible into QSs, into our newly issued ordinary shares, or ADSs, each currently representing one Share, at the option of the Holders.
In June 2007, we launched two new products: the Magic and the Winger. The Magic, developed on the platform of our successful Tata Ace, is a four-wheel vehicle for public transportation in the urban and rural areas. The Winger—India’s only maxi-van, offers a blend of the comfort of a car with the spaciousness of a bus for intra-city and long distance transportation needs. We believe that the two products will create new segments and in a complementary manner help to cover the full spectrum of customer needs in mass transportation.
On September 18, 2007, Mr. Praveen P. Kadle resigned from his position as Executive Director (Finance and Corporate Affairs) of Tata Motors and was appointed as Managing Director of Tata Capital Limited. Tata Capital Limited is a new company promoted by Tata Son, and will be the main financial services provider among the Tata Sons promoted entities. Mr. C. Ramakrishnan was appointed as the Chief Financial Officer of Tata Motors with effect from September 18, 2007.
• assignment of the receivables due from purchasers under hire-purchase agreements; and
• securitization of receivables due from purchasers by means of private placement.
• by furnishing to the investors collateral, in respect of the obligations of the purchasers and the undertakings to be provided
by us;
• by depositing, in favor of the investors, amounts not exceeding 10% of the gross receivables as cash collateral to secure the
obligations of the purchasers and our obligations as the collection agent; and
• by way of over-collateralization or by investing in subordinate pass-through certificates to secure the obligations of the
purchasers.
Fiscal 2006 Fiscal 2007 (Rs. million )
Securitized value 72,684 122,967 Balance payable 35,972 59,847 Overdue as a % of amount securitized 1.3% 2.2%

Capacity expansion plans. We have acquired land on a long term lease in Singur at West Bengal and Dharwad at Karnataka for setting up additional
manufacturing capacities for passenger and commercial vehicles.
36

C. Research and Development, Patents and Licenses, etc.
Please see Item 4.B of this annual report for the information required by this item.
D. Trend Information. Please see Item 5.A of this annual report for the information required by this item.
E. Off-balance Sheet Arrangements We use off-balance sheet arrangements where the economics and sound business principles warrant their use. Our principal
use of off-balance sheet arrangements occurs in connection with the securitization and sale of finance receivables generated in the ordinary course of our business. The receivables securitized and sold consist primarily of retail loans secured by vehicles sold through our dealer network.
Assets in off-balance sheet entities were as follows:
We have provided bank guarantees aggregating Rs. 11,767 million relating to certain securitized receivables to certain special purpose entities (“SPEs”). Our liability would crystallize in the event customers fail to fulfill their obligations under the contract and the SPE serves a notice of shortfall in collections on us. The term of each guarantee depends upon the weighted average term of each pool of finance receivables securitized. In the event a guarantee is called, we have the right to repossess the financed vehicle and to auction the vehicle. The maximum potential amount of future payment that we would be required to make is Rs.11,767 million as of March 31, 2007. We have recognized a liability of Rs.1,079 million for these guarantees.
F. Tabular Disclosure of Contractual Obligations.
A. Directors and Senior Management. Board of Directors.
Under our Articles of Association, the number of our Directors cannot be less than three nor more than fifteen. At present, there are ten Directors, including a nominee Director of Tata Steel Limited, or Tata Steel. Our Board of Directors, or the Board, has the power to appoint Managing Directors and Executive Directors.
Our Articles of Association provide that the Board of Directors of Tata Steel, which, with its subsidiary, owns, as of March 31, 2007, 8.62% of our shares, has the right to nominate one Director (the Steel Director) to the Board. Dr. J.J. Irani is the current nominee Director of Tata Steel.
In addition, our Articles of Association provide that (a) our debenture holders have the right to nominate one Director (the Debenture Director) if the trust deeds relating to outstanding debentures require the holders to nominate a Director; and (b) Financial Institutions in India, have the right to nominate two Directors, (the Financial Institutions Director) to the Board pursuant to the terms of loan agreements. Currently, there is no Debenture Director or Financial Institutions Director on the Board.
Fiscal 2006 Fiscal 2007 Fiscal 2007 (in Rs. millions) (in US$ millions)Finance receivables 35,972 59,847 1,389
Payments due by Period (Rs. in millions) Total Less than 1 year 1 year to 3 years 3 years to 5 years 5 years or more
Long Term Debts 45,992 5,757 21,546 18,621 68Capital Leases 95 30 41 24 — Operating Leases 623 175 262 132 54Purchase obligations 40,616 37,983 2,633 — — Other Liabilities 8,595 — 5,237 826 2,532
Total 95,921 43,945 29,719 19,603 2,654
Item 6. Directors, Senior Management and Employees.

Mr. S. A. Naik, previously Director, retired at the Annual General Meeting held on July 9, 2007 and did not seek re-election.
In May 2007, Mr. P. M. Telang was appointed as our Executive Director and is now responsible for Commercial Vehicle Business. In August 2007, Dr. R. A. Mashelkar was appointed as our Non-Executive Independent Director.
37

The Directors may be appointed by the Board or by a General Meeting of the shareholders. The Board may appoint any person as an additional Director, but such a Director must retire at the next Annual General Meeting unless re-elected by the shareholders after complying with the provisions of the Companies Act. A casual vacancy caused on the Board due to death or resignation of a sitting member can be filled by the Board; but such a person can remain in office only for the unexpired term of the person in whose place he was appointed. On the expiry of the term, he will retire unless re-elected by the shareholders. The Board may appoint an Alternate Director in accordance with the provisions of the Companies Act to act for a Director during his absence, which period of absence shall not be less than three months.
Two-thirds of the total numbers of Directors on the Board are subject to retirement by rotation, and of these Directors, one third must retire every year. The Directors to retire are those who have been the longest in office. Our Directors are not required to hold any of our shares by way of qualification shares.
As of March 31, 2007, our Directors and Executive Officers, in their sole and joint names, beneficially held an aggregate of 77,572 shares (approximately 0.02% of our issued share capital). In addition, some of our Directors hold as trustees for various non-affiliated trusts, an aggregate of 354,976 shares (representing approximately 0.09% of our issued share capital).
The following table provides information about our current Directors, Executive Officers and Chief Financial Officer as at September 24, 2007:
Biographies Set forth below is a short biography of each of our Directors, Executive Officers and Chief Financial Officer:
Mr. Ratan N. Tata (Chairman). Mr. Tata holds a B.Sc. (Architecture) degree from Cornell University, USA and has completed the Advanced Management Program at Harvard University, USA. He joined NELCO Limited in 1962 and is the Chairman of the Tata Sons Limited and other Tata Sons promoted entities including us. Mr. Tata is associated with various organizations in India and abroad. He is the Chairman of the Government of India’s Investment Commission and a member of Prime Minister’s Council on Trade and Industry, the National Hydrogen Energy Board and the National Manufacturing Competitiveness Council. He also serves, on the International Investment Council, South Africa, the International Business Advisory Council of the British Government, the Asia-Pacific Advisory Committee to the Board of Directors of the New York Stock Exchange and the International Advisory Boards of the Mitsubishi Corporation, the American International Group and JP Morgan Chase. Mr. Tata has been on our Board since August 1981 and has spent more than 14 years in an executive capacity and is actively involved with product development and other business strategies pursued by us.
Name Position
Date of Birth/Business
Address (1)
Year appointed as
Director or Executive
Officer or Chief
Financial Officer
Expiration of Term
Number ofshares
beneficiallyowned as of
September 24,
2007 (2)
Ratan N. Tata Chairman Dec. 28, 1937 1981 2008 53,288N.A. Soonawala Director Jun. 27, 1935 1989 2007 NilJ.J. Irani Director Jun. 2, 1936 1993 Non-rotational 1,850V.R. Mehta Director Jan. 12, 1934 1998 2009 9,332R. Gopalakrishnan Director Dec. 25, 1945 1998 2008 3,750N.N. Wadia Director Feb. 15, 1944 1998 2009 NilRavi Kant CEO & Managing Director Jun. 1, 1944 2000 Non-rotational NilS. M. Palia Director Apr. 25,1938 2006 2010 200P. M. Telang Executive Director Jun. 21, 1947 2007 2012 1120R. A. Mashelkar Director Jan. 1, 1943 2007 2008 NilC. Ramakrishnan Chief Financial Officer Jun. 27, 1955 2007 — 372
(1) The business address of each of our Directors, Executive Officers and Chief Financial Officer, other than as described immediately below, is Bombay House, 24 Homi Mody Street, Mumbai 400 001. The business address of V.R. Mehta is Ganesh Deep, 373, Anand Vihar, Block ‘D’, New Delhi 110 092, India, the business address of N.N. Wadia is The Bombay Dyeing & Manufacturing Co. Ltd., Hemming Building Office, Pandurang Budhkar Marg, Prabhadevi, Mumbai 400 025, India, the business address of S. M. Palia is 16, Ruchir Bungalows, Vastrapur, Beyond Sarathi Hotel, Ahmedabad-380054, the business address of R. A. Mashelkar is Raghunath, D-4, Varsha Park, Baner, Pune 411045, India.
(2) Each of our Directors, Executive Officers and Chief Financial Officer beneficially owns less than 1% of our shares as of March 31, 2007.
Mr. N.A. Soonawala. Mr. Soonawala is an honors graduate in commerce from the University of Bombay and a Chartered Accountant from the Institute of Chartered Accountants of India. He has wide exposure in the field of finance, including having previously worked with ICICI, Washington. He joined Tata Sons Limited in 1968 and was a Finance director until June 2000. He is on the boards and committees of various Tata Sons promoted entities including Tata Sons as Director. Mr. Soonawala has been on our Board since May 1989.
Dr. J.J. Irani. Dr. Irani obtained a B.Sc. degree from Science College, Nagpur in 1956 with a Gold Medal in Geology and a M.Sc. (Geology) degree from the Nagpur University in 1958, both with first class. He also obtained M.Met. and Ph.D. degrees from the University of Sheffield, UK, in 1960 and 1963 respectively, with a Gold Medal for the Ph.D. Thesis. In 1993, the University of Sheffield conferred upon him the Honorary Degree of “Doctor of Metallurgy”. Dr. Irani was conferred an honorary knighthood in 1997 by the Queen of England for his contribution towards strengthening the Indo-British Partnership. He is also on the boards of various Tata companies and has been on our Board as a Tata Steel Nominee since June 1993.
38

Mr. V.R. Mehta. Mr. Mehta holds a B.E. (Honours) degree from the University of Rajasthan. Mr. Mehta has considerable financial and project evaluation expertise, both at national and international levels. Mr. Mehta worked as a senior expert for the Asian Development Bank and earlier held a senior level position with the Indian Federal Ministries of Railways, Shipping and Transport. He played a key role in financial revamping and rationalization processes of major ports in India and has participated in important diplomatic missions and has represented India in International Conferences. Mr. Mehta is on the Board of other companies in his individual capacity or a nominee of financial institutions or foreign companies. Mr. Mehta joined our Board in June 1998 as a Financial Institutions nominee and is now on the Board in his individual capacity since September 2005.
Mr. R. Gopalakrishnan. Mr. Gopalakrishnan holds a Bachelor’s degree in Science and a B.Tech (Electronics) degree from the Indian Institute of Technology (IIT), Kharagpur. He is also an Executive Director of Tata Sons Limited and a member of the Group Executive Office of Tata Sons Limited, besides being on the Boards of various Tata companies. Prior to joining Tata Motors in August 1998, he was the Vice-Chairman of Hindustan Lever Limited.
Mr. N.N. Wadia. Educated in the UK, Mr. Wadia is the Chairman of Bombay Dyeing & Manufacturing Company Limited and heads the Wadia Group. He is also the Chairman/Trustee of various charitable institutions and non-profit organizations. Mr. Wadia has been on our Board since December 1998.
Mr. S. M. Palia. Mr. Palia is a graduate, both in Commerce and Law with CAIIB and AIB ( London ) degree in banking. Mr.Palia was a development banker by profession prior to his retirement. From 1964-1989, he worked for the Industrial Development Bank of India, where he held a number of positions, including that of an Executive Director. He has also acted as an advisor to the Industrial Bank of Yeman and the Industrial Bank of Sudan, under World Bank assistance programmes. In addition, he was the Managing Director of Kerala Industrial and Technical Consultancy Organization Limited, a company set up to provide consultancy services to micro, small and medium enterprises. Mr. Palia is on the Boards of various companies in the industrial and financial service sectors and is also actively involved as a trustee in various non governmental organizations and trusts. He was appointed on our Board with effect from May 19, 2006. Mr. Palia is also the financial expert on the Audit Committee.
Dr. R. A. Mashelkar, Dr. Mashelkar is a chemical engineer who has recently retired from the post of Director General from the CSIR, an industrial research and development institutions chain. Dr. Mashelkar is the President of the Indian National Science Academy (INSA), National Innovation Foundation, Institution of Chemical Engineers, and UK and Global Research Alliance. Dr. Mashelkar has also been elected as a Fellow / Associate of the Royal Society (FRS), London (1998), National Academy of Science (USA) (2005), US National Academy of Engineering (2003), Royal Academy of Engineering, UK (1996) and World Academy of Art & Science, USA (2000). Dr Mashelkar has won over 50 awards and medals at national and international levels, including the JRD Tata Corporate Leadership Award and the Stars of Asia Award (2005).
Mr. Ravi Kant (Managing Director). Mr. Kant holds a Bachelor of Technology degree from the IIT, Kharagpur and a Masters in Science in management techniques from Aston University, Birmingham, UK. Mr. Kant has wide and varied experience in the manufacturing and marketing field, particularly in the automobile industry. Prior to joining us, he was with Philips India Limited as Director of Consumers Electronics business and prior to that, with LML Ltd. as Senior Executive Director (Marketing) and Titan Watches Limited as Vice President (Sales & Marketing). Mr. Kant was also employed with Kinetic Engineering Limited, Hindustan Aluminum Company Limited and Hawkins Cookers Limited. Mr. Kant had been an Executive Director since May 2000, responsible for manufacturing and marketing of commercial vehicles and manufacturing of utility vehicles and was appointed as our Managing Director on July 29, 2005 and now overseas our day to day operations. Mr. Kant is our CEO.
Mr. P. M. Telang (Executive Director). Mr. Prakash Telang holds a Bachelor’s Degree in Mechanical Engineering and an MBA from IIM, Ahmedabad. Mr. Telang has over three decades of functional expertise in the automotive industry and machinery manufacturing. From August 1967 to June 1970, he served as Assistant Engineer at M/s Larsen & Toubro, he joined the TAS (Tata Administrative Services) cadre in June 1972. Since joining Tata Motors Limited, he has been responsible for product development, manufacturing, sales and marketing functions of the Strategic Business unit of the Light & Small Commercial Vehicles division. Mr. Telang has been appointed as Executive Director (Commercial Vehicles) of the Company effective May 18, 2007.
(Chief Financial Officer) Mr. C. Ramakrishnan. Mr. C. Ramakrishnan, aged 51 years, joined Tata Motors Limited in 1980 as a Junior Accounts Officer in
H.O. Accounts, Mumbai. He handled corporate treasury and accounting functions as well as management accounting. After a two-year company-wide IT project responsibility covering R&D, manufacturing, sourcing and sales & service, he has been working in the Chairman’s Office for the last 6 years. Mr. Ramakrishnan holds a B.Com. degree and is a qualified Chartered Accountant and Cost Accountant. Post Mr Kadle’s resignation as Executive Director and Chief Financial Officer, Mr Ramakrishnan was appointed as the Chief Financial Officer of Tata Motors with effect from September 18, 2007.
There is no family relationship between any of our Directors, Executive officers or Chief Financial Officer.
B. Compensation.

The following table provides the annual compensation paid to our Directors and Executive Officers for fiscal 2007.

39
Name Position Remuneration 2 (in Rupees)
Ratan N. Tata 4 Chairman 5,331,000N.A. Soonawala Director 3,645,000J.J. Irani Director 1,520,000J.K. Setna 1, 4 Director 965,000V.R. Mehta 4 Director 6,480,000R. Gopalakrishnan5 Director 2,530,000N.N. Wadia Director 745,000S.A. Naik Director 2,530,000S.M. Palia Director 1,840,000Ravi Kant 3 Managing Director & CEO 24,051,000P.P. Kadle 3, 5, 6 Executive Director & CFO 21,682,000C. Ramakrishnan 3, 5, 7 Chief Financial Officer 8,735,000
1 Ceased to be a Director with effect from July 11, 2006. 2 Includes salary, allowance, taxable value of perquisites, commission and our contribution to provident fund and superannuation
fund for Managing/Executive Directors and sitting fees and commission for Non-Executive Directors. 3 Rounded to nearest thousands of rupees and excludes provision for cashable leave and gratuity as a separate actuarial valuation
is not available. 4 The remuneration paid to Mr. J. K. Setna and Mr. V. R. Mehta includes sitting fees and commission paid by Telco Construction
Equipment Company Limited and in case of Mr. V. R. Mehta sitting fees paid by TML Financial Services Ltd. and for Mr. R. N. Tata sitting fees paid by Tata Motors European Technical Centre plc.
5 The above does not include Employee Stock Options granted by TTL, our unlisted subsidiary, to Mr. R. Gopalakrishnan and Mr. C. Ramakrishnan who have exercised 10,000 options each, which were vested in them during fiscal 2006 and 2007 (at 5000 options p.a.), respectively, at Rs.30 per share of TTL and Mr. P.P. Kadle who has exercised 5,000 options, which were vested in him during fiscal 2007 at Rs.30 per share of TTL.
6 Ceased to be Executive Director and Chief Financial Officer with effect from September 18, 2007 7 Chief Financial Officer with effect from September 18, 2007.

Apart from the above, the Managing and Executive Director are also eligible to receive special retirement benefits at the discretion of the Board on their retirement, which include housing, monthly pension and medical benefits.
Our Managing Director and our Executive Director are entitled to six months’ salary as severance fees upon termination of their contracts by us.
C. Board Practices. The Board size of ten directors is commensurate with our size and in line with the industry. The Board consists of
executive, non-executive and independent directors. Appointments of new directors are considered by the full Board and our shareholders at each year’s Annual General Meeting.
The role of the Chairman and the Chief Executive are distinct and separate with appropriate powers being delegated to the Managing Director and the Executive Directors to perform the day to day activities of the Company.
The Board, along with its Committees, provides leadership and guidance to our management, in particular with respect to corporate governance, business strategies and growth plans, the identification of risks and their mitigation strategies, entry into new businesses, product launches, demand fulfillment and capital expenditure requirements, and the review of our plans and targets.
The Board has delegated powers to the Committees of the Board through written/stated terms of reference and oversees the functioning operations of the Committees through various circulars / minutes circulated to it. The Board also undertakes our subsidiaries’ oversight functions through review of their performance against their set targets, advises them on growth plans and, where necessary, gives strategic guidelines.
Committees. The Audit Committee is comprised of the following three independent directors: V. R. Mehta, Chairman, S. M. Palia, S A
Naik (until July 2007) and N. N. Wadia. The scope of the Audit Committee includes:
40
• Reviewing the quarterly financial statements before submission to the Board, focusing primarily on: - any changes in accounting policies and practices and reasons for any such change;
- major accounting entries involving estimates based on an exercise of judgment by Management; - qualifications in draft audit reports; - significant adjustments arising out of audits; - compliance with accounting standards; - analysis of the effects of alternative GAAP methods on the financial statements;
- compliance with listing and other legal requirements concerning financial statements;
- disclosure of related party transactions;
- review Reports on the Management Discussion and Analysis of financial condition Report, Results of Operations and the
Directors’ Responsibility Statement;
- overseeing our financial reporting process and the disclosure of its financial information, including any earnings press
release, to ensure that the financial statements are correct, sufficient and credible; and
- disclosures made under the CEO and CFO certification to the Board and investors. • Reviewing with the management, external auditor and internal auditor the adequacy of our internal control systems and
recommending improvements to the management. • Recommending the appointment / removal of the statutory auditor, fixing audit fees and approving non-audit, consulting
services provided by the firms of statutory auditors to us and our subsidiaries; evaluating auditors performance, qualifications and independence.
• Reviewing the adequacy of the internal audit function, including the structure of the internal audit department, coverage and frequency of internal audits, appointment, removal, performance and terms of remuneration of the chief internal auditor.
• Oversight of the companies external financial reporting and monitoring components of internal control over financial reporting.

The Committee has also adopted policies for the approval of services to be rendered by our independent statutory auditor, based on a procedure for ensuring such auditor’s independence and objectivity, as well as for the oversight of audit work for streamlining the audit process across our subsidiaries.
The Remuneration Committee is empowered to review the remuneration of whole-time directors, retirement benefits to be paid to them and dealing with matters pertaining to Employees’ Stock Option Scheme.
We have not issued any stock options to our directors/employees. The Remuneration Committee is comprised of two independent and two non-executive directors, namely N.N. Wadia (from July 2007), Chairman, Ratan N. Tata, N.A. Soonawala, V.R. Mehta and S. A. Naik (until July 2007).
The Investor Grievance Committee oversees the redressing of investors’ complaints pertaining to securities transfers, interest/dividend payments, non-receipt of annual reports, issue of duplicate certificates and other miscellaneous complaints. Its scope also includes delegation of powers to the executives of the Company or the share transfer agents to process share transfers and other investor-related matters. The Investor Grievance Committee is comprised of R. Gopalakrishnan, S. A. Naik (until July 2007), S. M. Palia, Ravi Kant and P. P Kadle (until September 18, 2007).
The Executive Committee of the Board is comprised of Ratan N. Tata, Chairman, N. A. Soonawala, J. J. Irani, R. Gopalakrishnan, N. N. Wadia, Directors, Ravi Kant, Managing Director and P. P. Kadle, (until September 18, 2007). This Committee came into effect from July 25, 2006, upon the dissolution of the Finance Committee and the Committee of the Board. The Committee reviews revenue and capital expenditure budgets, long-term business strategy, the organizational structure, raising of finance, property related issues, review and sale of investments and the allotment of securities within established limits.
The Ethics and Compliance Committee sets forth policies relating to the implementation of the Tata Code of Conduct for Prevention of Insider Trading, and takes on record the monthly reports and dealings in securities by the “Specified Persons”. It also implements appropriate actions in respect of violations of the Tata Code of Conduct. The Ethics and Compliance Committee is comprised of R. Gopalakrishnan, S. A. Naik (until July 2007) and S. M. Palia. P. P. Kadle, was the Compliance Officer under the said Code until his resignation as Executive Director of Tata Motors with effect from September 18, 2007. Mr. C. Ramakrishnan, our new Chief Financial Officer, currently perform the functional equivalent of the position of compliance officer and is expected to be appointed as the new Compliance Officer.
The Nominations Committee was constituted on July 25, 2006, with the objective of identifying independent directors to be appointed to the Board from time to time to refresh its constitution. The Nominations Committee is comprised of N. N. Wadia, Chairman, Ratan N. Tata, N. A. Soonawala and S. M. Palia.
Apart from the Committees described above, the Board of Directors also constitutes committee(s) of Directors with specific terms of reference as it may deem fit.
Summary Comparison of Corporate Governance Practices The following is a summary comparison of significant differences between our corporate governance practices and those
required by the NYSE for non-U.S. issuers.
• Discussing with the internal auditor and senior management, significant internal audit findings and follow-up thereon.
• Reviewing the findings of any internal investigation by the internal auditor into matters involving suspected fraud or irregularity or a failure of internal control systems of a material nature and reporting any such matters to the Board.
• Discussing with the external auditor before the audit commences the nature and scope of such audit, as well as conducting post-audit discussions to ascertain any area of concern.
• Reviewing our financial and risk management policies.
• Reviewing the effectiveness of the system for monitoring compliance with laws and regulations. • Initiating investigations into the reasons for substantial defaults in payments to the depositors, debenture holders, shareholders
(in case of non payment of declared dividends) and creditors.
• Reviewing the functioning of the Whistle-Blower mechanism (which is an extension of the Tata Code of Conduct). • Reviewing the financial statements and investments made by our subsidiary companies.

Independent directors: The Board has determined the independence of its directors pursuant to applicable Indian listing requirements. Four directors of the Board of Directors are independent directors pursuant to such requirements. Under such requirements, a non-executive director is considered independent if he:
41
• apart from receiving director’s remuneration, does not have any material pecuniary relationships or transactions with us or our promoters, our directors, our senior management or our holding company, its subsidiaries and associates which may affect the independence of the director;
• is not related to promoters or person occupying management position at the board level or at one level below the board;
• has not been our executive in the immediately preceding three financial years;
• is not a partner or an executive or was not a partner or an executive during the preceding three years, of our statutory audit firm or internal audit firm or a legal/consulting firm that has a material association with us.
• is not a material supplier, service provider or customer or a lessor or lessee of the Company, which may affect their independence; and
• is not our substantial shareholders, owning two percent or more of our voting shares.

Non-management directors meetings: There is no such requirement under applicable Indian legal requirements.
Board Governance and Remuneration Committee and the Audit Committee: The requisite number of members of our Board Governance and Remuneration Committee are independent, as defined under applicable Indian legal requirements. All members of our Audit Committee are independent as defined under Rule 10A-3 under the Exchange Act. The constitution and main functions of these committees as approved by our Board are described above and, we believe, comply with the spirit of the NYSE requirements for non-U.S. issuers.
D. Employees. We consider our human capital as a critical factor to our success. Under the aegis of Tata Sons and the Tata Sons promoted
entities, we have drawn up a comprehensive human resource strategy that addresses key aspects of human resource development such as:
In line with the Human Resource strategy, we, in turn, have recently implemented various initiatives in order to build better organizational capability that we believe will enable us to sustain competitiveness in the global market place.
Our human resources focus is to attract talent, retain the better and advance the best.
Some of the initiatives to meet this objective include:
Other initiatives include:
We employed approximately 29,500; 33,536 and 33,900 permanent employees as of March 31, 2005, 2006 and 2007, respectively. The average number of temporary employees for the fiscal year ended March 31, 2007, was approximately 17,832.
The following tables set forth a breakdown of persons employed by our business segments and by geographic location as of March 31, 2007.
• Code of conduct and fair business practices.
• A fair and objective performance management system linked to the performance of the businesses which identifies and
differentiates high performers while offering separation avenues for non-performers.
• Creation of a common pool of talented managers across Tata Sons and the Tata Sons promoted entities with a view to
increasing their mobility through inter-company job rotation.
• Evolution of performance based compensation packages to attract and retain talent within Tata Sons and the Tata Sons
promoted entities. • Development of comprehensive training programs to impart and continuously upgrade the industry/function specific skills.
• Recruitment across the country to meet the requirements of the expansion plans.
• Extensive process mapping exercise to benchmark and align the human resource processes with global best practices.
• Introduction of a globally benchmarked employee engagement survey.
• Succession planning through identification of second level of managers for all units, locations, functions.
• Implementation of a “Fast Track Selection Scheme”, which is a system for identifying potential talent in the areas of
general, commercial and operations management and offering them opportunities for growth within the organization. Our human resources team has been invited to replicate this system in other Tata companies.
• Our “Talent Management Scheme” which includes the identification of high performers and high potentials through
various routes such as our Performance Management System and Development Centers. Subsequent to the identification process, we provide them with challenging assignments for faster development.
• Introduction of performance rating based salary review and quality linked variable payment for supervisory category of
employees.
• Extensive brand building initiatives at university campuses to increase recruiting from premium universities • Introduction of an employee self service portal and employee help desk for the benefit of employees.

42
Segment No. of Employees Location No. of Employees Automotive 29,024 India 31,942Other 4,876 Abroad 1,958Total 33,900 Total 33,900

Training and Development We are committed to building the competences of our employees and improving their performance through training and
development. Our focus is on identifying gaps in our employees’ competencies and preparing employees for changes in competitive environments, as well as to meet organizational challenges.
Some of the focus areas in training in the last year centered on leadership, innovation management and internationalization besides other training programmes to drive a change in our employees’ outlook as we continue to develop as a global competitor. Developmental initiatives for our senior leadership were undertaken through international programs at various premier institutions around the world. The entire senior leadership was also taken through cultural sensitivity programme conducted by world renowned faculty. Certain employees have also been selected for the Fulbright fellowships for leadership in management. In addition, in order to emphasize the sharing of skills across our locations and functions extensive technical training programs were organized in Pune, Jamshedpur and Lucknow. The technical exposure was enhanced further through international training and participation at international seminars.
At Jamshedpur, Pune and Lucknow in India, we have also established training divisions that impart basic skills in various trades like milling, grinding and welding to our young apprentices. We received the National Best Training Establishment award from the Government of India for the eighth time.
Union Wage Settlements All our regular employees in India, other than management, are members of labor unions. We have generally enjoyed
cordial relations with our employees at our factories and offices.
Employee wages are paid in accordance with wage agreements that have varying terms (typically three years) at different locations. The expiration dates of the wage agreements with respect to various locations are as follows:
A cordial industrial relations environment prevailed in all our manufacturing units.
The performance rating system, introduced for the first time, for the bargainable category in Mumbai and PCBU, has completed two full cycles and the feedback of the process received from all the quarters has been encouraging. Return-ability in wage settlements was built in by introducing quality linked payments based on a quality index as perceived by the customer.
Operatives support in the outsourcing low value added activities and in the implementation of other reforms that impact quality, cost cutting and productivity improvements across all locations.
E. Share Ownership. The information required by this item is set forth in Item 6.A of this annual report.
A. Major Shareholders We are a widely held, listed company with approximately 234,629 shareholders of record. To our knowledge, as of July 1,
2007, the following persons beneficially owned 1% or more of our 385,381,536 Ordinary Shares outstanding at that time:
Location Wage Agreement valid until
Pune CVBU August 31, 2009
Pune Car Plant August 31, 2007
Jamshedpur March 31, 2010
Mumbai January 31, 2009
Lucknow March 31, 2008
Item 7. Major Shareholders and Related Party Transactions.

43
Name of Shareholder Holding Percentage
Tata Sons Limited and subsidiaries 84,988,908 22.05Citibank N.A., as Depositary(2) 42,294,157 10.97Tata Steel Ltd.(1) and subsidiaries 33,226,383 8.62DaimlerChrysler AG 25,596,476 6.64Life Insurance Corporation of India Ltd. 23,519,685 6.10Tata Industries Limited 7,734,255 2.01HSBC Global Investment Funds A/C HSBC Global Investment Funds Mauritius
Limited 7,032,699 1.82The New India Assurance Company Limited 5,306,110 1.38Merrill Lynch Capital Markets Espana S.A. S.V. 4,248,426 1.10
(1) Formerly, Tata Iron and Steel Company Limited
(2) Citibank, N.A. as depositary for our ADRs, was the holder on record on July 2007 of 42,294,157 shares on behalf of
the beneficial owners of deposited shares.

From March 31, 2004 to March 31, 2007, the holdings of our largest shareholder, Tata Sons Limited (together with its subsidiaries), have marginally declined from 22.55% to 22.05%. Tata Steel Ltd. (together with its subsidiaries) has substantially increased its shareholdings, but its percentage shareholding has decreased slightly from 9.22% as of March 31, 2004 to 8.62% as of March 31, 2007, as a result of our new issuances of shares. Daimler Chrysler AG has kept its shareholdings steady, but its percentage shareholding has declined from 7.25% to 6.64% as a result of our new issuances of shares. Citibank N.A. as Depositary for our ADRs, has increased its shareholding from 7.12% to 10.97% because of the two-way fungibility of Depositary Receipts. Life Insurance Corporation of India Limited has increased its shareholding and has seen its shareholding percentage increase from 5.50% to 6.10%.
According to our register of shareholders and register of beneficial shareholders, as of March 31, 2007, there were 248 record holders of our shares with addresses in the United States, whose shareholdings represented approximately 0.05% of our outstanding Ordinary Shares on that date, excluding any of our shares held by United States residents in the form of depositary shares. Because some of these shares were held by brokers or other nominees, the number of record holders with addresses in the United States may be fewer than the number of beneficial owners in the United States.
The total permitted holding of Foreign Institutional Investors, or FIIs, in our paid up share capital has been increased to 35% by a resolution passed by our shareholders on January 22, 2004. The holding of FIIs in us as of March 31, 2007, was approximately 18.01%. See Item 10.D “— Exchange Controls” for further details.
None of our shares of common stock entitles the holder to any preferential voting rights.
Under the Takeover Regulations of India, any person who acquires more than 5%, 10% , 14%, 54% or 74% of our shares or who is entitled to exercise voting rights with respect to more than 5%, 10%, 14%, 54% or 74% of our shares must file a report concerning the shareholding or the voting rights with us and the stock exchanges on which our ordinary shares are traded. Please see Item 9.A “— The Offer and Listing —Markets” for information with respect to these stock exchanges. Similar disclosures would be applicable under the Insider Trading Regulations of India with respect to any person who acquires more than 5% of our shares or voting rights with respect to the shares. Any increases or decreases by 2% or more in the shareholding by such persons must also be disclosed. Furthermore, under our listing agreement with the stock exchanges where our shares are listed, we are required to periodically disclose to such stock exchanges the name and percentage of shares held by persons or entities that hold more than 1% of our Ordinary Shares. For the purposes of the above, reporting and takeover requirements under our listing agreements, shares withdrawn from our ADS facility will be included as part of a person’s shareholding in us.
To our knowledge, we are not, directly or indirectly, owned or controlled by any other corporation or by any government or by any other natural or legal persons severally or jointly. We are not aware of any arrangements the operation of which may at a later time result in our change of control.
For details regarding voting rights, please refer to Item 10.B “— Memorandum and Articles of Association — Voting Rights”.
44

B. Related Party Transactions. Business Relationships
We purchase materials, supplies, assets and services from numerous suppliers throughout the world in the ordinary course of business, including from our affiliates and firms with which certain members of our board of directors are interested. We purchased materials, supplies, fixed assets and services from these entities in the amount of Rs.13,701 million, Rs.16,498 million and Rs.21,857 million in fiscal 2005, 2006 and 2007, respectively. We also sell our products, assets and services to our affiliates and firms with which certain members of our board of directors are interested. We sold products and services to these entities in the amount of Rs.3,538 million, Rs.1,468 million and Rs.2,059 million in fiscal 2005, 2006 and 2007, respectively. We believe all of these purchase and sale transactions were arm’s-length transactions, none of which were material to our overall operations. See note 26 of our audited consolidated financial statements for additional information regarding our related party transactions with our affiliates and other related parties. The foregoing do not include transactions with and among our consolidated subsidiaries, the amounts of which are eliminated upon consolidation when preparing our financial statements.
Loans We regularly have trade accounts and other receivables payable by, and accounts payable to, our affiliates and firms with
which certain members of our board of directors are interested. We had outstanding trade accounts and other receivables payable by these entities in the amount of Rs.367 million, Rs. 392 million and Rs. 158 million as of March 31, 2005, 2006 and 2007, respectively. We had accounts payable to these entities in the amount of Rs.723 million and Rs.1,284 million as of March 31, 2006 and 2007, respectively.
From time to time, we provide short to medium-term loans to our subsidiaries and affiliates, as well as loans under a loan program established by us and our affiliates to assist executives and directors with the purchase of housing. We believe that each of these loans was entered into in the ordinary course of business. The total amount receivable by us from our affiliates and other companies in which certain members of our board of directors are interested as at March 31, 2005, 2006 and 2007 was Rs.406 million Rs. 645 million and Rs. 297 million respectively. We had amounts payable for medium term loans taken from our affiliates to the tune of Rs.105 million and Rs.105 million as at March 31, 2006 and 2007, respectively.
From time to time, we also provide security deposits to the lessors of residential properties that we lease for our employees, including our Executive Directors. No extension of credit has been made, arranged or renewed by us, directly or indirectly, in the form of a personal loan to or for any of our directors or executive officers, nor has there been any material modification to any term of any such extension of credit or any renewal of any such extension of credit on or after July 30, 2002.
C. Interests of Experts and Counsel. Not applicable.
A. Consolidated Statements and Other Financial Information. Financial Statements.
The information required by this item is set forth beginning on page F-1 of this annual report.
Legal or Arbitration Proceedings. The information on legal or arbitration proceedings required by this item is set forth in Item 4.B of this annual report.
Dividend Policy. Based on the net income available for appropriation, dividends are recommended by the Board of Directors for approval by
the shareholders at our Annual General Meeting. Further, the Board of Directors may also pay an interim dividend at its discretion. Since fiscal year 1956, we have had an uninterrupted dividend distribution except for the fiscal years 2001 and 2002. We returned to dividend distribution in fiscal 2003. In view of our profitable performance, we declared dividends (net of tax) totaling) Rs.4,522 million, Rs.4,979 million and Rs.5,781 million for fiscal 2005, 2006 and 2007, respectively.
Item 8. Financial Information.
B. Significant Changes Other than as set forth in this annual report, no significant change has occurred with respect to us since the date of our
audited consolidated US GAAP financial statements included elsewhere in this annual report.
A. Offer and Listing Details. There has been no SEC-registered offering of our shares in the United States.
The details on our share and ADS price history are included in Item 9.C “— Markets” below.
45
Item 9. The Offer and Listing

B. Plan of Distribution. Not Applicable.
C. Markets. Our ADSs are have been listed on the New York Stock Exchange or NYSE, since September 27, 2004. Each ADS
represents one Ordinary Share. Our shares are listed on The Bombay Stock Exchange Limited, which is also referred to as the Bombay Stock Exchange, Mumbai or the BSE, and the National Stock Exchange of India, or NSE. The following table shows closing price and trading volume data for our ordinary shares on the NSE and BSE and for our ADSs on the NYSE:
On September 24, 2007, the reported closing price of our shares on the BSE was Rs.745.2 per share, and Rs.747.2 per share on NSE on September 24, 2007, the ADS closing price on NYSE was $18.5 per ADS.
D. Selling shareholders. Not applicable.
E. Dilution. Not applicable.
F. Expenses of the issue. Not applicable.
46
NSE
Avg DailyTradingVolume(in ‘000)
BSE
Avg Daily Trading Volume (in ‘000)
NYSE
Avg DailyTradingVolume (in ‘000)
Closing Price per
Share Closing Price per
Share Closing Price per
ADS
PeriodHigh
PeriodLow
PeriodHigh
PeriodLow
Period High
PeriodLow
(Rs. Per Share) (Rs. Per Share) ($ Per ADS)
Fiscal
2007 986.25 659.2 1590.12 985.35 658.05 435.96 22.1 14.27 417.142006 941.35 406.4 2003.55 939.00 406.2 659.20 21.5 9.3 282.992005 525.2 366.7 3,837.70 524.8 366.6 1,604.90 12.1 8.7 237.922004 563.5 422.3 4,443.10 563.3 150.2 1,765.10
2003 169.7 119.45 1,729.20 169.9 119.4 676
Fiscal 2008
1st Quarter 766.6 641.2 1615.13 766.9 641.35 362.03 19.09 15.94 630.402007
1st Quarter 986.25 660.45 1981.12 985.35 659.9 620.93 21.96 14.91 538.692nd Quarter 899.5 659.2 1600.88 898 658.05 473.04 19.5 14.27 308.813rd Quarter 912.2 802.1 1349.76 911.75 802.2 353.57 20.83 17.92 307.754th Quarter 964.75 716.45 1416.47 964.55 715.1 298.32 22.1 16.21 516.572006
1st Quarter 450.2 406.4 1,715.32 449.3 406.2 532 10.4 9.3 168.212nd Quarter 546.1 427 1780.54 545.2 426.75 563.11 12.41 9.7 245.043rd Quarter 659.55 461.6 2323.85 659.5 460.8 770.35 14.37 10.44 269.384th Quarter 941.35 617.2 2210.21 939 617.45 781.31 21.46 13.93 453.32
Month August 2007 701.75 619.5 1627.48 701.85 618.95 542.39 17.16 15.56 563.73July 2007 776.75 682.2 1532.68 778.05 684.05 348.86 19.09 16.64 557.99Jun 2007 747.95 641.2 1686.25 747.15 641.35 314.36 18.78 16.00 672.41May 2007 755.7 708 1409.18 757.5 707.95 340.47 18.64 17.33 401.96April 2007 766.6 670.9 1756.68 766.9 669.25 434.71 19.09 15.94 837.57March 2007 805.1 716.45 1687.06 805.5 715.1 365.67 18.4 16.21 682.53

A. Share Capital Our Authorised Share Capital is Rs. 4,500,000,000 divided into 450,000,000 ordinary shares of Rs.10 each.
Under the Companies Act, as well as our Articles of Association, if our share capital is divided into different classes of shares, all or any of the rights or privileges attached to each class of shares may be varied, modified or abrogated with the consent in writing of the holders of not less than three-fourths of the issued shares of that class, or with the sanction of a special resolution passed at a separate meeting of the holders of the issued shares of that class. Our Articles of Association further provide that the rights conferred upon the holders of the shares of any class issued with preferential or other rights shall not, unless otherwise expressly prohibited by the terms of the issue of the shares of that class, be deemed to be varied by the creation or issue of further shares ranking pari passu thereto.
B. Memorandum and Articles of Association Objects and Purposes
Our principal objects, as provided by Clause 3 of our Memorandum of Association, include:
Directors Under the Companies Act, as well as our Articles of Association, each of our Directors, who is in any way directly or
indirectly concerned or interested in a contract or arrangement or proposed contract or arrangement entered into or to be entered into by or on our behalf is required to disclose the nature of his interest at a meeting of the first meeting of the Board held after the Director becomes concerned. Under the Companies Act, as well as the Articles of Association, an interested Director is not allowed to take part in the discussion of, or vote on, any contract, arrangement or proposal in which the Director is interested.
Under the Companies Act and our Articles of Association, we are restricted from making loans to Directors and the prior approval of the Central Government is required before we can make any loans, directly or indirectly, to any Director or provide, directly or indirectly, any guarantees or security in connection with any loan made by a third party to a Director.
Under our Articles of Association, a director is not required to hold any qualification shares. Our Articles of Association do not prescribe an age limit for the retirement of the Directors. As per the policy adopted by our Board, executive directors retire at the age of 65 and non-executive directors retire at the age of 75.
Dividends Under the Companies Act, unless the Board recommends the payment of a dividend, the shareholders at a general meeting
have no power to declare any dividend. Subject to certain conditions laid down by Section 205 of the Companies Act, no dividend can be declared or paid by a company for any fiscal year except out of the profits of the company calculated in accordance with the provisions of the Companies Act or out of the profits of the company for any previous fiscal year(s) calculated pursuant to the provisions of the Companies Act.
Under our Articles of Association, the shareholders at a general meeting may declare a lower, but not higher, dividend than that recommended by the Board. Dividends are generally declared as a percentage of the par value. The dividend recommended by the Board and approved by the shareholders at a general meeting is distributed and paid to shareholders in proportion to the paid-up value of their shares as on the record date for which such dividend is payable. In addition, the Board may declare and pay interim dividends. The shares to be issued upon the conversion of the ADSs will be fully paid-up when delivered as provided herein. Under the Companies Act, dividends can only be paid in cash to shareholders listed on the register of shareholders on the date which is specified as the “record date” or “book closure date”. No shareholder is entitled to a dividend while any lien in respect of unpaid calls on any of their shares is outstanding.
Shares issued upon conversion of ADSs will rank pari passu with our existing shares in all respects including entitlement of the dividend declared.
Item 10. Additional Information.
• manufacturing, marketing, import, export, hiring and letting on hire of commercial vehicles, automobile cars, two wheeler
vehicles, heavy and construction equipment including components, accessories and spare parts in relation thereto;
• to carry on the business as manufacturers and dealers of machinery articles and goods of all classes;
• to carry on the business of manufacturing materials which may be usefully combined with our manufacturing and
engineering business; and
• to carry on the business of financing and re-financing of all types of vehicles, construction equipment, capital equipment
and services by way of credit, hire purchases, leases and loans.

Dividends must be paid within 30 days from the date of the declaration and any dividend which remains unpaid or unclaimed after that period must be transferred within seven days to a special unpaid dividend account held at a scheduled bank. Any money which remains unpaid or unclaimed for seven years from the date of such transfer must be transferred by us to the Investor Education and Protection Fund established by the Government pursuant to which no claim shall lie against us or the said Fund.
47

Under the Companies Act, we may only pay a dividend in excess of 10% of paid-up capital in respect of any year out of the profits of that year after we have transferred to our reserves a percentage of our non consolidated Indian GAAP profits for that year ranging between 2.5% to 10% depending on the rate of dividend proposed to be declared in that year. The Companies Act further provides that if the profit for a year is insufficient, the dividend for that year may be declared out of the non consolidated Indian GAAP accumulated profits earned in previous years and transferred to reserves, subject to the following conditions: (i) the rate of dividend to be declared may not exceed the lesser of the average of the rates at which dividends were declared in the five years immediately preceding the year, or 10% of paid-up capital; (ii) the total amount to be drawn from the accumulated profits from previous years may not exceed an amount equivalent to 10% of paid-up capital and free reserves and the amount so drawn is first to be used to set off the losses incurred in the financial year before any dividends in respect of preference or equity shares; and (iii) the balance of reserves after withdrawals must not be below 15% of paid-up capital.
Capitalization of Reserves and Issue of Bonus Shares Our Articles of Association permit us by a resolution of our shareholders in a general meeting to resolve that amounts
standing to the credit of reserves or securities premium can be capitalized by the issue of fully paid bonus shares (also referred to as a stock dividend) or by crediting shares not fully paid-up with the whole or part of any sum outstanding. Bonus shares must be issued pro rata to the amount of capital paid-up on existing shareholdings. Any issue of bonus shares would be subject to the guidelines issued by SEBI in this regard.
Calls on Shares, Pre-Emptive Rights and Alteration of Share Capital Under the Companies Act, as well as our Articles of Association, the Board of Directors may from time to time make such
calls as they think fit upon the members of the Company in respect of all moneys unpaid on the shares held by them respectively and each member is required to pay the amount of every call so made on him to the Company.
Subject to the provisions of the Companies Act, we may increase our share capital by issuing new shares on such terms and with such rights as we, by action of shareholders in a general meeting, determine. These new shares will be offered to existing shareholders listed on the members’ register on the record date in proportion to the amount paid-up on these shares at that date. The offer will be made by notice specifying the number of shares offered and the date (being not less than 15 days from the date of the offer) after which the offer, if not accepted, will be deemed to have been declined. After this date, the Board may dispose of the shares offered in respect of which no acceptance has been received, in such manner as the Board thinks most beneficial to us. The offer is deemed to include a right exercisable by the person concerned to renounce the shares offered to such person in favor of any other person provided that the person in whose favor these shares have been renounced is approved by the Board in their absolute discretion.
Under the Companies Act, new shares may be offered to any persons whether or not those persons include existing shareholders, if a special resolution to that effect is passed by the shareholders of the company in a general meeting. The issuance of shares upon conversion of our outstanding Convertible Notes has been duly approved by a special resolution of our shareholders and our shareholders have waived their pre-emptive rights with respect to these shares.
The Company can also alter its share capital by way of a reduction of capital or by undertaking a buy-back of shares under the prescribed SEBI guidelines.
Our Articles of Association provide that, by a special resolution passed at the general meeting, we may consolidate or sub-divide our share capital, convert all or any of our fully paid-up shares into stock and re-convert that stock into fully paid-up shares or cancel shares which have not been taken up by any person. The Company may also from time to time by special resolution reduce its capital.
General Meetings of Shareholders We must hold our Annual General Meeting each year within 15 months of the previous Annual General Meeting and in
any event not later than six months after the end of each accounting year, unless extended by the Registrar of Companies at our request for any special reason. Our Board of Directors may convene an Extraordinary General Meeting of shareholders when necessary or at the request of a shareholder or shareholders holding in the aggregate not less than 10% of our capital. Written notices convening a meeting setting out the date, place and agenda of the meeting must be given to members at least 21 days prior to the date of the proposed meeting. A general meeting may be called after giving shorter notice if consent is received from all shareholders in the case of an Annual General Meeting, and from shareholders holding not less than 95% of our paid-up capital in the case of any other general meeting. Currently, we give written notices to all members and, in addition, give public notice of general meetings of shareholders in a daily newspaper of general circulation in Mumbai. General meetings are generally held at some place in Mumbai. The quorum for a general meeting of the company is five shareholders personally present.

A company intending to pass a resolution relating to matters such as, but not limited to, amendment in the objects clause of the memorandum, buy back of shares under the Companies Act, giving loans or extending guarantee in excess of limits prescribed under the Companies Act, and guidelines issued thereunder, is required to obtain the resolution passed by means of a postal ballot instead of transacting the business in the general meeting of the company. A notice to all the shareholders shall be sent along
48

with a draft resolution explaining the reasons therefore and requesting them to send their assent or dissent in writing on a postal ballot within a period of 30 days from the date of posting the letter. Postal ballot voting also allows shareholders to cast their votes by electronic means.
Voting Rights At a general meeting upon a show of hands, every member holding shares and entitled to vote and present in person has
one vote. Upon a poll, the voting rights of each shareholder entitled to vote and present in person or by proxy is in the same proportion as the capital paid-up on each share held by such holder bears to the total paid-up capital. Voting is by show of hands, unless a poll is ordered by the Chairman of the meeting or demanded by shareholder or shareholders holding at least 10% of the voting rights in respect of the resolution or by those holding paid-up capital of at least Rs.50,000. The Chairman of the meeting has a casting vote.
Holders of ADSs may exercise voting rights with respect to the Ordinary Shares represented by ADSs only in accordance with the provisions of our ADS deposit agreement and Indian law. Holders of ADSs are not entitled to attend or vote at shareholders meetings. A holder of ADSs may withdraw from the ADS facility the related underlying shares and vote as a direct shareholder, but there may not be sufficient time to do so after the announcement of an upcoming vote. If requested by us, the depositary will notify holders of ADSs of upcoming votes and arrange to deliver our voting materials to holders of ADSs. The materials will describe the matters to be voted on and explain how holders of ADSs on a record date specified by the depositary may instruct the depositary to vote on the deposited securities underlying the ADSs as directed by the holders of ADSs. For the instructions to be valid, the depositary must receive them in writing on or before a date specified by the depositary. The depositary will try, insofar as practicable, subject to Indian laws and the provisions of our Articles of Association, to vote or have its agents vote the deposited securities as instructed. The depositary will only vote as instructed and is not entitled to exercise any voting discretion. If the depositary timely receives voting instructions from a holder of ADSs and which fails to specify the manner in which the depositary is to vote the shares underlying such holder’s ADSs, such holder will be deemed to have instructed the depositary to vote in favor of the items set forth in such voting instructions. If the depositary does not receive timely instructions from a holder of ADSs, the holder shall be deemed to have instructed the depositary to give a discretionary proxy to a person designated by us, subject to the conditions set forth in the deposit agreement. If requested by us, the depositary is required to represent all shares underlying the outstanding ADSs, regardless whether timely instructions have been received from the holders of such ADSs, for the sole purpose of establishing a quorum at a meeting of shareholders.
Ordinary resolutions may be passed by simple majority of those shareholders present and voting at the meeting. Special resolutions require that the votes cast in favor of the resolution must be at least three times the votes cast against the resolution. The Companies Act provides that in order to amend the Articles of Association, a special resolution is required to be passed in a general meeting. Dissolutions, mergers or consolidations, transfers of the whole or a significant part of our business to another company or taking over the whole of the business of any other company and, in any case where shareholding of public financial institutions and banks exceeds 25%, appointment of statutory auditors, each require a special resolution. Our Articles of Association do not permit cumulative voting for the election of our directors.
A shareholder may exercise his voting rights by proxy to be given in the form required by our Articles of Association. The instrument appointing a proxy is required to be lodged with the company at least 48 hours before the time of the meeting. A shareholder may, by a single power of attorney, grant a general power of representation regarding several general meetings of shareholders. Any of our shareholders may appoint a proxy. A corporate shareholder is also entitled to nominate a representative to attend and vote on its behalf at general meetings. A proxy may not vote except on a poll and does not have a right to speak at meetings. A shareholder which is a legal entity may appoint an authorized representative who can vote in all respects as if a shareholder both on a show of hands and a poll.
The Companies Act allows for a company to issue shares with differential rights as to dividend, voting or otherwise subject to other conditions prescribed under applicable law. In this regard, the laws require that for a company to issue shares with differential voting rights the company must have had distributable profits in terms of the Companies Act for a period of three financial years, the company has not defaulted in filing annual accounts and annual returns for the immediately preceding three years, the articles of association of such company must allow for the issuance of such shares with differential voting rights and such other conditions set forth in the Companies (Issue of Share Capital with Differential Voting Rights) Rules, 2001 must be fulfilled.
Convertible Securities/Warrants We may issue from time to time debt instruments that are partly and fully convertible into shares and/or warrants to
purchase shares.
Register of Shareholders and Record Dates We are obliged to maintain a register of shareholders at our registered office in Mumbai or at some other place in the same
city. The register and index of our beneficial owners maintained by a depository under the Depositories Act, 1996 is deemed to be a

part of the index of members and register of shareholders. We recognize as shareholders only those persons who appear on our register of shareholders and we cannot recognize any person holding any Share or part of it upon any trust, express, implied or constructive, except as permitted by law. In the case of shares held in physical form, we register transfers of shares on the register of shareholders upon lodgment of the share transfer form duly complete in all respects accompanied by a share certificate or if there is no certificate, the letter of allotment in respect of shares transferred together with duly stamped transfer forms. In respect of electronic transfers, the depository transfers shares by entering the name of the purchaser in its books as the beneficial owner of the shares. In turn, we enter the name of the depository in our records as the registered owner of the shares. The beneficial owner is entitled to all the rights and benefits as well as the liabilities with respect to the shares that are held by the depository.
49

For the purpose of determining the shareholders, the register may be closed for periods not exceeding 45 days in any one year or 30 days at any one time. In order to determine the shareholders entitled to dividends, we keep the register of shareholders closed for approximately 21 days, generally in June or July of each year. Under the listing regulations of the stock exchanges on which our outstanding shares are listed, we may, upon at least 15 days’ advance notice to these stock exchanges, set a record date and/or close the register of shareholders in order to ascertain the identity of shareholders entitled to the dividend. The trading of shares and the delivery of certificates in respect thereof may continue while the register of shareholders is closed.
Annual Report and Financial Results Our Indian GAAP audited financial statements for the relevant fiscal year, the directors’ report and the auditors’ report,
(collectively the Annual Report), must be laid before the Annual General Meeting. These also include other financial information, a corporate governance section and management’s discussion and analysis report and general shareholders’ information and are also made available for inspection at our registered office during normal working hours for 21 days prior to our annual general meeting.
Under the Companies Act, we must file the Annual Report with the Registrar of Companies within seven months from the close of the accounting year or within 30 days from the date of the annual general meeting, whichever is earlier. As required under listing agreements with the applicable stock exchanges, copies are required to be simultaneously sent to all the stock exchanges on which our shares are listed. We must also publish our financial results in at least one English language daily newspaper circulating in the whole or substantially the whole of India and also in a newspaper published in the language of the region where our registered office is situated.
We submit information, including our Annual Report, half yearly financial statements, report on corporate governance and the shareholding pattern statement, in accordance with the requirements of the listing agreement with the Singapore Stock Exchange.
Transfer of Shares Shares held through depositories are transferred in book-entry form or in electronic form in accordance with the regulations
laid down by the SEBI. These regulations provide the regime for the functioning of the depositories and the participants and set out the manner in which the records are to be kept and maintained and the safeguards to be followed in this system. Transfers of beneficial ownership of shares held through a depository are exempt from stamp duty. We have entered into an agreement for these depository services with National Securities Depository Limited and the Central Depository Services (India) Limited.
The SEBI requires that all investors hold our shares in book-entry form for trading and settlement purposes, except for transactions that are not made on a stock exchange and transactions that are not required to be reported to the stock exchange.
The requirement to hold shares in book-entry form will apply to ADS holders when the shares are withdrawn from the depositary facility upon surrender of the ADSs. In order to trade in our shares in the Indian market, the withdrawing ADS holder will be required to comply with the procedures above.
Our ordinary shares are freely transferable, subject only to the provisions of the Companies Act under which, if a transfer of shares contravenes the SEBI provisions or the regulations issued under it or any other law for the time being in force or the Sick Industrial Companies (Special Provisions) Act, 1985, or SICA, or any other similar law, the Indian Company Law Board may, on an application made by the company, a depository incorporated in India, an investor, the SEBI or other parties, direct a rectification of the register of records. If a company without sufficient cause refuses to register a transfer of shares within two months from the date on which the instrument of transfer is delivered to the company, the transferee may appeal to the Indian Company Law Board seeking to register the transfer of equity shares. The Indian Company Law Board may in its discretion, issue an interim order suspending the voting rights attached to the relevant equity shares before completing its investigation of the alleged contravention. Under the Companies (Second Amendment) Act, 2002, the operative provisions of which are yet to come into force, the Indian Company Law Board is proposed to be replaced with the National Company Law Tribunal. Further, under the Sick Industrial Companies (Special Provisions) Repeal Act, 2003, the SICA is sought to be repealed and the Board of Industrial and Financial Reconstruction, as constituted under the SICA, is to be replaced with the National Company Law Tribunal.
Pursuant to the Listing Agreement, in the event we have not effected the transfer of shares within one month or where the Issuer has failed to communicate to the transferee any valid objection to the transfer within the stipulated time period of one month, the Issuer is required to compensate the aggrieved party for the opportunity loss caused during the period of the delay.
The Companies Act provides that the shares or debentures of the public listed company (like the Issuer) shall be freely transferable. Our Articles of Association provide for restrictions on the transfer of shares, including granting power to the board of directors in certain circumstances to refuse to register or acknowledge transfer of shares or other securities issued by us. However, under the Companies Act the enforceability of these transfer restrictions is unclear.
50

Acquisition of Our Own Shares The Company is prohibited from acquiring its own shares unless the consequent reduction of capital is effected by an
approval of at least 75% of its shareholders voting on the matter in accordance with the Companies Act, 1956 and is also sanctioned by a High Court of competent jurisdiction. Moreover, subject to certain conditions, a company is prohibited from giving, whether directly or indirectly and whether by means of a loan, gurantee, the provision of security or otherwise, any financial assistance for the purpose of or in connection with a purchase or subscription made or to be made by any person of or for any shares in the company or its holding company. However, pursuant to amendments to the Companies Act, a company has been empowered to purchase its own shares or other specified securities out of its free reserves, or the securities premium account or the proceeds of any shares or other specified securities (other than the kind of shares or other specified securities proposed to be bought back) subject to the following conditions:
The condition mentioned above in (ii) would not be applicable if the buy-back is for less than 10% of the total paid-up equity capital and free reserves of the company and provided that this buy-back has been authorized by the board of directors of the company. A company buying back its securities is required to extinguish and physically destroy the securities so bought back within seven days of the last date of completion of the buy-back. Further, a company buying back its securities is not permitted to buy-back any securities for a period of one year from the buy-back and to issue securities for six months. The aforesaid restriction relating to the one year period does not apply to a buyback authorized by a special resolution of the shareholders in general meeting. Every buy-back has to be completed within a period of one year from the date of passing of the special resolution or resolution of the Board, as the case may be.
A company is also prohibited from purchasing its own shares or specified securities through any subsidiary company including its own subsidiary companies or through any investment company (other than a purchase of shares in accordance with a scheme for the purchase of shares by trustees of or for shares to be held by or for the benefit of employees of the company) or if the company is defaulting on the repayment of deposit or interest, redemption of debentures or preference shares or payment of dividend to a shareholder or repayment of any term loan or interest payable thereon to any financial institution or bank, or in the event of non-compliance with other provisions of the Companies Act.
Liquidation Rights Subject to the rights of creditors, workmen and of the holders of any other shares entitled by their terms of issue to
preferential repayment over the shares, in the event of our winding up, the holders of our shares are entitled to be repaid the amounts of capital paid-up or credited as paid-up on these shares, or in case of shortfall, proportionately. All surplus assets after payments due to workmen, the holders of any preference shares and other creditors belong to the holders of the equity shares in proportion to the amount paid up or credited as paid-up on these shares respectively at the commencement of the winding-up.
C. Material Contracts. Except as given below, neither Tata Motors Limited nor any of its consolidated subsidiaries or associated companies is a
party to any material contract other than contracts entered into in the ordinary course of business:
D. Exchange Controls. General
Prior to June 1, 2000, foreign investment in Indian securities, including the acquisition, sale and transfer of securities of Indian companies, was regulated by the Foreign Exchange Regulation Act, 1973, or FERA, and the notifications issued by the Reserve Bank of India or RBI thereunder.
With effect from June 1, 2000, foreign investment in Indian securities is regulated by the Foreign Exchange Management Act 1999, or FEMA (as amended from time to time), and the rules, regulations and notifications made under FEMA. A person
(i) the buy back should be authorized by the Articles of Association;
(ii) a special resolution has been passed at our general meeting authorizing the buy back;
(iii) the buy back is limited to 25% of the total paid up capital and free reserves;
(iv) the debt owed by us (including all amounts of unsecured and secured debt) is not more than twice the capital and free reserves after the buy back; and
(v) the buy-back is in accordance with the Securities and Exchange Board of India (Buy-Back of Securities) Regulations, 1998.
• the Tata Brand Equity and Business Promotion Agreement incorporated by reference into this annual report as Exhibit 4.1,
which is described in Item 4.C of this annual report; and
• the agreement entered into by us with Mr. Ravi Kant for his appointment as Managing Director, which is included as
Exhibit 4.2 of this annual report.

resident outside India can transfer any security of an Indian company or any other security to an Indian resident only under the terms and conditions specified in FEMA and the rules and regulations made thereunder or as permitted by the RBI.
The RBI issued the Foreign Exchange Management (Transfer or issue of Security by a Person Resident Outside India) Regulations 2000, or the Regulations, to regulate the issue of Indian securities including American depository receipts to persons resident outside India and the transfer of Indian securities by or to persons resident outside India.
51

The Regulations provide that an Indian entity may issue securities to a person resident outside India or record in its books any transfer of security from or to such person only in the manner set forth in FEMA and the rules and regulations made thereunder or as permitted by the RBI.
Foreign Direct Investment The Government of India, pursuant to its liberalization policy, set up the Foreign Investment Promotion Board, or the
FIPB, to regulate all foreign direct investment into India. Foreign Direct Investment, means investment by way of subscription and/or purchase of securities of an Indian company by a non resident investor. FIPB approval is required for investment in some sectors, including housing, petroleum (other than refining), defense and strategic industries. Also, the following investments would require the prior permission of the FIPB:
Subject to certain exceptions, Foreign Direct Investment and investment by individuals of Indian nationality or origin residing outside India, or Non-Resident Indians, in Indian companies does not require the prior approval of the FIPB or the RBI. The Government has indicated that in all cases where Foreign Direct Investment is allowed on an automatic basis without FIPB approval the RBI would continue to be the primary agency for the purposes of monitoring and regulating foreign investment. In cases where FIPB approval is obtained, no approval of the RBI is required, although a declaration in the prescribed form, detailing the foreign investment, must be filed with the RBI once the foreign investment is made in the Indian company. The foregoing description applies only to an issuance of shares by, and not to a transfer of shares of, Indian companies.
The Government has set up the Foreign Investment Implementation Authority, or the FIIA in the Ministry of Commerce and Industry. The FIIA has been mandated to (i) translate foreign direct investment approvals into implementation, (ii) provide a proactive one-stop after-care service to foreign investors by helping them obtain necessary approvals, (iii) sort out operational problems and (iv) meet with various Government agencies to find solutions to foreign investment problems and maximize opportunities through a co-operative approach.
Pricing The price of shares of a listed Indian company issued to non-residents under the foreign direct investment scheme on an
automatic basis cannot be less than the price worked out in accordance with the guidelines issued by the SEBI for the preferential allotment of shares. Where an Indian company is not listed on any recognized stock exchange in India the minimum issue price of the shares would be based on a fair valuation of shares done by a chartered accountant as per the guidelines issued by the erstwhile Controller of Capital Issues.
Every Indian company issuing shares or convertible debentures in accordance with the Regulations is required to submit a report to the RBI within 30 days of receipt of the consideration and another report within 30 days from the date of issue of the shares to the non-resident purchaser. The above description applies only to an initial issue of shares or convertible debentures by an Indian company.
The above description applies only to a fresh issue of shares or convertible debentures by an Indian company.
Portfolio Investment by Foreign Institutional Investors In September 1992, the Government issued guidelines that enable foreign institutional investors, including institutions such
as pension funds, investment trusts, asset management companies, nominee companies and incorporated/institutional portfolio
• investments , including a transfer of shares, in excess of specified sectoral caps;
• investments by a foreign investor who has an existing joint venture or technology transfer/trade mark agreement in the same field. However, prior FIPB approval will not be required in case of investment made by a venture capital fund registered with SEBI or where the investment in the existing joint venture is less than 3.0 per cent. or where the existing joint venture is defunct or sick
• investment being more than 24% in the equity capital of units manufacturing items reserved for small scale industries;
• investments by an unincorporated entity; • investment in industries for which industrial licensing is compulsory; and
• all proposals relating to acquisition of shares of an Indian company by a foreign investor (including individuals of Indian nationality or origin residing outside India (a “Non-Resident Indian”), the activities of which company are not under the “automatic” route under existing Indian foreign investment policy or where the Indian company is engaged in the financial services sector or where the acquisition of shares attracts the provisions of the Takeover Code. However, pursuant to a recent Press Note issued by the Government of India, the prior permission of the FIPB would not be required for the transfer of shares from residents to non-residents in the financial services sector or, in transactions subject to the Indian Takeover Code in cases where approvals are required from the RBI, under the Takeover Code, or the Insurance Regulatory and Development Authority.

managers referred to as Foreign Institutional Investors, or FIIs, to make portfolio investments in all securities of listed and unlisted companies in India. Investments by registered Foreign Institutional Investors or Non-Resident Indians made through a stock exchange are known as Portfolio Investments. Foreign investors wishing to invest and trade in Indian securities in India under these guidelines are required to register with the SEBI and obtain a general permission from the RBI under the Foreign Exchange Management Act, 1999. However, since the SEBI provides a single window clearance, a single application must be made to the SEBI. Foreign investors are not necessarily required to register with the SEBI under the Securities and Exchange Board of India (Foreign Institutional Investors) Regulations 1995 (the “Foreign Institutional Investor Regulations”) as Foreign Institutional Investors and may invest in securities of Indian companies pursuant to the Foreign Direct Investment route discussed above.
52

Foreign Institutional Investors who are registered with the SEBI are required to comply with the provisions of the Securities and Exchange Board of India (Foreign Institutional Investors) Regulations, 1995, or Foreign Institutional Investor Regulations. A registered foreign institutional investor may buy, subject to the ownership restrictions discussed below, and sell freely securities issued by any Indian company, (excluding companies engaged in the print media sector) realize capital gains on investments made through the initial amount invested in India, subscribe to or renounce rights offerings for shares, appoint a domestic custodian for custody of investments made and repatriate the capital, capital gains, dividends, income received by way of interest and any compensation received towards sale or renunciation of rights offerings of shares. A Foreign Institutional Investor may not hold more than 10% of the total issued capital of a company in its own name; a corporate/individual sub-account of the Foreign Institutional Investor may not hold more than 5% of the total issued capital of a company, and a broad based sub-account may not hold more than 10% of the total issued capital of a company. The total holding of all Foreign Institutional Investors in a company is subject to a cap of 24% of the total paid up capital of a company, which can be increased to the relevant sectoral cap/ceiling applicable to the said company under the Foreign Direct Investment Regime with the passing of a special resolution by the shareholders of the company in a general meeting.
In terms of recent amendments made to the Foreign Institutional Investor Regulations, FIIs are permitted to purchase shares and convertible debentures, subject to the FII limits, of an Indian company either through:
Registered FIIs are generally subject to tax under Section 115AD of the Income Tax Act of 1961. There is uncertainty under Indian law as to the tax regime applicable to FIIs that hold and trade in ADSs and Shares. See Item 10.E “— Taxation — Taxation of Capital Gains —Indian Taxation”.
Portfolio Investment by Non-Resident Indians A variety of methods for investing in shares of Indian companies are available to Non-Resident Indians. These methods
allow Non-Resident Indians to make Portfolio Investments in shares and other securities of Indian companies on a basis not generally available to other foreign investors. In addition to Portfolio Investments in Indian companies, non-resident Indians may also make foreign direct investments in Indian companies pursuant to the Foreign Direct Investment route discussed above.
Transfer of shares and convertible debentures of an Indian company by a person resident outside India Until recently, the sale of shares of an Indian company from a non-resident to a resident required RBI approval, unless the
sale was made on a stock exchange at the market price. The Government has granted general permission to persons residing outside India to transfer shares and convertible debentures held by them to an Indian resident, subject to compliance with certain terms and conditions and reporting requirements. A resident who wishes to purchase shares from a non-resident must, pursuant to the relevant notice requirements, file a declaration with an authorised dealer in the prescribed Form FC-TRS, together with the relevant documents and file an acknowledgment thereof with the Indian company to effect transfer of the shares to his name. However, in such cases, the person to whom the shares are being transferred is required to obtain the prior permission of the Central Government of India to acquire the shares if such person has an existing venture (in which such person holds over 3% shares) or tie-up in India through investment in shares or debentures or a technical collaboration or a trade mark agreement or investment by whatever name in the same field to that in which the Indian company whose shares are being transferred is engaged. Further, a non-resident may transfer any security held by such resident to a person resident in India by way of gift.
Moreover, the transfer of shares between an Indian resident and a non-resident does not require the prior approval of the Government or RBI, provided that: (i) the activities of the investee company are under the automatic route pursuant to FDI Policy and the transfer is not subject to regulations under the Indian Takeover Code; (ii) the non-resident shareholding complies with sector limits under the FDI policy; and (iii) the pricing is in accordance with the guidelines prescribed by SEBI and RBI.
Sponsored ADR Schemes By notification dated November 23, 2002, the RBI has permitted existing shareholders of Indian companies to sell their
shares through the issuance of ADRs against the block of existing shares of the Indian company, subject to the following conditions:
• a public offer, where the price of the shares to be issued is not less than the price at which the shares are issued to Indian residents, or
• a private placement, where the price of the shares to be issued is not less than the price according to the terms of the relevant guidelines or the guidelines issued by the former Controller of Capital Issues.
• The facility to sell the shares would be available pari passu to all categories of shareholders.
• The sponsoring company whose shareholders propose to divest existing shares in the overseas market through issue of ADRs will give an option to all its shareholders indicating the number of shares to be divested and the mechanism how the price will be determined under the ADR norms. If the shares offered for divestment are more than the pre-specified number to be divested, shares would be accepted from the existing shareholders in proportion to their existing shareholdings.

53
• The proposal for divestment of the shares would have to be approved by a special resolution of the Indian company. • The proceeds of the ADR issue raised abroad shall be repatriated into India within a period of one month from the closure of the
issue. However, the proceeds of the ADR issue can also be retained abroad to meet the future foreign exchange requirements of the company and by a recent notification this facility has been extended indefinitely until further notice.
• The issue related expenses in relation to public issue of ADRs under this scheme would be subject to a ceiling of 4% of the issue size in the case of public issues and 2% of the issue size in the case of private placements. The issue related expenses would include underwriting commissions, lead managers’ charges, legal expenses and reimbursable expenses. The issue expenses shall be passed on to the shareholders participating in the sponsored issue on a pro rata basis.

Transfer of ADRs by Non-residents The Ministry of Finance, Government of India, has granted general permission for the transfer of ADRs outside India and
also permitted non-resident holders of ADRs to surrender ADRs in exchange for the underlying shares. Pursuant to the terms of the Deposit Agreement an investor who surrenders ADRs and withdraws shares is permitted to re-deposit such shares subject to the total issued ADRs and obtain ADRs at a later time.
Fungibility of ADRs In March 2001, the RBI permitted the re-conversion of shares of Indian Companies into ADRs, subject to the following
conditions:
Also the RBI has prescribed that the domestic custodians are the entity required to ensure compliance with the RBI guidelines and to file reports with the RBI from time to time. The domestic custodian is also required to perform the following functions:
E. Taxation. This section describes the material United States federal and Indian stamp duty and income and service tax consequences
of owning shares or ADSs. It applies to you only if you hold your shares or ADSs as capital assets for tax purposes. This section does not apply to you if you are a member of a special class of holders subject to special rules, including:
This section is based on the Internal Revenue Code of 1986, as amended, its legislative history, existing and proposed regulations, published rulings and court decisions, and the laws of India all as currently in effect, as well as on the Convention Between the Government of the United States of America and the Government of the Republic of India for the Avoidance of Double Taxation and the Prevention of Fiscal Evasion with Respect to Taxes on Income (the “Treaty”). These laws are subject to change, possibly on a retroactive basis. In addition, this section is based in part upon the representations of the Depositary and the assumption that each obligation in the Deposit Agreement and any related agreement will be performed in accordance with its terms.
You are a U.S. holder if you are a beneficial owner of shares or ADSs and you are, for U.S. federal income tax purposes:
• the Indian company has issued ADRs;
• the shares of the Indian company are purchased by a registered stock broker in India in the name of the Depository, on behalf of the non-resident investor who wishes to convert such shares into ADRs;
• shares are purchased on a recognized stock exchange; • the shares are purchased with the permission of the custodian of the ADRs of the Indian company and are deposited with the
custodian; • the issuer company has authorized the custodian to accept shares from non-resident investors for re-issuance of ADRs;
• the number of shares so purchased do not exceed the ADRs converted into underlying shares, and are in compliance with the sectoral caps applicable under the Foreign Direct Investment regime; and
• the non-resident investor, broker, custodian and the overseas depository comply with the provisions of the Depository Receipt Mechanism and the guidelines issued thereunder from time to time.
• provide a certificate to the RBI and the SEBI stating that the sectoral caps for foreign investment in the relevant company have not been breached;
• monitor the total number of ADRs that have been converted into underlying shares by non-resident investors; • liaise with the issuer company to ensure that the foreign investment restrictions, if any, are not being breached; and • file a monthly report about the ADR transactions under the two-way fungibility arrangement with the RBI and the SEBI.
• a dealer in securities, • a trader in securities that elects to use a mark-to-market method of accounting for securities holdings, • a tax-exempt organization, • a life insurance company, • a person liable for alternative minimum tax, • a person that actually or constructively owns 10% or more of our voting stock,
• a person that holds shares or ADSs as part of a straddle or a hedging or conversion transaction, or • a U.S. holder (as defined below) whose functional currency is not the dollar.
With regard to Indian tax, the following discussion addresses only the tax consequences for persons that are “non-residents” of India, as defined in the Indian Income Tax Act of 1961, or the Income Tax Act and is based on the provisions of Section 115AC and other applicable provisions of the Income Tax Act and the Issue of Foreign Currency Convertible Bonds and Ordinary Shares (through Depository Receipt Mechanism) Scheme 1993 promulgated by the Government of India, or together the Section 115AC Regime.
54
• a citizen or resident of the United States, • a domestic corporation, • an estate whose income is subject to United States federal income tax regardless of its source, or
• a trust if a United States court can exercise primary supervision over the trust’s administration and one or more United
States persons are authorized to control all substantial decisions of the trust.

You should consult your own tax advisor regarding the United States federal, state and local and the Indian and other tax consequences of owning and disposing of shares and ADSs in your particular circumstances.
This discussion addresses only United States federal income taxation and Indian stamp duty and income and service taxation.
In general, and taking into account the earlier assumptions, for United States federal income and Indian tax purposes, if you hold ADRs evidencing ADSs, you will be treated as the owner of the shares represented by those ADRs. Exchanges of shares for ADRs, and ADRs for shares, generally will not be subject to United States federal income or to Indian tax, but such exchange may give rise to Indian stamp duty as described below under “— Stamp Duty”.
Taxation of Dividends Indian Taxation. Dividends paid to non-residents of India will not be liable to tax. However, the Company will be liable
to pay a “dividend distribution tax” currently at the rate of 15% (plus a surcharge at 10% and education cess at the rate of 3% on the dividend distribution tax and surcharge) on the total amount distributed as a dividend. The effective rate of dividend distribution tax is 17%.
Distributions to non-residents of India of additional ADSs or shares or rights to subscribe for such shares made with respect to ADSs or shares are not subject to Indian tax.
U.S. Holders. Under the United States federal income tax laws, and subject to the passive foreign investment company, or PFIC rules described below, if you are a U.S. holder, the gross amount of any dividend we pay out of our current or accumulated earnings and profits (as determined for United States federal income tax purposes) is subject to United States federal income taxation. If you are a noncorporate U.S. holder, dividends paid to you in taxable years beginning before January 1, 2011 that constitute qualified dividend income will be taxable to you at a maximum tax rate of 15% provided that you hold the shares or ADSs for more than 60 days during the 121-day period beginning 60 days before the ex-dividend date and meet other holding period requirements. Dividends we pay with respect to the shares or ADSs generally will be qualified dividend income.
The dividend is taxable to you when you, in the case of shares, or the Depositary, in the case of ADSs, receive the dividend, actually or constructively. The dividend will not be eligible for the dividends-received deduction generally allowed to United States corporations in respect of dividends received from other United States corporations.
The amount of the dividend distribution that you must include in your income as a U.S. holder will be the U.S. dollar value of the rupee payments made, determined at the spot rupee/U.S. dollar rate on the date the dividend distribution is includible in your income, regardless of whether the payment is in fact converted into U.S. dollars. Generally, any gain or loss resulting from currency exchange fluctuations during the period from the date you include the dividend payment in income to the date you convert the payment into U.S. dollars will be treated as ordinary income or loss and will not be eligible for the special tax rate applicable to qualified dividend income. The gain or loss generally will be income or loss from sources within the Untied States for foreign tax credit limitation purposes.
Distributions in excess of current and accumulated earnings and profits, as determined for United States federal income tax purposes, will be treated as a non-taxable return of capital to the extent of your basis in the shares or ADSs and thereafter as capital gain.
Dividends will be income from sources outside the United States. Dividends paid in taxable years beginning before January 1, 2007 generally will be “passive” or “financial services” income, and dividends paid in taxable years beginning after December 31, 2006 will, depending on your circumstances, be “passive” or “general” income which, in either case, is treated separately from other types of income for purposes of computing the foreign tax credit allowable to you.
Distributions of additional shares to you with respect to shares or ADSs that are made as part of a pro rata distribution to all of our shareholders generally will not be subject to United States federal income tax.
Taxation of Capital Gains Indian Taxation
Capital Gains Generally. Under Section 115AC and other applicable provisions of the Income tax act 1961, any gain realized on the sale outside India of the ADSs from one non-resident of India to another non-resident holder is not subject to Indian capital gains tax. However, it is unclear whether a capital gain derived from the sale of rights by a non-resident of India to another non-resident holder outside India may be subject to Indian capital gains tax.

Capital gains arising to the non-resident investor on the transfer of the equity shares (including shares received in exchange of the ADSs) whether in India or outside India to a non-resident investor or Indian resident, will be liable for income tax under the provisions of the Income Tax Act.
55

Equity shares (including shares issuable on the exchange of the ADSs) held by the non-resident investor for a period of more than 12 months are treated as long-term capital assets. If the equity shares are held for a period of 12 months or less, the capital gains arising on the sale thereof is to be treated as short-term capital gains. A non-resident holder’s holding period (for purposes of determining the applicable Indian capital gains tax rate) in respect of shares received in exchange for ADSs commences on the date of the advice of withdrawal of such shares by the relevant depository to its custodian.
For the purpose of computing capital gains tax on the sale of the equity shares, the cost of acquisition of equity shares received in exchange for ADSs will be determined on the basis of the prevailing price of the shares on the Indian Stock Exchanges as on the date on which the relevant depository gives notice to its custodian for the delivery of such equity shares upon redemption of the ADSs, while the cost of acquisition of shares directly converted from the ADSs will be determined on the basis of the price prevailing on the Indian Stock Exchanges on the date of conversion into equity shares.
Gain realized on the sale of listed equity shares held for more than 12 months will not be subject to Indian capital gains tax if the Securities Transaction Tax (“STT”) has been paid on the transaction. The STT will be levied on and collected by a domestic stock exchange on which equity shares are sold at the rate of 0.025% to 0.125% depending upon the nature of the transaction.
Any gain realized on the sale of equity shares held for more than 12 months on which no STT has been paid will be subject to Indian capital gains tax at the rate of 10% plus applicable surcharge on income tax and education cess at the applicable rates.
Capital gains realised in respect of equity shares held (calculated in the manner set forth in the prior paragraph) for 12 months or less (short term gain) on which STT is paid in the manner and rates set out above, is subject to tax at the rate of 10% plus applicable surcharge on income tax and an education cess at the applicable rate. In the event that no STT is paid, short term gain is subject to tax at variable rates with the maximum rate of 40% plus applicable rate of surcharge on income tax and education cess at the rate of 3% of the tax and surcharge. The actual rate of tax on short term gains depends on a number of factors, including the legal status of the non-resident holder and the type of income chargeable in India.
Tax on capital gains is to be deducted at source by the person paying for the shares in accordance with the relevant provisions of the Income Tax Act.
Capital Losses. The Section 115AC Regime does not deal with capital losses arising on a transfer of shares. In general terms, losses arising from a transfer of a capital asset in India can only be set off only against capital gains and not against any other income. A short-term capital loss can be set off against a capital gain, whether short-term or long-term. However, long term capital loss can only be set off against long term capital gain and not against short term capital gain. To the extent that the losses are not absorbed in the year of transfer, they may be carried forward for a period of eight assessment years immediately succeeding the assessment year for which the loss was first determined and may be set off against the capital gains assessable for such subsequent assessment years. In order to set off capital losses in this manner, the non-resident investor would be required to file appropriate and timely tax returns in India. The long term capital loss arising on sale of equity shares in respect of which STT is paid may not be available for set-off against any capital gains.
United States Federal Income Taxation. U.S. Holders. Subject to the PFIC rules discussed below, if you are a U.S. holder and you sell or otherwise dispose of your
shares or ADSs, you will recognize capital gain or loss for United States federal income tax purposes equal to the difference between the dollar value of the amount that you realize and your tax basis, determined in dollars, in your shares or ADSs. Capital gain of a non-corporate U.S. holder that is recognized on taxable years beginning before January 1, 2011 is generally taxed at a maximum rate of 15% where the holder has a holding period greater than one year. The gain or loss will generally be income or loss from sources within the United States for foreign tax credit limitation purposes.
Tax Treaties. The provisions of the Agreement of Avoidance of Double Taxation entered into by Government with the country of
residence of the non-resident investor will be applicable to the extent that they are more beneficial to the non-resident investor.
Dividend income is not subject to tax in India in the hands of the holder of the shares. If any Shares are held by a non resident investor following withdrawal thereof from the depository facility under the Deposit Agreement, provisions of double taxation treaty, if any, entered into by India with the country of residence of such non resident investor will be applicable to taxation of any capital gain arising from transfer of such shares.
However, during the period of fiduciary ownership of Shares in the hands of the Overseas Depository Bank, the provisions of Double Taxation Avoidance Agreement entered into by the Government of India with the country of residence of the Overseas Depository Bank will be applicable in the matter of taxation of capital gains in respect of ADSs.

Stamp Duty. Under Indian law, any transfer of ADSs will be exempt from liability to Indian stamp duty. Purchasers of shares who seek to register such shares on the share register of the company are required to pay Indian stamp duty at the rate of
56

Rs.0.25 for every Rs.100 or part thereof of the market value of such shares. In order to register a transfer of shares in the physical form with the company, it is necessary to present a stamped deed of transfer. An acquisition of shares in physical form from the Depository in exchange for ADSs representing such shares will not render an investor liable to Indian stamp duty but the company will be required to pay stamp duty at the applicable rate on the Share Certificate. However, since our shares are compulsorily deliverable in dematerialized form (except for trades of up to 500 shares which may be delivered in physical form), no stamp duty is payable on the acquisition or transfer of shares in dematerialized form.
Service Tax. Brokerage or commission fees paid to stockbrokers in India in connection with the sale or purchase of shares are now subject to an Indian service tax of 12% (plus a 2% education cess). A stockbroker is responsible for collecting such service tax at such rate and for paying the same to the relevant authority.
PFIC. We believe that shares and ADSs should not be treated as stock of a PFIC for United States federal income tax purposes, but this conclusion is a factual determination that is made annually and thus may be subject to change. If we were to be treated as a PFIC, unless a U.S. holder elects to be taxed annually on a mark-to-market basis with respect to the shares or ADSs, gain realized on the sale or other disposition of your shares or ADSs would in general not be treated as capital gain. Instead, if you are a U.S. holder, you would be treated as if you had realized such gain and certain “excess distributions” ratably over your holding period for the shares or ADSs and would be taxed at the highest tax rate in effect for each such year to which the gain was allocated, together with an interest charged in respect of the tax attributable to each such year. With certain exceptions, your shares or ADSs will be treated as stock in a PFIC if we were a PFIC at any time during your holding period in your shares or ADSs. Dividends that you receive from us will not be eligible for the special tax rates applicable to qualified dividend income if we are treated as a PFIC with respect to you either in the taxable year of the distribution or the preceding taxable year, but instead will be taxable at rates applicable to ordinary income.
F. Dividends and Paying Agents Not applicable.
G. Statement by Experts Not applicable.
H. Documents on Display. You may review a copy of this annual report at the Securities and Exchange Commission’s public reference room at 100 F
Street, N.E., Washington, D.C. 20549. You may call the SEC at 1-800-732-0330 for additional information on how to obtain copies of all or any portion of the documents we file with or furnish to the SEC. The Securities and Exchange Commission also maintains a web site www.sec.gov that contains reports, proxy statements and other information regarding registrants that file electronically with the Securities and Exchange Commission.
We are subject to the information requirements of the Securities Exchange Act of 1934 and, in accordance therewith, will file annual reports on Form 20-F within six months of our fiscal year end and furnish other reports and information on Form 6-K with the Securities and Exchange Commission. These reports and other information can be inspected at the public reference room at the Securities and Exchange Commission and at the Securities and Exchange Commission regional offices listed above. You can also obtain copies of this material from the public reference room, the regional offices or by calling or writing the Securities and Exchange Commission upon payment of a prescribed fee. As a foreign private issuer, we are exempt from the rules under the Securities Exchange Act of 1934 prescribing the furnishing and content of proxy statements to shareholders.
I. Subsidiary Information Not applicable.
Our exposure to financial risks derives primarily from changes in interest rates and foreign exchange rates. To mitigate these risks, we utilize derivative financial instruments, including interest rate option contracts and currency swap agreements, the application of which is primarily for hedging purposes and not for speculative purposes.
Item 11. Quantitative and Qualitative Disclosures about Market Risk.

Interest Rate and Swap Agreements Our exposure to interest rate risks relates primarily to:
We are subject to market risk from exposure to changes in interest rates based on our financing, investing and cash management activities. We enter into various financial instrument transactions to maintain the desired level of exposure to the risk of interest rate fluctuations and to minimize interest expense. We have entered into exchange traded future and option contracts, interest rate caps and floors, along with various investments, to reduce the interest rate risk related to these activities.
57
• our long term debt, which is normally utilized to finance capital expenditure;
• our investment in marketable securities; and • our finance receivables

There are particular shortcomings inherent in the sensitivity analyses presented below. The model assumes interest rate changes are instantaneous parallel shifts in the yield curve; however, in reality, changes are rarely instantaneous. Although some assets and liabilities may have similar maturities or periods to repricing, they may not react correspondingly to changes in market interest rates. Also, the interest rates on some types of assets and liabilities may fluctuate with changes in market interest rates, while interest rates on other types of assets may lag behind changes in market rates.
The sensitivity to a change in interest rates of 1% on our unhedged floating rate loans as at March 31, 2006 and March 31, 2007 is Rs. 111 million and Rs. 252 million, respectively, on an annual basis. The sensitivity to a change in interest rates of 1% on the value of our portfolio of marketable securities as at March 31, 2006 and 2007 is Rs. 33 million and Rs. 29 million, respectively.
We may have a prepayment and default risk with respect to our finance receivables due to any change in interest rates.
Foreign Exchange Risk The following table sets forth information relating to our foreign currency debt exposure for the periods indicated:
We have foreign currency exposure related to buying, selling and financing in currencies, primarily in the dollar, other than the local currencies in which we operate. We are also exposed to foreign currency risk related to future earnings or assets and liabilities that are exposed due to operating cash flows and various financial instruments that are denominated in foreign currencies.
We use derivative instruments primarily to hedge our foreign exchange exposure, and also to hedge our interest rate exposure. Nevertheless, a weakening of the rupee against the dollar and other major foreign currencies may have an adverse effect on our cost of borrowing and cost of imported goods / technology and consequently may increase the cost of financing our capital expenditures. In addition, we have experienced and expect to continue to experience foreign exchange losses and gains on obligations denominated in foreign currencies in respect of our borrowings.
The sensitivity to a change in currency prices of 1% per US$ on our unhedged foreign currency loans as at March 31, 2007 and 2006 is Rs. 362 million and Rs.260 million, respectively.
We hedge most of our exports. However, some of our imports and exports have remained unhedged during the year. The sensitivity to a 1% change in exchange rates of individual currencies against the rupee for the unhedged portion of our imports payables for the year ending March 31, 2007 and 2006 is Rs.11 million and Rs.19 million, respectively, and sensitivity to a 1% change in exchange rates of individual currencies against the rupee for the unhedged portion of our exports receivables for the year ending March 31, 2007 is Rs.6 million.
Investment price risk The fair value of some of our investments in available-for-sale securities exposes us to equity price risks. In general, these
securities are not held for trading purposes. These investments are subject to changes in the market prices of the securities. The fair value of our available-for-sale, equity securities as of March 31, 2007 and 2006 was Rs.15,870 million and Rs.17,311 million respectively. A 1% change in equity prices of available-for-sale securities held as at March 31, 2007 and 2006 would result in an impact of Rs.159 million and Rs.173 million, respectively.
Commodity price risk Commodity price risk is the possibility of impact from changes in the prices of commodities, such as non-ferrous metals
(like aluminum), ferrous alloys (like steel) and others (like rubber), which we use in the production of automotive vehicles and their components. We do not use derivative instruments to hedge the price risk associated with the purchase of these commodities. However, we cover some of these risks through long-term purchase contracts.
Our exposure to financial risks derives primarily from changes in interest rates and foreign exchange rates. To mitigate these risks, we utilize derivative financial instruments, including interest rate option contracts and currency swap agreements, the application of which is primarily for hedging purposes and not for speculative purposes.
Fiscal 2007 Fiscal 2006 Percentage (%)Total Foreign Currency denominated debt as percentage of total outstanding
debt 46.6 73.6Total US$ debt as percentage of total outstanding debt 37.4 59.1

Not applicable.
58
Item 12. Description of Securities Other than Equity Securities.

PART II
None.
None.
Disclosure Controls and Procedures. Based on their evaluation as of March 31, 2007, our Managing Director, Mr. Ravikant, who is our chief executive officer and Mr. C. Ramakrishnan who is our chief financial officer, respectively, have concluded that our disclosure controls and procedures as defined in Rules 13a-15(e) and 15d-15(e) under the Securities Exchange Act of 1934 (the Exchange Act) are effective.
Management’s Annual Report on Internal Control Over Financial Reporting. Management is responsible for establishing and maintaining adequate internal control over financial reporting. Our internal control over financial reporting is a process designed under the supervision of our principal executive and principal financial officers to provide reasonable assurance regarding the reliability of financial reporting and the preparation of our financial statements for external reporting purposes in accordance with Indian GAAP and U.S. GAAP. Our internal control over financial reporting includes policies and procedures that pertain to the maintenance of records that, in reasonable detail, accurately and fairly reflect transactions and dispositions of assets; provide reasonable assurance that transactions are recorded as necessary to permit preparation of financial statements in accordance with Indian GAAP and U.S. GAAP, and that receipts and expenditures are being made only in accordance with authorizations of our management and directors; and provide reasonable assurance regarding prevention or timely detection of unauthorized acquisition, use or disposition of our assets that could have a material effect on our financial statements.
Our disclosure committee comprising of our senior executives has reviewed the adequacy of disclosure pertaining to its respective functions.
Our management conducted an assessment of the effectiveness of our internal control over financial reporting based on the framework established in Internal Control — Integrated Framework issued by the Committee of Sponsoring Organizations of the Treadway Commission. Based on this assessment, management has determined that our internal control over financial reporting as at March 31, 2007 is effective.
Because of its inherent limitations, internal control over financial reporting may not prevent or detect misstatements. Also, projections of any evaluation of effectiveness to future periods are subject to the risk that controls may become inadequate because of changes in conditions or that the degree of compliance with the policies or procedures may deteriorate.
Management’s assessment of the effectiveness of our internal control over financial reporting as at March 31, 2007 has been audited by Deloitte Haskins and Sells, an independent registered public accounting firm, as stated in their report appearing on the accompanying consolidated financial statements in Item 18, which expresses an unqualified opinion on management’s assessment and on the effectiveness of our internal control over financial reporting as at March 31, 2007.
Attestation Report of the Registered Public Accounting Firm. The attestation report of Deloitte Haskins and Sells, an independent registered public accounting firm, regarding its audit of our internal control over financial reporting is set forth in Item 18 “—Financial Statements”.
Changes in Internal Control over Financial Reporting. During the period covered by this annual report, there were no changes in our internal control over financial reporting that have materially affected or are reasonably likely to materially affect our internal control over financial reporting.
Our Board has determined that Mr. Palia, an independent director and a member of our Audit Committee, is an audit committee financial expert as defined under the applicable rules of the SEC issued pursuant to Section 407 of the Sarbanes – Oxley Act of 2002.
Item 13. Defaults, Dividend Arrearages and Delinquencies.
Item 14. Material Modifications to the Rights of Security Holders and Use of Proceeds.
Item 15. Controls and Procedures.
Item 16A. Audit Committee Financial Expert.

We have adopted the “Tata Code of Conduct” (hereinafter referred as to ‘the Code’) a written Code of Ethics which is applicable to all our employees, including the chief executive officer, chief financial officer, principal accounting officer, senior management, as well as all officers working in accounts, finance, treasury, internal audit, taxation, legal, secretarial, investor relations, Disclosure Committee, Audit Committee, Board of Directors and other departments. We have a separate Code of Conduct applicable to Non-Executive Directors. The Codes are available at all our offices and are publicly available on our website.
In August 2004, our Audit Committee adopted a Policy (the Whistle Blower Policy) that provided a formal mechanism for all our employees to approach our Management (or the Audit Committee in cases where the concern involves the Senior Management) and make protective disclosures to the Management about unethical behaviour, actual or suspected fraud or violations of the Company’s Code of Conduct or ethics policy. The Whistle Blower Policy is an extension of the Tata Code of Conduct, which requires every employee to promptly report to the Management any actual or possible violation of the Code or an event such employee becomes aware of that could affect the business or reputation of the Company. The disclosures reported are addressed in the manner and within the time frames prescribed in the Whistle Blower Policy.
59
Item 16B. Code of Ethics.

Our financial statements prepared in accordance with US GAAP, are audited by Deloitte Haskins and Sells (DHS), a firm registered with the Public Company Accounting Oversight Board (PCAOB) in the United States and an Indian firm of Chartered Accountants registered with the Institute of Chartered Accountants of India (ICAI).
DHS has served as our independent public accountant for each of the years ended March 31, 2007 and March 31, 2006, for which audited financial statements appear in this annual report.
The following table presents the aggregate fees for professional services and other services rendered by DHS and the various member firms of Deloitte to us including some of our subsidiaries in fiscal 2006 and fiscal 2007.
Audit Committee pre-approval for services rendered by independent accountants:
Not applicable.
None.
We have elected to provide the financial statements and related information specified in Item 18 in lieu of Item 17.
The information required by this item is set forth beginning on page F-1 of this annual report.
60
Item 16C. Principal Accountant Fees and Services.
Year ended March 31, Description of Services
2006 2007 2007
Rs. in million US $ inmillion
Audit Fees 56.7 121.2 2.8 Audit and review of financial statements.Audit Related Fees 3.7 — — Tax Fees 7.4 5.7 0.1 Tax audit, certification of foreign remittances and tax advisory services.All Other Fees 3.0 2.9 0.1 Audit of employee benefit funds, other certifications and advisory services.
Total 70.8 129.8 3.0
• We have adopted a policy for pre-approval of services to be rendered by our independent accountants for us and our subsidiaries based on an elaborate procedure for ensuring auditor independence and objectivity.
• At the beginning of each year, the Audit Committee approves the proposed services, including the nature, type and scope of services contemplated and/or the related fees to be rendered by these firms during the year.
• In addition, Audit committee pre-approval is also required for those engagements that may arise during the course of the year that are outside the scope of the initial services and such fees are pre-approved by the audit Committee.
• We do not engage our independent accountants for ‘prohibited services’.
• Our Audit Committee recommends the appointment and compensation of independent accountants. • In case of urgent requirements, our CFO and the Chairman of our Audit Committee jointly approve any services that may be
rendered by our independent accountants or their member firms and such services are subsequently ratified at the next Audit Committee meeting.
• The pre-approval is not required where the fees proposed to be paid for the non-audit services do not exceed 5% of the total amount of fees paid by us to our independent accountants and their member firms during the fiscal year, provided that such services were not recognized as non audit services at the time of the engagement of services. Such services are also brought to the attention of the Audit Committee at the next meeting.
Item 16D. Exemptions from the Listing Standards for Audit Committees.
Item 16E. Purchases of Equity Securities by the Issuer and Affiliated Purchasers.
Item 17. Financial Statements.
Item 18. Financial Statements.

We have not included as exhibits certain instruments with respect to our long-term debt, the amount of debt authorized under each of which does not exceed 10% of our total assets, and we agree to furnish a copy of any such instrument to the Securities Exchange Commission upon request.
61
Item 19. EXHIBITS.
Exhibit Number Description 1.1— Our Certificate of Incorporation ***
1.2— Our Memorandum and Articles of Association***
2.2—
Form of Amended and Restated Deposit Agreement among Tata Motors Limited, Citibank, N.A. as Depositary and all owners and holders from time to time of American Depositary Receipts, including the form of American Depositary Receipt**
4.1—
Tata Brand Equity & Business Promotion Agreement, dated December 18, 1998, between Tata Sons Limited and Tata Engineering and Locomotive Company Limited (now Tata Motors Limited) *
4.2— Agreement for appointment of Mr Ravi Kant as our Managing Director****
7.1— Computation of Ratio of Net Debt to Shareholders’ Equity
8.1— List of our Subsidiaries
11.1— The Tata Code of Conduct*
12.1— Certification of the Principal Executive Officer required by Rule 13a – 14(a)
12.2— Certification of the Principal Financial Officer required by Rule 13a – 14(a)
13—
Certification of the Chief Executive Officer and Chief Financial Officer required by Rule 13a – 14(b) and Section 1350 of Chapter 63 of Title 18 of the United States Code
* Incorporated by reference to our Registration Statement on Form 20-F File No. 001-32294 filed on September 15, 2004 ** Incorporated by reference to our Registration Statement on Form F-6 (File no 333-119066) filed on September 16, 2004 *** Incorporated by reference to our Annual Report on Form 20-F File No. 001-32294 filed on September 27, 2005 **** Incorporated by reference to our Annual Report on Form 20-F File No. 001-32294 filed on September 26, 2006

SIGNATURES The Registrant hereby certifies that it meets all of the requirements for filing on Form 20-F and that it has duly caused and authorized the undersigned to sign this annual report on its behalf.
September 24, 2007
66
TATA MOTORS LIMITED
By /s/ Ravi Kant Name: Ravi KantTitle: Managing Director
By /s/ C. Ramakrishnan Name: C. RamakrishnanTitle: Chief Financial Officer

INDEX TO CONSOLIDATED FINANCIAL STATEMENTS
F-1
Page
Consolidated Financial Statements of Tata Motors Limited
Report of independent registered public accounting firm F-2Report of independent registered public accounting firm F-3Consolidated balance sheets as of March 31, 2006 and 2007 F-4Consolidated statements of income for the years ended March 31, 2005, 2006 and 2007 F-5Consolidated statements of cash flows for the years ended March 31, 2005, 2006 and 2007 F-6Statements of shareholders’ equity for the years ended March 31, 2005, 2006 and 2007 F-8Notes to consolidated financial statements F-11

Report of Independent Registered Public Accounting Firm
To the Board of Directors and Shareholders of Tata Motors Limited Mumbai, India
We have audited the accompanying consolidated balance sheets of Tata Motors Limited and subsidiaries (the “Company”) as of March 31, 2007 and 2006, and the related consolidated statements of income, shareholders’ equity, and cash flows for each of the three years in the period ended March 31, 2007. These financial statements are the responsibility of the Company’s management. Our responsibility is to express an opinion on these financial statements based on our audits.
We conducted our audits in accordance with the standards of the Public Company Accounting Oversight Board (United States). Those standards require that we plan and perform the audit to obtain reasonable assurance about whether the financial statements are free of material misstatement. An audit includes examining, on a test basis, evidence supporting the amounts and disclosures in the financial statements. An audit also includes assessing the accounting principles used and significant estimates made by management, as well as evaluating the overall financial statement presentation. We believe that our audits provide a reasonable basis for our opinion.
In our opinion, such consolidated financial statements present fairly, in all material respects, the financial position of the Company as of March 31, 2007 and 2006, and the results of their operations and their cash flows for each of the three years in the period ended March 31, 2007, in conformity with accounting principles generally accepted in the United States of America.
We have also audited, in accordance with the standards of the Public Company Accounting Oversight Board (United States), the effectiveness of the Company’s internal control over financial reporting as of March 31, 2007, based on the criteria established in Internal Control — Integrated Framework issued by the Committee of Sponsoring Organizations of the Treadway Commission and our report dated September 24, 2007, expressed an unqualified opinion on management’s assessment of the effectiveness of the Company’s internal control over financial reporting and an unqualified opinion on the effectiveness of the Company’s internal control over financial reporting.
As described in Note 2 (a) to the consolidated financial statements, these consolidated financial statements have been prepared in accordance with accounting principles generally accepted in the United States of America, which differ in certain material respects from accounting principles generally accepted for companies in India, which form the basis of the Company’s general purpose financial statements.
Our audit for the year ended and as of March 31, 2007, also comprehended the translation of Indian rupee amounts into U.S. dollar amounts and, in our opinion, such translation has been made in conformity with the basis stated in Note 2 (ae). Such U.S. dollar amounts are presented solely for the convenience of readers in the United States of America.
F-2
DELOITTE HASKINS & SELLS Chartered Accountants Mumbai, India
September 24, 2007.

REPORT OF INDEPENDENT REGISTERED PUBLIC ACCOUNTING FIRM
To the Board of Directors and Shareholders of Tata Motors Limited Mumbai, India
We have audited management’s assessment, included in Item 15 under Controls and Procedures of the accompanying Form 20F titled Management’s Annual Report on Internal Control Over Financial Reporting, that Tata Motors Limited and subsidiaries (the “Company”) maintained effective internal control over financial reporting as of March 31, 2007, based on criteria established in Internal Control — Integrated Framework issued by the Committee of Sponsoring Organizations of the Treadway Commission. The Company’s management is responsible for maintaining effective internal control over financial reporting and for its assessment of the effectiveness of internal control over financial reporting. Our responsibility is to express an opinion on management’s assessment and an opinion on the effectiveness of the Company’s internal control over financial reporting based on our audit.
We conducted our audit in accordance with the standards of the Public Company Accounting Oversight Board (United States). Those standards require that we plan and perform the audit to obtain reasonable assurance about whether effective internal control over financial reporting was maintained in all material respects. Our audit included obtaining an understanding of internal control over financial reporting, evaluating management’s assessment, testing and evaluating the design and operating effectiveness of internal control, and performing such other procedures as we considered necessary in the circumstances. We believe that our audit provides a reasonable basis for our opinions.
A company’s internal control over financial reporting is a process designed by, or under the supervision of, the company’s principal executive and principal financial officers, or persons performing similar functions, and effected by the company’s board of directors, management, and other personnel to provide reasonable assurance regarding the reliability of financial reporting and the preparation of financial statements for external purposes in accordance with generally accepted accounting principles. A company’s internal control over financial reporting includes those policies and procedures that (1) pertain to the maintenance of records that, in reasonable detail, accurately and fairly reflect the transactions and dispositions of the assets of the company; (2) provide reasonable assurance that transactions are recorded as necessary to permit preparation of financial statements in accordance with generally accepted accounting principles, and that receipts and expenditures of the company are being made only in accordance with authorizations of management and directors of the company; and (3) provide reasonable assurance regarding prevention or timely detection of unauthorized acquisition, use, or disposition of the company’s assets that could have a material effect on the financial statements.
Because of the inherent limitations of internal control over financial reporting, including the possibility of collusion or improper management override of controls, material misstatements due to error or fraud may not be prevented or detected on a timely basis. Also, projections of any evaluation of the effectiveness of the internal control over financial reporting to future periods are subject to the risk that the controls may become inadequate because of changes in conditions, or that the degree of compliance with the policies or procedures may deteriorate.
In our opinion, management’s assessment that the Company maintained effective internal control over financial reporting as of March 31, 2007, is fairly stated, in all material respects, based on the criteria established in Internal Control — Integrated Framework issued by the Committee of Sponsoring Organizations of the Treadway Commission.
Also in our opinion, the Company maintained, in all material respects, effective internal control over financial reporting as of March 31, 2007, based on the criteria established in Internal Control — Integrated Framework issued by the Committee of Sponsoring Organizations of the Treadway Commission.
We have also audited, in accordance with the standards of the Public Company Accounting Oversight Board (United States), the consolidated financial statements as of and for the year ended March 31, 2007 of the Company, and our report dated September 24, 2007, expressed an unqualified opinion on those financial statements.
DELOITTE HASKINS & SELLS Chartered Accountants Mumbai, India
September 24, 2007.
F-3

Tata Motors Limited Consolidated Balance Sheets
As of March 31, 2006 and 2007
See accompanying notes to consolidated financial statements
F-4
As of March 31, 2006 2007 2007 (In millions, except share and per share amounts)ASSETS:
Current assets:
Cash and cash equivalents Rs. 6,315.9 Rs. 7,652.5 US$ 177.5Short-term deposits with banks 4,914.8 173.2 4.0Investments – current 3,153.0 2,589.6 60.1Finance receivables (net of allowances of Rs. 846.8 million and Rs.730.2 million,
respectively) 20,452.9 28,704.4 666.0Accounts receivable (net of allowances of Rs. 571.1 million and Rs. 710.1 million,
respectively) 14,256.7 19,320.7 448.3Inventories 26,303.6 33,923.1 787.1Deferred income taxes 2,216.5 2,531.2 58.8Other current assets (net of allowances of Rs.1,074.8 million and Rs. 997.3 million,
respectively) 12,474.5 19,039.1 441.7
Total current assets 90,087.9 113,933.8 2,643.5Investments – non-current 21,697.5 19,668.7 456.4Equity in affiliates 2,436.1 2,690.2 62.4Finance receivables – non-current 27,164.2 54,153.5 1,256.5Property, plant and equipment, net 45,506.3 63,649.7 1,476.8Goodwill and intangible assets 9,389.2 10,229.1 237.3Other non-current assets 5,877.0 6,690.4 155.2
Total assets Rs. 202,158.2 Rs. 271,015.4 US$ 6,288.1
LIABILITIES AND SHAREHOLDERS’ EQUITY:
Liabilities:
Current liabilities:
Accounts payable Rs. 30,316.3 Rs. 45,474.0 US$ 1,055.1Acceptances 29,502.3 24,608.1 571.0Accrued expenses and other current liabilities 11,636.3 11,794.4 273.7Short-term borrowings and current portion of long term debt 9,438.1 38,902.0 902.6
Total current liabilities 80,893.0 120,778.5 2,802.4Long-term debt 27,203.3 40,235.1 933.5Other liabilities 3,607.1 8,595.2 199.4Deferred income taxes 6,135.2 5,983.6 138.8
Total liabilities 117,838.6 175,592.4 4,074.1
Commitments and contingencies (See Note 22)
Minority interest 3,303.8 4,054.1 94.1Shareholders’ equity:
Ordinary shares; Par value Rs. 10 per share; authorized 410,000,000 and 450,000,000 shares, as of March 31, 2006 and 2007 respectively, issued and fully paid up 382,820,381 and shares 385,360,135 as of March 31, 2006 and 2007 respectively; issued and partly paid up 13,750 shares partly paid up, both years 3,828.7 3,854.1 89.4
Additional paid-in capital 38,773.6 39,711.0 921.4Capital redemption reserve 22.8 52.8 1.2Debenture redemption reserve 3,341.5 3,341.5 77.5Reserve for research and human resource development 56.2 669.5 15.5Special reserve 75.2 127.8 3.0Retained earnings 20,401.3 32,135.2 745.6Accumulated other comprehensive income 14,516.5 11,477.0 266.3
Total shareholders’ equity 81,015.8 91,368.9 2,119.9
Total liabilities and shareholders’ equity Rs. 202,158.2 Rs. 271,015.4 US$ 6,288.1

Tata Motors Limited
Consolidated Statements of Income For each of the years ended March 31, 2005, 2006 and 2007
See accompanying notes to consolidated financial statements
F-5
Years ended March 31, 2005 2006 2007 2007 (In millions, except share and per share amounts)
Revenues
Gross sales Rs. 228,549.4 Rs. 272,350.8 Rs. 370,709.1 US$ 8,601.2Less: Excise duty 31,771.0 35,465.0 46,227.9 1,072.6
Net sales 196,778.4 236,885.8 324,481.2 7,528.6Finance revenues 1,608.6 3,728.7 7,043.4 163.4
Total revenues 198,387.0 240,614.5 331,524.6 7,692.0Cost of sales 156,906.7 189,318.7 263,449.7 6,112.5
Operating expenses
Selling, general and administrative 20,144.9 26,586.2 35,623.3 826.5Research and development 2,532.4 4,663.0 6,018.1 139.6Employee separation compensation (See Note 18) 11.5 4.2 2.6 0.1
Total operating expenses 22,688.8 31,253.4 41,644.0 966.2
Operating income 18,791.5 20,042.4 26,430.9 613.3
Non-operating (expense) income
Gain on shares issued by subsidiary — 86.5 30.4 0.7Gain on sale of equity interests in subsidiary (See
Note 19) — 1,532.1 — — Other non-operating income, net 1,821.6 1,882.6 4,745.4 110.1Interest income 761.6 662.8 598.3 13.9Interest expense (2,993.3) (3,717.8) (5,413.8) (125.6)
Total non-operating (expense) income (410.1) 446.2 (39.7) (0.9)
Income before equity in affiliates, minority interest and income taxes 18,381.4 20,488.6 26,391.2 612.4
Income tax expense (5,099.9) (5,618.3) (8,113.0) (188.2)Minority interest, net of tax (365.7) (331.1) (718.5) (16.7)Equity in net income of affiliates, net of tax 340.4 471.4 551.9 12.8
Net income Rs. 13,256.2 Rs. 15,010.6 Rs. 18,111.6 US$ 420.3
Weighted average equity shares outstanding: Basic 359,837,353 373,268,040 384,544,205 384,544,205 Diluted 388,849,716 399,310,236 407,166,995 407,166,995
Earnings per share:
Basic Rs. 36.8 Rs. 40.2 Rs. 47.1 US$ 1.1Diluted Rs. 34.9 Rs. 38.7 Rs. 45.4 US$ 1.1

Tata Motors Limited
Consolidated Statements of Cash Flows For each of the years ended March 31, 2005, 2006 and 2007
F-6
Years ended March 31, 2005 2006 2007 2007 (In millions)
Cash flows from operating activities:
Net income Rs. 13,256.2 Rs. 15,010.6 Rs. 18,111.6 US$ 420.3Adjustments to reconcile net income to net cash provided by operating
activities:
Depreciation 4,888.8 5,470.3 5,943.1 137.9Amortization of intangible assets 33.2 373.1 663.2 15.4 Gain on sale of finance receivables (139.5) (294.3) (412.8) (9.6)Write offs of delinquent finance receivables 77.3 294.2 1,333.9 30.9Allowances for delinquent finance receivables, net of recoveries 8.9 717.2 (116.6) (2.7)Equity in earnings of affiliates (340.4) (471.4) (551.9) (12.8)Gain on sale of property, plant and equipment (36.4) (58.0) (132.3) (3.1)Loss on liquidation of subsidiaries — — 25.8 0.6Gain on sale of investment in affiliate/ equity interests in subsidiary (29.8) (1,532.1) (214.1) (5.0)Gain on shares issued by subsidiary — (86.5) (30.4) (0.7)Deferred tax expense 904.9 684.6 828.8 19.2Gain on sale of investments (496.7) (173.8) (176.4) (4.1)Impairment of investments 40.0 — 8.6 0.2Minority interest 365.7 331.1 718.5 16.7
Changes in: Accounts receivable (1,720.1) (2,782.2) (4,993.5) (115.9)Other current assets (735.5) (10,372.9) (6,571.7) (152.5)Inventories (6,047.0) (4,605.2) (7,569.8) (175.6)Other non-current assets (342.8) (1,835.9) (812.8) (18.9)Accounts payable 146.2 3,457.4 14,203.2 329.5Acceptances 12,302.9 562.8 (4,908.7) (113.9)Accrued expenses and other current liabilities 1,490.8 977.3 2,152.3 49.9
Net cash provided by operating activities 23,626.7 5,666.3 17,498.0 405.8
Cash flows from investing activities:
Short-term bank deposits (12,939.3) 10,884.8 4,741.6 110.0Loans given to affiliate and others (5,096.6) — — — Payment made to Liquidators of subsidiaries — — (4.4) (0.1)Purchases of available-for-sale investments (1,753.7) (390.6) (123.5) (2.9)Purchase of Held to Maturity securities — — (15.0) (0.3)Purchases of other investments (1,708.6) (300.0) (45.0) (1.0)Proceeds from sale of available-for-sale investments 4,977.3 8,199.7 1,539.6 35.7 Proceeds from sale of equity interests in subsidiary — 2,078.3 — — Proceeds from sale of investments in affiliates 91.2 — 396.4 9.2Proceeds from sale of other investments 1,127.8 76.6 4.9 0.1Investments in affiliates (401.7) (181.4) (340.1) (7.9)Dividends received from affiliates 277.6 188.8 449.6 10.4Net change in finance receivables (14,243.1) (43,368.4) (79,072.3) (1,834.6)Proceeds from sale of finance receivables, net of retained interests 2,701.1 28,128.3 43,027.0 998.3 Cash flow from retained interests in securitized transactions 595.8 629.4 (286.6) (6.6)Purchases of property, plant and equipment (8,556.8) (10,354.9) (24,121.8) (559.7)Proceeds from sale of property, plant and equipment 315.3 195.8 1,040.9 24.2Purchase of intangible assets (605.9) (379.5) (1,155.2) (26.8)Shares of subsidiary purchased from minority shareholders — (152.9) — — Payments for acquisitions, net of cash acquired (186.6) (4,304.2) — —
Net cash used in investing activities (35,406.2) (9,050.2) (53,963.9) (1,252.0)

Tata Motors Limited
Consolidated Statements of Cash Flows For each of the years ended March 31, 2005, 2006 and 2007
See accompanying notes to consolidated financial statements
F-7
Years ended March 31, 2005 2006 2007 2007 (In millions)Cash flows from financing activities:
Proceeds from issuance of shares, net of issue expenses Rs. 756.4 Rs. 259.2 Rs. (0.9) US$ — Proceeds from issue of shares by a subsidiary to minority
shareholders 738.9 415.1 161.8 3.8Dividend paid (including dividend tax) (1,653.8) (5,147.5) (5,678.6) (131.8)Dividends paid to minority shareholders of subsidiaries (118.7) (127.9) (152.0) (3.5)Net change in short-term debt (3,457.0) 4,074.9 24,768.9 574.7Proceeds from issuance of long-term debt 19,230.4 8,759.7 21,667.1 502.7Repayments of long-term debt (5,508.8) (3,783.1) (2,292.7) (53.2)
Net cash provided by financing activities 9,987.4 4,450.4 38,473.6 892.7
Net change in cash and cash equivalents (1,792.1) 1,066.5 2,007.7 46.5Cash and Bank balance on liquidation of subsidiaries taken over by
Administrator — — (5.5) (0.1)Effect of foreign exchange on cash flows 154.3 376.1 (665.6) (15.4)Cash and cash equivalents, beginning of the year 6,511.1 4,873.3 6,315.9 146.5
Cash and cash equivalents, end of the year Rs. 4,873.3 Rs. 6,315.9 Rs. 7,652.5 US$ 177.5
Supplemental cash flows information:
Interest paid Rs. 2,997.8 Rs. 3,507.2 Rs. 5,017.7 US$ 116.4Income taxes paid Rs. 4,685.6 Rs. 5,609.8 Rs. 7,056.3 US$ 163.7
Non-cash transactions:
1% Foreign Currency Convertible Notes converted into 2,490,199 and 312,955 and 1,620,003 ordinary shares Rs. 602.5 Rs. 75.9 Rs. 412.7 US$ 9.6
Zero Coupon Foreign Currency Convertible Notes converted into 6,264,476 and 919,297 ordinary shares Rs. — Rs. 3,638.1 Rs. 551.0 US$ 12.8
14,053,791 ordinary shares issued on acquisition of Tata Finance Limited as purchase consideration Rs. — Rs. 6,867.9 Rs. — US$ —
Shares/warrants alloted on settlement of legal cases against the rights entitlement, which were held in abeyance Rs. — Rs. — Rs. — US$ —
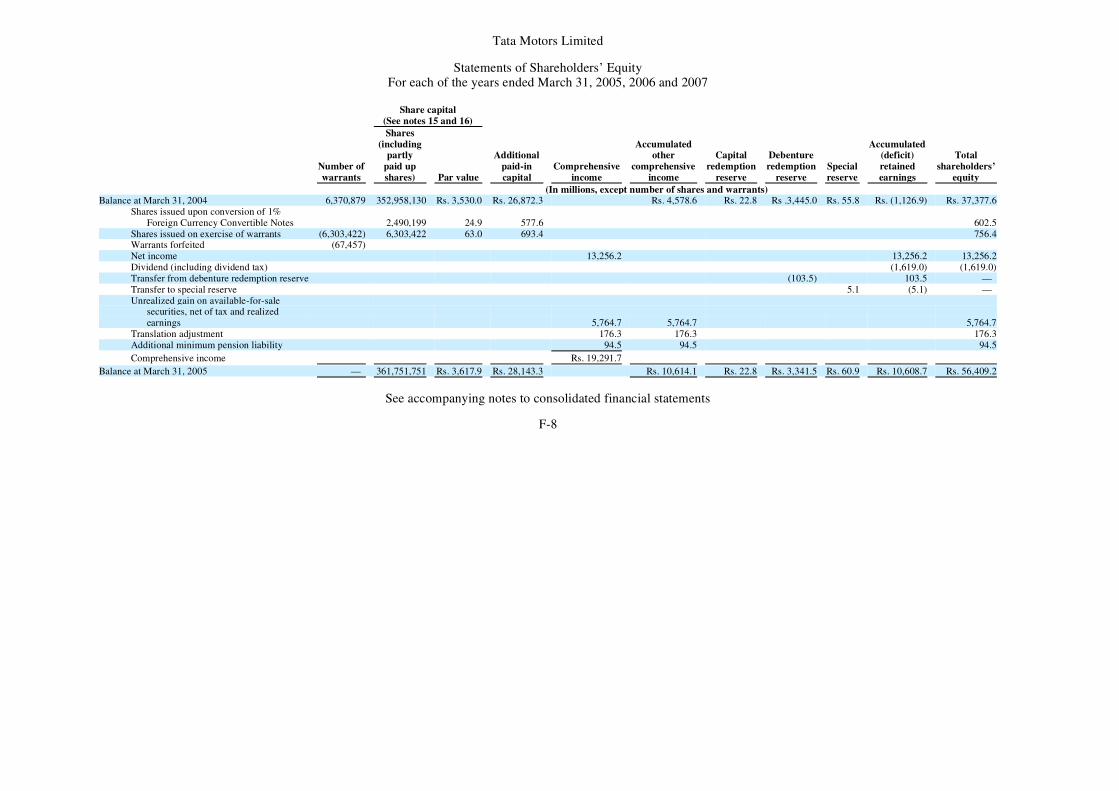
Tata Motors Limited
Statements of Shareholders’ Equity For each of the years ended March 31, 2005, 2006 and 2007
See accompanying notes to consolidated financial statements
F-8
Share capital
(See notes 15 and 16)
Number of warrants
Shares (including
partly paid up shares) Par value
Additionalpaid-in capital
Comprehensiveincome
Accumulated other
comprehensive income
Capital redemption
reserve
Debentureredemption
reserve Specialreserve
Accumulated(deficit) retained earnings
Total shareholders’
equity (In millions, except number of shares and warrants)Balance at March 31, 2004 6,370,879 352,958,130 Rs. 3,530.0 Rs. 26,872.3 Rs. 4,578.6 Rs. 22.8 Rs .3,445.0 Rs. 55.8 Rs. (1,126.9) Rs. 37,377.6
Shares issued upon conversion of 1% Foreign Currency Convertible Notes 2,490,199 24.9 577.6 602.5
Shares issued on exercise of warrants (6,303,422) 6,303,422 63.0 693.4 756.4Warrants forfeited (67,457) Net income 13,256.2 13,256.2 13,256.2Dividend (including dividend tax) (1,619.0) (1,619.0)Transfer from debenture redemption reserve (103.5) 103.5 — Transfer to special reserve 5.1 (5.1) — Unrealized gain on available-for-sale
securities, net of tax and realized earnings 5,764.7 5,764.7 5,764.7
Translation adjustment 176.3 176.3 176.3Additional minimum pension liability 94.5 94.5 94.5
Comprehensive income Rs. 19,291.7
Balance at March 31, 2005 — 361,751,751 Rs. 3,617.9 Rs. 28,143.3 Rs. 10,614.1 Rs. 22.8 Rs. 3,341.5 Rs. 60.9 Rs. 10,608.7 Rs. 56,409.2
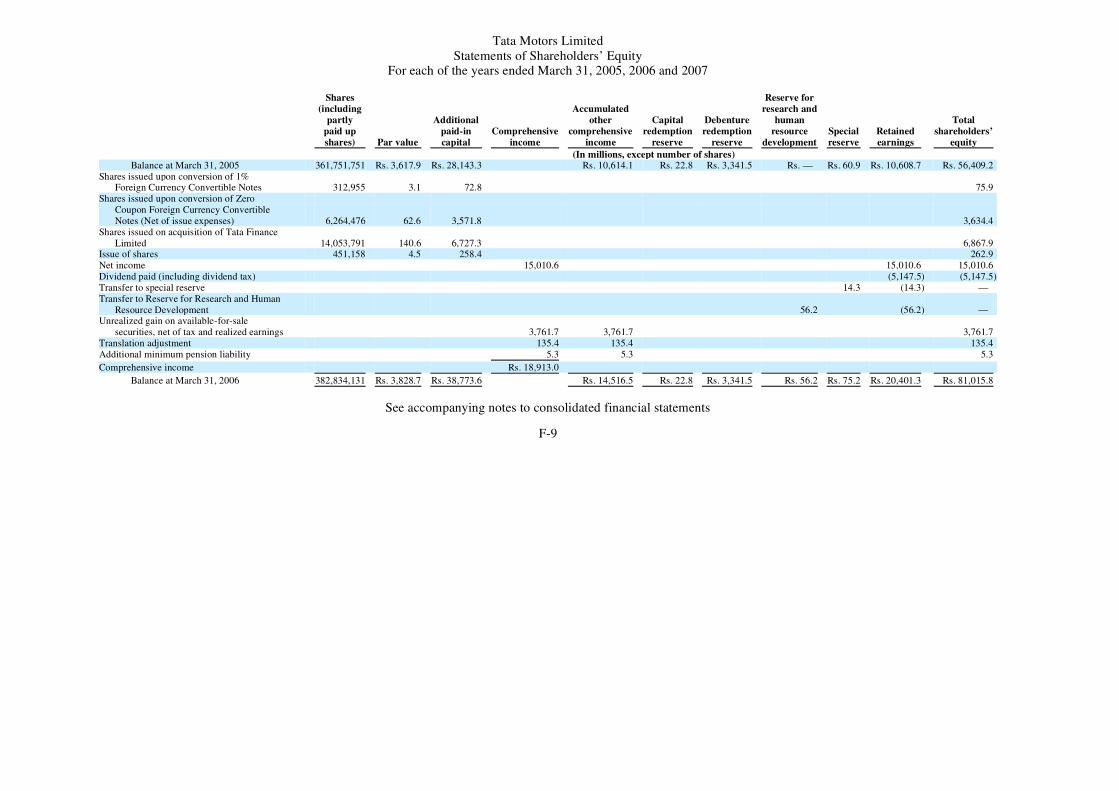
Tata Motors Limited Statements of Shareholders’ Equity
For each of the years ended March 31, 2005, 2006 and 2007
See accompanying notes to consolidated financial statements
F-9
Shares (including
partly paid up shares) Par value
Additionalpaid-in capital
Comprehensiveincome
Accumulatedother
comprehensiveincome
Capital redemption
reserve
Debenture redemption
reserve
Reserve forresearch and
human resource
development Specialreserve
Retainedearnings
Total shareholders’
equity (In millions, except number of shares)
Balance at March 31, 2005 361,751,751 Rs. 3,617.9 Rs. 28,143.3 Rs. 10,614.1 Rs. 22.8 Rs. 3,341.5 Rs. — Rs. 60.9 Rs. 10,608.7 Rs. 56,409.2 Shares issued upon conversion of 1%
Foreign Currency Convertible Notes 312,955 3.1 72.8 75.9 Shares issued upon conversion of Zero
Coupon Foreign Currency Convertible Notes (Net of issue expenses) 6,264,476 62.6 3,571.8 3,634.4
Shares issued on acquisition of Tata Finance Limited 14,053,791 140.6 6,727.3 6,867.9
Issue of shares 451,158 4.5 258.4 262.9 Net income 15,010.6 15,010.6 15,010.6 Dividend paid (including dividend tax) (5,147.5) (5,147.5)Transfer to special reserve 14.3 (14.3) — Transfer to Reserve for Research and Human
Resource Development 56.2 (56.2) — Unrealized gain on available-for-sale
securities, net of tax and realized earnings 3,761.7 3,761.7 3,761.7 Translation adjustment 135.4 135.4 135.4 Additional minimum pension liability 5.3 5.3 5.3
Comprehensive income Rs. 18,913.0
Balance at March 31, 2006 382,834,131 Rs. 3,828.7 Rs. 38,773.6 Rs. 14,516.5 Rs. 22.8 Rs. 3,341.5 Rs. 56.2 Rs. 75.2 Rs. 20,401.3 Rs. 81,015.8

Tata Motors Limited Statements of Shareholders’ Equity
For each of the years ended March 31, 2005, 2006 and 2007
See accompanying notes to consolidated financial statements
F-10
Shares (including partly paid up shares) Par value
Additionalpaid-in capital
Comprehensiveincome
Accumulatedother
comprehensiveincome
Capital redemption
reserve
Debenture redemption
reserve
Reserve forresearch
and humanresource
developmentSpecialreserve
Retainedearnings
Total shareholders’
equity (In millions except number of shares)
Balance at March 31, 2006 382,834,131 Rs. 3,828.7 Rs. 38,773.6 Rs. 14,516.5 Rs. 22.8 Rs. 3,341.5 Rs. 56.2 Rs. 75.2 Rs. 20,401.3 Rs. 81,015.8 Shares issued upon conversion of 1%
Foreign Currency Convertible Notes 1,620,003 16.2 395.6 411.8 Shares issued upon conversion of Zero
Coupon Foreign Currency Convertible Notes 919,297 9.2 541.8 551.0
Shares/warrants alloted on settlement of legal cases against the rights entitlement, which were held in abeyance 454 — — —
Net income 18,111.6 18,111.6 18,111.6 Dividend paid (including dividend tax) (5,678.6) (5,678.6)Transfer to capital redemption reserve 30.0 (30.0) — Transfer to special reserve 52.6 (52.6) — Transfer to Reserve for Research and Human
Resource Development 613.3 (613.3) — Liquidation of Subsidiaries (3.2) (3.2)Unrealized gain on available-for-sale
securities (1,634.9) (1,634.9) (1,634.9)Translation adjustment 612.0 612.0 612.0 Initial application of SFAS 158 (net of
deferred tax) (1,434.8) (1,434.8)Unamortized actuarial gains and losses/ prior
service cost (net of deferred tax) (581.8) (581.8) (581.8)
Comprehensive income Rs. 16,506.9
Balance at March 31, 2007 385,373,885 Rs. 3,854.1 Rs. 39,711.0 Rs. 11,477.0 Rs. 52.8 Rs. 3,341.5 Rs. 669.5 Rs. 127.8 Rs. 32,135.2 Rs. 91,368.9
US$ 89.4 US$ 921.4 US$ 266.3 US$ 1.2 US$ 77.5 US$ 15.5 US$ 3.0 US$ 745.6 US$ 2,119.9

Tata Motors Limited
Notes to Consolidated Financial Statements
Tata Motors Limited and its subsidiaries, collectively referred to as “the Company”, primarily designs, manufactures and sells a wide range of vehicles. The Company provides financing for the vehicles sold by it. The Company also manufactures and sells spare parts for its vehicles and engines for industrial and marine applications, as well as construction equipment, including hydraulic excavators, cranes and wheel loaders, aggregates such as axles and transmissions for commercial vehicles and factory automation equipment, and provides information technology services.
Tata Sons Limited (or Tata Sons), together with its subsidiaries, owns 22.05% of the shares of Tata Motors Limited, and has the ability to significantly influence the Company’s operations.
These consolidated financial statements have been prepared in accordance with accounting principles generally accepted in the United States of America (or US GAAP). US GAAP differs in certain material respects from accounting principles generally accepted in India and the requirements of India’s Companies Act, 1956 (collectively Indian GAAP), which form the basis of the general purpose financial statements of the Company in India.
Principal differences insofar as they relate to the Company includes the identification of subsidiaries and affiliates, differences in the measurement basis for acquisitions accounted for using the purchase method, the valuation of investments, accounting for retirement benefits, compensated absences, startup expenses, foreign exchange, debt issuance and extinguishment costs, intangible assets, research and development costs and employee separation costs and the presentation and format of the financial statements and related notes.
The Company consolidates all entities in which it has a majority financial interest. There are no Variable Interest Entities to be consolidated in accordance with Financial Accounting Standards Board (FASB) Interpretation No. 46(R), Consolidation of Variable Interest Entities, an interpretation of ARB No. 51 [FIN 46(R)]. Inter-company transactions, balances and unrealized profit or loss on inter-company transactions are eliminated on consolidation.
The results of subsidiaries acquired have been consolidated from the date of acquisition. Purchase consideration paid in excess of the fair value of net assets acquired is recognized as goodwill. The excess of fair value over the purchase consideration is first allocated to reduce the amounts otherwise assigned to the eligible acquired long-term assets, and any excess remaining is recognized as an extraordinary gain in the income statement in the period in which the business combination is consummated.
At March 31, 2006 and 2007 we had 40 and 39 consolidated subsidiaries respectively.
Entities where the Company exerts significant influence, generally where the Company controls between 20% and 50% of the voting stock of the investee company, are considered affiliates, and are accounted for using the equity method. Inter-company unrealized profit or loss on transactions with affiliates is eliminated.
F-11
1. Background and Operations
2. Significant Accounting Policies
a. Basis of Presentation
b. Basis of Consolidation
c. Affiliates
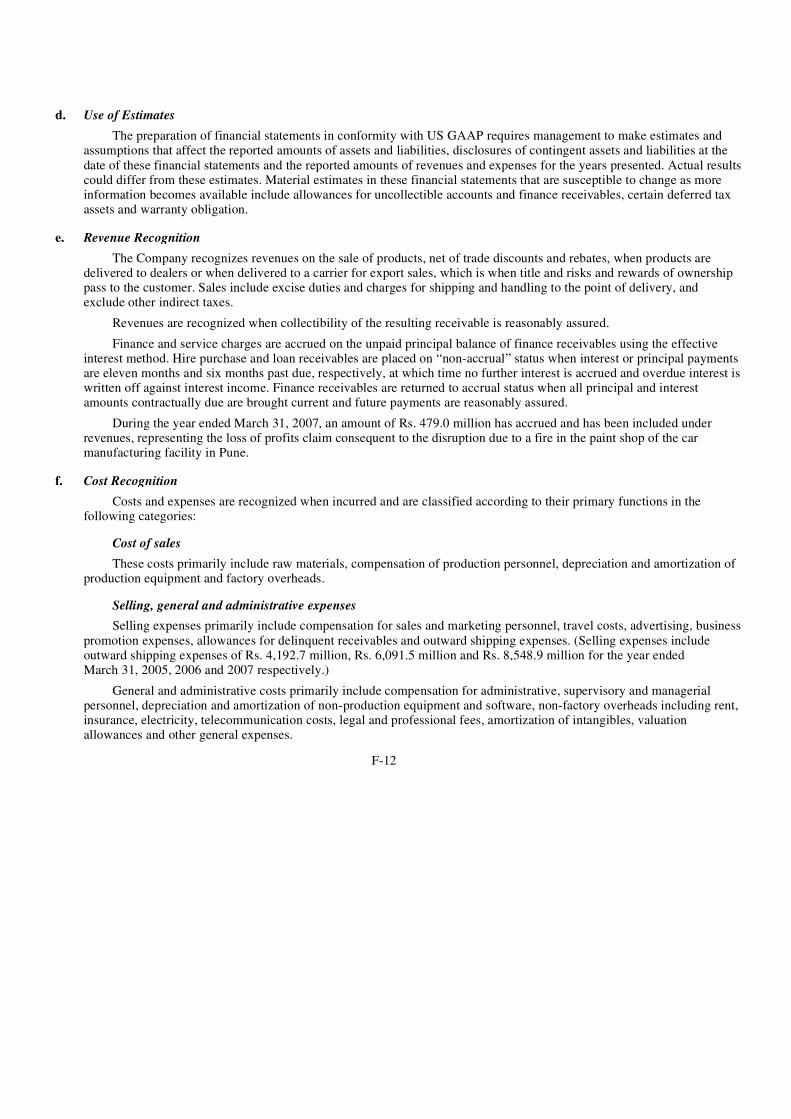
The preparation of financial statements in conformity with US GAAP requires management to make estimates and assumptions that affect the reported amounts of assets and liabilities, disclosures of contingent assets and liabilities at the date of these financial statements and the reported amounts of revenues and expenses for the years presented. Actual results could differ from these estimates. Material estimates in these financial statements that are susceptible to change as more information becomes available include allowances for uncollectible accounts and finance receivables, certain deferred tax assets and warranty obligation.
The Company recognizes revenues on the sale of products, net of trade discounts and rebates, when products are delivered to dealers or when delivered to a carrier for export sales, which is when title and risks and rewards of ownership pass to the customer. Sales include excise duties and charges for shipping and handling to the point of delivery, and exclude other indirect taxes.
Revenues are recognized when collectibility of the resulting receivable is reasonably assured. Finance and service charges are accrued on the unpaid principal balance of finance receivables using the effective
interest method. Hire purchase and loan receivables are placed on “non-accrual” status when interest or principal payments are eleven months and six months past due, respectively, at which time no further interest is accrued and overdue interest is written off against interest income. Finance receivables are returned to accrual status when all principal and interest amounts contractually due are brought current and future payments are reasonably assured.
During the year ended March 31, 2007, an amount of Rs. 479.0 million has accrued and has been included under revenues, representing the loss of profits claim consequent to the disruption due to a fire in the paint shop of the car manufacturing facility in Pune.
Costs and expenses are recognized when incurred and are classified according to their primary functions in the following categories:
Cost of sales These costs primarily include raw materials, compensation of production personnel, depreciation and amortization of
production equipment and factory overheads.
Selling, general and administrative expenses Selling expenses primarily include compensation for sales and marketing personnel, travel costs, advertising, business
promotion expenses, allowances for delinquent receivables and outward shipping expenses. (Selling expenses include outward shipping expenses of Rs. 4,192.7 million, Rs. 6,091.5 million and Rs. 8,548.9 million for the year ended March 31, 2005, 2006 and 2007 respectively.)
General and administrative costs primarily include compensation for administrative, supervisory and managerial personnel, depreciation and amortization of non-production equipment and software, non-factory overheads including rent, insurance, electricity, telecommunication costs, legal and professional fees, amortization of intangibles, valuation allowances and other general expenses.
F-12
d. Use of Estimates
e. Revenue Recognition
f. Cost Recognition

Research and development expenses All research and development expenses are expensed when incurred. Research and development expenses include all
costs relating to the Company’s Engineering Research Center (“ERC”) and all costs incurred for the design and development of new vehicle models.
The estimated liability for product warranties is recorded when products are sold. These estimates are established using historical information on the nature, frequency and average cost of warranty claims and management estimates regarding possible future incidences based on actions on product failures.
Tata Motors sells finance receivables to special purpose entities (“SPE”) in securitization transactions. Recourse is in the form of the Company’s investment in subordinated securities issued by these special purpose entities, cash collateral and bank guarantees. The receivables are derecognized in the balance sheet when they are sold and consideration has been received by the Company. Sales and transfers that do not meet the criteria for surrender of control are accounted for as secured borrowings.
Gains or losses from the sale of receivables are recognized in the period the sale occurs based on the relative fair value of the portion sold and the portion allocated to retained interests, and are reported net of the estimated cost of servicing.
The functional currency of the Company is the Indian rupee. Foreign currency transactions are translated into Indian rupees at exchange rates prevailing on the date of transaction. Foreign currency denominated monetary assets and liabilities are converted into Indian rupees using exchange rates prevailing on the balance sheet dates. Gains and losses arising on conversion of foreign currency denominated monetary assets and liabilities and on foreign currency transactions are included in net income.
The financial statements of foreign subsidiaries have been translated into Indian rupees for the purposes of consolidation as follows: income statement items have been converted at the average exchange rates during the period, and assets and liabilities have been translated at exchange rates prevailing on the balance sheet date. Any resulting unrealized gains or losses are reported in other comprehensive income, a separate component of shareholders’ equity.
Income tax consists of the current tax provision and the net change in the deferred tax asset or liability for the year. Current income taxes are provided for in accordance with the provisions of the Indian Income Tax Act of 1961 or
applicable law in foreign tax jurisdictions. Deferred tax assets and liabilities are recognized for the future tax consequences of temporary differences between the
carrying values of assets and liabilities and their respective tax bases, and unutilized business loss and depreciation carry-forwards. Such deferred tax assets and liabilities are computed separately for each taxable entity in the consolidated enterprise and for each taxable jurisdiction. Valuation allowances are recorded to reduce deferred tax assets when it is more likely than not that a tax benefit will not be realized and are separately estimated at each such entity without offsetting.
Deferred tax assets and liabilities are measured using enacted tax rates expected to apply to taxable income in the years in which the temporary differences are expected to be received or settled. The effect on deferred tax
F-13
g. Product Warranty Expenses
h. Sales of Receivables
i. Foreign Currency
j. Income Taxes

assets and liabilities of a change in tax rates is recognized in the income statement in the period of enactment of the change.
Basic earnings per ordinary share has been computed by dividing net income by the weighted average number of ordinary shares outstanding during the year. Partly paid up shares are included as fully paid equivalents according to the fraction paid up. Diluted earnings per ordinary share has been computed using the weighted average number of ordinary shares and dilutive potential ordinary shares outstanding during the year using the “if-converted” method for warrants and convertible instruments, except where the result would be antidilutive.
The Company considers all highly liquid financial instruments which are readily convertible to cash and have an original maturity on the date of purchase of three months or less to be cash equivalents.
Tata Motors finances vehicle sales with hire purchase and loan financing provided to its customers. Such contracts are accounted for as sales type leases and give rise to a normal manufacturer’s margin. Finance receivables are reported at their outstanding unpaid principal balances reduced by a valuation allowance and are reported net of any deferred origination costs.
Origination fees and certain direct origination costs are deferred and amortized as an adjustment to the yield of the related finance receivable.
The Company establishes a specific and unallocated allowance for credit losses for finance receivables based on management’s best estimate of losses inherent in the finance receivable portfolio.
The Company considers a finance receivable to be impaired when, based on current information and events, it is probable that the Company will be unable to collect scheduled payments of principal or interest when due according to the contractual terms of the financing agreement.
The Company provides a specific allowance for credit losses for hire purchase and loan receivables that are in arrears for eleven months and six months or more, respectively, in an amount equivalent to the outstanding principal and interest balance.
The allowance for credit losses is evaluated on a regular basis by management and is based upon management’s view of the probability of recovery of receivables in light of historical experience, adverse situations that may affect the borrower’s ability to repay, the estimated value of any underlying collateral, amounts that may be recoverable from originating dealers, factors affecting the industry which the receivable exposure relates to and prevailing economic conditions. This evaluation is inherently subjective, as it requires estimates that are susceptible to significant revision as more information becomes available.
Credit losses are charged against the allowance when management believes that the balance cannot be recovered. Subsequent recoveries and proceeds from auctions of repossessed vehicles are credited to the allowance.
Repossessed Vehicles Vehicles repossessed from delinquent financing customers and held for auction are recorded at the lower of the
unpaid principal balance and estimated net realizable value. Gains or losses on disposal are recorded when the vehicles are sold.
F-14
k. Earnings Per Share
l. Cash and Cash Equivalents
m. Finance Receivables, Deferred Origination Costs and Allowance for Credit Losses

Inventories are valued at the lower of cost and market. Cost of raw materials and components is ascertained on a weighted average basis. Cost of work-in-progress and finished goods are determined on a full absorption cost basis.
Financial instruments that potentially subject the Company to concentrations of credit risk principally consist of cash and cash equivalents, investments in mutual funds, other investments securities, derivative financial instruments, accounts receivable and loans and advances. None of the financial instruments result in material concentrations of credit risk.
Debt securities for which management has the positive intent and ability to hold them to maturity are classified as held-to-maturity securities and are reported at amortized cost.
Debt securities and equity securities with readily determinable fair market values that are not classified as held-to-maturity, and retained interests in sold receivables are classified as available-for-sale and recorded at fair value. Unrealized gains and losses on such securities, net of applicable taxes, are reported in other comprehensive income, a separate component of shareholders’ equity.
Retained interests in sold receivables are initially measured at fair value determined by an external credit rating process considering various factors; principally, the expected credit losses, the age of the receivables portfolio, expected prepayments and the credit rating of the Company. These retained interests are not quoted and therefore, subsequent fair values are determined based on a valuation model that takes account of various assumptions such as the shortfall in collections, prepayments, the age of the portfolio and other assumptions. These fair values are usually certified by the special purpose entities.
The Company does not have any securities classified as trading. Equity securities that do not have readily determinable market values are accounted for at original cost. The fair
values of these securities are not estimated if there are no events or changes in circumstances that may have a significant effect on the fair value.
Declines in the fair values below cost that are other than temporary are reflected in earnings as realized losses. The cost in respect of securities sold is determined on a weighted average basis.
The issuance of stock by a subsidiary to third parties reduces the proportionate ownership interest in the investee. Unless the issuance of such stock is part of a broader corporate reorganization or unless realization is not assured, the Company recognizes a gain or loss, equal to the difference between the issuance price per share and the Company’s carrying amount per share. Such gain or loss is recognized in the statement of income when the transaction occurs.
Property, plant and equipment are stated at cost of acquisition or construction less accumulated depreciation.
F-15
n. Inventories
o. Concentrations of Credit Risk
p. Investments
q. Shares issued by Subsidiary
r. Property, Plant and Equipment
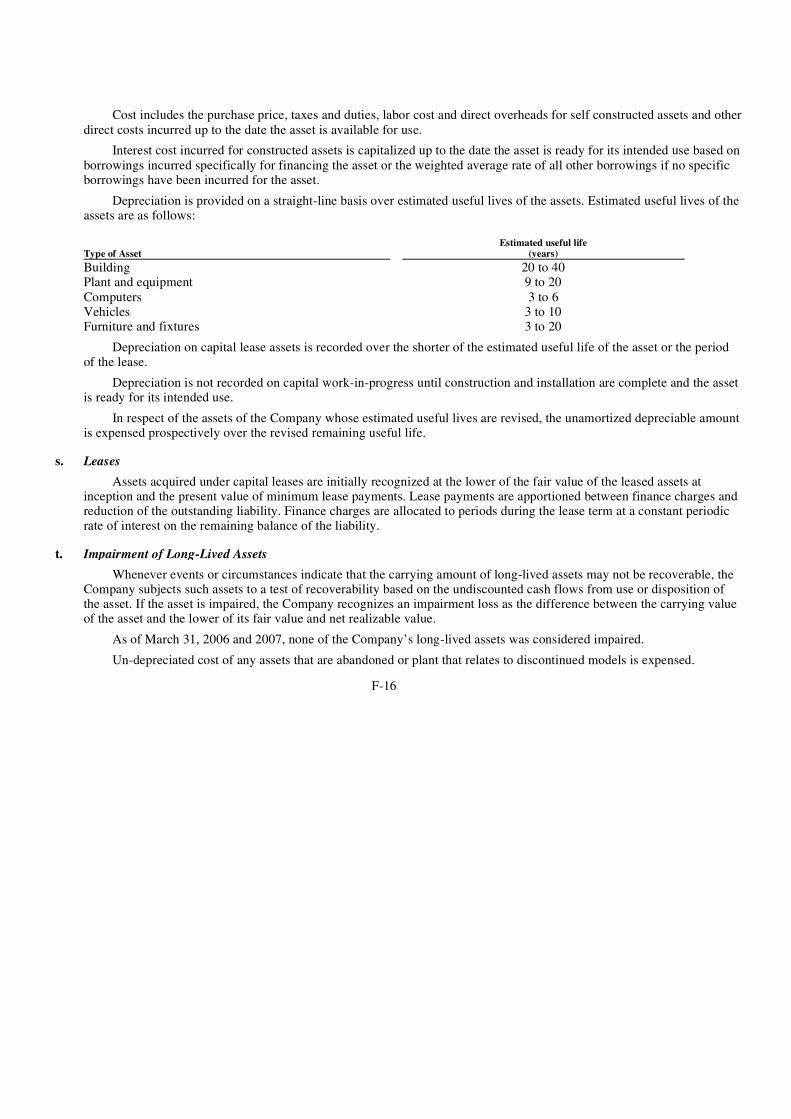
Cost includes the purchase price, taxes and duties, labor cost and direct overheads for self constructed assets and other direct costs incurred up to the date the asset is available for use.
Interest cost incurred for constructed assets is capitalized up to the date the asset is ready for its intended use based on borrowings incurred specifically for financing the asset or the weighted average rate of all other borrowings if no specific borrowings have been incurred for the asset.
Depreciation is provided on a straight-line basis over estimated useful lives of the assets. Estimated useful lives of the assets are as follows:
Depreciation on capital lease assets is recorded over the shorter of the estimated useful life of the asset or the period of the lease.
Depreciation is not recorded on capital work-in-progress until construction and installation are complete and the asset is ready for its intended use.
In respect of the assets of the Company whose estimated useful lives are revised, the unamortized depreciable amount is expensed prospectively over the revised remaining useful life.
Assets acquired under capital leases are initially recognized at the lower of the fair value of the leased assets at inception and the present value of minimum lease payments. Lease payments are apportioned between finance charges and reduction of the outstanding liability. Finance charges are allocated to periods during the lease term at a constant periodic rate of interest on the remaining balance of the liability.
Whenever events or circumstances indicate that the carrying amount of long-lived assets may not be recoverable, the Company subjects such assets to a test of recoverability based on the undiscounted cash flows from use or disposition of the asset. If the asset is impaired, the Company recognizes an impairment loss as the difference between the carrying value of the asset and the lower of its fair value and net realizable value.
As of March 31, 2006 and 2007, none of the Company’s long-lived assets was considered impaired. Un-depreciated cost of any assets that are abandoned or plant that relates to discontinued models is expensed.
F-16
Type of Asset Estimated useful life
(years)
Building 20 to 40Plant and equipment 9 to 20Computers 3 to 6Vehicles 3 to 10Furniture and fixtures 3 to 20
s. Leases
t. Impairment of Long-Lived Assets

In accordance with Statement of Financial Accounting Standards (SFAS) No. 141, Business Combinations, the Company uses the purchase method of accounting for all business combinations. Intangible assets acquired in a business combination are recognized and reported apart from goodwill if they meet the criteria specified in SFAS No. 141.
The Company tests goodwill for impairment annually. The intangible assets are amortized over their estimated useful life, which are as follows:
Purchased intangible assets other than intangible assets with indefinite lives, primarily consist of technology know-how, patents and software that are valued at acquisition cost and is amortized over its useful life of two to twenty years.
Purchased intangible assets with an indefinite useful life are capitalized. Such intangibles are not amortized but are evaluated for impairment annually or when significant events occur that indicate that the fair value is less than its carrying value. The Company determines fair value by estimating the present value of expected future cash flows.
Derivative financial instruments are reported as assets or liabilities in the balance sheet at fair value. Changes in fair value are reported in earnings. Fair values of derivative financial instruments are generally based on quoted market prices or quotations obtained from inter-bank market participants.
Although these contracts are effective as hedges from an economic perspective, they do not qualify for hedge accounting under SFAS No. 133, Accounting for Derivative Instruments and Hedging Activities, as amended, as they are not designated as hedges.
Pension benefits Gratuity
Tata Motors and some of its subsidiaries have an obligation towards gratuity, a defined benefit retirement plan covering eligible employees. The plan provides for a lump sum payment to vested employees at retirement, death while in employment or on termination of employment of an amount equivalent to 15 to 30 days salary payable for each completed year of service. Vesting occurs upon completion of five years of service. Tata Motors and the said subsidiaries make annual contributions to gratuity funds established as trusts. Some subsidiaries have obtained insurance policies with the Life Insurance Corporation of India. Tata Motors and some of its subsidiaries account for the liability for gratuity benefits payable in the future based on an actuarial valuation.
F-17
u. Goodwill and Other Intangible Assets (acquired in a business combination)
Type of Asset Estimated useful life
(years)
Software 7Customer related intangibles 10Supplier related intangibles 5
v. Purchased Intangible Assets (other than in a business combination)
w. Derivative Instruments
x. Employee Benefits

Superannuation Tata Motors and some of its subsidiaries have two superannuation plans, a defined benefit plan and a defined
contribution plan. An eligible employee on April 1, 1996 could elect to be a member of either plan. Employees who are members of the defined benefit superannuation plan are entitled to benefits depending on the
years of service and salary drawn. The monthly pension benefits after retirement range from 0.75% to 2% of the annual basic salary for each year of service. Tata Motors and the said subsidiaries account for superannuation benefits payable in future under the plan based on an actuarial valuation.
With effect from April 1, 2003, this plan was amended and benefits earned by covered employees have been protected as at March 31, 2003. Employees covered by this plan are prospectively entitled to benefits computed on a basis that ensures that the annual cost of providing the pension benefits would not exceed 15% of salary.
Tata Motors and some of its subsidiaries maintain separate irrevocable trusts for employees covered and entitled to benefits. Tata Motors and its subsidiaries contributes up to 15% of the eligible employees’ salary to the trust every year. Such contributions are recognized as an expense when incurred. Tata Motors and the said subsidiaries have no further obligation beyond this contribution.
Bhavishya Kalyan Yojana (BKY) Bhavishya Kalyan Yojana is an unfunded defined benefit plan for employees of Tata Motors and some of its
subsidiaries. The benefits of the plan accrue to an eligible employee at the time of death or permanent disablement, while in service, either as a result of an injury or as certified by the appropriate authority. The monthly payment to dependents of the deceased/disabled employee under the plan equals 50% of the salary drawn at the time of death or accident or a specified amount, whichever is higher. Tata Motors and the said subsidiaries account for the liability for BKY benefits payable in the future based on an actuarial valuation.
Severance indemnity Tata Daewoo Commercial Vehicle Company Limited (TDCV) a subsidiary company incorporated in Korea, has an
obligation towards severance indemnity, a defined benefit retirement plan, covering eligible employees. The plan provides for a lump sum payment to all employees with more than one year of employment equivalent to 30 days’ salary payable for each completed year of service.
Post-retirement Medicare Scheme Under this scheme, employees of Tata Motors and some of its subsidiaries get medical benefits subject to certain
limits of amount, periods after retirement and types of benefits, depending on their grade and location at the time of retirement. Employees separated from the Company as part of Early Separation Scheme, on medical grounds or due to permanent disablement are also covered under the scheme. Tata Motors and the said subsidiaries account for the liability for post-retirement medical scheme based on an actuarial valuation.
Measurement date The measurement date of retirement plans is March 31.
F-18

Provident fund In accordance with Indian law, eligible employees of Tata Motors and its subsidiaries are entitled to receive benefits
in respect of provident fund, a defined contribution plan, in which both employees and the company/subsidiaries make monthly contributions at a specified percentage of the covered employees’ salary (currently 12% of employees’ salary). The contributions, as specified under the law, are made to the provident fund and pension fund set up as irrevocable trust by Tata Motors and its subsidiaries or to respective Regional Provident Fund Commissioner and the Central Provident Fund under the State Pension scheme. Tata Motors and its subsidiaries are generally liable for any shortfall in the fund assets based on the government specified minimum rates of return or pension and recognises such shortfall, if any, as an expense in the year incurred.
Compensated absences The Company provides for the cost of vacation earned based on the number of days of unutilized leave at each
balance sheet date.
The Company reports long-term debt at the outstanding principal balance. The proceeds from debt issued with detachable warrants is allocated between the debt instrument and the warrant based on the relative fair values of the two instruments determined by reference to quoted market prices. The proceeds from convertible debt which has a beneficial conversion feature at inception is allocated between the host contract and the option based on the intrinsic value of the option. Amounts allocated to warrants are reported as additional paid in capital. Amounts allocated to any beneficial conversion features are deferred and amortized as a yield adjustment using the interest method over the life of the debt.
Issuance costs of long-term debt are amortized over the tenure of the debt.
Any dividends declared by Tata Motors are based on the profits available for distribution as reported in the unconsolidated statutory financial statements of Tata Motors prepared in accordance with Indian GAAP. Further, Indian law mandates that any dividend be declared out of distributable profits only after the transfer of a specified percentage of net income computed in accordance with current regulations to a general reserve. Accordingly, in certain years the net income reported in these financial statements may not be fully distributable. As at March 31, 2006 and March 31, 2007, the amounts available for distribution were Rs. 37,379.9 million and Rs. 50,670.1 million, respectively. Subsequent to March 31, 2007, Tata Motors has paid a dividend of Rs.15.00 per share. Moreover, the remittance of dividends outside India is governed by Indian law on foreign exchange and is subject to applicable taxes.
The Company reports comprehensive income in accordance with SFAS No.130, Reporting Comprehensive Income. Accounting principles generally require that recognized revenue, expenses, gains and losses be included in net income. Unrealized gains and losses on available-for-sale securities, translation adjustments arising on the consolidation of foreign subsidiaries, unamortized actuarial gains and losses and net income are components of comprehensive income.
F-19
y. Long Term Debts
z. Debt Issuance Costs
aa. Dividends
ab. Comprehensive Income

The Company operates in one identified reportable segment, namely Automotive. Other operating segments do not meet the quantitative thresholds for disclosure and have been aggregated. Segment information has been provided in Note 25.
In June 2006, the FASB issued FIN 48, Accounting for Uncertainty in Income Taxes an interpretation of FASB Statement No. 109. This Interpretation clarifies the accounting for uncertainty in income taxes recognized in an enterprise’s financial statements in accordance with FASB Statement No. 109, Accounting for Income Taxes. This Interpretation prescribes a recognition threshold and measurement attribute for the financial statement recognition and measurement of a tax position taken or expected to be taken in a tax return. This Interpretation also provides guidance on de-recognition, classification, interest and penalties, disclosure, etc. This interpretation is applicable from the fiscal year beginning after December 15, 2006. The impact, if any, on account of this interpretation is under evaluation.
In September 2006, the FASB issued SFAS 157 Fair Valuation Measurement which provides a definition of fair value, establishes a framework for measuring fair value and requires expanded disclosures about fair value measurements. SFAS 157 is effective for financial statements issued for fiscal years beginning after November 15, 2007 and interim periods within those fiscal years. The provisions of SFAS 157 should be applied prospectively. The company is evaluating the application of this statement.
In February 2007, the FASB issued SFAS 159, The Fair Value Option for Financial Assets and Financial Liabilities. SFAS 159 permits measurement of recognized financial assets and liabilities at fair value with some certain exceptions such as investments in subsidiaries, obligations for pension or other postretirement benefits, and financial assets and financial liabilities recognized under leases. Changes in the fair value of items for which the fair value option is elected should be recognized in income or loss. The election to measure eligible items at fair value is irrevocable and can only be made at defined election dates or events, generally on an instrument by instrument basis. Items for which the fair value option is elected should be separately presented or parenthetically be disclosed in the statement of financial position. SFAS 159 also requires significant new disclosures that apply for interim and annual financial statements. SFAS 159 shall be effective for fiscal years beginning after November 15, 2007 with earlier adoption permitted, if certain conditions are met. The company is evaluating the application of this statement.
The accompanying consolidated financial statements have been expressed in Indian rupees ("Rs."), the Company’s functional currency. For the convenience of the reader, the financial statements as at and for the year ended March 31, 2007 have been translated into U.S. dollars at US$1.00 = Rs. 43.1 based on the noon buying rate for cable transfers on March 30, 2007 as certified for customs purposes by the Federal Reserve Bank of New York. Such translation should not be construed as representation that the rupee amounts have been or could be converted into U.S. dollars at that or any other rate, or at all.
F-20
ac. Segments
ad. New accounting pronouncements
ae. Convenience Translation

Cash and cash equivalents consist of the following:
Net investments in sales type and direct financing leases are as follows:
Changes in the allowance for doubtful finance receivables are as follows:
Minimum direct financing lease receivables are contractually due as follows:
F-21
3. Cash and cash equivalents
As of March 31, 2006 2007 2007 (In millions)Cash on hand Rs. 76.5 Rs. 65.3 US$ 1.5Balances with banks in Indian rupees 4,561.0 6,590.5 152.9Balances with banks in foreign currencies 1,678.4 996.7 23.1
Total Rs. 6,315.9 Rs. 7,652.5 US$ 177.5
4. Finance receivables
As of March 31, 2006 2007 2007 (In millions)Total minimum lease payments to be received Rs. 54,195.8 Rs. 97,482.5 US$ 2,261.8
Less: Unearned income 5,731.9 13,894.4 322.4
48,463.9 83,588.1 1,939.4Less: Allowance for credit losses 846.8 730.2 16.9
Net investment in financing leases Rs. 47,617.1 Rs. 82,857.9 US$ 1,922.5
Current portion 20,452.9 28,704.4 666.0Non-current portion 27,164.2 54,153.5 1,256.5
Net investment in financing leases Rs. 47,617.1 Rs. 82,857.9 US$ 1,922.5
As of March 31, 2005 2006 2007 2007 (In millions)Beginning balance Rs. 120.7 Rs. 129.6 Rs. 846.8 US$ 19.6 Additional allowances for credit losses for the year ( net of
recoveries) 8.9 717.2 (116.6) (2.7)
Ending balance Rs. 129.6 Rs. 846.8 Rs. 730.2 US$ 16.9
Years ending March 31: As of March 31, 2007 (In Millions)
2008 Rs. 36,489.8 US$ 846.72009 29,256.3 678.82010 21,439.5 497.42011 8,697.8 201.82012 1,583.7 36.7Thereafter 15.4 0.4
Gross minimum lease payments to be received Rs. 97,482.5 US $ 2,261.8

Retained interests in sold receivables, which consist of subordinated / other securities that have been included in available-for-sale investments, were as follows:
Retained interests in sold receivables which are not in the nature of securities are Rs. 458.3 million and Rs. 694.5 million as on March 31, 2006 and March 31, 2007 respectively.
The following table summarizes pre-tax gains on securitizations and certain cash flows received from customers and paid to SPEs for sales that were completed in year ended March 31, 2005, 2006 and 2007:
Tata Motors retained servicing rights for finance receivables sold in securitization transactions. The servicing portfolio is summarized in the table as follows:
Key assumptions used in measuring the retained interests in finance receivables of sales completed in year ended March 31, 2005, 2006 and 2007 as of the dates of such sales were as follows:
F-22
As of March 31, 2006 2007 2007 (In millions)Subordinated / other securities Rs. 482.5 Rs. 640.1 US$ 14.8
For the years ended March 31, 2005 2006 2007 2007 (In millions)Gross proceeds from new securitizations Rs. 2,701.1 Rs. 28,128.3 Rs. 43,027.0 US$ 998.3Fair value of finance receivables derecognized 2,508.0 27,403.5 41,955.2 973.4Estimated cost of servicing by dealers 53.6 430.5 659.0 15.3
Pre-tax gains on securitization Rs. 139.5 Rs. 294.3 Rs. 412.8 US$ 9.6
Cash flow information Collections against securitized receivables Rs. 6,470.0 Rs. 15,170.2 Rs. 26,407.1 US$ 612.7Payments made to SPEs Rs. 5,852.2 Rs. 13,743.6 Rs. 25,759.3 US$ 597.7Cash flows on retained interests:
Subordinated securities Rs. 595.8 Rs. 629.4 Rs. (286.6) US$ (6.6)Others Rs. — Rs. 354.0 Rs. (236.2) US$ (5.5)
As of March 31, 2006 2007 2007 (In millions)Balance at the beginning Rs. 5,161.9 Rs. 35,971.6 US$ 834.6On acquisition 13,473.4 — — Receivables sold 32,506.5 50,282.5 1,166.6Collections (15,170.2) (26,407.1) (612.7)
Balance at the end Rs. 35,971.6 Rs. 59,847.0 US$ 1,388.5
For the years ended March 31, 2005 2006 2007
Key assumptions: (rates per annum) Annual prepayment rate 0.36% 0.42-1.74% 0.60%Expected credit losses 0.76-0.90% 0.24-1.34% 0.26-1.23%

Changes in the allowance for doubtful securitized receivables were as follows:
The table below outlines the economic assumptions and the sensitivity of the estimated fair value of retained interests in finance receivables at March 31, 2007 to immediate 10% and 20% changes in those assumptions:
The discount rate used for the valuation of retained interests is the rate of return to the transferees of the various pools of securitized receivables and, therefore, is not subject to change. The weighted average life in years of the securitized receivables is also not subject to change except in case of change in the prepayment rate assumption. Consequently, the above sensitivity analysis does not include the impact on the estimated fair values of the retained interests due to adverse change in the weighted average life in years or the discount rate.
The above sensitivities are hypothetical and should be used with appropriate caution. A 10% change in the assumptions may not result in lineally proportionate changes in the fair values of retained interests. Adverse changes assumed in the above analysis and resultant changes in the fair values of retained interests are calculated independently of each other. In reality, any change in one factor may cause changes in the other factors.
F-23
As of March 31, 2005 2006 2007 2007 (In millions)Beginning balance Rs. 137.5 Rs. 186.0 Rs. 411.5 US$ 9.5Additional allowances for credit losses for the year (net of
recoveries) (includes Rs. 217.1 million liability assumed on acquisition for 2006) 48.5 225.5 667.7 15.5
Ending balance Rs. 186.0 Rs. 411.5 Rs. 1,079.2 US$ 25.0
As of March 31, 2007 (In millions)Carrying value/fair value of retained interests
Annual prepayment rate
Impact of 10% adverse change Rs. 0.1 US$— Impact of 20% adverse change 0.3 —
Expected credit losses Impact of 10% adverse change 0.8 — Impact of 20% adverse change 1.6 —

Inventories consist of the following:
Other current assets consist of the following:
Investments consist of the following:
F-24
5. Inventories
As of March 31, 2006 2007 2007 (In millions)Raw materials and manufacturing supplies Rs. 13,280.3 Rs. 16,110.6 US$ 373.8Work-in-progress 3,629.8 4,009.7 93.0Finished products 9,393.5 13,802.8 320.3
Total Rs. 26,303.6 Rs. 33,923.1 US$ 787.1
6. Other current assets
As of March 31, 2006 2007 2007 (In millions)Advances to suppliers, contractors and others Rs. 2,158.3 Rs. 7,059.1 US$ 163.7Deposits with government and public bodies 2,198.9 2,782.5 64.6Prepaid expenses 467.7 862.5 20.0Advance taxes (net) 3,183.6 2,986.7 69.3Other current assets 4,466.0 5,348.3 124.1
Total Rs. 12,474.5 Rs. 19,039.1 US$ 441.7
7. Investments
As of March 31, 2006 2007 2007 (In millions)Investments available-for-sale, at market Rs. 22,131.1 Rs. 19,484.2 US$ 452.1Investments held-to-maturity, at amortized cost 61.5 76.5 1.8Investments at cost, net 2,657.9 2,697.6 62.6
Total Rs. 24,850.5 Rs. 22,258.3 US$ 516.5

Information on unrealized gains and losses for investments available-for-sale is as follows:
The contractual maturity of the Company’s available-for-sale debt securities as of March 31, 2007 is as follows:
F-25
Available-for-sale securities Amortized
Cost
Gross unrealized
gains
Gross unrealized
losses Fair value (In millions)As of March 31, 2006:
Equity shares Rs. 2,572.9 Rs. 14,738.0 Rs. — Rs. 17,310.9Investments in mutual funds 2,570.5 134.2 — 2,704.7Government bonds 6.0 0.4 — 6.4Corporate bonds and other debt securities 1,646.7 — 20.1 1,626.6
6,796.1 14,872.6 20.1 21,648.6
Retained interests in securitized transactions 482.5
Total available-for-sale securities Rs. 22,131.1
As of March 31, 2007:
Equity shares Rs. 2,623.1 Rs. 13,264.3 Rs. 17.3 Rs. 15,870.1Investments in mutual funds 1,327.8 50.6 — 1,378.4Government bonds — — — — Corporate bonds and other debt securities 1,620.3 — 24.7 1,595.6
5,571.2 13,314.9 42.0 18,844.1
Retained interests in securitized transactions 640.1
Total available-for-sale securities Rs. 19,484.2
Total available-for-sale securities US$ 452.1
Amortized
Cost Fair value (In millions)Due in year ending March 31,
2008 Rs. 1,068.1 Rs. 1,051.12009 379.5 371.82010 150.0 150.02011 7.5 7.52012 7.7 7.7Thereafter 7.5 7.5
Rs. 1,620.3 Rs. 1,595.6 US$ 37.6 US$ 37.0

Information on unrealized gains and losses for held-to-maturity investments is as follows:
The contractual maturity of the Company’s fixed income held-to-maturity securities as of March 31, 2007 is as follows:
Information on equity investments without readily determinable market values is as follows:
The current and non – current break up of investments are as under
Interest and dividends on investments were Rs. 802.6 million, Rs. 661.5 million and Rs. 1,076.0 million in the years ended March 31, 2005, 2006 and 2007, respectively. Realized gains on sale of investments for year ended March 31, 2005, 2006 and 2007 amounted to Rs. 496.7million, Rs. 173.8 million and Rs. 176.4 million, respectively.
F-26
Held-to-maturity securities Fair value
Gross unrealized
gains
Gross unrealized
losses Amortized
Cost (In millions)As of March 31, 2006:
Debentures Rs. 61.5 — — Rs. 61.5
As of March 31, 2007:
Debentures Rs. 76.5 — — Rs. 76.5
US$1.8 — — US$ 1.8
In millions
Due in year ending March 31,
2010 Rs. 61.5Thereafter 15.0
Rs. 76.5
In millions
As of March 31, 2006:
Original cost Rs. 2,747.8Less: Other than temporary impairment 89.9
Total securities carried at cost, net Rs. 2,657.9
As of March 31, 2007:
Original cost Rs. 2,790.8Less: Other than temporary impairment 93.2
Total securities carried at cost, net Rs. 2,697.6
Total securities carried at cost, net US$ 62.6
As of March 31, 2006 2007 2007 (In millions)Current Investments Rs. 3,153.0 Rs. 2,589.6 US$ 60.1Non-current Investments 21,697.5 19,668.7 456.4
Total Rs. 24,850.5 Rs. 22,258.3 US$ 516.5
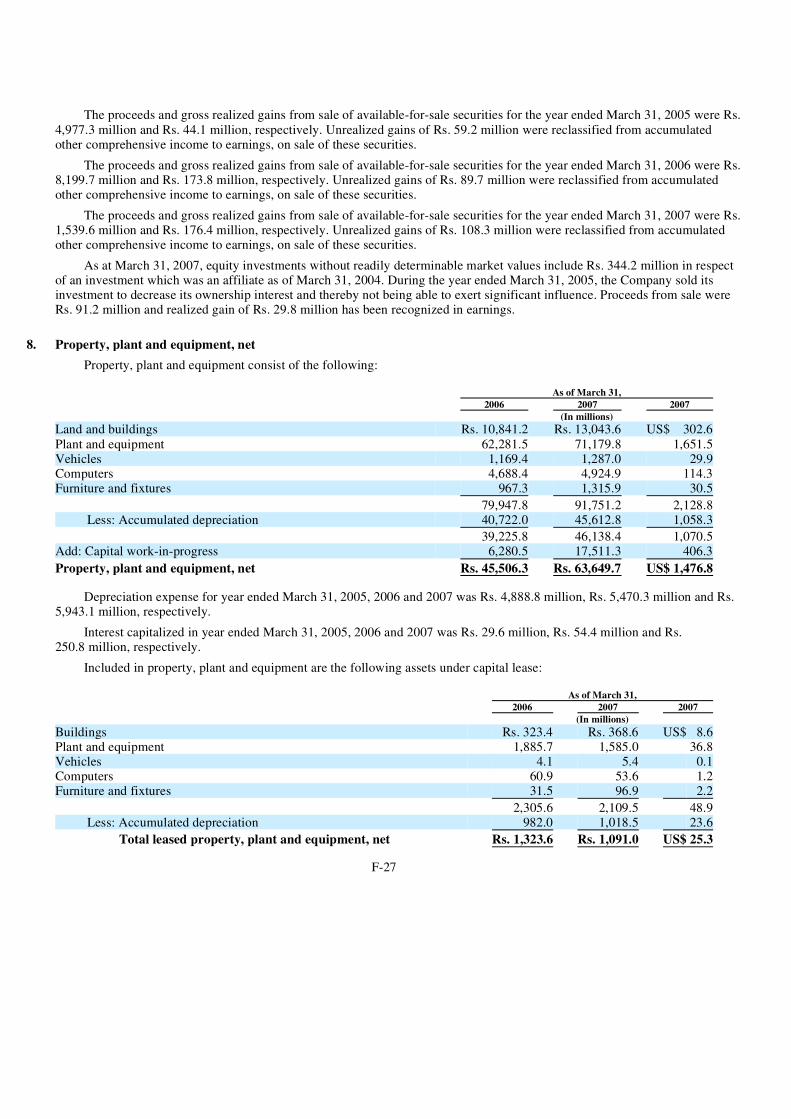
The proceeds and gross realized gains from sale of available-for-sale securities for the year ended March 31, 2005 were Rs. 4,977.3 million and Rs. 44.1 million, respectively. Unrealized gains of Rs. 59.2 million were reclassified from accumulated other comprehensive income to earnings, on sale of these securities.
The proceeds and gross realized gains from sale of available-for-sale securities for the year ended March 31, 2006 were Rs. 8,199.7 million and Rs. 173.8 million, respectively. Unrealized gains of Rs. 89.7 million were reclassified from accumulated other comprehensive income to earnings, on sale of these securities.
The proceeds and gross realized gains from sale of available-for-sale securities for the year ended March 31, 2007 were Rs. 1,539.6 million and Rs. 176.4 million, respectively. Unrealized gains of Rs. 108.3 million were reclassified from accumulated other comprehensive income to earnings, on sale of these securities.
As at March 31, 2007, equity investments without readily determinable market values include Rs. 344.2 million in respect of an investment which was an affiliate as of March 31, 2004. During the year ended March 31, 2005, the Company sold its investment to decrease its ownership interest and thereby not being able to exert significant influence. Proceeds from sale were Rs. 91.2 million and realized gain of Rs. 29.8 million has been recognized in earnings.
Property, plant and equipment consist of the following:
Depreciation expense for year ended March 31, 2005, 2006 and 2007 was Rs. 4,888.8 million, Rs. 5,470.3 million and Rs. 5,943.1 million, respectively.
Interest capitalized in year ended March 31, 2005, 2006 and 2007 was Rs. 29.6 million, Rs. 54.4 million and Rs. 250.8 million, respectively.
Included in property, plant and equipment are the following assets under capital lease:
F-27
8. Property, plant and equipment, net
As of March 31, 2006 2007 2007 (In millions)Land and buildings Rs. 10,841.2 Rs. 13,043.6 US$ 302.6Plant and equipment 62,281.5 71,179.8 1,651.5Vehicles 1,169.4 1,287.0 29.9Computers 4,688.4 4,924.9 114.3Furniture and fixtures 967.3 1,315.9 30.5
79,947.8 91,751.2 2,128.8Less: Accumulated depreciation 40,722.0 45,612.8 1,058.3
39,225.8 46,138.4 1,070.5Add: Capital work-in-progress 6,280.5 17,511.3 406.3
Property, plant and equipment, net Rs. 45,506.3 Rs. 63,649.7 US$ 1,476.8
As of March 31, 2006 2007 2007 (In millions)Buildings Rs. 323.4 Rs. 368.6 US$ 8.6Plant and equipment 1,885.7 1,585.0 36.8Vehicles 4.1 5.4 0.1Computers 60.9 53.6 1.2Furniture and fixtures 31.5 96.9 2.2
2,305.6 2,109.5 48.9Less: Accumulated depreciation 982.0 1,018.5 23.6
Total leased property, plant and equipment, net Rs. 1,323.6 Rs. 1,091.0 US$ 25.3

The Company has taken on lease property, machinery, equipment and vehicles under operating and capital leases. The following is a summary of future minimum lease rental commitments under non cancelable operating leases and capital leases entered into by the Company:
Total operating lease rental expense was Rs. 116.1 million, Rs. 168.7 million and Rs. 158.2 million in the year ended March 31, 2005, 2006 and 2007, respectively.
The income tax expense consists of the following:
F-28
9. Leases
As of March 31, 2007 Operating Capital (In millions)Years ending March 31,
2008 Rs. 174.8 Rs. 29.72009 161.1 23.92010 100.6 17.32011 82.5 16.52012 49.5 7.6Thereafter 54.5 —
Total minimum lease commitments 623.0 95.0Less: Interest on capital leases — 11.4
Present value of minimum lease payments Rs. 623.0 Rs. 83.6
10. Income taxes
For the years ended March 31, 2005 2006 2007 2007 (In millions)Current Rs. 4,195.0 Rs. 4,933.7 Rs. 7,284.2 US$ 169.0Deferred 904.9 684.6 828.8 19.2
Total income tax expense Rs. 5,099.9 Rs. 5,618.3 Rs. 8,113.0 US$ 188.2

The domestic and foreign tax components of Income tax expense are given below:
The reconciliation of estimated income taxes at the Indian statutory income tax rate to income tax expense is as follows:
Effective year ended March 31, 2005, long-term capital gains on sale of equity shares through a recognized stock exchange have been exempted from tax. Consequently, reduction in deferred tax liability on unrealized gain on such investments held by Tata Motors has been included in determination of net income for the year ended March 31, 2005.
Significant components of deferred tax asset and liability are as follows:
F-29
For the years ended March 31, 2005 2006 2007 2007 (In millions)Current taxes
Domestic Rs. 4,132.3 Rs. 4,710.7 Rs. 6,654.2 US$ 154.4Foreign 62.7 223.0 630.0 14.6
Deferred taxes
Domestic 797.8 505.9 796.0 18.5Foreign 107.1 178.7 32.8 0.7
Total income tax expense Rs. 5,099.9 Rs. 5,618.3 Rs. 8,113.0 US$ 188.2
For the years ended March 31, 2005 2006 2007 2007 (In millions)
Income before income taxes Rs. 18,381.4 Rs. 20,488.6 Rs. 26,391.2 US$ 612.4Statutory tax rate 36.5925% 33.66% 33.66% 33.66%Expected income tax expense at statutory tax
rate Rs. 6,726.2 Rs. 6,896.5 Rs. 8,883.3 US$ 206.1Add/(less): Tax effect of permanent differences
Research and development (410.4) (808.2) (1,316.4) (30.5)Dividend income (268.6) (161.6) (315.7) (7.3)Long term gain on sale of shares of
subsidiary — (515.7) — — Set off of loss upon demerger (360.3) — — —
Undistributed earnings of subsidiaries 161.7 390.1 603.1 14.0Effect of change in tax laws and rates (484.5) (391.3) — — Change in valuation allowance (84.0) (6.7) 68.9 1.6Others (Net) (180.2) 215.2 189.8 4.3
Income tax expense reported Rs. 5,099.9 Rs. 5,618.3 Rs. 8,113.0 US$ 188.2
As of March 31, 2006 2007 2007 (In millions)Deferred tax assets:
Depreciation carryforwards Rs. 103.9 Rs. 133.8 US$ 3.1Business loss carryforwards 469.5 1,067.8 24.8Employees separation scheme 232.2 152.8 3.5Expenses deductible in future years 537.2 409.8 9.5On valuation adjustment of assets of acquired company 1,130.8 1,388.4 32.2

Valuation allowances have been created for deferred tax assets arising at subsidiaries that are making losses and that do not expect a return to tax profitability in the foreseeable future. The net change in the total valuation allowance for deferred tax assets for the years ended March 31, 2005, 2006 and 2007 consist of the following:
In assessing the realisability of deferred tax assets representing loss carry forwards, management considers whether these assets could be realized on the basis of generation of future taxable income during the periods in which these carry forwards become deductible. Accordingly suitable valuation allowance has been created.
Deferred tax assets and liabilities are offset if they arise in the same legal entity and taxing jurisdiction but not otherwise. Under the Indian Income Tax Act, 1961, unutilized business losses expire eight years after the year in which they originate
whereas unutilized depreciation allowances can be carried forward indefinitely. In respect of a foreign subsidiary in Singapore the unutilized business losses can be carried forward indefinitely unless there is a substantial change in the ownership.
During the year ended March 31, 2006, INCAT International Plc, UK and Tata Technologies Pte Limited Singapore, were acquired by subsidiaries of the Company. Based on evaluation of possibility of utilization of the pre-acquisition carried forward losses, a valuation allowance of the entire amount of Rs. 149.5 million has been created. Reversal, if any, of the valuation allowance would be recorded as the reduction of goodwill arising from the respective acquisition.
Business loss carryforwards expire unutilized based on the year of origination as follows:
F-30
Allowances for doubtful receivables and other current assets 818.0 1,046.2 24.3Upfront fees and debt issuance costs 153.0 288.8 6.7Compensated absences 835.4 1,175.5 27.3Retirement benefits — 624.0 14.5Others 376.9 476.6 11.1
Total deferred tax asset 4,656.9 6,763.7 157.0Less: Valuation allowance 503.1 1,180.7 27.4
Net deferred tax asset 4,153.8 5,583.0 129.6
Deferred tax liabilities:
Property, Plant & Equipment 6,691.6 7,245.4 168.1Retirement benefits 321.7 — — Undistributed earnings in subsidiaries 563.6 1,166.6 27.1Reserve for Research & Human resource development 305.9 270.2 6.3 Others 189.7 353.2 8.1
Total deferred tax liability 8,072.5 9,035.4 209.6
Net deferred tax liability Rs. (3,918.7) Rs. (3,452.4) US$ (80.0)
Current Rs. 2,216.5 Rs. 2,531.2 US$ 58.8Non-current Rs. (6,135.2) Rs. (5,983.6) US$(138.8)
For the years ended March 31, 2005 2006 2007 2007 (In millions)
Valuation allowance at the beginning of the year Rs. 448.3 Rs. 364.3 Rs. 503.1 US$11.7Additions 3.8 186.6 735.2 17.0Deductions (87.8) (47.8) (57.6) (1.3)
Valuation allowance at the end of the year Rs. 364.3 Rs. 503.1 Rs. 1,180.7 US$27.4
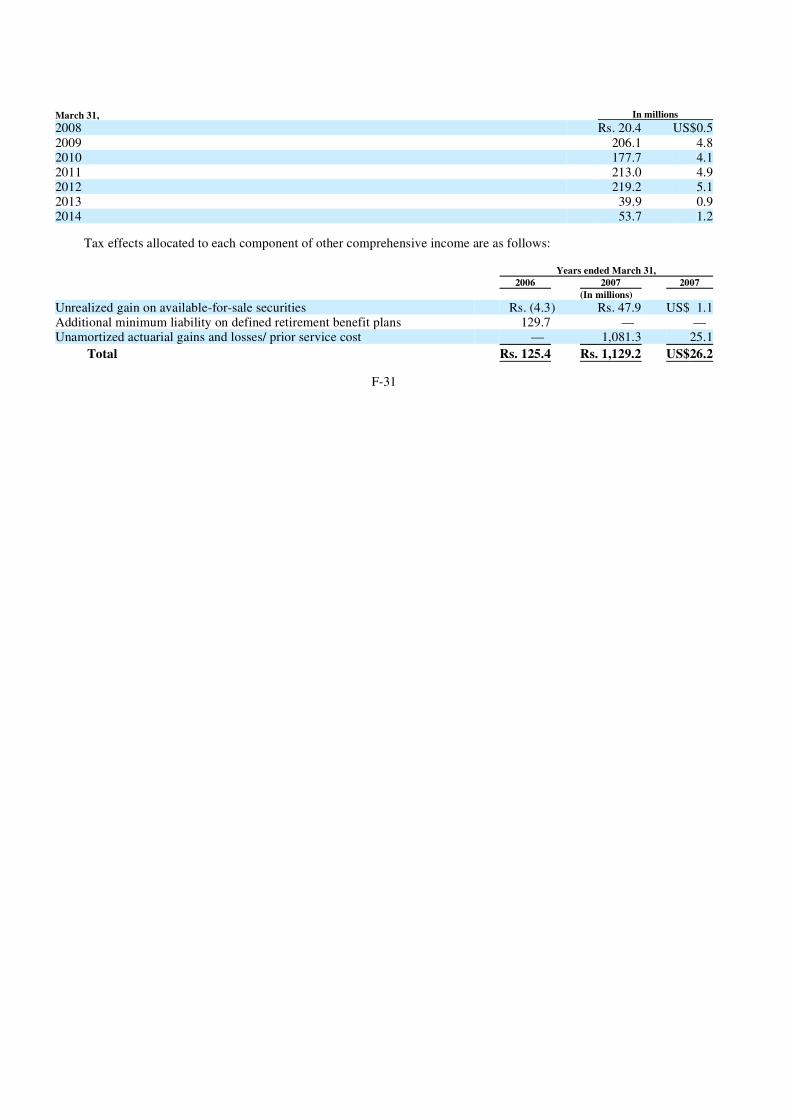
Tax effects allocated to each component of other comprehensive income are as follows:
F-31
March 31, In millions
2008 Rs. 20.4 US$0.52009 206.1 4.82010 177.7 4.12011 213.0 4.92012 219.2 5.12013 39.9 0.92014 53.7 1.2
Years ended March 31, 2006 2007 2007 (In millions)Unrealized gain on available-for-sale securities Rs. (4.3) Rs. 47.9 US$ 1.1Additional minimum liability on defined retirement benefit plans 129.7 — — Unamortized actuarial gains and losses/ prior service cost — 1,081.3 25.1
Total Rs. 125.4 Rs. 1,129.2 US$26.2

As of March 31, 2006 Goodwill of Rs. 4,664.5 million and Rs. 2,369.6 million relates to the automotive segment and other segment respectively. As of March 31, 2007 Goodwill of Rs. 4,660.1 million and Rs.2,579.0 million relates to the automotive segment and other segment respectively. The movement of goodwill is given below:
In year ended March 31, 2005, 2006 and 2007, there were no goodwill impairments. Intangible assets consist of the following:
Amortization expense for year ended March 31, 2005, 2006 and 2007 was Rs. 33.2 million, Rs. 373.1 million and Rs. 663.2 million, respectively.
F-32
11. Goodwill and Other Intangible Assets
As of March 31, 2006 2007 2007 (In millions)Goodwill Rs. 7,034.1 Rs. 7,239.1 US$167.9Other intangible assets 2,355.1 2,990.0 69.4
Total Rs. 9,389.2 Rs. 10,229.1 US$237.3
Years ended March 31, 2005 2006 2007 2007 (In millions)
Balance at the beginning Rs. 201.2 Rs. 289.9 Rs. 7,034.1 US$163.2On acquisition during the year 88.7 6,744.2 — — Effect of currency translation — — 225.8 5.2Deductions on liquidation of subsidiaries during the year — — (20.8) (0.5)
Balance at the end Rs. 289.9 Rs. 7,034.1 Rs. 7,239.1 US$167.9
As of March 31, 2006 2007 2007 (In millions)Software Rs. 1,070.1 Rs. 1,749.1 US$40.7Patents and Technology know-how 388.9 561.2 13.1Customer Related 966.7 1,023.1 23.7Supplier Related 691.1 759.0 17.6
3,116.8 4,092.4 95.1Less: Accumulated amortization
Software 234.8 649.8 15.1Patents and Technology know-how 383.0 28.3 0.7Customer Related 74.8 196.6 4.6Supplier Related 69.1 227.7 5.3
761.7 1,102.4 25.7
Intangible assets, Total Rs. 2,355.1 Rs. 2,990.0 US$69.4

The estimated year wise amortization for Intangible assets is as follows:
Other non-current assets consist of the following:
Margin money with banks is in the nature of restricted cash, and consists of collateral provided in support of guarantees issued by banks on the Company’s behalf, in accordance with loan agreements and as may be required for securitization transactions.
Accrued expenses and other current liabilities consist of the following:
F-33
As of March 31,Due in the year ending March 31, (In millions)
2008 Rs. 744.4 US$17.22009 714.6 16.62010 493.7 11.52011 292.8 6.82012 184.6 4.3Thereafter 559.9 13.0
Total Rs. 2,990.0 US$69.4
12. Other non-current assets
As of March 31, 2006 2007 2007 (In millions)Deposits with Government and public bodies Rs. 442.3 Rs. 533.6 US$ 12.3Margin money 2,444.3 2,675.7 62.1Loans to employees 1,165.1 1,052.0 24.4Loans to affiliates 269.7 — — Others 1,555.6 2,429.1 56.4
Total Rs. 5,877.0 Rs. 6,690.4 US$155.2
13. Accrued expenses and other current liabilities
As of March 31, 2006 2007 2007 (In millions)Advances Rs. 4,198.8 Rs. 3,470.7 US$ 80.5Accrued interest 199.9 282.6 6.6Product warranties 1,811.5 2,187.3 50.7Liability for compensated absences 3,070.7 3,835.5 89.0Provision for employee benefits 659.3 190.4 4.4Other accrued expenses 1,696.1 1,827.9 42.5
Total Rs. 11,636.3 Rs. 11,794.4 US$273.7

Short-term borrowings and current portion of long term debt consists of the following:
Inter corporate deposits and Commercial paper are unsecured while bank debt and Loan from State Bank of India are secured by hypothecation of existing and future stocks of raw materials, stock in trade, stores, work in progress, book debts, hire purchase book debts and outstanding amounts on vehicle loan contracts.
Long-term debt consists of the following:
F-34
14. Short-term borrowings and current portion of long term debt
As of March 31, 2006 2007 2007 (In millions)
Inter-corporate deposits Rs. 42.5 Rs. 42.5 US$ 1.0Commercial paper — 1,400.0 32.5Bank debt 7,930.3 26,265.1 609.4Loan from State Bank of India (foreign currency, floating rate
demand loan) — 5,436.9 126.1 Current portion of long-term debt 1,465.3 5,757.5 133.6
Total Rs. 9,438.1 Rs. 38,902.0 US$902.6
Weighted average interest rate 6.12% 7.17% 7.17%Unused short-term credit facilities available Rs. 23,636.9 Rs. 19,870.5 US$461.0
15. Long-term debt
As of March 31, Redemption/ 2006 2007 2007 Maturity date (In millions)Debentures:
14.75% Non-convertible debentures October 11, 2008 Rs. 702.6 Rs. 703.3 US$ 16.3Floating rate non convertible debentures October 1, 2007 49.8 50.0 1.2
Foreign Currency Convertible Notes:
1% Foreign Currency Convertible Notes July 31, 2008 435.2 3.0 0.1Zero Coupon Foreign Currency Convertible
Notes (USD) April 27, 2009 770.6 250.4 5.81% Foreign Currency Convertible Notes April 27, 2011 13,931.0 13,998.7 324.8Zero Coupon Foreign Currency Convertible
Notes (JPY) March 21, 2011 4,384.7 4,267.4 99.0
7.875% US Notes July 15, 2007 1,987.0 1,937.0 44.94.7% - 6.0% Buyers credit — 4,312.6 100.1Others:
Loan from Standard Chartered Bank February 03, 2009 2,685.8 2,168.0 50.3Loan from other banks in Indian rupees 2008 to 2010 — 13,500.0 313.2Others Term loans 1,159.7 3,118.8 72.4Foreign currency loans from banks 1,502.4 890.0 20.6

Interest rates shown in the table above are the stated coupon interest rates as per the terms of the loan. The effective interest rates and the face amount of the loans included in the above table, for which the coupon and effective rates are different, are as follows:
The scheduled maturity of long-term debt as of March 31, 2007 is set out as below:
F-35
Zero coupon sales tax deferment loan 857.8 705.2 16.4Other 202.0 88.2 2.0
Total Rs. 28,668.6 Rs. 45,992.6 US$1,067.1Less: current portion 1,465.3 5,757.5 133.6
Long-term debt Rs. 27,203.3 Rs. 40,235.1 US$ 933.5
Weighted average interest rate 4.60% 4.84% 4.84%
As of March 31, Effective interest rate Face amount 2006 2007 2006 2007 2007 (In millions)14.75% non convertible Debentures 14.88% 14.88% Rs. 705.0 Rs. 705.0 US$ 16.4Floating rate non convertible debentures 8.10% 8.48% 50.0 50.0 1.21% Foreign Currency Convertible Notes due 2008 4.31% — 395.3 2.6 0.1Zero Coupon Foreign Currency Convertible Notes due
2009 1.51% 4.62% 808.7 265.8 6.21% Foreign Currency Convertible Notes due 2011 4.06% 3.91% 13,385.3 13,048.5 302.7Zero Coupon Foreign Currency Convertible Notes (JPY) 0.19% 0.17% 4,456.9 4,330.0 100.57.875% US Notes 7.87% 7.87% 1,987.0 1,937.0 44.95.12% Loan from Standard Chartered Bank 5.31% 5.93% 2,677.8 2,172.8 50.4Zero coupon sales tax deferment loan 5.75% 7.40% 958.5 754.9 17.5
As of March 31, 2007Due in the year ending March 31, (In millions)
2008 Rs. 5,757.5 US$ 133.62009 14,447.5 335.22010 7,098.9 164.72011 4,555.8 105.72012 14,064.6 326.3Thereafter 68.3 1.6
Total Rs. 45,992.6 US$1,067.1

Non-refundable fees and loan origination costs amounting Rs. 402.0 million, Rs. 495.0 million and Rs. 417.1 million has been recognized as interest expense in year ended March 31, 2005, 2006 and 2007, respectively, as an adjustment of yield over the lives of the related loans.
Premium on early redemption of loans and debentures of Rs. 121.4 million, Rs. 22.0 million and Rs. Nil has been recognized in earnings in year ended March 31, 2005, 2006 and 2007, respectively.
The following are specific terms relating to long-term debt: Debentures The 14.75% Non-Convertible Debentures (2008) and Floating rate Non-Convertible Debentures (2007) are secured by pari
passu charges by way of equitable mortgages of immovable properties and fixed assets in or attached thereto, both present and future, and a first lien on all other assets except inventory and book debts, present and future, two of the Company’s showrooms in Mumbai, land and buildings in Mumbai; the Company’s residential flats at Mumbai, Pune and Jamshedpur; freehold land measuring approximately 4,245 sq. mtrs. situated in Thane.
Foreign Currency Convertible Notes 1% Foreign Currency Convertible Notes due 2008
On July 31, 2003, Tata Motors issued 1% foreign currency convertible Notes (or the “Notes”) amounting to Rs. 4,615.6 million (US$100 million). Unless previously redeemed, or purchased and cancelled the Notes may be converted into newly issued ordinary shares of the Company or American Depositary Shares (“ADSs”), at the option of the holders of the Notes, at any time from September 11, 2003 to July 1, 2008, at an initial conversion price of Rs. 250.745 per share.
The Notes may be redeemed, in whole or in part, at the option of the Company, at any time on or after July 31, 2006, at a specified early redemption amount plus accrued and unpaid interest, if the closing price of the shares is greater than 125% of the conversion price for a period of at least 25 consecutive business days or in the event of certain changes relating to taxation in India. Unless previously converted, redeemed or purchased and cancelled, the Notes are redeemable on July 31, 2008 at 116.824% of their principal amount.
16,778,052 ordinary shares were allotted during the period September 11, 2003 to March 31, 2006, consequent to conversion of 91,140 Notes with an aggregate value of Rs. 4,119.1 million.
During the year ended March 31, 2007, 1,620,003 ordinary shares were allotted consequent to conversion of 8,800 Notes with an aggregate value , net of Rs. 0.9 million being stamp duty expenses on conversion, of Rs. 411.8 million (US$ 8.8 million). Further, 60 of the Notes with an aggregate value of Rs. 2.61 million (US$ 0.06 million) outstanding as at March 31, 2007, may at the option of the noteholders be converted into 11,045 ADSs or shares at any time up to July 1, 2008.
Zero Coupon Foreign Currency Convertible Notes due 2009 On April 27, 2004, Tata Motors raised US$ 100 million by way of Zero Coupon Convertible Notes due for redemption on
April 27, 2009. The noteholders have an option to convert these Notes into ordinary shares or ADSs determined at an initial conversion price of Rs. 573.106 per share with a fixed rate of exchange on conversion of Rs. 43.85 per USD, from and including June 7, 2004 to and including March 28, 2009. The conversion price will be subject to certain adjustments. Further, Tata Motors has a right to redeem in whole, but not in part, these Notes at any time on or after April 27, 2005, subject to certain conditions. Unless previously converted, redeemed or purchased and cancelled, these Notes will be due for redemption on April 27, 2009, at 95.111% of the principal amount.
During the year ended March 31, 2006, 6,264,476 ordinary shares were allotted consequent to conversion of 81,875 Notes with an aggregate value, net of Rs. 3.7 million being stamp duty expenses on conversion, of Rs. 3,634.4 million (US$ 81.7 million).
During the year ended March 31, 2007, 919,297 ordinary shares were allotted consequent to conversion of 12,015 Notes with an aggregate value of Rs. 551.0 million (US$ 12.01 million). Further, 6,110 of the Notes with an aggregate value of Rs. 265.75 million (US$ 6.2 million) outstanding as at March 31, 2007, may at the option of the noteholders be converted into 467,494 ADSs or shares at any time up to March 28, 2009.
F-36

1% Foreign Currency Convertible Notes due 2011 On April 27, 2004, Tata Motors also raised US$ 300 million by way of one percent Convertible Notes due for redemption
on April 27, 2011. The note holders have an option to convert these Notes into ordinary shares / ADSs determined at an initial conversion price of Rs. 780.400 per share at a fixed rate of conversion of Rs. 43.85 per USD, from and including June 7, 2004 to and including March 28, 2011. The conversion price will be subject to certain adjustments. In the event of certain changes affecting taxation, Tata Motors has an option to redeem in whole but not in part, these Notes at any time. Unless previously converted, redeemed or purchased and cancelled, these Notes will be due for redemption on April 27, 2011 at 121.781% of the principal amount. There has been no conversion during the year ended March 31, 2007. Outstanding Notes may at the option of the noteholders be converted into 16,856,740 ADSs or shares at any time up to March 28, 2011.
Zero Coupon Foreign Currency Convertible Notes due 2011 On March 20, 2006, Tata Motors issued Yen 11,760 million (Rs. 4,500.3 million) Zero Coupon Convertible Notes due for
redemption on March 21, 2011. The noteholders have an option to convert these Notes into ordinary shares or ADSs determined at an initial conversion price of Rs. 1,001.39 per share with a fixed rate of exchange on conversion of Rs. 1.00 per Yen 2.66, from and including May 2, 2006 to and including February 19, 2011. The conversion price will be subject to certain adjustments. Further, Tata Motors has a right to redeem in whole, or in part, these Notes at any time on or after March 20, 2009 but prior to February 8, 2011, subject to certain conditions. In the event of certain changes affecting taxation, Tata Motors has an option to redeem in whole but not in part, these Notes at any time. Unless previously converted, redeemed or purchased and cancelled, these Notes will be due for redemption on March 21, 2011, at 99.253% of the principal amount. There has been no conversion during the year ended March 31, 2007. Outstanding Notes may at the option of the noteholders be converted into 4,414,916 ADSs or shares at any time up to February 19, 2011.
None of these above convertible borrowings contained a beneficial conversion feature at the time of issue.
7.875% US Notes As per the terms of issue of US Notes, Tata Motors and its material subsidiaries may not create or permit to subsist any
liens for the benefit of other foreign currency debt instruments on any such material subsidiaries’ property or assets, present or future, to secure payment of sum due in respect of any such debt instruments, any payment under any guarantee of any such debt instruments, or any indemnity or other like obligation in respect of any such debt instruments, unless approved by the holders of these Notes.
For a foreign currency loan, Tata Motors is required to ensure that, at all times, its financial condition shall be such that tangible net worth as computed under Indian GAAP is not less than a specified amount and a specified percentage of its total direct liabilities. In addition to this, Tata Motors is also required to maintain its fixed assets and current assets at not less than a specified amount and certain ratios at not less than a specified percentage.
Buyers Credit The buyers line of credit from State Bank of India (SBI) and Hongkong and Shanghai Banking Corporation (HSBC) is
secured by Hypothecation of existing and future stocks of raw materials, stock in trade, stores, work in progress and book debts except Hire Purchase book debts and outstanding amounts on vehicle loan contracts and is repayable at the end of three years from drawdown dates.
Others Other loans from banks pertaining to Tata Motors’ subsidiaries are secured by charges on certain movable and immovable
assets including finance receivables of the respective subsidiary companies. One of the subsidiaries of the company has to maintain a non performing asset ratio of less than 3%. The interest rates of these loans range from 8.2% to 10%.
The Sales Tax Deferment Loan is secured by a residual charge on the immovable and movable properties at Lucknow.
F-37

Other term loans include loan from Technology Development Board that has a specific charge on the Company’s movable plant and machinery, machinery spares, tools and accessories and other movables, both present and future, except book debts and stocks pertaining to the Indica Car plant at Chikali.
Ordinary Shares The entitlements to 49,989 Ordinary shares are subject matter of various suits filed in the courts/forums by third parties for
which final order is awaited and hence kept in abeyance.
Capital redemption reserve The Indian Companies Act, 1956 (the “Companies Act”) requires that where a company purchases its own shares not out
of proceeds of a fresh issue but out of free reserves, then a sum equal to the nominal value of the shares so purchased shall be transferred to a capital redemption reserve account, which may be applied to issue fully paid bonus shares. The Company established this reserve pursuant to the redemption of preference shares issued in earlier years.
Debenture redemption reserve The Companies Act requires that where a company issues debentures, it shall create a debenture redemption reserve from
profits every year until such debentures are redeemed. Manufacturing companies are required to maintain a minimum proportion of the outstanding redeemable debentures as a reserve. The amounts credited to the debenture redemption reserve may not be utilized by the Company except to redeem debentures. As at March 31, 2007, Tata Motors has Rs. 3,182.4 million more in the debenture redemption reserve than statutorily required and, therefore, this excess amount is unrestricted.
Special Reserve The special reserve represents the reserve created by two subsidiaries of Tata Motors pursuant to the Reserve Bank of India
Act, 1934 (the “RBI Act”) and related regulations applicable to those companies. Under the RBI Act, a non-banking finance company is required to transfer an amount not less than 20 per cent of its net profit to a reserve fund before declaring any dividend. Appropriation from this reserve fund is permitted only for the purposes specified by the RBI.
Reserve for Research and Human Resource Development In terms of Article 9 of the Act on Special Taxation Restriction in Korea, Tata Daewoo Commercial Vehicle Company
Limited (TDCV, a subsidiary company) is entitled for deferment of tax in respect of expenditure incurred on research and development subject to fulfillment of certain conditions, by way of deduction from the taxable income, provided TDCV appropriates an equivalent amount from ‘Retained Earnings’ to ‘Reserve for Research and Human Resource Development’.
The deferment is for a period of three years and from the fourth year onwards one-third of the reserve is offered to tax and an equal amount is then transferred from the reserve to ‘Retained earnings available for appropriation’.
F-38
16. Shareholders’ equity
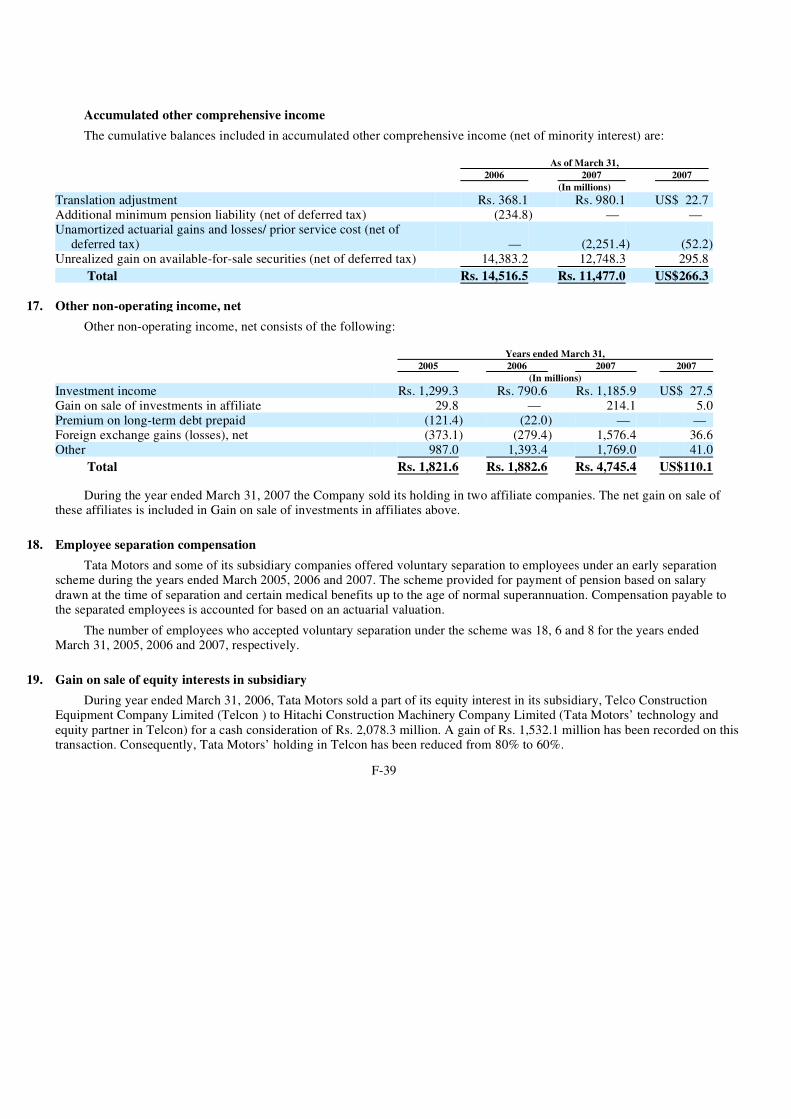
Accumulated other comprehensive income The cumulative balances included in accumulated other comprehensive income (net of minority interest) are:
Other non-operating income, net consists of the following:
During the year ended March 31, 2007 the Company sold its holding in two affiliate companies. The net gain on sale of these affiliates is included in Gain on sale of investments in affiliates above.
Tata Motors and some of its subsidiary companies offered voluntary separation to employees under an early separation scheme during the years ended March 2005, 2006 and 2007. The scheme provided for payment of pension based on salary drawn at the time of separation and certain medical benefits up to the age of normal superannuation. Compensation payable to the separated employees is accounted for based on an actuarial valuation.
The number of employees who accepted voluntary separation under the scheme was 18, 6 and 8 for the years ended March 31, 2005, 2006 and 2007, respectively.
During year ended March 31, 2006, Tata Motors sold a part of its equity interest in its subsidiary, Telco Construction Equipment Company Limited (Telcon ) to Hitachi Construction Machinery Company Limited (Tata Motors’ technology and equity partner in Telcon) for a cash consideration of Rs. 2,078.3 million. A gain of Rs. 1,532.1 million has been recorded on this transaction. Consequently, Tata Motors’ holding in Telcon has been reduced from 80% to 60%.
F-39
As of March 31, 2006 2007 2007 (In millions)
Translation adjustment Rs. 368.1 Rs. 980.1 US$ 22.7Additional minimum pension liability (net of deferred tax) (234.8) — — Unamortized actuarial gains and losses/ prior service cost (net of
deferred tax) — (2,251.4) (52.2)Unrealized gain on available-for-sale securities (net of deferred tax) 14,383.2 12,748.3 295.8
Total Rs. 14,516.5 Rs. 11,477.0 US$266.3
17. Other non-operating income, net
Years ended March 31, 2005 2006 2007 2007 (In millions)Investment income Rs. 1,299.3 Rs. 790.6 Rs. 1,185.9 US$ 27.5Gain on sale of investments in affiliate 29.8 — 214.1 5.0Premium on long-term debt prepaid (121.4) (22.0) — — Foreign exchange gains (losses), net (373.1) (279.4) 1,576.4 36.6Other 987.0 1,393.4 1,769.0 41.0
Total Rs. 1,821.6 Rs. 1,882.6 Rs. 4,745.4 US$110.1
18. Employee separation compensation
19. Gain on sale of equity interests in subsidiary
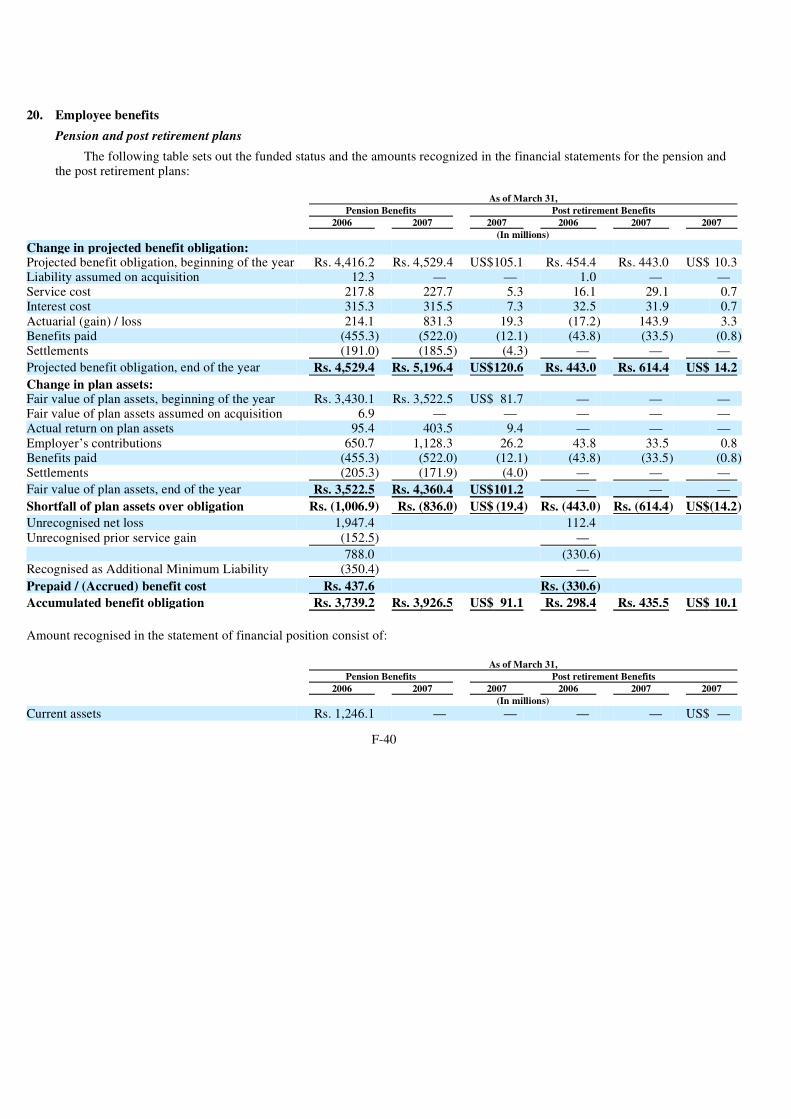
Pension and post retirement plans The following table sets out the funded status and the amounts recognized in the financial statements for the pension and
the post retirement plans:
F-40
20. Employee benefits
As of March 31, Pension Benefits Post retirement Benefits 2006 2007 2007 2006 2007 2007 (In millions)
Change in projected benefit obligation:
Projected benefit obligation, beginning of the year Rs. 4,416.2 Rs. 4,529.4 US$105.1 Rs. 454.4 Rs. 443.0 US$ 10.3Liability assumed on acquisition 12.3 — — 1.0 — — Service cost 217.8 227.7 5.3 16.1 29.1 0.7Interest cost 315.3 315.5 7.3 32.5 31.9 0.7 Actuarial (gain) / loss 214.1 831.3 19.3 (17.2) 143.9 3.3Benefits paid (455.3) (522.0) (12.1) (43.8) (33.5) (0.8)Settlements (191.0) (185.5) (4.3) — — —
Projected benefit obligation, end of the year Rs. 4,529.4 Rs. 5,196.4 US$120.6 Rs. 443.0 Rs. 614.4 US$ 14.2
Change in plan assets:
Fair value of plan assets, beginning of the year Rs. 3,430.1 Rs. 3,522.5 US$ 81.7 — — — Fair value of plan assets assumed on acquisition 6.9 — — — — — Actual return on plan assets 95.4 403.5 9.4 — — — Employer’s contributions 650.7 1,128.3 26.2 43.8 33.5 0.8Benefits paid (455.3) (522.0) (12.1) (43.8) (33.5) (0.8)Settlements (205.3) (171.9) (4.0) — — —
Fair value of plan assets, end of the year Rs. 3,522.5 Rs. 4,360.4 US$101.2 — — —
Shortfall of plan assets over obligation Rs. (1,006.9) Rs. (836.0) US$ (19.4) Rs. (443.0) Rs. (614.4) US$(14.2)
Unrecognised net loss 1,947.4 112.4
Unrecognised prior service gain (152.5) —
788.0 (330.6)
Recognised as Additional Minimum Liability (350.4) —
Prepaid / (Accrued) benefit cost Rs. 437.6 Rs. (330.6)
Accumulated benefit obligation Rs. 3,739.2 Rs. 3,926.5 US$ 91.1 Rs. 298.4 Rs. 435.5 US$ 10.1
Amount recognised in the statement of financial position consist of:
As of March 31, Pension Benefits Post retirement Benefits 2006 2007 2007 2006 2007 2007 (In millions)
Current assets Rs. 1,246.1 — — — — US$ —

Information for funded plans with an accumulated benefit obligation in excess of plan assets:
Information for unfunded plans with an accumulated benefit obligation in excess of plan assets:
Net pension and post retirement cost consists of the following components:
F-41
Non current assets — 3.9 0.1 — — — Current liabilities (522.1) (35.1) (0.8) (26.7) (29.2) (0.6)Non current liabilities (286.4) (804.8) (18.7) (303.9) (585.2) (13.6)
Prepaid / (Accrued) benefit cost Rs. 437.6 Rs. (836.0) US$(19.4) Rs. (330.6) Rs. (614.4) US$(14.2)
Amount recognised in accumulated other comprehensive income consist of:
As of March 31, Pension Benefits Post retirement Benefits 2006 2007 2007 2006 2007 2007 (In millions)
Net loss (gain) Rs. 480.9 Rs. 2,436.5 US$ 56.5 — Rs. 251.9 US$ 5.8Prior service cost (gain) (130.5) (81.3) (1.9) — — —
Rs. 350.4 Rs. 2,355.2 US$ 54.6 — Rs. 251.9 US$ 5.8
As of March 31, Pension Benefits 2006 2007 2007 (In millions)Projected benefit obligation Rs. 1,229.8 Rs. 1,132.6 US$26.3
Accumulated benefit obligation 1,229.8 1,132.6 26.3
Fair value of plan assets Rs. 750.6 Rs. 703.6 US$16.3
Information for funded plans with an accumulated benefit obligation less than plan assets:
As of March 31, Pension Benefits 2006 2007 2007 (In millions)Projected benefit obligation Rs. 2,940.3 Rs. 3,652.9 US$84.8
Accumulated benefit obligation 2,192.7 2,454.5 56.9
Fair value of plan assets Rs. 2,771.9 Rs. 3,656.8 US$84.9
As of March 31, As of March 31, Pension Benefits Post retirement Benefits 2006 2007 2007 2006 2007 2007 (In millions)Projected benefit obligation Rs. 359.3 Rs. 410.9 US$ 9.5 Rs. 443.0 Rs. 614.4 US$14.2
Accumulated benefit obligation 316.7 339.4 7.9 298.4 435.5 10.1
Fair value of plan assets — — — — — —

The estimated net loss and prior service cost that will be amortized from accumulated other comprehensive income into net periodic benefit cost over the next fiscal year are:
F-42
Years ended March 31, Pension Benefits Post retirement Benefits 2005 2006 2007 2007 2005 2006 2007 2007 (In millions)
Service cost Rs. 205.6 Rs. 217.8 Rs. 227.7 US$ 5.3 Rs. 13.2 Rs. 16.1 Rs. 29.1 US$ 0.7Interest cost 289.8 315.3 315.5 7.3 22.4 32.5 31.9 0.7 Amortisation of prior service cost /
(gain) (71.3) (71.3) (71.3) (1.7) — — — — Actuarial loss / (gain) 203.3 181.5 158.1 3.7 (0.3) 5.7 4.4 0.1Expected return on plan assets (233.8) (265.2) (282.7) (6.6) — — — — Cost of settlement — 85.3 52.1 1.2 — — — —
Net periodic cost Rs. 393.6 Rs. 463.4 Rs. 399.4 US$ 9.2 Rs. 35.3 Rs. 54.3 Rs. 65.4 US$ 1.5
Other changes in plan assets and benefit obligation recognized in other comprehensive income:
Years ended March 31, Pension Benefits Post retirement Benefits 2005 2006 2007 2007 2005 2006 2007 2007 (In millions)
Increase (decrease) in minimum liability Rs. (185.2) Rs. 26.0 — — — — — —
Net loss — — Rs. 696.7 US$16.2 — — Rs. 143.9 US$ 3.3 Cost of settlement — — (52.1) (1.2) — — — — Amortisation of Net loss — — (158.1) (3.7) — — (4.4) (0.1)Amortisation of prior service
(cost) / gain — — 71.3 1.7 — — — —
Total recognised in other comprehensive income Rs. (185.2) Rs. 26.0 Rs. 557.8 US$13.0 — — Rs. 139.5 US$ 3.2
Total recognised in net periodic cost and other comprehensive income Rs. 208.4 Rs. 489.4 Rs. 957.2 US$22.2 Rs. 35.3 Rs. 54.3 Rs. 204.9 US$ 4.7
Pension Benefits Post retirement Benefits (In millions) (In millions)Prior service cost / (gain) Rs. (71.3) US$(1.7) — — Actuarial loss / (gain) Rs. 175.4 US$ 4.1 Rs. 11.9 US$ 0.3

The following table presents estimated future benefit payments relating to the pension and post retirement plans:
The weighted average assumptions used in accounting for the pension and post retirement plans are set out below:
The expected return on plan assets is determined considering several applicable factors mainly including the composition of the plan assets held, assessed risks of asset management, historical results of the return on plan assets and the Company’s policy for plan asset management.
Plan Assets The Company’s pension plans asset allocation as of March 31, 2006 and 2007 by category are as follows:
The Company’s policy and objective for plan asset management is to maximize return on plan assets to meet future benefit payment requirements while at the same time accepting only a low level of risk. The asset allocation for plan assets is determined based on investment criteria approved under the Indian Income Tax Act, 1961, and is also subject to other exposure limitations. The Company evaluates the risks, transaction costs and liquidity for potential investments. To measure plan asset performance, the Company compares actual returns for each asset category with published bench marks.
The Company expects to contribute Rs. 781.1 million to the funded pension plans in fiscal 2008.
The table below outlines the impact on the service cost, the interest cost and the Projected Benefit Obligation in the event of an increase of 1% in the assumed rate of increase in annual post retirement benefit cost:
F-43
As of March 31, Pension Benefits Post retirement Benefits (In millions) (In millions)2008 Rs. 351.1 US$ 8.1 Rs. 29.2 US$ 0.72009 509.1 11.8 29.6 0.72010 562.3 13.0 31.8 0.72011 588.5 13.7 32.7 0.82012 565.7 13.1 34.0 0.82013 – 2017 Rs. 3,445.2 US$79.9 Rs. 211.6 US$ 4.9
Years ended March 31, Pension Benefits Post retirement Benefits 2005 2006 2007 2005 2006 2007
Discount rate 7.50% 7.50% 8.00% - 8.50% 7.50% 7.50% 8.50%Rate of increase in compensation level of covered employees 3% - 5% 3% - 5% 4% - 7.50% NA NA NAIncrease in health care cost NA NA NA 4% 4% 4%Expected long-term return on assets 7.50% 7.50% 8.00%-8.50% NA NA NA
Pension benefits Plan assets as of March 31, 2006 2007 Asset category:
Debt securities 59% 64%Balances with banks 41% 36%
100% 100%

The table below outlines the impact on the service cost, the interest cost and the Projected Benefit Obligation in the event of a decrease of 1% in the assumed rate of decrease in annual post retirement benefit cost:
Severance indemnity plan Severance indemnity plan is a foreign plan of Tata Daewoo Commercial Vehicles Ltd (TDCV), a subsidiary of Tata
Motors Ltd. The following table reconciles the PBO of the severance indemnity plan, an unfunded plan, and the amount recognized in
financial statements.
F-44
Years ended March 31, 2006 2007 2007 (In millions)PBO at the beginning of the year Rs. 505.3 Rs. 494.7 US$11.5PBO at the end of the year 494.7 677.8 15.7Service cost 18.8 32.1 0.7Interest cost Rs. 36.3 Rs. 35.2 US$ 0.8
Years ended March 31, 2006 2007 2007 (In millions)PBO at the beginning of the year Rs. 410.0 Rs. 397.7 US$ 9.2PBO at the end of the year 397.7 560.0 13.0Service cost 13.8 26.5 0.6Interest cost Rs. 29.2 Rs. 29.1 US$ 0.7
As of March 31, 2006 2007 2007 (In millions)
Change in projected benefit obligation:
Projected benefit obligation, beginning of the year Rs. 894.2 Rs. 1137.0 US$ 26.4Service cost 138.6 158.8 3.7Interest cost 50.8 62.5 1.5Actuarial loss 57.5 227.9 5.3 Plan Amendments 22.9 — — Benefits paid (86.4) (94.3) (2.2)Exchange Fluctuation 59.4 4.1 0.1
Projected benefit obligation, end of the year Rs. 1,137.0 Rs. 1,496.0 US$ 34.8
Change in plan assets:
Fair value of plan assets, beginning of the year — — — Actual return on plan assets — — — Employer’s contributions 86.4 94.3 2.2Benefits paid (86.4) (94.3) (2.2)
Fair value of plan assets, end of the year — — —
Shortfall of plan assets over obligation (1,137.0) (1,496.0) (34.8)
Unrecognised net loss 545.8
(Accrued) pension cost Rs. (591.2)
Accumulated benefit obligation Rs. 558.9 Rs. 727.8 US$ 16.9

Amount recognised in the statement of financial position consist of:
Net severance indemnity cost consists of the following components:
The estimated net loss that will be amortized from accumulated other comprehensive income into net periodic pension cost over the next fiscal year is Rs. 51.7 million.
The following table presents estimated future benefit payments relating to the severance indemnity plan:
F-45
As of March 31, 2006 2007 2007 (In millions)
Current liabilities Rs. (591.2) Rs. (79.4) US$ (1.9)Non current liabilities — (1,416.6) (32.9)
(Accrued) pension cost Rs. (591.2) Rs. (1,496.0) US$(34.8)
Amount recognised in accumulated other comprehensive income consist of:
As of March 31, 2006 2007 2007 (In millions)
Net loss (gain) — Rs. 741.0 US$ 17.2
— Rs. 741.0 US$ 17.2
Years ended March 31, 2005 2006 2007 2007 (In millions)
Service cost Rs. 51.0 Rs. 138.6 Rs. 158.8 US$ 3.7Interest cost 23.2 50.8 62.5 1.5 Actuarial loss/ (gain) — 49.3 39.2 0.9
Net periodic pension cost Rs. 74.2 Rs. 238.7 Rs. 260.5 US$ 6.1
Other changes in plan assets and benefit obligation recognised in other comprehensive income:
Years ended March 31, 2005 2006 2007 2007 (In millions)
Increase (decrease) in minimum liability Rs. 45.4 Rs. (45.4) — — Net loss (gain) — — Rs. 227.9 US$ 5.3Amortisation of Net loss — — (39.2) (0.9)Exchange Fluctuation — — 6.5 0.2
Total recognised in other comprehensive income 45.4 (45.4) 195.2 4.6
Total recognised in net periodic pension cost and other comprehensive income Rs. 119.6 Rs. 193.3 Rs. 455.7 US$10.7
As of March 31, (In millions)2008 Rs. 79.4 US$1.82009 79.8 1.9
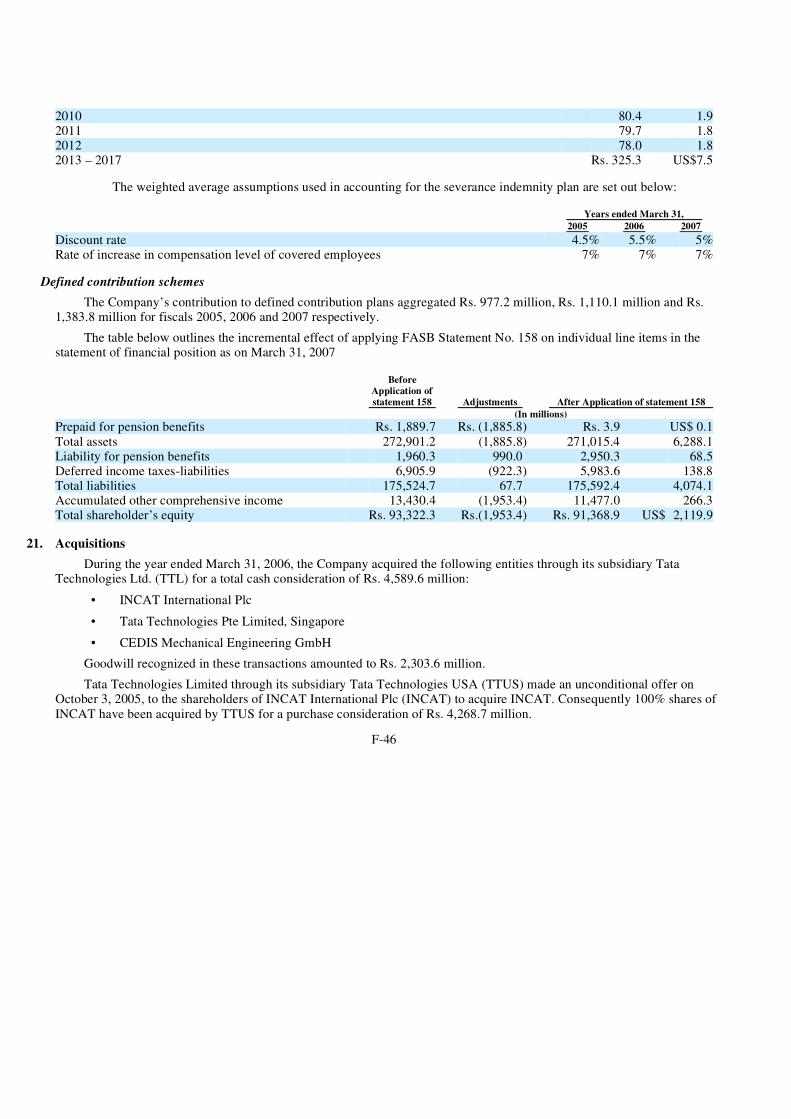
The weighted average assumptions used in accounting for the severance indemnity plan are set out below:
Defined contribution schemes The Company’s contribution to defined contribution plans aggregated Rs. 977.2 million, Rs. 1,110.1 million and Rs.
1,383.8 million for fiscals 2005, 2006 and 2007 respectively. The table below outlines the incremental effect of applying FASB Statement No. 158 on individual line items in the
statement of financial position as on March 31, 2007
During the year ended March 31, 2006, the Company acquired the following entities through its subsidiary Tata Technologies Ltd. (TTL) for a total cash consideration of Rs. 4,589.6 million:
Goodwill recognized in these transactions amounted to Rs. 2,303.6 million. Tata Technologies Limited through its subsidiary Tata Technologies USA (TTUS) made an unconditional offer on
October 3, 2005, to the shareholders of INCAT International Plc (INCAT) to acquire INCAT. Consequently 100% shares of INCAT have been acquired by TTUS for a purchase consideration of Rs. 4,268.7 million.
F-46
2010 80.4 1.92011 79.7 1.82012 78.0 1.82013 – 2017 Rs. 325.3 US$7.5
Years ended March 31, 2005 2006 2007
Discount rate 4.5% 5.5% 5%Rate of increase in compensation level of covered employees 7% 7% 7%
Before Application ofstatement 158 Adjustments After Application of statement 158
(In millions)Prepaid for pension benefits Rs. 1,889.7 Rs. (1,885.8) Rs. 3.9 US$ 0.1Total assets 272,901.2 (1,885.8) 271,015.4 6,288.1Liability for pension benefits 1,960.3 990.0 2,950.3 68.5Deferred income taxes-liabilities 6,905.9 (922.3) 5,983.6 138.8Total liabilities 175,524.7 67.7 175,592.4 4,074.1Accumulated other comprehensive income 13,430.4 (1,953.4) 11,477.0 266.3Total shareholder’s equity Rs. 93,322.3 Rs.(1,953.4) Rs. 91,368.9 US$ 2,119.9
21. Acquisitions
• INCAT International Plc
• Tata Technologies Pte Limited, Singapore • CEDIS Mechanical Engineering GmbH

Purchase consideration paid for acquisition of INCAT has been allocated as follows:
Both, Tata Technologies and INCAT provide Engineering and Design Services (E&D) and Product Lifecycle Management (PLM) products and services, primarily to OEM’s and their suppliers in the international automotive, aerospace and engineering markets. The offshore capabilities of Tata Technologies in the field of E&D and PLM combined with the high-end onshore strengths of INCAT are expected to offer a strong and seamless onshore/offshore delivery capability to the international customers in the automotive, aerospace and engineering industries.
On December 7, 2005, the Company entered into share purchase agreement with shareholders of Tata Technologies Pte Limited, Singapore (TTPL) and acquired 100% stake for a consideration of Rs. 186.5 million, which is the fair value of net assets acquired.
Further on January 2, 2006, INCAT acquired 100% shares of CEDIS Mechanical Engineering GmbH, a Germany based company which provides automotive engineering and design services to leading manufacturers, for a cash consideration of Rs. 134.4 million. In this acquisition, the Company acquired net assets at fair value of Rs. 43.0 million and recorded a goodwill of Rs. 91.4 million.
On April 26, 2005, the shareholders and creditors of Tata Motors Limited (“TML”) and Tata Finance Limited (“TFL”) approved the amalgamation, in the nature of merger, of TML and TFL. The merger was effective June 29, 2005 when the approvals of High Court of Judicature at Mumbai and other regulatory agencies were obtained. In accordance with the merger scheme, the shareholders of erstwhile TFL received 8 ordinary shares of par value Rs. 10 each in TML for every 100 ordinary shares of par value Rs. 10 each held in TFL. The merger is a transaction between entities which are not under common control and has been accounted for under the purchase method from June 29, 2005.
The acquisition would result in synergies to Tata Motors through complementary customer sourcing models, access to low cost funds, flexibility to offer competitive products and services, offering financing options with other products. The acquisition combines the vehicle financing business undertaken by both TFL and TML to create operational synergies and leverages cash resources.
Purchase consideration paid for this acquisitions has been allocated as follows:
F-47
Allocation of purchase price(In millions)
Net assets acquired, at fair value: INCAT
Cash and cash equivalents Rs. 418.5 Property and equipment 57.9Inventories 36.4Intangibles 1,350.2Accounts Receivables 929.6Prepaid Expenses and other current assets 158.9Other non-current assets 1.8Accounts Payable (190.4)Other current liabilities (713.2)Deferred Tax Asset / (Liability) 50.6Valuation allowance on deferred tax assets (43.8)
Fair value of net assets acquired 2,056.5
Purchase consideration 4,268.7
Goodwill 2,212.2
Allocation of purchase price(In millions)
Net assets acquired, at fair value: TFL
Cash and cash equivalents Rs. 138.8Short-term deposits with banks 62.7Finance receivables 13,168.8Accounts receivable 10.0Prepaid expenses and other assets 3,575.4Deferred income taxes 756.9Investments 593.0

During the year ended March 31, 2006, Tata Motors’s subsidiary Tata AutoComp Systems Limited (“TACO”) acquired assets at its fair value for a cash consideration of Rs. 376.7 million from the liquidators of Wundsch Weidinger in Germany and formed two subsidiary companies TACO Kunstsofftechnik (TKT) and TACO Grundstucksverwaltungs (TGV).
During the year ended March 31, 2006, Tata Motors made additional investments in its subsidiary Tata Technologies Limited resulting in a goodwill of Rs. 47.0 million.
During the year ended March 31, 2006, Telco Dadajee Dhackjee Limited (TDDL) and Suryodaya Capital & Finance (Bombay) Limited (SCFL) both 100% subsidiaries were merged with Tata Motors Limited and ceased to be subsidiaries, both the companies are under common control, and the merger has been accounted for at carrying values.
The fair value of the net assets acquired during the year ended March 31, 2006, of Rs. 11,890.7 million represents approximately 7.5% and 5.9% of total assets of the Company as on March 31, 2005 and 2006, respectively.
Proforma information related to these acquisitions has not been included as the impact of these acquisitions, either individually or in aggregate, on the Company’s consolidated results of operations is not considered to be material.
During the year ended March 31, 2005, the Company acquired the following entities for a total cash consideration of Rs. 187 million:
Goodwill recognized in these transactions amounted to Rs. 88.7 million.
In the normal course, the Company faces claims and assertions by various parties. The Company assesses such claims and assertions and monitors the legal environment on an ongoing basis, with the assistance of external legal counsel wherever necessary. The Company records a liability for any claims where a potential loss is probable and capable of being estimated and discloses such matters in its financial statements, if material. For potential losses that are considered reasonably possible, but not probable, the Company provides disclosure in the financial statements but does not record a liability in its accounts unless the loss becomes probable.
The following is a description of claims and assertions where a potential loss is reasonably possible, but not probable. Management believes that none of the contingencies described below, either individually or in aggregate, would have a material adverse effect on the Company’s financial condition, results of operations or cash flows.
F-48
Property and equipment 1,562.2Intangibles 392.0Other non-current assets 1,116.2Accounts payable (1,747.5)Accrued expenses and other liabilities (479.8)Short-term debt (16,270.7)Long-term debt (347.2)
Fair value of net assets acquired 2,530.8
Purchase consideration 6,924.4
Goodwill 4,393.6
• all of the remaining ownership interests in Concorde Motors Limited and Telco Dadajee Dhackjee Limited;
• Suryodaya Capital & Finance (Bombay) Limited.
22. Commitments and contingencies

Litigations The company is involved in legal proceedings in various states in India, both as plaintiff and as defendant. There are
claims which management does not believe to be of material nature, other than those described below:
Income Tax The Company has ongoing disputes with Income Tax authorities relating to tax treatment of certain items. These
mainly include disallowed expenses, tax treatment of certain expenses claimed by the Company as deductions, and the computation of, or eligibility of, certain tax incentives or allowances. Some of the disputes relate to the year in which the tax consequences of financial transactions were recognized and in the event these disputes are not resolved in the Company’s favour in that year, the tax consequences can be reflected in the tax year in which it is allowed by the income tax authorities and are, therefore, timing differences.
Most of these disputes/disallowances, being repetitive in nature, have been raised by the income tax authorities consistently in most of the years.
The Company has a right of appeal to the High Court or Supreme Court against adverse decisions by the appellate authorities for matters involving substantial question of law. The Income Tax authorities have similar rights of appeal.
As of March 31, 2007, the income tax demands by the Income Tax authorities aggregated Rs. 3,896 million, which are being contested by the Company on appeal and in respect of which the Company expects to succeed based on favourable decisions in earlier assessment years. There are matters aggregating Rs. 566 million in respect of which the Company has won in appeals which have been further contested by the income tax department before the higher appellate authorities. There are other matters/disputes pending in appeal aggregating Rs. 1,880 million, which includes Rs 1,799 million pertaining to the former Tata Finance Limited.
Excise Duty & Service Tax As of March 31, 2007, there were pending litigations on various counts relating to Excise Duty and Service Tax
involving demand of Rs. 869 million. These demands challenged the basis of valuation of the Company’s products and denial of the ‘Central value added tax’ (“CENVAT”) on inputs. The details of the demands involving more than Rs. 50 million are as follows:
Excise demands amounting to Rs. 212 million, mainly relating to denial of CENVAT credit on various technical grounds, where the Company had won the appeals, have been further contested by the excise authorities.
The Excise authorities had denied CENVAT credit of Rs. 161 million in earlier years on certain accessories supplied with the vehicles and on other technical grounds. The matter is being contested by the Company before the appellate authorities. On the basis of judicial precedents and favorable decisions in Company’s own earlier cases, the Company believes that it has a strong case.
The Excise authorities had raised demand aggregating Rs. 62 million on various classification disputes. These disputes mainly relate to classification of CKD dispatches made to Vehicle Factory Jabalpur (VFJ), classification of Tractor chassis and demand of Automobile Cess on dispatches to VFJ. The Department is classifying CKD dispatches to VFJ under Excise tariff heading which is for chassis fitted with Engine. The Company is contending that CKD kits do not fall under the said category. The Company’s appeal on this issue before the appellate authorities has since been allowed. In relation to other disputes, the Company is in various stages of appeal.
The Excise authorities have raised a demand of Rs. 103 million on HV Axles Ltd. (HVAL) denying the CENVAT credit of Rs. 52 million availed on inputs sold to Tata Motors Ltd. and demanding consequential penalty of an equal amount. HVAL is contending that CENVAT credit cannot be denied on the inputs sold to Tata Motors as duty has been paid on the final product, i.e. Axles using the subject inputs on the assessable value including the materials consumed.
F-49

The total amount of Service tax demand, included in above, is Rs. 50 million in relation to Tata Motor Finance, a division of Tata Motors Ltd. and Tata Technologies Ltd.
Sales tax The total sales tax demands (including interest and penalty), which are being contested by the Company amount to
Rs. 2,463 million as of March 31, 2007. The details of the demands involving more than Rs. 50 million are as follows: The sales tax authorities in certain states have raised disputes totaling up to Rs. 487 million as of March 31, 2007,
treating the stock transfers of vehicles from the Company’s manufacturing plants to sales offices and the transfers between two sales offices as sales liable for levy of sales tax.
Under a notification issued by the State Government of Rajasthan, vehicles having gross weight of more than 8,000 kgs were classified for certain tax rate. The sales tax authorities had raised demand of Rs. 121 million on the ground that the Company’s bare chassis weight being less than 8,000 kgs, it does not fall under relevant tax entry. The gross vehicle weight of the vehicle was not considered by the sales tax authorities.
Sales tax demands aggregating Rs. 193 million as of March 31, 2007, were raised by the sales tax authorities on interest/hire premium charges and other issues relating to the use of trade marks and denial of resale claims on the vehicles sold under hire purchase. The interest/ hire premium charges are in the nature of Service charges and hence should not be liable to sales tax.
Under the notification issued by the Sales Tax authority, Jharkhand, the rate of sales tax was reduced to 4%. Consequently, the inter-state sales tax also became 4% and since it was not concessional rate against a Declaration Form, the collection of Declaration Forms was not mandatory. However the Jharkhand Sales tax authorities raised the demand aggregating Rs. 909 million as of March 31, 2007, on the ground that Declaration Forms were not collected. Based on the above notification, the company has a strong case. The notification was valid until May 10, 2002. In addition to the above issue, the Sales tax authorities have raised demands aggregating Rs. 57 million as of March 31, 2007, for Non-Submission of Declaration Forms at various locations. The Company is confident of getting relief in appeal on submission of Forms.
Sales Tax demands aggregating Rs. 203 million has been raised by Jamshedpur Sales Tax authorities disallowing the purchase of raw material from Jharkhand vendors at concessional rate of 2% in case the final product is stock transferred for sale outside the state. The Sales Tax Department is relying on a notification issued by the Jharkhand Government which is not applicable on the Company’s transactions.
In respect of matters pertaining to the former Tata Finance Ltd., the sales tax authorities at Kolkata raised demand of Rs. 105 million in earlier years by making a Best Judgement assessment. With regard to the appeal filed by the Company against the Order, the case was remanded for regular assessment. In addition, Sales Tax authorities at Bangalore, pursuant to a Karnataka High Court decision, passed revision orders demanding tax of Rs. 61 million on hire purchase and lease transactions, which were accepted as exempt during regular assessments. The Supreme Court has allowed the appeal and set aside the order of the Karnataka High Court. Applications have been filed to the sales tax authority along with a copy of the Supreme Court Order for passing of a rectification order dropping the demand.
Other taxes and dues Other amounts for which the Company may contingently be liable aggregating Rs. 1,161 million as of March 31,
2007, include the following cases involving more than Rs. 50 million: The municipal authorities in certain states levy octroi duty (a local indirect tax) on goods brought inside the municipal
limits at rates based on the classification of goods. Demands aggregating Rs. 496 million have been raised demanding higher octroi duties on account of classification disputes relating to components purchased for the manufacture of vehicles and on retrospective demand of octroi at enhanced rate. The dispute relating to classification is presently pending before the Supreme Court and the other dispute is pending before the Bombay High Court on remand by the Supreme Court.
F-50

The motor vehicles taxation authorities have demanded Road Tax aggregating Rs. 85 million as of March 31, 2007, on vehicles stored inside the Company’s manufacturing plants. The Company has filed appeal before the Supreme Court in the matter, which is pending for disposal. The contention of the Company is that the vehicles are subjected to tax when put on the road and the law does not have a provision for double taxation. Moreover, the definition of “Dealer” under the said Act does not include a manufacturer of the vehicles.
As of March 31, 2007, Property Tax amounting to Rs. 146 million has been demanded by Pimpri Chinchwad Municipal Corporation (PCMC) on vacant land in possession of the Company. The Company filed an SLP (Special Leave Petition) before the Supreme Court against an unfavorable decision of the Bombay High Court. The Supreme Court has disposed of the SLP and remanded the matter back to PCMC for fresh adjudication.
Regional Provident Fund Commissioner (RPFC) at Jamshedpur had demanded payment towards Provident Fund amounting to Rs. 153 million treating the convoy drivers appointed by Telco Transporters Convoy Driver's Association (TTCA) as employees of the Company. The Company filed a Writ Petition in the High Court against the order, which was admitted.
Other claims There are other claims against the Company, majority of which pertain to motor accident claims (involving third
parties getting affected in accidents while the Company’s vehicles were being transferred from the Company’s manufacturing plants to regional sales offices or from one sales office to the other) and consumer complaints. Some of the cases also relate to replacement of parts of vehicles and/or compensation for deficiency in the services by the Company or its dealers.
Guarantees The Company has provided guarantees / collaterals aggregating Rs. 11,767 million relating to certain securitized
receivables to certain Special Purpose Entities (‘SPE’). The Company’s liability would crystallize in the event customers fail to fulfill their obligations under the contract and the SPE serves a notice of shortfall in collections on the Company. The term of each guarantee depends upon the weighted average term of each pool of finance receivables securitized. In the event the guarantee is invoked, the Company has the right against the borrower to repossess the vehicle financed and to auction the vehicle. This also includes a guarantee amounting to Rs. 50 million given by the former Tata Finance Ltd. in respect of sale of shares of Tata Home Finance Ltd. to IDBI. The maximum potential amount of future payment, the Company would be required to make is Rs. 11,767 million as at March 31, 2007. The Company has recognized a liability of Rs. 1,079.2 million for this guarantee.
Commitments The Company has entered into various contracts with vendors and contractors for the purchase of raw materials and
components, machinery, tools and equipment and various civil contracts of a capital nature aggregating Rs. 40,616 million, which are yet to be executed.
Bill discounting In respect of bills and export sales on deferred credit, which have been discounted with banks, the Company is
contingently liable for a sum of Rs. 5,700 million as of March 31, 2007, in the event customers fail to pay the banks as scheduled.
F-51

Product warranties Estimated warranty costs are accrued at the time vehicles are sold, based primarily on historical warranty claim
experience. The following is a tabular reconciliation of the product warranty accrual for year ended March 31, 2006 and 2007:
The following table presents a comparison of the fair values and carrying values of Tata Motors’ principal financial instruments:
The carrying amounts of cash and cash equivalents, short-term deposits, accounts receivable, other current assets, accounts payable, acceptances, accrued expenses and other current liabilities, and Short-term borrowings and current portion of long term debt approximate their fair values due to the short-terms of these instruments.
The fair value of finance receivables is estimated by discounting expected cash flows using rates at which loans of similar credit quality and maturity would be made as of March 31, 2006 and 2007.
Available-for-sale securities are carried at their fair values, which are generally based on market price quotations. Fair values of investments classified as held-to-maturity have been determined by discounting the future cash flows at the market rate as at the balance sheet dates of similar investments. The fair values of investments carried at cost cannot be reasonably estimated. The fair values of borrowings have been estimated by discounting expected future cash flows using a discount rate equivalent to the risk free rate of return adjusted for the market spread required by Tata Motors’ lenders for instruments of the given maturity. The fair values of foreign currency convertible notes are based on the quoted prices as of March 31, 2006 and 2007.
F-52
Years ended March 31, 2006 2007 2007 (In millions)
Balance at the beginning Rs. 1,795.1 Rs. 1,811.5 US$ 42.0Payments made during the year (1,763.9) (2,058.8) (47.8)Changes in the accrued warranties 1,763.3 2,438.6 56.6Impact of foreign exchange rate changes 17.0 (4.0) (0.1)
Balance at the end Rs. 1,811.5 Rs. 2,187.3 US$ 50.7
23. Estimated fair value of financial instruments
As of March 31, 2006 2007
Carrying
value Estimated fair
value Carrying
value Estimated fair
value (In millions)ASSETS:
Cash and cash equivalents Rs. 6,315.9 Rs. 6,315.9 Rs. 7,652.5 Rs. 7,652.5Short-term deposits with banks 4,914.8 4,914.8 173.2 173.2Finance receivables 47,617.1 47,782.7 82,857.9 85,015.4Accounts receivable 14,256.7 14,256.7 19,320.7 19,320.7Other current assets 12,474.5 12,474.5 19,039.1 19,039.1Investments 24,850.5 24,850.5 22,258.3 22,258.3Other non-current assets 5,877.0 5,517.3 6,690.4 6,509.1LIABILITIES:
Accounts payable Rs. 30,316.3 Rs. 30,316.3 Rs. 45,474.0 Rs. 45,474.0Acceptances 29,502.3 29,502.3 24,608.1 24,608.1Accrued expenses and other current liabilities 11,636.3 11,636.3 11,794.4 11,794.4Short-term borrowings and current portion of long term debt 9,438.1 9,438.1 38,902.0 38,902.0Long-term debt 27,203.3 30,575.4 40,235.1 41,874.1

Management uses its best judgment in estimating the fair value of its financial instruments; however, there are inherent limitations in any estimation technique. Therefore, for substantially all financial instruments, the fair value estimates presented above are not necessarily indicative of all the amounts Tata Motors could have realized in a sales transaction as of either March 31, 2006 or 2007. The estimated fair value amounts for the years ended March 31, 2006 and 2007 have been measured as of the respective year ends, and have not been reevaluated or updated for purposes of these financial statements subsequent to those respective dates. As such, the estimated fair values of these financial instruments subsequent to the respective reporting dates may be different than the amounts reported at each year-end.
Tata Motors is party to a variety of foreign exchange rate, interest rate and foreign currency forward contracts and options entered into to manage its exposure to fluctuations in foreign exchange rates and interest rates. The counter party is generally a bank. These financial exposures are managed in accordance with the corporate risk management policies and procedures.
The Company enters into interest rate swaps, and interest rate currency swap agreements mainly to manage exposure on its fixed-rate or variable-rate debt. The Company uses interest rate derivatives or currency swap agreements to hedge exposure to exchange rate fluctuations on principal and interest payments for borrowings denominated in currencies other than the functional currency of the Company.
The Company recognized gains (losses) on fair valuation of derivative financial instruments as follows:
SFAS No. 131, Disclosures about Segments of an Enterprise and Related Information, establishes standards for reporting information about operating segments in financial statements. Operating segments are defined as components of an enterprise about which separate financial information is available that is evaluated regularly by the chief operating decision maker, or decision making group, in deciding how to allocate resources and in assessing performance. Tata Motors’ chief operating decision maker is managing director of the Company.
Tata Motors primarily operates in the Automotive segment. The Automotive segment includes all activities relating to development, design, manufacture, assembly and sale of vehicles including financing thereof, as well as sale of related parts and accessories. The Company evaluates segment performance of this operating segment based on standalone net income of the segment and generally accounts for inter-segment sales and transfers as if the sales or transfers were to third parties. Revenues are allocated between ‘within India’ and ‘exports’ based on the location of the dealer/customer.
The Company’s other segment comprises primarily activities relating to production, designing and selling of automotive components, construction equipment, engineering solutions and software operations. None of the other operating segments meets the quantitative thresholds specified in SFAS No. 131, and accordingly, have been aggregated.
F-53
24. Derivative financial instruments and risk management
Years ended March 31, 2005 2006 2007 2007 (In millions)
Interest rate swaps Rs. (4.9) Rs. 21.9 Rs. (16.1) US$(0.4)Forward exchange contracts, options and currency swaps (74.4) (104.8) 27.7 0.6
Total Rs. (79.3) Rs. (82.9) Rs. 11.6 US$ 0.2
25. Segment reporting

F-54
For the year ended March 31, 2005
Automotive Other Inter-segment eliminations Total
(In millions)
Revenues
External revenue Rs. 188,812.7 Rs. 9,574.3 Rs. — Rs. 198,387.0Inter-segment revenue 167.5 1,439.6 (1,607.1) —
Total revenues 188,980.2 11,013.9 (1,607.1) 198,387.0
Depreciation and amortization 4,655.5 266.5 — 4,922.0 Operating income 17,918.0 745.3 128.2 18,791.5Non-operating income, net 1,819.1 175.4 (172.9) 1,821.6Interest income 784.9 11.1 (34.4) 761.6Interest expense (2,870.8) (156.9) 34.4 (2,993.3)Income tax expense (4,806.0) (293.9) — (5,099.9)Equity in income of affiliates, net of tax 244.3 96.1 — 340.4Minority interest, net of tax (275.8) (89.9) — (365.7)
Net income Rs. 12,813.7 Rs. 487.2 Rs. (44.7) Rs. 13,256.2
For the year ended March 31, 2006
Automotive Other Inter-segment eliminations Total
(In millions)
Revenues External revenue Rs. 224,534.0 Rs. 16,080.5 Rs. — Rs. 240,614.5Inter-segment revenue 219.1 1,980.5 (2,199.6) —
Total revenues 224,753.1 18,061.0 (2,199.6) 240,614.5
Depreciation and amortization 5,231.5 611.9 — 5,843.4Operating income 18,922.4 1,059.4 60.6 20,042.4Non-operating income, net 3,541.6 288.3 (328.7) 3,501.2Interest income 734.1 64.5 (135.8) 662.8Interest expense (3,592.9) (260.7) 135.8 (3,717.8)Income tax expense (5,074.3) (576.2) 32.2 (5,618.3)Equity in income of affiliates, net of tax 470.5 0.9 — 471.4 Minority interest, net of tax (140.1) (191.0) — (331.1)
Net income Rs. 14,861.3 Rs. 385.2 Rs. (235.9) Rs. 15,010.6
As of March 31, 2006
Automotive Other Inter-segment eliminations Total
(In millions)
Segment assets Rs. 184,780.5 Rs. 19,401.7 Rs. (2,024.0) Rs. 202,158.2Capital expenditure Rs. 10,463.1 Rs. 356.7 Rs. (85.4) Rs. 10,734.4 Equity in affiliates Rs. 2,351.6 Rs. 84.5 Rs. — Rs. 2,436.1
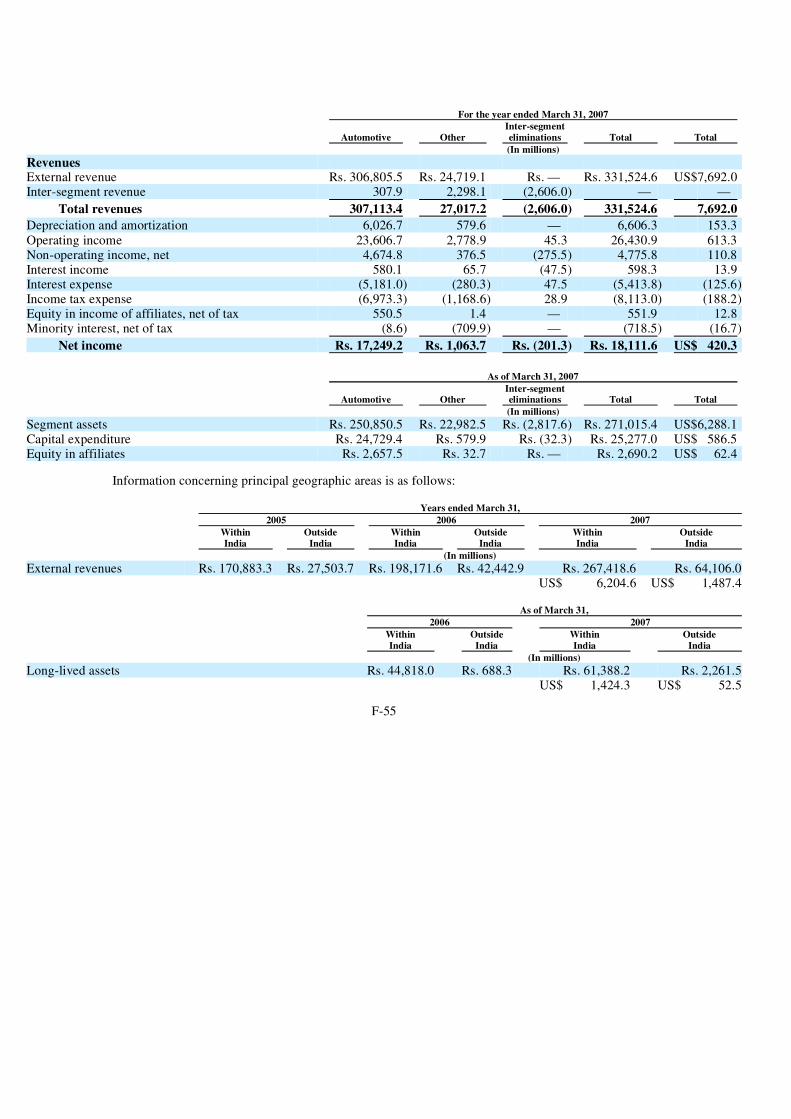
Information concerning principal geographic areas is as follows:
F-55
For the year ended March 31, 2007
Automotive Other Inter-segment eliminations Total Total
(In millions)
Revenues
External revenue Rs. 306,805.5 Rs. 24,719.1 Rs. — Rs. 331,524.6 US$7,692.0Inter-segment revenue 307.9 2,298.1 (2,606.0) — —
Total revenues 307,113.4 27,017.2 (2,606.0) 331,524.6 7,692.0
Depreciation and amortization 6,026.7 579.6 — 6,606.3 153.3 Operating income 23,606.7 2,778.9 45.3 26,430.9 613.3Non-operating income, net 4,674.8 376.5 (275.5) 4,775.8 110.8Interest income 580.1 65.7 (47.5) 598.3 13.9Interest expense (5,181.0) (280.3) 47.5 (5,413.8) (125.6)Income tax expense (6,973.3) (1,168.6) 28.9 (8,113.0) (188.2)Equity in income of affiliates, net of tax 550.5 1.4 — 551.9 12.8Minority interest, net of tax (8.6) (709.9) — (718.5) (16.7)
Net income Rs. 17,249.2 Rs. 1,063.7 Rs. (201.3) Rs. 18,111.6 US$ 420.3
As of March 31, 2007
Automotive OtherInter-segment eliminations Total Total
(In millions)
Segment assets Rs. 250,850.5 Rs. 22,982.5 Rs. (2,817.6) Rs. 271,015.4 US$6,288.1Capital expenditure Rs. 24,729.4 Rs. 579.9 Rs. (32.3) Rs. 25,277.0 US$ 586.5Equity in affiliates Rs. 2,657.5 Rs. 32.7 Rs. — Rs. 2,690.2 US$ 62.4
Years ended March 31, 2005 2006 2007
WithinIndia
Outside India
WithinIndia
OutsideIndia
Within India
OutsideIndia
(In millions)External revenues Rs. 170,883.3 Rs. 27,503.7 Rs. 198,171.6 Rs. 42,442.9 Rs. 267,418.6 Rs. 64,106.0
US$ 6,204.6 US$ 1,487.4
As of March 31, 2006 2007
WithinIndia
Outside India
Within India
OutsideIndia
(In millions)Long-lived assets Rs. 44,818.0 Rs. 688.3 Rs. 61,388.2 Rs. 2,261.5
US$ 1,424.3 US$ 52.5

Tata Motors’ related parties principally consist of subsidiaries of Tata Sons Limited, subsidiaries of Tata International Limited (until February 28, 2005), affiliates of subsidiaries and its principal shareholders. Tata Motors routinely enters into transactions with these companies and other related parties in the ordinary course of business. The Company mainly enters into transactions for sale and purchase of products with Tata Cummins Limited, an affiliate. Transactions and balances with its own subsidiaries are eliminated on consolidation.
The following table summarizes related party transactions and balances included in these financial statements:
F-56
26. Related party transactions
Years ended March 31, 2005 2006 2007 2007 (In millions)Purchases of products Rs. 12,935.0 Rs. 15,602.0 Rs. 21,058.6 US$488.6Purchase of fixed assets 108.0 223.7 0.1 — Sale of fixed assets 0.5 0.4 — — Sale of products 3,144.1 1,109.4 1,196.6 27.8Services received 657.5 672.1 798.0 18.5Services rendered 393.2 358.5 862.3 20.0Interest/dividend expense/ (income), net 115.2 842.2 588.9 13.7
As of March 31, 2006 2007 2007 (In millions)Amounts receivable in respect of loans Rs. 644.7 Rs. 296.7 US$ 6.9Amounts payable in respect of loans 105.0 105.0 2.4Accounts receivable 392.2 157.7 3.7Accounts payable 723.3 1,283.5 29.8

Zero Coupon Convertible Alternative Reference Securities due 2012
Subsequent to the year ended March 31, 2007, the Company has raised funds aggregating US$ 490 Million (Rs. 19,927.1 million at issue) by issue of Zero Coupon Convertible Alternative Reference Securities (CARSTM) due on July 12, 2012. The noteholders have an option, subject to the terms and conditions of the issue, to convert these notes into Qualified Securities or the Company’s newly issued ordinary shares or ADSs. The conversion may be made by the noteholders from and including October 11, 2011 to and including June 12, 2012 at an initial conversion price of Rs. 960.96 per Share (equivalent to US$23.67 at a fixed rate of exchange on conversion of Rs. 40.59 = US$1.00) that is subject to adjustment in certain circumstances. The Company has a right to redeem in whole, but not in part, these notes at any time on or after October 11, 2011, subject to certain conditions. Unless previously converted, redeemed or purchased and cancelled as per the terms of issue, these will be redeemed on July 12, 2012 at 131.82% of the outstanding principal amount.
FCCN Conversion Subsequent to March 31, 2007, 1,200 Zero Coupon Foreign Currency Convertible Notes (2009) representing 1.2% of the
said Notes, have been converted into 91,813 Ordinary shares of Rs. 10 each at a premium as per the terms of issue.
Investment in Automobile Corporation of Goa Ltd (ACGL) On May 21, 2007, Tata Motors subscribed 873,191 shares at Rs. 475 per share in a right issue of Automobile Corporation
of Goa Ltd. (ACGL). Further, on June 6, 2007, Tata Motors purchased 1,059,768 shares of ACGL at Rs. 475 per share from Tata International. Total holding of Tata Motors in ACGL has increased from 10% to 37.79% with these additional investments.
Sale of Tata Securities Ltd. shares On June 25, 2007 Tata Motors has sold 115,550 shares of Tata Securities Ltd., due to which the total holding of Tata
Motors in Tata Securities Ltd. has reduced from 29.34% to 18%.
F-57
27. Subsequent events
28. Earnings per share (“EPS”)
NetIncome
(In millions)
Weighted average
shares (Nos.)
Earnings per share
(Rs./US$)
For the year ended March 31, 2005
Basic net earnings per share Rs. 13,256.2 359,837,353 Rs. 36.8Effect of warrants Rs. 23.3 2,112,798 Rs. (11.03)
Effect of foreign currency convertible notes Rs. 305.9 26,899,565 Rs. (11.4)Diluted earnings per share Rs. 13,585.4 388,849,716 Rs. 34.9
For the year ended March 31, 2006 Basic net earnings per share Rs. 15,010.6 373,268,040 Rs. 40.2
Effect of foreign currency convertible notes Rs. 427.1 26,042,196 Rs. (16.4)Diluted earnings per share Rs. 15,437.7 399,310,236 Rs. 38.7
For the period ended March 31, 2007
Basic net earnings per share Rs. 18,111.6 384,544,205 Rs. 47.1 US$ 420.3 US$ 1.1
Effect of foreign currency convertible notes Rs. 369.6 22,622,790 Rs. (16.3) US$ 8.5 US$ (0.4)
Diluted earnings per share Rs. 18,481.2 407,166,995 Rs. 45.4 US$ 428.8 US$ 1.1

EXHIBIT 7.1
Computation of Ratio of Net Debt to Shareholders’ Equity The computation of Net Debt to Shareholders’ Equity ratio as of March 31, 2006 and 2007 is as follows:
As of
March 31, 2006 As of
March 31, 2007 (Rs. millions)Long-term Debt 27,203.3 40,235.1Short-term Debt (including current portion) 9,438.1 38,902.0Total Debt 36,641.4 79,137.1
Cash and Cash Equivalents 6,315.9 7652.5Mutual Fund Units 2,704.7 1,378.4Total Investible Surplus 9020.6 9030.9
Net Debt 27,620.8 70,106.2
Shareholders’ Equity 81,015.8 91,368.9
Net Debt/Shareholders’ Equity 0.34 0.77

EXHIBIT 8.1
We have the following consolidated subsidiaries as of March 31, 2007: Name of the Subsidiary Company Country of incorporation % of holding
1 Sheba Properties Ltd. India 100.002 Concorde Motors (India) Ltd. India 100.003 HV Axles Ltd. India 100.004 HV Transmissions Ltd. India 100.005 TAL Manufacturing Solutions Ltd. India 100.00 6 Tata Motors Insurance Services Ltd. India 100.007 Tata Daewoo Commercial Vehicle Co. Ltd. South Korea 100.008 Tata Motors European Technical Centre plc UK 100.009 Tata Technologies Ltd. and its 17 subsidiaries India (1) 85.92(2)
10 Telco Construction Equipment Co. Ltd. India 60.0011 Tata AutoComp Systems Ltd. and its 8 subsidiaries India(3) 54.70(4)
12 Tata Precision Industries Pte. Ltd. Singapore and its subsidiary Singapore 51.0713 TML Financial Services Ltd. (5) India 100.0014 Tata Motors (Thailand) Ltd. Thailand 70.00 15 Hispano Carrocera S.A. and its subsidiary(6) Spain 21.00
(1) These subsidiaries are based in many countries abroad. (2) The holdings in these subsidiaries range between 85.92 % to 86.03% and three of the subsidiaries were under liquidation as at
March 31, 2007. Subsequently, two of these have been liquidated. (3) These subsidiaries are based in India, Mauritius, China and Germany. (4) The holdings in these subsidiaries range between 27.90 % to 54.71%. (5) The name of the subsidiary has subsequently been changed to Tata Motors Finance Ltd. (6) The subsidiary is based in Morocco.

Exhibit 12.1
CERTIFICATION I, Ravi Kant, certify that:
Date: September 24, 2007
1. I have reviewed this annual report on Form 20-F of Tata Motors Limited;
2. Based on my knowledge, this report does not contain any untrue statement of a material fact or omit to state a material fact necessary to make the statements made, in light of the circumstances under which such statements were made, not misleading with respect to the period covered by this report;
3. Based on my knowledge, the financial statements, and other financial information included in this report, fairly present in all material respects the financial condition, results of operations and cash flows of the company as of, and for, the periods presented in this annual report;
4. The company’s other certifying officer(s) and I are responsible for establishing and maintaining disclosure controls and procedures (as defined in Exchange Act Rules 13a-15(e) and 15d-15(e)) and internal control over financial reporting (as defined in Exchange Act Rules 13a-15(f) and 15d-15(f)) for the company and have:
(a) Designed such disclosure controls and procedures, or caused such disclosure controls and procedures to be designed under
our supervision, to ensure that material information relating to the company, including its consolidated subsidiaries, is made known to us by others within those entities, particularly during the period in which this report is being prepared;
(b) Designed such internal control over financial reporting, or caused such internal control over financial reporting to be
designed under our supervision, to provide reasonable assurance regarding the reliability of financial reporting and the preparation of financial statements for external purposes in accordance with generally accepted accounting principles;
(c) Evaluated the effectiveness of the company’s disclosure controls and procedures and presented in this report our
conclusions about the effectiveness of the disclosure controls and procedures, as of the end of the period covered by this report based on such evaluation; and
(d) Disclosed in this report any change in the company’s internal control over financial reporting that occurred during the
period covered by the annual report that has materially affected, or is reasonably likely to materially affect, the company’s internal control over financial reporting; and
5. The company’s other certifying officer(s) and I have disclosed, based on our most recent evaluation of internal control over financial reporting, to the company’s auditors and the audit committee of the company’s board of directors (or persons performing the equivalent functions):
(a) All significant deficiencies and material weaknesses in the design or operation of internal control over financial reporting
which are reasonably likely to adversely affect the company’s ability to record, process, summarize and report financial information; and
(b) Any fraud, whether or not material, that involves management or other employees who have a significant role in the
company’s internal control over financial reporting.
/s/ RAVI KANT Ravi KantManaging Director

Exhibit 12.2
CERTIFICATION I, C. Ramakrishnan, certify that:
Date: September 24, 2007
1. I have reviewed this annual report on Form 20-F of Tata Motors Limited;
2. Based on my knowledge, this report does not contain any untrue statement of a material fact or omit to state a material fact necessary to make the statements made, in light of the circumstances under which such statements were made, not misleading with respect to the period covered by this report;
3. Based on my knowledge, the financial statements, and other financial information included in this report, fairly present in all material respects the financial condition, results of operations and cash flows of the company as of, and for, the periods presented in this annual report;
4. The company’s other certifying officer(s) and I are responsible for establishing and maintaining disclosure controls and procedures (as defined in Exchange Act Rules 13a-15(e) and 15d-15(e)) and internal control over financial reporting (as defined in Exchange Act Rules 13a-15(f) and 15d-15(f)) for the company and have:
(a) Designed such disclosure controls and procedures, or caused such disclosure controls and procedures to be designed under
our supervision, to ensure that material information relating to the company, including its consolidated subsidiaries, is made known to us by others within those entities, particularly during the period in which this report is being prepared;
(b) Designed such internal control over financial reporting, or caused such internal control over financial reporting to be
designed under our supervision, to provide reasonable assurance regarding the reliability of financial reporting and the preparation of financial statements for external purposes in accordance with generally accepted accounting principles;
(c) Evaluated the effectiveness of the company’s disclosure controls and procedures and presented in this report our
conclusions about the effectiveness of the disclosure controls and procedures, as of the end of the period covered by this report based on such evaluation; and
(d) Disclosed in this report any change in the company’s internal control over financial reporting that occurred during the
period covered by the annual report that has materially affected, or is reasonably likely to materially affect, the company’s internal control over financial reporting; and
5. The company’s other certifying officer(s) and I have disclosed, based on our most recent evaluation of internal control over financial reporting, to the company’s auditors and the audit committee of the company’s board of directors (or persons performing the equivalent functions):
(a) All significant deficiencies and material weaknesses in the design or operation of internal control over financial reporting
which are reasonably likely to adversely affect the company’s ability to record, process, summarize and report financial information; and
(b) Any fraud, whether or not material, that involves management or other employees who have a significant role in the
company’s internal control over financial reporting.
/s/ C. RAMAKRISHNAN C. RamakrishnanChief Financial Officer

Exhibit 13
CERTIFICATION Pursuant to 18 U.S.C. Section 1350, each of the undersigned officers of Tata Motors Limited (the “Company”) hereby certifies, to such officer’s knowledge, that:
Date: September 24, 2007
i. The Company’s annual report on Form 20-F for the year ended March 31, 2006 (the “Report”) fully complies with the requirements of Section 13(a) or 15(d), as applicable, of the Securities Exchange Act of 1934; and
ii. the information contained in the Report fairly presents, in all material respects, the financial condition and results of operations of the Company.
/s/ RAVI KANT Ravi KantManaging Director
/s/ C. RAMAKRISHNAN C. RamakrishnanChief Financial Officer