UNITED STATES - s21.q4cdn.com
43
UNITED STATES SECURITIES AND EXCHANGE COMMISSION Washington, D.C. 20549 FORM 10-Q (Mark One) ☒ QUARTERLY REPORT PURSUANT TO SECTION 13 OR 15(d) OF THE SECURITIES EXCHANGE ACT OF 1934 For the quarterly period ended June 30, 2021 OR ☐ TRANSITION REPORT PURSUANT TO SECTION 13 OR 15(d) OF THE SECURITIES EXCHANGE ACT OF 1934 For the transition period from ____________ to ___________ Commission File Number 1-12031 UNIVERSAL DISPLAY CORPORATION (Exact name of registrant as specified in its charter) Pennsylvania 23-2372688 (State or other jurisdiction of incorporation or organization) (I.R.S. Employer Identification No.) 375 Phillips Boulevard, Ewing, New Jersey 08618 (Address of principal executive offices) (Zip Code) Registrant’s telephone number, including area code: (609) 671-0980 Securities registered pursuant to Section 12(b) of the Act: Title of each class Trading Symbol(s) Name of each exchange on which registered Common Stock, $0.01 par value OLED The NASDAQ Stock Market LLC Indicate by check mark whether the registrant (1) has filed all reports required to be filed by Section 13 or 15(d) of the Securities Exchange Act of 1934 during the preceding 12 months (or for such shorter period that the registrant was required to file such reports), and (2) has been subject to such filing requirements for the past 90 days. Yes ☒ No ☐ Indicate by check mark whether the registrant has submitted electronically every Interactive Data File required to be submitted pursuant to Rule 405 of Regulation S-T (§ 232.405 of this chapter) during the preceding 12 months (or for such shorter period that the registrant was required to submit such files). Yes ☒ No ☐ Indicate by check mark whether the registrant is a large accelerated filer, an accelerated filer, a non-accelerated filer, a smaller reporting company, or an emerging growth company. See the definitions of “large accelerated filer,” “accelerated filer,” “smaller reporting company” and “emerging growth company” in Rule 12b-2 of the Exchange Act. Large accelerated filer ☒ Accelerated filer ☐ Emerging growth company ☐ Non-accelerated filer ☐ Smaller reporting company ☐ If an emerging growth company, indicate by check mark if the registrant has elected not to use the extended transition period for complying with any new or revised financial account standards provided pursuant to Section 13(a) of the Exchange Act. ☐ Indicate by check mark whether the registrant is a shell company (as defined in Rule 12b-2 of the Exchange Act). Yes ☐ No ☒ As of August 3, 2021, the registrant had outstanding 47,119,914 shares of common stock.
Transcript of UNITED STATES - s21.q4cdn.com

UNITED STATESSECURITIES AND EXCHANGE COMMISSION
Washington, D.C. 20549
FORM 10-Q
(Mark One)☒☒ QUARTERLY REPORT PURSUANT TO SECTION 13 OR 15(d) OF THE SECURITIES EXCHANGE ACT OF 1934
For the quarterly period ended June 30, 2021
OR
☐☐ TRANSITION REPORT PURSUANT TO SECTION 13 OR 15(d) OF THE SECURITIES EXCHANGE ACT OF 1934
For the transition period from ____________ to ___________
Commission File Number 1-12031
UNIVERSAL DISPLAY CORPORATION(Exact name of registrant as specified in its charter)
Pennsylvania 23-2372688(State or other jurisdiction of
incorporation or organization) (I.R.S. Employer
Identification No.)
375 Phillips Boulevard, Ewing, New Jersey 08618(Address of principal executive offices) (Zip Code)
Registrant’s telephone number, including area code: (609) 671-0980
Securities registered pursuant to Section 12(b) of the Act:
Title of each class Trading Symbol(s) Name of each exchange on which registeredCommon Stock, $0.01 par value OLED The NASDAQ Stock Market LLC
Indicate by check mark whether the registrant (1) has filed all reports required to be filed by Section 13 or 15(d) of the Securities Exchange Act of 1934during the preceding 12 months (or for such shorter period that the registrant was required to file such reports), and (2) has been subject to such filing requirementsfor the past 90 days. Yes ☒☒ No ☐☐
Indicate by check mark whether the registrant has submitted electronically every Interactive Data File required to be submitted pursuant to Rule 405 ofRegulation S-T (§ 232.405 of this chapter) during the preceding 12 months (or for such shorter period that the registrant was required to submit suchfiles). Yes ☒☒ No ☐☐
Indicate by check mark whether the registrant is a large accelerated filer, an accelerated filer, a non-accelerated filer, a smaller reporting company, or anemerging growth company. See the definitions of “large accelerated filer,” “accelerated filer,” “smaller reporting company” and “emerging growth company” inRule 12b-2 of the Exchange Act.
Large accelerated filer ☒☒ Accelerated filer ☐☐ Emerging growth company ☐☐Non-accelerated filer ☐☐ Smaller reporting company ☐☐
If an emerging growth company, indicate by check mark if the registrant has elected not to use the extended transition period for complying with any new orrevised financial account standards provided pursuant to Section 13(a) of the Exchange Act. ☐☐
Indicate by check mark whether the registrant is a shell company (as defined in Rule 12b-2 of the Exchange Act). Yes ☐☐ No ☒☒
As of August 3, 2021, the registrant had outstanding 47,119,914 shares of common stock.

TABLE OF CONTENTS
PART I – FINANCIAL INFORMATION
Item 1. Financial Statements (unaudited) Consolidated Balance Sheets – June 30, 2021 and December 31, 2020 1Consolidated Statements of Income – Three and six months ended June 30, 2021 and 2020 2Consolidated Statements of Comprehensive Income – Three and six months ended June 30, 2021 and 2020 3Consolidated Statements of Shareholders’ Equity – Three and six months ended June 30, 2021 and 2020 4Consolidated Statements of Cash Flows – Six months ended June 30, 2021 and 2020 6Notes to Consolidated Financial Statements 7
Item 2. Management’s Discussion and Analysis of Financial Condition and Results of Operations 26Item 3. Quantitative and Qualitative Disclosures About Market Risk 34Item 4. Controls and Procedures 34
PART II – OTHER INFORMATION
Item 1. Legal Proceedings 34Item 1A. Risk Factors 35Item 2. Unregistered Sales of Equity Securities and Use of Proceeds 35Item 3. Defaults Upon Senior Securities 35Item 4. Mine Safety Disclosures 35Item 5. Other Information 35Item 6. Exhibits 36

PART I – FINANCIAL INFORMATION
ITEM 1. FINANCIAL STATEMENTS
UNIVERSAL DISPLAY CORPORATION AND SUBSIDIARIES
CONSOLIDATED BALANCE SHEETS
(UNAUDITED)
(in thousands, except share and per share data) June 30, 2021 December 31, 2020
ASSETS CURRENT ASSETS:
Cash and cash equivalents $ 542,914 $ 630,012 Short-term investments 190,540 99,996 Accounts receivable 99,629 82,261 Inventory 104,653 91,591 Other current assets 55,156 20,746
Total current assets 992,892 924,606 PROPERTY AND EQUIPMENT, net of accumulated depreciation of $81,721 and $72,493 113,187 102,113 ACQUIRED TECHNOLOGY, net of accumulated amortization of $163,343 and $153,050 59,960 70,253 OTHER INTANGIBLE ASSETS, net of accumulated amortization of $6,848 and $6,155 10,386 10,685 GOODWILL 15,535 15,535 INVESTMENTS 8,500 5,000 DEFERRED INCOME TAXES 35,579 37,695 OTHER ASSETS 114,676 103,341 TOTAL ASSETS $ 1,350,715 $ 1,269,228
LIABILITIES AND SHAREHOLDERS’ EQUITY CURRENT LIABILITIES:
Accounts payable $ 10,334 $ 13,801 Accrued expenses 27,247 41,404 Deferred revenue 122,978 105,215 Other current liabilities 2,004 4,540
Total current liabilities 162,563 164,960 DEFERRED REVENUE 46,174 57,086 RETIREMENT PLAN BENEFIT LIABILITY 79,966 78,527 OTHER LIABILITIES 70,396 55,941
Total liabilities 359,099 356,514 COMMITMENTS AND CONTINGENCIES (Note 15) SHAREHOLDERS’ EQUITY:
Preferred Stock, par value $0.01 per share, 5,000,000 shares authorized, 200,000 shares of Series A Nonconvertible Preferred Stock issued and outstanding (liquidation value of $7.50 per share or $1,500) 2 2 Common Stock, par value $0.01 per share, 200,000,000 shares authorized, 49,054,059 and 49,013,476 shares issued, and 47,688,411 and 47,647,828 shares outstanding, at June 30, 2021 and December 31, 2020, respectively 491 490 Additional paid-in capital 638,991 635,595 Retained earnings 427,188 353,930 Accumulated other comprehensive loss (33,772) (36,019)Treasury stock, at cost (1,365,648 shares at June 30, 2021 and December 31, 2020) (41,284) (41,284)
Total shareholders’ equity 991,616 912,714 TOTAL LIABILITIES AND SHAREHOLDERS’ EQUITY $ 1,350,715 $ 1,269,228
The accompanying notes are an integral part of these Consolidated Financial Statements.
1

UNIVERSAL DISPLAY CORPORATION AND SUBSIDIARIES
CONSOLIDATED STATEMENTS OF INCOME
(UNAUDITED)
(in thousands, except share and per share data) Three Months Ended June 30, Six Months Ended June 30, 2021 2020 2021 2020 REVENUE:
Material sales $ 77,438 $ 31,927 $ 157,246 $ 98,502 Royalty and license fees 48,212 22,380 99,098 65,458 Contract research services 4,010 3,661 7,316 6,285
Total revenue 129,660 57,968 263,660 170,245 COST OF SALES 27,969 12,643 51,267 35,102
Gross margin 101,691 45,325 212,393 135,143 OPERATING EXPENSES:
Research and development 24,101 21,397 47,406 40,894 Selling, general and administrative 20,239 16,147 36,643 31,550 Amortization of acquired technology and other intangible assets 5,497 5,490 10,985 10,980 Patent costs 1,809 1,858 3,644 3,496 Royalty and license expense 149 1,618 261 4,902
Total operating expenses 51,795 46,510 98,939 91,822 OPERATING INCOME (LOSS) 49,896 (1,185) 113,454 43,321
Interest income, net 75 1,268 208 3,415 Other income, net 221 170 280 372
Interest and other income, net 296 1,438 488 3,787 INCOME BEFORE INCOME TAXES 50,192 253 113,942 47,108 INCOME TAX (EXPENSE) BENEFIT (9,651) 562 (21,714) (8,138)NET INCOME $ 40,541 $ 815 $ 92,228 $ 38,970 NET INCOME PER COMMON SHARE:
BASIC $ 0.85 $ 0.02 $ 1.94 $ 0.82 DILUTED $ 0.85 $ 0.02 $ 1.94 $ 0.82
WEIGHTED AVERAGE SHARES USED IN COMPUTING NET INCOME PER COMMON SHARE:
BASIC 47,299,627 47,227,294 47,284,773 47,160,163 DILUTED 47,356,864 47,243,991 47,347,596 47,190,505
CASH DIVIDENDS DECLARED PER COMMON SHARE $ 0.20 $ 0.15 $ 0.40 $ 0.30
The accompanying notes are an integral part of these Consolidated Financial Statements.
2

UNIVERSAL DISPLAY CORPORATION AND SUBSIDIARIES
CONSOLIDATED STATEMENTS OF COMPREHENSIVE INCOME
(UNAUDITED)
(in thousands) Three Months Ended June 30, Six Months Ended June 30, 2021 2020 2021 2020 NET INCOME $ 40,541 $ 815 $ 92,228 $ 38,970 OTHER COMPREHENSIVE INCOME (LOSS), NET OF TAX:
Unrealized gain (loss) on available-for-sale securities, net of tax of $7, $251, $9 and $274, respectively 26 (887) (32) 968 Amortization of prior service cost and actuarial loss for retirement plan included in net periodic pension costs, net of tax of $334, $181, $669 and $362, respectively 1,174 640 2,348 1,278 Change in cumulative foreign currency translation adjustment 37 3 (69) (30)
TOTAL OTHER COMPREHENSIVE INCOME (LOSS) 1,237 (244) 2,247 2,216 COMPREHENSIVE INCOME $ 41,778 $ 571 $ 94,475 $ 41,186
The accompanying notes are an integral part of these Consolidated Financial Statements.
3

UNIVERSAL DISPLAY CORPORATION AND SUBSIDIARIES
CONSOLIDATED STATEMENTS OF SHAREHOLDERS’ EQUITY
(UNAUDITED)
(in thousands, except for share data)
Three Months Ended June 30, 2021
Series A
Nonconvertible Additional Accumulated
Other Total Preferred Stock Common Stock Paid-in Retained Comprehensive Treasury Stock Shareholders’ Shares Amount Shares Amount Capital Earnings Loss Shares Amount Equity BALANCE,MARCH 31, 2021 200,000 $ 2 49,050,776 $ 491 $ 632,138 $ 396,130 $ (35,009) 1,365,648 $ (41,284) $ 952,468
Net income — — — — — 40,541 — — — 40,541 Other comprehensiveincome — — — — — — 1,237 — — 1,237 Cash dividend — — — — — (9,483) — — — (9,483)Issuance of common stockto employees — — 4,267 — 9,296 — — — — 9,296 Shares withheld foremployee taxes — — (4,660) — (3,384) — — — — (3,384)Issuance of common stockto Board of Directorsand Scientific AdvisoryBoard — — 1,353 — 374 — — — — 374 Issuance of common stockto employees under anESPP — — 2,323 — 567 — — — — 567
BALANCE,JUNE 30, 2021 200,000 $ 2 49,054,059 $ 491 $ 638,991 $ 427,188 $ (33,772) 1,365,648 $ (41,284) $ 991,616
Six Months Ended June 30, 2021
Series A
Nonconvertible Additional Accumulated
Other Total Preferred Stock Common Stock Paid-in Retained Comprehensive Treasury Stock Shareholders’ Shares Amount Shares Amount Capital Earnings Loss Shares Amount Equity BALANCE,DECEMBER 31, 2020 200,000 $ 2 49,013,476 $ 490 $ 635,595 $ 353,930 $ (36,019) 1,365,648 $ (41,284) $ 912,714
Net income — — — — — 92,228 — — — 92,228 Other comprehensiveincome — — — — — — 2,247 — — 2,247 Cash dividend — — — — — (18,970) — — — (18,970)Issuance of common stockto employees — — 57,390 1 14,411 — — — — 14,412 Shares withheld foremployee taxes — — (26,708) — (13,018) — — — — (13,018)Issuance of common stockto Board of Directorsand Scientific AdvisoryBoard — — 5,796 — 1,004 — — — — 1,004 Issuance of common stockto employees under anESPP — — 4,105 — 999 — — — — 999
BALANCE,JUNE 30, 2021 200,000 $ 2 49,054,059 $ 491 $ 638,991 $ 427,188 $ (33,772) 1,365,648 $ (41,284) $ 991,616
The accompanying notes are an integral part of these Consolidated Financial Statements.
4
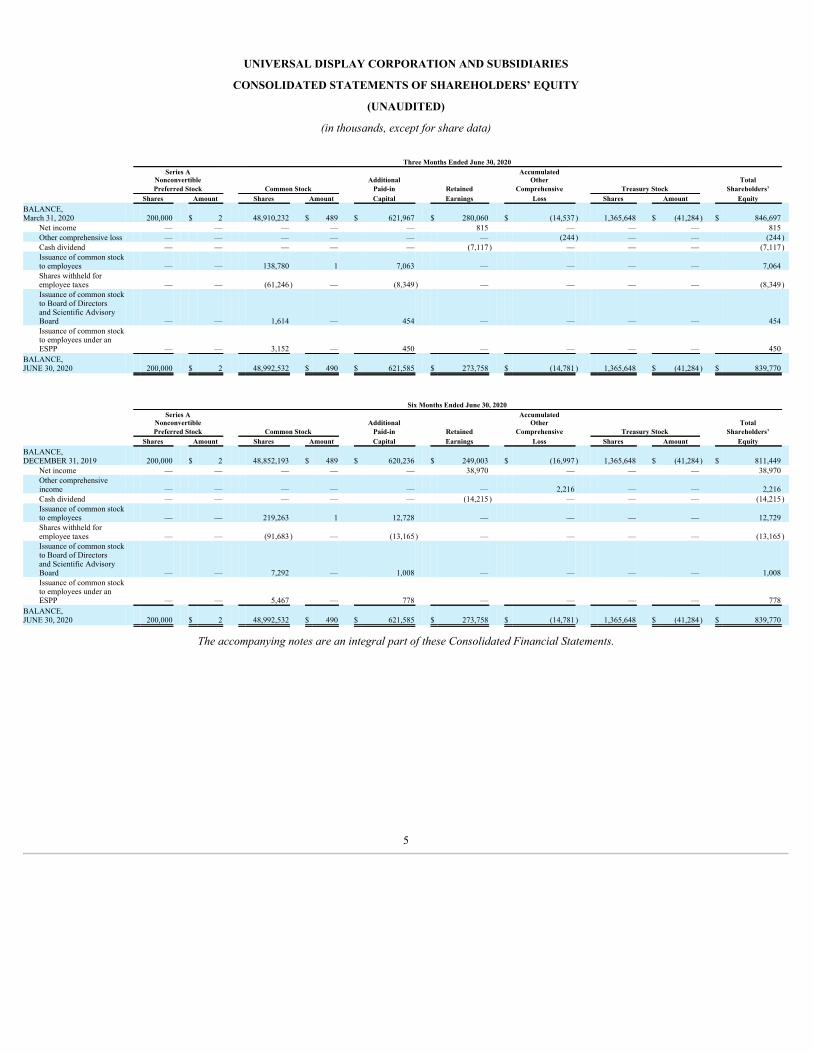
UNIVERSAL DISPLAY CORPORATION AND SUBSIDIARIES
CONSOLIDATED STATEMENTS OF SHAREHOLDERS’ EQUITY
(UNAUDITED)
(in thousands, except for share data)
Three Months Ended June 30, 2020
Series A
Nonconvertible Additional Accumulated
Other Total Preferred Stock Common Stock Paid-in Retained Comprehensive Treasury Stock Shareholders’ Shares Amount Shares Amount Capital Earnings Loss Shares Amount Equity BALANCE,March 31, 2020 200,000 $ 2 48,910,232 $ 489 $ 621,967 $ 280,060 $ (14,537) 1,365,648 $ (41,284) $ 846,697
Net income — — — — — 815 — — — 815 Other comprehensive loss — — — — — — (244) — — (244)Cash dividend — — — — — (7,117) — — — (7,117)Issuance of common stockto employees — — 138,780 1 7,063 — — — — 7,064 Shares withheld foremployee taxes — — (61,246) — (8,349) — — — — (8,349)Issuance of common stockto Board of Directorsand Scientific AdvisoryBoard — — 1,614 — 454 — — — — 454 Issuance of common stockto employees under anESPP — — 3,152 — 450 — — — — 450
BALANCE,JUNE 30, 2020 200,000 $ 2 48,992,532 $ 490 $ 621,585 $ 273,758 $ (14,781) 1,365,648 $ (41,284) $ 839,770
Six Months Ended June 30, 2020
Series A
Nonconvertible Additional Accumulated
Other Total Preferred Stock Common Stock Paid-in Retained Comprehensive Treasury Stock Shareholders’ Shares Amount Shares Amount Capital Earnings Loss Shares Amount Equity BALANCE,DECEMBER 31, 2019 200,000 $ 2 48,852,193 $ 489 $ 620,236 $ 249,003 $ (16,997) 1,365,648 $ (41,284) $ 811,449
Net income — — — — — 38,970 — — — 38,970 Other comprehensiveincome — — — — — — 2,216 — — 2,216 Cash dividend — — — — — (14,215) — — — (14,215)Issuance of common stockto employees — — 219,263 1 12,728 — — — — 12,729 Shares withheld foremployee taxes — — (91,683) — (13,165) — — — — (13,165)Issuance of common stockto Board of Directorsand Scientific AdvisoryBoard — — 7,292 — 1,008 — — — — 1,008 Issuance of common stockto employees under anESPP — — 5,467 — 778 — — — — 778
BALANCE,JUNE 30, 2020 200,000 $ 2 48,992,532 $ 490 $ 621,585 $ 273,758 $ (14,781) 1,365,648 $ (41,284) $ 839,770
The accompanying notes are an integral part of these Consolidated Financial Statements.
5

UNIVERSAL DISPLAY CORPORATION AND SUBSIDIARIES
CONSOLIDATED STATEMENTS OF CASH FLOWS
(UNAUDITED)
(in thousands) Six Months Ended June 30, 2021 2020 CASH FLOWS FROM OPERATING ACTIVITIES: Net income $ 92,228 $ 38,970 Adjustments to reconcile net income to net cash provided by operating activities:
Amortization of deferred revenue and recognition of unbilled receivables (110,993) (58,644)Depreciation 9,229 7,283 Amortization of intangibles 10,985 10,980 Change in excess inventory reserve 1,117 611 Amortization of premium and discount on investments, net (128) (3,280)Stock-based compensation to employees 14,624 12,918 Stock-based compensation to Board of Directors and Scientific Advisory Board 704 708 Deferred income tax expense (benefit) 1,458 (336)Retirement plan expense 4,457 2,828
Decrease (increase) in assets: Accounts receivable (17,368) (8,046)Inventory (14,179) (21,181)Other current assets (5,712) (5,967)Other assets (15,005) (5,942)
Increase (decrease) in liabilities: Accounts payable and accrued expenses (17,036) (20,332)Other current liabilities (2,536) (639)Deferred revenue 92,816 75,683 Other liabilities 14,455 6,416
Net cash provided by operating activities 59,116 32,030 CASH FLOWS FROM INVESTING ACTIVITIES:
Purchases of property and equipment (20,668) (11,804)Purchases of intangibles (394) (25)Purchases of investments (193,951) (404,232)Proceeds from sale and maturity of investments 100,000 412,760
Net cash used in investing activities (115,013) (3,301)CASH FLOWS FROM FINANCING ACTIVITIES:
Proceeds from issuance of common stock 787 590 Payment of withholding taxes related to stock-based compensation to employees (13,018) (13,165)Cash dividends paid (18,970) (14,215)
Net cash used in financing activities (31,201) (26,790)(DECREASE) INCREASE IN CASH AND CASH EQUIVALENTS (87,098) 1,939 CASH AND CASH EQUIVALENTS, BEGINNING OF PERIOD 630,012 131,627 CASH AND CASH EQUIVALENTS, END OF PERIOD $ 542,914 $ 133,566 The following non-cash activities occurred: Unrealized (loss) gain on available-for-sale securities $ (35) $ 1,242 Common stock issued to Board of Directors and Scientific Advisory Board that was earned and accrued for in a previous period 300 300 Net change in accounts payable and accrued expenses related to purchases of property and equipment 366 390
The accompanying notes are an integral part of these Consolidated Financial Statements.
6

UNIVERSAL DISPLAY CORPORATION AND SUBSIDIARIES
NOTES TO CONSOLIDATED FINANCIAL STATEMENTS
(UNAUDITED) 1. BUSINESS:
Universal Display Corporation and its subsidiaries (the Company) is a leader in the research, development and commercialization of organic light emittingdiode (OLED) technologies and materials for use in display and solid-state lighting applications. OLEDs are thin, lightweight and power-efficient solid-state devicesthat emit light that can be manufactured on both flexible and rigid substrates, making them highly suitable for use in full-color displays and as lighting products.OLED displays are capturing a growing share of the display market, especially in the mobile phone, television, wearable, tablet, notebook and personal computer,augmented reality (AR), virtual reality (VR) and automotive markets. The Company believes this is because OLEDs offer potential advantages over competingdisplay technologies with respect to power efficiency, contrast ratio, viewing angle, video response time, form factor and manufacturing cost. The Company alsobelieves that OLED lighting products have the potential to replace many existing light sources in the future because of their high-power efficiency, excellent colorrendering index, low operating temperature and novel form factor. The Company’s technology leadership, intellectual property position, and the Company’s morethan 20 years of experience working closely with leading OLED display manufacturers are some of the competitive advantages that should enable the Company tocontinue to share in the revenues from OLED displays and lighting products as they gain wider acceptance.
The Company’s primary business strategy is to (1) develop new OLED materials and sell existing and any new materials to product manufacturers ofproducts for display applications, such as mobile phones, televisions, wearables, tablets, portable media devices, notebook computers, personal computers andautomotive applications, and specialty and general lighting products; and (2) further develop and license the Company’s proprietary OLED technologies to thosemanufacturers. The Company has established a significant portfolio of proprietary OLED technologies and materials, primarily through internal research anddevelopment efforts and acquisitions of patents and patent applications, as well as maintaining long-standing, and establishing new relationships with world-classuniversities, research institutions and strategic manufacturing partnerships. The Company currently owns, exclusively licenses or has the sole right to sublicensemore than 5,000 patents issued and pending worldwide.
The Company manufactures and sells its proprietary OLED materials to customers for evaluation and use in commercial OLED products. The Company alsoenters into agreements with manufacturers of OLED display and lighting products under which it grants them licenses to practice under the Company’s patents andto use the Company's proprietary know-how. At the same time, the Company works with these and other companies that are evaluating the Company's OLEDtechnologies and materials for possible use in commercial OLED display and lighting products.
2. SUMMARY OF SIGNIFICANT ACCOUNTING POLICIES:
Interim Financial Information
In the opinion of management, the accompanying unaudited Consolidated Financial Statements contain all adjustments (consisting of only normal recurringadjustments) necessary to present fairly the Company’s financial position as of June 30, 2021 and results of operations for the three and six months ended June 30,2021 and 2020, and cash flows for the six months ended June 30, 2021 and 2020. While management believes that the disclosures presented are adequate to makethe information not misleading, these unaudited Consolidated Financial Statements should be read in conjunction with the audited Consolidated Financial Statementsand the notes thereto in the Company’s latest year-end Consolidated Financial Statements, which are included in the Company’s Annual Report on Form 10-K forthe year ended December 31, 2020. The results of the Company’s operations for any interim period are not necessarily indicative of the results of operations for anyother interim period or for the full year.
Principles of Consolidation
The Consolidated Financial Statements include the accounts of Universal Display Corporation and its wholly owned subsidiaries, UDC, Inc., UDC IrelandLimited (UDC Ireland), Universal Display Corporation Hong Kong, Limited, Universal Display Corporation Korea, Y.H., Universal Display Corporation Japan GK,Universal Display Corporation China, Ltd., Adesis, Inc. (Adesis), UDC Ventures LLC, OVJP Corporation (OVJP Corp) and OLED Material Manufacturing Limited(OMM). All intercompany transactions and accounts have been eliminated.
7

In November 2020, a wholly-owned subsidiary of UDC Ireland, OMM, was formed as an Ireland limited company. Based out of Shannon, Ireland, OMMwas formed to increase the Company’s production capacity to meet market demand and diversify the manufacturing base due to evolving industry requirements.
Management’s Use of Estimates
The preparation of financial statements in conformity with U.S. generally accepted accounting principles (GAAP) requires management to make estimatesand assumptions that affect the reported amounts of assets and liabilities and disclosure of contingent assets and liabilities at the date of the financial statements andthe reported amounts of revenues and expenses during the reporting period. The estimates made are principally in the areas of revenue recognition includingestimates of material unit sales and royalties, the useful life of acquired intangibles, lease liabilities, right-of-use assets, the use and recoverability of inventories,intangibles, investments and income taxes including realization of deferred tax assets, stock-based compensation and retirement benefit plan liabilities. Actualresults could differ from those estimates.
Inventories
Inventories consist of raw materials, work-in-process and finished goods, including inventory consigned to customers, and are stated at the lower of cost,determined on a first-in, first-out basis, or net realizable value. Inventory valuation and firm committed purchase order assessments are performed on a quarterlybasis and those items that are identified to be obsolete or in excess of forecasted usage are written down to their estimated realizable value. Estimates of realizablevalue are based upon management’s analyses and assumptions, including, but not limited to, forecasted sales levels by product, expected product lifecycle, productdevelopment plans and future demand requirements. A 12-month rolling forecast based on factors, including, but not limited to, production cycles, anticipatedproduct orders, marketing forecasts, backlog, and shipment activities is used in the inventory analysis. If market conditions are less favorable than forecasts or actualdemand from customers is lower than estimates, additional inventory write-downs may be required. If demand is higher than expected, inventories that hadpreviously been written down may be sold.
Fair Value of Financial Instruments
The carrying values of accounts receivable, other current assets, accounts payable and other current liabilities approximate fair value in the accompanyingConsolidated Financial Statements due to the short-term nature of those instruments. The Company’s other financial instruments, which include cash equivalents,investments, retirement plan benefit liability and other liabilities are carried at fair value.
Minority Equity Investments
The Company accounts for minority equity investments in companies that are not accounted for under the equity method as equity securities without readilydeterminable fair values. The fair value of these securities is based on original cost less impairments, if any, plus or minus changes resulting from observable pricechanges in orderly transactions for the identical or similar investment of the same issuer. Under this method, the share of income or loss of such companies is notincluded in the Consolidated Statements of Income. The carrying value of these investments is included in investments on the Consolidated Balance Sheets.
The Company’s policy is to recognize an impairment in the value of its minority equity investments when clear evidence of an impairment exists. Factorsconsidered in the assessment include a significant adverse change in the regulatory, economic, or technological environment, the completion of new equity financingthat may indicate a decrease in value, the failure to complete new equity financing arrangements after seeking to raise additional funds, or the commencement ofproceedings under which the assets of the business may be placed in receivership or liquidated to satisfy the claims of debt and equity stakeholders.
Leases
The Company is a lessee in operating leases primarily incurred to facilitate the expansion of manufacturing, research and development, and selling, generaland administrative activities. At contract inception, the Company determines if an arrangement is or contains a lease, and if so recognizes a right-of-use asset andlease liability at the lease commencement date. For operating leases, the lease liability is measured at the present value of the unpaid lease payments at the leasecommencement date, whereas for finance leases, the lease liability is initially measured at the present value of the unpaid lease payments and subsequently measuredat amortized cost using the interest method. Operating lease right-of-use assets are included in other assets on the Consolidated Balance Sheets. The short-termportion of operating lease liabilities is included in other current liabilities on the Consolidated Balance Sheets and the long-term portion is included in otherliabilities on the Consolidated Balance Sheets. As of June 30, 2021, the Company had no leases that qualified as financing arrangements.
8

Key estimates and judgments include how the Company determines the discount rate used to discount the unpaid lease payments to present value and thelease term. The Company monitors for events or changes in circumstances that could potentially require recognizing an impairment loss.
Revenue Recognition and Deferred Revenue
Material sales relate to the Company’s sale of its OLED materials for incorporation into its customers’ commercial OLED products or for their OLEDdevelopment and evaluation activities. Revenue associated with material sales is generally recognized at the time title passes, which is typically at the time ofshipment or at the time of delivery, depending upon the contractual agreement between the parties. Revenue may be recognized after control of the material passesin the event the transaction price includes variable consideration. For example, a customer may be provided an extended opportunity to stock materials prior to usein mass production and given a general right of return not conditioned on breaches of warranties associated with the specific product. In such circumstances, revenuewill be recognized at the earlier of the expiration of the customer’s general right of return or once it becomes unlikely that the customer will exercise its right ofreturn.
The rights and benefits to the Company’s OLED technologies are conveyed to the customer through technology license agreements and material supplyagreements. The Company believes that the licenses and materials sold under these combined agreements are not distinct from each other for financial reportingpurposes and as such, are accounted for as a single performance obligation. Accordingly, total contract consideration is estimated and recognized over the contractterm based on material units sold at the estimated per unit fee over the life of the contract. Total contract consideration is allocated to material sales and royalty andlicensing fees on the Consolidated Statements of Income based on contract pricing.
Various estimates are relied upon to recognize revenue. The Company estimates total material units to be purchased by its customers over the contract termbased on historical trends, industry estimates and its forecast process. Management uses the expected value method to estimate the material per unit fee.Additionally, management estimates the total sales-based royalties based on the estimated net sales revenue of its customers over the contract term.
Contract research services revenue is revenue earned by Adesis by providing chemical materials synthesis research, development and commercialization fornon-OLED applications on a contractual basis. These services range from intermediates for structure-activity relationship studies, reference agents and buildingblocks for combinatorial synthesis, re-synthesis of key intermediates, specialty organic chemistry needs, and selective toll manufacturing. These services areprovided to third-party pharmaceutical and life sciences firms and other technology firms at fixed costs or on an annual contract basis. Revenue is recognized asservices are performed with billing schedules and payment terms negotiated on a contract-by-contract basis. Payments received in excess of revenue recognized arerecorded as deferred revenue. In other cases, services may be provided and revenue is recognized before the customer is invoiced. In these cases, revenue recognizedwill exceed amounts billed and the difference, representing amounts which are currently unbillable to the customer pursuant to contractual terms, is recorded as anunbilled receivable.
Technology development and support revenue is revenue earned from development and technology evaluation agreements and commercialization assistancefees, along with, to a minimal extent, government contracts. Relating to the Company’s government contracts, the Company may receive reimbursements bygovernment entities for all or a portion of the research and development costs the Company incurs. Revenues are recognized as services are performed,proportionally as research and development costs are incurred, or as defined milestones are achieved. Technology development and support revenue is included incontract research services on the Consolidated Statements of Income.
In 2018, the Company entered into a commercial patent license agreement with Samsung Display Co., Ltd. (SDC). This agreement, which covers themanufacture and sale of specified OLED display materials, was effective as of January 1, 2018 and lasts through the end of 2022 with an additional two-yearextension option. Under this agreement, the Company is being paid a license fee, payable in quarterly installments over the agreement term of five years. Theagreement conveys to SDC the non-exclusive right to use certain of the Company's intellectual property assets for a limited period of time that is less than theestimated life of the assets.
At the same time the Company entered into the current commercial license agreement with SDC, the Company also entered into a new supplemental materialpurchase agreement with SDC. Under the supplemental material purchase agreement, SDC agrees to purchase from the Company a minimum amount ofphosphorescent emitter materials for use in the manufacture of licensed products. This minimum commitment is subject to SDC’s requirements for phosphorescentemitter materials and the Company’s ability to meet these requirements over the term of the supplemental agreement.
In 2015, the Company entered into an OLED patent license agreement and an OLED commercial supply agreement with LG Display Co., Ltd. (LG Display)which were effective as of January 1, 2015 and superseded the existing 2007 commercial supply agreement between the parties. The terms of the agreements wereset to expire by the end of 2022. The patent license agreement
9
provides LG Display a non-exclusive, royalty bearing portfolio license to make and sell OLED displays under the Company's patent portfolio. The patent licensecalls for license fees, prepaid royalties and running royalties on licensed products. The agreements include customary provisions relating to warranties, indemnities,confidentiality, assignability and business terms. The agreements provide for certain other minimum obligations relating to the volume of material sales anticipatedover the life of the agreements as well as minimum royalty revenue to be generated under the patent license agreement. The Company generates revenue under theseagreements that are predominantly tied to LG Display’s sales of OLED licensed products. The OLED commercial supply agreement provides for the sale ofmaterials for use by LG Display, which may include phosphorescent emitters and host materials.
In 2021, the Company entered into amendments of the OLED patent license agreement and the OLED commercial supply agreement with LG Display, whichwere effective as of January 1, 2021. The amended agreements included a term extension and are set to expire by the end of 2025.
In 2016, the Company entered into long-term, multi-year OLED patent license and material purchase agreements with Tianma Micro-electronics Co., Ltd.(Tianma). Under the license agreement, the Company has granted Tianma non-exclusive license rights under various patents owned or controlled by the Company tomanufacture and sell OLED display products. The license agreement calls for license fees and running royalties on licensed products. Additionally, the Companysupplies phosphorescent OLED materials to Tianma for use in its licensed products. On July 21, 2021, the Tianma patent license and material purchase agreementsexpired. The parties are currently working to complete long-term extensions to both agreements.
In 2017, the Company entered into long-term, multi-year agreements with BOE Technology Group Co., Ltd. (BOE). Under these agreements, the Companyhas granted BOE non-exclusive license rights under various patents owned or controlled by the Company to manufacture and sell OLED display products. TheCompany supplies phosphorescent OLED materials to BOE for use in its licensed products.
In 2018, the Company entered into long-term, multi-year OLED patent license and material purchase agreements with Visionox Technology, Inc. (Visionox).Under the license agreement, the Company granted certain of Visionox’s affiliates a non-exclusive license rights under various patents owned or controlled by theCompany to manufacture and sell OLED display products. The license agreement calls for license fees and running royalties on licensed products. Additionally, theCompany supplies phosphorescent OLED materials to Visionox for use in its licensed products. On April 22, 2021, the Company announced that it had extended theVisionox agreement by entering into new five-year OLED material supply and license agreements with a new affiliate of Visionox, Visionox Hefei Technology Co.Ltd.
In 2019, the Company entered into an evaluation and commercial supply relationship with Wuhan China Star Optoelectronics Semiconductor DisplayTechnology Co., Ltd. (CSOT). In 2020, the Company entered into long-term, multi-year agreements with CSOT. Under these agreements, the Company has grantedCSOT non-exclusive license rights under various patents owned or controlled by the Company to manufacture and sell OLED display products. The Company alsosupplies phosphorescent OLED materials to CSOT for use in its licensed products.
All material sales transactions that are not variable consideration transactions are billed and due within 90 days and substantially all are transacted in U.S.dollars.
Cost of Sales
Cost of sales consists of labor and material costs associated with the production of materials processed at the Company's manufacturing partners and at theCompany's internal manufacturing processing facility. The Company’s portion of cost of sales also includes depreciation of manufacturing equipment, as well asmanufacturing overhead costs and inventory adjustments for excess and obsolete inventory.
Research and Development
Expenditures for research and development are charged to expense as incurred.
Patent Costs
Costs associated with patent applications, patent prosecution, patent defense and the maintenance of patents are charged to expense as incurred. Costs tosuccessfully defend a challenge to a patent are capitalized to the extent of an evident increase in the value of the patent. Costs that relate to an unsuccessful outcomeare charged to expense.
10

Amortization of Acquired Technology
Amortization costs primarily relate to technology acquired from BASF and Fujifilm. These acquisitions were completed in the years ended December 31,2016 and 2012, respectively. Acquisition costs are being amortized over a period of 10 years for both the BASF and Fujifilm patents.
Amortization of Other Intangible Assets
Other intangible assets primarily relate to the Adesis acquisition and are being amortized over a period of 10 to 15 years. See Note 7 for further discussion.
Translation of Foreign Currency Financial Statements and Foreign Currency Transactions
The Company’s reporting currency is the U.S. dollar. The functional currency for the UDC Ireland subsidiary is also the U.S. dollar and the functionalcurrency for the OMM subsidiary and each of the Company's Asia-Pacific foreign subsidiaries is its local currency. The Company translates the amounts included inthe Consolidated Statements of Income from OMM and its Asia-Pacific foreign subsidiaries into U.S. dollars at weighted-average exchange rates, which theCompany believes are representative of the actual exchange rates on the dates of the transactions. The Company's foreign subsidiaries' assets and liabilities aretranslated into U.S. dollars from the local currency at the actual exchange rates as of the end of each reporting date, and the Company records the resulting foreignexchange translation adjustments in the Consolidated Balance Sheets as a component of accumulated other comprehensive loss. The overall effect of the translationof foreign currency and foreign currency transactions to date has been insignificant.
Income Taxes
Income taxes are accounted for under the asset and liability method. Deferred tax assets and liabilities are recognized for the future tax consequencesattributable to differences between the financial statement carrying amounts of existing assets and liabilities and their respective tax bases and operating loss and taxcredit carryforwards. Deferred tax assets and liabilities are measured using enacted tax rates expected to apply to taxable income in the years in which thosetemporary differences are expected to be recovered or settled. The effect on deferred tax assets and liabilities of a change in tax rates is recognized in income in theperiod that includes the enactment date. The Company recognizes the effect of income tax positions only if those positions are more likely than not of beingsustained. Recognized income tax positions are measured at the largest amount of which the likelihood of realization is greater than 50%. Changes in recognition ormeasurement are reflected in the period in which the change in judgment occurs. The Company records interest and penalties, if any, related to unrecognized taxbenefits as a component of tax expense.
Share-Based Payment Awards
The Company recognizes in the Consolidated Statements of Income the grant-date fair value of equity-based awards such as shares issued under employeestock purchase plans, restricted stock awards, restricted stock units and performance unit awards issued to employees and directors.
The grant-date fair value of stock awards is based on the closing price of the stock on the date of grant. The fair value of share-based awards is recognized ascompensation expense on a straight-line basis over the requisite service period, net of forfeitures. The Company issues new shares upon the respective grant,exercise or vesting of the share-based payment awards, as applicable.
Performance unit awards are subject to either a performance-based or market-based vesting requirement. For performance-based vesting, the grant-date fairvalue of the award, based on fair value of the Company's common stock, is recognized over the service period based on an assessment of the likelihood that theapplicable performance goals will be achieved and compensation expense is periodically adjusted based on actual and expected performance. Compensation expensefor performance unit awards with market-based vesting is calculated based on the estimated fair value as of the grant date utilizing a Monte Carlo simulation modeland is recognized over the service period on a straight-line basis.
11

3. CASH, CASH EQUIVALENTS AND INVESTMENTS:
The Company’s portfolio of fixed income securities consists of term bank certificates of deposit, U.S. Government bonds, corporate bonds and convertiblenotes. The Company considers all highly liquid debt instruments purchased with an original maturity (maturity at the purchase date) of three months or less to becash equivalents. The Company classifies its remaining debt security investments as available-for-sale. These debt securities are carried at fair market value, withunrealized gains and losses reported in shareholders’ equity. Gains or losses on securities sold are based on the specific identification method.
Cash and Cash Equivalents
The following table provides details regarding the Company’s portfolio of cash and cash equivalents (in thousands): Amortized Unrealized Aggregate Fair
Cash and Cash Equivalents Classification Cost Gains (Losses) Market Value June 30, 2021
Cash accounts in banking institutions $ 167,339 $ — $ — $ 167,339 Money market accounts 16,588 — — 16,588 U.S. Government bonds 358,991 — (4) 358,987
$ 542,918 $ — $ (4) $ 542,914 December 31, 2020
Cash accounts in banking institutions $ 163,779 $ — $ — $ 163,779 Money market accounts 17,261 — — 17,261 U.S. Government bonds 448,970 6 (4) 448,972
$ 630,010 $ 6 $ (4) $ 630,012
Short-term Investments
The following table provides details regarding the Company’s portfolio of short-term investments (in thousands):
Amortized Unrealized Aggregate Fair Short-term Investments Classification Cost Gains (Losses) Market Value
June 30, 2021 Certificates of deposit $ 720 $ — $ — $ 720 Corporate bonds 189,789 41 (10) 189,820
$ 190,509 $ 41 $ (10) $ 190,540 December 31, 2020
U.S. Government bonds $ 99,929 $ 67 $ — $ 99,996 $ 99,929 $ 67 $ — $ 99,996
Minority Investments and Convertible Notes
The Company’s portfolio of minority investments and convertible notes consist of investments in privately held early-stage companies primarily motivated togain early access to new technology and are passive in nature in that the Company does not obtain representation on the board of directors of the companies in whichit invests. Minority investments and convertible notes are included in investments on the Consolidated Balance Sheets. As of June 30, 2021, the Company had twominority investments with a total carrying value of $8.0 million accounted for as equity securities without readily determinable fair values. As of June 30, 2021, theCompany had one convertible note investment with a fair value of $500,000 accounted for as an available-for-sale debt security with a level 3 fair valuemeasurement.
12

4. FAIR VALUE MEASUREMENTS:
The following table provides the assets and liabilities carried at fair value measured on a recurring basis as of June 30, 2021 (in thousands): Fair Value Measurements, Using
Total Carrying Valueas of June 30,
2021
Quoted Prices inActive Markets
(Level 1)
Significant OtherObservable Inputs
(Level 2)
Significant UnobservableInputs
(Level 3) Cash equivalents $ 375,575 $ 375,575 $ — $ — Short-term investments 190,540 190,540 — — Convertible notes 500 — — 500
The following table provides the assets and liabilities carried at fair value measured on a recurring basis as of December 31, 2020 (in thousands): Fair Value Measurements, Using
Total Carrying Valueas of December 31,
2020
Quoted Prices inActive Markets
(Level 1)
Significant OtherObservable Inputs
(Level 2)
Significant UnobservableInputs
(Level 3) Cash equivalents $ 466,233 $ 466,233 $ — $ — Short-term investments 99,996 99,996 — —
Level 1 inputs are quoted prices (unadjusted) in active markets for identical assets or liabilities. Level 2 inputs are quoted prices for similar assets andliabilities in active markets or inputs that are observable for the asset or liability, either directly or indirectly through market corroboration, for substantially the fullterm of the financial instrument. Level 3 inputs are unobservable inputs based on management’s own assumptions used to measure assets and liabilities at fair value.A financial asset’s or liability’s classification is determined based on the lowest level input that is significant to the fair value measurement.
Changes in fair value of the debt investments are recorded as unrealized gains and losses in accumulated other comprehensive loss on the ConsolidatedBalance Sheets and any credit losses on debt investments are recorded as an allowance for credit losses with an offset recognized in other income, net on theConsolidated Statements of Income. There were no credit losses on debt investments as of June 30, 2021 or December 31, 2020.
5. INVENTORY:
Inventory consisted of the following (in thousands):
June 30, 2021 December 31, 2020 Raw materials $ 62,011 $ 46,843 Work-in-process 8,052 9,904 Finished goods 34,590 34,844 Inventory $ 104,653 $ 91,591
The Company recorded an increase in inventory reserve of $450,000 and none for the three months ended June 30, 2021 and 2020, respectively, and $1.1million and $611,000 for the six months ended June 30, 2021 and 2020, respectively, due to excess inventory levels in certain products.
13

6. PROPERTY AND EQUIPMENT:
Property and equipment, net consist of the following (in thousands): June 30, 2021 December 31, 2020 Land $ 2,642 $ 2,642 Building and improvements 71,359 53,568 Office and lab equipment 96,927 85,881 Furniture, fixtures and computer related assets 12,676 8,921 Construction-in-progress 11,304 23,594 194,908 174,606 Less: Accumulated depreciation (81,721) (72,493)Property and equipment, net $ 113,187 $ 102,113
Depreciation expense was $4.9 million and $3.8 million for the three months ended June 30, 2021 and 2020, respectively, and $9.2 million and $7.3 millionfor the six months ended June 30, 2021 and 2020, respectively.
7. GOODWILL AND INTANGIBLE ASSETS:
The Company monitors the recoverability of goodwill annually or whenever events or changes in circumstances indicate the carrying value may not berecoverable. Purchased intangible assets subject to amortization consist of acquired technology and other intangible assets that include trade names, customerrelationships and developed intellectual property (IP) processes.
Acquired Technology
Acquired technology consists of acquired license rights for patents and know-how obtained from PD-LD, Inc., Motorola, BASF SE (BASF) and Fujifilm.These intangible assets consist of the following (in thousands): June 30, 2021 December 31, 2020 PD-LD, Inc. $ 1,481 $ 1,481 Motorola 15,909 15,909 BASF 95,989 95,989 Fujifilm 109,462 109,462 Other 462 462 223,303 223,303 Less: Accumulated amortization (163,343) (153,050)Acquired technology, net $ 59,960 $ 70,253
Amortization expense related to acquired technology was $5.1 million for both three-month periods ended June 30, 2021 and 2020, and $10.3 million forboth six-month periods ended June 30, 2021. Amortization expense is included in amortization of acquired technology and other intangible assets expense line itemon the Consolidated Statements of Income and is expected to be $10.4 million for the six months ending December 31, 2021, $15.8 million in the year endingDecember 31, 2022, $9.7 million in the year ending December 31, 2023, $9.6 million in the years ending December 31, 2024 and 2025 and $4.9 million in totalthereafter.
Fujifilm Patent Acquisition
On July 23, 2012, the Company entered into a Patent Sale Agreement with Fujifilm. Under the agreement, Fujifilm sold more than 1,200 OLED-relatedpatents and patent applications in exchange for a cash payment of $105.0 million, plus costs incurred in connection with the purchase. The agreement containscustomary representations and warranties and covenants, including respective covenants not to sue by both parties thereto. The agreement permitted the Company toassign all of its rights and obligations under the agreement to its affiliates, and the Company assigned, prior to the consummation of the transactions contemplated bythe agreement, its rights and obligations to UDC Ireland, a wholly-owned subsidiary of the Company formed under the laws of the Republic of Ireland. Thetransactions contemplated by the agreement were consummated on July 26, 2012. The Company recorded the $105.0 million plus $4.5 million of purchase costs asacquired technology, which is being amortized over a period of 10 years.
14

BASF Patent Acquisition
On June 28, 2016, UDC Ireland entered into and consummated an IP Transfer Agreement with BASF. Under the IP Transfer Agreement, BASF sold to UDCIreland all of its rights, title and interest to certain of its owned and co-owned intellectual property rights relating to the composition of, development, manufactureand use of OLED materials, including OLED lighting and display stack technology, as well as certain tangible assets. The intellectual property includes knowhowand more than 500 issued and pending patents in the area of phosphorescent materials and technologies. These assets were acquired in exchange for a cash paymentof €86.8 million ($95.8 million). In addition, UDC Ireland also took on certain rights and obligations under three joint research and development agreements towhich BASF was a party. The IP Transfer Agreement also contains customary representations, warranties and covenants of the parties. UDC Ireland recorded thepayment of €86.8 million ($95.8 million) and acquisition costs incurred of $217,000 as acquired technology, which is being amortized over a period of 10 years.
Other Intangible Assets
As a result of the Adesis acquisition in June 2016, the Company recorded $16.8 million of other intangible assets, including $10.5 million assigned tocustomer relationships with a weighted average life of 11.5 years, $4.8 million of internally developed IP, processes and recipes with a weighted average life of 15years, and $1.5 million assigned to trade name and trademarks with a weighted average life of 10 years.
At June 30, 2021, these other intangible assets consist of the following (in thousands):
June 30, 2021
Gross Carrying
Amount AccumulatedAmortization
Net CarryingAmount
Customer relationships $ 10,520 $ (4,512) $ 6,008 Developed IP, processes and recipes 4,820 (1,587) 3,233 Trade name/Trademarks 1,500 (743) 757 Other 394 (6) 388 Total identifiable other intangible assets $ 17,234 $ (6,848) $ 10,386
Amortization expense related to other intangible assets was $351,000 and $345,000 for the three months ended June 30, 2021 and 2020, respectively, and
$693,000 and $690,000 for the six months ended June 30, 2021 and 2020, respectively. Amortization expense is included in amortization of acquired technology andother intangible assets expense line item on the Consolidated Statements of Income and is expected to be $712,000 for the six months ending December 31, 2021,$1.4 million for each of the next four fiscal years (2022 – 2025) and $4.1 million in total thereafter.
8. LEASES:
The Company has entered into operating leases to facilitate the expansion of its manufacturing, research and development, and selling, general andadministrative activities. For purposes of calculating operating lease liabilities, lease terms may be deemed to include options to extend or terminate the lease whenthose events are reasonably certain to occur. The interest rate implicit in lease contracts is typically not readily determinable and as such the Company uses theappropriate incremental borrowing rate based on information available at the lease commencement date in determining the present value of the lease payments.Current lease agreements do not contain any residual value guarantees or material restrictive covenants. As of June 30, 2021, the Company did not have any financeleases and had one operating lease that had not yet commenced, related to expansion of the Adesis research facilities in Wilmington, Delaware.
The following table presents the Company’s operating lease cost and supplemental cash flow information related to the Company’s operating leases (inthousands):
Three Months Ended June 30, Six Months Ended June 30, 2021 2020 2021 2020 Operating lease cost $ 757 $ 535 $ 1,372 $ 1,072 Non-cash activity:
Right-of-use assets obtained in exchange for lease obligations $ 5,351 $ — $ 10,071 $ —
15

The following table presents the Company’s operating right-of-use assets and liabilities (in thousands):
June 30, 2021 December 31, 2020 Right-of-use assets $ 16,633 $ 8,750 Short-term lease liabilities 2,004 1,871 Long-term lease liabilities 14,629 6,879
The following table presents weighted average assumptions used to compute the Company’s right-of-use assets and lease liabilities:
June 30, 2021 Weighted average remaining lease term (in years) 7.7 Weighted average discount rate 3.3%
As of June 30, 2021, current operating leases had remaining terms between three months and ten years with options to extend the lease terms.
Undiscounted future minimum lease payments as of June 30, 2021, by year and in the aggregate, having non-cancelable lease terms in excess of one yearwere as follows (in thousands):
Maturities of
Operating Lease Liabilities 2021 (1) $ 1,128 2022 2,578 2023 2,460 2024 2,306 2025 2,121 Thereafter 8,146 Total lease payments 18,739 Less: Imputed interest (2,106)Present value of lease payments $ 16,633
(1) Scheduled maturities of lease liabilities represent the period from July 1, 2021 to December 31, 2021.
9. RESEARCH AND LICENSE AGREEMENTS WITH PRINCETON UNIVERSITY, UNIVERSITY OF SOUTHERN CALIFORNIA AND THEUNIVERSITY OF MICHIGAN:
The Company has long-standing relationships with Princeton University (Princeton) and the University of Southern California (USC), dating back to 1994,for the conduct of research relating to the Company’s OLED and other organic thin-film technologies and materials. This research had been performed at Princetonunder the direction of Professor Stephen R. Forrest and at USC under the direction of Professor Mark E. Thompson.
Under an Amended License Agreement entered into in 1997 by the Company, Princeton and USC (as amended, the 1997 Amended License Agreement),Princeton and USC granted the Company worldwide, exclusive license rights, with rights to sublicense, to make, have made, use, lease and/or sell products and topractice processes based on patent applications and issued patents arising out of research performed by Princeton and USC for the Company. Under the 1997Amended License Agreement, the Company pays Princeton royalties of 3% of the net sales price for licensed products it sells or 3% of the revenues the Companyreceives from its sublicensees for their sale of licensed products. The Company recorded royalty expense in connection with this agreement of $149,000 and $1.6million for the three months ended June 30, 2021 and 2020, respectively, and $261,000 and $4.9 million for the six months ended June 30, 2021 and 2020,respectively. The decline in the royalty expense was primarily due to the expiration of patents relating to the licensed products, as specified in the Amended LicenseAgreement.
In 2006, Professor Forrest transferred from Princeton to the University of Michigan (Michigan) and the Company amended the 1997 Amended LicenseAgreement to include Michigan as a party to that agreement. Also in connection with the transfer, the Company entered into a sponsored research agreement withUSC under which the Company continues to fund organic electronics research being conducted by Professors Forrest and Thompson (the 2006 ResearchAgreement). Work by Professor Forrest is being funded through a subcontract between USC and Michigan. The 2006 Research Agreement extends through April2023 with an option to further extend for an additional two years.
16

The Company makes payments under the 2006 Research Agreement to USC on a quarterly basis as actual expenses are incurred. As of June 30, 2021, theCompany was obligated to pay USC up to $4.9 million for work to be performed during the remaining extended term. The Company recorded research anddevelopment expense in connection with work performed under the 2006 Research Agreement of $394,000 and $304,000 for the three months ended June 30, 2021and 2020, respectively, and $679,000 and $581,000 for the six months ended June 30, 2021 and 2020, respectively.
10. EQUITY AND CASH COMPENSATION UNDER THE PPG AGREEMENTS:
On September 22, 2011, the Company entered into an Amended and Restated OLED Materials Supply and Service Agreement with PPG Industries, Inc.(PPG) (the New OLED Materials Agreement), which replaced the original OLED Materials Agreement with PPG effective as of October 1, 2011. The term of theNew OLED Materials Agreement ran through December 31, 2015 and shall be automatically renewed for additional one-year terms, unless terminated by theCompany by providing prior notice of one year or terminated by PPG by providing prior notice of two years. The agreement was automatically renewed throughDecember 31, 2021. The New OLED Materials Agreement contains provisions that are substantially similar to those of the original OLED Materials Agreement.Under the New OLED Materials Agreement, PPG continues to assist the Company in developing its proprietary OLED materials and supplying the Company withthose materials for evaluation purposes and for resale to its customers.
Under the New OLED Materials Agreement, the Company compensates PPG on a cost-plus basis for the services provided during each calendar quarter. TheCompany is required to pay for some of these services in all cash. Up to 50% of the remaining services are payable, at the Company’s sole discretion, in cash orshares of the Company’s common stock, with the balance payable in cash. The actual number of shares of common stock issuable to PPG is determined based on theaverage closing price for the Company’s common stock during a specified number of days prior to the end of each calendar half-year period ending on March 31 andSeptember 30. If, however, this average closing price is less than $20.00, the Company is required to compensate PPG in cash. No shares were issued for services toPPG for the three or six months ended June 30, 2021 or 2020.
The Company is also required to reimburse PPG for raw materials used for research and development. The Company records the purchases of these rawmaterials as a current asset until such materials are used for research and development efforts.
On February 23, 2021, the Company entered into an amendment to the New OLED Materials Agreement specifying operation and maintenance services thatwill be provided by PPG affiliate, PPG SCM Ireland Limited, to OMM, at the new manufacturing site in Shannon, Ireland, currently being leased by OMM for theproduction of OLED materials. Facility improvements and regulatory approvals are expected to be completed in the next 12 months and operations are scheduled tocommence by mid-year 2022. As with the initial New OLED Materials Agreement, the Company will compensate PPG on a cost-plus basis for the services providedat the Shannon manufacturing facility.
The Company recorded research and development expense of $738,000 and $836,000 for the three months ended June 30, 2021 and 2020, respectively, and$2.2 million and $1.3 million for the six months ended June 30, 2021 and 2020, respectively, in relation to the cash portion of the reimbursement of expenses andwork performed by PPG, excluding amounts paid for commercial chemicals.
11. SHAREHOLDERS’ EQUITY:
Preferred Stock
The Company’s Amended and Restated Articles of Incorporation authorize it to issue up to 5,000,000 shares of $0.01 par value preferred stock withdesignations, rights and preferences determined from time-to-time by the Company’s Board of Directors. Accordingly, the Company’s Board of Directors isempowered, without shareholder approval, to issue preferred stock with dividend, liquidation, conversion, voting or other rights superior to those of shareholders ofthe Company’s common stock.
In 1995, the Company issued 200,000 shares of Series A Nonconvertible Preferred Stock (Series A) to American Biomimetics Corporation (ABC) pursuantto a certain Technology Transfer Agreement between the Company and ABC. The Series A shares have a liquidation value of $7.50 per share. Series Ashareholders, as a single class, have the right to elect two members of the Company’s Board of Directors. This right has never been exercised. Holders of the SeriesA shares are entitled to one vote per share on matters which shareholders are generally entitled to vote. The Series A shareholders are not entitled to any dividends.
As of June 30, 2021, the Company had issued 200,000 shares of preferred stock, all of which were outstanding.
17

Common Stock
The Company’s Amended and Restated Articles of Incorporation authorize it to issue up to 200,000,000 shares of $0.01 par value common stock. Each shareof the Company’s common stock entitles the holder to one vote on all matters to be voted upon by the shareholders.
As of June 30, 2021, the Company had issued 49,054,059 shares of common stock, of which 47,688,411 were outstanding. During the three and six monthsended June 30, 2021 and 2020, the Company repurchased no shares of common stock.
Scientific Advisory Board Awards
During the six months ended June 30, 2021 and 2020, the Company granted a total of 1,400 and 1,926 shares, respectively, of fully vested common stock tonon-employee members of the Scientific Advisory Board for services performed in 2020 and 2019, respectively. The fair value of shares issued to members of theScientific Advisory Board was $300,000 for both six-month periods.
Dividends
During the three months ended June 30, 2021, the Company declared and paid cash dividends of $0.20 per share, or $9.5 million, and during the six monthsended June 30, 2021, the Company declared and paid cash dividends of $0.40 per share, or $19.0 million, on the Company’s outstanding common stock.
On August 3, 2021, the Company’s Board of Directors declared a third quarter dividend of $0.20 per share to be paid on September 30, 2021 to allshareholders of record of the Company’s common stock as of the close of business on September 16, 2021. All future dividends will be subject to the approval of theCompany’s Board of Directors.
12. ACCUMULATED OTHER COMPREHENSIVE LOSS:
Amounts related to the changes in accumulated other comprehensive loss were as follows (in thousands):
Unrealized Gain (Loss) onAvailable-for-Sale
Securities
Net UnrealizedGain (Loss) on
Retirement Plan (2)
Change in CumulativeForeign Currency
Translation Adjustment Total
Affected Line Items in theConsolidated Statements of
IncomeBalance December 31, 2020, net of tax $ 91 $ (36,075) $ (35) $ (36,019) Other comprehensive loss before reclassification (32) — (69) (101) Reclassification to net income (1)
— 2,348 — 2,348
Selling, general andadministrative,
research and development andcost of sales
Change during period (32) 2,348 (69) 2,247 Balance June 30, 2021, net of tax $ 59 $ (33,727) $ (104) $ (33,772)
18

Unrealized Gain (Loss) onAvailable-for-Sale
Securities
Net UnrealizedGain (Loss) on
Retirement Plan (2)
Change in CumulativeForeign Currency
Translation Adjustment Total
Affected Line Items in theConsolidated Statements of
IncomeBalance December 31, 2019, net of tax $ 191 $ (17,167) $ (21) $ (16,997) Other comprehensive gain before reclassification 968 — (30) 938 Reclassification to net income (1)
— 1,278 — 1,278
Selling, general andadministrative,
research and development andcost of sales
Change during period 968 1,278 (30) 2,216 Balance June 30, 2020, net of tax $ 1,159 $ (15,889) $ (51) $ (14,781)
(1) The Company reclassified amortization of prior service cost and actuarial loss for its retirement plan from accumulated other comprehensive loss to netincome of $2.3 million and $1.3 million for the six months ended June 30, 2021 and 2020.
(2) Refer to Note 14: Supplemental Executive Retirement Plan.
13. STOCK-BASED COMPENSATION:
Equity Compensation Plan
The Equity Compensation Plan provides for the granting of incentive and nonqualified stock options, shares of common stock, stock appreciation rights andperformance units to employees, directors and consultants of the Company. Stock options are exercisable over periods determined by the Company’s Human CapitalCommittee, but for no longer than 10 years from the grant date. Through June 30, 2021, the Company’s shareholders have approved increases in the number ofshares reserved for issuance under the Equity Compensation Plan to 10,500,000, and have extended the term of the plan through 2024. As of June 30, 2021, therewere 1,828,424 shares that remained available to be granted under the Equity Compensation Plan.
Restricted Stock Awards and Units
The Company has issued restricted stock awards and units to employees and non-employees with vesting terms of one to six years. The fair value is equal tothe market price of the Company’s common stock on the date of grant for awards granted to employees and equal to the market price at the end of the reportingperiod for unvested non-employee awards or upon the date of vesting for vested non-employee awards. Expense for restricted stock awards and units is amortizedratably over the vesting period for the awards issued to employees and using a graded vesting method for the awards issued to non-employees.
During the six months ended June 30, 2021, the Company granted 100,929 shares of restricted stock awards and restricted stock units to employees and non-employees, which had a total fair value of $22.9 million on the respective dates of grant, and will vest over three to five years from the date of grant, provided thatthe grantee is still an employee of the Company or is still providing services to the Company on the applicable vesting date.
For the three months ended June 30, 2021 and 2020, the Company recorded, as compensation charges related to all restricted stock awards and units grantedto employees and non-employees, selling, general and administrative expense of $4.1 million and $3.8 million, respectively, research and development expense of$1.3 million and $1.1 million, respectively, and cost of sales of $711,000 and $492,000, respectively. For the six months ended June 30, 2021 and 2020, theCompany recorded, as compensation charges related to all restricted stock awards and units granted to employees and non-employees, selling, general andadministrative expense of $7.7 million and $7.1 million, respectively, research and development expense of $2.5 million and $2.0 million, respectively, and cost ofsales of $1.3 million and $892,000, respectively.
In connection with the vesting of restricted stock awards and units during the three months ended June 30, 2021 and 2020, 14,660 and 54,332 shares,respectively, with aggregate fair values of $3.4 million and $7.4 million, respectively, were withheld in satisfaction of tax withholding obligations and are reflectedas a financing activity within the Consolidated Statements of Cash Flows. For the six months ended June 30, 2021 and 2020, 60,827 and 78,806 shares, respectively,with aggregate fair values of $12.1 million and $11.3 million, respectively, were withheld in satisfaction of tax withholding obligations and are reflected as afinancing activity within the Consolidated Statements of Cash Flows.
For the three months ended June 30, 2021 and 2020, the Company recorded as compensation charges related to all restricted stock units granted to non-employee members of the Scientific Advisory Board, whose unvested shares are marked to market each reporting period, research and development expense of$76,000 and $156,000, respectively. For the six months ended June 30, 2021 and 2020, the Company recorded as compensation charges related to all restricted stockunits granted to non-employee members of the Scientific Advisory Board, whose unvested shares are marked to market each
19

reporting period, research and development expense of $112,000 for both six-month periods.
The Company has granted restricted stock units to non-employee members of the Board of Directors with quarterly vesting over a period of approximatelyone year. The fair value is equal to the market price of the Company's common stock on the date of grant. The restricted stock units are issued and expense isrecognized ratably over the vesting period. For the three months ended June 30, 2021 and 2020, the Company recorded compensation charges for servicesperformed, related to all restricted stock units granted to non-employee members of the Board of Directors, selling, general and administrative expense of $297,000and $299,000, respectively. For the six months ended June 30, 2021 and 2020, the Company recorded compensation charges for services performed, related to allrestricted stock units granted to non-employee members of the Board of Directors, selling, general and administrative expense of $591,000 and $596,000,respectively. In connection with the vesting of the restricted stock, the Company issued to non-employee members of the Board of Directors 2,706 and 3,228 shares,respectively, during the six months ended June 30, 2021 and 2020.
Performance Unit Awards
Each performance unit award is subject to both a performance-vesting requirement (either performance-based or market-based) and a service-vestingrequirement. The performance-based vesting requirement is tied to the Company's cumulative revenue growth compared to the cumulative revenue growth ofcompanies comprising the Nasdaq Electronics Components Index, as measured over a specific performance period. The market-based vesting requirement is tied tothe Company's total shareholder return relative to the total shareholder return of companies comprising the Nasdaq Electronics Components Index, as measured overa specific performance period. The maximum number of performance units that may vest based on performance is two times the shares granted. Further, if theCompany's total shareholder return is negative, the performance units may not vest at all.
During the six months ended June 30, 2021, the Company granted 69,586 performance units, of which 34,791 units are subject to performance-based vestingrequirements and 34,795 units are subject to market-based vesting requirements, and which will vest over the terms described below. The grant date fair value of theperformance unit awards granted was $15.8 million for the six months ended June 30, 2021, as determined by the Company’s common stock on date of grant for theunits with performance-based vesting and a Monte-Carlo simulation for the units with market-based vesting.
For the three months ended June 30, 2021 and 2020, the Company recorded selling, general and administrative expense of $2.2 million and $1.1 million,respectively, research and development expense of $596,000 and $301,000, respectively, and cost of sales of $366,000 and $183,000, respectively, related toperformance units. For the six months ended June 30, 2021 and 2020, the Company recorded selling, general and administrative expense of $2.0 million and $1.9million, respectively, research and development expense of $539,000 and $503,000, respectively, and cost of sales of $332,000 and $296,000, respectively, relatedto performance units.
In connection with the vesting of performance units during the six months ended June 30, 2021 and 2020, 3,881 and 12,877 shares, respectively, with anaggregate fair value of $875,000 and $1.9 million, respectively, were withheld in satisfaction of tax withholding obligations and are reflected as a financing activitywithin the Consolidated Statements of Cash Flows.
Employee Stock Purchase Plan
On April 7, 2009, the Board of Directors of the Company adopted an Employee Stock Purchase Plan (ESPP). The ESPP was approved by the Company’sshareholders and became effective on June 25, 2009. The Company has reserved 1,000,000 shares of common stock for issuance under the ESPP. Unless terminatedby the Board of Directors, the ESPP will expire when all reserved shares have been issued.
Eligible employees may elect to contribute to the ESPP through payroll deductions during consecutive three-month purchase periods, the first of which beganon July 1, 2009. Each employee who elects to participate will be deemed to have been granted an option to purchase shares of the Company’s common stock on thefirst day of the purchase period. Unless the employee opts out during the purchase period, the option will automatically be exercised on the last day of the period,which is the purchase date, based on the employee’s accumulated contributions to the ESPP. The purchase price will equal 85% of the lesser of the closing price pershare of common stock on the first day of the period or the last business day of the period.
Employees may allocate up to 10% of their base compensation to purchase shares of common stock under the ESPP; however, each employee may purchaseno more than 12,500 shares on a given purchase date, and no employee may purchase more than $25,000 of common stock under the ESPP during a given calendaryear.
20

During the six months ended June 30, 2021 and 2020, the Company issued 4,105 and 5,467 shares, respectively, of its common stock under the ESPP,resulting in proceeds of $787,000 and $590,000, respectively.
For the three months ended June 30, 2021 and 2020, the Company recorded charges of $35,000 and $37,000, respectively, to selling, general andadministrative expense, $58,000 and $44,000, respectively, to research and development expense, and $36,000 and $37,000, respectively, to cost of sales related tothe ESPP equal to the amount of the discount and the value of the look-back feature. For the six months ended June 30, 2021 and 2020, the Company recordedcharges of $58,000 and $59,000, respectively, to selling, general and administrative expense, $95,000 and $72,000, respectively, to research and developmentexpense, and $60,000 and $56,000, respectively to cost of sales related to the ESPP equal to the amount of the discount and the value of the look-back feature.
14. SUPPLEMENTAL EXECUTIVE RETIREMENT PLAN:
On March 18, 2010, the Human Capital Committee and the Board of Directors of the Company approved and adopted the Universal Display CorporationSupplemental Executive Retirement Plan (SERP). The SERP is currently unfunded and includes salary and bonus as part of the plan. The purpose of the SERP is toprovide certain of the Company’s key employees with supplemental pension benefits following a cessation of their employment and to encourage their continuedemployment with the Company. As of June 30, 2021, there were seven participants in the SERP.
The Company records amounts relating to the SERP based on calculations that incorporate various actuarial and other assumptions, including discount rates,rate of compensation increases, retirement dates and life expectancies. The net periodic costs are recognized as employees render the services necessary to earn theSERP benefits.
The components of net periodic pension cost were as follows (in thousands):
Three Months Ended June 30, Six Months Ended June 30, 2021 2020 2021 2020
Service cost $ 429 $ 273 $ 857 $ 546 Interest cost 292 321 583 642 Amortization of prior service cost 274 274 549 549 Amortization of loss 1,234 546 2,468 1,091 Total net periodic benefit cost $ 2,229 $ 1,414 $ 4,457 $ 2,828
15. COMMITMENTS AND CONTINGENCIES:
Commitments
Under the 2006 Research Agreement with USC, the Company is obligated to make certain payments to USC based on work performed by USC under thatagreement, and by Michigan under its subcontractor agreement with USC. See Note 9 for further explanation.
Under the terms of the 1997 Amended License Agreement, the Company is required to make minimum royalty payments to Princeton. See Note 9 for furtherexplanation.
The Company has agreements with six executive officers and 12 senior level employees which provide for certain cash and other benefits upon terminationof employment of the officer or employee in connection with a change in control of the Company. If a covered person’s employment is terminated in connectionwith the change in control, the person is entitled to a lump-sum cash payment equal to two times (in the case of the executive officers) or either one or two times (inthe case of the senior level employees) the sum of the average annual base salary and bonus of the person and immediate vesting of all stock options and other equityawards that may be outstanding at the date of the change in control, among other items.
In order to manage manufacturing lead times and help ensure adequate material supply, the Company entered into the New OLED Materials Agreement (seeNote 10) that allows PPG to procure and produce inventory based upon criteria as defined by the Company. These purchase commitments consist of firm,noncancelable and unconditional commitments. In certain instances, this agreement allows the Company the option to reschedule and adjust the Company’srequirements based on its business needs prior to firm orders being placed. As of June 30, 2021 and December 31, 2020, the Company had purchase commitmentsfor inventory of $24.6 million and $13.7 million, respectively.
21
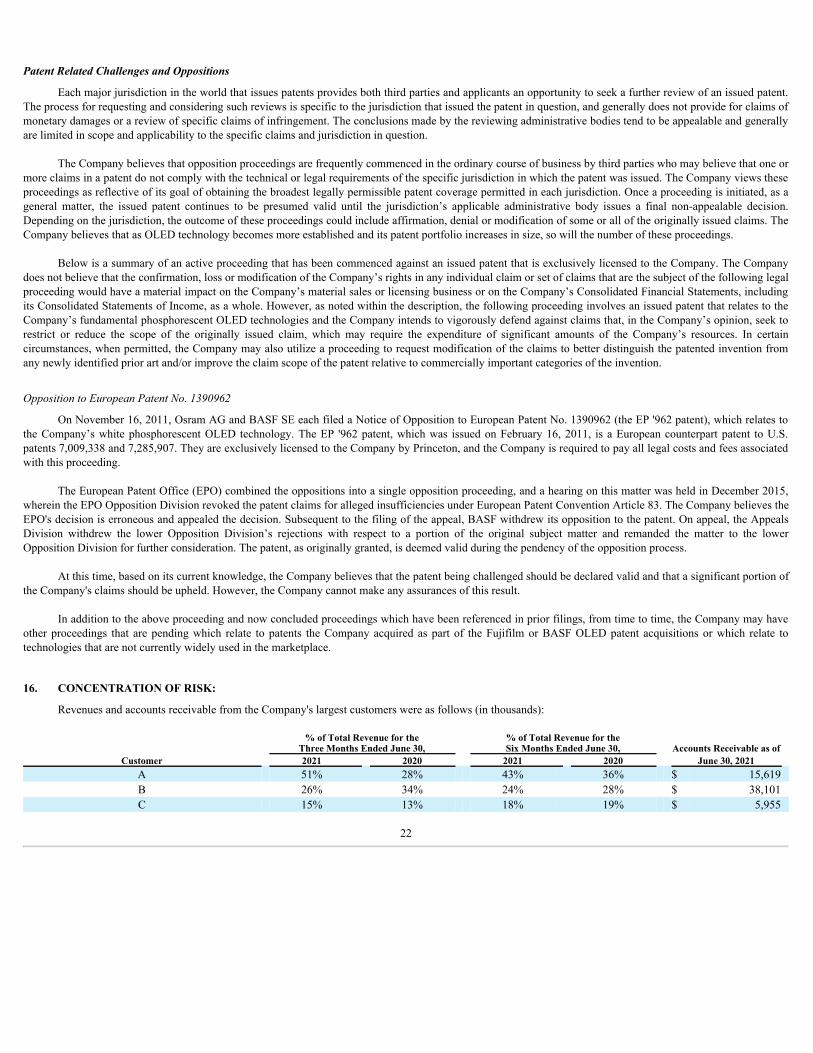
Patent Related Challenges and Oppositions
Each major jurisdiction in the world that issues patents provides both third parties and applicants an opportunity to seek a further review of an issued patent.The process for requesting and considering such reviews is specific to the jurisdiction that issued the patent in question, and generally does not provide for claims ofmonetary damages or a review of specific claims of infringement. The conclusions made by the reviewing administrative bodies tend to be appealable and generallyare limited in scope and applicability to the specific claims and jurisdiction in question.
The Company believes that opposition proceedings are frequently commenced in the ordinary course of business by third parties who may believe that one ormore claims in a patent do not comply with the technical or legal requirements of the specific jurisdiction in which the patent was issued. The Company views theseproceedings as reflective of its goal of obtaining the broadest legally permissible patent coverage permitted in each jurisdiction. Once a proceeding is initiated, as ageneral matter, the issued patent continues to be presumed valid until the jurisdiction’s applicable administrative body issues a final non-appealable decision.Depending on the jurisdiction, the outcome of these proceedings could include affirmation, denial or modification of some or all of the originally issued claims. TheCompany believes that as OLED technology becomes more established and its patent portfolio increases in size, so will the number of these proceedings.
Below is a summary of an active proceeding that has been commenced against an issued patent that is exclusively licensed to the Company. The Companydoes not believe that the confirmation, loss or modification of the Company’s rights in any individual claim or set of claims that are the subject of the following legalproceeding would have a material impact on the Company’s material sales or licensing business or on the Company’s Consolidated Financial Statements, includingits Consolidated Statements of Income, as a whole. However, as noted within the description, the following proceeding involves an issued patent that relates to theCompany’s fundamental phosphorescent OLED technologies and the Company intends to vigorously defend against claims that, in the Company’s opinion, seek torestrict or reduce the scope of the originally issued claim, which may require the expenditure of significant amounts of the Company’s resources. In certaincircumstances, when permitted, the Company may also utilize a proceeding to request modification of the claims to better distinguish the patented invention fromany newly identified prior art and/or improve the claim scope of the patent relative to commercially important categories of the invention.
Opposition to European Patent No. 1390962
On November 16, 2011, Osram AG and BASF SE each filed a Notice of Opposition to European Patent No. 1390962 (the EP '962 patent), which relates tothe Company’s white phosphorescent OLED technology. The EP '962 patent, which was issued on February 16, 2011, is a European counterpart patent to U.S.patents 7,009,338 and 7,285,907. They are exclusively licensed to the Company by Princeton, and the Company is required to pay all legal costs and fees associatedwith this proceeding.
The European Patent Office (EPO) combined the oppositions into a single opposition proceeding, and a hearing on this matter was held in December 2015,wherein the EPO Opposition Division revoked the patent claims for alleged insufficiencies under European Patent Convention Article 83. The Company believes theEPO's decision is erroneous and appealed the decision. Subsequent to the filing of the appeal, BASF withdrew its opposition to the patent. On appeal, the AppealsDivision withdrew the lower Opposition Division’s rejections with respect to a portion of the original subject matter and remanded the matter to the lowerOpposition Division for further consideration. The patent, as originally granted, is deemed valid during the pendency of the opposition process.
At this time, based on its current knowledge, the Company believes that the patent being challenged should be declared valid and that a significant portion ofthe Company's claims should be upheld. However, the Company cannot make any assurances of this result.
In addition to the above proceeding and now concluded proceedings which have been referenced in prior filings, from time to time, the Company may haveother proceedings that are pending which relate to patents the Company acquired as part of the Fujifilm or BASF OLED patent acquisitions or which relate totechnologies that are not currently widely used in the marketplace. 16. CONCENTRATION OF RISK:
Revenues and accounts receivable from the Company's largest customers were as follows (in thousands):
% of Total Revenue for the
Three Months Ended June 30, % of Total Revenue for theSix Months Ended June 30, Accounts Receivable as of
Customer 2021 2020 2021 2020 June 30, 2021 A 51% 28% 43% 36% $ 15,619 B 26% 34% 24% 28% $ 38,101 C 15% 13% 18% 19% $ 5,955
22

Revenues from outside of North America represented approximately 97% and 93% of consolidated revenue for the three months ended June 30, 2021 and2020, respectively, and approximately 97% and 96% for the six months ended June 30, 2021 and 2020, respectively. Revenues by geographic area are as follows (inthousands):
Three Months Ended June 30, Six Months Ended June 30, Country 2021 2020 2021 2020
South Korea $ 86,324 $ 31,062 $ 154,299 $ 100,487 China 36,308 20,508 96,812 58,342 Japan 2,001 2,197 3,316 3,984 Other non-U.S. locations 895 315 1,720 812 Total non-U.S. locations 125,528 54,082 256,147 163,625 United States 4,132 3,886 7,513 6,620 Total revenue $ 129,660 $ 57,968 $ 263,660 $ 170,245
The Company attributes revenue to different geographic areas on the basis of the location of the customer.
Long-lived assets (net), by geographic area are as follows (in thousands):
June 30, 2021 December 31, 2020 United States $ 104,692 $ 93,230 Other 8,495 8,883 Total long-lived assets $ 113,187 $ 102,113
Substantially all chemical materials were purchased from one supplier. See Note 10.
17. INCOME TAXES:
The Company is subject to income taxes in both the United States and foreign jurisdictions. The effective income tax rate was an expense of 19.2% and abenefit of 222.1% for the three months ended June 30, 2021 and 2020, respectively, and an expense of 19.1% and 17.3% for the six months ended June 30, 2021 and2020, respectively. The Company recorded an income tax expense of $9.7 million and a benefit of $562,000 for the three months ended June 30, 2021 and 2020,respectively, and an expense of $21.7 million and $8.1 million for the six months ended June 30, 2021 and 2020, respectively.
In assessing the realizability of deferred tax assets, management considers whether it is more likely than not that some portion or all of the deferred tax assetswill not be realized. The ultimate realization of deferred tax assets is dependent on the Company's ability to generate future taxable income to obtain benefit from thereversal of temporary differences, net operating loss carryforwards and tax credits. As part of its assessment, management considers the scheduled reversal ofdeferred tax liabilities, projected future taxable income, and tax planning strategies. At this time there is no evidence to release the valuation allowance that hashistorically been recorded for the New Jersey research and development credit.
On December 27, 2018 the Korean Supreme Court, citing prior cases, held that the applicable law and interpretation of the Korea-U.S. Tax Treaty were clearthat only royalties paid with respect to Korean registered patents are Korean source income and subject to Korean withholding tax. Based on this decision, theCompany has decided that it will litigate the Korean withholding taxes paid or withheld on the 2018, 2019, 2020 and 2021 royalty payments and has engaged aleading Korean law firm which has advised that there is a more-likely-than-not chance of success. As a result, as of June 30, 2021 and December 31, 2020, theCompany has recorded a long-term asset of $46.6 million and $40.1 million, respectively, representing the allocation of withholding to non-Korean patents and along-term liability of $39.2 million and $32.7 million, respectively, for estimated amounts due to the U.S. Federal government based on the amendment of U.S. taxreturns for lower withholding amounts.
With respect to the Korean withholding for the years 2011 through 2017, the Company has decided to continue the U.S.-Korean Mutual AgreementProcedure which was accepted by the Korean National Tax Service (KNTS) on September 15, 2017. The Company believes that it is more-likely-than-not that afavorable settlement will be reached resulting in a reduction of the Korean withholding taxes previously withheld since 2011. A long-term asset of $36.9 million forestimated refunds due from the Korean government, a long-term payable of $16.2 million for estimated amounts due to the U.S. Federal government based onamendment of prior year U.S. tax returns for the lower withholding amounts, and a reduction of deferred tax assets for foreign tax credits and research anddevelopment credits of $20.7 million has been recorded on the June 30, 2021 and December 31, 2020 Consolidated Balance Sheets for this matter.
23

On October 30, 2018, the KNTS concluded a tax audit with LG Display that included the licensing and royalty payments made to UDC Ireland during theyears 2015 through 2017. The KNTS questioned whether UDC Ireland was the beneficial owner of these payments and assessed UDC Ireland a charge of $13.2million for withholding and interest for the three-year period. UDC Ireland has engaged a leading Korean law firm which believes it is more-likely-than-not thatUDC Ireland has beneficial ownership of the underlying intellectual property. Based on this authority, UDC Ireland has paid the assessment which is recorded as along-term asset as of June 30, 2021 and December 31, 2020. In September 2020, the Korean District Court ruled entirely in the favor of UDC Ireland on thebeneficial ownership issue. However, the KNTS has decided to appeal the ruling to the Korean High Court.
The Company’s federal income tax returns for the years 2017 to 2020 are open and subject to examination. The State of New Jersey is currently auditing the2014 to 2017 tax returns of UDC, Inc. The state and foreign tax returns are open for a period of generally three to four years.
The above estimates may change in the future and upon settlement.
18. REVENUE RECOGNITION:
Effective on January 1, 2018, the Company recognizes revenue in accordance with ASC Topic 606, Revenue from Contracts with Customers (Topic 606).The standard establishes the principles that an entity shall apply to report useful information to users of financial statements about the nature, amount, timing, anduncertainty of revenue and cash flows from a contract with a customer.
For the three months ended June 30, 2021 and 2020, the Company recorded 97% and 94% of its revenue from OLED related sales, respectively, and 3% and6% from the providing of services through Adesis, respectively. For the six months ended June 30, 2021 and 2020, the Company recorded 97% and 96% of itsrevenue from OLED related sales, respectively, and 3% and 4% from the providing of services through Adesis, respectively.
Contract Balances
The following table provides information about assets and liabilities associated with our contracts from customers (in thousands): As of June 30, 2021 Accounts receivable $ 99,629 Short-term unbilled receivables 29,357 Long-term unbilled receivables 100 Short-term deferred revenue 122,978 Long-term deferred revenue 46,174
Short-term and long-term unbilled receivables are classified as other current assets and other assets, respectively, on the Consolidated Balance Sheets. Thedeferred revenue balance at June 30, 2021 will be recognized as materials are shipped to customers over the remaining contract periods. As of June 30, 2021, theCompany had $27.2 million of backlog associated with committed purchase orders from its customers for phosphorescent emitter material. These orders areanticipated to be fulfilled within the next 90 days.
Significant changes in the unbilled receivables and deferred liabilities balances for the six months ended June 30, 2021 and 2020, are as follows (inthousands):
Six Months Ended June 30, 2021 Unbilled Receivables Deferred Revenue Balance at December 31, 2020 $ 10,429 $ (162,301)Revenue recognized that was previously included in deferred revenue — 81,458 Increases due to cash received — (92,816)Cumulative catch-up adjustment arising from changes in estimates of transaction price — 4,507 Unbilled receivables recognized 25,028 — Transferred to receivables from unbilled receivables (6,000) —
Net change 19,028 (6,851)Balance at June 30, 2021 $ 29,457 $ (169,152)
24
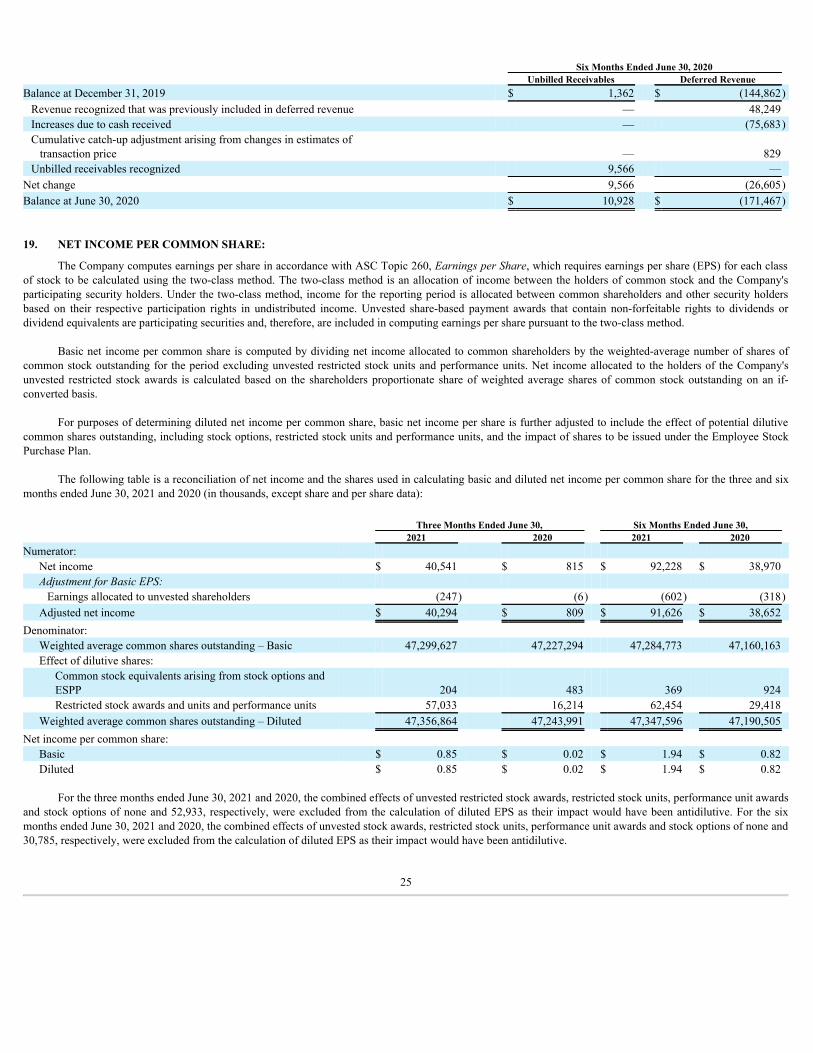
Six Months Ended June 30, 2020 Unbilled Receivables Deferred Revenue Balance at December 31, 2019 $ 1,362 $ (144,862)Revenue recognized that was previously included in deferred revenue — 48,249 Increases due to cash received — (75,683)Cumulative catch-up adjustment arising from changes in estimates of transaction price — 829 Unbilled receivables recognized 9,566 —
Net change 9,566 (26,605)Balance at June 30, 2020 $ 10,928 $ (171,467)
19. NET INCOME PER COMMON SHARE:
The Company computes earnings per share in accordance with ASC Topic 260, Earnings per Share, which requires earnings per share (EPS) for each classof stock to be calculated using the two-class method. The two-class method is an allocation of income between the holders of common stock and the Company'sparticipating security holders. Under the two-class method, income for the reporting period is allocated between common shareholders and other security holdersbased on their respective participation rights in undistributed income. Unvested share-based payment awards that contain non-forfeitable rights to dividends ordividend equivalents are participating securities and, therefore, are included in computing earnings per share pursuant to the two-class method.
Basic net income per common share is computed by dividing net income allocated to common shareholders by the weighted-average number of shares ofcommon stock outstanding for the period excluding unvested restricted stock units and performance units. Net income allocated to the holders of the Company'sunvested restricted stock awards is calculated based on the shareholders proportionate share of weighted average shares of common stock outstanding on an if-converted basis.
For purposes of determining diluted net income per common share, basic net income per share is further adjusted to include the effect of potential dilutivecommon shares outstanding, including stock options, restricted stock units and performance units, and the impact of shares to be issued under the Employee StockPurchase Plan.
The following table is a reconciliation of net income and the shares used in calculating basic and diluted net income per common share for the three and sixmonths ended June 30, 2021 and 2020 (in thousands, except share and per share data):
Three Months Ended June 30, Six Months Ended June 30, 2021 2020 2021 2020
Numerator: Net income $ 40,541 $ 815 $ 92,228 $ 38,970 Adjustment for Basic EPS: Earnings allocated to unvested shareholders (247) (6) (602) (318)
Adjusted net income $ 40,294 $ 809 $ 91,626 $ 38,652 Denominator:
Weighted average common shares outstanding – Basic 47,299,627 47,227,294 47,284,773 47,160,163 Effect of dilutive shares:
Common stock equivalents arising from stock options andESPP
204
483 369 924
Restricted stock awards and units and performance units 57,033 16,214 62,454 29,418 Weighted average common shares outstanding – Diluted 47,356,864 47,243,991 47,347,596 47,190,505
Net income per common share: Basic $ 0.85 $ 0.02 $ 1.94 $ 0.82 Diluted $ 0.85 $ 0.02 $ 1.94 $ 0.82
For the three months ended June 30, 2021 and 2020, the combined effects of unvested restricted stock awards, restricted stock units, performance unit awardsand stock options of none and 52,933, respectively, were excluded from the calculation of diluted EPS as their impact would have been antidilutive. For the sixmonths ended June 30, 2021 and 2020, the combined effects of unvested stock awards, restricted stock units, performance unit awards and stock options of none and30,785, respectively, were excluded from the calculation of diluted EPS as their impact would have been antidilutive.
25

ITEM 2. MANAGEMENT’S DISCUSSION AND ANALYSIS OF FINANCIAL CONDITION AND RESULTS OF OPERATIONS
The following discussion and analysis of our financial condition and results of operations should be read in conjunction with the unaudited ConsolidatedFinancial Statements and related notes above.
CAUTIONARY STATEMENTCONCERNING FORWARD-LOOKING STATEMENTS
This discussion and analysis contains some “forward-looking statements.” Forward-looking statements concern possible or assumed future results ofoperations, including descriptions of our business strategies and customer relationships. These statements often include words such as “believe,” “expect,”“anticipate,” “intend,” “plan,” “estimate,” “seek,” “will,” “may” or similar expressions. These statements are based on assumptions that we have made in light of ourexperience in the industry, as well as our perceptions of historical trends, current conditions, expected future developments and other factors that we believe areappropriate in these circumstances.
As you read and consider this discussion and analysis, you should not place undue reliance on any forward-looking statements. You should understand thatthese statements involve substantial risk and uncertainty and are not guarantees of future performance or results. They depend on many factors that are discussedfurther in the sections entitled (Risk Factors) in our Annual Report on Form 10-K for the year ended December 31, 2020, as supplemented by disclosures in Item 1Aof Part II below. Changes or developments in any of these areas could affect our financial results or results of operations and could cause actual results to differmaterially from those contemplated in the forward-looking statements.
All forward-looking statements speak only as of the date of this report or the documents incorporated by reference, as the case may be. We do not undertakeany duty to update any of these forward-looking statements to reflect events or circumstances after the date of this report or to reflect the occurrence of unanticipatedevents.
OVERVIEW
We are a leader in the research, development and commercialization of organic light emitting diode (OLED) technologies and materials for use in displayapplications, such as mobile phones, televisions, wearables, tablets, portable media devices, notebook computers, personal computers, and automotive applications,as well as specialty and general lighting products. Since 1994, we have been engaged and expect to continue to be primarily engaged, in funding and performingresearch and development activities relating to OLED technologies and materials, and commercializing these technologies and materials. We derive our revenueprimarily from the following:
• sales of OLED materials for evaluation, development and commercial manufacturing;
• intellectual property and technology licensing;
• technology development and support, including third-party collaboration efforts and providing support to third parties for commercializationof their OLED products; and
• contract research services in the areas of chemical materials synthesis research, development and commercialization for non-OLEDapplications.
Material sales relate to our sale of OLED materials for incorporation into our customers’ commercial OLED products or for their OLED development andevaluation activities. Material sales are generally recognized at the time title passes, which is typically at the time of shipment or at the time of delivery, dependingupon the contractual agreement between the parties.
We receive license and royalty payments under certain commercial, development and technology evaluation agreements, some of which are non-refundableadvances. These payments may include royalty and license fees made pursuant to license agreements and also license fees included as part of certain commercialsupply agreements. These payments are included in the estimate of total contract consideration by customer and recognized as revenue over the contract term basedon material units sold at the estimated per unit fee over the life of the contract.
In 2018, we entered into a commercial patent license agreement with Samsung Display Co., Ltd. (SDC). This agreement, which covers the manufacture andsale of specified OLED display materials, was effective as of January 1, 2018 and lasts through the end of 2022 with an additional two-year extension option. Underthis agreement, we are being paid a license fee, payable in quarterly
26
installments over the agreement term of five years. The agreement conveys to SDC the non-exclusive right to use certain of our intellectual property assets for alimited period of time that is less than the estimated life of the assets.
At the same time that we entered into the current commercial license agreement with SDC, we also entered into a material purchase agreement with SDC.Under the material purchase agreement, SDC agrees to purchase from us a minimum amount of phosphorescent emitter materials for use in the manufacture oflicensed products. This minimum commitment is subject to SDC’s requirements for phosphorescent emitter materials and our ability to meet these requirements overthe term of the supplemental agreement.
In 2015, we entered into an OLED patent license agreement and an OLED commercial supply agreement with LG Display Co., Ltd. (LG Display), whichwere effective as of January 1, 2015. The terms of the agreements were set to expire by the end of 2022. The patent license agreement provides LG Display a non-exclusive, royalty bearing portfolio license to make and sell OLED displays under our patent portfolio. The patent license calls for license fees, prepaid royalties andrunning royalties on licensed products. The agreements include customary provisions relating to warranties, indemnities, confidentiality, assignability and businessterms. The agreements provide for certain other minimum obligations relating to the volume of material sales anticipated over the life of the agreements as well asminimum royalty revenue to be generated under the patent license agreement. We generate revenue under these agreements that are predominantly tied to LGDisplay’s sales of OLED licensed products. The OLED commercial supply agreement provides for the sales of materials for use by LG Display, which may includephosphorescent emitters and host materials.
In 2021, we entered into amendments of the OLED patent license agreement and the OLED commercial supply agreement with LG Display, which wereeffective as of January 1, 2021. The amended agreements included a term extension and are set to expire by the end of 2025.
In 2016, we entered into long-term, multi-year OLED patent license and material purchase agreements with Tianma Micro-electronics Co., Ltd. (Tianma).Under the license agreement, we have granted Tianma non-exclusive license rights under various patents owned or controlled by us to manufacture and sell OLEDdisplay products. The license agreement calls for license fees and running royalties on Tianma’s sales of licensed products. Additionally, we supply phosphorescentOLED materials to Tianma for use in its licensed products. On July 21, 2021, the Tianma patent license and material purchase agreements expired. The parties arecurrently working to complete long-term extensions to both agreements.
In 2017, we entered into long-term, multi-year agreements with BOE Technology Group Co., Ltd. (BOE). Under these agreements, we have granted BOEnon-exclusive license rights under various patents owned or controlled by us to manufacture and sell OLED display products. We also supply phosphorescent OLEDmaterials to BOE for use in its licensed products.
In 2018, we entered into long-term, multi-year OLED patent license and material purchase agreements with Visionox Technology, Inc. (Visionox). Under thelicense agreement, we have granted certain of Visionox’s affiliates a non-exclusive license rights under various patents owned or controlled by us to manufactureand sell OLED display products. The license agreement calls for license fees and running royalties on licensed products. Additionally, we supply phosphorescentOLED materials to Visionox for use in its licensed products. On April 22, 2021, we announced an extension of the Visionox agreement by entering into new five-year OLED material supply and license agreements with a new affiliate of Visionox, Visionox Hefei Technology Co. Ltd.
In 2016, we acquired Adesis, Inc. (Adesis) with operations in New Castle, Delaware. Adesis is a contract research organization (CRO) that provides supportservices to the OLED, pharma, biotech, catalysis and other industries. As of June 30, 2021, Adesis employed a team of 114 research scientists, chemists, engineersand laboratory technicians. Prior to our acquisition of Adesis in 2016, we utilized more than 50% of Adesis’ technology service and production output. We continueto utilize a significant portion of its technology research capacity for the benefit of our OLED technology development, and Adesis uses the remaining capacity tooperate as a CRO in the above-mentioned industries by providing contract research services for non-OLED applications to those third-party customers. Contractresearch services revenue is earned by providing chemical materials synthesis research, development and commercialization for non-OLED applications on acontractual basis for those third-party customers.
In June 2020, a wholly-owned subsidiary, OVJP Corporation (OVJP Corp) was formed as a Delaware corporation. Based out of California, OVJP Corp wasfounded to advance the commercialization of our proprietary Organic Vapor Jet Printing (OVJP) technology. As a direct printing technique, OVJP technology hasthe potential to offer high deposition rates for large-area OLEDs. In addition, OVJP technology reduces OLED material waste associated with use of a shadow mask(i.e., the waste of material that deposits on the shadow mask itself when fabricating an OLED). By comparison to inkjet printing, an OVJP process does not useliquid solvents and therefore the OLED materials utilized are not limited by their viscosity or solvent solubility. OVJP also avoids generation of solvent wastes andeliminates the additional step of removing residual solvent from the OLED device. We believe the successful implementation of the OVJP technology has thepotential to increase the addressable market for large-size OLED panels while also serving another potential growth market for our proprietary PHOLED materialsand technologies.
27

In February 2021, we announced the establishment of a new manufacturing site in Shannon, Ireland and an agreement between UDC Ireland Limited andPPG for the production of our OLED materials. The new facility is expected to double our production capacity and allow for the diversification of our manufacturingbase for phosphorescent emitters. We anticipate the facility to be operational by mid-year 2022.
We also generate technology development and support revenue earned from development and technology evaluation agreements and commercializationassistance fees, along with, to a minimal extent, government contracts. Relating to our government contracts, we may receive reimbursements by governmententities for all or a portion of the research and development costs we incur. Revenues are recognized as services are performed, proportionally as research anddevelopment costs are incurred, or as defined milestones are achieved.
We anticipate fluctuations in our annual and quarterly results of operations due to uncertainty regarding, among other factors:
• the timing, cost and volume of sales of our OLED materials;
• the timing of our receipt of license fees and royalties, as well as fees for future technology development and evaluation;
• the timing and magnitude of expenditures we may incur in connection with our ongoing research and development and patent-relatedactivities; and
• the timing and financial consequences of our formation of new business relationships and alliances.
Further, we continue to monitor the impact of COVID-19 on our business. Our global operations, and the global nature of our customer base and theirrespective customers, expose us to risks associated with public health crises, such as pandemics and epidemics. The ongoing COVID-19 pandemic had a substantialimpact on our operations and financial results during the year ended December 31, 2020 and continued to have an impact in the three and six months ended June 30,2021. We expect that as the pandemic continues to evolve, it may potentially have a further adverse impact on our results of operations due to uncertaintiesinvolving the continued disruption of the global economy, uncertainties associated with consumer demand for finished OLED goods, and the potential resultingimpact on our customers and their demand for our phosphorescent emitters.
At this time, the crisis has not had a significant impact on our ability to fulfill shipments of commercial materials as required by our customers. However, thesustainability of maintaining our testing and manufacturing operations at levels needed to meet fluctuating customer demand is uncertain and is dependent upon therapidly evolving situations being encountered by our logistics and supply chain partners. In an effort to protect the health and safety of our employees, we have takenproactive measures to adopt social distancing policies at all of our locations, employing nurses to check everyone entering our buildings, working from home,reducing the number of people in our sites at any one time, and suspending employee travel.
While the ultimate health and economic impact of the COVID-19 pandemic is highly uncertain, we expect that our business operations and results ofoperations, including our revenues, net income and cash flows, will continue to be adversely impacted for at least the second half of 2021, including as a result of:
• temporary closure of electronics and other retail stores through which our customers sell the products for which they use our technology andmaterials;
• consumer confidence and consumer spending habits, including spending for the products that our customers sell and negative trends inconsumer purchasing patterns due to consumers’ disposable income, credit availability and debt levels;
• possible disruption to the supply chain caused by distribution and other logistical issues, which may impact suppliers of our raw materials aswell as our ability to ship our materials to customers on a timely basis;
• decreased productivity due to travel ban, work-from-home policies or shelter-in-place orders;
• a slowdown in the U.S. economy, and uncertain global economic outlook or a credit crisis; and
• uncertain trade restrictions amongst jurisdictions seeking to manage their respective exposure to risks, including the COVID-19 pandemic.
We are focused on navigating these recent challenges presented by COVID-19 through preserving our liquidity and managing our cash flow. We continue toactively monitor the COVID-19 situation and may take further actions altering our business operations that we determine are in the best interests of our employees,customers, partners, suppliers, and stakeholders, or as required by federal, state, or local authorities. It is not clear what the potential effects any such alterations ormodifications may have on our business,
28

including the effects on our customers, employees, and on our financial results for the remainder of the 2021 fiscal year.
RESULTS OF OPERATIONS
Comparison of the Three Months Ended June 30, 2021 and 2020 Three Months Ended June 30, 2021 2020 Increase (Decrease) REVENUE:
Material sales $ 77,438 $ 31,927 $ 45,511 Royalty and license fees 48,212 22,380 25,832 Contract research services 4,010 3,661 349
Total revenue 129,660 57,968 71,692 COST OF SALES 27,969 12,643 15,326
Gross margin 101,691 45,325 56,366 OPERATING EXPENSES:
Research and development 24,101 21,397 2,704 Selling, general and administrative 20,239 16,147 4,092 Amortization of acquired technology and other intangible assets 5,497 5,490 7 Patent costs 1,809 1,858 (49)Royalty and license expense 149 1,618 (1,469)
Total operating expenses 51,795 46,510 5,285 OPERATING INCOME (LOSS) 49,896 (1,185) 51,081
Interest income, net 75 1,268 (1,193)Other income, net 221 170 51
Interest and other income, net 296 1,438 (1,142)INCOME BEFORE INCOME TAXES 50,192 253 49,939 INCOME TAX (EXPENSE) BENEFIT (9,651) 562 (10,213)NET INCOME $ 40,541 $ 815 $ 39,726
Revenue
Our total material sales were $77.4 million for the three months ended June 30, 2021, as compared to $31.9 million for the three months ended June 30,2020, an increase of 143% with a commensurate increase in unit material volume of 145%. The increase in material sales was due to strengthened demand forOLED products utilizing our emitter material, as well as the recovery in sales that were adversely impacted due to the COVID-19 pandemic that occurred during thethree months ended June 30, 2020. Even though we believe we have experienced the worst effects of the COVID-19 pandemic, we remain uncertain as to thepossibility of its re-emergence and corresponding negative impact on OLED market demand.
• Green emitter sales for the three months ended June 30, 2021, which include our yellow-green emitters, were $57.8 million as compared to$24.2 million for the three months ended June 30, 2020, with unit material volumes increasing by 147%.
• Red emitter sales for the three months ended June 30, 2021 were $19.5 million as compared to $7.5 million for the three months ended June30, 2020, with unit material volumes increasing by 140%.
Revenue from royalty and license fees was $48.2 million for the three months ended June 30, 2021 as compared to $22.4 million for the three months endedJune 30, 2020, an increase of 115%, as our customers’ sales of royalty bearing OLED licensed products strengthened, as well as an increase in unit material sales toour customers during the three months ended June 30, 2021.
Contract research services revenue was $4.0 million for the three months ended June 30, 2021 as compared to $3.7 million for the three months ended June30, 2020, an increase of 10%. Revenue from contract research services consists of revenue earned by our subsidiary, Adesis, which provides support services to thepharma, biotech, catalysis and other industries on a contractual basis for those third-party customers.
29

Cost of sales
Cost of sales for the three months ended June 30, 2021 increased by $15.3 million as compared to the three months ended June 30, 2020, primarily due to anincrease in the level of material sales. Included in the cost of sales for the three months ended June 30, 2021 and 2020 was an increase in inventory reserve of$450,000 and none, respectively, due to excess inventory levels in certain products. As a result of the increase in revenue from material sales and royalty and licensefees, gross margin for the three months ended June 30, 2021 increased by $56.4 million as compared to the three months ended June 30, 2020, with gross margin asa percentage of revenue remaining stable at 78%.
Research and development
Research and development expenses increased to $24.1 million for the three months ended June 30, 2021, as compared to $21.4 million for the three monthsended June 30, 2020. The increase in research and development expenses was primarily due to higher employee-related compensation expenses and operating costs,including increased contract research and PPG development activity.
Selling, general and administrative
Selling, general and administrative expenses increased to $20.2 million for the three months ended June 30, 2021, as compared to $16.1 million for the threemonths ended June 30, 2020. The increase in selling, general and administrative expenses was primarily due to higher employee-related compensation expenses.
Amortization of acquired technology and other intangible assets
Amortization of acquired technology and other intangible assets was $5.5 million for both three-month periods ended June 30, 2021 and 2020.
Patent costs
Patent costs decreased to $1.8 million for the three months ended June 30, 2021, as compared to $1.9 million for the three months ended June 30, 2020. Theresults in the current quarter reflected lower internal patent prosecution related costs.
Royalty and license expense
Royalty and license expense decreased to $149,000 for the three months ended June 30, 2021, as compared to $1.6 million for the three months ended June30, 2020. The decrease was due to decreased royalties incurred under our amended license agreement with Princeton, USC and Michigan, resulting from a decreasein qualifying material sales. See Note 9 in Notes to the Consolidated Financial Statements for further discussion.
Interest and other income, net
Interest income, net was $75,000 for the three months ended June 30, 2021, as compared to $1.3 million for the three months ended June 30, 2020. Thedecrease in interest income, net was primarily due to a decrease in bond yields on available-for-sale investments held in the current year over bond yields onavailable-for-sale investments held in the comparable period in 2020. Other income, net primarily consisted of net exchange gains and losses on foreign currencytransactions and rental income. We recorded other income, net of $221,000 for the three months ended June 30, 2021 as compared to $170,000 for the three monthsended June 30, 2020.
Income tax expense
We are subject to income taxes in both the United States and foreign jurisdictions. The effective income tax rate was an expense of 19.2% and a benefit of222.1% for the three months ended June 30, 2021 and 2020, respectively, and we recorded income tax expense of $9.7 million and a benefit of $562,000,respectively, for those periods.
30

Comparison of the Six Months Ended June 30, 2021 and 2020 Six Months Ended June 30, 2021 2020 Increase (Decrease) REVENUE:
Material sales $ 157,246 $ 98,502 $ 58,744 Royalty and license fees 99,098 65,458 33,640 Contract research services 7,316 6,285 1,031
Total revenue 263,660 170,245 93,415 COST OF SALES 51,267 35,102 16,165
Gross margin 212,393 135,143 77,250 OPERATING EXPENSES:
Research and development 47,406 40,894 6,512 Selling, general and administrative 36,643 31,550 5,093 Amortization of acquired technology and other intangible assets 10,985 10,980 5 Patent costs 3,644 3,496 148 Royalty and license expense 261 4,902 (4,641)
Total operating expenses 98,939 91,822 7,117 OPERATING INCOME 113,454 43,321 70,133
Interest income, net 208 3,415 (3,207)Other income, net 280 372 (92)
Interest and other income, net 488 3,787 (3,299)INCOME BEFORE INCOME TAXES 113,942 47,108 66,834 INCOME TAX EXPENSE (21,714) (8,138) (13,576)NET INCOME $ 92,228 $ 38,970 $ 53,258
Revenue
Our total material sales were $157.2 million for the six months ended June 30, 2021, as compared to $98.5 million for the six months ended June 30, 2020,an increase of 60% with a commensurate increase in unit material volume of 56%. The increase in material sales was due to strengthened demand for OLEDproducts utilizing our emitter material, as well as the recovery in sales that were adversely impacted due to the COVID-19 pandemic that occurred during the threemonths ended June 30, 2020. Even though we believe we have experienced the worst effects of the COVID-19 pandemic, we remain uncertain as to the possibilityof its re-emergence and corresponding negative impact on OLED market demand.
• Green emitter sales for the six months ended June 30, 2021, which include our yellow-green emitters, were $118.4 million as compared to$76.7 million for the six months ended June 30, 2020, with unit material volumes increasing by 54%.
• Red emitter sales for the six months ended June 30, 2021 were $38.6 million as compared to $21.4 million for the six months ended June 30,2020, with unit material volumes increasing by 63%.
Revenue from royalty and license fees was $99.1 million for the six months ended June 30, 2021 as compared to $65.5 million for the six months ended June30, 2020, an increase of 51%, as our customers’ sales of royalty bearing OLED licensed products strengthened, as well as an increase in unit material sales to ourcustomers during the six months ended June 30, 2021.
Contract research services revenue was $7.3 million for the six months ended June 30, 2021 as compared to $6.3 million for the six months ended June 30,2020, an increase of 16%. Revenue from contract research services consists of revenue earned by our subsidiary, Adesis, which provides support services to thepharma, biotech, catalysis and other industries on a contractual basis for those third-party customers.
Cost of sales
Cost of sales for the six months ended June 30, 2021 increased by $16.2 million as compared to the six months ended June 30, 2020, primarily due to anincrease in the level of material sales. Included in the cost of sales for the six months ended June 30, 2021 and 2020 was an increase in inventory reserve of $1.1million and $611,000, respectively, due to excess inventory levels in certain products. As a result of the increase in revenue from material sales and royalty andlicense fees, gross margin for the six months ended
31

June 30, 2021 increased by $77.3 million as compared to the six months ended June 30, 2020, with gross margin as a percentage of revenue increasing to 81% from79%.
Research and development
Research and development expenses increased to $47.4 million for the six months ended June 30, 2021, as compared to $40.9 million for the six monthsended June 30, 2020. The increase in research and development expenses was primarily due to higher employee-related compensation expenses and operating costs,including increased contract research and PPG development activity.
Selling, general and administrative
Selling, general and administrative expenses increased to $36.6 million for the six months ended June 30, 2021, as compared to $31.6 million for the sixmonths ended June 30, 2020. The increase in selling, general and administrative expenses was primarily due to higher employee-related compensation expenses.
Amortization of acquired technology and other intangible assets
Amortization of acquired technology and other intangible assets was $11.0 million for both six-month periods ended June 30, 2021 and 2020.
Patent costs
Patent costs increased to $3.6 million for the six months ended June 30, 2021, as compared to $3.5 million for the six months ended June 30, 2020. Theresults in the current year reflected higher internal patent prosecution related costs.
Royalty and license expense
Royalty and license expense decreased to $261,000 for the six months ended June 30, 2021, as compared to $4.9 million for the six months ended June 30,2020. The decrease was due to decreased royalties incurred under our amended license agreement with Princeton, USC and Michigan, resulting from a decrease inqualifying material sales. See Note 9 in Notes to the Consolidated Financial Statements for further discussion.
Interest and other income, net
Interest income, net was $208,000 for the six months ended June 30, 2021, as compared to $3.4 million for the six months ended June 30, 2020. The decreasein interest income, net was primarily due to a decrease in bond yields on available-for-sale investments held in the current year over bond yields on available-for-saleinvestments held in the comparable period in 2020. Other income, net primarily consisted of net exchange gains and losses on foreign currency transactions andrental income. We recorded other income, net of $280,000 for the six months ended June 30, 2021 as compared to $372,000 for the six months ended June 30, 2020.
Income tax expense
We are subject to income taxes in both the United States and foreign jurisdictions. The effective income tax rate was an expense of 19.1% and 17.3% for thesix months ended June 30, 2021 and 2020, respectively, and we recorded income tax expense of $21.7 million and $8.1 million, respectively, for those periods.
Liquidity and Capital Resources
Our principal sources of liquidity are our cash and cash equivalents and our short-term investments. As of June 30, 2021, we had cash and cash equivalentsof $542.9 million and short-term investments of $190.6 million, for a total of $733.5 million. This compares to cash and cash equivalents of $630.0 million andshort-term investments of $100.0 million, for a total of $730.0 million, as of December 31, 2020.
Cash provided by operating activities for the six months ended June 30, 2021 was $59.1 million resulting from $92.2 million of net income and $35.4 milliondue to changes in our operating assets and liabilities, partially offset by a $68.5 million reduction due to non-cash items including amortization of deferred revenue,amortization of intangibles and stock-based compensation. Changes in our operating assets and liabilities related to an increase in deferred revenue of $92.8 millionand an increase in other liabilities of $11.9
32

million, partially offset by an increase in other assets of $20.7 million, an increase in accounts receivable of $17.4 million, a decrease in accounts payable andaccrued expenses of $17.0 million and an increase in inventory of $14.2 million.
Cash provided by operating activities for the six months ended June 30, 2020 was $32.0 million resulting from $39.0 million of net income and $20.0 milliondue to changes in our operating assets and liabilities, partially offset by a $27.0 million reduction due to non-cash items including amortization of deferred revenue,amortization of intangibles and stock-based compensation. Changes in our operating assets and liabilities related to an increase in deferred revenue of $75.7 millionand a decrease in other liabilities of $5.8 million, partially offset by an increase in inventory of $21.2 million, a decrease in accounts payable and accrued expensesof $20.4 million, an increase in other assets of $11.9 million and an increase in accounts receivable of $8.0 million.
Cash used in investing activities was $115.0 million for the six months ended June 30, 2021, as compared to $3.3 million for the six months ended June 30,2020. The increase was due to the timing of maturities and purchases of investments resulting in net purchases of $94.0 million for the six months ended June 30,2021, as compared to net sales of $8.5 million for the six months ended June 30, 2020, and an increase in purchases of intangibles and property, plant and equipmentof $9.2 million for the six months ended June 30, 2021 as compared to the six months ended June 30, 2020. The increase in property, plant and equipment purchasesduring 2021 was primarily due to improvements to our Ewing facilities in New Jersey.
Cash used in financing activities was $31.2 million for the six months ended June 30, 2021, as compared to $26.8 million for the six months ended June 30,2020. The increase was due to an increase in the cash payment of dividends in the current year of $4.8 million, partially offset by an increase in proceeds from theissuance of common stock of $197,000 and a decrease in the payment of withholding taxes related to stock-based compensation to employees of $147,000.
Working capital was $830.3 million as of June 30, 2021, as compared to $759.6 million as of December 31, 2020. The increase was primarily due to anincrease in short-term investments, an increase in other current assets, an increase in accounts receivable and a decrease in accrued expenses, partially offset by adecrease in cash and cash equivalents and an increase in deferred revenue.
We anticipate, based on our internal forecasts and assumptions relating to our operations (including, among others, assumptions regarding our workingcapital requirements, the progress of our research and development efforts, the availability of sources of funding for our research and development work, and thetiming and costs associated with the preparation, filing, prosecution, maintenance, defense and enforcement of our patents and patent applications), that we havesufficient cash, cash equivalents and short-term investments to meet our obligations for at least the next 12 months. However, the extent to which the COVID-19pandemic and our precautionary measures in response thereto may impact our business and thus our liquidity will depend on future developments, which are highlyuncertain and cannot be precisely estimated at this time.
We believe that potential additional financing sources for us include long-term and short-term borrowings, public and private sales of our equity and debtsecurities. It should be noted, however, that additional funding may be required in the future for research, development and commercialization of our OLEDtechnologies and materials, to obtain, maintain and enforce patents respecting these technologies and materials, and for working capital and other purposes, thetiming and amount of which are difficult to ascertain. There can be no assurance that additional funds will be available to us when needed, on commerciallyreasonable terms or at all, particularly in the current economic environment.
Critical Accounting Policies and Estimates
The discussion and analysis of our financial condition and results of operations is based on our Consolidated Financial Statements, which have been preparedin accordance with U.S. generally accepted accounting principles. The preparation of these Consolidated Financial Statements requires us to make estimates andjudgments that affect our reported assets and liabilities, revenues and expenses, and other financial information. Actual results may differ significantly from ourestimates under other assumptions and conditions.
We believe that our accounting policies related to revenue recognition and deferred revenue, inventories, and income taxes are our “critical accountingpolicies” as contemplated by the SEC.
Refer to our Annual Report on Form 10-K for the year ended December 31, 2020, for additional discussion of our critical accounting policies.
Contractual Obligations
Refer to our Annual Report on Form 10-K for the year ended December 31, 2020 for a discussion of our contractual obligations.
33

Off-Balance Sheet Arrangements
As of June 30, 2021, we had no off-balance sheet arrangements in the nature of guarantee contracts, retained or contingent interests in assets transferred tounconsolidated entities (or similar arrangements serving as credit, liquidity or market risk support to unconsolidated entities for any such assets), or obligations(including contingent obligations) arising out of variable interests in unconsolidated entities providing financing, liquidity, market risk or credit risk support to us, orthat engage in leasing, hedging or research and development services with us.
ITEM 3. QUANTITATIVE AND QUALITATIVE DISCLOSURES ABOUT MARKET RISK
We do not utilize financial instruments for trading purposes and hold no derivative financial instruments, other financial instruments or derivative commodityinstruments that could expose us to significant market risk other than our investments disclosed in “Fair Value Measurements” in Note 4 to the ConsolidatedFinancial Statements included herein. We generally invest in investment grade financial instruments to reduce our exposure related to investments. Our primarymarket risk exposure with regard to such financial instruments is to changes in interest rates, which would impact interest income earned on investments. However,based upon the conservative nature of our investment portfolio and current experience, we do not believe a decrease in investment yields would have a materialnegative effect on our interest income.
Substantially all our revenue is derived from outside of North America. All revenue is primarily denominated in U.S. dollars and therefore we bear nosignificant foreign exchange risk.
ITEM 4. CONTROLS AND PROCEDURES
Evaluation of Disclosure Controls and Procedures
Our management, with the participation of our Chief Executive Officer and Chief Financial Officer, evaluated the effectiveness of our disclosure controlsand procedures as of June 30, 2021. Based on that evaluation, the Chief Executive Officer and Chief Financial Officer concluded that our disclosure controls andprocedures, as of the end of the period covered by this report, are effective to provide reasonable assurance that the information required to be disclosed by us inreports filed or submitted under the Securities Exchange Act of 1934, as amended, is (i) recorded, processed, summarized and reported within the time periodsspecified in the SEC’s rules and forms, and (ii) accumulated and communicated to our management, including the Chief Executive Officer and Chief FinancialOfficer, as appropriate to allow timely decisions regarding disclosure. However, a controls system, no matter how well designed and operated, cannot provideabsolute assurance that the objectives of the controls system are met, and no evaluation of controls can provide absolute assurance that all control issues andinstances of fraud, if any, within a company have been detected.
Changes in Internal Control over Financial Reporting
There were no changes in our internal control over financial reporting during the quarter ended June 30, 2021 that have materially affected, or are reasonablylikely to materially affect, our internal control over financial reporting.
PART II – OTHER INFORMATION
ITEM 1. LEGAL PROCEEDINGS
Patent Related Challenges and Oppositions
Each major jurisdiction in the world that issues patents provides both third parties and applicants an opportunity to seek a further review of an issued patent.The process for requesting and considering such reviews is specific to the jurisdiction that issued the patent in question, and generally does not provide for claims ofmonetary damages or a review of specific claims of infringement. The conclusions made by the reviewing administrative bodies tend to be appealable and generallyare limited in scope and applicability to the specific claims and jurisdiction in question.
We believe that opposition proceedings are frequently commenced in the ordinary course of business by third parties who may believe that one or moreclaims in a patent do not comply with the technical or legal requirements of the specific jurisdiction in which the patent was issued. We view these proceedings asreflective of its goal of obtaining the broadest legally permissible patent coverage permitted in each jurisdiction. Once a proceeding is initiated, as a general matter,the issued patent continues to be presumed valid until the jurisdiction’s applicable administrative body issues a final non-appealable decision. Depending on thejurisdiction, the outcome of these proceedings could include affirmation, denial or modification of some or all of the originally issued claims. We believe that asOLED technology becomes more established and its patent portfolio increases in size, so will the number of these proceedings.
34

Below is a summary of an active proceeding that has been commenced against an issued patent that is exclusively licensed to us. We do not believe that theconfirmation, loss or modification of our rights in any individual claim or set of claims that are the subject of the following legal proceeding would have a materialimpact on our material sales or licensing business or on our Consolidated Financial Statements, including our Consolidated Statements of Income, as a whole.However, as noted within the description, the following proceeding involves an issued patent that relates to our fundamental phosphorescent OLED technologies andwe intend to vigorously defend against claims that, in our opinion, seek to restrict or reduce the scope of the originally issued claim, which may require theexpenditure of significant amounts of our resources. In certain circumstances, when permitted, we may also utilize a proceeding to request modification of the claimsto better distinguish the patented invention from any newly identified prior art and/or improve the claim scope of the patent relative to commercially importantcategories of the invention.
Opposition to European Patent No. 1390962
On November 16, 2011, Osram AG and BASF SE each filed a Notice of Opposition to European Patent No. 1390962 (the EP '962 patent), which relates tothe Company’s white phosphorescent OLED technology. The EP '962 patent, which was issued on February 16, 2011, is a European counterpart patent to U.S.patents 7,009,338 and 7,285,907. They are exclusively licensed to us by Princeton, and we are required to pay all legal costs and fees associated with thisproceeding.
The European Patent Office (EPO) combined the oppositions into a single opposition proceeding, and a hearing on this matter was held in December 2015,wherein the EPO Opposition Division revoked the patent claims for alleged insufficiencies under European Patent Convention Article 83. We believe the EPO'sdecision is erroneous and appealed the decision. Subsequent to the filing of the appeal, BASF withdrew its opposition to the patent. On appeal, the Appeals Divisionwithdrew the lower Opposition Division’s rejections with respect to a portion of the original subject matter and remanded the matter to the lower OppositionDivision for further consideration. The patent, as originally granted, is deemed valid during the pendency of the opposition process.
At this time, based on its current knowledge, we believe that the patent being challenged should be declared valid and that a significant portion of our claimsshould be upheld. However, we cannot make any assurances of this result.
In addition to the above proceeding and now concluded proceedings which have been referenced in prior filings, from time to time, we may have otherproceedings that are pending which relate to patents we acquired as part of the Fujifilm patent or BASF OLED patent acquisitions or which relate to technologiesthat are not currently widely used in the marketplace.
ITEM 1A. RISK FACTORS
There have been no material changes to the risk factors previously discussed in Part I, Item 1A “Risk Factors” in our Annual Report on Form 10-K for theyear ended December 31, 2020.
ITEM 2. UNREGISTERED SALES OF EQUITY SECURITIES AND USE OF PROCEEDS
None.
ITEM 3. DEFAULTS UPON SENIOR SECURITIES
None.
ITEM 4. MINE SAFETY DISCLOSURES
Not applicable.
ITEM 5. OTHER INFORMATION
None.
35
ITEM 6. EXHIBITS
The following is a list of the exhibits filed as part of this report. Where so indicated by footnote, exhibits that were previously filed are incorporated byreference. For exhibits incorporated by reference, the location of the exhibit in the previous filing is indicated parenthetically, together with a reference to the filingindicated by footnote.
ExhibitNumber Description
31.1* Certifications of Steven V. Abramson, Chief Executive Officer, as required by Rule 13a-14(a) or Rule 15d-14(a)
31.2* Certifications of Sidney D. Rosenblatt, Chief Financial Officer, as required by Rule 13a-14(a) or Rule 15d-14(a)
32.1**
Certifications of Steven V. Abramson, Chief Executive Officer, as required by Rule 13a-14(b) or Rule 15d-14(b), and by 18 U.S.C. Section 1350.(This exhibit shall not be deemed “filed” for purposes of Section 18 of the Securities Exchange Act of 1934, as amended, or otherwise subject to theliability of that section. Further, this exhibit shall not be deemed to be incorporated by reference into any filing under the Securities Act of 1933, asamended, or the Securities Exchange Act of 1934, as amended.)
32.2**
Certifications of Sidney D. Rosenblatt, Chief Financial Officer, as required by Rule 13a-14(b) or Rule 15d-14(b), and by 18 U.S.C. Section 1350.(This exhibit shall not be deemed “filed” for purposes of Section 18 of the Securities Exchange Act of 1934, as amended, or otherwise subject to theliability of that section. Further, this exhibit shall not be deemed to be incorporated by reference into any filing under the Securities Act of 1933, asamended, or the Securities Exchange Act of 1934, as amended.)
101.INS* Inline XBRL Instance Document – the instance document does not appear in the Interactive Data File because its XBRL tags are embedded withinthe Inline XBRL document.
101.SCH* Inline XBRL Taxonomy Extension Schema Document
101.CAL* Inline XBRL Taxonomy Extension Calculation Linkbase Document
101.DEF* Inline XBRL Taxonomy Extension Definition Linkbase Document
101.LAB* Inline XBRL Taxonomy Extension Label Linkbase Document
101.PRE* Inline XBRL Taxonomy Extension Presentation Linkbase Document
104 The cover page of this Quarterly Report on Form 10-Q for the quarter ended June 30, 2021 formatted in Inline XBRL (included in Item 101.INS)
Explanation of footnotes to listing of exhibits: * Filed herewith.** Furnished herewith.
36

SIGNATURES
Pursuant to the requirements of the Securities Exchange Act of 1934, the registrant has duly caused this report to be signed on its behalf by the undersigned,thereunto duly authorized: UNIVERSAL DISPLAY CORPORATION Date: August 5, 2021 By: /s/ Sidney D. Rosenblatt Sidney D. Rosenblatt Executive Vice President, Chief Financial Officer, Treasurer and Secretary
37

Exhibit 31.1
CERTIFICATIONS REQUIRED BYRULE 13a-14(a)/15d-14(a)
I, Steven V. Abramson, certify that:
1. I have reviewed this quarterly report on Form 10-Q of Universal Display Corporation (the “registrant”) for the quarter ended June 30, 2021;
2. Based on my knowledge, this report does not contain any untrue statement of a material fact or omit to state a material fact necessary to make the statementsmade, in light of the circumstances under which such statements were made, not misleading with respect to the period covered by this report;
3. Based on my knowledge, the financial statements, and other financial information included in this report, fairly present in all material respects the financialcondition, results of operations and cash flows of the registrant as of, and for, the periods presented in this report;
4. The registrant’s other certifying officer(s) and I are responsible for establishing and maintaining disclosure controls and procedures (as defined in Exchange ActRules 13a-15(e) and 15d-15(e)) and internal control over financial reporting (as defined in Exchange Act Rules 13a-15(f) and 15d-15(f)) for the registrant and have:
(a) Designed such disclosure controls and procedures, or caused such disclosure controls and procedures to be designed under our supervision, to ensure thatmaterial information relating to the registrant, including its consolidated subsidiaries, is made known to us by others within those entities, particularly during theperiod in which this report is being prepared;
(b) Designed such internal control over financial reporting, or caused such internal control over financial reporting to be designed under our supervision, toprovide reasonable assurance regarding the reliability of financial reporting and the preparation of financial statements for external purposes in accordance withgenerally accepted accounting principles;
(c) Evaluated the effectiveness of the registrant’s disclosure controls and procedures and presented in this report our conclusions about the effectiveness ofthe disclosure controls and procedures, as of the end of the period covered by this report based on such evaluation; and
(d) Disclosed in this report any change in the registrant’s internal control over financial reporting that occurred during the registrant’s most recent fiscalquarter (the registrant’s fourth fiscal quarter in the case of an annual report) that has materially affected, or is reasonably likely to materially affect, the registrant’sinternal control over financial reporting; and
5. The registrant’s other certifying officer(s) and I have disclosed, based on our most recent evaluation of internal control over financial reporting, to the registrant’sauditors and the audit committee of the registrant’s board of directors (or persons performing the equivalent functions):
(a) All significant deficiencies and material weaknesses in the design or operation of internal control over financial reporting which are reasonably likely toadversely affect the registrant’s ability to record, process, summarize and report financial information; and
(b) Any fraud, whether or not material, that involves management or other employees who have a significant role in the registrant’s internal control overfinancial reporting. Date: August 5, 2021 By: /s/ Steven V. Abramson Steven V. Abramson President and Chief Executive Officer

Exhibit 31.2
CERTIFICATIONS REQUIRED BYRULE 13a-14(a)/15d-14(a)
I, Sidney D. Rosenblatt, certify that:
1. I have reviewed this quarterly report on Form 10-Q of Universal Display Corporation (the “registrant”) for the quarter ended June 30, 2021;
2. Based on my knowledge, this report does not contain any untrue statement of a material fact or omit to state a material fact necessary to make the statementsmade, in light of the circumstances under which such statements were made, not misleading with respect to the period covered by this report;
3. Based on my knowledge, the financial statements, and other financial information included in this report, fairly present in all material respects the financialcondition, results of operations and cash flows of the registrant as of, and for, the periods presented in this report;
4. The registrant’s other certifying officer(s) and I are responsible for establishing and maintaining disclosure controls and procedures (as defined in Exchange ActRules 13a-15(e) and 15d-15(e)) and internal control over financial reporting (as defined in Exchange Act Rules 13a-15(f) and 15d-15(f)) for the registrant and have:
(a) Designed such disclosure controls and procedures, or caused such disclosure controls and procedures to be designed under our supervision, to ensure thatmaterial information relating to the registrant, including its consolidated subsidiaries, is made known to us by others within those entities, particularly during theperiod in which this report is being prepared;
(b) Designed such internal control over financial reporting, or caused such internal control over financial reporting to be designed under our supervision, toprovide reasonable assurance regarding the reliability of financial reporting and the preparation of financial statements for external purposes in accordance withgenerally accepted accounting principles;
(c) Evaluated the effectiveness of the registrant’s disclosure controls and procedures and presented in this report our conclusions about the effectiveness ofthe disclosure controls and procedures, as of the end of the period covered by this report based on such evaluation; and
(d) Disclosed in this report any change in the registrant’s internal control over financial reporting that occurred during the registrant’s most recent fiscalquarter (the registrant’s fourth fiscal quarter in the case of an annual report) that has materially affected, or is reasonably likely to materially affect, the registrant’sinternal control over financial reporting; and
5. The registrant’s other certifying officer(s) and I have disclosed, based on our most recent evaluation of internal control over financial reporting, to the registrant’sauditors and the audit committee of the registrant’s board of directors (or persons performing the equivalent functions):
(a) All significant deficiencies and material weaknesses in the design or operation of internal control over financial reporting which are reasonably likely toadversely affect the registrant’s ability to record, process, summarize and report financial information; and
(b) Any fraud, whether or not material, that involves management or other employees who have a significant role in the registrant’s internal control overfinancial reporting. Date: August 5, 2021 By: /s/ Sidney D. Rosenblatt Sidney D. Rosenblatt Executive Vice President and Chief Financial Officer

Exhibit 32.1
CERTIFICATIONS REQUIRED BYRULE 13a-14(b)/15d-14(b) AND 18 U.S.C. SECTION 1350
In connection with the quarterly report of Universal Display Corporation (the “Company”) on Form 10-Q for the quarter ended June 30, 2021 as filedwith the Securities and Exchange Commission on the date hereof (the “Report”), I, Steven V. Abramson, President and Chief Executive Officer of the Company,hereby certify, based on my knowledge, that:
(1) The Report fully complies with the requirements of section 13(a) or 15(d) of the Securities Exchange Act of 1934; and
(2) The information contained in the Report fairly presents, in all material respects, the financial condition and results of operations of the Company. Date: August 5, 2021 By: /s/ Steven V. Abramson Steven V. Abramson President and Chief Executive Officer

Exhibit 32.2
CERTIFICATIONS REQUIRED BYRULE 13a-14(b)/15d-14(b) AND 18 U.S.C. SECTION 1350
In connection with the quarterly report of Universal Display Corporation (the “Company”) on Form 10-Q for the quarter ended June 30, 2021, as filedwith the Securities and Exchange Commission on the date hereof (the “Report”), I, Sidney D. Rosenblatt, Executive Vice President and Chief Financial Officer ofthe Company, hereby certify, based on my knowledge, that:
(1) The Report fully complies with the requirements of section 13(a) or 15(d) of the Securities Exchange Act of 1934; and
(2) The information contained in the Report fairly presents, in all material respects, the financial condition and results of operations of the Company. Date: August 5, 2021 By: /s/ Sidney D. Rosenblatt Sidney D. Rosenblatt Executive Vice President and Chief Financial Officer