UNITED STATES -...
77
UNITED STATES SECURITIES AND EXCHANGE COMMISSION WASHINGTON, D.C. 20549 FORM 10-K x ANNUAL REPORT PURSUANT TO SECTION 13 OR 15(d) OF THE SECURITIES EXCHANGE ACT OF 1934 For the Fiscal Year Ended September 30, 2018 . ¨ TRANSITION REPORT PURSUANT TO SECTION 13 OR 15(d) OF THE SECURITIES EXCHANGE ACT OF 1934 For the transition period from to Commission File Number 000-10843 CSP Inc. (Exact name of Registrant as specified in its Charter) Massachusetts 04-2441294 (State of incorporation) (I.R.S. Employer Identification No.) 175 Cabot Street, Lowell, Massachusetts 01854 (Address of principal executive offices) (978) 954-5038 (Registrant's telephone number including area code) Securities Registered Pursuant to Section 12(b) of the Act: Title of Each Class Name of Exchange on Which Registered Common Stock, par value $0.01 per share NASDAQ Global Market Securities registered pursuant to Section 12(g) of the Act: None Indicate by check mark if the registrant is a well-known seasoned issuer, as defined in Rule 405 of the Securities Act. Yes ¨ No x Indicate by check mark if the registrant is not required to file reports pursuant to Section 13 or Section 15(d) of the Act. Yes ¨ No x Indicate by check mark whether the registrant (1) has filed all reports required to be filed by Section 13 or 15(d) of the Securities Exchange Act of 1934 during the preceding 12 months (or for such shorter period that the registrant was required to file such reports), and (2) has been subject to such filing requirements for the past 90 days. Yes x No ¨ . Indicate by check mark whether the registrant has submitted electronically every Interactive Data File required to be submitted and posted pursuant to Rule 405 of Regulation S-T (§232.405 of this chapter) during the preceding 12 months (or for such shorter period that the registrant was required to submit such files). Yes x No ¨ . Indicate by check mark if disclosure of delinquent filers pursuant to Item 405 of Regulation S-K(§229.405 of this chapter) is not contained herein, and will not be contained, to the best of registrant's knowledge, in definitive proxy or information statements incorporated by reference in Part III of this Form 10-K or any amendment to this Form 10-K. x Indicate by check mark whether the registrant is a large accelerated filer, an accelerated filer, a non-accelerated filer, a smaller reporting company, or an emerging growth company. See the definitions of “large accelerated filer”, “accelerated filer”, “smaller reporting company”, and "emerging growth company" in Rule 12b-2 of the Exchange Act. Large accelerated filer ¨ Accelerated filer ¨ Non-accelerated filer x Smaller Reporting Company x Emerging Growth Company ¨ If an emerging growth company, indicate by check mark if the registrant has elected not to use the extended transition period for complying with any new or revised financial accounting standards provided pursuant to Section 13(a) of the Exchange Act. ¨ Indicate by check mark whether the registrant is a shell company (as defined in Rule 12b-2 of the Exchange Act). Yes ¨ No x As of March 29, 2018, the aggregate market value of the registrant's common stock held by non-affiliates of the registrant was $38,586,781 based on the closing sale price of $10.75 as reported on the Nasdaq Global Market. As of December 26, 2018, we had outstanding 4,019,254 shares of common stock. DOCUMENTS INCORPORATED BY REFERENCE Certain portions of the information required in Part III of this Form 10-K are incorporated by reference from our definitive proxy statement for our 2019 annual meeting of stockholders to be filed with the Securities and Exchange Commission within 120 days after the end of our fiscal year ended September 30, 2018 .
Transcript of UNITED STATES -...
UNITED STATESSECURITIES AND EXCHANGE COMMISSION
WASHINGTON, D.C. 20549
FORM 10-K
xx ANNUAL REPORT PURSUANT TO SECTION 13 OR 15(d) OF THE SECURITIES EXCHANGE ACT OF 1934
For the Fiscal Year Ended September 30, 2018 .
¨ TRANSITION REPORT PURSUANT TO SECTION 13 OR 15(d) OF THE SECURITIES EXCHANGE ACT OF 1934
For the transition period from to
Commission File Number 000-10843
CSP Inc.(Exact name of Registrant as specified in its Charter)
Massachusetts 04-2441294(State of incorporation) (I.R.S. Employer Identification No.)
175 Cabot Street, Lowell, Massachusetts 01854(Address of principal executive offices)
(978) 954-5038(Registrant's telephone number including area code)
Securities Registered Pursuant to Section 12(b) of the Act:
Title of Each Class
Name of Exchange on Which Registered
Common Stock, par value $0.01 per share NASDAQ Global Market
Securities registered pursuant to Section 12(g) of the Act:None
Indicate by check mark if the registrant is a well-known seasoned issuer, as defined in Rule 405 of the Securities Act. Yes ¨ No x
Indicate by check mark if the registrant is not required to file reports pursuant to Section 13 or Section 15(d) of the Act.Yes ¨ No x
Indicate by check mark whether the registrant (1) has filed all reports required to be filed by Section 13 or 15(d) of the Securities Exchange Act of 1934 during thepreceding 12 months (or for such shorter period that the registrant was required to file such reports), and (2) has been subject to such filing requirements for the past 90days. Yes x No ¨.
Indicate by check mark whether the registrant has submitted electronically every Interactive Data File required to be submitted and posted pursuant to Rule 405 ofRegulation S-T (§232.405 of this chapter) during the preceding 12 months (or for such shorter period that the registrant was required to submit such files). Yes x No ¨.
Indicate by check mark if disclosure of delinquent filers pursuant to Item 405 of Regulation S-K(§229.405 of this chapter) is not contained herein, and will not becontained, to the best of registrant's knowledge, in definitive proxy or information statements incorporated by reference in Part III of this Form 10-K or any amendment to thisForm 10-K. x
Indicate by check mark whether the registrant is a large accelerated filer, an accelerated filer, a non-accelerated filer, a smaller reporting company, or an emerging growthcompany. See the definitions of “large accelerated filer”, “accelerated filer”, “smaller reporting company”, and "emerging growth company" in Rule 12b-2 of the Exchange Act.
Large accelerated filer ¨ Accelerated filer ¨Non-accelerated filer x Smaller Reporting Company x
Emerging Growth Company ¨
If an emerging growth company, indicate by check mark if the registrant has elected not to use the extended transition period for complying with any new or revisedfinancial accounting standards provided pursuant to Section 13(a) of the Exchange Act. ¨
Indicate by check mark whether the registrant is a shell company (as defined in Rule 12b-2 of the Exchange Act). Yes ¨ No x
As of March 29, 2018, the aggregate market value of the registrant's common stock held by non-affiliates of the registrant was $38,586,781 based on the closing sale priceof $10.75 as reported on the Nasdaq Global Market.
As of December 26, 2018, we had outstanding 4,019,254 shares of common stock.
DOCUMENTS INCORPORATED BY REFERENCE
Certain portions of the information required in Part III of this Form 10-K are incorporated by reference from our definitive proxy statement for our 2019 annual meetingof stockholders to be filed with the Securities and Exchange Commission within 120 days after the end of our fiscal year ended September 30, 2018 .
TABLE OF CONTENTS
Page PART I. Item 1. Business 1Item 1A. Risk Factors 9Item 2. Properties 17Item 3. Legal Proceedings 17Item 4. Mine Safety Disclosures 17
PART II. Item 5. Market for Registrant's Common Equity, Related Stockholder Matters and Issuer Purchases of Equity Securities 17Item 7. Management's Discussion and Analysis of Financial Condition and Results of Operations 18Item 8. Financial Statements and Supplementary Data 28Item 9. Change in and Disagreements with Accountants on Accounting and Financial Disclosures 28Item 9A. Controls and Procedures 28Item 9B. Other Information 30
PART III. Item 10. Directors, Executive Officers and Corporate Governance 30Item 11. Executive Compensation 30Item 12. Security Ownership of Certain Beneficial Owners and Management and Related Stockholder Matters 30Item 13. Certain Relationships and Related Transactions and Director Independence 31Item 14. Principal Accountant Fees and Services 31
PART IV. Item 15. Exhibits and Financial Statement Schedules 31Item 16. Form 10-K Summary 32
Note: Items 1B, 6 and 7A are not required for Smaller Reporting Companies and therefore are not furnished.
i
Special Note Regarding Forward-Looking Statements
This annual report on Form 10-K contains forward-looking statements within the meaning of Section 27A of the Securities Act of 1933, as amended, andSection 21E of the Securities Exchange Act of 1934, as amended. This information may involve known and unknown risks, uncertainties and other factors that aredifficult to predict and may cause our actual results, performance or achievements to be materially different from future results, performance or achievementsexpressed or implied by any forward-looking statements. The discussion below contains certain forward-looking statements related but not limited to, amongothers, statements concerning future revenues and future business plans. Forward-looking statements include statements in which we use words such as “expect,”“believe,” “anticipate,” “intend,” “estimate,” “should,” “could,” “may,” “plan,” “potential,” “predict,” “project,” “will,” “would” and similar expressions.Although we believe the expectations reflected in such forward-looking statements are based on reasonable assumptions, the forward-looking statements aresubject to significant risks and uncertainties, and thus we cannot assure you that these expectations will prove to be correct, and actual results may vary fromthose contained in such forward-looking statements. We discuss many of these risks and uncertainties in Item 1A under the heading “Risk Factors” in this AnnualReport.
Factors that may cause such variances include, but are not limited to, our dependence on a small number of customers for a significant portion of ourrevenue, our high dependence on contracts with the U.S. federal government, our reliance in certain circumstances on single sources for supply of key productcomponents, and intense competition in the market segments in which we operate. Given these uncertainties, you should not place undue reliance on theseforward-looking statements. Also, forward-looking statements represent our estimates and assumptions only as of the date of this document. We have based theforward-looking statements included in this annual report on Form 10-K on information available to us on the date of this annual report, and we assume noobligation to update any such forward-looking statements, other than as required by law.
PART I Item 1. Business
CSP Inc. ("CSPi" or "CSPI" or "the Company" or "we" or "our") was incorporated in 1968 and is based in Lowell, Massachusetts. To meet the diverserequirements of our commercial and defense customers worldwide, CSPi and its subsidiaries develop and market IT integration solutions, advanced securityproducts, managed IT services, purpose built network adapters, and high-performance cluster computer systems.
On July 31, 2018, CSPi LTD sold all of the outstanding stock of Modcomp GmbH for $14.4 million cash, and recognized a gain of $16.8 million. Thedivestiture of our German operations and our increased cash position will enable us to focus time and resources on our higher-margin and greater-potential growthopportunities. We are encouraged by the traction of our managed services business in the U.S. and we intend to continue to invest and focus on our new ARIASDS cyber security products and to capitalize on the proliferation of our wireless service business.
Segments
CSPI operates in two segments; High Performance Products ("HPP") and Technology Solutions ("TS"). HPP Segment
• The HPP segment revenue comes from four distinct product lines: (i) a cyber security product named ARIA™ Software-Defined Security ("SDS"), whichis offered to commercial, original equipment manufacturers ("OEM") and government customers; (ii) the Myricom ® ARC Series of 10G Ethernetadapters for both the commercial and government customers; (iii) the Myricom nVoy Series of appliances for OEMs and end-user customers; and (iv) theMulticomputer product portfolio of computing systems for digital signal processing ("DSP") applications within the defense markets.
• The ARIA SDS solution is a new portfolio of software products (an orchestrator, light-weight instances, and hosted applications) that protect anorganization’s critical high-value data, such as personally identifiable information ("PII"), from breaches. Revenue from ARIA will come from the sale ofthe platform components, hosted software
1
applications, and required support packages, all of which will be renewed on an annual basis. ARIA can be deployed on commercially available serversacross an organization’s enterprise, as well as on the latest generation of Myricom adapters.
• We anticipate that ARIA will be of value to regulated industries, such as financial services or healthcare, due to the rise of data privacy regulationsenforced by federal, state, and industry entities. We also believe the patent-pending ARIA SDS solution will be attractive to value-added service providersand OEMs that pursue differentiated security services for their customers. While initial offerings of ARIA applications are planned for revenue shipmentin fiscal year 2019, the number of applications will continue to be expanded over time.
• The Myricom ARC Series of 10G network adapters are optimized for and sold into markets that require high bandwidth and low latency: (i) packetcapture, (ii) financial transactions, and (iii) the storage interconnect market. Our primary customers for packet capture include government agencies thatneed to capture, inject, and analyze network traffic at line rate, and OEMs selling into vendors of computer security appliances. Financial institutions,such as banks, and brokerage firms use Myricom adapters to decrease transaction times. Our storage interconnect customers, primarily in the filmindustry, use our adapters for video capture and film editing.
• The Myricom nVoy Series of appliances (Packet Recorder and Packet Broker) can be deployed as part of an organization’s data security structure as anew component to complement existing systems, and provides data breach verification and notification as well as compliance reporting. The primarycustomers will be OEMs and value- added services providers that are looking to expand their product and services offerings of industry regulationcompliance and breach response solutions.
• Multicomputer products for DSP applications are utilized by domestic and foreign government entities for existing programs. In 2016, the Companydecided not to participate in the next generation of defense programs. Revenue flows come from servicing the existing product line for a modest numberof existing high-value customers. Therefore, the revenue from these products, as a percentage of overall Company revenue, is expected to decline overtime.
TS Segment
• The TS segment consists of our wholly-owned Modcomp subsidiary, which operates in the United States and the United Kingdom.
• The TS segment generates product revenues by reselling third-party computer hardware and software as a value added reseller ("VAR"). The TSsegment generates service revenues by the delivery of integration services for complex IT environments, including advanced security; unifiedcommunications and collaboration; wireless and mobility; data center solutions; and network solutions as well as managed IT services ("MSP") thatprimarily serve the small and mid-sized business market ("SMB").
• Third party products and professional services are marketed and sold through the Company's direct sales force into a variety of vertical markets,including; automotive; defense; health care; education; federal, state and local government; and maritime.
• CSPi sold all of the outstanding stock of Modcomp GmbH to Reply AG on July 31, 2018 for total cash consideration of $14.4 million. CSP recognized aone-time gain of $16.8 million. The Company determined the German subsidiary met the criteria for discontinued operations under ASC 205. TheConsolidated Balance Sheets and Consolidated Statements of Operations reflect the results of Modcomp GmbH classified as discontinued operations atand as of September 30, 2018 and 2017. See Note 2 to the consolidated financial statements for additional information.
Sales Information by Industry Segment
The following table details our sales by operating segment for fiscal years ending September 30, 2018 and 2017 . Additional segment and geographicalinformation is set forth in Note 15 to the consolidated financial statements.
2
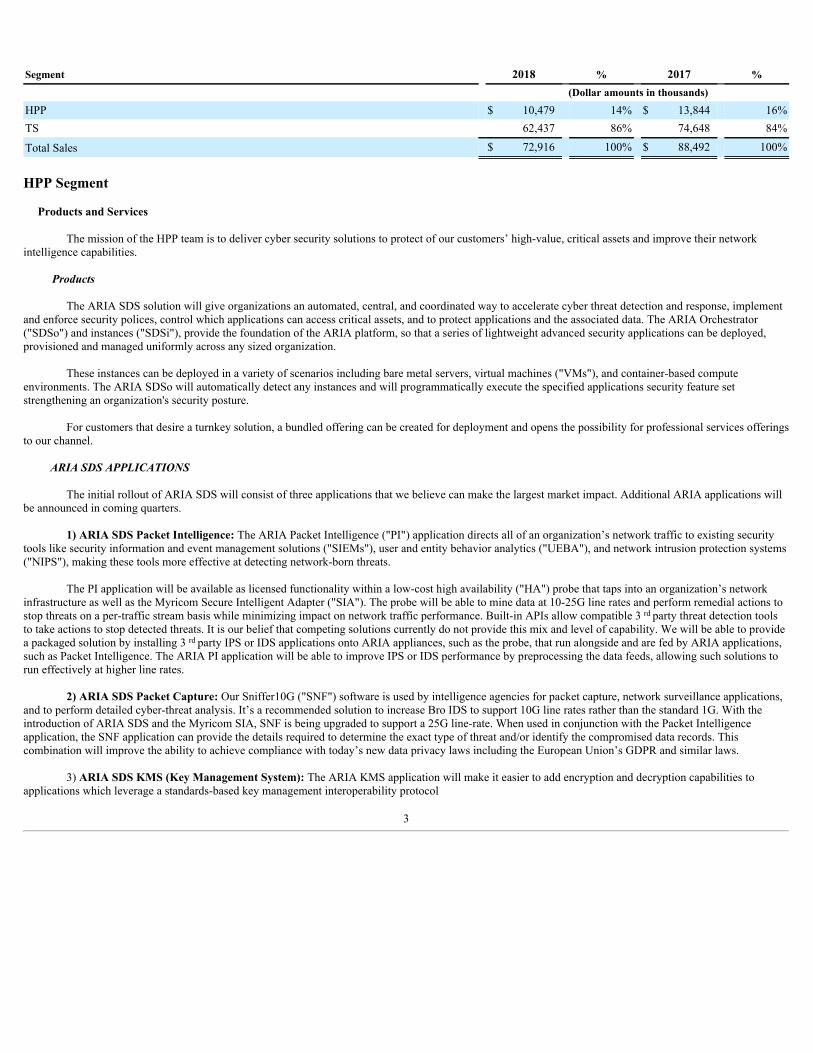
Segment 2018 % 2017 %
(Dollar amounts in thousands)
HPP $ 10,479 14% $ 13,844 16%TS 62,437 86% 74,648 84%
Total Sales $ 72,916 100% $ 88,492 100% HPP Segment
Products and Services
The mission of the HPP team is to deliver cyber security solutions to protect of our customers’ high-value, critical assets and improve their networkintelligence capabilities.
Products
The ARIA SDS solution will give organizations an automated, central, and coordinated way to accelerate cyber threat detection and response, implementand enforce security polices, control which applications can access critical assets, and to protect applications and the associated data. The ARIA Orchestrator("SDSo") and instances ("SDSi"), provide the foundation of the ARIA platform, so that a series of lightweight advanced security applications can be deployed,provisioned and managed uniformly across any sized organization.
These instances can be deployed in a variety of scenarios including bare metal servers, virtual machines ("VMs"), and container-based computeenvironments. The ARIA SDSo will automatically detect any instances and will programmatically execute the specified applications security feature setstrengthening an organization's security posture.
For customers that desire a turnkey solution, a bundled offering can be created for deployment and opens the possibility for professional services offeringsto our channel.
ARIA SDS APPLICATIONS
The initial rollout of ARIA SDS will consist of three applications that we believe can make the largest market impact. Additional ARIA applications willbe announced in coming quarters.
1) ARIA SDS Packet Intelligence: The ARIA Packet Intelligence ("PI") application directs all of an organization’s network traffic to existing securitytools like security information and event management solutions ("SIEMs"), user and entity behavior analytics ("UEBA"), and network intrusion protection systems("NIPS"), making these tools more effective at detecting network-born threats.
The PI application will be available as licensed functionality within a low-cost high availability ("HA") probe that taps into an organization’s networkinfrastructure as well as the Myricom Secure Intelligent Adapter ("SIA"). The probe will be able to mine data at 10-25G line rates and perform remedial actions tostop threats on a per-traffic stream basis while minimizing impact on network traffic performance. Built-in APIs allow compatible 3 rd party threat detection toolsto take actions to stop detected threats. It is our belief that competing solutions currently do not provide this mix and level of capability. We will be able to providea packaged solution by installing 3 rd party IPS or IDS applications onto ARIA appliances, such as the probe, that run alongside and are fed by ARIA applications,such as Packet Intelligence. The ARIA PI application will be able to improve IPS or IDS performance by preprocessing the data feeds, allowing such solutions torun effectively at higher line rates.
2) ARIA SDS Packet Capture: Our Sniffer10G ("SNF") software is used by intelligence agencies for packet capture, network surveillance applications,and to perform detailed cyber-threat analysis. It’s a recommended solution to increase Bro IDS to support 10G line rates rather than the standard 1G. With theintroduction of ARIA SDS and the Myricom SIA, SNF is being upgraded to support a 25G line-rate. When used in conjunction with the Packet Intelligenceapplication, the SNF application can provide the details required to determine the exact type of threat and/or identify the compromised data records. Thiscombination will improve the ability to achieve compliance with today’s new data privacy laws including the European Union’s GDPR and similar laws.
3) ARIA SDS KMS (Key Management System): The ARIA KMS application will make it easier to add encryption and decryption capabilities toapplications which leverage a standards-based key management interoperability protocol
3
("KMIP") client. For example, each of VMware’s vSphere and vSAN instances leverage a KMIP client to encrypt their application data output. As such, they needto be fed a KMIP compatible key to perform encryption. Depending upon the size of the environment, this could require thousands of keys. Our KMS keymanagement server solution provides such KMIP keys securely and rapidly at scale while ensuring that the servers are highly available at all times. Our applicationwas designed to solve the deployment complexity challenges currently associated with key management.
MYRICOM ARC SERIES
Our Myricom ARC Series product line includes a portfolio of Ethernet adapters and specialized software, which is branded as DBL for financialinstitutions and Sniffer10G ("SNF") for network monitoring. Both are compatible with Linux, Windows, Mac OS X, and VMware ESX. Our legacy generation of10G ARC Series adapters are primarily used by media editors, especially those that use Avid ® MediaCentral™ Platform, as stand-alone Network Interface Cards("NIC"). Our most current ARC Series adapters, also 10G, are purpose-built for applications that require high bandwidth, low latency and line-rate packet capturesuch as high-frequency financial trading and network traffic analysis.
The 25G Myricom ARC Series Secure Intelligent Adapter ("SIA") is our next-generation adapter and will provide additional compute capabilities and
specialized hardware to run the ARIA SDS platform and applications. A 25G version of SNF is being developed to deliver higher line rates as required byenterprise and government customers. This will also let these organizations achieve lossless packet capture and packet inspection, which is required for networksurveillance use cases and tools, such as lawful intercept, deep packet inspection, forensic tools, and threat detection applications. Other customers for the SIAinclude OEMs and MSSP partners to run their own applications upon.
Packet Broker and Packet Recorder: Also sold under the Myricom brand, the nVoy Series is comprised of a 100G Packet Broker, a 10G PacketRecorder appliance, and specialized software. These tools assist customers in the monitoring of specified critical assets and automatically verify data breaches andalert the appropriate teams, thus reducing overall breach response time. We believe that the automated breach notification capabilities found in nVoy are bestsuited for regulated industries such as banking, finance, healthcare, insurance, retail, and state and local government ("SLED"), all of which are under pressure tocomply with data privacy regulations. The nVoy’s capabilities complement our ARIA SDS solution and can be deployed as a solution for network and/or datasecurity forensics and regulatory compliance.
MULTICOMPUTER PRODUCTS
Our Multicomputer product portfolio includes the 2000 SERIES VME and 3000 SERIES VXS systems. The 2000 SERIES products, based onPowerPC RISC processors with AltiVec™ technology, high-speed memory, and Myrinet-2000™ cluster interconnect, are currently is use by customers in theaerospace, commercial, and defense markets. The 3000 SERIES VXS product line, incorporating the Freescale QorIQ PowerPC processors with AltiVectechnology, targets high-performance DSP, signal intelligence ("SIGINT"), and radar and sonar applications in airborne, shipboard, and unmanned aerial vehicle("UAV") platforms where space, power, and cooling are at a premium. The HPP segment continues to ship and repair existing Multicomputer products to itscustomer base and support an installed base of DSP systems.
Royalties
We license the design of certain 2000 SERIES computer processor boards and switch interconnect technology to third parties. In exchange for licensingthis technology, we receive a royalty payment for each processor board that utilizes our design for these products.
Markets, Marketing and Dependence on Certain Customers
Aerospace & Defense Market
Our focus for fiscal 2019 and beyond is to continue our support of established Multicomputer and Myricom products allowing system deployments to bemade by government entities. These programs have support requirements that often extend beyond twenty years.
Financial Transactions Market
Myricom network adapters with DBL application software address the need for the ultra-low latency required in the world of financial trading. RunningDBL on the Myricom ARC Series provides acceleration for 10G Ethernet environments,
4
with benchmarked application-to-application latency in the single digit microsecond range for Linux and Microsoft Windows operating systems.
Packet Capture Market
Myricom Sniffer10G, and in development, the 25G software, running on ARC Series Ethernet adapters, provides enterprise and government customersand partners the ability to capture, inject, and analyze network traffic at line rate for all Ethernet packet sizes, with low-cost CPU overhead. Sniffer10G serves thefollowing market segments: network surveillance, monitoring and analysis, testing, measurement, and packet generation, as well as deep packet inspection ("DPI").The ARC series is a technology component within intrusion detection systems ("IDS"), forensic tools, and threat detection and response solutions.
Storage Interconnect Market
Myricom ARC Series network adapters are used in a wide range of networked applications, including those that connect to storage subsystems usingEthernet. Many of these customers are using content-creation applications requiring high-performance networking from the storage system to video-editingworkstations. We also have customers in the supercomputing market and building cable head ends for video distribution. These adapters, in conjunction with theMyri10GE software, deliver best-in-class throughput performance for Ethernet controllers.
Security Products Market
The ARIA SDS solution is targeted at organizations that need to get additional functionality out of their current cyber security solutions to find and stopintrusion threats, while also reducing their operating costs. While our ARIA SDS solutions will be offered through our direct sales channel, it is more likely thatsales will come through via independent software vendor channels to the end customers.
OEMs in the applications performance management ("APM"), as well as the cyber security segments will be candidates for ARIA deployments. Thesevendors can benefit from integrating the ARIA applications as internal solution toolsets to allow their application to scale, add critical functionality, or solveparticular problems, such as poor performance.
Another target for ARIA will be the managed security services providers, as these providers desire simple, yet differentiated, solutions that can bedeployed across their customer bases. The orchestration and automation capabilities found in ARIA SDS are valuable as they allow these security service providersto scale their offerings while increasing the productivity of their security operation center staff.
It is expected that the Myricom nVoy solution will be used by information security resources who desire a new approach to quickly validate and benotified of a data breach to minimize breach impact and to meet compliance regulations. This is appealing due to the changing regulatory climate that requiresresponse to breaches within a few days. The nVoy solution can further reduce that time and provide proof of the records breached by leveraging the ARIAapplications. Value added resellers will find nVoy appealing to expand their portfolio of security products and services and replace less-effective tools andprocesses in their customer environments.
Competition
CSPi’s completion in the security space comes primarily from the large, traditional security vendors like Dell, IBM, and to a lesser degree, Intel. Due tothe ARIA’s approach to network and data security, we also face competition from traditional security tools and best practices approaches to breaches such as threathunting, breach detection, and breach prevention. The competition includes common firewall manufacturers such as Palo Alto or Cisco, and in the case of datapacket brokers, Gigamon and Ixia. Competitors for ARIA SDS encryption include applications and appliances provided by Thales, HPE’s Voltaic group, and othersmaller market players.
In the crowded security products market, our history of supporting defense and government military programs, strong security application expertise, andthe ability to develop optimized products for OEMs will help set us apart. However, we must continually develop new features and solutions to stay abreast ofevolving customer requirements and leverage advances in technology. One example is Intel’s chip-level roadmap that may provide additional functionality for ourARIA SDS solution but our competitors could also attempt to leverage this. Some of these competitors may also be potential go-to-market partners or OEMcustomers looking to integrate our capabilities within their products and solutions.
5
Customers who need a combination of advanced data protection features and who require optimized application performance are best suited to the ARIAsolution. Security adapter products will also leverage previous generation Myricom ARC Series network adapter capabilities that include advanced filtering,support for kernel bypass technologies, lossless packet capture, and precision time stamping. These new capabilities will offer a variety of security servicecombinations that our customers can put to use.
Manufacturing, Assembly and Testing
Currently, all Multicomputer products are shipped to our customers directly from our plant in Lowell, Massachusetts. Our manufacturing activities consistmainly of final assembly and testing of printed circuit boards and systems that are designed by us and fabricated by outside third-party vendors.
Upon our receipt of material and components from outside suppliers, our quality assurance technicians inspect these products and components. Duringmanufacture and assembly, both sub-assemblies and completed systems are subjected to extensive testing, including burn-in and environmental stress screeningdesigned to minimize equipment failure at delivery and over the useful service life of the system. We also use diagnostic programs to detect and isolate potentialcomponent failures. A comprehensive log is maintained of past failures to monitor the ongoing reliability of our products and improve design standards.
Currently, Myricom products, including the nVoy appliances and ARC Series adapters, are shipped to our customers directly from our plant in Lowell,Massachusetts. The packet recorder and packet broker appliances are sourced from third-party partners, integrated with CSPi software and resold under the CSPibrand. Our network adapters are designed in-house and fabricated by outside third party vendors. Material and components received from outside suppliers areinspected by our quality assurance technicians.
The ARIA SDS solution (platform and applications) will be downloaded and licensed from servers or content-delivery services directly controlled byCSPi. The ARIA software can be sold in conjunction with the SIA, or our appliances, which may be preloaded with the appropriate images. Licensing will behandled by the ARIA SDSo which will be accessible by CSPi’s licensing severs to allow proper flexible services feature set activation and payment.
We provide a warranty covering defects arising from the sale of Multicomputer and Myricom products, which varies from 90 days to three years,depending upon the particular unit in question.
Sources and Availability of Raw Materials
Several components used in our HPP segment products are obtained from sole-source suppliers. We are dependent on key vendors such as Xilinx or NXPfor a variety of processors for certain products and Wind River Systems, Inc. for VxWorks operating system software. Despite our dependence on these sole-sourcesuppliers, based on our current forecast and our projected sales obligations, we believe we have adequate inventory on hand and our current near-term requirementscan be met in the existing supply chain.
Research and Development
For the year ended September 30, 2018, our expenses for R&D were approximately $3.3 million compared to approximately $2.4 million for fiscal year2017. Expenditures for R&D are expensed as they are incurred. Product development efforts in fiscal year 2018 involved development of the ARIA SDS productset, and enhancements to our Myricom products, in which we expect to continue to make investments related to the development of new hardware adapter productsand the ARIA SDS software that enables the hardware to meet the needs of specific applications. Our current R&D plan is intended to extend the usefulness andmarketability of these products by adding features and capabilities to meet the needs of our markets.
Intellectual Property
We rely on a combination of trademark and trade secret laws in the United States and other jurisdictions, as well as confidentiality procedures andcontractual provisions to protect our intellectual property rights. We have two pending patents for the ARIA software and will be pursuing additional patent rightsover time.
Backlog
6
The backlog of customer orders and contracts in the HPP segment was approximately $1.0 million at September 30, 2018 as compared to $0.8 million atSeptember 30, 2017 . Our backlog can fluctuate greatly. These possible large fluctuations can be due to the timing of receipt of large orders often for purchasesfrom prime contractors for sales to the government. It is expected that all of the customer orders in backlog will ship within the next twelve months fromSeptember 30, 2018.
TS Segment
Products and Services
Integration Solutions
In the TS segment, we focus on value-added reseller ("VAR") integrated solutions including third-party hardware, software and technical computer-related consulting services and managed services. Our value proposition is our ability to integrate diverse third-party components together into a complete solutionto install the system at the customer site and to offer high value IT consulting services to deliver solutions.
Third-Party Hardware and Software
Our wholly-owned subsidiary, Modcomp, sells third-party hardware and software products in the information technology market, with a strategic focuson industry standard servers and data center infrastructure solutions, midrange data storage infrastructure products, network products, unified communications, andIT security hardware and software solutions. Our key offerings include products from HPE/Aruba, Cisco Systems, Palo Alto Networks, DellEMC, JuniperNetworks, Citrix, Intel, VMWare, Fortinet, Microsoft and Checkpoint. Through our business relationships with these vendors, we are able to offer competitivelypriced robust products to meet our customers' diverse technology needs, providing procurement and engineering expertise in server infrastructure, storage, security,unified communications and networking, to the small-to-medium sized businesses ("SMBs") and large enterprise businesses ("LEBs") with complex ITenvironments. We offer our customers a single point of contact for complex multi-vendor technology purchases. Many of our SMB customers have uniquetechnology needs and may lack technical purchasing expertise or have very limited IT engineering resources on staff. We also provide installation, integration,logistical assistance and other value-added services that customers may require. Our current customers are in web and infrastructure hosting, education,telecommunications, healthcare services, distribution, financial services, professional services and manufacturing. We target SMBs and LEB customers across allindustries.
Professional Services
We provide professional IT consulting services in the following areas:
• Implementation, integration, migration, configuration, installation services and project management.
• Hyper-Converged Infrastructure ("HCI") - We assist our clients with designing and implementing HCI solutions from multiple vendors includingDellEMC, Nutanix, HPE and Cisco. HCI is a software-centric architecture that tightly integrates compute, storage and virtualization resources in asingle system. The benefits of an HCI solution are improved performance, scalability and flexibility all in a reduced footprint.
• Virtualization - We help our customers implement virtualization solutions using products from companies such as VMWare and Citrix that allow onecomputer to do the job of multiple computers by sharing resources of a single computer across multiple environments. Virtualization eliminates physicaland geographical limitations and enables users to host multiple operating systems and applications on fewer servers. Benefits include energy costsavings, lower capital expenditure requirements, high availability of resources, better desktop management, increased security and improved disasterrecovery.
• Enterprise security intrusion prevention, network access control and unified threat management. Using third-party products from companies like PaloAlto, Aruba Networks, Juniper Networks, Fortinet, Checkpoint and Cisco Systems, our services are designed to ensure data security and integritythrough the establishment of virtual private networks, firewalls and other technologies.
• IT security compliance services. We provide services for IT security compliance with personal privacy laws such as the Payment Card Industry DataSecurity Standard ("PCI DSS"), t he Health Insurance Portability and Accountability Act of 1996 (" HIPAA"), and internal control regulations under theSarbanes-Oxley Act ("SOX").
7
• Unified communications, wireless and routing and switching solutions using Cisco Systems and Aruba Networks products and services.
• Custom software applications and solutions development and support. We develop custom applications to customer specifications using industrystandard platforms such as Microsoft.Net, SharePoint and OnBase. We are a Microsoft Gold Partner.
• Managed IT services that include monitoring, reporting and management of alerts for the resolution and preventive general IT and IT security supporttasks.
• Maintenance and technical support for third-party products including hardware and software, operating system and user support.
Managed and Cloud Services
As consumption models continue to evolve in our industry, Modcomp has developed a robust managed & cloud services offering to provide alternativesolutions to traditional capital expenditure investments in IT solutions and IT operations for our clients. Our value is to provide an elastic offering that will allowthe client to scale and consume these offerings with monthly billing options that help control costs and provide economies of scale.
We provide managed and cloud services in the following areas:
• Proactive monitoring and remote management of IT Infrastructure that includes network (both wired and wireless), data center (which includes compute,storage and virtualization), desktops, unified communications platforms and security.
• Managed Collaboration solutions (voice and video), resale of Cisco Webex Teams under annuity program.
• Managed Security (firewall, endpoint protection, malware, anti-virus and SIEM).
• Managed BackUp and Replication.
• Cloud services that include Microsoft Office 365, Azure, Greencloud and Amazon Web Services.
Markets, Marketing and Dependence on Certain Customers
We are an IT systems integrator and computer hardware and software VAR. We also provide technical services to achieve a value-add to our customers.We operate within the VAR sales channels of major computer hardware and software OEMs, primarily within the geographic areas of our sales offices and acrossthe U.S. We provide innovative IT solutions, including a myriad of infrastructure products with customized integration consulting services and managed services tomeet the unique requirements of our customers. We market the products and services we sell through sales offices in the U.S. and the U.K. using our direct salesforce (for a list of our locations, see Item 2 of this Form 10-K).
Competition
Our primary competition in the TS segment is other VARs ranging from small companies that number in the thousands, to large enterprises such as CDW,PC Connection, Insight, Presidio, Dimension Data, Bechtle AG and Computacenter AG & Co oHG. In addition, we compete directly with many of the companiesthat manufacture the third-party products we sell, including Cisco Systems, IBM, Hewlett Packard (HPE), EMC (now part of Dell) and others. In the networkmanagement, security and storage systems integration services business, our competitors are extensive and vary to a certain degree in each of the geographicalmarkets, but they also include such national competitors as HP/EDS, IBM and Cap Gemini.
Nearly all of our product offerings are available through other channels. Favorable competitive factors for the TS segment include procurement capability,product diversity which enables the delivery of complete and custom solutions to our customers and the strength of our key business relationships with the majorIT OEMs. We also consider our ability to meet the unique and/or specialized needs of the SMB and LEB markets and our strong knowledge of the IT products thatwe sell to be a key competitive advantage. Our ability to provide managed services through our network operations center and the consulting integration servicesrequired to design and install the custom solutions that fit our customers' IT needs are distinct competitive advantages. Unfavorable competitive factors include lowname recognition, limited geographic coverage and pricing.
8
Backlog
The backlog of customer orders and contracts for the TS segment was approximately $7.2 million at September 30, 2018 , as compared to $8.9 million atSeptember 30, 2017 . Our backlog can fluctuate greatly. These fluctuations can be due to the timing of receiving large orders for third-party products and/or ITservices. It is expected that all of the customer orders in backlog will ship and/or be provided during fiscal year 2019.
Significant Customers
See Note 15 in the notes to the consolidated financial statements for detailed information regarding customers which comprised 10% or more ofconsolidated revenues for the years ended September 30, 2018 and 2017 .
Employees
On September 30, 2018 , we had approximately 124 full time equivalent employees worldwide for our consolidated operations. None of our employeesare represented by a labor union and we have had no work stoppages in the last three fiscal years. We consider relations with our employees to be good.
Company Website
The Company's internet address is http://www.cspi.com . Through that address, the Company's Annual Report on Form 10-K, quarterly reports onForm 10-Q, current reports on Form 8-K and amendments to those reports are available free of charge as soon as reasonably practicable after they are filed with theUnited States Securities and Exchange Commission (Securities and Exchange Commission or Commission). The information contained on the Company's websiteis not included in, nor incorporated by reference into, this annual report on Form 10-K.
Financial Information about Geographic Areas
Information regarding our sales by geographic area and percentage of sales based on the location to which the products are shipped or services renderedare in Note 15 of the notes to the consolidated financial statements.
Item 1A. Risk Factors
If any of the risks and uncertainties set forth below actually materialize, our business, financial condition and/or results of operations could be materiallyand adversely affected, the trading price of our common stock could decline and a stockholder could lose all or part of its, his or her investment. The risks anduncertainties set forth below are not the only ones we face. Additional risks and uncertainties not presently known to us or that we currently considerimmaterial may also impair our business operations.
We depend on a small number of customers for a significant portion of our revenue and loss of any customer could significantly affect our business.
Both the HPP and TS segments are reliant upon a small number of significant customers, and the loss of or significant reduction in sales to any one of whichcould have a material adverse effect on our business. For the fiscal year ended September 30, 2018, one customer accounted for approximately $7.5 million inrevenue, or 10% of our total revenues for the fiscal year. A significant reduction in the sales to or loss of any of our major customers would have a material adverseeffect on our business, financial condition and results of operations. In addition, our revenues are largely dependent upon the ability of our customers to continue togrow or need services or to develop and sell products that incorporate our products. No assurance can be given that our customers will not experience financial orother difficulties that could adversely affect their operations and, in turn, our results of operations.
We depend on key personnel and skilled employees and face competition in hiring and retaining qualified employees.
We are largely dependent upon the skills and efforts of our senior management, managerial, sales and technical employees. None of our senior managementpersonnel or other key employees are subject to any employment contracts except Victor Dellovo, our Chief Executive Officer and President. The loss of servicesof any of our executives or other key personnel could have a material adverse effect on our business, financial condition and results of operations. Our futuresuccess will depend to a significant extent on our ability to attract, train, motivate and retain highly skilled technical professionals. Our ability to maintain andrenew existing engagements and obtain new business depends, in large part, on our ability to hire and retain technical personnel with the skills that keep pace withcontinuing changes in our industry standards and technologies. The inability to hire additional qualified personnel could impair our ability to satisfy or grow ourclient base. There can be no assurance that we will be successful in retaining current or future employees.
Our success depends in part on our timely introduction of new products and technologies and our results can be impacted by the effectiveness of oursignificant investments in new products and technologies
9
We make significant investments in Aria SDS cyber security products and services that may not achieve expected returns. We will continue to makesignificant investments in research, development, and marketing for Aria products, services, and technologies. Commercial success depends on many factors,including innovativeness, developer support, and effective distribution and marketing. If customers do not perceive our latest offerings as providing significant newfunctionality or other value, they may reduce their purchases of new software and hardware products or upgrades, unfavorably affecting revenue. We may notachieve significant revenue from new product, service, and distribution channel investments for several years, if at all. New products and services may not beprofitable, and even if they are profitable, operating margins for some new products and businesses will not be as high as the margins we have experiencedhistorically. Developing new technologies is complex. It can require long development and testing periods. Significant delays in new releases or significantproblems in creating new products or services could adversely affect our revenue.
We depend on contracts with the federal government, primarily with the Department of Defense ("DoD"), for a significant portion of our revenue, and ourbusiness could be seriously harmed if the government significantly decreased or ceased doing business with us.
We derived 6% of our total revenue in fiscal year 2018 and 8% of our total revenue in fiscal year 2017 from the DoD as a subcontractor. We expect that theDoD contracts will continue to be important to our business for the foreseeable future. If we were suspended or debarred from contracting with the federalgovernment generally, the General Services Administration, or any significant agency in the intelligence community or the DoD, if our reputation or relationshipwith government agencies were to be impaired, or if the government otherwise ceased doing business with us or significantly decreased the amount of business itdoes with us, our business, prospects, financial condition and operating results would be materially and adversely affected.
To be successful, we must respond to the rapid changes in technology . If we are unable to do so on a timely basis our business could be materially adverselyaffected.
Our future success will depend in large part on our ability to enhance our current products and to develop new commercial products on a timely and cost-effective basis in order to respond to technological developments and changing customer needs. The design-in process is typically lengthy and expensive and therecan be no assurance that we will be able to continue to meet the product specifications of our customers in a timely and adequate manner. In addition, if we fail toanticipate or to respond adequately to changes in technology and customer preferences, or if there is any significant delay in product developments orintroductions, this could have a material adverse effect on our business, financial condition and results of operations, including the risk of inventory obsolescence.Because of the complexity of our products, we have experienced delays from time to time in completing products on a timely basis. If we are unable to design,develop or introduce competitive new products on a timely basis, our future operating results would be adversely affected, particularly in our HPP segment. Therecan be no assurance that we will be successful in developing new products or enhancing our existing products on a timely or cost-effective basis, or that such newproducts or product enhancements will achieve market acceptance.
We rely on single sources for supply of certain components and our business may be seriously harmed if our supply of any of these components or othercomponents is disrupted.
Several components used in our HPP products are currently obtained from sole-source suppliers. We are dependent on key vendors like MellanoxTechnologies for our high-speed interconnect components. Generally, suppliers may terminate our purchase orders without cause upon 30 days' notice and maycease offering products to us upon 180 days' notice. Although we do not consider the risk of interruption of supply to be a significant risk in the near term, if in thefuture, Mellanox Technologies were to limit or reduce the sale of such components to us, or if these or other component suppliers, some of which are smallcompanies, were to experience future financial difficulties or other problems which could prevent them from supplying the necessary components, such eventscould have a material adverse effect on our business, financial condition and results of operations. These sole source and other suppliers are each subject to qualityand performance risks, materials shortages, excess demand, reduction in capacity and other factors that may disrupt the flow of goods to us or our customers,which thereby may adversely affect our business and customer relationships.
We have no guaranteed supply arrangements with our suppliers and there can be no assurance that our suppliers will continue to meet our requirements. Ifour supply arrangements are interrupted, there can be no assurance that we would be able to find another supplier on a timely or satisfactory basis. Any shortage orinterruption in the supply of any of the components used in our products, or the inability to procure these components from alternate sources on acceptable terms,could have a material adverse effect on our business, financial condition and results of operations. There can be no assurance that severe shortages of componentswill not occur in the future. Such shortages could increase the cost or delay the shipment of our products, which could have a material adverse effect on ourbusiness, financial condition and results of operations. Significant increases in the prices of these components would also materially adversely affect our financialperformance since we may not
10
be able to adjust product pricing to reflect the increase in component costs. We could incur set-up costs and delays in manufacturing should it become necessary toreplace any key vendors due to work stoppages, shipping delays, financial difficulties or other factors and, under certain circumstances, these costs and delayscould have a material adverse effect on our business, financial condition and results of operations.
Our international operation is subject to a number of risks.
We market and sell our products in certain international markets and we have established operations in the U.K. The sale of our German operation in fiscalyear 2018 is treated as discontinued operations in our 2018 financial statements. Foreign-based revenue is determined based on the location to which the product isshipped or services are rendered and represented 17% and 21% of our total revenue for the fiscal years ended September 30, 2018 and 2017, respectively. Ifrevenues generated by foreign activities are not adequate to offset the expense of establishing and maintaining these foreign activities, our business, financialcondition and results of operations could be materially adversely affected. In addition, there are certain risks inherent in transacting business internationally, suchas changes in applicable laws and regulatory requirements, export and import restrictions, export controls relating to technology, tariffs and other trade barriers,longer payment cycles, problems in collecting accounts receivable, political instability, fluctuations in currency exchange rates, expatriation controls and potentialadverse tax consequences, any of which could adversely impact the success of our international activities. In particular, it is possible activity in the UnitedKingdom and the rest of Europe will be adversely impacted and that we will face increased regulatory and legal complexities, including those related to tax, trade,and employee relations as a result of Brexit. A portion of our revenues are from sales to foreign entities, including foreign governments, which are primarily paidin the form of foreign currencies. There can be no assurance that one or more of such factors will not have a material adverse effect on our future internationalactivities and, consequently, on our business, financial condition or results of operations.
Systems failures may disrupt our business and have an adverse effect on our results of operations.
Any systems failures, including network, software or hardware failures, whether caused by us, a third party service provider, unauthorized intruders andhackers, computer viruses, natural disasters, power shortages or terrorist attacks, could cause loss of data or interruptions or delays in our business or that of ourclients and reputational harm as a security provider. Like other companies, we have experienced cyber security threats to our data and systems, our companysensitive information, and our information technology infrastructure, including malware and computer virus attacks, unauthorized access, systems failures andtemporary disruptions. We may experience similar security threats at customer sites that we operate and manage as a contractual requirement. Prior cyber attacksdirected at us have not had a material adverse impact on our business or our financial results, and we believe that our continuing commitment toward threatdetection and mitigation processes and procedures will avoid such impact in the future. Due to the evolving nature of these security threats, however, the impact ofany future incident cannot be predicted.
In addition, the failure or disruption of our email, communications or utilities could cause us to interrupt or suspend our operations or otherwise harm ourbusiness. Our property and business interruption insurance may be inadequate to compensate us for all losses that may occur as a result of any system oroperational failure or disruption and, as a result, our actual results could differ materially and adversely from those anticipated.
The systems and networks that we maintain for our clients, although highly redundant in their design, could also fail. If a system or network we maintainwere to fail or experience service interruptions, we might experience loss of revenue or face claims for damages or contract termination. Our errors and omissionsliability insurance may be inadequate to compensate us for all the damages that we might incur and, as a result, our actual results could differ materially andadversely from those anticipated.
We face competition that could adversely affect our sales and profitability.
The markets for our products are highly competitive and are characterized by rapidly changing technology, frequent product performance improvements andevolving industry standards. Many of our competitors are substantially larger than we are and have greater access to capital and human resources and in manycases price their products and services less than ours. In addition, due to the rapidly changing nature of technology, new competitors may emerge. Competitors maybe able to offer more attractive pricing or develop products that could offer performance features that are superior to our products, resulting in reduced demand forour products. Such competitors could have a negative impact on our ability to win future business opportunities. There can be no assurance that a new competitorwill not attempt to penetrate the various markets for our products and services. Their entry into markets historically targeted by us may have a material adverseeffect on our business, financial condition and results of operations.
11
Our business could be adversely affected by changes in budgetary priorities of the federal government.
Because we derive a significant percentage of our revenue from contracts with the federal government, changes in federal government budgetary prioritiescould directly affect our financial performance. A significant decline in government expenditures, a shift of expenditures away from programs that we support or achange in federal government contracting policies could cause federal government agencies to reduce their purchases under contracts, to exercise their right toterminate contracts at any time without penalty or not to exercise options to renew contracts.
In years when Congress does not complete its budget process before the end of its fiscal year (September 30), government operations are funded through acontinuing resolution ("CR") that temporarily funds federal agencies. Recent CRs have generally provided funding at the levels provided in the previous fiscal yearand have not authorized new spending initiatives. When the federal government operates under a CR, delays can occur in the procurement of products and services.Historically, such delays have not had a material effect on our business; however, should funding of the federal government by CR be prolonged or extended, andsequestration is not alleviated, it could continue to have significant consequences to our business and our industry.
Additionally, our business could be seriously affected if changes in DoD priorities reduces the demand for our services on contracts supporting someoperations and maintenance activities or if we experience an increase in set-asides for small businesses, which could result in our inability to compete directly forcontracts.
U.S. Federal government contracts contain numerous provisions that are unfavorable to us.
U.S. Federal government contracts contain provisions and are subject to laws and regulations that give the government rights and remedies, some of whichare not typically found in commercial contracts, including allowing the government to:
• cancel multi-year contracts and related orders if funds for contract performance for any subsequent year become unavailable;• claim rights in systems and software developed by us;• suspend or debar us from doing business with the federal government or with a governmental agency;• impose fines and penalties and subject us to criminal prosecution; and• control or prohibit the export of our data and technology.
If the government terminates a contract for convenience, we may recover only our incurred or committed costs, settlement expenses and profit on work
completed prior to the termination. If the government terminates a contract for default, we may be unable to recover even those amounts, and instead may be liablefor excess costs incurred by the government in procuring undelivered items and services from another source. Depending on the value of a contract, suchtermination could cause our actual results to differ materially and adversely from those anticipated.
As is common with government contractors, we have experienced and continue to experience occasional performance issues under certain of our contracts. Depending upon the value of the matters affected, a performance problem that impacts our performance of a program or contract could cause our actual results todiffer materially and adversely from those anticipated.
We may be unsuccessful in protecting our intellectual property rights which could result in the loss of a competitive advantage.
Our ability to compete effectively against other companies in our industry depends, in part, on our ability to protect our current and future proprietarytechnology under patent, copyright, trademark, trade secret and unfair competition laws. We cannot assure that our means of protecting our proprietary rights in theUnited States or abroad will be adequate, or that others will not develop technologies similar or superior to our technology or design around our proprietary rights.In addition, we may incur substantial costs in attempting to protect our proprietary rights.
Also, despite the steps taken by us to protect our proprietary rights, it may be possible for unauthorized third parties to copy or reverse-engineer aspects ofour products develop similar technology independently or otherwise obtain and use information that we regard as proprietary and we may be unable to successfullyidentify or prosecute unauthorized uses of our technology. Furthermore, with respect to our issued patents and patent applications, we cannot assure that patentsfrom any pending patent applications (or from any future patent applications) will be issued, that the scope of any patent protection will exclude competitors orprovide competitive advantages to us, that any of our patents will be held valid if subsequently
12
challenged or that others will not claim rights in or ownership of the patents (and patent applications) and other proprietary rights held by us.
If we become subject to intellectual property infringement claims, we could incur significant expenses and could be prevented from selling specific products.
We may become subject to claims that we infringe the intellectual property rights of others in the future. We cannot assure that, if made, these claims will notbe successful. Any claim of infringement could cause us to incur substantial costs defending against the claim even if the claim is invalid, and could distractmanagement from other business. Any judgment against us could require substantial payment in damages and could also include an injunction or other court orderthat could prevent us from offering certain products.
Our need for continued or increased investment in research and development may increase expenses and reduce our profitability.
Our industry is characterized by the need for continued investment in research and development. If we fail to invest sufficiently in research and development,our products could become less attractive to potential customers and our business and financial condition could be materially and adversely affected. As a result ofthe need to maintain or increase spending levels in this area and the difficulty in reducing costs associated with research and development, our operating resultscould be materially harmed if our research and development efforts fail to result in new products or if revenues fall below expectations. In addition, as a result ofour commitment to invest in research and development, spending levels of research and development expenses as a percentage of revenues may fluctuate in thefuture.
Our results of operations are subject to fluctuation from period to period and may not be an accurate indication of future performance.
We have experienced fluctuations in operating results in large part due to the sale of products and services in relatively large dollar amounts to a relativelysmall number of customers. Customers specify delivery date requirements that coincide with their need for our products and services. Because these customersmay use our products and services in connection with a variety of defense programs or other projects with different sizes and durations, a customer’s orders for onequarter generally do not indicate a trend for future orders by that customer. As such, we have not been able in the past to consistently predict when our customerswill place orders and request shipments so that we cannot always accurately plan our manufacturing, inventory, and working capital requirements. As a result, iforders and shipments differ from what we predict, we may incur additional expenses and build excess inventory, which may require additional reserves andallowances and reduce our working capital and operational flexibility. Any significant change in our customers’ purchasing patterns could have a material adverseeffect on our operating results and reported earnings per share for a particular quarter. Thus, results of operations in any period should not be considered indicativeof the results to be expected for any future period.
High quarterly book-ship ratios may pressure inventory and cash flow management, necessitating increased inventory balances to ensure quarterly revenueattainment. Increased inventory balances tie up additional capital, limiting our operational flexibility. Some of our customers may have become conditioned to waituntil the end of a quarter to place orders in the expectation of receiving a discount. Customers conditioned to seek quarter-end discounts increase risk anduncertainty in our financial forecasting and decrease our margins and profitability.
Our quarterly results may be subject to fluctuations resulting from a number of other factors, including:
• delays in completion of internal product development projects;
• delays in shipping hardware and software;
• delays in acceptance testing by customers;
• a change in the mix of products sold to our served markets;
• changes in customer order patterns;
• production delays due to quality problems with outsourced components;
• inability to scale quick reaction capability products due to low product volume;
13
• shortages and costs of components;
• the timing of product line transitions;
• declines in quarterly revenues from previous generations of products following announcement of replacement products containing more advancedtechnology;
• inability to realize the expected benefits from acquisitions and restructurings, or delays in realizing such benefits;
• potential asset impairment, including goodwill and intangibles, or restructuring charges; and
• changes in estimates of completion on fixed price service engagements.
In addition, from time to time, we have entered into contracts, referred to as development contracts, to engineer a specific solution based on modifications tostandard products. Gross margins from development contract revenues are typically lower than gross margins from standard product revenues. We intend tocontinue to enter into development contracts and anticipate that the gross margins associated with development contract revenues will continue to be lower thangross margins from standard product sales.
Another factor contributing to fluctuations in our quarterly results is the fixed nature of expenditures on personnel, facilities and marketing programs.Expense levels for these programs are based, in significant part, on expectations of future revenues. If actual quarterly revenues are below management’sexpectations, our results of operations will likely be adversely affected. Further, the preparation of financial statements in conformity with accounting principlesgenerally accepted in the United States requires us to make estimates and assumptions that affect the reported amounts of assets and liabilities and disclosure ofcontingent assets and liabilities at the dates of the financial statements and the reported amounts of revenues and expenses during the reporting periods. Actualresults could differ from those estimates, and changes in estimates in subsequent periods could cause our results of operations to fluctuate.
Changes in regulations could materially adversely affect us.
Our business, results of operations, or financial condition could be materially adversely affected if laws, regulations, or standards relating to us or ourproducts are newly implemented or changed. In addition, our compliance with existing regulations may have a material adverse impact on us. Under applicablefederal securities laws, we are required to evaluate and determine the effectiveness of our internal control structure and procedures. We determined internalcontrols had not been effective in fiscal year 2017 due to a material weakness described below. If we have a material weakness in our internal controls, our resultsof operations or financial condition may be materially adversely affected or our stock price may decline. As of September 30, 2018, we have concluded theidentified material weakness in connection with controls over revenue recognition in foreign subsidiaries in the prior years had been remediated. See Item 9A"Controls and Procedures" elsewhere in this document.
If we experience a disaster or other business continuity problem, we may not be able to recover successfully, which could cause material financial loss, lossof human capital, regulatory actions, reputational harm, or legal liability.
If we experience a local or regional disaster or other business continuity problem, such as a hurricane, earthquake, terrorist attack, pandemic or other naturalor man-made disaster, our continued success will depend, in part, on the availability of our personnel, our office facilities, and the proper functioning of ourcomputer, telecommunication and other related systems and operations. As we attempt to grow our operations, the potential for particular types of natural or man-made disasters, political, economic or infrastructure instabilities, or other country- or region-specific business continuity risks increases.
If we suffer any data breaches involving the designs, schematics, or source code for our products or other sensitive information, our business and financialresults could be adversely affected.
We securely store our designs, schematics, and source code for our products as they are created. A breach, whether physical, electronic or otherwise, of thesystems on which this sensitive data is stored could lead to damage or piracy of our products. If we are subject to data security breaches from external sources orfrom an insider threat, we may have a loss in sales or increased costs arising from the restoration or implementation of additional security measures, either ofwhich could adversely affect our business and financial results. Other potential costs could include loss of brand value, incident response costs, loss of stockmarket value, regulatory inquiries, litigation, and management distraction. In addition, a security breach that
14
involved classified information could subject us to civil or criminal penalties, loss of a government contract, loss of access to classified information, or debarmentas a government contractor. Similarly, a breach that involved loss of customer-provided data could subject us to loss of a customer, loss of a contract, litigationcosts and legal damages, and reputational harm.
Our operating results may fluctuate significantly.
Our operating results have fluctuated widely on a quarterly and annual basis during the last several years and we expect to experience significant fluctuationsin future operating results. Many factors, some of which are beyond our control, have contributed to these fluctuations in the past and may continue to do so. Suchfactors include:
• sales in relatively large dollar amounts to a relatively small number of customers;
• competitive pricing programs and volume discounts;
• loss of customers;
• market acceptance of our products;
• product obsolescence;
• general economic conditions;
• change in the mix of products sold;
• whether or not we are able to secure design wins for significant customer systems;
• timing of significant orders;
• delays in completion of internal product development projects or introduction of new products;
• delays in shipping our products;
• delays in acceptance testing by customers;
• production delays due to quality programs with outsourced components;
• shortages of components;
• timing of product line transitions;
• uncertainty and timing of funding of governmental programs, including defense;
• declines of revenues from previous generations of products following announcement of replacement products containing more advanced technology;and
• fixed nature of our expenditures on personnel, facilities and marketing programs.
We believe that period-to-period comparisons of our results of operations will not necessarily be meaningful and should not be relied upon as indicative of
our future performance. It is also possible that in some periods, our operating results may be below the expectations of securities analysts and investors. In suchcircumstances, the price of our common stock may decline.
We need to continue to expend resources on research and development ("R&D") efforts, particularly our HPP segment, to meet the needs of our customers. Ifwe are unable to do so, our products could become less attractive to customers and our business could be materially adversely affected.
Our industry requires a continued investment in R&D. As a result of our need to maintain or increase our spending levels for R&D in this area and thedifficulty in reducing costs associated with R&D, our operating results could be materially harmed if our revenues fall below expectations. In addition, as a resultof CSPI's commitment to invest in R&D, spending as a percent
15
of revenues may fluctuate in the future. Further, if we fail to invest sufficiently in R&D or our R&D does not produce competitive results, our products maybecome less attractive to our customers or potentialcustomers, which could materially harm our business and results of operations.
Our business could be adversely impacted if we have deficiencies in our disclosure controls and procedures or internal controls over financial reporting.
Our management identified a material weakness in internal controls over financial reporting as of September 30, 2017. A material weakness is a deficiency,or combination of deficiencies, in internal control over financial reporting at our foreign subsidiaries, such that there is a reasonable possibility that a materialmisstatement of the Company's annual or interim financial statements will not be prevented or detected in a timely basis.
The material weakness, which was first identified in fiscal year 2015, was in connection with our controls over the revenue recognition process at our foreignsubsidiary, specifically that revenue recognition criteria have been satisfied prior to recognizing revenue and the failure to sufficiently assess gross versus netrevenue indicators to certain revenue transactions. We determined that controls over the revenue recognition process, primarily in Germany, were not operatingeffectively and the resulting control deficiency amounted to a material weakness in our internal controls over financial reporting. Management has concluded thatthe material weakness has been remediated making internal controls over financial reporting effective as of September 30, 2018. See Item 9A “Controls andProcedures” for details.
Effective internal control over financial reporting and disclosure controls and procedures are necessary in order for us to provide reliable financial and otherreports and effectively prevent fraud. These types of controls are designed to provide reasonable assurance regarding the reliability of financial reporting and theproper preparation of our financial statements, as well as regarding the timely reporting of material information. If we cannot maintain effective internal controlover financial reporting or disclosure controls and procedures, or provide reliable financial statements or SEC reports or prevent fraud, investors may loseconfidence in our reported financial information, our common stock could be subject to delisting on the stock exchange where it is traded, our operating results andthe trading price of our common stock could suffer and we might become subject to litigation.
While our management will continue to review the effectiveness of our internal control over financial reporting and disclosure controls and procedures, thereis no assurance that our disclosure controls and procedures or our internal control over financial reporting will be effective in accomplishing all control objectives,including the prevention and detection of fraud, all of the time.
Our stock price may continue to be volatile
Historically, the market for technology stocks has been extremely volatile. Our common stock has experienced and may continue to experience, substantialprice volatility. The following factors could cause the market price of our common stock to fluctuate significantly:
• loss of a major customer;
• loss of a major supplier;
• the addition or departure of key personnel;
• variations in our quarterly operating results;
• announcements by us or our competitors of significant contracts, new products or product enhancements;
• acquisitions, distribution partnerships, joint ventures or capital commitments;
• regulatory changes;
• sales of our common stock or other securities in the future;
• changes in market valuations of technology companies; and
• fluctuations in stock market prices and volumes.
In addition, the stock market in general and the NASDAQ Global Market and technology companies in particular, have experienced extreme price andvolume fluctuations that have often been unrelated or disproportionate to the operating
16
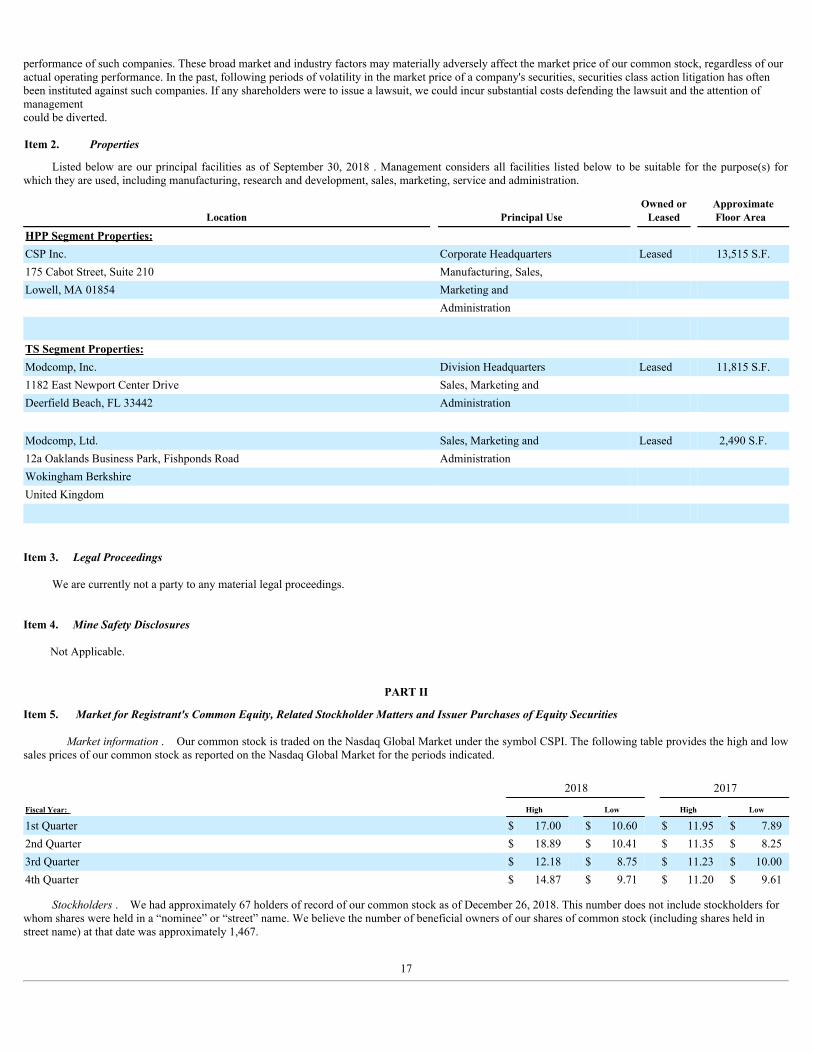
performance of such companies. These broad market and industry factors may materially adversely affect the market price of our common stock, regardless of ouractual operating performance. In the past, following periods of volatility in the market price of a company's securities, securities class action litigation has oftenbeen instituted against such companies. If any shareholders were to issue a lawsuit, we could incur substantial costs defending the lawsuit and the attention ofmanagementcould be diverted.
Item 2. Properties
Listed below are our principal facilities as of September 30, 2018 . Management considers all facilities listed below to be suitable for the purpose(s) forwhich they are used, including manufacturing, research and development, sales, marketing, service and administration.
Location Principal Use Owned orLeased
ApproximateFloor Area
HPP Segment Properties:
CSP Inc. Corporate Headquarters Leased 13,515 S.F.175 Cabot Street, Suite 210 Manufacturing, Sales,
Lowell, MA 01854 Marketing and
Administration
TS Segment Properties:
Modcomp, Inc. Division Headquarters Leased 11,815 S.F.1182 East Newport Center Drive Sales, Marketing and
Deerfield Beach, FL 33442 Administration
Modcomp, Ltd. Sales, Marketing and Leased 2,490 S.F.12a Oaklands Business Park, Fishponds Road Administration
Wokingham Berkshire
United Kingdom
Item 3. Legal Proceedings
We are currently not a party to any material legal proceedings.
Item 4. Mine Safety Disclosures
Not Applicable.
PART II Item 5. Market for Registrant's Common Equity, Related Stockholder Matters and Issuer Purchases of Equity Securities
Market information . Our common stock is traded on the Nasdaq Global Market under the symbol CSPI. The following table provides the high and lowsales prices of our common stock as reported on the Nasdaq Global Market for the periods indicated.
2018 2017
Fiscal Year: High Low High Low
1st Quarter $ 17.00 $ 10.60 $ 11.95 $ 7.892nd Quarter $ 18.89 $ 10.41 $ 11.35 $ 8.253rd Quarter $ 12.18 $ 8.75 $ 11.23 $ 10.004th Quarter $ 14.87 $ 9.71 $ 11.20 $ 9.61
Stockholders . We had approximately 67 holders of record of our common stock as of December 26, 2018. This number does not include stockholders forwhom shares were held in a “nominee” or “street” name. We believe the number of beneficial owners of our shares of common stock (including shares held instreet name) at that date was approximately 1,467.
17
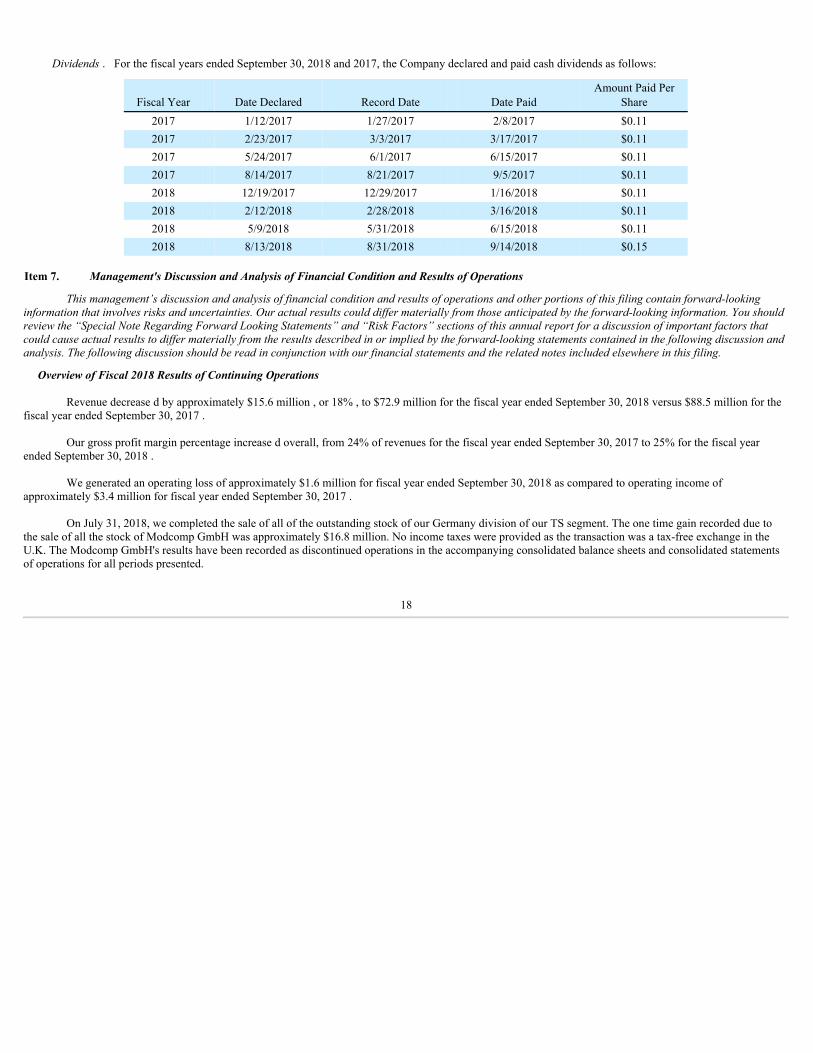
Dividends . For the fiscal years ended September 30, 2018 and 2017, the Company declared and paid cash dividends as follows:
Fiscal Year Date Declared Record Date Date Paid Amount Paid Per
Share2017 1/12/2017 1/27/2017 2/8/2017 $0.112017 2/23/2017 3/3/2017 3/17/2017 $0.112017 5/24/2017 6/1/2017 6/15/2017 $0.112017 8/14/2017 8/21/2017 9/5/2017 $0.112018 12/19/2017 12/29/2017 1/16/2018 $0.112018 2/12/2018 2/28/2018 3/16/2018 $0.112018 5/9/2018 5/31/2018 6/15/2018 $0.112018 8/13/2018 8/31/2018 9/14/2018 $0.15
Item 7. Management's Discussion and Analysis of Financial Condition and Results of Operations
This management’s discussion and analysis of financial condition and results of operations and other portions of this filing contain forward-lookinginformation that involves risks and uncertainties. Our actual results could differ materially from those anticipated by the forward-looking information. You shouldreview the “Special Note Regarding Forward Looking Statements” and “Risk Factors” sections of this annual report for a discussion of important factors thatcould cause actual results to differ materially from the results described in or implied by the forward-looking statements contained in the following discussion andanalysis. The following discussion should be read in conjunction with our financial statements and the related notes included elsewhere in this filing.
Overview of Fiscal 2018 Results of Continuing Operations
Revenue decrease d by approximately $15.6 million , or 18% , to $72.9 million for the fiscal year ended September 30, 2018 versus $88.5 million for thefiscal year ended September 30, 2017 .
Our gross profit margin percentage increase d overall, from 24% of revenues for the fiscal year ended September 30, 2017 to 25% for the fiscal yearended September 30, 2018 .
We generated an operating loss of approximately $1.6 million for fiscal year ended September 30, 2018 as compared to operating income ofapproximately $3.4 million for fiscal year ended September 30, 2017 .
On July 31, 2018, we completed the sale of all of the outstanding stock of our Germany division of our TS segment. The one time gain recorded due tothe sale of all the stock of Modcomp GmbH was approximately $16.8 million. No income taxes were provided as the transaction was a tax-free exchange in theU.K. The Modcomp GmbH's results have been recorded as discontinued operations in the accompanying consolidated balance sheets and consolidated statementsof operations for all periods presented.
18
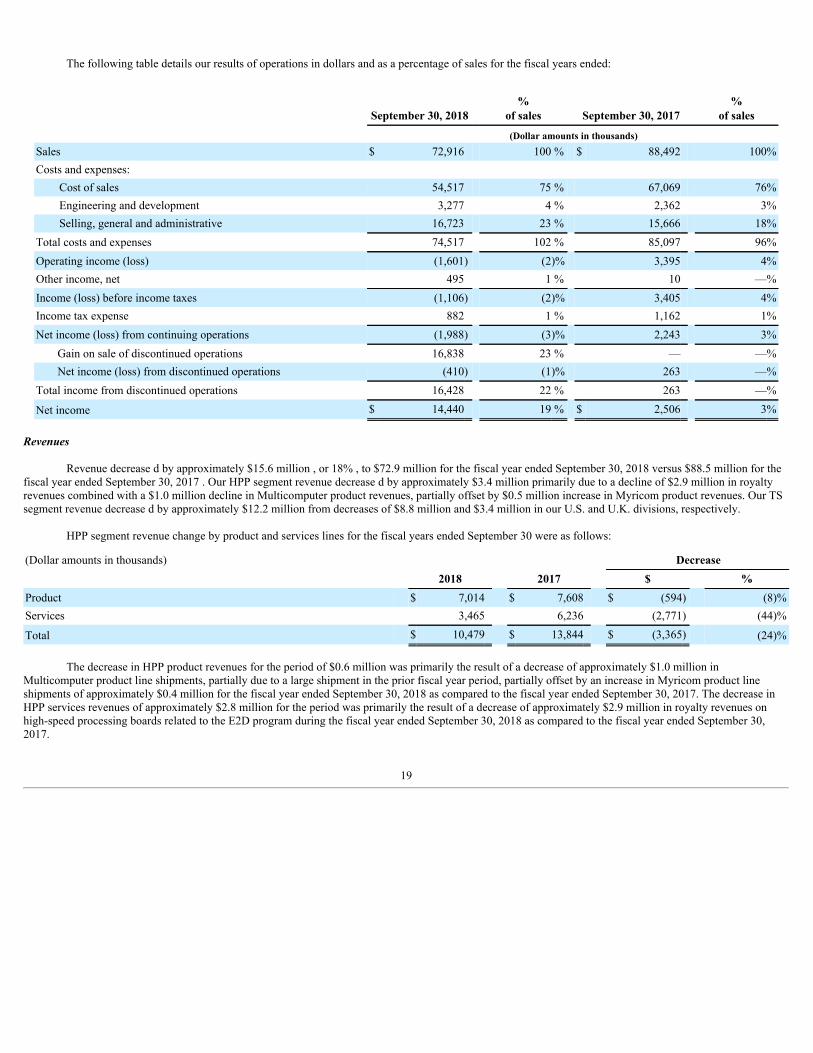
The following table details our results of operations in dollars and as a percentage of sales for the fiscal years ended:
September 30, 2018 %
of sales September 30, 2017 %
of sales (Dollar amounts in thousands)Sales $ 72,916 100 % $ 88,492 100%Costs and expenses:
Cost of sales 54,517 75 % 67,069 76%Engineering and development 3,277 4 % 2,362 3%Selling, general and administrative 16,723 23 % 15,666 18%
Total costs and expenses 74,517 102 % 85,097 96%Operating income (loss) (1,601) (2)% 3,395 4%Other income, net 495 1 % 10 —%Income (loss) before income taxes (1,106) (2)% 3,405 4%Income tax expense 882 1 % 1,162 1%Net income (loss) from continuing operations (1,988) (3)% 2,243 3%
Gain on sale of discontinued operations 16,838 23 % — —%Net income (loss) from discontinued operations (410) (1)% 263 —%
Total income from discontinued operations 16,428 22 % 263 —%
Net income $ 14,440 19 % $ 2,506 3%
Revenues
Revenue decrease d by approximately $15.6 million , or 18% , to $72.9 million for the fiscal year ended September 30, 2018 versus $88.5 million for thefiscal year ended September 30, 2017 . Our HPP segment revenue decrease d by approximately $3.4 million primarily due to a decline of $2.9 million in royaltyrevenues combined with a $1.0 million decline in Multicomputer product revenues, partially offset by $0.5 million increase in Myricom product revenues. Our TSsegment revenue decrease d by approximately $12.2 million from decreases of $8.8 million and $3.4 million in our U.S. and U.K. divisions, respectively.
HPP segment revenue change by product and services lines for the fiscal years ended September 30 were as follows:
(Dollar amounts in thousands) Decrease 2018 2017 $ %Product $ 7,014 $ 7,608 $ (594) (8)%Services 3,465 6,236 (2,771) (44)%
Total $ 10,479 $ 13,844 $ (3,365) (24)% The decrease in HPP product revenues for the period of $0.6 million was primarily the result of a decrease of approximately $1.0 million in
Multicomputer product line shipments, partially due to a large shipment in the prior fiscal year period, partially offset by an increase in Myricom product lineshipments of approximately $0.4 million for the fiscal year ended September 30, 2018 as compared to the fiscal year ended September 30, 2017. The decrease inHPP services revenues of approximately $2.8 million for the period was primarily the result of a decrease of approximately $2.9 million in royalty revenues onhigh-speed processing boards related to the E2D program during the fiscal year ended September 30, 2018 as compared to the fiscal year ended September 30,2017.
19
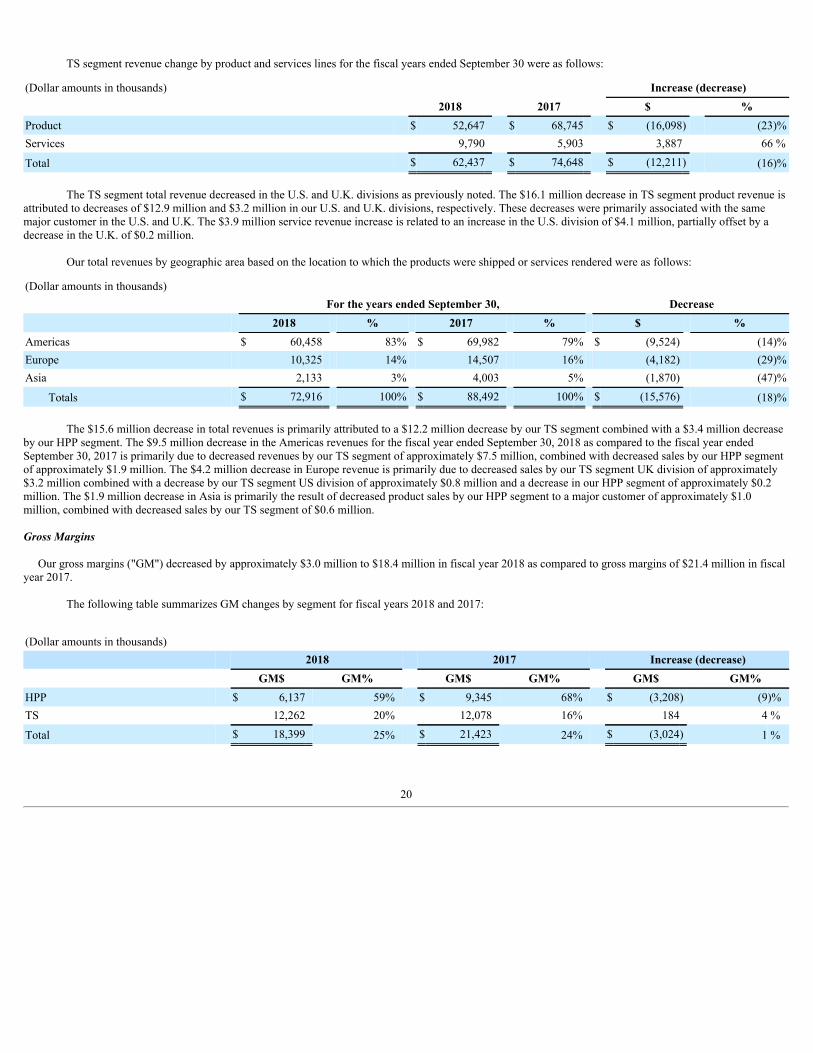
TS segment revenue change by product and services lines for the fiscal years ended September 30 were as follows:
(Dollar amounts in thousands) Increase (decrease) 2018 2017 $ %Product $ 52,647 $ 68,745 $ (16,098) (23)%Services 9,790 5,903 3,887 66 %
Total $ 62,437 $ 74,648 $ (12,211) (16)%
The TS segment total revenue decreased in the U.S. and U.K. divisions as previously noted. The $16.1 million decrease in TS segment product revenue isattributed to decreases of $12.9 million and $3.2 million in our U.S. and U.K. divisions, respectively. These decreases were primarily associated with the samemajor customer in the U.S. and U.K. The $3.9 million service revenue increase is related to an increase in the U.S. division of $4.1 million, partially offset by adecrease in the U.K. of $0.2 million.
Our total revenues by geographic area based on the location to which the products were shipped or services rendered were as follows:
(Dollar amounts in thousands) For the years ended September 30, Decrease 2018 % 2017 % $ %Americas $ 60,458 83% $ 69,982 79% $ (9,524) (14)%Europe 10,325 14% 14,507 16% (4,182) (29)%Asia 2,133 3% 4,003 5% (1,870) (47)%
Totals $ 72,916 100% $ 88,492 100% $ (15,576) (18)%
The $15.6 million decrease in total revenues is primarily attributed to a $12.2 million decrease by our TS segment combined with a $3.4 million decreaseby our HPP segment. The $9.5 million decrease in the Americas revenues for the fiscal year ended September 30, 2018 as compared to the fiscal year endedSeptember 30, 2017 is primarily due to decreased revenues by our TS segment of approximately $7.5 million, combined with decreased sales by our HPP segmentof approximately $1.9 million. The $4.2 million decrease in Europe revenue is primarily due to decreased sales by our TS segment UK division of approximately$3.2 million combined with a decrease by our TS segment US division of approximately $0.8 million and a decrease in our HPP segment of approximately $0.2million. The $1.9 million decrease in Asia is primarily the result of decreased product sales by our HPP segment to a major customer of approximately $1.0million, combined with decreased sales by our TS segment of $0.6 million.
Gross Margins
Our gross margins ("GM") decreased by approximately $3.0 million to $18.4 million in fiscal year 2018 as compared to gross margins of $21.4 million in fiscalyear 2017.
The following table summarizes GM changes by segment for fiscal years 2018 and 2017:
(Dollar amounts in thousands) 2018 2017 Increase (decrease) GM$ GM% GM$ GM% GM$ GM%HPP $ 6,137 59% $ 9,345 68% $ (3,208) (9)%TS 12,262 20% 12,078 16% 184 4 %
Total $ 18,399 25% $ 21,423 24% $ (3,024) 1 %
20

The impact of product mix on gross margins within our HPP segment for the fiscal years ended September 30 was as follows:
(Dollar amounts in thousands) 2018 2017 Decrease GM$ GM% GM$ GM% GM$ GM%Product $ 2,775 40% $ 3,249 43% $ (474) (3)%Services 3,362 97% 6,096 98% (2,734) (1)%
Total $ 6,137 59% $ 9,345 68% $ (3,208) (9)%
The overall HPP segment gross margins as a percentage of sales decreased to 59% in fiscal year 2018, from 68% in fiscal year 2017. The 9% decrease ingross margin as a percentage of sales in the HPP segment was primarily attributed to the impact of a decrease of $2.9 million in high margin Multicomputer royaltyrevenues combined with a $1.0 million decrease in higher margin Multicomputer product sales.
The impact of product mix within our TS segment on gross margins for the fiscal years ended September 30 was as follows:
(Dollar amounts in thousands) 2018 2017 Increase (decrease) GM$ GM% GM$ GM% GM$ GM%Product $ 6,886 13% $ 8,607 13% $ (1,721) — %Services 5,376 55% 3,471 59% 1,905 (4)%
Total $ 12,262 20% $ 12,078 16% $ 184 4 %
The overall TS segment gross margin as a percentage of sales increased 4% for the period. For fiscal year 2018 compared to fiscal year 2017, the $1.7 milliondecrease in our TS segment product gross margins resulted from decreased product revenues in both divisions. The $1.9 million increase in the TS segment servicegross margins resulted from a combination of increased service revenues of approximately $3.9 million combined with a general decrease in overall servicerevenue margins.
Engineering and Development Expenses
The following table details our engineering and development expenses by operating segment for the fiscal years ended September 30, 2018 and 2017:
(Dollar amounts in thousands) For the years ended September 30,
2018 % ofTotal 2017
% ofTotal $ Increase % Increase
By Operating Segment: HPP $ 3,277 100% $ 2,362 100% $ 915 39%TS — —% — —% — —%
Total $ 3,277 100% $ 2,362 100% $ 915 39%
Engineering and development expenses increase d by $0.9 million to $3.3 million for the fiscal year ended September 30, 2018 as compared to $2.4million for the fiscal year ended September 30, 2017. The current fiscal year expenses were primarily for product engineering expenses incurred in connection withthe development of the new ARIA SDS cyber security products. The increased engineering and development expenses for the fiscal year ended September 30,2018 as compared to the fiscal year ended September 30, 2017 is primarily attributed to an increase in engineering headcount and consulting related expenses.
21
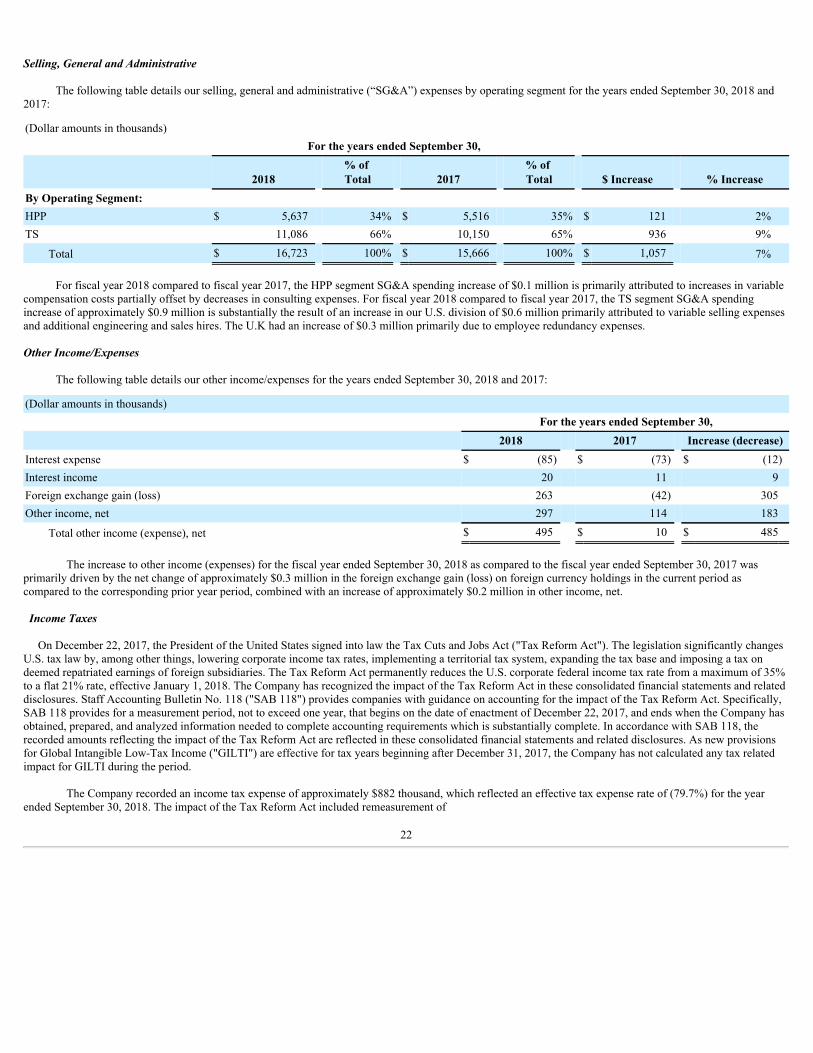
Selling, General and Administrative
The following table details our selling, general and administrative (“SG&A”) expenses by operating segment for the years ended September 30, 2018 and2017:
(Dollar amounts in thousands) For the years ended September 30,
2018 % of Total 2017
% of Total $ Increase % Increase
By Operating Segment: HPP $ 5,637 34% $ 5,516 35% $ 121 2%TS 11,086 66% 10,150 65% 936 9%
Total $ 16,723 100% $ 15,666 100% $ 1,057 7%
For fiscal year 2018 compared to fiscal year 2017, the HPP segment SG&A spending increase of $0.1 million is primarily attributed to increases in variablecompensation costs partially offset by decreases in consulting expenses. For fiscal year 2018 compared to fiscal year 2017, the TS segment SG&A spendingincrease of approximately $0.9 million is substantially the result of an increase in our U.S. division of $0.6 million primarily attributed to variable selling expensesand additional engineering and sales hires. The U.K had an increase of $0.3 million primarily due to employee redundancy expenses.
Other Income/Expenses
The following table details our other income/expenses for the years ended September 30, 2018 and 2017:
(Dollar amounts in thousands) For the years ended September 30, 2018 2017 Increase (decrease)Interest expense $ (85) $ (73) $ (12)Interest income 20 11 9Foreign exchange gain (loss) 263 (42) 305Other income, net 297 114 183
Total other income (expense), net $ 495 $ 10 $ 485 The increase to other income (expenses) for the fiscal year ended September 30, 2018 as compared to the fiscal year ended September 30, 2017 was
primarily driven by the net change of approximately $0.3 million in the foreign exchange gain (loss) on foreign currency holdings in the current period ascompared to the corresponding prior year period, combined with an increase of approximately $0.2 million in other income, net.
Income Taxes On December 22, 2017, the President of the United States signed into law the Tax Cuts and Jobs Act ("Tax Reform Act"). The legislation significantly changesU.S. tax law by, among other things, lowering corporate income tax rates, implementing a territorial tax system, expanding the tax base and imposing a tax ondeemed repatriated earnings of foreign subsidiaries. The Tax Reform Act permanently reduces the U.S. corporate federal income tax rate from a maximum of 35%to a flat 21% rate, effective January 1, 2018. The Company has recognized the impact of the Tax Reform Act in these consolidated financial statements and relateddisclosures. Staff Accounting Bulletin No. 118 ("SAB 118") provides companies with guidance on accounting for the impact of the Tax Reform Act. Specifically,SAB 118 provides for a measurement period, not to exceed one year, that begins on the date of enactment of December 22, 2017, and ends when the Company hasobtained, prepared, and analyzed information needed to complete accounting requirements which is substantially complete. In accordance with SAB 118, therecorded amounts reflecting the impact of the Tax Reform Act are reflected in these consolidated financial statements and related disclosures. As new provisionsfor Global Intangible Low-Tax Income ("GILTI") are effective for tax years beginning after December 31, 2017, the Company has not calculated any tax relatedimpact for GILTI during the period.
The Company recorded an income tax expense of approximately $882 thousand, which reflected an effective tax expense rate of (79.7%) for the yearended September 30, 2018. The impact of the Tax Reform Act included remeasurement of
22
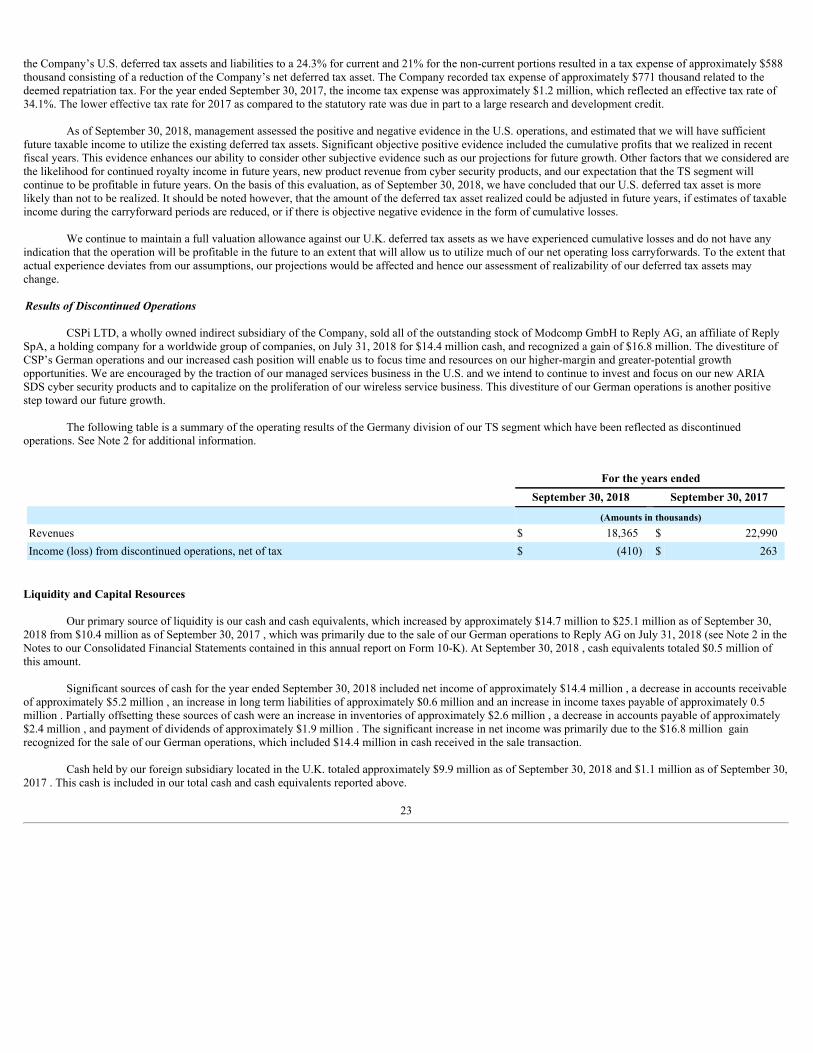
the Company’s U.S. deferred tax assets and liabilities to a 24.3% for current and 21% for the non-current portions resulted in a tax expense of approximately $588thousand consisting of a reduction of the Company’s net deferred tax asset. The Company recorded tax expense of approximately $771 thousand related to thedeemed repatriation tax. For the year ended September 30, 2017, the income tax expense was approximately $1.2 million, which reflected an effective tax rate of34.1%. The lower effective tax rate for 2017 as compared to the statutory rate was due in part to a large research and development credit.
As of September 30, 2018, management assessed the positive and negative evidence in the U.S. operations, and estimated that we will have sufficientfuture taxable income to utilize the existing deferred tax assets. Significant objective positive evidence included the cumulative profits that we realized in recentfiscal years. This evidence enhances our ability to consider other subjective evidence such as our projections for future growth. Other factors that we considered arethe likelihood for continued royalty income in future years, new product revenue from cyber security products, and our expectation that the TS segment willcontinue to be profitable in future years. On the basis of this evaluation, as of September 30, 2018, we have concluded that our U.S. deferred tax asset is morelikely than not to be realized. It should be noted however, that the amount of the deferred tax asset realized could be adjusted in future years, if estimates of taxableincome during the carryforward periods are reduced, or if there is objective negative evidence in the form of cumulative losses.
We continue to maintain a full valuation allowance against our U.K. deferred tax assets as we have experienced cumulative losses and do not have anyindication that the operation will be profitable in the future to an extent that will allow us to utilize much of our net operating loss carryforwards. To the extent thatactual experience deviates from our assumptions, our projections would be affected and hence our assessment of realizability of our deferred tax assets maychange.
Results of Discontinued Operations
CSPi LTD, a wholly owned indirect subsidiary of the Company, sold all of the outstanding stock of Modcomp GmbH to Reply AG, an affiliate of ReplySpA, a holding company for a worldwide group of companies, on July 31, 2018 for $14.4 million cash, and recognized a gain of $16.8 million. The divestiture ofCSP’s German operations and our increased cash position will enable us to focus time and resources on our higher-margin and greater-potential growthopportunities. We are encouraged by the traction of our managed services business in the U.S. and we intend to continue to invest and focus on our new ARIASDS cyber security products and to capitalize on the proliferation of our wireless service business. This divestiture of our German operations is another positivestep toward our future growth.
The following table is a summary of the operating results of the Germany division of our TS segment which have been reflected as discontinuedoperations. See Note 2 for additional information.
For the years ended September 30, 2018 September 30, 2017 (Amounts in thousands)Revenues $ 18,365 $ 22,990Income (loss) from discontinued operations, net of tax $ (410) $ 263
Liquidity and Capital Resources
Our primary source of liquidity is our cash and cash equivalents, which increased by approximately $14.7 million to $25.1 million as of September 30,2018 from $10.4 million as of September 30, 2017 , which was primarily due to the sale of our German operations to Reply AG on July 31, 2018 (see Note 2 in theNotes to our Consolidated Financial Statements contained in this annual report on Form 10-K). At September 30, 2018 , cash equivalents totaled $0.5 million ofthis amount.
Significant sources of cash for the year ended September 30, 2018 included net income of approximately $14.4 million , a decrease in accounts receivableof approximately $5.2 million , an increase in long term liabilities of approximately $0.6 million and an increase in income taxes payable of approximately 0.5million . Partially offsetting these sources of cash were an increase in inventories of approximately $2.6 million , a decrease in accounts payable of approximately$2.4 million , and payment of dividends of approximately $1.9 million . The significant increase in net income was primarily due to the $16.8 million gainrecognized for the sale of our German operations, which included $14.4 million in cash received in the sale transaction.
Cash held by our foreign subsidiary located in the U.K. totaled approximately $9.9 million as of September 30, 2018 and $1.1 million as of September 30,2017 . This cash is included in our total cash and cash equivalents reported above.
23
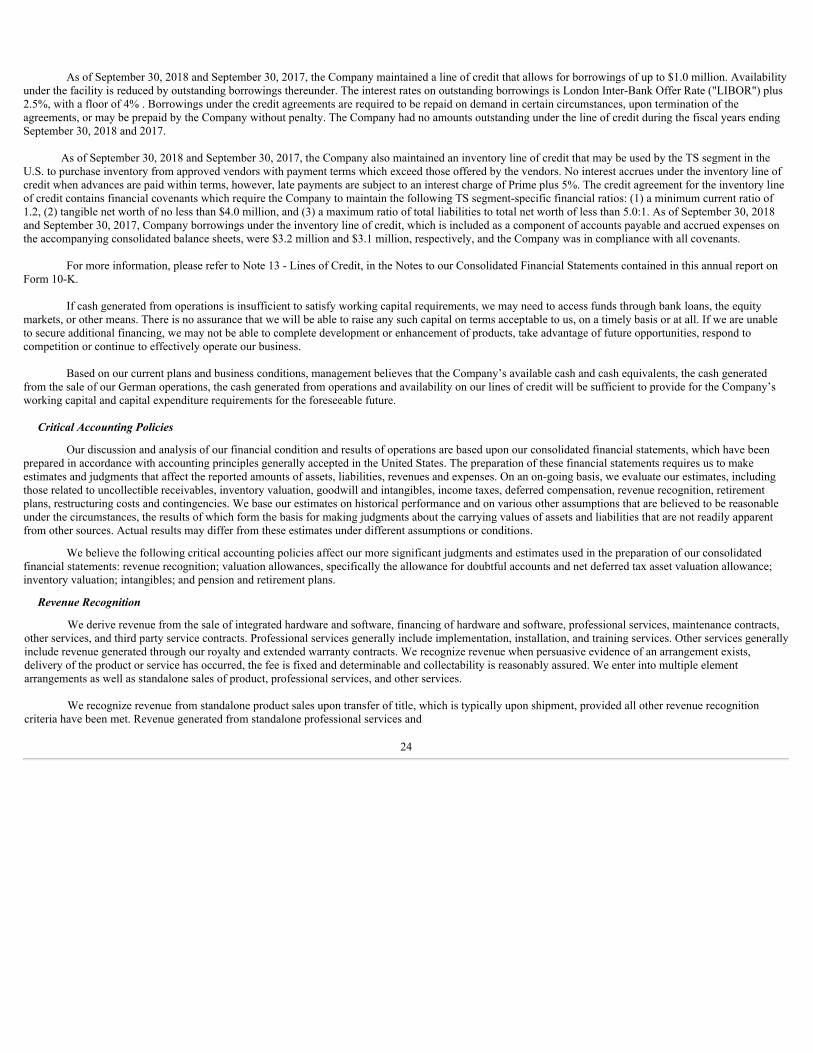
As of September 30, 2018 and September 30, 2017, the Company maintained a line of credit that allows for borrowings of up to $1.0 million. Availability
under the facility is reduced by outstanding borrowings thereunder. The interest rates on outstanding borrowings is London Inter-Bank Offer Rate ("LIBOR") plus2.5%, with a floor of 4% . Borrowings under the credit agreements are required to be repaid on demand in certain circumstances, upon termination of theagreements, or may be prepaid by the Company without penalty. The Company had no amounts outstanding under the line of credit during the fiscal years endingSeptember 30, 2018 and 2017.
As of September 30, 2018 and September 30, 2017, the Company also maintained an inventory line of credit that may be used by the TS segment in theU.S. to purchase inventory from approved vendors with payment terms which exceed those offered by the vendors. No interest accrues under the inventory line ofcredit when advances are paid within terms, however, late payments are subject to an interest charge of Prime plus 5%. The credit agreement for the inventory lineof credit contains financial covenants which require the Company to maintain the following TS segment-specific financial ratios: (1) a minimum current ratio of1.2, (2) tangible net worth of no less than $4.0 million, and (3) a maximum ratio of total liabilities to total net worth of less than 5.0:1. As of September 30, 2018and September 30, 2017, Company borrowings under the inventory line of credit, which is included as a component of accounts payable and accrued expenses onthe accompanying consolidated balance sheets, were $3.2 million and $3.1 million, respectively, and the Company was in compliance with all covenants.
For more information, please refer to Note 13 - Lines of Credit, in the Notes to our Consolidated Financial Statements contained in this annual report onForm 10-K.
If cash generated from operations is insufficient to satisfy working capital requirements, we may need to access funds through bank loans, the equitymarkets, or other means. There is no assurance that we will be able to raise any such capital on terms acceptable to us, on a timely basis or at all. If we are unableto secure additional financing, we may not be able to complete development or enhancement of products, take advantage of future opportunities, respond tocompetition or continue to effectively operate our business.
Based on our current plans and business conditions, management believes that the Company’s available cash and cash equivalents, the cash generatedfrom the sale of our German operations, the cash generated from operations and availability on our lines of credit will be sufficient to provide for the Company’sworking capital and capital expenditure requirements for the foreseeable future.
Critical Accounting Policies
Our discussion and analysis of our financial condition and results of operations are based upon our consolidated financial statements, which have beenprepared in accordance with accounting principles generally accepted in the United States. The preparation of these financial statements requires us to makeestimates and judgments that affect the reported amounts of assets, liabilities, revenues and expenses. On an on-going basis, we evaluate our estimates, includingthose related to uncollectible receivables, inventory valuation, goodwill and intangibles, income taxes, deferred compensation, revenue recognition, retirementplans, restructuring costs and contingencies. We base our estimates on historical performance and on various other assumptions that are believed to be reasonableunder the circumstances, the results of which form the basis for making judgments about the carrying values of assets and liabilities that are not readily apparentfrom other sources. Actual results may differ from these estimates under different assumptions or conditions.
We believe the following critical accounting policies affect our more significant judgments and estimates used in the preparation of our consolidatedfinancial statements: revenue recognition; valuation allowances, specifically the allowance for doubtful accounts and net deferred tax asset valuation allowance;inventory valuation; intangibles; and pension and retirement plans.
Revenue Recognition
We derive revenue from the sale of integrated hardware and software, financing of hardware and software, professional services, maintenance contracts,other services, and third party service contracts. Professional services generally include implementation, installation, and training services. Other services generallyinclude revenue generated through our royalty and extended warranty contracts. We recognize revenue when persuasive evidence of an arrangement exists,delivery of the product or service has occurred, the fee is fixed and determinable and collectability is reasonably assured. We enter into multiple elementarrangements as well as standalone sales of product, professional services, and other services.
We recognize revenue from standalone product sales upon transfer of title, which is typically upon shipment, provided all other revenue recognitioncriteria have been met. Revenue generated from standalone professional services and
24
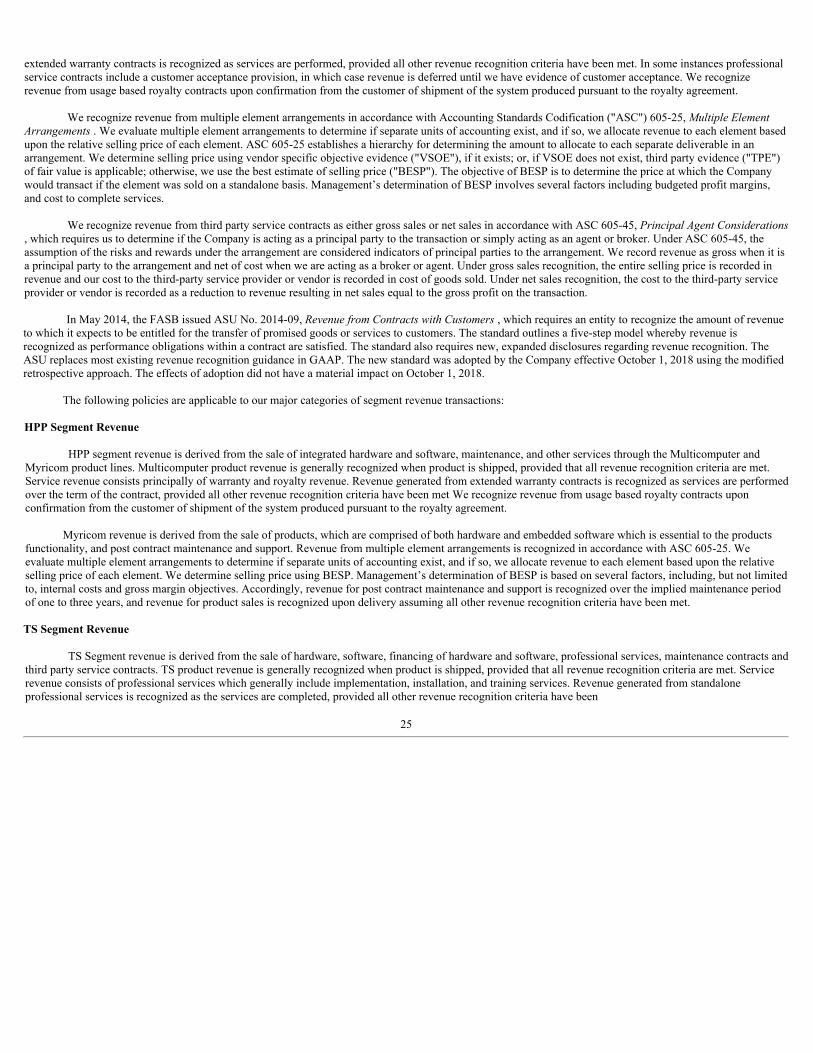
extended warranty contracts is recognized as services are performed, provided all other revenue recognition criteria have been met. In some instances professionalservice contracts include a customer acceptance provision, in which case revenue is deferred until we have evidence of customer acceptance. We recognizerevenue from usage based royalty contracts upon confirmation from the customer of shipment of the system produced pursuant to the royalty agreement.
We recognize revenue from multiple element arrangements in accordance with Accounting Standards Codification ("ASC") 605-25, Multiple ElementArrangements . We evaluate multiple element arrangements to determine if separate units of accounting exist, and if so, we allocate revenue to each element basedupon the relative selling price of each element. ASC 605-25 establishes a hierarchy for determining the amount to allocate to each separate deliverable in anarrangement. We determine selling price using vendor specific objective evidence ("VSOE"), if it exists; or, if VSOE does not exist, third party evidence ("TPE")of fair value is applicable; otherwise, we use the best estimate of selling price ("BESP"). The objective of BESP is to determine the price at which the Companywould transact if the element was sold on a standalone basis. Management’s determination of BESP involves several factors including budgeted profit margins,and cost to complete services.
We recognize revenue from third party service contracts as either gross sales or net sales in accordance with ASC 605-45, Principal Agent Considerations, which requires us to determine if the Company is acting as a principal party to the transaction or simply acting as an agent or broker. Under ASC 605-45, theassumption of the risks and rewards under the arrangement are considered indicators of principal parties to the arrangement. We record revenue as gross when it isa principal party to the arrangement and net of cost when we are acting as a broker or agent. Under gross sales recognition, the entire selling price is recorded inrevenue and our cost to the third-party service provider or vendor is recorded in cost of goods sold. Under net sales recognition, the cost to the third-party serviceprovider or vendor is recorded as a reduction to revenue resulting in net sales equal to the gross profit on the transaction.
In May 2014, the FASB issued ASU No. 2014-09, Revenue from Contracts with Customers , which requires an entity to recognize the amount of revenueto which it expects to be entitled for the transfer of promised goods or services to customers. The standard outlines a five-step model whereby revenue isrecognized as performance obligations within a contract are satisfied. The standard also requires new, expanded disclosures regarding revenue recognition. TheASU replaces most existing revenue recognition guidance in GAAP. The new standard was adopted by the Company effective October 1, 2018 using the modifiedretrospective approach. The effects of adoption did not have a material impact on October 1, 2018.
The following policies are applicable to our major categories of segment revenue transactions:
HPP Segment Revenue
HPP segment revenue is derived from the sale of integrated hardware and software, maintenance, and other services through the Multicomputer andMyricom product lines. Multicomputer product revenue is generally recognized when product is shipped, provided that all revenue recognition criteria are met.Service revenue consists principally of warranty and royalty revenue. Revenue generated from extended warranty contracts is recognized as services are performedover the term of the contract, provided all other revenue recognition criteria have been met We recognize revenue from usage based royalty contracts uponconfirmation from the customer of shipment of the system produced pursuant to the royalty agreement.
Myricom revenue is derived from the sale of products, which are comprised of both hardware and embedded software which is essential to the productsfunctionality, and post contract maintenance and support. Revenue from multiple element arrangements is recognized in accordance with ASC 605-25. Weevaluate multiple element arrangements to determine if separate units of accounting exist, and if so, we allocate revenue to each element based upon the relativeselling price of each element. We determine selling price using BESP. Management’s determination of BESP is based on several factors, including, but not limitedto, internal costs and gross margin objectives. Accordingly, revenue for post contract maintenance and support is recognized over the implied maintenance periodof one to three years, and revenue for product sales is recognized upon delivery assuming all other revenue recognition criteria have been met.
TS Segment Revenue
TS Segment revenue is derived from the sale of hardware, software, financing of hardware and software, professional services, maintenance contracts andthird party service contracts. TS product revenue is generally recognized when product is shipped, provided that all revenue recognition criteria are met. Servicerevenue consists of professional services which generally include implementation, installation, and training services. Revenue generated from standaloneprofessional services is recognized as the services are completed, provided all other revenue recognition criteria have been
25
met. Our standard sales agreements generally do not include customer acceptance provisions. However, in certain instances when arrangements include a customeracceptance provision or there is uncertainty about customer acceptance, revenue is deferred until we have evidence of customer acceptance.
Revenue derived from the sale of products, which are comprised of both hardware and software, and professional services is recognized in accordancewith ASC 605-25. We evaluate multiple element arrangements to determine if separate units of accounting exist, and if so, we allocate revenue to each elementbased upon the relative selling price of each element. We determine selling price using BESP. Management’s determination of BESP is based on several factors,including, but not limited to, internal costs and gross margin objectives. Accordingly revenue for professional services is recognized as services are completed, andrevenue for product sales is recognized upon delivery assuming all other revenue recognition criteria have been met.
We also recognize TS segment revenue from certain third party service contracts, which are evaluated to determine whether such service revenue shouldbe recorded as gross sales or net sales in accordance with ASC 605-45. We evaluate all third party service contracts to determine whether we act as a principal inthe transaction and assume the risks and rewards of ownership or if we are simply acting as an agent or broker. Under gross sales recognition, the entire sellingprice is recorded in sales and our cost to the third-party service provider or vendor is recorded in cost of goods sold. Under net sales recognition, the cost to thethird-party service provider or vendor is recorded as a reduction to sales resulting in net sales equal to the gross profit on the transaction and there are no costs ofgoods sold. We use the net sales recognition method for the third party service contracts that we sell when we are not the primary obligor on the contract. We usethe gross sales recognition for the third party service contracts that we sell when we act as principal and are the primary obligor.
Product Warranty Accrual
Our product sales generally include a 90-day to three-year hardware warranty. At time of product shipment, we accrue for the estimated cost to repair orreplace potentially defective products. Estimated warranty costs are based upon prior actual warranty costs for substantially similar products.
Engineering and Development Expenses
Engineering and development expenses include payroll, employee benefits, stock-based compensation and other headcount-related expenses associatedwith product development. Engineering and development expenses also include third-party development and programming costs. We consider technologicalfeasibility for our software products to be reached upon the release of the software, accordingly, no internal software development costs have been capitalized.
Income Taxes
We use the asset and liability method of accounting for income taxes whereby deferred tax assets and liabilities are recognized for the estimated future taxconsequences attributable to differences between the financial statement carrying amounts of existing assets and liabilities and their respective tax bases. Deferredtax assets and liabilities are measured using enacted tax rates in effect for the year in which those temporary differences are expected to be recovered or settled.The effect on deferred tax assets and liabilities of a change in tax rates is recognized in income in the period that includes the enactment date. We also reducedeferred tax assets by a valuation allowance if, based on the weight of available evidence, it is more likely than not that some portion or all of the recorded deferredtax assets will not be realized in future periods. This methodology requires estimates and judgments in the determination of the recoverability of deferred tax assetsand in the calculation of certain tax liabilities. Valuation allowances are recorded against the gross deferred tax assets that management believes, after consideringall available positive and negative objective evidence, historical and prospective, with greater weight given to historical evidence, that it is more likely than not thatthese assets will not be realized.
In addition, we are required to recognize in the consolidated financial statements, those tax positions determined to be more-likely-than-not of beingsustained upon examination, based on the technical merits of the positions as of the reporting date. If a tax position is not considered more-likely-than-not to besustained based solely on its technical merits, no benefits of the position are recognized.
In addition, the calculation of the Company's tax liabilities involves dealing with uncertainties in the application of complex tax regulations in a multitudeof jurisdictions. The Company records liabilities for estimated tax obligations in the U.S. and other tax jurisdictions. These estimated tax liabilities include theprovision for taxes that may become payable in the future.
26
I ntangible Assets
Intangible assets that are not subject to amortization are also required to be tested annually, or more frequently if events or circumstances indicate that theasset may be impaired. We did not have intangible assets with indefinite lives at any time during the two years ended September 30, 2018 . Intangible assetssubject to amortization are amortized over their estimated useful lives, generally three to ten years, and are carried at net book value. The remaining useful lives ofintangible assets are evaluated on an annual basis. Intangible assets subject to amortization are also tested for recoverability whenever events or changes incircumstances indicate that their carrying amount may not be recoverable. If the fair value of an intangible asset subject to amortization is determined to be lessthan its carrying value, then an impairment charge is recorded to write down that asset to its fair value.
Inventories
Inventories are stated at the lower of cost or market, with cost determined using the first-in, first-out method. The recoverability of inventories is basedupon the types and levels of inventories held, forecasted demand, pricing, competition and changes in technology. We write down our inventory for estimatedobsolescence or unmarketable inventory equal to the difference between the cost of inventory and the estimated market value based upon assumptions about futuredemand and market conditions. If actual market conditions are less favorable than those projected by management, additional inventory write-downs may berequired.
Pension and Retirement Plans
The funded status of pension and other post-retirement benefit plans is recognized prospectively on the consolidated balance sheet. Gains and losses, priorservice costs and credits and any remaining transition amounts that have not yet been recognized through pension expense will be recognized in accumulated othercomprehensive income, net of tax, until they are amortized as a component of net periodic pension/post-retirement benefits expense. Additionally, plan assets andobligations are measured as of our fiscal year-end balance sheet date (September 30).
We have defined benefit and defined contribution plans in the U.K. and in the U.S. In the U.K., the Company provides defined benefit pension plans forcertain employees and former employees and defined contribution plans for the majority of the employees. The defined benefit plans in the U.K. are closed tonewly hired employees and have been for the two years ended September 30, 2018 . In the U.S., the Company provides defined contribution plans that cover mostemployees and supplementary retirement plans to certain employees and former employees who are now retired. These supplementary retirement plans are alsoclosed to newly hired employees and have been for the two years ended September 30, 2018 . These supplementary plans are funded through whole life insurancepolicies. The Company expects to recover all insurance premiums paid under these policies in the future, through the cash surrender value of the policies and anydeath benefits or portions thereof to be paid upon the death of the participant. These whole life insurance policies are carried on the balance sheet at their cashsurrender values as they are owned by the Company and not assets of the defined benefit plans. In the U.S., the Company also provides for officer death benefitsand post-retirement health insurance benefits through supplemental post-retirement plans to certain officers. The Company also funds these supplemental plans'obligations through whole life insurance policies on the officers.
Pension expense is based on an actuarial computation of current future benefits using estimates for expected return on assets, expected compensationincreases and applicable discount rates. Management has reviewed the discount rates and rates of return with our consulting actuaries and investment advisers andconcluded they were reasonable. A decrease in the expected return on pension assets would increase pension expense. Expected compensation increases areestimated based on historical and expected increases in the future. Increases in estimated compensation increases would result in higher pension expense whiledecreases would lower pension expense. Discount rates are selected based upon rates of return on high quality fixed income investments currently available andexpected to be available during the period to maturity of the pension benefit. A decrease in the discount rate would result in greater pension expense while anincrease in the discount rate would decrease pension expense.
The Company funds its pension plans in amounts sufficient to meet the requirements set forth in applicable employee benefits laws and local tax laws.Liabilities for amounts in excess of these funding levels are accrued and reported in the consolidated balance sheets.
Inflation and Changing Prices
Management does not believe that inflation and changing prices had significant impact on sales, revenues or income during fiscal years 2018 or 2017 .There is no assurance that the Company's business will not be materially and adversely affected by inflation and changing prices in the future.
27
Item 8. Financial Statements and Supplementary Data
The consolidated financial statements are included herein.
Page
Report of Independent Registered Public Accounting Firm 34 Consolidated Balance Sheets as of September 30, 2018 and 2017 35 Consolidated Statements of Operations for the years ended September 30, 2018 and 2017 36 Consolidated Statements of Comprehensive Income for the years ended September 30, 2018 and 2017 37 Consolidated Statements of Shareholders' Equity for the years ended September 30, 2018 and 2017 38 Consolidated Statements of Cash Flows for the years ended September 30, 2018 and 2017 39 Notes to Consolidated Financial Statements 40
Item 9. Changes in and Disagreements with Accountants on Accounting and Financial Disclosures
None.
Item 9A. Controls and Procedures
Evaluation of Controls and Procedures
Disclosure Controls and Procedures. The Company evaluated the effectiveness of the design and operation of our disclosure controls and procedures as ofSeptember 30, 2018. Our Chief Executive Officer, our Chief Financial Officer and other members of our senior management team supervised and participated inthis evaluation. The term “disclosure controls and procedures,” as defined in Rules 13a-15(e) and 15d-15(e) under the Exchange Act, means controls and otherprocedures of a company that are designed to ensure that information required to be disclosed by a company in the reports that it files or
28
submits under the Exchange Act is recorded, processed, summarized and reported, within the time periods specified in the Securities and Exchange Commission's("SEC") rules and forms. Disclosure controls and procedures include, without limitation, controls and procedures designed to ensure that information required to bedisclosed by a company in the reports that it files or submits under the Exchange Act is accumulated and communicated to the company's management, includingits principal executive and principal financial officers, as appropriate to allow timely decisions regarding required disclosure. Management recognizes that anycontrols and procedures, no matter how well designed and operated, can provide only reasonable assurance of achieving their objectives and managementnecessarily applies its judgment in evaluating the cost-benefit relationship of possible controls and procedures. Based on the evaluation of our disclosure controlsand procedures as of September 30, 2018, the Company’s Chief Executive Officer and Chief Financial Officer concluded that, as of such date, our disclosurecontrols and procedures were effective. As discussed below, we concluded the prior year’s material weakness described in this Item 9A has been remediated by thechanges we made in fiscal year 2018 in response to that material weakness.
Management's Report on Internal Control over Financial Reporting.
The Company's management is responsible for establishing and maintaining adequate internal control over financial reporting. As defined in Rule 13a-15(f)under the Exchange Act, internal control over financial reporting is a process designed by or under the supervision of a company's principal executive and principalfinancial officers and effected by a company's board of directors, management and other personnel, to provide reasonable assurance regarding the reliability offinancial reporting and the preparation of financial statements for external purposes in accordance with accounting principles generally accepted in the UnitedStates of America. It includes those policies and procedures that:
• pertain to the maintenance of records that in reasonable detail accurately and fairly reflect the transactions and dispositions of the assets of a company;
• provide reasonable assurance that transactions are recorded as necessary to permit preparation of financial statements in accordance with generallyaccepted accounting principles and that receipts and expenditures of a company are being made only in accordance with authorizations of managementand the board of directors of a company; and
• provide reasonable assurance regarding prevention or timely detection of unauthorized acquisition, use or disposition of a company's assets that couldhave a material effect on its financial statements.
Management has assessed the effectiveness of the Company's internal control over financial reporting as of September 30, 2018. In making its assessment ofinternal control, management used the criteria described in “Internal Control-Integrated Framework” issued by the Committee of Sponsoring Organizations("COSO") of the Treadway Commission. As a result of its assessment, management has concluded that the Company's internal control over financial reporting waseffective as of September 30, 2018.
As of September 30, 2017, management had identified a material weakness. A material weakness is a deficiency, or combination of deficiencies, in internalcontrol over financial reporting, such that there is a reasonable possibility that a material misstatement of the Company's annual or interim financial statements willnot be prevented or detected in a timely basis.
The material weakness was in connection with our controls over the revenue recognition process at our foreign subsidiaries, specifically whether revenuerecognition criteria have been satisfied prior to recognizing revenue and the failure to sufficiently assess gross versus net revenue indicators to certain revenuetransactions. We determined that controls over the revenue recognition process, primarily in Germany, were not operating effectively and the resulting controldeficiency amounted to a material weakness in our controls over financial reporting. As a result, we have concluded that the Company’s internal control overfinancial reporting was not effective as of September 30, 2017.
During the periods following our initial identification of the material weakness referred to above, management assessed various alternatives to remediate thismaterial weakness and we implemented additional changes to our system of internal controls, which included the implementation of enhanced internal auditingprocedures, whereby a comprehensive review form is prepared for all new revenue transactions. Our review process has been expanded to include corporate andTS accounting personnel reviews to ensure the correct accounting methodology is applied to all revenue transactions. We also created new revenue reports fromthe German ERP system to assist in the revenue transaction review process. During the twelve months ended September 30, 2017, management took additionalactions to upgrade our international accounting staff with the hiring of a new controller at the beginning of fiscal year 2018 and added consultants to assist in therevenue transaction processing which improved accounting operations in our European divisions during fiscal year 2018.
29
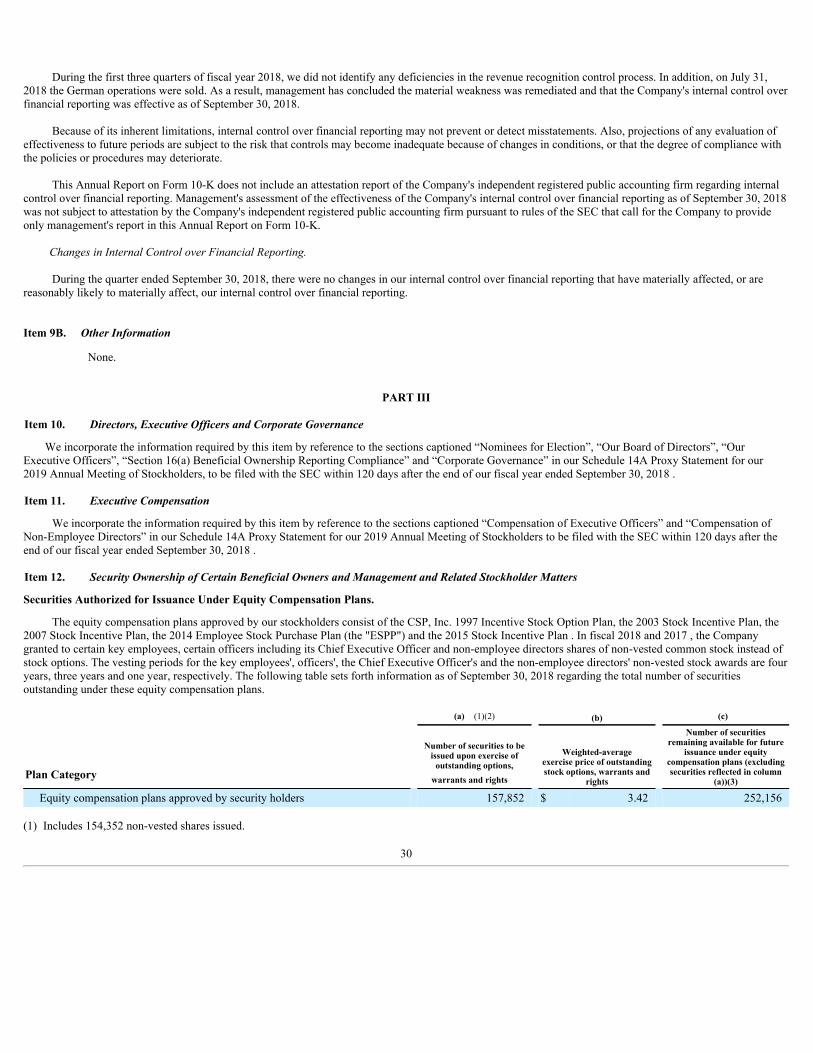
During the first three quarters of fiscal year 2018, we did not identify any deficiencies in the revenue recognition control process. In addition, on July 31,2018 the German operations were sold. As a result, management has concluded the material weakness was remediated and that the Company's internal control overfinancial reporting was effective as of September 30, 2018.
Because of its inherent limitations, internal control over financial reporting may not prevent or detect misstatements. Also, projections of any evaluation ofeffectiveness to future periods are subject to the risk that controls may become inadequate because of changes in conditions, or that the degree of compliance withthe policies or procedures may deteriorate.
This Annual Report on Form 10-K does not include an attestation report of the Company's independent registered public accounting firm regarding internalcontrol over financial reporting. Management's assessment of the effectiveness of the Company's internal control over financial reporting as of September 30, 2018was not subject to attestation by the Company's independent registered public accounting firm pursuant to rules of the SEC that call for the Company to provideonly management's report in this Annual Report on Form 10-K.
Changes in Internal Control over Financial Reporting.
During the quarter ended September 30, 2018, there were no changes in our internal control over financial reporting that have materially affected, or arereasonably likely to materially affect, our internal control over financial reporting.
Item 9B. Other Information
None.
PART III
Item 10. Directors, Executive Officers and Corporate Governance
We incorporate the information required by this item by reference to the sections captioned “Nominees for Election”, “Our Board of Directors”, “OurExecutive Officers”, “Section 16(a) Beneficial Ownership Reporting Compliance” and “Corporate Governance” in our Schedule 14A Proxy Statement for our2019 Annual Meeting of Stockholders, to be filed with the SEC within 120 days after the end of our fiscal year ended September 30, 2018 .
Item 11. Executive Compensation
We incorporate the information required by this item by reference to the sections captioned “Compensation of Executive Officers” and “Compensation ofNon-Employee Directors” in our Schedule 14A Proxy Statement for our 2019 Annual Meeting of Stockholders to be filed with the SEC within 120 days after theend of our fiscal year ended September 30, 2018 .
Item 12. Security Ownership of Certain Beneficial Owners and Management and Related Stockholder Matters Securities Authorized for Issuance Under Equity Compensation Plans.
The equity compensation plans approved by our stockholders consist of the CSP, Inc. 1997 Incentive Stock Option Plan, the 2003 Stock Incentive Plan, the2007 Stock Incentive Plan, the 2014 Employee Stock Purchase Plan (the "ESPP") and the 2015 Stock Incentive Plan . In fiscal 2018 and 2017 , the Companygranted to certain key employees, certain officers including its Chief Executive Officer and non-employee directors shares of non-vested common stock instead ofstock options. The vesting periods for the key employees', officers', the Chief Executive Officer's and the non-employee directors' non-vested stock awards are fouryears, three years and one year, respectively. The following table sets forth information as of September 30, 2018 regarding the total number of securitiesoutstanding under these equity compensation plans.
(a) (1)(2) (b) (c)
Plan Category
Number of securities to beissued upon exercise ofoutstanding options,warrants and rights
Weighted-averageexercise price of outstandingstock options, warrants and
rights
Number of securitiesremaining available for future
issuance under equitycompensation plans (excludingsecurities reflected in column
(a))(3)
Equity compensation plans approved by security holders 157,852 $ 3.42 252,156
(1) Includes 154,352 non-vested shares issued.
30
(2) Does not include purchase rights under the ESPP, as the purchase price and number of shares to be purchased under the ESPP are not determined until the endof the relevant purchase period.
(3) Includes 125,965 shares available for future issuance under the stock incentive and stock option plans and 126,191 under the ESPP.
We incorporate additional information required by this Item by reference to the section captioned “Security Ownership of Certain Beneficial Owners andManagement” in our Schedule 14A Proxy Statement for our 2019 Annual Meeting of Stockholders to be filed with the SEC within 120 days after the end of ourfiscal year ended September 30, 2018 .
Item 13. Certain Relationships and Related Transactions and Director Independence
We incorporate the information required by this item by reference to the section captioned “Corporate Governance” in our Schedule 14A Proxy Statementfor our 2019 Annual Meeting of Stockholders to be filed with the SEC within 120 days after the end of our fiscal year ended September 30, 2018 .
Item 14. Principal Accountant Fees and Services
We incorporate the information required by this item by reference to the sections captioned “Fees for Professional Services” and “Pre-approval Policies andProcedures” in our Schedule 14A Proxy Statement for our 2019 Annual Meeting of Stockholders to be filed with the SEC within 120 days after the end of ourfiscal year ended September 30, 2018 .
PART IV
Item 15. Exhibits and Financial Statement Schedules
(a) (1) Financial statements filed as part of this report:
Consolidated Balance Sheets as of September 30, 2018 and 2017
Consolidated Statements of Operations for the years ended September 30, 2018 and 2017
Consolidated Statements of Comprehensive Income for the years ended September 30, 2018 and 2017
Consolidated Statements of Shareholders' Equity for the years ended September 30, 2018 and 2017
Consolidated Statements of Cash Flows for the years ended September 30, 2018 and 2017
Notes to Consolidated Financial Statements
(2) Financial statement schedules
All other financial statements and schedules not listed have been omitted since the required information is included in the consolidated financial statementsor the notes thereto included in Item 8, or is not applicable, material or required.
31
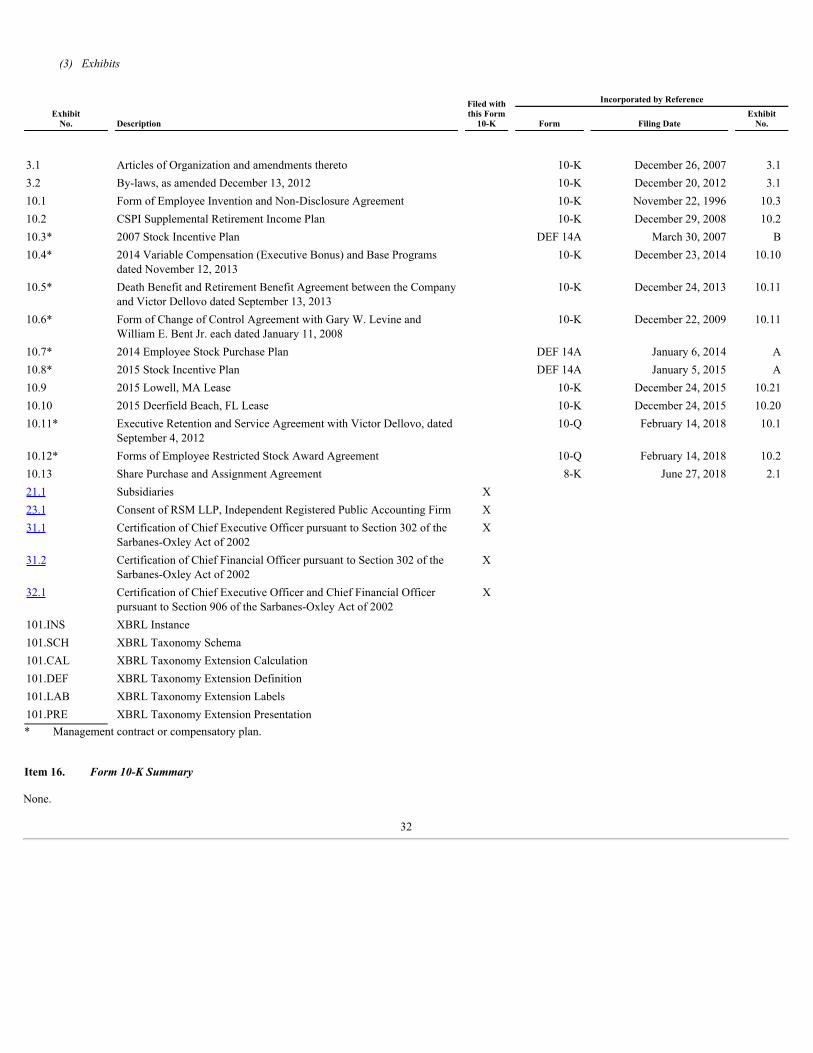
(3) Exhibits
ExhibitNo. Description
Filed withthis Form10-K
Incorporated by Reference
Form Filing Date ExhibitNo.
3.1 Articles of Organization and amendments thereto 10-K December 26, 2007 3.13.2 By-laws, as amended December 13, 2012 10-K December 20, 2012 3.110.1 Form of Employee Invention and Non-Disclosure Agreement 10-K November 22, 1996 10.310.2 CSPI Supplemental Retirement Income Plan 10-K December 29, 2008 10.210.3* 2007 Stock Incentive Plan DEF 14A March 30, 2007 B10.4*
2014 Variable Compensation (Executive Bonus) and Base Programsdated November 12, 2013
10-K
December 23, 2014
10.10
10.5*
Death Benefit and Retirement Benefit Agreement between the Companyand Victor Dellovo dated September 13, 2013
10-K
December 24, 2013
10.11
10.6*
Form of Change of Control Agreement with Gary W. Levine andWilliam E. Bent Jr. each dated January 11, 2008
10-K
December 22, 2009
10.11
10.7* 2014 Employee Stock Purchase Plan DEF 14A January 6, 2014 A10.8* 2015 Stock Incentive Plan DEF 14A January 5, 2015 A10.9 2015 Lowell, MA Lease 10-K December 24, 2015 10.2110.10 2015 Deerfield Beach, FL Lease 10-K December 24, 2015 10.2010.11*
Executive Retention and Service Agreement with Victor Dellovo, datedSeptember 4, 2012
10-Q
February 14, 2018
10.1
10.12* Forms of Employee Restricted Stock Award Agreement 10-Q February 14, 2018 10.210.13 Share Purchase and Assignment Agreement 8-K June 27, 2018 2.121.1 Subsidiaries X
23.1 Consent of RSM LLP, Independent Registered Public Accounting Firm X
31.1
Certification of Chief Executive Officer pursuant to Section 302 of theSarbanes-Oxley Act of 2002
X
31.2
Certification of Chief Financial Officer pursuant to Section 302 of theSarbanes-Oxley Act of 2002
X
32.1
Certification of Chief Executive Officer and Chief Financial Officerpursuant to Section 906 of the Sarbanes-Oxley Act of 2002
X
101.INS XBRL Instance 101.SCH XBRL Taxonomy Schema 101.CAL XBRL Taxonomy Extension Calculation 101.DEF XBRL Taxonomy Extension Definition 101.LAB XBRL Taxonomy Extension Labels 101.PRE XBRL Taxonomy Extension Presentation * Management contract or compensatory plan.
Item 16. Form 10-K Summary
None.
32
SIGNATURES
Pursuant to the requirements of Section 13 or 15(d) of the Securities Exchange Act of 1934, the registrant has duly caused this report to be signedon its behalf by the undersigned, thereunto duly authorized.
CSP INC.By: /s/ Victor Dellovo
Victor DellovoChief Executive Officer and President
Date: December 27, 2018
Pursuant to the requirements of the Securities Exchange Act of 1934, this report has been signed below by the following persons on behalf of theregistrant and in the capacities and on the dates indicated.
Name Title Date
/s/ Victor Dellovo Chief Executive Officer, President andDirector
December 27, 2018Victor Dellovo
/s/ Gary W. Levine Chief Financial Officer(Principal Financial Officer)
December 27, 2018Gary W. Levine
/s/ Mike Newbanks Vice President of Finance(Chief Accounting Officer)
December 27, 2018Mike Newbanks
/s/ C. Shelton James Director December 27, 2018C. Shelton James
/s/ Raymond Charles Blackmon Director December 27, 2018Raymond Charles Blackmon
/s/ Marilyn T. Smith Director December 27, 2018Marilyn T. Smith /s/ Izzy Azeri Director December 27, 2018Izzy Azeri
33
Report of Independent Registered Public Accounting Firm To the Shareholders and the Board of Directors of CSP Inc. and Subsidiaries Opinion on the Financial StatementsWe have audited the accompanying consolidated balance sheets of CSP Inc. and Subsidiaries (the “Company”) as of September 30, 2018 and2017, the related consolidated statements of operations, comprehensive income, shareholders' equity and cash flows for the years then ended, andthe related notes to the consolidated financial statements (collectively, the financial statements). In our opinion, the financial statements presentfairly, in all material respects, the financial position of the Company as of September 30, 2018 and 2017, and the results of its operations and itscash flows for the years then ended, in conformity with accounting principles generally accepted in the United States of America.
Basis for OpinionThese financial statements are the responsibility of the Company's management. Our responsibility is to express an opinion on the Company’sfinancial statements based on our audits. We are a public accounting firm registered with the Public Company Accounting Oversight Board (UnitedStates) (PCAOB) and are required to be independent with respect to the Company in accordance with U.S. federal securities laws and theapplicable rules and regulations of the Securities and Exchange Commission and the PCAOB. We conducted our audits in accordance with the standards of the PCAOB. Those standards require that we plan and perform the audit to obtainreasonable assurance about whether the financial statements are free of material misstatement, whether due to error or fraud. The Company is notrequired to have, nor were we engaged to perform, an audit of its internal control over financial reporting. As part of our audits we are required toobtain an understanding of internal control over financial reporting but not for the purpose of expressing an opinion on the effectiveness of theCompany's internal control over financial reporting. Accordingly, we express no such opinion. Our audits included performing procedures to assess the risks of material misstatement of the financial statements, whether due to error or fraud,and performing procedures that respond to those risks. Such procedures included examining, on a test basis, evidence regarding the amounts anddisclosures in the financial statements. Our audits also included evaluating the accounting principles used and significant estimates made bymanagement, as well as evaluating the overall presentation of the financial statements. We believe that our audits provide a reasonable basis forour opinion. /s/ RSM US LLP
We have served as the Company’s auditor since 2007. Boston, MassachusettsDecember 27, 2018
34
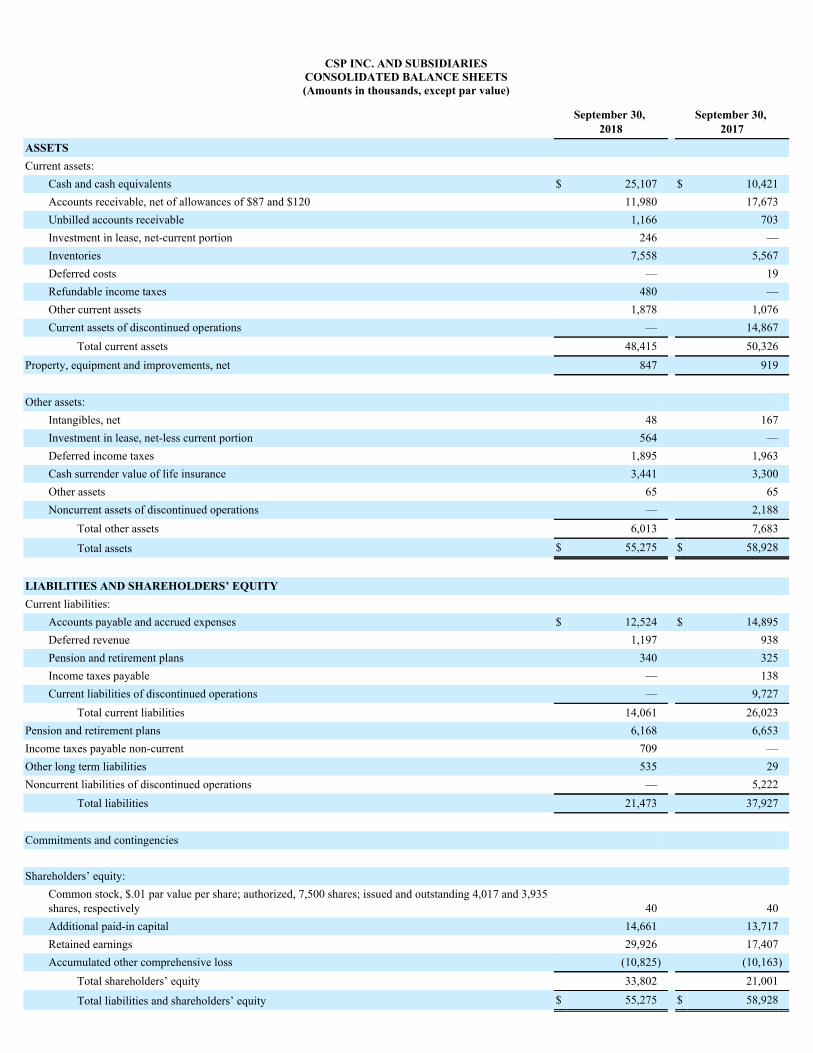
CSP INC. AND SUBSIDIARIESCONSOLIDATED BALANCE SHEETS(Amounts in thousands, except par value)
September 30,
2018 September 30,
2017ASSETS Current assets:
Cash and cash equivalents $ 25,107 $ 10,421Accounts receivable, net of allowances of $87 and $120 11,980 17,673Unbilled accounts receivable 1,166 703Investment in lease, net-current portion 246 —Inventories 7,558 5,567Deferred costs — 19Refundable income taxes 480 —Other current assets 1,878 1,076Current assets of discontinued operations — 14,867
Total current assets 48,415 50,326Property, equipment and improvements, net 847 919 Other assets:
Intangibles, net 48 167Investment in lease, net-less current portion 564 —Deferred income taxes 1,895 1,963Cash surrender value of life insurance 3,441 3,300Other assets 65 65Noncurrent assets of discontinued operations — 2,188
Total other assets 6,013 7,683
Total assets $ 55,275 $ 58,928
LIABILITIES AND SHAREHOLDERS’ EQUITY Current liabilities:
Accounts payable and accrued expenses $ 12,524 $ 14,895Deferred revenue 1,197 938Pension and retirement plans 340 325Income taxes payable — 138Current liabilities of discontinued operations — 9,727
Total current liabilities 14,061 26,023Pension and retirement plans 6,168 6,653Income taxes payable non-current 709 —Other long term liabilities 535 29Noncurrent liabilities of discontinued operations — 5,222
Total liabilities 21,473 37,927 Commitments and contingencies Shareholders’ equity:
Common stock, $.01 par value per share; authorized, 7,500 shares; issued and outstanding 4,017 and 3,935shares, respectively 40 40Additional paid-in capital 14,661 13,717Retained earnings 29,926 17,407Accumulated other comprehensive loss (10,825) (10,163)
Total shareholders’ equity 33,802 21,001
Total liabilities and shareholders’ equity $ 55,275 $ 58,928

See accompanying notes to consolidated financial statements.
35
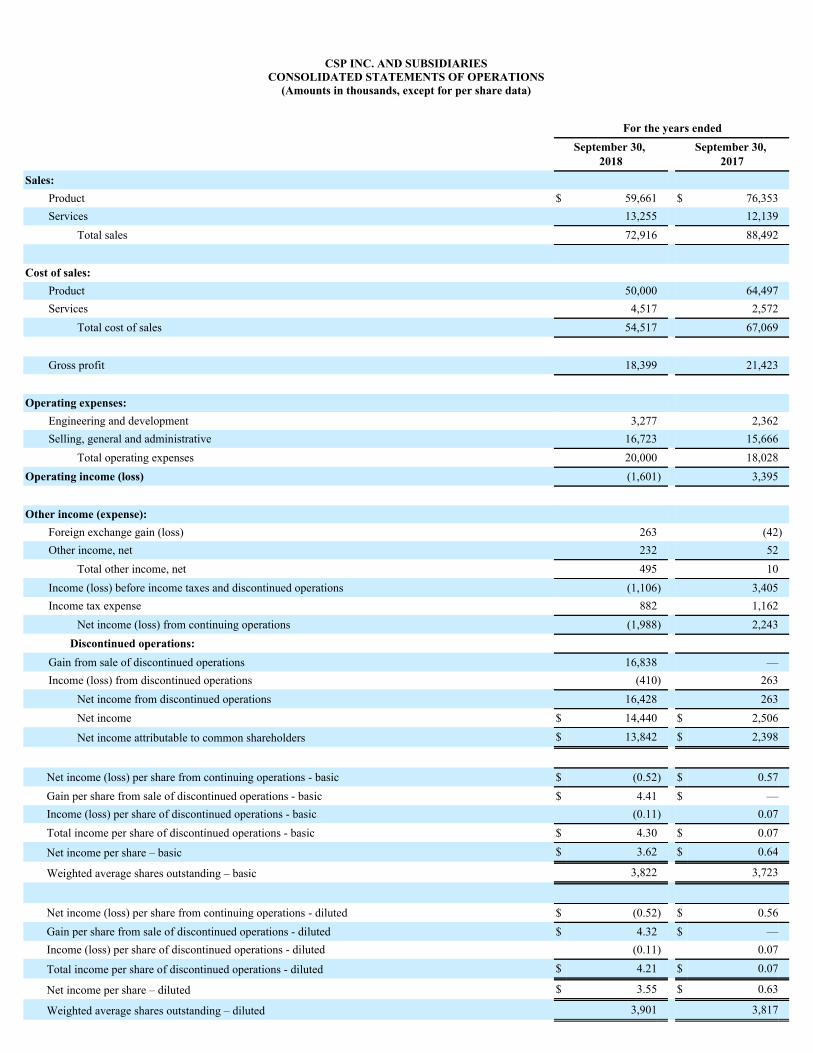
CSP INC. AND SUBSIDIARIESCONSOLIDATED STATEMENTS OF OPERATIONS
(Amounts in thousands, except for per share data)
For the years ended
September 30,
2018 September 30,
2017Sales:
Product $ 59,661 $ 76,353Services 13,255 12,139
Total sales 72,916 88,492 Cost of sales:
Product 50,000 64,497Services 4,517 2,572
Total cost of sales 54,517 67,069
Gross profit 18,399 21,423 Operating expenses:
Engineering and development 3,277 2,362Selling, general and administrative 16,723 15,666
Total operating expenses 20,000 18,028Operating income (loss) (1,601) 3,395 Other income (expense):
Foreign exchange gain (loss) 263 (42)Other income, net 232 52
Total other income, net 495 10Income (loss) before income taxes and discontinued operations (1,106) 3,405Income tax expense 882 1,162
Net income (loss) from continuing operations (1,988) 2,243Discontinued operations:
Gain from sale of discontinued operations 16,838 —Income (loss) from discontinued operations (410) 263
Net income from discontinued operations 16,428 263Net income $ 14,440 $ 2,506
Net income attributable to common shareholders $ 13,842 $ 2,398
Net income (loss) per share from continuing operations - basic $ (0.52) $ 0.57Gain per share from sale of discontinued operations - basic $ 4.41 $ —Income (loss) per share of discontinued operations - basic (0.11) 0.07Total income per share of discontinued operations - basic $ 4.30 $ 0.07
Net income per share – basic $ 3.62 $ 0.64
Weighted average shares outstanding – basic 3,822 3,723
Net income (loss) per share from continuing operations - diluted $ (0.52) $ 0.56Gain per share from sale of discontinued operations - diluted $ 4.32 $ —Income (loss) per share of discontinued operations - diluted (0.11) 0.07
Total income per share of discontinued operations - diluted $ 4.21 $ 0.07
Net income per share – diluted $ 3.55 $ 0.63
Weighted average shares outstanding – diluted 3,901 3,817

See accompanying notes to consolidated financial statements.
36
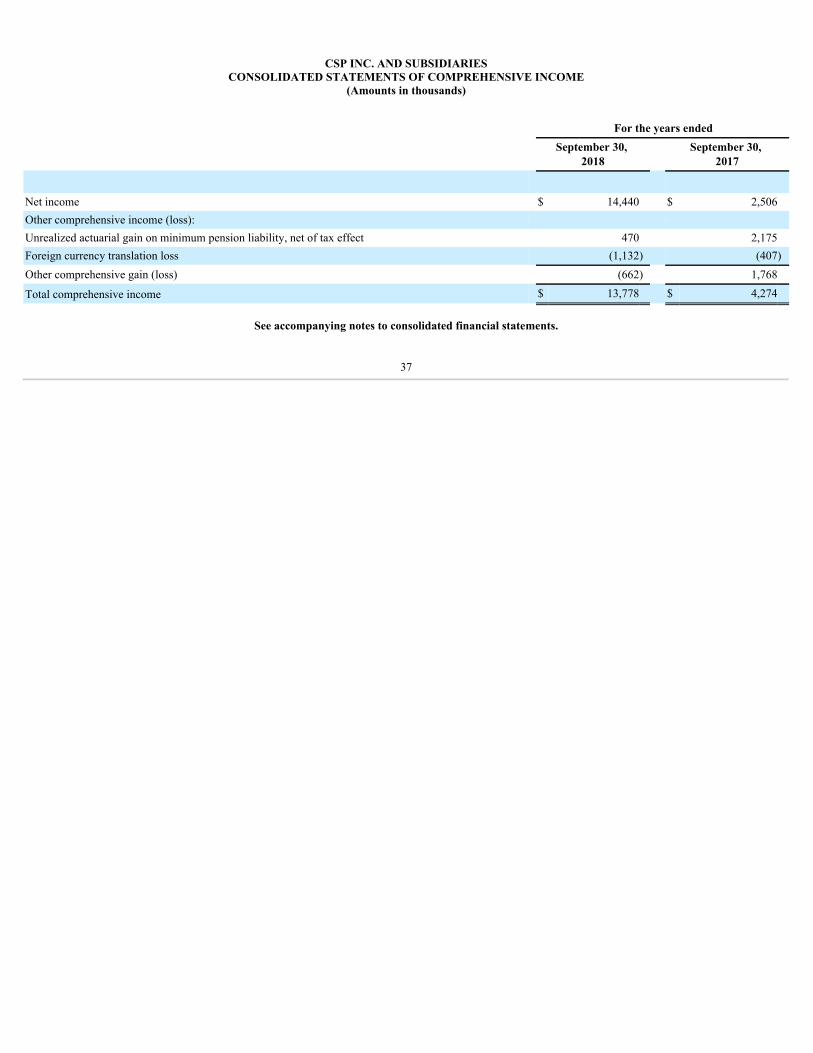
CSP INC. AND SUBSIDIARIESCONSOLIDATED STATEMENTS OF COMPREHENSIVE INCOME
(Amounts in thousands)
For the years ended
September 30,
2018 September 30,
2017
Net income $ 14,440 $ 2,506Other comprehensive income (loss): Unrealized actuarial gain on minimum pension liability, net of tax effect 470 2,175Foreign currency translation loss (1,132) (407)Other comprehensive gain (loss) (662) 1,768
Total comprehensive income $ 13,778 $ 4,274
See accompanying notes to consolidated financial statements.
37
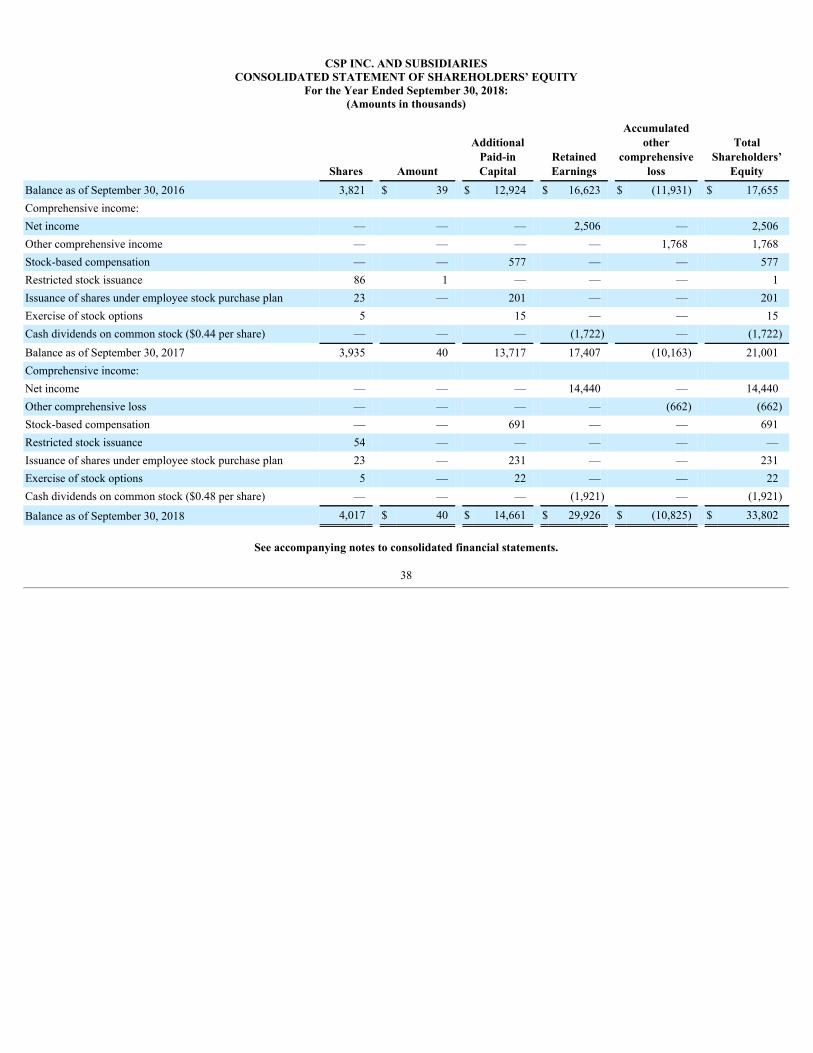
CSP INC. AND SUBSIDIARIESCONSOLIDATED STATEMENT OF SHAREHOLDERS’ EQUITY
For the Year Ended September 30, 2018:(Amounts in thousands)
Shares Amount
AdditionalPaid-inCapital
RetainedEarnings
Accumulatedother
comprehensiveloss
TotalShareholders’
EquityBalance as of September 30, 2016 3,821 $ 39 $ 12,924 $ 16,623 $ (11,931) $ 17,655Comprehensive income: Net income — — — 2,506 — 2,506Other comprehensive income — — — — 1,768 1,768Stock-based compensation — — 577 — — 577Restricted stock issuance 86 1 — — — 1Issuance of shares under employee stock purchase plan 23 — 201 — — 201Exercise of stock options 5 15 — — 15Cash dividends on common stock ($0.44 per share) — — — (1,722) — (1,722)Balance as of September 30, 2017 3,935 40 13,717 17,407 (10,163) 21,001Comprehensive income: Net income — — — 14,440 — 14,440Other comprehensive loss — — — — (662) (662)Stock-based compensation — — 691 — — 691Restricted stock issuance 54 — — — — —Issuance of shares under employee stock purchase plan 23 — 231 — — 231Exercise of stock options 5 — 22 — — 22Cash dividends on common stock ($0.48 per share) — — — (1,921) — (1,921)
Balance as of September 30, 2018 4,017 $ 40 $ 14,661 $ 29,926 $ (10,825) $ 33,802
See accompanying notes to consolidated financial statements.
38
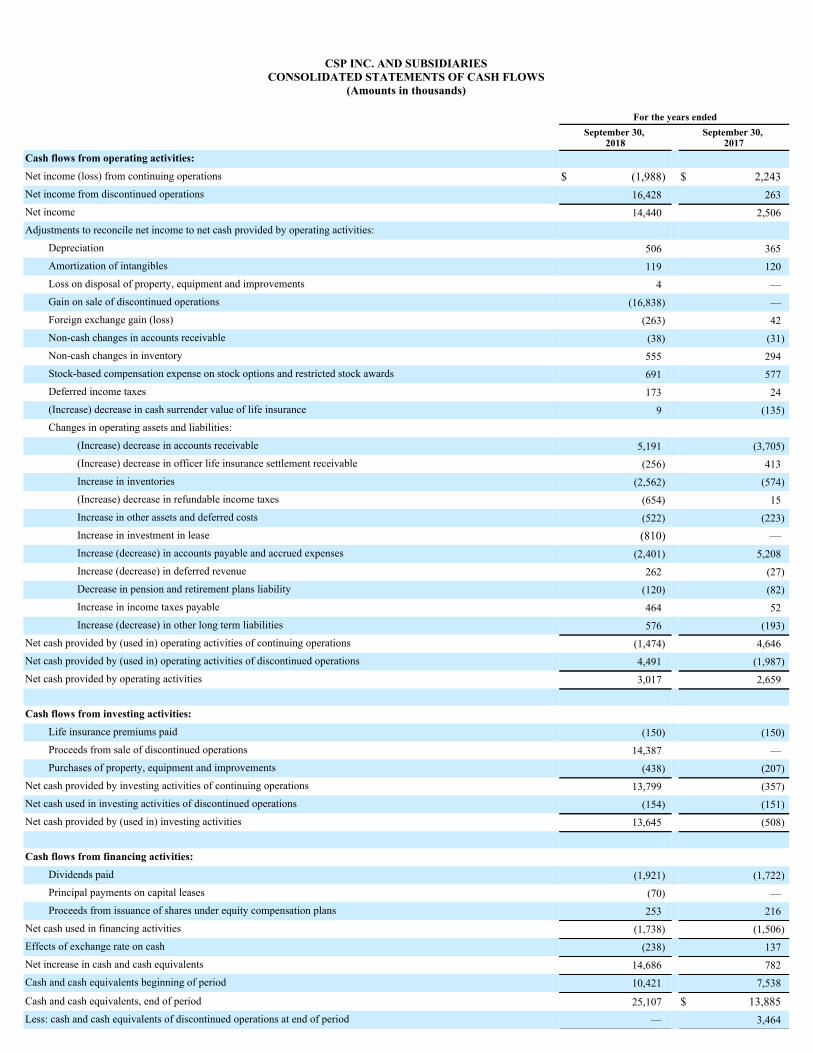
CSP INC. AND SUBSIDIARIESCONSOLIDATED STATEMENTS OF CASH FLOWS
(Amounts in thousands)
For the years ended
September 30,
2018 September 30,
2017Cash flows from operating activities: Net income (loss) from continuing operations $ (1,988) $ 2,243Net income from discontinued operations 16,428 263Net income 14,440 2,506Adjustments to reconcile net income to net cash provided by operating activities:
Depreciation 506 365Amortization of intangibles 119 120Loss on disposal of property, equipment and improvements 4 —Gain on sale of discontinued operations (16,838) —Foreign exchange gain (loss) (263) 42Non-cash changes in accounts receivable (38) (31)Non-cash changes in inventory 555 294Stock-based compensation expense on stock options and restricted stock awards 691 577Deferred income taxes 173 24(Increase) decrease in cash surrender value of life insurance 9 (135)Changes in operating assets and liabilities:
(Increase) decrease in accounts receivable 5,191 (3,705)(Increase) decrease in officer life insurance settlement receivable (256) 413Increase in inventories (2,562) (574)(Increase) decrease in refundable income taxes (654) 15Increase in other assets and deferred costs (522) (223)Increase in investment in lease (810) —Increase (decrease) in accounts payable and accrued expenses (2,401) 5,208Increase (decrease) in deferred revenue 262 (27)Decrease in pension and retirement plans liability (120) (82)Increase in income taxes payable 464 52Increase (decrease) in other long term liabilities 576 (193)
Net cash provided by (used in) operating activities of continuing operations (1,474) 4,646Net cash provided by (used in) operating activities of discontinued operations 4,491 (1,987)Net cash provided by operating activities 3,017 2,659
Cash flows from investing activities:
Life insurance premiums paid (150) (150)Proceeds from sale of discontinued operations 14,387 —Purchases of property, equipment and improvements (438) (207)
Net cash provided by investing activities of continuing operations 13,799 (357)Net cash used in investing activities of discontinued operations (154) (151)Net cash provided by (used in) investing activities 13,645 (508)
Cash flows from financing activities:
Dividends paid (1,921) (1,722)Principal payments on capital leases (70) —Proceeds from issuance of shares under equity compensation plans 253 216
Net cash used in financing activities (1,738) (1,506)Effects of exchange rate on cash (238) 137Net increase in cash and cash equivalents 14,686 782Cash and cash equivalents beginning of period 10,421 7,538
Cash and cash equivalents, end of period 25,107 $ 13,885Less: cash and cash equivalents of discontinued operations at end of period — 3,464

Cash and cash equivalents of continuing operations at end of period $ 25,107 $ 10,421
Supplementary cash flow information: Cash paid for income taxes $ 900 $ 1,142
Cash paid for interest $ 73 $ 75
See accompanying notes to consolidated financial statements.
39
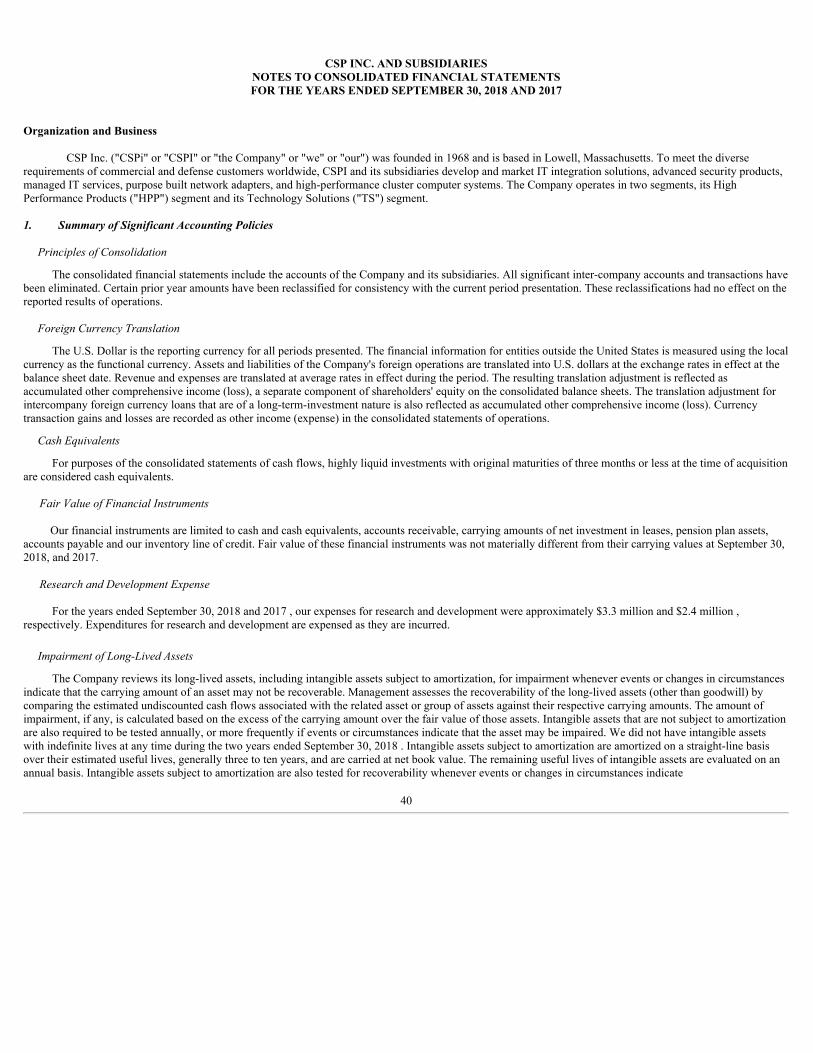
CSP INC. AND SUBSIDIARIESNOTES TO CONSOLIDATED FINANCIAL STATEMENTSFOR THE YEARS ENDED SEPTEMBER 30, 2018 AND 2017
Organization and Business
CSP Inc. ("CSPi" or "CSPI" or "the Company" or "we" or "our") was founded in 1968 and is based in Lowell, Massachusetts. To meet the diverserequirements of commercial and defense customers worldwide, CSPI and its subsidiaries develop and market IT integration solutions, advanced security products,managed IT services, purpose built network adapters, and high-performance cluster computer systems. The Company operates in two segments, its HighPerformance Products ("HPP") segment and its Technology Solutions ("TS") segment.
1. Summary of Significant Accounting Policies
Principles of Consolidation
The consolidated financial statements include the accounts of the Company and its subsidiaries. All significant inter-company accounts and transactions havebeen eliminated. Certain prior year amounts have been reclassified for consistency with the current period presentation. These reclassifications had no effect on thereported results of operations.
Foreign Currency Translation
The U.S. Dollar is the reporting currency for all periods presented. The financial information for entities outside the United States is measured using the localcurrency as the functional currency. Assets and liabilities of the Company's foreign operations are translated into U.S. dollars at the exchange rates in effect at thebalance sheet date. Revenue and expenses are translated at average rates in effect during the period. The resulting translation adjustment is reflected asaccumulated other comprehensive income (loss), a separate component of shareholders' equity on the consolidated balance sheets. The translation adjustment forintercompany foreign currency loans that are of a long-term-investment nature is also reflected as accumulated other comprehensive income (loss). Currencytransaction gains and losses are recorded as other income (expense) in the consolidated statements of operations.
Cash Equivalents
For purposes of the consolidated statements of cash flows, highly liquid investments with original maturities of three months or less at the time of acquisitionare considered cash equivalents.
Fair Value of Financial Instruments
Our financial instruments are limited to cash and cash equivalents, accounts receivable, carrying amounts of net investment in leases, pension plan assets,accounts payable and our inventory line of credit. Fair value of these financial instruments was not materially different from their carrying values at September 30,2018, and 2017.
Research and Development Expense
For the years ended September 30, 2018 and 2017 , our expenses for research and development were approximately $3.3 million and $2.4 million ,respectively. Expenditures for research and development are expensed as they are incurred.
Impairment of Long-Lived Assets
The Company reviews its long-lived assets, including intangible assets subject to amortization, for impairment whenever events or changes in circumstancesindicate that the carrying amount of an asset may not be recoverable. Management assesses the recoverability of the long-lived assets (other than goodwill) bycomparing the estimated undiscounted cash flows associated with the related asset or group of assets against their respective carrying amounts. The amount ofimpairment, if any, is calculated based on the excess of the carrying amount over the fair value of those assets. Intangible assets that are not subject to amortizationare also required to be tested annually, or more frequently if events or circumstances indicate that the asset may be impaired. We did not have intangible assetswith indefinite lives at any time during the two years ended September 30, 2018 . Intangible assets subject to amortization are amortized on a straight-line basisover their estimated useful lives, generally three to ten years, and are carried at net book value. The remaining useful lives of intangible assets are evaluated on anannual basis. Intangible assets subject to amortization are also tested for recoverability whenever events or changes in circumstances indicate
40
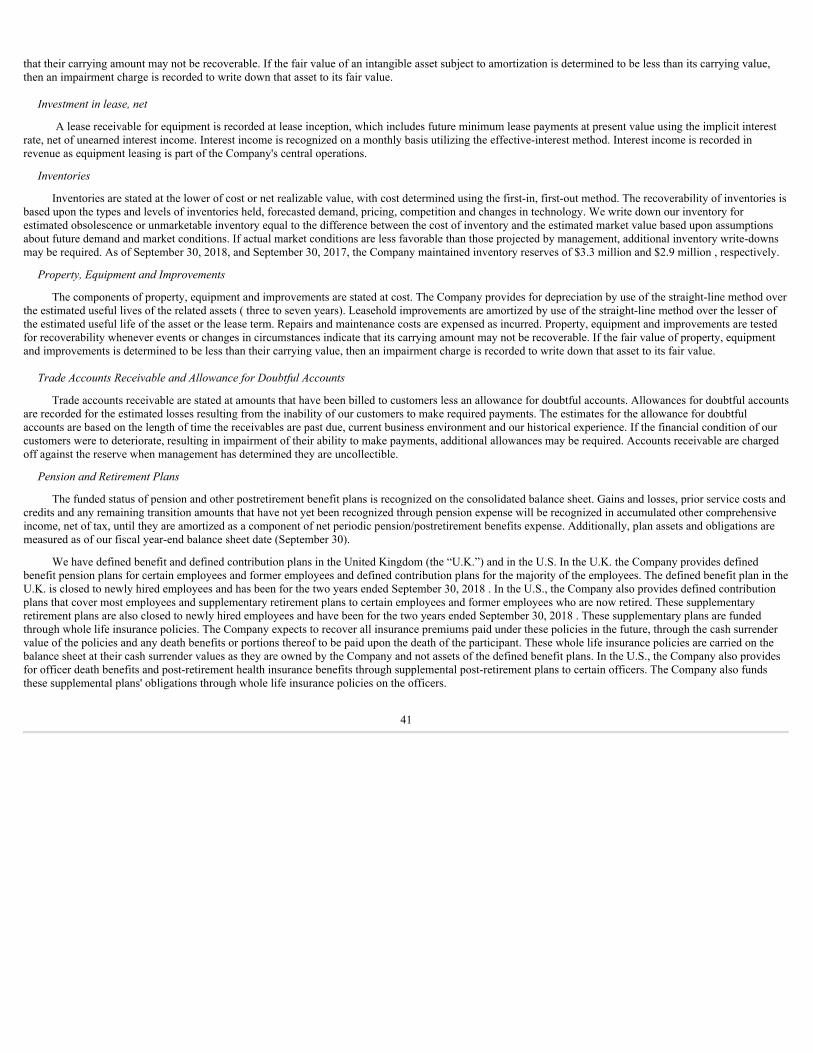
that their carrying amount may not be recoverable. If the fair value of an intangible asset subject to amortization is determined to be less than its carrying value,then an impairment charge is recorded to write down that asset to its fair value.
Investment in lease, net
A lease receivable for equipment is recorded at lease inception, which includes future minimum lease payments at present value using the implicit interestrate, net of unearned interest income. Interest income is recognized on a monthly basis utilizing the effective-interest method. Interest income is recorded inrevenue as equipment leasing is part of the Company's central operations.
Inventories
Inventories are stated at the lower of cost or net realizable value, with cost determined using the first-in, first-out method. The recoverability of inventories isbased upon the types and levels of inventories held, forecasted demand, pricing, competition and changes in technology. We write down our inventory forestimated obsolescence or unmarketable inventory equal to the difference between the cost of inventory and the estimated market value based upon assumptionsabout future demand and market conditions. If actual market conditions are less favorable than those projected by management, additional inventory write-downsmay be required. As of September 30, 2018, and September 30, 2017, the Company maintained inventory reserves of $3.3 million and $2.9 million , respectively.
Property, Equipment and Improvements
The components of property, equipment and improvements are stated at cost. The Company provides for depreciation by use of the straight-line method overthe estimated useful lives of the related assets ( three to seven years). Leasehold improvements are amortized by use of the straight-line method over the lesser ofthe estimated useful life of the asset or the lease term. Repairs and maintenance costs are expensed as incurred. Property, equipment and improvements are testedfor recoverability whenever events or changes in circumstances indicate that its carrying amount may not be recoverable. If the fair value of property, equipmentand improvements is determined to be less than their carrying value, then an impairment charge is recorded to write down that asset to its fair value.
Trade Accounts Receivable and Allowance for Doubtful Accounts
Trade accounts receivable are stated at amounts that have been billed to customers less an allowance for doubtful accounts. Allowances for doubtful accountsare recorded for the estimated losses resulting from the inability of our customers to make required payments. The estimates for the allowance for doubtfulaccounts are based on the length of time the receivables are past due, current business environment and our historical experience. If the financial condition of ourcustomers were to deteriorate, resulting in impairment of their ability to make payments, additional allowances may be required. Accounts receivable are chargedoff against the reserve when management has determined they are uncollectible.
Pension and Retirement Plans
The funded status of pension and other postretirement benefit plans is recognized on the consolidated balance sheet. Gains and losses, prior service costs andcredits and any remaining transition amounts that have not yet been recognized through pension expense will be recognized in accumulated other comprehensiveincome, net of tax, until they are amortized as a component of net periodic pension/postretirement benefits expense. Additionally, plan assets and obligations aremeasured as of our fiscal year-end balance sheet date (September 30).
We have defined benefit and defined contribution plans in the United Kingdom (the “U.K.”) and in the U.S. In the U.K. the Company provides definedbenefit pension plans for certain employees and former employees and defined contribution plans for the majority of the employees. The defined benefit plan in theU.K. is closed to newly hired employees and has been for the two years ended September 30, 2018 . In the U.S., the Company also provides defined contributionplans that cover most employees and supplementary retirement plans to certain employees and former employees who are now retired. These supplementaryretirement plans are also closed to newly hired employees and have been for the two years ended September 30, 2018 . These supplementary plans are fundedthrough whole life insurance policies. The Company expects to recover all insurance premiums paid under these policies in the future, through the cash surrendervalue of the policies and any death benefits or portions thereof to be paid upon the death of the participant. These whole life insurance policies are carried on thebalance sheet at their cash surrender values as they are owned by the Company and not assets of the defined benefit plans. In the U.S., the Company also providesfor officer death benefits and post-retirement health insurance benefits through supplemental post-retirement plans to certain officers. The Company also fundsthese supplemental plans' obligations through whole life insurance policies on the officers.
41
Pension expense is based on an actuarial computation of current future benefits using estimates for expected return on assets, expected compensationincreases and applicable discount rates. Management has reviewed the discount rates and rates of return with our consulting actuaries and investment advisor andconcluded they were reasonable. A decrease in the expected return on pension assets would increase pension expense. Expected compensation increases areestimated based on historical and expected increases in the future. Increases in estimated compensation increases would result in higher pension expense whiledecreases would lower pension expense. Discount rates are selected based upon rates of return on high quality fixed income investments currently available andexpected to be available during the period to maturity of the pension benefit. A decrease in the discount rate would result in greater pension expense while anincrease in the discount rate would decrease pension expense.
The Company funds its pension plans in amounts sufficient to meet the requirements set forth in applicable employee benefits laws and local tax laws.Liabilities for amounts in excess of these funding levels are accrued and reported in the consolidated balance sheets.
Segment Information
We have two operating segments; (i) High Performance Products ("HPP") and (ii) Technology Solutions ("TS"). In the HPP segment, we design,manufacture and deliver products and services to customers that require specialized cyber security services, networking and signal processing products. In the TSsegment, we focus on value added reseller ("VAR") integrated solutions including third party hardware, software and technical computer-related consulting andmanaged services. The operations and assets of our HPP segment are located in the United States. The operations and assets of our TS segment are located in theUnited States and the United Kingdom.
Revenue Recognition
We derive revenue from the sale of integrated hardware and software, professional services, maintenance contracts, other services, and third party servicecontracts. Professional services generally include implementation, installation, and training services. Other services generally include revenue generated throughour royalty and extended warranty contracts. We recognize revenue when persuasive evidence of an arrangement exists, delivery of the product or service hasoccurred, the fee is fixed and determinable and collectability is reasonably assured. We enter into multiple element arrangements as well as standalone sales ofproduct, professional services, and other services.
We recognize revenue from standalone product sales upon transfer of title, which is typically upon shipment, provided all other revenue recognition criteriahave been met. Revenue generated from standalone professional services and extended warranty contracts is recognized as services are completed, provided allother revenue recognition criteria have been met. In some instances professional service contracts include a customer acceptance provision, in which case revenueis deferred until we have evidence of customer acceptance. We recognize revenue from usage based royalty contracts upon confirmation from the customer ofshipment of the system produced pursuant to the royalty agreement.
We recognize revenue from multiple element arrangements in accordance with ASC 605-25, Multiple Element Arrangements . We evaluate multiple elementarrangements to determine if separate units of accounting exist, and if so, we allocate revenue to each element based upon the relative selling price of eachelement. ASC 605-25 establishes a hierarchy for determining the amount to allocate to each separate deliverable in an arrangement. We determine selling priceusing vendor specific objective evidence ("VSOE"), if it exists; or, if VSOE does not exist, third party evidence ("TPE") of fair value if applicable; otherwise, weuse the best estimate of selling price ("BESP"). The objective of BESP is to determine the price at which the Company would transact if the element was sold on astandalone basis. Management’s determination of BESP involves several factors including budgeted profit margins, and cost to complete services.
We recognize revenue from third party service contracts as either gross sales or net sales in accordance with ASC 605-45, Principal Agent Considerations ,which requires us to determine if the Company is acting as a principal party to the transaction or simply acting as an agent or broker. Under ASC 605-45, theassumption of the risks and rewards under the arrangement are considered indicators of principal parties to the arrangement. We record revenue as gross when it isa principal party to the arrangement and net of cost when we are acting as a broker or agent. Under gross sales recognition, the entire selling price is recorded inrevenue and our cost to the third-party service provider or vendor is recorded in cost of goods sold. Under net sales recognition, the cost to the third-party serviceprovider or vendor is recorded as a reduction to revenue resulting in net sales equal to the gross profit on the transaction.
The following policies are applicable to our major categories of segment revenue transactions:
42
HPP Segment Revenue
HPP segment revenue is derived from the sale of integrated hardware and software, maintenance, and other services through the Multicomputer andMyricom product lines. Multicomputer product revenue is generally recognized when product is shipped, provided that all revenue recognition criteria are met.Service revenue consists principally of royalty revenue, repair service revenue and warranty revenue. Revenue generated from extended warranty contracts isrecognized as services are completed, provided all other revenue recognition criteria have been met. We recognize revenue from usage based royalty contractsupon confirmation from the customer of shipment of the system produced pursuant to the royalty agreement. In the years ended September 30, 2018 and 2017,respectively, $2.5 million and $5.4 million of royalty income is included in service revenues.
Myricom revenue is derived from the sale of products, which are comprised of both hardware and embedded software which is essential to the productsfunctionality, and post contract maintenance and support. Revenue on multiple element arrangements is recognized in accordance with ASC 605-25. We evaluatemultiple element arrangements to determine if separate units of accounting exist, and if so, we allocate revenue to each element based upon the relative sellingprice of each element. We determine selling price using BESP. Management’s determination of BESP is based on several factors, including, but not limited to,internal costs and gross margin objectives. Accordingly, revenue for post contract maintenance and support is recognized over the implied maintenance period ofeither one or three years, and revenue for product sales is recognized upon delivery assuming all other revenue recognition criteria have been met.
TS Segment Revenue
TS Segment revenue is derived from the sale of hardware, financing of hardware and software, software, professional services, and third party servicecontracts. TS product revenue is generally recognized when product is shipped, provided that all revenue recognition criteria are met. Service revenue consists ofprofessional services which generally include implementation, installation, and training services. Revenue generated from standalone professional services isrecognized as services are completed, provided all other revenue recognition criteria has been met. Our standard sales agreements generally do not includecustomer acceptance provisions. However, in certain instances when arrangements include a customer acceptance provision or there is uncertainty about customeracceptance, revenue is deferred until we have evidence of customer acceptance.
Revenue derived from the sale of products, which are comprised of both hardware and software, and professional services is recognized in accordance withASC 605-25. We evaluate multiple element arrangements to determine if separate units of accounting exist, and if so, we allocate revenue to each element basedupon the relative selling price of each element. We determine selling price using BESP. Management’s determination of BESP is based on several factors,including, but not limited to, internal costs and gross margin objectives. Accordingly, revenue for professional services is recognized as services are completed,and revenue for product sales is recognized upon delivery assuming all other revenue recognition criteria have been met.
We recognize revenue from certain third party service contracts, which are evaluated to determine whether such service revenue should be recorded as grosssales or net sales in accordance ASC 605-45. We evaluate all third party service contracts to determine whether we act as a principal in the transaction and assumethe risks and rewards of ownership or if we are simply acting as an agent or broker. Under gross sales recognition, the entire selling price is recorded in sales andour cost to the third-party service provider or vendor is recorded in cost of goods sold. Under net sales recognition, the cost to the third-party service provider orvendor is recorded as a reduction to sales resulting in net sales equal to the gross profit on the transaction and there are no costs of goods sold. We use the net salesrecognition method for the third party service contracts that we sell when we are not the primary obligor on the contract. We use the gross sales recognition for thethird party service contracts that we sell when we act as principal and are the primary obligor.
Product Warranty Accrual
Our product sales generally include a hardware warranty which ranges from 90 -days to three -years. At time of product shipment, we accrue for theestimated cost to repair or replace potentially defective products. Estimated warranty costs are based upon prior actual warranty costs for substantially similarproducts.
Engineering and Development Expenses
Engineering and development expenses include payroll, employee benefits, stock-based compensation and other headcount-related expenses associated withproduct development. Engineering and development expenses also include third-
43
party development and programming costs. We consider technological feasibility for our software products to be reached upon the release of the software,accordingly, no internal software development costs have been capitalized.
Income Taxes
We use the asset and liability method of accounting for income taxes whereby deferred tax assets and liabilities are recognized for the estimated future taxconsequences attributable to differences between the financial statement carrying amounts of existing assets and liabilities and their respective tax bases. Deferredtax assets and liabilities are measured using enacted tax rates in effect for the year in which those temporary differences are expected to be recovered or settled.The effect on deferred tax assets and liabilities of a change in tax rates is recognized in income in the period that includes the enactment date. We also reducedeferred tax assets by a valuation allowance if, based on the weight of available evidence, it is more likely than not that some portion or all of the recorded deferredtax assets will not be realized in future periods. This methodology requires estimates and judgments in the determination of the recoverability of deferred tax assetsand in the calculation of certain tax liabilities. Valuation allowances are recorded against the gross deferred tax assets that management believes, after consideringall available positive and negative objective evidence, historical and prospective, with greater weight given to historical evidence, that it is more likely than not thatthese assets will not be realized.
In addition, we are required to recognize in the consolidated financial statements, those tax positions determined to be more-likely-than-not of beingsustained upon examination, based on the technical merits of the positions as of the reporting date. If a tax position is not considered more-likely-than-not to besustained based solely on its technical merits, no benefits of the position are recognized.
In addition, the calculation of the Company's tax liabilities involves dealing with uncertainties in the application of complex tax regulations in a multitude ofjurisdictions. The Company records liabilities for estimated tax obligations in the U.S. and other tax jurisdictions. These estimated tax liabilities include theprovision for taxes that may become payable in the future.
Earnings per Share of Common Stock
Basic net income per common share is computed by dividing net income available to common shareholders by the weighted average number of commonshares outstanding for the period. Diluted net income per common share reflects the maximum dilution that would have resulted from the assumed exercise andshare repurchase related to dilutive stock options and is computed by dividing net income by the assumed weighted average number of common sharesoutstanding.
We are required to present earnings per share ("EPS") utilizing the two class method because we had outstanding, non-vested share-based payment awardsthat contain non-forfeitable rights to dividends or dividend equivalents, which are considered participating securities.
44
Basic and diluted earnings per share computations for the Company's reported net income attributable to common stockholders are as follows:
For the years ended
September 30, 2018 September 30, 2017 (Amounts in thousands except per share data)
Net income (loss) from continuing operations $ (1,988) $ 2,243Gain from sale of discontinued operations 16,838 —Income (loss) from discontinued operations (410) 263
Total income from discontinued operations 16,428 263Net income (loss) 14,440 2,506Less: Net income attributable to nonvested common stock 598 108
Net income attributable to common stockholders $ 13,842 $ 2,398
Weighted average total shares outstanding - basic 3,987 3,890Less: weighted average non-vested shares outstanding 165 167Weighted average number of common shares outstanding - basic 3,822 3,723Potential common shares from non-vested stock awards and the assumed exercise of stock options 79 94
Weighted average common shares outstanding - diluted 3,901 3,817
Net income (loss) from continuing operations per share - basic $ (0.52) $ 0.57Net income from discontinued operations per share - basic $ 4.30 $ 0.07Net income per share - basic $ 3.62 $ 0.64
Net income (loss) from continuing operations per share - diluted $ (0.52) $ 0.56Net income from discontinued operations per share - diluted $ 4.21 $ 0.07Net income per share - diluted $ 3.55 $ 0.63
All anti-dilutive securities, including stock options, are excluded from the diluted income per share computation. For the years ended September 30, 2018and September 30, 2017 , there were no shares subject to stock options excluded from the diluted net income per share calculation because their inclusion wouldhave been anti-dilutive. Non-vested restricted stock awards of 165,000 shares were excluded from net income (loss) per share from continuing operations as therewas a net loss from continuing operations for the year ended September 30, 2018, and their inclusion would have been anti-dilutive.
Use of Estimates
The preparation of consolidated financial statements in conformity with accounting principles generally accepted in the United States requires managementto make estimates and assumptions that affect the reported amounts of assets and liabilities and disclosure of contingent assets and liabilities at the date of thefinancial statements and the reported amounts of revenues and expenses during the reporting period. Actual results may differ from those estimates under differentassumptions or conditions.
Stock-Based Compensation
We measure and recognize compensation expense for all stock-based payment awards made to employees and directors including stock options andnonvested shares of restricted common stock based on estimated fair values of stock-based payment awards on the date of grant. The Company uses the Black-Scholes option-pricing model to calculate the fair value of stock option grants. The fair value of nonvested restricted share awards is equal to the quoted marketprice of our common stock as quoted on the Nasdaq Global Market on the date of grant. The fair value of the portion of the award that is ultimately expected tovest is recognized as expense over the requisite service periods in the Company's consolidated statements of operations.
Because stock-based compensation expense recognized in the consolidated statements of operations for the fiscal years ended September 30, 2018 and 2017is based on awards ultimately expected to vest, it has been reduced for estimated forfeitures and will be revised, if necessary, in subsequent periods if actualforfeitures differ from those estimates.
45
Stock-based compensation expense recognized for the fiscal years ended September 30, 2018 and 2017 consisted of stock-based compensation expense
related to options and restricted stock granted pursuant to the Company's stock incentive and employee stock purchase plans of approximately $0.7 million and$0.6 million , respectively.
Concentrations of Credit Risk
Cash and cash equivalents are maintained with several financial institutions in the U.S. and the U.K. Deposits held with banks may exceed the amount ofinsurance on such deposits. Generally, these deposits may be redeemed upon demand. The Company has not experienced any losses in such accounts and believesit is not exposed to any significant credit risk on cash and cash equivalents.
Subsequent Events
The Company recognizes in the consolidated financial statements the effects of all subsequent events that provide additional evidence about conditions thatexisted at the date of the statement of financial position, including the estimates inherent in the process of preparing financial statements. The Company hasevaluated subsequent events through the date of this filing.
New Accounting Pronouncements
In May 2014, the FASB issued ASU No. 2014-09, Revenue from Contracts with Customers , which requires an entity to recognize the amount of revenueto which it expects to be entitled for the transfer of promised goods or services to customers. The standard outlines a five-step model whereby revenue isrecognized as performance obligations within a contract are satisfied. The standard also requires new, expanded disclosures regarding revenue recognition. TheASU replaces most existing revenue recognition guidance in GAAP. We utilized a bottom-up approach to analyze the standard's impact on our contract portfolio,comparing our historical accounting policies and practices, and identifying potential differences from applying the requirements of the new standard to ourcontracts. Because the new standard impacts our business processes, systems and controls, we developed a comprehensive change management project plan toguide the implementation. The new standard was adopted by the Company effective October 1, 2018 using the modified retrospective approach. A portfolioapproach for similar contracts was utilized in adoption. Under the new standard, product revenue sold as part of a multi-element agreement will no longer bedeferred as it will now be recognized when control is transferred due to product being a separate performance obligation. Additionally, revenue will not be deferredon customer support related to the HPP segment as this was determined to be immaterial within the context of the contract, and therefore not a separateperformance obligation under the new standard. Onboarding revenue will be amortized over the contract period and, under the new standard, includes the estimatedrenewal period. Each reporting period the Company will make estimates for contracts that have volume discounts, as separate performance obligations may arisefrom these discounts if a material right to the customer exists, which could affect the timing of revenue recognition. The Company enters into noncancelablecontracts in which it has an unconditional right to consideration when the contract is signed by both parties. This will result in a receivable and deferred revenuebeing recorded when the contract is signed by both parties rather than when work is performed. The new standard requires an entity to present any unconditionalrights to consideration separately as a receivable and conditional rights as a contract asset. The Company has determined when it has the right to bill a customer,accounts receivable is recorded as an unconditional right exists. This could result as contract assets being recorded rather than a receivable. The effects of adoptiondid not have a material impact on October 1, 2018.
Effective September 30, 2017, the Company adopted FASB ASU No. 2014-15, Disclosure of Uncertainties about an Entity’s Ability to Continue as a GoingConcern, an amendment of the FASB Accounting Standards Codification. The ASU has added additional disclosure requirements to the codification. It requiresmanagement to assess, at each interim and annual reporting period, whether substantial doubt exists about an entity’s ability to continue as a going concern.Substantial doubt exists if it is probable (the “probable” threshold under GAAP has generally been interpreted to be between 75 and 80 percent) that the entity willbe unable to meet its obligations as they become due within one year after the date the financial statements are issued or available to be issued (assessment date).This guidance did not have an impact to the Company's consolidated financial statements.
In July 2015, the FASB issued ASU No. 2015-11, Inventory (Topic 330) Simplifying the Measurement of Inventory , which requires entities to measureinventory at the lower of cost and net realizable value, except for inventory measured using last-in, first-out (LIFO) or the retail inventory method. Net realizablevalue is the estimated selling prices in the ordinary course of business, less reasonably predictable costs of completion, disposal, and transportation. This ASU iseffective for fiscal years beginning after December 15, 2016 and requires prospective application, with early adoption permitted as of the beginning of
46
an interim or annual reporting period. Beginning October 1, 2017, the Company adopted the ASU and it hasn’t had a material impact on our consolidated financialstatements.
In November 2015, the FASB issued ASU No, 2015-17, Income Taxes (Topic 740) Balance Sheet Classification of Deferred Taxes, which require thatdeferred tax liabilities and assets be classified as noncurrent in a classified statement of financial position. The amendments in this Topic apply to all entities thatpresent a classified statement of financial position. The current requirement that deferred tax liabilities and assets of a tax-paying component of an entity be offsetand presented as a single amount is not affected by the amendments in this Topic. The amendments in this Topic are effective for financial statements issued forannual periods beginning after December 15, 2016, and interim periods within those annual periods. Beginning October 1, 2017, the Company adopted the ASUand it did not have a material impact on our consolidated financial statements.
In February 2016, the FASB issued ASU 2016-02, Leases (Topic 842) , an amendment of the FASB Accounting Standards Codification. This ASU requireslessees to recognize a right-of-use asset and lease liability for most lease arrangements. The new standard is effective for the Company on October 1, 2019. Thestandard mandates a modified retrospective transition method for all entities and early adoption is permitted. The Company is evaluating the effect that ASU 2016-02 will have on its consolidated financial statements and related disclosures.
In March 2016, the FASB issued ASU No. 2016-09, Compensation - Stock Compensation, Improvements to Employee Share-Based Payment Accounting
(Topic 718), to simplify several aspects of the accounting for share-based payment transactions, including the income tax consequences, classification of awards aseither equity or liabilities, and classification on the statement of cash flows. Additionally, the amendments eliminate the guidance in Topic 718 that wasindefinitely deferred shortly after the issuance of FASB Statement No. 123 (revised 2004), Share-Based Payment. This should not result in a change in practicebecause the guidance that is being superseded was never effective. The Company has adopted this ASU effective October 1, 2017 and it did not have a materialimpact on our consolidated financial statements.
In August 2016, the FASB issued ASU No. 2016-15, Classification of Certain Cash Receipts and Cash Payments , an amendment of the FASB AccountingStandards Codification. This ASU will reduce diversity in practice for classifying cash payments and receipts in the statement of cash flows for a number ofcommon transactions. It will also clarify when identifiable cash flows should be separated versus classified based on their predominant source or use. This ASU iseffective for public business entities for fiscal years beginning after December 15, 2017, and interim periods within those fiscal years. Early adoption is permitted,including adoption in an interim period. If an entity early adopts the amendments in an interim period, any adjustments should be reflected as of the beginning ofthe fiscal year that includes that interim period. An entity that elects early adoption must adopt all of the amendments in the same period. The Company isevaluating the effect that ASU 2016-15 will have on its consolidated financial statements and related disclosures.
In October 2016, the FASB issued ASU No. 2016-16, Intra-Entity Transfers of Assets Other Than Inventory, an amendment of the FASB AccountingStandards Codification. This ASU requires the seller and buyer to recognize at the transaction date the current and deferred income tax consequences ofintercompany asset transfers (except transfers of inventory). Under current GAAP, the seller and buyer defer the consolidated tax consequences of an intercompanyasset transfer from the period of the transfer to a future period when the asset is transferred out of the consolidated group, or otherwise affects consolidatedearnings. This standard will cause volatility in companies’ effective tax rates, particularly for those that transfer intangible assets to foreign subsidiaries. For publicentities, the new standard is effective for annual and interim periods in fiscal years beginning after December 15, 2017. An entity may early adopt the standard butonly at the beginning of an annual period for which it has not issued or made available for issuance financial statements (interim or annual). The Company isevaluating the effect that ASU 2016-16 will have on its consolidated financial statements and related disclosures.
In January 2017, FASB issued ASU No. 2017-01, Business Combinations Clarifying the Definition of a Business (Topic 805) (“ASU No. 2017-01”). ASU 2017-01 provides a framework to use in determining when a set of assets and activities is a business. ASU 2017-01 provides more consistency inapplying the business combination guidance, reduces the costs of application, and makes the definition of a business more operable. ASU 2017-01 is effective forinterim and annual periods within those annual periods beginning after December 15, 2017. The Company is currently evaluating the impact ASU 2017-01 willhave on the Company’s results of operations, financial position and disclosures.
In March 2017, the FASB issued ASU No. 2017-07, Compensation Retirement Benefits (Topic 715): Improving the Presentation of Net Periodic PensionCost and Net Periodic Postretirement Benefit Cost , an amendment of the FASB Accounting Standards Codification. This ASU requires employers that sponsordefined benefit pension and/or other post-retirement benefit plans to report the service cost component of net benefit cost in the same line item as othercompensation
47
costs arising from services rendered by the pertinent employees during the period. Employers are required to present the other components of net benefit costs inthe income statement separately from the service cost component and outside a subtotal of income from operations. Additionally, only the service cost componentof net periodic pension cost will be eligible for asset capitalization. For public entities, the new standard is effective for annual periods beginning after December15, 2017, including interim periods within that annual period. Early adoption is permitted as of the beginning of an annual period for which financial statements(interim or annual) have not been issued or made available for issuance. This ASU should be applied retrospectively for the presentation of the service costcomponent and the other components of net periodic pension cost and net periodic postretirement benefit cost in the income statement and prospectively, on andafter the effective date, for the capitalization of the service cost component of net periodic pension cost and net periodic postretirement benefit in assets. TheCompany is evaluating the effect that ASU 2017-07 will have on its consolidated financial statements and related disclosures.
In February 2018, the FASB issued ASU No. 2018-02, Income Statement - Reporting Comprehensive Income (Topic 220): Reclassification of Certain TaxEffects from Accumulated Other Comprehensive Income, an amendment of the FASB Accounting Standards Codification. This update addresses issues from theTax Cuts and Jobs Act enacted on December 22, 2017. The amendment allows for a reclassification from accumulated other comprehensive income to retainedearnings for stranded tax effects resulting from the Act. There are also certain required disclosures about the stranded tax effects. For public entities, the newstandard is effective for annual periods beginning after December 15, 2018. The Company is evaluating the effect that ASU 2018-02 will have on its consolidatedfinancial statements and related disclosures.
In June 2018, the FASB issued ASU No. 2018-07, Compensation - Stock Compensation (Topic 718) : Improvements to Nonemployee Share-Based PaymentAccounting, an amendment of the FASB Accounting Standards Codification. Under this ASU companies will no longer be required to value non-employee awardsdifferently from employee awards, but the accounting remains different for attribution and a contractual term election for valuing nonemployee equity shareoptions. Equity-classified awards to nonemployees will now be measured at the grant date using fair value of the equity instruments the company is obligated toissue and recognition is associated with the probable outcome. Awards are subsequently measured using stock compensation guidance unless they are modifiedafter the nonemployee stops providing goods or services. Existing disclosure requirements within the stock compensation guidance also apply to nonemployeeawards. For public entities, the new standard is effective for annual periods beginning after December 15, 2018, including interim periods within that fiscal year.The Company is evaluating the effect that ASU 2018-07 will have on its consolidated financial statements and related disclosures.
In August 2018, the FASB issued ASU No. 2018-14, Compensation - Retirement Benefits - Defined Benefit Plans - General (Subtopic 715-20) : DisclosureFramework-Changes to the Disclosure Requirements for Defined Benefit Plans, an amendment of the FASB Accounting Standards Codification. Under this ASUexisting disclosures not considered cost beneficial are removed, disclosures identified as relevant are added, and there is added clarification regarding specificexisting disclosures. For public entities, the new standard is effective for annual periods beginning after December 15, 2020. The Company is evaluating the effectthat ASU 2018-14 will have on its consolidated financial statements and related disclosures.
2. Discontinued Operations of TS segment
On July 31, 2018, CSPi LTD, a wholly owned indirect subsidiary of the Company, completed its sale of all of the outstanding stock of Modcomp GmbH,to Reply AG, an affiliate of Reply SpA, a holding company for a worldwide group of companies, pursuant to the terms of a Share Purchase and AssignmentAgreement dated June 27, 2018. Modcomp GmbH, dba CSPI GmbH, through itself and its wholly owned subsidiaries, provided managed security services tocustomers primarily in Germany.
Upon the closing of the Share Purchase Agreement, Reply AG paid to CSPI total cash at closing of approximately $14.4 million, which consisted of theoriginal purchase price of $11.7 million plus an adjustment at closing for Net Cash (as defined in the Share Purchase Agreement) of approximately $2.7 million .An additional €400 thousand is included in escrow and will be recorded if and when received by the Company. Accordingly, CSPi determined that the assets andliabilities of this reportable segment met the discontinued operations criteria in U.S. GAAP in the year ended September 30, 2018. The gain recorded due to thesale of all the stock of Modcomp GmbH was approximately $16.8 million . No income taxes were provided as the transaction was a tax-free exchange in the U.K.As such, Modcomp GmbH's results have been recorded as discontinued operations in the accompanying consolidated balance sheets and consolidated statements ofoperations for all periods presented.
48
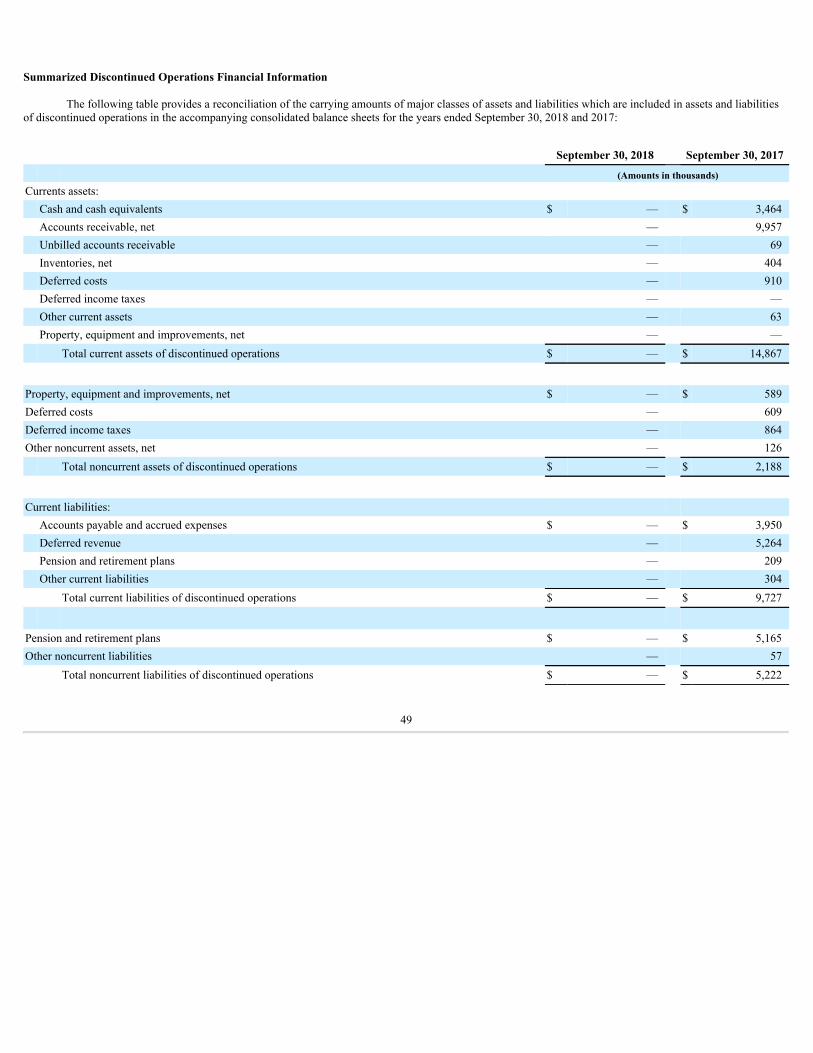
Summarized Discontinued Operations Financial Information
The following table provides a reconciliation of the carrying amounts of major classes of assets and liabilities which are included in assets and liabilitiesof discontinued operations in the accompanying consolidated balance sheets for the years ended September 30, 2018 and 2017:
September 30, 2018 September 30, 2017 (Amounts in thousands)Currents assets: Cash and cash equivalents $ — $ 3,464 Accounts receivable, net — 9,957 Unbilled accounts receivable — 69 Inventories, net — 404 Deferred costs — 910 Deferred income taxes — — Other current assets — 63 Property, equipment and improvements, net — — Total current assets of discontinued operations $ — $ 14,867
Property, equipment and improvements, net $ — $ 589Deferred costs — 609Deferred income taxes — 864Other noncurrent assets, net — 126 Total noncurrent assets of discontinued operations $ — $ 2,188
Current liabilities: Accounts payable and accrued expenses $ — $ 3,950 Deferred revenue — 5,264 Pension and retirement plans — 209 Other current liabilities — 304 Total current liabilities of discontinued operations $ — $ 9,727
Pension and retirement plans $ — $ 5,165Other noncurrent liabilities — 57 Total noncurrent liabilities of discontinued operations $ — $ 5,222
49
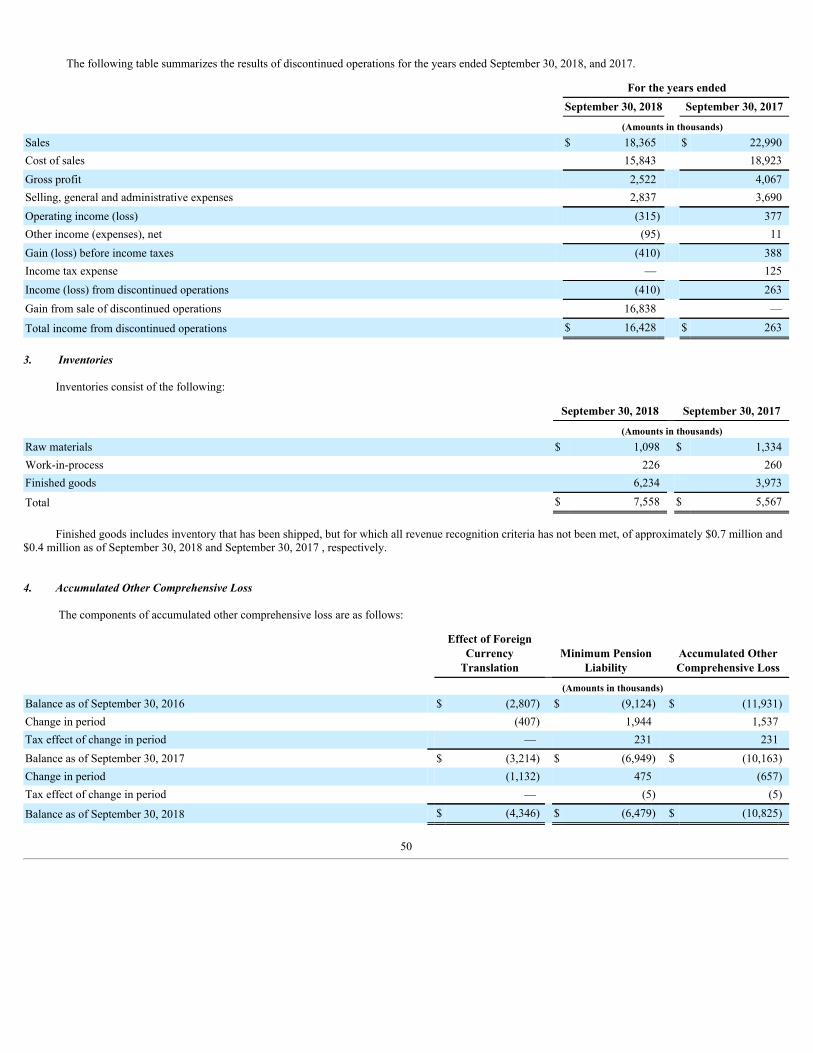
The following table summarizes the results of discontinued operations for the years ended September 30, 2018, and 2017.
For the years ended September 30, 2018 September 30, 2017 (Amounts in thousands)Sales $ 18,365 $ 22,990Cost of sales 15,843 18,923Gross profit 2,522 4,067Selling, general and administrative expenses 2,837 3,690Operating income (loss) (315) 377Other income (expenses), net (95) 11Gain (loss) before income taxes (410) 388Income tax expense — 125Income (loss) from discontinued operations (410) 263Gain from sale of discontinued operations 16,838 —
Total income from discontinued operations $ 16,428 $ 263
3. Inventories
Inventories consist of the following:
September 30, 2018 September 30, 2017 (Amounts in thousands)Raw materials $ 1,098 $ 1,334Work-in-process 226 260Finished goods 6,234 3,973
Total $ 7,558 $ 5,567
Finished goods includes inventory that has been shipped, but for which all revenue recognition criteria has not been met, of approximately $0.7 million and$0.4 million as of September 30, 2018 and September 30, 2017 , respectively. 4. Accumulated Other Comprehensive Loss
The components of accumulated other comprehensive loss are as follows:
Effect of ForeignCurrencyTranslation
Minimum PensionLiability
Accumulated OtherComprehensive Loss
(Amounts in thousands)Balance as of September 30, 2016 $ (2,807) $ (9,124) $ (11,931)Change in period (407) 1,944 1,537Tax effect of change in period — 231 231Balance as of September 30, 2017 $ (3,214) $ (6,949) $ (10,163)Change in period (1,132) 475 (657)Tax effect of change in period — (5) (5)
Balance as of September 30, 2018 $ (4,346) $ (6,479) $ (10,825)
50
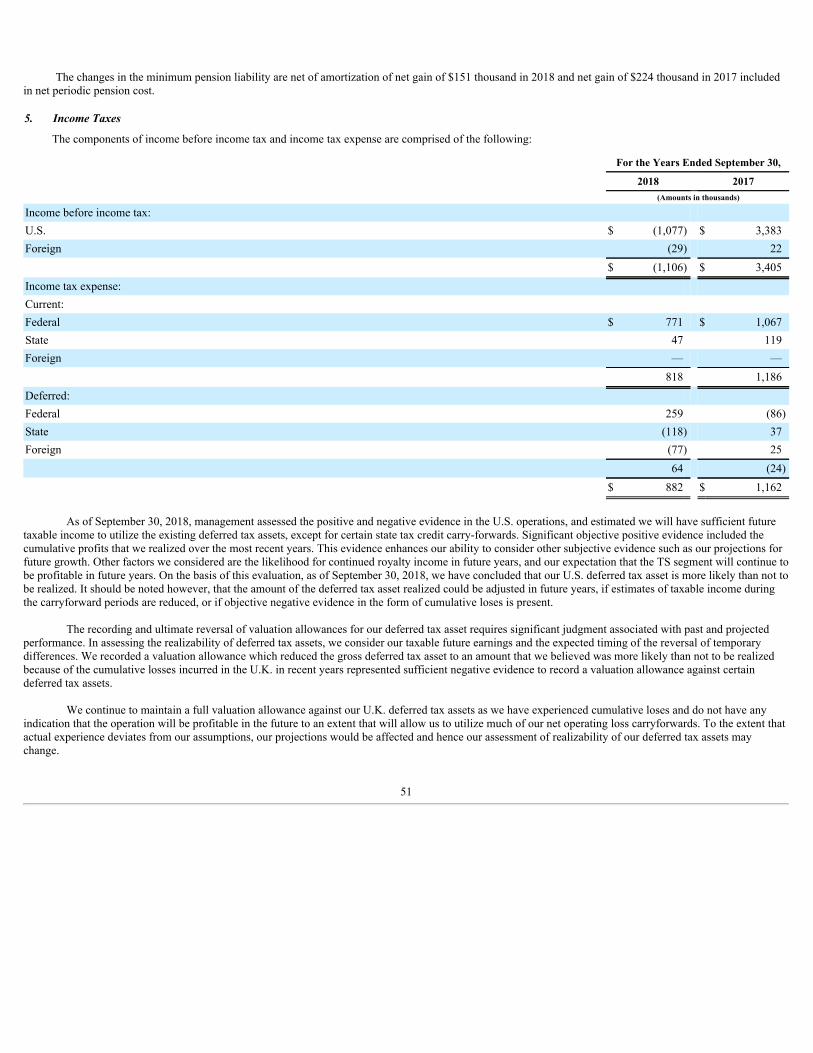
The changes in the minimum pension liability are net of amortization of net gain of $151 thousand in 2018 and net gain of $224 thousand in 2017 includedin net periodic pension cost.
5. Income Taxes
The components of income before income tax and income tax expense are comprised of the following:
For the Years Ended September 30,
2018 2017 (Amounts in thousands)
Income before income tax:
U.S. $ (1,077) $ 3,383Foreign (29) 22
$ (1,106) $ 3,405
Income tax expense:
Current:
Federal $ 771 $ 1,067State 47 119Foreign — —
818 1,186
Deferred:
Federal 259 (86)State (118) 37Foreign (77) 25
64 (24)
$ 882 $ 1,162
As of September 30, 2018, management assessed the positive and negative evidence in the U.S. operations, and estimated we will have sufficient future
taxable income to utilize the existing deferred tax assets, except for certain state tax credit carry-forwards. Significant objective positive evidence included thecumulative profits that we realized over the most recent years. This evidence enhances our ability to consider other subjective evidence such as our projections forfuture growth. Other factors we considered are the likelihood for continued royalty income in future years, and our expectation that the TS segment will continue tobe profitable in future years. On the basis of this evaluation, as of September 30, 2018, we have concluded that our U.S. deferred tax asset is more likely than not tobe realized. It should be noted however, that the amount of the deferred tax asset realized could be adjusted in future years, if estimates of taxable income duringthe carryforward periods are reduced, or if objective negative evidence in the form of cumulative loses is present.
The recording and ultimate reversal of valuation allowances for our deferred tax asset requires significant judgment associated with past and projectedperformance. In assessing the realizability of deferred tax assets, we consider our taxable future earnings and the expected timing of the reversal of temporarydifferences. We recorded a valuation allowance which reduced the gross deferred tax asset to an amount that we believed was more likely than not to be realizedbecause of the cumulative losses incurred in the U.K. in recent years represented sufficient negative evidence to record a valuation allowance against certaindeferred tax assets.
We continue to maintain a full valuation allowance against our U.K. deferred tax assets as we have experienced cumulative loses and do not have anyindication that the operation will be profitable in the future to an extent that will allow us to utilize much of our net operating loss carryforwards. To the extent thatactual experience deviates from our assumptions, our projections would be affected and hence our assessment of realizability of our deferred tax assets maychange.
51
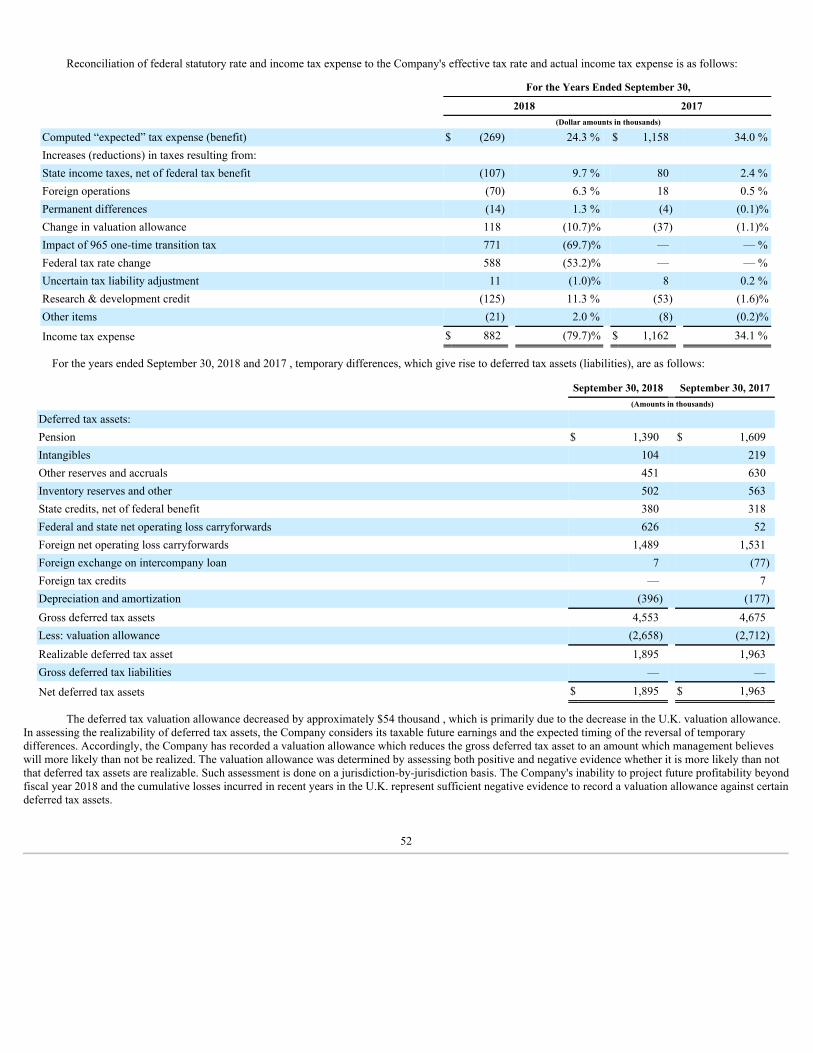
Reconciliation of federal statutory rate and income tax expense to the Company's effective tax rate and actual income tax expense is as follows:
For the Years Ended September 30,
2018 2017 (Dollar amounts in thousands)
Computed “expected” tax expense (benefit) $ (269) 24.3 % $ 1,158 34.0 %Increases (reductions) in taxes resulting from: State income taxes, net of federal tax benefit (107) 9.7 % 80 2.4 %Foreign operations (70) 6.3 % 18 0.5 %Permanent differences (14) 1.3 % (4) (0.1)%Change in valuation allowance 118 (10.7)% (37) (1.1)%Impact of 965 one-time transition tax 771 (69.7)% — — %Federal tax rate change 588 (53.2)% — — %Uncertain tax liability adjustment 11 (1.0)% 8 0.2 %Research & development credit (125) 11.3 % (53) (1.6)%Other items (21) 2.0 % (8) (0.2)%
Income tax expense $ 882 (79.7)% $ 1,162 34.1 %
For the years ended September 30, 2018 and 2017 , temporary differences, which give rise to deferred tax assets (liabilities), are as follows:
September 30, 2018 September 30, 2017 (Amounts in thousands)
Deferred tax assets:
Pension $ 1,390 $ 1,609Intangibles 104 219Other reserves and accruals 451 630Inventory reserves and other 502 563State credits, net of federal benefit 380 318Federal and state net operating loss carryforwards 626 52Foreign net operating loss carryforwards 1,489 1,531Foreign exchange on intercompany loan 7 (77)Foreign tax credits — 7Depreciation and amortization (396) (177)Gross deferred tax assets 4,553 4,675Less: valuation allowance (2,658) (2,712)Realizable deferred tax asset 1,895 1,963Gross deferred tax liabilities — —
Net deferred tax assets $ 1,895 $ 1,963
The deferred tax valuation allowance decreased by approximately $54 thousand , which is primarily due to the decrease in the U.K. valuation allowance.In assessing the realizability of deferred tax assets, the Company considers its taxable future earnings and the expected timing of the reversal of temporarydifferences. Accordingly, the Company has recorded a valuation allowance which reduces the gross deferred tax asset to an amount which management believeswill more likely than not be realized. The valuation allowance was determined by assessing both positive and negative evidence whether it is more likely than notthat deferred tax assets are realizable. Such assessment is done on a jurisdiction-by-jurisdiction basis. The Company's inability to project future profitability beyondfiscal year 2018 and the cumulative losses incurred in recent years in the U.K. represent sufficient negative evidence to record a valuation allowance against certaindeferred tax assets.
52
On December 22, 2017, the President of the United States signed into law the Tax Cuts and Jobs Act ("Tax Reform Act"). The legislation significantlychanges U.S. tax law by, among other things, lowering corporate income tax rates, implementing a territorial tax system, expanding the tax base and imposing a taxon deemed repatriated earnings of foreign subsidiaries. The Tax Reform Act permanently reduces the U.S. corporate federal income tax rate from a maximum of35% to a flat 21% rate, effective January 1, 2018. The Company has recognized the impact of the Tax Reform Act in these consolidated financial statements andrelated disclosures. Staff Accounting Bulletin No. 118 ("SAB 118") provides Companies with guidance on accounting for the impact of the Tax Reform Act.Specifically, SAB 118 provides for a measurement period, not to exceed one year, that begins on the date of enactment of December 22, 2017, and ends when theCompany has obtained, prepared, and analyzed information needed to complete accounting requirements which is substantially complete. In accordance with SAB118, the recorded amounts reflecting the impact of the Tax Reform Act in these consolidated financial statements and related disclosures. The impact of theremeasurement of the Company’s US deferred tax assets and liabilities to 21% resulted in a tax expense of approximately $0.5 million consisting of a reduction ofthe Company’s net deferred tax asset. The Company recorded tax expense of approximately $0.8 million related to the deemed repatriation tax. As new provisionsfor Global Intangible Low-Tax Income ("GILTI") are effective for tax years beginning after December 31, 2017, the Company has not calculated any tax relatedimpact for GILTI during the period.
For fiscal taxpayers, the rate change is effective at the beginning of the Company’s fiscal year, using a blended rate for the annual period. The Company’sblended U.S. statutory tax rate for fiscal 2018 is 24.28%. In future years, the corporate tax rate will be 21%.
As of September 30, 2018 and 2017, the Company had U.S. net operating loss carryforwards for federal purposes of approximately $1.7 million and $0 ,respectively, which are available to offset future taxable income with no expiration. The company had U.S. net operating loss carryforwards for state purposes ofapproximately $0.5 million and $0.4 million , respectively, which are available to offset future taxable income through 2034.
As of September 30, 2018, the Company had other state tax credit carryforwards of $55 thousand available to reduce future state tax expense which hasunlimited carryover status.
As of September 30, 2018, the Company concluded that a net increase of $41 thousand of the valuation allowance for the U.S. was appropriate. As part ofthe Company’s analysis, the Company evaluated, among other factors, its recent history of generating taxable income in state jurisdictions and its near-termforecasts of future taxable income. The net increase in the Company’s valuation allowance of $41 thousand is to reserve for state tax credit carryforwards that theCompany believes will expire unused.
As of September 30, 2018, the Company had U.K. net operating loss carryforwards of approximately $8.8 million that have an indefinite life with noexpiration.
Undistributed earnings of the Company's foreign subsidiaries amounted to approximately $12.7 million and $2.8 million at September 30, 2018 and 2017,respectively. The Company is considering cash distribution of undistributed foreign earnings in the future and will continue to access the potential impact of anyfuture distributions on U.S. taxes. The state impact of a distribution of foreign earnings and profits would not be material.
In addition, the calculation of the Company's tax liabilities involves dealing with uncertainties in the application of complex tax regulations in a multitudeof jurisdictions. The Company records liabilities for estimated tax obligations in the U.S. and other tax jurisdictions. These estimated tax liabilities include theprovision for taxes that may become payable in the future.
As of September 30, 2018, the total amount of uncertain tax liabilities was $220 thousand . We recognized $11 thousand of interest and potential penaltiesaccrued related to unrecognized tax benefits in our provision for income taxes.
53
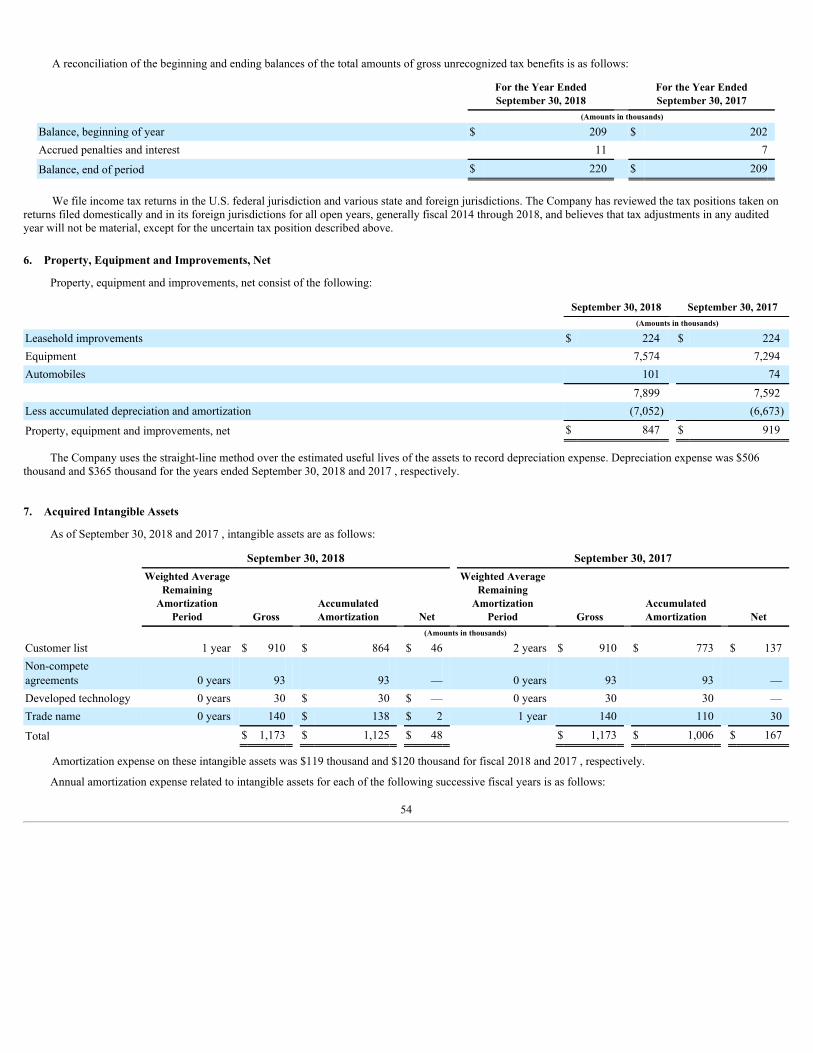
A reconciliation of the beginning and ending balances of the total amounts of gross unrecognized tax benefits is as follows:
For the Year EndedSeptember 30, 2018
For the Year EndedSeptember 30, 2017
(Amounts in thousands)
Balance, beginning of year $ 209 $ 202Accrued penalties and interest 11 7
Balance, end of period $ 220 $ 209
We file income tax returns in the U.S. federal jurisdiction and various state and foreign jurisdictions. The Company has reviewed the tax positions taken onreturns filed domestically and in its foreign jurisdictions for all open years, generally fiscal 2014 through 2018, and believes that tax adjustments in any auditedyear will not be material, except for the uncertain tax position described above.
6. Property, Equipment and Improvements, Net
Property, equipment and improvements, net consist of the following:
September 30, 2018 September 30, 2017 (Amounts in thousands)
Leasehold improvements $ 224 $ 224Equipment 7,574 7,294Automobiles 101 74
7,899 7,592Less accumulated depreciation and amortization (7,052) (6,673)
Property, equipment and improvements, net $ 847 $ 919
The Company uses the straight-line method over the estimated useful lives of the assets to record depreciation expense. Depreciation expense was $506thousand and $365 thousand for the years ended September 30, 2018 and 2017 , respectively.
7. Acquired Intangible Assets
As of September 30, 2018 and 2017 , intangible assets are as follows:
September 30, 2018 September 30, 2017Weighted Average
RemainingAmortization
Period Gross AccumulatedAmortization Net
Weighted AverageRemainingAmortization
Period Gross AccumulatedAmortization Net
(Amounts in thousands)
Customer list 1 year $ 910 $ 864 $ 46 2 years $ 910 $ 773 $ 137Non-competeagreements 0 years 93 93 — 0 years 93 93 —Developed technology 0 years 30 $ 30 $ — 0 years 30 30 —Trade name 0 years 140 $ 138 $ 2 1 year 140 110 30
Total $ 1,173 $ 1,125 $ 48 $ 1,173 $ 1,006 $ 167
Amortization expense on these intangible assets was $119 thousand and $120 thousand for fiscal 2018 and 2017 , respectively.
Annual amortization expense related to intangible assets for each of the following successive fiscal years is as follows:
54
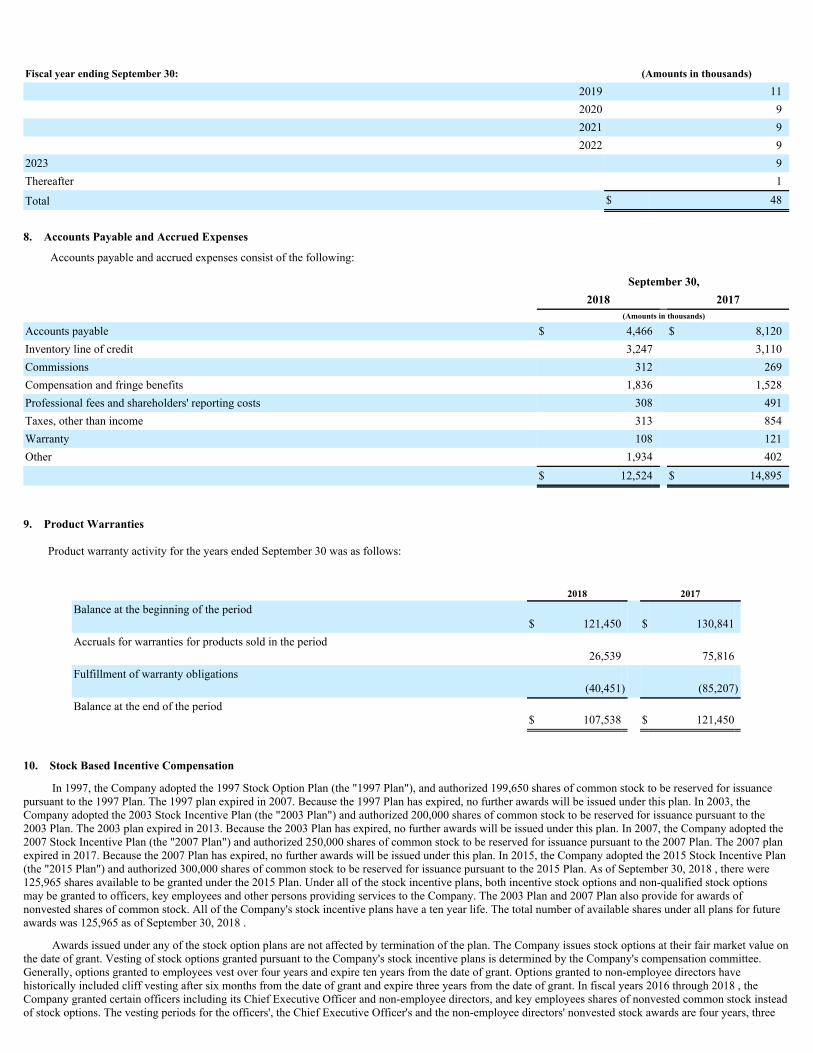
Fiscal year ending September 30: (Amounts in thousands)
2019 112020 92021 92022 9
2023 9Thereafter 1
Total $ 48
8. Accounts Payable and Accrued Expenses
Accounts payable and accrued expenses consist of the following:
September 30,
2018 2017 (Amounts in thousands)
Accounts payable $ 4,466 $ 8,120Inventory line of credit 3,247 3,110Commissions 312 269Compensation and fringe benefits 1,836 1,528Professional fees and shareholders' reporting costs 308 491Taxes, other than income 313 854Warranty 108 121Other 1,934 402
$ 12,524 $ 14,895
9. Product Warranties
Product warranty activity for the years ended September 30 was as follows:
2018 2017Balance at the beginning of the period
$ 121,450 $ 130,841Accruals for warranties for products sold in the period
26,539 75,816Fulfillment of warranty obligations
(40,451) (85,207)Balance at the end of the period
$ 107,538 $ 121,450
10. Stock Based Incentive Compensation
In 1997, the Company adopted the 1997 Stock Option Plan (the "1997 Plan"), and authorized 199,650 shares of common stock to be reserved for issuancepursuant to the 1997 Plan. The 1997 plan expired in 2007. Because the 1997 Plan has expired, no further awards will be issued under this plan. In 2003, theCompany adopted the 2003 Stock Incentive Plan (the "2003 Plan") and authorized 200,000 shares of common stock to be reserved for issuance pursuant to the2003 Plan. The 2003 plan expired in 2013. Because the 2003 Plan has expired, no further awards will be issued under this plan. In 2007, the Company adopted the2007 Stock Incentive Plan (the "2007 Plan") and authorized 250,000 shares of common stock to be reserved for issuance pursuant to the 2007 Plan. The 2007 planexpired in 2017. Because the 2007 Plan has expired, no further awards will be issued under this plan. In 2015, the Company adopted the 2015 Stock Incentive Plan(the "2015 Plan") and authorized 300,000 shares of common stock to be reserved for issuance pursuant to the 2015 Plan. As of September 30, 2018 , there were125,965 shares available to be granted under the 2015 Plan. Under all of the stock incentive plans, both incentive stock options and non-qualified stock optionsmay be granted to officers, key employees and other persons providing services to the Company. The 2003 Plan and 2007 Plan also provide for awards ofnonvested shares of common stock. All of the Company's stock incentive plans have a ten year life. The total number of available shares under all plans for futureawards was 125,965 as of September 30, 2018 .
Awards issued under any of the stock option plans are not affected by termination of the plan. The Company issues stock options at their fair market value onthe date of grant. Vesting of stock options granted pursuant to the Company's stock incentive plans is determined by the Company's compensation committee.Generally, options granted to employees vest over four years and expire ten years from the date of grant. Options granted to non-employee directors havehistorically included cliff vesting after six months from the date of grant and expire three years from the date of grant. In fiscal years 2016 through 2018 , theCompany granted certain officers including its Chief Executive Officer and non-employee directors, and key employees shares of nonvested common stock insteadof stock options. The vesting periods for the officers', the Chief Executive Officer's and the non-employee directors' nonvested stock awards are four years, three

years and one year, respectively. The vesting period for the key employees' awards is four years.
55
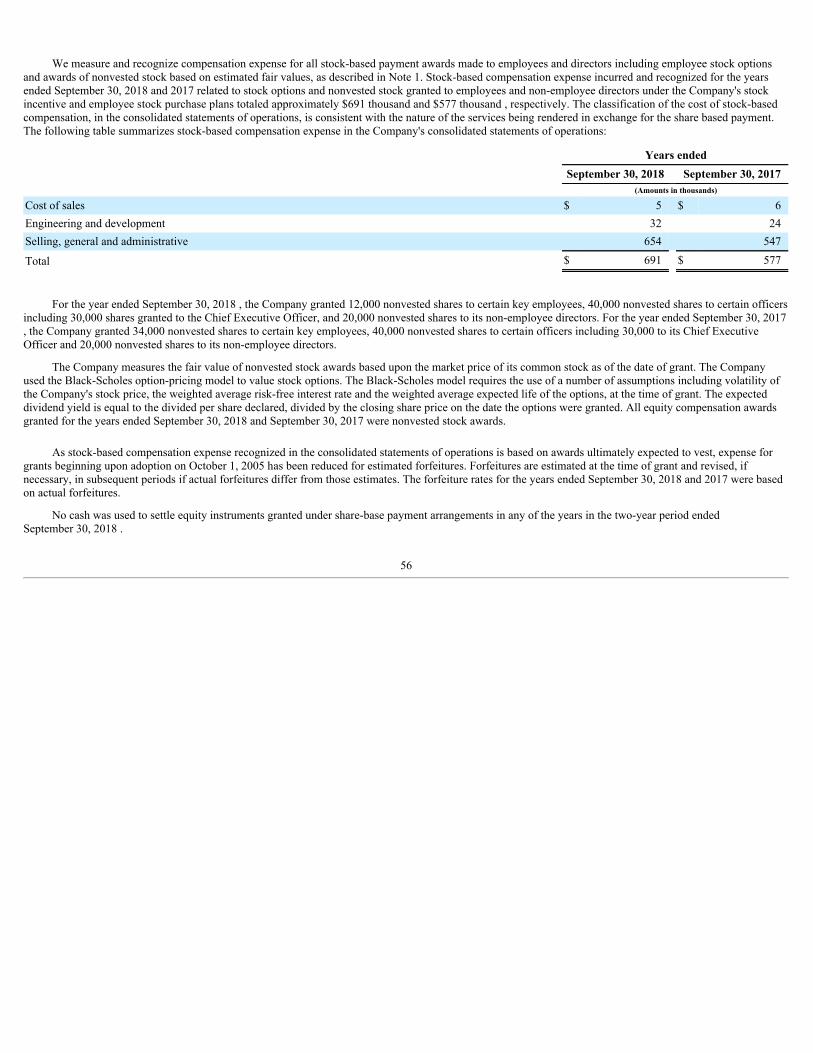
We measure and recognize compensation expense for all stock-based payment awards made to employees and directors including employee stock optionsand awards of nonvested stock based on estimated fair values, as described in Note 1. Stock-based compensation expense incurred and recognized for the yearsended September 30, 2018 and 2017 related to stock options and nonvested stock granted to employees and non-employee directors under the Company's stockincentive and employee stock purchase plans totaled approximately $691 thousand and $577 thousand , respectively. The classification of the cost of stock-basedcompensation, in the consolidated statements of operations, is consistent with the nature of the services being rendered in exchange for the share based payment.The following table summarizes stock-based compensation expense in the Company's consolidated statements of operations:
Years ended
September 30, 2018 September 30, 2017 (Amounts in thousands)
Cost of sales $ 5 $ 6Engineering and development 32 24Selling, general and administrative 654 547
Total $ 691 $ 577
For the year ended September 30, 2018 , the Company granted 12,000 nonvested shares to certain key employees, 40,000 nonvested shares to certain officers
including 30,000 shares granted to the Chief Executive Officer, and 20,000 nonvested shares to its non-employee directors. For the year ended September 30, 2017, the Company granted 34,000 nonvested shares to certain key employees, 40,000 nonvested shares to certain officers including 30,000 to its Chief ExecutiveOfficer and 20,000 nonvested shares to its non-employee directors.
The Company measures the fair value of nonvested stock awards based upon the market price of its common stock as of the date of grant. The Companyused the Black-Scholes option-pricing model to value stock options. The Black-Scholes model requires the use of a number of assumptions including volatility ofthe Company's stock price, the weighted average risk-free interest rate and the weighted average expected life of the options, at the time of grant. The expecteddividend yield is equal to the divided per share declared, divided by the closing share price on the date the options were granted. All equity compensation awardsgranted for the years ended September 30, 2018 and September 30, 2017 were nonvested stock awards.
As stock-based compensation expense recognized in the consolidated statements of operations is based on awards ultimately expected to vest, expense forgrants beginning upon adoption on October 1, 2005 has been reduced for estimated forfeitures. Forfeitures are estimated at the time of grant and revised, ifnecessary, in subsequent periods if actual forfeitures differ from those estimates. The forfeiture rates for the years ended September 30, 2018 and 2017 were basedon actual forfeitures.
No cash was used to settle equity instruments granted under share-base payment arrangements in any of the years in the two-year period endedSeptember 30, 2018 .
56
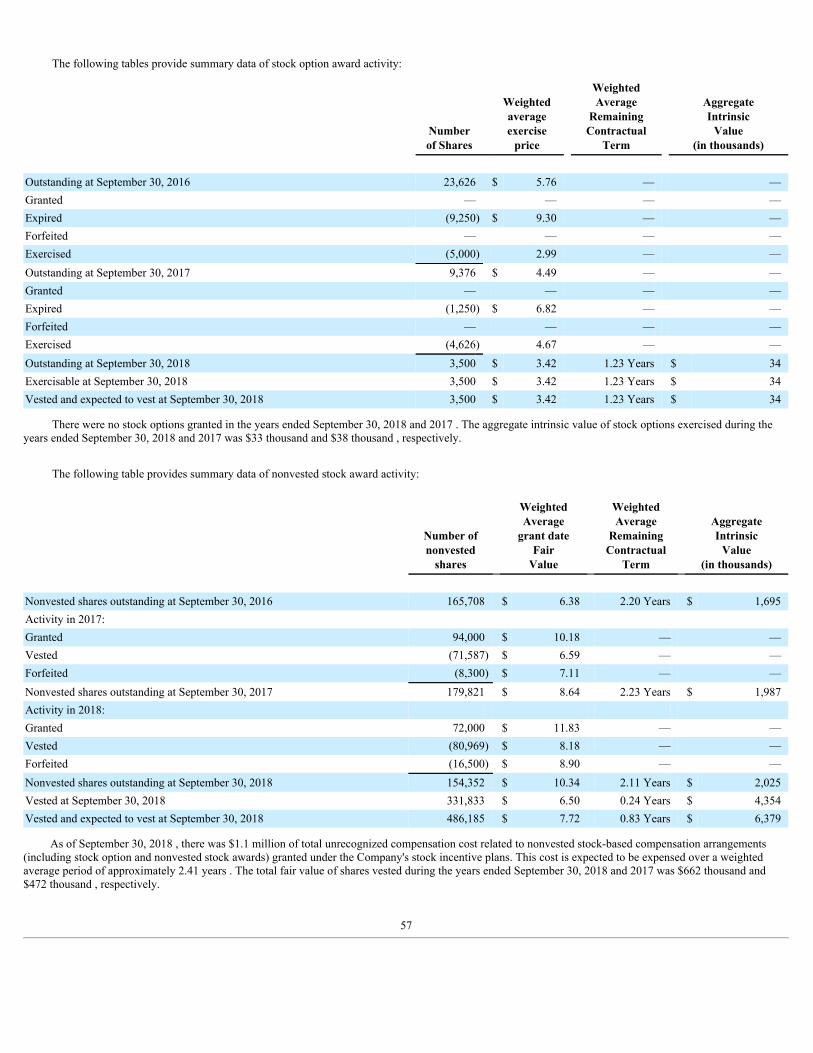
The following tables provide summary data of stock option award activity:
Numberof Shares
Weightedaverageexerciseprice
WeightedAverageRemainingContractual
Term
AggregateIntrinsicValue
(in thousands)
Outstanding at September 30, 2016 23,626 $ 5.76 — —Granted — — — —Expired (9,250) $ 9.30 — —Forfeited — — — —Exercised (5,000) 2.99 — —Outstanding at September 30, 2017 9,376 $ 4.49 — —Granted — — — —Expired (1,250) $ 6.82 — —Forfeited — — — —Exercised (4,626) 4.67 — —Outstanding at September 30, 2018 3,500 $ 3.42 1.23 Years $ 34Exercisable at September 30, 2018 3,500 $ 3.42 1.23 Years $ 34Vested and expected to vest at September 30, 2018 3,500 $ 3.42 1.23 Years $ 34
There were no stock options granted in the years ended September 30, 2018 and 2017 . The aggregate intrinsic value of stock options exercised during theyears ended September 30, 2018 and 2017 was $33 thousand and $38 thousand , respectively.
The following table provides summary data of nonvested stock award activity:
Number ofnonvestedshares
WeightedAveragegrant date
FairValue
WeightedAverageRemainingContractual
Term
AggregateIntrinsicValue
(in thousands)
Nonvested shares outstanding at September 30, 2016 165,708 $ 6.38 2.20 Years $ 1,695Activity in 2017:
Granted 94,000 $ 10.18 — —Vested (71,587) $ 6.59 — —Forfeited (8,300) $ 7.11 — —Nonvested shares outstanding at September 30, 2017 179,821 $ 8.64 2.23 Years $ 1,987Activity in 2018:
Granted 72,000 $ 11.83 — —Vested (80,969) $ 8.18 — —Forfeited (16,500) $ 8.90 — —Nonvested shares outstanding at September 30, 2018 154,352 $ 10.34 2.11 Years $ 2,025Vested at September 30, 2018 331,833 $ 6.50 0.24 Years $ 4,354Vested and expected to vest at September 30, 2018 486,185 $ 7.72 0.83 Years $ 6,379
As of September 30, 2018 , there was $1.1 million of total unrecognized compensation cost related to nonvested stock-based compensation arrangements(including stock option and nonvested stock awards) granted under the Company's stock incentive plans. This cost is expected to be expensed over a weightedaverage period of approximately 2.41 years . The total fair value of shares vested during the years ended September 30, 2018 and 2017 was $662 thousand and$472 thousand , respectively.
57
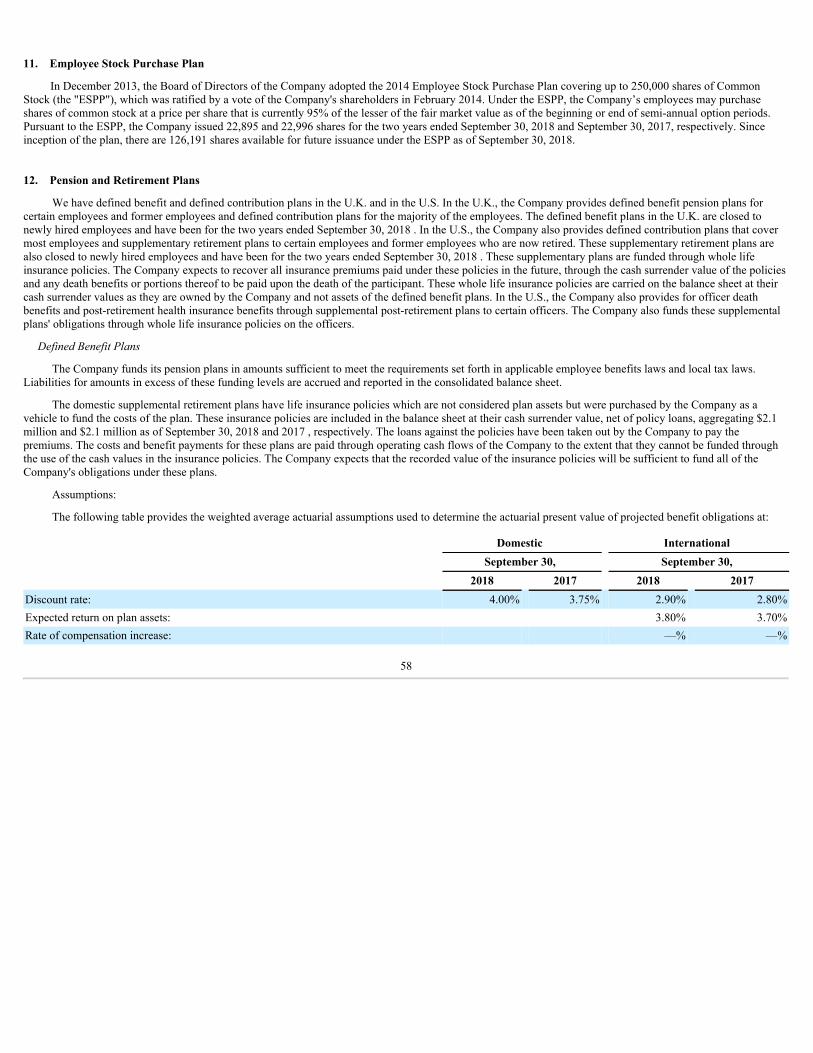
11. Employee Stock Purchase Plan
In December 2013, the Board of Directors of the Company adopted the 2014 Employee Stock Purchase Plan covering up to 250,000 shares of CommonStock (the "ESPP"), which was ratified by a vote of the Company's shareholders in February 2014. Under the ESPP, the Company’s employees may purchaseshares of common stock at a price per share that is currently 95% of the lesser of the fair market value as of the beginning or end of semi-annual option periods.Pursuant to the ESPP, the Company issued 22,895 and 22,996 shares for the two years ended September 30, 2018 and September 30, 2017, respectively. Sinceinception of the plan, there are 126,191 shares available for future issuance under the ESPP as of September 30, 2018.
12. Pension and Retirement Plans
We have defined benefit and defined contribution plans in the U.K. and in the U.S. In the U.K., the Company provides defined benefit pension plans forcertain employees and former employees and defined contribution plans for the majority of the employees. The defined benefit plans in the U.K. are closed tonewly hired employees and have been for the two years ended September 30, 2018 . In the U.S., the Company also provides defined contribution plans that covermost employees and supplementary retirement plans to certain employees and former employees who are now retired. These supplementary retirement plans arealso closed to newly hired employees and have been for the two years ended September 30, 2018 . These supplementary plans are funded through whole lifeinsurance policies. The Company expects to recover all insurance premiums paid under these policies in the future, through the cash surrender value of the policiesand any death benefits or portions thereof to be paid upon the death of the participant. These whole life insurance policies are carried on the balance sheet at theircash surrender values as they are owned by the Company and not assets of the defined benefit plans. In the U.S., the Company also provides for officer deathbenefits and post-retirement health insurance benefits through supplemental post-retirement plans to certain officers. The Company also funds these supplementalplans' obligations through whole life insurance policies on the officers.
Defined Benefit Plans
The Company funds its pension plans in amounts sufficient to meet the requirements set forth in applicable employee benefits laws and local tax laws.Liabilities for amounts in excess of these funding levels are accrued and reported in the consolidated balance sheet.
The domestic supplemental retirement plans have life insurance policies which are not considered plan assets but were purchased by the Company as avehicle to fund the costs of the plan. These insurance policies are included in the balance sheet at their cash surrender value, net of policy loans, aggregating $2.1million and $2.1 million as of September 30, 2018 and 2017 , respectively. The loans against the policies have been taken out by the Company to pay thepremiums. The costs and benefit payments for these plans are paid through operating cash flows of the Company to the extent that they cannot be funded throughthe use of the cash values in the insurance policies. The Company expects that the recorded value of the insurance policies will be sufficient to fund all of theCompany's obligations under these plans.
Assumptions:
The following table provides the weighted average actuarial assumptions used to determine the actuarial present value of projected benefit obligations at:
Domestic International
September 30, September 30,
2018 2017 2018 2017Discount rate: 4.00% 3.75% 2.90% 2.80%Expected return on plan assets: 3.80% 3.70%Rate of compensation increase: —% —%
58
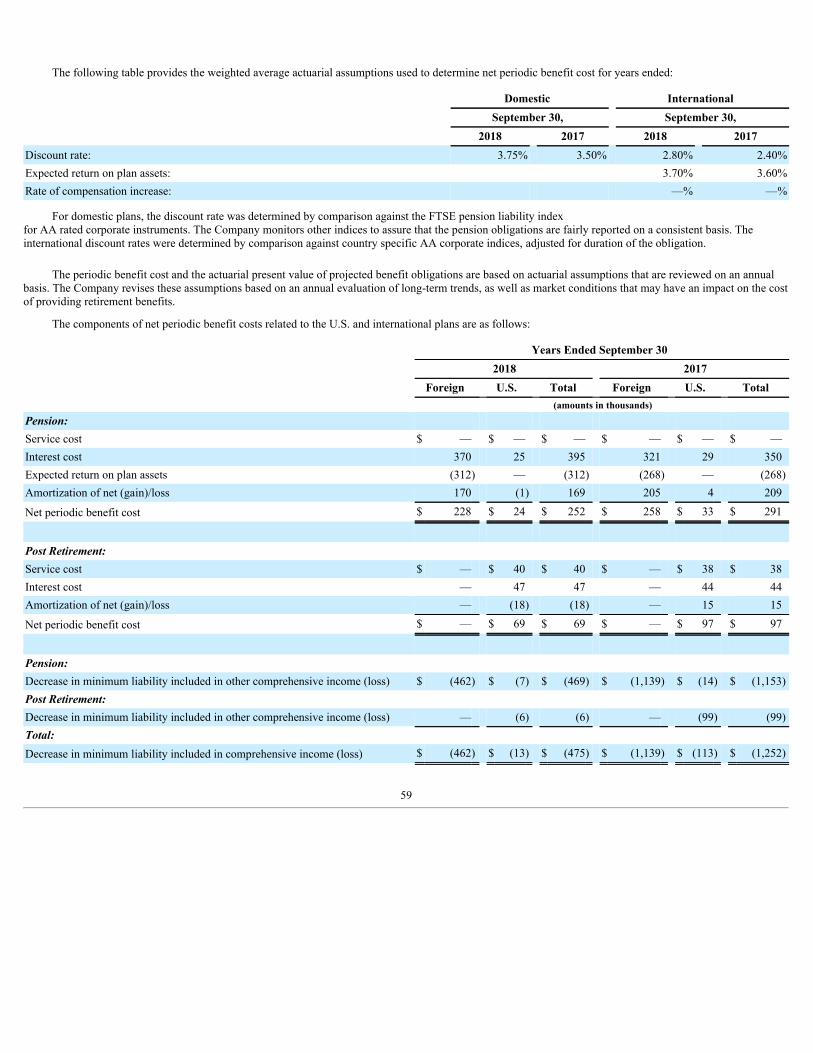
The following table provides the weighted average actuarial assumptions used to determine net periodic benefit cost for years ended:
Domestic International
September 30, September 30,
2018 2017 2018 2017Discount rate: 3.75% 3.50% 2.80% 2.40%Expected return on plan assets: 3.70% 3.60%Rate of compensation increase: —% —%
For domestic plans, the discount rate was determined by comparison against the FTSE pension liability indexfor AA rated corporate instruments. The Company monitors other indices to assure that the pension obligations are fairly reported on a consistent basis. Theinternational discount rates were determined by comparison against country specific AA corporate indices, adjusted for duration of the obligation.
The periodic benefit cost and the actuarial present value of projected benefit obligations are based on actuarial assumptions that are reviewed on an annualbasis. The Company revises these assumptions based on an annual evaluation of long-term trends, as well as market conditions that may have an impact on the costof providing retirement benefits.
The components of net periodic benefit costs related to the U.S. and international plans are as follows:
Years Ended September 30 2018 2017
Foreign U.S. Total Foreign U.S. Total (amounts in thousands)Pension:
Service cost $ — $ — $ — $ — $ — $ —Interest cost 370 25 395 321 29 350Expected return on plan assets (312) — (312) (268) — (268)Amortization of net (gain)/loss 170 (1) 169 205 4 209
Net periodic benefit cost $ 228 $ 24 $ 252 $ 258 $ 33 $ 291
Post Retirement:
Service cost $ — $ 40 $ 40 $ — $ 38 $ 38Interest cost — 47 47 — 44 44Amortization of net (gain)/loss — (18) (18) — 15 15
Net periodic benefit cost $ — $ 69 $ 69 $ — $ 97 $ 97
Pension:
Decrease in minimum liability included in other comprehensive income (loss) $ (462) $ (7) $ (469) $ (1,139) $ (14) $ (1,153)Post Retirement:
Decrease in minimum liability included in other comprehensive income (loss) — (6) (6) — (99) (99)Total:
Decrease in minimum liability included in comprehensive income (loss) $ (462) $ (13) $ (475) $ (1,139) $ (113) $ (1,252)
59
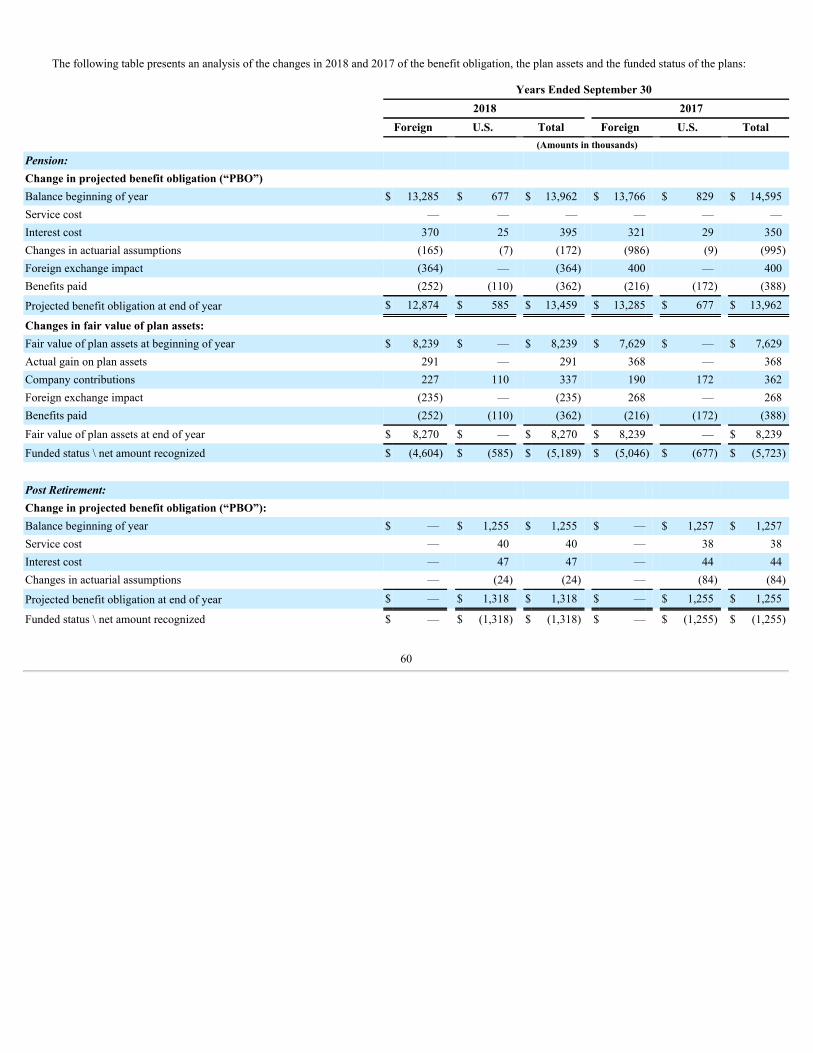
The following table presents an analysis of the changes in 2018 and 2017 of the benefit obligation, the plan assets and the funded status of the plans:
Years Ended September 30 2018 2017
Foreign U.S. Total Foreign U.S. Total (Amounts in thousands)Pension:
Change in projected benefit obligation (“PBO”)
Balance beginning of year $ 13,285 $ 677 $ 13,962 $ 13,766 $ 829 $ 14,595Service cost — — — — — —Interest cost 370 25 395 321 29 350Changes in actuarial assumptions (165) (7) (172) (986) (9) (995)Foreign exchange impact (364) — (364) 400 — 400Benefits paid (252) (110) (362) (216) (172) (388)
Projected benefit obligation at end of year $ 12,874 $ 585 $ 13,459 $ 13,285 $ 677 $ 13,962
Changes in fair value of plan assets:
Fair value of plan assets at beginning of year $ 8,239 $ — $ 8,239 $ 7,629 $ — $ 7,629Actual gain on plan assets 291 — 291 368 — 368Company contributions 227 110 337 190 172 362Foreign exchange impact (235) — (235) 268 — 268Benefits paid (252) (110) (362) (216) (172) (388)Fair value of plan assets at end of year $ 8,270 $ — $ 8,270 $ 8,239 — $ 8,239Funded status \ net amount recognized $ (4,604) $ (585) $ (5,189) $ (5,046) $ (677) $ (5,723) Post Retirement:
Change in projected benefit obligation (“PBO”):
Balance beginning of year $ — $ 1,255 $ 1,255 $ — $ 1,257 $ 1,257Service cost — 40 40 — 38 38Interest cost — 47 47 — 44 44Changes in actuarial assumptions — (24) (24) — (84) (84)
Projected benefit obligation at end of year $ — $ 1,318 $ 1,318 $ — $ 1,255 $ 1,255
Funded status \ net amount recognized $ — $ (1,318) $ (1,318) $ — $ (1,255) $ (1,255)
60
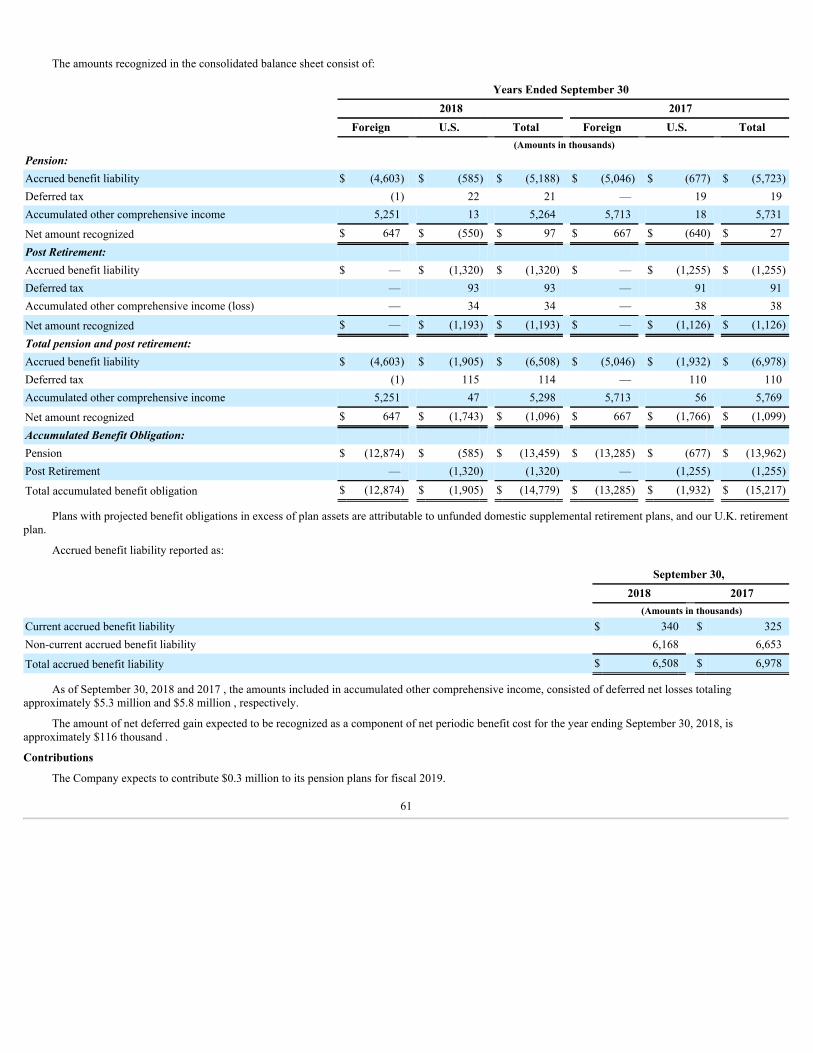
The amounts recognized in the consolidated balance sheet consist of:
Years Ended September 30 2018 2017
Foreign U.S. Total Foreign U.S. Total (Amounts in thousands)Pension:
Accrued benefit liability $ (4,603) $ (585) $ (5,188) $ (5,046) $ (677) $ (5,723)Deferred tax (1) 22 21 — 19 19Accumulated other comprehensive income 5,251 13 5,264 5,713 18 5,731
Net amount recognized $ 647 $ (550) $ 97 $ 667 $ (640) $ 27Post Retirement:
Accrued benefit liability $ — $ (1,320) $ (1,320) $ — $ (1,255) $ (1,255)Deferred tax — 93 93 — 91 91Accumulated other comprehensive income (loss) — 34 34 — 38 38
Net amount recognized $ — $ (1,193) $ (1,193) $ — $ (1,126) $ (1,126)Total pension and post retirement:
Accrued benefit liability $ (4,603) $ (1,905) $ (6,508) $ (5,046) $ (1,932) $ (6,978)Deferred tax (1) 115 114 — 110 110Accumulated other comprehensive income 5,251 47 5,298 5,713 56 5,769
Net amount recognized $ 647 $ (1,743) $ (1,096) $ 667 $ (1,766) $ (1,099)Accumulated Benefit Obligation:
Pension $ (12,874) $ (585) $ (13,459) $ (13,285) $ (677) $ (13,962)Post Retirement — (1,320) (1,320) — (1,255) (1,255)
Total accumulated benefit obligation $ (12,874) $ (1,905) $ (14,779) $ (13,285) $ (1,932) $ (15,217)
Plans with projected benefit obligations in excess of plan assets are attributable to unfunded domestic supplemental retirement plans, and our U.K. retirementplan.
Accrued benefit liability reported as:
September 30,
2018 2017 (Amounts in thousands)Current accrued benefit liability $ 340 $ 325Non-current accrued benefit liability 6,168 6,653
Total accrued benefit liability $ 6,508 $ 6,978
As of September 30, 2018 and 2017 , the amounts included in accumulated other comprehensive income, consisted of deferred net losses totalingapproximately $5.3 million and $5.8 million , respectively.
The amount of net deferred gain expected to be recognized as a component of net periodic benefit cost for the year ending September 30, 2018, isapproximately $116 thousand .
Contributions
The Company expects to contribute $0.3 million to its pension plans for fiscal 2019.
61
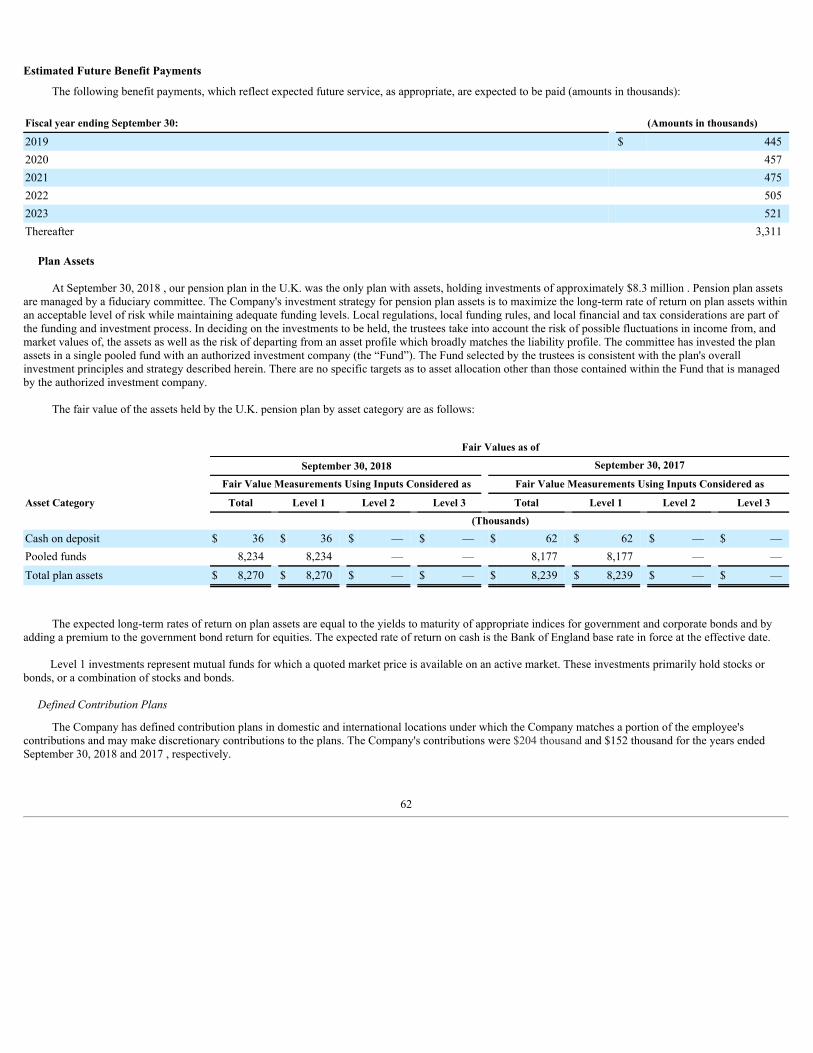
Estimated Future Benefit Payments
The following benefit payments, which reflect expected future service, as appropriate, are expected to be paid (amounts in thousands):
Fiscal year ending September 30: (Amounts in thousands)
2019 $ 4452020 4572021 4752022 5052023 521Thereafter 3,311
Plan Assets
At September 30, 2018 , our pension plan in the U.K. was the only plan with assets, holding investments of approximately $8.3 million . Pension plan assetsare managed by a fiduciary committee. The Company's investment strategy for pension plan assets is to maximize the long-term rate of return on plan assets withinan acceptable level of risk while maintaining adequate funding levels. Local regulations, local funding rules, and local financial and tax considerations are part ofthe funding and investment process. In deciding on the investments to be held, the trustees take into account the risk of possible fluctuations in income from, andmarket values of, the assets as well as the risk of departing from an asset profile which broadly matches the liability profile. The committee has invested the planassets in a single pooled fund with an authorized investment company (the “Fund”). The Fund selected by the trustees is consistent with the plan's overallinvestment principles and strategy described herein. There are no specific targets as to asset allocation other than those contained within the Fund that is managedby the authorized investment company.
The fair value of the assets held by the U.K. pension plan by asset category are as follows:
Fair Values as of
September 30, 2018 September 30, 2017
Fair Value Measurements Using Inputs Considered as Fair Value Measurements Using Inputs Considered as
Asset Category Total Level 1 Level 2 Level 3 Total Level 1 Level 2 Level 3
(Thousands)
Cash on deposit $ 36 $ 36 $ — $ — $ 62 $ 62 $ — $ —Pooled funds 8,234 8,234 — — 8,177 8,177 — —Total plan assets $ 8,270 $ 8,270 $ — $ — $ 8,239 $ 8,239 $ — $ —
The expected long-term rates of return on plan assets are equal to the yields to maturity of appropriate indices for government and corporate bonds and byadding a premium to the government bond return for equities. The expected rate of return on cash is the Bank of England base rate in force at the effective date.
Level 1 investments represent mutual funds for which a quoted market price is available on an active market. These investments primarily hold stocks orbonds, or a combination of stocks and bonds.
Defined Contribution Plans
The Company has defined contribution plans in domestic and international locations under which the Company matches a portion of the employee'scontributions and may make discretionary contributions to the plans. The Company's contributions were $204 thousand and $152 thousand for the years endedSeptember 30, 2018 and 2017 , respectively.
62
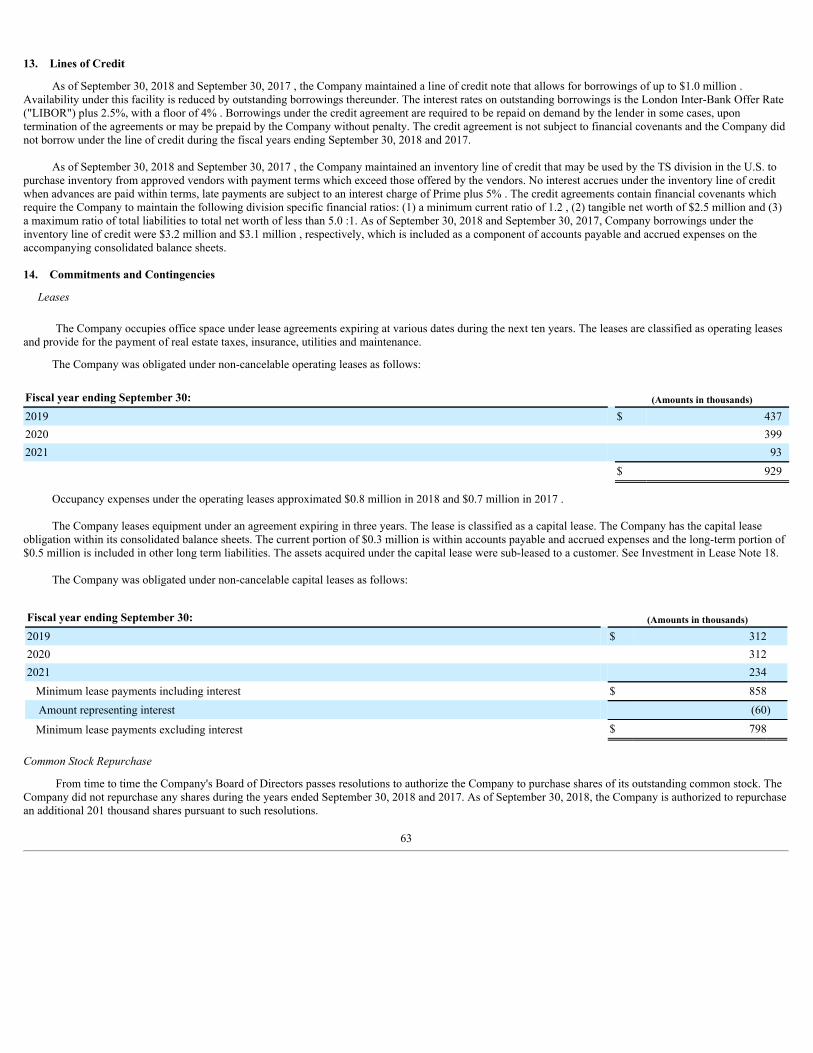
13. Lines of Credit
As of September 30, 2018 and September 30, 2017 , the Company maintained a line of credit note that allows for borrowings of up to $1.0 million .Availability under this facility is reduced by outstanding borrowings thereunder. The interest rates on outstanding borrowings is the London Inter-Bank Offer Rate("LIBOR") plus 2.5%, with a floor of 4% . Borrowings under the credit agreement are required to be repaid on demand by the lender in some cases, upontermination of the agreements or may be prepaid by the Company without penalty. The credit agreement is not subject to financial covenants and the Company didnot borrow under the line of credit during the fiscal years ending September 30, 2018 and 2017.
As of September 30, 2018 and September 30, 2017 , the Company maintained an inventory line of credit that may be used by the TS division in the U.S. topurchase inventory from approved vendors with payment terms which exceed those offered by the vendors. No interest accrues under the inventory line of creditwhen advances are paid within terms, late payments are subject to an interest charge of Prime plus 5% . The credit agreements contain financial covenants whichrequire the Company to maintain the following division specific financial ratios: (1) a minimum current ratio of 1.2 , (2) tangible net worth of $2.5 million and (3)a maximum ratio of total liabilities to total net worth of less than 5.0 :1. As of September 30, 2018 and September 30, 2017, Company borrowings under theinventory line of credit were $3.2 million and $3.1 million , respectively, which is included as a component of accounts payable and accrued expenses on theaccompanying consolidated balance sheets.
14. Commitments and Contingencies
Leases
The Company occupies office space under lease agreements expiring at various dates during the next ten years. The leases are classified as operating leasesand provide for the payment of real estate taxes, insurance, utilities and maintenance.
The Company was obligated under non-cancelable operating leases as follows:
Fiscal year ending September 30: (Amounts in thousands)
2019 $ 4372020 3992021 93
$ 929
Occupancy expenses under the operating leases approximated $0.8 million in 2018 and $0.7 million in 2017 .
The Company leases equipment under an agreement expiring in three years. The lease is classified as a capital lease. The Company has the capital leaseobligation within its consolidated balance sheets. The current portion of $0.3 million is within accounts payable and accrued expenses and the long-term portion of$0.5 million is included in other long term liabilities. The assets acquired under the capital lease were sub-leased to a customer. See Investment in Lease Note 18.
The Company was obligated under non-cancelable capital leases as follows:
Fiscal year ending September 30: (Amounts in thousands)
2019 $ 3122020 3122021 234 Minimum lease payments including interest $ 858 Amount representing interest (60)
Minimum lease payments excluding interest $ 798
Common Stock Repurchase
From time to time the Company's Board of Directors passes resolutions to authorize the Company to purchase shares of its outstanding common stock. TheCompany did not repurchase any shares during the years ended September 30, 2018 and 2017. As of September 30, 2018, the Company is authorized to repurchasean additional 201 thousand shares pursuant to such resolutions.
63
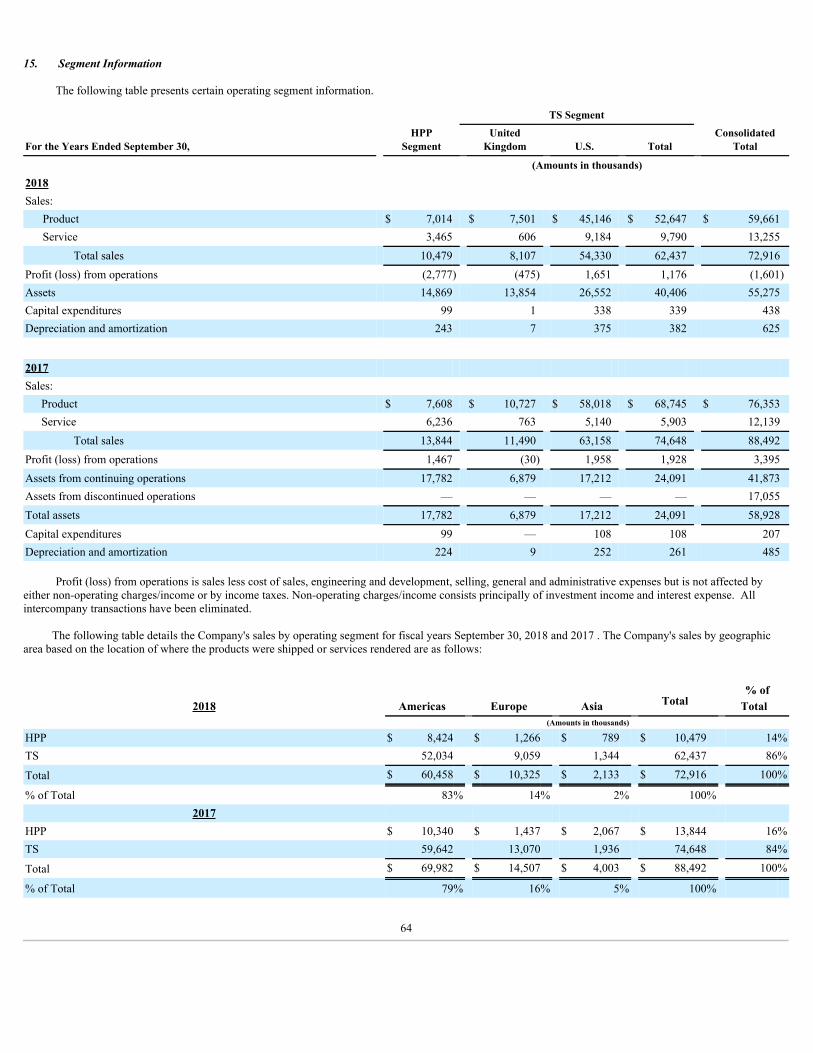
15. Segment Information
The following table presents certain operating segment information.
TS Segment
For the Years Ended September 30, HPP
Segment UnitedKingdom U.S. Total
ConsolidatedTotal
(Amounts in thousands)
2018 Sales: Product $ 7,014 $ 7,501 $ 45,146 $ 52,647 $ 59,661 Service 3,465 606 9,184 9,790 13,255
Total sales 10,479 8,107 54,330 62,437 72,916Profit (loss) from operations (2,777) (475) 1,651 1,176 (1,601)Assets 14,869 13,854 26,552 40,406 55,275Capital expenditures 99 1 338 339 438Depreciation and amortization 243 7 375 382 625
2017 Sales:
Product $ 7,608 $ 10,727 $ 58,018 $ 68,745 $ 76,353Service 6,236 763 5,140 5,903 12,139
Total sales 13,844 11,490 63,158 74,648 88,492Profit (loss) from operations 1,467 (30) 1,958 1,928 3,395Assets from continuing operations 17,782 6,879 17,212 24,091 41,873Assets from discontinued operations — — — — 17,055Total assets 17,782 6,879 17,212 24,091 58,928Capital expenditures 99 — 108 108 207Depreciation and amortization 224 9 252 261 485
Profit (loss) from operations is sales less cost of sales, engineering and development, selling, general and administrative expenses but is not affected byeither non-operating charges/income or by income taxes. Non-operating charges/income consists principally of investment income and interest expense. Allintercompany transactions have been eliminated.
The following table details the Company's sales by operating segment for fiscal years September 30, 2018 and 2017 . The Company's sales by geographicarea based on the location of where the products were shipped or services rendered are as follows:
2018 Americas Europe Asia Total
% ofTotal
(Amounts in thousands)
HPP $ 8,424 $ 1,266 $ 789 $ 10,479 14%TS 52,034 9,059 1,344 62,437 86%
Total $ 60,458 $ 10,325 $ 2,133 $ 72,916 100%
% of Total 83% 14% 2% 100%
2017 HPP $ 10,340 $ 1,437 $ 2,067 $ 13,844 16%TS 59,642 13,070 1,936 74,648 84%
Total $ 69,982 $ 14,507 $ 4,003 $ 88,492 100%
% of Total 79% 16% 5% 100%
64
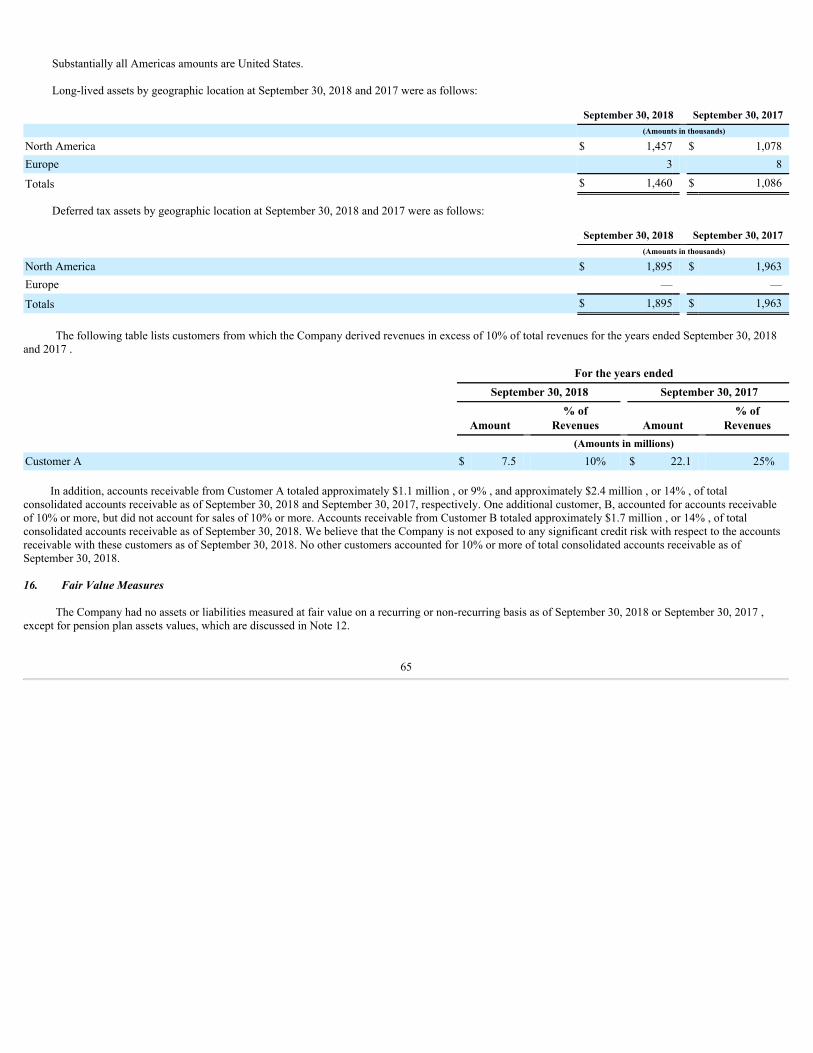
Substantially all Americas amounts are United States.
Long-lived assets by geographic location at September 30, 2018 and 2017 were as follows:
September 30, 2018 September 30, 2017 (Amounts in thousands)
North America $ 1,457 $ 1,078Europe 3 8
Totals $ 1,460 $ 1,086
Deferred tax assets by geographic location at September 30, 2018 and 2017 were as follows:
September 30, 2018 September 30, 2017 (Amounts in thousands)
North America $ 1,895 $ 1,963Europe — —
Totals $ 1,895 $ 1,963
The following table lists customers from which the Company derived revenues in excess of 10% of total revenues for the years ended September 30, 2018and 2017 .
For the years ended September 30, 2018 September 30, 2017
Amount % of
Revenues Amount % of
Revenues (Amounts in millions)
Customer A $ 7.5 10% $ 22.1 25%
In addition, accounts receivable from Customer A totaled approximately $1.1 million , or 9% , and approximately $2.4 million , or 14% , of totalconsolidated accounts receivable as of September 30, 2018 and September 30, 2017, respectively. One additional customer, B, accounted for accounts receivableof 10% or more, but did not account for sales of 10% or more. Accounts receivable from Customer B totaled approximately $1.7 million , or 14% , of totalconsolidated accounts receivable as of September 30, 2018. We believe that the Company is not exposed to any significant credit risk with respect to the accountsreceivable with these customers as of September 30, 2018. No other customers accounted for 10% or more of total consolidated accounts receivable as ofSeptember 30, 2018. 16. Fair Value Measures
The Company had no assets or liabilities measured at fair value on a recurring or non-recurring basis as of September 30, 2018 or September 30, 2017 ,except for pension plan assets values, which are discussed in Note 12.
65
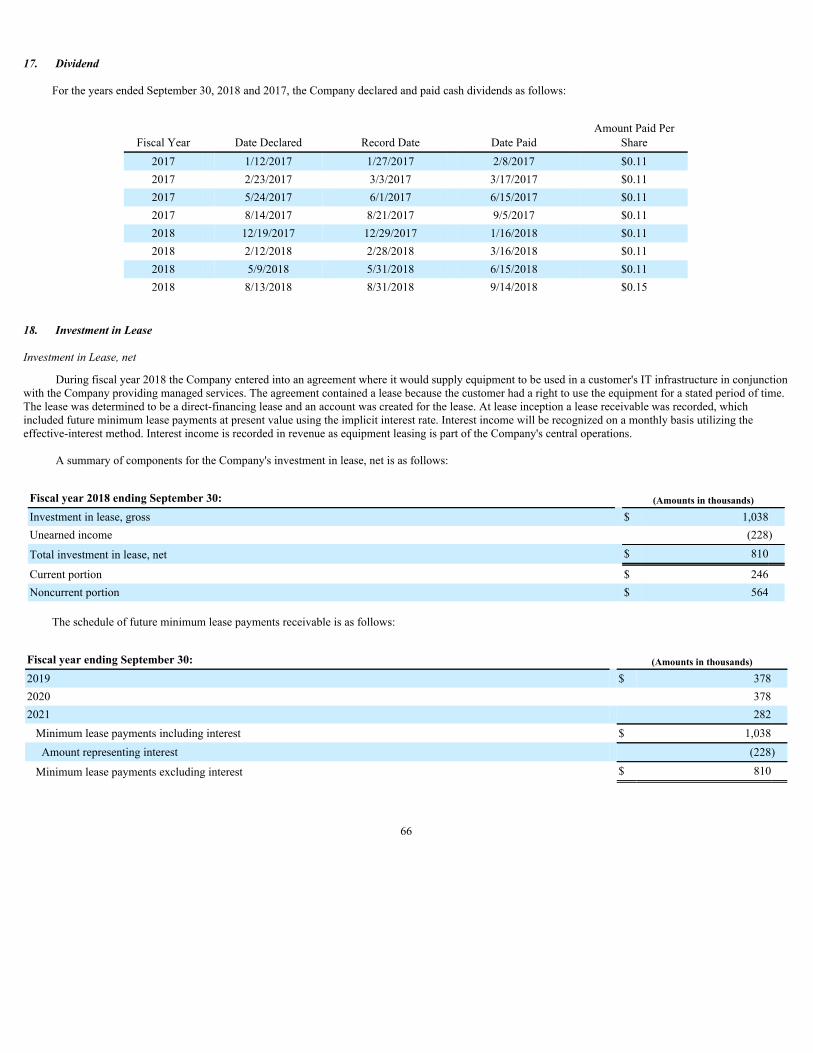
17. Dividend
For the years ended September 30, 2018 and 2017, the Company declared and paid cash dividends as follows:
Fiscal Year Date Declared Record Date Date Paid Amount Paid Per
Share2017 1/12/2017 1/27/2017 2/8/2017 $0.112017 2/23/2017 3/3/2017 3/17/2017 $0.112017 5/24/2017 6/1/2017 6/15/2017 $0.112017 8/14/2017 8/21/2017 9/5/2017 $0.112018 12/19/2017 12/29/2017 1/16/2018 $0.112018 2/12/2018 2/28/2018 3/16/2018 $0.112018 5/9/2018 5/31/2018 6/15/2018 $0.112018 8/13/2018 8/31/2018 9/14/2018 $0.15
18. Investment in Lease
Investment in Lease, net
During fiscal year 2018 the Company entered into an agreement where it would supply equipment to be used in a customer's IT infrastructure in conjunctionwith the Company providing managed services. The agreement contained a lease because the customer had a right to use the equipment for a stated period of time.The lease was determined to be a direct-financing lease and an account was created for the lease. At lease inception a lease receivable was recorded, whichincluded future minimum lease payments at present value using the implicit interest rate. Interest income will be recognized on a monthly basis utilizing theeffective-interest method. Interest income is recorded in revenue as equipment leasing is part of the Company's central operations.
A summary of components for the Company's investment in lease, net is as follows:
Fiscal year 2018 ending September 30: (Amounts in thousands)
Investment in lease, gross $ 1,038Unearned income (228)
Total investment in lease, net $ 810
Current portion $ 246Noncurrent portion $ 564
The schedule of future minimum lease payments receivable is as follows:
Fiscal year ending September 30: (Amounts in thousands)
2019 $ 3782020 3782021 282 Minimum lease payments including interest $ 1,038 Amount representing interest (228)
Minimum lease payments excluding interest $ 810
66
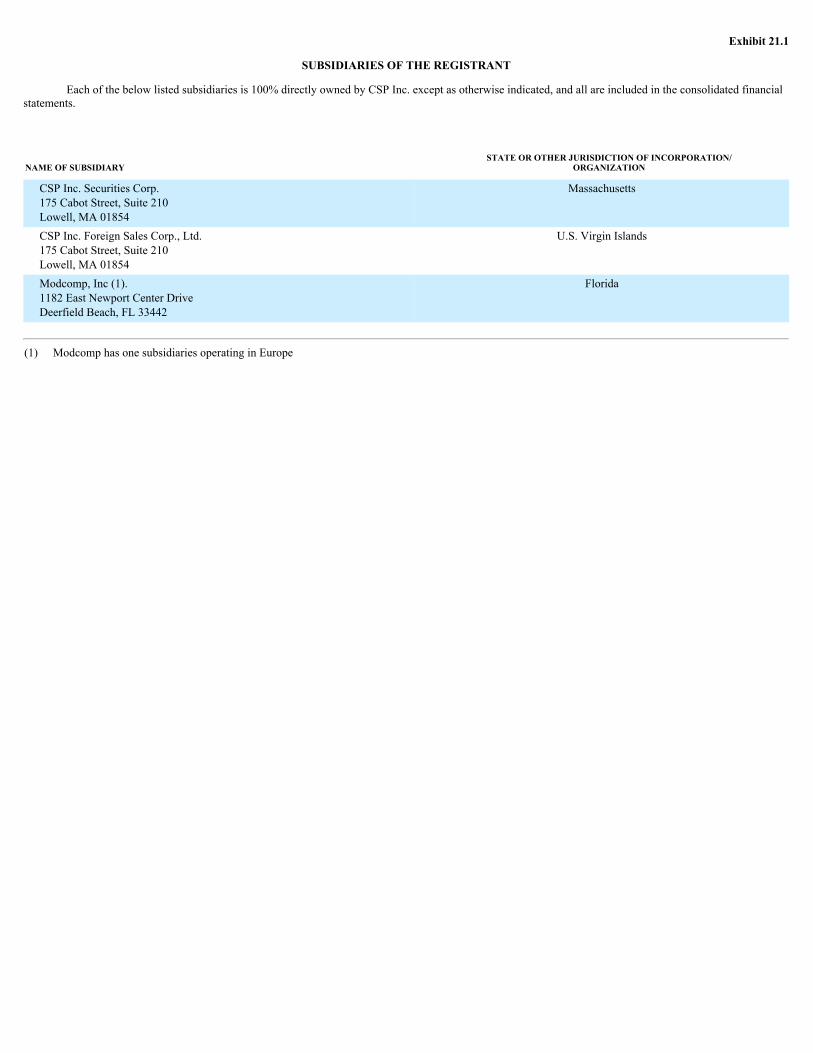
Exhibit 21.1
SUBSIDIARIES OF THE REGISTRANT
Each of the below listed subsidiaries is 100% directly owned by CSP Inc. except as otherwise indicated, and all are included in the consolidated financialstatements.
NAME OF SUBSIDIARY
STATE OR OTHER JURISDICTION OF INCORPORATION/ORGANIZATION
CSP Inc. Securities Corp.175 Cabot Street, Suite 210Lowell, MA 01854
Massachusetts
CSP Inc. Foreign Sales Corp., Ltd.175 Cabot Street, Suite 210Lowell, MA 01854
U.S. Virgin Islands
Modcomp, Inc (1).1182 East Newport Center DriveDeerfield Beach, FL 33442
Florida
(1) Modcomp has one subsidiaries operating in Europe

EXHIBIT 23.1
Consent of Independent Registered Public Accounting Firm
We consent to the incorporation by reference in these Registration Statements (Nos. 333-64493, 333-124030, 333-124031, 333-151024, 333-197608, and 333-207229) on Form S-8 of CSP Inc. and Subsidiaries of our report dated December 27, 2018, relating to the consolidated financialstatements of CSP Inc. and Subsidiaries, appearing in this Annual Report on Form 10-K of CSP Inc. for the year ended September 30, 2018.
/s/ RSM US LLP
Boston, MassachusettsDecember 27, 2018
Exhibit 31.1
CERTIFICATION PURSUANT TO SECTION 302 OF THE SARBANES-OXLEY ACT OF 2002
I, Victor Dellovo, certify that:
1. I have reviewed this annual report on Form 10-K of CSP Inc.;
2. Based on my knowledge, this report does not contain any untrue statement of a material fact or omit to state a material fact necessary to make thestatements made, in light of the circumstances under which such statements were made, not misleading with respect to the period covered by this report;
3. Based on my knowledge, the financial statements, and other financial information included in this report, fairly present in all material respects thefinancial condition, results of operations and cash flows of the registrant as of, and for, the periods presented in this report;
4. The registrant’s other certifying officer(s) and I are responsible for establishing and maintaining disclosure controls and procedures (as defined inExchange Act Rules 13a-15(e) and 15d-15(e)) and internal control over financial reporting (as defined in Exchange Act Rules 13a-15(f) and 15d-15(f)) for theregistrant and have:
a) Designed such disclosure controls and procedures, or caused such disclosure controls and procedures to be designed under our supervision, toensure that material information relating to the registrant, including its consolidated subsidiaries, is made known to us by others within those entities,particularly during the period in which this report is being prepared;
b) Designed such internal control over financial reporting, or caused such internal control over financial reporting to be designed under oursupervision, to provide reasonable assurance regarding the reliability of financial reporting and the preparation of financial statements for externalpurposes in accordance with generally accepted accounting principles;
c) Evaluated the effectiveness of the registrant’s disclosure controls and procedures and presented in this report our conclusions about theeffectiveness of the disclosure controls and procedures, as of the end of the period covered by this report based on such evaluation; and
d) Disclosed in this report any change in the registrant’s internal control over financial reporting that occurred during the registrant’s most recentfiscal quarter (the registrant’s fourth fiscal quarter in the case of an annual report) that has materially affected, or is reasonably likely to materially affect,the registrant’s internal control over financial reporting; and
5. The registrant’s other certifying officer(s) and I have disclosed, based on our most recent evaluation of internal control over financial reporting, to theregistrant’s auditors and the audit committee of the registrant’s board of directors (or persons performing the equivalent functions):
a) All significant deficiencies and material weaknesses in the design or operation of internal control over financial reporting which arereasonably likely to adversely affect the registrant’s ability to record, process, summarize and report financial information; and
b) Any fraud, whether or not material, that involves management or other employees who have a significant role in the registrant’s internalcontrol over financial reporting.
December 27, 2018
/s/ Victor DellovoVictor DellovoChief Executive Officer andPresident
Exhibit 31.2
CERTIFICATION PURSUANT TO SECTION 302 OF THE SARBANES-OXLEY ACT OF 2002
I, Gary W. Levine, certify that:
1. I have reviewed this annual report on Form 10-K of CSP Inc.;
2. Based on my knowledge, this report does not contain any untrue statement of a material fact or omit to state a material fact necessary to make thestatements made, in light of the circumstances under which such statements were made, not misleading with respect to the period covered by this report;
3. Based on my knowledge, the financial statements, and other financial information included in this report, fairly present in all material respects thefinancial condition, results of operations and cash flows of the registrant as of, and for, the periods presented in this report;
4. The registrant’s other certifying officer(s) and I are responsible for establishing and maintaining disclosure controls and procedures (as defined inExchange Act Rules 13a-15(e) and 15d-15(e)) and internal control over financial reporting (as defined in Exchange Act Rules 13a-15(f) and 15d-15(f)) for theregistrant and have:
a) Designed such disclosure controls and procedures, or caused such disclosure controls and procedures to be designed under our supervision, toensure that material information relating to the registrant, including its consolidated subsidiaries, is made known to us by others within those entities,particularly during the period in which this report is being prepared;
b) Designed such internal control over financial reporting, or caused such internal control over financial reporting to be designed under oursupervision, to provide reasonable assurance regarding the reliability of financial reporting and the preparation of financial statements for externalpurposes in accordance with generally accepted accounting principles;
c) Evaluated the effectiveness of the registrant’s disclosure controls and procedures and presented in this report our conclusions about theeffectiveness of the disclosure controls and procedures, as of the end of the period covered by this report based on such evaluation; and
d) Disclosed in this report any change in the registrant’s internal control over financial reporting that occurred during the registrant’s most recentfiscal quarter (the registrant’s fourth fiscal quarter in the case of an annual report) that has materially affected, or is reasonably likely to materially affect,the registrant’s internal control over financial reporting; and
5. The registrant’s other certifying officer(s) and I have disclosed, based on our most recent evaluation of internal control over financial reporting, to theregistrant’s auditors and the audit committee of the registrant’s board of directors (or persons performing the equivalent functions):
a) All significant deficiencies and material weaknesses in the design or operation of internal control over financial reporting which arereasonably likely to adversely affect the registrant’s ability to record, process, summarize and report financial information; and
b) Any fraud, whether or not material, that involves management or other employees who have a significant role in the registrant’s internalcontrol over financial reporting.
December 27, 2018
/s/Gary W. LevineGary W. LevineChief Financial Officer
Exhibit 32.1
18 U.S.C. Section 1350,
AS ADOPTED PURSUANT TO
SECTION 906 OF THE SARBANES-OXLEY ACT OF 2002
In connection with the Annual Report on Form 10-K of CSP Inc. (the “Company”) for the year ended September 30, 2018 , as filed with the Securitiesand Exchange Commission on the date hereof (the “Report”), each of the undersigned Chief Executive Officer and Chief Financial Officer of the Company,certifies, to the best knowledge and belief of the signatory, pursuant to 18 U.S.C. Section 1350, as adopted pursuant to Section 906 of the Sarbanes-Oxley Act of2002, that:
(1) The Report fully complies with the requirements of Section 13(a) or 15(d) of the Securities Exchange Act of 1934; and
(2) The information contained in the Report fairly presents, in all material respects, the financial condition and results of operations of the Company.
December 27, 2018 By: /s/ Victor Dellovo Victor Dellovo Chief Executive Officer and President
December 27, 2018 By: /s/ Gary W. Levine Gary W. Levine Chief Financial Officer