Pro Forma Financial Statements Pro Forma Financial Statements

NOTES TO THE FINANCIAL STATEMENTS 55
United States Government Notes to the Financial Statements for the Years Ended September 30, 2014, and 2013 Note 1. Summary of Significant Accounting Policies
A. Reporting Entity This Financial Report includes the financial status and activities of the executive branch, the legislative branch (the
U.S. Senate and the U.S. House of Representatives are included on a cash basis), and the judicial branch (which is primarily included on a cash basis) of the government. The financial reporting period ends September 30 and is the same as used for the annual budget. The legislative and judicial branches are included on a limited basis and are not required by law to submit financial statement information to Treasury. Appendix A of this report lists the organizations and agencies (entities) included in the U.S. Government’s consolidated reporting entity for the Financial Report, as well as some entities not included in the reporting entity. Federal Accounting Standards Advisory Board’s (FASAB) Statement of Federal Financial Accounting Concepts (SFFAC) No. 2, Entity and Display, provides criteria for determining which entities are included in the reporting entity. Such criteria is summarized in Appendix A. Also, as discussed further in Appendix A, certain entities are excluded from the Financial Report because they do not meet the criteria, such as the Thrift Savings Fund, or were specifically excluded from the consolidated reporting entity in accordance with SFFAC No. 2, such as the Board of Governors of the Federal Reserve System and bailout entities. Examples of bailout entities include the Federal Home Loan Mortgage Corporation (Freddie Mac) and Federal National Mortgage Association (Fannie Mae).
During fiscal year 2008, the government began a number of emergency economic measures relating to the economy that involved various financing programs. Key initiatives beginning in fiscal year 2008 involved programs concerning Fannie Mae and Freddie Mac (Government-Sponsored Enterprises [GSEs]), provision of a credit facility for GSEs and Federal Home Loan Banks, purchase of Mortgage-Backed Securities (MBSs), and setup of a Money Market Guarantee Program (see Note 1.I—Investments in Government-Sponsored Enterprises and Note 9—Investments in Government-Sponsored Enterprises). The Emergency Economic Stabilization Act of 2008 (EESA) gave the Secretary of the Treasury temporary authority to purchase and guarantee assets from a wide range of financial institutions through the Troubled Asset Relief Program (TARP) (see Note 5—TARP Direct Loans and Equity Investments, Net).
Following U.S. Generally Accepted Accounting Principles (GAAP) for federal entities, the government has not consolidated into its financial statements the assets, liabilities, or results of operations of any financial organization or commercial entity in which Treasury holds either a direct, indirect, or beneficial equity investment. Even though some of the equity investments are significant, under Statement of Federal Financial Accounting Concepts (SFFAC) No. 2, these entities meet the criteria of paragraph 50 and do not appear in the federal budget section “Federal Programs by Agency and Account.” As such, these entities are not consolidated into the financial reports of the government. However, the values of the investment in such entities are presented on the balance sheet.
Material intragovernmental transactions are eliminated in consolidation, except as described in the Other Information—Unmatched Transactions and Balances (see Note 1.T).

56 NOTES TO THE FINANCIAL STATEMENTS
B. Basis of Accounting and Revenue Recognition These financial statements were prepared using U.S. GAAP, primarily based on Statement of Federal Financial
Accounting Standards (SFFAS). Under these principles: Expenses are generally recognized when incurred. Nonexchange revenue, including taxes, duties, fines, and penalties, are recognized when collected and adjusted
for the change in net measurable and legally collectible amounts receivable. Related refunds and other offsets, including those that are measurable and legally payable, are netted against nonexchange revenue.
Exchange (earned) revenue are recognized when the government provides goods and services to the public for a price. Exchange revenue include user charges such as admission to federal parks and premiums for certain federal insurance.
The basis of accounting used for budgetary purposes, which is primarily on a cash and obligation basis and follows budgetary concepts and policies, differs from the basis of accounting used for the financial statements which follow U.S. GAAP. See the Reconciliations of Net Operating Cost and Unified Budget Deficit in the Financial Statements section.
The basis of accounting used and the detail of the basis for the Statement of Social Insurance (SOSI) and the Statement of Changes in Social Insurance Amounts (SCSIA) are covered in Note 24—Social Insurance. New Standards Issued and Implemented
Beginning in fiscal year 2014, the government implemented the requirements of a new standard related to the reporting for Federal Natural Resources Other than Oil and Gas. The new standard being implemented is:
Technical Bulletin 2011-1, Accounting for Federal Natural Resources Other than Oil and Gas. TB 2011-1 clarifies that the government should report the value of its estimated royalties and other revenue from federal natural resources other than oil and gas, e.g., coal, that are (1) under lease, contract, or other long-term agreement, and (2) reasonably estimable as of the reporting date in RSI, consistent with the guidance contained in SFFAS No. 38. TB 2011-1 became effective in fiscal year 2014.
New Standards Issued and Not Yet Implemented
FASAB issued the following new standards that are applicable to the Financial Report, but are not yet implemented at the governmentwide level for fiscal year 2014:
In April 2012, FASAB issued SFFAS No. 42, Deferred Maintenance and Repairs, Amending SFFAS No. 6, 14, 29, and 32. SFFAS No. 42 replaces the definition, measurement, and reporting requirements for deferred maintenance and repairs established in SFFAS No. 6. In addition, SFFAS No. 42, paragraph 19 rescinds the current governmentwide disclosures required for deferred maintenance established in SFFAS 32 paragraph 24. SFFAS 42 paragraph 16 requires the governmentwide financial statements to disclose as RSI a description of what constitutes deferred maintenance and repairs (DM&R) and how it was measured; amounts of DM&R for each major category of property, plant, and equipment; and a general reference to specific component entity reports for additional information. SFFAS No. 42 becomes effective in fiscal year 2015. The specific impact of implementing the new standard has not yet been determined.
In January 2013, FASAB issued SFFAS No. 44, Accounting for Impairment of General Property, Plant, and Equipment Remaining in Use which provides accounting and reporting requirements for partial impairments of general property, plant, and equipment (G-PP&E) remaining in use and construction work-in-process. SFFAS No. 44 requires description of what constitutes G-PP&E impairment and the disclosure of related losses, if material. SFFAS No. 44 becomes effective in fiscal year 2015. The specific impact of implementing the new standard has not yet been determined.
In October 2014, FASAB issued SFFAS No. 46, Deferral of the Transition to Basic Information for Long-Term Projections; Amending SFFAS No. 36 and 45. Issued on September 2009, SFFAS No. 36, Comprehensive Long-Term Projections for the U.S. Government required that certain information currently included as RSI be presented as basic information starting in fiscal year 2013. This included the statement of long-term fiscal projections and related disclosures on the assumptions underlying the projections. Issued in July of 2013, SFFAS No. 45 amended the effective date for the transition to a basic financial statement for fiscal year 2014. SFFAS No. 46 amends the effective date for the transition to a basic financial statement for fiscal year 2015.

NOTES TO THE FINANCIAL STATEMENTS 57
In December 2014, FASAB issued SFFAS No. 47, Reporting Entity. SFFAS 47 establishes principles to identify organizations for which elected officials are accountable. The standard also guides preparers of general purpose federal financial reports in determining what organizations to report upon, whether such organizations are considered “consolidation entities” or “disclosure entities,” and what information should be presented about those organizations. The standard also requires information to be provided about related party relationships of such significance that it would be misleading to exclude information. SFFAS 47 is effective for periods beginning after September 30, 2017 and early implementation is not permitted.
C. Accounts and Taxes Receivable Accounts receivable represent claims to cash or other assets from entities outside the government that arise from the
sale of goods or services, duties, fines, certain license fees, recoveries, or other provisions of the law. Accounts receivable are reported net of an allowance for uncollectible accounts. An allowance is established when it is more likely than not the receivables will not be totally collected. The allowance method varies among the agencies in the government and is usually based on past collection experience and is re-estimated periodically as needed. Methods include statistical sampling of receivables, specific identification and intensive analysis of each case, aging methodologies, and percentage of total receivables based on historical collection.
Taxes Receivable consist primarily of uncollected tax assessments, penalties, and interest when taxpayers have agreed or a court has determined the assessments are owed. Taxes Receivable do not include unpaid assessments when taxpayers or a court have not agreed that the amounts are owed (compliance assessments) or the government does not expect further collections due to factors such as the taxpayer’s death, bankruptcy, or insolvency (write-offs). Taxes receivable are reported net of an allowance for the estimated portion deemed to be uncollectible. The allowance for doubtful accounts is based on projections of collectibles from a statistical sample of unpaid tax assessments.
D. Loans Receivable and Loan Guarantee Liabilities, Net Direct loans obligated and loan guarantees committed after fiscal year 1991 are reported based on the present value of
the net cashflows estimated over the life of the loan or guarantee. The difference between the outstanding principal of the direct loans and the present value of their net cash inflows is recognized as a subsidy cost allowance. The present value of estimated net cashflows of the loan guarantees is recognized as a liability for loan guarantees.
The subsidy expense for direct or guaranteed loans disbursed during a fiscal year is the present value of estimated net cashflows for those loans or guarantees. A subsidy expense also is recognized for modifications made during the year to loans and guarantees outstanding and for re-estimates made as of the end of the fiscal year to the subsidy allowances or loan guarantee liability for loans and guarantees outstanding.
Direct loans obligated and loan guarantees committed before fiscal year 1992 are valued under two different methodologies within the government: the allowance-for-loss method and the present-value method. Under the allowance-for-loss method, the outstanding principal of direct loans is reduced by an allowance for uncollectible amounts; the liability for loan guarantees is the amount the agency estimates would more likely than not require future cash outflow to pay default claims. Under the present-value method, the outstanding principal of direct loans is reduced by an allowance equal to the difference between the outstanding principal and the present value of the expected net cashflows. The liability for loan guarantees is the present value of expected net cash outflows due to the loan guarantees.
E. TARP Direct Loans and Equity Investments, Net TARP equity investments are accounted for at fair value, which is defined as the estimated amount of proceeds that
would be received if the equity investments were sold to a market participant in an orderly transaction. Consistent with the present value accounting concepts embedded in SFFAS No. 2, Accounting for Direct Loans and Loan Guarantees, TARP direct loans and equity investments, net, disbursed and outstanding are recognized as assets at the net present value of their estimated future cashflows and outstanding asset guarantees are recognized as liabilities or assets at the net present value of their estimated future cashflows. Market risk is considered in the calculation and determination of the estimated net present values.

58 NOTES TO THE FINANCIAL STATEMENTS
The subsidy allowance for TARP’s direct loans and equity investments represents the difference between the face value of the outstanding direct loan and equity investment balance and the net present value of the expected future cashflows. The subsidy allowance is reported as an adjustment to the face value of the direct loan or equity investment.
The recorded subsidy allowance for a direct loan or equity investment is based on a set of assumptions regarding estimated future cashflows.
The government used the following methodologies for valuation of the TARP direct loans and equity investments: The estimated future cashflows for TARP direct loans were derived using analytical models that estimate the cashflows to
and from the government over the life of the loan. These cashflows include the scheduled principal, interest, and other payments to the government, including estimated proceeds from equity interest obtained or additional notes. These models also include estimates of default and recoveries, incorporating the value of any collateral provided by the contract. The probability and timing of default, as well as losses relating to a default, are estimated by using applicable historical data when available, or publicly available proxy data, including credit rating agency historical performance data. The models include an adjustment for market risk which is intended to capture the risk of unexpected losses, but are not intended to represent fair value, i.e., the proceeds that would be expected to be received if the loans were sold to a market participant.
TARP preferred stock cashflows are projected using an analytical model developed to incorporate the risk of losses associated with adverse events, such as failure of the institution or increases in market interest rates. The model estimates how cashflows vary depending on: (1) current interest rates, which may affect the decision whether to repay the preferred stock; and (2) the strength of a financial institution’s assets. Inputs to the model include institution specific accounting data obtained from regulatory filings, an institution’s stock price volatility, and historical bank failure information. The government estimates the values and projects the cashflows of warrants using an option-pricing approach based on the current stock price and its volatility. Investments in common stock which are exchange traded are valued at the market price. The result of using market prices, either quoted prices for the identical asset or quoted prices for comparable assets, is that the equity investments are recorded at estimated fair value.
For more details on TARP, see Note 5—TARP Direct Loans and Equity Investments, Net.
F. Inventories and Related Property Inventory is tangible personal property that is (1) held for sale, principally to federal agencies, (2) in the process of
production for sale, or (3) to be consumed in the production of goods for sale or in the provision of services for a fee. SFFAS No. 3, Accounting for Inventory and Related Property, requires inventories held for sale and held in reserve for future sale within the government to be valued using either historical cost or latest acquisition cost (LAC). Historical cost methods include first-in-first-out, weighted average, and moving average. When LAC methods are used, the inventory is revalued periodically and an allowance account should be established for unrealized holding gains and losses.
The Department of Defense (DOD) holds the majority of the inventories within the government and uses standard price and moving average cost methods for valuing most of its inventory. To a lesser degree, DOD also uses first-in-first-out methods and LAC methods adjusted for holding gains and losses to approximate the historical cost of resale inventory items remaining in its legacy system. The latest acquisition cost method is used because legacy inventory systems were designed for material management rather than accounting. Although these systems provide visibility and accountability over inventory items, they do not maintain historical cost data necessary to comply with SFFAS No. 3, Accounting for Inventory and Related Property. DOD is continuing to transition inventories currently accounted for under the LAC methods, to be accounted for under the moving average cost methods.
When using historical cost valuation, estimated repair costs reduce the value of inventory held for repair. Excess, obsolete, and unserviceable inventories are valued at estimated net realizable value. When LAC is used to value inventory held for sale, it is adjusted for holding gains and losses in order to approximate historical cost.
Related property includes commodities, seized monetary instruments, forfeited and foreclosed property, raw materials and work in process. Operating materials and supplies are valued at historical cost, LAC, and standard price using the purchase and consumption method of accounting. Operating materials and supplies that are valued at latest acquisition cost and standard pricing are not adjusted for holding gains and losses.

NOTES TO THE FINANCIAL STATEMENTS 59
G. Property, Plant, and Equipment Property, Plant, and Equipment (PP&E) consists of tangible assets including buildings, equipment, construction in
progress, internal use software, assets acquired through capital leases (including leasehold improvements), and other assets used to provide goods and services.
PP&E used in government operations are carried at acquisition cost, with the exception of some DOD equipment. In some instances, DOD equipment is valued at estimated historical costs, which are calculated using internal DOD records. To establish a baseline, DOD accumulated information relating to program funding and associated equipment, equipment useful life, program acquisitions, as well as disposals. The equipment baseline is updated using expenditure information and information related to acquisitions and disposals.
All PP&E is capitalized if the acquisition costs (or estimated acquisition cost for DOD) are in excess of capitalization thresholds that vary considerably between the federal entities. Depreciation and amortization expense applies to PP&E reported on the balance sheets except for land, unlimited duration land rights, and construction in progress. Depreciation and amortization are recognized using the straight-line method over the estimated useful lives of the assets. All PP&E are assigned useful lives depending on their category. The cost of acquisition, betterment, or reconstruction of all multi-use heritage assets is capitalized as general PP&E and is depreciated. Construction in progress is used for the accumulation of the cost of construction or major renovation of fixed assets during the construction period. The assets are transferred out of construction in progress when the project is substantially completed. Internal use software includes purchased commercial off-the-shelf software, contractor-developed software, and software internally developed.
For financial reporting purposes, other than multi-use heritage assets, stewardship assets are not recorded as part of PP&E. Stewardship Assets consist of public domain land (Stewardship Land) and Heritage Assets. Examples of stewardship land include national parks, wildlife refuges, national forests, and other lands of national and historical significance. Heritage assets include national monuments, and historical sites that among other characteristics are of historical, natural, cultural, educational, or artistic significance. Stewardship land and most heritage assets are considered priceless and irreplaceable, and as such they are measured in physical units with no financial value assigned to them. Some heritage assets have been designated as multi-use heritage assets, for example the White House, the predominant use of which is in government operations. For more details on stewardship assets, see Note 25—Stewardship Land and Heritage Assets.
H. Debt and Equity SecuritiesDebt and equity securities are classified as held-to-maturity, available-for-sale, and trading. Held-to-maturity debt and
equity securities are reported at amortized cost, net of unamortized premiums and discounts. Available-for-sale debt and equity securities are reported at fair value. Trading debt and equity securities are reported at fair value.
I. Investments in Government-Sponsored Enterprises The senior preferred stock and associated common stock warrants in GSEs are presented at their fair value. The
annual valuation to estimate the asset’s fair value incorporates various forecasts, projections, and cashflow analyses. These valuations are performed on the senior preferred stock and warrants and any changes in valuation, including impairment, are recorded and disclosed in accordance with SFFAS No. 7, Accounting for Revenue and Other Financing Sources. Since the valuation is an annual process, the changes in valuation of the senior preferred stock and warrants are deemed usual and recurring. Accordingly, changes in valuation are recorded as an exchange transaction which is either an expense or revenue. Since the costs of the senior preferred stock and warrants are reflected in exchange transactions, any change in valuation is also recorded as an exchange transaction.
The Housing and Economic Recovery Act of 2008 (HERA) established the Federal Housing Finance Agency (FHFA), which was created to enhance authority over the GSEs, and provide the Secretary of the Treasury with certain authorities to support the financial stability of the GSEs. In September 2008, Treasury entered into a Senior Preferred Stock Purchase Agreement (SPSPA) with each GSE. Based on U.S. GAAP, these commitments, predicated on the future occurrence of any stockholders’ equity net deficits of the GSEs, at the end of any reporting quarter are potential liabilities of Treasury. The potential liabilities to the GSEs, if any, are assessed annually and recorded at the gross estimated amount. For more detailed information on investments in GSEs, refer to Note 9—Investments in Government-Sponsored Enterprises.

60 NOTES TO THE FINANCIAL STATEMENTS
J. Federal Debt Accrued interest on Treasury securities held by the public is recorded as an expense when incurred, instead of when
paid. Certain Treasury securities are issued at a discount or premium. These discounts and premiums are amortized over the term of the security using an interest method for all long-term securities and the straight line method for short-term securities. Treasury also issues Treasury Inflation-Protected Securities (TIPS). The principal for TIPS is adjusted daily over the life of the security based on the Consumer Price Index for All Urban Consumers (CPI–U).
K. Federal Employee and Veteran Benefits Payable Generally, federal employee and veteran benefits payable are recorded during the time employee services are rendered.
The related liabilities for defined benefit pension plans, veterans’ compensation and burial benefits, post-retirement health benefits, and post-retirement life insurance benefits, are recorded at estimated present value of future benefits, less any estimated present value of future normal cost contributions. Normal cost is the portion of the actuarial present value of projected benefits allocated as an expense for employee services rendered in the current year. Actuarial gains and losses (as well as prior service cost, if any) are recognized immediately in the year they occur without amortization.
The Department of Veterans Affairs (VA) also provides certain veterans and/or their dependents with pension benefits, based on annual eligibility reviews, if the veteran died or was disabled for nonservice-related causes. The actuarial present value of the future liability for these VA pension benefits is a nonexchange transaction and is not required to be recorded on the Balance Sheet. These benefits are expenses when benefits are paid rather than when employee services are rendered.
The liabilities for Federal Employees’ Compensation Act (workers compensation) benefits are recorded at estimated present value of future benefits for injuries and deaths that have already been incurred.
Gains and losses from changes in long-term assumptions used to estimate federal employee pensions, Other Retirement Benefits (ORB), and Other Postemployment Benefits (OPEB) liabilities are reflected separately on the Statement of Net Cost and the components of the expense related to federal employee pension, ORB, and OPEB liabilities are disclosed in Note 13—Federal Employee and Veteran Benefits Payable as prescribed by SFFAS No. 33. In addition, SFFAS No. 33 also provides a standard for selecting the discount rate assumption for present value estimates of federal employee pension, ORB, and OPEB liabilities.
L. Environmental and Disposal Liabilities Environmental and disposal liabilities are recorded at the estimated current cost of removing, containing, treating,
and/or disposing of radioactive waste, hazardous waste, chemical and nuclear weapons, as well as other environmental contaminations (including asbestos), assuming the use of current technology. Hazardous waste is a solid, liquid, or gaseous waste that, because of its quantity or concentration, presents a potential hazard to human health or the environment. Remediation consists of removal, decontamination, decommissioning, site restoration, site monitoring, closure as well as post-closure cost, treatment, and/or safe containment. Where technology does not exist to clean up radioactive or hazardous waste, only the estimable portion of the liability (typically monitoring and safe containment) is recorded.
M. Insurance and Guarantee Program Liabilities Insurance and guarantee programs (such as Deposit Insurance Fund Program, Federal Crop Insurance Program and
Benefit Pension Plans Program) provide protection to individuals or entities against specified risks except for those specifically covered by federal employee and veteran benefits, social insurance, and loan guarantee programs. Insurance and guarantee program funds are commonly held in revolving funds in the government and losses sustained by participants are paid from these funds. Many of these programs receive appropriations to pay excess claims and/or have authority to borrow from the Treasury. The values of insurance and guarantee program liabilities are particularly sensitive to changes in underlying estimates and assumptions. Insurance and guarantee programs with recognized liabilities in future periods (i.e., liabilities that extend beyond one year) are reported at their actuarial present value.

NOTES TO THE FINANCIAL STATEMENTS 61
N. Deferred Maintenance and Repairs Deferred maintenance and repairs are maintenance and repairs that were not performed when they should have been or
scheduled maintenance and repairs that were delayed or postponed. Maintenance is the act of keeping fixed assets in acceptable condition, including preventative maintenance, normal repairs, and other activities needed to preserve the assets, so they continue to provide acceptable service and achieve their expected life. Maintenance and repairs exclude activities aimed at expanding the capacity of assets or otherwise upgrading them to serve needs different from those originally intended. Deferred maintenance and repairs expenses are not accrued in the Statements of Net Cost or recognized as liabilities on the Balance Sheet. However, deferred maintenance and repairs information is disclosed in the unaudited Required Supplementary Information section of this report.
O. Contingent Liabilities Liabilities for contingencies are recognized on the Balance Sheet when both: A past transaction or event has occurred, and A future outflow or other sacrifice of resources is probable and measurable.
The estimated contingent liability may be a specific amount or a range of amounts. If some amount within the range is a better estimate than any other amount within the range, then that amount is recognized. If no amount within the range is a better estimate than any other amount, then the minimum amount in the range is recognized and the range is disclosed.
Contingent liabilities that do not meet the above criteria for recognition, but for which there is at least a reasonable possibility that a loss may be incurred, are disclosed in Note 20—Contingencies.
P. Commitments In the normal course of business, the government has a number of unfulfilled commitments that may require the use of
its financial resources. Note 21—Commitments describes the components of the government’s actual commitments that are disclosed due to their nature and/or their amount. They include long-term leases, undelivered orders, and other commitments.
Q. Social Insurance A liability for social insurance programs (Social Security, Medicare, Railroad Retirement, Black Lung, and
Unemployment) is recognized for any unpaid amounts currently due as of the reporting date. No liability is recognized for future benefit payments not yet due. For further information, see the unaudited RSI—Social Insurance section, and Note 24—Social Insurance.
R. Funds from Dedicated Collections Generally, funds from dedicated collections are financed by specifically identified revenues, provided to the
government by non-federal sources, often supplemented by other financing sources that remain available over time. These specifically identified revenues and other financing sources are required by statute to be used for designated activities, benefits, or purposes, and must be accounted for separately from the government’s general revenues. The three required criteria for a fund from dedicated collections are:
A statute committing the government to use specifically identified revenues and/or other financing sources that are originally provided to the government by a non-federal source only for designated activities, benefits, or purposes;
Explicit authority for the fund to retain revenues and/or other financing sources not used in the current period for future use to finance the designated activities, benefits, or purposes; and
A requirement to account for and report on the receipt, use, and retention of the revenues and/or other financing sources that distinguishes the fund from the government’s general revenues.
For more details on funds from dedicated collections, see Note 22—Funds from Dedicated Collections.
62 NOTES TO THE FINANCIAL STATEMENTS
S. Related Party Transactions
Federal Reserve System The Federal Reserve System (FR System) was created by Congress under the Federal Reserve Act of 1913. The FR
System consists of the Federal Reserve Board of Governors (Board), the Federal Open Market Committee (FOMC), and the Federal Reserve Banks (FRBs). Collectively, the FR System serves as the nation’s central bank and is responsible for formulating and conducting monetary policy, issuing and distributing currency (Federal Reserve Notes), supervising and regulating financial institutions, providing nationwide payments systems (including large-dollar transfers of funds, Automated Clearing House operations, as well as check processing and settlement), and providing certain financial services to federal agencies and fiscal principals. Monetary policy includes actions undertaken by the FR System that influence the availability and cost of money and credit as a means of helping to promote national economic goals. The FR System also conducts operations in foreign markets in order to counter disorderly conditions in exchange markets or to meet other needs specified by the FOMC to carry out its central bank responsibilities. The FR System is not included in the federal budget. It is considered an independent central bank, and its decisions are not ratified by the executive branch of the federal government.
The government interacts with the FRBs in a variety of ways, including the following: The FRBs serve as the government’s fiscal agent and depositary, executing banking and other financial transactions
on the government’s behalf. The government reimburses the FRBs for these services, the cost of which is included on the Statements of Net Cost;
The FRBs hold Treasury and other federal securities in the FRBs’ System Open Market Account (SOMA) for the purpose of conducting monetary policy (Note 12—Federal Debt Securities Held by the Public and Accrued Interest);
The FRBs hold gold certificates issued by the government in which the certificates are collateralized by gold (Note 2—Cash and Other Monetary Assets);
The FRBs hold Special Drawing Rights (SDR) certificates issued by the government which are collateralized by SDRs (see Note 2—Cash and Other Monetary Assets); and,
The FRBs are required by Board policy to transfer their excess earnings to the government, which are included in Other Taxes and Receipts on the Statements of Operations and Changes in Net Position.
The government also consults with the FR System on matters affecting the economy and certain financial stability activities (Note 4—Loans Receivable and Loan Guarantee Liabilities, Net, and Note 5—Troubled Asset Relief Program (TARP)—Direct Loans and Equity Investments, Net). The above financial activities involving the government are accounted for and disclosed in the government consolidated financial statements. In accordance with SFFAC No. 2, Entity and Display, the FR System’s assets, liabilities, and operations are not consolidated into the government’s financial statements, and are, therefore, not a part of the reporting entity.
Federal Reserve System Structure The Board is an independent organization governed by seven members who are appointed by the President and
confirmed by the Senate. The full term of a Board member is 14 years, and the appointments are staggered so that one term expires on January 31 of each even-numbered year. The Board has a number of supervisory and regulatory responsibilities for institutions including, among others, state-chartered banks that are members of the FR System, bank holding companies, plus savings and loan holding companies. In addition, the Board has general supervisory responsibilities for the 12 FRBs, and issues currency (Federal Reserve Notes) to the FRBs for distribution. The FOMC is comprised of the seven Board members and five of the 12 FRB presidents, and is charged with formulating and conducting monetary policy primarily through open market operations (the purchase and sale of certain securities in the open market), the principal tool of national monetary policy. These operations affect the amount of reserve balances available to depository institutions, thereby influencing overall monetary and credit conditions. The 12 FRBs are chartered under the Federal Reserve Act, which requires each member bank to own the capital stock of its FRB. Supervision and control of each FRB is exercised by a board of directors, of which three are appointed by the Board of Governors of the FR System, and six are elected by their member banks.
The FRBs participate in formulating and conducting monetary policy, distribute currency and coin, and serve as fiscal agents for the government, other federal agencies, and fiscal principals. Additionally, the FRBs provide short-term loans to depository institutions and loans to participants in programs or facilities with broad-based eligibility in unusual and exigent circumstances when approved by the Board.

NOTES TO THE FINANCIAL STATEMENTS 63
Federal Reserve System Assets and Liabilities The FRBs hold Treasury and other securities in the SOMA for the purpose of conducting monetary policy. Treasury
securities held by the FRBs totaled $1,919.4 billion and $1,930.2 billion at September 30, 2014 and 2013, respectively (Note 12—Federal Debt Securities Held by the Public and Accrued Interest). These assets are generally subject to the same market (principally interest-rate) and credit risks as other financial instruments. In the open market, the FR System purchases and sells Treasury securities as a mechanism for controlling the money supply.
The FRBs have deposit liabilities with Treasury and depository institutions. The FRBs issue Federal Reserve Notes, the circulating currency of the United States, which are collateralized by the Treasury securities and other assets held by the FRBs. Financial and other information concerning the FR System, including financial statements for the Board and the FRBs, may be obtained at http://www.federalreserve.gov.
FRB Residual Earnings Transferred to the Government FRBs generate income from interest earned on securities, reimbursable services provided to federal agencies, and the
provision of priced services to depository institutions, as specified by the Monetary Control Act of 1980. Although the FRBs generate earnings from carrying out open market operations (via the earnings on securities held in the SOMA account), their execution of these operations is for the purpose of accomplishing monetary policy rather than generating earnings. Each FRB is required by Board policy to transfer to the government its residual (or excess) earnings, after providing for the cost of operations, payment of dividends, and reservation of an amount necessary to equate surplus with paid-in capital. These residual earnings may vary due to, among other things, changes in the SOMA balance levels that may occur in conducting monetary policy. The FRB residual earnings of $99.2 billion and $75.8 billion for fiscal years ended September 30, 2014 and 2013, respectively, are reported as other taxes and receipts on the Statements of Operations and Changes in Net Position. Accounts and taxes receivables, net, includes a receivable for FRB’s residual earnings which represents the earnings due to the Treasury General Fund as of September 30, but not collected by the Treasury General Fund until after the end of the month. As of September 30, 2014 and 2013, interest receivable on FRB’s residual earnings are $1.7 billion and $3.1 billion, respectively (Note 3—Accounts and Taxes Receivables, Net).
Other Related Parties
The federal government, through the Federal Housing Finance Agency (FHFA) is the conservator for Fannie Mae and Freddie Mac. See Note 9—Investments in Government-Sponsored Enterprises.
The Secretary of Transportation has possession of two long term notes with the National Railroad Passenger Service Corporation (more commonly referred to as Amtrak). The first note is for $4 billion and matures in 2975 and the second note is for $1.1 billion and matures in 2082 with renewable 99 year terms. Interest is not accruing on these notes as long as the current financial structure of Amtrak remains unchanged. If the financial structure of Amtrak changes, both principal and accrued interest are due and payable. The Department of Transportation (DOT) does not record the notes in its financial statements because the present value of the notes was immaterial at September 30, 2014. These notes were discounted according to rates published in OMB M-14-5, Appendix C, Discount Rates for Cost Effectiveness Lease Purchase and Related Analyses with maturity dates of 2975 and 2082.
In addition, DOT has possession of all the preferred stock shares (109.4 million) of Amtrak. Congress, through DOT, has continued to fund Amtrak since approximately 1972; originally through grants, then, beginning in 1981, through the purchase of preferred stock, and then through grants again after 1997. The Amtrak Reform and Accountability Act of 1997 changed the structure of the preferred stock by rescinding the voting rights with respect to the election of the Board of Directors and by eliminating the preferred stock’s liquidation preference over the common stock. The Act also eliminated further issuance to DOT of preferred stock. DOT does not record the Amtrak preferred stock in its financial statements because, under the Corporation's current financial structure, the preferred shares do not have a liquidation preference over the common shares, the preferred shares do not have any voting rights, and dividends are neither declared nor in arrears.
Amtrak is not a department, agency, or instrumentality of the government or DOT. The nine members of Amtrak’s Board of Directors are appointed by the President of the United States and are subject to confirmation by the U.S. Senate. Once appointed, Board members, as a whole, act independently without the consent of the government or any of its officers to set Amtrak policy, determine its budget and decide operational issues. The Secretary of Transportation is statutorily appointed to the nine-member Board. Traditionally, the Secretary of Transportation has designated the Administrator of the Federal Railroad Administration to represent the Secretary at Board meetings.
The Export-Import Bank of the United States (Ex-Im Bank) has contractual agreements with the Private Export Funding Corporation (PEFCO). PEFCO, which is owned by a consortium of private-sector banks, industrial companies, and financial services institutions, makes medium-term and long-term fixed-rate and variable-rate loans to foreign borrowers to purchase U.S.-made equipment when such loans are not available from traditional private sector lenders on competitive terms. Ex-Im Bank’s credit and guarantee agreement with PEFCO extends through December 31, 2020. Through its contractual

64 NOTES TO THE FINANCIAL STATEMENTS
agreements with PEFCO, Ex-Im Bank exercises a broad measure of supervision over PEFCO’s major financial management decisions, including approval of both the terms of individual loan commitments and the terms of PEFCO’s long-term debt issues, and is entitled to representation at all meetings of PEFCO’s board of directors, advisory board, and its exporters’ council.
The contractual agreements provide that Ex-Im Bank will (1) guarantee the due and punctual payment of principal, as well as interest on export loans made by PEFCO, and (2) guarantee the due and punctual payment of interest on PEFCO’s long-term secured debt obligations when requested by PEFCO. Related to the amounts for Ex-Im Bank as shown in Note 4—Loans Receivable and Loan Guarantee Liabilities, Net, these guarantees to PEFCO, aggregating $10.0 billion and $7.5 billion at September 30, 2014, and 2013, respectively, are included within the principal amounts guaranteed by the United States. The allowance related to these transactions is included within the guaranteed loan liability. Ex-Im Bank received fees for the agreements totaling $0.04 billion for both fiscal years 2014 and 2013, which are included as earned revenue on the Statements of Net Cost.
T. Unmatched Transactions and Balances The reconciliation of the change in net position requires that the difference between ending and beginning net position
equals the difference between revenue and cost, plus or minus prior-period adjustments. The unmatched transactions and balances are needed to bring the change in net position into balance. The primary
factors affecting this out of balance situation are: Unmatched intragovernmental transactions and balances between federal agencies; Unmatched intragovernmental transactions and balances between federal agencies and General Fund; and Errors and restatements in federal agencies’ reporting.
Refer to the Other Information (unaudited) —Unmatched Transactions and Balances for detailed information.
U. Reclassifications Certain amounts were reclassified in fiscal year 2014 and affect the fiscal year 2013 Statement of Net Cost,
Reconciliations of Net Operating Cost and Unified Budget Deficit, Statement of Changes in Cash Balance from Unified Budget and Other Activities, and Notes to the Balance Sheet – Other Liabilities and Insurance Guarantee Program Liabilities. For fiscal year 2014, Millennium Challenge Corporation (MCC) and Overseas Private Investment Corporation (OPIC), which were previously identified as non-significant entities, are now being reported as significant entities required to provide audited fiscal year end data to prepare the Financial Report. They both are now separately identified on the Statement of Net Cost and their fiscal year 2013 net cost amounts were reclassified out of “All other entities.”
In previous years only TARP year end re-estimates were reflected as a separate line on the Reconciliation of Net Operating Cost and Unified Budget Deficit and the Statement of Changes in Cash Balance from Unified Budget and Other Activities. These statements now reflect all agencies year end credit reform subsidy re-estimates as a separate line, thus the fiscal year 2013 amounts for the other agencies were reclassified out of the “Other” line.
It has been determined that for fiscal year 2013 Pension Benefit Guaranty Corporation (PBGC) obligations for future financial assistance to multiemployer plans for $9.9 billion be reclassified from Other Liabilities to Insurance and Guarantee Programs. PBGC will report in future years obligations to the financial assistance multiemployer plans in Insurance and Guarantee Programs.
V. RestatementsThere were no material restatements to fiscal year 2013 reported amounts.

NOTES TO THE FINANCIAL STATEMENTS 65
W. Fiduciary Activities Fiduciary activities are the collection or receipt, as well as the management, protection, accounting, investment and
disposition by the government of cash or other assets in which non-federal individuals or entities have an ownership interest that the government must uphold. Fiduciary cash and other fiduciary assets are not assets of the government and are not recognized on the Balance Sheet. See Note 23—Fiduciary Activities, for further information.
X. Use of Estimates The government has made certain estimates and assumptions relating to the reporting of assets, liabilities, revenues,
expenses, and the disclosure of contingent liabilities to prepare these financial statements. There are a large number of factors that affect these assumptions and estimates, which are inherently subject to substantial uncertainty arising from the likelihood of future changes in general economic, regulatory, and market conditions. As such, actual results will differ from these estimates and such differences may be material.
Significant transactions subject to estimates include loans and credit program receivables, federal employee and veteran benefits payable, credit reform subsidy costs, investments in GSEs, and other non-federal securities and related impairment, tax receivables, loan guarantees, depreciation, imputed costs, other actuarial liabilities, cost and earned revenue allocations, as well as contingencies and any related recognized liabilities.
The government recognizes the sensitivity of credit reform modeling to slight changes in some model assumptions and uses regular review of model factors, statistical modeling, and annual re-estimates to reflect the most accurate cost of the credit programs to the U.S. Government. Federal Credit Reform Act of 1990 (FCRA) loan receivables and loan guarantees are disclosed in Note 4—Loans Receivable and Loan Guarantee Liabilities, Net. Additionally, all TARP credit activity, including investments in common and preferred stock, as well as loans and asset guarantees, are also subject to credit reform accounting (see Note 5—TARP Direct Loans and Equity Investments, Net).
The forecasted future cashflows used to determine credit reform amounts as of September 30, 2014, and 2013, are sensitive to slight changes in model assumptions, such as general economic conditions, specific stock price volatility of the entities in which the government has an equity interest, estimates of expected default, and prepayment rates. Forecasts of future financial results have inherent uncertainty and the TARP Direct Loans and Equity Investments, Net line item as of September 30, 2014, and 2013, is reflective of relatively illiquid, troubled assets whose values are particularly sensitive to future economic conditions and other assumptions.
The GSE senior preferred stock purchase agreements (SPSPAs) provide that the government will fund the GSEs, if needed at the end of any quarter. The FHFA, acting as the conservator, determines whether the liabilities of either GSE, individually, exceed its respective assets. The annual valuation performed as of September 30 on the preferred stock and warrants comprising the Investments in GSEs line item on the Balance Sheets incorporates various forecasts, projections, and cash flow analyses to develop an estimate of the asset’s fair value. A key input into the investment valuation for the senior preferred stock is the present value of the projected quarterly dividend payments, and a key input for the warrants is the market value of the shares of common stock of the GSEs which are traded on the over-the-counter (OTC) Bulletin Board. Treasury performs annual calculations, as of September 30, to assess the need for recording an estimated liability in accordance with SFFAS No. 5, related to the government’s funding commitment to the GSEs under the SPSPAs. As part of the fiscal year 2014 assessment process, Treasury used 25-year financial forecasts prepared through year 2039 and 2038 in assessing if a contingent liability was required as of September 30, 2014 and 2013, respectively, to determine the implied amount of total liability. In fiscal year 2012, the SPSPAs were amended. For more detailed information on investments in GSEs and the amended SPSPAs, see Note 9—Investments in Government-Sponsored Enterprises.
The government offers its employees pension and other post-employment retirement benefits, as well as life and health insurance. The Office of Personnel Management administers the largest civilian plan and the Department of Defense and Department of Veterans Affairs administer the military plans. Generally the benefits payable are recorded during the time employee services are rendered. The related liabilities for defined benefit pension plans, veterans’ compensation and burial benefits, post-retirement health benefits, life insurance benefits, and Federal Employees’ Compensation Act benefits are recorded at estimated present value of future benefits, less any estimated present value of future normal cost contributions. See Note—13 Federal Employee and Veteran Benefits Payable for additional information.

66 NOTES TO THE FINANCIAL STATEMENTS
Y. Credit Risk Credit risk is the potential, no matter how remote, for financial loss from a failure of a borrower or a counterparty to
perform in accordance with underlying contractual obligations. The government takes on credit risk when it makes direct loans or credits to foreign entities or becomes exposed to institutions which engage in financial transactions with foreign countries.
The government also takes on credit risk related to committed, but undisbursed direct loans, funding commitments to GSEs, investments, loans, and asset guarantees of the TARP, guarantee of money market funds, and the Terrorism Risk Insurance Program. Except for the Terrorism Risk Insurance Program, these activities focus on the underlying problems in the credit markets, and the ongoing instability in those markets exposes the government to potential unknown costs and losses. The extent of the risk assumed is described in more detail in the notes to the financial statements, and where applicable, is factored into credit reform models and reflected in fair value measurements.

NOTES TO THE FINANCIAL STATEMENTS 67
Note 2. Cash and Other Monetary Assets
Cash and Other Monetary Assets as of September 30, 2014, and 2013 (In billions of dollars) 2014 2013 Unrestricted cash: Cash held by Treasury for Governmentwide operations ....................... 153.2 82.8 Other ...................................................................................................... 7.2 6.3 Restricted cash ................................................................................ 21.5 21.5 Total Cash ........................................................................................... 181.9 110.6 International Monetary assets .................................................................. 66.0 72.9 Gold and silver ......................................................................................... 11.1 11.1 Foreign Currency ..................................................................................... 5.9 11.7 Total cash and other monetary assets ................................................... 264.9 206.3
Unrestricted cash includes cash held by Treasury for Governmentwide operations (Operating Cash) and all other unrestricted cash held by the federal agencies. Operating Cash represents balances from tax collections, other revenue, federal debt receipts, and other various receipts net of cash outflows for budget outlays and other payments. Treasury checks outstanding are netted against Operating Cash until they are cleared by the Federal Reserve System. Other unrestricted cash not included in Treasury’s Operating Cash balance includes balances representing cash, cash equivalents, and other funds held by agencies, such as undeposited collections, deposits in transit, demand deposits, amounts held in trust, and imprest funds. Operating Cash held by the Treasury increased by $70.4 billion (an increase of approximately 85 percent) in fiscal year 2014 due to Treasury’s investment and borrowing decisions to manage the balance and timing of the Government’s cash position.
Restrictions on cash are due to the imposition on cash deposits by law, regulation, or agreement. Restricted cash is primarily composed of cash held by the Executive Office of the President (EOP) Foreign Military Sales program. The Foreign Military Sales program included $20.5 billion and $20.6 billion as of September 30, 2014, and 2013, respectively.
International monetary assets include the U.S. reserve position in the International Monetary Fund (IMF) and U.S. holdings of Special Drawing Rights (SDRs). The U.S. reserve position in the IMF is an interest-bearing claim on the IMF that includes the reserve asset portion of the financial subscription that the United States has paid in as part of its participation in the IMF as well as any amounts drawn by the IMF from a letter of credit made available by the United States as part of its financial subscription to the IMF. The IMF promotes international monetary cooperation and a stable payments system to facilitate growth in the world economy. Its primary activities are surveillance of members’ economies, financial assistance, as appropriate, and technical assistance.
Only a portion of the U.S. financial subscription to the IMF is made in the form of reserve assets; the remainder is provided in the form of a letter of credit from the United States to the IMF. The balance available under the letter of credit totaled $47.6 billion and $44.6 billion as of September 30, 2014, and 2013 respectively. The U.S. reserve position in the IMF has a U.S. dollar equivalent of $14.7 billion and $19.8 billion as of September 30, 2014, and 2013, respectively.
The SDR is an international reserve asset created by the IMF to supplement the existing reserve assets of its members. These interest-bearing assets can be obtained by IMF allocations, transactions with IMF member countries, or in the form of interest earnings on SDR holdings and reserve positions in the IMF. U.S. SDR holdings are an interest-bearing asset of Treasury’s Exchange Stabilization Fund (ESF). The total amount of SDR holdings of the United States was the equivalent of $53.2 billion and $55.0 billion as of September 30, 2014, and 2013, respectively.
The IMF allocates SDRs to its members in proportion to each member’s quota in the IMF. The SDR Act, enacted in 1968, authorized the Secretary of the Treasury to issue SDR Certificates (SDRCs) to the Federal Reserve in exchange for dollars. The amount of SDRCs outstanding cannot exceed the dollar value of SDR holdings. The Secretary of the Treasury
68 NOTES TO THE FINANCIAL STATEMENTS
determines when Treasury will issue or redeem SDRCs. SDRCs outstanding totaled $5.2 billion as of September 30, 2014, and 2013, and are included in Note 17—Other Liabilities.
As of September 30, 2014, and 2013, other liabilities included $52.4 billion and $54.2 billion of interest-bearing liability to the IMF for SDR allocations. The SDR allocation item represents the cumulative total of SDRs distributed by the IMF to the United States in allocations that occurred in 1970, 1971, 1972, 1979, 1980, 1981, and 2009. The United States has received no SDR allocations since 2009.
Gold is valued at the statutory price of $42.2222 per fine troy ounce. The number of fine troy ounces of gold was 261,498,927 as of September 30, 2014 and 2013. The market value of gold on the London Fixing was $1,217 and $1,327 per fine troy ounce as of September 30, 2014, and 2013, respectively. In addition, silver is valued at the statutory price of $1.2929 per fine troy ounce. The number of fine troy ounces of silver was 16,000,000 as of September 30, 2014, and 2013. The market value of silver on the London Fixing was $17.11 and $21.68 per fine troy ounce as of September 30, 2014, and 2013, respectively. Gold totaling $11.0 billion as of September 30, 2014, and 2013, was pledged as collateral for gold certificates issued and authorized to the FRBs by the Secretary of the Treasury. Gold certificates were valued at $11.0 billion as of September 30, 2014, and 2013, which are included in Note 17—Other Liabilities. Treasury may redeem the gold certificates at any time. Foreign currency is translated into U.S. dollars at the exchange rate at fiscal year end. The foreign currency is maintained by the ESF and various U.S. federal agencies as well as foreign banks.

NOTES TO THE FINANCIAL STATEMENTS 69
Note 3. Accounts and Taxes Receivable, Net
Accounts and Taxes Receivable as of September 30, 2014, and 2013
(In billions of dollars) 2014 2013 Accounts receivable: Gross accounts receivable .................................................................... 87.0 89.1 Allowance for uncollectible accounts ..................................................... (26.0) (23.6) Accounts receivable, net ........................................................................ 61.0 65.5 Taxes receivable: Gross taxes receivable .......................................................................... 161.7 164.0 Allowance for doubtful accounts ............................................................ (118.7) (126.3) Taxes receivable, net ............................................................................. 43.0 37.7 Total accounts and taxes receivable, net ............................................ 104.0 103.2
Accounts receivable include related interest receivable of $5.0 billion and $8.1 billion as of September 30, 2014, and 2013, respectively.
Treasury comprises approximately 40.9 percent of the Government’s reported accounts and taxes receivable, net, as of September 30, 2014. Refer to the financial statements of the Department of the Treasury, the Social Security Administration, the Department of Health and Human Services, the Department of Defense, the Department of Homeland Security, the Pension Benefit Guaranty Corporation, the Department of Energy, the Department of Veterans Affairs, the Federal Deposit Insurance Corporation, the Department of the Interior, the Department of Housing and Urban Development, and the Department of Labor for details on gross accounts and taxes receivable and the related allowance for doubtful accounts. These agencies comprise 91.7 percent of the Government’s accounts and taxes receivable, net, of $104.0 billion as of September 30, 2014.

70 NOTES TO THE FINANCIAL STATEMENTS
Note 4. Loans Receivable and Loan Guarantee Liabilities, Net
Direct Loan and Defaulted Guaranteed Loan Programs as of September 30, 2014, and 2013
Face Value of Loans
Outstanding
Long-term Cost of (Income
from) Direct Loans and Defaulted
Guaranteed Loans
Outstanding Loans
Receivable, Net
Subsidy Expense
(Income) for the Fiscal Year
(In billions of dollars) 2014 2013 2014 2013 2014 2013 2014 2013
Federal Direct Student Loans – Education…………………………. 731.2 613.9 (47.4) (65.3) 778.6 679.2 8.1 (39.7)
Federal Family Education Loans – Education………………………. 139.8 143.6 (3.1) (2.1) 142.9 145.7 (2.0) (0.9)
Electric Loans – USDA…………. 51.2 49.5 2.2 2.2 49.0 47.3 (0.1) 0.2 Rural Housing Services - USDA 31.9 31.8 3.6 3.4 28.3 28.4 0.2 0.4 Export-Import Bank Loans……... 22.9 19.7 3.4 3.0 19.5 16.7 (0.5) (0.9) International Monetary Fund Program – Treasury……………... 16.2 15.8 0.7 0.2 15.5 15.6 0.2 -
Housing and Urban Development Loans…………….. 18.1 15.7 5.5 3.9 12.6 11.8 (0.6) (0.3)
Water and Environmental Loans – USDA…………………………… 12.6 12.3 0.3 0.2 12.3 12.1 0.1 (0.1)
All other programs……………… 81.8 82.9 17.0 17.4 64.8 65.5 0.7 2.9
Total direct loans and defaulted guaranteed loans………………. 1,105.7 985.2 (17.8) (37.1) 1,123.5 1,022.3 6.1 (38.4)

NOTES TO THE FINANCIAL STATEMENTS 71
Loan Guarantees as of September 30, 2014, and 2013
Principal Amount of
Loans Under Guarantee
Principal Amount Guaranteed by the
United States Loan Guarantee
Liabilities
Subsidy Expense (Income) for the
Fiscal Year (In billions of dollars) 2014 2013 2014 2013 2014 2013 2014 2013
Federal Housing Administration Loans – HUD……………………. 1,290.6 1,282.9 1,185.7 1,191.9 33.5 41.5 (10.5) (18.4)
Veterans Housing Benefit Programs – VA………………….. 389.3 339.2 101.5 89.2 8.9 7.9 0.4 1.5
Rural Housing Services - USDA 102.9 90.2 92.6 82.5 4.5 3.8 0.7 0.6
Small Business Loans – SBA…. 99.0 93.1 83.5 79.1 2.0 3.0 (1.3) (0.5)
Export-Import Bank Guarantees 78.1 79.5 78.1 79.5 1.6 1.6 (0.3) (0.3)
Israel Loan Guarantee Program – AID………………………………… 10.5 10.9 10.5 10.9 1.0 1.2 - (0.2)
Federal Family Education Loans – Education………………………… 241.6 264.0 236.5 258.4 - - (4.6) (7.8)
All other guaranteed loan programs………………………... 42.8 47.4 38.3 42.9 1.3 0.2 0.7 0.1
Total loan guarantees………….. 2,254.8 2,207.2 1,826.7 1,834.4 52.8 59.2 (14.9) (25.0)
The Government has two types of loan programs: direct loans and loan guarantees. One major type of loan is direct
loans such as the Department of Education’s (Education) Federal Direct Student Loans. The second type is loan guarantee programs, such as the Department of Housing and Urban Development’s (HUD’s) Federal Housing Administration Loans program.
Direct loans and loan guarantee programs are used to promote the Nation’s welfare by making financing available to segments of the population not served adequately by non-federal institutions, or otherwise providing for certain activities or investments. For those unable to afford credit at the market rate, federal credit programs provide subsidies in the form of direct loans offered at an interest rate lower than the market rate. For those to whom non-federal financial institutions are reluctant to grant credit because of the high risk involved, federal credit programs guarantee the payment of these non-federal loans and absorb the cost of defaults.
The amount of the long-term cost of post-1991 direct loans and loan guarantees outstanding equals the subsidy cost allowance for direct loans and the liability for loan guarantees as of September 30. The amount of the long-term cost of pre-1992 direct loans and loan guarantees equals the allowance for uncollectible amounts (or present value allowance) for direct loans and the liability for loan guarantees. The long-term cost is based on all direct loans and guaranteed loans disbursed in this fiscal year and previous years that are outstanding as of September 30. It includes the subsidy cost of these loans and guarantees estimated as of the time of loan disbursement and subsequent adjustments such as modifications, re-estimates, amortizations, and write-offs.
Net loans receivable includes related interest and foreclosed property. Foreclosed property is property that is transferred from borrowers to a federal credit program, through foreclosure or other means, in partial or full settlement of post-1991 direct loans or as a compensation for losses that the Government sustained under post-1991 loan guarantees. Please refer to the financial statements of the United States Department of Agriculture (USDA), VA, and HUD for significant detailed information regarding foreclosed property.
The total subsidy expense/(income) is the cost of direct loans and loan guarantees recognized during the fiscal year. It consists of the subsidy expense/(income) incurred for direct and guaranteed loans disbursed during the fiscal year, for modifications made during the fiscal year of loans and guarantees outstanding, and for upward or downward re-estimates as

72 NOTES TO THE FINANCIAL STATEMENTS
of the end of the fiscal year of the cost of loans and guarantees outstanding. This expense/(income) is included in the Statements of Net Cost.
Loan Programs The majority of the loan programs are provided by Education, HUD, USDA, Treasury, Small Business Administration
(SBA), VA, Export-Import Bank and United States Agency for International Development (USAID). For significant detailed information regarding the direct and guaranteed loan programs listed in the tables above, please refer to the financial statements of the agencies.
Education has two major loan programs, authorized by Title IV of the Higher Education Act of 1965 (HEA). The first program is the William D. Ford Federal Direct Student Loan Program, (referred to as the Direct Loan Program) that was established in fiscal year 1994. The Direct Loan Program offers four types of educational loans: Stafford, Unsubsidized Stafford, PLUS for parents and/or graduate or professional students, and consolidation loans. With this program, the Government makes loans directly to students and parents through participating institutions of higher education. Direct loans are originated and serviced through contracts with private vendors. Education disbursed approximately $134.0 billion in Direct Loans to eligible borrowers in fiscal year 2014 and approximately $130.0 billion in fiscal year 2013. The second program is the Federal Family Education Loan (FFEL) Program. This program was established in fiscal year 1965, and is a guaranteed loan program. Like the William D. Ford Federal Direct Student Loan Program, it offers four types of loans: Stafford, Unsubsidized Stafford, PLUS for parents and/or graduate or professional students, and consolidation loans. The Student Aid and Fiscal Responsibility Act (SAFRA), which was enacted as part of the Health Care Education and Reconciliation Act of 2010 (Public Law 111-152), eliminated the authority to guarantee new FFEL after June 30, 2010. During fiscal year 2014, Education net loans receivable increased by $99.4 billion, largely the result of increased Direct Loan Program disbursements for new loan originations and FFEL consolidations, net of borrower principal and interest collections.
HUD’s Federal Housing Administration (FHA) provides mortgage insurance to encourage lenders to make credit available to expand home ownership. FHA serves many borrowers that the conventional market does not serve adequately. This includes first-time homebuyers, minorities, low-income, and other underserved households to realize the benefit of home ownership. Borrowers obtain an FHA insured mortgage and pay an upfront premium as well as an annual premium to FHA. The proceeds from those premiums are used to fund FHA program costs, including claims on defaulted mortgages and holding costs, property management fees, property sales, and other associated costs. The possibility of a sizable volume of delinquencies remains a significant risk for the housing market and for FHA in the near term. The number of FHA mortgages has risen dramatically. FHA has taken a number of steps to help improve its financial health and reduce its market share, including fee increases and underwriting changes.
In 2009, Congress passed the Supplemental Appropriations Act of 2009 which authorized an increase in the U.S. quota in the IMF, as well as an increase in U.S. participation in the New Arrangements to Borrow, one of the IMF’s supplemental borrowing arrangements. The legislation applied FCRA to both program increases and, thus, the program increases are treated as direct loans to the IMF.
USDA offers direct and guaranteed loans through credit programs in the Farm and Foreign Agricultural Services (FFAS) mission area through the Farm Service Agency (FSA), and the Commodity Credit Corporation (CCC), and in the Rural Development (RD) mission area. The FFAS delivers commodity, credit, conservation, disaster, and emergency assistance programs that help strengthen and stabilize the agricultural economy. The FSA offers direct and guaranteed loans to farmers who are temporarily unable to obtain private, commercial credit. Through this supervised credit offered by FSA, the goal is to graduate its borrowers to commercial credit. The CCC offers both credit guarantee and direct credit programs for buyers of U.S. exports, suppliers, and sovereign countries in need of food assistance. The RD provides affordable housing and essential community facilities to rural communities through its rural housing loan and grant programs. The Rural Utilities Program helps to improve the quality of life in rural America through a variety of loan programs for electric energy, telecommunications, and water and environmental projects.
The Export-Import Bank aids in financing and promoting U.S. exports. The average repayment term for these loans is approximately seven years.
The SBA’s Disaster Assistance Loan Program makes direct loans to disaster victims primarily for homes and personal property.
VA operates the following direct loan and loan guaranty programs: Vocational Rehabilitation and Employment, Home Loans, and Insurance. The VA Home Loans program is the largest of the VA loan programs. The Home Loan program provides loan guarantees and direct loans to veterans, service members, qualifying dependents, and limited non-veterans to purchase homes and retain homeownership with favorable market terms. During fiscal year 2014, the VA principal amount of loans under guarantee increased by $50.1 billion. This increase was primarily due to new loans under guarantee with a principal totaling $86.8 billion, partially offset by guaranteed loan terminations with a principal amount of $36.7 billion.

NOTES TO THE FINANCIAL STATEMENTS 73
USAID’s Israel Loan Guarantee Program guarantees the repayment of loans made from commercial sources that cover the costs for immigrants resettling to Israel from the former Soviet Union, Ethiopia, and other countries. As of fiscal year 2014, $6.8 billion in loan guarantees remains outstanding. The program also guarantees the repayment of loans that support Israel’s comprehensive economic plan to overcome economic difficulties and create conditions for higher and sustainable growth, of which $3.7 billion in loan guarantees remains outstanding as of September 30, 2014.

74 NOTES TO THE FINANCIAL STATEMENTS
Note 5. Troubled Asset Relief Program (TARP) — Direct Loans and Equity Investments, Net
The TARP was authorized by the Emergency Economic Stabilization Act of 2008 (EESA). This Act gave the Secretary of the Treasury broad flexible authority to establish the TARP to purchase and guarantee mortgages, mortgage related securities, and other troubled assets from financial institutions. This permitted the Secretary of the Treasury to inject capital into, and receive equity interests in, banks and other financial institutions. Treasury established several programs under the TARP designed to help stabilize the financial system, restore the flow of credit to consumers and businesses, and help prevent avoidable foreclosures. Under the TARP programs, Treasury made direct loans, equity investments, and entered into other credit programs. This authority to make new commitments to purchase or guarantee troubled assets expired in October 2010. Since then, the Department of Treasury has focused its efforts on winding down the various TARP programs through recoveries of investments in the form of repayments, sales, dividends, interest, and other income. The Treasury also continues to implement the housing programs under TARP to help struggling homeowners avoid foreclosure.
The following table lists the TARP programs and types:
Program Program Type Automotive Industry Financing Program Equity Investment and Direct Loan Capital Purchase Program Equity Investments/Subordinated Debentures Other Investment Programs Equity Investments/Subordinated Debentures/ Direct Loans Housing Programs under TARP* Expenditure and Loss Sharing
*Housing Programs under TARP are not designed to recoup money spent on loan modifications or payments on the loss sharing agreement. As such, these programs do not include direct loans and equity investments as well as the related amounts are not included in this line item.
NOTES TO THE FINANCIAL STATEMENTS 75
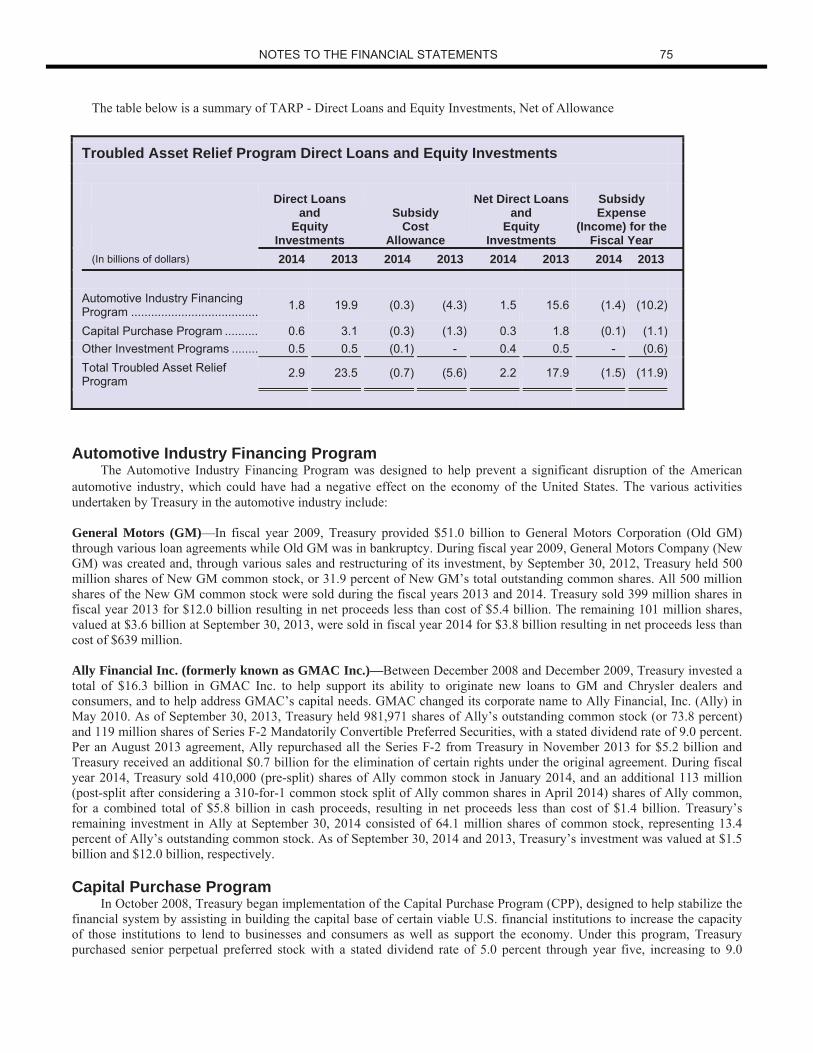
The table below is a summary of TARP - Direct Loans and Equity Investments, Net of Allowance
Troubled Asset Relief Program Direct Loans and Equity Investments
Direct Loans
and Equity
Investments
Subsidy Cost
Allowance
Net Direct Loansand
Equity Investments
Subsidy Expense
(Income) for the Fiscal Year
(In billions of dollars) 2014 2013 2014 2013 2014 2013 2014 2013
Automotive Industry Financing Program ...................................... 1.8 19.9 (0.3) (4.3) 1.5 15.6 (1.4) (10.2)
Capital Purchase Program .......... 0.6 3.1 (0.3) (1.3) 0.3 1.8 (0.1) (1.1) Other Investment Programs ........ 0.5 0.5 (0.1) - 0.4 0.5 - (0.6)
Total Troubled Asset Relief Program 2.9 23.5 (0.7) (5.6) 2.2 17.9 (1.5) (11.9)
Automotive Industry Financing Program The Automotive Industry Financing Program was designed to help prevent a significant disruption of the American
automotive industry, which could have had a negative effect on the economy of the United States. The various activities undertaken by Treasury in the automotive industry include:
General Motors (GM)—In fiscal year 2009, Treasury provided $51.0 billion to General Motors Corporation (Old GM) through various loan agreements while Old GM was in bankruptcy. During fiscal year 2009, General Motors Company (New GM) was created and, through various sales and restructuring of its investment, by September 30, 2012, Treasury held 500 million shares of New GM common stock, or 31.9 percent of New GM’s total outstanding common shares. All 500 million shares of the New GM common stock were sold during the fiscal years 2013 and 2014. Treasury sold 399 million shares in fiscal year 2013 for $12.0 billion resulting in net proceeds less than cost of $5.4 billion. The remaining 101 million shares, valued at $3.6 billion at September 30, 2013, were sold in fiscal year 2014 for $3.8 billion resulting in net proceeds less than cost of $639 million.
Ally Financial Inc. (formerly known as GMAC Inc.)—Between December 2008 and December 2009, Treasury invested a total of $16.3 billion in GMAC Inc. to help support its ability to originate new loans to GM and Chrysler dealers and consumers, and to help address GMAC’s capital needs. GMAC changed its corporate name to Ally Financial, Inc. (Ally) in May 2010. As of September 30, 2013, Treasury held 981,971 shares of Ally’s outstanding common stock (or 73.8 percent) and 119 million shares of Series F-2 Mandatorily Convertible Preferred Securities, with a stated dividend rate of 9.0 percent. Per an August 2013 agreement, Ally repurchased all the Series F-2 from Treasury in November 2013 for $5.2 billion and Treasury received an additional $0.7 billion for the elimination of certain rights under the original agreement. During fiscal year 2014, Treasury sold 410,000 (pre-split) shares of Ally common stock in January 2014, and an additional 113 million (post-split after considering a 310-for-1 common stock split of Ally common shares in April 2014) shares of Ally common, for a combined total of $5.8 billion in cash proceeds, resulting in net proceeds less than cost of $1.4 billion. Treasury’s remaining investment in Ally at September 30, 2014 consisted of 64.1 million shares of common stock, representing 13.4 percent of Ally’s outstanding common stock. As of September 30, 2014 and 2013, Treasury’s investment was valued at $1.5 billion and $12.0 billion, respectively.
Capital Purchase Program In October 2008, Treasury began implementation of the Capital Purchase Program (CPP), designed to help stabilize the
financial system by assisting in building the capital base of certain viable U.S. financial institutions to increase the capacity of those institutions to lend to businesses and consumers as well as support the economy. Under this program, Treasury purchased senior perpetual preferred stock with a stated dividend rate of 5.0 percent through year five, increasing to 9.0

76 NOTES TO THE FINANCIAL STATEMENTS
percent in subsequent years, from qualifying U.S. controlled banks, savings associations, plus certain bank and savings and loan holding companies (Qualified Financial Institution or QFI). The dividends are cumulative for bank holding companies as well as subsidiaries of bank holding companies and non-cumulative for others. These are payable when and if declared by the institution’s board of directors. In addition to the senior preferred stock, Treasury received warrants, with a ten-year term, from public QFIs to purchase shares of common stock. Treasury invested a total of $204.9 billion under the CPP program. For fiscal years 2014 and 2013, repayments and sales totaled $1.5 billion and $4.8 billion, respectively. As of September 30, 2014, and 2013, Treasury’s investment was valued at $0.3 billion and $1.8 billion, respectively.
Other Investment Programs Treasury implemented the Community Development Capital Initiative (CDCI) program under TARP to help unlock the
flow of credit to consumers and small businesses. The CDCI provided additional low-cost capital to Community Development Financial Institutions (CDFI) to encourage more lending to small businesses. Under the terms of the initiatives, Treasury purchased senior preferred stock (or subordinated debt) from eligible CDFI financial institutions with an initial dividend rate of 2.0 percent, increasing up to a maximum rate of 9.0 percent after eight years. Treasury invested a total of $0.6 billion in 84 institutions under the CDCI. This program is included in the “All other” row of the table within this note.
Housing Programs under TARP Housing programs under TARP are not designed to recoup money spent on loan modifications or payments on the loss
sharing agreement. As such, these programs do not include direct loans and equity investments as well as the related amounts are not included in this line item.
Housing programs under TARP are designed to help prevent avoidable foreclosures. These programs provide incentives for mortgage modifications and other types of assistance in order to enable homeowners who are experiencing financial hardships to remain in their homes until their financial position improves or they relocate to more sustainable living situations.
As of September 30, 2014, and 2013, Treasury had committed up to $38.5 billion for these programs. Payments made under the housing programs under TARP for fiscal years 2014 and 2013, amounted to $4.3 billion and $3.9 billion, respectively. As of September 30, 2014, Treasury had $24.4 billion in total commitments outstanding for future payments under the housing programs.
For more details on the TARP, please see the Treasury’s Annual Financial Report.

NOTES TO THE FINANCIAL STATEMENTS 77
Note 6. Inventories and Related Property, Net
Inventories and Related Property, Net as of September 30, 2014, and 2013
Defense
All
Others Total Defense
All
Others Total (In billions of dollars) 2014 2013
Inventory purchased for resale ................................. 63.2 0.4 63.6 57.1 0.5 57.6
Inventory and operating material and supplies
held for repair ........................................................ 60.8 1.4 62.2 59.6 1.5 61.1
Inventory—excess, obsolete, and unserviceable ..... 0.5 - 0.5 7.0 - 7.0
Operating materials and supplies held for use ......... 138.5 3.5 142.0 142.8 3.5 146.3
Operating materials and supplies held in
reserve for future use ............................................ - 0.2 0.2 - 0.2 0.2
Operating materials and supplies—excess,
obsolete, and unserviceable .................................. 2.4 - 2.4 2.1 - 2.1
Stockpile materials ................................................... 0.3 50.8 51.1 0.1 50.9 51.0
Stockpile materials held for sale .............................. 0.2 0.1 0.3 0.4 0.1 0.5
Other related property .............................................. 1.5 1.1 2.6 1.5 1.0 2.5
Allowance for loss .................................................... (5.9) (0.6) (6.5) (16.6) (0.6) (17.2)
Total inventories and related property, net ............ 261.5 56.9 318.4 254.0 57.1 311.1
Inventory purchased for resale is the cost or value of tangible personal property purchased by an agency for resale. As
of September 30, 2014, DOD values approximately 87 percent of its resale inventory using the moving average cost (MAC) method. An additional 11 percent (fuel inventory) is reported using the first-in-first-out method. DOD reports the remaining 2 percent of resale inventories at an approximation of historical cost using LAC adjusted for holding gains and losses. The LAC method is used because DOD’s legacy inventory systems do not maintain historical cost data. DOD developed a methodology to determine the net realizable value of inventory-excess, obsolete, and unserviceable that resulted in a major decrease in the amount reported for fiscal year 2014. Please refer to the individual financial statements of DOD for significant detailed information regarding its inventories.
Inventory and operating materials and supplies held for repair are damaged inventory that require repair to make them suitable for sale (inventory) or is more economical to repair than to dispose of (operating materials and supplies). Excess, obsolete, and unserviceable inventory is reported at net realizable value. Inventory—excess, obsolete, and unserviceable consists of:
Excess inventory that exceeds the demand expected in the normal course of operations and which does not meet management’s criteria to be held in reserve for future sale.
Obsolete inventory that is no longer needed due to changes in technology, laws, customs, or operations. Unserviceable inventory that is damaged beyond economic repair. Operating materials and supplies held for use are tangible personal property to be consumed in normal operations.
Operating materials and supplies held in reserve for future use are materials retained because they are not readily available in the market or because they will not be used in the normal course of operations, but there is more than a remote chance they

78 NOTES TO THE FINANCIAL STATEMENTS
will eventually be needed. DOD, which accounts for most of the reported operating materials and supplies held for use, uses LAC, MAC, and Standard Price and expenses a significant amount when purchased instead of when consumed.
Operating materials and supplies—excess, obsolete, and unserviceable consists of: Excess operating materials and supplies are materials that exceed the demand expected in the normal course of
operations, and do not meet management’s criteria to be held in reserve for future use. Obsolete operating materials and supplies are materials no longer needed due to changes in technology, laws, customs, or
operations. Unserviceable operating materials and supplies are materials damaged beyond economic repair.
DOD, which accounts for most of the reported excess, obsolete, and unserviceable operating materials and supplies, revalues it to a net realizable value of zero through the allowance account. Please refer to the individual financial statements of DOD for significant detailed information regarding operating materials and supplies. Stockpile materials include strategic and critical materials held in reserve for use in national defense, conservation, or national emergencies due to statutory requirements; for example, nuclear materials and oil, as well as stockpile materials that are authorized to be sold. The majority of the amount reported by DOD is stockpile materials held for sale. The amount reported by others is stockpile materials held in reserve, with the majority of it being reported by the Department of Energy (DOE). Please refer to their financial statements for more information on stockpile materials.
Other related property consists of the following: Commodities include items of commerce or trade that have an exchange value used to stabilize or support market
prices. Please refer to the financial statements of the USDA for detailed information regarding commodities. Seized monetary instruments are comprised only of monetary instruments that are awaiting judgment to determine
ownership. The related liability is included in other liabilities. Other property seized by the Government, such as real property and tangible personal property, is not considered a Government asset. It is accounted for in agency property-management records until the property is forfeited, returned, or otherwise liquidated. Please refer to the financial statements of the Department of Justice (DOJ), Treasury, and the Department of Homeland Security (DHS) for detailed information regarding seized property.
Forfeited property is comprised of monetary instruments, intangible property, real property, and tangible personal property acquired through forfeiture proceedings; property acquired by the Government to satisfy a tax liability; and/or unclaimed/abandoned merchandise. Please refer to the financial statements of DOJ, Treasury, and DHS for detailed information regarding forfeited property.
Foreclosed property is comprised of assets received in satisfaction of a loan receivable or as a result of payment of a claim under a guaranteed or insured loan (excluding commodities acquired under price support programs). All properties included in foreclosed property are assumed to be held for sale. Please refer to the financial statements of USDA and HUD for detailed information regarding foreclosed property.

NOTES TO THE FINANCIAL STATEMENTS 79
Note 7. Property, Plant, and Equipment, Net
Property, Plant, and Equipment as of September 30, 2014
Accumulated Depreciation/ Cost Amortization Net
(In billions of dollars) Defense
AllOthers Defense
AllOthers Defense
AllOthers
Buildings, structures, and facilities ............................. 271.7 259.2 130.7 137.3 141.0 121.9
Furniture, fixtures, and equipment ............................. 992.0 166.2 571.6 105.4 420.4 60.8
Construction in progress ............................................ 42.1 41.3 N/A N/A 42.1 41.3
Land ........................................................................... 10.8 12.6 N/A N/A 10.8 12.6
Internal use software .................................................. 11.8 28.5 8.4 16.4 3.4 12.1
Assets under capital lease ......................................... 0.6 3.3 0.5 1.7 0.1 1.6
Leasehold improvements ........................................... 0.5 9.4 0.2 5.0 0.3 4.4
Other property, plant, and equipment ........................ 0.8 9.5 - 4.8 0.8 4.7
Subtotal ................................................................... 1,330.3 530.0 711.4 270.6 618.9 259.4
Total property, plant, and equipment, net ............. 1,860.3 982.0 878.3
Property, Plant, and Equipment as of September 30, 2013
Accumulated Depreciation/ Cost Amortization Net
(In billions of dollars) Defense
AllOthers Defense
AllOthers Defense
AllOthers
Buildings, structures, and facilities ............................. 269.8 249.7 127.9 130.0 141.9 119.7
Furniture, fixtures, and equipment ............................. 983.6 165.1 547.5 102.5 436.1 62.6
Construction in progress ............................................ 46.6 41.6 N/A N/A 46.6 41.6
Land ........................................................................... 10.8 12.5 N/A N/A 10.8 12.5
Internal use software .................................................. 11.0 25.0 8.0 14.2 3.0 10.8
Assets under capital lease ......................................... 0.6 3.3 0.4 1.7 0.2 1.6
Leasehold improvements ........................................... 0.4 8.6 0.2 4.5 0.2 4.1
Other property, plant, and equipment ........................ 1.0 7.6 - 3.6 1.0 4.0
Subtotal ................................................................... 1,323.8 513.4 684.0 256.5 639.8 256.9
Total property, plant, and equipment, net ............. 1,837.2 940.5 896.7

80 NOTES TO THE FINANCIAL STATEMENTS
See Note 25—Stewardship Land and Heritage Assets for additional information on multi-use heritage assets. DOD comprises approximately 70.5 percent of the Government’s reported property, plant, and equipment, net, as of
September 30, 2014. Refer to the financial statements of DOD, DOE, the Tennessee Valley Authority (TVA), GSA, VA, the Department of Interior (DOI), DHS, and the Department of State, for detailed information on the useful lives and related capitalization thresholds for property, plant, and equipment. These agencies comprise 90.4 percent of the Government’s total cost of property, plant, and equipment net of $878.3 billion as of September 30, 2014.

NOTES TO THE FINANCIAL STATEMENTS 81
Note 8. Debt and Equity Securities
Debt and Equity Securities as of September 30, 2014
By Category Held-To-Maturity Available-for-Sale Trading Securities Unamor- Unreal- Unreal- tized Net ized ized Cost Premium/ Invest- Cost Gain Fair Cost Gain Fair (In billions of dollars) Basis Discount ment Basis (Loss) Value Basis (Loss) Value Total Debt Securities: Non-U.S. Government ........... 0.2 - 0.2 19.0 (1.1) 17.9 11.4 (0.1) 11.3 29.4 Commercial ........................... - - - - - - - - - - Mortgage/asset backed ......... 0.3 - 0.3 - - - 3.0 - 3.0 3.3 Corporate and other bonds ... - - - - - - 10.6 0.6 11.2 11.2 All other debt securities ......... - - - - - - 2.6 (0.1) 2.5 2.5 Equity Securities: Common stocks ..................... - - - - - - 2.0 0.6 2.6 2.6 Unit trust ................................ - - - - - - 15.3 5.7 21.0 21.0 All other equity securities ...... 0.1 - 0.1 - - - 2.3 (0.2) 2.1 2.2 Other ...................................... 3.6 - 3.6 - - - 14.2 0.2 14.4 18.0 Total debt and equity securities categorized as held-to-maturity, available-for-sale or trading ............................ 4.2 - 4.2 19.0 (1.1) 17.9 61.4 6.7 68.1 90.2 Total RRB debt and equity securities .............. 25.2 Total debt and equity securities ......................... 115.4

82 NOTES TO THE FINANCIAL STATEMENTS
Debt and Equity Securities as of September 30, 2013
By Category Held-To-Maturity Available-for-Sale Trading Securities Unamor- Unreal- Unreal- tized Net ized ized Cost Premium/ Invest- Cost Gain Fair Cost Gain Fair (In billions of dollars) Basis Discount ment Basis (Loss) Value Basis (Loss) Value Total Debt securities: Non-U.S. Government .......... 0.2 - 0.2 14.2 (0.1) 14.1 10.1 (0.1) 10.0 24.3 Commercial .......................... - - - - - - 0.1 - 0.1 0.1 Mortgage/asset backed ........ - - - - - - 3.0 0.1 3.1 3.1 Corporate and other bonds .. - - - - - - 10.0 0.4 10.4 10.4 All other debt securities ........ - - - - - - 2.0 (0.1) 1.9 1.9 Equity securities: Common stocks .................... - - - - - - 2.2 0.6 2.8 2.8 Unit trust ............................... - - - - - - 12.0 7.1 19.1 19.1 All other equity securities ..... 0.1 - 0.1 - - - 2.8 0.1 2.9 3.0 Other ..................................... 3.7 - 3.7 - - - 15.1 - 15.1 18.8 Total debt and equity securities categorized as held-to-maturity, available-for-sale or trading ............................ 4.0 - 4.0 14.2 (0.1) 14.1 57.3 8.1 65.4 83.5 Total RRB debt and equity securities .............. 24.3 Total debt and equity securities ......................... 107.8
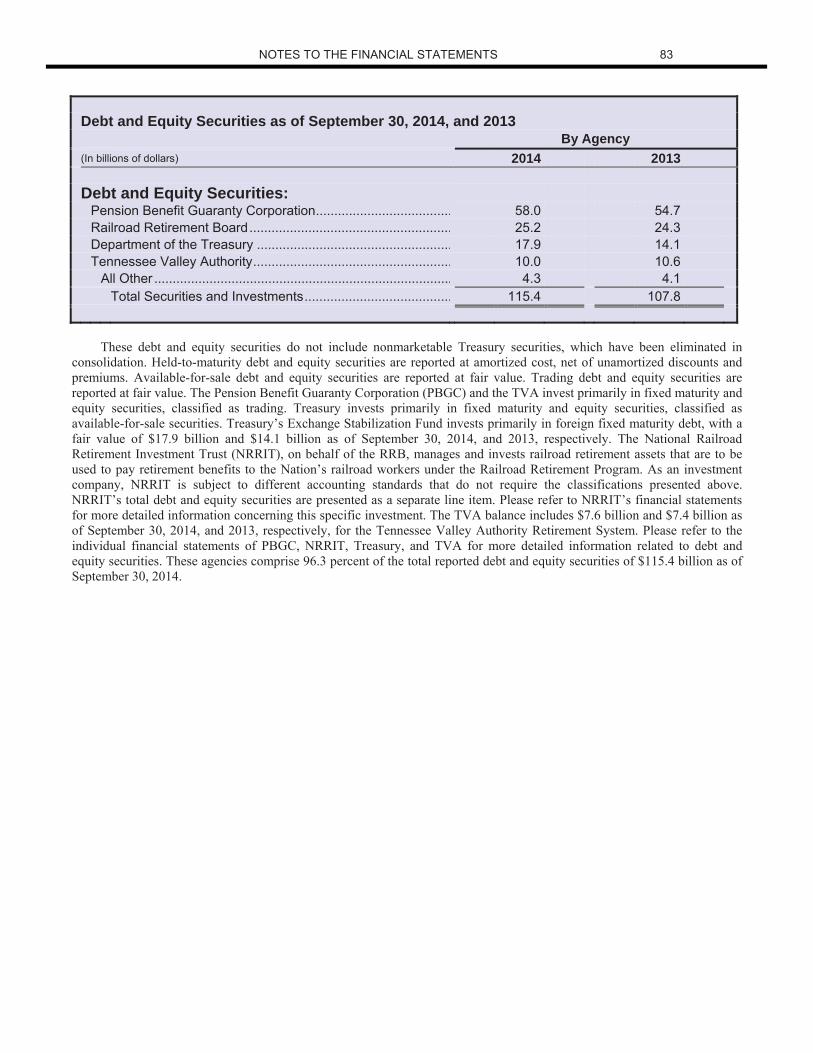
NOTES TO THE FINANCIAL STATEMENTS 83
Debt and Equity Securities as of September 30, 2014, and 2013
By Agency (In billions of dollars) 2014 2013 Debt and Equity Securities: Pension Benefit Guaranty Corporation ..................................... 58.0 54.7 Railroad Retirement Board ....................................................... 25.2 24.3 Department of the Treasury ..................................................... 17.9 14.1 Tennessee Valley Authority ...................................................... 10.0 10.6 All Other ................................................................................. 4.3 4.1 Total Securities and Investments ........................................ 115.4 107.8
These debt and equity securities do not include nonmarketable Treasury securities, which have been eliminated in consolidation. Held-to-maturity debt and equity securities are reported at amortized cost, net of unamortized discounts and premiums. Available-for-sale debt and equity securities are reported at fair value. Trading debt and equity securities are reported at fair value. The Pension Benefit Guaranty Corporation (PBGC) and the TVA invest primarily in fixed maturity and equity securities, classified as trading. Treasury invests primarily in fixed maturity and equity securities, classified as available-for-sale securities. Treasury’s Exchange Stabilization Fund invests primarily in foreign fixed maturity debt, with a fair value of $17.9 billion and $14.1 billion as of September 30, 2014, and 2013, respectively. The National Railroad Retirement Investment Trust (NRRIT), on behalf of the RRB, manages and invests railroad retirement assets that are to be used to pay retirement benefits to the Nation’s railroad workers under the Railroad Retirement Program. As an investment company, NRRIT is subject to different accounting standards that do not require the classifications presented above. NRRIT’s total debt and equity securities are presented as a separate line item. Please refer to NRRIT’s financial statements for more detailed information concerning this specific investment. The TVA balance includes $7.6 billion and $7.4 billion as of September 30, 2014, and 2013, respectively, for the Tennessee Valley Authority Retirement System. Please refer to the individual financial statements of PBGC, NRRIT, Treasury, and TVA for more detailed information related to debt and equity securities. These agencies comprise 96.3 percent of the total reported debt and equity securities of $115.4 billion as of September 30, 2014.

84 NOTES TO THE FINANCIAL STATEMENTS
Note 9. Investments in Government-Sponsored Enterprises
Congress established Fannie Mae and Freddie Mac as GSEs to support the supply of mortgage loans. A key function of the GSEs is to package purchased mortgages into securities, which are subsequently sold to investors, and guarantee the timely payment of principal and interest on these securities.
Leading up to the financial crisis, increasingly difficult conditions in the housing market challenged the soundness and profitability of the GSEs, thereby undermining the entire housing market. This led Congress to pass the HERA. This Act created the FHFA, with enhanced regulatory authority over the GSEs, and provided the Secretary of the Treasury with certain authorities intended to ensure the financial stability of the GSEs, if necessary. In September 2008, FHFA placed the GSEs under conservatorship and Treasury entered into a SPSPA with each GSE. These actions were taken to preserve the GSEs’ assets, ensure a sound and solvent financial condition, and mitigate systemic risks that contributed to market instability. The SPSPAs were amended in August 2012 (the amended SPSPAs) and changed, among other things, the basis for determining quarterly dividends that are paid by the GSEs to the U.S. Government. The dividend change in the amended SPSPAs became operationally effective commencing with the quarter ending March 31, 2013.
The actions taken by Treasury, as authorized by section 1117 of HERA, thus far are temporary and are intended to provide financial stability. The purpose of Treasury’s actions is to maintain the solvency of the GSEs so they can continue to fulfill their vital roles in the home mortgage market while the Administration and Congress determine what structural changes should be made. Draws under the SPSPAs are designed to enable the GSEs to maintain a positive net worth. The SPSPAs were structured to ensure any draws result in an increased investment as further discussed below. Per SFFAC No. 2, Entity and Display, these entities meet the criteria of “bailed out” entities. Accordingly, the government has not consolidated them into the financial statements, but included disclosure of the relationship(s) with the bailed out entities and any actual or potential material costs or liabilities in the consolidated financial statements.
Senior Preferred Stock Purchase Agreements Under the SPSPAs, Treasury initially received from each GSE: 1) 1,000,000 shares of non-voting variable liquidation
preference senior preferred stock with a liquidation preference value of $1,000 per share; and 2) a non-transferable warrant for the purchase, at a nominal cost, of 79.9 percent of common stock on a fully-diluted basis. The warrants expire on September 7, 2028. Under the amended SPSPAs, the quarterly dividend payment changed from a 10.0 percent per annum fixed rate dividend to an amount equivalent to the GSE’s positive net worth above a capital reserve amount. The capital reserve amount was initially set at $3.0 billion for calendar year 2013, declined to $2.4 billion on January 1, 2014, and will continue to decline by $600 million at the beginning of each calendar year thereafter until it reaches zero by calendar year 2018. The GSEs will not pay a quarterly dividend if their positive net worth is below the required capital reserve threshold.
Cash dividends of $72.5 billion and $95.7 billion were received during fiscal years ended September 30, 2014, and 2013, respectively. Dividends received in fiscal years 2014 and 2013 were primarily attributable to a federal income tax benefit that was recognized in the earnings of one GSE in fiscal year 2014 and the earnings of the other GSE in fiscal year 2013.
The SPSPAs, which have no expiration date, provide that Treasury will disburse funds to the GSEs if at the end of any quarter, the FHFA determines that the liabilities of either GSE exceed its assets. The maximum amount available to each GSE under this agreement was previously based on a formulaic cap which ended December 31, 2012, at which time, the maximum amount became fixed. Draws against the funding commitment of the SPSPAs do not result in the issuance of additional shares of senior preferred stock; instead the liquidation preference of the initial 1,000,000 shares is increased by the amount of the draw. There were no payments to the GSEs for the fiscal years ended September 30, 2014 and 2013.
Senior Preferred Stock and Warrants for Common Stock
In determining the fair value of the senior preferred stock and warrants for common stock, Treasury relied on the GSEs’ public filings and press releases concerning their financial statements, as well as non-public, long-term financial forecasts, monthly summaries, quarterly credit supplements, independent research regarding preferred stock trading, independent research regarding the GSEs’ common stock trading on the OTC Bulletin Board, discussions with each of the GSEs and FHFA, and other information pertinent to the fair valuations. Because of the nature of the senior preferred stock and warrants, which are not publicly traded and for which there is no comparable trading information available, the fair valuations rely on significant unobservable inputs that reflect assumptions about the expectations that market participants would use in pricing.
The fair value of the senior preferred stock considers the amount of forecasted dividend payments. The fair valuations assume that a hypothetical buyer would acquire the discounted dividend stream as of the transaction date. The fair value of

NOTES TO THE FINANCIAL STATEMENTS 85
the senior preferred stock decreased at September 30, 2014 when compared to 2013 primarily due to lower forecasted dividends as a result of lower forecasted GSE earnings to be derived from guarantee fees, coupled with one-time benefits recognized in the GSEs’ historical earnings that contributed to the higher fair value of these investments at the end of 2013 but which did not recur at the end of 2014.
The fair value of the warrants is impacted by the nominal exercise price and the large number of potential exercise shares, the market trading of the common stock that underlies the warrants as of September 30, the principal market, and the market participants. Other factors impacting the fair value include, among other things, the holding period risk related directly to the assumption of the amount of time that it will take to sell the exercised shares without depressing the market. The fair value of the warrants increased at the end of fiscal year 2014 when compared to 2013 primarily due to increases in the market price of the underlying common stock of each GSE.
Contingent Liability to GSEs As part of the annual process undertaken by Treasury, a series of long-term financial forecasts are prepared to assess as
of September 30, the likelihood and magnitude of future draws under the SPSPAs. Treasury used financial forecasts prepared through 2039 and 2038 in assessing if a contingent liability was required as of September 30, 2014 and 2013, respectively. If future payments under the SPSPAs are deemed to be probable within the forecast time horizon, Treasury will estimate and accrue a contingent liability to the GSEs to reflect the forecasted equity deficits of the GSEs.
Based on the annual assessment, Treasury estimated no probable future funding draws as of September 30, 2014 and 2013, and thereby accrued no contingent liability. During fiscal year 2013, the accrued contingent liability decreased by $9.0 billion. Such recorded accruals will be adjusted as new information develops or circumstances change.
Treasury forecasts of potential future draws by the GSEs may differ from actual experience. Potential future actual draw amounts will depend on numerous factors that are difficult to predict including, but not limited to, changes in government policy with respect to the GSEs, the business cycle, inflation, home prices, unemployment rates, interest rates, changes in housing preferences, home financing alternatives, availability of debt financing, market rates of guarantee fees, outcomes of loan refinancings and modifications, new housing programs, and other applicable factors. As of September 30, 2014 and 2013, the maximum remaining contractual commitment to the GSEs for the remaining life of the SPSPAs was $258.1 billion, which was established at a fixed amount as of December 31, 2012.
Regulatory Environment A provision within the Dodd Frank Act required the Secretary of the Treasury to conduct a study and develop
recommendations regarding the options for ending the conservatorship of the two GSEs. In 2011, the President delivered to Congress a report from the Secretary of the Treasury that provided recommendations regarding the options for ending the conservatorship and plans to wind down the GSEs. To date, Congress has not approved a plan to address the future of the GSEs, and thus the GSEs continue to operate under the direction of their conservator, the FHFA, whose stated strategic goals for the GSEs are to: (1) maintain foreclosure prevention activities and credit availability; (2) reduce taxpayer risk through increasing the role of private capital in the mortgage market; and (3) build a new single-family securitization infrastructure.
The Temporary Payroll Tax Cut Continuation Act of 2011 (TPTCCA) was funded by an increase of 10-basis points in the GSEs’ guarantee fees which began in April 2012, and is effective through October 1, 2021. The increased fees are to be remitted to Treasury and not retained by the GSEs.
Accordingly, the increased fees do not affect the profitability of the GSEs. For fiscal years 2014 and 2013, the GSEs remitted to the Treasury the increased fees totaling $1.9 billion and $946 million, respectively.

86 NOTES TO THE FINANCIAL STATEMENTS
As of September 30, 2014, and 2013, GSEs investments consisted of the following: Investments in GSEs as of September 30, 2014
Gross Cumulative 9/30/14 Investments Valuation Fair (In billions of dollars) as of 9/30/14 Gain/(Loss) Value Fannie Mae Senior Preferred Stock ................................... 117.0 (64.3) 52.7 Freddie Mac Senior Preferred Stock .................................. 72.1 (40.7) 31.4 Fannie Mae Warrants Common Stock ................................ 3.1 4.6 7.7 Freddie Mac Warrants Common Stock ............................... 2.3 1.7 4.0 Total Investments in GSEs ............................................... 194.5 (98.7) 95.8
Investments in GSEs as of September 30, 2013
Gross Cumulative 9/30/13 Investments Valuation Fair (In billions of dollars) as of 9/30/13 Gain/(Loss) Value Fannie Mae Senior Preferred Stock ................................... 117.0 (40.4) 76.6 Freddie Mac Senior Preferred Stock .................................. 72.1 (16.3) 55.8 Fannie Mae Warrants Common Stock ................................ 3.1 2.0 5.1 Freddie Mac Warrants Common Stock ............................... 2.3 0.4 2.7 Total Investments in GSEs ............................................... 194.5 (54.3) 140.2

NOTES TO THE FINANCIAL STATEMENTS 87
Note 10. Other Assets
Other Assets as of September 30, 2014, and 2013
(In billions of dollars) 2014 2013
Advances and prepayments ......................................................................... 106.6 106.0 FDIC receivable from resolution activity ...................................................... 15.2 17.0 Regulatory assets ........................................................................................ 21.1 21.6 Other ............................................................................................................ 19.9 18.2 Total Other Assets .................................................................................. 162.8 162.8
Advances and prepayments are assets that represent funds disbursed in contemplation of the future performance of services, receipt of goods, the incurrence of expenditures, or the receipt of other assets. These include advances to contractors and grantees, travel advances, and prepayments for items such as rents, taxes, insurance, royalties, commissions, and supplies.
The Federal Deposit Insurance Corporation (FDIC) has the responsibility for resolving failed institutions in an orderly and efficient manner. The resolution process involves valuing a failing institution, marketing it, soliciting and accepting bids for the sale of the institution, determining which bid is least costly to the insurance fund, and working with the acquiring institution through the closing process. FDIC records receivables for resolutions that include payments by the Deposit Insurance Fund to cover obligations to insured depositors, advances to receiverships and conservatorships for working capital, and administrative expenses paid on behalf of receiverships and conservatorships.
With regard to regulatory assets, the DOE’s Power Marketing Authorities (PMAs) and the TVA record certain amounts as assets in accordance with Financial Accounting Standards Board (FASB) Accounting Standards Codification (ASC) Topic 980, Regulated Operations. The provisions of FASB ASC Topic 980 require that regulated enterprises reflect rate actions of the regulator in their financial statements, when appropriate. These rate actions can provide reasonable assurance of the existence of an asset, reduce or eliminate the value of an asset, or impose a liability on a regulated enterprise. In order to defer incurred costs under FASB ASC Topic 980, a regulated entity must have the statutory authority to establish rates that recover all costs, and those rates must be charged to and collected from customers. If the PMAs’ or TVA’s rates should become market-based, FASB ASC Topic 980 would no longer be applicable, and all of the deferred costs under that standard would be expensed. Other items included in “other” are purchased power generating capacity, deferred nuclear generating units, nonmarketable equity investments in international financial institutions, derivatives assets, and the balance of assets held by the experience rated carriers participating in the Health Benefits and Life Insurance Program (pending disposition on behalf of OPM).
Payable

88 NOTES TO THE FINANCIAL STATEMENTS
Note 11. Accounts Payable
Accounts Payable as of September 30, 2014, and 2013
(In billions of dollars) 2014 2013
Department of Defense .................................................................................................. 17.9 20.2 Department of Veterans Affairs ...................................................................................... 11.7 10.8 Department of the Treasury ........................................................................................... 6.4 3.9 Department of Justice .................................................................................................... 5.9 4.2 Department of Education ............................................................................................... 4.0 4.1 Department of State ....................................................................................................... 2.7 2.8 Department of Agriculture .............................................................................................. 2.3 2.1 Department of Homeland Security ................................................................................. 2.3 2.1 General Services Administration .................................................................................... 2.1 2.1 U.S. Postal Service ........................................................................................................ 1.9 1.8 Agency for International Development ........................................................................... 1.7 1.6 Department of Energy .................................................................................................... 1.5 1.5 National Aeronautics and Space Administration ............................................................ 1.5 1.3 Tennessee Valley Authority ........................................................................................... 1.4 1.9 Department of the Interior .............................................................................................. 0.9 1.0 All other .......................................................................................................................... 4.8 4.8 Total accounts payable ............................................................................................. 69.0 66.2
Accounts payable includes amounts due for goods and property ordered and received, services rendered by other than federal employees, accounts payable for cancelled appropriations, and non-debt related interest payable.

NOTES TO THE FINANCIAL STATEMENTS 89
Note 12. Federal Debt Securities Held by the Public and Accrued Interest
Federal Debt Securities Held by the Public and Accrued Interest Net Change During Balance Fiscal Balance Average Interest September 30, Year September 30, Rate (In billions of dollars) 2013 2014 2014 2014 2013
Treasury securities (public): Marketable securities: Treasury bills ............................... 1,527.9 (118.3) 1,409.6 0.1% 0.1% Treasury notes ........................... 7,750.3 409.9 8,160.2 1.8% 1.8% Treasury bonds .......................... 1,363.1 171.0 1,534.1 4.9% 5.1% Treasury inflation-protected securities (TIPS) ...................... 936.1 108.6 1,044.7 0.9% 1.1%
Treasury floating rate notes (FRN) .......................................... - 123.0 123.0 0.1% -
Total marketable Treasury securities .................................... 11,577.4 694.2 12,271.6 Nonmarketable securities .............. 398.9 114.5 513.4 2.3% 2.4% Net unamortized premiums/ (discounts) ............................... (24.5) (4.9) (29.4) Total Treasury securities, net (public) .......................................... 11,951.8 803.8 12,755.6 Agency securities: Tennessee Valley Authority ........... 24.8 (1.2) 23.6 All other agencies .......................... 0.2 - 0.2 Total agency securities, net of unamortized premiums and discounts .................................... 25.0 (1.2) 23.8 Accrued interest payable ............... 51.6 2.6 54.2 Total federal debt securities held by the public and accrued interest ……………… . 12,028.4 805.2 12,833.6
Types of marketable securities: Bills–Short-term obligations issued with a term of 1 year or less. Notes–Medium-term obligations issued with a term of 2-10 years. Bonds–Long-term obligations of more than 10 years. TIPS–Term of more than 5 years. FRN–Term of 2 years.
90 NOTES TO THE FINANCIAL STATEMENTS
Federal debt securities held by the public outside the Government are held by individuals, corporations, state or local governments, FRBs, foreign governments, and other entities outside the federal government. The above table details Government borrowing primarily to finance operations and shows marketable and nonmarketable securities at face value less net unamortized premiums and discounts including accrued interest.
Securities that represent federal debt held by the public are issued primarily by the Treasury and include: Interest-bearing marketable securities (bills, notes, bonds, inflation-protected, and floating rate notes). Interest-bearing nonmarketable securities (government account series held by deposit and fiduciary funds, foreign series, state and local government series, domestic series, and savings bonds).
Non-interest-bearing marketable and nonmarketable securities (matured and other). Section 3111 of Title 31, United States Code (U.S.C.) authorizes the Secretary of the Treasury to use money received
from the sale of an obligation and other money in the General Fund of the Treasury to buy, redeem, or refund, at or before maturity, outstanding bonds, notes, certificates of indebtedness, Treasury bills, or savings certificates of the Government. There were no buyback operations in fiscal years 2014 and 2013.
Gross federal debt (with some adjustments) is subject to a statutory ceiling (i.e., the debt limit). Prior to 1917, Congress approved each debt issuance. In 1917, to facilitate planning in World War I, Congress and the President first enacted a statutory dollar ceiling for federal borrowing. With the Public Debt Act of 1941 (Public Law No. 77-7), Congress and the President set an overall limit of $65 billion on Treasury debt obligations that could be outstanding at any one time; since then, Congress and the President have enacted a number of debt limit increases.
Most recently, Treasury faced two delays in raising the statutory debt limit that required it to depart from its normal debt management operations and to invoke legal authorities to avoid exceeding the statutory debt limit. During each of these periods, extraordinary measures taken by Treasury resulted in federal debt securities not being issued to certain federal accounts. The first occurred from May 20, 2013 through October 16, 2013. As such, a delay in raising the statutory debt limit existed as of September 30, 2013. The $120.4 billion of uninvested principal of and related interest for the Thrift Saving Plan (TSP) G Fund that would have been reported as Federal Debt Securities Held by the Public and Accrued Interest had there not been a delay in raising the statutory debt limit as of September 30, 2013, and had the securities been issued, were reported as miscellaneous liabilities. On October 17, 2013, the Continuing Appropriations Act, 2014 (Public Law No. 113-46) was enacted which temporarily suspended the statutory debt limit through February 7, 2014. Treasury subsequently restored the uninvested principal and related interest, resulting in an increase in federal debt securities held by the public from 2013 to 2014. See Note 17, Other Liabilities for more information. On February 8, 2014, the debt limit was raised to $17,211.6 billion. The second occurred from February 10, 2014, through February 14, 2014. On February 15, 2014 Congress enacted the Temporary Debt Limit Extension Act (Public Law No. 113-83) which temporarily suspended the debt limit through March 15, 2015.
As of September 30, 2014, and 2013, debt subject to the statutory debt limit was $17,781.1 billion and $16,699.4 billion, respectively. The debt subject to the limit includes Treasury securities held by the public and Government guaranteed debt of federal agencies (shown in the table above) and intragovernmental debt holdings (shown in the following table). See Note 17—Other Liabilities and Note 23—Fiduciary Activities for additional information.

NOTES TO THE FINANCIAL STATEMENTS 91
Intragovernmental Debt Holdings: Federal Debt Securities Held as Investments by Government Accounts as of September 30, 2014, and 2013 Net Change During Balance Fiscal Year Balance (In billions of dollars) 2013 2014 2014
Social Security Administration, Federal Old-Age and Survivors Insurance Trust Fund
2,655.6 57.2 2,712.8
Office of Personnel Management, Civil Service Retirement and Disability Fund 719.4 137.8 857.2
Department of Defense, Military Retirement Fund 421.3 61.8 483.1 Department of Health and Human Services,
Federal Hospital Insurance Fund
206.0 (3.8) 202.2
Department of Defense, Medicare-Eligible Retiree Health Care Fund 188.7 11.7 200.4
Social Security Administration, Federal Disability Insurance Trust Fund 100.8 (30.7) 70.1
Department of Health and Human Services, Federal Supplementary Medical Insurance Trust Fund
67.4 1.0 68.4
Department of Energy, Nuclear Waste Disposal Fund 50.6 0.9 51.5
Federal Deposit Insurance Corporation Funds 37.7 11.9 49.6
Office of Personnel Management, Postal Service Retiree Health Benefits Fund 42.3 6.2 48.5
Office of Personnel Management, Employees Life Insurance Fund 42.0 1.2 43.2
Department of Labor, Unemployment Trust Fund 29.5 6.4 35.9
Office of Personnel Management, Employees Health Benefits Fund 23.4 0.2 23.6
Department of the Treasury, Exchange Stabilization Fund 22.7 (0.1) 22.6
Department of State, Foreign Service Retirement and Disability Fund 17.4 0.4 17.8
Pension Benefit Guaranty Corporation Fund 22.6 (5.2) 17.4
Department of Transportation, Airport and Airway Trust Fund 11.8 1.0 12.8
National Credit Union Share Insurance Fund 10.6 0.4 11.0 Department of Transportation, Highway Trust Fund 2.0 8.7 10.7 All other programs and funds 90.1 10.2 100.3 Subtotal 4,761.9 277.2 5,039.1 Total Net Unamortized Premiums/(Discounts) for Intragovernmental 69.4 (1.6) 67.8 Total intragovernmental debt holdings, net 4,831.3 275.6 5,106.9
Intragovernmental debt holdings represent the portion of the gross federal debt held as investments by government entities such as trust funds, revolving funds, and special funds. As noted above, the delay in raising the debt limit still existed

92 NOTES TO THE FINANCIAL STATEMENTS
as of September 30, 2013. On October 17, 2013, the Continuing Appropriations Act, 2014 (Public Law No. 113-46) was enacted which temporarily suspended the statutory debt limit through February 7, 2014. Treasury subsequently restored uninvested principal and related interest, resulting in an increase to the Civil Service Retirement and Disability Fund from 2013 to 2014.
Government entities that held investments in Treasury securities include trust funds that have funds from dedicated collections. For more information on funds from dedicated collections, see Note 22 Funds from Dedicated Collections. These intragovernmental debt holdings are eliminated in the consolidation of these financial statements.

NOTES TO THE FINANCIAL STATEMENTS 93
Note 13. Federal Employee and Veteran Benefits Payable
Federal Employee and Veteran Benefits Payable as of September 30, 2014 and 2013 Civilian Military Total (In billions of dollars) 2014 2013 2014 2013 2014 2013
Pension and accrued benefits ............ 1,905.2 1,867.9 1,565.1 1,524.2 3,470.3 3,392.1 Post-retirement health and accrued benefits ........................................... 336.8 326.7 760.5 747.6 1,097.3 1,074.3 Veterans compensation and burial benefits ............................................ N/A N/A 2,007.1 1,974.8 2,007.1 1,974.8 Life insurance and accrued benefits... 48.3 47.6 9.1 9.9 57.4 57.5 FECA benefits .................................... 28.3 27.4 8.8 9.0 37.1 36.4 Liability for other benefits ................... 0.9 0.8 2.5 2.4 3.4 3.2 Total federal employee and veteran benefits payable .............................. 2,319.5 2,270.4 4,353.1 4,267.9 6,672.6 6,538.3
Change in Pension and Accrued Benefits
Civilian Military Total (In billions of dollars) 2014 2013 2014 2013 2014 2013 Actuarial accrued pension liability, beginning of fiscal year ..................................... 1,867.9 1,772.3 1,524.2 1,482.0 3,392.1 3,254.3 Pension Expense: Normal costs .................................. 38.4 38.1 32.6 32.0 71.0 70.1 Interest on liability .......................... 77.2 76.7 64.9 67.5 142.1 144.2 Actuarial (gains)/losses (from experience) .................................... (12.9) (19.4) (22.6) (14.7) (35.5) (34.1) Actuarial (gains)/losses (from assumption changes) ..................... 17.6 80.8 21.6 11.9 39.2 92.7 Total pension expense................ 120.3 176.2 96.5 96.7 216.8 272.9
Less benefits paid .......................... (83.0) (80.6) (55.6) (54.5)
(138.6)
(135.1)
Actuarial accrued pension liability, end of fiscal year .......... 1,905.2 1,867.9 1,565.1 1,524.2 3,470.3 3,392.1

94 NOTES TO THE FINANCIAL STATEMENTS
Change in Post-Retirement Health and Accrued Benefits
Civilian Military Total (In billions of dollars) 2014 2013 2014 2013 2014 2013
Actuarial accrued post- retirement health benefits liability, beginning of fiscal year .................................................. 326.7 328.1 747.6 833.3 1,074.3 1,161.4 Post-Retirement health benefits expense: Prior (and past) service costs from plan amendments or new plans .... - - - (46.8) - (46.8) Normal costs .................................... 11.7 11.8 21.8 22.1 33.5 33.9 Interest on liability ............................ 14.2 15.1 33.3 38.8 47.5 53.9 Actuarial (gains)/losses (from experience) .................................... (3.1) (14.7) (8.0) (3.8) (11.1) (18.5) Actuarial (gains)/losses (from assumption changes) .................... 1.3 - (14.7) (74.8) (13.4) (74.8) Total post-retirement health benefits expense......................... 24.1 12.2 32.4 (64.5) 56.5 (52.3) Less claims paid ............................... (14.0) (13.6) (19.5) (21.2) (33.5) (34.8) Actuarial accrued post- retirement health benefits liability, end of fiscal year ............. 336.8 326.7 760.5 747.6 1,097.3 1,074.3
The Government offers its employees life and health insurance, as well as retirement and other benefits. The liabilities
for these benefits, which include both actuarial amounts and amounts due and payable to beneficiaries and health care carriers, apply to current and former civilian and military employees. Large fluctuations in actuarial amounts can result from changes in estimates to future outflows for benefits based on complex assumptions and cost models.
OPM administers the largest civilian plan. DOD and VA administer the largest military plans. Other significant pension plans with more than $10 billion in accrued benefits payable include those of the Coast Guard (DHS), Foreign Service (Department of State), TVA, and HHS’s Public Health Service Commissioned Corps Retirement System. Please refer to the financial statements of the agencies listed for further details regarding their pension plans and other benefits.
Change in Civilian Life Insurance and Accrued Benefits (In billions of dollars) 2014 2013 Actuarial accrued life insurance benefits liability, beginning of fiscal year ............................................................................. 47.6 47.2 Life insurance benefits expense: New entrant expense ................................................................................... 0.2 0.4 Interest on liability ........................................................................................ 2.0 2.1 Actuarial (gains)/losses (from experience) .................................................. (0.7) (0.7) Actuarial (gains)/losses (from assumption changes) ................................... (0.2) (0.9) Total life insurance benefits expense........................................................ 1.3 0.9 Less costs paid ............................................................................................ (0.6) (0.5) Actuarial accrued life insurance benefits liability, end of fiscal year ....................................................................................... 48.3 47.6

NOTES TO THE FINANCIAL STATEMENTS 95
Significant Long-Term Economic Assumptions Used in Determining Pension Liability and the Related Expense Civilian Military 2014 2013 2014 2013 FERS CSRS FERS CSRS
Rate of interest ................................. 4.30% 3.90% 4.40% 4.10% 4.30% 4.30% Rate of inflation ................................. 2.50% 2.50% 2.50% 2.50% 2.40% 2.40% Projected salary increases ............... 1.90% 1.90% 2.20% 2.20% 2.50% 2.80% Cost of living adjustment ................. 1.90% 2.50% 2.00% 2.50% - -
Significant Long-Term Economic Assumptions Used in Determining Post-Retirement Health Benefits and the Related Expense Civilian Military 2014 2013 2014 2013 Rate of interest ................................................. 4.30% 4.40% 4.30% 4.40% Single equivalent medical trend rate ................ 5.30% 5.20% 4.92% 4.80% Ultimate medical trend rate .............................. 4.20% 4.20% 5.15% 5.15%
Significant Long-Term Economic Assumptions Used in Determining Life Insurance Benefits and the Related Expense Civilian
2014 2013
Rate of interest ................................................. 4.20% 4.30% Rate of increase in salary ................................. 1.90% 2.20%
With the implementation of SFFAS No. 33, Pension, Other Retirement Benefits, and Other Postemployment Benefits:
Reporting the Gains and Losses from Changes in Assumptions and Selecting Discount Rates and Valuation Dates, agencies are required to separately present gains and losses from changes in long-term assumptions used to estimate liabilities associated with pensions, ORB, and OPEB on the Statement of Net Cost. SFFAS No. 33 also provides a standard for selecting the discount rate assumption for present value estimates of federal employee pension, ORB, and OPEB liabilities. In addition, SFFAS No. 33 provides a standard for selecting the valuation date for estimates of federal employee pension, ORB, and OPEB liabilities that will establish a consistent method for such measurements. The SFFAS 33 standard for selecting discount rate assumption requires it be based on a historical average of interest rates on marketable Treasury securities consistent with the cash flows being discounted.
In fiscal year 2014, Treasury developed a new model and methodology for developing these rates to provide a sustainable, justifiable data resource for the affected agencies. As of July 2014, Treasury began releasing interest rate yield curve data using this new Yield Curve for Treasury Nominal Coupon Issues (TNC yield curve), which is derived from Treasury notes and bonds. The TNC yield curve provides information on Treasury nominal coupon issues and the methodology extrapolates yields beyond 30 years through 100 years maturity. The TNC yield curve is used to produce a Treasury spot yield curve (a zero coupon curve), which provides the basis for discounting future cash flows. The new method is based on methodology used to produce the High Quality Market (HQM) Yield Curve pursuant to the Pension Protection

96 NOTES TO THE FINANCIAL STATEMENTS
Act of 2006.1 Generally, for FY 2014, the data from the new yield curve was implemented in full in one single year (i.e., replace the historical rate series used under the legacy method with those produced under the new TNC method).
Civilian Employees Pensions
OPM administers the largest civilian pension plan, which covers substantially all full-time, permanent civilian federal employees. This plan includes two components of defined benefits, the Civil Service Retirement System (CSRS) and the Federal Employees’ Retirement System (FERS). The basic benefit components of the CSRS and the FERS are financed and operated through the Civil Service Retirement and Disability Fund (CSRDF), a trust fund.
CSRDF monies are generated primarily from employees’ contributions, agency contributions, payments from the General Fund, and interest on investments in Treasury securities. See Note 22—Funds from Dedicated Collections.
The Federal Retirement Thrift Investment Board administers the TSP Fund. The TSP Fund investment options include two fixed income funds (the G and F Funds), three stock funds (the C, S, and I Funds) and five lifecycle funds (L 2050, L 2040, L 2030, L 2020, and L Income). The L Funds diversify participant accounts among the G, F, C, S, and I Funds, using professionally determined investment mixes (allocations) that are tailored to different time horizons. Treasury securities held in the G Fund are included in federal debt securities held by the public and accrued interest on the Balance Sheet. The G Fund held $183.7 billion and $52.5 billion in nonmarketable Treasury securities as of September 30, 2014, and 2013, respectively. The increase in nonmarketable Treasury securities held in the G Fund relates to the delay in raising the debt limit that was ongoing as of September 30, 2013. The Secretary of the Treasury has authority to take extraordinary measures to stay within the statutory debt limit imposed by Congress.
One such measure involves the suspension of the issuance of securities to the G Fund if the issuance cannot be made without causing the debt limit to be exceeded. Please see Note 17— Other Liabilities for additional information.
Post-Retirement Health Benefits The post-retirement civilian health benefit liability is an estimate of the Government’s future cost of providing post-
retirement health benefits to current employees and retirees. Although active and retired employees pay insurance premiums under the Federal Employees Health Benefits Program (FEHB), these premiums cover only a portion of the costs. The OPM actuary applies economic assumptions to historical cost information to estimate the liability. The Postal Accountability and Enhancement Act of 2006 (Postal Act of 2006) (Public Law No 109-435, Title VIII), made significant changes in the funding of future retiree health benefits for employees of the USPS, including the requirement for the USPS to make scheduled payments to the third Health Benefits Program (HBP) fund, the Postal Service Retiree Health Benefits (PSRHB) Fund. Public Law No. 109-435 requires the USPS to make scheduled payment contributions to the PSRHB Fund ranging from $5.4 billion to $5.8 billion per year from fiscal year 2007 through fiscal year 2016. (The fiscal year 2009 payment was subsequently reduced to $1.4 billion.) Thereafter, the USPS will make annual payments in the amount of the normal cost payment plus or minus an amount to amortize the unfunded liability or surplus. The payment originally due by September 30, 2011, was deferred by Public Law No. 112-74, resulting in two payments due in fiscal year 2012, one for $5.5 billion due by August 1, 2012, and a second payment of $5.6 billion due by September 30, 2012, a total of $11.1 billion. Both were defaulted upon by USPS. In addition, there was a $5.6 billion and a $5.7 billion payment due by September 30, 2013 and September 30, 2014, respectively, which USPS also did not make. At this time, Congress has not taken further action on these payments due to the PSRHB from USPS. The cost for these annual payments, including any defaulted payments, along with all its other benefit program costs, are included in USPS’ net cost in the consolidated Statements of Net Cost.
Life Insurance Benefits One of the largest other employee benefits is the Federal Employee Group Life Insurance (FEGLI) Program. Employee
and annuitant contributions and interest on investments fund a portion of this liability. The actuarial life insurance liability is the expected present value of future benefits to pay to, or on behalf of, existing FEGLI participants, less the expected present value of future contributions to be collected from those participants. The OPM actuary uses salary increase and interest rate yield curve assumptions that are generally consistent with the pension liability.
1 Treasury’s HQM resource is available at: http://www.treasury.gov/resource-center/economic-policy/corp-bond-yield/Pages/Corp-Yield-Bond-Curve-Papers.aspx.

NOTES TO THE FINANCIAL STATEMENTS 97
Workers’ Compensation Benefits The DOL determines both civilian and military agencies’ liabilities for future workers’ compensation benefits for
civilian federal employees, as mandated by the Federal Employees’ Compensation Act (FECA), for death, disability, medical, and miscellaneous costs for approved compensation cases, and a component for incurred, but not reported, claims. The FECA liability is determined annually using historical benefit payment patterns related to injury years to predict the future payments.
DOL refined the approach for selecting the interest rate assumptions used to discount projected future payments. For FY 2014, projected annual payments were discounted to present value based on interest rate assumptions from the Treasury’s Yield Curve for Treasury Nominal Coupon Issues to reflect the average duration for income payments of 15.1 years and medical payments of 9.9 years. For 2014, a 3.46 percent interest rate was assumed in years one, two, and thereafter for income payments and 2.86 percent for years one, two, and thereafter for medical payments.
For FY 2013, projected annual payments were discounted to present value based on OMB’s interest rate assumptions which were interpolated to reflect the average duration for income payments of 14.7 years and medical payments of 9.6 years. For FY 2013, interest rate assumptions were 2.73 percent in year one and 3.13 percent in year two and thereafter for income payments and 2.33 percent in year one and 2.87 percent in year two and thereafter for medical payments.
The actuarial methodology provides for the effects of inflation and adjusts historical payments to current year constant dollars by applying wage inflation factors (cost-of-living adjustments or COLA) and medical inflation factors (consumer price index-medical or CPIM) to the calculation of projected benefits. The COLAs and CPIMs used in the projections for FY 2014 were as follows. For the COLAs and CPIMs used in the projections for FY 2013, refer to the Fiscal Year 2013 Financial Report of the U.S. Government.
Fiscal Year COLA CPIM 2015 1.73% 2.93% 2016 2.17% 3.76% 2017 2.13% 3.86% 2018 2.23% 3.90% 2019+ 2.30% 3.90%
Military Employees (Including Veterans) Pensions
The DOD Military Retirement Fund accumulates funds to finance, on an accrual basis, the liabilities of DOD military retirement and survivor benefit programs. The increase in the Military Retirement Pension liability is due to additional benefit accruals (normal cost), interest on the pension liability, and assumption changes, offset somewhat by reductions due to experience gains and benefits paid out. Liabilities in the future will depend on expected changes due to interest and benefit accruals, future benefit changes, assumption changes, and actuarial experience.
This Fund receives income from three sources: monthly normal cost payments from the Services and Treasury to pay for the current years’ service cost; annual payments from the Treasury to amortize the unfunded liability and pay for the increase in the normal cost attributable to Concurrent Receipt per Public Law 108-136; and investment income.
The military retirement system consists of a funded, noncontributory, defined benefit plan. It applies to military personnel (Departments of Army, Navy, Air Force, and the Marine Corps). This system includes non-disability retired pay, disability retired pay, survivor annuity programs, and Combat-Related Special Compensation. The Service Secretaries may approve immediate non-disability retired pay at any age with credit of at least 20 years of active duty service. Reserve retirees must be at least 60 years old and have at least 20 qualifying years of service before retired pay commences; however, in some cases, the age can be less than 60 if the reservist performs certain types of active service. There are three distinct non-disability benefit formulas related to three populations within the Military Retirement System: Final Pay, High-3, and Career Status Bonus/Redux. The date an individual enters the military determines which retirement system they would fall under and

98 NOTES TO THE FINANCIAL STATEMENTS
if they have the option to pick their retirement system. For more information on these benefits, see DOD’s website http://www.dfas.mil/retiredmilitary/plan/estimate/csbredux.html.
Post-Retirement Health Benefits Military retirees and their dependents are entitled to health care in military medical facilities if a facility can provide the
needed care. Prior to becoming Medicare eligible, military retirees and other eligible beneficiaries are entitled to participate in TRICARE (now managed by the Defense Health Agency)2, which reimburses (net of beneficiary copay and deductible requirements) for the cost of health care from civilian providers. TRICARE options are available in indemnity, preferred provider organization, and health maintenance organization (HMO) designs.
Since fiscal year 2002, TRICARE, as second payer to Medicare, covers military retirees and other eligible beneficiaries after they become Medicare eligible. This TRICARE coverage for Medicare eligible beneficiaries requires that the beneficiary enroll in Medicare Part B (unless the beneficiary that is Medicare eligible is the spouse of an Active Duty Service Member) and is referred to as TRICARE for Life (TFL). Health care under TFL can be obtained from military medical facilities on an “as available” basis or from civilian providers. Military retiree health care actuarial liabilities are calculated annually using assumptions and actual experience. Military retiree health care liability figures include costs incurred in military medical facilities, as well as claims paid to civilian providers and certain administrative costs. Costs paid to civilian providers are net of Medicare’s portion of the cost.
10 U.S.C., Chapter 56 created the DOD Medicare-Eligible Retiree Health Care Fund, which became operative on October 1, 2002. The purpose of this fund is to account for the health benefits of Medicare-eligible military retirees, their dependents, and survivors who are Medicare eligible. The Fund receives contributions from the Uniformed Services and Treasury, as well as interest earnings on its investments and pays costs incurred in military medical facilities, as well as claims for care provided by civilian providers under TFL, administration costs associated with processing the TFL claims, and capitated payments for coverage provided by U.S. Family Health Plans. The actuaries calculate the actuarial liabilities annually using assumptions and actual experience (e.g., mortality and retirement rates, direct care costs, purchased care). The current year actuarial present value of projected plan benefits rolls forward from the prior year’s results.
In addition to the health care benefits for civilian and military retirees and their dependents, the VA also provides medical care to veterans on an “as available” basis, subject to the limits of the annual appropriations. In accordance with 38 CFR 17.36 (c), VA’s Secretary makes an annual enrollment decision that defines the veterans, by priority, who will be treated for that fiscal year subject to change based on funds appropriated, estimated collections, usage, the severity index of enrolled veterans, and changes in cost. While VA expects to continue to provide medical care to veterans in future years, an estimate of such future benefits cannot be reasonably made. Accordingly, VA recognizes the medical care expenses in the period the medical care services are provided. For the fiscal years 2010 through 2014, the average medical care cost per year was $41.0 billion.
Veterans Compensation and Burial Benefits The Government compensates disabled veterans and their survivors. Veterans compensation is payable as a disability
benefit or a survivor’s benefit. Entitlement to compensation depends on the veteran’s disabilities having been incurred in, or aggravated during, active military service; death while on duty; or death resulting from service-connected disabilities, if not on active duty.
Eligible veterans who die or are disabled from military service-related causes, as well as their dependents, receive compensation benefits. Also, veterans are provided with burial flags, headstones/markers, and grave liners for burial in a VA national cemetery or are provided a burial flag, headstone/marker and a plot allowance for burial in a private cemetery. These benefits are provided under 38 U.S.C., Part 2, Chapter 23 in recognition of a veteran’s military service and are recorded as a liability in the period the requirements are met.
The liability for veterans’ compensation and burial benefits payable is based on an actuarial estimate of future compensation and burial payments and increased by $32.3 billion in fiscal year 2014. The $32.3 billion increase in the Federal Employee and Veterans Benefits Liabilities represents a small increase of 1.6 percent which consists of several component changes, none of which is significant.
Several significant actuarial assumptions were used in the valuation of compensation and burial benefits to calculate the present value of the liability. A liability was recognized for the projected benefit payments to: 1) those beneficiaries, including veterans and survivors, currently receiving benefit payments; 2) current veterans who will in the future become beneficiaries of the compensation program; and 3) a proportional share of those in active military service as of the valuation date who will become veterans in the future. Future benefits payments to survivors of those veterans in classes 1, 2, and 3 above are also incorporated into the projection. The projected liability does not include any administrative costs. 2 On October 1, 2013, the Department of Defense established the Defense Health Agency (DHA) to manage the activities of the Military Health System. These activities include those previously managed by TRICARE Management Activity (TMA), which was disestablished on the same date. 2013,

NOTES TO THE FINANCIAL STATEMENTS 99
The veterans compensation and burial benefits liability is developed on an actuarial basis. It is impacted by interest on the liability balance, changes in experience, changes in actuarial assumptions, prior service costs, and amounts paid for costsincluded in the liability balance.
Change in Veterans Compensation and Burial Benefits
Compensation Burial Total (In billions of dollars) 2014 2013 2014 2013 2014 2013Actuarial accrued liability beginning
of fiscal year ........................................... 1,970.2 1,757.1 4.6 4.5 1,974.8 1,761.6 Current Year Expenses:
Interest on the liability balance ............... 82.7 75.7 0.2 0.2 82.9 75.9 Prior (and past) service costs from
program amendments or new programs during the period ................. - 1.2 - - - 1.2
Actuarial (gain)/losses (from experience) ........................................... 36.8 86.8 - (0.1) 36.8 86.7
Actuarial (gain)/losses (from assumption changes) .................. (22.0) 113.9 (0.1) 0.2 (22.1) 114.1 Total current year expense .................. 97.5 277.6 0.1 0.3 97.6 277.9
Less benefits paid ..................................... (65.1) (64.5) (0.2) (0.2) (65.3) (64.7)Actuarial accrued liability, end of
fiscal year .............................................. 2,002.6 1,970.2 4.5 4.6 2,007.1 1,974.8
Significant Economic Assumptions Used in Determining Veterans Compensation and Burial Benefits as of September 30, 2014, and 2013
2014 2013Rate of interest .................................................................... 4.29% 4.20%Rate of inflation .................................................................... 2.61% 2.57%
Life Insurance Benefits The largest veterans’ life insurance programs consist of the following:
National Service Life Insurance (NSLI) covers policyholders who served during World War II. Veterans’ Special Life Insurance (VSLI) was established in 1951 to meet the insurance needs of veterans who served during the Korean Conflict and through the period ending January 1, 1957. Service-Disabled Veterans Insurance (S-DVI) program was established in 1951 to meet the insurance needs of veterans who received a service-connected disability rating.

100 NOTES TO THE FINANCIAL STATEMENTS
The components of veteran life insurance liability for future policy benefits are presented below. Veterans Life Insurance Liability as of September 30, 2014, and 2013
(In billions of dollars) 2014 2013 Insurance death benefits: NSLI ................................................................................................................ 4.4 5.0 VSLI ................................................................................................................ 1.4 1.5 S-DVI .............................................................................................................. 0.6 0.5 Other ............................................................................................................... 0.3 0.4 Total death benefits .................................................................................... 6.7 7.4 Death benefit annuities ..................................................................................... 0.1 0.1 Disability income & waiver ................................................................................ 0.8 0.8 Insurance dividends payable ............................................................................. 1.4 1.5 Unearned premiums .......................................................................................... 0.1 0.1 Total veterans life insurance liability ............................................................... 9.1 9.9
Insurance dividends payable consists of dividends left on a deposit with VA, related interest payable, and dividends payable to policyholders.
The VA supervises Servicemembers Group Life Insurance and Veterans Group Life Insurance programs that provide life insurance coverage to members of the uniformed armed services, reservists, and post-Vietnam Veterans as well as their families.
Pension Benefits
The VA also provides certain veterans and/or their dependents with pension benefits, based on annual eligibility reviews, if the veteran died or was disabled for nonservice-related causes. VA pension benefits are recognized as a nonexchange transaction due to the nature of the VA pension plan. Therefore, the actuarial present value of these future benefits is not required to be recorded on the Balance Sheet. The projected amounts of future payments for pension benefits (presented for informational purposes only) as of September 30, 2014, and 2013, was $102.8 billion and $97.5 billion, respectively.

NOTES TO THE FINANCIAL STATEMENTS 101
Note 14. Environmental and Disposal Liabilities
Environmental and Disposal Liabilities as of September 30, 2014, and 2013 (In billions of dollars) 2014 2013 Department of Energy: Environmental and Disposal Liabilities ........................................................... 299.8 280.2 Department of Defense: Environmental Restoration ............................................................................. 27.0 26.6 Disposal of Weapon Systems Program .......................................................... 21.2 21.8 Environmental Corrective Other ..................................................................... 6.2 5.7 Base Realignment and Closure ...................................................................... 4.2 4.3 Total Department of Defense........................................................................ 58.6 58.4 All other agencies ............................................................................................ 10.7 10.5 Total environmental and disposal liabilities 369.1 349.1
During World War II and the Cold War, DOE (or predecessor agencies) developed a massive industrial complex to research, produce, and test nuclear weapons. This included nuclear reactors, chemical-processing buildings, metal machining plants, laboratories, and maintenance facilities that manufactured tens of thousands of nuclear warheads and conducted more than 1,000 nuclear tests.
At all sites where these activities took place, some environmental contamination occurred. This contamination was caused by the production, storage, and use of radioactive materials and hazardous chemicals, which resulted in contamination of soil, surface water, and groundwater. The environmental legacy of nuclear weapons production also includes thousands of contaminated buildings and large volumes of waste and special nuclear materials requiring treatment, stabilization, and disposal.
Estimated cleanup costs at sites for which there are no current feasible remediation approaches, such as the Nevada nuclear test site, are excluded from the estimates, although applicable stewardship and monitoring costs for these sites are included. DOE has not been required through regulation to establish remediation activities for these sites.
Estimating DOE’s environmental cleanup liability requires making assumptions about future activities and is inherently uncertain. The future course of DOE’s environmental cleanup and disposal will depend on a number of fundamental technical and policy choices, many of which have not been made. The sites and facilities could be restored to a condition suitable for any desirable use, or could be restored to a point where they pose no near-term health risks. Achieving the former conditions would have a higher cost but may (or may not) warrant the costs, or be legally required. The environmental and disposal liability estimates include contingency estimates intended to account for the uncertainties associated with the technical cleanup scope of the program.
DOE’s environmental and disposal liabilities estimates are dependent on annual funding levels and achievement of work as scheduled. Congressional appropriations at lower than anticipated levels or unplanned delays in project completion would cause increases in life-cycle costs.
DOE’s environmental and disposal liabilities also include the estimated cleanup and post-closure responsibilities, including surveillance and monitoring activities, soil and groundwater remediation, and disposition of excess material for sites. The Department is responsible for the post-closure activities at many of the closure sites as well as other sites. The costs for these post-closure activities are estimated for a period of 75 years after the balance sheet date, i.e., through 2089 in fiscal year 2014 and through 2088 in fiscal year 2013. While some post-cleanup monitoring and other long-term stewardship activities post-2089 are included in the liability, there are others the Department expects to continue beyond 2089 for which the costs cannot reasonably be estimated.
A portion of DOE’s environmental and disposal liabilities at various field sites includes anticipated costs for facilities managed by DOE’s ongoing program operations which will ultimately require stabilization, deactivation, and decommissioning. The estimate is largely based upon a cost-estimating model. Site specific estimates are used in lieu of the

102 NOTES TO THE FINANCIAL STATEMENTS
cost-estimating model, when available. Cost estimates for ongoing program facilities are updated each year. For facilities newly contaminated since fiscal year 1997, cleanup costs allocated to future periods and not included in environmental and disposal liabilities amounted to $710.0 million and $766.0 million for fiscal years 2014 and 2013, respectively.
Please refer to the financial statements of the DOE for significant detailed information regarding DOE’s environmental and disposal liabilities, including cleanup costs.
DOD follows the Comprehensive Environmental Response, Compensation, and Liability Act (CERCLA), Superfund Amendments and Reauthorization Act, Resource Conservation and Recovery Act (RCRA) and other applicable federal or state laws to clean up contamination. The CERCLA and RCRA require the DOD to clean up contamination in coordination with regulatory agencies, current owners of property damaged by the Department, and third parties that have a partial responsibility for the environmental restoration. Failure to comply with agreements and legal mandates puts the DOD at risk of incurring fines and penalties.
DOD must restore active installations, installations affected by base realignment and closure, and other areas formerly used as Defense sites. DOD also bears responsibility for disposal of chemical weapons and environmental costs associated with the disposal of weapons systems (primarily nuclear powered aircraft carriers and submarines).
DOD uses engineering estimates and independently validated models to estimate environmental costs. The engineering estimates are used after obtaining extensive data during the remedial investigation/feasibility phase of the environmental project.
For general PP&E placed into service after September 30, 1997, DOD expenses associated environmental costs systematically over the life of the asset using two methods: physical capacity for operating landfills and life expectancy in years for all other assets. The Department expenses the full cost to clean up contamination for stewardship property, plant, and equipment at the time the asset is placed into service. DOD has expensed the costs for cleanup associated with general property, plant, and equipment placed into service before October 1, 1997, except for costs intended to be recovered through user charges; for those costs, DOD has expensed cleanup costs associated with that portion of the asset life that has passed since it was placed into service. DOD systematically recognizes the remaining cost over the remaining life of the asset. The unrecognized portion of the cleanup cost associated with general property, plant, and equipment is $3.1 billion and $3.2 billion for fiscal years 2014 and 2013, respectively. Not all components of DOD are able to compile the necessary information for this disclosure, thus the amount reported may not accurately reflect DOD’s total unrecognized costs associated with general property, plant, and equipment. DOD is implementing procedures to address these deficiencies.
DOD is unable to estimate and report a liability for environmental restoration and corrective action for buried chemical munitions and agents, because the extent of the buried chemical munitions and agents is unknown at this time. DOD is also unable to provide a complete estimate for the Formerly Utilized Sites Remedial Action Program. DOD has ongoing studies and will update its estimate as additional liabilities are identified. DOD has the potential to incur costs for restoration initiatives in conjunction with returning overseas Defense facilities to host nations. However, DOD is unable to provide a reasonable estimate at this time because the extent of required restoration is unknown.
Please refer to the financial statements of the DOD for further detailed information regarding DOD’s environmental and disposal liabilities, including cleanup costs.
In addition, due to the implementation of TB 2006-1 in fiscal year 2013, agencies recorded an environmental and disposal liability for asbestos-related cleanup costs totaling $3.6 billion and $4.0 billion as of September 30, 2014, and 2013, respectively.

NOTES TO THE FINANCIAL STATEMENTS 103
Note 15. Benefits Due and Payable
Benefits Due and Payable as of September 30, 2014, and 2013 (In billions of dollars) 2014 2013 Federal Old-Age and Survivors Insurance ........................................................ 62.9 60.0 Grants to States for Medicaid ............................................................................ 32.3 27.6 Federal Supplementary Medical Insurance (Medicare Parts B and D) ............. 31.9 27.8 Federal Disability Insurance .............................................................................. 25.8 24.2 Federal Hospital Insurance (Medicare Part A) .................................................. 25.7 20.8 Supplemental Security Income .......................................................................... 5.2 5.2 Unemployment Insurance ................................................................................. 1.0 2.4 All other benefits programs ............................................................................... 6.8 6.3 Total benefits due and payable .................................................................... 191.6 174.3
Benefits due and payable are amounts owed to program recipients or medical service providers as of September 30 that
have not been paid. HHS and the SSA administer the majority of the medical service programs and the DOL administers the Unemployment Insurance program. For a description of the programs, see Note 24—Social Insurance and the Unaudited Required Supplementary Information—Social Insurance section.

104 NOTES TO THE FINANCIAL STATEMENTS
Note 16. Insurance and Guarantee Program Liabilities
Insurance and Guarantee Program Liabilities as of September 30, 2014, and 2013 (In billions of dollars) 2014 2013
Insurance and Guarantee Program Liabilities: Pension Benefit Guaranty Corporation - Benefit Pension Plans .................... 146.9 114.9 Federal Deposit Insurance Corporation Funds ............................................... 13.2 16.9 Department of Agriculture - Federal Crop Insurance ..................................... 7.3 6.9 All other insurance and guarantee programs ................................................. 0.8 1.2 Total insurance and guarantee program liabilities ....................................... 168.2 139.9
PBGC insures pension benefits for participants in covered defined benefit pension plans. As a wholly-owned
corporation of the Government, PBGC’s financial activity and balances are included in the consolidated financial statements of the Government. However, under current law, PBGC’s liabilities may be paid only from PBGC’s assets and not from the General Fund of the Treasury or assets of the Government in general. As of September 30, 2014, and 2013, PBGC had total liabilities of $151.6 billion and $120.6 billion, and its total liabilities exceeded its total assets by $61.8 billion and $35.6 billion, respectively. In addition, as discussed in Note 20—Contingencies, PBGC reported reasonably possible contingent losses of about $184.4 billion and $328.9 billion as of September 30, 2014, and 2013, respectively.
Of the total FDIC amount as of September 30, 2014, and 2013, $1.9 billion and $1.2 billion, respectively, represents the recorded contingent liability and loss provision for institutions insured by the Deposit Insurance Fund that are likely to fail. In addition, $11.3 billion and $15.8 billion pertain to liabilities due to resolutions of failed or failing institutions and to pending depositor claims as of September 30, 2014, and 2013, respectively.
As of September 30, 2014, and 2013, $7.3 billion and $6.9 billion, respectively, pertain to the USDA’s Federal Crop Insurance Program. The Federal Crop Insurance Program is administered by the Federal Crop Insurance Corporation, whose mission is to provide an actuarially sound risk management program to reduce agricultural producers’ economic losses due to natural disasters.

NOTES TO THE FINANCIAL STATEMENTS 105
Note 17. Other Liabilities
Other Liabilities as of September 30, 2014, and 2013 (In billions of dollars) 2014 2013 Unearned revenue and assets held for others: Unearned fees for nuclear waste disposal (DOE) and other unearned revenue ......................................................................................................... 50.6 48.5 Assets held on behalf of others ........................................................................ 81.9 79.5 Subtotal ......................................................................................................... 132.5 128.0 Employee-related liabilities: Accrued federal employees' wages and benefits ............................................. 38.3 38.2 Selected DOE contractors' and D.C. employees' pension benefits .................. 48.6 46.5 Subtotal ......................................................................................................... 86.9 84.7 International monetary liabilities and gold certificates: Exchange Stabilization Fund ............................................................................ 57.6 59.4 Gold Certificates (see Note 2) .......................................................................... 11.0 11.0 Subtotal ......................................................................................................... 68.6 70.4 Subsidies and grants: Farm and other subsidies ................................................................................. 9.8 10.6 Grant payments due to state and local governments and others ..................... 16.9 15.6 Subtotal ......................................................................................................... 26.7 26.2 Miscellaneous liabilities: Legal and other contingencies .......................................................................... 46.1 43.4 Non-federal power projects and capital lease liabilities, and disposal liabilities .............................................. 13.1 12.8 Liability for restoration of federal debt principal and interest ........................... - 120.4 Other miscellaneous ......................................................................................... 35.2 36.3 Subtotal ......................................................................................................... 94.4 212.9 Total other liabilities .................................................................................... 409.1 522.2
Other liabilities represent liabilities that are not separately identified on the Balance Sheet and are presented on acomparative basis by major category.

106 NOTES TO THE FINANCIAL STATEMENTS
Unearned Revenue and Assets Held for Others The government recognizes a liability when it receives money in advance of providing goods and services or assumes
custody of money belonging to others. The government’s unearned revenue from fees DOE has collected from utility companies for the future cost of managing the disposal of nuclear waste is about $36.0 billion and $34.1 billion as of September 30, 2014, and 2013, respectively. Other unearned revenue includes USPS income for such things as prepaid postage, outstanding money orders, and prepaid P.O. Box rentals. FDIC collected prepaid assessments from the financial institutions to address the Deposit Insurance Fund (DIF) liquidity needs to pay for projected near-term failures and to ensure that the deposit insurance system remains industry-funded. The prepaid collection was based on maintaining assessment rates at their current levels through the end of 2010 and adopting a uniform three basis point increase in assessment rates effective January 1, 2011. An institution’s quarterly risk-based deposit insurance assessment thereafter is offset by the amount prepaid until that amount is exhausted or until June 30, 2013, when any amount remaining would be returned to the institution. The final offset of prepaid assessments occurred for the period ending March 31, 2013, and in June 2013, as required by regulation, the DIF refunded $5.8 billion of unused prepaid assessments to Insured Depository Institutions. Assets held on behalf of others include funds collected in advance and undelivered Defense articles. The Foreign Military Sales program holds $68.0 billion and $67.0 billion as of September 30, 2014, and 2013, respectively for articles and services for future delivery to foreign governments.
Employee-Related Liabilities This category includes amounts owed to employees at year end and actuarial liabilities for certain non-federal
employees. Actuarial liabilities for federal employees and veteran benefits are included in Note 13–Federal Employee and Veteran Benefits Payable and are reported on another line on the Balance Sheet. The largest liability in the employee-related liabilities category is the amount owed at the end of the fiscal year to federal employees for wages and benefits (including accrued annual leave). In addition, DOE is liable to certain contractors such as the University of California, which operates the Lawrence Livermore National Laboratory, for contractor employee pension and post-retirement benefits, which is about $23.4 billion and $21.3 billion as of September 30, 2014, and 2013, respectively. Also, the government owed about $9.2 billion as of both September 30, 2014, and 2013, for estimated future pension benefits of the District of Columbia’s judges, police, firefighters, and teachers.
International Monetary Liabilities and Gold Certificates Consistent with U.S. obligations in the IMF on orderly exchange arrangements and a stable system of exchange rates,
the Secretary of the Treasury, with the approval of the President, may use the Exchange Stabilization Fund to deal in gold, foreign exchange, and other instruments of credit and securities.
Gold certificates are issued in nondefinitive or book-entry form to the Federal Reserve Banks. The government’s liability incurred by issuing the gold certificates, as reported on the Balance Sheet, is limited to the gold being held by the Department of the Treasury at the standard value established by law. Upon issuance of gold certificates to the FRBs, the proceeds from the certificates are deposited into the operating cash of the U.S. Government. All of the Department of the Treasury’s certificates issued are payable to the FRBs.
Subsidies and Grants The government supports the public good through a wide variety of subsidy and grant programs in such areas as agriculture, medical and scientific research, education, and transportation. USDA programs such as Conservation Reserve, Tobacco Transition Payment, Disaster Assistance and Direct and Counter-Cyclical Payment Programs account for the majority of the subsidies due, about $5.3 billion and $6.8 billion as of September 30, 2014, and 2013, respectively. The government awards hundreds of billions of dollars in grants annually. These include project grants that are competitively awarded for agency-specific projects, such as HHS grants to fund projects to “enhance the independence, productivity, integration, and inclusion into the community of people with developmental disabilities.” Other grants are formula grants, such as matching grants. Formula grants go to state governments for such things as education and transportation programs. These grants are paid in accordance with distribution formulas that have been provided by law or administrative regulations. Of the total liability reported for grants as of September 30, 2014, and 2013, DOT, Education, and HHS collectively owed their grantees about $12.3 billion and $12.7 billion, respectively. Refer to the financial statements and footnotes of the respective agencies for additional information.

NOTES TO THE FINANCIAL STATEMENTS 107
Miscellaneous Liabilities Some of the more significant liabilities included in this category are for (1) legal and other contingencies (see Note 20—Contingencies), (2) Bonneville Power Administration liability to pay annual budgets of several power projects for its electrical generating capacity, (3) payables due to the purchases of securities, and (4) other liabilities reported by Treasury as a result of the occurrence of a delay in raising the statutory debt limit as of September 30, 2013. When delays in raising the statutory debt limit occur, Treasury often must deviate from its normal debt management operations and take a number of extraordinary measures to meet the government’s obligations as they come due without exceeding the debt limit. Many extraordinary measures taken by Treasury during the period of May 20, 2013, through September 30, 2013, resulted in federal debt securities not being issued to certain federal government accounts. As a result of Treasury securities not being issued to the G Fund, Treasury reported miscellaneous liabilities in the amount of $120.4 billion that represent uninvested principal of and related interest for the Thrift Savings Plan’s (TSP) G Fund that would have been reported in Note 12—Federal Debt Securities Held by the Public and Accrued Interest had there not been a delay in raising the statutory debt limit as of September 30, 2013, and had the securities been issued. These extraordinary measures ended when Congress enacted legislation which temporarily suspended the debt limit, therefore resulting in an increase of Federal Debt Securities Held by the Public and Accrued Interest from fiscal years 2013 to 2014. For further information on this, see Note 12—Federal Debt Securities Held by the Public and Accrued Interest and Note 23—Fiduciary Activities. In addition, many federal agencies reported relatively small amounts of miscellaneous liabilities that are not otherwise classified.

108 NOTES TO THE FINANCIAL STATEMENTS
Note 18. Collections and Refunds of Federal Revenue
Collections of Federal Tax Revenue for the Year Ended September 30, 2014
Federal Tax Year to Which Collections Relate Tax Revenue Prior (In billions of dollars) Collections 2014 2013 2012 Years Individual income tax and tax withholdings ..................................... 2,605.0 1,691.1 864.3 24.3 25.3 Corporation income taxes .................... 353.1 252.9 87.9 1.2 11.1 Excise taxes ......................................... 96.7 74.4 22.1 0.1 0.1 Unemployment taxes ............................ 52.7 27.1 15.3 10.2 0.1 Customs duties ..................................... 34.2 34.2 - - - Estate and gift taxes ............................. 20.2 - 7.0 0.9 12.3 Railroad retirement taxes ..................... 6.0 4.6 1.4 - - Fines, penalties, interest, and other revenue ..................................... 6.7 6.5 0.1 0.1 - Subtotal .............................................. 3,174.6 2,090.8 998.1 36.8 48.9 Less: amounts collected for non-federal entities ....................... (0.3) Total .............................................. 3,174.3
Treasury is the Government’s principal revenue-collecting agency. Collections of individual income and tax withholdings include FICA/SECA and individual income taxes. These taxes are characterized as non-exchange revenue.
Excise taxes, also characterized as non-exchange revenue, consist of taxes collected for various items, such as airline tickets, gasoline products, distilled spirits and imported liquor, tobacco, firearms, and others.

NOTES TO THE FINANCIAL STATEMENTS 109
Federal Tax Refunds Disbursed for the Year Ended September 30, 2014 Tax Year to Which Refunds Relate Refunds Prior (In billions of dollars) Disbursed 2014 2013 2012 Years Individual income tax and tax withholdings .......................................... 335.8 13.7 290.8 24.0 7.3 Corporation income taxes ........................ 35.3 4.4 10.9 6.7 13.3 Excise taxes ............................................. 1.8 0.5 0.9 0.2 0.2 Unemployment taxes ................................ 0.1 - 0.1 - - Customs duties ......................................... 1.3 0.7 0.3 0.1 0.2 Estate and gift taxes ................................. 0.9 - 0.2 0.5 0.2 Total ..................................................... 375.2 19.3 303.2 31.5 21.2
Reconciliation of Revenue to Tax Collections for the Year Ended September 30, 2014, and 2013
(In billions of dollars) 2014 2013 Consolidated revenue per the Statements of Operations and Changes in Net Position ........................................................................................ 3,066.1 2,842.5 Tax refunds ................................................................................................................ 375.2 365.9 Earned income tax and child tax credit imputed revenue ......................................... (81.6) (79.1) Other tax credits and accrual adjustments ................................................................ (21.9) (9.5) Federal Insurance Contributions Act - Tax ................................................................ 19.8 20.3 Federal Reserve earnings ......................................................................................... (99.2) (75.8) Nontax-related fines and penalties reported by agencies ......................................... (65.1) (87.2) Nontax-related earned revenue ................................................................................. (19.0) (11.2) Collections of federal tax revenue ............................................................................. 3,174.3 2,965.9
Consolidated revenue in the SOCNP is presented on a modified cash basis, net of tax refunds, and includes other non-
tax related revenue. Earned Income Tax Credit, Child Tax Credit, and other tax credits amounts (unaudited) are included in gross cost in the Statements of Net Cost. The Federal Insurance Contributions Act – Tax is included in the Individual income and tax withholdings line in the Collections of Federal tax revenue; however, it is not reported on the SOCNP as these collections are intragovernmental revenue and eliminated in consolidation. The table above reconciles total revenue to federal tax collections.

110 NOTES TO THE FINANCIAL STATEMENTS
Collections of Federal Revenue for the Year Ended September 30, 2013
Federal Tax Year to Which Collections Relate Tax Revenue Prior (In billions of dollars) Collections 2013 2012 2011 Years Individual income tax and tax withholdings ..................................... 2,448.5 1,580.4 821.5 22.3 24.3 Corporation income taxes ..................... 312.0 217.6 83.6 2.0 8.8 Excise taxes .......................................... 87.1 64.0 22.9 0.1 0.1 Unemployment taxes ............................. 54.1 28.0 15.3 10.7 0.1 Customs duties ...................................... 31.8 31.8 - - - Estate and gift taxes .............................. 19.8 - 10.3 0.6 8.9 Railroad retirement taxes ...................... 5.5 4.2 1.3 - - Fines, penalties, interest, and other revenue ..................................... 7.5 7.2 0.2 0.1 - Subtotal .............................................. 2,966.3 1,933.2 955.1 35.8 42.2 Less: amounts collected for ................ non-federal entities ........................... (0.4) Total ................................................ 2,965.9 Federal Tax Refunds Disbursed for the Year Ended September 30, 2013
Tax Year to Which Refunds Relate Refunds Prior (In billions of dollars) Disbursed 2013 2012 2011 Years Individual income tax and tax withholdings ....................................... 320.4 0.7 287.1 21.9 10.7 Corporation income taxes ....................... 41.6 5.4 12.9 6.7 16.6 Excise taxes ............................................ 1.6 0.6 0.8 0.1 0.1 Unemployment taxes ............................... 0.1 - 0.1 - - Customs duties ........................................ 1.2 1.2 - - - Estate and gift taxes ................................ 1.0 - 0.2 0.3 0.5 Total ...................................................... 365.9 7.9 301.1 29.0 27.9

NOTES TO THE FINANCIAL STATEMENTS 111
Note 19. Prior-Period Adjustments
Prior-Period Adjustments for the Year Ended September 30, 2014, and 2013 Changes to Net Position (In billions of dollars) 2014 2013 Prior-period adjustments Department of Justice ........................................................................................ (0.1) (0.3) General Services Administration ....................................................................... - (1.8) Department of the Interior .................................................................................. - (0.5) Other prior-period adjustments .......................................................................... - (0.6) Total prior-period adjustments ........................................................................ (0.1) (3.2)
For fiscal years 2013 and 2014, DOJ applied a change in accounting principle to certain components based on the implementation of their Financial Management Policy Memorandum (FMPM) 13-12, Capitalization of General Property, Plant, and Equipment and Internal Use Software. The primary impact of the policy change was an increase in the thresholds for capitalizing and reporting real property, including leasehold improvements; personal property; and internal use software. The change in accounting principle caused a $0.1 billion and $0.3 billion reduction in the overall PP&E balance for fiscal years 2014 and 2013, respectively.
For fiscal year 2013, GSA and DOI applied a change in accounting principle for the recognition of environmental liabilities related to asbestos, as required by FASAB Technical Bulletin 2006-1. GSA recognized a total asbestos liability of $1.8 billion attributable to prior years’ amortized cost. This was recognized as a prior-period adjustment in fiscal year 2013. The DOI recognized a liability and an adjustment to ending net position for the total estimated asbestos cleanup cost of $0.5 billion. The other prior-period adjustment line includes Department of Commerce, Department of Agriculture, and Department of State reporting. The Departments of Commerce, Agriculture, and State also implemented FASAB Technical Bulletin 2006-1.
As discussed in Note 22 — Funds from Dedicated Collections, five independent agencies were erroneously reported as funds from dedicated collections for fiscal year 2013. In addition, the Patient Centered Outcome Research Trust Fund erroneously did not report as a fund from dedicated collections for fiscal year 2013. These errors were corrected in fiscal year 2014 and resulted in a prior-period adjustment amount of $0.3 billion.

112 NOTES TO THE FINANCIAL STATEMENTS
Note 20. Contingencies
Financial Treatment of Loss Contingencies Loss contingencies that are assessed to be at least reasonably possible are disclosed in this note. Loss contingencies
involve situations where there is an uncertainty of a possible loss. The reporting of loss contingencies depends on the likelihood that a future event or events will confirm the loss or impairment of an asset or the incurrence of a liability. Terms used to assess the range for the likelihood of loss are probable, reasonably possible, and remote. Loss contingencies that are assessed as probable and measurable are accrued in the financial statements. Loss contingencies that are assessed as remote are not reported in the financial statements, nor disclosed in the notes. All other material loss contingencies are disclosed in this note. The following table provides criteria for how federal agencies are to account for loss contingencies, based on the likelihood of the loss and measurability.3
Likelihood of future outflow or other
sacrifice of resources
Loss amount can be reasonably measured
Loss range can be reasonably measured
Loss amount or range cannot be reasonably
measured
Probable Future confirming event(s) are more likely to occur than
not.4
Accrue the liability. Report on Balance
Sheet and Statement of Net Cost.
Accrue liability of the best estimate or (if there
is no best estimate) minimum amount in loss
range, and disclose nature of contingency
and range of estimated liability.
Disclose nature of contingency and include
a statement that an estimate cannot be
made.
Reasonably possible Possibility of future confirming event(s)
occurring is more than remote and less than
likely.
Disclose nature of contingency and
estimated loss amount.
Disclose nature of contingency and
estimated loss range.
Disclose nature of contingency and include
a statement that an estimate cannot be
made.
Remote Possibility of future
event(s) occurring is slight.
No disclosure. No disclosure. No disclosure.
3 In addition, a third condition must be met to be a loss contingency: a past event or an exchange transaction must occur. 4 For loss contingencies related to litigation, probable is defined as the future confirming event or events that are more likely than not to occur, with the exception of pending or threatened litigation and unasserted claims. For the pending or threatened litigation and unasserted claims, the future confirming event or events are likely to occur.
NOTES TO THE FINANCIAL STATEMENTS 113
The Government is subject to loss contingencies that include insurance and litigation cases. These loss contingencies arise in the normal course of operations and their ultimate disposition is unknown. Based on information currently available, however, it is management’s opinion that the expected outcome of these matters, individually or in the aggregate, will not have a material adverse effect on the financial statements, except for the insurance and litigation described in the following section, which could have a material adverse effect on the financial statements.
Insurance Contingencies At the time an insurance policy is issued, a contingency arises. The contingency is the risk of loss assumed by the
insurer, that is, the risk of loss from events that may occur during the term of the policy. The Government has insurance contingencies that are reasonably possible in the amount of $186.4 billion as of September 30, 2014, and $332.8 billion as of September 30, 2013. The major programs are identified below:
PBGC reported $184.4 billion and $328.9 billion as of September 30, 2014, and 2013, respectively, for the estimated aggregate unfunded vested benefits exposure to the PBGC for private-sector single-employer and multi-employer defined benefit pension plans that are classified as a reasonably possible exposure to loss.
FDIC reported $1.7 billion and $3.6 billion as of September 30, 2014, and 2013, respectively, for identified additional risk in the financial services industry that could result in additional loss to the DIF should potentially vulnerable insured institutions ultimately fail. Actual losses, if any, will largely depend on future economic and market conditions.
Deposit Insurance Deposit insurance covers all types of deposit accounts such as checking, Negotiable Order of Withdrawal and savings
accounts, money market deposit accounts, and certificates of deposit received at an insured bank, savings association, or credit union. The insurance covers the balance of each depositor’s account and shares, dollar-for-dollar, up to the insurance limit, including principal and any accrued interest through the date of the insured financial institution’s closing. As a result, the Government has the following exposure from federally-insured financial institutions:
FDIC has estimated insured deposits of $6,131.9 billion as of September 30, 2014, and $5,969.0 billion as of September 30, 2013, for the DIF.
National Credit Union Administration (NCUA) has estimated insured shares of $895.7 billion as of September 30, 2014, and $869.0 billion as of September 30, 2013, for the National Credit Union Share Insurance Fund.

114 NOTES TO THE FINANCIAL STATEMENTS
Legal Contingencies Legal contingencies as of September 30, 2014, and 2013, are summarized in the table below:
2014 2013 Estimated Range of Loss Estimated Range of Loss for Certain Cases 2 for Certain Cases 2 Accrued Accrued (In billions of dollars) Liabilities 1 Lower End Upper End Liabilities 1 Lower End Upper End
Legal contingencies: Probable ....................... 7.1 7.1 8.5 7.2 7.2 9.2 Reasonably possible ..................... - 9.9 13.5 - 9.2 15.1
1 Accrued liabilities are recorded and presented in the related line items of the Balance Sheet. 2 Does not reflect the total range of loss; many cases assessed as reasonably possible of an unfavorable outcome did not include
estimated losses that could be determined.
The Government is party to various administrative claims and legal actions brought against it, some of which may ultimately result in settlements or decisions against the Government.
Management and legal counsel have determined that it is “probable” that some of these actions will result in a loss to the Government and the loss amounts are reasonably measurable. The estimated liabilities for these cases are $7.1 billion and $7.2 billion as of September 30, 2014, and 2013, respectively, and are included in “Other Liabilities” on the Balance Sheet. For example, HHS is subject to various claims and contingencies related to lawsuits. For cases in which payment has been deemed probable and for which the amount of potential liability has been estimated, about $2.9 billion and $2.8 billion has been accrued in the financial statements as of September 30, 2014, and 2013, respectively. The U.S. Supreme Court decision in Salazar v. Ramah Navajo, dated June 18, 2012 is likely to result in increased claims against the Indian Health Service, a component within HHS. Tribes are expected to file claims for prior years and seek to consolidate their claims in a class action lawsuit. It is not clear if these will be filed as administrative cases or filed in Federal District Court. In fiscal year 2014, in DOI’s case of Navajo Nation v. United States, in which an Indian tribe seeks damages relating to management of tribal trust funds and assets, the federal government settled the case for $554 million, an amount representing the largest settlement with a single Indian tribe. The $554 million was not recorded as a liability in fiscal year 2013 as the settlement negotiation was ongoing.
There are also administrative claims and legal actions pending where adverse decisions are considered by management and legal counsel as “reasonably possible” with an estimate of potential loss or a range of potential loss. The estimated potential losses for such claims and actions range from $9.9 billion to $13.5 billion as of September 30, 2014, and from $9.2 billion to $15.1 billion as of September 30, 2013.
Numerous litigation cases are pending where the outcome is uncertain or it is reasonably possible that a loss has been incurred and where estimates cannot be made. There are other litigation cases where the plaintiffs have not made claims for specific dollar amounts, but the settlement may be significant. The ultimate resolution of these legal actions for which the potential loss could not be determined may materially affect the U.S. government’s financial position or operating results. Examples of specific cases are summarized below:
In the case, Starr International Co., Inc. v. United States, the plaintiffs’ principal class claim in this case, filed in the U.S. Court of Federal Claims, arises out of the receipt by the United States of a 79.9 percent equity interest in American International Group, Inc. (AIG) as part of the consideration for the extension of an $85 billion, two-year revolving credit facility to AIG by the Federal Reserve Bank of New York in September 2008 and prior to the passage of the Emergency Economic Stabilization Act of 2008. Plaintiffs claim that the transfer of the equity interest, which was in the form of Series C preferred stock held by a trust for the benefit of the U.S. government, was an illegal exaction under Section 13(3) of the Federal Reserve Act or constituted a taking of AIG shareholders’ property for which just compensation is due under the Fifth Amendment to the United States Constitution. In a separate class claim, plaintiffs allege that an illegal exaction or taking for which just compensation is due occurred when the U.S. government allegedly caused AIG to conduct a reverse

NOTES TO THE FINANCIAL STATEMENTS 115
stock split in June 2009 without a separate class vote of the then outstanding common shareholders. Plaintiffs seek compensatory damages from the Government, including an amount related to the exchange of Series E and F preferred shares for common shares of AIG in January 2011 that were previously held by TARP, which common shareholders allegedly could have blocked had the reverse stock split not occurred. The federal government is unable to determine the likelihood of an unfavorable outcome or make an estimate of potential loss at this time.
Environmental and Disposal Contingencies Environmental and disposal contingencies as of September 30, 2014, and 2013, are summarized in the table below:
2014 2013 Estimated Range of Loss Estimated Range of Loss for Certain Cases 2 for Certain Cases 2 Accrued Accrued (In billions of dollars) Liabilities 1 Lower End Upper End Liabilities 1 Lower End Upper End
Environmental and
disposalcontingencies:
Probable ........................ 23.1 22.9 23.1 24.0 24.0 24.1 Reasonably possible ....................... - 0.7 0.7 - 0.5 0.5
1 Accrued liabilities are recorded and presented in the related line items of the Balance Sheet. 2 Does not reflect the total range of loss; many cases assessed as reasonably possible of an unfavorable outcome did not include estimated losses that could be determined.
The Government is subject to loss contingencies for a variety of environmental cleanup costs for the storage and disposal of hazardous material as well as the operations and closures of facilities at which environmental contamination may be present.
Management and legal counsel have determined that it is “probable” that some of these actions will result in a loss to the Government and the loss amounts are reasonably measurable. The estimated liabilities for these cases are $23.1 billion and $24.0 billion as of September 30, 2014, and 2013, respectively, and are included in “Other Liabilities” on the Balance Sheet. DOE is subject to Spent Nuclear Fuel litigation for damages suffered by all utilities as a result of the delay in beginning disposal of spent nuclear fuel and also damages for alleged exposure to radioactive and/or toxic substances. Significant claims for partial breach of contract and a large number of class action and/or multiple plaintiff tort suits have been filed with estimated liability amounts of $22.6 billion and $21.4 billion as of September 30, 2014, and 2013, respectively.
Other Contingencies
DOT and HHS reported the following other contingencies: The Federal Highway Administration (FHWA) reimburses states for construction costs on projects related to the
Federal Highway System of roads. FHWA has pre-authorized $46.0 billion and $45.9 billion to the states to establish budgets for its construction projects for fiscal years ending September 30, 2014, and 2013, respectively. Congress has not provided appropriations for these projects and no liability is accrued in the DOT consolidated financial statements.
Contingent liabilities have been accrued as a result of Medicaid audit and program disallowances that are currently being appealed by the states and for reimbursement of state plan amendments. The Medicaid amounts are $8.4 billion and $6.1 billion for fiscal years ending September 30, 2014, and 2013, respectively. In all cases, the funds have been returned to HHS. If the appeals are decided in favor of the states, HHS will be required to pay these amounts. In addition, certain amounts for payment have been deferred under the Medicaid program when there is

116 NOTES TO THE FINANCIAL STATEMENTS
reasonable doubt as to the legitimacy of expenditures claimed by a state. There are also outstanding reviews of the state expenditures in which a final determination has not been made.
TreatiesThe U.S. Government is a party to major treaties and other international agreements. These treaties and other
international agreements address various issues including, but not limited to trade, commerce, security, and arms that may involve financial obligations or give rise to possible exposure to losses. A comprehensive analysis to determine any such financial obligations or possible exposure to loss and their related effect on the consolidated financial statements of the U.S. Government has not yet been performed.

NOTES TO THE FINANCIAL STATEMENTS 117
Note 21. Commitments
Long-Term Operating Leases as of September 30, 2014, and 2013 (In billions of dollars) 2014 2013 General Services Administration ....................................................................... 24.4 23.6 U.S. Postal Service ............................................................................................ 6.8 6.7 Department of State .......................................................................................... 1.4 1.3 Department of Health and Human Services ...................................................... 0.9 0.9 Department of Agriculture ................................................................................. 0.8 0.8 Department of Defense ..................................................................................... 0.7 1.3 Department of the Treasury .............................................................................. 0.6 0.7 Other operating leases ...................................................................................... 2.8 4.1 Total long-term operating leases ................................................................... 38.4 39.4
The Government has entered into contractual commitments that require future use of financial resources. It has significant amounts of long-term lease obligations and undelivered orders. Undelivered orders represent the value of goods and services ordered that have not yet been received.
The Government has other commitments that may require future use of financial resources. For example, the Government has callable subscriptions in certain Multilateral Development Banks (MDBs), which are international financial institutions that finance economic and social development projects in developing countries. Callable capital stock shares in the MDBs serve as a supplemental pool of resources that may be redeemed and converted into ordinary paid in shares, if the MDB cannot otherwise meet certain obligations through its other available resources. MDBs are able to use callable capital as backing to obtain very favorable financing terms when borrowing from world capital markets. To date, there has never been a call on this capital for any of the major MDBs and none are anticipated.

118 NOTES TO THE FINANCIAL STATEMENTS
Undelivered Orders and Other Commitments as of September 30, 2014, and 2013 (In billions of dollars) 2014 2013 Undelivered Orders: Department of the Treasury ............................................................................ 164.4 171.3 EOP Foreign Military Sales Program .............................................................. 160.9 153.9 Department of Defense ................................................................................... 136.2 201.8 Department of Education ................................................................................ 130.2 215.6 Department of Health and Human Services ................................................... 110.6 88.4 Department of Transportation ......................................................................... 107.8 101.5 Department of Agriculture ............................................................................... 43.6 46.4 Department of Housing and Urban Development .......................................... 40.7 45.7 Department of Homeland Security ................................................................. 30.4 31.2 Department of Energy ..................................................................................... 25.5 21.8 Department of State ........................................................................................ 19.5 20.0 Agency for International Development ........................................................... 18.6 17.2 Department of Veterans Affairs ...................................................................... 13.9 13.9 Export-Import Bank of the United States ........................................................ 12.6 15.9 National Science Foundation .......................................................................... 11.1 11.2 Department of Labor ....................................................................................... 9.8 9.6 All other agencies ........................................................................................... 27.6 36.8 Total undelivered orders ............................................................................. 1,063.4 1,202.2 Other Commitments: GSE Senior Preferred Stock Purchase Agreement ........................................ 258.1 258.1 Callable Capital Subscriptions for Multilateral Development Banks ............... 102.3 90.8 Agriculture Direct Loans and Guarantees ...................................................... 5.8 5.4 Fuel Purchase Obligations .............................................................................. 5.3 6.3 Power Purchase Obligations .......................................................................... 4.5 4.4 Conservation Reserve Program ..................................................................... 1.7 2.0 Long-term Satellite and Systems .................................................................... 1.5 3.6 All other commitments .................................................................................... 6.0 6.3 Total other commitments ............................................................................. 385.2 376.9

NOTES TO THE FINANCIAL STATEMENTS 119
Other Commitments and Risks
Commitments to GSEs At September 30, 2014, and 2013, the maximum remaining potential commitment to the GSEs for the remaining life of
the SPSPAs was $258.1 billion, which was established on December 31, 2012. Refer to Note 9—Investments in Government-Sponsored Enterprises for a full description of the SPSPA agreements, related commitments, and contingent liability, if any, as well as additional information. Terrorism Risk Insurance Program
The Terrorism Risk Insurance Act of 2002 (TRIA or the Act), which established the Terrorism Risk Insurance Program (Program) first was enacted on November 26, 2002. On January 12, 2015, the Terrorism Risk Insurance Program Reauthorization Act of 2015 (the “Reauthorization Act”), amended the termination date of the Program to December 31, 2020. This program could create claims on government resources in the future. The purpose of the Act is to address market disruptions and ensure the continued widespread availability and affordability of commercial property and casualty insurance for terrorism risk. If the Secretary of the Treasury, in consultation with the Secretary of Homeland Security and the Attorney General, certifies an act as an “act of terrorism,” insurers may be eligible to receive payments from the government partially reimbursing insured losses above a designated deductible amount. The Act also gives Treasury authority to recoup federal payments made under the Program through policyholder surcharges under certain circumstances and contains provisions designed to manage litigation arising from or relating to certified acts of terrorism. The Secretary of the Treasury has never certified an “act of terrorism” under TRIA, and therefore, there have been no payments under the Program.

120 NOTES TO THE FINANCIAL STATEMENTS
Note 22. Funds from Dedicated Collections
Funds from Dedicated Collections as of September 30, 20141
Federal Federal Hospital Supplementary
Federal Insurance Federal Medical All Other Total
Old-Age and Trust Disability Insurance Funds Funds from Survivors Fund Insurance Trust Fund from Dedicated Insurance (Medicare Trust (Medicare Dedicated Collections (In billions of dollars) Trust Fund Part A) Fund Parts B and D) Collections (Combined) Assets: Cash and other monetary assets ............ - - - - 58.0 58.0 Fund balance with Treasury .................. (0.1) 0.7 (0.2) 18.4 119.5 138.3 Investments in U.S. Treasury securities, net of unamortized premiums/discounts ........................... 2,712.8 202.2 70.1 68.4 182.4 3,235.9 Other federal assets .............................. 23.3 32.9 0.8 35.6 16.6 109.2 Non-federal assets ................................. 2.2 1.2 4.2 5.4 112.8 125.8 Total assets ........................................ 2,738.2 237.0 74.9 127.8 489.3 3,667.2
Liabilities and net position: Due and payable to beneficiaries ........... 63.0 25.7 26.0 31.9 2.5 149.1 Other federal liabilities ........................... 4.6 31.0 1.2 36.4 79.8 153.0 Other non-federal liabilities .................... - 0.5 - 2.3 164.7 167.5 Total liabilities ..................................... 67.6 57.2 27.2 70.6 247.0 469.6 Total net position ................................ 2,670.6 179.8 47.7 57.2 242.3 3,197.6 Total liabilities and net position ....... 2,738.2 237.0 74.9 127.8 489.3 3,667.2
Change in net position: Beginning net position ........................... 2,616.3 190.0 79.5 52.7 205.2 3,143.7 Prior-period adjustment ......................... - - - - 0.3 0.3 Beginning net position, adjusted ............ 2,616.3 190.0 79.5 52.7 205.5 3,144.0 Investment revenue ................................ 95.6 8.8 3.7 2.4 3.3 113.8 Individual income taxes .......................... 642.3 227.6 109.1 - - 979.0 Unemployment and excise taxes ........... - - - - 108.9 108.9 Other taxes and receipts ....................... - 9.7 0.1 5.5 35.5 50.8 Miscellaneous earned revenue ............... - - - - 5.0 5.0 Other changes in fund balance (e.g., appropriations, transfers) ................... 18.0 10.5 (1.9) 247.9 25.4 299.9 Program gross cost and non- program expenses ............................... 701.6 270.4 142.8 320.2 177.9 1,612.9 Less: program revenue ...................... - 3.6 - 68.9 36.6 109.1 Net cost ............................................... 701.6 266.8 142.8 251.3 141.3 1,503.8 Ending net position ............................ 2,670.6 179.8 47.7 57.2 242.3 3,197.6
1 By law, certain expenses (costs), revenues, and other financing sources related to the administration of the above funds are not charged to
the funds and are therefore financed and/or credited to other sources.

NOTES TO THE FINANCIAL STATEMENTS 121
Funds from Dedicated Collections as of September 30, 20131
Federal Federal Hospital Supplementary
Federal Insurance Federal Medical All Other Total
Old-Age and Trust Disability Insurance Funds Funds from
Survivors Fund Insurance Trust Fund from Dedicated Insurance (Medicare Trust (Medicare Dedicated Collections (In billions of dollars) Trust Fund Part A) Fund Parts B and D) Collections (Combined) Assets: Cash and other monetary assets .................. - - - - 65.4 65.4 Fund balance with Treasury ......................... (0.3) 2.0 (0.4) 7.5 104.1 112.9 Investments in U.S. Treasury securities, net of unamortized premiums/discounts ................................. 2,655.6 206.0 100.8 67.4 163.8 3,193.6 Other federal assets ..................................... 24.0 30.8 1.1 45.6 17.4 118.9 Non-federal assets........................................ 2.0 - 3.8 - 108.4 114.2 Total assets ............................................. 2,681.3 238.8 105.3 120.5 459.1 3,605.0
Liabilities and net position: Due and payable to beneficiaries ................. 60.1 20.8 24.4 27.8 3.7 136.8 Other federal liabilities .................................. 4.9 27.3 1.4 38.0 89.3 160.9 Other non-federal liabilities ........................... - 0.7 - 2.0 160.9 163.6 Total liabilities ............................................... 65.0 48.8 25.8 67.8 253.9 461.3 Total net position .......................................... 2,616.3 190.0 79.5 52.7 205.2 3,143.7 Total liabilities and net position ............... 2,681.3 238.8 105.3 120.5 459.1 3,605.0
Change in net position: Beginning net position .................................. 2,551.6 212.3 111.3 70.1 202.5 3,147.8 Prior-period adjustment ................................ - - - - 0.9 0.9 Beginning net position, adjusted ................... 2,551.6 212.3 111.3 70.1 203.4 3,148.7 Investment revenue ...................................... 99.1 9.5 5.1 2.4 3.5 119.6 Individual income taxes ............................... 589.4 212.9 100.1 - - 902.4 Unemployment and excise taxes .................. - - - - 106.8 106.8 Other taxes and receipts .............................. - 1.3 0.1 3.4 31.6 36.4 Miscellaneous earned revenue - - - - 4.2 4.2 Other changes in fund balance (e.g., appropriations, transfers) .......................... 43.2 15.4 2.4 213.9 32.7 307.6 Program gross cost and non- program expenses ..................................... 667.0 265.2 139.5 302.6 211.2 1,585.5 Less: program revenue ................................ - 3.8 - 65.5 34.2 103.5 Net cost ..................................................... 667.0 261.4 139.5 237.1 177.0 1,482.0 Ending net position ................................ 2,616.3 190.0 79.5 52.7 205.2 3,143.7 1 By law, certain expenses (costs), revenues, and other financing sources related to the administration of the above funds are not charged to the funds and are therefore financed and/or credited to other sources.
Generally, funds from dedicated collections are financed by specifically identified revenues, often supplemented by other financing sources, provided to the Government by non-federal sources, which remain available over time. These specifically identified revenues and other financing sources are required by statute to be used for designated activities, benefits, or purposes and must be accounted for separately from the Government’s general revenues. Funds from dedicated collections generally include trust funds, public enterprise revolving funds (not including credit reform financing funds), and special funds. Funds from dedicated collections specifically exclude any fund established to account for pensions, other

122 NOTES TO THE FINANCIAL STATEMENTS
retirement benefits, other postemployment or other benefits provided for federal employees (civilian and military). In the federal budget, the term “trust fund” means only that the law requires a particular fund be accounted for separately, used only for a specified purpose, and designated as a trust fund. A change in law may change the future receipts and the terms under which the fund’s resources are spent. In the private sector, trust fund refers to funds of one party held and managed by a second party (the trustee) in a fiduciary capacity. The activity of funds from dedicated collections differs from fiduciary activities primarily in that assets within funds from dedicated collections are government-owned. For further information related to fiduciary activities, see Note 23—Fiduciary Activities.
Public enterprise revolving funds include expenditure accounts authorized by law to be credited with offsetting collections, mostly from the public, that are generated by and dedicated to finance a continuing cycle of business-type operations. Some of the financing for these funds may be from appropriations.
Special funds are federal funds dedicated by law for a specific purpose. Special funds include the special fund receipt account and the special fund expenditure account.
The tables above depict major funds from dedicated collections chosen based on their significant financial activity and importance to taxpayers. All other government funds from dedicated collections not shown separately are aggregated as “all other.”
Total assets represent the unexpended balance from all sources of receipts and amounts due to the funds from dedicated collections, regardless of source, including related governmental transactions. These are transactions between two different entities within the Government (for example, monies received by one entity of the Government from another entity of the Government).
The intragovernmental assets are comprised of fund balances with Treasury, investments in Treasury securities-including unamortized amounts, and other assets that include the related accrued interest receivable on federal investments. These amounts were eliminated in preparing the principal financial statements.
The non-federal assets represent only the activity with individuals and organizations outside of the Government. Most of the assets within funds from dedicated collections are invested in intragovernmental debt holdings. The
Government does not set aside assets to pay future benefits or other expenditures associated with funds from dedicated collections. The cash receipts collected from the public for funds from dedicated collections are deposited in the U.S. Treasury, which uses the cash for general government purposes. Treasury securities are issued to federal agencies as evidence of its receipts. Treasury securities are an asset to the federal agencies and a liability to the U.S. Treasury and, therefore, they do not represent an asset or a liability in the Financial Report. These securities require redemption if a fund’s disbursements exceeds its receipts. Redeeming these securities will increase the government’s financing needs and require more borrowing from the public (or less repayment of debt), or will result in higher taxes than otherwise would have been needed, or less spending on other programs than otherwise would have occurred, or some combination thereof. See Note 12—Federal Debt Securities Held by the Public and Accrued Interest for further information related to the investments in federal debt securities.
Depicted below is a description of the major funds from dedicated collections shown in the above tables, which also identifies the government agencies that administer each particular fund. For detailed information regarding these funds from dedicated collections, please refer to the financial statements of the corresponding administering agencies. For information on the benefits due and payable liability associated with certain funds from dedicated collections, see Note 15—Benefits Due and Payable.
Federal Old-Age and Survivors Insurance Trust Fund The Federal Old-Age and Survivors Insurance Trust Fund, administered by the SSA, provides retirement and survivors
benefits to qualified workers and their families. Payroll and self-employment taxes primarily fund the Federal Old-Age and Survivors Insurance Trust Fund. Interest
earnings on Treasury securities, federal agencies’ payments for the Social Security benefits earned by military and federal civilian employees, and Treasury payments for a portion of income taxes collected on Social Security benefits provide the fund with additional income. The law establishing the Federal Old-Age and Survivors Insurance Trust Fund and authorizing the depositing of amounts to the credit of the fund is set forth in 42 U.S.C. § 401.

NOTES TO THE FINANCIAL STATEMENTS 123
Federal Hospital Insurance Trust Fund (Medicare Part A)
The Federal Hospital Insurance Trust Fund, administered by HHS, finances the Hospital Insurance Program (Medicare Part A). This program funds the cost of inpatient hospital and related care for individuals age 65 or older who meet certain insured status requirements, and eligible disabled people.
The Federal Hospital Insurance Trust Fund is financed primarily by payroll taxes, including those paid by federal agencies. It also receives income from interest earnings on Treasury securities and a portion of income taxes collected on Social Security benefits. Section 1817 of the Social Security Act established the Medicare Hospital Trust Fund.
Federal Disability Insurance Trust Fund The Federal Disability Insurance Trust Fund provides financial assistance and protection against the loss of earnings
due to a wage earner’s disability. The SSA administers this fund. Like the Federal Old-Age and Survivors Insurance Trust Fund, payroll taxes primarily fund the Federal Disability
Insurance Trust Fund. The fund also receives income from interest earnings on Treasury securities, federal agencies’ payments for the Social Security benefits earned by military and federal civilian employees, and a portion of income taxes collected on Social Security benefits. The law establishing the Federal Disability Insurance Trust Fund and authorizing the depositing of amounts to the credit of the fund is set forth in 42 U.S.C. § 401.
Federal Supplementary Medical Insurance Trust Fund (Medicare Parts B and D)
The Federal Supplementary Medical Insurance Trust Fund, administered by HHS, finances the Supplementary Medical Insurance Program (Medicare Part B) and the Medicare Prescription Drug Benefit Program (Medicare Part D). These programs provide supplementary medical insurance for enrolled eligible participants to cover physician and outpatient services not covered by Medicare Part A and to obtain qualified prescription drug coverage, respectively. Medicare Part B financing is not based on payroll taxes; it is primarily based on monthly premiums, income from the General Fund of the Treasury, and interest earnings on Treasury securities. Medicare Supplementary Medical Insurance Trust Fund was established by Section 1841 of the Social Security Act.
Medicare Part D was created by the Medicare Prescription Drug, Improvement, and Modernization Act of 2003 (Public Law No. 108-173). Medicare Part D financing is similar to Part B; it is primarily based on monthly premiums and income from the General Fund of the Treasury, not on payroll taxes. The fund also receives transfers from States. The law creating the Medicare prescription drug account within the Federal Supplementary Medical Insurance Trust Fund and authorizing the depositing of amounts to the credit of the fund is set forth in 42 U.S.C. § 1395w-116.
All Other Funds from Dedicated Collections The Government is responsible for the management of numerous funds from dedicated collections that serve a wide
variety of purposes. The funds from dedicated collections presented on an individual basis in the above tables represent the majority of the Government’s net position attributable to funds from dedicated collections. All other activity attributable to funds from dedicated collections is aggregated in accordance with SFFAS No. 27, as amended by SFFAS No. 43. For the years ending September 30, 2014, and 2013, there were approximately 641 and 648 funds from dedicated collections, respectively. The funds from dedicated collections within the “all other” aggregate, along with the agencies that administer them, include the following:
Exchange Stabilization Fund—administered by Treasury. Land and Water Conservation Fund, Reclamation Fund, and Water and Related Resources Fund—administered
by DOI. Railroad Retirement Trust Fund—administered by RRB.

124 NOTES TO THE FINANCIAL STATEMENTS
National Flood Insurance Program—administered by DHS. Highway Trust Fund and Airport and Airway Trust Fund—administered by DOT. Government National Mortgage Association—administered by HUD. Decommissioning and Decontamination Fund—administered by DOE. Crime Victims Fund—administered by DOJ. Harbor Maintenance Trust Fund—administered by DOD. Unemployment Trust Fund (UTF) and Black Lung Disability Trust Fund (BLDTF)—administered by DOL.
In accordance with SFFAS No. 43, any funds established to account for pension, other retirement, or other post-employment benefits to civilian or military personnel are excluded from the reporting requirements related to funds from dedicated collections.
Five independent agencies were erroneously reported as funds from dedicated collections for fiscal year 2013. In addition, the Patient Centered Outcome Research Trust Fund erroneously did not report as a fund from dedicated collections for fiscal year 2013. These errors were corrected in fiscal year 2014 and resulted in a prior-period adjustment of $0.3 billion.
Unemployment and Excise Taxes Unemployment Taxes The Unemployment Trust Fund (UTF), within the “all other” aggregate, represents all the unemployment tax revenues attributable to funds from dedicated collections shown on the consolidated Statement of Operations and Changes in Net Position. UTF provides temporary assistance to workers who lose their jobs. The program is administered through a unique system of federal and state partnerships, established in federal law, but executed through conforming state laws by state officials. DOL administers the federal operations of the program. ........ Employer taxes provide the primary funding source for the UTF and constitute all the unemployment tax revenues attributable to funds from dedicated collections as shown on the consolidated Statement of Operations and Changes in Net Position. However, interest earnings on Treasury securities also provide income to the fund. For the years ending September 30, 2014, and 2013, UTF unemployment tax revenues were $52.6 billion and $54.0 billion, respectively. Appropriations have supplemented the fund’s income during periods of high and extended unemployment. UTF was established under the authority of Section 904 of the Social Security Act of 1935.
Excise Taxes There are 11 funds from dedicated collections within the “all other” aggregate that represent all of the dedicated excise
tax revenue attributable to funds from dedicated collections shown on the consolidated Statement of Operations and Changes in Net Position. The Highway Trust Fund and the Airport and Airway Trust Fund, combined, represent more than 90 percent of all dedicated excise tax revenues. Both of these funds are administered by the DOT. For more information, please refer to DOT’s financial statements.
The Highway Trust Fund was established to promote domestic interstate transportation and to move people and goods. The fund provides federal grants to states for highway construction, certain transit programs, and related transportation purposes. The Highway Trust Fund was created by the Highway Revenue Act of 1956. Funding sources include designated excise taxes on gasoline and other fuels, certain tires, the initial sale of heavy trucks, and highway use by commercial motor vehicles. For the years ending September 30, 2014, and 2013, Highway Trust Fund excise tax revenues were $39.0 billion and $36.5 billion, respectively. As funds are needed for payments, the Highway Trust Fund corpus investments are liquidated and funds are transferred to the Federal Highway Administration, the Federal Transit Administration, or other DOT entities, for payment of obligations.
The Airport and Airway Trust Fund provides for airport improvement and airport facilities maintenance. It also funds airport equipment, research, and a portion of the Federal Aviation Administration’s administrative operational support. The Airport and Airway Trust Fund was authorized by the Airport and Airway Revenue Act of 1970. Funding sources include:
Taxes received from transportation of persons and property in the air, as well as fuel used in commercial and general aviation.
International departure taxes. Interest earnings on Treasury securities.
For the years ending September 30, 2014, and 2013, Airport and Airway Trust Fund excise tax revenues were $13.5 billion and $12.9 billion, respectively.

NOTES TO THE FINANCIAL STATEMENTS 125
Miscellaneous Earned Revenues Miscellaneous earned revenues due to activity attributable to funds from dedicated collections primarily relate to
royalties retained by various funds within DOI.

126 NOTES TO THE FINANCIAL STATEMENTS
Note 23. Fiduciary Activities
Fiduciary activities are the collection or receipt, and the management, protection, accounting, investment, and disposition by the Government of cash or other assets in which non-federal individuals or entities have an ownership interest that the Government must uphold. Fiduciary cash and other assets are not assets of the Government and accordingly are not recognized on the consolidated Balance Sheet. Examples of the Government’s fiduciary activities include the Thrift Savings Plan (the Plan), which is administered by the Federal Retirement Thrift Investment Board, and the Indian Tribal and individual Indian Trust Funds, which are administered by the DOI. Schedule of Fiduciary Net Assets as of September 30, 2014, and 2013 (In billions of dollars) 2014 2013
FRTIB-Thrift Savings Plan ................................................................................. 416.1 374.3 Department of the Interior ................................................................................. 5.1 4.7 All other ............................................................................................................. 5.9 (0.4) Total fiduciary net assets ................................................................................ 427.1 378.6
In accordance with the requirements of SFFAS No. 31, Accounting for Fiduciary Activities, fiduciary investments in Treasury securities and fund balance with Treasury held by fiduciary funds are to be recognized on the Balance Sheet as debt held by the public and a liability for fiduciary fund balance with Treasury, respectively. Refer to Note 12—Federal Debt Securities Held by the Public and Accrued Interest for more information on Treasury securities.
As of September 30, 2014, total fiduciary investments in Treasury securities and in non-Treasury securities are $187.1 billion and $241.9 billion, respectively. As of September 30, 2013, total fiduciary investments in Treasury securities and in non-Treasury securities were $176.8 billion and $206.0 billion, respectively. As of September 30, 2014, and 2013, the total fiduciary fund balance with Treasury is $1.0 billion and $1.1 billion, respectively. A liability for this fiduciary fund balance with Treasury is reflected as other miscellaneous liabilities in Note 17—Other Liabilities.
As of September 30, 2014, and 2013, collectively, the fiduciary investments in Treasury securities and fiduciary fund balance with Treasury held by all Government entities represent $3.4 billion and $4.0 billion, respectively, of unrestricted cash included within cash held by Treasury for Governmentwide Operations shown in Note 2—Cash and Other Monetary Assets.
Federal Retirement Thrift Investment Board (FRTIB)-Thrift Savings Plan
The TSP is administered by an independent Government agency, the FRTIB, which is charged with operating the TSP prudently and solely in the interest of the participants and their beneficiaries. Assets of the TSP are maintained in the Thrift Savings Fund.
The TSP is a retirement savings and investment plan for federal employees and members of the uniformed services. It was authorized by the United States Congress in the Federal Employees’ Retirement System Act of 1986. The Plan provides federal employees and members of the uniformed services with a savings and tax benefit similar to what many private sector employers offer their employees. The Plan was primarily designed to be a key part of the retirement package (along with a basic annuity benefit and Social Security) for employees who are covered by FERS.
Federal employees, who are participants of FERS, the CSRS, or equivalent retirement systems, as provided by statute, and members of the uniformed services, are eligible to join the Plan immediately upon being hired. Generally, FERS employees are those employees hired on or after January 1, 1984, while CSRS employees are employees hired before January 1, 1984, who have not elected to convert to FERS. Each group has different rules that govern contribution rates. As of December 31, 2013, and 2012, there were approximately 4.6 million participants in the TSP, with approximately 2.9 million contributing their own money. For further information about FRTIB and the TSP, please refer to the FRTIB website at http://www.frtib.gov.

NOTES TO THE FINANCIAL STATEMENTS 127
As of September 30, 2014, and 2013, the TSP held $416.1 billion and $374.3 billion, respectively, in net assets, which included $183.7 billion and $52.5 billion, respectively, of U.S. Government Securities (amounts are unaudited). The most recent audited financial statements for the TSP are as of December 31, 2013, and 2012. As of December 31, 2013, and 2012, the TSP held $394.5 billion and $334.9 billion, respectively, in net assets, which included $172.7 billion and $158.5 billion, respectively, of U.S. Government Securities. These unaudited amounts above are included to enhance comparability of the TSP net assets with the remainder of the Government’s fiduciary net assets as of September 30, 2014, and 2013. The increase from fiscal year 2013 to fiscal year 2014 was due to debt suspension in fiscal year 2013 as discussed in the Intragovernmental Section of Note 12 — Federal Debt Securities Held by the Public.
DOI–Indian Trust Funds As stated above, DOI has responsibility for the assets held in trust on behalf of American Indian Tribes and individuals,
and these account for all of DOI’s fiduciary net assets. DOI maintains accounts for Tribal and Other Trust Funds (including the Alaska Native Escrow Fund and Individual Indian Money Trust Funds) in accordance with the American Indian Trust Fund Management Reform Act of 1994. The fiduciary balances that have accumulated in these funds have resulted from land use agreements, royalties on natural resource depletion, other proceeds derived directly from trust resources, judgment awards, settlements of claims, and investment income. These funds are maintained for the benefit of individual Native Americans as well as for designated Indian tribes. DOI maintains separate financial statements for these trust funds which were prepared using the cash or modified cash basis of accounting, a comprehensive basis of accounting other than GAAP. The independent auditors’ reports were qualified as it was not practical to extend audit procedures sufficiently to satisfy themselves as to the fairness of the trust fund balances. For further information related to these assets, see the financial statements of the DOI.
All Other Entities with Fiduciary Activities The Government is responsible for the management of other fiduciary net assets on behalf of various non-federal
entities. The component entities presented individually in the table on the previous page represent the vast majority of the Government’s fiduciary net assets. All other component entities with fiduciary net assets are aggregated in accordance with SFFAS No. 31. As of September 30, 2014, and 2013, including FRTIB and DOI, there are a total of 15 and 20 federal entities, respectively, with fiduciary activities at a grand total of 50 and 66 fiduciary funds, respectively. SBA and LOC are the significant agencies relating to the fiduciary activities of the remaining component entities within the “all other” aggregate balance. As of September 30, 2014, “all other” fiduciary net assets were $0.8 billion, compared to $(0.4) billion as of September 30, 2013.

128 NOTES TO THE FINANCIAL STATEMENTS
Note 24. Social Insurance
The Statement of Social Insurance presents the projected actuarial present value of the estimated future revenue and estimated future expenditures of the Social Security, Medicare, Railroad Retirement, and Black Lung social insurance programs which are administered by the SSA, HHS, RRB, and DOL, respectively. These estimates are based on the economic as well as demographic assumptions presented later in this note as set forth in the relevant Social Security and Medicare trustees’ reports and in the agency financial reports of HHS, SSA, and DOL as well as in the relevant agency performance and accountability report for RRB. The projections are based on the continuation of program provisions contained in current law, with exceptions in regard to (1) the sustainable growth rate formula for physician fee schedule payment under Medicare Part B, which is further described in the next paragraph, and (2) payment reductions that would result from the projected depletion of the Social Security and Medicare Hospital Insurance (Part A) trust funds; under current law, payments would be reduced to levels that could be covered by tax revenues when the Social Security and Medicare Hospital Insurance (Part A) trust funds are depleted. The estimates in the consolidated SOSI of the open group measures are for persons who are participants or eventually will participate in the programs as contributors (workers) or beneficiaries (retired workers, survivors, and disabled) during the 75-year projection period (Black Lung is projected only through September 30, 2040, because the program will terminate on that date).
Contributions and dedicated taxes consist of payroll taxes from employers, employees, and self-employed persons; revenue from federal income taxation of Old-Age Survivors and Disability Insurance (OASDI) and railroad retirement benefits; excise tax on coal (Black Lung); premiums from, and state transfers on behalf of, participants in Medicare; and reimbursements from the General Fund of the Treasury to the OASDI trust funds to make up for reductions in payroll tax revenue due to temporary payroll tax rate reductions. Income for all programs is presented from a consolidated perspective. Future interest payments and other future intragovernmental transfers have been excluded upon consolidation. Expenditures include scheduled benefit payments and administrative expenses. Scheduled benefits are projected based on the benefit formulas under current law, with an exception in regard to the Sustainable Growth Rate (SGR) formula for physician fee schedule payment under Medicare Part B. Current law requires a reduction in Medicare payment rates for physician services of 21 percent in April 2015. It is a virtual certainty that lawmakers will override the required reduction in Medicare physician payment rates as they have for every year beginning with 2003. For this reason, the income, expenditures, and assets for Part B reflect a projected baseline, which includes an override of the provisions of the SGR and an assumed annual increase in the physician fee schedule equal to the average SGR override over the 10-year period ending March 31, 2015. Current Social Security and Medicare law also provides for full benefit payments only to the extent that there are sufficient balances in the trust funds. Expenditures reflect full benefit payments even after the point at which assets are projected to be depleted.
Actuarial present values of estimated future income (excluding interest) and estimated future expenditures for the Social Security, Medicare, and Railroad Retirement social insurance programs are presented for three different groups of participants: (1) current participants who have not yet attained eligibility age; (2) current participants who have attained eligibility age; and (3) new entrants, who are expected to become participants in the future. Current participants in the Social Security and Medicare programs are the “closed group” of taxpayers and/or beneficiaries who are at least age 15 years at the start of the projection period. Since the projection period for the Social Security, Medicare, and Railroad Retirement social insurance programs consists of 75 years, the period covers virtually all of the current participants’ working and retirement years, a period that could be greater than 75 years in a relatively small number of instances. Future participants for Social Security and Medicare include births during the projection period and individuals below age 15 as of January 1 of the valuation year. Railroad Retirement’s future participants are the projected new entrants as of January 1 of the valuation year.
The present values of future expenditures in excess of future revenue are calculated by subtracting the actuarial present values of future scheduled contributions as well as dedicated tax income by and on behalf of current and future participants from the actuarial present value of the future scheduled benefit payments to them or on their behalf. To determine a program’s funding shortfall over any given period of time, the starting trust fund balance is subtracted from the present value of expenditures in excess of revenues over the period.

NOTES TO THE FINANCIAL STATEMENTS 129
The trust fund balances as of the valuation date for the respective programs, including interest earned, are shown in the table below. Substantially all of the Social Security (OASDI), Medicare Hospital Insurance (HI), and Supplementary Medical Insurance (SMI) trust fund balances consist of investments in special nonmarketable U.S. Treasury securities that are backed by the full faith and credit of the U.S. Government.
Social Insurance Programs Trust Fund Balances 1
(In billions of dollars) 2014 2013 2012 2011 2010
Social Security ...................................... 2,764 2,732 2,678 2,609 2,540 Medicare ............................................... HI ........................................................ 205 220 244 272 304 SMI Part B ........................................... 74 66 80 71 76 SMI Part D .......................................... 1 1 1 1 1 Railroad Retirement .............................. 28 26 24 26 25 Black Lung ............................................ (6) (6) (6) (6) (6) 1 As of the valuation date of the respective programs.
Social Security The Old-Age and Survivors Insurance (OASI) program, created in 1935, and the Disability Insurance (DI) program,
created in 1956, collectively referred to as OASDI or “Social Security,” provides cash benefits for eligible U.S. citizens and residents. Eligibility and benefit amounts are determined under the laws applicable for the period. Current law provides that the amount of the monthly benefit payments for workers, or their eligible dependents or survivors, is based on the workers’ lifetime earnings histories.
The primary financing of the OASDI Trust Funds are taxes paid by workers, their employers, and individuals with self-employment income, based on work covered by the OASDI Program. Refer to the Unaudited Required Supplementary Information—Social Insurance section for additional information on Social Security program financing.
That portion of each trust fund not required to pay benefits and administrative costs is invested, on a daily basis, in interest-bearing obligations of the U.S. Government. The Social Security Act authorizes the issuance by the Treasury of special nonmarketable, intragovernmental debt obligations for purchase exclusively by the trust funds. Although the special issues cannot be bought or sold in the open market, they are redeemable at any time at face value and thus bear no risk of fluctuation in principal value due to changes in market yield rates. Interest on the bonds is credited to the trust funds and becomes an asset to the funds and a liability to the General Fund of the Treasury. These Treasury securities and related interest are eliminated in consolidation at the governmentwide level.
MedicareThe Medicare Program, created in 1965, has two separate trust funds: the HI (Medicare Part A) and SMI (Medicare
Parts B and D) Trust Funds. HI pays for inpatient acute hospital services and major alternatives to hospitals (skilled nursing services, for example), and SMI pays for hospital outpatient services, physician services, and assorted other services and products through the Part B account and pays for prescription drugs through the Part D account. Though the events that trigger benefit payments are similar, HI and SMI have different dedicated financing structures. Similar to OASDI, HI is financed primarily by payroll contributions. Other income to the HI Trust Fund includes a small amount of premium income from voluntary enrollees, a portion of the federal income taxes that beneficiaries pay on Social Security benefits and interest credited on Treasury securities held in the HI Trust Fund. These Treasury securities and related interest are eliminated in the consolidation at the governmentwide level.

130 NOTES TO THE FINANCIAL STATEMENTS
For SMI, transfers from the General Fund of the Treasury represent the largest source of income for both Parts B and D. Generally, beneficiaries finance the remainder of Parts B and D costs via monthly premiums to these programs. With the introduction of Part D drug coverage, Medicaid is no longer the primary payer for beneficiaries dually eligible for Medicare and Medicaid. For those beneficiaries, states must pay a portion of their estimated foregone drug costs into the Part D account (referred to as state transfers). As with HI, interest received on Treasury securities held in the SMI Trust Fund is credited to the fund and these Treasury securities as well as related interest are eliminated in consolidation at the governmentwide level. By accounting convention, the transfers of general revenues are eliminated in the consolidation of the SOSI at the governmentwide level and as such, the general revenues that are used to finance Medicare Parts B and D are not included in these calculations even though the expenditures on these programs are included. For the fiscal year 2014 and 2013 SOSI, the amounts eliminated totaled $24.7 trillion and $22.5 trillion, respectively. Refer to Unaudited Required Supplementary Information—Social Insurance section for additional information on Medicare program financing.
The Medicare Prescription Drug, Improvement, and Modernization Act (MMA), enacted on December 8, 2003, created the Part D account in the SMI Trust Fund to account for the prescription drug benefit that began in 2006. The MMA established within SMI two Part D accounts related to prescription drug benefits: the Medicare Prescription Drug Account and the Transitional Assistance Account. The Medicare Prescription Drug Account was used in conjunction with the broad, voluntary prescription drug benefits that commenced in 2006. The Transitional Assistance Account was used to provide transitional assistance benefits, beginning in 2004 and extending through 2005, for certain low-income beneficiaries prior to the start of the new prescription drug benefit.
Affordable Care Act (ACA) The financial projections for the Medicare program reflect substantial, but very uncertain, cost savings deriving from
provisions of the ACA. However, it is important to note that the improved results for HI and SMI Part B since 2010 depend in part on the long-range feasibility of the various cost-saving measures in the ACA–in particular, the lower increases in Medicare payment rates to most categories of health care providers. Under the ACA, the rate of increase of Medicare payment rates is equal to the prior law rate of increase (equal to the rate of increase in the prices of inputs used to produce Medicare services) less the rate of increase of total economy multifactor productivity. Without fundamental change in the current delivery system, these productivity-related adjustments to Medicare payment rates would probably not be viable indefinitely. It is possible that health care providers could improve their productivity, reduce wasteful expenditures, and take other steps to keep their cost growth within the bounds imposed by the Medicare price limitations. For such efforts to be successful in the long range, providers would have to generate and sustain unprecedented levels of productivity gains–a very challenging and uncertain prospect.
A transformation of health care in the United States, affecting both the means of delivery and the method of paying for care, is also a possibility. The ACA takes important steps in this direction by initiating programs of research into innovative payment and service delivery models, such as accountable care organizations, patient-centered medical homes, improvement in care coordination for individuals with multiple chronic health conditions, improvement in coordination of post-acute care, payment bundling, pay for performance, and assistance for individuals in making informed health choices. If researchers and policy makers can demonstrate that the new approaches developed through these initiatives will improve the quality of health care and/or reduce costs, then the Secretary of HHS can adopt them for Medicare without further legislation. Such changes have the potential to reduce health care costs as well as cost growth rates and could, as a result, help lower Medicare cost growth rates to levels compatible with the lower price updates payable under current law.
The ability of new delivery and payment methods to significantly lower cost growth rates is uncertain at this time, since specific changes have not yet been designed, tested, or evaluated. Hopes for success are high, but at this time there is insufficient evidence to support an assumption that improvements in efficiency can occur of the magnitude needed to align with the statutory Medicare price updates. The ability of health care providers to sustain these productivity-related adjustments will be challenging, as the best available evidence indicates that most providers cannot improve their productivity to this degree for a prolonged period given the labor-intensive nature of these services. As a result, actual Medicare expenditures are highly uncertain for reasons apart from the inherent difficulty in projecting health care cost growth over time.
The reduction in provider payment updates, if implemented for all future years as required under current law, could have secondary impacts on provider participation, beneficiary access to care; quality of services; and other factors. These possible impacts are very speculative and at present there is no consensus among experts as to their potential scope. Further research and analysis will help to better inform this issue and may enable the development of specific projections of secondary effects under current law in the future.
The SOSI projections are based on current law, with exceptions in regard to (1) the sustainable growth rate (SGR) formula for physician fee schedule payment under Part B, where current law requires a reduction in Medicare payment rates for physician services of 21 percent in April 2015, and (2) payment reductions that would result from the projected depletion
NOTES TO THE FINANCIAL STATEMENTS 131
of the Medicare Hospital Insurance (Part A) trust fund; under current law, payments would be reduced to levels that could be covered by tax revenues when the Medicare Hospital Insurance (Part A) trust funds are depleted. It is a virtual certainty that lawmakers will override the required reduction in Medicare physician payment rates as they have for every year beginning with 2003. For this reason, the income, expenditures, and assets for Part B reflect a projected baseline, which includes an override of the provisions of the SGR and an assumed annual increase in the physician fee schedule equal to the average SGR override over the 10-year period ending with March 31, 2015.
The extent to which actual future Part A and Part B costs exceed the projected amounts due to changes to the productivity adjustments depends on what specific changes might be legislated and whether Congress would pass further provisions to help offset such costs. However, absent an unprecedented change in health care delivery systems and payment mechanisms, the prices paid by Medicare for health services will fall increasingly short of the costs of providing these services. By the end of the long-range projection period, Medicare prices for many services would be less than half of their level without consideration of the productivity price reductions. Before such an outcome would occur, lawmakers would likely intervene to prevent the withdrawal of providers from the Medicare market and the severe problems with beneficiary access to care that would result. Overriding the productivity adjustments, as lawmakers have done repeatedly in the case of physician payment rates, would lead to substantially higher costs for Medicare in the long range than those projected in this report. As noted, these examples reflect only hypothetical changes to provider payment rates.
To help illustrate and quantify the potential magnitude of the cost understatement, the Trustees asked the Office of the Actuary at CMS to prepare an illustrative Medicare trust fund projection under a hypothetical alternative that assumes that, starting in 2020, the economy-wide productivity adjustments gradually phase down to 0.4 percent. This alternative was developed for illustrative purposes only; the calculations have not been audited; no endorsement of the policies underlying the illustrative alternative by the Trustees, CMS, or the Office of the Actuary should be inferred; and the examples do not attempt to portray likely or recommended future outcomes. Thus, the illustrations are useful only as general indicators of the substantial impacts that could result from future legislation affecting the productivity adjustments under Medicare and of the broad range of uncertainty associated with such impacts. The table below contains a comparison of the Medicare 75-year present values of estimated future income and estimated future expenditures under the projected baseline with those under current law—including the 21 percent scheduled reduction in physician payment rates under the SGR formula—and the illustrative alternative scenario.

132 NOTES TO THE FINANCIAL STATEMENTS
Medicare Present Values (in billions) (Unaudited)
2014 Consolidated 2014 Consolidated Illustrative SOSI SOSI Alternative Projected Baseline Current Law Scenario 1, 2
Income Part A ..................................................... $16,542 $16,542 $16,550 Part B 3 ................................................... $6,456 $5,797 $7,249 Part D 4 ................................................... $2,508 $2,512 $2,542 Total Income ...................................... $25,506 $24,851 $26,341
Expenditures Part A .................................................... $20,365 $20,396 $24,848 Part B .................................................... $24,311 $21,847 $27,286 Part D .................................................... $9,312 $9,327 $9,440 Total Expenditures .............................. $53,988 $51,570 $61,574
Part A ...................................................... $3,823 $3,854 $8,297 Part B ....................................................... $17,856 $16,050 $20,037 Part D ...................................................... $6,804 $6,815 $6,898 Excess of Expenditures over Income $28,483 $26,719 $35,232
1These amounts are not presented in the 2014 Trustees' Report. 2At the request of the Trustees, the Office of the Actuary at CMS has prepared an illustrative set of Medicare Trust Fund projections that differ from current law. No endorsement of the illustrative alternative to current law by the Trustees, CMS, or the Office of the Actuary should be inferred. 3Excludes $17,856 billion, $16,050 billion, and $20,037 billion of General Revenue Contributions from the 2014 Consolidated SOSI Projected Baseline projection, the 2014 Consolidated SOSI Current Law projection, and the Illustrative Alternative Scenario's projection, respectively; i.e., to reflect Part B income on a consolidated governmentwide basis. 4Excludes $6,804 billion, $6,815 billion, and $6,898 billion of General Revenue Contributions from the 2014 Consolidated SOSI Projected Baseline projection, the 2014 Consolidated SOSI Current Law projection, and the Illustrative Alternative Scenario's projection, respectively; i.e., to reflect Part D income on a consolidated governmentwide basis.
Note: Amounts may not add up due to rounding.

NOTES TO THE FINANCIAL STATEMENTS 133
As expected, the projected baseline and current-law projections differ most markedly for Part B, since the physician fee reductions do not affect Part A and Part D directly. The present values of estimated future income and expenditures under current law are roughly 10 percent lower than under the projected baseline projections. The difference between the projected baseline and illustrative alternative projections is substantial for Parts A and B. All Part A fee-for-service providers and roughly half of Part B fee-for-service providers are affected by the productivity adjustments, so the projected baseline and current-law projections reflect an estimated 1.1 percent reduction in annual cost growth each year. If the productivity adjustments were gradually phased out, as illustrated under the alternative scenario, the estimated present value of Part A and Part B expenditures would be higher than the projected baseline projections by roughly 22 percent and 12 percent, respectively. As indicated above, the present value of Part A income is basically unaffected under the alternative scenario; and the present value of Part B income is also 12 percent higher under the illustrative alternative scenario, since income is set each year to mirror expenditures.
The Part D values are similar under each projection because the services are not affected by the productivity adjustments or the physician fee schedule reductions. The very minor impact is the result of a slight change in the discount rates that are used to calculate the present values.
Social Security and Medicare–Demographic and Economic Assumptions The Boards of Trustees5 of the OASDI and Medicare Trust Funds provide in their annual reports to Congress short-
range (10-year) and long-range (75-year) actuarial estimates of each trust fund. Because of the inherent uncertainty in estimates for 75 years into the future, the Boards use three alternative sets of economic and demographic assumptions to show a range of possibilities. Assumptions are made about many economic and demographic factors, including Gross Domestic Product (GDP)6, disability incidence and terminations, earnings, the Consumer Price Index (CPI), the unemployment rate, the fertility rate, immigration, mortality, and for the Medicare projections health care cost growth. The assumptions used for the most recent set of projections shown in Table 1A (Social Security) and Table 1B (Medicare) are generally referred to as the “intermediate assumptions,” and reflect the trustees’ reasonable estimate of expected future experience. For further information on Social Security and Medicare demographic and economic assumptions, refer to SSA’s and HHS’ Agency Financial Reports.
5 There are six trustees: the Secretaries of the Treasury (managing trustee), Health and Human Services, and Labor; the Commissioner of the Social Security Administration, and two public trustees who are generally appointed by the President and confirmed by the Senate for a 4-year term. By law, the public trustees are members of two different political parties. 6In July 2013, the Bureau of Economic Analysis (BEA) revised upward the historical values for GDP beginning with estimates for 1929.

134 NOTES TO THE FINANCIAL STATEMENTS
Table 1ASocial Security – Demographic and Economic Assumptions
Demographic Assumptions
Age-Sex Adjusted
Death Rate
(per 100,000)2
Net Annual Immigration(persons per
year)3
Period LifeExpectancy
at Birth4Total Fertility Rate1Year Male Female
2014 1.91 779.8 1,345,000 76.7 81.4 2020 2.06 730.2 1,345,000 77.6 82.1 2030 2.03 667.6 1,155,000 78.8 83.1 2040 2.00 614.6 1,100,000 79.9 84.0 2050 2.00 568.1 1,080,000 80.9 84.8 2060 2.00 527.1 1,070,000 81.8 85.5 2070 2.00 490.8 1,065,000 82.7 86.2 2080 2.00 458.4 1,060,000 83.5 86.9 Economic Assumptions
RealWage Differ- ential
(percent)5
AverageAnnual Wage
In Covered Employment
(percent change)6
TotalEmploy-
ment(percent change)9
AverageAnnual Interest
Rate (percent)10
RealGDP
(percent change)8
CPI(percent change)7Year
2014 2.18 3.78 1.61 3.1 1.3 2.92020 1.42 4.12 2.70 2.6 1.0 5.52030 1.24 3.94 2.70 2.1 0.4 5.62040 1.15 3.85 2.70 2.2 0.6 5.62050 1.11 3.81 2.70 2.1 0.5 5.62060 1.10 3.80 2.70 2.1 0.4 5.62070 1.09 3.79 2.70 2.1 0.5 5.62080 1.13 3.83 2.70 2.1 0.4 5.6
1 The total fertility rate for any year is the average number of children that would be born to a woman in her lifetime if she were to experience, at each age of her life, the birth rate observed in, or assumed for, the selected year, and if she were to survive the entire childbearing period.
2 The age-sex-adjusted death rate is based on the enumerated total population as of April 1, 2010, if that population were to experience the death rates by age and sex observed in, or assumed for, the selected year. It is a summary measure and not a basic assumption; it summarizes the basic assumptions from which it is derived.
3 Net annual immigration is the number of persons who enter during the year (both legally and otherwise) less the number of persons who leave during the year. It is a summary measure and not a basic assumption; it summarizes the effects of the basic assumptions from which it is derived.
4 The period life expectancy at a given age for a given year is the average remaining number of years expected prior to death for a person at that exact age, born on January 1, using the mortality rates for that year over the course of his or her remaining life. It is a summary measure and not a basic assumption; it summarizes the effects of the basic assumptions from which it is derived.
5 The real-wage differential is the annual percentage change in the average annual wage in covered employment less the annual percentage change in the CPI. Values are rounded after computations.
6 The average annual wage in covered employment is the total amount of wages and salaries for all employment covered by the OASDI program in a year, divided by the number of employees with any such earnings during the year. It is a summary measure and not a basic assumption; it summarizes the basic assumptions from which it is derived.
7 The CPI is the Consumer Price Index for Urban Wage Earners and Clerical Workers (CPI-W).
8 The real GDP is the value of total output of goods and services produced in the U.S. in 2009 dollars. It is a summary measure and not a basic assumption; it summarizes the effects of the basic assumptions from which it is derived.
9 Total employment is total U.S. military and civilian employment. It is a summary measure and not a basic assumption; it summarizes the basic assumptions from which it is derived.
10 The average annual interest rate is the average of the nominal interest rates, which compound semiannually, for special public-debt obligations issuable to the OASI and DI Funds in each of the 12 months of the year. It is a summary measure and not a basic assumption; it summarizes the basic assumptions from which it is derived.

NOTES TO THE FINANCIAL STATEMENTS 135
Table 1BMedicare – Demographic and Economic Assumptions
Demographic AssumptionsAge-SexAdjusted
Death Rate (per 100,000)2
Net AnnualImmigration(persons per
year)3
TotalFertilityRate1Year
2014 1.91 779.8 1,345,000 2020 2.06 730.2 1,350,000 2030 2.03 667.6 1,160,000 2040 2.00 614.6 1,105,000 2050 2.00 568.1 1,085,000 2060 2.00 527.1 1,070,000 2070 2.00 490.8 1,065,000 2080 2.00 458.4 1,060,000 Economic Assumptions Average
Annual Wage In Covered
Employment (percent
change) 5
Per Beneficiary Cost8
RealWage Differ- ential
(percent)4
(percent change)RealGDP
(percent change)
7
RealInterest
Rate (percent)
9
CPI(percent change)6
SMI
Year HI Part B Part D
2014 2.18 3.78 1.61 3.1 (2.9) 3.4 0.2 0.32020 1.42 4.12 2.70 2.6 4.0 5.6 6.3 2.72030 1.24 3.94 2.70 2.1 4.5 5.1 5.3 2.92040 1.15 3.85 2.70 2.2 5.2 4.9 5.2 2.92050 1.11 3.81 2.70 2.1 4.1 4.5 5.0 2.92060 1.10 3.80 2.70 2.1 3.8 4.3 4.7 2.92070 1.09 3.79 2.70 2.1 4.0 4.2 4.6 2.92080 1.13 3.83 2.70 2.1 3.8 4.1 4.4 2.9
1 The total fertility rate for any year is the average number of children that would be born to a woman in her lifetime if she were to experience, at each age of her life, the birth rate observed in, or assumed for, the selected year, and if she were to survive the entire childbearing period.
2 The age-sex-adjusted death rate is based on the enumerated total population as of April 1, 2010, if that population were to experience the death rates by age and sex observed in, or assumed for, the selected year. It is a summary measure and not a basic assumption; it summarizes the basic assumptions from which it is derived.
3 Net annual immigration is the number of persons who enter during the year (both legally and otherwise) less the number of persons who leave during the year. It is a summary measure and not a basic assumption; it summarizes the effects of the basic assumptions from which it is derived.
4 The real-wage differential is the annual percentage change in the average annual wage in covered employment less the annual percentage change in CPI. Values are rounded after computations.
5 The average annual wage in covered employment is the total amount of wages and salaries for all employment covered by the OASDI program in a year, divided by the number of employees with any such earnings during the year. It is a summary measure and not a basic assumption; it summarizes the basic assumptions from which it is derived.
6 The CPI is the Consumer Price Index for Urban Wage Earners and Clerical Workers (CPI-W).
7 The real GDP is the value of total output of goods and services produced in the U.S. in 2009 dollars. It is a summary measure and not a basic assumption; it summarizes the effects of the basic assumptions from which it is derived.
8 These increases reflect the overall impact of more detailed assumptions that are made for each of the different types of service provided by the Medicare program (for example, hospital care, physician services, and pharmaceutical costs). These assumptions include changes in the payment rates, utilization, and intensity of each type of service.
9 The real interest rate is the average rate of interest earned on new trust fund securities, above and beyond the rate of inflation.
136 NOTES TO THE FINANCIAL STATEMENTS
Railroad Retirement The Railroad Retirement and Survivor Benefit program pays full retirement annuities at age 60 to railroad workers with
30 years of service. The program pays disability annuities based on total or occupational disability. It also pays annuities to spouses and divorced spouses of retired workers and to widow(er)s, partitioned surviving spouses, partitioned surviving divorced spouses, remarried widow(er)s, surviving divorced spouses, children, and parents of deceased railroad workers. Medicare covers qualified railroad retirement beneficiaries in the same way as it does Social Security beneficiaries. The Railroad Retirement and Survivors’ Improvement Act of 2001 (RRSIA) liberalized benefits for 30-year service employees and their spouses, eliminated a cap on monthly benefits for retirement and disability benefits, lowered minimum service requirements from 10 to 5 years if performed after 1995, and provided for increased benefits for widow(er)s.
The RRB and the SSA share jurisdiction over the payment of retirement and survivor benefits. RRB has jurisdiction if the employee has at least 10 years (5 if performed after 1995) of railroad service. For survivor benefits, RRB requires that the employee’s last regular employment before retirement or death be in the railroad industry. If a railroad employee or his or her survivors do not qualify for railroad retirement benefits, the RRB transfers the employee’s railroad retirement credits to SSA.
Payroll taxes paid by railroad employers and their employees are a primary source of income for the Railroad Retirement and Survivor Benefit Program. By law, railroad retirement taxes are coordinated with Social Security taxes. Employees and employers pay Tier I taxes at the same rate as Social Security taxes and Tier II taxes to finance railroad retirement benefit payments that are higher than Social Security levels.
Other sources of program income include: financial transactions with the Social Security and Medicare Trust Funds, earnings on investments, federal income taxes on railroad retirement benefits, and appropriations (provided after 1974 as part of a phase out of certain vested dual benefits). The financial interchange between RRB’s Social Security Equivalent Benefit (SSEB) Account, the Federal Old-Age and Survivors Insurance Trust Fund, the Disability Insurance Trust Fund, and the Federal Hospital Insurance Trust Fund is intended to put the latter three trust funds in the same position they would have been had railroad employment been covered under the Social Security Act. From a governmentwide perspective, these future financial interchanges and transactions are intragovernmental transfers and are eliminated in consolidation.
Railroad Retirement–Employment, Demographic, and Economic Assumptions The most recent set of projections are prepared using employment, demographic, and economic assumptions reflecting
the Board Members’ reasonable estimate of expected future experience. Three employment assumptions were used in preparing the projections and reflect optimistic, moderate, and pessimistic
future passenger rail as well as freight employment. The average railroad employment is assumed to be 232,000 in 2014 under the moderate employment assumption. This employment assumption, based on a model developed by the Association of American Railroads, assumes that (1) passenger service employment will remain at the level of 46,000 and (2) the employment base, excluding passenger service employment, will decline at a constant 2.0 percent annual rate for 25 years, at a falling rate over the next 25 years, and remain level thereafter. All the projections are based on an open-group (i.e., future entrants) population.
The moderate (middle) economic assumptions include a long-term cost of living increase of 2.8 percent, an interest rate of 7.0 percent, and a wage increase of 3.8 percent. The cost of living assumption reflects the expected level of price inflation. The interest (or investment) rate assumption reflects the expected rate of return on NRRIT investments. The wage increase reflects the expected increase in railroad employee earnings.
Sources of the demographic assumptions (including mortality rates and total termination rates, remarriage rates for widow(er)s, retirement rates, and withdrawal rates) are listed in Table 2. For further details on the employment, demographic, economic and all other assumptions, refer to the Annual Report of the Railroad Retirement System Required by Section 502 of the Railroad Retirement Solvency Act of 1983, and the 25th Actuarial Valuation of the Assets and Liabilities under the Railroad Retirement Acts (Valuation Report) as of December 31, 2010, with Technical Supplement.

NOTES TO THE FINANCIAL STATEMENTS 137
Table 2 Railroad Retirement Demographic Actuarial Assumptions (Sources)
Mortality Rates 1
Mortality after age 2010 RRB Annuitants Mortality Table retirement 2010 RRB Disabled Mortality Table for Mortality after disability Annuitants with Disability Freeze retirement 2010 RRB Disabled Mortality Table for Annuitants without Disability Freeze Mortality during active
2006 RRB Active Service Mortality Table service Mortality of widowed
1995 RRB Mortality Table for Widows annuitants
Total Termination Termination for spouses 2010 RRB Spouse Total Termination Table Rates 2 Termination for disabled 2004 RRB Total Termination Table for
children Disabled Children Widow Remarriage
1997 RRB Remarriage Table Rates 3
Retirement Rates 4 Age retirement See the Valuation Report.
Disability retirement See the Valuation Report. Withdrawal Rates 5 See the Valuation Report.
1 These mortality tables are used to project the termination of eligible employee benefit payments within the population. 2 Total termination rates are used to project the termination of dependent benefits to spouses and disabled children. 3 This rate is used to project the termination of spousal survivor benefits. 4 The retirement rates are used to determine the expected annuity to be paid based on age and years of service for both age and disability retirees. 5 The withdrawal rates are used to project all withdrawals from the railroad industry and resultant effect on the population and accumulated benefits to be paid.

138 NOTES TO THE FINANCIAL STATEMENTS
Black Lung–Disability Benefit ProgramThe Black Lung Disability Benefit Program provides for compensation and medical benefits for eligible coal miners
who are totally disabled due to pneumoconiosis (black lung disease) attributed to their coal mine employment. The same program also provides for survivor benefits for eligible survivors of coal miners who died due to pneumoconiosis. DOL operates the Black Lung Disability Benefit Program.
Black lung disability benefit payments are funded by excise taxes from coal mine operators based on the sale of coal, as are the fund’s administrative costs. These taxes are collected by the Internal Revenue Service (IRS) and transferred to the BLDTF, which was established under the authority of the Black Lung Benefits Revenue Act, and administered by the Treasury.
P.L. 110-343, Division B-Energy Improvement and Extension Act of 2008, enacted on October 3, 2008, among other things, restructured the BLDTF debt by refinancing the outstanding high interest rate repayable advances with low interest rate discounted debt instruments similar in form to zero-coupon bonds, plus a one-time appropriation. This Act also allowed that any subsequent debt issued by the BLDTF may be used to make benefit payments, other authorized expenditures, or to repay debt and interest from the initial refinancing.
Black Lung–Demographic and Economic Assumptions The demographic assumptions used for the most recent set of projections are the number of beneficiaries and their life
expectancy. The beneficiary population data is updated from information supplied by the program. The beneficiary population is a nearly closed universe in which attrition by death exceeds new entrants by a ratio of more than ten to one. SSA Life Tables are used to project the life expectancies of the beneficiary population.
The economic assumptions used for the most recent set of projections are coal excise tax revenue estimates, the tax rate structure, federal civilian pay raises, and medical cost inflation.
Estimates of future receipts of the black lung excise tax are based on projections of future coal production and sale prices prepared by the Energy Information Agency of DOE. Treasury’s Office of Tax Analysis provides the first 10 years of tax receipt estimates. The remaining years are estimated using a growth rate based on both historical tax receipts and Treasury’s estimated tax receipts. The coal excise tax rate structure is $1.10 per ton of underground-mined coal and $0.55 per ton of surface-mined coal sold, with a cap of 4.4 percent of sales price until the earlier of December 31, 2018, or the first December 31, in which there exist no (1) balance of repayable debt described in section 9501 of the Internal Revenue Code and (2) unpaid interest on the debt. At that time, the tax rates revert to $0.50 per ton of underground-mined coal and $0.25 per ton of surface-mine coal sold, and a limit of 2.0 percent of sales price.
OMB supplies assumptions for future monthly benefit rate increases based on increases in the federal pay scale and future medical cost inflation based on increases in the CPIM, which are used to calculate future benefit costs. During the current projection period, the future benefit rate increases 3.56 percent in 2015, 3.49 percent in 2016, 3.20 percent in 2017 and 2018, and approximately 3.10 percent in each year thereafter, and medical cost increases 3.3 percent in 2015, 3.8 percent in 2016, and 3.9 percent in each year thereafter. Estimates for administrative costs for the first 10 years of the projection are supplied by DOL’s Budget Office, based on current year enacted amounts, while later years are based on the number of projected beneficiaries.
Statement of Changes in Social Insurance Amounts The Statement of Changes in Social Insurance Amounts reconciles the change (between the current valuation and the
prior valuation) in the present value of future revenue less future expenditures for current and future participants (the open group measure) over the next 75 years (except Black Lung is projected only through September 30, 2040). The reconciliation identifies several components of the changes that are significant and provides reasons for the changes. The following disclosures relate to the Statement of Changes in Social Insurance Amounts including the reasons for the components of the changes in the open group measure during the reporting period from the end of the previous reporting period for the Government’s social insurance programs. The Statement of Changes in Social Insurance Amounts shows two reconciliations: (1) changing from the period beginning on January 1, 2013, to the period beginning on January 1, 2014, and (2) changing from the period beginning on January 1, 2012, to the period beginning on January 1, 2013.
Social Security All estimates relating to the Social Security Program in the Statement of Changes in Social Insurance Amounts
represent values that are incremental to the prior change. As an example, the present values shown for economic data,

NOTES TO THE FINANCIAL STATEMENTS 139
assumptions, and methods, represent the additional effect of these new data, assumptions, and methods after considering the effects from demography and the change in the valuation period.
Assumptions Used for the Components of the Changes for the Social Security Program The present values included in the Statement of Changes in Social Insurance Amounts are for the current and prior years
and are based on various economic as well as demographic assumptions used for the intermediate assumptions in the Social Security Trustees Reports for these years. Table 1A summarizes these assumptions for the current year.
Period Beginning on January 1, 2013, and Ending January 1, 2014Present values as of January 1, 2013, are calculated using interest rates from the intermediate assumptions of the 2013
Social Security Trustees Report. All other present values in this part of the Statement of Changes in Social Insurance Amounts are calculated as a present value as of January 1, 2014. Estimates of the present value of changes in social insurance amounts due to changing the valuation period and changing demographic data, assumptions, and methods are presented using the interest rates under the intermediate assumptions of the 2013 Social Security Trustees Report. Since interest rates are an economic estimate and all estimates in the table are incremental to the prior change, all other present values in this part of the Statement of Changes in Social Insurance Amounts are calculated using the interest rates under the intermediate assumptions of the 2014 Social Security Trustees Report.
Period Beginning on January 1, 2012, and Ending January 1, 2013
Present values as of January 1, 2012, are calculated using interest rates from the intermediate assumptions of the 2012 Social Security Trustees Report. All other present values in this part of the Statement of Changes in Social Insurance Amounts are calculated as a present value as of January 1, 2013. Estimates of the present value of changes in social insurance amounts due to changing the valuation period and changing demographic data, assumptions, and methods are presented using the interest rates under the intermediate assumptions of the 2012 Social Security Trustees Report. Since interest rates are an economic estimate and all estimates in the table are incremental to the prior change, all other present values in this part of the Statement of Changes in Social Insurance Amounts are calculated using the interest rates under the intermediate assumptions of the 2013 Social Security Trustees Report.
Changes in Valuation Period
Period Beginning on January 1, 2013, and Ending January 1, 2014 The effect on the 75-year present values of changing the valuation period from the prior valuation period (2013-2087)
to the current valuation period (2014-2088) is measured by using the assumptions for the prior valuation and extending them to cover the current valuation. Changing the valuation period removes a small negative net cashflow for 2013, replaces it with a much larger negative net cashflow for 2088, and measures the present values as of January 1, 2014, one year later. Thus, the present value of future net cashflows (excluding the combined OASI and DI Trust Fund asset reserves at the start of the period) decreased (became more negative) when the 75-year valuation period changed from 2013-2087 to 2014-2088.
Period Beginning on January 1, 2012, and Ending January 1, 2013 The effect on the 75-year present values of changing the valuation period from the prior valuation period (2012-2086) to
the current valuation period (2013-2087) is measured by using the assumptions for the prior valuation and extending them to cover the current valuation. Changing the valuation period removes a small negative net cashflow for 2012, replaces it with a much larger negative net cashflow for 2087, and measures the present values as of January 1, 2013, one year later. Thus, the present value of future net cashflows (excluding the combined OASI and DI Trust Fund asset reserves at the start of the period) decreased (became more negative) when the 75-year valuation period changed from 2012-2086 to 2013-2087.
Changes in Demographic Data, Assumptions, and Methods
Period Beginning on January 1, 2013, and Ending January 1, 2014 The ultimate demographic assumptions for the current valuation (beginning on January 1, 2014) are the same as those
for the prior valuation. However, the starting demographic values, and the way these values transition to the ultimate assumptions, were changed.
Preliminary birth rate data for 2012 indicated lower birth rates than were expected in the prior valuation. During the period of transition to their ultimate values, the birth rates in the current valuation are generally lower than they were in the prior valuation.

140 NOTES TO THE FINANCIAL STATEMENTS
New detailed historical divorce data along with revisions in the assumed path of the age-sex-adjusted divorce rate in the period of transition to the ultimate were used in the current valuation.
New historical data since 2001 along with smoothing to the historical distribution of the married population by age of husband and wife was used in the current valuation period.
The effect of including the new birth rate data was a decrease in the present value of future net cashflows, while the
inclusion of the remaining data increased the present value of future net cashflows.
There was one change in demographic methodology. The modeling of the other immigrant population was divided into three distinct groups for the current valuation:
(1) those with temporary legal status; (2) those never authorized to be in the country; and (3) those that had temporary legal status previously but are no longer authorized to be in the country.
The effect of this new valuation methodology was an increase in the present value of future net cashflows.
Period Beginning on January 1, 2012, and Ending January 1, 2013 For the current valuation (beginning on January 1, 2013), changes in ultimate assumptions and recent data for
immigration have significant but largely offsetting effects. The assumed ultimate annual immigration of “other immigrants,” that is, those entering the country without legal
permanent resident (LPR) status, is 1.4 million in the current valuation, compared with 1.5 million assumed for the prior valuation.
The assumed ultimate annual number of persons attaining LPR status is 1.05 million for the current valuation, compared with 1.00 million assumed for the prior valuation. The distribution of the ultimate number between those entering the country with LPR status and those adjusting status after having already entered the country was also revised.
Reasons for these changes include: (1) the expectation of continued tighter border control in the future; (2) the assumed
continuation of a recent increase in the number attaining LPR status as immediate relatives; and (3) the assumed continuation of a recent increase in the proportion of persons attaining LPR status upon entering the country (rather than adjusting status after entry).
The effect of the changes to immigration assumptions was an increase in the present value of future cashflows. Otherwise, the ultimate demographic assumptions for the current valuation are the same as those for the prior valuation.
However, the starting demographic values, plus the way these values transition to the ultimate assumptions, were changed. Final mortality data for 2008 and 2009 show substantially larger reductions in death rates for the current valuation
than were expected in the prior valuation. The new data show a lower starting level of death rates and a faster rate of decline in death rates over the next 25 years.
Final fertility (birth) data for 2009 and 2010, and preliminary data for 2011, indicate lower birth rates for these years than were assumed in the prior valuation.
New historical data for marital status, for the number of new marriages, for “other immigration,” and for the size of the population (based on the 2010 Census) were used in the current valuation.
The effect of including the new mortality and fertility data was a decrease in the present value of future net cashflows,
while the inclusion of the remaining data increased the present value of future net cashflows.
Changes in Economic Data, Assumptions, and Methods
Period Beginning on January 1, 2013, and Ending January 1, 2014 For the current valuation (beginning on January 1, 2014), there was one change to the ultimate economic assumptions.
The ultimate annual rate of change in the Consumer Price Index for Urban Wage Earners and Clerical Workers (CPI-W) is assumed to be 2.7 percent per year in the current valuation period, compared to 2.8 percent per year in the previous valuation period.
Lowering the ultimate average annual increase in the CPI-W makes it more comparable to recent historical annual
increases. This change to the CPI-W assumption decreased the present value of future cashflows.

NOTES TO THE FINANCIAL STATEMENTS 141
Otherwise, the ultimate economic assumptions for the current valuation are the same as those for the prior valuation. However, the starting economic values, and the way these values transition to the ultimate assumptions, were changed.
The ratio of average taxable earnings to the average wage index is lower by 1.9 percent in 2012 and 1.5 percent in 2013, compared to the previous valuation period.
This change to the ratio of average taxable earnings to the average wage index decreased the present value of future
cashflows. There were two main changes in the economic methodology.
Projected labor force participation rates for the older population are slightly lower for the current valuation in order to better reflect the difference in participation rates between never-married and married populations and the projected improvement in life expectancy.
Different earnings levels are assigned to the three distinct groups of the other immigrant population supplied by demography. (This change decreased the present value of estimated future net cashflows by about the same amount as the related change in the demography methodology increased the present value of estimated future net cashflows.)
The effect of including these changes in methodology decreased the present value of estimated future net cashflows.
Period Beginning on January 1, 2012, and Ending January 1, 2013 The ultimate economic assumptions for the current valuation (beginning on January 1, 2013) are the same as those for
the prior valuation. Other changes include the following. The real interest rate is projected to be lower over the first ten years of the current valuation. The starting economic values and near-term economic growth rate assumptions were updated.
The projection of lower real interest rates decreased the present value of future net cashflows, while the changes to starting economic values and near-term economic growth rates increased the present value of future net cashflows.
Two changes in economic methods were made for this valuation. The alignment of projected labor force participation rates with future trends in disability, longevity, and
population levels was altered. Future changes in disability prevalence now affect labor force participation, and the starting year for longevity changes used in the participation rate projections is now consistent with the starting year for those projections.
Ultimate age-sex specific unemployment rates based on the relative levels of long-term historical patterns were developed through the most recent historical year. This improvement is expected to substantially reduce the volatility in projected levels of these rates between valuations.
Both changes increased the present value of estimated future net cashflows.
Changes in Law or Policy
Period Beginning on January 1, 2013, and Ending January 1, 2014 In the current valuation period (beginning on January 1, 2014) no laws were enacted that are expected to have
significant effects on the long-range cost of the OASDI program. However, the Supreme Court’s decision in the United States v. Windsor repealed parts of the Defense of Marriage Act, which affects the payment of federal benefits based on same-sex marriages. The extent to which OASDI benefits based on marriage will be available to same-sex couples is still not completely clear. The agency has issued guidelines, approved by the Department of Justice, for certain benefits for same-sex couples who were legally married when the insured accountholder resided in a state or jurisdiction that recognized same-sex marriages at the time of application or death. For estimates in this valuation, it is assumed that the agency will expand its guidelines to recognize all auxiliary beneficiaries for such marriages and that same-sex marriage will eventually be recognized in all states.
This expected expansion of benefits decreased the present value of future net cashflows.
Period Beginning on January 1, 2012, and Ending January 1, 2013 The current valuation (beginning on January 1, 2013) reflects the enactment of one law and the implementation of one
policy change. The American Taxpayer Relief Act of 2012 (ATRA) was enacted on January 2, 2013. The Act reduces federal
marginal income tax rates for most beneficiaries and thus lowers projected revenue from taxation of benefits.

142 NOTES TO THE FINANCIAL STATEMENTS
The Deferred Action for Childhood Arrivals (DACA) policy was implemented on June 15, 2012. DACA provides protection from deportation and an opportunity to work legally for many unauthorized immigrants who entered the country before age 16 and were under age 31 on June 15, 2012.
Inclusion of the ATRA decreased the present value of future net cashflows, while inclusion of DACA increased the present value of future net cashflows.
Changes in Methodology and Programmatic Data
Period Beginning on January 1, 2013, and Ending January 1, 2014 Several methodological improvements and updates of program-specific data are included in the current valuation
(beginning on January 1, 2014). The most significant are identified below. The ultimate projected ratio of income from taxation of benefits to total benefits was increased for this valuation
period. There were also updates to programmatic data, method changes for projecting beneficiaries and benefit levels
over the first 10 years of the projection period, other small methodological improvements, and interactions. The change to taxation of benefits increased the present value of future net cashflows, while updates of program-
specific data decreased the present value of future net cashflows. Taken together, these changes decreased the present value of future net cashflows.
Period Beginning on January 1, 2012, and Ending January 1, 2013 Several methodological improvements and updates of program-specific data are included in the current valuation
(beginning on January 1, 2013). The most significant are identified below. The modeling of the number of workers insured under the programs was separated into two groups by residency
status: (1) citizens and immigrants with legal permanent resident status; and (2) other immigrants. Separate modeling for these groups is important because their relative sizes in the total population have been changing and will continue to do so.
The historical sample of earnings histories for new beneficiaries was updated to reflect new benefit entitlements in 2008 for the current valuation. The prior valuation used a sample, which reflected new benefit entitlements in 2007.
The projections of revenue from taxation of benefits were better aligned between the first 10 years and the remaining years of the projection period.
There were also minor updates to programmatic data, method changes for projecting beneficiaries and benefit levels over the first 10 years of the projection period, other small methodological improvements, and interactions.
Inclusion of each of these methodological improvements and updates of program-specific data increased the present value of future net cashflows.
MedicareAll estimates relating to the Medicare program in the Statement of Changes in Social Insurance Amounts represent
values that are incremental to the prior change. As an example, the present values shown for demographic assumptions, represent the additional effect that these assumptions have, once the effects from the change in the valuation period and projection base have been considered.
Assumptions Used for the Components of the Changes for the Medicare Program The present values included in the Statement of Changes in Social Insurance Amounts are for the current and prior years
and are based on various economic and demographic assumptions used for the intermediate assumptions in the Medicare Trustees Reports for these years. Table 1B summarizes these assumptions for the current year.

NOTES TO THE FINANCIAL STATEMENTS 143
Period Beginning on January 1, 2013, and Ending January 1, 2014 Present values as of January 1, 2013 are calculated using interest rates from the intermediate assumptions of the 2013
Medicare Trustees Report. All other present values in this part of the Statement of Changes in Social Insurance Amounts are calculated as a present value as of January 1, 2014. Estimates of the present value of changes in social insurance amounts due to changing the valuation period, projection base, demographic assumptions, and law are determined using the interest rates under the intermediate assumptions of the 2013 Medicare Trustees Report. Since interest rates are economic assumptions, the estimates of the present values of changes in economic and health care assumptions are presented using the interest rates under the intermediate assumptions of the 2014 Medicare Trustees Report.
Period Beginning on January 1, 2012, and Ending January 1, 2013 Present values as of January 1, 2012, are calculated using interest rates from the intermediate assumptions of the 2012
Medicare Trustees Report. All other present values in this part of the Statement of Changes in Social Insurance Amounts are calculated as a present value as of January 1, 2013. Estimates of the present value of changes in social insurance amounts due to changing the valuation period, projection base, demographic assumptions, and law are determined using the interest rates under the intermediate assumptions of the 2012 Medicare Trustees Report. Since interest rates are economic assumptions, the estimates of the present values of changes in economic assumptions are presented using the interest rates under the intermediate assumptions of the 2013 Medicare Trustees Report.
Changes in Valuation Period
Period Beginning on January 1, 2013, and Ending January 1, 2014
The effect on the 75-year present values of changing the valuation period from the prior valuation period (2013-2087) to the current valuation period (2014-2088) is measured by using the assumptions for the prior valuation period and applying them, in the absence of any other changes, to the current valuation period. Changing the valuation period removes a small negative net cashflow for 2013 and replaces it with a much larger negative net cashflow for 2088. The present value of estimated future net cashflow (including or excluding the combined Medicare Trust Fund assets at the start of the period) was therefore decreased (made more negative) when the 75-year valuation period changed from 2013-2087 to 2014-2088. Period Beginning on January 1, 2012, and Ending January 1, 2013
The effect on the 75-year present values of changing the valuation period from the prior valuation period (2012-2086) to the current valuation period (2013-2087) is measured by using the assumptions for the prior valuation period and applying them, in the absence of any other changes, to the current valuation period. Changing the valuation period removes a small negative net cashflow for 2012 and replaces it with a much larger negative net cashflow for 2087. The present value of future net cashflow (including or excluding the combined Medicare Trust Fund assets at the start of the period) was therefore decreased (made more negative) when the 75-year valuation period changed from 2012-2086 to 2013-2087.
Changes in Demographic Data, Assumptions, and Methods
Period Beginning January 1, 2013, and Ending January 1, 2014 The demographic assumptions used in the Medicare projections are the same as those used for the Old-Age, Survivors
and Disability Insurance (OASDI) and are prepared by the Office of the Chief Actuary at the SSA.

144 NOTES TO THE FINANCIAL STATEMENTS
The ultimate demographic assumptions for the current valuation (beginning on January 1, 2014) are the same as those for the prior valuation. However, the starting demographic values, and the way these values transition to the ultimate assumptions, were changed.
Preliminary birth rate data for 2012 indicated lower birth rates than were expected in the prior valuation. During the period of transition to their ultimate values, the birth rates in the current valuation are generally lower than they were in the prior valuation.
There was one change in demographic methodology: The modeling of the other immigrant population was divided into three distinct groups for the current valuation:
(1) those with temporary legal status; (2) those never authorized to be in the country; and (3) those who had temporary legal status previously but are no longer authorized to be in the country.
These changes slightly lowered overall Medicare enrollment for the current valuation period resulting in a decrease in the estimated future net cashflow. These changes had a very minor impact on the present value of estimated income and estimated expenditures for Part A, as well as a very minor impact on the present value of estimated expenditures for Part B and Part D.
A further assumption change was made that resulted in higher Part D enrollment for the current valuation period. The participation rate represents the percentage of beneficiaries assumed to enroll in a Part D plan out of all eligible and, in prior years, was assumed to stay relatively constant at the same rate as the recent historical period. However, since actual participation has consistently been higher than expected, it was decided to increase the participation rate by 1 percent per year for the first 3 years of the projection period, before leveling out. This results in an assumed 62.4 percent participation rate, prior to adjustments for beneficiaries who have retiree drug subsidy coverage and those who are assumed to drop out because they are required to pay an income-related premium, for 2017 and later, which is higher than the 57.2 percent that was assumed for all years in the prior valuation period. This assumption change resulted in an increase in the present value of estimated future expenditures for Part D, and had no impact on the Part A and Part B present values. Period Beginning January 1, 2012, and Ending January 1, 2013
The demographic assumptions used in the Medicare projections are the same as those used for the OASDI and are prepared by the Office of the Chief Actuary at the SSA.
For the current valuation (beginning on January 1, 2013), changes in ultimate assumptions and recent data for immigration have significant effects.
The assumed ultimate annual immigration of “other immigrants,” that is, those entering the country without legal permanent resident (LPR) status, is 1.4 million in the current valuation, compared with 1.5 million assumed for the prior valuation.
The assumed ultimate annual number of persons attaining LPR status is 1.05 million for the current valuation, compared with 1.00 million assumed for the prior valuation. The distribution of the ultimate number between those entering the country with LPR status and those adjusting status after having already entered the country was also revised.
Otherwise, the ultimate demographic assumptions for the current valuation period are the same as those for the prior valuation period. However, the starting demographic values, and the way these values transition to the ultimate assumptions, were changed.
Final mortality data for 2008 and 2009 show substantially larger reductions in death rates for the current valuation than were expected in the prior valuation. The new data show a lower starting level of death rates and a faster rate of decline in death rates over the next 25 years.
Final fertility (birth) data for 2009 and 2010, and preliminary data for 2011, indicate lower birth rates for these years than were assumed in the prior valuation.
New historical data for marital status, for the number of new marriages, for “other immigration,” and for the size of the population (based on the 2010 Census) were used in the current valuation.
These changes increased the Part A present values of future expenditures and income. Since overall population projections are higher compared to the prior valuation, these changes increase the Part B and Part D present values of expenditures.
NOTES TO THE FINANCIAL STATEMENTS 145
Changes in Economic and Other Health Care Assumptions
Period Beginning January 1, 2013, and Ending January 1, 2014 The economic assumptions used in the Medicare projections are the same as those used for the OASDI and are prepared
by the Office of the Chief Actuary at the SSA. For the current valuation (beginning on January 1, 2014), there was one change to the ultimate economic assumptions:
The ultimate annual rate of change in the Consumer Price Index for Urban Wage Earners and Clerical Workers (CPI-W) is assumed to be 2.7 percent per year in the current valuation period, compared to 2.8 percent per year in the previous valuation period. Lowering the ultimate average annual increase in the CPI-W makes it more comparable to recent historical annual increases.
Otherwise, the ultimate economic assumptions for the current valuation are the same as those for the prior valuation. However, the starting economic values, and the way these values transition to the ultimate assumptions, were changed.
The ratio of average taxable earnings to the average wage index is lower by 1.9 percent in 2012 and 1.5 percent in 2013, compared to the previous valuation period.
There were two main changes in the economic methodology: Projected labor force participation rates for the older population are slightly lower for the current valuation in
order to better reflect the difference in participation rates between never-married and married populations and the projected improvement in life expectancy.
Different earnings levels are assigned to the three distinct groups of the other immigrant population supplied by demography. (This change decreased the present value of future cashflows by about the same amount as the related change in the demography methodology increased the present value of future cashflows.)
The health care assumptions are specific to the Medicare projections. The following health care assumptions were changed in the current valuation.
The projections emphasized in the 2014 Medicare Trustees Report were changed to reflect the projected baseline scenario. This scenario assumes that the physician payment updates required under the current-law sustainable growth rate formula will be permanently overridden by lawmakers. The use of these projections increases the present value of estimated future expenditures, compared to the current law projections, for Part B by roughly 11 percent, and for total Medicare by about 5 percent.
Utilization rate assumptions for inpatient hospital services were decreased. Case mix increase assumptions for skilled nursing facilities and home health agencies were decreased. Market basket differential for skilled nursing facilities was lowered. Higher assumed enrollment in Medicare Advantage plans where benefits are more costly. Higher increases in productivity rates, resulting in lower payment updates. The methodology used to transition from the short-range projections to the long-range projections was refined,
resulting in smaller increases during this transition period. Lower projected prescription drug trend rates. Higher assumed rebates from drug manufacturers.
The net impact of these changes resulted in an increase in the estimated future net cashflow for total Medicare. For Part A, these changes resulted in a decrease to the present value of estimated future expenditures and income, with an overall increase in the estimated future net cashflow. For Part B, these changes increased the present value of estimated future expenditures. On the other hand, the above-mentioned changes lowered the present value of estimated future expenditures for Part D.
Period Beginning January 1, 2012, and Ending January 1, 2013 The economic assumptions used in the Medicare projections are the same as those used for OASDI and are prepared by
the Office of the Chief Actuary at SSA. The ultimate economic assumptions for the current valuation (beginning on January 1, 2013) are the same as those for
the prior valuation. Other changes include the following. The real interest rate is projected to be lower over the first ten years of the current valuation. The starting economic values and near-term economic growth rate assumptions were updated.
The health care assumptions are specific to the Medicare projections. The following health care assumptions were changed in the current valuation.
Utilization rate and case mix increase assumptions for skilled nursing facilities were decreased. Lower projected Medicare Advantage program costs that reflect recent data suggesting that certain provisions of the
Affordable Care Act will reduce growth in these costs by more than was previously projected.

146 NOTES TO THE FINANCIAL STATEMENTS
Administrative action that increased Medicare Advantage payment rates beginning in 2014 to reflect assumed future legislative overrides of the physician payment reductions.
Larger than previously projected impact from patent expiration of several major prescription drugs in 2012. Lower projected prescription drug trend for 2013.
The net impact of these changes resulted in a slight increase in the future net cashflow for total Medicare. For Part A, these changes resulted in a decrease to the present value of expenditures and income, with an overall slight increase in the future net cashflow. For Part B, these changes increased the present value of expenditures. On the other hand, the above-mentioned changes lowered the present value of expenditures for Part D.
Changes in Law or Policy
Period Beginning January 1, 2013, and Ending January 1, 2014 Although Medicare legislation was enacted since the prior valuation date, many of the provisions have a negligible
impact on the present value of the 75-year estimated future income, expenditures, and net cashflow. The Continuing Appropriations Resolution of 2014 included several provisions that had an impact on the Medicare program, including a 0.5 percent physician payment update for January through March of 2014, extension of the Medicare sequester to fiscal years 2022 and 2023, and payment reform for long-term care hospitals. Further, sections 1 and 3 of Public Law 113-82 included a further extension of the Medicare sequester to fiscal year 2024. Lastly, the Protecting Access to Medicare Act of 2014 extended the 0.5 percent physician update through December 2014, enacted a 0 percent update for January through March of 2015, improved payment policy for clinical diagnostic lab tests, made revisions to the end-stage renal disease (ESRD) prospective payment system and physician fee schedule, and realigned the Medicare sequester in fiscal year 2024. Overall these provisions resulted in an increase in the estimated future net cashflow for total Medicare. For Part A, these changes resulted in an increase to the present value of estimated future expenditures, with an overall increase in the estimated future net cashflow. For Part B, these changes lowered the present value of estimated future expenditures only very slightly. For Part D, the above-mentioned changes increased the present value of estimated future expenditures also very slightly.
Period Beginning January 1, 2012, and Ending January 1, 2013 Although Medicare legislation was enacted since the prior valuation date, many of the provisions have a negligible
impact on the present value of the 75-year revenue, expenditures, and net cashflow. The ATRA included several provisions that had an impact on the Medicare program. These include the extension of the 0 percent physician payment update through 2013, which slightly increases the present value of Part B expenditures; payments for inpatient hospital services in 2014-2017 are reduced in order to recoup $11 billion in overpayments associated with documentation and coding adjustments during 2008-2010 that were not previously recovered, which lowers the present value of Part A expenditures; reductions to the end-stage renal disease (ESRD) bundled payment rate to reflect changes in the utilization of certain drugs and biological plus a delay in the inclusion of oral-only ESRD drugs in the rate, which reduces the present value of Part B expenditures and increases the present value of Part D expenditures; and the coding intensity adjustment used in determining payments to Medicare Advantage plans was revised, which decreases the present value of Part A and Part B expenditures.
Change in Projection Base
Period Beginning January 1, 2013, and Ending January 1, 2014
Actual income and expenditures in 2013 were different than what was anticipated when the 2013 Medicare Trustees Report projections were prepared. Part A income was slightly higher and expenditures were lower than anticipated, based on actual experience. Part B total income and expenditures were also lower than estimated based on actual experience. For Part D, actual income and expenditures were both slightly higher on an incurred basis than prior estimates. The net impact of the Part A, B, and D projection base changes is an increase in the estimated future net cashflow. Actual experience of the Medicare Trust Funds between January 1, 2013 and January 1, 2014 is incorporated in the current valuation and is slightly more than projected in the prior valuation.
Period Beginning January 1, 2012, and Ending January 1, 2013 Actual revenue and expenditures in 2012 were different than what was anticipated when the 2012 Medicare Trustees
Report projections were prepared. Part A revenue and expenditures were lower than anticipated, based on actual experience. Part B total revenue and expenditures were also lower than estimated based on actual experience. For Part D, actual revenue and expenditures were both slightly lower than prior estimates. The net impact of the Part A, B, and D projection-base changes is an increase in the future net cashflow. Actual experience of the Medicare Trust Funds between January 1, 2012,
NOTES TO THE FINANCIAL STATEMENTS 147
and January 1, 2013, is incorporated in the current valuation and is slightly more than projected in the prior valuation.
Railroad Retirement The present values included in the Statement of Changes in Social Insurance Amounts are for the current and prior years
and are based on various employment, demographic, and economic assumptions that reflect the RRB’s reasonable estimate of expected future financial and actuarial status of the trust funds. Selected economic assumptions were updated in 2014 along with the following other components of changes in the open group measure.
Changes in Valuation Period
Period Beginning January 1, 2013, and Ending January 1, 2014 The effect on the 75-year present values of changing the valuation period from the prior valuation period (2013-2087)
to the current valuation period (2014-2088) was a $1.7 billion decrease (became more negative) on the open group measure between January 1, 2013, and January 1, 2014.
Period Beginning January 1, 2012, and Ending January 1, 2013 The effect on the 75-year present values of changing the valuation period from the prior valuation period (2012-2086) to the current valuation period (2013-2087) was a $1.5 billion decrease (became more negative) on the open group measure between January 1, 2012, and January 1, 2013.
Changes in Demographic Data and Assumptions
Period Beginning January 1, 2013, and Ending January 1, 2014 Demographic assumptions were not changed between the Statement of Social Insurance as of January 1, 2013, and the
Statement of Social Insurance as of January 1, 2014. Changes in demographic data resulted in an increase of $2.3 billion in the open group measure between January 1, 2013, and January 1, 2014.
Period Beginning January 1, 2012, and Ending January 1, 2013 Demographic assumptions were not changed between the Statement of Social Insurance as of January 1, 2012, and the
Statement of Social Insurance as of January 1, 2013. Changes in demographic data resulted in an increase of $1.5 billion in the open group measure between January 1, 2012, and January 1, 2013.
Changes in Economic Data and Assumptions
Period Beginning January 1, 2013, and Ending January 1, 2014
Ultimate economic assumptions were not changed between the Statement of Social Insurance as of January 1, 2013, and the Statement of Social Insurance as of January 1, 2014, but select economic assumptions were. The actual COLA of 1.5 percent was used for 2014 in place of the 1.8 percent COLA assumed for 2014 in the prior year’s report. A 1.7 percent COLA was assumed for 2015 instead of a 2.3 percent COLA, and a 2.2 percent COLA was assumed for 2016 instead of a 2.8 percent COLA. Also, the actual 2013 investment return of 16.0 percent was higher than the assumed 7.0 percent investment return used for 2013 in the prior year’s report. Economic data and assumptions resulted in a change of about ($1.2) billion from January 1, 2013, to January 1, 2014.
Period Beginning January 1, 2012, and Ending January 1, 2013 Ultimate economic assumptions were not changed between the Statement of Social Insurance as of January 1, 2012 and
the Statement of Social Insurance as of January 1, 2013, but selected economic assumptions were. The actual COLA of 1.7 percent was used for 2013 in place of the 2.0 percent COLA assumed for 2013 in the prior year’s report. A 1.8 percent COLA was assumed for 2014 instead of a 2.4 percent COLA, and a 2.3 percent COLA was assumed for 2015 instead of a 2.8 percent COLA. Also, the actual 2012 interest rate (investment return) of 13.9 percent was higher than the assumed 7.0 percent interest rate used for 2012 in the prior year’s report. Changes in economic data and assumptions had a relatively small effect of a $0.5 billion decrease in the open group measure between January 1, 2012, and January 1, 2013.

148 NOTES TO THE FINANCIAL STATEMENTS
Changes in Methodology and Programmatic Data
Period Beginning January 1, 2013, and Ending January 1, 2014 There were no changes in methodology and programmatic data.
Period Beginning January 1, 2012, and Ending January 1, 2013 There were no changes in methodology and programmatic data.
Changes in Law or Policy
Period Beginning January 1, 2013, and Ending January 1, 2014 There were no changes in law or policy.
Period Beginning January 1, 2012, and Ending January 1, 2013 There were no changes in law or policy.
Black Lung The significant assumptions used in the projections of the Black Lung social insurance program presented in the
Statement of Social Insurance are the number of beneficiaries, life expectancy, coal excise tax revenue estimates, the tax rate structure, federal civilian pay raises and medical cost inflation. These assumptions also affect the amounts reported on the Statement of Changes in Social Insurance Amounts.
During fiscal year 2014, the decrease in the open and closed group measures was primarily due to projected lower coal excise tax revenues, offset in part due to lower beneficiary costs, and the change in interest rates used to discount the cash flows from between 2.79 and 2.95 percent in fiscal year 2013 to 2.5 percent for income payments, and 2.63 percent for medical payments, administrative expenses, and coal excise tax collections in fiscal year 2014. In fiscal year 2014, DOL further refined the approach for selecting the interest rate assumptions to enhance matching between the timing of cash flows and interest rates and increase comparability. For fiscal year 2014, projected annual cash flows were discounted to present value based on Treasury rates that reflect the average duration of cash flows between 10.4 and 12.2 years for income payments, medical payments, administrative expenses, and coal excise tax collections. The interest rates used to discount fiscal year 2014 projections were 2.5 percent for income payments, and 2.63 percent for medical payments, administrative expenses, and coal excise tax collections.
During fiscal year 2013, the decrease in the open group measure was primarily due to projected lower coal excise tax revenues and changes in the interest rates used to discount cashflows from 2.75 percent in fiscal year 2012 to between 2.79 and 2.95 percent in fiscal year 2013 offset in part due to lower beneficiary costs. In fiscal year 2013, the matching between the timing of cashflows and interest rates was enhanced and the approach for selecting the interest rate assumptions was refined by selecting discount rates based on OMB’s interest rate assumptions which were interpolated to reflect the average duration of payments between 21.3 and 25.4 years for income payments, medical payments, administrative expenses and coal excise tax collections. For fiscal years 2009 to 2012, the projections were discounted using an interest rate published by Treasury as of the start of the projection period for Treasury loans to government agencies for loans with a duration that approximated the projection period.

NOTES TO THE FINANCIAL STATEMENTS 149
Note 25. Stewardship Land and Heritage Assets
Stewardship land is federally-owned land that is set aside for the use and enjoyment of present and future generations, and land on which military bases are located. Except for military bases, this land is not used or held for use in general government operations. Stewardship land is land that the government does not expect to use to meet its obligations, unlike the assets listed in the Balance Sheets. Stewardship land is measured in non-financial units such as acres of land and lakes, and a number of National Parks and National Marine Sanctuaries. Examples of stewardship land include national parks, national forests, wilderness areas, and land used to enhance ecosystems to encourage animal and plant species, and to conserve nature. This category excludes lands administered by the Bureau of Indian Affairs and held in trust.
The majority of public lands that are under the management of DOI were acquired by the government during the first century of the Nation’s existence between 1781 and 1867.
Stewardship land is used and managed in accordance with the statutes authorizing acquisition or directing use and management. Additional detailed information concerning stewardship land, such as agency stewardship policies, physical units by major categories, and the condition of stewardship land, can be obtained from the financial statements of DOI, DOD, DOE, HHS, TVA, and USDA.
Heritage assets are government-owned assets that have one or more of the following characteristics: Historical or natural significance; Cultural, educational, or artistic importance; and/or Significant architectural characteristics The cost of heritage assets often is not determinable or relevant to their significance. Like stewardship land, the
government does not expect to use these assets to meet its obligations. The most relevant information about heritage assets is non-financial. The public entrusts the government with these assets and holds it accountable for their preservation. Examples of heritage assets include the Mount Rushmore National Memorial and Yosemite National Park. Other examples of heritage assets include the Declaration of Independence, the U.S. Constitution, and the Bill of Rights preserved by the National Archives. Also included are national monuments/structures such as the Vietnam Veterans Memorial, the Jefferson Memorial, and the Washington Monument, as well as the Library of Congress. Many other sites such as battlefields, historic structures, and national historic landmarks are placed in this category, as well.
Many laws and regulations govern the preservation and management of heritage assets. Established policies by individual federal agencies for heritage assets ensure the proper care and handling of the assets under their control and preserve these assets for the benefit of the American public.
Some heritage assets are used both to remind us of our heritage and for day-to-day operations. These assets are referred to as multi-use heritage assets. One typical example is the White House. The cost of acquisition, betterment, or reconstruction of all multi-use heritage assets is capitalized as general Property, Plant, and Equipment (PP&E) and is depreciated.
The government classifies heritage assets into two broad categories: collection type and non-collection type. Collection type heritage assets include objects gathered and maintained for museum and library collections. Non-collection type heritage assets include national wilderness areas, wild and scenic rivers, natural landmarks, forests, grasslands, historic places and structures, memorials and monuments, buildings, national cemeteries, and archeological sites.
This discussion of the government’s heritage assets is not exhaustive. Rather, it highlights significant heritage assets reported by federal agencies. Please refer to the individual financial statements of the DOC, VA, DOT, State, DOD, as well as websites for the Library of Congress (http://loc.gov), the Smithsonian Institution (http://si.edu), and the Architect of the Capitol (http://aoc.gov) for additional information on multi-use heritage assets, agency stewardship policies, and physical units by major categories and conditions.

150 NOTES TO THE FINANCIAL STATEMENTS
Note 26. Subsequent Events
Updates to Troubled Asset Relief Program (TARP) Investments
Ally Financial, Inc. In October and December 2014, the U.S. Department of the Treasury sold the remaining shares of Ally Financial Inc.
(Ally) common stock. This ends the last major Troubled Asset Relief Program (TARP) investment and winds down the Auto Industry Financing Program. The remaining 64.1 million shares were sold for approximately $1.5 billion.
See Note 5 – Troubled Asset Relief Program (TARP) – Direct Loans and Equity Investments, Net for further information on TARP investments related to Ally.