United States Government Accountability Office - gao.gov Other U.S. government agencies regulate ......
16
United States Government Accountability Office ashington, DC 20548 W November 13, 2006 The Honorable Henry J. Hyde Chairman Committee on International Relations House of Representatives Subject: Analysis of Data for Exports Regulated by the Department of Commerce In light of the September 2001 terror attacks, you had asked us to examine the Department of Commerce’s Bureau of Industry and Security’s (BIS) dual-use export control system. We reported our findings in a June 26, 2006, report, 1 saying that BIS has not systematically evaluated the overall effectiveness and efficiency of the dual-use export control system. Specifically, we reported that BIS has not conducted comprehensive analyses of available data about items that have actually been exported from the United States. We made several recommendations in that report, including that Commerce should use the available data to evaluate the system’s effectiveness. Because we had difficulty obtaining data on actual exports from Commerce, we were unable to provide you with specific details about these data in time for our June 2006 report. We have since obtained the data and are now transmitting to you our analysis of the data for 2004 and 2005. In assessing what dual-use items were exported in 2004 and 2005, we analyzed data from the U.S. Census Bureau, which is part of the Department of Commerce and is responsible for collecting and maintaining data provided by exporters through the Automated Export System. The data comprise items that Commerce regulates under the Export Administration Regulations (EAR). 2 Because electronic filing of export documentation has greatly increased in the past few years—previously, paper filings were more common—the data we analyzed were for 2004 and 2005 and represent the most complete data from the Automated Export System. 3 We examined selected fields of data, such as license codes, country of destination, commodity type, and dollar value of items. The data we present do not include exports to Canada because Census relies on Canada’s data on what it imported from the United States to represent U.S. exports to Canada. The data also do not include exports filed on paper; in 2005, paper filings represented only 4 percent of the value of all exports. We excluded Census data for U.S. territories and possessions because shipments to these locations are not covered under the EAR. We assessed data reliability by performing electronic testing of the data, obtaining and reviewing system documentation, and interviewing Census officials and found the data to be sufficiently reliable for the purpose of this analysis. We also interviewed BIS officials to determine how they use these data. The following analyses focus on 2005 data, as data for 2004 are not substantially different. Detailed data for 2004 and 2005 are contained in enclosure 1. We conducted our review between July and November 2006 in accordance with generally accepted government auditing standards. 1 GAO, Export Controls: Improvements to Commerce’s Dual-Use System Needed to Ensure Protection of U.S. Interests in the Post-9/11 Environment, GAO-06-638 (Washington, D.C., June 26, 2006). 2 15 C.F.R. §§ 730-774. 3 Electronic filings became mandatory for all items on the Commerce Control List in October 2003. GAO-07-197R Export Controls
-
Upload
phungkhanh -
Category
Documents
-
view
214 -
download
1
Transcript of United States Government Accountability Office - gao.gov Other U.S. government agencies regulate ......
United States Government Accountability Office
ashington, DC 20548 W
November 13, 2006 The Honorable Henry J. Hyde Chairman Committee on International Relations House of Representatives
Subject: Analysis of Data for Exports Regulated by the Department of Commerce In light of the September 2001 terror attacks, you had asked us to examine the Department of Commerce’s Bureau of Industry and Security’s (BIS) dual-use export control system. We reported our findings in a June 26, 2006, report,1 saying that BIS has not systematically evaluated the overall effectiveness and efficiency of the dual-use export control system. Specifically, we reported that BIS has not conducted comprehensive analyses of available data about items that have actually been exported from the United States. We made several recommendations in that report, including that Commerce should use the available data to evaluate the system’s effectiveness. Because we had difficulty obtaining data on actual exports from Commerce, we were unable to provide you with specific details about these data in time for our June 2006 report. We have since obtained the data and are now transmitting to you our analysis of the data for 2004 and 2005. In assessing what dual-use items were exported in 2004 and 2005, we analyzed data from the U.S. Census Bureau, which is part of the Department of Commerce and is responsible for collecting and maintaining data provided by exporters through the Automated Export System. The data comprise items that Commerce regulates under the Export Administration Regulations (EAR).2 Because electronic filing of export documentation has greatly increased in the past few years—previously, paper filings were more common—the data we analyzed were for 2004 and 2005 and represent the most complete data from the Automated Export System.3 We examined selected fields of data, such as license codes, country of destination, commodity type, and dollar value of items. The data we present do not include exports to Canada because Census relies on Canada’s data on what it imported from the United States to represent U.S. exports to Canada. The data also do not include exports filed on paper; in 2005, paper filings represented only 4 percent of the value of all exports. We excluded Census data for U.S. territories and possessions because shipments to these locations are not covered under the EAR. We assessed data reliability by performing electronic testing of the data, obtaining and reviewing system documentation, and interviewing Census officials and found the data to be sufficiently reliable for the purpose of this analysis. We also interviewed BIS officials to determine how they use these data. The following analyses focus on 2005 data, as data for 2004 are not substantially different. Detailed data for 2004 and 2005 are contained in enclosure 1. We conducted our review between July and November 2006 in accordance with generally accepted government auditing standards. 1 GAO, Export Controls: Improvements to Commerce’s Dual-Use System Needed to Ensure Protection of U.S. Interests in
the Post-9/11 Environment, GAO-06-638 (Washington, D.C., June 26, 2006). 2 15 C.F.R. §§ 730-774. 3 Electronic filings became mandatory for all items on the Commerce Control List in October 2003.
GAO-07-197R Export Controls

Summary The data we obtained provide an overall picture of the dollar value of commodities subject to Commerce regulations and of the countries receiving these exports. Most items do not require government review and approval in the form of a license prior to export. We found that less than 1 percent of exports subject to Commerce regulations were licensed in 2005. The dollar value of unlicensed exports from the United States in 2005 was about $624 billion, while the value of licensed exports was about $1.2 billion. BIS regulates the export of dual-use items that have both commercial and military applications, as well as purely commercial items. These items are either specifically identified on a control list or fall into a catch-all category referred to as EAR99. We analyzed the data according to recipient country, type of commodity, and dollar value. Items identified on the control list, whether licensed or unlicensed, were generally exported to Asian countries, such as China, Taiwan, and Singapore, and to European countries, such as France and the United Kingdom. Aircraft, computers, equipment to manufacture semiconductors, telecommunications equipment, and chemicals were some of the top commodities in terms of highest dollar value for exports identified on the control list. Turning to EAR99 items, Mexico was the largest recipient of unlicensed exports in terms of dollar value, while Cuba and Syria—embargoed countries—were the top two recipients of licensed exports. Some of the top commodities in terms of dollar value for unlicensed EAR99 exports were industrial machinery, chemicals, computers, and semiconductors, while agricultural commodities dominated licensed EAR99 exports. The insight we gained from analyzing these data further supports our prior recommendation to Commerce that it use available data to evaluate the effectiveness of its export control system. The data could aid in determining the economic impact of current regulations and in evaluating whether exporters are complying with regulations. BIS officials told us they periodically use portions of the data for enforcement activities but currently do not use the data to evaluate the system’s effectiveness. Background
BIS is responsible for implementing and enforcing the EAR.4 For fiscal year 2005, BIS had a staff of 414 (including 48 licensing officers) and a budget of $67.5 million, of which $33.9 million was for the administration of the export control system.5 The Commerce Control List (CCL)6 generally specifies dual-use items that are designated by a specific Export Control Classification Number (ECCN), which describes a particular item and shows the controls placed on that item. Dual-use items are regulated for a variety of reasons, including restricting exports that could significantly enhance a foreign country’s military potential, preventing exports to countries that sponsor terrorism, and limiting proliferation of chemical, biological, and nuclear weapons and their delivery systems. If an item is not listed on the CCL but is subject to the EAR, it falls into the category known as EAR99.
4 Other U.S. government agencies regulate other exports. For example, the Department of State regulates the export of defense articles and services. In fiscal year 2003, State had 35 licensing officers who reviewed about 54,700 license applications. 5 In addition to administering the dual-use export control system, BIS is responsible for enforcing dual-use export control regulations and law, along with the Departments of Homeland Security and Justice. BIS is also responsible for monitoring the viability of the defense industrial base, ensuring industry compliance with arms control treaties, enforcing antiboycott laws, and assisting other countries in developing effective export control systems. 6 15 C.F.R. Part 774, Supp. 1.
GAO-07-197R Export Controls 2

Exporters are ultimately responsible for determining whether the items they want to export are subject to the EAR and if a license is required prior to export. The EAR requires exporters to follow several steps, including
• classifying their item to determine if it is on the CCL, • determining the restrictions that apply to the country the item is being exported to, • reviewing several lists to determine if they are exporting to a denied person or person of
concern, and • determining if the item will be used for a prohibited purpose.
By following these steps, exporters are to determine whether a license is required or one of the licensing exceptions permissible under the EAR is applicable. Exporters can request a commodity classification when unsure of the requirements for exporting an item subject to the EAR.7 Through outreach efforts, BIS also educates exporters on export requirements. After an exporter has either obtained an export license from BIS or determined that a license is not needed, the exporter is required in most cases8 to document the actual export with a Shipper’s Export Declaration. Most declarations are filed electronically through the Automated Export System. The Census Bureau maintains this system and publishes some aggregate data for the purpose of reporting U.S. trade statistics. In most cases,9 exporters are not required to file an export declaration for exports to Canada because the United States and Canada exchange import data, which are used by each country to represent its export statistics. Most Items Subject to Commerce’s Regulations Were Exported Without Licenses, with Asia
and Europe as Major Recipients of Certain Commodities
Our analysis of export data shows that more than 99 percent of CCL and EAR99 items—or about $624 billion—were exported without licenses in 2005. These items were exported worldwide, while top recipient countries of CCL items were chiefly in Asia and Europe. The majority of items, about $555.3 billion worth, were declared by exporters to be EAR99. About $1 billion of CCL items were exported with licenses. The primary commodities exported from the United States comprised aircraft, certain gas turbine engines, industrial and service machinery, and computers. Because 2004 data are not substantially different, we focus on 2005 data in this section of our letter. Both years’ data are in enclosure 1. The insight we gained from analyzing this data further supports our prior recommendation to Commerce that it use available data to evaluate the effectiveness of its export control system.
7 GAO, Export Controls: Processes for Determining Proper Control of Defense-Related Items Need Improvement, GAO-02-996 (Washington, D.C.: Sept. 20, 2002.) 8 Per the Foreign Trade Statistics Regulations (15 C.F.R. Part 30), an export declaration is required for most countries for any commodity valued at $2,500 or above, with certain limited exemptions. In general, a declaration is required for all items requiring an export license. 9 Generally, export declarations are not required to Canada unless an export license is required or the items are being transshipped through Canada to another country.
GAO-07-197R Export Controls 3

Overview of Export Data
About $625 billion of U.S. exports were subject to Commerce regulations in 2005.10 Exporters declared that about $70 billion of these items were on the CCL, representing about 11 percent of all exports subject to Commerce regulations. The remaining $555 billion fell under the general designation of EAR99. About 98.5 percent of the CCL items were exported without licenses, and 99.98 percent of EAR99 items were exported without licenses, as shown in figure 1. Commerce regulations permit both CCL and EAR99 items to be exported without a license under a variety of circumstances.
Figure 1: Value of Licensed and Unlicensed Exports Subject to Commerce’s Regulations, 2005 (in millions of dollars)
Source: U.S. Census Bureau (data); GAO (analysis and presentation).
Items exportedwith licenses
Items exportedwithout licenses
Total value ofitems exported
CCLEAR99Total
$1,050.85 (1.50%) 126.86 (0.02) 1,177.72 (0.19)
$69,026.41 (98.50%)555,284.75 (99.98)624,311.16 (99.81)
$70,077.26555,411.61625,488.88
0.19%Licensed($1,177.7 million)
Unlicensed($624,311.2 million)
99.81%
Note: Figure does not include data for Canada. Some numbers may not add because of rounding.
10 In 2005, U.S. world exports, excluding Canada, totaled about $693 billion.
GAO-07-197R Export Controls 4

Countries
The top countries receiving exports of items identified by exporters as being on the CCL were largely in Asia and Europe. In 2005, China, Taiwan, Singapore, and France were the largest recipients of both licensed and unlicensed CCL exports (see table 1). Among the top five recipients of these items, the percentages in terms of dollar value of items exported with licenses to those countries ranged from 1.4 to 3.6. The majority of EAR99 items exported with a license were to Cuba, an embargoed country. In contrast, Mexico—a major U.S. trading partner—received the largest dollar value of unlicensed EAR99 exports.
Table 1: Top Five Countries in Terms of Dollar Value for Items Exported with and without Licenses (2005)
CCL items
Exported with licenses Exported without licenses
Rank Country Value (in millions of dollars)
Percentage of all CCL exports Rank Country
Value (in millions of dollars)
Percentage of all CCL exports
1 France $168.47 3.64% 1 Japan $8,751.83 99.58%
2 China 123.95 1.96 2 China 6,196.96 98.04
3 United Kingdom 101.95 2.49 3 Taiwan 5,176.88 98.61
4 Taiwan 72.80 1.39 4 France 4,454.73 96.36
5 Singapore 70.30 1.61 5 Singapore 4,301.76 98.39
EAR99 items
Exported with licenses Exported without licenses
Rank Country Value (in millions of dollars)
Percentage of all EAR99 exports Rank Country
Value (in millions of dollars)
Percentage of all EAR99 exports
1 Cuba $104.32 40.46% 1 Mexico $105,197.71 100.00%
2 Syria 4.89 3.55 2 Japan 40,074.20 100.00
3 Taiwan 3.75 0.02 3 China 33,076.30 99.99
4 China 2.85 0.01 4 United Kingdom 30,369.41 100.00
5 Uzbekistan 2.03 2.82 5 Germany 29,262.51 100.00
Source: Census Bureau (data); GAO (presentation and analysis).
Note: Table does not include data for Canada.
GAO-07-197R Export Controls 5

Commodities
The CCL consists of about 500 ECCNs, which describe the item or types of items and designate the controls placed on that item. The top CCL items exported with a license include items listed on the Wassenaar Arrangement11 munitions list, navigation equipment, semiconductor manufacturing equipment, aircraft, and chemicals (see table 2). Aircraft and certain aircraft engines were the most common CCL item exported without a license in terms of dollar value. Other top unlicensed items included computers and electronics.
Table 2: Top Five Exports of CCL Items by Dollar Value and Export Control Classification Numbers, 2005
Rank ECCN Descriptions of CCL items exported with licenses
Value (in millions of dollars)
1 9A018 Equipment on the Wassenaar munitions lista $129.21
2 7A103 Instrumentation, navigation equipment/systems
116.24
3 3B001 Equipment for manufacture of semiconductors
89.41
4 9A991 Aircraft and certain gas turbine engines 69.50
5 1C350 Chemicals and precursors for toxic chemical agents
68.42
Rank ECCN Descriptions of CCL items exported without licenses
Value (in millions of dollars)
1 9A991 Aircraft and certain gas turbine engines $29,198.03
2 4A994 Computers, electronic assemblies, and related equipment
8,079.06
3 5A991 Telecommunications equipment 6,736.68
4 3A991 Other electronic devices and components not covered under 3A001
3,490.47
5 3A001 Electronic devices and components 3,360.13
Source: Census Bureau (data); GAO (presentation and analysis).
Note: Table does not include data for Canada. a Items that fall under 9A018 include certain military trainer aircraft including parts and components and ground transport vehicles with specific ballistic protection.
11 The Wassenaar Arrangement on Export Controls for Conventional Arms and Dual-Use Goods and Technologies is one of four multilateral export control regimes in which the United States participates. The arrangement establishes lists of items for which member countries are to apply export controls. The lists include dual-use goods and technologies such as materials, electronics, navigation and propulsion, as well as munitions including weapons and ammunition.
GAO-07-197R Export Controls 6

In terms of dollar value, most EAR99 items exported with a license were agricultural and food-related (see table 3). These items required a license because they were exported to an embargoed country, such as Cuba, or were exported to an end user of concern or in support of a prohibited use. In contrast, top U.S. exports that were unlicensed EAR99 included industrial machinery, computers, and chemicals.
Table 3: Top Five Commodity Type Categories for Exports of EAR99 Items by Dollar Value (2005)
Rank Commodity type of EAR99 items exported with licenses Value (in millions of dollars)
1 Other agricultural foods $41.11
2 Feedstuff 35.06
3 Industrial and service machinery 8.38
4 Soybeans and other oil seeds and food oils 8.35
5 Chemicals, excluding medicinals and food additives 7.63
Rank Commodity type of EAR99 items exported without licenses
Value (in millions of dollars)
1 Industrial and service machinery $60,590.56
2 Computers, peripherals, and semiconductors 58,664.01
3 Chemicals, excluding medicinals and food additives 58,465.29
4 Other consumer nondurables 34,248.71
5 Civilian aircraft, engines, parts 24,194.69
Source: Census Bureau (data); GAO (presentation and analysis).
Note: These commodity type categories were developed by the Census Bureau and the Bureau of Economic Analysis utilizing the international Harmonized Tariff Schedule categories. Table does not include data for Canada.
GAO-07-197R Export Controls 7

BIS Analysis
In our June 2006 report, we recommended that BIS obtain and analyze available data to systematically evaluate its export control system. While BIS is responsible for regulating a wide range of dual-use and commercial items, it only has visibility over the small portion of items it has licensed for export. BIS has not conducted comprehensive analysis of export data from Census. BIS officials told us they have access to Automated Export System data and can view individual export declarations. They said they periodically use these data for enforcement activities, such as targeting licensed exports for post-shipment verification. Analysis of the data gave us insight into how the data could be used. We analyzed the data on a macro level to gain insight into the magnitude of items leaving the United States, in terms of recipient countries and commodities. To gain insight on a micro level, the specific data elements could be examined, for example, to determine the economic impact of a proposed regulatory change that would add or remove licensing requirements for commodities to a country. The data could also be used to evaluate industry compliance of regulations, especially for unlicensed exports, and target industry outreach activities. During the course of our review, BIS officials told us the bureau recognizes the value of analyzing overall export data and has recently established an Office of Technology Evaluation to perform this type of analysis. BIS is in the process of hiring analysts with the needed skills for this office. In addition, BIS is determining how it can better utilize Automated Export System data for analyses. Agency Comments We provided Commerce the results of our analysis and obtained oral comments. Commerce officials agreed with our analysis and the value of using export data to assess the effectiveness of the export system. They also provided technical comments, which we incorporated as appropriate.
GAO-07-197R Export Controls 8
We plan no further distribution of this letter until 30 days from the letter date. At that time, we will send copies to the Secretary of Commerce and interested congressional committees. We will also make copies available to others upon request. In addition, the report will be available at no charge on GAO's Web site at http://www.gao.gov. If you have any questions about this letter or need additional information please contact me at (202) 512-4841 or [email protected]. Contact points for our Offices of Congressional Relations and Public Affairs may be found on the last page of this letter. Key contributors to this letter were Anne-Marie Lasowski, Assistant Director; Bradley Terry; Brandon Booth; Lily Chin; and Karen Thornton. Sincerely,
Ann Calvaresi-Barr Director, Acquisition and Sourcing Management Enclosure
GAO-07-197R Export Controls 9

Enclosure I: Analysis of Export Data for 2004 and 2005
We are providing export data for 2004 and additional data for 2005. The data include overall dollar value of exports under Commerce regulations, the top 10 countries of destination, and top 10 commodities for both years.
Table 4: Dollar Value and Percentage of Exports for Items Regulated by Commerce in 2004 and 2005 (in millions of dollars)
2004
Items Exported with licenses Exported without licenses Total value of items exported
CCL $1,166.45 (2.50%) $45,518.53 (97.50%) $46,684.98
EAR99 143.55 (0.03) 506,411.17 (99.97) 506,554.72
Total value of items exported 1,310.01 (0.24) 551,929.69 (99.76) 553,239.70
2005
Items Exported with licenses Exported without licenses Total value of items exported
CCL $1,050.85 (1.50%) $69,026.41 (98.50%) $70,077.26
EAR99 126.86 (0.02) 555,284.75 (99.98) 555,411.61
Total value of items exported 1,177.72 (0.19) 624,311.16 (99.81) 625,488.88
Source: Census Bureau (data); GAO (presentation and analysis).
Note: Table does not include data for Canada. Some numbers do not add because of rounding.
GAO-07-197R Export Controls 10

Table 5: Top 10 Countries in Terms of Dollar Value for CCL Items Exported with and without Licenses in 2004 and 2005
2004
Exported with licenses Exported without licenses
Rank Country Value (in millions of dollars)
Percentage of all CCL exports Rank Country
Value (in millions of dollars)
Percentage of all CCL exports
1 China $214.04 6.60% 1 Japan $6,652.52 99.42%
2 Taiwan 201.68 4.60 2 Taiwan 4,179.20 95.40
3 Singapore 118.71 3.44 3 France 3,526.08 98.03
4 France 70.95 1.97 4 Singapore 3,336.20 96.56
5 Germany 49.21 2.80 5 China 3,027.06 93.40
6 Philippines 46.26 3.69 6 Netherlands 2,597.68 99.58
7 Brazil 42.22 9.92 7 Malaysia 2,593.53 99.43
8 Japan 38.73 0.58 8 United Kingdom 2,366.76 98.43
9 United Kingdom 37.86 1.57 9 South Korea 1,901.32 99.85
10 Israel 36.87 8.66 10 Germany 1,707.68 97.20
2005
Exported with licenses Exported without licenses
Rank Country Value (in millions of dollars)
Percentage of all CCL exports Rank Country
Value (in millions of dollars)
Percentage of all CCL exports
1 France $168.47 3.64% 1 Japan $8,751.83 99.58%
2 China 123.95 1.96 2 China 6,196.96 98.04
3 United Kingdom 101.95 2.49 3 Taiwan 5,176.88 98.61
4 Taiwan 72.80 1.39 4 France 4,454.73 96.36
5 Singapore 70.30 1.61 5 Singapore 4,301.76 98.39
6 Germany 37.95 1.38 6 United Kingdom 3,993.26 97.51
7 Japan 36.79 0.42 7 Netherlands 3,855.56 99.46
8 Thailand 34.97 5.32 8 South Korea 3,151.91 99.44
9 Mexico 30.77 1.09 9 Mexico 2,793.47 98.91
10 Israel 22.21 4.11 10 Germany 2,714.32 98.62
Source: Census Bureau (data); GAO (presentation and analysis).
Note: Table does not include data for Canada. Percentages for some countries may not add to 100 percent due to rounding.
GAO-07-197R Export Controls 11
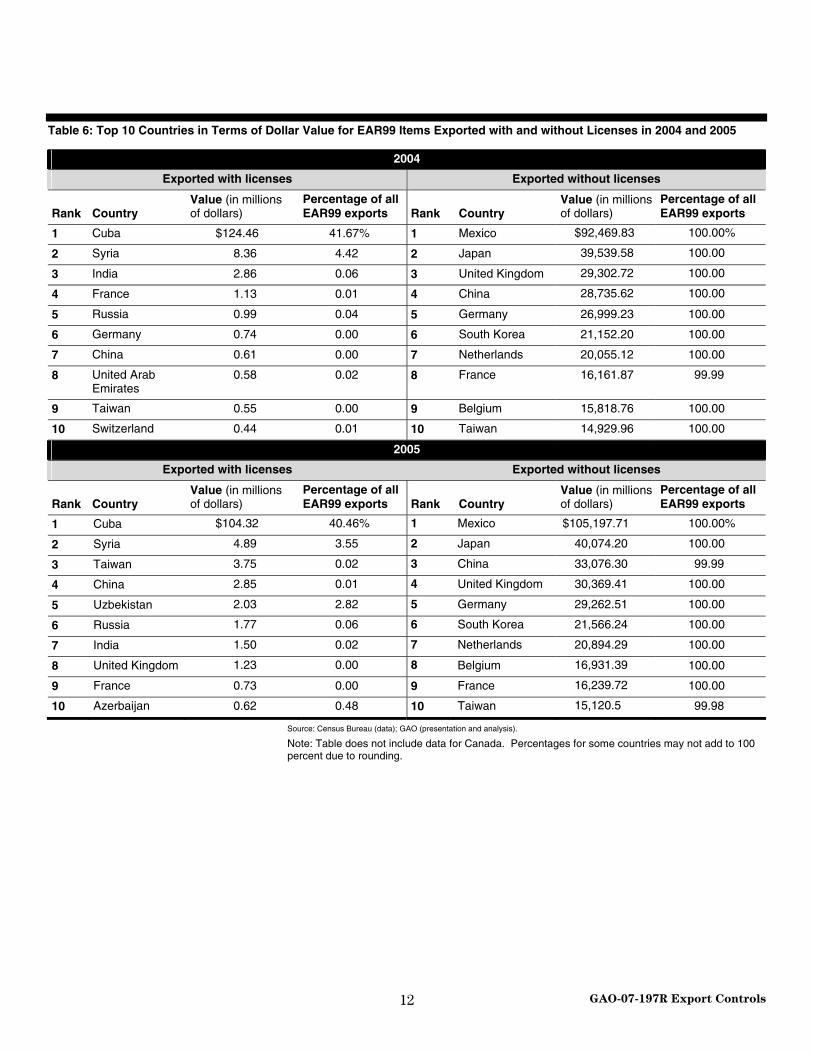
Table 6: Top 10 Countries in Terms of Dollar Value for EAR99 Items Exported with and without Licenses in 2004 and 2005
2004
Exported with licenses Exported without licenses
Rank Country Value (in millions of dollars)
Percentage of all EAR99 exports Rank Country
Value (in millions of dollars)
Percentage of all EAR99 exports
1 Cuba $124.46 41.67% 1 Mexico $92,469.83 100.00%
2 Syria 8.36 4.42 2 Japan 39,539.58 100.00
3 India 2.86 0.06 3 United Kingdom 29,302.72 100.00
4 France 1.13 0.01 4 China 28,735.62 100.00
5 Russia 0.99 0.04 5 Germany 26,999.23 100.00
6 Germany 0.74 0.00 6 South Korea 21,152.20 100.00
7 China 0.61 0.00 7 Netherlands 20,055.12 100.00
8 United Arab Emirates
0.58 0.02 8 France 16,161.87 99.99
9 Taiwan 0.55 0.00 9 Belgium 15,818.76 100.00
10 Switzerland 0.44 0.01 10 Taiwan 14,929.96 100.00
2005
Exported with licenses Exported without licenses
Rank Country Value (in millions of dollars)
Percentage of all EAR99 exports Rank Country
Value (in millions of dollars)
Percentage of all EAR99 exports
1 Cuba $104.32 40.46% 1 Mexico $105,197.71 100.00%
2 Syria 4.89 3.55 2 Japan 40,074.20 100.00
3 Taiwan 3.75 0.02 3 China 33,076.30 99.99
4 China 2.85 0.01 4 United Kingdom 30,369.41 100.00
5 Uzbekistan 2.03 2.82 5 Germany 29,262.51 100.00
6 Russia 1.77 0.06 6 South Korea 21,566.24 100.00
7 India 1.50 0.02 7 Netherlands 20,894.29 100.00
8 United Kingdom 1.23 0.00 8 Belgium 16,931.39 100.00
9 France 0.73 0.00 9 France 16,239.72 100.00
10 Azerbaijan 0.62 0.48 10 Taiwan 15,120.5 99.98
Source: Census Bureau (data); GAO (presentation and analysis).
Note: Table does not include data for Canada. Percentages for some countries may not add to 100 percent due to rounding.
GAO-07-197R Export Controls 12

Table 7: Top 10 Exports of CCL Items by Dollar Value and Export Control Classification Numbers in 2004
Exported with licenses Exported without licenses
Rank ECCN
Descriptions of CCL items
Value (in millions of dollars) Rank ECCN
Descriptions of CCL items
Value (in millions of dollars)
1 3B001 Equipment for the manufacture of semiconductors
$296.87 1 9A991 Aircraft and certain gas turbine engines
$15,809.81
2 3A001 Electronic devices and components
194.33 2 4A994 Computers, electronic assemblies, and related equipment
5,704.23
3 7A103 Instrumentation, navigation equipment/systems
90.58 3 5A991 Telecommunication equipment
4,735.27
4 5A002 Systems/equipment/ integrated circuits for information security
79.49 4 3B991 Other manufacturing and test equipment
3,598.29
5 1C350 Chemicals and precursors for toxic chemical agents
68.76 5 3A991 Other electronic devices and components not covered under 3A001
3,265.88
6 9A018 Equipment on the Wassenaar munitions list
49.09 6 3A001 Electronic devices and components
2,930.56
7 6A003 Cameras 34.07 7 3B001 Equipment for the manufacture of semiconductors
1,759.16
8 6A001 Acoustics 31.13 8 3B992 Equipment for the inspection/testing of components
1,491.37
9 9A003 Gas turbine engine propulsion systems
24.68 9 5A002 Systems/equipment/ integrated circuits for information security
1,008.54
10 3A101 Electronic equipment and devices not covered under 3A001
20.54 10 5A992 Information security equipment
886.05
Source: Census Bureau (data); GAO (presentation and analysis).
Note: Table does not include data for Canada.
GAO-07-197R Export Controls 13
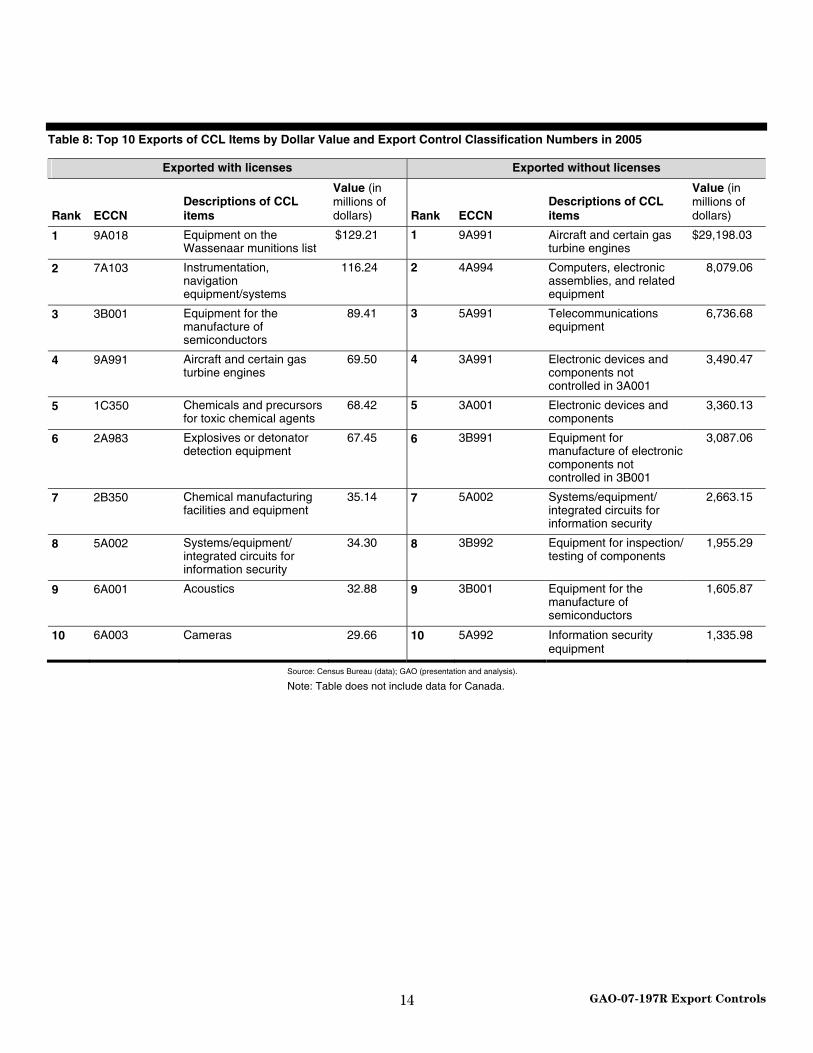
Table 8: Top 10 Exports of CCL Items by Dollar Value and Export Control Classification Numbers in 2005
Exported with licenses Exported without licenses
Rank ECCN Descriptions of CCL items
Value (in millions of dollars) Rank ECCN
Descriptions of CCL items
Value (in millions of dollars)
1 9A018 Equipment on the Wassenaar munitions list
$129.21 1 9A991 Aircraft and certain gas turbine engines
$29,198.03
2 7A103 Instrumentation, navigation equipment/systems
116.24 2 4A994 Computers, electronic assemblies, and related equipment
8,079.06
3 3B001 Equipment for the manufacture of semiconductors
89.41 3 5A991 Telecommunications equipment
6,736.68
4 9A991 Aircraft and certain gas turbine engines
69.50 4 3A991 Electronic devices and components not controlled in 3A001
3,490.47
5 1C350 Chemicals and precursors for toxic chemical agents
68.42 5 3A001 Electronic devices and components
3,360.13
6 2A983 Explosives or detonator detection equipment
67.45 6 3B991 Equipment for manufacture of electronic components not controlled in 3B001
3,087.06
7 2B350 Chemical manufacturing facilities and equipment
35.14 7 5A002 Systems/equipment/ integrated circuits for information security
2,663.15
8 5A002 Systems/equipment/ integrated circuits for information security
34.30 8 3B992 Equipment for inspection/testing of components
1,955.29
9 6A001 Acoustics 32.88 9 3B001 Equipment for the manufacture of semiconductors
1,605.87
10 6A003 Cameras 29.66 10 5A992 Information security equipment
1,335.98
Source: Census Bureau (data); GAO (presentation and analysis).
Note: Table does not include data for Canada.
GAO-07-197R Export Controls 14

Table 9: Top 10 Exports of EAR99 Items by Dollar Value of Commodity Type in 2004 and 2005
2004
Exported with licenses Exported without licenses
Rank Descriptions of EAR99 items
Value (in millions of dollars) Rank Descriptions of EAR99 items
Value (in millions of dollars)
1 Wheat, rice, other food grains $34.19 1 Computers, peripherals, and semiconductors
$61,269.08
2 Other agricultural foods 32.60 2 Industrial and service machinery 54,963.48
3 Feedstuff 31.47 3 Chemicals, excluding medicinals and food additives
49,678.48
4 Soybeans and other oil seeds and food oils 13.15 4 Other consumer nondurables 30,876.08
5 Trucks, buses, and special purpose vehicles
6.98 5 Civilian aircraft, engines, parts 27,654.48
6 Scientific, hospital, and medical machinery 3.33 6 Electric and electric generating equipment 22,311.43
7 Lumber and other wood supplies 3.23 7 Parts, engines, bodies, and chassis 21,108.78
8 Paper and paper base stocks 2.74 8 Scientific, hospital, and medical machinery 19,472.02
9 Chemicals, excluding medicinals and food additives
2.73 9 Other nonagricultural industrial materials 16,327.74
10 Cotton, including linters-raw 2.05 10 Other agricultural foods 15,401.20
2005
Exported with licenses Exported without licenses
1 Other agricultural foods $41.11 1 Industrial and service machinery $60,590.56
2 Feedstuff 35.06 2 Computers, peripherals, and semiconductors
58,664.01
3 Industrial and service machinery 8.38 3 Chemicals, excluding medicinals and food additives
58,465.29
4 Soybeans and other oil seeds and food oils 8.35 4 Other consumer nondurables 34,248.71
5 Chemicals, excluding medicinals and food additives
7.63 5 Civilian aircraft, engines, parts 24,194.69
6 Lumber and other wood supplies 4,75 6 Electric and electric generating equipment 24,103.62
7 Wheat, rice, other food grains 4.00 7 Scientific, hospital, and medical machinery 22,393.25
8 Scientific, hospital, and medical machinery 3.85 8 Parts, engines, bodies, and chassis 22,222.83
9 Other domestic exports 2.93 9 Other agricultural foods 18,178.09
10 Recreational equipment and materials 1.34 10 Other nonagricultural industrial materials 17,930.81
Source: Census Bureau (data); GAO (presentation and analysis).
Note: These commodity type categories were developed by the Census Bureau and the Bureau of Economic Analysis utilizing the international Harmonized Tariff Schedule categories. Table does not include data for Canada.
(120578)
GAO-07-197R Export Controls 15
GAO’s Mission The Government Accountability Office, the audit, evaluation and investigative arm of Congress, exists to support Congress in meeting its constitutional responsibilities and to help improve the performance and accountability of the federal government for the American people. GAO examines the use of public funds; evaluates federal programs and policies; and provides analyses, recommendations, and other assistance to help Congress make informed oversight, policy, and funding decisions. GAO’s commitment to good government is reflected in its core values of accountability, integrity, and reliability.
The fastest and easiest way to obtain copies of GAO documents at no cost is through GAO’s Web site (www.gao.gov). Each weekday, GAO posts newly released reports, testimony, and correspondence on its Web site. To have GAO e-mail you a list of newly posted products every afternoon, go to www.gao.gov and select “Subscribe to Updates.”
The first copy of each printed report is free. Additional copies are $2 each. A check or money order should be made out to the Superintendent of Documents. GAO also accepts VISA and Mastercard. Orders for 100 or more copies mailed to a single address are discounted 25 percent. Orders should be sent to:
U.S. Government Accountability Office 441 G Street NW, Room LM Washington, D.C. 20548
To order by Phone: Voice: (202) 512-6000 TDD: (202) 512-2537 Fax: (202) 512-6061
Contact:
Web site: www.gao.gov/fraudnet/fraudnet.htm E-mail: [email protected] Automated answering system: (800) 424-5454 or (202) 512-7470
Gloria Jarmon, Managing Director, [email protected] (202) 512-4400 U.S. Government Accountability Office, 441 G Street NW, Room 7125 Washington, D.C. 20548
Paul Anderson, Managing Director, [email protected] (202) 512-4800 U.S. Government Accountability Office, 441 G Street NW, Room 7149 Washington, D.C. 20548
Obtaining Copies of GAO Reports and Testimony
Order by Mail or Phone
To Report Fraud, Waste, and Abuse in Federal Programs
Congressional Relations
Public Affairs
PRINTED ON RECYCLED PAPER