
United States Department of Agriculture ... - Parkdale Mills
29
United States Department of Agriculture Foreign Agricultural Service Cotton: World Markets and Trade Approved by the World Agricultural Outlook Board/USDA For email subscription, click here to register: https://public.govdelivery.com/accounts/USDAFAS/subscriber/new May 2021 Global 2021/22 Cotton Consumption Highest in 4 Years USDA’s first forecast for 2021/22 shows record global supply driving use higher as recovery from the COVID-19 pandemic continues. Global consumption is expected to grow 3.5 percent to almost 122 million bales, higher than the pre-pandemic 2018/19 level. However, lingering pandemic related disruptions (i.e. reduced consumer demand and logistical issues) are expected to keep global use below the 2017/18 record level. All top ten consuming countries are expected to witness growth. India is up 2.0 million bales, accounting for nearly one-half of growth in global use. Consumption growth in Pakistan, Turkey, and Bangladesh is expected at or above the long-term world growth rate of around 2 percent. Consumption in Vietnam is also forecast to increase. Global ending stocks are forecast lower on smaller beginning stocks and consumption exceeding production for the second consecutive year. Stocks in China and India are both expected to decline by more than 1.5 million bales. China’s share of global stocks will decline to the second lowest level in 11 years. India’s consumption growth will exceed the expected increase in production, and lower stocks to their lowest level in 3 years. Stocks in the United States are also expected to decline. Brazil stocks are expected to increase due to the arrival of the second-largest projected crop at the end of the marketing year. 0 20 40 60 80 100 120 140 2017/18 2018/19 2019/20 2020/21 2021/22 Million Bales World Consumption Up 3% China 1% India 9% Pakistan 2% Bangladesh 3% Turkey 7% Others 3% 0% 5% 10% 15% 20% 25% 30% 35% 40% 45% 50% 0 20 40 60 80 100 120 2017/18 2018/19 2019/20 2020/21 2021/22 Million Bales World Ending Stocks Down 2% China -5% India -9% Brazil 10% United States -6% Pakistan -10% Others 4% China Share
Transcript of United States Department of Agriculture ... - Parkdale Mills
United States Department of Agriculture Foreign Agricultural Service
Cotton: World Markets and Trade
Approved by the World Agricultural Outlook Board/USDA For email subscription, click here to register:
https://public.govdelivery.com/accounts/USDAFAS/subscriber/new
May 2021
Global 2021/22 Cotton Consumption Highest in 4 Years
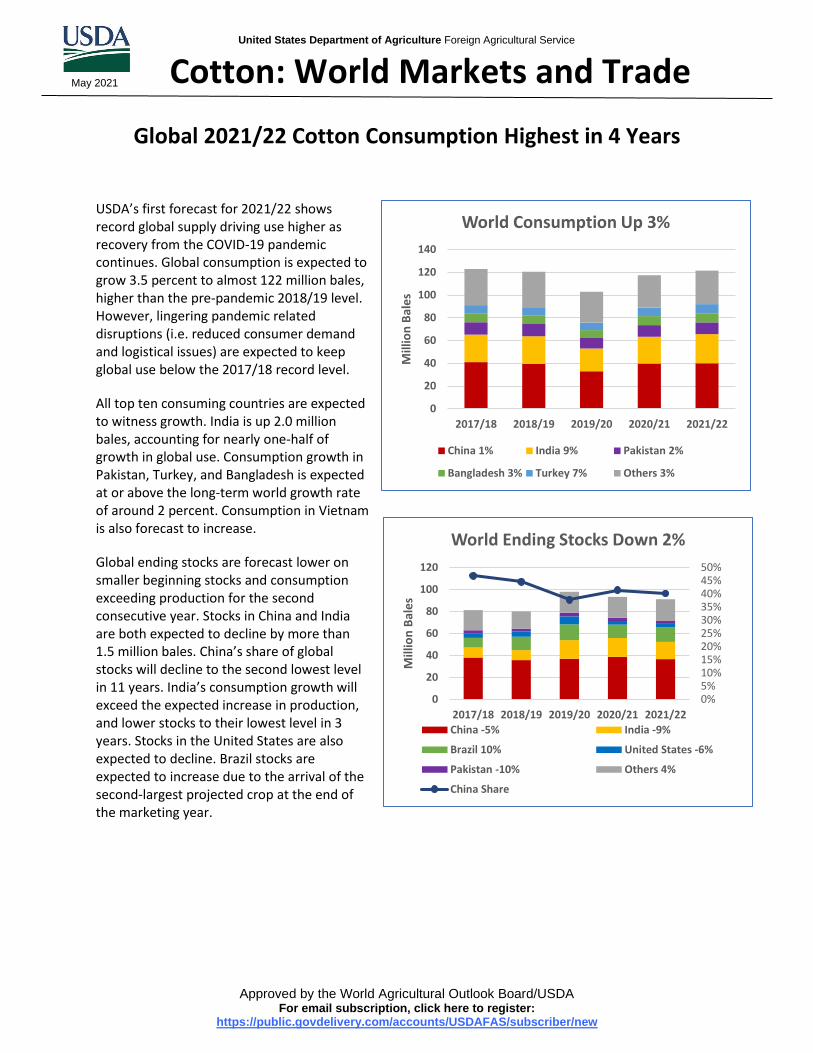
USDA’s first forecast for 2021/22 shows record global supply driving use higher as recovery from the COVID-19 pandemic continues. Global consumption is expected to grow 3.5 percent to almost 122 million bales, higher than the pre-pandemic 2018/19 level. However, lingering pandemic related disruptions (i.e. reduced consumer demand and logistical issues) are expected to keep global use below the 2017/18 record level.
All top ten consuming countries are expected to witness growth. India is up 2.0 million bales, accounting for nearly one-half of growth in global use. Consumption growth in Pakistan, Turkey, and Bangladesh is expected at or above the long-term world growth rate of around 2 percent. Consumption in Vietnam is also forecast to increase.
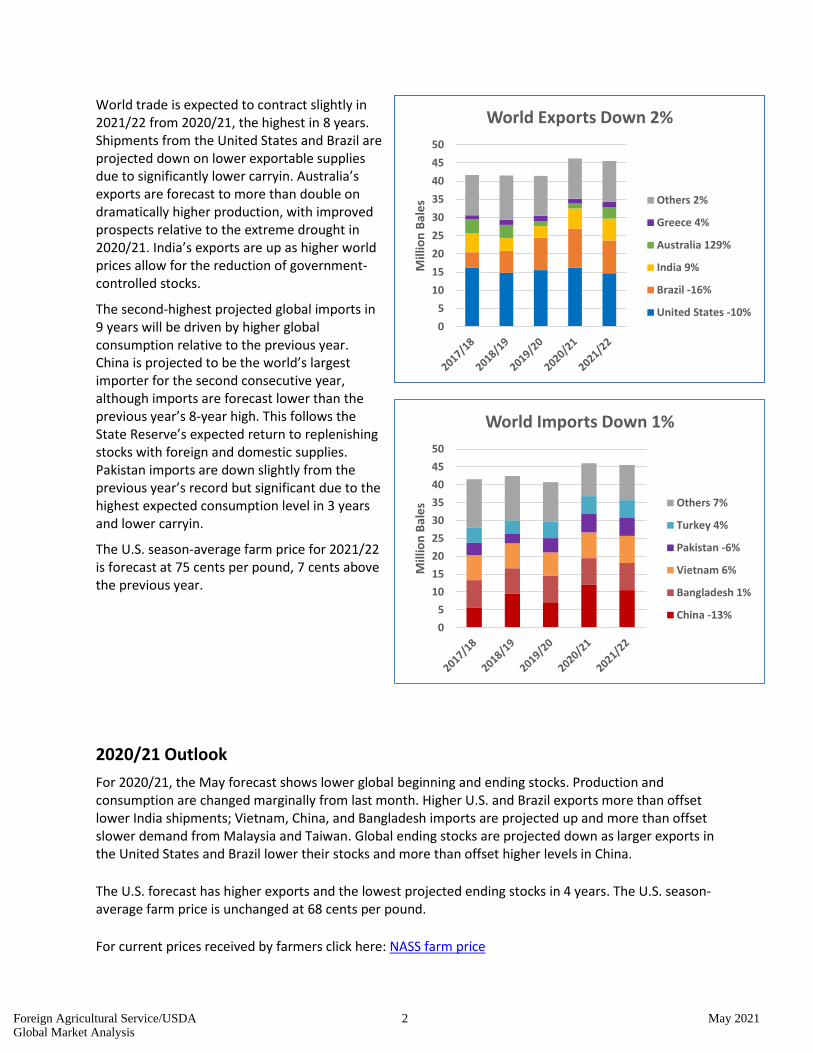
Global ending stocks are forecast lower on smaller beginning stocks and consumption exceeding production for the second consecutive year. Stocks in China and India are both expected to decline by more than 1.5 million bales. China’s share of global stocks will decline to the second lowest level in 11 years. India’s consumption growth will exceed the expected increase in production, and lower stocks to their lowest level in 3 years. Stocks in the United States are also expected to decline. Brazil stocks are expected to increase due to the arrival of the second-largest projected crop at the end of the marketing year.
0
20
40
60
80
100
120
140
2017/18 2018/19 2019/20 2020/21 2021/22
Mill
ion
Bal
es
World Consumption Up 3%
China 1% India 9% Pakistan 2%
Bangladesh 3% Turkey 7% Others 3%
0%5%10%15%20%25%30%35%40%45%50%
0
20
40
60
80
100
120
2017/18 2018/19 2019/20 2020/21 2021/22
Mill
ion
Bal
es
World Ending Stocks Down 2%
China -5% India -9%
Brazil 10% United States -6%
Pakistan -10% Others 4%
China Share
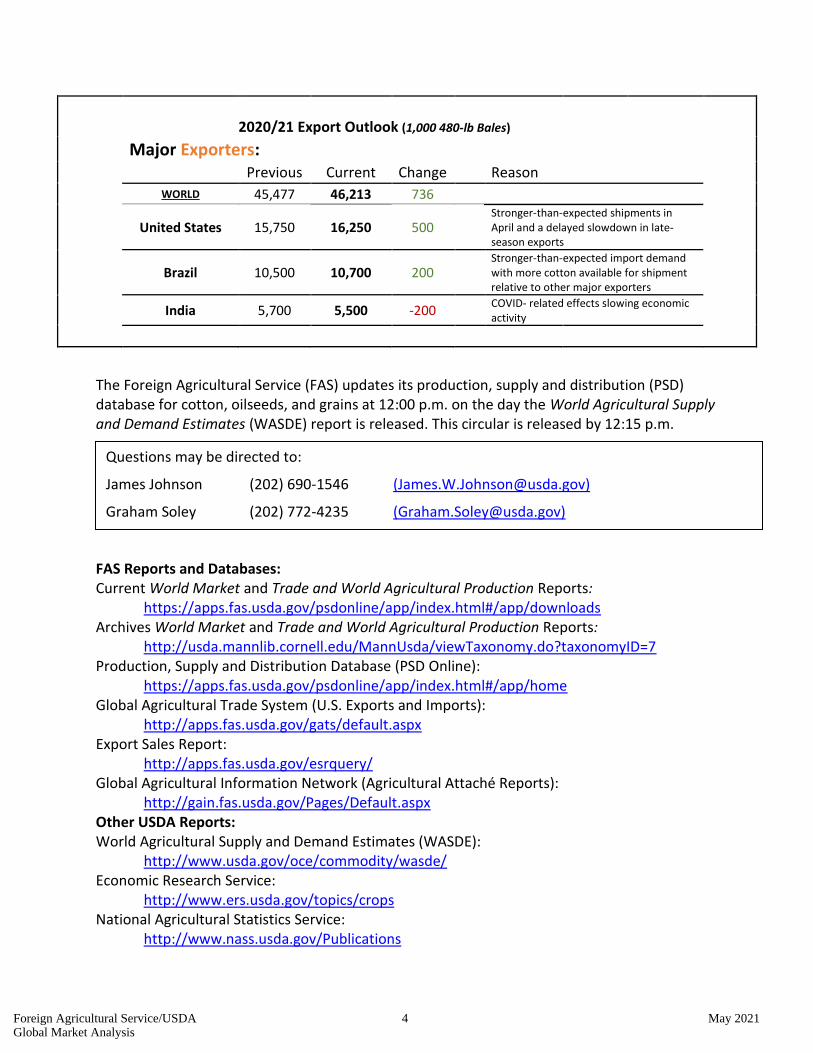
World trade is expected to contract slightly in 2021/22 from 2020/21, the highest in 8 years. Shipments from the United States and Brazil are projected down on lower exportable supplies due to significantly lower carryin. Australia’s exports are forecast to more than double on dramatically higher production, with improved prospects relative to the extreme drought in 2020/21. India’s exports are up as higher world prices allow for the reduction of government-controlled stocks.
The second-highest projected global imports in 9 years will be driven by higher global consumption relative to the previous year. China is projected to be the world’s largest importer for the second consecutive year, although imports are forecast lower than the previous year’s 8-year high. This follows the State Reserve’s expected return to replenishing stocks with foreign and domestic supplies. Pakistan imports are down slightly from the previous year’s record but significant due to the highest expected consumption level in 3 years and lower carryin.
The U.S. season-average farm price for 2021/22 is forecast at 75 cents per pound, 7 cents above the previous year.
2020/21 Outlook
For 2020/21, the May forecast shows lower global beginning and ending stocks. Production and consumption are changed marginally from last month. Higher U.S. and Brazil exports more than offset lower India shipments; Vietnam, China, and Bangladesh imports are projected up and more than offset slower demand from Malaysia and Taiwan. Global ending stocks are projected down as larger exports in the United States and Brazil lower their stocks and more than offset higher levels in China.
The U.S. forecast has higher exports and the lowest projected ending stocks in 4 years. The U.S. season-average farm price is unchanged at 68 cents per pound.
For current prices received by farmers click here: NASS farm price
0
5
10
15
20
25
30
35
40
45
50
Mill
ion
Bal
es
World Exports Down 2%
Others 2%
Greece 4%
Australia 129%
India 9%
Brazil -16%
United States -10%
0
5
10
15
20
25
30
35
40
45
50
Mill
ion
Bal
es
World Imports Down 1%
Others 7%
Turkey 4%
Pakistan -6%
Vietnam 6%
Bangladesh 1%
China -13%
Foreign Agricultural Service/USDA 2 May 2021Global Market Analysis

Prices
The A-index and U.S. spot price have edged up slightly from April’s WASDE owing to dry weather in Texas and stronger commodity prices including corn, wheat, and soybeans. April’s A-Index was more than 40 percent higher compared with last year’s respective month, itself the lowest monthly average in 11 years. Higher global consumption and lower global supplies since April 2020 have boosted prices.
For more information on U.S. spot price click here: AMS Cotton Market News
2020/21 Import Outlook (1,000 480-lb Bales)
Major Importers:
Previous Current Change Reason
WORLD 45,472 46,007 535
Vietnam 6,800 7,200 400 Record March imports and strong recent U.S. sales and shipments
China 11,750 12,000 250 Strong March imports and year-to-date arrivals at more than 9.5 million bales
Malaysia 850 700 -150 Less global exports to Malaysia’s bonded warehouses, a strategic area for re-export
Bangladesh 7,400 7,500 100 Higher consumption
Taiwan 300 200 -100 Imports only 100,000 bales through February
93.3
84.3
30.0
40.0
50.0
60.0
70.0
80.0
90.0
100.0
110.0
Ap
r-18
Jun
-18
Au
g-18
Oct-1
8
De
c-18
Feb
-19
Ap
r-19
Jun
-19
Au
g-19
Oct-1
9
De
c-19
Feb
-20
Ap
r-20
Jun
-20
Au
g-20
Oct-2
0
De
c-20
Feb
-21
Ap
r-21
Monthly Average Cotton Prices
A-Index U.S. Spot Price
Foreign Agricultural Service/USDA 3 May 2021Global Market Analysis
2020/21 Export Outlook (1,000 480-lb Bales)
Major Exporters:
Previous Current Change Reason
WORLD 45,477 46,213 736
United States 15,750 16,250 500 Stronger-than-expected shipments in April and a delayed slowdown in late-season exports
Brazil 10,500 10,700 200 Stronger-than-expected import demand with more cotton available for shipment relative to other major exporters
India 5,700 5,500 -200 COVID- related effects slowing economic activity
The Foreign Agricultural Service (FAS) updates its production, supply and distribution (PSD) database for cotton, oilseeds, and grains at 12:00 p.m. on the day the World Agricultural Supply and Demand Estimates (WASDE) report is released. This circular is released by 12:15 p.m.
FAS Reports and Databases: Current World Market and Trade and World Agricultural Production Reports:
https://apps.fas.usda.gov/psdonline/app/index.html#/app/downloads Archives World Market and Trade and World Agricultural Production Reports:
http://usda.mannlib.cornell.edu/MannUsda/viewTaxonomy.do?taxonomyID=7 Production, Supply and Distribution Database (PSD Online):
https://apps.fas.usda.gov/psdonline/app/index.html#/app/home Global Agricultural Trade System (U.S. Exports and Imports):
http://apps.fas.usda.gov/gats/default.aspx Export Sales Report:
http://apps.fas.usda.gov/esrquery/ Global Agricultural Information Network (Agricultural Attaché Reports):
http://gain.fas.usda.gov/Pages/Default.aspx Other USDA Reports: World Agricultural Supply and Demand Estimates (WASDE):
http://www.usda.gov/oce/commodity/wasde/ Economic Research Service:
http://www.ers.usda.gov/topics/crops National Agricultural Statistics Service:
http://www.nass.usda.gov/Publications
Questions may be directed to:
James Johnson (202) 690-1546 ([email protected])
Graham Soley (202) 772-4235 ([email protected])
Foreign Agricultural Service/USDA 4 May 2021Global Market Analysis

Summary of Changes in estimates and Forecasts from Last Month
(1,000 480 lb Bales and 1,000 Ha)
Country Mktg Year Area
Harvested
Beginning
Stocks
Production Imports Exports Use Loss Total Dom.
Cons.
Ending
Stocks
Argentina
-1000050040015 2020/21
Azerbaijan
5-50-500000 2019/20
-30-150-15500050 2020/21
Bangladesh
010001000100000 2020/21
Bolivia
000000001 2015/16
200000201 2018/19
520200522 2019/20
42020-1251 2020/21
Brazil
-2000002000000 2020/21
Bulgaria
0-100-100-10000 2020/21
Burkina Faso
0000000021 2020/21
Burma
-5-250-2500-3000 2020/21
China
750000025050000 2020/21
Dominican Republic
1-10-100000 2020/21
Germany
-5-50-5100000 2020/21
Greece
000000001 2020/21
Honduras
525025030000 2020/21
India
-70000000-70000 2019/20
Foreign Agricultural Service/USDA 5 May 2021Global Market Analysis

Summary of Changes in estimates and Forecasts from Last Month (Continued)
(1,000 480 lb Bales and 1,000 Ha)
Country Mktg Year Area
Harvested
Beginning
Stocks
Production Imports Exports Use Loss Total Dom.
Cons.
Ending
Stocks
-200-8000-800-2000-500-700-350 2020/21
Korea, North
-105050-5000 2020/21
Korea, South
100000101 2017/18
200000111 2018/19
300000121 2019/20
400000131 2020/21
Malaysia
-100-500-500-150000 2020/21
Mexico
-500000-50-5 2020/21
Nicaragua
217017-910000 2018/19
323023-915020 2019/20
844044-940030 2020/21
Pakistan
25000-250000 2020/21
Paraguay
0-100-10100000 2020/21
Philippines
0-250-250-25000 2020/21
Portugal
-150504000 2019/20
-1000000-10 2020/21
Russia
520020025000 2020/21
Spain
-15000150000 2020/21
Sri Lanka
0-40-40-4000 2020/21
Syria
-30000300000 2016/17
Foreign Agricultural Service/USDA 6 May 2021Global Market Analysis

Summary of Changes in estimates and Forecasts from Last Month (Continued)
(1,000 480 lb Bales and 1,000 Ha)
Country Mktg Year Area
Harvested
Beginning
Stocks
Production Imports Exports Use Loss Total Dom.
Cons.
Ending
Stocks
-10000-2000-300 2017/18
70000-8000-100 2018/19
95000-2500700 2019/20
150008000950 2020/21
Taiwan
-30-750-755-100000 2020/21
Tajikistan
-25000250000 2020/21
Tunisia
0-50-50-5000 2018/19
0-100-100-10000 2019/20
0-150-150-15000 2020/21
Turkmenistan
25000-250000 2020/21
United States
00000000-47 2019/20
-6008805000-920-172 2020/21
Vietnam
040004000400000 2020/21
Zambia
25000-250000 2020/21
Zimbabwe
-500000-50-25 2019/20
70000750150-530 2020/21
World
World
000000001 2015/16
-30000300000 2016/17
-9000-2001-301 2017/18
7612012-8953-92 2018/19
-59515015-349-69976-69 2019/20
-299-4318-43973653566-595-458 2020/21
Foreign Agricultural Service/USDA 7 May 2021Global Market Analysis

Table 01 Cotton World Supply, Use, and Trade (Season Beginning August 1)
(1000 MT)
2016/17 2017/18 2018/19 2019/20 2020/21
May
2021/22
Production none
5,879 India 6,314 5,617 6,271 6,205 6,314
4,953 China 5,987 6,042 5,933 6,423 5,987
3,738 United States 4,555 3,999 4,336 3,181 3,701
1,528 Brazil 2,007 2,830 3,000 2,504 2,885
1,676 Pakistan 1,785 1,655 1,350 980 1,154
882 Australia 1,045 479 136 544 849
697 Turkey 871 816 751 631 740
3,873 Other 4,424 4,376 4,659 4,158 4,374
23,226 Total 26,989 25,815 26,436 24,626 26,005
USE Dom. Consumption none
8,382 China 8,927 8,600 7,185 8,655 8,709
5,302 India 5,258 5,291 4,355 5,117 5,552
2,243 Pakistan 2,373 2,330 2,003 2,243 2,286
1,481 Bangladesh 1,633 1,568 1,502 1,698 1,742
1,448 Turkey 1,644 1,502 1,437 1,633 1,742
1,176 Vietnam 1,437 1,524 1,437 1,568 1,633
435 Uzbekistan 544 610 653 686 697
4,848 Other 4,938 4,806 3,842 3,964 4,088
25,314 Total 26,754 26,230 22,414 25,563 26,449
Imports none
1,096 China 1,243 2,099 1,554 2,613 2,286
1,481 Bangladesh 1,655 1,524 1,633 1,633 1,655
1,197 Vietnam 1,524 1,511 1,411 1,568 1,655
533 Pakistan 740 621 865 1,154 1,089
838 Turkey 956 785 1,017 1,045 1,089
738 Indonesia 766 664 547 490 544
596 India 365 392 496 174 218
1,767 Other 1,798 1,643 1,346 1,341 1,373
8,246 Total 9,047 9,239 8,869 10,017 9,908
Exports none
3,248 United States 3,545 3,230 3,381 3,538 3,201
607 Brazil 909 1,310 1,946 2,330 1,960
991 India 1,128 767 697 1,197 1,306
812 Australia 852 791 296 305 697
221 Greece 234 295 319 294 305
180 Benin 233 303 261 283 294
239 Mali 283 294 256 131 239
1,995 Other 1,893 2,058 1,868 1,984 1,907
8,294 Total 9,077 9,048 9,024 10,062 9,909
Ending Stocks none
9,998 China 8,272 7,766 8,034 8,404 7,958
1,716 India 2,009 1,960 3,676 3,741 3,415
1,509 Brazil 1,885 2,668 3,136 2,662 2,918
599 United States 914 1,056 1,579 718 675
504 Pakistan 616 543 738 618 558
477 Australia 662 342 175 406 551
347 Turkey 425 369 602 548 548
2,327 Other 2,873 2,717 3,357 3,185 3,189
17,476 Total 17,656 17,423 21,297 20,284 19,811
Foreign Agricultural Service/USDA 8 May 2021Global Market Analysis
Table 02 Cotton World Supply, Use, and Trade (Season Beginning August 1)
(1000 Bales)
2016/17 2017/18 2018/19 2019/20 2020/21
May
2021/22
Production none
27,000 India 29,000 25,800 28,800 28,500 29,000
22,750 China 27,500 27,750 27,250 29,500 27,500
17,170 United States 20,923 18,367 19,913 14,608 17,000
7,020 Brazil 9,220 13,000 13,780 11,500 13,250
7,700 Pakistan 8,200 7,600 6,200 4,500 5,300
4,050 Australia 4,800 2,200 625 2,500 3,900
3,200 Turkey 4,000 3,750 3,450 2,900 3,400
17,787 Other 20,317 20,099 21,399 19,097 20,091
106,677 Total 123,960 118,566 121,417 113,105 119,441
USE Dom. Consumption none
38,500 China 41,000 39,500 33,000 39,750 40,000
24,350 India 24,150 24,300 20,000 23,500 25,500
10,300 Pakistan 10,900 10,700 9,200 10,300 10,500
6,800 Bangladesh 7,500 7,200 6,900 7,800 8,000
6,650 Turkey 7,550 6,900 6,600 7,500 8,000
5,400 Vietnam 6,600 7,000 6,600 7,200 7,500
2,000 Uzbekistan 2,500 2,800 3,000 3,150 3,200
3,200 Brazil 3,400 3,400 2,700 3,000 3,100
3,300 Indonesia 3,500 3,150 2,400 2,400 2,500
3,250 United States 3,225 2,975 2,150 2,300 2,500
12,517 Other 12,553 12,547 10,397 10,508 10,676
116,267 Total 122,878 120,472 102,947 117,408 121,476
Imports none
5,032 China 5,710 9,640 7,136 12,000 10,500
6,800 Bangladesh 7,600 7,000 7,500 7,500 7,600
5,500 Vietnam 7,000 6,940 6,480 7,200 7,600
2,450 Pakistan 3,400 2,850 3,975 5,300 5,000
3,851 Turkey 4,391 3,607 4,672 4,800 5,000
3,391 Indonesia 3,517 3,051 2,512 2,250 2,500
2,736 India 1,677 1,800 2,280 800 1,000
1,000 Mexico 925 850 590 850 900
392 Malaysia 739 744 850 700 800
525 Egypt 550 500 500 600 575
6,197 Other 6,042 5,453 4,240 4,007 4,033
37,874 Total 41,551 42,435 40,735 46,007 45,508
Exports none
14,917 United States 16,281 14,837 15,527 16,250 14,700
2,789 Brazil 4,174 6,018 8,937 10,700 9,000
4,550 India 5,182 3,521 3,200 5,500 6,000
3,731 Australia 3,915 3,632 1,360 1,400 3,200
1,017 Greece 1,076 1,355 1,467 1,350 1,400
825 Benin 1,070 1,390 1,200 1,300 1,350
1,100 Mali 1,300 1,350 1,175 600 1,100
625 Cote d'Ivoire 620 895 643 1,100 1,000
1,155 Burkina Faso 1,225 800 930 825 900
266 Argentina 168 545 388 600 600
7,117 Other 6,680 7,213 6,620 6,588 6,260
38,092 Total 41,691 41,556 41,447 46,213 45,510
Ending Stocks none
45,919 China 37,993 35,670 36,899 38,599 36,549
7,880 India 9,225 9,004 16,884 17,184 15,684
6,929 Brazil 8,657 12,256 14,404 12,226 13,401
2,750 United States 4,200 4,850 7,250 3,300 3,100
2,315 Pakistan 2,830 2,495 3,390 2,840 2,565
2,189 Australia 3,039 1,572 802 1,867 2,532
1,594 Turkey 1,950 1,694 2,766 2,516 2,516
10,688 Other 13,197 12,480 15,420 14,630 14,645
80,264 Total 81,091 80,021 97,815 93,162 90,992
Foreign Agricultural Service/USDA 9 May 2021Global Market Analysis
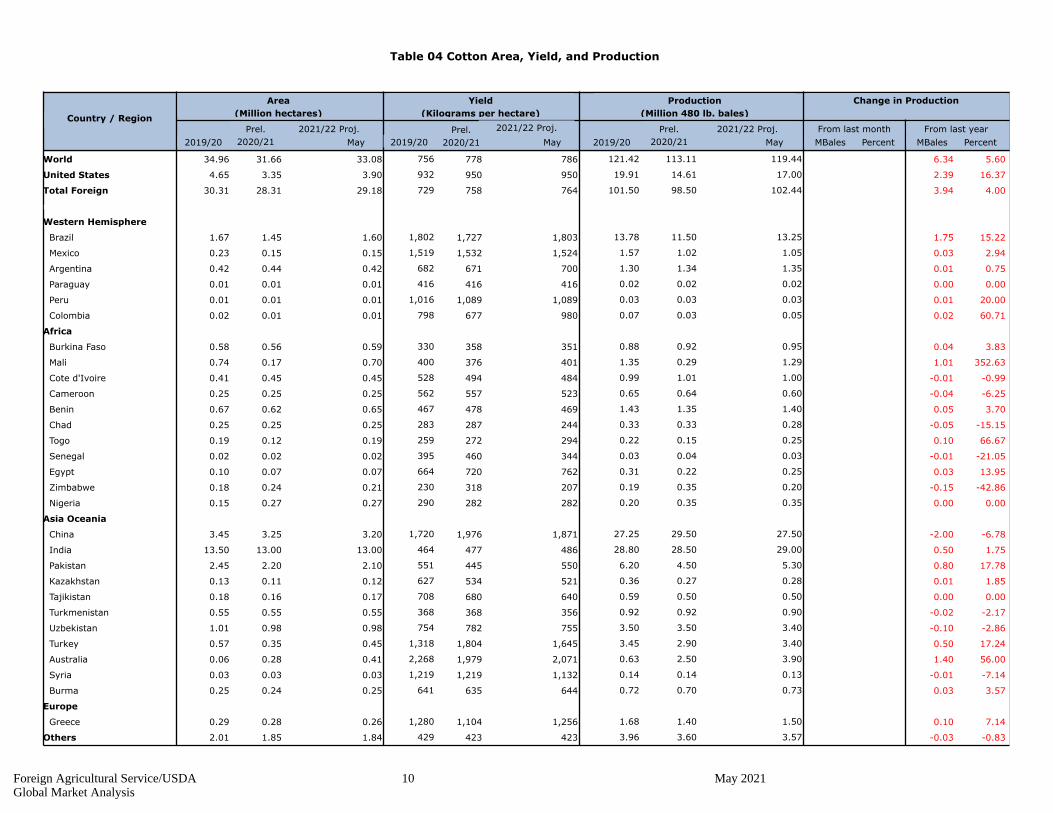
Table 04 Cotton Area, Yield, and Production
From last month From last year
MBalesPercent
Yield
(Kilograms per hectare)
May 2019/20 MBales
Country / Region
Area
(Million hectares)
Production
(Million 480 lb. bales)
Change in Production
2019/20
Prel.
2020/21
Prel.
2020/21 May
Prel.
2020/21 May Percent
2021/22 Proj.2021/22 Proj. 2021/22 Proj.
2019/20
34.96World 5.606.34119.4431.66 33.08 756 778 786 121.42 113.11
4.65United States 16.372.3917.003.35 3.90 932 950 950 19.91 14.61
30.31Total Foreign 4.003.94102.4428.31 29.18 729 758 764 101.50 98.50
none
Western Hemisphere
1.67 Brazil 15.221.7513.251.45 1.60 1,802 1,727 1,803 13.78 11.50
0.23 Mexico 2.940.031.050.15 0.15 1,519 1,532 1,524 1.57 1.02
0.42 Argentina 0.750.011.350.44 0.42 682 671 700 1.30 1.34
0.01 Paraguay 0.000.000.020.01 0.01 416 416 416 0.02 0.02
0.01 Peru 20.000.010.030.01 0.01 1,016 1,089 1,089 0.03 0.03
0.02 Colombia 60.710.020.050.01 0.01 798 677 980 0.07 0.03
Africa
0.58 Burkina Faso 3.830.040.950.56 0.59 330 358 351 0.88 0.92
0.74 Mali 352.631.011.290.17 0.70 400 376 401 1.35 0.29
0.41 Cote d'Ivoire -0.99-0.011.000.45 0.45 528 494 484 0.99 1.01
0.25 Cameroon -6.25-0.040.600.25 0.25 562 557 523 0.65 0.64
0.67 Benin 3.700.051.400.62 0.65 467 478 469 1.43 1.35
0.25 Chad -15.15-0.050.280.25 0.25 283 287 244 0.33 0.33
0.19 Togo 66.670.100.250.12 0.19 259 272 294 0.22 0.15
0.02 Senegal -21.05-0.010.030.02 0.02 395 460 344 0.03 0.04
0.10 Egypt 13.950.030.250.07 0.07 664 720 762 0.31 0.22
0.18 Zimbabwe -42.86-0.150.200.24 0.21 230 318 207 0.19 0.35
0.15 Nigeria 0.000.000.350.27 0.27 290 282 282 0.20 0.35
Asia Oceania
3.45 China -6.78-2.0027.503.25 3.20 1,720 1,976 1,871 27.25 29.50
13.50 India 1.750.5029.0013.00 13.00 464 477 486 28.80 28.50
2.45 Pakistan 17.780.805.302.20 2.10 551 445 550 6.20 4.50
0.13 Kazakhstan 1.850.010.280.11 0.12 627 534 521 0.36 0.27
0.18 Tajikistan 0.000.000.500.16 0.17 708 680 640 0.59 0.50
0.55 Turkmenistan -2.17-0.020.900.55 0.55 368 368 356 0.92 0.92
1.01 Uzbekistan -2.86-0.103.400.98 0.98 754 782 755 3.50 3.50
0.57 Turkey 17.240.503.400.35 0.45 1,318 1,804 1,645 3.45 2.90
0.06 Australia 56.001.403.900.28 0.41 2,268 1,979 2,071 0.63 2.50
0.03 Syria -7.14-0.010.130.03 0.03 1,219 1,219 1,132 0.14 0.14
0.25 Burma 3.570.030.730.24 0.25 641 635 644 0.72 0.70
Europe
0.29 Greece 7.140.101.500.28 0.26 1,280 1,104 1,256 1.68 1.40
2.01Others -0.83-0.033.571.85 1.84 429 423 423 3.96 3.60
Foreign Agricultural Service/USDA 10 May 2021Global Market Analysis

(1,000 HA and 1000 480-lb. Bales)
Table 05 Cotton Supply and Distribution MY 2021/22
Area
Harvested
Ending
Stocks
ExportsLossUseTotal
Supply
ImportsProductionCountry
0 600301278545 Afghanistan 37
0 001211 Albania 1
30 00354000 Algeria 5
0 0051053 Angola 5
0 60005752,6981,350420 Argentina 1,523
0 000000 Armenia 0
0 3,2000355,7673,900410 Australia 2,532
15 00151800 Austria 3
0 375075474460135 Azerbaijan 24
45 00455400 Bahrain 9
7,600 0108,00010,09914946 Bangladesh 2,089
40 00404600 Belarus 6
30 100203600 Belgium-Luxembour 6
0 1,3500151,7881,400650 Benin 423
2 001220105 Bolivia 8
25 9,00003,10025,50113,2501,600 Brazil 13,401
15 002532102 Bulgaria 7
0 9000251,220950590 Burkina Faso 295
50 5007251,052725245 Burma 277
1 001200 Cambodia 1
0 575020914600250 Cameroon 319
2 002200 Canada 0
0 3500523634 Central African Republic 17
0 275010581280250 Chad 296
0 000000 Chile 0
10,500 50040,00076,59927,5003,200 China 36,549
80 001151484510 Colombia 33
2 0017211530 Congo (Kinshasa) 4
35 00354500 Costa Rica 10
0 1,0000301,4641,000450 Cote d'Ivoire 434
0 000000 Croatia 0
10 00141644 Cuba 2
0 000000 Cyprus 0
7 006900 Czech Republic 3
0 000000 Denmark 0
Foreign Agricultural Service/USDA 11 May 2021Global Market Analysis

(1,000 HA and 1000 480-lb. Bales)
Table 05 Cotton Supply and Distribution MY 2021/22 (Continued)
Area
Harvested
Ending
Stocks
ExportsLossUseTotal
Supply
ImportsProductionCountry
1 002300 Dominican Republic 1
55 00657893 Ecuador 13
575 2751055094424570 Egypt 109
150 0016019600 El Salvador 36
15 00151800 Estonia 3
30 5027034024082 Ethiopia 65
35 00354300 France 8
80 100709000 Germany 10
0 15010402815 Ghana 15
30 1,40025901,6931,500260 Greece 178
130 0013516532 Guatemala 30
0 1800211813 Guinea 3
5 00101157 Haiti 1
65 00657500 Honduras 10
5 500700 Hong Kong 2
3 300300 Hungary 0
1,000 6,000025,50047,18429,00013,000 India 15,684
2,500 502,5002,99322 Indonesia 488
250 0052568026080 Iran 155
35 0050751711 Iraq 25
0 000000 Ireland 0
2 350449375 Israel 10
135 0013515800 Italy 23
170 0017019500 Japan 25
0 225060378275115 Kazakhstan 93
10 0040622826 Kenya 22
90 001452105519 Korea, North 65
525 5052565611 Korea, South 126
0 90001009018 Kyrgyzstan 10
7 106900 Latvia 2
5 005600 Lebanon 1
85 008511000 Lesotho 25
0 000000 Lithuania 0
5 005600 North Macedonia 1
0 10020453020 Madagascar 15
Foreign Agricultural Service/USDA 12 May 2021Global Market Analysis

(1,000 HA and 1000 480-lb. Bales)
Table 05 Cotton Supply and Distribution MY 2021/22 (Continued)
Area
Harvested
Ending
Stocks
ExportsLossUseTotal
Supply
ImportsProductionCountry
0 80051699080 Malawi 84
800 45003501,67100 Malaysia 871
0 1,1000251,5711,290700 Mali 446
110 0011013300 Mauritius 23
900 250251,7002,3641,050150 Mexico 389
50 00507200 Moldova 22
28 00303611 Morocco 6
0 11005206115125 Mozambique 91
15 00151700 Netherlands 2
50 00506000 Nicaragua 10
0 6031495 Niger 5
10 1000250479350270 Nigeria 129
5,000 502510,50013,1405,3002,100 Pakistan 2,565
0 000000 Panama 0
5 2005332111 Paraguay 8
210 20240291306 Peru 49
30 00304321 Philippines 13
17 00172000 Poland 3
170 0017021200 Portugal 42
1 001200 Romania 1
100 0010011900 Russia 19
0 3000393019 Senegal 9
8 0081000 Serbia 2
0 000000 Singapore 0
1 001100 Slovakia 0
8 0081000 Slovenia 2
3 001011712 Somalia 1
50 500702287016 South Africa 108
12 27501530928562 Spain 19
1 006855 Sri Lanka 2
0 500070899600200 Sudan 329
0 000000 Sweden 0
2 002300 Switzerland 1
0 10006520413025 Syria 39
260 1025031400 Taiwan 63
Foreign Agricultural Service/USDA 13 May 2021Global Market Analysis
(1,000 HA and 1000 480-lb. Bales)
Table 05 Cotton Supply and Distribution MY 2021/22 (Continued)
Area
Harvested
Ending
Stocks
ExportsLossUseTotal
Supply
ImportsProductionCountry
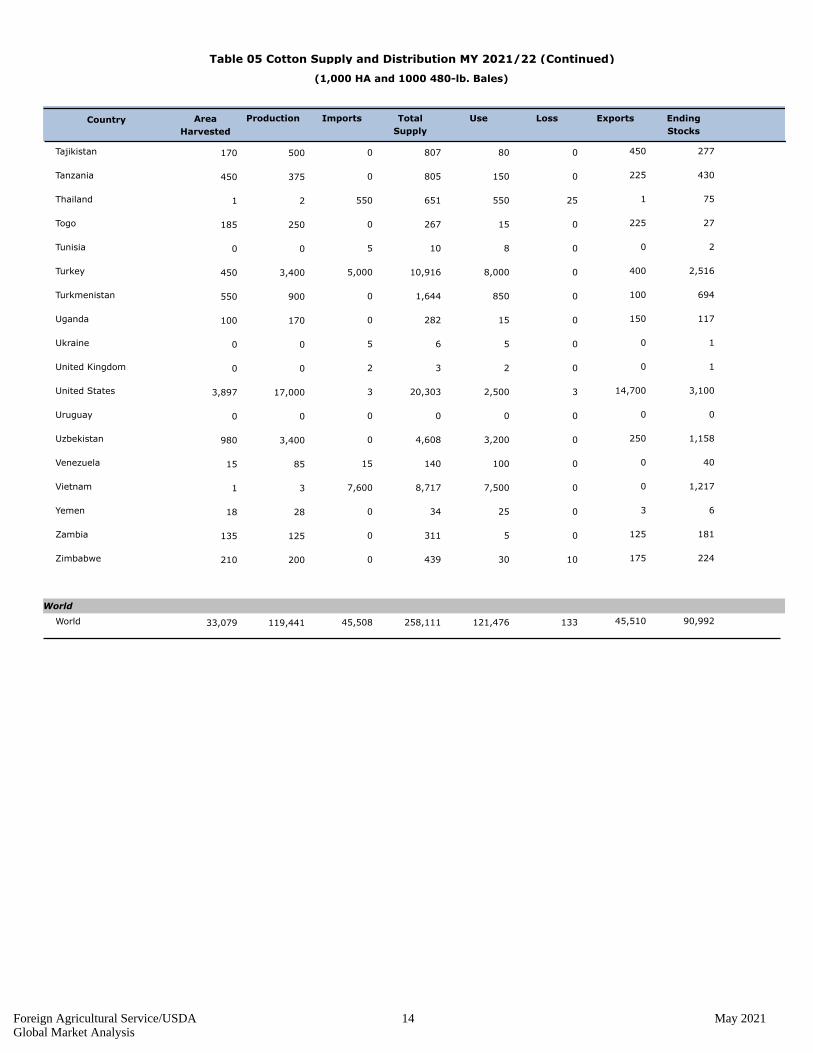
0 450080807500170 Tajikistan 277
0 2250150805375450 Tanzania 430
550 12555065121 Thailand 75
0 225015267250185 Togo 27
5 0081000 Tunisia 2
5,000 40008,00010,9163,400450 Turkey 2,516
0 10008501,644900550 Turkmenistan 694
0 150015282170100 Uganda 117
5 005600 Ukraine 1
2 002300 United Kingdom 1
3 14,70032,50020,30317,0003,897 United States 3,100
0 000000 Uruguay 0
0 25003,2004,6083,400980 Uzbekistan 1,158
15 001001408515 Venezuela 40
7,600 007,5008,71731 Vietnam 1,217
0 3025342818 Yemen 6
0 12505311125135 Zambia 181
0 1751030439200210 Zimbabwe 224
World
45,508 45,510133121,476258,111119,44133,079 World 90,992
Foreign Agricultural Service/USDA 14 May 2021Global Market Analysis
(1000 MT and 1000 HA)
Table 05A Cotton Supply and Distribution MY 2021/22
Area
Harvested
Ending
Stocks
ExportsLossUseTotal
Supply
ImportsProductionCountry
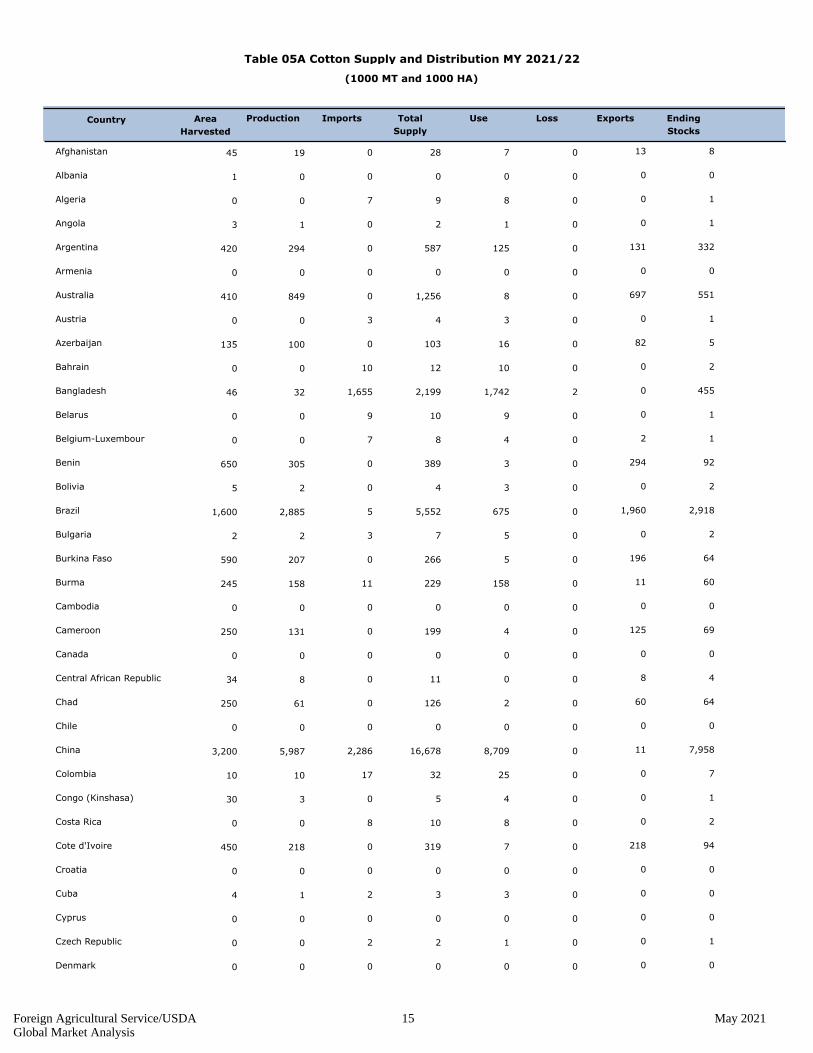
0 1307281945 Afghanistan 8
0 000001 Albania 0
7 008900 Algeria 1
0 001213 Angola 1
0 1310125587294420 Argentina 332
0 000000 Armenia 0
0 697081,256849410 Australia 551
3 003400 Austria 1
0 82016103100135 Azerbaijan 5
10 00101200 Bahrain 2
1,655 021,7422,1993246 Bangladesh 455
9 0091000 Belarus 1
7 204800 Belgium-Luxembour 1
0 29403389305650 Benin 92
0 003425 Bolivia 2
5 1,96006755,5522,8851,600 Brazil 2,918
3 005722 Bulgaria 2
0 19605266207590 Burkina Faso 64
11 110158229158245 Burma 60
0 000000 Cambodia 0
0 12504199131250 Cameroon 69
0 000000 Canada 0
0 80011834 Central African Republic 4
0 600212661250 Chad 64
0 000000 Chile 0
2,286 1108,70916,6785,9873,200 China 7,958
17 0025321010 Colombia 7
0 0045330 Congo (Kinshasa) 1
8 0081000 Costa Rica 2
0 21807319218450 Cote d'Ivoire 94
0 000000 Croatia 0
2 003314 Cuba 0
0 000000 Cyprus 0
2 001200 Czech Republic 1
0 000000 Denmark 0
Foreign Agricultural Service/USDA 15 May 2021Global Market Analysis

(1000 MT and 1000 HA)
Table 05A Cotton Supply and Distribution MY 2021/22 (Continued)
Area
Harvested
Ending
Stocks
ExportsLossUseTotal
Supply
ImportsProductionCountry
0 000100 Dominican Republic 0
12 00141723 Ecuador 3
125 6021202065370 Egypt 24
33 00354300 El Salvador 8
3 003400 Estonia 1
7 1059745282 Ethiopia 14
8 008900 France 2
17 20152000 Germany 2
0 3029615 Ghana 3
7 305520369327260 Greece 39
28 00293612 Guatemala 7
0 4005413 Guinea 1
1 002217 Haiti 0
14 00141600 Honduras 2
1 100200 Hong Kong 0
1 100100 Hungary 0
218 1,30605,55210,2736,31413,000 India 3,415
544 1054465202 Indonesia 106
54 001141485780 Iran 34
8 001116411 Iraq 5
0 000000 Ireland 0
0 8011185 Israel 2
29 00293400 Italy 5
37 00374200 Japan 5
0 490138260115 Kazakhstan 20
2 00913626 Kenya 5
20 0032461219 Korea, North 14
114 1011414301 Korea, South 27
0 2000222018 Kyrgyzstan 2
2 001200 Latvia 0
1 001100 Lebanon 0
19 00192400 Lesotho 5
0 000000 Lithuania 0
1 001100 North Macedonia 0
0 20410720 Madagascar 3
Foreign Agricultural Service/USDA 16 May 2021Global Market Analysis

(1000 MT and 1000 HA)
Table 05A Cotton Supply and Distribution MY 2021/22 (Continued)
Area
Harvested
Ending
Stocks
ExportsLossUseTotal
Supply
ImportsProductionCountry
0 1701372080 Malawi 18
174 9807636400 Malaysia 190
0 23905342281700 Mali 97
24 00242900 Mauritius 5
196 545370515229150 Mexico 85
11 00111600 Moldova 5
6 007801 Morocco 1
0 24014525125 Mozambique 20
3 003400 Netherlands 0
11 00111300 Nicaragua 2
0 101325 Niger 1
2 2205410476270 Nigeria 28
1,089 1152,2862,8611,1542,100 Pakistan 558
0 000000 Panama 0
1 4017511 Paraguay 2
46 00526376 Peru 11
7 007901 Philippines 3
4 004400 Poland 1
37 00374600 Portugal 9
0 000000 Romania 0
22 00222600 Russia 4
0 7008719 Senegal 2
2 002200 Serbia 0
0 000000 Singapore 0
0 000000 Slovakia 0
2 002200 Slovenia 0
1 0022212 Somalia 0
11 11015501516 South Africa 24
3 6003676262 Spain 4
0 001215 Sri Lanka 0
0 109015196131200 Sudan 72
0 000000 Sweden 0
0 000100 Switzerland 0
0 22014442825 Syria 8
57 00546800 Taiwan 14
Foreign Agricultural Service/USDA 17 May 2021Global Market Analysis

(1000 MT and 1000 HA)
Table 05A Cotton Supply and Distribution MY 2021/22 (Continued)
Area
Harvested
Ending
Stocks
ExportsLossUseTotal
Supply
ImportsProductionCountry
0 98017176109170 Tajikistan 60
0 4903317582450 Tanzania 94
120 0512014201 Thailand 16
0 49035854185 Togo 6
1 002200 Tunisia 0
1,089 8701,7422,377740450 Turkey 548
0 220185358196550 Turkmenistan 151
0 33036137100 Uganda 25
1 001100 Ukraine 0
0 000100 United Kingdom 0
1 3,20115444,4213,7013,897 United States 675
0 000000 Uruguay 0
0 5406971,003740980 Uzbekistan 252
3 0022301915 Venezuela 9
1,655 001,6331,89811 Vietnam 265
0 1057618 Yemen 1
0 27016827135 Zambia 39
0 38279644210 Zimbabwe 49
World
9,908 9,9092926,44956,19826,00533,079 World 19,811
Foreign Agricultural Service/USDA 18 May 2021Global Market Analysis
(1,000 HA and 1000 480-lb. Bales)
Table 06: Cotton Supply and Distribution by Country 2020/21
Area
Harvested
Ending
Stocks
ExportsLossUseTotal
Supply
ImportsProductionCountry
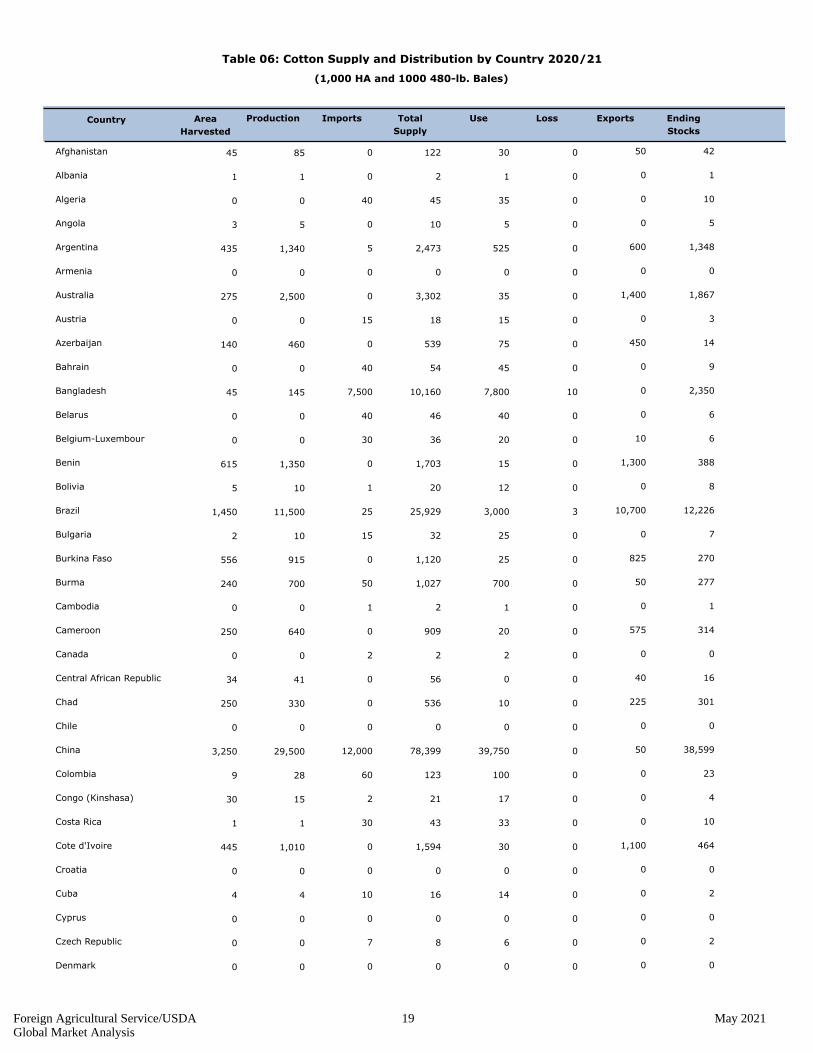
0 500301228545 Afghanistan 42
0 001211 Albania 1
40 00354500 Algeria 10
0 0051053 Angola 5
5 60005252,4731,340435 Argentina 1,348
0 000000 Armenia 0
0 1,4000353,3022,500275 Australia 1,867
15 00151800 Austria 3
0 450075539460140 Azerbaijan 14
40 00455400 Bahrain 9
7,500 0107,80010,16014545 Bangladesh 2,350
40 00404600 Belarus 6
30 100203600 Belgium-Luxembour 6
0 1,3000151,7031,350615 Benin 388
1 001220105 Bolivia 8
25 10,70033,00025,92911,5001,450 Brazil 12,226
15 002532102 Bulgaria 7
0 8250251,120915556 Burkina Faso 270
50 5007001,027700240 Burma 277
1 001200 Cambodia 1
0 575020909640250 Cameroon 314
2 002200 Canada 0
0 4000564134 Central African Republic 16
0 225010536330250 Chad 301
0 000000 Chile 0
12,000 50039,75078,39929,5003,250 China 38,599
60 00100123289 Colombia 23
2 0017211530 Congo (Kinshasa) 4
30 00334311 Costa Rica 10
0 1,1000301,5941,010445 Cote d'Ivoire 464
0 000000 Croatia 0
10 00141644 Cuba 2
0 000000 Cyprus 0
7 006800 Czech Republic 2
0 000000 Denmark 0
Foreign Agricultural Service/USDA 19 May 2021Global Market Analysis

(1,000 HA and 1000 480-lb. Bales)
Table 06: Cotton Supply and Distribution by Country 2020/21 (Continued)
Area
Harvested
Ending
Stocks
ExportsLossUseTotal
Supply
ImportsProductionCountry
1 003534 Dominican Republic 2
50 00607493 Ecuador 14
600 325105501,00921565 Egypt 124
165 0015520111 El Salvador 46
15 00151800 Estonia 3
20 5027535024082 Ethiopia 70
35 10354400 France 8
70 100709000 Germany 10
0 15010372815 Ghana 12
30 1,35025901,6281,400276 Greece 163
130 0013516732 Guatemala 32
0 1800211813 Guinea 3
5 00101157 Haiti 1
65 00657542 Honduras 10
5 500700 Hong Kong 2
3 300300 Hungary 0
800 5,500023,50046,18428,50013,000 India 17,184
2,250 402,4002,89522 Indonesia 491
250 0052569527580 Iran 170
35 0050731510 Iraq 23
0 000000 Ireland 0
2 350449354 Israel 10
135 5013516300 Italy 23
160 0017019500 Japan 25
0 225060388270110 Kazakhstan 103
15 0040642826 Kenya 24
90 001452105519 Korea, North 65
550 10055069011 Korea, South 130
0 100001109518 Kyrgyzstan 10
7 106900 Latvia 2
5 005600 Lebanon 1
80 008511000 Lesotho 25
0 000000 Lithuania 0
5 005600 North Macedonia 1
0 10020453020 Madagascar 15
Foreign Agricultural Service/USDA 20 May 2021Global Market Analysis

(1,000 HA and 1000 480-lb. Bales)
Table 06: Cotton Supply and Distribution by Country 2020/21 (Continued)
Area
Harvested
Ending
Stocks
ExportsLossUseTotal
Supply
ImportsProductionCountry
0 80051649080 Malawi 79
700 30003001,47100 Malaysia 871
0 600025906285165 Mali 281
115 0011513800 Mauritius 23
850 425251,7002,5641,020145 Mexico 414
50 00507200 Moldova 22
28 00303711 Morocco 7
0 10505201115125 Mozambique 91
15 00151700 Netherlands 2
40 004555104 Nicaragua 10
0 6031495 Niger 5
10 1000215434350270 Nigeria 119
5,300 252510,30013,1904,5002,200 Pakistan 2,840
0 000000 Panama 0
5 2005322111 Paraguay 7
210 20240293255 Peru 51
25 00253621 Philippines 11
17 00172000 Poland 3
175 4016521100 Portugal 42
1 001200 Romania 1
100 0010512400 Russia 19
0 3500443818 Senegal 9
8 0081000 Serbia 2
0 000000 Singapore 0
1 001100 Slovakia 0
8 0081000 Slovenia 2
3 001011712 Somalia 1
50 750802637016 South Africa 108
12 27501630326962 Spain 12
1 006855 Sri Lanka 2
0 475070844600200 Sudan 299
0 000000 Sweden 0
2 002300 Switzerland 1
0 15006528914025 Syria 74
200 20025032400 Taiwan 54
Foreign Agricultural Service/USDA 21 May 2021Global Market Analysis

(1,000 HA and 1000 480-lb. Bales)
Table 06: Cotton Supply and Distribution by Country 2020/21 (Continued)
Area
Harvested
Ending
Stocks
ExportsLossUseTotal
Supply
ImportsProductionCountry
0 500080887500160 Tajikistan 307
0 2250150805375450 Tanzania 430
600 12558070521 Thailand 99
0 140015172150120 Togo 17
5 001520102 Tunisia 5
4,800 45007,50010,4662,900350 Turkey 2,516
0 10008001,644920545 Turkmenistan 744
0 150015277170100 Uganda 112
5 005600 Ukraine 1
2 002300 United Kingdom 1
3 16,250112,30021,86114,6083,349 United States 3,300
0 000000 Uruguay 0
0 35003,1504,7083,500975 Uzbekistan 1,208
15 00951358515 Venezuela 40
7,200 007,2008,31431 Vietnam 1,114
0 3025342818 Yemen 6
0 10005291125135 Zambia 186
0 2501030529350240 Zimbabwe 239
World
46,007 46,213144117,408256,927113,10531,656 World 93,162
Foreign Agricultural Service/USDA 22 May 2021Global Market Analysis

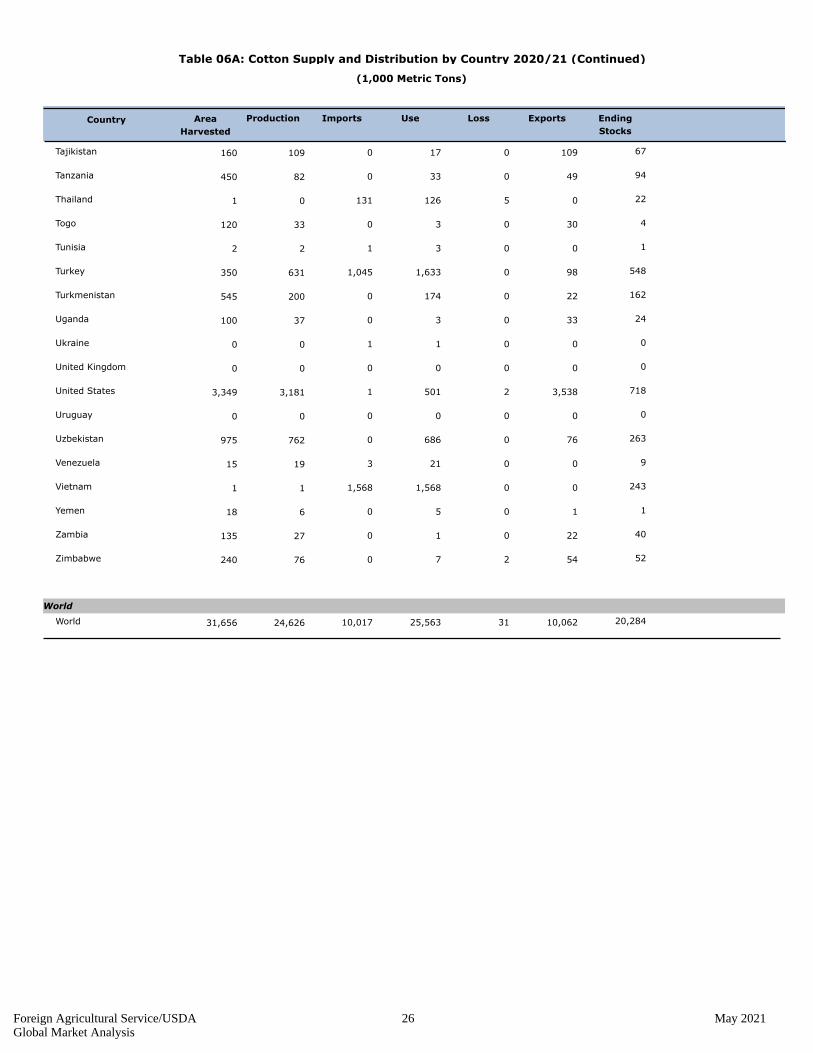
(1,000 Metric Tons)
Table 06A: Cotton Supply and Distribution by Country 2020/21
Area
Harvested
Ending
Stocks
ExportsLossUseImportsProductionCountry
0 911071945 Afghanistan
0 000001 Albania
9 200800 Algeria
0 100113 Angola
1 2931310114292435 Argentina
0 000000 Armenia
0 40630508544275 Australia
3 100300 Austria
0 398016100140 Azerbaijan
9 2001000 Bahrain
1,633 512021,6983245 Bangladesh
9 100900 Belarus
7 120400 Belgium-Luxembour
0 8428303294615 Benin
0 200325 Bolivia
5 2,6622,33016532,5041,450 Brazil
3 200522 Bulgaria
0 5918005199556 Burkina Faso
11 60110152152240 Burma
0 000000 Cambodia
0 6812504139250 Cameroon
0 000000 Canada
0 3900934 Central African Republic
0 66490272250 Chad
0 000000 Chile
2,613 8,4041108,6556,4233,250 China
13 5002269 Colombia
0 1004330 Congo (Kinshasa)
7 200701 Costa Rica
0 10123907220445 Cote d'Ivoire
0 000000 Croatia
2 000314 Cuba
0 000000 Cyprus
2 000100 Czech Republic
0 000000 Denmark
Foreign Agricultural Service/USDA 23 May 2021Global Market Analysis

(1,000 Metric Tons)
Table 06A: Cotton Supply and Distribution by Country 2020/21 (Continued)
Area
Harvested
Ending
Stocks
ExportsLossUseImportsProductionCountry
0 000114 Dominican Republic
11 3001323 Ecuador
131 277121204765 Egypt
36 10003401 El Salvador
3 100300 Estonia
4 1510605282 Ethiopia
8 200800 France
15 2201500 Germany
0 3302615 Ghana
7 35294520305276 Greece
28 7002912 Guatemala
0 1400413 Guinea
1 000217 Haiti
14 2001412 Honduras
1 010000 Hong Kong
1 010000 Hungary
174 3,7411,19705,1176,20513,000 India
490 1071052302 Indonesia
54 37001146080 Iran
8 50011310 Iraq
0 000000 Ireland
0 280184 Israel
29 5102900 Italy
35 5003700 Japan
0 224901359110 Kazakhstan
3 5009626 Kenya
20 1400321219 Korea, North
120 282012001 Korea, South
0 222002118 Kyrgyzstan
2 000100 Latvia
1 000100 Lebanon
17 5001900 Lesotho
0 000000 Lithuania
1 000100 North Macedonia
0 3204720 Madagascar
Foreign Agricultural Service/USDA 24 May 2021Global Market Analysis

(1,000 Metric Tons)
Table 06A: Cotton Supply and Distribution by Country 2020/21 (Continued)
Area
Harvested
Ending
Stocks
ExportsLossUseImportsProductionCountry
0 1717012080 Malawi
152 1906506500 Malaysia
0 611310562165 Mali
25 5002500 Mauritius
185 90935370222145 Mexico
11 5001100 Moldova
6 200701 Morocco
0 20230125125 Mozambique
3 000300 Netherlands
9 2001024 Nicaragua
0 110125 Niger
2 262204776270 Nigeria
1,154 618552,2439802,200 Pakistan
0 000000 Panama
1 2401511 Paraguay
46 11005255 Peru
5 200501 Philippines
4 100400 Poland
38 9103600 Portugal
0 000000 Romania
22 4002300 Russia
0 2800818 Senegal
2 000200 Serbia
0 000000 Singapore
0 000000 Slovakia
2 000200 Slovenia
1 0002212 Somalia
11 24160171516 South Africa
3 360035962 Spain
0 000115 Sri Lanka
0 65103015131200 Sudan
0 000000 Sweden
0 000000 Switzerland
0 16330143025 Syria
44 12405400 Taiwan
Foreign Agricultural Service/USDA 25 May 2021Global Market Analysis
(1,000 Metric Tons)
Table 06A: Cotton Supply and Distribution by Country 2020/21 (Continued)
Area
Harvested
Ending
Stocks
ExportsLossUseImportsProductionCountry
0 67109017109160 Tajikistan
0 944903382450 Tanzania
131 220512601 Thailand
0 4300333120 Togo
1 100322 Tunisia
1,045 5489801,633631350 Turkey
0 162220174200545 Turkmenistan
0 24330337100 Uganda
1 000100 Ukraine
0 000000 United Kingdom
1 7183,53825013,1813,349 United States
0 000000 Uruguay
0 263760686762975 Uzbekistan
3 900211915 Venezuela
1,568 243001,56811 Vietnam
0 1105618 Yemen
0 40220127135 Zambia
0 52542776240 Zimbabwe
World
10,017 20,28410,0623125,56324,62631,656 World
Foreign Agricultural Service/USDA 26 May 2021Global Market Analysis

Table 09: World Cotton Supply and Distribution
(1,000 HA and 1000 480-lb. Bales)
Country Mktg Year Beginning
Stocks
Area
Harvested
Production Imports Total
Supply
Exports Use Loss Total Dom.
Cons.
Ending
Stocks
Stock to
Use %
World
3227,47385,69417085,52429,560142,72730,57887,16533,15324,984 1990/91
4336,97186,55636886,18828,204151,73129,02495,23434,75827,473 1991/92
4034,51086,4006386,33725,435146,34527,06782,30732,64336,971 1992/93
3327,83385,70314385,56026,620140,15627,96777,67930,71834,510 1993/94
3832,02084,292-33084,62228,118144,43030,30086,29732,25027,833 1994/95
4740,13585,396-54485,94027,396152,92727,00493,90335,92032,020 1995/96
5144,63987,351-58587,93626,777158,76728,57990,05333,74040,135 1996/97
5749,47386,686-58187,26726,777162,93625,92992,36833,79744,639 1997/98
6252,85883,651-1,11484,76523,517160,02624,48086,07332,88549,473 1998/99
5651,14490,490-60291,09227,126168,76027,99387,90932,35052,858 1999/00
5449,56290,724-1,42492,14826,156166,44226,20989,08932,01151,144 2000/01
5854,68093,601-78194,38229,081177,36229,29798,50333,71749,562 2001/02
4947,88297,608-80498,41230,400175,89030,18891,02230,75654,680 2002/03
4948,37697,179-90998,08833,152178,70734,15096,67532,25847,882 2003/04
5660,977107,960-1,245109,20534,949203,88633,965121,54535,65848,376 2004/05
5361,906115,178-1,793116,97144,922222,00644,668116,36134,72060,977 2005/06
5162,987122,493-1,715124,20837,416222,89638,305122,68534,57661,906 2006/07
5061,878121,743-2,094123,83738,868222,48939,453120,04932,87862,987 2007/08
5661,453108,860-1,436110,29630,207200,52030,573108,06930,62261,878 2008/09
3946,179119,482-12119,49435,804201,46536,928103,08430,18761,453 2009/10
4349,273115,591119115,47234,910199,77436,297117,29833,82646,179 2010/11
6972,035103,876-210104,08646,029221,94045,423127,24436,05649,273 2011/12
8389,326107,880-343108,22346,360243,56647,630123,90134,31672,035 2012/13
9199,946109,97892109,88641,197251,12141,436120,35932,85589,326 2013/14
95106,830112,589268112,32136,224255,64336,480119,21733,86599,946 2014/15
8090,278113,486264113,22234,949238,71335,72096,16330,753106,830 2015/16
6980,264116,473206116,26738,092234,82937,874106,67729,76190,278 2016/17
6681,091122,993115122,87841,691245,77541,551123,96033,75680,264 2017/18
6680,021120,51543120,47241,556242,09242,435118,56633,34981,091 2018/19
9597,815102,911-36102,94741,447242,17340,735121,41734,96080,021 2019/20
7993,162117,552144117,40846,213256,92746,007113,10531,65697,815 2020/21
7590,992121,609133121,47645,510258,11145,508119,44133,07993,162 2021/22
Foreign Agricultural Service/USDA 27 May 2021Global Market Analysis

Table 10: United States Cotton Supply and Distribution
(1,000 HA and 1000 480-lb. Bales)
Country Mktg Year Area
Harvested
Yield Beginning
Stocks
Production Imports Total
Supply
Exports Use Loss Ending
Stocks
Stock to
Use %
United States
142,344-2858,6577,79318,509415,5053,0007114,748 1990/91
233,70489,6136,64619,9711317,6142,3447315,245 1991/92
304,662-19010,2505,20119,923116,2183,7047854,501 1992/93
203,530-810,4186,86220,802616,1344,6626795,173 1993/94
132,650-3811,1989,40223,2122019,6623,5307945,391 1994/95
142,6092710,6477,67520,95840817,9002,6506026,478 1995/96
223,971-811,1266,86521,95440318,9422,6097915,216 1996/97
213,8874111,3497,50022,7771318,7933,9717545,425 1997/98
273,939-39410,4014,29818,24443913,9183,8877014,324 1998/99
233,91514510,1946,75021,0049716,9683,9396805,433 1999/00
386,000-4838,8626,74021,1191617,1883,9157085,282 2000/01
407,4481807,69611,00026,3242120,3036,0007905,596 2001/02
285,3851667,27311,90024,7246717,2097,4487465,025 2002/03
173,4502116,26613,75823,6854518,2555,3858184,858 2003/04
265,4951086,69114,43626,7302923,2513,4509585,284 2004/05
266,069-2005,87117,67329,4132823,8905,4959315,586 2005/06
539,4793034,93512,95927,6761921,5886,0699125,152 2006/07
5510,0514294,58413,63428,6981219,2079,4799854,245 2007/08
386,337-2633,54113,26122,876012,82510,0519123,063 2008/09
192,947-143,55012,03718,520012,1836,3378703,049 2009/10
142,6001823,90014,37621,058918,1022,9479104,330 2010/11
223,350-1723,30011,71418,1921915,5732,6008863,829 2011/12
233,8003483,50013,02620,6741017,3143,3509993,772 2012/13
172,3502923,55010,53016,7221312,9093,8009213,051 2013/14
253,6502103,57511,24618,6811216,3192,3509393,785 2014/15
303,8001683,4509,15316,5713312,8883,6508593,268 2015/16
152,750603,25014,91720,977717,1703,8009723,848 2016/17
224,200-303,22516,28123,676320,9232,7501,0144,492 2017/18
274,850-922,97514,83722,570318,3674,2009894,043 2018/19
417,250-1612,15015,52724,766319,9134,8509324,653 2019/20
183,300112,30016,25021,861314,6087,2509503,349 2020/21
183,10032,50014,70020,303317,0003,3009503,897 2021/22
Foreign Agricultural Service/USDA 28 May 2021Global Market Analysis
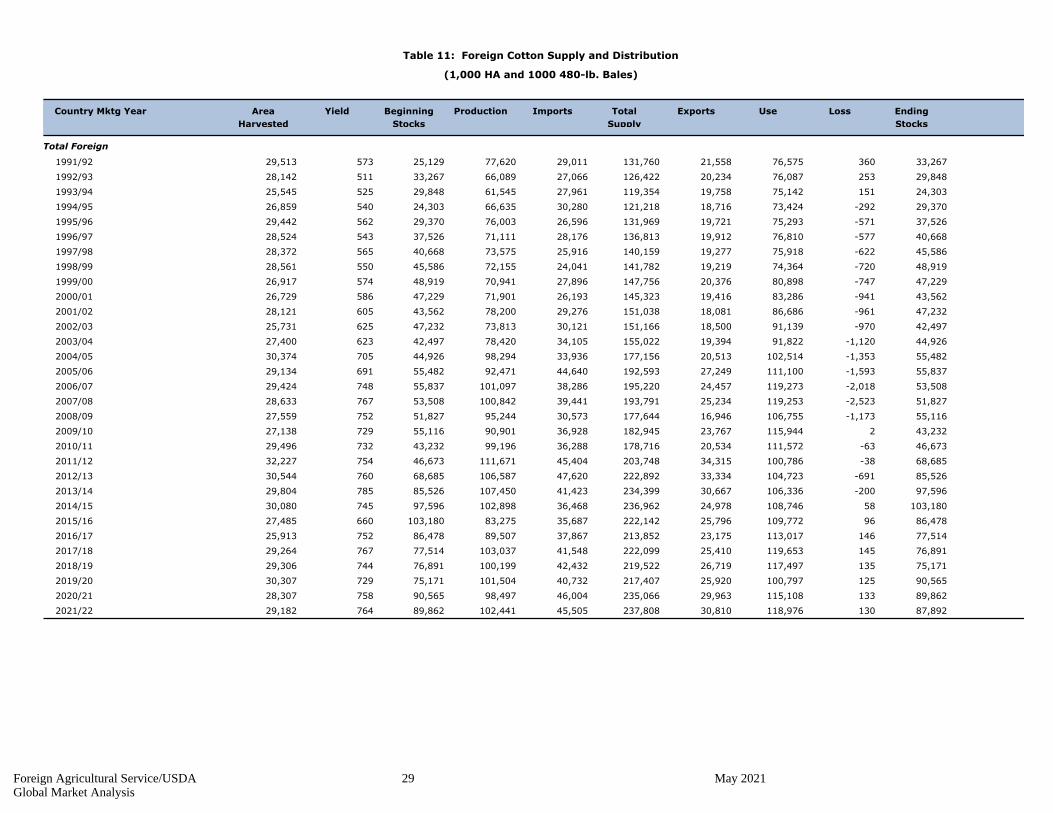
Table 11: Foreign Cotton Supply and Distribution
(1,000 HA and 1000 480-lb. Bales)
Country Mktg Year Area
Harvested
Yield Beginning
Stocks
Production Imports Total
Supply
Exports Use Loss Ending
Stocks
Total Foreign
33,26736076,57521,558131,76029,01177,62025,12957329,513 1991/92
29,84825376,08720,234126,42227,06666,08933,26751128,142 1992/93
24,30315175,14219,758119,35427,96161,54529,84852525,545 1993/94
29,370-29273,42418,716121,21830,28066,63524,30354026,859 1994/95
37,526-57175,29319,721131,96926,59676,00329,37056229,442 1995/96
40,668-57776,81019,912136,81328,17671,11137,52654328,524 1996/97
45,586-62275,91819,277140,15925,91673,57540,66856528,372 1997/98
48,919-72074,36419,219141,78224,04172,15545,58655028,561 1998/99
47,229-74780,89820,376147,75627,89670,94148,91957426,917 1999/00
43,562-94183,28619,416145,32326,19371,90147,22958626,729 2000/01
47,232-96186,68618,081151,03829,27678,20043,56260528,121 2001/02
42,497-97091,13918,500151,16630,12173,81347,23262525,731 2002/03
44,926-1,12091,82219,394155,02234,10578,42042,49762327,400 2003/04
55,482-1,353102,51420,513177,15633,93698,29444,92670530,374 2004/05
55,837-1,593111,10027,249192,59344,64092,47155,48269129,134 2005/06
53,508-2,018119,27324,457195,22038,286101,09755,83774829,424 2006/07
51,827-2,523119,25325,234193,79139,441100,84253,50876728,633 2007/08
55,116-1,173106,75516,946177,64430,57395,24451,82775227,559 2008/09
43,2322115,94423,767182,94536,92890,90155,11672927,138 2009/10
46,673-63111,57220,534178,71636,28899,19643,23273229,496 2010/11
68,685-38100,78634,315203,74845,404111,67146,67375432,227 2011/12
85,526-691104,72333,334222,89247,620106,58768,68576030,544 2012/13
97,596-200106,33630,667234,39941,423107,45085,52678529,804 2013/14
103,18058108,74624,978236,96236,468102,89897,59674530,080 2014/15
86,47896109,77225,796222,14235,68783,275103,18066027,485 2015/16
77,514146113,01723,175213,85237,86789,50786,47875225,913 2016/17
76,891145119,65325,410222,09941,548103,03777,51476729,264 2017/18
75,171135117,49726,719219,52242,432100,19976,89174429,306 2018/19
90,565125100,79725,920217,40740,732101,50475,17172930,307 2019/20
89,862133115,10829,963235,06646,00498,49790,56575828,307 2020/21
87,892130118,97630,810237,80845,505102,44189,86276429,182 2021/22
Foreign Agricultural Service/USDA 29 May 2021Global Market Analysis