UNITED STATES CONSUMER LAW ATTORNEY FEE SURVEY … · United States Consumer Law Attorney Fee...
423
UNITED STATES CONSUMER LAW ATTORNEY FEE SURVEY REPORT 2015-2016 Ronald L. Burdge, Esq.
Transcript of UNITED STATES CONSUMER LAW ATTORNEY FEE SURVEY … · United States Consumer Law Attorney Fee...

UNITED STATESCONSUMER LAW
ATTORNEY FEE SURVEYREPORT
2015-2016
Ronald L. Burdge, Esq.

United States Consumer LawAttorney Fee Survey Report 2015-2016
Survey Conducted Byand
Survey Report Authored By
Ronald L. Burdge, Esq.Burdge Law Office Co. L.A.
8250 Washington Village DriveDayton, OH 45458-1850
Voice: 937.432.9500Fax: 937.432.9503
Email: [email protected]
Attribution, No DerivsCC-BY-ND
This copyright license allows for redistribution, commercial and non-commercial, aslong as all quoted and selected contents are passed along unchanged and with credit tothe author.
Copyright © 2017, 2018 by R.L.BurdgeMarch 13, 2018
This publication contains the results of proprietary research.
This publication was created to provide accurate and authoritative informationconcerning the subject matter covered. The publisher is not engaged in rendering legalor other professional advice and this publication is not a substitute for the advice of anattorney or expert. If you require legal or other expert advice, you should seek theservices of a competent attorney or other professional.

Acknowledgments
This work is dedicated to the private and public practice members of the Consumer Lawbar and the Judicial officers who decide Consumer Law cases across the United Statesand its territories, all of whom tirelessly dedicate their careers to helping people findJustice every day in our legal system. Without their support and participation, theresearch for this publication would not have been possible.
A special thanks is extended to Ira Rheingold, Willard Ogburn, and Jon Sheldon fortheir constant encouragement of this project since the survey began in 1999. I am alsoindebted to Edward Boltz for his advice and assistance over the past year. The support,suggestions and comments from countless others over the years have contributedgreatly to the result before you.
I am especially grateful to the members of the National Association of ConsumerAdvocates and the National Association of Consumer Bankruptcy Attorneys and themany friends and supporters of the National Consumer Law Center, and to theConsumer Law bar who participated in the research that formed the foundation of thisSurvey Report. They are the men and women who tirelessly work in the field ofConsumer Law to further the cause of Justice.
Finally, no words could adequately express my thanks to my wife, who guided,supported and encouraged me every day for the decades throughout this work. I couldnot do what I do, and I would accomplish nothing without her.
Ronald L. Burdge, Esq.March 13, 2018

Table of Contents
1. Introduction. . . . . . . . . . . . . . . . . . . . . . . . . . . . . . . . . . . . . . . . . . . . . . . . . . . . . . . . . . . . . . 1Goals of Survey Report . . . . . . . . . . . . . . . . . . . . . . . . . . . . . . . . . . . . . . . . . . . . . . . . . 2What’s New . . . . . . . . . . . . . . . . . . . . . . . . . . . . . . . . . . . . . . . . . . . . . . . . . . . . . . . . . . 2Survey Report Sections Explained . . . . . . . . . . . . . . . . . . . . . . . . . . . . . . . . . . . . . . . 5Niche Areas in the Field of Consumer Law Defined . . . . . . . . . . . . . . . . . . . . . . . . . 7Geographic Areas Defined . . . . . . . . . . . . . . . . . . . . . . . . . . . . . . . . . . . . . . . . . . . . . . 7The Average and the Median: What it Means to You . . . . . . . . . . . . . . . . . . . . . . . . 8Interpreting the Findings: Primary and Minor Variable Factors . . . . . . . . . . . . . 10Data Gathering Methodology . . . . . . . . . . . . . . . . . . . . . . . . . . . . . . . . . . . . . . . . . . 11Data Analysis Methodology . . . . . . . . . . . . . . . . . . . . . . . . . . . . . . . . . . . . . . . . . . . . 13Peer Review of Methodologies and Survey Analyses . . . . . . . . . . . . . . . . . . . . . . . 15Error Rate . . . . . . . . . . . . . . . . . . . . . . . . . . . . . . . . . . . . . . . . . . . . . . . . . . . . . . . . . . 15Section 508 Compliance. . . . . . . . . . . . . . . . . . . . . . . . . . . . . . . . . . . . . . . . . . . . . . . 15
2. Summary Profile of the Typical U.S. Consumer Law Attorney . . . . . . . . . . . . . . . . . . . 17National Summary Profile Data . . . . . . . . . . . . . . . . . . . . . . . . . . . . . . . . . . 17Conclusions . . . . . . . . . . . . . . . . . . . . . . . . . . . . . . . . . . . . . . . . . . . . . . . . . . . 26National Summary Profile Table . . . . . . . . . . . . . . . . . . . . . . . . . . . . . . . . . . 27National Median Rates for Practice Areas Table . . . . . . . . . . . . . . . . . . . . . 28National Experience Variable Table . . . . . . . . . . . . . . . . . . . . . . . . . . . . . . . 28National Specialty Variable Table . . . . . . . . . . . . . . . . . . . . . . . . . . . . . . . . . 29National Small Firm Size Variable Table . . . . . . . . . . . . . . . . . . . . . . . . . . . 29National Large Firm Size Variable Table . . . . . . . . . . . . . . . . . . . . . . . . . . . 30
3. State Summary Tables . . . . . . . . . . . . . . . . . . . . . . . . . . . . . . . . . . . . . . . . . . . . . . . . . . . . 31Explanation of Tables . . . . . . . . . . . . . . . . . . . . . . . . . . . . . . . . . . . . . . . . . . . . . . . . . 31Alabama . . . . . . . . . . . . . . . . . . . . . . . . . . . . . . . . . . . . . . . . . . . . . . . . . . . . . . . . . . . . 34
Median Rates for Practice Areas . . . . . . . . . . . . . . . . . . . . . . . . . . . . . . . . . . 35Alaska . . . . . . . . . . . . . . . . . . . . . . . . . . . . . . . . . . . . . . . . . . . . . . . . . . . . . . . . . . . . . . 36
Median Rates for Practice Areas . . . . . . . . . . . . . . . . . . . . . . . . . . . . . . . . . . 37Arizona . . . . . . . . . . . . . . . . . . . . . . . . . . . . . . . . . . . . . . . . . . . . . . . . . . . . . . . . . . . . . 38
Median Rates for Practice Areas . . . . . . . . . . . . . . . . . . . . . . . . . . . . . . . . . . 39Arkansas. . . . . . . . . . . . . . . . . . . . . . . . . . . . . . . . . . . . . . . . . . . . . . . . . . . . . . . . . . . . 40
Median Rates for Practice Areas . . . . . . . . . . . . . . . . . . . . . . . . . . . . . . . . . . 41California . . . . . . . . . . . . . . . . . . . . . . . . . . . . . . . . . . . . . . . . . . . . . . . . . . . . . . . . . . . 42
Median Rates for Practice Areas . . . . . . . . . . . . . . . . . . . . . . . . . . . . . . . . . . 43Experience Variable Table . . . . . . . . . . . . . . . . . . . . . . . . . . . . . . . . . . . . . . . 43Specialty Variable Table . . . . . . . . . . . . . . . . . . . . . . . . . . . . . . . . . . . . . . . . . 44Small Firm Size Variable Table . . . . . . . . . . . . . . . . . . . . . . . . . . . . . . . . . . . 44Large Firm Size Variable Table . . . . . . . . . . . . . . . . . . . . . . . . . . . . . . . . . . . 45
Colorado. . . . . . . . . . . . . . . . . . . . . . . . . . . . . . . . . . . . . . . . . . . . . . . . . . . . . . . . . . . . 46Median Rates for Practice Areas . . . . . . . . . . . . . . . . . . . . . . . . . . . . . . . . . . 47
i

Connecticut . . . . . . . . . . . . . . . . . . . . . . . . . . . . . . . . . . . . . . . . . . . . . . . . . . . . . . . . . 48Median Rates for Practice Areas . . . . . . . . . . . . . . . . . . . . . . . . . . . . . . . . . . 49
Delaware . . . . . . . . . . . . . . . . . . . . . . . . . . . . . . . . . . . . . . . . . . . . . . . . . . . . . . . . . . . 50Median Rates for Practice Areas . . . . . . . . . . . . . . . . . . . . . . . . . . . . . . . . . . 51
District of Columbia . . . . . . . . . . . . . . . . . . . . . . . . . . . . . . . . . . . . . . . . . . . . . . . . . . 52Median Rates for Practice Areas . . . . . . . . . . . . . . . . . . . . . . . . . . . . . . . . . . 53
Florida . . . . . . . . . . . . . . . . . . . . . . . . . . . . . . . . . . . . . . . . . . . . . . . . . . . . . . . . . . . . . 54Median Rates for Practice Areas . . . . . . . . . . . . . . . . . . . . . . . . . . . . . . . . . . 55Experience Variable Table . . . . . . . . . . . . . . . . . . . . . . . . . . . . . . . . . . . . . . . 55Specialty Variable Table . . . . . . . . . . . . . . . . . . . . . . . . . . . . . . . . . . . . . . . . . 56Small Firm Size Variable Table . . . . . . . . . . . . . . . . . . . . . . . . . . . . . . . . . . . 56Large Firm Size Variable Table . . . . . . . . . . . . . . . . . . . . . . . . . . . . . . . . . . . 57
Georgia . . . . . . . . . . . . . . . . . . . . . . . . . . . . . . . . . . . . . . . . . . . . . . . . . . . . . . . . . . . . . 58Median Rates for Practice Areas . . . . . . . . . . . . . . . . . . . . . . . . . . . . . . . . . . 59Experience Variable Table . . . . . . . . . . . . . . . . . . . . . . . . . . . . . . . . . . . . . . . 59Specialty Variable Table . . . . . . . . . . . . . . . . . . . . . . . . . . . . . . . . . . . . . . . . . 60Small Firm Size Variable Table . . . . . . . . . . . . . . . . . . . . . . . . . . . . . . . . . . . 60Large Firm Size Variable Table . . . . . . . . . . . . . . . . . . . . . . . . . . . . . . . . . . . 61
Hawaii . . . . . . . . . . . . . . . . . . . . . . . . . . . . . . . . . . . . . . . . . . . . . . . . . . . . . . . . . . . . . 62Median Rates for Practice Areas . . . . . . . . . . . . . . . . . . . . . . . . . . . . . . . . . . 63
Idaho. . . . . . . . . . . . . . . . . . . . . . . . . . . . . . . . . . . . . . . . . . . . . . . . . . . . . . . . . . . . . . . 64Median Rates for Practice Areas . . . . . . . . . . . . . . . . . . . . . . . . . . . . . . . . . . 65Experience Variable Table . . . . . . . . . . . . . . . . . . . . . . . . . . . . . . . . . . . . . . . 65
Illinois. . . . . . . . . . . . . . . . . . . . . . . . . . . . . . . . . . . . . . . . . . . . . . . . . . . . . . . . . . . . . . 66Median Rates for Practice Areas . . . . . . . . . . . . . . . . . . . . . . . . . . . . . . . . . . 67Experience Variable Table . . . . . . . . . . . . . . . . . . . . . . . . . . . . . . . . . . . . . . . 67Specialty Variable Table . . . . . . . . . . . . . . . . . . . . . . . . . . . . . . . . . . . . . . . . . 68Small Firm Size Variable Table . . . . . . . . . . . . . . . . . . . . . . . . . . . . . . . . . . . 68Large Firm Size Variable Table . . . . . . . . . . . . . . . . . . . . . . . . . . . . . . . . . . . 69
Indiana . . . . . . . . . . . . . . . . . . . . . . . . . . . . . . . . . . . . . . . . . . . . . . . . . . . . . . . . . . . . . 70Median Rates for Practice Areas . . . . . . . . . . . . . . . . . . . . . . . . . . . . . . . . . . 71
Iowa . . . . . . . . . . . . . . . . . . . . . . . . . . . . . . . . . . . . . . . . . . . . . . . . . . . . . . . . . . . . . . . 72Median Rates for Practice Areas . . . . . . . . . . . . . . . . . . . . . . . . . . . . . . . . . . 73
Kansas . . . . . . . . . . . . . . . . . . . . . . . . . . . . . . . . . . . . . . . . . . . . . . . . . . . . . . . . . . . . . 74Median Rates for Practice Areas . . . . . . . . . . . . . . . . . . . . . . . . . . . . . . . . . . 75
Kentucky . . . . . . . . . . . . . . . . . . . . . . . . . . . . . . . . . . . . . . . . . . . . . . . . . . . . . . . . . . . 76Median Rates for Practice Areas . . . . . . . . . . . . . . . . . . . . . . . . . . . . . . . . . . 77
Louisiana . . . . . . . . . . . . . . . . . . . . . . . . . . . . . . . . . . . . . . . . . . . . . . . . . . . . . . . . . . . 78Median Rates for Practice Areas . . . . . . . . . . . . . . . . . . . . . . . . . . . . . . . . . . 79
Maine . . . . . . . . . . . . . . . . . . . . . . . . . . . . . . . . . . . . . . . . . . . . . . . . . . . . . . . . . . . . . . 80Median Rates for Practice Areas . . . . . . . . . . . . . . . . . . . . . . . . . . . . . . . . . . 81
Maryland . . . . . . . . . . . . . . . . . . . . . . . . . . . . . . . . . . . . . . . . . . . . . . . . . . . . . . . . . . . 82Median Rates for Practice Areas . . . . . . . . . . . . . . . . . . . . . . . . . . . . . . . . . . 83
Massachusetts . . . . . . . . . . . . . . . . . . . . . . . . . . . . . . . . . . . . . . . . . . . . . . . . . . . . . . . 84Median Rates for Practice Areas . . . . . . . . . . . . . . . . . . . . . . . . . . . . . . . . . . 85
ii

Experience Variable Table . . . . . . . . . . . . . . . . . . . . . . . . . . . . . . . . . . . . . . . 85Specialty Variable Table . . . . . . . . . . . . . . . . . . . . . . . . . . . . . . . . . . . . . . . . . 86Small Firm Size Variable Table . . . . . . . . . . . . . . . . . . . . . . . . . . . . . . . . . . . 86Large Firm Size Variable Table . . . . . . . . . . . . . . . . . . . . . . . . . . . . . . . . . . . 87
Michigan. . . . . . . . . . . . . . . . . . . . . . . . . . . . . . . . . . . . . . . . . . . . . . . . . . . . . . . . . . . . 88Median Rates for Practice Areas . . . . . . . . . . . . . . . . . . . . . . . . . . . . . . . . . . 89Experience Variable Table . . . . . . . . . . . . . . . . . . . . . . . . . . . . . . . . . . . . . . . 89Specialty Variable Table . . . . . . . . . . . . . . . . . . . . . . . . . . . . . . . . . . . . . . . . . 90Small Firm Size Variable Table . . . . . . . . . . . . . . . . . . . . . . . . . . . . . . . . . . . 90Large Firm Size Variable Table . . . . . . . . . . . . . . . . . . . . . . . . . . . . . . . . . . . 91
Minnesota . . . . . . . . . . . . . . . . . . . . . . . . . . . . . . . . . . . . . . . . . . . . . . . . . . . . . . . . . . 92Median Rates for Practice Areas . . . . . . . . . . . . . . . . . . . . . . . . . . . . . . . . . . 93
Mississippi . . . . . . . . . . . . . . . . . . . . . . . . . . . . . . . . . . . . . . . . . . . . . . . . . . . . . . . . . . 94Median Rates for Practice Areas . . . . . . . . . . . . . . . . . . . . . . . . . . . . . . . . . . 95
Missouri . . . . . . . . . . . . . . . . . . . . . . . . . . . . . . . . . . . . . . . . . . . . . . . . . . . . . . . . . . . . 96Median Rates for Practice Areas . . . . . . . . . . . . . . . . . . . . . . . . . . . . . . . . . . 97
Montana . . . . . . . . . . . . . . . . . . . . . . . . . . . . . . . . . . . . . . . . . . . . . . . . . . . . . . . . . . . . 98Median Rates for Practice Areas . . . . . . . . . . . . . . . . . . . . . . . . . . . . . . . . . . 99
Nebraska . . . . . . . . . . . . . . . . . . . . . . . . . . . . . . . . . . . . . . . . . . . . . . . . . . . . . . . . . . 100Median Rates for Practice Areas . . . . . . . . . . . . . . . . . . . . . . . . . . . . . . . . . 101
Nevada . . . . . . . . . . . . . . . . . . . . . . . . . . . . . . . . . . . . . . . . . . . . . . . . . . . . . . . . . . . . 102Median Rates for Practice Areas . . . . . . . . . . . . . . . . . . . . . . . . . . . . . . . . . 103
New Hampshire. . . . . . . . . . . . . . . . . . . . . . . . . . . . . . . . . . . . . . . . . . . . . . . . . . . . . 104Median Rates for Practice Areas . . . . . . . . . . . . . . . . . . . . . . . . . . . . . . . . . 105
New Jersey . . . . . . . . . . . . . . . . . . . . . . . . . . . . . . . . . . . . . . . . . . . . . . . . . . . . . . . . . 106Median Rates for Practice Areas . . . . . . . . . . . . . . . . . . . . . . . . . . . . . . . . . 107
New Mexico . . . . . . . . . . . . . . . . . . . . . . . . . . . . . . . . . . . . . . . . . . . . . . . . . . . . . . . . 108Median Rates for Practice Areas . . . . . . . . . . . . . . . . . . . . . . . . . . . . . . . . . 109
New York . . . . . . . . . . . . . . . . . . . . . . . . . . . . . . . . . . . . . . . . . . . . . . . . . . . . . . . . . . 110Median Rates for Practice Areas . . . . . . . . . . . . . . . . . . . . . . . . . . . . . . . . . 111Experience Variable Table . . . . . . . . . . . . . . . . . . . . . . . . . . . . . . . . . . . . . . 111Specialty Variable Table . . . . . . . . . . . . . . . . . . . . . . . . . . . . . . . . . . . . . . . . 112Small Firm Size Variable Table . . . . . . . . . . . . . . . . . . . . . . . . . . . . . . . . . . 112Large Firm Size Variable Table . . . . . . . . . . . . . . . . . . . . . . . . . . . . . . . . . . 113
North Carolina. . . . . . . . . . . . . . . . . . . . . . . . . . . . . . . . . . . . . . . . . . . . . . . . . . . . . . 114Median Rates for Practice Areas . . . . . . . . . . . . . . . . . . . . . . . . . . . . . . . . . 115
North Dakota. . . . . . . . . . . . . . . . . . . . . . . . . . . . . . . . . . . . . . . . . . . . . . . . . . . . . . . 116Median Rates for Practice Areas . . . . . . . . . . . . . . . . . . . . . . . . . . . . . . . . . 117
Ohio . . . . . . . . . . . . . . . . . . . . . . . . . . . . . . . . . . . . . . . . . . . . . . . . . . . . . . . . . . . . . . 118Median Rates for Practice Areas . . . . . . . . . . . . . . . . . . . . . . . . . . . . . . . . . 119Experience Variable Table . . . . . . . . . . . . . . . . . . . . . . . . . . . . . . . . . . . . . . 119Specialty Variable Table . . . . . . . . . . . . . . . . . . . . . . . . . . . . . . . . . . . . . . . . 120Small Firm Size Variable Table . . . . . . . . . . . . . . . . . . . . . . . . . . . . . . . . . . 120Large Firm Size Variable Table . . . . . . . . . . . . . . . . . . . . . . . . . . . . . . . . . . 121
Oklahoma. . . . . . . . . . . . . . . . . . . . . . . . . . . . . . . . . . . . . . . . . . . . . . . . . . . . . . . . . . 122
iii

Median Rates for Practice Areas . . . . . . . . . . . . . . . . . . . . . . . . . . . . . . . . . 123Oregon . . . . . . . . . . . . . . . . . . . . . . . . . . . . . . . . . . . . . . . . . . . . . . . . . . . . . . . . . . . . 124
Median Rates for Practice Areas . . . . . . . . . . . . . . . . . . . . . . . . . . . . . . . . . 125Pennsylvania . . . . . . . . . . . . . . . . . . . . . . . . . . . . . . . . . . . . . . . . . . . . . . . . . . . . . . . 126
Median Rates for Practice Areas . . . . . . . . . . . . . . . . . . . . . . . . . . . . . . . . . 127Experience Variable Table . . . . . . . . . . . . . . . . . . . . . . . . . . . . . . . . . . . . . . 127Specialty Variable Table . . . . . . . . . . . . . . . . . . . . . . . . . . . . . . . . . . . . . . . . 128Small Firm Size Variable Table . . . . . . . . . . . . . . . . . . . . . . . . . . . . . . . . . . 128Large Firm Size Variable Table . . . . . . . . . . . . . . . . . . . . . . . . . . . . . . . . . . 129
Puerto Rico . . . . . . . . . . . . . . . . . . . . . . . . . . . . . . . . . . . . . . . . . . . . . . . . . . . . . . . . 130Median Rates for Practice Areas . . . . . . . . . . . . . . . . . . . . . . . . . . . . . . . . . 131
Rhode Island . . . . . . . . . . . . . . . . . . . . . . . . . . . . . . . . . . . . . . . . . . . . . . . . . . . . . . . 132Median Rates for Practice Areas . . . . . . . . . . . . . . . . . . . . . . . . . . . . . . . . . 133
South Carolina . . . . . . . . . . . . . . . . . . . . . . . . . . . . . . . . . . . . . . . . . . . . . . . . . . . . . 134Median Rates for Practice Areas . . . . . . . . . . . . . . . . . . . . . . . . . . . . . . . . . 135
South Dakota . . . . . . . . . . . . . . . . . . . . . . . . . . . . . . . . . . . . . . . . . . . . . . . . . . . . . . . 136Median Rates for Practice Areas . . . . . . . . . . . . . . . . . . . . . . . . . . . . . . . . . 137
Tennessee. . . . . . . . . . . . . . . . . . . . . . . . . . . . . . . . . . . . . . . . . . . . . . . . . . . . . . . . . . 138Median Rates for Practice Areas . . . . . . . . . . . . . . . . . . . . . . . . . . . . . . . . . 139
Texas. . . . . . . . . . . . . . . . . . . . . . . . . . . . . . . . . . . . . . . . . . . . . . . . . . . . . . . . . . . . . . 140Median Rates for Practice Areas . . . . . . . . . . . . . . . . . . . . . . . . . . . . . . . . . 141Experience Variable Table . . . . . . . . . . . . . . . . . . . . . . . . . . . . . . . . . . . . . . 141Specialty Variable Table . . . . . . . . . . . . . . . . . . . . . . . . . . . . . . . . . . . . . . . . 142Small Firm Size Variable Table . . . . . . . . . . . . . . . . . . . . . . . . . . . . . . . . . . 142Large Firm Size Variable Table . . . . . . . . . . . . . . . . . . . . . . . . . . . . . . . . . . 143
Utah . . . . . . . . . . . . . . . . . . . . . . . . . . . . . . . . . . . . . . . . . . . . . . . . . . . . . . . . . . . . . . 144Median Rates for Practice Areas . . . . . . . . . . . . . . . . . . . . . . . . . . . . . . . . . 145
Vermont . . . . . . . . . . . . . . . . . . . . . . . . . . . . . . . . . . . . . . . . . . . . . . . . . . . . . . . . . . . 146Median Rates for Practice Areas . . . . . . . . . . . . . . . . . . . . . . . . . . . . . . . . . 147
Virgin Islands U.S. . . . . . . . . . . . . . . . . . . . . . . . . . . . . . . . . . . . . . . . . . . . . . . . . . . 148Median Rates for Practice Areas . . . . . . . . . . . . . . . . . . . . . . . . . . . . . . . . . 149
Virginia. . . . . . . . . . . . . . . . . . . . . . . . . . . . . . . . . . . . . . . . . . . . . . . . . . . . . . . . . . . . 150Median Rates for Practice Areas . . . . . . . . . . . . . . . . . . . . . . . . . . . . . . . . . 151
Washington . . . . . . . . . . . . . . . . . . . . . . . . . . . . . . . . . . . . . . . . . . . . . . . . . . . . . . . . 152Median Rates for Practice Areas . . . . . . . . . . . . . . . . . . . . . . . . . . . . . . . . . 153
West Virginia . . . . . . . . . . . . . . . . . . . . . . . . . . . . . . . . . . . . . . . . . . . . . . . . . . . . . . . 154Median Rates for Practice Areas . . . . . . . . . . . . . . . . . . . . . . . . . . . . . . . . . 155
Wisconsin. . . . . . . . . . . . . . . . . . . . . . . . . . . . . . . . . . . . . . . . . . . . . . . . . . . . . . . . . . 156Median Rates for Practice Areas . . . . . . . . . . . . . . . . . . . . . . . . . . . . . . . . . 157
Wyoming . . . . . . . . . . . . . . . . . . . . . . . . . . . . . . . . . . . . . . . . . . . . . . . . . . . . . . . . . . 158Median Rates for Practice Areas . . . . . . . . . . . . . . . . . . . . . . . . . . . . . . . . . 159
4. Metropolitan Area Tables . . . . . . . . . . . . . . . . . . . . . . . . . . . . . . . . . . . . . . . . . . . . . . . . 160Explanation of Table. . . . . . . . . . . . . . . . . . . . . . . . . . . . . . . . . . . . . . . . . . . . . . . . . 160Alabama, Birmingham . . . . . . . . . . . . . . . . . . . . . . . . . . . . . . . . . . . . . . . . . . . . . . . 163
iv

Median Rate for Practice Areas . . . . . . . . . . . . . . . . . . . . . . . . . . . . . . . . . . 163Experience Variable Table . . . . . . . . . . . . . . . . . . . . . . . . . . . . . . . . . . . . . . 163
Alabama, Huntsville . . . . . . . . . . . . . . . . . . . . . . . . . . . . . . . . . . . . . . . . . . . . . . . . . 165Median Rate for Practice Areas . . . . . . . . . . . . . . . . . . . . . . . . . . . . . . . . . . 165Experience Variable Table . . . . . . . . . . . . . . . . . . . . . . . . . . . . . . . . . . . . . . 166
Alabama, Mobile . . . . . . . . . . . . . . . . . . . . . . . . . . . . . . . . . . . . . . . . . . . . . . . . . . . . 167Median Rate for Practice Areas . . . . . . . . . . . . . . . . . . . . . . . . . . . . . . . . . . 167Experience Variable Table . . . . . . . . . . . . . . . . . . . . . . . . . . . . . . . . . . . . . . 168
Alabama, Montgomery . . . . . . . . . . . . . . . . . . . . . . . . . . . . . . . . . . . . . . . . . . . . . . . 169Median Rate for Practice Areas . . . . . . . . . . . . . . . . . . . . . . . . . . . . . . . . . . 169Experience Variable Table . . . . . . . . . . . . . . . . . . . . . . . . . . . . . . . . . . . . . . 170
Alaska, Anchorage. . . . . . . . . . . . . . . . . . . . . . . . . . . . . . . . . . . . . . . . . . . . . . . . . . . 171Median Rate for Practice Areas . . . . . . . . . . . . . . . . . . . . . . . . . . . . . . . . . . 171Experience Variable Table . . . . . . . . . . . . . . . . . . . . . . . . . . . . . . . . . . . . . . 172
Arizona, Flagstaff . . . . . . . . . . . . . . . . . . . . . . . . . . . . . . . . . . . . . . . . . . . . . . . . . . . 173Median Rate for Practice Areas . . . . . . . . . . . . . . . . . . . . . . . . . . . . . . . . . . 173Experience Variable Table . . . . . . . . . . . . . . . . . . . . . . . . . . . . . . . . . . . . . . 174
Arizona, Phoenix . . . . . . . . . . . . . . . . . . . . . . . . . . . . . . . . . . . . . . . . . . . . . . . . . . . . 175Median Rate for Practice Areas . . . . . . . . . . . . . . . . . . . . . . . . . . . . . . . . . . 175Experience Variable Table . . . . . . . . . . . . . . . . . . . . . . . . . . . . . . . . . . . . . . 176
Arizona, Tucson. . . . . . . . . . . . . . . . . . . . . . . . . . . . . . . . . . . . . . . . . . . . . . . . . . . . . 177Median Rate for Practice Areas . . . . . . . . . . . . . . . . . . . . . . . . . . . . . . . . . . 177Experience Variable Table . . . . . . . . . . . . . . . . . . . . . . . . . . . . . . . . . . . . . . 178
Arizona, Yuma . . . . . . . . . . . . . . . . . . . . . . . . . . . . . . . . . . . . . . . . . . . . . . . . . . . . . . 179Median Rate for Practice Areas . . . . . . . . . . . . . . . . . . . . . . . . . . . . . . . . . . 179Experience Variable Table . . . . . . . . . . . . . . . . . . . . . . . . . . . . . . . . . . . . . . 180
California, Fresno . . . . . . . . . . . . . . . . . . . . . . . . . . . . . . . . . . . . . . . . . . . . . . . . . . . 181Median Rate for Practice Areas . . . . . . . . . . . . . . . . . . . . . . . . . . . . . . . . . . 181Experience Variable Table . . . . . . . . . . . . . . . . . . . . . . . . . . . . . . . . . . . . . . 182
California, Los Angeles - Long Beach - Anaheim . . . . . . . . . . . . . . . . . . . . . . . . . 183Median Rate for Practice Areas . . . . . . . . . . . . . . . . . . . . . . . . . . . . . . . . . . 183Experience Variable Table . . . . . . . . . . . . . . . . . . . . . . . . . . . . . . . . . . . . . . 184
California, Sacramento. . . . . . . . . . . . . . . . . . . . . . . . . . . . . . . . . . . . . . . . . . . . . . . 185Median Rate for Practice Areas . . . . . . . . . . . . . . . . . . . . . . . . . . . . . . . . . . 185Experience Variable Table . . . . . . . . . . . . . . . . . . . . . . . . . . . . . . . . . . . . . . 186
California, San Diego . . . . . . . . . . . . . . . . . . . . . . . . . . . . . . . . . . . . . . . . . . . . . . . . 187Median Rate for Practice Areas . . . . . . . . . . . . . . . . . . . . . . . . . . . . . . . . . . 187Experience Variable Table . . . . . . . . . . . . . . . . . . . . . . . . . . . . . . . . . . . . . . 188
California, San Francisco . . . . . . . . . . . . . . . . . . . . . . . . . . . . . . . . . . . . . . . . . . . . . 189Median Rate for Practice Areas . . . . . . . . . . . . . . . . . . . . . . . . . . . . . . . . . . 189Experience Variable Table . . . . . . . . . . . . . . . . . . . . . . . . . . . . . . . . . . . . . . 190
California, San Jose - Santa Clara . . . . . . . . . . . . . . . . . . . . . . . . . . . . . . . . . . . . . . 191Median Rate for Practice Areas . . . . . . . . . . . . . . . . . . . . . . . . . . . . . . . . . . 191Experience Variable Table . . . . . . . . . . . . . . . . . . . . . . . . . . . . . . . . . . . . . . 192
California, Riverside - San Bernardino. . . . . . . . . . . . . . . . . . . . . . . . . . . . . . . . . . 193
v

Median Rate for Practice Areas . . . . . . . . . . . . . . . . . . . . . . . . . . . . . . . . . . 193Experience Variable Table . . . . . . . . . . . . . . . . . . . . . . . . . . . . . . . . . . . . . . 194
Colorado, Colorado Springs . . . . . . . . . . . . . . . . . . . . . . . . . . . . . . . . . . . . . . . . . . . 195Median Rate for Practice Areas . . . . . . . . . . . . . . . . . . . . . . . . . . . . . . . . . . 195Experience Variable Table . . . . . . . . . . . . . . . . . . . . . . . . . . . . . . . . . . . . . . 196
Colorado, Denver . . . . . . . . . . . . . . . . . . . . . . . . . . . . . . . . . . . . . . . . . . . . . . . . . . . 197Median Rate for Practice Areas . . . . . . . . . . . . . . . . . . . . . . . . . . . . . . . . . . 197Experience Variable Table . . . . . . . . . . . . . . . . . . . . . . . . . . . . . . . . . . . . . . 198
Connecticut, New Haven . . . . . . . . . . . . . . . . . . . . . . . . . . . . . . . . . . . . . . . . . . . . . 199Median Rate for Practice Areas . . . . . . . . . . . . . . . . . . . . . . . . . . . . . . . . . . 199Experience Variable Table . . . . . . . . . . . . . . . . . . . . . . . . . . . . . . . . . . . . . 200
Connecticut, Hartford. . . . . . . . . . . . . . . . . . . . . . . . . . . . . . . . . . . . . . . . . . . . . . . . 201Median Rate for Practice Areas . . . . . . . . . . . . . . . . . . . . . . . . . . . . . . . . . . 201Experience Variable Table . . . . . . . . . . . . . . . . . . . . . . . . . . . . . . . . . . . . . . 202
Florida, Cape Coral . . . . . . . . . . . . . . . . . . . . . . . . . . . . . . . . . . . . . . . . . . . . . . . . . . 203Median Rate for Practice Areas . . . . . . . . . . . . . . . . . . . . . . . . . . . . . . . . . . 203Experience Variable Table . . . . . . . . . . . . . . . . . . . . . . . . . . . . . . . . . . . . . . 204
Florida, Jacksonville . . . . . . . . . . . . . . . . . . . . . . . . . . . . . . . . . . . . . . . . . . . . . . . . . 205Median Rate for Practice Areas . . . . . . . . . . . . . . . . . . . . . . . . . . . . . . . . . . 205Experience Variable Table . . . . . . . . . . . . . . . . . . . . . . . . . . . . . . . . . . . . . . 206
Florida, Miami - Fort Lauderdale . . . . . . . . . . . . . . . . . . . . . . . . . . . . . . . . . . . . . . 207Median Rate for Practice Areas . . . . . . . . . . . . . . . . . . . . . . . . . . . . . . . . . . 207Experience Variable Table . . . . . . . . . . . . . . . . . . . . . . . . . . . . . . . . . . . . . . 208
Florida, Tallahassee . . . . . . . . . . . . . . . . . . . . . . . . . . . . . . . . . . . . . . . . . . . . . . . . . 209Median Rate for Practice Areas . . . . . . . . . . . . . . . . . . . . . . . . . . . . . . . . . . 209Experience Variable Table . . . . . . . . . . . . . . . . . . . . . . . . . . . . . . . . . . . . . . 210
Florida, Tampa . . . . . . . . . . . . . . . . . . . . . . . . . . . . . . . . . . . . . . . . . . . . . . . . . . . . . 211Median Rate for Practice Areas . . . . . . . . . . . . . . . . . . . . . . . . . . . . . . . . . . 211Experience Variable Table . . . . . . . . . . . . . . . . . . . . . . . . . . . . . . . . . . . . . . 212
Florida, Orlando . . . . . . . . . . . . . . . . . . . . . . . . . . . . . . . . . . . . . . . . . . . . . . . . . . . . 213Median Rate for Practice Areas . . . . . . . . . . . . . . . . . . . . . . . . . . . . . . . . . . 213Experience Variable Table . . . . . . . . . . . . . . . . . . . . . . . . . . . . . . . . . . . . . . 214
Georgia, Atlanta . . . . . . . . . . . . . . . . . . . . . . . . . . . . . . . . . . . . . . . . . . . . . . . . . . . . 215Median Rate for Practice Areas . . . . . . . . . . . . . . . . . . . . . . . . . . . . . . . . . . 215Experience Variable Table . . . . . . . . . . . . . . . . . . . . . . . . . . . . . . . . . . . . . . 216
Georgia, Macon . . . . . . . . . . . . . . . . . . . . . . . . . . . . . . . . . . . . . . . . . . . . . . . . . . . . . 217Median Rate for Practice Areas . . . . . . . . . . . . . . . . . . . . . . . . . . . . . . . . . . 217Experience Variable Table . . . . . . . . . . . . . . . . . . . . . . . . . . . . . . . . . . . . . . 218
Georgia, Savannah . . . . . . . . . . . . . . . . . . . . . . . . . . . . . . . . . . . . . . . . . . . . . . . . . . 219Median Rate for Practice Areas . . . . . . . . . . . . . . . . . . . . . . . . . . . . . . . . . . 219Experience Variable Table . . . . . . . . . . . . . . . . . . . . . . . . . . . . . . . . . . . . . . 220
Hawaii, Honolulu . . . . . . . . . . . . . . . . . . . . . . . . . . . . . . . . . . . . . . . . . . . . . . . . . . . 221Median Rate for Practice Areas . . . . . . . . . . . . . . . . . . . . . . . . . . . . . . . . . . 221Experience Variable Table . . . . . . . . . . . . . . . . . . . . . . . . . . . . . . . . . . . . . . 222
Illinois, Chicago. . . . . . . . . . . . . . . . . . . . . . . . . . . . . . . . . . . . . . . . . . . . . . . . . . . . . 223
vi

Median Rate for Practice Areas . . . . . . . . . . . . . . . . . . . . . . . . . . . . . . . . . . 223Experience Variable Table . . . . . . . . . . . . . . . . . . . . . . . . . . . . . . . . . . . . . . 224
Illinois, Springfield . . . . . . . . . . . . . . . . . . . . . . . . . . . . . . . . . . . . . . . . . . . . . . . . . . 225Median Rate for Practice Areas . . . . . . . . . . . . . . . . . . . . . . . . . . . . . . . . . . 225Experience Variable Table . . . . . . . . . . . . . . . . . . . . . . . . . . . . . . . . . . . . . . 226
Illinois, St Louis Metro East . . . . . . . . . . . . . . . . . . . . . . . . . . . . . . . . . . . . . . . . . . 227Median Rate for Practice Areas . . . . . . . . . . . . . . . . . . . . . . . . . . . . . . . . . . 227Experience Variable Table . . . . . . . . . . . . . . . . . . . . . . . . . . . . . . . . . . . . . . 228
Indiana, Fort Wayne. . . . . . . . . . . . . . . . . . . . . . . . . . . . . . . . . . . . . . . . . . . . . . . . . 229Median Rate for Practice Areas . . . . . . . . . . . . . . . . . . . . . . . . . . . . . . . . . . 229Experience Variable Table . . . . . . . . . . . . . . . . . . . . . . . . . . . . . . . . . . . . . . 230
Indiana, Gary - Hammond. . . . . . . . . . . . . . . . . . . . . . . . . . . . . . . . . . . . . . . . . . . . 231Median Rate for Practice Areas . . . . . . . . . . . . . . . . . . . . . . . . . . . . . . . . . . 231Experience Variable Table . . . . . . . . . . . . . . . . . . . . . . . . . . . . . . . . . . . . . . 232
Indiana, Indianapolis . . . . . . . . . . . . . . . . . . . . . . . . . . . . . . . . . . . . . . . . . . . . . . . . 233Median Rate for Practice Areas . . . . . . . . . . . . . . . . . . . . . . . . . . . . . . . . . . 233Experience Variable Table . . . . . . . . . . . . . . . . . . . . . . . . . . . . . . . . . . . . . . 234
Indiana, South Bend - Elkhart - Mishawaka . . . . . . . . . . . . . . . . . . . . . . . . . . . . . 235Median Rate for Practice Areas . . . . . . . . . . . . . . . . . . . . . . . . . . . . . . . . . . 235Experience Variable Table . . . . . . . . . . . . . . . . . . . . . . . . . . . . . . . . . . . . . . 236
Iowa, Des Moines . . . . . . . . . . . . . . . . . . . . . . . . . . . . . . . . . . . . . . . . . . . . . . . . . . . 237Median Rate for Practice Areas . . . . . . . . . . . . . . . . . . . . . . . . . . . . . . . . . . 237Experience Variable Table . . . . . . . . . . . . . . . . . . . . . . . . . . . . . . . . . . . . . . 238
Iowa, Dubuque . . . . . . . . . . . . . . . . . . . . . . . . . . . . . . . . . . . . . . . . . . . . . . . . . . . . . 239Median Rate for Practice Areas . . . . . . . . . . . . . . . . . . . . . . . . . . . . . . . . . . 239Experience Variable Table . . . . . . . . . . . . . . . . . . . . . . . . . . . . . . . . . . . . . . 240
Kansas, Kansas City . . . . . . . . . . . . . . . . . . . . . . . . . . . . . . . . . . . . . . . . . . . . . . . . . 241Median Rate for Practice Areas . . . . . . . . . . . . . . . . . . . . . . . . . . . . . . . . . . 241Experience Variable Table . . . . . . . . . . . . . . . . . . . . . . . . . . . . . . . . . . . . . . 242
Kansas, Wichita. . . . . . . . . . . . . . . . . . . . . . . . . . . . . . . . . . . . . . . . . . . . . . . . . . . . . 243Median Rate for Practice Areas . . . . . . . . . . . . . . . . . . . . . . . . . . . . . . . . . . 243Experience Variable Table . . . . . . . . . . . . . . . . . . . . . . . . . . . . . . . . . . . . . . 244
Kentucky, Lexington. . . . . . . . . . . . . . . . . . . . . . . . . . . . . . . . . . . . . . . . . . . . . . . . . 245Median Rate for Practice Areas . . . . . . . . . . . . . . . . . . . . . . . . . . . . . . . . . . 245Experience Variable Table . . . . . . . . . . . . . . . . . . . . . . . . . . . . . . . . . . . . . . 246
Kentucky, Louisville . . . . . . . . . . . . . . . . . . . . . . . . . . . . . . . . . . . . . . . . . . . . . . . . . 247Median Rate for Practice Areas . . . . . . . . . . . . . . . . . . . . . . . . . . . . . . . . . . 247Experience Variable Table . . . . . . . . . . . . . . . . . . . . . . . . . . . . . . . . . . . . . . 248
Louisiana, Shreveport. . . . . . . . . . . . . . . . . . . . . . . . . . . . . . . . . . . . . . . . . . . . . . . . 249Median Rate for Practice Areas . . . . . . . . . . . . . . . . . . . . . . . . . . . . . . . . . . 249Experience Variable Table . . . . . . . . . . . . . . . . . . . . . . . . . . . . . . . . . . . . . . 250
Maryland, Baltimore. . . . . . . . . . . . . . . . . . . . . . . . . . . . . . . . . . . . . . . . . . . . . . . . . 251Median Rate for Practice Areas . . . . . . . . . . . . . . . . . . . . . . . . . . . . . . . . . . 251Experience Variable Table . . . . . . . . . . . . . . . . . . . . . . . . . . . . . . . . . . . . . . 252
Massachusetts, Boston - Cambridge. . . . . . . . . . . . . . . . . . . . . . . . . . . . . . . . . . . . 253
vii

Median Rate for Practice Areas . . . . . . . . . . . . . . . . . . . . . . . . . . . . . . . . . . 253Experience Variable Table . . . . . . . . . . . . . . . . . . . . . . . . . . . . . . . . . . . . . . 254
Massachusetts, Springfield . . . . . . . . . . . . . . . . . . . . . . . . . . . . . . . . . . . . . . . . . . . 255Median Rate for Practice Areas . . . . . . . . . . . . . . . . . . . . . . . . . . . . . . . . . . 255Experience Variable Table . . . . . . . . . . . . . . . . . . . . . . . . . . . . . . . . . . . . . . 256
Michigan, Detroit . . . . . . . . . . . . . . . . . . . . . . . . . . . . . . . . . . . . . . . . . . . . . . . . . . . 257Median Rate for Practice Areas . . . . . . . . . . . . . . . . . . . . . . . . . . . . . . . . . . 257Experience Variable Table . . . . . . . . . . . . . . . . . . . . . . . . . . . . . . . . . . . . . . 258
Michigan, Grand Rapids. . . . . . . . . . . . . . . . . . . . . . . . . . . . . . . . . . . . . . . . . . . . . . 259Median Rate for Practice Areas . . . . . . . . . . . . . . . . . . . . . . . . . . . . . . . . . . 259Experience Variable Table . . . . . . . . . . . . . . . . . . . . . . . . . . . . . . . . . . . . . . 260
Michigan, Lansing. . . . . . . . . . . . . . . . . . . . . . . . . . . . . . . . . . . . . . . . . . . . . . . . . . . 261Median Rate for Practice Areas . . . . . . . . . . . . . . . . . . . . . . . . . . . . . . . . . . 261Experience Variable Table . . . . . . . . . . . . . . . . . . . . . . . . . . . . . . . . . . . . . . 262
Michigan, Marquette . . . . . . . . . . . . . . . . . . . . . . . . . . . . . . . . . . . . . . . . . . . . . . . . 263Median Rate for Practice Areas . . . . . . . . . . . . . . . . . . . . . . . . . . . . . . . . . . 263Experience Variable Table . . . . . . . . . . . . . . . . . . . . . . . . . . . . . . . . . . . . . . 264
Minnesota, Minneapolis - St Paul . . . . . . . . . . . . . . . . . . . . . . . . . . . . . . . . . . . . . . 265Median Rate for Practice Areas . . . . . . . . . . . . . . . . . . . . . . . . . . . . . . . . . . 265Experience Variable Table . . . . . . . . . . . . . . . . . . . . . . . . . . . . . . . . . . . . . . 266
Mississippi, Jackson . . . . . . . . . . . . . . . . . . . . . . . . . . . . . . . . . . . . . . . . . . . . . . . . . 267Median Rate for Practice Areas . . . . . . . . . . . . . . . . . . . . . . . . . . . . . . . . . . 267Experience Variable Table . . . . . . . . . . . . . . . . . . . . . . . . . . . . . . . . . . . . . . 268
Missouri, Columbia. . . . . . . . . . . . . . . . . . . . . . . . . . . . . . . . . . . . . . . . . . . . . . . . . . 269Median Rate for Practice Areas . . . . . . . . . . . . . . . . . . . . . . . . . . . . . . . . . . 269Experience Variable Table . . . . . . . . . . . . . . . . . . . . . . . . . . . . . . . . . . . . . . 270
Missouri, Kansas City . . . . . . . . . . . . . . . . . . . . . . . . . . . . . . . . . . . . . . . . . . . . . . . . 271Median Rate for Practice Areas . . . . . . . . . . . . . . . . . . . . . . . . . . . . . . . . . . 271Experience Variable Table . . . . . . . . . . . . . . . . . . . . . . . . . . . . . . . . . . . . . . 272
Missouri, Springfield . . . . . . . . . . . . . . . . . . . . . . . . . . . . . . . . . . . . . . . . . . . . . . . . 273Median Rate for Practice Areas . . . . . . . . . . . . . . . . . . . . . . . . . . . . . . . . . . 273Experience Variable Table . . . . . . . . . . . . . . . . . . . . . . . . . . . . . . . . . . . . . . 274
Missouri, St Louis . . . . . . . . . . . . . . . . . . . . . . . . . . . . . . . . . . . . . . . . . . . . . . . . . . . 275Median Rate for Practice Areas . . . . . . . . . . . . . . . . . . . . . . . . . . . . . . . . . . 275Experience Variable Table . . . . . . . . . . . . . . . . . . . . . . . . . . . . . . . . . . . . . . 276
Nebraska, Lincoln . . . . . . . . . . . . . . . . . . . . . . . . . . . . . . . . . . . . . . . . . . . . . . . . . . . 277Median Rates for Practice Areas . . . . . . . . . . . . . . . . . . . . . . . . . . . . . . . . . 277Experience Variable Table . . . . . . . . . . . . . . . . . . . . . . . . . . . . . . . . . . . . . . 278
Nebraska, Omaha . . . . . . . . . . . . . . . . . . . . . . . . . . . . . . . . . . . . . . . . . . . . . . . . . . . 279Median Rate for Practice Areas . . . . . . . . . . . . . . . . . . . . . . . . . . . . . . . . . . 279Experience Variable Table . . . . . . . . . . . . . . . . . . . . . . . . . . . . . . . . . . . . . . 280
Nevada, Las Vegas. . . . . . . . . . . . . . . . . . . . . . . . . . . . . . . . . . . . . . . . . . . . . . . . . . . 281Median Rate for Practice Areas . . . . . . . . . . . . . . . . . . . . . . . . . . . . . . . . . . 281Experience Variable Table . . . . . . . . . . . . . . . . . . . . . . . . . . . . . . . . . . . . . . 282
Nevada, Reno - Carson City . . . . . . . . . . . . . . . . . . . . . . . . . . . . . . . . . . . . . . . . . . . 283
viii

Median Rate for Practice Areas . . . . . . . . . . . . . . . . . . . . . . . . . . . . . . . . . . 283Experience Variable Table . . . . . . . . . . . . . . . . . . . . . . . . . . . . . . . . . . . . . . 284
New Jersey, Newark . . . . . . . . . . . . . . . . . . . . . . . . . . . . . . . . . . . . . . . . . . . . . . . . . 285Median Rate for Practice Areas . . . . . . . . . . . . . . . . . . . . . . . . . . . . . . . . . . 285Experience Variable Table . . . . . . . . . . . . . . . . . . . . . . . . . . . . . . . . . . . . . . 286
New Jersey, Trenton. . . . . . . . . . . . . . . . . . . . . . . . . . . . . . . . . . . . . . . . . . . . . . . . . 287Median Rate for Practice Areas . . . . . . . . . . . . . . . . . . . . . . . . . . . . . . . . . . 287Experience Variable Table . . . . . . . . . . . . . . . . . . . . . . . . . . . . . . . . . . . . . . 288
New Mexico, Albuquerque - Santa Fe. . . . . . . . . . . . . . . . . . . . . . . . . . . . . . . . . . . 289Median Rate for Practice Areas . . . . . . . . . . . . . . . . . . . . . . . . . . . . . . . . . . 289Experience Variable Table . . . . . . . . . . . . . . . . . . . . . . . . . . . . . . . . . . . . . . 290
New York, Albany - Schenectady. . . . . . . . . . . . . . . . . . . . . . . . . . . . . . . . . . . . . . . 291Median Rate for Practice Areas . . . . . . . . . . . . . . . . . . . . . . . . . . . . . . . . . . 291Experience Variable Table . . . . . . . . . . . . . . . . . . . . . . . . . . . . . . . . . . . . . . 292
New York, Buffalo . . . . . . . . . . . . . . . . . . . . . . . . . . . . . . . . . . . . . . . . . . . . . . . . . . . 293Median Rate for Practice Areas . . . . . . . . . . . . . . . . . . . . . . . . . . . . . . . . . . 293Experience Variable Table . . . . . . . . . . . . . . . . . . . . . . . . . . . . . . . . . . . . . . 294
New York, New York City. . . . . . . . . . . . . . . . . . . . . . . . . . . . . . . . . . . . . . . . . . . . . 295Median Rate for Practice Areas . . . . . . . . . . . . . . . . . . . . . . . . . . . . . . . . . . 295Experience Variable Table . . . . . . . . . . . . . . . . . . . . . . . . . . . . . . . . . . . . . . 296
New York, Rochester . . . . . . . . . . . . . . . . . . . . . . . . . . . . . . . . . . . . . . . . . . . . . . . . 297Median Rate for Practice Areas . . . . . . . . . . . . . . . . . . . . . . . . . . . . . . . . . . 297Experience Variable Table . . . . . . . . . . . . . . . . . . . . . . . . . . . . . . . . . . . . . . 298
New York, Syracuse . . . . . . . . . . . . . . . . . . . . . . . . . . . . . . . . . . . . . . . . . . . . . . . . . 299Median Rate for Practice Areas . . . . . . . . . . . . . . . . . . . . . . . . . . . . . . . . . . 299Experience Variable Table . . . . . . . . . . . . . . . . . . . . . . . . . . . . . . . . . . . . . . 300
North Carolina, Charlotte . . . . . . . . . . . . . . . . . . . . . . . . . . . . . . . . . . . . . . . . . . . . 301Median Rate for Practice Areas . . . . . . . . . . . . . . . . . . . . . . . . . . . . . . . . . . 301Experience Variable Table . . . . . . . . . . . . . . . . . . . . . . . . . . . . . . . . . . . . . . 302
North Carolina, Greensboro . . . . . . . . . . . . . . . . . . . . . . . . . . . . . . . . . . . . . . . . . . 303Median Rate for Practice Areas . . . . . . . . . . . . . . . . . . . . . . . . . . . . . . . . . . 303Experience Variable Table . . . . . . . . . . . . . . . . . . . . . . . . . . . . . . . . . . . . . . 304
North Carolina, Raleigh . . . . . . . . . . . . . . . . . . . . . . . . . . . . . . . . . . . . . . . . . . . . . . 305Median Rate for Practice Areas . . . . . . . . . . . . . . . . . . . . . . . . . . . . . . . . . . 305Experience Variable Table . . . . . . . . . . . . . . . . . . . . . . . . . . . . . . . . . . . . . . 306
Ohio, Cincinnati . . . . . . . . . . . . . . . . . . . . . . . . . . . . . . . . . . . . . . . . . . . . . . . . . . . . 307Median Rate for Practice Areas . . . . . . . . . . . . . . . . . . . . . . . . . . . . . . . . . . 307Experience Variable Table . . . . . . . . . . . . . . . . . . . . . . . . . . . . . . . . . . . . . . 308
Ohio, Cleveland . . . . . . . . . . . . . . . . . . . . . . . . . . . . . . . . . . . . . . . . . . . . . . . . . . . . . 309Median Rate for Practice Areas . . . . . . . . . . . . . . . . . . . . . . . . . . . . . . . . . . 309Experience Variable Table . . . . . . . . . . . . . . . . . . . . . . . . . . . . . . . . . . . . . . 310
Ohio, Columbus. . . . . . . . . . . . . . . . . . . . . . . . . . . . . . . . . . . . . . . . . . . . . . . . . . . . . 311Median Rate for Practice Areas . . . . . . . . . . . . . . . . . . . . . . . . . . . . . . . . . . 311Experience Variable Table . . . . . . . . . . . . . . . . . . . . . . . . . . . . . . . . . . . . . . 312
Ohio, Toledo . . . . . . . . . . . . . . . . . . . . . . . . . . . . . . . . . . . . . . . . . . . . . . . . . . . . . . . 313
ix

Median Rate for Practice Areas . . . . . . . . . . . . . . . . . . . . . . . . . . . . . . . . . . 313Experience Variable Table . . . . . . . . . . . . . . . . . . . . . . . . . . . . . . . . . . . . . . 314
Oklahoma, Oklahoma City . . . . . . . . . . . . . . . . . . . . . . . . . . . . . . . . . . . . . . . . . . . . 315Median Rate for Practice Areas . . . . . . . . . . . . . . . . . . . . . . . . . . . . . . . . . . 315Experience Variable Table . . . . . . . . . . . . . . . . . . . . . . . . . . . . . . . . . . . . . . 316
Oklahoma, Tulsa . . . . . . . . . . . . . . . . . . . . . . . . . . . . . . . . . . . . . . . . . . . . . . . . . . . . 317Median Rate for Practice Areas . . . . . . . . . . . . . . . . . . . . . . . . . . . . . . . . . . 317Experience Variable Table . . . . . . . . . . . . . . . . . . . . . . . . . . . . . . . . . . . . . . 318
Oregon, Eugene . . . . . . . . . . . . . . . . . . . . . . . . . . . . . . . . . . . . . . . . . . . . . . . . . . . . . 319Median Rate for Practice Areas . . . . . . . . . . . . . . . . . . . . . . . . . . . . . . . . . . 319Experience Variable Table . . . . . . . . . . . . . . . . . . . . . . . . . . . . . . . . . . . . . . 320
Oregon, Portland. . . . . . . . . . . . . . . . . . . . . . . . . . . . . . . . . . . . . . . . . . . . . . . . . . . . 321Median Rate for Practice Areas . . . . . . . . . . . . . . . . . . . . . . . . . . . . . . . . . . 321Experience Variable Table . . . . . . . . . . . . . . . . . . . . . . . . . . . . . . . . . . . . . . 322
Pennsylvania, Philadelphia . . . . . . . . . . . . . . . . . . . . . . . . . . . . . . . . . . . . . . . . . . . 323Median Rate for Practice Areas . . . . . . . . . . . . . . . . . . . . . . . . . . . . . . . . . . 323Experience Variable Table . . . . . . . . . . . . . . . . . . . . . . . . . . . . . . . . . . . . . . 324
Pennsylvania, Pittsburgh . . . . . . . . . . . . . . . . . . . . . . . . . . . . . . . . . . . . . . . . . . . . . 325Median Rate for Practice Areas . . . . . . . . . . . . . . . . . . . . . . . . . . . . . . . . . . 325Experience Variable Table . . . . . . . . . . . . . . . . . . . . . . . . . . . . . . . . . . . . . . 326
Pennsylvania, Scranton . . . . . . . . . . . . . . . . . . . . . . . . . . . . . . . . . . . . . . . . . . . . . . 327Median Rate for Practice Areas . . . . . . . . . . . . . . . . . . . . . . . . . . . . . . . . . . 327Experience Variable Table . . . . . . . . . . . . . . . . . . . . . . . . . . . . . . . . . . . . . . 328
Rhode Island, Providence . . . . . . . . . . . . . . . . . . . . . . . . . . . . . . . . . . . . . . . . . . . . 329Median Rate for Practice Areas . . . . . . . . . . . . . . . . . . . . . . . . . . . . . . . . . . 329Experience Variable Table . . . . . . . . . . . . . . . . . . . . . . . . . . . . . . . . . . . . . . 330
Tennessee, Knoxville . . . . . . . . . . . . . . . . . . . . . . . . . . . . . . . . . . . . . . . . . . . . . . . . 331Median Rate for Practice Areas . . . . . . . . . . . . . . . . . . . . . . . . . . . . . . . . . . 331Experience Variable Table . . . . . . . . . . . . . . . . . . . . . . . . . . . . . . . . . . . . . . 332
Tennessee, Memphis . . . . . . . . . . . . . . . . . . . . . . . . . . . . . . . . . . . . . . . . . . . . . . . . 333Median Rate for Practice Areas . . . . . . . . . . . . . . . . . . . . . . . . . . . . . . . . . . 333Experience Variable Table . . . . . . . . . . . . . . . . . . . . . . . . . . . . . . . . . . . . . . 334
Tennessee, Nashville. . . . . . . . . . . . . . . . . . . . . . . . . . . . . . . . . . . . . . . . . . . . . . . . . 335Median Rate for Practice Areas . . . . . . . . . . . . . . . . . . . . . . . . . . . . . . . . . . 335Experience Variable Table . . . . . . . . . . . . . . . . . . . . . . . . . . . . . . . . . . . . . . 336
Texas, Amarillo . . . . . . . . . . . . . . . . . . . . . . . . . . . . . . . . . . . . . . . . . . . . . . . . . . . . . 337Median Rate for Practice Areas . . . . . . . . . . . . . . . . . . . . . . . . . . . . . . . . . . 337Experience Variable Table . . . . . . . . . . . . . . . . . . . . . . . . . . . . . . . . . . . . . . 338
Texas, Austin . . . . . . . . . . . . . . . . . . . . . . . . . . . . . . . . . . . . . . . . . . . . . . . . . . . . . . . 339Median Rate for Practice Areas . . . . . . . . . . . . . . . . . . . . . . . . . . . . . . . . . . 339Experience Variable Table . . . . . . . . . . . . . . . . . . . . . . . . . . . . . . . . . . . . . . 340
Texas, Dallas – Fort Worth . . . . . . . . . . . . . . . . . . . . . . . . . . . . . . . . . . . . . . . . . . . 341Median Rate for Practice Areas . . . . . . . . . . . . . . . . . . . . . . . . . . . . . . . . . . 341Experience Variable Table . . . . . . . . . . . . . . . . . . . . . . . . . . . . . . . . . . . . . . 342
Texas, Houston . . . . . . . . . . . . . . . . . . . . . . . . . . . . . . . . . . . . . . . . . . . . . . . . . . . . . 343
x
Median Rate for Practice Areas . . . . . . . . . . . . . . . . . . . . . . . . . . . . . . . . . . 343Experience Variable Table . . . . . . . . . . . . . . . . . . . . . . . . . . . . . . . . . . . . . . 344
Texas, San Antonio . . . . . . . . . . . . . . . . . . . . . . . . . . . . . . . . . . . . . . . . . . . . . . . . . . 345Median Rate for Practice Areas . . . . . . . . . . . . . . . . . . . . . . . . . . . . . . . . . . 345Experience Variable Table . . . . . . . . . . . . . . . . . . . . . . . . . . . . . . . . . . . . . . 346
Virginia, Richmond. . . . . . . . . . . . . . . . . . . . . . . . . . . . . . . . . . . . . . . . . . . . . . . . . . 347Median Rate for Practice Areas . . . . . . . . . . . . . . . . . . . . . . . . . . . . . . . . . . 347Experience Variable Table . . . . . . . . . . . . . . . . . . . . . . . . . . . . . . . . . . . . . . 348
Virginia, Norfolk – Virginia Beach . . . . . . . . . . . . . . . . . . . . . . . . . . . . . . . . . . . . . 349Median Rate for Practice Areas . . . . . . . . . . . . . . . . . . . . . . . . . . . . . . . . . . 349Experience Variable Table . . . . . . . . . . . . . . . . . . . . . . . . . . . . . . . . . . . . . . 350
Washington, Seattle - Tacoma. . . . . . . . . . . . . . . . . . . . . . . . . . . . . . . . . . . . . . . . . 351Median Rate for Practice Areas . . . . . . . . . . . . . . . . . . . . . . . . . . . . . . . . . . 351Experience Variable Table . . . . . . . . . . . . . . . . . . . . . . . . . . . . . . . . . . . . . . 352
Washington, Spokane. . . . . . . . . . . . . . . . . . . . . . . . . . . . . . . . . . . . . . . . . . . . . . . . 353Median Rate for Practice Areas . . . . . . . . . . . . . . . . . . . . . . . . . . . . . . . . . . 353Experience Variable Table . . . . . . . . . . . . . . . . . . . . . . . . . . . . . . . . . . . . . . 354
Wisconsin, Eau Claire. . . . . . . . . . . . . . . . . . . . . . . . . . . . . . . . . . . . . . . . . . . . . . . . 355Median Rate for Practice Areas . . . . . . . . . . . . . . . . . . . . . . . . . . . . . . . . . . 355Experience Variable Table . . . . . . . . . . . . . . . . . . . . . . . . . . . . . . . . . . . . . . 356
Wisconsin, Milwaukee . . . . . . . . . . . . . . . . . . . . . . . . . . . . . . . . . . . . . . . . . . . . . . . 357Median Rate for Practice Areas . . . . . . . . . . . . . . . . . . . . . . . . . . . . . . . . . . 357Experience Variable Table . . . . . . . . . . . . . . . . . . . . . . . . . . . . . . . . . . . . . . 358
5. Survey Techniques . . . . . . . . . . . . . . . . . . . . . . . . . . . . . . . . . . . . . . . . . . . . . . . . . . . . . . 359
6. Cases Employing Use of Prior Editions of this Survey Report . . . . . . . . . . . . . . . . . . 360Cases Listed by State or Other Jurisdiction . . . . . . . . . . . . . . . . . . . . . . . . . . . . . . 364
7. Cases on Use of Survey Data . . . . . . . . . . . . . . . . . . . . . . . . . . . . . . . . . . . . . . . . . . . . . . 382
8. About the Editor . . . . . . . . . . . . . . . . . . . . . . . . . . . . . . . . . . . . . . . . . . . . . . . . . . . . . . . . 385
9. Recommendations for Future Survey Data . . . . . . . . . . . . . . . . . . . . . . . . . . . . . . . . . . 386
Appendix 1. 2015-2016 Survey Questions . . . . . . . . . . . . . . . . . . . . . . . . . . . . . . . . . . . . . 387
Appendix 2. Geographic Area Definitions Used in Prior Survey Reports . . . . . . . . . . . 391
Appendix 3. Statement of Peer Review by The National Association of Legal FeeAnalysis . . . . . . . . . . . . . . . . . . . . . . . . . . . . . . . . . . . . . . . . . . . . . . . . . . . . . . . . . . . 392
Appendix 4. Table of Authorities . . . . . . . . . . . . . . . . . . . . . . . . . . . . . . . . . . . . . . . . . . . . 394
xi
UNITED STATES CONSUMER LAW SURVEY REPORT 2015-2016
1. Introduction
This Survey Report publishes the results of the United States Consumer Law
Attorney Fee Survey for 2015-2016. It is the only Consumer Law survey whose
methodologies have been supported by the National Association of Legal Fee Analysis, a
non-profit professional association for the legal fee analysis field.
This Survey Report continues to be the only national survey of Consumer Law
practitioners in the United States and has been used in more than 35 jurisdictions,
including state and federal courts, the U.S. Court of Federal Claims, the U.S.
Department of Justice, the U.S. Department of Labor, and the American Arbitration
Association to determine reasonable attorney fee rates, resulting in more than $7.9
million in awards across the United States.
Attorneys in every state and the U.S. Territories took part in the national survey
and the results this year continue the trend of being the most comprehensive since our
continuous research work began in 1999.
The findings cited in this Survey Report are based on a survey employing an
online, email, and telephone survey representing about 4,500 members of the National
Association of Consumer Advocates and the National Association of Consumer
Bankruptcy Attorneys and other known attorneys practicing in the field of Consumer
Law identified through Avvo.com, Lawyers.com, and court filings around the country.
There were 721 participants in this survey, establishing an approximate 16.0%
participation rate. This participation rate was robust. An internet search for similar state
bar association surveys located 13 surveys with an average participation rate of 12.4%.1
Because the survey was conducted in 2015 and 2016, the hourly rates and other
data reported represent 2015 and 2016 values. The reader may find some minor
adjustment necessary or desirable for application outside of 2015 and 2016.
1 A Google search of the term “Economics of Law Practice Survey,” acommon title for many bar association surveys, resulted in survey reports withparticipation rates that could be compared to state attorney totals as follows:Alabama (7.3%), Arizona (16.0%), Florida (1.7%), Iowa (16%), Michigan(11.6%), Mississippi (9.7%), Missouri (9.5%), Nebraska (12.2%), NewHampshire (20.4%), New Mexico (15.1%), Ohio (7.8%), Oklahoma (11.3%),Texas (12.5%).
1
UNITED STATES CONSUMER LAW SURVEY REPORT 2015-2016
Goals of Survey Report
The primary goals of this research project have been and continue to be to:
! provide timely, relevant and accurate data and information to inform and
guide practical, management, and planning decisions by Consumer Law
attorneys, including private practitioners, non-private practitioners, the
judiciary and government workers
! better understand the demographics of Consumer Law attorneys and their
practice
! monitor and document general and key trends in the legal profession,
based on previous and present survey research and analysis
! understand how attorney compensation (e.g., hourly rate) is impacted by
various variable factors (e.g., years in practice, niche area of practice,
experience level, geographic location, and more)
! collect thorough and accurate information on the economic realities
associated with the career field to share with the bar, present and potential
future attorneys, and the bench
! create a point of reference for future economic surveys of Consumer Law
practitioners
What’s New
A number of beneficial changes in format and content are introduced with this
edition of the Survey Report.
This What’s New section is itself new and intended to provide a central point
where changes that appear in the new edition of the Survey Report may be highlighted,
explained and contrasted with the last edition. Because of the substantial changes
occurring with this edition, this section is presently longer than it is likely to be in future
editions of the Survey Report.
This Introduction section contains far greater introductory detail to the areas
covered so that the reader can make better and more accurate use of the Survey Report.
The Summary Profile of the Typical U.S. Consumer Law Attorney, section 2, has
2
UNITED STATES CONSUMER LAW SURVEY REPORT 2015-2016
been expanded to include visual graphic illustrations of key data and to add national
data charts.
These visual graphics make for easier recognition of data while the national
charts now provide a national data perspective on the data using generally the same
format for presentation of the survey results. Thus, it will be easier for the reader to
compare the data from any state or greater metropolitan area with the national data in
order to understand where their area stands with respect to the same national data
numbers.
For the first time, this Survey Report covers every state, greater metropolitan
area, and most non-metropolitan areas in the United States and includes the District of
Columbia. The two most heavily populated Territories, Puerto Rico and the U.S. Virgin
Islands, are also included in this Survey Report.
Since this survey began in 1999, more localized data reporting has become
generally preferred by the Bar. To better serve this continuing shift in focus, the Survey
Report has expanded from twelve multi-state regions and 29 individual state Survey
Reports, to provide individualized data for each of 50 states, the District of Columbia,
Puerto Rico and the U.S. Virgin Islands. Continuing the trend of providing greater
localized data, the survey has expanded its coverage from 46 greater metropolitan areas
to 98 greater metropolitan areas, which comprise 64% of the U.S. population.
This change provides the reader with a quick and easy analysis of their particular
relevant data on a highly localized approach. It is expected that the resulting analyses
will be of greater use to the reader, the profession, the Bar, and the Courts.
Consumer Law is recognized as a specialized field of law by courts2 as well as
often recognized as a specialized field by universities, law schools and the profession
itself. As the field has matured, niche specialty areas have developed within the broader
field of Consumer Law. Some practitioners and a few courts have expressed a desire to
better understand data from within these niche specialty areas.
2 As said by the Ohio 9th District Court of Appeals, “[c]onsumer lawis a specialty area that is not common among many legal practitioners.”Crow v. Fred Martin Motor Co., 2003-Ohio-1293 (Summit App. No.21128).
3

UNITED STATES CONSUMER LAW SURVEY REPORT 2015-2016
To that end, now included in each state and greater metropolitan area is a table of
Median Rate for Practice Areas for each of Consumer Law’s six niche areas, such as
Bankruptcy Law, Class Action Law, and others that are further explained below.
Providing the median hourly rate for each of these more specific niche areas in the field
of Consumer Law may give the reader a starting point upon which to draw inferences
from other state and greater metropolitan data for any given niche area within the
overall field of Consumer Law. The State Summary Tables that appear in section 3 list
the 25% Median point, the Median point, and the 95% Median points of hourly rates for
each state. For the Metropolitan Area Tables in section 4, the tables list only the Median
point for each niche area. The 25% and 95% points can be determined in the manner of
calculation described below.
As discussed below, there are specific factors that will commonly have a larger
impact on an hourly rate than other, less common factors. These larger impact factors
more readily cause an hourly rate to vary. To more accurately label these factors which
can vary the hourly rate by their application, they have been renamed as Variables.
Thus, what was termed as Years Practicing Consumer Law in prior versions of this
survey is now termed more accurately as an Experience Variable.
The experience level of an advocate is a primary variable in determining a
reasonable hourly rate. The hourly rate data as gauged by years in practice has been
expanded from nine to eleven age brackets. The prior ceiling bracket of 31+ years has
been increased to 41+. These two additional brackets allow greater analysis of the
experience variable of senior attorneys that fall in the 31-35 and 36-40 years in practice
bracket.
To better understand the “years in practice” variable and its localized impact on a
professional’s hourly rate, each greater metropolitan area in this Survey Report is now
followed by an Experience Variable table as well as a table of Median Rate for Practice
Areas.
The Experience Variable table takes the years in practice of legal practitioners
and breaks it down into eleven brackets, generally in five year increments and capped by
the elder bracket of 41+ years in practice. The average attorney hourly rate for each
bracket is then provided.
The ten states with the largest survey participation provided detailed data that
allowed their Survey Reports to include additional data tables, including a Specialty
4

UNITED STATES CONSUMER LAW SURVEY REPORT 2015-2016
Variable table, Small Firm Size Variable table, and Large Firm Size Variable table.
The Specialty Variable table focuses on the percentage of practice time that is
consumed by the practitioner on Consumer Law matters in brackets of ten percentage
points from 50% to 100%. The average attorney hourly rate for each bracket is then
provided.
The Small Firm Size Variable table and the Large Firm Size Variable table each
take the Experience Variable tables and separate them by law firm size and then
examine and report the average attorney hourly rates for each years in practice bracket
therein. This allows further contrasting of data between both large and small firm
members by their levels of experience.
The Table of Authorities has been added and provides a convenient alphabetical
listing of cases and authorities cited in this Survey Report, updated to March 13, 2018.
Survey Report Sections Explained
After this introductory section, the results of this Survey Report are reported in
two major data sections. At the beginning of each Section is an explanatory table of the
Section’s structure and content.
Section 2 of this Survey Report contains the Summary Profile of the Typical U.S.
Consumer Law Attorney, a collective approach to the entire survey results which yields a
general picture of key aspects of the typical U.S. Consumer Law practitioner in the
United States and its territories. It is based on the survey results as a whole and may
serve as a benchmark for both larger and local comparisons by the reader.
Section 3 begins the State Summary Tables analyses for each state in the United
States, the District of Columbia, Puerto Rico and the U.S. Virgin Islands and includes a
table of the Median Rate for Practice Areas for each, reporting the 25% Median, the
Median, and the 95% Median hourly rate brackets, as further explained below. This
section provides the Survey’s analytical approach to each state or area’s survey results,
which yields a more detailed summary picture of key aspects of the typical U.S.
Consumer Law practitioner in each survey state or area.
Section 4 contains data for the greater metropolitan area tables for 98 greater
5

UNITED STATES CONSUMER LAW SURVEY REPORT 2015-2016
metropolitan areas in the United States. Once again, these selections were made based
chiefly on the basis of their larger population count. For each greater metropolitan area,
this section contains a similar averages and median summary table as was included in
Section 3 and also adds the Median Rate for Practice Areas table and Experience
Variable Table (i.e., years in practice) to each greater metropolitan area analysis. This
approach allows for far more localized data reported than ever before in our Survey
Report. Although the greater metropolitan Median Rate for Practice Areas tables only
list the Median point and not the 25% and 95% Median points that are listed in the state
Median Rate for Practice Areas tables, there is a simple and statistically reliable way to
calculate those greater metropolitan points if the reader desires to do so in any situation.
Since the Median Rate for Practice Areas provided in Section 3 give the 25% and
95% Median points and the table in Section 4 does not do so, the greater metropolitan
area 25% and 95% points can be calculated based on the percentage difference away
from the Median point. For example, in the state Median Rate for Practice Areas table
for Alabama, the Credit Rights fields for 25%, Median, and 95% list hourly rates of
$300, $350, and $700 respectively. In the Birmingham, Alabama greater metropolitan
Mediate Rate for Practice Areas table, the Credit Rights field only lists the Median at an
hourly rate of $338. Referring to the greater metropolitan table field for Credit Rights
shows the Median hourly rate to be $338. The state table field for the Median is $350.
The greater metropolitan table field is 96.57% of the state table field number. Applying
that percentage to the 25% and the 95% Median points will result in a close
approximation of the Birmingham 25% and 95% Median points, e.g. $290 and $676
respectively.
Section 5 explains Survey Techniques in general and those used in gathering the
data reported herein.
Section 6 provides a brief discussion of cases employing the use of prior editions
of this Survey Report along with a listing of citations to cases which have used or cited
the Survey Report since its inception.
Section 7 discusses various cases that have dealt with the actual use of survey
data in court proceedings such as fee hearings, with citations.
Section 8 provides biographical information about the Survey Report Editor.
Section 9 provides contact information for the reader’s recommendations for
6

UNITED STATES CONSUMER LAW SURVEY REPORT 2015-2016
future survey data gathering or other suggestion.
Appendix 1 provides the actual survey questions and possible answers for each.
Niche Areas in the Field of Consumer Law Defined
Consumer Law is recognized as a specialized area of law dealing with issues
arising from transactions involving one or more persons acting as individuals or as a
family. Consumer Law as a field of law typically includes niche areas, e.g. bankruptcy,
credit discrimination, consumer banking, warranty law, unfair and deceptive acts and
practices, and more narrow topics of consumer law such as consumer protection rights
enabled by specific statutes such as the Fair Credit Reporting Act, the Uniform
Consumer Sales Practices Act, state and federal lemon laws, and many others.
While Consumer Law is a field of law, for greater analysis of the niche areas
within Consumer Law the following categorization has been made for purposes of this
Survey Report and the Median Rate for Practice Areas tables:
1. Bankruptcy
2. Class Action
3. Credit Rights (FCRA, FDCPA, ECOA, TILA, Credit Discrimination, Credit
Reporting, Debt Defense, etc)
4. Mortgage (Foreclosure Defense, RESPA, HOLA, Real Estate, Housing
Rights, etc.
5. Vehicles (Autofraud, Lemon Law, Warranty Law, UDAP, Repossession
Law, etc.)
6. TCPA
7. Other
Geographic Areas Defined
Survey participant data has been analyzed and compiled for this Survey Report
for all 50 states and the geographic areas of the District of Columbia, Puerto Rico and
U.S. Virgin Islands.
This national Survey Report also takes a localized view of the survey data and
7

UNITED STATES CONSUMER LAW SURVEY REPORT 2015-2016
includes 98 greater metropolitan areas, providing a more detailed, specific and slightly
different analysis of the survey data for the reader’s review and further analysis.
Generally, a metropolitan statistical area contains a core urban area of 50,000 or
more population and includes the adjacent counties or municipalities that have a high
degree of social and economic integration, as measured by commuting to work, with the
urban core. However, a greater metropolitan area in this Survey Report is not defined
the same as in the U.S. Census. The key difference is that in the Census definition of a
metropolitan statistical area (MSA), the MSA may cross state or other governmental
borders. In this Survey Report, data responses were confined to state or territorial
political boundaries, e.g. in this Survey Report the Chicago greater metropolitan area
does not include the northwest Indiana area where Gary, Hammond and other Indiana
cities are located which are socio-economically connected to Chicago, Illinois.
In response to requests for even more detailed data, this year’s survey added a
new question which obtained from each survey participant the specific niche areas of
Consumer Law in which the participant regularly practiced. It also added a new
question which obtained local geographic location data from each survey participant,
e.g., if the respondent regularly practiced in the north, south, east, west, or central area
of their particular state or territory.
The responsive data enables an even more narrow and localized analysis to be
generated and which provides median-based hourly rate numbers for these niche areas
of Consumer Law within the wider field of Consumer Law itself, with a greater focus on
geographic locality.
The Average and the Median: What it Means to You
To help practitioners understand and interpret the data in this Survey Report, a
brief explanation of common data terminology in this Survey Report may be useful.
The tables in this Survey Report use some terms whose meaning, while
understood by statisticians, may not be clear to attorneys and Judges. The data is
presented in measures of central tendency (mean and median) and dispersion or spread
(percentiles).
The mean (sometimes called the arithmetic average) is calculated by adding the
8

UNITED STATES CONSUMER LAW SURVEY REPORT 2015-2016
values of all responses, then dividing by the number of responses.
For example, five responses are reported, 3, 4, 6, 8 and 12. The average is
calculated by adding their values (3 + 4 + 6 + 8 + 12 = 33), then dividing by the number
of responses (5). Thus, the average is 33 / 5 = 6.6.
The median has a different meaning. It is the middle value of a series of values,
which is initially rank-ordered from low to high. By definition, half the numbers are
greater and half are less than the median. Both mean and median values are used
throughout this Survey Report to denote the measure of central tendency, e.g., as a
pointer for the central area of survey results without regard to the average.
Statisticians variously agree that using the median as a statistic reduces the effect
of extreme outlier numbers (extremely high or low values, such as 12 in the above
example) while the average does not do so because it takes all numbers into account.
As an example of how using a median affects the above numbers, the same five
responses are reported, 3, 4, 6, 8 and 12. The median is the middle number of the order
of distribution, 6. Note, however, that the average of this same distribution of numbers
is 6.6. Depending on the set of numbers under analysis, the mean (i.e., the average) may
be incrementally higher or lower than the actual median of that set of numbers.
The median literally is the value in the middle. It represents the mid way point in
a sequence of numbers. It is determined by lining up the values in the set of data (for
example, in this fee survey that would be all of the individual fee rate responses logged
in the survey) from the smallest to the largest. The one in the dead-center position is the
median number.
The median is not the average of the numbers because you don’t add anything in
the list, but you merely determine the center of the list. Some statisticians say that using
the mean (instead of the average) gives less weight to the individual numbers that are on
the outer limits of the survey responses and thus it is more likely to direct the survey to
the real center of the responses.
The median result of a set of numbers may be higher or lower than the average of
that same set of numbers. Because the median number is commonly not the same as the
average number, being either slightly above or below it, we are including both the
average and the median results for key data points in the survey.
9
UNITED STATES CONSUMER LAW SURVEY REPORT 2015-2016
The dispersion of data around the median, which is at the 50th percentile point, is
reported in three increments in several places throughout the Survey Report:
� 25th percentile (what statisticians call the lower quartile); one-fourth of the
number values are less and three-fourth of the values are more than this
value
� 75th percentile (the upper quartile); three-fourths of the number values are
less and one-fourth are more than this value
� 95th percentile; ninety-five percent of the number values are less and only
five percent are more than this value.
Interpreting the Findings: Primary and Minor Variable Factors
An hourly rate may commonly be impacted by several factors, including years of
practice, firm size, practice location, and degree of practice concentration. These four
variables are known to have a significant impact on an hourly rate and in this survey are
identified as the primary variables.
Depending on the specific situation, there are other variable factors that
historically are often of less impact than the primary variables, such as advertising,
personal client relationships, and other remote factors. These minor variables may
apply in any given instance but almost always to a lesser variable degree than the
primary variables. Most often these minor variables are highly individual to the
practitioner at hand.
Thus, the information presented here on the factors that are primary variables
will be indicative of a particular attorney’s reasonable hourly rate but there may be times
when a further, more detailed analysis of minor variable factors may be useful to further
modify the result of the primary variable factors in a specific situation. Such further
analysis is not possible in this Survey Report but would require an individual inquiry
and even then the impact of such individualistic minor variables is doubtful.
A Summary Profile of the Typical U.S. Consumer Law Attorney is presented at
the outset of this Survey Report in Section 2, in order to provide a summary profile of
the average U.S. Consumer Law attorney and their practice. It may be viewed as the
10
UNITED STATES CONSUMER LAW SURVEY REPORT 2015-2016
average of all survey responses nationwide. Charts appear here which are employed in
the state and greater metropolitan sections, enabling a local versus national comparison
of data.
The Experience Variable Tables now appear only in the Metropolitan Area Tables
and present an analysis of the impact that years in practice in Consumer Law has on the
average attorney hourly rate. Each greater metropolitan area has its own table of survey
results with the levels of experience, e.g., years in practice, being divided into 11 time
frames with less than one year and more than 41 years bracketing the outer limits at
each end. One might think that longevity of practice would dictate an increasingly
higher hourly rate and these tables report survey results that test that assumption and,
in some cases, variations are observed. Economic trends outside of this survey may test
that assumption even further but are not considered in this survey.
The State and Metropolitan Summary Tables in Sections 3 and 4 are presented to
give an overview of the practice of Consumer Law lawyers for each listed state, area or
greater metropolitan area. Note the use of both average and median results in these
sections, with the median used to reduce the effect of extremely high or low values in
some data. These tables also show the difference in survey results when comparing the
average hourly rates and the median hourly rates, a factor considered by some
statisticians to arrive at what they consider to be more neutral or accurate survey
results.
Data Gathering Methodology
To help practitioners understand and interpret the data in this Survey Report, a
brief explanation of the data gathering methodology may help.
In designing the United States Consumer Law Attorney Fee Survey, the author
considered all procedure, question and design factors enumerated and discussed in
three primary sources: Evaluating Survey Questions: An Inventory of Methods
prepared by the Subcommittee on Questionnaire Evaluation Methods of the Statistical
and Science Policy Office in the U.S. Office of Management and Budget (January 2016),
and Evaluating Survey Questions by Doctor Chase H. Harrison of Harvard University’s
Program on Survey Research, and Methods for Testing and Evaluating Survey
Questions by Stanley Presser et al, Public Opinion Quarterly Vol. 68, Issue 1 (March
2004).
11
UNITED STATES CONSUMER LAW SURVEY REPORT 2015-2016
Survey results are based on the results of a survey that was fielded during 2015
and 2016 and consisting of twelve key data questions. The survey was administered via
email, ordinary mail, facsimile and telephonic data gathering and invitations to an
internet-based online questionnaire. The survey was closed when data compilation
began in early 2017.
In compiling this Survey Report, a valuable contribution was made by members
of the National Association of Consumer Advocates and the National Association of
Consumer Bankruptcy Attorneys and Consumer Law attorneys across the United States
and its territories who were invited to participate during 2015 and 2016.
The entire active membership of the National Association of Consumer Advocates
and the National Association of Consumer Bankruptcy Attorneys, along with other
known Consumer Law practitioners from around the United States and its territories
were surveyed.
Invitations to participate were also randomly sent to attorneys disclosed through
internet search engine results conducted on a national level as well as randomly selected
physical telephone book specialty listings where available. Invitations to participate
were also randomly sent to attorneys identified through court filings in various
jurisdictions and bar association directories.
As with prior surveys, an on-line survey service, along with email and telephone,
was utilized to gather and tabulate the results with safeguards in place to limit data
input to one participant per survey. Additional direct telephone survey input was also
utilized.
Our similar studies have been undertaken annually since 1999. The objective of
these studies has been to determine the demographics of Consumer Law private
practitioners, including attorney hourly billing rate, firm size, years in practice,
concentration of practice, primary and secondary practice area prevalence, paralegal
billing rates and other data of use to the profession.
The collected information has been condensed into this national reference to
provide useful data and benchmarks to assist Consumer Law attorneys as they manage
their practice and Courts as they seek to determine applicable reasonable hourly rates in
cases before them.
12

UNITED STATES CONSUMER LAW SURVEY REPORT 2015-2016
The data is reported in various tables below, allowing the reader to consider the
data from several viewpoints of selected factors or criteria. Nevertheless there may be
situations where a practitioner desires a data analysis and report specific to their
practice. If a more detailed analysis of data for any geographic or practice-specific
situation is necessary, it can be performed upon request directed to the editor of this
work.
Data Analysis Methodology
The data analysis relies on descriptive statistics, including averages, medians,
and percentiles. The average, also known as the mean, is calculated by adding all of the
respondents’ numerical answers for a particular item and dividing by the total number
of respondents. The median, also known as the midpoint, is the point at which half of
the responses are above and half are below that number.
The percentiles, e.g., 25th, 75th, and 95th, represent the point in the range of
responses at which 25%, 75%, 95% of the responses occur for a specific question. For
example, the 95th percentile hourly rate amount is the hourly rate amount at which 95%
of the reported hourly rate amounts were below and 5% of the hourly rate amounts were
above.
Items may not sum up to 100% due to rounding. Data is indicated as a dash mark
(e.g., “ - “) if no data or if insufficient data was reported.
Data is presented for all of the United States and the geopolitical areas of the
District of Columbia, Puerto Rico and the U.S. Virgin Islands. Some survey data
quantities allowed for greater analysis reporting than other geographic areas because
not all reported at high levels of data responses. In almost all table fields, survey
participation yielded sufficient data for reliable analysis without inference. In the State
Summary Tables, the minimum state participation level was 5 survey participants for
analyses to be performed. In the Metropolitan Summary Tables, the minimum greater
metropolitan participation level was 3 survey participants for analyses to be performed.
In a Median Rate for Practice Areas table, if one field had no survey participant then the
remaining six other practice area fields in that table would be considered and the
median result entered in the field that had insufficient participation.
This was a r0bust survey, e.g., there are more than 4,153 fields of data calculation
13
UNITED STATES CONSUMER LAW SURVEY REPORT 2015-2016
in this Survey Report but only three data fields lacked sufficient input from survey
participants when the survey was closed, which represents 0.0007224 of all data
presented. The results for these three data fields were imputed using a variation of the
scientifically accepted standard Maximum Likelihood Estimation (MLE) method
statistical approach, which estimates the parameters of a statistical model given
observations by finding the parameter values that maximize the likelihood of making the
observations given the parameters. This approach assumes a uniform prior distribution
of the parameters, which was verified to exist by examination of the presented data in
this survey. The common variation of MLE employed here used multiple but related
fields as sources of data for imputation, invoking multiple fields of related known data
to arrive at imputed data for the three missing fields. Data fields used for imputation
purposes were limited to geographically contiguous data fields because of the
established multi-state regional data relationships observed over our years of previous
survey data analyses. Simply put, data movement has always been more relational
within a region than when contrasted between regions.
In performing calculations of state data for any field in any table, several rules
applied for the imputation of missing or insufficient data.
First, if the current survey state data was insufficient then using the prior survey
result the editor looked first for a field with data in the prior survey that was contiguous
to the data deficient field in the current survey. Next, the editor determined the
percentage change from one data field to the next data field in the prior survey and then
applied that percentage change to the current survey to calculate the percentage change
that would occur from the same known contiguous field to the data deficient field in the
current survey. Finally, if there was none then the editor would use the average of all
contiguous states’ data in the deficient field to determine the entry for the insufficient
data field.
In the greater metropolitan Median Rate for Practice Areas table, if any data field
was insufficient then the state data for that field is used. In performing calculations for
the greater metropolitan Experience Variable Table, if greater metropolitan data was
insufficient then the current survey uses the state data result for that field where data is
insufficient. In performing the greater metropolitan calculations for any field, if greater
metropolitan data is insufficient then the current survey uses the state data result for
that field.
14

UNITED STATES CONSUMER LAW SURVEY REPORT 2015-2016
Peer Review of Methodologies and Survey Analyses
The National Association of Legal Fee Analysis (NALFA) has reviewed this
United States Consumer Law Attorney Fee Survey Report prior to publication and has
announced its support of methodology used in the data collection and analyses
performed. See Appendix 3.
NALFA is a 501(c)(6) non-profit professional association for the legal fee analysis
field, providing services on attorney fee and legal billing matters. Courts and clients turn
to NALFA for expertise when attorney fees and expenses are at issue in large complex
cases. NALFA members include fully qualified attorney fee experts, special fee masters,
bankruptcy fee examiners, fee dispute mediators and legal bill auditors and NALFA
members follow Best Practices in legal fee analysis. For more information, visit
www.thenalfa.org.
Separately, the Survey Report data was independently peer reviewed for accuracy
in its data gathering, analyses and reporting by practitioners of Consumer Law,
including those with data analysis experience.
Error Rate
Before this publication, a hand selected review was conducted of selected data
received during this survey and compared with the data reported in the previous survey.
The results indicate an error rate of less than one percentage point at the 95%
confidence level in the present Survey Report, a number substantially lower than the
published error rate of similar types of surveys.
Section 508 Compliance
The United States Consumer Law Attorney Fee Survey is the only survey of its
type that is Section 508 Certified. This means that the survey program on which this
survey runs meets all current U.S. Federal Section 508 certification guidelines.
Section 508 is a Federal law that outlines the requirements to make online
information and services accessible to users with disabilities. All Federal agencies are
required to use 508 certified software and technologies when available.
15

UNITED STATES CONSUMER LAW SURVEY REPORT 2015-2016
The Voluntary Product Accessibility Template was used in the design of the
survey. VPAT’s purpose is to assist Federal contracting officials and others in making
preliminary assessments regarding the availability of commercial "Electronic and
Information Technology" products and services with features that support accessibility.
The VPAT was developed by the Information Technology Industry Council (ITI) in
partnership with the U.S. General Services Administration (GSA).
Use of the VPAT means that this survey is built on programming that includes a
text element for every non-text element of the survey web page, web pages are designed
so that all information displayed with color is also available without color, all parts of
the survey are readable without having to open another window, and other techniques
to enable disabled persons to fully participate in every aspect of the Fee Survey.
The editor deems it important that the survey reach the broadest range of
potential respondents possible in order to provide the reader with the most accurate
results. By including survey feedback from the disabled demographic, the survey
ensures a more representative population is able to participate so that all demographics
may be included in the survey results.
16

UNITED STATES CONSUMER LAW SURVEY REPORT 2015-2016
2. Summary Profile of the Typical U.S. Consumer Law Attorney
National Summary Profile Data
This section graphically illustrates and contrasts key data derived from the survey
when viewed only from a national approach. Emphasis here is on the average Consumer
Law attorney in the United States without regard for any specific survey factor or
geographic location. More specific data results appear in the next section below.
While the vast bulk of survey participants predominantly practiced Consumer
Law, nearly a quarter of participants primarily practiced Bankruptcy Law. A wide
variety of other areas of primary practice were noticed, supplemented in part by
Consumer Law work.
17

UNITED STATES CONSUMER LAW SURVEY REPORT 2015-2016
The average Consumer Law attorney continues to supplement their work in this
field primarily with Bankruptcy work by an average of 24.8% which is up significantly
from the 14.5% in the last Survey Report.
Nevertheless, when Bankruptcy Law is taken out of the analysis, it is clear that
about two-thirds of all Consumer Law attorneys supplement their Consumer Law work
with varying degrees of other legal work in other areas of practice.
The percentage of actual practice time expended solely on non-Bankruptcy Law
Consumer Law matters by the average practitioner is holding consistent, with 49.2% of
all respondents reporting their practice to consist of 90-100% Consumer Law issues, a
figure still far below that reported four years ago when 82.7% was the level reporting
their practice to fall in the 90-100% range for Consumer Law issues. An analysis of the
possible impact of this degree of focus is contained in the state-specific Specialty
Variable Tables that appear in Section 3 of this Survey Report.
18
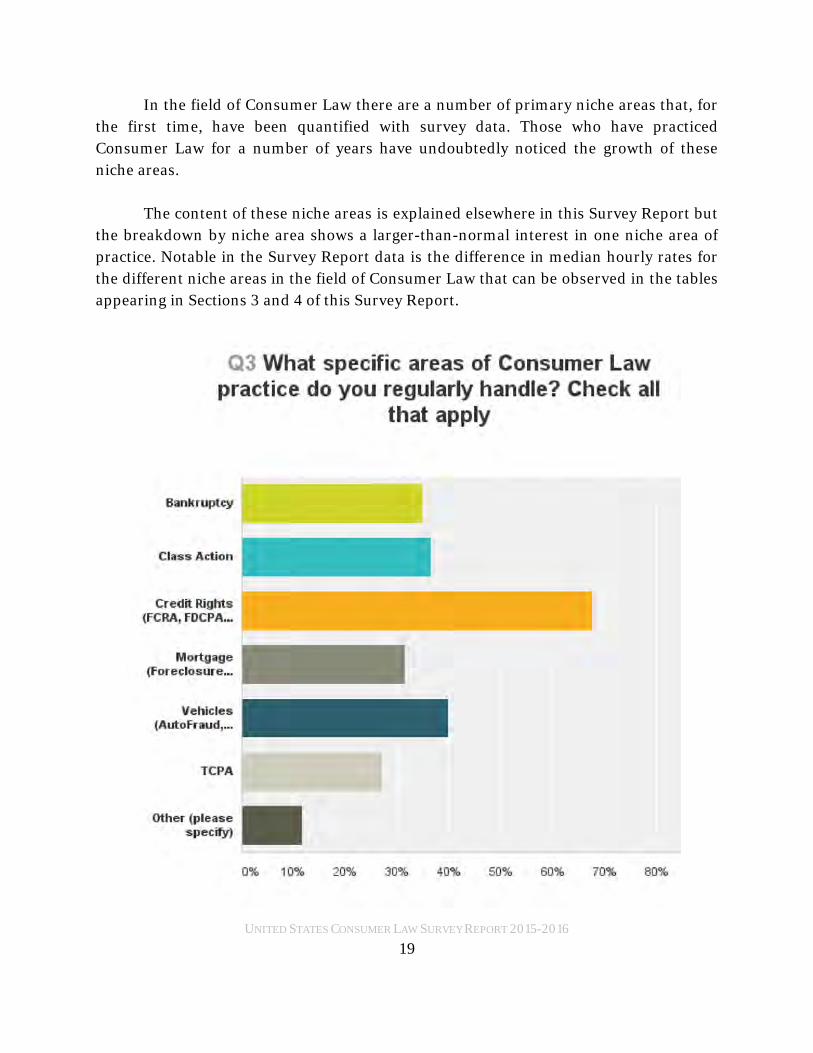
UNITED STATES CONSUMER LAW SURVEY REPORT 2015-2016
In the field of Consumer Law there are a number of primary niche areas that, for
the first time, have been quantified with survey data. Those who have practiced
Consumer Law for a number of years have undoubtedly noticed the growth of these
niche areas.
The content of these niche areas is explained elsewhere in this Survey Report but
the breakdown by niche area shows a larger-than-normal interest in one niche area of
practice. Notable in the Survey Report data is the difference in median hourly rates for
the different niche areas in the field of Consumer Law that can be observed in the tables
appearing in Sections 3 and 4 of this Survey Report.
19

UNITED STATES CONSUMER LAW SURVEY REPORT 2015-2016
While certain economies of scale may be achievable in a larger practice with five
or more attorneys, Consumer Law is a field that has historically been dominated by
small firm practitioners of four or fewer. This long-term trend continues to be so.
Surprisingly, sole practitioners dominate the area of Consumer Law by a wide
margin. Just over half of all survey participants reported being solo practitioners. When
two and three and four member firms are added, small firms who primarily practice
Consumer Law make up just over 80% of all Consumer Law firms.
In such a circumstance, law office economics are often more important to the
practitioner than they may be to large law firms who may count on a larger client base
for support. Consumer Law has always meant dealing with a different kind of clientele
than typical large firm practices, often involving a one-time attorney-client relationship
necessitated by a single legal problem.
20

UNITED STATES CONSUMER LAW SURVEY REPORT 2015-2016
The experience level of the average Consumer Law attorney continues to ebb
upwards. The typical Consumer Law attorney has been practicing law for 20.4 years, the
third year of consecutive increases.
The last two Survey
Reports have indicated a
s l o w i n g g r o w t h o f
practitioners in this area of
law and this Survey Report
continues that trend. 11.3% of
all Consumer Law attorneys
report that they have been in
practice 5 years or less, a
significant drop from 16.3%
in the last Survey Report,
indicating the third year of a
continuing slow growth of
practitioners in this area of
law. 28.35% have been in
practice 10 years or less.
Another 26.7% have been in
practice between 10 and 20
years. Only 3.1% have been in
practice 45 or more years,
about double from the last
survey, an indication that
senior attorneys in this area
of the law have a greater
tendency to remain in this area of law.
More-experienced attorneys (those with 35 or more years of practice) make up
17.6% of survey respondents.
The state with the largest percentage of senior attorneys is California, where
17.5% of all attorneys have been in practice for 40 or more years, followed by Ohio with
11.1%. The largest percentage of most-senior attorneys, those with 45 or more years of
practice, practice in either California or New Hampshire, which are tied at 22.7% each.
Only eight states have no one in practice more than 35 years.
21

UNITED STATES CONSUMER LAW SURVEY REPORT 2015-2016
Disregarding all other factors, including geographical location, the average hourly
rate for the typical Consumer Law attorney in the United States is $366, a slight increase
from the last Survey Report of $361. The median attorney hourly rate is $350 nationally
which is the same result in the last Survey Report.
The median 25% Attorney hourly rate (the point at which 25% of all survey
participants reported an hourly rate lower than this number) is $275, the same as in the
last Survey Report. The median 75% Attorney hourly rate is $450 an increase from the
last Survey Report which was $425 at the 75% median point. The median 95% Attorney
hourly rate is $625, a slight decrease from the last survey, which was $650.
22

UNITED STATES CONSUMER LAW SURVEY REPORT 2015-2016
Since about half of all
Consumer Law firms are solo
attorneys, and 80% of all
Consumer Law firms have
four or fewer attorneys, one
might expect to see in this
group a tendency to take
advantage of the profit and
cost-effectiveness of paralegal
support. Instead, about a
third of Consumer Law
attorneys choose to work with
no paralegal support. Still,
from an overall viewpoint the
average Consumer Law
a t t o r n e y emp l o y s o n e
paralegal. The number is 1.45,
to be precise.
The average paralegal
hourly billable rate nationally
averages $84, a substantial
decrease below the last Survey
Report of $116 and far below
four years ago when it was
$96.
The current median
paralegal hourly rate is $90,
substantially down from the
last Survey Report number of
$125.
23

UNITED STATES CONSUMER LAW SURVEY REPORT 2015-2016
The average attorney raised their hourly rate 19.9 months ago. 41.1% of all
Consumer Law attorneys raised their hourly rates during the last 12 months. At 50.1%,
more than half of all Consumer Law attorneys raised their hourly rate within the last 18
months. In spite of that, fully 20.4% have not raised their hourly rate in the last 3 or
more years and 8.5% have not raised their hourly rate for 5 or more years.
Of all brackets in the years in practice table, which is now more properly termed
as the Experience Variable Table, in the 41 to 45 years or more bracket, more than three
quarters of the total have not raised their hourly rate for at least two or more years and
26.4% of that bracket range have not raised their hourly rate for at least four or more
years. That fact is obvious looking at almost any Experience Variable Table in this
Survey Report and is historically observable in at least the last three Survey Reports.
24

UNITED STATES CONSUMER LAW SURVEY REPORT 2015-2016
There is evidence of a slight shift in representation toward a more rural client
base. 61.4% of all Consumer Law attorneys report that they practice law in a greater
metropolitan area of 200,000 persons or more, down very slightly from the last Survey
Report of 63.2%. Only 12.5% reported their practice to be in a non-metropolitan, rural
area, almost identical to the last Survey Report. 26.1% reported their regular practice to
involve both types of population densities, up slightly from the last Survey Report of
24.4%. The practice of Consumer Law continues to be primarily a greater metropolitan
practice.
25

UNITED STATES CONSUMER LAW SURVEY REPORT 2015-2016
Conclusions
From a historical perspective, several observations can be made when the survey
data is viewed over the last decade.
Small law firms of four or fewer attorneys have consistently dominated the area
of Consumer Law and still continue to do so, although on a slightly decreasing scale.
Large Consumer Law firms tend to charge higher hourly rates than small firms in
most instances.
The number of paralegals employed by the average Consumer Law firm has
previously been tied to the economy but for the last two Survey Reports it has been
trending toward Consumer Law attorneys operating in a solo practice with no paralegal
support, regardless of the profit or cost-effectiveness of the support a paralegal often
provides to a firm. This may be the result of younger attorneys’ lack of experience with
working alongside a paralegal.
The average number of years in practice for Consumer Law attorneys continues
to increase during the last decade, indicating that Consumer Law remains of interest to
those who practice in this area of law as they age in their career, but also indicating that
attorneys who are new to the bar are less likely to focus on the field of Consumer Law for
their future.
Attorneys who have been in practice the longest tend to hold their hourly rates
level the longest. At the same time, younger attorneys are entering the field of Consumer
Law but not on the scale that existed before the recession of 2008-2009.
The quantity rise in less-senior attorneys has been mirrored in the stronger
tendency of Consumer Law attorneys to raise their hourly rates more often than prior
Survey Reports demonstrated, at least until the years in practice arrives at the last three
brackets of 31 years or longer. At that point, the hourly rates tend to reach a plateau and
increases are incrementally smaller when they occur.
Consumer Law and Bankruptcy Law continue to be two areas of law where
practitioners frequently concentrate on one while supplementing their work with the
other.
26
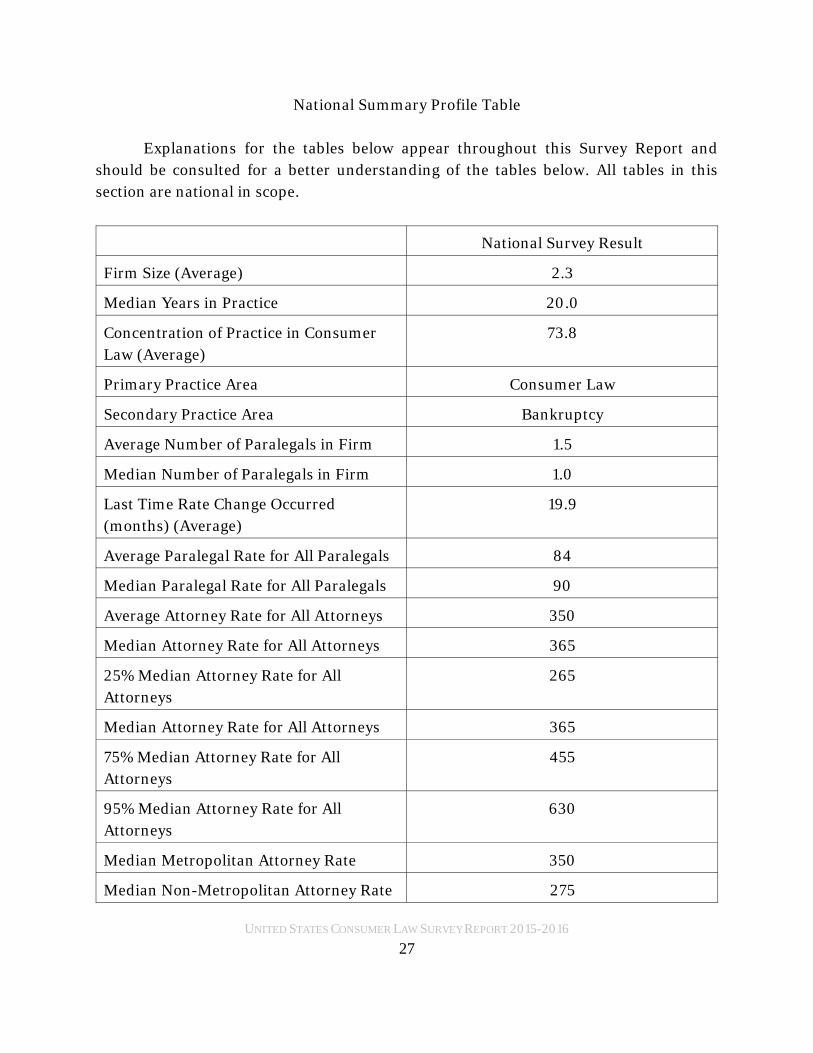
UNITED STATES CONSUMER LAW SURVEY REPORT 2015-2016
National Summary Profile Table
Explanations for the tables below appear throughout this Survey Report and
should be consulted for a better understanding of the tables below. All tables in this
section are national in scope.
National Survey Result
Firm Size (Average) 2.3
Median Years in Practice 20.0
Concentration of Practice in Consumer
Law (Average)
73.8
Primary Practice Area Consumer Law
Secondary Practice Area Bankruptcy
Average Number of Paralegals in Firm 1.5
Median Number of Paralegals in Firm 1.0
Last Time Rate Change Occurred
(months) (Average)
19.9
Average Paralegal Rate for All Paralegals 84
Median Paralegal Rate for All Paralegals 90
Average Attorney Rate for All Attorneys 350
Median Attorney Rate for All Attorneys 365
25% Median Attorney Rate for All
Attorneys
265
Median Attorney Rate for All Attorneys 365
75% Median Attorney Rate for All
Attorneys
455
95% Median Attorney Rate for All
Attorneys
630
Median Metropolitan Attorney Rate 350
Median Non-Metropolitan Attorney Rate 275
27
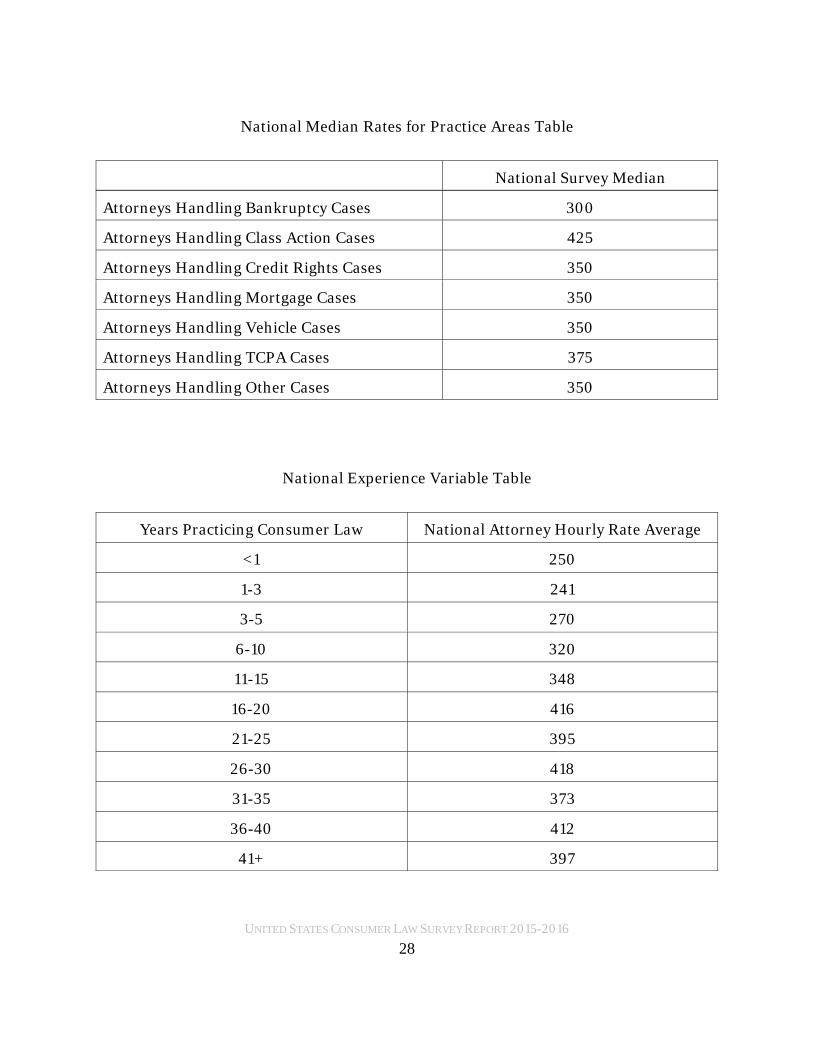
UNITED STATES CONSUMER LAW SURVEY REPORT 2015-2016
National Median Rates for Practice Areas Table
National Survey Median
Attorneys Handling Bankruptcy Cases 300
Attorneys Handling Class Action Cases 425
Attorneys Handling Credit Rights Cases 350
Attorneys Handling Mortgage Cases 350
Attorneys Handling Vehicle Cases 350
Attorneys Handling TCPA Cases 375
Attorneys Handling Other Cases 350
National Experience Variable Table
Years Practicing Consumer Law National Attorney Hourly Rate Average
<1 250
1-3 241
3-5 270
6-10 320
11-15 348
16-20 416
21-25 395
26-30 418
31-35 373
36-40 412
41+ 397
28

UNITED STATES CONSUMER LAW SURVEY REPORT 2015-2016
National Specialty Variable Table
Percentage of Consumer Law Practice National Attorney Hourly Rate Average
100 407
90 401
80 370
70 390
60 338
50 361
National Small Firm Size Variable Table
Years in Practice National Attorney Hourly Rate Average
<1 293
1-3 260
3-5 275
6-10 313
11-15 333
16-20 404
21-25 386
26-30 400
31-35 354
36-40 373
41+ 394
29

UNITED STATES CONSUMER LAW SURVEY REPORT 2015-2016
National Large Firm Size Variable Table
Years in Practice National Attorney Hourly Rate Average
<1 275
1-3 233
3-5 279
6-10 340
11-15 407
16-20 455
21-25 437
26-30 556
31-35 457
36-40 539
41+ 463
30

UNITED STATES CONSUMER LAW SURVEY REPORT 2015-2016
3. State Summary Tables
Explanation of Tables
Firm Size The average number of attorneys in a law
firm.
Median Years in Practice The median number of years that all
attorneys in this state have been in
practice.
Concentration of Practice in Consumer
Law
The percentage of practice time expended
in Consumer Law matters.
Primary Practice Area The area comprising the largest
percentage of the practice.
Secondary Practice Area The largest practice area outside of
Consumer Law.
Median Number of Paralegals in Firm The median number resulting from all
survey responses in this state.
Last Time Rate Change Occurred
(months)
The median number, expressed in
months.
Median Paralegal Rate for All Paralegals Expressed in dollars.
Average Attorney Rate for All Attorneys Expressed in dollars. Note that this is not
the median.
25% Median Attorney Rate for All
Attorneys
25% of all survey responses are below this
number, expressed in dollars.
Median Attorney Rate for All Attorneys Half of all survey responses are above this
number and half below, expressed in
dollars.
75% Median Attorney Rate for All
Attorneys
75% of all survey responses are below this
number, expressed in dollars.
95% Median Attorney Rate for All
Attorneys
5% of all survey responses are above this
number, expressed in dollars.
31

UNITED STATES CONSUMER LAW SURVEY REPORT 2015-2016
Median Metropolitan Attorney Rate Half of all survey responses in
metropolitan areas of the state are above
this number and half are below
Median Non-Metropolitan Attorney Rate Half of all survey responses in non-
metropolitan areas of the state are above
this number and half are below
Median Attorney Rate in Northern Area
of State
Half of all survey responses in this area of
the state are above this number and half
are below
Median Attorney Rate in Southern Area
of State
Half of all survey responses in this area of
the state are above this number and half
are below
Median Attorney Rate in Eastern Area of
State
Half of all survey responses in this area of
the state are above this number and half
are below
Median Attorney Rate in Western Area of
State
Half of all survey responses in this area of
the state are above this number and half
are below
Median Attorney Rate in Central Area of
State
Half of all survey responses in this area of
the state are above this number and half
are below
Median Rates for Practice Areas in Consumer Law
Median Rate for Attorneys Handling
Bankruptcy Cases
For all attorneys handling this specific
niche area of Consumer Law, the 25%
Median, Median and 95% Median points
are providedMedian Rate for Attorneys Handling
Class Action Case
For all attorneys handling this specific
niche area of Consumer Law, the 25%
Median, Median and 95% Median points
are provided
32

UNITED STATES CONSUMER LAW SURVEY REPORT 2015-2016
Median Rate for Attorneys Handling
Credit Rights Cases
For all attorneys handling this specific
niche area of Consumer Law, the 25%
Median, Median and 95% Median points
are providedMedian Rate for Attorneys Handling
Mortgage Cases
For all attorneys handling this specific
niche area of Consumer Law, the 25%
Median, Median and 95% Median points
are providedMedian Rate for Attorneys Handling
Vehicle Cases
For all attorneys handling this specific
niche area of Consumer Law, the 25%
Median, Median and 95% Median points
are providedMedian Rate for Attorneys Handling
TCPA Cases
For all attorneys handling this specific
niche area of Consumer Law, the 25%
Median, Median and 95% Median points
are providedMedian Rate for Attorneys Handling
Other Cases
For all attorneys handling a niche area of
Consumer Law not defined in the
preceding six areas, the 25% Median,
Median and 95% Median points are
provided
33

UNITED STATES CONSUMER LAW SURVEY REPORT 2015-2016
Alabama
This Survey
Firm Size 2.47
Median Years in Practice 22.2
Concentration of Practice in Consumer Law 98.7
Primary Practice Area Consumer Law
Secondary Practice Area Bankruptcy
Number of Paralegals in Firm 1.13
Last Time Rate Change Occurred (months) 16.1
Median Paralegal Rate for All Paralegals 76
Average Attorney Rate for All Attorneys 397
25% Median Attorney Rate for All Attorneys 308
Median Attorney Rate for All Attorneys 350
75% Median Attorney Rate for All Attorneys 400
95% Median Attorney Rate for All Attorneys 625
Median Metropolitan Attorney Rate 325
Median Non-Metropolitan Attorney Rate 325
Median Attorney Rate in Northern Area of State 325
Median Attorney Rate in Southern Area of State 325
Median Attorney Rate in Eastern Area of State 300
Median Attorney Rate in Western Area of State 300
Median Attorney Rate in Central Area of State 300
34

UNITED STATES CONSUMER LAW SURVEY REPORT 2015-2016
Median Rates for Practice Areas
25%
Median
Median 95%
Median
Attorneys Handling Bankruptcy Cases 300 350 375
Attorneys Handling Class Action Cases 300 325 700
Attorneys Handling Credit Rights Cases 300 350 700
Attorneys Handling Mortgage Cases 300 363 700
Attorneys Handling Vehicle Cases 300 363 700
Attorneys Handling TCPA Cases 300 350 700
Attorneys Handling Other Cases 300 350 700
35

UNITED STATES CONSUMER LAW SURVEY REPORT 2015-2016
Alaska
This Survey
Firm Size 1.4
Median Years in Practice 19.7
Concentration of Practice in Consumer Law 71.4
Primary Practice Area Consumer Law
Secondary Practice Area General Practice
Number of Paralegals in Firm 1.1
Last Time Rate Change Occurred (months) 8.6
Median Paralegal Rate for All Paralegals 75
Average Attorney Rate for All Attorneys 329
25% Median Attorney Rate for All Attorneys 225
Median Attorney Rate for All Attorneys 325
75% Median Attorney Rate for All Attorneys 450
95% Median Attorney Rate for All Attorneys 500
Median Metropolitan Attorney Rate 325
Median Non-Metropolitan Attorney Rate 338
Median Attorney Rate in Northern Area of State 325
Median Attorney Rate in Southern Area of State 338
Median Attorney Rate in Eastern Area of State 350
Median Attorney Rate in Western Area of State 350
Median Attorney Rate in Central Area of State 338
36

UNITED STATES CONSUMER LAW SURVEY REPORT 2015-2016
Median Rates for Practice Areas
25%
Median
Median 95%
Median
Attorneys Handling Bankruptcy Cases 300 300 450
Attorneys Handling Class Action Cases 325 363 400
Attorneys Handling Credit Rights Cases 325 338 500
Attorneys Handling Mortgage Cases 100 218 325
Attorneys Handling Vehicle Cases 325 363 400
Attorneys Handling TCPA Cases 100 300 500
Attorneys Handling Other Cases 100 250 400
37

UNITED STATES CONSUMER LAW SURVEY REPORT 2015-2016
Arizona
This Survey
Firm Size 2.0
Median Years in Practice 26.0
Concentration of Practice in Consumer Law 92.8
Primary Practice Area Consumer Law
Secondary Practice Area Bankruptcy
Number of Paralegals in Firm 1.2
Last Time Rate Change Occurred (months) 21.0
Median Paralegal Rate for All Paralegals 125
Average Attorney Rate for All Attorneys 432
25% Median Attorney Rate for All Attorneys 363
Median Attorney Rate for All Attorneys 425
75% Median Attorney Rate for All Attorneys 483
95% Median Attorney Rate for All Attorneys 700
Median Metropolitan Attorney Rate 425
Median Non-Metropolitan Attorney Rate 425
Median Attorney Rate in Northern Area of State 463
Median Attorney Rate in Southern Area of State 438
Median Attorney Rate in Eastern Area of State 463
Median Attorney Rate in Western Area of State 450
Median Attorney Rate in Central Area of State 438
38

UNITED STATES CONSUMER LAW SURVEY REPORT 2015-2016
Median Rates for Practice Areas
25%Median
Median 95%Median
Attorneys Handling Bankruptcy Cases 250 300 475
Attorneys Handling Class Action Cases 400 425 700
Attorneys Handling Credit Rights Cases 375 433 700
Attorneys Handling Mortgage Cases 350 425 700
Attorneys Handling Vehicle Cases 375 400 700
Attorneys Handling TCPA Cases 400 450 700
Attorneys Handling Other Cases 250 500 700
39

UNITED STATES CONSUMER LAW SURVEY REPORT 2015-2016
Arkansas
This Survey
Firm Size 2.5
Median Years in Practice 18.5
Concentration of Practice in Consumer Law 62.5
Primary Practice Area Consumer Law
Secondary Practice Area General Practice
Number of Paralegals in Firm .75
Last Time Rate Change Occurred (months) 19.5
Median Paralegal Rate for All Paralegals 25
Average Attorney Rate for All Attorneys 269
25% Median Attorney Rate for All Attorneys 175
Median Attorney Rate for All Attorneys 225
75% Median Attorney Rate for All Attorneys 250
95% Median Attorney Rate for All Attorneys 450
Median Metropolitan Attorney Rate 200
Median Non-Metropolitan Attorney Rate 213
Median Attorney Rate in Northern Area of State 200
Median Attorney Rate in Southern Area of State 350
Median Attorney Rate in Eastern Area of State 313
Median Attorney Rate in Western Area of State 250
Median Attorney Rate in Central Area of State 350
40

UNITED STATES CONSUMER LAW SURVEY REPORT 2015-2016
Median Rates for Practice Areas
25%
Median
Median 95%
Median
Attorneys Handling Bankruptcy Cases 160 200 380
Attorneys Handling Class Action Cases 200 250 450
Attorneys Handling Credit Rights Cases 175 225 450
Attorneys Handling Mortgage Cases 200 250 450
Attorneys Handling Vehicle Cases 140 175 315
Attorneys Handling TCPA Cases 360 450 725
Attorneys Handling Other Cases 325 330 475
41

UNITED STATES CONSUMER LAW SURVEY REPORT 2015-2016
California
This Survey
Firm Size 2.3
Median Years in Practice 18.0
Concentration of Practice in Consumer Law 83.2
Primary Practice Area Consumer Law
Secondary Practice Area Bankruptcy
Median Number of Paralegals in Firm 1.0
Last Time Rate Change Occurred (months) 19.0
Median Paralegal Rate for All Paralegals 75
Average Attorney Rate for All Attorneys 465
25% Median Attorney Rate for All Attorneys 325
Median Attorney Rate for All Attorneys 450
75% Median Attorney Rate for All Attorneys 600
95% Median Attorney Rate for All Attorneys 725
Median Metropolitan Attorney Rate 450
Median Non-Metropolitan Attorney Rate 350
Median Attorney Rate in Northern Area of State 475
Median Attorney Rate in Southern Area of State 450
Median Attorney Rate in Eastern Area of State 475
Median Attorney Rate in Western Area of State 475
Median Attorney Rate in Central Area of State 463
42

UNITED STATES CONSUMER LAW SURVEY REPORT 2015-2016
Median Rates for Practice Areas
25%
Median
Median 95%
Median
Attorneys Handling Bankruptcy Cases 300 350 625
Attorneys Handling Class Action Cases 450 513 725
Attorneys Handling Credit Rights Cases 350 450 725
Attorneys Handling Mortgage Cases 350 438 700
Attorneys Handling Vehicle Cases 400 463 700
Attorneys Handling TCPA Cases 400 450 700
Attorneys Handling Other Cases 350 425 725
Experience Variable Table
Years Practicing Consumer Law Average Attorney Hourly Rate
<1 300
1-3 225
3-5 273
6-10 389
11-15 443
16-20 501
21-25 513
26-30 511
31-35 513
36-40 534
41+ 625
43

UNITED STATES CONSUMER LAW SURVEY REPORT 2015-2016
Specialty Variable Table
Percentage of Consumer Law Practice Average Attorney Hourly Rate
100 496
90 519
80 414
70 520
60 510
50 458
Small Firm Size Variable Table
Years in Practice Average Attorney Hourly Rate
<1 300
1-3 300
3-5 283
6-10 380
11-15 450
16-20 554
21-25 550
26-30 585
31-35 538
36-40 600
41+ 625
44
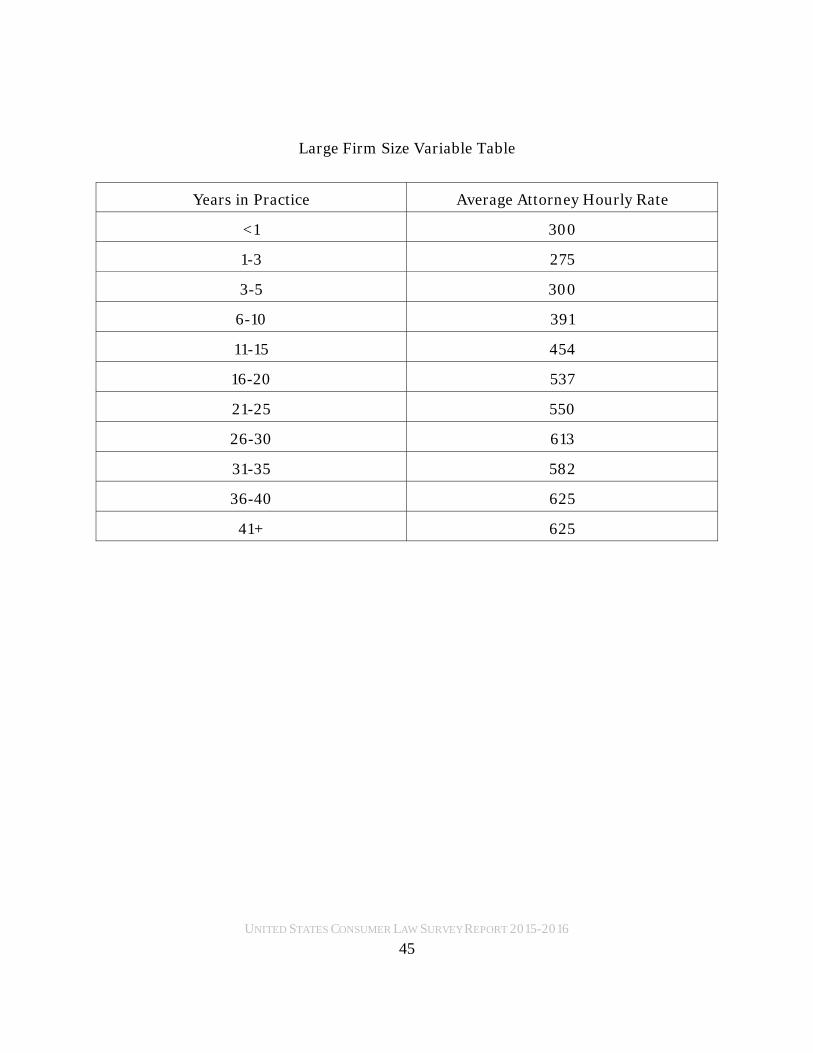
UNITED STATES CONSUMER LAW SURVEY REPORT 2015-2016
Large Firm Size Variable Table
Years in Practice Average Attorney Hourly Rate
<1 300
1-3 275
3-5 300
6-10 391
11-15 454
16-20 537
21-25 550
26-30 613
31-35 582
36-40 625
41+ 625
45

UNITED STATES CONSUMER LAW SURVEY REPORT 2015-2016
Colorado
This Survey
Firm Size 2.1
Median Years in Practice 17.5
Concentration of Practice in Consumer Law 96.0
Primary Practice Area Consumer Law
Secondary Practice Area Bankruptcy
Number of Paralegals in Firm 1.2
Last Time Rate Change Occurred (months) 20.4
Median Paralegal Rate for All Paralegals 105
Average Attorney Rate for All Attorneys 395
25% Median Attorney Rate for All Attorneys 300
Median Attorney Rate for All Attorneys 400
75% Median Attorney Rate for All Attorneys 500
95% Median Attorney Rate for All Attorneys 550
Median Metropolitan Attorney Rate 400
Median Non-Metropolitan Attorney Rate 375
Median Attorney Rate in Northern Area of State 425
Median Attorney Rate in Southern Area of State 400
Median Attorney Rate in Eastern Area of State 400
Median Attorney Rate in Western Area of State 350
Median Attorney Rate in Central Area of State 400
46

UNITED STATES CONSUMER LAW SURVEY REPORT 2015-2016
Median Rates for Practice Areas
25%
Median
Median 95%
Median
Attorneys Handling Bankruptcy Cases 280 300 400
Attorneys Handling Class Action Cases 300 350 500
Attorneys Handling Credit Rights Cases 300 375 550
Attorneys Handling Mortgage Cases 250 300 500
Attorneys Handling Vehicle Cases 275 300 400
Attorneys Handling TCPA Cases 300 450 550
Attorneys Handling Other Cases - - -
47

UNITED STATES CONSUMER LAW SURVEY REPORT 2015-2016
Connecticut
This Survey
Firm Size 2.2
Median Years in Practice 24.1
Concentration of Practice in Consumer Law 73.8
Primary Practice Area Consumer Law
Secondary Practice Area Bankruptcy
Number of Paralegals in Firm 1.57
Last Time Rate Change Occurred (months) 30.0
Median Paralegal Rate for All Paralegals 110
Average Attorney Rate for All Attorneys 438
25% Median Attorney Rate for All Attorneys 350
Median Attorney Rate for All Attorneys 400
75% Median Attorney Rate for All Attorneys 625
95% Median Attorney Rate for All Attorneys 725
Median Metropolitan Attorney Rate 388
Median Non-Metropolitan Attorney Rate 400
Median Attorney Rate in Northern Area of State 450
Median Attorney Rate in Southern Area of State 450
Median Attorney Rate in Eastern Area of State 400
Median Attorney Rate in Western Area of State 388
Median Attorney Rate in Central Area of State 425
48

UNITED STATES CONSUMER LAW SURVEY REPORT 2015-2016
Median Rates for Practice Areas
25%
Median
Median 95%
Median
Attorneys Handling Bankruptcy Cases 300 350 450
Attorneys Handling Class Action Cases 400 625 725
Attorneys Handling Credit Rights Cases 375 400 725
Attorneys Handling Mortgage Cases 300 363 725
Attorneys Handling Vehicle Cases 300 388 400
Attorneys Handling TCPA Cases 375 400 725
Attorneys Handling Other Cases 300 375 625
49

UNITED STATES CONSUMER LAW SURVEY REPORT 2015-2016
Delaware
This Survey
Firm Size 3.0
Median Years in Practice 36.0
Concentration of Practice in Consumer Law 70.0
Primary Practice Area Consumer Law
Secondary Practice Area Bankruptcy
Number of Paralegals in Firm 1.5
Last Time Rate Change Occurred (months) 15.0
Median Paralegal Rate for All Paralegals 133
Average Attorney Rate for All Attorneys 613
25% Median Attorney Rate for All Attorneys 562
Median Attorney Rate for All Attorneys 613
75% Median Attorney Rate for All Attorneys 660
95% Median Attorney Rate for All Attorneys 700
Median Metropolitan Attorney Rate 500
Median Non-Metropolitan Attorney Rate 500
Median Attorney Rate in Northern Area of State 613
Median Attorney Rate in Southern Area of State 725
Median Attorney Rate in Eastern Area of State 725
Median Attorney Rate in Western Area of State 725
Median Attorney Rate in Central Area of State 725
50

UNITED STATES CONSUMER LAW SURVEY REPORT 2015-2016
Median Rates for Practice Areas
25%
Median
Median 95%
Median
Attorneys Handling Bankruptcy Cases 275 340 400
Attorneys Handling Class Action Cases 500 613 725
Attorneys Handling Credit Rights Cases 300 508 625
Attorneys Handling Mortgage Cases 590 725 725
Attorneys Handling Vehicle Cases 352 500 580
Attorneys Handling TCPA Cases 300 508 625
Attorneys Handling Other Cases 352 500 580
51

UNITED STATES CONSUMER LAW SURVEY REPORT 2015-2016
District of Columbia
This Survey
Firm Size 3.2
Median Years in Practice 30.1
Concentration of Practice in Consumer Law 87.9
Primary Practice Area Consumer Law
Secondary Practice Area Bankruptcy
Number of Paralegals in Firm 1.57
Last Time Rate Change Occurred (months) 16.7
Median Paralegal Rate for All Paralegals 140
Average Attorney Rate for All Attorneys 580
25% Median Attorney Rate for All Attorneys 475
Median Attorney Rate for All Attorneys 700
75% Median Attorney Rate for All Attorneys 710
95% Median Attorney Rate for All Attorneys 725
Median Metropolitan Attorney Rate 700
Median Non-Metropolitan Attorney Rate 613
Median Attorney Rate in Northern Area of DC 650
Median Attorney Rate in Southern Area of DC 700
Median Attorney Rate in Eastern Area of DC 687
Median Attorney Rate in Western Area of DC 725
Median Attorney Rate in Central Area of DC 675
52

UNITED STATES CONSUMER LAW SURVEY REPORT 2015-2016
Median Rates for Practice Areas
25%
Median
Median 95%
Median
Attorneys Handling Bankruptcy Cases 250 375 500
Attorneys Handling Class Action Cases 675 700 725
Attorneys Handling Credit Rights Cases 383 563 725
Attorneys Handling Mortgage Cases 325 450 725
Attorneys Handling Vehicle Cases 325 450 550
Attorneys Handling TCPA Cases 325 450 600
Attorneys Handling Other Cases 250 488 725
53

UNITED STATES CONSUMER LAW SURVEY REPORT 2015-2016
Florida
This Survey
Firm Size 2.8
Median Years in Practice 17.0
Concentration of Practice in Consumer Law 98.4
Primary Practice Area Consumer Law
Secondary Practice Area Bankruptcy
Number of Paralegals in Firm 1.9
Last Time Rate Change Occurred (months) 19.0
Median Paralegal Rate for All Paralegals 100
Average Attorney Rate for All Attorneys 416
25% Median Attorney Rate for All Attorneys 325
Median Attorney Rate for All Attorneys 400
75% Median Attorney Rate for All Attorneys 500
95% Median Attorney Rate for All Attorneys 700
Median Metropolitan Attorney Rate 425
Median Non-Metropolitan Attorney Rate 450
Median Attorney Rate in Northern Area of State 425
Median Attorney Rate in Southern Area of State 400
Median Attorney Rate in Eastern Area of State 388
Median Attorney Rate in Western Area of State 388
Median Attorney Rate in Central Area of State 375
54

UNITED STATES CONSUMER LAW SURVEY REPORT 2015-2016
Median Rates for Practice Areas
25%Median
Median 95%Median
Attorneys Handling Bankruptcy Cases 275 325 475
Attorneys Handling Class Action Cases 360 475 725
Attorneys Handling Credit Rights Cases 338 413 650
Attorneys Handling Mortgage Cases 310 450 700
Attorneys Handling Vehicle Cases 325 375 700
Attorneys Handling TCPA Cases 325 400 700
Attorneys Handling Other Cases 350 388 500
Experience Variable Table
Years Practicing Consumer Law Average Attorney Hourly Rate
<1 350
1-3 338
3-5 300
6-10 357
11-15 411
16-20 525
21-25 515
26-30 486
31-35 519
36-40 700
41+ 500
55

UNITED STATES CONSUMER LAW SURVEY REPORT 2015-2016
Specialty Variable Table
Percentage of Consumer Law Practice Average Attorney Hourly Rate
100 422
90 413
80 416
70 325
60 658
50 -
Small Firm Size Variable Table
Years in Practice Average Attorney Hourly Rate
<1 350
1-3 350
3-5 308
6-10 381
11-15 389
16-20 450
21-25 538
26-30 463
31-35 542
36-40 -
41+ 500
56

UNITED STATES CONSUMER LAW SURVEY REPORT 2015-2016
Large Firm Size Variable Table
Years in Practice Average Attorney Hourly Rate
<1 -
1-3 275
3-5 283
6-10 325
11-15 488
16-20 600
21-25 500
26-30 533
31-35 450
36-40 700
41+ -
57

UNITED STATES CONSUMER LAW SURVEY REPORT 2015-2016
Georgia
This Survey
Firm Size 2.1
Median Years in Practice 18.4
Concentration of Practice in Consumer Law 88.4
Primary Practice Area Consumer Law
Secondary Practice Area Bankruptcy
Number of Paralegals in Firm 2.7
Last Time Rate Change Occurred (months) 18.3
Median Paralegal Rate for All Paralegals 90
Average Attorney Rate for All Attorneys 331
25% Median Attorney Rate for All Attorneys 275
Median Attorney Rate for All Attorneys 300
75% Median Attorney Rate for All Attorneys 400
95% Median Attorney Rate for All Attorneys 650
Median Metropolitan Attorney Rate 338
Median Non-Metropolitan Attorney Rate 275
Median Attorney Rate in Northern Area of State 313
Median Attorney Rate in Southern Area of State 300
Median Attorney Rate in Eastern Area of State 325
Median Attorney Rate in Western Area of State 325
Median Attorney Rate in Central Area of State 325
58
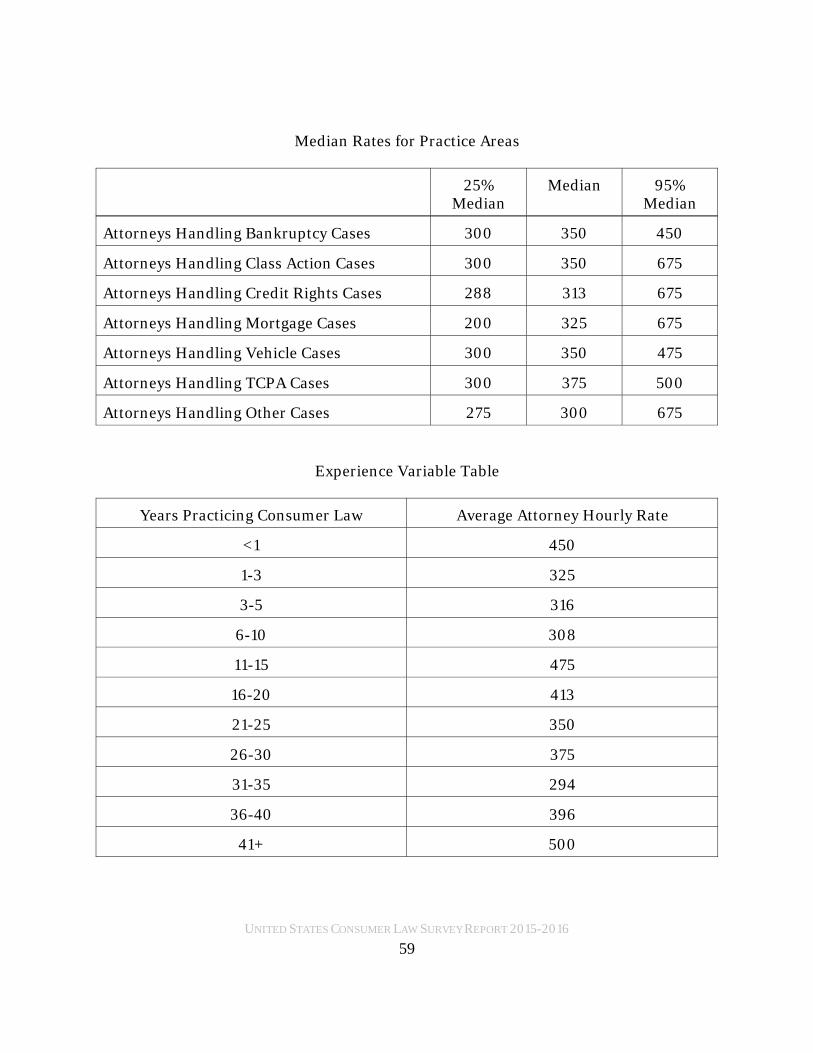
UNITED STATES CONSUMER LAW SURVEY REPORT 2015-2016
Median Rates for Practice Areas
25%Median
Median 95%Median
Attorneys Handling Bankruptcy Cases 300 350 450
Attorneys Handling Class Action Cases 300 350 675
Attorneys Handling Credit Rights Cases 288 313 675
Attorneys Handling Mortgage Cases 200 325 675
Attorneys Handling Vehicle Cases 300 350 475
Attorneys Handling TCPA Cases 300 375 500
Attorneys Handling Other Cases 275 300 675
Experience Variable Table
Years Practicing Consumer Law Average Attorney Hourly Rate
<1 450
1-3 325
3-5 316
6-10 308
11-15 475
16-20 413
21-25 350
26-30 375
31-35 294
36-40 396
41+ 500
59

UNITED STATES CONSUMER LAW SURVEY REPORT 2015-2016
Specialty Variable Table
Percentage of Consumer Law Practice Average Attorney Hourly Rate
100 363
90 400
80 358
70 350
60 281
50 350
Small Firm Size Variable Table
Years in Practice Average Attorney Hourly Rate
<1 450
1-3 450
3-5 300
6-10 308
11-15 350
16-20 350
21-25 350
26-30 375
31-35 294
36-40 396
41+ 500
60

UNITED STATES CONSUMER LAW SURVEY REPORT 2015-2016
Large Firm Size Variable Table
Years in Practice Average Attorney Hourly Rate
<1 200
1-3 200
3-5 245
6-10 350
11-15 538
16-20 450
21-25 500
26-30 540
31-35 575
36-40 575
41+ 625
61

UNITED STATES CONSUMER LAW SURVEY REPORT 2015-2016
Hawaii
This Survey
Firm Size 1.3
Median Years in Practice 21.1
Concentration of Practice in Consumer Law 57.1
Primary Practice Area Consumer Law
Secondary Practice Area Bankruptcy
Number of Paralegals in Firm 2.1
Last Time Rate Change Occurred (months) 27.4
Median Paralegal Rate for All Paralegals 100
Average Attorney Rate for All Attorneys 357
25% Median Attorney Rate for All Attorneys 300
Median Attorney Rate for All Attorneys 350
75% Median Attorney Rate for All Attorneys 500
95% Median Attorney Rate for All Attorneys 550
Median Metropolitan Attorney Rate 350
Median Non-Metropolitan Attorney Rate 300
Median Attorney Rate in Northern Area of State 300
Median Attorney Rate in Southern Area of State 300
Median Attorney Rate in Eastern Area of State 300
Median Attorney Rate in Western Area of State 325
Median Attorney Rate in Central Area of State 325
62

UNITED STATES CONSUMER LAW SURVEY REPORT 2015-2016
Median Rates for Practice Areas
25%
Median
Median 95%
Median
Attorneys Handling Bankruptcy Cases 250 300 350
Attorneys Handling Class Action Cases 350 450 550
Attorneys Handling Credit Rights Cases 300 350 550
Attorneys Handling Mortgage Cases 300 350 550
Attorneys Handling Vehicle Cases 250 300 350
Attorneys Handling TCPA Cases 350 450 550
Attorneys Handling Other Cases 300 350 550
63
UNITED STATES CONSUMER LAW SURVEY REPORT 2015-2016
Idaho
This Survey
Firm Size 1.0
Median Years in Practice 10.0
Concentration of Practice in Consumer Law 86.7
Primary Practice Area Consumer Law
Secondary Practice Area Bankruptcy
Number of Paralegals in Firm .7
Last Time Rate Change Occurred (months) 20.0
Median Paralegal Rate for All Paralegals 90
Average Attorney Rate for All Attorneys 250
25% Median Attorney Rate for All Attorneys 175
Median Attorney Rate for All Attorneys 200
75% Median Attorney Rate for All Attorneys 325
95% Median Attorney Rate for All Attorneys 375
Median Metropolitan Attorney Rate 275
Median Non-Metropolitan Attorney Rate 200
Median Attorney Rate in Northern Area of State 375
Median Attorney Rate in Southern Area of State 375
Median Attorney Rate in Eastern Area of State 288
Median Attorney Rate in Western Area of State 275
Median Attorney Rate in Central Area of State 375
64
UNITED STATES CONSUMER LAW SURVEY REPORT 2015-2016
Median Rates for Practice Areas
25%
Median
Median 95%
Median
Attorneys Handling Bankruptcy Cases 175 200 275
Attorneys Handling Class Action Cases 240 375 515
Attorneys Handling Credit Rights Cases 175 275 375
Attorneys Handling Mortgage Cases 175 200 275
Attorneys Handling Vehicle Cases 175 275 375
Attorneys Handling TCPA Cases 240 375 515
Attorneys Handling Other Cases 275 391 725
Experience Variable Table
Years Practicing Consumer Law Average Attorney Hourly Rate
<1 150
1-3 175
3-5 175
6-10 375
11-15 268
16-20 275
21-25 313
26-30 325
31-35 200
36-40 375
41+ 325
65

UNITED STATES CONSUMER LAW SURVEY REPORT 2015-2016
Illinois
This Survey
Firm Size 3.5
Median Years in Practice 15.0
Concentration of Practice in Consumer Law 95.1
Primary Practice Area Consumer Law
Secondary Practice Area Bankruptcy
Number of Paralegals in Firm 2.5
Last Time Rate Change Occurred (months) 12.4
Median Paralegal Rate for All Paralegals 125
Average Attorney Rate for All Attorneys 448
25% Median Attorney Rate for All Attorneys 325
Median Attorney Rate for All Attorneys 450
75% Median Attorney Rate for All Attorneys 575
95% Median Attorney Rate for All Attorneys 700
Median Metropolitan Attorney Rate 450
Median Non-Metropolitan Attorney Rate 288
Median Attorney Rate in Northern Area of State 450
Median Attorney Rate in Southern Area of State 500
Median Attorney Rate in Eastern Area of State 450
Median Attorney Rate in Western Area of State 475
Median Attorney Rate in Central Area of State 450
66

UNITED STATES CONSUMER LAW SURVEY REPORT 2015-2016
Median Rates for Practice Areas
25%Median
Median 95%Median
Attorneys Handling Bankruptcy Cases 275 388 650
Attorneys Handling Class Action Cases 450 500 713
Attorneys Handling Credit Rights Cases 350 463 713
Attorneys Handling Mortgage Cases 425 500 700
Attorneys Handling Vehicle Cases 313 450 700
Attorneys Handling TCPA Cases 450 500 700
Attorneys Handling Other Cases 300 450 600
Experience Variable Table
Years Practicing Consumer Law Average Attorney Hourly Rate
<1 250
1-3 300
3-5 308
6-10 454
11-15 500
16-20 536
21-25 505
26-30 563
31-35 600
36-40 575
41+ 600
67
UNITED STATES CONSUMER LAW SURVEY REPORT 2015-2016
Specialty Variable Table
Percentage of Consumer Law Practice Average Attorney Hourly Rate
100 452
90 550
80 475
70 410
60 375
50 375
Small Firm Size Variable Table
Years in Practice Average Attorney Hourly Rate
<1 275
1-3 315
3-5 325
6-10 725
11-15 525
16-20 675
21-25 463
26-30 563
31-35 600
36-40 450
41+ 500
68

UNITED STATES CONSUMER LAW SURVEY REPORT 2015-2016
Large Firm Size Variable Table
Years in Practice Average Attorney Hourly Rate
<1 250
1-3 263
3-5 275
6-10 400
11-15 492
16-20 513
21-25 533
26-30 565
31-35 600
36-40 700
41+ 750
69

UNITED STATES CONSUMER LAW SURVEY REPORT 2015-2016
Indiana
This Survey
Firm Size 2.6
Median Years in Practice 27.0
Concentration of Practice in Consumer Law 98.3
Primary Practice Area Consumer Law
Secondary Practice Area Bankruptcy
Number of Paralegals in Firm 2.4
Last Time Rate Change Occurred (months) 17.5
Median Paralegal Rate for All Paralegals 125
Average Attorney Rate for All Attorneys 426
25% Median Attorney Rate for All Attorneys 350
Median Attorney Rate for All Attorneys 450
75% Median Attorney Rate for All Attorneys 540
95% Median Attorney Rate for All Attorneys 675
Median Metropolitan Attorney Rate 450
Median Non-Metropolitan Attorney Rate 350
Median Attorney Rate in Northern Area of State 450
Median Attorney Rate in Southern Area of State 488
Median Attorney Rate in Easter Area of State 450
Median Attorney Rate in Western Area of State 450
Median Attorney Rate in Central Area of State 450
70

UNITED STATES CONSUMER LAW SURVEY REPORT 2015-2016
Median Rates for Practice Areas
25%Median
Median 95%Median
Attorneys Handling Bankruptcy Cases 175 213 450
Attorneys Handling Class Action Cases 350 463 700
Attorneys Handling Credit Rights Cases 335 450 675
Attorneys Handling Mortgage Cases 310 350 700
Attorneys Handling Vehicle Cases 325 450 700
Attorneys Handling TCPA Cases 400 450 700
Attorneys Handling Other Cases 525 563 600
71

UNITED STATES CONSUMER LAW SURVEY REPORT 2015-2016
Iowa
This Survey
Firm Size 2.1
Median Years in Practice 25.0
Concentration of Practice in Consumer Law 57.1
Primary Practice Area Bankruptcy
Secondary Practice Area Consumer Law
Number of Paralegals in Firm 2.1
Last Time Rate Change Occurred (months) 16.6
Median Paralegal Rate for All Paralegals 125
Average Attorney Rate for All Attorneys 339
25% Median Attorney Rate for All Attorneys 250
Median Attorney Rate for All Attorneys 275
75% Median Attorney Rate for All Attorneys 475
95% Median Attorney Rate for All Attorneys 500
Median Metropolitan Attorney Rate 363
Median Non-Metropolitan Attorney Rate 275
Median Attorney Rate in Northern Area of State 375
Median Attorney Rate in Southern Area of State 325
Median Attorney Rate in Eastern Area of State 263
Median Attorney Rate in Western Area of State 275
Median Attorney Rate in Central Area of State 263
72

UNITED STATES CONSUMER LAW SURVEY REPORT 2015-2016
Median Rates for Practice Areas
25%
Median
Median 95%
Median
Attorneys Handling Bankruptcy Cases 220 250 275
Attorneys Handling Class Action Cases 250 475 500
Attorneys Handling Credit Rights Cases 310 425 500
Attorneys Handling Mortgage Cases 300 400 500
Attorneys Handling Vehicle Cases 300 400 450
Attorneys Handling TCPA Cases 325 425 500
Attorneys Handling Other Cases 325 400 500
73

UNITED STATES CONSUMER LAW SURVEY REPORT 2015-2016
Kansas
This Survey
Firm Size 2.9
Median Years in Practice 5.0
Concentration of Practice in Consumer Law 94.5
Primary Practice Area Consumer Law
Secondary Practice Area Bankruptcy
Number of Paralegals in Firm 1.2
Last Time Rate Change Occurred (months) 9.3
Median Paralegal Rate for All Paralegals 140
Average Attorney Rate for All Attorneys 377
25% Median Attorney Rate for All Attorneys 275
Median Attorney Rate for All Attorneys 350
75% Median Attorney Rate for All Attorneys 425
95% Median Attorney Rate for All Attorneys 725
Median Metropolitan Attorney Rate 350
Median Non-Metropolitan Attorney Rate 350
Median Attorney Rate in Northern Area of State 425
Median Attorney Rate in Southern Area of State 500
Median Attorney Rate in Eastern Area of State 350
Median Attorney Rate in Western Area of State 350
Median Attorney Rate in Central Area of State 500
74

UNITED STATES CONSUMER LAW SURVEY REPORT 2015-2016
Median Rates for Practice Areas
25%
Median
Median 95%
Median
Attorneys Handling Bankruptcy Cases 200 250 350
Attorneys Handling Class Action Cases 300 350 725
Attorneys Handling Credit Rights Cases 300 350 725
Attorneys Handling Mortgage Cases 300 350 650
Attorneys Handling Vehicle Cases 200 313 350
Attorneys Handling TCPA Cases 325 350 500
Attorneys Handling Other Cases 300 350 650
75

UNITED STATES CONSUMER LAW SURVEY REPORT 2015-2016
Kentucky
This Survey
Firm Size 1.7
Median Years in Practice 25.9
Concentration of Practice in Consumer Law 88.8
Primary Practice Area Consumer Law
Secondary Practice Area Bankruptcy
Number of Paralegals in Firm 1.3
Last Time Rate Change Occurred (months) 25.5
Median Paralegal Rate for All Paralegals 90
Average Attorney Rate for All Attorneys 316
25% Median Attorney Rate for All Attorneys 200
Median Attorney Rate for All Attorneys 300
75% Median Attorney Rate for All Attorneys 450
95% Median Attorney Rate for All Attorneys 600
Median Metropolitan Attorney Rate 300
Median Non-Metropolitan Attorney Rate 200
Median Attorney Rate in Northern Area of State 475
Median Attorney Rate in Southern Area of State 300
Median Attorney Rate in Eastern Area of State 325
Median Attorney Rate in Western Area of State 300
Median Attorney Rate in Central Area of State 350
76
UNITED STATES CONSUMER LAW SURVEY REPORT 2015-2016
Median Rates for Practice Areas
25%Median
Median 95%Median
Attorneys Handling Bankruptcy Cases 200 213 250
Attorneys Handling Class Action Cases 300 325 600
Attorneys Handling Credit Rights Cases 200 300 350
Attorneys Handling Mortgage Cases 200 213 250
Attorneys Handling Vehicle Cases 200 300 350
Attorneys Handling TCPA Cases 175 200 320
Attorneys Handling Other Cases 450 600 725
77

UNITED STATES CONSUMER LAW SURVEY REPORT 2015-2016
Louisiana
This Survey
Firm Size 2.5
Median Years in Practice 24.0
Concentration of Practice in Consumer Law 55.0
Primary Practice Area Bankruptcy
Secondary Practice Area Consumer Law
Number of Paralegals in Firm 1.75
Last Time Rate Change Occurred (months) 16.5
Median Paralegal Rate for All Paralegals 110
Average Attorney Rate for All Attorneys 406
25% Median Attorney Rate for All Attorneys 325
Median Attorney Rate for All Attorneys 400
75% Median Attorney Rate for All Attorneys 425
95% Median Attorney Rate for All Attorneys 500
Median Metropolitan Attorney Rate 400
Median Non-Metropolitan Attorney Rate 325
Median Attorney Rate in Northern Area of State 400
Median Attorney Rate in Southern Area of State 400
Median Attorney Rate in Eastern Area of State 450
Median Attorney Rate in Western Area of State 413
Median Attorney Rate in Central Area of State 500
78

UNITED STATES CONSUMER LAW SURVEY REPORT 2015-2016
Median Rates for Practice Areas
25%
Median
Median 95%
Median
Attorneys Handling Bankruptcy Cases 325 400 440
Attorneys Handling Class Action Cases 325 400 440
Attorneys Handling Credit Rights Cases 400 425 500
Attorneys Handling Mortgage Cases 350 400 500
Attorneys Handling Vehicle Cases 225 348 700
Attorneys Handling TCPA Cases 400 425 500
Attorneys Handling Other Cases 275 325 425
79

UNITED STATES CONSUMER LAW SURVEY REPORT 2015-2016
Maine
This Survey
Firm Size 1.2
Median Years in Practice 45.0
Concentration of Practice in Consumer Law 70.0
Primary Practice Area Consumer Law
Secondary Practice Area Other
Number of Paralegals in Firm 1.6
Last Time Rate Change Occurred (months) 34.8
Median Paralegal Rate for All Paralegals 110
Average Attorney Rate for All Attorneys 450
25% Median Attorney Rate for All Attorneys 375
Median Attorney Rate for All Attorneys 400
75% Median Attorney Rate for All Attorneys 500
95% Median Attorney Rate for All Attorneys 600
Median Metropolitan Attorney Rate 400
Median Non-Metropolitan Attorney Rate 425
Median Attorney Rate in Northern Area of State 550
Median Attorney Rate in Southern Area of State 400
Median Attorney Rate in Eastern Area of State 500
Median Attorney Rate in Western Area of State 600
Median Attorney Rate in Central Area of State 600
80

UNITED STATES CONSUMER LAW SURVEY REPORT 2015-2016
Median Rates for Practice Areas
25%
Median
Median 95%
Median
Attorneys Handling Bankruptcy Cases 200 250 290
Attorneys Handling Class Action Cases 350 500 600
Attorneys Handling Credit Rights Cases 275 350 600
Attorneys Handling Mortgage Cases 350 400 425
Attorneys Handling Vehicle Cases 275 350 550
Attorneys Handling TCPA Cases 400 550 700
Attorneys Handling Other Cases 375 600 700
81

UNITED STATES CONSUMER LAW SURVEY REPORT 2015-2016
Maryland
This Survey
Firm Size 2.3
Median Years in Practice 21.9
Concentration of Practice in Consumer Law 71.3
Primary Practice Area Consumer Law
Secondary Practice Area Bankruptcy
Number of Paralegals in Firm 1.7
Last Time Rate Change Occurred (months) 16.4
Median Paralegal Rate for All Paralegals 100
Average Attorney Rate for All Attorneys 425
25% Median Attorney Rate for All Attorneys 275
Median Attorney Rate for All Attorneys 450
75% Median Attorney Rate for All Attorneys 550
95% Median Attorney Rate for All Attorneys 675
Median Metropolitan Attorney Rate 450
Median Non-Metropolitan Attorney Rate 417
Median Attorney Rate in Northern Area of State 325
Median Attorney Rate in Southern Area of State 475
Median Attorney Rate in Eastern Area of State 475
Median Attorney Rate in Western Area of State 475
Median Attorney Rate in Central Area of State 450
82
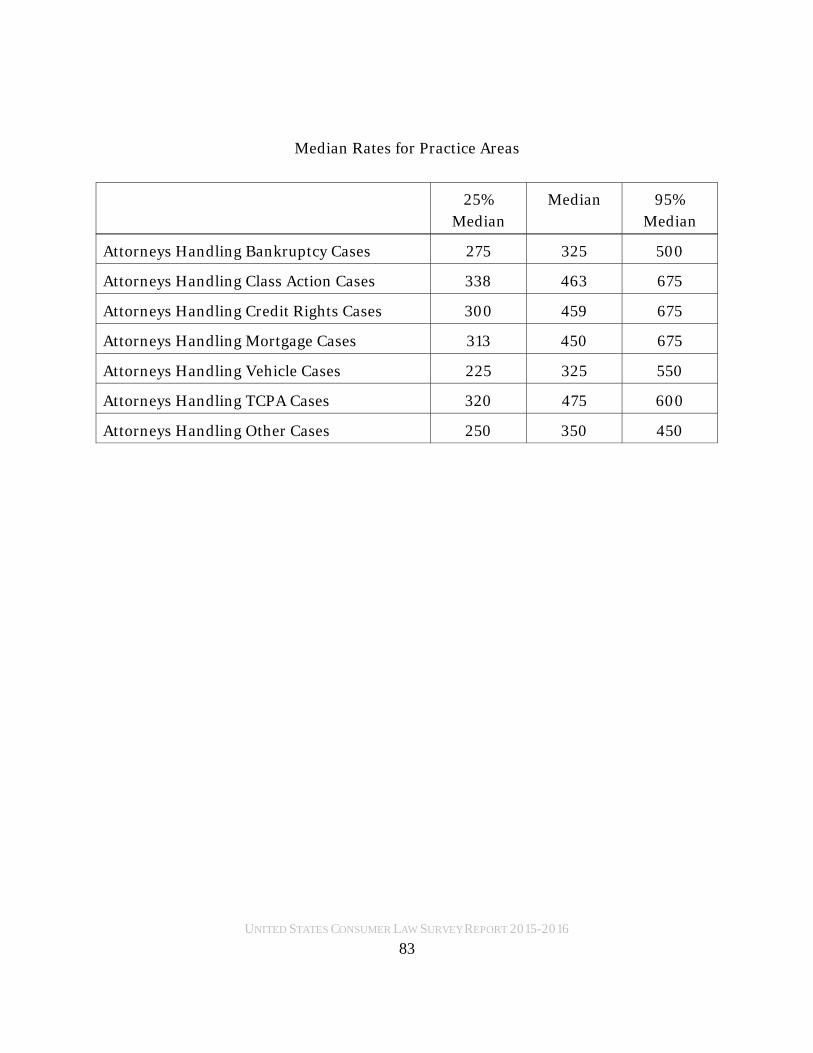
UNITED STATES CONSUMER LAW SURVEY REPORT 2015-2016
Median Rates for Practice Areas
25%
Median
Median 95%
Median
Attorneys Handling Bankruptcy Cases 275 325 500
Attorneys Handling Class Action Cases 338 463 675
Attorneys Handling Credit Rights Cases 300 459 675
Attorneys Handling Mortgage Cases 313 450 675
Attorneys Handling Vehicle Cases 225 325 550
Attorneys Handling TCPA Cases 320 475 600
Attorneys Handling Other Cases 250 350 450
83

UNITED STATES CONSUMER LAW SURVEY REPORT 2015-2016
Massachusetts
This Survey
Firm Size 2.4
Median Years in Practice 27.5
Concentration of Practice in Consumer Law 73.1
Primary Practice Area Consumer Law
Secondary Practice Area Bankruptcy
Number of Paralegals in Firm 1.4
Last Time Rate Change Occurred (months) 18.2
Median Paralegal Rate for All Paralegals 100
Average Attorney Rate for All Attorneys 443
25% Median Attorney Rate for All Attorneys 325
Median Attorney Rate for All Attorneys 375
75% Median Attorney Rate for All Attorneys 600
95% Median Attorney Rate for All Attorneys 725
Median Metropolitan Attorney Rate 375
Median Non-Metropolitan Attorney Rate 350
Median Attorney Rate in Northern Area of State 500
Median Attorney Rate in Southern Area of State 600
Median Attorney Rate in Eastern Area of State 388
Median Attorney Rate in Western Area of State 550
Median Attorney Rate in Central Area of State 500
84

UNITED STATES CONSUMER LAW SURVEY REPORT 2015-2016
Median Rates for Practice Areas
25%Median
Median 95%Median
Attorneys Handling Bankruptcy Cases 250 350 375
Attorneys Handling Class Action Cases 390 600 725
Attorneys Handling Credit Rights Cases 325 388 700
Attorneys Handling Mortgage Cases 300 475 725
Attorneys Handling Vehicle Cases 275 325 700
Attorneys Handling TCPA Cases 400 500 700
Attorneys Handling Other Cases 350 400 600
Experience Variable Table
Years Practicing Consumer Law Average Attorney Hourly Rate
<1 200
1-3 213
3-5 238
6-10 275
11-15 538
16-20 350
21-25 363
26-30 575
31-35 600
36-40 446
41+ 450
85

UNITED STATES CONSUMER LAW SURVEY REPORT 2015-2016
Specialty Variable Table
Percentage of Consumer Law Practice Average Attorney Hourly Rate
100 423
90 525
80 500
70 700
60 725
50 375
Small Firm Size Variable Table
Years in Practice Average Attorney Hourly Rate
<1 250
1-3 275
3-5 300
6-10 258
11-15 300
16-20 350
21-25 363
26-30 433
31-35 600
36-40 338
41+ 450
86
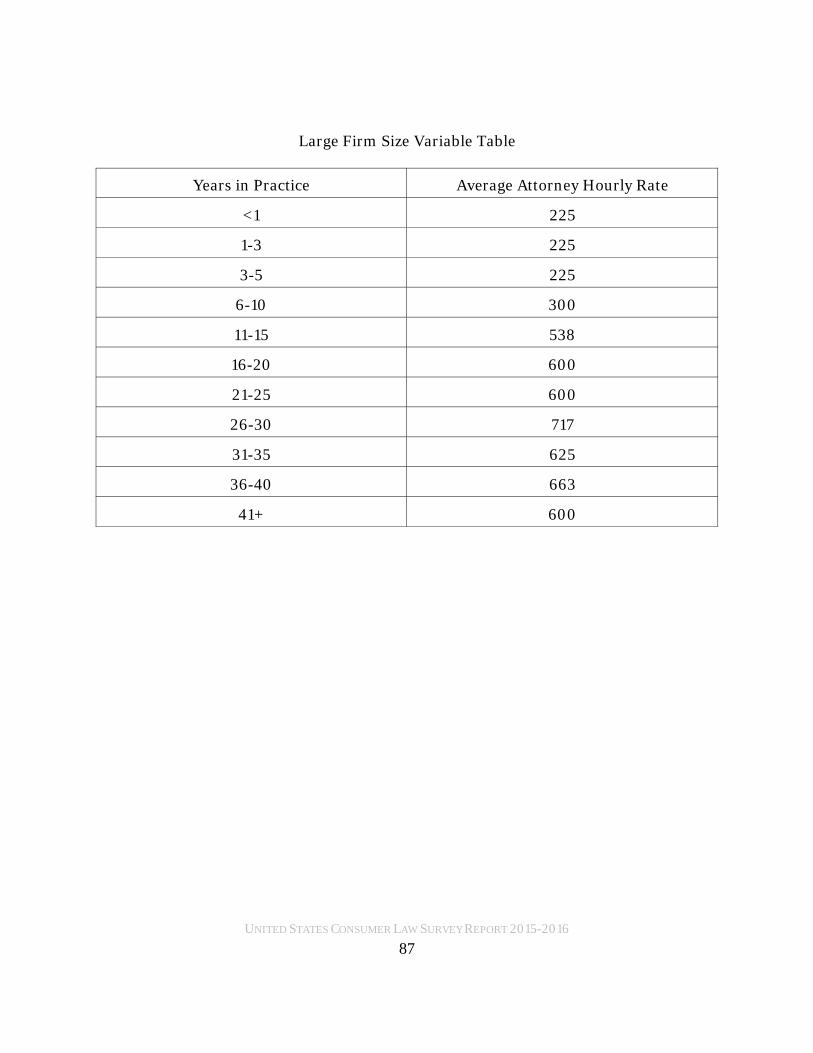
UNITED STATES CONSUMER LAW SURVEY REPORT 2015-2016
Large Firm Size Variable Table
Years in Practice Average Attorney Hourly Rate
<1 225
1-3 225
3-5 225
6-10 300
11-15 538
16-20 600
21-25 600
26-30 717
31-35 625
36-40 663
41+ 600
87

UNITED STATES CONSUMER LAW SURVEY REPORT 2015-2016
Michigan
This Survey
Firm Size 2.4
Median Years in Practice 20.0
Concentration of Practice in Consumer Law 80.0
Primary Practice Area Consumer Law
Secondary Practice Area Bankruptcy
Number of Paralegals in Firm 1.4
Last Time Rate Change Occurred (months) 20.4
Median Paralegal Rate for All Paralegals 75
Average Attorney Rate for All Attorneys 346
25% Median Attorney Rate for All Attorneys 275
Median Attorney Rate for All Attorneys 325
75% Median Attorney Rate for All Attorneys 400
95% Median Attorney Rate for All Attorneys 675
Median Metropolitan Attorney Rate 313
Median Non-Metropolitan Attorney Rate 375
Median Attorney Rate in Northern Area of State 375
Median Attorney Rate in Southern Area of State 350
Median Attorney Rate in Eastern Area of State 300
Median Attorney Rate in Western Area of State 350
Median Attorney Rate in Central Area of State 375
88

UNITED STATES CONSUMER LAW SURVEY REPORT 2015-2016
Median Rates for Practice Areas
25%Median
Median 95%Median
Attorneys Handling Bankruptcy Cases 225 263 350
Attorneys Handling Class Action Cases 250 350 700
Attorneys Handling Credit Rights Cases 275 350 675
Attorneys Handling Mortgage Cases 300 333 700
Attorneys Handling Vehicle Cases 240 350 675
Attorneys Handling TCPA Cases 300 350 675
Attorneys Handling Other Cases 200 225 350
Experience Variable Table
Years Practicing Consumer Law Average Attorney Hourly Rate
<1 200
1-3 231
3-5 263
6-10 306
11-15 390
16-20 319
21-25 413
26-30 420
31-35 383
36-40 419
41+ 263
89

UNITED STATES CONSUMER LAW SURVEY REPORT 2015-2016
Specialty Variable Table
Percentage of Consumer Law Practice Average Attorney Hourly Rate
100 372
90 396
80 300
70 250
60 325
50 300
Small Firm Size Variable Table
Years in Practice Average Attorney Hourly Rate
<1 250
1-3 263
3-5 238
6-10 306
11-15 375
16-20 350
21-25 425
26-30 400
31-35 383
36-40 325
41+ 300
90

UNITED STATES CONSUMER LAW SURVEY REPORT 2015-2016
Large Firm Size Variable Table
Years in Practice Average Attorney Hourly Rate
<1 200
1-3 200
3-5 275
6-10 300
11-15 513
16-20 450
21-25 400
26-30 475
31-35 525
36-40 700
41+ 550
91

UNITED STATES CONSUMER LAW SURVEY REPORT 2015-2016
Minnesota
This Survey
Firm Size 2.5
Median Years in Practice 11.0
Concentration of Practice in Consumer Law 88.6
Primary Practice Area Consumer Law
Secondary Practice Area Bankruptcy
Number of Paralegals in Firm 1.5
Last Time Rate Change Occurred (months) 11.6
Median Paralegal Rate for All Paralegals 82
Average Attorney Rate for All Attorneys 370
25% Median Attorney Rate for All Attorneys 275
Median Attorney Rate for All Attorneys 350
75% Median Attorney Rate for All Attorneys 450
95% Median Attorney Rate for All Attorneys 675
Median Metropolitan Attorney Rate 375
Median Non-Metropolitan Attorney Rate 200
Median Attorney Rate in Northern Area of State 350
Median Attorney Rate in Southern Area of State 350
Median Attorney Rate in Eastern Area of State 350
Median Attorney Rate in Western Area of State 350
Median Attorney Rate in Central Area of State 362
92

UNITED STATES CONSUMER LAW SURVEY REPORT 2015-2016
Median Rates for Practice Areas
25%Median
Median 95%Median
Attorneys Handling Bankruptcy Cases 200 250 350
Attorneys Handling Class Action Cases 450 563 675
Attorneys Handling Credit Rights Cases 310 360 675
Attorneys Handling Mortgage Cases 375 450 675
Attorneys Handling Vehicle Cases 325 359 450
Attorneys Handling TCPA Cases 325 363 550
Attorneys Handling Other Cases 300 379 675
93

UNITED STATES CONSUMER LAW SURVEY REPORT 2015-2016
Mississippi
This Survey
Firm Size 2.0
Median Years in Practice 20.6
Concentration of Practice in Consumer Law 76.0
Primary Practice Area Consumer Law
Secondary Practice Area Bankruptcy
Number of Paralegals in Firm .8
Last Time Rate Change Occurred (months) 27.6
Median Paralegal Rate for All Paralegals 100
Average Attorney Rate for All Attorneys 340
25% Median Attorney Rate for All Attorneys 250
Median Attorney Rate for All Attorneys 325
75% Median Attorney Rate for All Attorneys 350
95% Median Attorney Rate for All Attorneys 475
Median Metropolitan Attorney Rate 325
Median Non-Metropolitan Attorney Rate 250
Median Attorney Rate in Northern Area of State 288
Median Attorney Rate in Southern Area of State 338
Median Attorney Rate in Eastern Area of State 325
Median Attorney Rate in Western Area of State 325
Median Attorney Rate in Central Area of State 325
94

UNITED STATES CONSUMER LAW SURVEY REPORT 2015-2016
Median Rates for Practice Areas
25%
Median
Median 95%
Median
Attorneys Handling Bankruptcy Cases 270 350 445
Attorneys Handling Class Action Cases 300 325 475
Attorneys Handling Credit Rights Cases 288 338 475
Attorneys Handling Mortgage Cases 313 350 445
Attorneys Handling Vehicle Cases 300 388 475
Attorneys Handling TCPA Cases 250 288 325
Attorneys Handling Other Cases 363 475 538
95
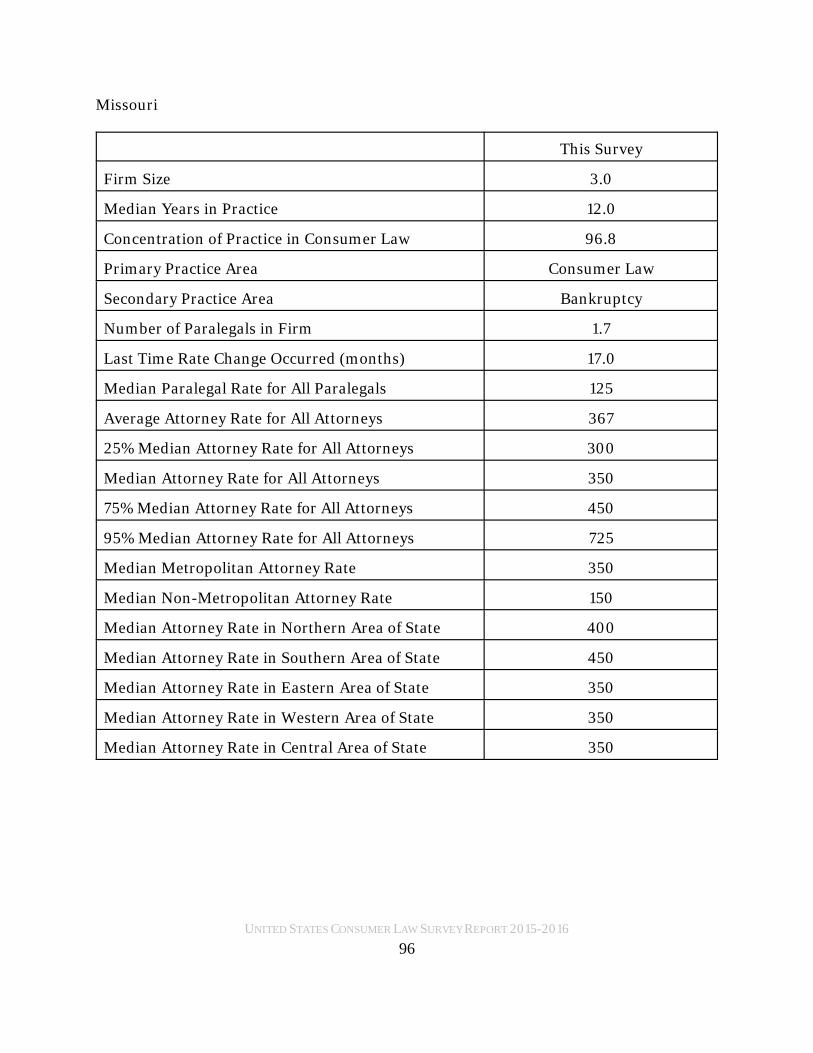
UNITED STATES CONSUMER LAW SURVEY REPORT 2015-2016
Missouri
This Survey
Firm Size 3.0
Median Years in Practice 12.0
Concentration of Practice in Consumer Law 96.8
Primary Practice Area Consumer Law
Secondary Practice Area Bankruptcy
Number of Paralegals in Firm 1.7
Last Time Rate Change Occurred (months) 17.0
Median Paralegal Rate for All Paralegals 125
Average Attorney Rate for All Attorneys 367
25% Median Attorney Rate for All Attorneys 300
Median Attorney Rate for All Attorneys 350
75% Median Attorney Rate for All Attorneys 450
95% Median Attorney Rate for All Attorneys 725
Median Metropolitan Attorney Rate 350
Median Non-Metropolitan Attorney Rate 150
Median Attorney Rate in Northern Area of State 400
Median Attorney Rate in Southern Area of State 450
Median Attorney Rate in Eastern Area of State 350
Median Attorney Rate in Western Area of State 350
Median Attorney Rate in Central Area of State 350
96

UNITED STATES CONSUMER LAW SURVEY REPORT 2015-2016
Median Rates for Practice Areas
25%Median
Median 95%Median
Attorneys Handling Bankruptcy Cases 175 200 350
Attorneys Handling Class Action Cases 300 350 725
Attorneys Handling Credit Rights Cases 300 350 725
Attorneys Handling Mortgage Cases 150 350 425
Attorneys Handling Vehicle Cases 300 350 450
Attorneys Handling TCPA Cases 338 350 550
Attorneys Handling Other Cases 300 325 350
97

UNITED STATES CONSUMER LAW SURVEY REPORT 2015-2016
Montana
This Survey
Firm Size 2.3
Median Years in Practice 31.0
Concentration of Practice in Consumer Law 76.7
Primary Practice Area Consumer Law
Secondary Practice Area Bankruptcy
Number of Paralegals in Firm 1.0
Last Time Rate Change Occurred (months) 24.0
Median Paralegal Rate for All Paralegals 100
Average Attorney Rate for All Attorneys 350
25% Median Attorney Rate for All Attorneys 225
Median Attorney Rate for All Attorneys 300
75% Median Attorney Rate for All Attorneys 470
95% Median Attorney Rate for All Attorneys 500
Median Metropolitan Attorney Rate 500
Median Non-Metropolitan Attorney Rate 275
Median Attorney Rate in Northern Area of State 210
Median Attorney Rate in Southern Area of State 500
Median Attorney Rate in Eastern Area of State 300
Median Attorney Rate in Western Area of State 250
Median Attorney Rate in Central Area of State 315
98

UNITED STATES CONSUMER LAW SURVEY REPORT 2015-2016
Median Rates for Practice Areas
25%
Median
Median 95%
Median
Attorneys Handling Bankruptcy Cases 225 250 388
Attorneys Handling Class Action Cases 300 400 500
Attorneys Handling Credit Rights Cases 250 300 500
Attorneys Handling Mortgage Cases 250 275 300
Attorneys Handling Vehicle Cases 200 255 375
Attorneys Handling TCPA Cases 250 300 500
Attorneys Handling Other Cases 250 263 290
99

UNITED STATES CONSUMER LAW SURVEY REPORT 2015-2016
Nebraska
This Survey
Firm Size 1.7
Median Years in Practice 22.5
Concentration of Practice in Consumer Law 75.0
Primary Practice Area Consumer Law
Secondary Practice Area Bankruptcy
Number of Paralegals in Firm .5
Last Time Rate Change Occurred (months) 9.0
Median Paralegal Rate for All Paralegals 90
Average Attorney Rate for All Attorneys 367
25% Median Attorney Rate for All Attorneys 275
Median Attorney Rate for All Attorneys 338
75% Median Attorney Rate for All Attorneys 500
95% Median Attorney Rate for All Attorneys 550
Median Metropolitan Attorney Rate 338
Median Non-Metropolitan Attorney Rate -
Median Attorney Rate in Northern Area of State 450
Median Attorney Rate in Southern Area of State 450
Median Attorney Rate in Eastern Area of State 325
Median Attorney Rate in Western Area of State 450
Median Attorney Rate in Central Area of State 400
100

UNITED STATES CONSUMER LAW SURVEY REPORT 2015-2016
Median Rates for Practice Areas
25%Median
Median 95%Median
Attorneys Handling Bankruptcy Cases 250 275 500
Attorneys Handling Class Action Cases 250 333 450
Attorneys Handling Credit Rights Cases 275 333 500
Attorneys Handling Mortgage Cases 250 275 500
Attorneys Handling Vehicle Cases 275 333 500
Attorneys Handling TCPA Cases 450 500 550
Attorneys Handling Other Cases 275 333 500
101

UNITED STATES CONSUMER LAW SURVEY REPORT 2015-2016
Nevada
This Survey
Firm Size 2.4
Median Years in Practice 30.0
Concentration of Practice in Consumer Law 97.1
Primary Practice Area Consumer Law
Secondary Practice Area Bankruptcy
Number of Paralegals in Firm 1.3
Last Time Rate Change Occurred (months) 22.0
Median Paralegal Rate for All Paralegals 130
Average Attorney Rate for All Attorneys 457
25% Median Attorney Rate for All Attorneys 350
Median Attorney Rate for All Attorneys 450
75% Median Attorney Rate for All Attorneys 600
95% Median Attorney Rate for All Attorneys 700
Median Metropolitan Attorney Rate 450
Median Non-Metropolitan Attorney Rate 450
Median Attorney Rate in Northern Area of State 425
Median Attorney Rate in Southern Area of State 450
Median Attorney Rate in Eastern Area of State 450
Median Attorney Rate in Western Area of State 450
Median Attorney Rate in Central Area of State 450
102

UNITED STATES CONSUMER LAW SURVEY REPORT 2015-2016
Median Rates for Practice Areas
25%Median
Median 95%Median
Attorneys Handling Bankruptcy Cases 310 450 700
Attorneys Handling Class Action Cases 310 450 700
Attorneys Handling Credit Rights Cases 350 450 700
Attorneys Handling Mortgage Cases 310 450 700
Attorneys Handling Vehicle Cases 410 450 700
Attorneys Handling TCPA Cases 450 500 700
Attorneys Handling Other Cases 375 450 700
103

UNITED STATES CONSUMER LAW SURVEY REPORT 2015-2016
New Hampshire
This Survey
Firm Size 1.7
Median Years in Practice 36.3
Concentration of Practice in Consumer Law 61.3
Primary Practice Area Consumer Law
Secondary Practice Area Bankruptcy
Number of Paralegals in Firm 1.6
Last Time Rate Change Occurred (months) 27
Median Paralegal Rate for All Paralegals 105
Average Attorney Rate for All Attorneys 388
25% Median Attorney Rate for All Attorneys 250
Median Attorney Rate for All Attorneys 350
75% Median Attorney Rate for All Attorneys 525
95% Median Attorney Rate for All Attorneys 600
Median Metropolitan Attorney Rate 550
Median Non-Metropolitan Attorney Rate 350
Median Attorney Rate in Northern Area of State 500
Median Attorney Rate in Southern Area of State 250
Median Attorney Rate in Eastern Area of State 425
Median Attorney Rate in Western Area of State 550
Median Attorney Rate in Central Area of State 425
104
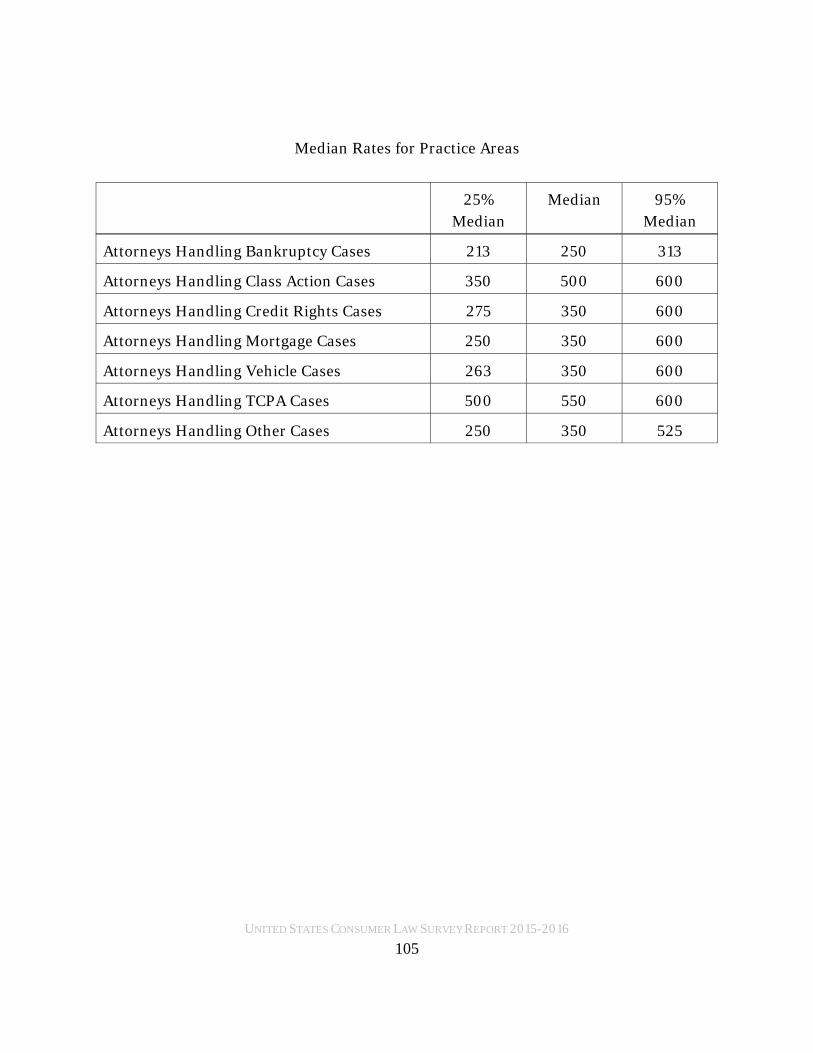
UNITED STATES CONSUMER LAW SURVEY REPORT 2015-2016
Median Rates for Practice Areas
25%
Median
Median 95%
Median
Attorneys Handling Bankruptcy Cases 213 250 313
Attorneys Handling Class Action Cases 350 500 600
Attorneys Handling Credit Rights Cases 275 350 600
Attorneys Handling Mortgage Cases 250 350 600
Attorneys Handling Vehicle Cases 263 350 600
Attorneys Handling TCPA Cases 500 550 600
Attorneys Handling Other Cases 250 350 525
105

UNITED STATES CONSUMER LAW SURVEY REPORT 2015-2016
New Jersey
This Survey
Firm Size 2.9
Median Years in Practice 20.0
Concentration of Practice in Consumer Law 84.9
Primary Practice Area Consumer Law
Secondary Practice Area Bankruptcy Employment Law
Number of Paralegals in Firm 1.9
Last Time Rate Change Occurred (months) 10.8
Median Paralegal Rate for All Paralegals 150
Average Attorney Rate for All Attorneys 497
25% Median Attorney Rate for All Attorneys 325
Median Attorney Rate for All Attorneys 450
75% Median Attorney Rate for All Attorneys 675
95% Median Attorney Rate for All Attorneys 725
Median Metropolitan Attorney Rate 463
Median Non-Metropolitan Attorney Rate 425
Median Attorney Rate in Northern Area of State 425
Median Attorney Rate in Southern Area of State 650
Median Attorney Rate in Eastern Area of State 450
Median Attorney Rate in Western Area of State 713
Median Attorney Rate in Central Area of State 675
106

UNITED STATES CONSUMER LAW SURVEY REPORT 2015-2016
Median Rates for Practice Areas
25%Median
Median 95%Median
Attorneys Handling Bankruptcy Cases 320 350 550
Attorneys Handling Class Action Cases 438 650 725
Attorneys Handling Credit Rights Cases 310 375 700
Attorneys Handling Mortgage Cases 400 675 725
Attorneys Handling Vehicle Cases 350 375 700
Attorneys Handling TCPA Cases 300 425 700
Attorneys Handling Other Cases 300 625 700
107

UNITED STATES CONSUMER LAW SURVEY REPORT 2015-2016
New Mexico
This Survey
Firm Size 2.0
Median Years in Practice 35.0
Concentration of Practice in Consumer Law 86.0
Primary Practice Area Consumer Law
Secondary Practice Area Bankruptcy
Number of Paralegals in Firm 1.0
Last Time Rate Change Occurred (months) 31.2
Median Paralegal Rate for All Paralegals 90
Average Attorney Rate for All Attorneys 310
25% Median Attorney Rate for All Attorneys 250
Median Attorney Rate for All Attorneys 325
75% Median Attorney Rate for All Attorneys 365
95% Median Attorney Rate for All Attorneys 400
Median Metropolitan Attorney Rate 325
Median Non-Metropolitan Attorney Rate 400
Median Attorney Rate in Northern Area of State 288
Median Attorney Rate in Southern Area of State 325
Median Attorney Rate in Eastern Area of State 325
Median Attorney Rate in Western Area of State 325
Median Attorney Rate in Central Area of State 250
108

UNITED STATES CONSUMER LAW SURVEY REPORT 2015-2016
Median Rates for Practice Areas
25%
Median
Median 95%
Median
Attorneys Handling Bankruptcy Cases 190 250 313
Attorneys Handling Class Action Cases 250 325 350
Attorneys Handling Credit Rights Cases 250 325 400
Attorneys Handling Mortgage Cases 220 250 283
Attorneys Handling Vehicle Cases 250 325 400
Attorneys Handling TCPA Cases 238 250 283
Attorneys Handling Other Cases 238 250 283
109

UNITED STATES CONSUMER LAW SURVEY REPORT 2015-2016
New York
This Survey
Firm Size 2.7
Median Years in Practice 20.0
Concentration of Practice in Consumer Law 72.3
Primary Practice Area Consumer Law
Secondary Practice Area Bankruptcy
Number of Paralegals in Firm 1.8
Last Time Rate Change Occurred (months) 16.2
Median Paralegal Rate for All Paralegals 75
Average Attorney Rate for All Attorneys 450
25% Median Attorney Rate for All Attorneys 300
Median Attorney Rate for All Attorneys 425
75% Median Attorney Rate for All Attorneys 600
95% Median Attorney Rate for All Attorneys 725
Median Metropolitan Attorney Rate 463
Median Non-Metropolitan Attorney Rate 350
Median Attorney Rate in Northern Area of State 500
Median Attorney Rate in Southern Area of State 500
Median Attorney Rate in Eastern Area of State 425
Median Attorney Rate in Western Area of State 475
Median Attorney Rate in Central Area of State 688
110

UNITED STATES CONSUMER LAW SURVEY REPORT 2015-2016
Median Rates for Practice Areas
25%Median
Median 95%Median
Attorneys Handling Bankruptcy Cases 288 350 550
Attorneys Handling Class Action Cases 400 513 725
Attorneys Handling Credit Rights Cases 300 400 725
Attorneys Handling Mortgage Cases 350 450 725
Attorneys Handling Vehicle Cases 350 400 700
Attorneys Handling TCPA Cases 325 413 700
Attorneys Handling Other Cases 500 575 725
Experience Variable Table
Years Practicing Consumer Law Average Attorney Hourly Rate
<1 225
1-3 300
3-5 233
6-10 350
11-15 373
16-20 488
21-25 575
26-30 725
31-35 490
36-40 629
41+ 458
111

UNITED STATES CONSUMER LAW SURVEY REPORT 2015-2016
Specialty Variable Table
Percentage of Consumer Law Practice Average Attorney Hourly Rate
100 407
90 529
80 467
70 454
60 725
50 543
Small Firm Size Variable Table
Years in Practice Average Attorney Hourly Rate
<1 250
1-3 300
3-5 250
6-10 355
11-15 335
16-20 488
21-25 550
26-30 500
31-35 490
36-40 638
41+ 458
112

UNITED STATES CONSUMER LAW SURVEY REPORT 2015-2016
Large Firm Size Variable Table
Years in Practice Average Attorney Hourly Rate
<1 175
1-3 200
3-5 200
6-10 325
11-15 450
16-20 500
21-25 625
26-30 725
31-35 650
36-40 625
41+ -
113

UNITED STATES CONSUMER LAW SURVEY REPORT 2015-2016
North Carolina
This Survey
Firm Size 2.1
Median Years in Practice 15.0
Concentration of Practice in Consumer Law 41.5
Primary Practice Area Bankruptcy
Secondary Practice Area Consumer Law
Number of Paralegals in Firm 1.9
Last Time Rate Change Occurred (months) 20.6
Median Paralegal Rate for All Paralegals 88
Average Attorney Rate for All Attorneys 295
25% Median Attorney Rate for All Attorneys 250
Median Attorney Rate for All Attorneys 275
75% Median Attorney Rate for All Attorneys 325
95% Median Attorney Rate for All Attorneys 500
Median Metropolitan Attorney Rate 300
Median Non-Metropolitan Attorney Rate 250
Median Attorney Rate in Northern Area of State 225
Median Attorney Rate in Southern Area of State 300
Median Attorney Rate in Eastern Area of State 300
Median Attorney Rate in Western Area of State 250
Median Attorney Rate in Central Area of State 250
114

UNITED STATES CONSUMER LAW SURVEY REPORT 2015-2016
Median Rates for Practice Areas
25%Median
Median 95%Median
Attorneys Handling Bankruptcy Cases 250 250 525
Attorneys Handling Class Action Cases 300 325 675
Attorneys Handling Credit Rights Cases 250 300 675
Attorneys Handling Mortgage Cases 250 300 675
Attorneys Handling Vehicle Cases 250 300 350
Attorneys Handling TCPA Cases 250 325 375
Attorneys Handling Other Cases 250 275 350
115

UNITED STATES CONSUMER LAW SURVEY REPORT 2015-2016
North Dakota
This Survey
Firm Size 2.0
Median Years in Practice 12.0
Concentration of Practice in Consumer Law 70.0
Primary Practice Area Consumer Law
Secondary Practice Area Bankruptcy
Number of Paralegals in Firm .3
Last Time Rate Change Occurred (months) 8.0
Median Paralegal Rate for All Paralegals 80
Average Attorney Rate for All Attorneys 383
25% Median Attorney Rate for All Attorneys 200
Median Attorney Rate for All Attorneys 390
75% Median Attorney Rate for All Attorneys 450
95% Median Attorney Rate for All Attorneys 500
Median Metropolitan Attorney Rate 375
Median Non-Metropolitan Attorney Rate 200
Median Attorney Rate in Northern Area of State 375
Median Attorney Rate in Southern Area of State 375
Median Attorney Rate in Eastern Area of State 375
Median Attorney Rate in Western Area of State 375
Median Attorney Rate in Central Area of State 475
116

UNITED STATES CONSUMER LAW SURVEY REPORT 2015-2016
Median Rates for Practice Areas
25%
Median
Median 95%
Median
Attorneys Handling Bankruptcy Cases 175 200 283
Attorneys Handling Class Action Cases 200 450 500
Attorneys Handling Credit Rights Cases 200 450 500
Attorneys Handling Mortgage Cases 200 450 500
Attorneys Handling Vehicle Cases 200 450 500
Attorneys Handling TCPA Cases 450 475 500
Attorneys Handling Other Cases 200 450 500
117

UNITED STATES CONSUMER LAW SURVEY REPORT 2015-2016
Ohio
This Survey
Firm Size 2.6
Median Years in Practice 22.0
Concentration of Practice in Consumer Law 84.4
Primary Practice Area Consumer Law
Secondary Practice Area Bankruptcy
Number of Paralegals in Firm 2.5
Last Time Rate Change Occurred (months) 18.4
Median Paralegal Rate for All Paralegals 125
Average Attorney Rate for All Attorneys 353
25% Median Attorney Rate for All Attorneys 300
Median Attorney Rate for All Attorneys 370
75% Median Attorney Rate for All Attorneys 500
95% Median Attorney Rate for All Attorneys 625
Median Metropolitan Attorney Rate 400
Median Non-Metropolitan Attorney Rate 263
Median Attorney Rate in Northern Area of State 400
Median Attorney Rate in Southern Area of State 300
Median Attorney Rate in Eastern Area of State 300
Median Attorney Rate in Western Area of State 350
Median Attorney Rate in Central Area of State 325
118
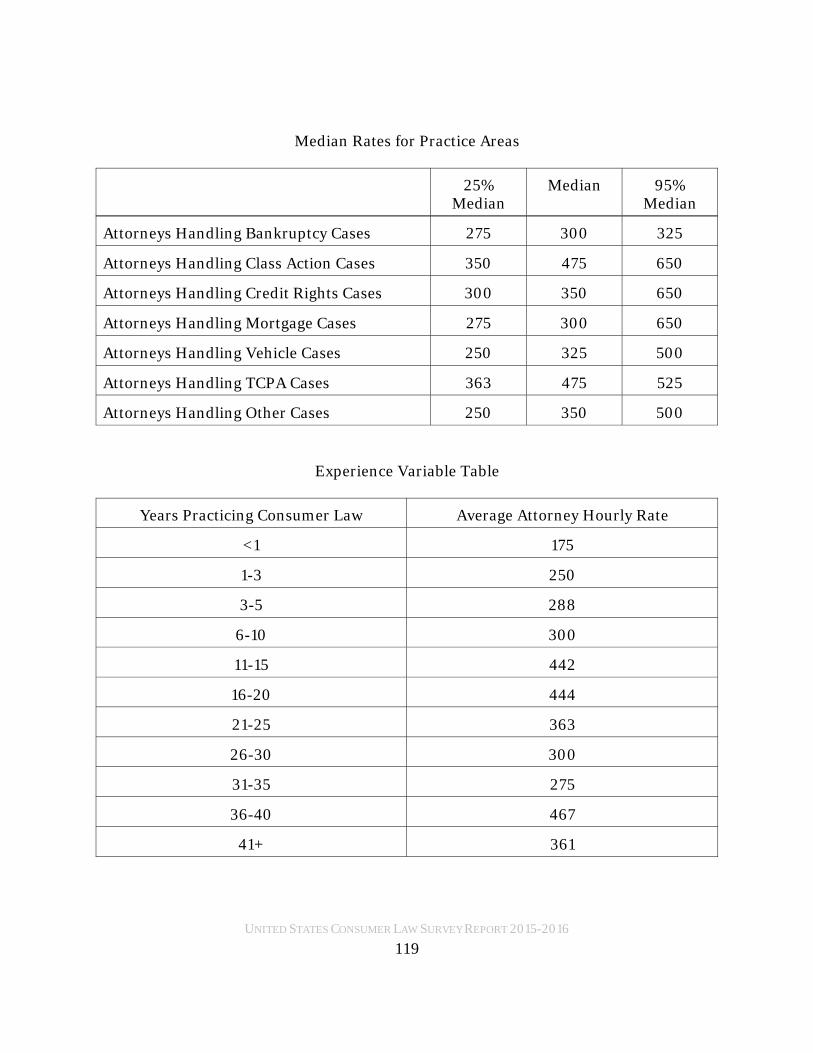
UNITED STATES CONSUMER LAW SURVEY REPORT 2015-2016
Median Rates for Practice Areas
25%Median
Median 95%Median
Attorneys Handling Bankruptcy Cases 275 300 325
Attorneys Handling Class Action Cases 350 475 650
Attorneys Handling Credit Rights Cases 300 350 650
Attorneys Handling Mortgage Cases 275 300 650
Attorneys Handling Vehicle Cases 250 325 500
Attorneys Handling TCPA Cases 363 475 525
Attorneys Handling Other Cases 250 350 500
Experience Variable Table
Years Practicing Consumer Law Average Attorney Hourly Rate
<1 175
1-3 250
3-5 288
6-10 300
11-15 442
16-20 444
21-25 363
26-30 300
31-35 275
36-40 467
41+ 361
119

UNITED STATES CONSUMER LAW SURVEY REPORT 2015-2016
Specialty Variable Table
Percentage of Consumer Law Practice Average Attorney Hourly Rate
100 368
90 410
80 500
70 500
60 325
50 350
Small Firm Size Variable Table
Years in Practice Average Attorney Hourly Rate
<1 175
1-3 250
3-5 250
6-10 250
11-15 350
16-20 417
21-25 306
26-30 300
31-35 275
36-40 460
41+ 375
120

UNITED STATES CONSUMER LAW SURVEY REPORT 2015-2016
Large Firm Size Variable Table
Years in Practice Average Attorney Hourly Rate
<1 250
1-3 275
3-5 375
6-10 325
11-15 488
16-20 525
21-25 475
26-30 525
31-35 525
36-40 500
41+ 275
121

UNITED STATES CONSUMER LAW SURVEY REPORT 2015-2016
Oklahoma
This Survey
Firm Size 1.8
Median Years in Practice 15.6
Concentration of Practice in Consumer Law 65.5
Primary Practice Area Consumer Law
Secondary Practice Area Bankruptcy
Number of Paralegals in Firm 1.8
Last Time Rate Change Occurred (months) 18.0
Median Paralegal Rate for All Paralegals 90
Average Attorney Rate for All Attorneys 271
25% Median Attorney Rate for All Attorneys 225
Median Attorney Rate for All Attorneys 300
75% Median Attorney Rate for All Attorneys 350
95% Median Attorney Rate for All Attorneys 500
Median Metropolitan Attorney Rate 325
Median Non-Metropolitan Attorney Rate 250
Median Attorney Rate in Northern Area of State 300
Median Attorney Rate in Southern Area of State 300
Median Attorney Rate in Eastern Area of State 300
Median Attorney Rate in Western Area of State 250
Median Attorney Rate in Central Area of State 250
122

UNITED STATES CONSUMER LAW SURVEY REPORT 2015-2016
Median Rates for Practice Areas
25%Median
Median 95%Median
Attorneys Handling Bankruptcy Cases 175 250 300
Attorneys Handling Class Action Cases 275 300 438
Attorneys Handling Credit Rights Cases 275 300 500
Attorneys Handling Mortgage Cases 175 300 500
Attorneys Handling Vehicle Cases 300 400 500
Attorneys Handling TCPA Cases 275 300 500
Attorneys Handling Other Cases 225 300 350
123

UNITED STATES CONSUMER LAW SURVEY REPORT 2015-2016
Oregon
This Survey
Firm Size 2.8
Median Years in Practice 14.0
Concentration of Practice in Consumer Law 97.4
Primary Practice Area Consumer Law
Secondary Practice Area Bankruptcy
Number of Paralegals in Firm 1.2
Last Time Rate Change Occurred (months) 17.6
Median Paralegal Rate for All Paralegals 150
Average Attorney Rate for All Attorneys 443
25% Median Attorney Rate for All Attorneys 300
Median Attorney Rate for All Attorneys 388
75% Median Attorney Rate for All Attorneys 550
95% Median Attorney Rate for All Attorneys 725
Median Metropolitan Attorney Rate 400
Median Non-Metropolitan Attorney Rate 350
Median Attorney Rate in Northern Area of State 400
Median Attorney Rate in Southern Area of State 375
Median Attorney Rate in Eastern Area of State 375
Median Attorney Rate in Western Area of State 375
Median Attorney Rate in Central Area of State 525
124

UNITED STATES CONSUMER LAW SURVEY REPORT 2015-2016
Median Rates for Practice Areas
25%Median
Median 95%Median
Attorneys Handling Bankruptcy Cases 250 325 375
Attorneys Handling Class Action Cases 375 400 725
Attorneys Handling Credit Rights Cases 275 375 675
Attorneys Handling Mortgage Cases 250 400 675
Attorneys Handling Vehicle Cases 275 300 400
Attorneys Handling TCPA Cases 350 375 400
Attorneys Handling Other Cases 300 400 725
125

UNITED STATES CONSUMER LAW SURVEY REPORT 2015-2016
Pennsylvania
This Survey
Firm Size 2.6
Median Years in Practice 19.0
Concentration of Practice in Consumer Law 88.5
Primary Practice Area Consumer Law
Secondary Practice Area Bankruptcy
Number of Paralegals in Firm 2.1
Last Time Rate Change Occurred (months) 16.9
Median Paralegal Rate for All Paralegals 125
Average Attorney Rate for All Attorneys 415
25% Median Attorney Rate for All Attorneys 300
Median Attorney Rate for All Attorneys 375
75% Median Attorney Rate for All Attorneys 525
95% Median Attorney Rate for All Attorneys 725
Median Metropolitan Attorney Rate 388
Median Non-Metropolitan Attorney Rate 200
Median Attorney Rate in Northern Area of State 388
Median Attorney Rate in Southern Area of State 450
Median Attorney Rate in Eastern Area of State 375
Median Attorney Rate in Western Area of State 425
Median Attorney Rate in Central Area of State 450
126

UNITED STATES CONSUMER LAW SURVEY REPORT 2015-2016
Median Rates for Practice Areas
25%Median
Median 95%Median
Attorneys Handling Bankruptcy Cases 225 300 400
Attorneys Handling Class Action Cases 375 475 725
Attorneys Handling Credit Rights Cases 325 375 700
Attorneys Handling Mortgage Cases 300 388 725
Attorneys Handling Vehicle Cases 300 400 700
Attorneys Handling TCPA Cases 275 388 700
Attorneys Handling Other Cases 400 475 600
Experience Variable Table
Years Practicing Consumer Law Average Attorney Hourly Rate
<1 200
1-3 200
3-5 300
6-10 364
11-15 414
16-20 435
21-25 450
26-30 458
31-35 556
36-40 345
41+ 425
127

UNITED STATES CONSUMER LAW SURVEY REPORT 2015-2016
Specialty Variable Table
Percentage of Consumer Law Practice Average Attorney Hourly Rate
100 408
90 478
80 525
70 478
60 488
50 338
Small Firm Size Variable Table
Years in Practice Average Attorney Hourly Rate
<1 200
1-3 200
3-5 275
6-10 300
11-15 355
16-20 394
21-25 450
26-30 325
31-35 556
36-40 257
41+ 425
128

UNITED STATES CONSUMER LAW SURVEY REPORT 2015-2016
Large Firm Size Variable Table
Years in Practice Average Attorney Hourly Rate
<1 225
1-3 250
3-5 350
6-10 525
11-15 488
16-20 600
21-25 625
26-30 725
31-35 700
36-40 700
41+ 550
129

UNITED STATES CONSUMER LAW SURVEY REPORT 2015-2016
Puerto Rico
This Survey
Firm Size 1.7
Median Years in Practice 24.5
Concentration of Practice in Consumer Law 46.7
Primary Practice Area Bankruptcy
Secondary Practice Area Consumer Law
Number of Paralegals in Firm 1.1
Last Time Rate Change Occurred (months) 27.5
Median Paralegal Rate for All Paralegals 75
Average Attorney Rate for All Attorneys 223
25% Median Attorney Rate for All Attorneys 150
Median Attorney Rate for All Attorneys 200
75% Median Attorney Rate for All Attorneys 225
95% Median Attorney Rate for All Attorneys 275
Median Metropolitan Attorney Rate 225
Median Non-Metropolitan Attorney Rate 163
Median Attorney Rate in Northern Area of State 213
Median Attorney Rate in Southern Area of State 200
Median Attorney Rate in Eastern Area of State 225
Median Attorney Rate in Western Area of State 200
Median Attorney Rate in Central Area of State 213
130

UNITED STATES CONSUMER LAW SURVEY REPORT 2015-2016
Median Rates for Practice Areas
25%
Median
Median 95%
Median
Attorneys Handling Bankruptcy Cases 175 200 275
Attorneys Handling Class Action Cases 200 250 325
Attorneys Handling Credit Rights Cases 200 213 225
Attorneys Handling Mortgage Cases 200 225 275
Attorneys Handling Vehicle Cases 200 225 225
Attorneys Handling TCPA Cases 200 225 275
Attorneys Handling Other Cases 200 213 225
131

UNITED STATES CONSUMER LAW SURVEY REPORT 2015-2016
Rhode Island
This Survey
Firm Size 1.8
Median Years in Practice 42.5
Concentration of Practice in Consumer Law 53.3
Primary Practice Area Consumer Law
Secondary Practice Area Other
Number of Paralegals in Firm 2.3
Last Time Rate Change Occurred (months) 25.0
Median Paralegal Rate for All Paralegals 138
Average Attorney Rate for All Attorneys 500
25% Median Attorney Rate for All Attorneys 350
Median Attorney Rate for All Attorneys 500
75% Median Attorney Rate for All Attorneys 600
95% Median Attorney Rate for All Attorneys 700
Median Metropolitan Attorney Rate 425
Median Non-Metropolitan Attorney Rate 425
Median Attorney Rate in Northern Area of State 500
Median Attorney Rate in Southern Area of State 550
Median Attorney Rate in Eastern Area of State 500
Median Attorney Rate in Western Area of State 550
Median Attorney Rate in Central Area of State 550
132

UNITED STATES CONSUMER LAW SURVEY REPORT 2015-2016
Median Rates for Practice Areas
25%
Median
Median 95%
Median
Attorneys Handling Bankruptcy Cases 225 350 400
Attorneys Handling Class Action Cases 350 550 700
Attorneys Handling Credit Rights Cases 500 600 700
Attorneys Handling Mortgage Cases 350 525 700
Attorneys Handling Vehicle Cases 350 700 725
Attorneys Handling TCPA Cases 500 600 700
Attorneys Handling Other Cases 500 600 700
133
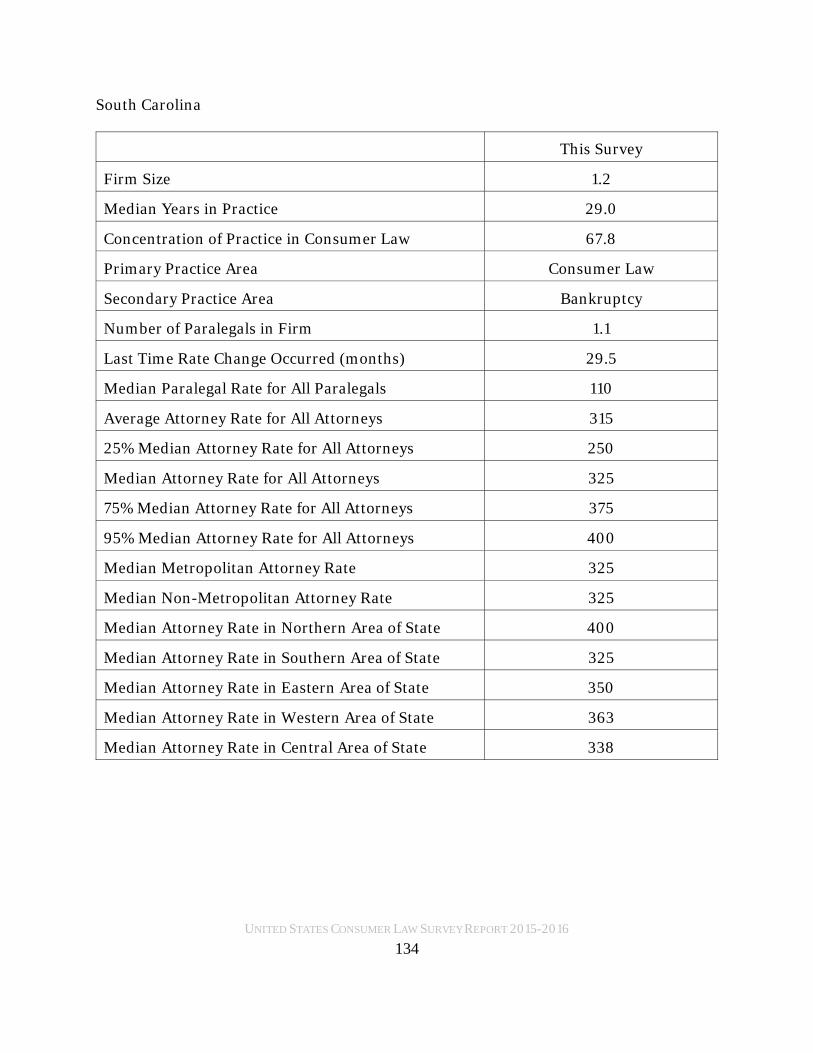
UNITED STATES CONSUMER LAW SURVEY REPORT 2015-2016
South Carolina
This Survey
Firm Size 1.2
Median Years in Practice 29.0
Concentration of Practice in Consumer Law 67.8
Primary Practice Area Consumer Law
Secondary Practice Area Bankruptcy
Number of Paralegals in Firm 1.1
Last Time Rate Change Occurred (months) 29.5
Median Paralegal Rate for All Paralegals 110
Average Attorney Rate for All Attorneys 315
25% Median Attorney Rate for All Attorneys 250
Median Attorney Rate for All Attorneys 325
75% Median Attorney Rate for All Attorneys 375
95% Median Attorney Rate for All Attorneys 400
Median Metropolitan Attorney Rate 325
Median Non-Metropolitan Attorney Rate 325
Median Attorney Rate in Northern Area of State 400
Median Attorney Rate in Southern Area of State 325
Median Attorney Rate in Eastern Area of State 350
Median Attorney Rate in Western Area of State 363
Median Attorney Rate in Central Area of State 338
134
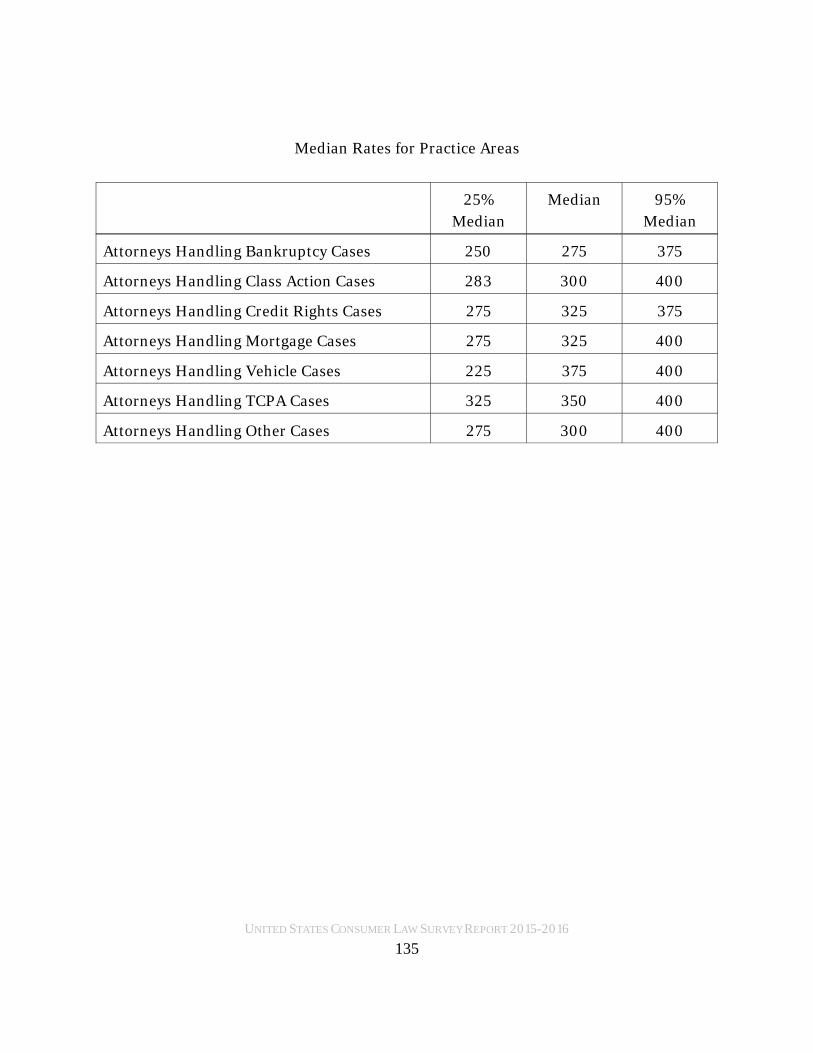
UNITED STATES CONSUMER LAW SURVEY REPORT 2015-2016
Median Rates for Practice Areas
25%
Median
Median 95%
Median
Attorneys Handling Bankruptcy Cases 250 275 375
Attorneys Handling Class Action Cases 283 300 400
Attorneys Handling Credit Rights Cases 275 325 375
Attorneys Handling Mortgage Cases 275 325 400
Attorneys Handling Vehicle Cases 225 375 400
Attorneys Handling TCPA Cases 325 350 400
Attorneys Handling Other Cases 275 300 400
135

UNITED STATES CONSUMER LAW SURVEY REPORT 2015-2016
South Dakota
This Survey
Firm Size 1.0
Median Years in Practice 42.0
Concentration of Practice in Consumer Law 56.7
Primary Practice Area Consumer Law
Secondary Practice Area Criminal Law
Number of Paralegals in Firm .7
Last Time Rate Change Occurred (months) 30.0
Median Paralegal Rate for All Paralegals 93
Average Attorney Rate for All Attorneys 333
25% Median Attorney Rate for All Attorneys 250
Median Attorney Rate for All Attorneys 300
75% Median Attorney Rate for All Attorneys 400
95% Median Attorney Rate for All Attorneys 500
Median Metropolitan Attorney Rate 500
Median Non-Metropolitan Attorney Rate 300
Median Attorney Rate in Northern Area of State 500
Median Attorney Rate in Southern Area of State 500
Median Attorney Rate in Eastern Area of State 350
Median Attorney Rate in Western Area of State 400
Median Attorney Rate in Central Area of State 500
136
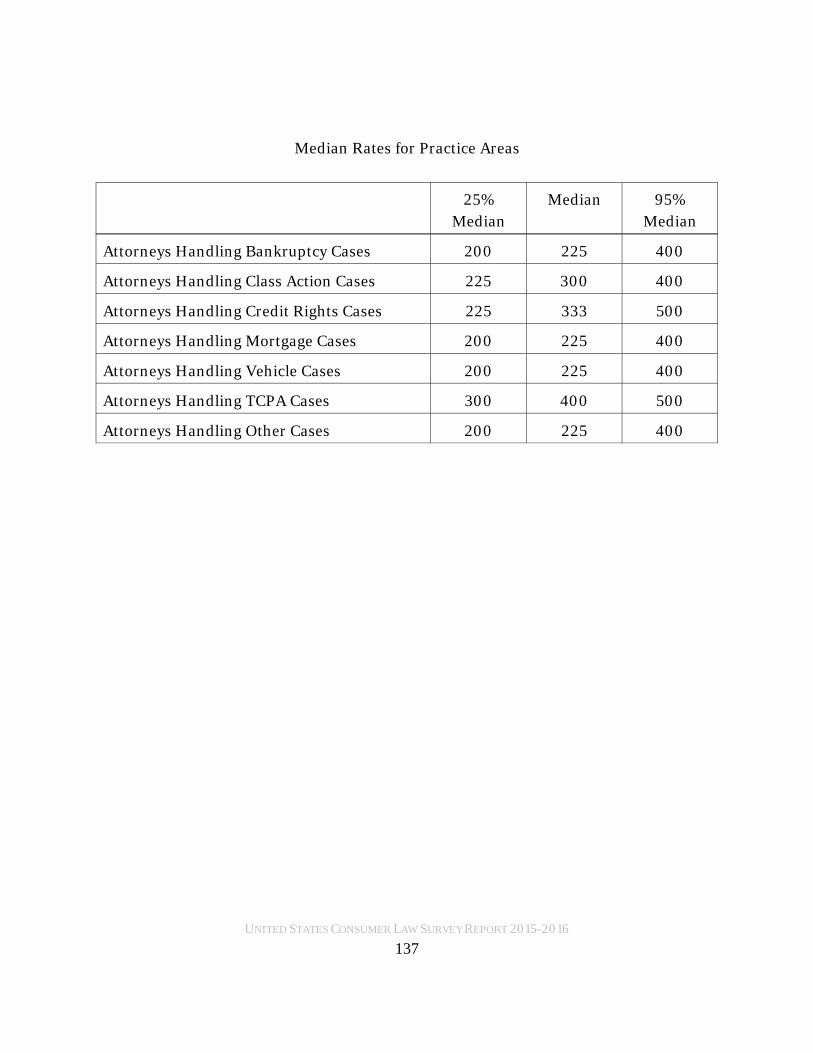
UNITED STATES CONSUMER LAW SURVEY REPORT 2015-2016
Median Rates for Practice Areas
25%
Median
Median 95%
Median
Attorneys Handling Bankruptcy Cases 200 225 400
Attorneys Handling Class Action Cases 225 300 400
Attorneys Handling Credit Rights Cases 225 333 500
Attorneys Handling Mortgage Cases 200 225 400
Attorneys Handling Vehicle Cases 200 225 400
Attorneys Handling TCPA Cases 300 400 500
Attorneys Handling Other Cases 200 225 400
137

UNITED STATES CONSUMER LAW SURVEY REPORT 2015-2016
Tennessee
This Survey
Firm Size 1.7
Median Years in Practice 21.0
Concentration of Practice in Consumer Law 65.4
Primary Practice Area Consumer Law
Secondary Practice Area Bankruptcy
Number of Paralegals in Firm 1.3
Last Time Rate Change Occurred (months) 23.1
Median Paralegal Rate for All Paralegals 105
Average Attorney Rate for All Attorneys 366
25% Median Attorney Rate for All Attorneys 250
Median Attorney Rate for All Attorneys 300
75% Median Attorney Rate for All Attorneys 400
95% Median Attorney Rate for All Attorneys 675
Median Metropolitan Attorney Rate 288
Median Non-Metropolitan Attorney Rate 300
Median Attorney Rate in Northern Area of State 275
Median Attorney Rate in Southern Area of State 300
Median Attorney Rate in Eastern Area of State 300
Median Attorney Rate in Western Area of State 250
Median Attorney Rate in Central Area of State 475
138

UNITED STATES CONSUMER LAW SURVEY REPORT 2015-2016
Median Rates for Practice Areas
25%
Median
Median 95%
Median
Attorneys Handling Bankruptcy Cases 250 250 300
Attorneys Handling Class Action Cases 300 475 650
Attorneys Handling Credit Rights Cases 250 288 575
Attorneys Handling Mortgage Cases 250 600 675
Attorneys Handling Vehicle Cases 300 388 475
Attorneys Handling TCPA Cases 275 300 575
Attorneys Handling Other Cases 300 475 650
139

UNITED STATES CONSUMER LAW SURVEY REPORT 2015-2016
Texas
This Survey
Firm Size 2.6
Median Years in Practice 14.5
Concentration of Practice in Consumer Law 88.2
Primary Practice Area Consumer Law
Secondary Practice Area Bankruptcy
Number of Paralegals in Firm 1.9
Last Time Rate Change Occurred (months) 17.0
Median Paralegal Rate for All Paralegals 125
Average Attorney Rate for All Attorneys 385
25% Median Attorney Rate for All Attorneys 300
Median Attorney Rate for All Attorneys 350
75% Median Attorney Rate for All Attorneys 450
95% Median Attorney Rate for All Attorneys 725
Median Metropolitan Attorney Rate 350
Median Non-Metropolitan Attorney Rate 250
Median Attorney Rate in Northern Area of State 400
Median Attorney Rate in Southern Area of State 350
Median Attorney Rate in Eastern Area of State 375
Median Attorney Rate in Western Area of State 375
Median Attorney Rate in Central Area of State 375
140

UNITED STATES CONSUMER LAW SURVEY REPORT 2015-2016
Median Rates for Practice Areas
25%Median
Median 95%Median
Attorneys Handling Bankruptcy Cases 250 350 400
Attorneys Handling Class Action Cases 375 400 700
Attorneys Handling Credit Rights Cases 300 375 675
Attorneys Handling Mortgage Cases 275 350 675
Attorneys Handling Vehicle Cases 250 375 550
Attorneys Handling TCPA Cases 325 400 700
Attorneys Handling Other Cases 325 350 725
Experience Variable Table
Years Practicing Consumer Law Average Attorney Hourly Rate
<1 150
1-3 150
3-5 292
6-10 292
11-15 439
16-20 350
21-25 410
26-30 275
31-35 438
36-40 522
41+ 475
141

UNITED STATES CONSUMER LAW SURVEY REPORT 2015-2016
Specialty Variable Table
Percentage of Consumer Law Practice Average Attorney Hourly Rate
100 446
90 394
80 325
70 333
60 275
50 -
Small Firm Size Variable Table
Years in Practice Average Attorney Hourly Rate
<1 150
1-3 150
3-5 350
6-10 300
11-15 390
16-20 350
21-25 410
26-30 300
31-35 475
36-40 258
41+ 475
142
UNITED STATES CONSUMER LAW SURVEY REPORT 2015-2016
Large Firm Size Variable Table
Years in Practice Average Attorney Hourly Rate
<1 175
1-3 250
3-5 263
6-10 200
11-15 563
16-20 575
21-25 575
26-30 463
31-35 400
36-40 719
41+ 700
143

UNITED STATES CONSUMER LAW SURVEY REPORT 2015-2016
Utah
This Survey
Firm Size 2.7
Median Years in Practice 23.5
Concentration of Practice in Consumer Law 77.5
Primary Practice Area Consumer Law
Secondary Practice Area Bankruptcy
Number of Paralegals in Firm 1.3
Last Time Rate Change Occurred (months) 36.0
Median Paralegal Rate for All Paralegals 90
Average Attorney Rate for All Attorneys 294
25% Median Attorney Rate for All Attorneys 275
Median Attorney Rate for All Attorneys 288
75% Median Attorney Rate for All Attorneys 300
95% Median Attorney Rate for All Attorneys 325
Median Metropolitan Attorney Rate 275
Median Non-Metropolitan Attorney Rate 325
Median Attorney Rate in Northern Area of State 288
Median Attorney Rate in Southern Area of State -
Median Attorney Rate in Eastern Area of State -
Median Attorney Rate in Western Area of State 300
Median Attorney Rate in Central Area of State 300
144

UNITED STATES CONSUMER LAW SURVEY REPORT 2015-2016
Median Rates for Practice Areas
25%
Median
Median 95%
Median
Attorneys Handling Bankruptcy Cases 250 275 363
Attorneys Handling Class Action Cases 275 288 300
Attorneys Handling Credit Rights Cases 275 288 325
Attorneys Handling Mortgage Cases 275 300 350
Attorneys Handling Vehicle Cases 250 275 363
Attorneys Handling TCPA Cases 275 300 325
Attorneys Handling Other Cases 275 325 350
145
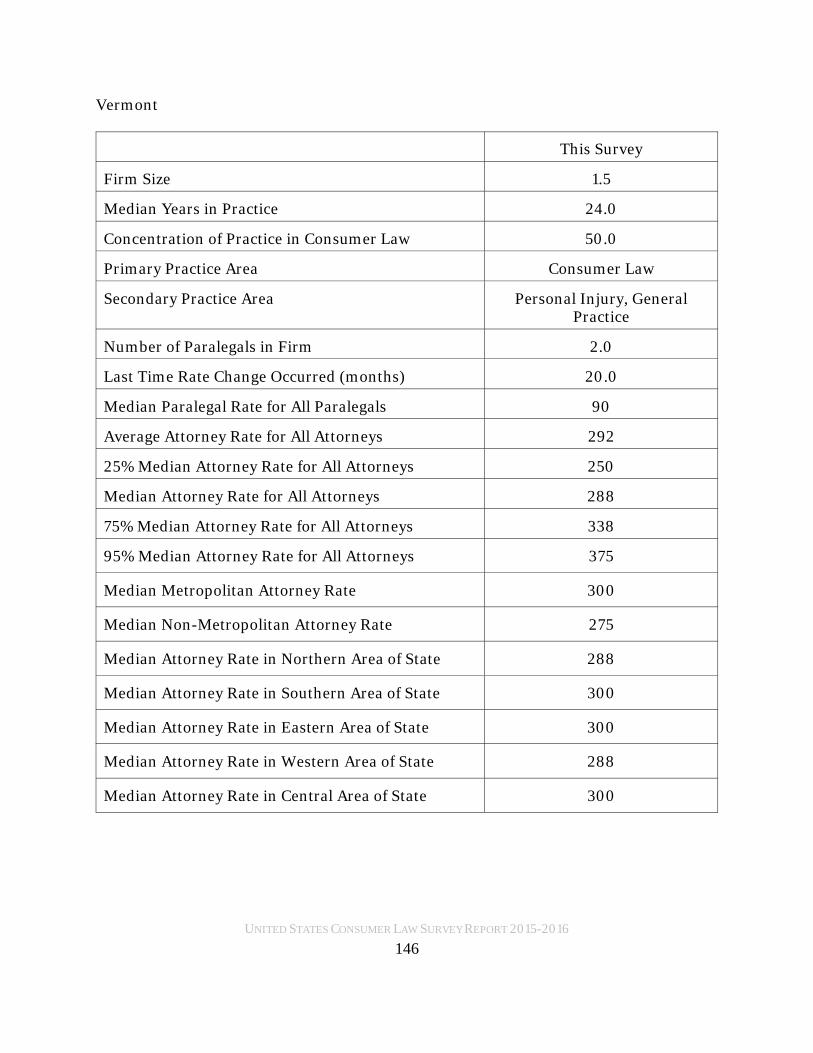
UNITED STATES CONSUMER LAW SURVEY REPORT 2015-2016
Vermont
This Survey
Firm Size 1.5
Median Years in Practice 24.0
Concentration of Practice in Consumer Law 50.0
Primary Practice Area Consumer Law
Secondary Practice Area Personal Injury, GeneralPractice
Number of Paralegals in Firm 2.0
Last Time Rate Change Occurred (months) 20.0
Median Paralegal Rate for All Paralegals 90
Average Attorney Rate for All Attorneys 292
25% Median Attorney Rate for All Attorneys 250
Median Attorney Rate for All Attorneys 288
75% Median Attorney Rate for All Attorneys 338
95% Median Attorney Rate for All Attorneys 375
Median Metropolitan Attorney Rate 300
Median Non-Metropolitan Attorney Rate 275
Median Attorney Rate in Northern Area of State 288
Median Attorney Rate in Southern Area of State 300
Median Attorney Rate in Eastern Area of State 300
Median Attorney Rate in Western Area of State 288
Median Attorney Rate in Central Area of State 300
146

UNITED STATES CONSUMER LAW SURVEY REPORT 2015-2016
Median Rates for Practice Areas
25%
Median
Median 95%
Median
Attorneys Handling Bankruptcy Cases 200 275 300
Attorneys Handling Class Action Cases 200 275 300
Attorneys Handling Credit Rights Cases 200 275 300
Attorneys Handling Mortgage Cases 225 288 375
Attorneys Handling Vehicle Cases 250 275 300
Attorneys Handling TCPA Cases 200 250 275
Attorneys Handling Other Cases 213 275 300
147

UNITED STATES CONSUMER LAW SURVEY REPORT 2015-2016
Virgin Islands U.S.
This Survey
Firm Size 1.0
Median Years in Practice 24.5
Concentration of Practice in Consumer Law 38.5
Primary Practice Area Consumer Law
Secondary Practice Area Bankruptcy
Number of Paralegals in Firm .5
Last Time Rate Change Occurred (months) 15.0
Median Paralegal Rate for All Paralegals 0
Average Attorney Rate for All Attorneys 350
25% Median Attorney Rate for All Attorneys 325
Median Attorney Rate for All Attorneys 350
75% Median Attorney Rate for All Attorneys 562
95% Median Attorney Rate for All Attorneys 640
Median Metropolitan Attorney Rate 350
Median Non-Metropolitan Attorney Rate 350
Median Attorney Rate in Northern Area of State 350
Median Attorney Rate in Southern Area of State 350
Median Attorney Rate in Eastern Area of State 350
Median Attorney Rate in Western Area of State 350
Median Attorney Rate in Central Area of State 350
148
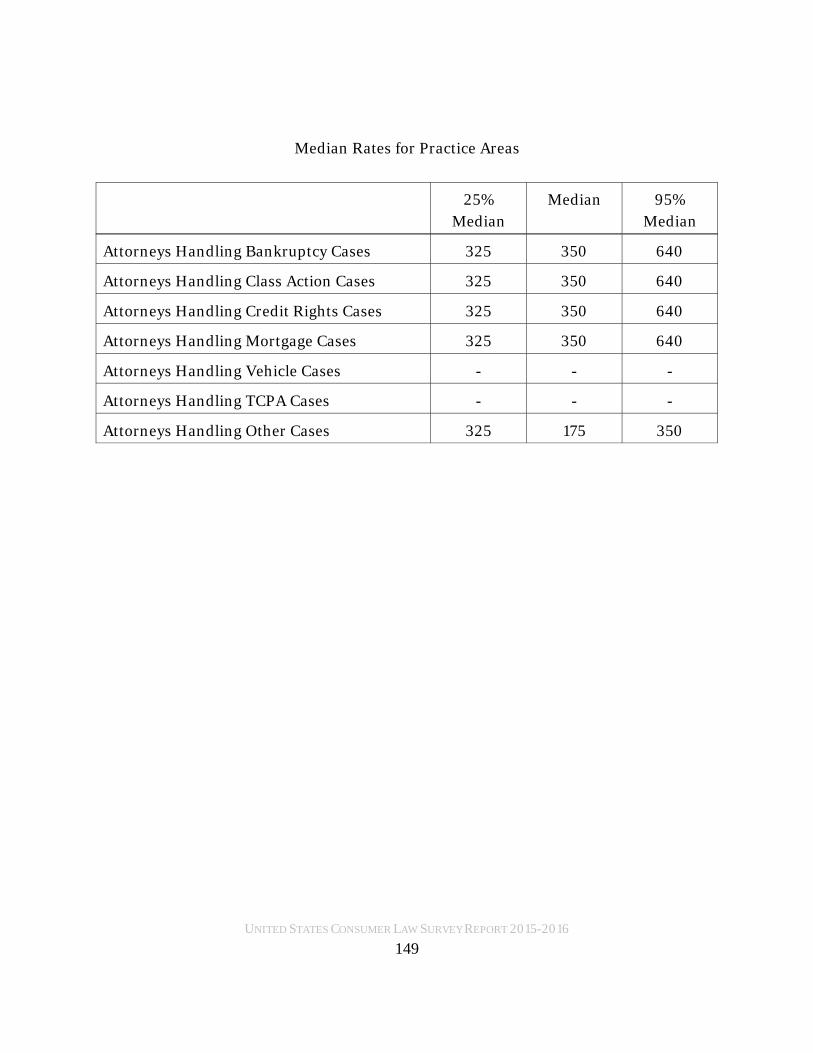
UNITED STATES CONSUMER LAW SURVEY REPORT 2015-2016
Median Rates for Practice Areas
25%
Median
Median 95%
Median
Attorneys Handling Bankruptcy Cases 325 350 640
Attorneys Handling Class Action Cases 325 350 640
Attorneys Handling Credit Rights Cases 325 350 640
Attorneys Handling Mortgage Cases 325 350 640
Attorneys Handling Vehicle Cases - - -
Attorneys Handling TCPA Cases - - -
Attorneys Handling Other Cases 325 175 350
149
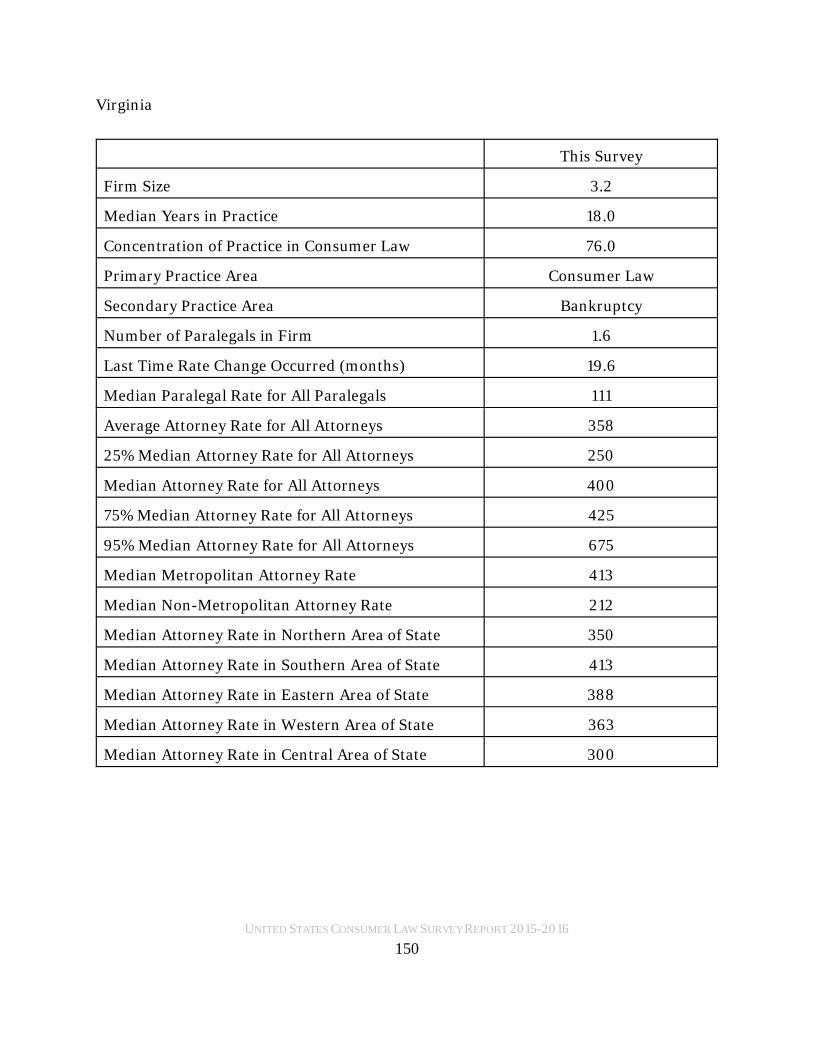
UNITED STATES CONSUMER LAW SURVEY REPORT 2015-2016
Virginia
This Survey
Firm Size 3.2
Median Years in Practice 18.0
Concentration of Practice in Consumer Law 76.0
Primary Practice Area Consumer Law
Secondary Practice Area Bankruptcy
Number of Paralegals in Firm 1.6
Last Time Rate Change Occurred (months) 19.6
Median Paralegal Rate for All Paralegals 111
Average Attorney Rate for All Attorneys 358
25% Median Attorney Rate for All Attorneys 250
Median Attorney Rate for All Attorneys 400
75% Median Attorney Rate for All Attorneys 425
95% Median Attorney Rate for All Attorneys 675
Median Metropolitan Attorney Rate 413
Median Non-Metropolitan Attorney Rate 212
Median Attorney Rate in Northern Area of State 350
Median Attorney Rate in Southern Area of State 413
Median Attorney Rate in Eastern Area of State 388
Median Attorney Rate in Western Area of State 363
Median Attorney Rate in Central Area of State 300
150

UNITED STATES CONSUMER LAW SURVEY REPORT 2015-2016
Median Rates for Practice Areas
25%
Median
Median 95%
Median
Attorneys Handling Bankruptcy Cases 250 350 425
Attorneys Handling Class Action Cases 425 488 675
Attorneys Handling Credit Rights Cases 300 400 438
Attorneys Handling Mortgage Cases 275 425 675
Attorneys Handling Vehicle Cases 250 300 450
Attorneys Handling TCPA Cases 275 400 675
Attorneys Handling Other Cases 275 325 475
151

UNITED STATES CONSUMER LAW SURVEY REPORT 2015-2016
Washington
This Survey
Firm Size 2.3
Median Years in Practice 13.0
Concentration of Practice in Consumer Law 83.6
Primary Practice Area Consumer Law
Secondary Practice Area General Practice Bankruptcy
Number of Paralegals in Firm 1.8
Last Time Rate Change Occurred (months) 21.4
Median Paralegal Rate for All Paralegals 77
Average Attorney Rate for All Attorneys 374
25% Median Attorney Rate for All Attorneys 300
Median Attorney Rate for All Attorneys 325
75% Median Attorney Rate for All Attorneys 450
95% Median Attorney Rate for All Attorneys 700
Median Metropolitan Attorney Rate 300
Median Non-Metropolitan Attorney Rate 350
Median Attorney Rate in Northern Area of State 363
Median Attorney Rate in Southern Area of State 363
Median Attorney Rate in Eastern Area of State 338
Median Attorney Rate in Western Area of State 325
Median Attorney Rate in Central Area of State 375
152

UNITED STATES CONSUMER LAW SURVEY REPORT 2015-2016
Median Rates for Practice Areas
25%
Median
Median 95%
Median
Attorneys Handling Bankruptcy Cases 250 300 375
Attorneys Handling Class Action Cases 325 475 675
Attorneys Handling Credit Rights Cases 300 325 700
Attorneys Handling Mortgage Cases 200 488 700
Attorneys Handling Vehicle Cases 200 350 700
Attorneys Handling TCPA Cases 300 350 700
Attorneys Handling Other Cases 250 275 300
153

UNITED STATES CONSUMER LAW SURVEY REPORT 2015-2016
West Virginia
This Survey
Firm Size 2.0
Median Years in Practice 22.5
Concentration of Practice in Consumer Law 74.3
Primary Practice Area Consumer Law
Secondary Practice Area Bankruptcy
Number of Paralegals in Firm 1.6
Last Time Rate Change Occurred (months) 17.5
Median Paralegal Rate for All Paralegals 100
Average Attorney Rate for All Attorneys 302
25% Median Attorney Rate for All Attorneys 250
Median Attorney Rate for All Attorneys 300
75% Median Attorney Rate for All Attorneys 350
95% Median Attorney Rate for All Attorneys 450
Median Metropolitan Attorney Rate 350
Median Non-Metropolitan Attorney Rate 250
Median Attorney Rate in Northern Area of State 300
Median Attorney Rate in Southern Area of State 300
Median Attorney Rate in Eastern Area of State 300
Median Attorney Rate in Western Area of State 300
Median Attorney Rate in Central Area of State 300
154

UNITED STATES CONSUMER LAW SURVEY REPORT 2015-2016
Median Rates for Practice Areas
25%
Median
Median 95%
Median
Attorneys Handling Bankruptcy Cases 250 300 350
Attorneys Handling Class Action Cases 300 400 450
Attorneys Handling Credit Rights Cases 250 300 425
Attorneys Handling Mortgage Cases 300 338 450
Attorneys Handling Vehicle Cases 275 300 375
Attorneys Handling TCPA Cases 250 300 350
Attorneys Handling Other Cases 175 288 35o
155

UNITED STATES CONSUMER LAW SURVEY REPORT 2015-2016
Wisconsin
This Survey
Firm Size 2.2
Median Years in Practice 17.5
Concentration of Practice in Consumer Law 97.5
Primary Practice Area Consumer Law
Secondary Practice Area Bankruptcy
Number of Paralegals in Firm 1.5
Last Time Rate Change Occurred (months) 12.1
Median Paralegal Rate for All Paralegals 125
Average Attorney Rate for All Attorneys 404
25% Median Attorney Rate for All Attorneys 300
Median Attorney Rate for All Attorneys 375
75% Median Attorney Rate for All Attorneys 475
95% Median Attorney Rate for All Attorneys 700
Median Metropolitan Attorney Rate 375
Median Non-Metropolitan Attorney Rate 425
Median Attorney Rate in Northern Area of State 450
Median Attorney Rate in Southern Area of State 425
Median Attorney Rate in Eastern Area of State 425
Median Attorney Rate in Western Area of State 425
Median Attorney Rate in Central Area of State 425
156
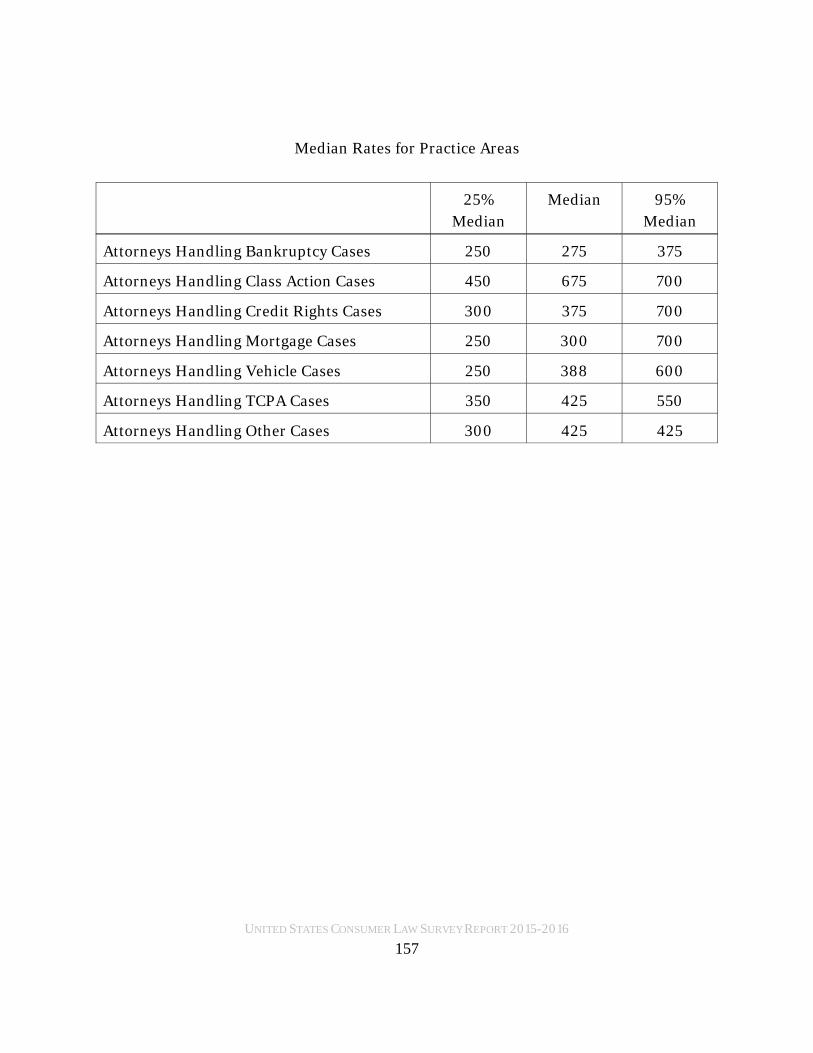
UNITED STATES CONSUMER LAW SURVEY REPORT 2015-2016
Median Rates for Practice Areas
25%
Median
Median 95%
Median
Attorneys Handling Bankruptcy Cases 250 275 375
Attorneys Handling Class Action Cases 450 675 700
Attorneys Handling Credit Rights Cases 300 375 700
Attorneys Handling Mortgage Cases 250 300 700
Attorneys Handling Vehicle Cases 250 388 600
Attorneys Handling TCPA Cases 350 425 550
Attorneys Handling Other Cases 300 425 425
157
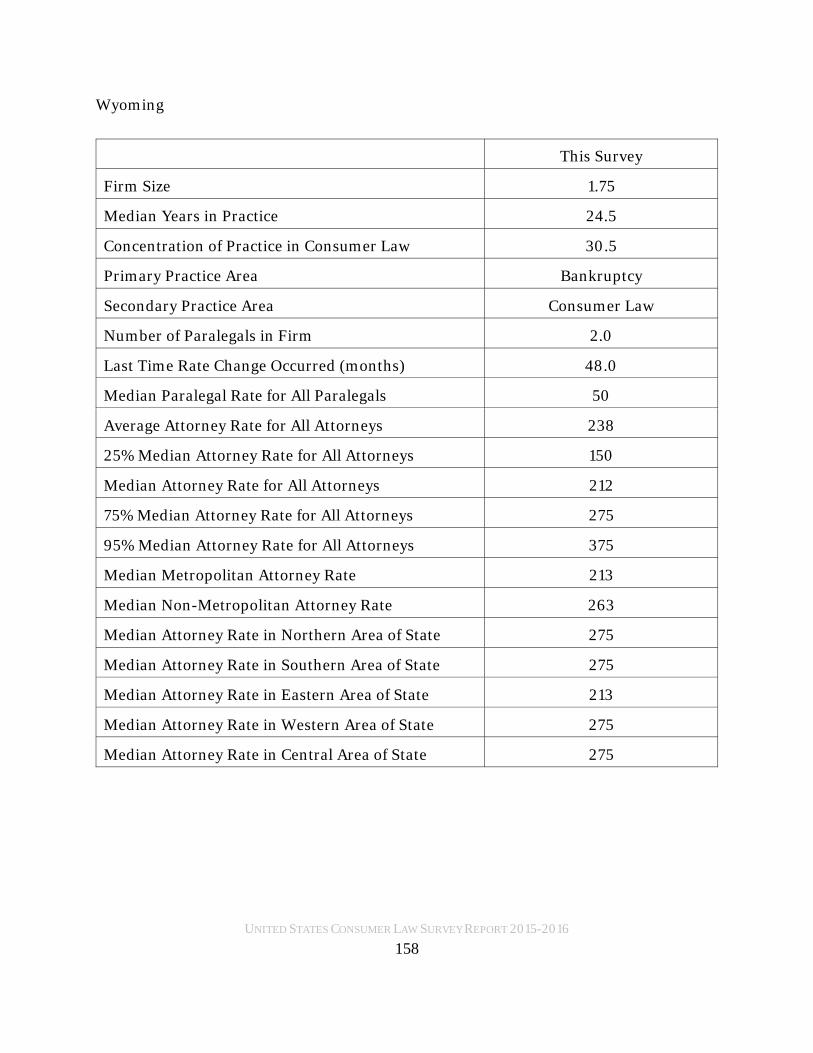
UNITED STATES CONSUMER LAW SURVEY REPORT 2015-2016
Wyoming
This Survey
Firm Size 1.75
Median Years in Practice 24.5
Concentration of Practice in Consumer Law 30.5
Primary Practice Area Bankruptcy
Secondary Practice Area Consumer Law
Number of Paralegals in Firm 2.0
Last Time Rate Change Occurred (months) 48.0
Median Paralegal Rate for All Paralegals 50
Average Attorney Rate for All Attorneys 238
25% Median Attorney Rate for All Attorneys 150
Median Attorney Rate for All Attorneys 212
75% Median Attorney Rate for All Attorneys 275
95% Median Attorney Rate for All Attorneys 375
Median Metropolitan Attorney Rate 213
Median Non-Metropolitan Attorney Rate 263
Median Attorney Rate in Northern Area of State 275
Median Attorney Rate in Southern Area of State 275
Median Attorney Rate in Eastern Area of State 213
Median Attorney Rate in Western Area of State 275
Median Attorney Rate in Central Area of State 275
158

UNITED STATES CONSUMER LAW SURVEY REPORT 2015-2016
Median Rates for Practice Areas
25%
Median
Median 95%
Median
Attorneys Handling Bankruptcy Cases 150 213 375
Attorneys Handling Class Action Cases 300 313 500
Attorneys Handling Credit Rights Cases 150 275 375
Attorneys Handling Mortgage Cases 150 150 150
Attorneys Handling Vehicle Cases 150 275 375
Attorneys Handling TCPA Cases 150 213 375
Attorneys Handling Other Cases 150 275 375
159
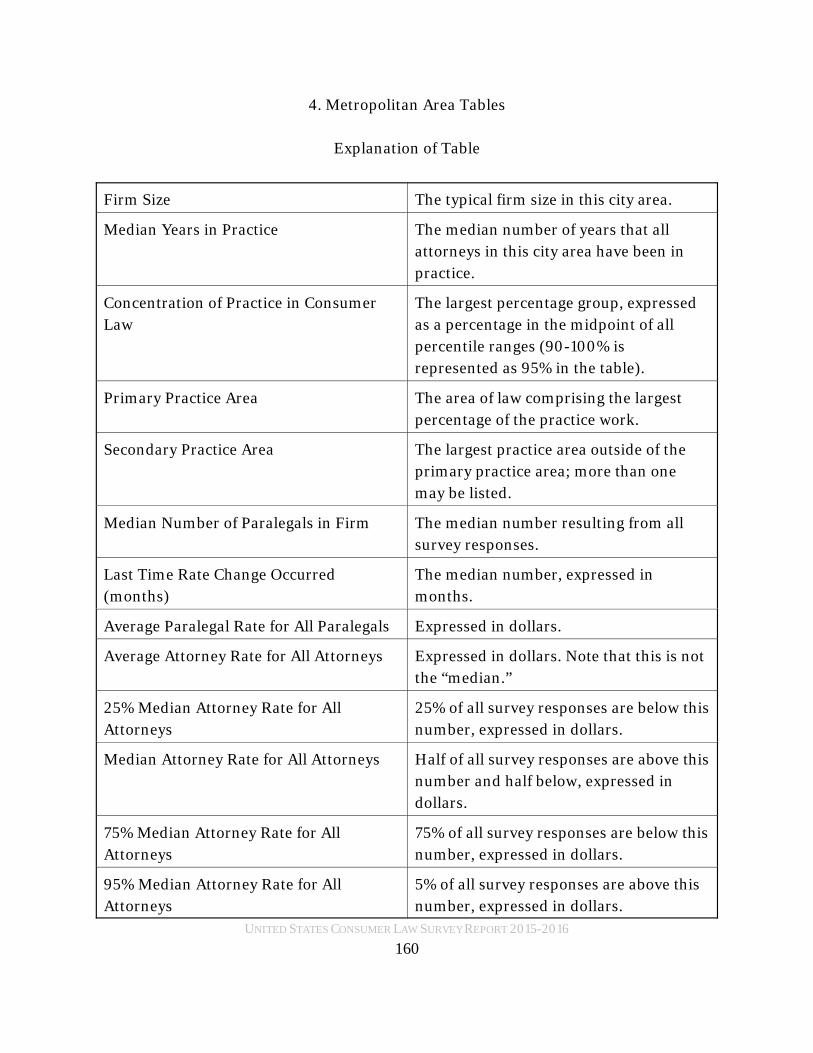
UNITED STATES CONSUMER LAW SURVEY REPORT 2015-2016
4. Metropolitan Area Tables
Explanation of Table
Firm Size The typical firm size in this city area.
Median Years in Practice The median number of years that all
attorneys in this city area have been in
practice.
Concentration of Practice in Consumer
Law
The largest percentage group, expressed
as a percentage in the midpoint of all
percentile ranges (90-100% is
represented as 95% in the table).
Primary Practice Area The area of law comprising the largest
percentage of the practice work.
Secondary Practice Area The largest practice area outside of the
primary practice area; more than one
may be listed.
Median Number of Paralegals in Firm The median number resulting from all
survey responses.
Last Time Rate Change Occurred
(months)
The median number, expressed in
months.
Average Paralegal Rate for All Paralegals Expressed in dollars.
Average Attorney Rate for All Attorneys Expressed in dollars. Note that this is not
the “median.”
25% Median Attorney Rate for All
Attorneys
25% of all survey responses are below this
number, expressed in dollars.
Median Attorney Rate for All Attorneys Half of all survey responses are above this
number and half below, expressed in
dollars.
75% Median Attorney Rate for All
Attorneys
75% of all survey responses are below this
number, expressed in dollars.
95% Median Attorney Rate for All
Attorneys
5% of all survey responses are above this
number, expressed in dollars.
160

UNITED STATES CONSUMER LAW SURVEY REPORT 2015-2016
Median Rates for Practice Areas in Consumer Law
Median Rate for Attorneys Handling
Bankruptcy Cases
For all attorneys handling this specific
niche area of Consumer Law, half of all
survey responses are above this number
and half are belowMedian Rate for Attorneys Handling
Class Action Case
For all attorneys handling this specific
niche area of Consumer Law, half of all
survey responses are above this number
and half are belowMedian Rate for Attorneys Handling
Credit Rights Cases
For all attorneys handling this specific
niche area of Consumer Law, half of all
survey responses are above this number
and half are belowMedian Rate for Attorneys Handling
Mortgage Cases
For all attorneys handling this specific
niche area of Consumer Law, half of all
survey responses are above this number
and half are belowMedian Rate for Attorneys Handling
Vehicle Cases
For all attorneys handling this specific
niche area of Consumer Law, half of all
survey responses are above this number
and half are belowMedian Rate for Attorneys Handling
TCPA Cases
For all attorneys handling this specific
niche area of Consumer Law, half of all
survey responses are above this number
and half are belowMedian Rate for Attorneys Handling
Other Cases
For all attorneys handling a niche area of
Consumer Law not defined in the
preceding six areas, half of all survey
responses are above this number and half
are below
Metropolitan areas listed in this section appear alphabetically by state and not
merely by the name of the city since the name may appear in more than one state. Thus,
metropolitan areas in Alabama lead the list and metropolitan areas in Wisconsin are at
the end of the list.
161

UNITED STATES CONSUMER LAW SURVEY REPORT 2015-2016
Following each Metropolitan Area Summaries Table is the Median Rates for
Practice Areas table, as explained in the chart above. After that there appears the
Experience Variable Table which provides attorney hourly rates by years in practice for
that Metropolitan Area. Combined, these tables are intended to provide the reader with
a quick and easy snapshot of the data as viewed in the narrow metropolitan approach to
the data. The Experience Variable Table also may provide a view of the average hourly
rates for an attorney as measured simply by years in practice, but all three metropolitan
tables should also be considered in making such a determination.
Of course, the years in practice of an attorney is often deemed related to the
experience level of an attorney and is also one of the traditional ways of determining the
reasonableness of a particular attorney’s hourly rate.
The years in practice alone may not be a sufficient basis, by itself, to consider a
particular hourly rate to be reasonable in a particular case. Other factors also relate to
the determination of a reasonable hourly rate in a particular case.
In this section of the Survey Report, the only data included is from attorneys who
indicated they practiced in the metropolitan area. Non-metropolitan area data was
excluded. However, where the survey participant indicated they practiced in both
metropolitan and non-metropolitan areas at the same hourly rate, their data was
included in the metropolitan reporting below.
A non-metropolitan data report by years in practice can be made available upon
request. However, case law indicates that the hourly rate for the jurisdiction at hand
often applies to an attorney’s hourly rate when practicing in that jurisdiction, rather
than the hourly rate for their office location.
162

UNITED STATES CONSUMER LAW SURVEY REPORT 2015-2016
Alabama, Birmingham
Firm Size 2.0
Median Years in Practice 12.0
Concentration of Practice in Consumer Law 91.7
Primary Practice Area Consumer Law
Secondary Practice Area General Practice
Last Time Rate Change Occurred (months) 15.4
Median Number of Paralegals in Firm .9
Average Paralegal Rate for All Paralegals 142
Average Attorney Rate for All Attorneys 408
25% Median Attorney Rate for All Attorneys 313
Median Attorney Rate for All Attorneys 325
75% Median Attorney Rate for All Attorneys 525
95% Median Attorney Rate for All Attorneys 700
Median Rate for Practice Areas
Median
Attorneys Handling Bankruptcy Cases 363
Attorneys Handling Class Action Cases 325
Attorneys Handling Credit Rights Cases 338
Attorneys Handling Mortgage Cases 350
Attorneys Handling Vehicle Cases 538
Attorneys Handling TCPA Cases 325
Attorneys Handling Other Cases 500
Experience Variable Table
163

UNITED STATES CONSUMER LAW SURVEY REPORT 2015-2016
Years Practicing Consumer Law Average Attorney Hourly Rate
<1 175
1-3 200
3-5 250
6-10 325
11-15 313
16-20 350
21-25 450
26-30 450
31-35 500
36-40 700
41+ 500
164

UNITED STATES CONSUMER LAW SURVEY REPORT 2015-2016
Alabama, Huntsville
Firm Size 2.4
Median Years in Practice 20.0
Concentration of Practice in Consumer Law 85.0
Primary Practice Area Consumer Law
Secondary Practice Area Bankruptcy
Last Time Rate Change Occurred (months) 18.5
Median Number of Paralegals in Firm 0
Average Paralegal Rate for All Paralegals 75
Average Attorney Rate for All Attorneys 398
25% Median Attorney Rate for All Attorneys 325
Median Attorney Rate for All Attorneys 350
75% Median Attorney Rate for All Attorneys 500
95% Median Attorney Rate for All Attorneys 700
Median Rate for Practice Areas
Median
Attorneys Handling Bankruptcy Cases 363
Attorneys Handling Class Action Cases 325
Attorneys Handling Credit Rights Cases 350
Attorneys Handling Mortgage Cases 350
Attorneys Handling Vehicle Cases 375
Attorneys Handling TCPA Cases 350
Attorneys Handling Other Cases 350
165

UNITED STATES CONSUMER LAW SURVEY REPORT 2015-2016
Experience Variable Table
Years Practicing Consumer Law Average Attorney Hourly Rate
<1 175
1-3 200
3-5 275
6-10 325
11-15 313
16-20 375
21-25 450
26-30 350
31-35 375
36-40 700
41+ 500
166

UNITED STATES CONSUMER LAW SURVEY REPORT 2015-2016
Alabama, Mobile
Firm Size 1.7
Median Years in Practice 12.0
Concentration of Practice in Consumer Law 92.4
Primary Practice Area Consumer Law
Secondary Practice Area Bankruptcy
Last Time Rate Change Occurred (months) 11.2
Median Number of Paralegals in Firm 0
Average Paralegal Rate for All Paralegals 130
Average Attorney Rate for All Attorneys 393
25% Median Attorney Rate for All Attorneys 300
Median Attorney Rate for All Attorneys 325
75% Median Attorney Rate for All Attorneys 550
95% Median Attorney Rate for All Attorneys 700
Median Rate for Practice Areas
Median
Attorneys Handling Bankruptcy Cases 363
Attorneys Handling Class Action Cases 325
Attorneys Handling Credit Rights Cases 338
Attorneys Handling Mortgage Cases 350
Attorneys Handling Vehicle Cases 538
Attorneys Handling TCPA Cases 325
Attorneys Handling Other Cases 338
167

UNITED STATES CONSUMER LAW SURVEY REPORT 2015-2016
Experience Variable Table
Years Practicing Consumer Law Average Attorney Hourly Rate
<1 175
1-3 200
3-5 250
6-10 325
11-15 313
16-20 375
21-25 350
26-30 350
31-35 375
36-40 700
41+ 500
168

UNITED STATES CONSUMER LAW SURVEY REPORT 2015-2016
Alabama, Montgomery
Firm Size 2.0
Median Years in Practice 12.0
Concentration of Practice in Consumer Law 93.3
Primary Practice Area Consumer Law
Secondary Practice Area General Practice
Last Time Rate Change Occurred (months) 15.4
Median Number of Paralegals in Firm .9
Average Paralegal Rate for All Paralegals 110
Average Attorney Rate for All Attorneys 408
25% Median Attorney Rate for All Attorneys 313
Median Attorney Rate for All Attorneys 325
75% Median Attorney Rate for All Attorneys 525
95% Median Attorney Rate for All Attorneys 700
Median Rate for Practice Areas
Median
Attorneys Handling Bankruptcy Cases 363
Attorneys Handling Class Action Cases 325
Attorneys Handling Credit Rights Cases 338
Attorneys Handling Mortgage Cases 350
Attorneys Handling Vehicle Cases 538
Attorneys Handling TCPA Cases 325
Attorneys Handling Other Cases 500
169

UNITED STATES CONSUMER LAW SURVEY REPORT 2015-2016
Experience Variable Table
Years Practicing Consumer Law Average Attorney Hourly Rate
<1 175
1-3 200
3-5 250
6-10 325
11-15 313
16-20 350
21-25 450
26-30 450
31-35 500
36-40 700
41+ 500
170
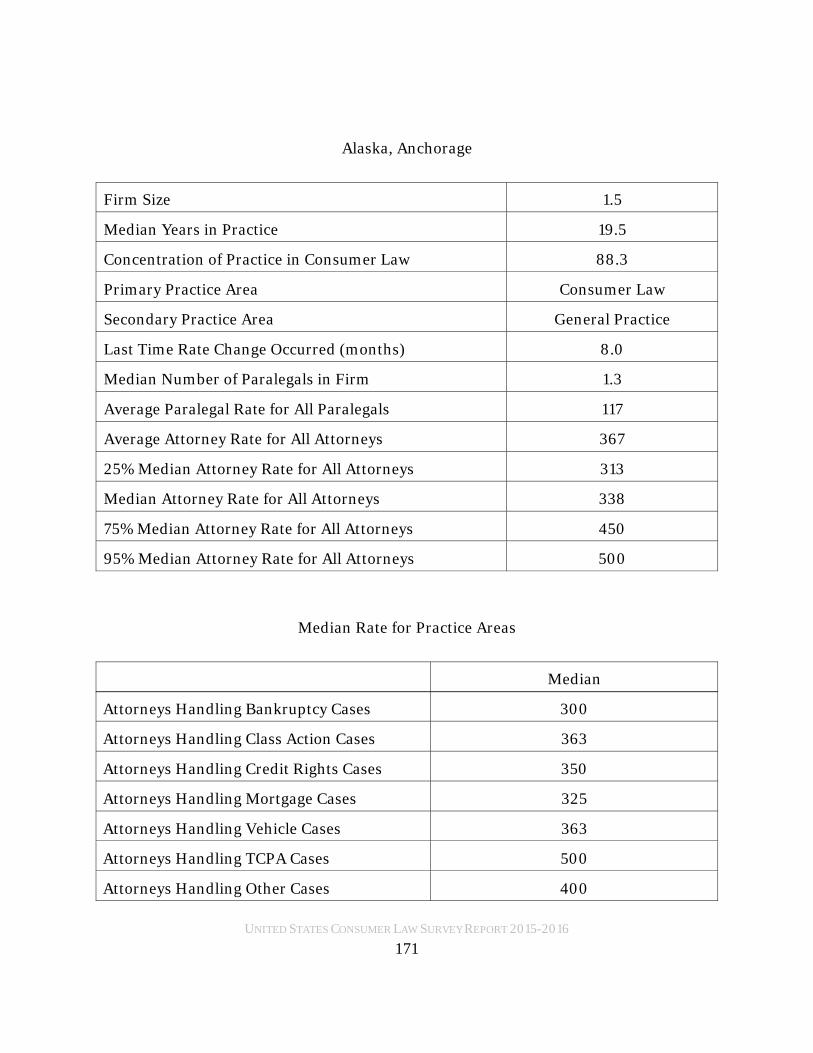
UNITED STATES CONSUMER LAW SURVEY REPORT 2015-2016
Alaska, Anchorage
Firm Size 1.5
Median Years in Practice 19.5
Concentration of Practice in Consumer Law 88.3
Primary Practice Area Consumer Law
Secondary Practice Area General Practice
Last Time Rate Change Occurred (months) 8.0
Median Number of Paralegals in Firm 1.3
Average Paralegal Rate for All Paralegals 117
Average Attorney Rate for All Attorneys 367
25% Median Attorney Rate for All Attorneys 313
Median Attorney Rate for All Attorneys 338
75% Median Attorney Rate for All Attorneys 450
95% Median Attorney Rate for All Attorneys 500
Median Rate for Practice Areas
Median
Attorneys Handling Bankruptcy Cases 300
Attorneys Handling Class Action Cases 363
Attorneys Handling Credit Rights Cases 350
Attorneys Handling Mortgage Cases 325
Attorneys Handling Vehicle Cases 363
Attorneys Handling TCPA Cases 500
Attorneys Handling Other Cases 400
171

UNITED STATES CONSUMER LAW SURVEY REPORT 2015-2016
Experience Variable Table
Years Practicing Consumer Law Average Attorney Hourly Rate
<1 200
1-3 213
3-5 213
6-10 325
11-15 350
16-20 375
21-25 400
26-30 400
31-35 450
36-40 300
41+ 500
172

UNITED STATES CONSUMER LAW SURVEY REPORT 2015-2016
Arizona, Flagstaff
Firm Size 1.75
Median Years in Practice 26.5
Concentration of Practice in Consumer Law 85.8
Primary Practice Area Consumer Law
Secondary Practice Area Bankruptcy
Last Time Rate Change Occurred (months) 19.0
Median Number of Paralegals in Firm 1.25
Average Paralegal Rate for All Paralegals 73
Average Attorney Rate for All Attorneys 438
25% Median Attorney Rate for All Attorneys 350
Median Attorney Rate for All Attorneys 425
75% Median Attorney Rate for All Attorneys 500
95% Median Attorney Rate for All Attorneys 700
Median Rate for Practice Areas
Median
Attorneys Handling Bankruptcy Cases 300
Attorneys Handling Class Action Cases 450
Attorneys Handling Credit Rights Cases 450
Attorneys Handling Mortgage Cases 700
Attorneys Handling Vehicle Cases 413
Attorneys Handling TCPA Cases 450
Attorneys Handling Other Cases 438
173

UNITED STATES CONSUMER LAW SURVEY REPORT 2015-2016
Experience Variable Table
Years Practicing Consumer Law Average Attorney Hourly Rate
<1 190
1-3 220
3-5 265
6-10 275
11-15 450
16-20 475
21-25 550
26-30 428
31-35 565
36-40 588
41+ 450
174

UNITED STATES CONSUMER LAW SURVEY REPORT 2015-2016
Arizona, Phoenix
Firm Size 1.8
Median Years in Practice 26.5
Concentration of Practice in Consumer Law 92.6
Primary Practice Area Consumer Law
Secondary Practice Area Bankruptcy
Last Time Rate Change Occurred (months) 19.0
Median Number of Paralegals in Firm 1.0
Average Paralegal Rate for All Paralegals 103
Average Attorney Rate for All Attorneys 438
25% Median Attorney Rate for All Attorneys 350
Median Attorney Rate for All Attorneys 438
75% Median Attorney Rate for All Attorneys 500
95% Median Attorney Rate for All Attorneys 700
Median Rate for Practice Areas
Median
Attorneys Handling Bankruptcy Cases 300
Attorneys Handling Class Action Cases 450
Attorneys Handling Credit Rights Cases 450
Attorneys Handling Mortgage Cases 700
Attorneys Handling Vehicle Cases 413
Attorneys Handling TCPA Cases 450
Attorneys Handling Other Cases 438
175

UNITED STATES CONSUMER LAW SURVEY REPORT 2015-2016
Experience Variable Table
Years Practicing Consumer Law Average Attorney Hourly Rate
<1 190
1-3 220
3-5 265
6-10 275
11-15 450
16-20 475
21-25 550
26-30 428
31-35 565
36-40 588
41+ 450
176

UNITED STATES CONSUMER LAW SURVEY REPORT 2015-2016
Arizona, Tucson
Firm Size 3.0
Median Years in Practice 21.0
Concentration of Practice in Consumer Law 100.0
Primary Practice Area Consumer Law
Secondary Practice Area General Practice
Last Time Rate Change Occurred (months) 20.0
Median Number of Paralegals in Firm 1.7
Average Paralegal Rate for All Paralegals 95
Average Attorney Rate for All Attorneys 483
25% Median Attorney Rate for All Attorneys 400
Median Attorney Rate for All Attorneys 438
75% Median Attorney Rate for All Attorneys 600
95% Median Attorney Rate for All Attorneys 700
Median Rate for Practice Areas
Median
Attorneys Handling Bankruptcy Cases 438
Attorneys Handling Class Action Cases 425
Attorneys Handling Credit Rights Cases 438
Attorneys Handling Mortgage Cases 425
Attorneys Handling Vehicle Cases 550
Attorneys Handling TCPA Cases 475
Attorneys Handling Other Cases 438
177
UNITED STATES CONSUMER LAW SURVEY REPORT 2015-2016
Experience Variable Table
Years Practicing Consumer Law Average Attorney Hourly Rate
<1 200
1-3 240
3-5 288
6-10 325
11-15 450
16-20 425
21-25 450
26-30 435
31-35 459
36-40 700
41+ 500
178

UNITED STATES CONSUMER LAW SURVEY REPORT 2015-2016
Arizona, Yuma
Firm Size 2.25
Median Years in Practice 32.0
Concentration of Practice in Consumer Law 87.8
Primary Practice Area Consumer Law
Secondary Practice Area Bankruptcy
Last Time Rate Change Occurred (months) 20.5
Median Number of Paralegals in Firm 1.3
Average Paralegal Rate for All Paralegals 120
Average Attorney Rate for All Attorneys 458
25% Median Attorney Rate for All Attorneys 400
Median Attorney Rate for All Attorneys 450
75% Median Attorney Rate for All Attorneys 500
95% Median Attorney Rate for All Attorneys 700
Median Rate for Practice Areas
Median
Attorneys Handling Bankruptcy Cases 475
Attorneys Handling Class Action Cases 425
Attorneys Handling Credit Rights Cases 450
Attorneys Handling Mortgage Cases 425
Attorneys Handling Vehicle Cases 400
Attorneys Handling TCPA Cases 475
Attorneys Handling Other Cases 500
179
UNITED STATES CONSUMER LAW SURVEY REPORT 2015-2016
Experience Variable Table
Years Practicing Consumer Law Average Attorney Hourly Rate
<1 190
1-3 220
3-5 265
6-10 350
11-15 450
16-20 425
21-25 375
26-30 400
31-35 470
36-40 588
41+ 475
180
UNITED STATES CONSUMER LAW SURVEY REPORT 2015-2016
California, Fresno
Firm Size 2.8
Median Years in Practice 18.0
Concentration of Practice in Consumer Law 83.9
Primary Practice Area Consumer Law
Secondary Practice Area Bankruptcy
Last Time Rate Change Occurred (months) 14.0
Median Number of Paralegals in Firm 1.0
Average Paralegal Rate for All Paralegals 103
Average Attorney Rate for All Attorneys 475
25% Median Attorney Rate for All Attorneys 350
Median Attorney Rate for All Attorneys 475
75% Median Attorney Rate for All Attorneys 575
95% Median Attorney Rate for All Attorneys 725
Median Rate for Practice Areas
Median
Attorneys Handling Bankruptcy Cases 338
Attorneys Handling Class Action Cases 488
Attorneys Handling Credit Rights Cases 450
Attorneys Handling Mortgage Cases 563
Attorneys Handling Vehicle Cases 475
Attorneys Handling TCPA Cases 513
Attorneys Handling Other Cases 513
181

UNITED STATES CONSUMER LAW SURVEY REPORT 2015-2016
Experience Variable Table
Years Practicing Consumer Law Average Attorney Hourly Rate
<1 244
1-3 300
3-5 300
6-10 400
11-15 463
16-20 500
21-25 550
26-30 550
31-35 550
36-40 700
41+ 500
182
UNITED STATES CONSUMER LAW SURVEY REPORT 2015-2016
California, Los Angeles - Long Beach - Anaheim
Firm Size 2.5
Median Years in Practice 16.5
Concentration of Practice in Consumer Law 80.1
Primary Practice Area Consumer Law
Secondary Practice Area General Practice
Last Time Rate Change Occurred (months) 14.4
Median Number of Paralegals in Firm 2.0
Average Paralegal Rate for All Paralegals 94
Average Attorney Rate for All Attorneys 464
25% Median Attorney Rate for All Attorneys 325
Median Attorney Rate for All Attorneys 450
75% Median Attorney Rate for All Attorneys 600
95% Median Attorney Rate for All Attorneys 725
Median Rate for Practice Areas
Median
Attorneys Handling Bankruptcy Cases 350
Attorneys Handling Class Action Cases 500
Attorneys Handling Credit Rights Cases 450
Attorneys Handling Mortgage Cases 400
Attorneys Handling Vehicle Cases 475
Attorneys Handling TCPA Cases 450
Attorneys Handling Other Cases 400
183

UNITED STATES CONSUMER LAW SURVEY REPORT 2015-2016
Experience Variable Table
Years Practicing Consumer Law Average Attorney Hourly Rate
<1 300
1-3 258
3-5 267
6-10 386
11-15 425
16-20 496
21-25 534
26-30 560
31-35 619
36-40 645
41+ 450
184

UNITED STATES CONSUMER LAW SURVEY REPORT 2015-2016
California, Sacramento
Firm Size 2.3
Median Years in Practice 19.0
Concentration of Practice in Consumer Law 83.2
Primary Practice Area Consumer Law
Secondary Practice Area Bankruptcy
Last Time Rate Change Occurred (months) 19.4
Median Number of Paralegals in Firm 1.0
Average Paralegal Rate for All Paralegals 96
Average Attorney Rate for All Attorneys 481
25% Median Attorney Rate for All Attorneys 350
Median Attorney Rate for All Attorneys 450
75% Median Attorney Rate for All Attorneys 550
95% Median Attorney Rate for All Attorneys 725
Median Rate for Practice Areas
Median
Attorneys Handling Bankruptcy Cases 350
Attorneys Handling Class Action Cases 513
Attorneys Handling Credit Rights Cases 450
Attorneys Handling Mortgage Cases 450
Attorneys Handling Vehicle Cases 475
Attorneys Handling TCPA Cases 500
Attorneys Handling Other Cases 475
185

UNITED STATES CONSUMER LAW SURVEY REPORT 2015-2016
Experience Variable Table
Years Practicing Consumer Law Average Attorney Hourly Rate
<1 -
1-3 275
3-5 300
6-10 410
11-15 499
16-20 524
21-25 514
26-30 502
31-35 453
36-40 550
41+ 463
186

UNITED STATES CONSUMER LAW SURVEY REPORT 2015-2016
California, San Diego
Firm Size 2.0
Median Years in Practice 16.0
Concentration of Practice in Consumer Law 82.0
Primary Practice Area Consumer Law
Secondary Practice Area Bankruptcy
Last Time Rate Change Occurred (months) 12.5
Median Number of Paralegals in Firm 1.0
Average Paralegal Rate for All Paralegals 100
Average Attorney Rate for All Attorneys 371
25% Median Attorney Rate for All Attorneys 257
Median Attorney Rate for All Attorneys 360
75% Median Attorney Rate for All Attorneys 474
95% Median Attorney Rate for All Attorneys 595
Median Rate for Practice Areas
Median
Attorneys Handling Bankruptcy Cases 377
Attorneys Handling Class Action Cases 425
Attorneys Handling Credit Rights Cases 375
Attorneys Handling Mortgage Cases 316
Attorneys Handling Vehicle Cases 375
Attorneys Handling TCPA Cases 355
Attorneys Handling Other Cases 315
187

UNITED STATES CONSUMER LAW SURVEY REPORT 2015-2016
Experience Variable Table
Years Practicing Consumer Law Average Attorney Hourly Rate
<1 265
1-3 250
3-5 250
6-10 340
11-15 400
16-20 442
21-25 475
26-30 495
31-35 553
36-40 575
41+ 440
188

UNITED STATES CONSUMER LAW SURVEY REPORT 2015-2016
California, San Francisco
Firm Size 2.78
Median Years in Practice 17.0
Concentration of Practice in Consumer Law 93.0
Primary Practice Area Consumer Law
Secondary Practice Area Bankruptcy
Last Time Rate Change Occurred (months) 13.6
Median Number of Paralegals in Firm 1.0
Average Paralegal Rate for All Paralegals 96
Average Attorney Rate for All Attorneys 461
25% Median Attorney Rate for All Attorneys 350
Median Attorney Rate for All Attorneys 450
75% Median Attorney Rate for All Attorneys 575
95% Median Attorney Rate for All Attorneys 725
Median Rate for Practice Areas
Median
Attorneys Handling Bankruptcy Cases 350
Attorneys Handling Class Action Cases 488
Attorneys Handling Credit Rights Cases 425
Attorneys Handling Mortgage Cases 525
Attorneys Handling Vehicle Cases 450
Attorneys Handling TCPA Cases 500
Attorneys Handling Other Cases 325
189

UNITED STATES CONSUMER LAW SURVEY REPORT 2015-2016
Experience Variable Table
Years Practicing Consumer Law Average Attorney Hourly Rate
<1 300
1-3 250
3-5 293
6-10 396
11-15 495
16-20 520
21-25 525
26-30 564
31-35 494
36-40 644
41+ 500
190
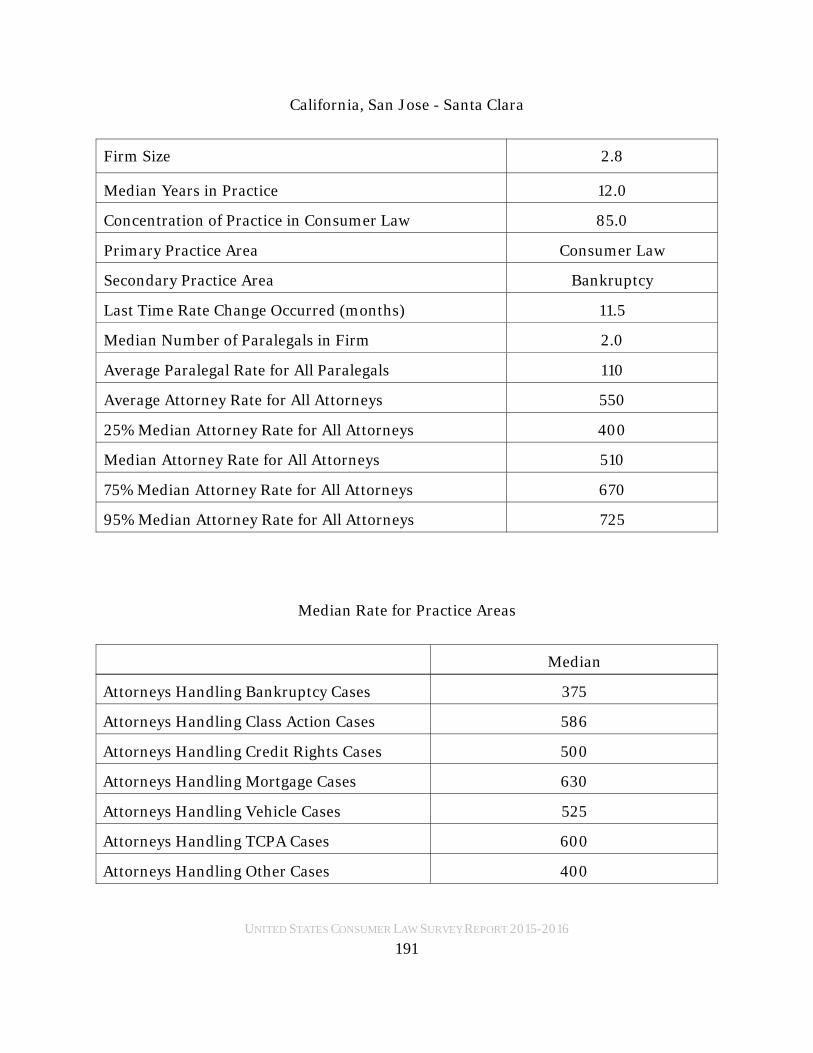
UNITED STATES CONSUMER LAW SURVEY REPORT 2015-2016
California, San Jose - Santa Clara
Firm Size 2.8
Median Years in Practice 12.0
Concentration of Practice in Consumer Law 85.0
Primary Practice Area Consumer Law
Secondary Practice Area Bankruptcy
Last Time Rate Change Occurred (months) 11.5
Median Number of Paralegals in Firm 2.0
Average Paralegal Rate for All Paralegals 110
Average Attorney Rate for All Attorneys 550
25% Median Attorney Rate for All Attorneys 400
Median Attorney Rate for All Attorneys 510
75% Median Attorney Rate for All Attorneys 670
95% Median Attorney Rate for All Attorneys 725
Median Rate for Practice Areas
Median
Attorneys Handling Bankruptcy Cases 375
Attorneys Handling Class Action Cases 586
Attorneys Handling Credit Rights Cases 500
Attorneys Handling Mortgage Cases 630
Attorneys Handling Vehicle Cases 525
Attorneys Handling TCPA Cases 600
Attorneys Handling Other Cases 400
191

UNITED STATES CONSUMER LAW SURVEY REPORT 2015-2016
Experience Variable Table
Years Practicing Consumer Law Average Attorney Hourly Rate
<1 300
1-3 250
3-5 293
6-10 396
11-15 495
16-20 520
21-25 525
26-30 564
31-35 494
36-40 644
41+ 500
192

UNITED STATES CONSUMER LAW SURVEY REPORT 2015-2016
California, Riverside - San Bernardino
Firm Size 2.0
Median Years in Practice 17.4
Concentration of Practice in Consumer Law 74.0
Primary Practice Area Consumer Law
Secondary Practice Area General Practice
Last Time Rate Change Occurred (months) 16.0
Median Number of Paralegals in Firm 1.0
Average Paralegal Rate for All Paralegals 98
Average Attorney Rate for All Attorneys 440
25% Median Attorney Rate for All Attorneys 310
Median Attorney Rate for All Attorneys 425
75% Median Attorney Rate for All Attorneys 550
95% Median Attorney Rate for All Attorneys 650
Median Rate for Practice Areas
Median
Attorneys Handling Bankruptcy Cases 325
Attorneys Handling Class Action Cases 475
Attorneys Handling Credit Rights Cases 425
Attorneys Handling Mortgage Cases 375
Attorneys Handling Vehicle Cases 450
Attorneys Handling TCPA Cases 425
Attorneys Handling Other Cases 375
193

UNITED STATES CONSUMER LAW SURVEY REPORT 2015-2016
Experience Variable Table
Years Practicing Consumer Law Average Attorney Hourly Rate
<1 290
1-3 240
3-5 250
6-10 360
11-15 400
16-20 445
21-25 500
26-30 528
31-35 580
36-40 605
41+ 420
194

UNITED STATES CONSUMER LAW SURVEY REPORT 2015-2016
Colorado, Colorado Springs
Firm Size 1.8
Median Years in Practice 16.0
Concentration of Practice in Consumer Law 84.5
Primary Practice Area Consumer Law
Secondary Practice Area Bankruptcy
Last Time Rate Change Occurred (months) 23.5
Median Number of Paralegals in Firm 1.0
Average Paralegal Rate for All Paralegals 94
Average Attorney Rate for All Attorneys 364
25% Median Attorney Rate for All Attorneys 270
Median Attorney Rate for All Attorneys 325
75% Median Attorney Rate for All Attorneys 465
95% Median Attorney Rate for All Attorneys 550
Median Rate for Practice Areas
Median
Attorneys Handling Bankruptcy Cases 300
Attorneys Handling Class Action Cases 313
Attorneys Handling Credit Rights Cases 300
Attorneys Handling Mortgage Cases 275
Attorneys Handling Vehicle Cases 300
Attorneys Handling TCPA Cases 388
Attorneys Handling Other Cases 300
195

UNITED STATES CONSUMER LAW SURVEY REPORT 2015-2016
Experience Variable Table
Years Practicing Consumer Law Average Attorney Hourly Rate
<1 220
1-3 225
3-5 225
6-10 300
11-15 288
16-20 325
21-25 550
26-30 550
31-35 500
36-40 363
41+ 500
196
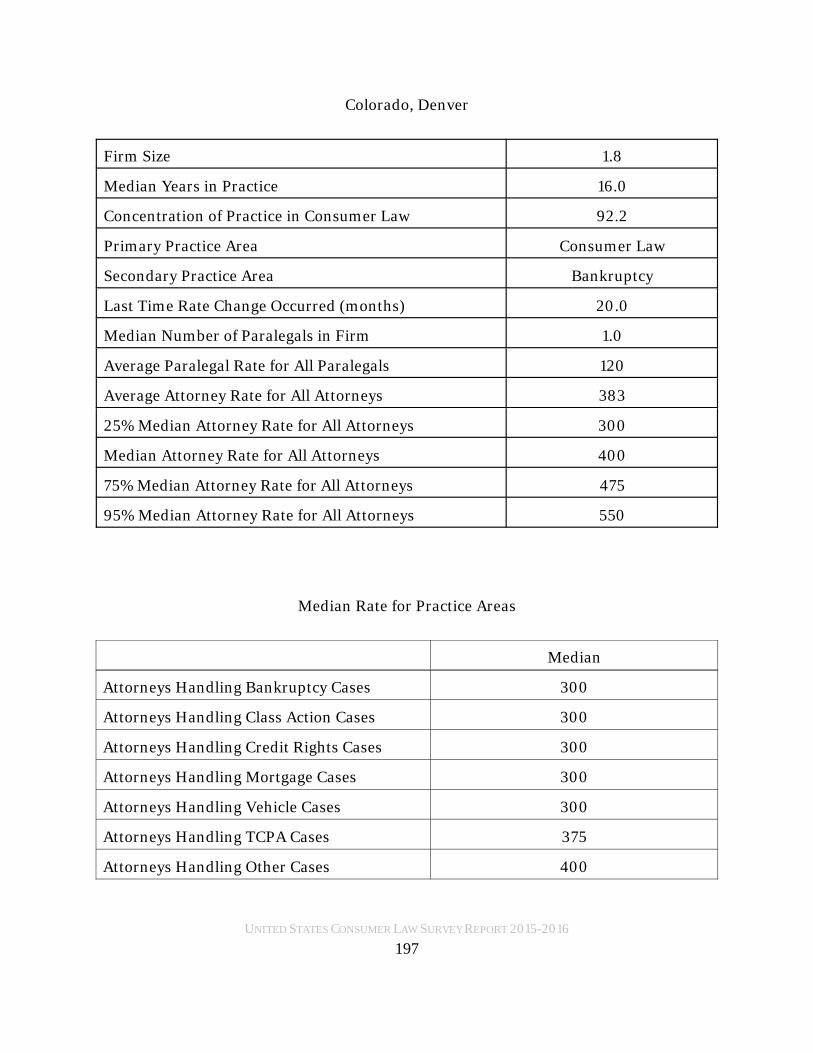
UNITED STATES CONSUMER LAW SURVEY REPORT 2015-2016
Colorado, Denver
Firm Size 1.8
Median Years in Practice 16.0
Concentration of Practice in Consumer Law 92.2
Primary Practice Area Consumer Law
Secondary Practice Area Bankruptcy
Last Time Rate Change Occurred (months) 20.0
Median Number of Paralegals in Firm 1.0
Average Paralegal Rate for All Paralegals 120
Average Attorney Rate for All Attorneys 383
25% Median Attorney Rate for All Attorneys 300
Median Attorney Rate for All Attorneys 400
75% Median Attorney Rate for All Attorneys 475
95% Median Attorney Rate for All Attorneys 550
Median Rate for Practice Areas
Median
Attorneys Handling Bankruptcy Cases 300
Attorneys Handling Class Action Cases 300
Attorneys Handling Credit Rights Cases 300
Attorneys Handling Mortgage Cases 300
Attorneys Handling Vehicle Cases 300
Attorneys Handling TCPA Cases 375
Attorneys Handling Other Cases 400
197

UNITED STATES CONSUMER LAW SURVEY REPORT 2015-2016
Experience Variable Table
Years Practicing Consumer Law Average Attorney Hourly Rate
<1 220
1-3 225
3-5 225
6-10 250
11-15 300
16-20 375
21-25 325
26-30 550
31-35 500
36-40 500
41+ 400
198

UNITED STATES CONSUMER LAW SURVEY REPORT 2015-2016
Connecticut, New Haven
Firm Size 2.9
Median Years in Practice 20
Concentration of Practice in Consumer Law 89.1
Primary Practice Area Consumer Law
Secondary Practice Area Bankruptcy
Last Time Rate Change Occurred (months) 25.1
Median Number of Paralegals in Firm 3.0
Average Paralegal Rate for All Paralegals 79
Average Attorney Rate for All Attorneys 477
25% Median Attorney Rate for All Attorneys 300
Median Attorney Rate for All Attorneys 400
75% Median Attorney Rate for All Attorneys 700
95% Median Attorney Rate for All Attorneys 725
Median Rate for Practice Areas
Median
Attorneys Handling Bankruptcy Cases 350
Attorneys Handling Class Action Cases 725
Attorneys Handling Credit Rights Cases 400
Attorneys Handling Mortgage Cases 350
Attorneys Handling Vehicle Cases 350
Attorneys Handling TCPA Cases 400
Attorneys Handling Other Cases 400
199

UNITED STATES CONSUMER LAW SURVEY REPORT 2015-2016
Experience Variable Table
Years Practicing Consumer Law Average Attorney Hourly Rate
<1 205
1-3 250
3-5 283
6-10 400
11-15 410
16-20 550
21-25 625
26-30 617
31-35 600
36-40 350
41+ 400
200

UNITED STATES CONSUMER LAW SURVEY REPORT 2015-2016
Connecticut, Hartford
Firm Size 2.6
Median Years in Practice 20.0
Concentration of Practice in Consumer Law 96.7
Primary Practice Area Consumer Law
Secondary Practice Area Employment Law
Last Time Rate Change Occurred (months) 21.4
Median Number of Paralegals in Firm 1.0
Average Paralegal Rate for All Paralegals 97
Average Attorney Rate for All Attorneys 486
25% Median Attorney Rate for All Attorneys 380
Median Attorney Rate for All Attorneys 400
75% Median Attorney Rate for All Attorneys 700
95% Median Attorney Rate for All Attorneys 725
Median Rate for Practice Areas
Median
Attorneys Handling Bankruptcy Cases 400
Attorneys Handling Class Action Cases 725
Attorneys Handling Credit Rights Cases 400
Attorneys Handling Mortgage Cases 375
Attorneys Handling Vehicle Cases 388
Attorneys Handling TCPA Cases 400
Attorneys Handling Other Cases 375
201
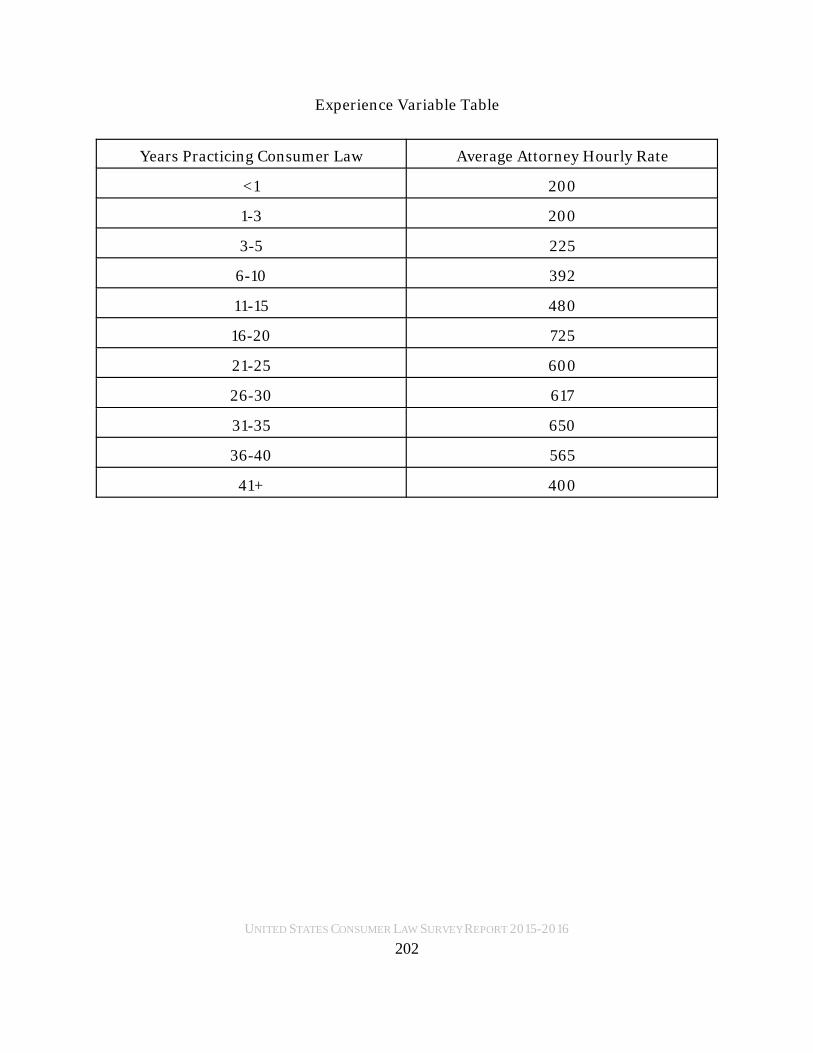
UNITED STATES CONSUMER LAW SURVEY REPORT 2015-2016
Experience Variable Table
Years Practicing Consumer Law Average Attorney Hourly Rate
<1 200
1-3 200
3-5 225
6-10 392
11-15 480
16-20 725
21-25 600
26-30 617
31-35 650
36-40 565
41+ 400
202
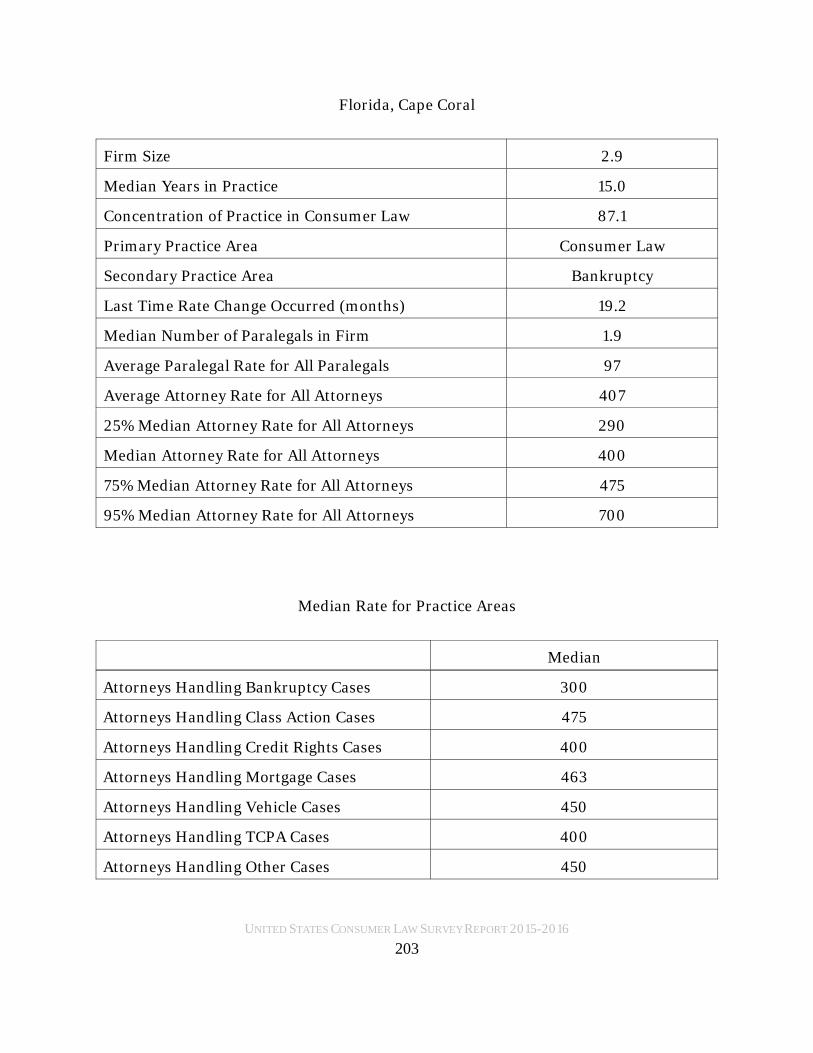
UNITED STATES CONSUMER LAW SURVEY REPORT 2015-2016
Florida, Cape Coral
Firm Size 2.9
Median Years in Practice 15.0
Concentration of Practice in Consumer Law 87.1
Primary Practice Area Consumer Law
Secondary Practice Area Bankruptcy
Last Time Rate Change Occurred (months) 19.2
Median Number of Paralegals in Firm 1.9
Average Paralegal Rate for All Paralegals 97
Average Attorney Rate for All Attorneys 407
25% Median Attorney Rate for All Attorneys 290
Median Attorney Rate for All Attorneys 400
75% Median Attorney Rate for All Attorneys 475
95% Median Attorney Rate for All Attorneys 700
Median Rate for Practice Areas
Median
Attorneys Handling Bankruptcy Cases 300
Attorneys Handling Class Action Cases 475
Attorneys Handling Credit Rights Cases 400
Attorneys Handling Mortgage Cases 463
Attorneys Handling Vehicle Cases 450
Attorneys Handling TCPA Cases 400
Attorneys Handling Other Cases 450
203

UNITED STATES CONSUMER LAW SURVEY REPORT 2015-2016
Experience Variable Table
Years Practicing Consumer Law Average Attorney Hourly Rate
<1 350
1-3 275
3-5 300
6-10 325
11-15 400
16-20 500
21-25 450
26-30 475
31-35 450
36-40 700
41+ 500
204

UNITED STATES CONSUMER LAW SURVEY REPORT 2015-2016
Florida, Jacksonville
Firm Size 3.2
Median Years in Practice 15.5
Concentration of Practice in Consumer Law 95.9
Primary Practice Area Consumer Law
Secondary Practice Area Real Estate
Last Time Rate Change Occurred (months) 19.4
Median Number of Paralegals in Firm 2.0
Average Paralegal Rate for All Paralegals 106
Average Attorney Rate for All Attorneys 445
25% Median Attorney Rate for All Attorneys 350
Median Attorney Rate for All Attorneys 450
75% Median Attorney Rate for All Attorneys 525
95% Median Attorney Rate for All Attorneys 725
Median Rate for Practice Areas
Median
Attorneys Handling Bankruptcy Cases 300
Attorneys Handling Class Action Cases 500
Attorneys Handling Credit Rights Cases 438
Attorneys Handling Mortgage Cases 438
Attorneys Handling Vehicle Cases 375
Attorneys Handling TCPA Cases 438
Attorneys Handling Other Cases 438
205
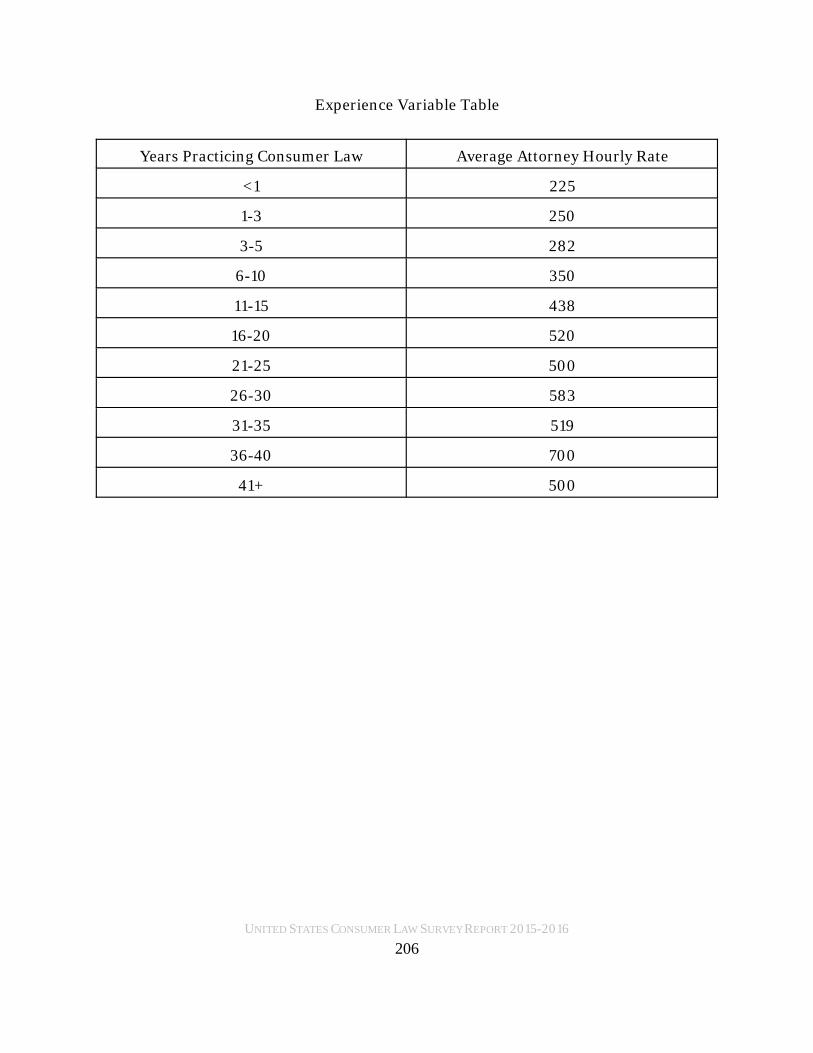
UNITED STATES CONSUMER LAW SURVEY REPORT 2015-2016
Experience Variable Table
Years Practicing Consumer Law Average Attorney Hourly Rate
<1 225
1-3 250
3-5 282
6-10 350
11-15 438
16-20 520
21-25 500
26-30 583
31-35 519
36-40 700
41+ 500
206

UNITED STATES CONSUMER LAW SURVEY REPORT 2015-2016
Florida, Miami - Fort Lauderdale
Firm Size 2.9
Median Years in Practice 15.0
Concentration of Practice in Consumer Law 95.9
Primary Practice Area Consumer Law
Secondary Practice Area Bankruptcy, Real Estate
Last Time Rate Change Occurred (months) 20.2
Median Number of Paralegals in Firm 3.0
Average Paralegal Rate for All Paralegals 95
Average Attorney Rate for All Attorneys 418
25% Median Attorney Rate for All Attorneys 325
Median Attorney Rate for All Attorneys 400
75% Median Attorney Rate for All Attorneys 525
95% Median Attorney Rate for All Attorneys 725
Median Rate for Practice Areas
Median
Attorneys Handling Bankruptcy Cases 300
Attorneys Handling Class Action Cases 475
Attorneys Handling Credit Rights Cases 400
Attorneys Handling Mortgage Cases 450
Attorneys Handling Vehicle Cases 375
Attorneys Handling TCPA Cases 400
Attorneys Handling Other Cases 363
207

UNITED STATES CONSUMER LAW SURVEY REPORT 2015-2016
Experience Variable Table
Years Practicing Consumer Law Average Attorney Hourly Rate
<1 350
1-3 283
3-5 281
6-10 335
11-15 400
16-20 456
21-25 475
26-30 533
31-35 542
36-40 700
41+ 500
208

UNITED STATES CONSUMER LAW SURVEY REPORT 2015-2016
Florida, Tallahassee
Firm Size 3.1
Median Years in Practice 17.5
Concentration of Practice in Consumer Law 70.6
Primary Practice Area Consumer Law
Secondary Practice Area Bankruptcy
Last Time Rate Change Occurred (months) 15.7
Median Number of Paralegals in Firm 2.0
Average Paralegal Rate for All Paralegals 114
Average Attorney Rate for All Attorneys 411
25% Median Attorney Rate for All Attorneys 399
Median Attorney Rate for All Attorneys 388
75% Median Attorney Rate for All Attorneys 525
95% Median Attorney Rate for All Attorneys 725
Median Rate for Practice Areas
Median
Attorneys Handling Bankruptcy Cases 300
Attorneys Handling Class Action Cases 525
Attorneys Handling Credit Rights Cases 413
Attorneys Handling Mortgage Cases 525
Attorneys Handling Vehicle Cases 325
Attorneys Handling TCPA Cases 500
Attorneys Handling Other Cases 400
209

UNITED STATES CONSUMER LAW SURVEY REPORT 2015-2016
Experience Variable Table
Years Practicing Consumer Law Average Attorney Hourly Rate
<1 210
1-3 250
3-5 260
6-10 325
11-15 438
16-20 425
21-25 409
26-30 575
31-35 610
36-40 700
41+ 500
210

UNITED STATES CONSUMER LAW SURVEY REPORT 2015-2016
Florida, Tampa
Firm Size 2.8
Median Years in Practice 16.0
Concentration of Practice in Consumer Law 80.7
Primary Practice Area Consumer Law
Secondary Practice Area Bankruptcy
Last Time Rate Change Occurred (months) 17.2
Median Number of Paralegals in Firm 3.0
Average Paralegal Rate for All Paralegals 101
Average Attorney Rate for All Attorneys 409
25% Median Attorney Rate for All Attorneys 300
Median Attorney Rate for All Attorneys 375
75% Median Attorney Rate for All Attorneys 500
95% Median Attorney Rate for All Attorneys 700
Median Rate for Practice Areas
Median
Attorneys Handling Bankruptcy Cases 300
Attorneys Handling Class Action Cases 500
Attorneys Handling Credit Rights Cases 400
Attorneys Handling Mortgage Cases 500
Attorneys Handling Vehicle Cases 375
Attorneys Handling TCPA Cases 363
Attorneys Handling Other Cases 388
211

UNITED STATES CONSUMER LAW SURVEY REPORT 2015-2016
Experience Variable Table
Years Practicing Consumer Law Average Attorney Hourly Rate
<1 225
1-3 250
3-5 258
6-10 350
11-15 392
16-20 456
21-25 455
6-30 519
31-35 590
36-40 700
41+ 500
212

UNITED STATES CONSUMER LAW SURVEY REPORT 2015-2016
Florida, Orlando
Firm Size 3.0
Median Years in Practice 12.0
Concentration of Practice in Consumer Law 95.4
Primary Practice Area Consumer Law
Secondary Practice Area Real Estate
Last Time Rate Change Occurred (months) 17.3
Median Number of Paralegals in Firm 1.5
Average Paralegal Rate for All Paralegals 103
Average Attorney Rate for All Attorneys 406
25% Median Attorney Rate for All Attorneys 300
Median Attorney Rate for All Attorneys 375
75% Median Attorney Rate for All Attorneys 500
95% Median Attorney Rate for All Attorneys 700
Median Rate for Practice Areas
Median
Attorneys Handling Bankruptcy Cases 263
Attorneys Handling Class Action Cases 500
Attorneys Handling Credit Rights Cases 388
Attorneys Handling Mortgage Cases 438
Attorneys Handling Vehicle Cases 375
Attorneys Handling TCPA Cases 350
Attorneys Handling Other Cases 388
213

UNITED STATES CONSUMER LAW SURVEY REPORT 2015-2016
Experience Variable Table
Years Practicing Consumer Law Average Attorney Hourly Rate
<1 200
1-3 250
3-5 258
6-10 350
11-15 400
16-20 467
21-25 494
26-30 538
31-35 555
36-40 700
41+ 500
214

UNITED STATES CONSUMER LAW SURVEY REPORT 2015-2016
Georgia, Atlanta
Firm Size 1.7
Median Years in Practice 21.2
Concentration of Practice in Consumer Law 86.5
Primary Practice Area Consumer Law
Secondary Practice Area General Practice
Last Time Rate Change Occurred (months) 17.6
Median Number of Paralegals in Firm 1.0
Average Paralegal Rate for All Paralegals 89
Average Attorney Rate for All Attorneys 349
25% Median Attorney Rate for All Attorneys 300
Median Attorney Rate for All Attorneys 325
75% Median Attorney Rate for All Attorneys 350
5% Median Attorney Rate for All Attorneys 675
Median Rate for Practice Areas
Median
Attorneys Handling Bankruptcy Cases 325
Attorneys Handling Class Action Cases 325
Attorneys Handling Credit Rights Cases 325
Attorneys Handling Mortgage Cases 338
Attorneys Handling Vehicle Cases 338
Attorneys Handling TCPA Cases 338
Attorneys Handling Other Cases 325
215

UNITED STATES CONSUMER LAW SURVEY REPORT 2015-2016
Experience Variable Table
Years Practicing Consumer Law Average Attorney Hourly Rate
<1 200
1-3 290
3-5 325
6-10 313
11-15 513
16-20 300
21-25 317
26-30 275
31-35 350
36-40 375
41+ 500
216

UNITED STATES CONSUMER LAW SURVEY REPORT 2015-2016
Georgia, Macon
Firm Size 2.0
Median Years in Practice 15.0
Concentration of Practice in Consumer Law 87.7
Primary Practice Area Consumer Law
Secondary Practice Area General Practice
Last Time Rate Change Occurred (months) 18.0
Median Number of Paralegals in Firm 1.7
Average Paralegal Rate for All Paralegals 107
Average Attorney Rate for All Attorneys 386
25% Median Attorney Rate for All Attorneys 275
Median Attorney Rate for All Attorneys 325
75% Median Attorney Rate for All Attorneys 550
5% Median Attorney Rate for All Attorneys 675
Median Rate for Practice Areas
Median
Attorneys Handling Bankruptcy Cases 325
Attorneys Handling Class Action Cases 338
Attorneys Handling Credit Rights Cases 325
Attorneys Handling Mortgage Cases 513
Attorneys Handling Vehicle Cases 350
Attorneys Handling TCPA Cases 338
Attorneys Handling Other Cases 325
217

UNITED STATES CONSUMER LAW SURVEY REPORT 2015-2016
Experience Variable Table
Years Practicing Consumer Law Average Attorney Hourly Rate
<1 200
1-3 290
3-5 325
6-10 300
11-15 513
16-20 300
21-25 317
26-30 275
31-35 300
36-40 375
41+ 500
218
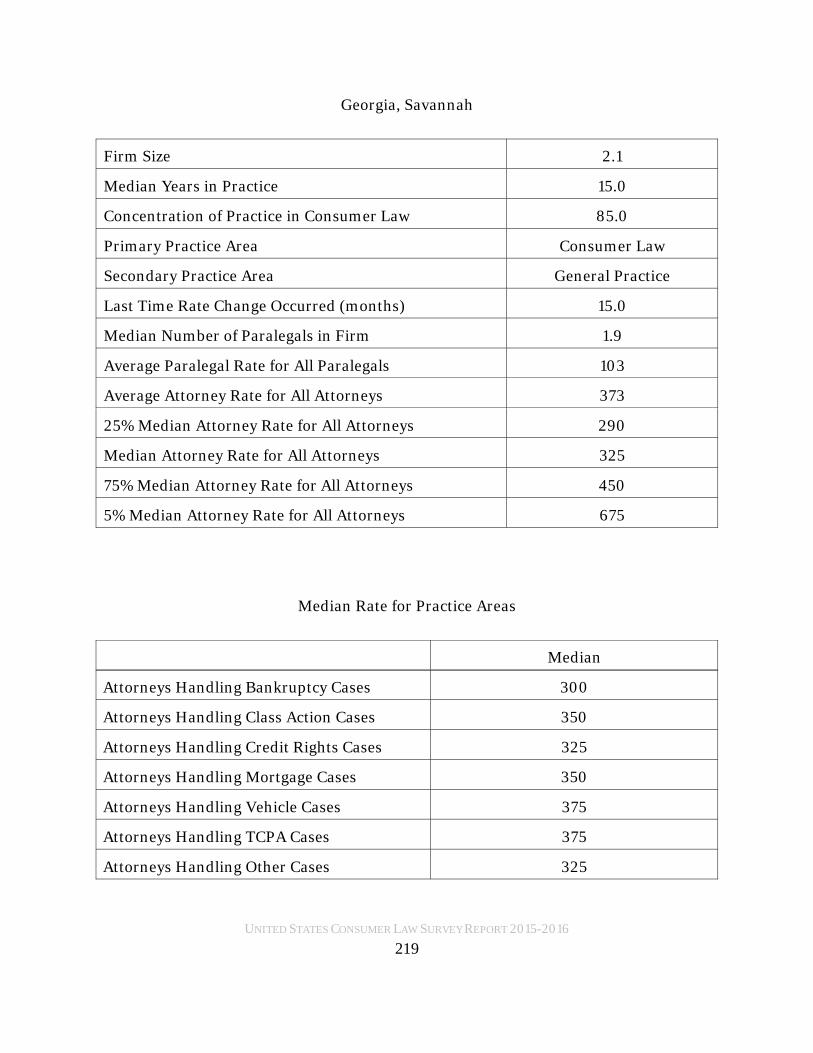
UNITED STATES CONSUMER LAW SURVEY REPORT 2015-2016
Georgia, Savannah
Firm Size 2.1
Median Years in Practice 15.0
Concentration of Practice in Consumer Law 85.0
Primary Practice Area Consumer Law
Secondary Practice Area General Practice
Last Time Rate Change Occurred (months) 15.0
Median Number of Paralegals in Firm 1.9
Average Paralegal Rate for All Paralegals 103
Average Attorney Rate for All Attorneys 373
25% Median Attorney Rate for All Attorneys 290
Median Attorney Rate for All Attorneys 325
75% Median Attorney Rate for All Attorneys 450
5% Median Attorney Rate for All Attorneys 675
Median Rate for Practice Areas
Median
Attorneys Handling Bankruptcy Cases 300
Attorneys Handling Class Action Cases 350
Attorneys Handling Credit Rights Cases 325
Attorneys Handling Mortgage Cases 350
Attorneys Handling Vehicle Cases 375
Attorneys Handling TCPA Cases 375
Attorneys Handling Other Cases 325
219

UNITED STATES CONSUMER LAW SURVEY REPORT 2015-2016
Experience Variable Table
Years Practicing Consumer Law Average Attorney Hourly Rate
<1 200
1-3 290
3-5 325
6-10 300
11-15 400
16-20 300
21-25 325
26-30 275
31-35 100
36-40 375
41+ 500
220

UNITED STATES CONSUMER LAW SURVEY REPORT 2015-2016
Hawaii, Honolulu
Firm Size 1.2
Median Years in Practice 16.0
Concentration of Practice in Consumer Law 58.8
Primary Practice Area Consumer Law
Secondary Practice Area Bankruptcy
Last Time Rate Change Occurred (months) 22.0
Median Number of Paralegals in Firm .5
Average Paralegal Rate for All Paralegals 50
Average Attorney Rate for All Attorneys 358
25% Median Attorney Rate for All Attorneys 290
Median Attorney Rate for All Attorneys 325
75% Median Attorney Rate for All Attorneys 450
95% Median Attorney Rate for All Attorneys 550
Median Rate for Practice Areas
Median
Attorneys Handling Bankruptcy Cases 300
Attorneys Handling Class Action Cases 450
Attorneys Handling Credit Rights Cases 350
Attorneys Handling Mortgage Cases 350
Attorneys Handling Vehicle Cases 300
Attorneys Handling TCPA Cases 450
Attorneys Handling Other Cases 350
221
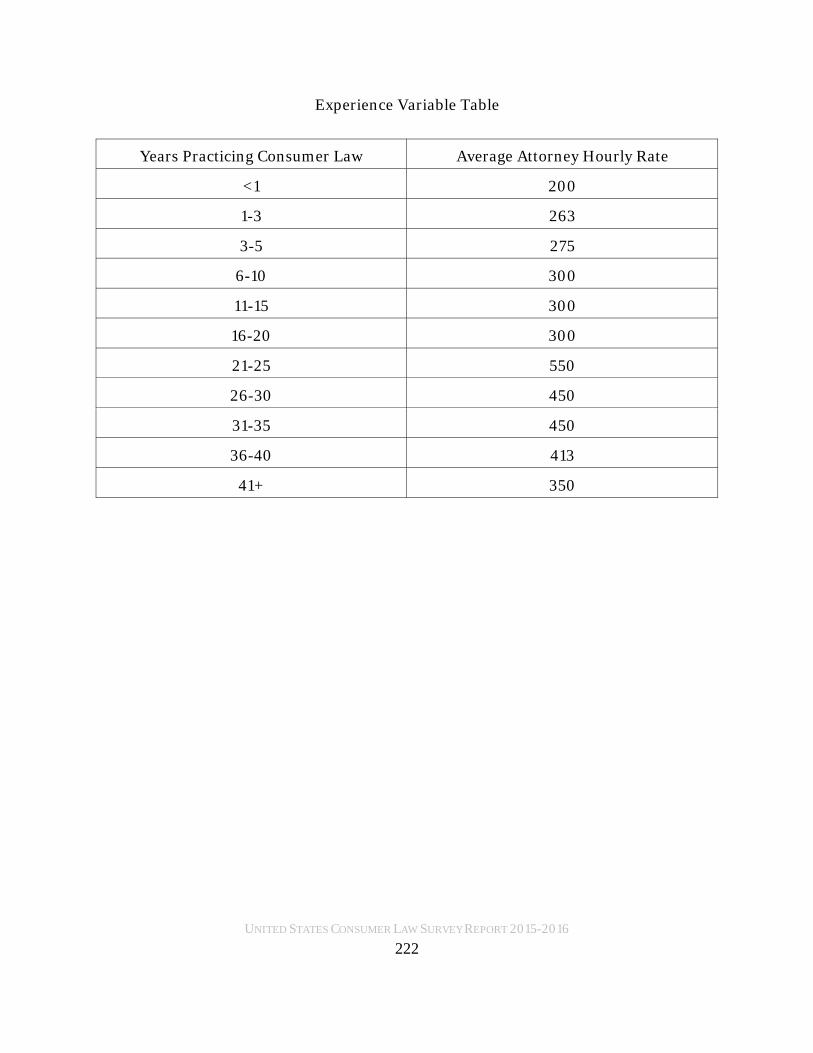
UNITED STATES CONSUMER LAW SURVEY REPORT 2015-2016
Experience Variable Table
Years Practicing Consumer Law Average Attorney Hourly Rate
<1 200
1-3 263
3-5 275
6-10 300
11-15 300
16-20 300
21-25 550
26-30 450
31-35 450
36-40 413
41+ 350
222

UNITED STATES CONSUMER LAW SURVEY REPORT 2015-2016
Illinois, Chicago
Firm Size 3.67
Median Years in Practice 15.5
Concentration of Practice in Consumer Law 93.3
Primary Practice Area Consumer Law
Secondary Practice Area Bankruptcy
Last Time Rate Change Occurred (months) 11.9
Median Number of Paralegals in Firm 3.0
Average Paralegal Rate for All Paralegals 113
Average Attorney Rate for All Attorneys 456
25% Median Attorney Rate for All Attorneys 350
Median Attorney Rate for All Attorneys 450
75% Median Attorney Rate for All Attorneys 600
95% Median Attorney Rate for All Attorneys 700
Median Rate for Practice Areas
Median
Attorneys Handling Bankruptcy Cases 388
Attorneys Handling Class Action Cases 510
Attorneys Handling Credit Rights Cases 475
Attorneys Handling Mortgage Cases 475
Attorneys Handling Vehicle Cases 450
Attorneys Handling TCPA Cases 500
Attorneys Handling Other Cases 475
223

UNITED STATES CONSUMER LAW SURVEY REPORT 2015-2016
Experience Variable Table
Years Practicing Consumer Law Average Attorney Hourly Rate
<1 250
1-3 300
3-5 305
6-10 429
11-15 447
16-20 525
21-25 515
26-30 563
31-35 300
36-40 575
41+ 650
224

UNITED STATES CONSUMER LAW SURVEY REPORT 2015-2016
Illinois, Springfield
Firm Size 3.75
Median Years in Practice 14.5
Concentration of Practice in Consumer Law 98.0
Primary Practice Area Consumer Law
Secondary Practice Area Securities Law
Last Time Rate Change Occurred (months) 11.1
Median Number of Paralegals in Firm 3.25
Average Paralegal Rate for All Paralegals 143
Average Attorney Rate for All Attorneys 486
25% Median Attorney Rate for All Attorneys 325
Median Attorney Rate for All Attorneys 463
75% Median Attorney Rate for All Attorneys 650
95% Median Attorney Rate for All Attorneys 725
Median Rate for Practice Areas
Median
Attorneys Handling Bankruptcy Cases 388-
Attorneys Handling Class Action Cases 600
Attorneys Handling Credit Rights Cases 500
Attorneys Handling Mortgage Cases 700
Attorneys Handling Vehicle Cases 450
Attorneys Handling TCPA Cases 500
Attorneys Handling Other Cases 425
225

UNITED STATES CONSUMER LAW SURVEY REPORT 2015-2016
Experience Variable Table
Years Practicing Consumer Law Average Attorney Hourly Rate
<1 250
1-3 275
3-5 300
6-10 325
11-15 475
16-20 463
21-25 475
26-30 600
31-35 600
36-40 700
41+ 650
226

UNITED STATES CONSUMER LAW SURVEY REPORT 2015-2016
Illinois, St Louis Metro East
Firm Size 3.85
Median Years in Practice 19.0
Concentration of Practice in Consumer Law 98.8
Primary Practice Area Consumer Law
Secondary Practice Area Bankruptcy
Last Time Rate Change Occurred (months) 11.1
Median Number of Paralegals in Firm 4.0
Average Paralegal Rate for All Paralegals 145
Average Attorney Rate for All Attorneys 520
25% Median Attorney Rate for All Attorneys 425
Median Attorney Rate for All Attorneys 500
75% Median Attorney Rate for All Attorneys 675
95% Median Attorney Rate for All Attorneys 725
Median Rate for Practice Areas
Median
Attorneys Handling Bankruptcy Cases 500
Attorneys Handling Class Action Cases 625
Attorneys Handling Credit Rights Cases 600
Attorneys Handling Mortgage Cases 700
Attorneys Handling Vehicle Cases 450
Attorneys Handling TCPA Cases 600
Attorneys Handling Other Cases 463
227

UNITED STATES CONSUMER LAW SURVEY REPORT 2015-2016
Experience Variable Table
Years Practicing Consumer Law Average Attorney Hourly Rate
<1 185
1-3 225
3-5 275
6-10 450
11-15 494
16-20 513
21-25 500
26-30 563
31-35 600
36-40 700
41+ 550
228

UNITED STATES CONSUMER LAW SURVEY REPORT 2015-2016
Indiana, Fort Wayne
Firm Size 2.9
Median Years in Practice 28.0
Concentration of Practice in Consumer Law 92.9
Primary Practice Area Consumer Law
Secondary Practice Area Bankruptcy
Last Time Rate Change Occurred (months) 13.3
Median Number of Paralegals in Firm 3.0
Average Paralegal Rate for All Paralegals 122
Average Attorney Rate for All Attorneys 498
25% Median Attorney Rate for All Attorneys 425
Median Attorney Rate for All Attorneys 463
75% Median Attorney Rate for All Attorneys 600
95% Median Attorney Rate for All Attorneys 700
Median Rate for Practice Areas
Median
Attorneys Handling Bankruptcy Cases 450
Attorneys Handling Class Action Cases 563
Attorneys Handling Credit Rights Cases 500
Attorneys Handling Mortgage Cases 613
Attorneys Handling Vehicle Cases 450
Attorneys Handling TCPA Cases 500
Attorneys Handling Other Cases 563
229

UNITED STATES CONSUMER LAW SURVEY REPORT 2015-2016
Experience Variable Table
Years Practicing Consumer Law Average Attorney Hourly Rate
<1 245
1-3 275
3-5 310
6-10 313
11-15 450
16-20 450
21-25 350
26-30 600
31-35 600
36-40 550
41+ 300
230

UNITED STATES CONSUMER LAW SURVEY REPORT 2015-2016
Indiana, Gary - Hammond
Firm Size 2.8
Median Years in Practice 28.0
Concentration of Practice in Consumer Law 97.7
Primary Practice Area Consumer Law
Secondary Practice Area General Practice
Last Time Rate Change Occurred (months) 12.5
Median Number of Paralegals in Firm 2.6
Average Paralegal Rate for All Paralegals 129
Average Attorney Rate for All Attorneys 502
25% Median Attorney Rate for All Attorneys 425
Median Attorney Rate for All Attorneys 475
5% Median Attorney Rate for All Attorneys 600
95% Median Attorney Rate for All Attorneys 700
Median Rate for Practice Areas
Median
Attorneys Handling Bankruptcy Cases 450
Attorneys Handling Class Action Cases 563
Attorneys Handling Credit Rights Cases 525
Attorneys Handling Mortgage Cases 613
Attorneys Handling Vehicle Cases 450
Attorneys Handling TCPA Cases 525
Attorneys Handling Other Cases 563
231

UNITED STATES CONSUMER LAW SURVEY REPORT 2015-2016
Experience Variable Table
Years Practicing Consumer Law Average Attorney Hourly Rate
<1 225
1-3 275
3-5 310
6-10 313
11-15 450
16-20 450
21-25 350
26-30 600
31-35 600
36-40 550
41+ 300
232

UNITED STATES CONSUMER LAW SURVEY REPORT 2015-2016
Indiana, Indianapolis
Firm Size 2.3
Median Years in Practice 28.0
Concentration of Practice in Consumer Law 94.3
Primary Practice Area Consumer Law
Secondary Practice Area Personal Injury
Last Time Rate Change Occurred (months) 12.0
Median Number of Paralegals in Firm 2.0
Average Paralegal Rate for All Paralegals 73
Average Attorney Rate for All Attorneys 475
25% Median Attorney Rate for All Attorneys 375
Median Attorney Rate for All Attorneys 450
5% Median Attorney Rate for All Attorneys 600
95% Median Attorney Rate for All Attorneys 700
Median Rate for Practice Areas
Median
Attorneys Handling Bankruptcy Cases 450
Attorneys Handling Class Action Cases 450
Attorneys Handling Credit Rights Cases 450
Attorneys Handling Mortgage Cases 488
Attorneys Handling Vehicle Cases 450
Attorneys Handling TCPA Cases 450
Attorneys Handling Other Cases 563
233

UNITED STATES CONSUMER LAW SURVEY REPORT 2015-2016
Experience Variable Table
Years Practicing Consumer Law Average Attorney Hourly Rate
<1 225
1-3 275
3-5 310
6-10 313
11-15 450
16-20 450
21-25 350
26-30 525
31-35 600
36-40 550
41+ 560
234

UNITED STATES CONSUMER LAW SURVEY REPORT 2015-2016
Indiana, South Bend - Elkhart - Mishawaka
Firm Size 2.4
Median Years in Practice 28.0
Concentration of Practice in Consumer Law 95.0
Primary Practice Area Consumer Law
Secondary Practice Area Personal Injury
Last Time Rate Change Occurred (months) 12.0
Median Number of Paralegals in Firm 1.5
Average Paralegal Rate for All Paralegals 111
Average Attorney Rate for All Attorneys 485
25% Median Attorney Rate for All Attorneys 400
Median Attorney Rate for All Attorneys 450
75% Median Attorney Rate for All Attorneys 600
95% Median Attorney Rate for All Attorneys 700
Median Rate for Practice Areas
Median
Attorneys Handling Bankruptcy Cases 450
Attorneys Handling Class Action Cases 475
Attorneys Handling Credit Rights Cases 463
Attorneys Handling Mortgage Cases 450
Attorneys Handling Vehicle Cases 450
Attorneys Handling TCPA Cases 450
Attorneys Handling Other Cases 563
235

UNITED STATES CONSUMER LAW SURVEY REPORT 2015-2016
Experience Variable Table
Years Practicing Consumer Law Average Attorney Hourly Rate
<1 255
1-3 275
3-5 310
6-10 313
11-15 450
16-20 450
21-25 350
26-30 563
31-35 600
36-40 550
41+ 560
236
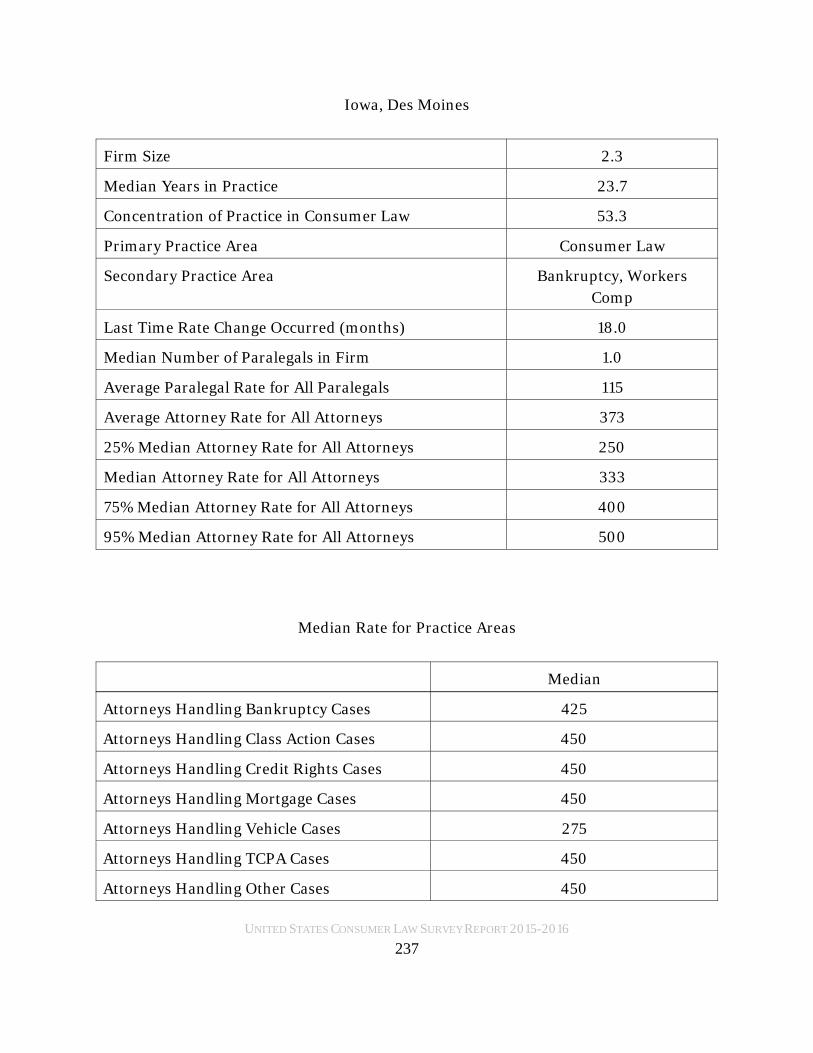
UNITED STATES CONSUMER LAW SURVEY REPORT 2015-2016
Iowa, Des Moines
Firm Size 2.3
Median Years in Practice 23.7
Concentration of Practice in Consumer Law 53.3
Primary Practice Area Consumer Law
Secondary Practice Area Bankruptcy, Workers
Comp
Last Time Rate Change Occurred (months) 18.0
Median Number of Paralegals in Firm 1.0
Average Paralegal Rate for All Paralegals 115
Average Attorney Rate for All Attorneys 373
25% Median Attorney Rate for All Attorneys 250
Median Attorney Rate for All Attorneys 333
75% Median Attorney Rate for All Attorneys 400
95% Median Attorney Rate for All Attorneys 500
Median Rate for Practice Areas
Median
Attorneys Handling Bankruptcy Cases 425
Attorneys Handling Class Action Cases 450
Attorneys Handling Credit Rights Cases 450
Attorneys Handling Mortgage Cases 450
Attorneys Handling Vehicle Cases 275
Attorneys Handling TCPA Cases 450
Attorneys Handling Other Cases 450
237
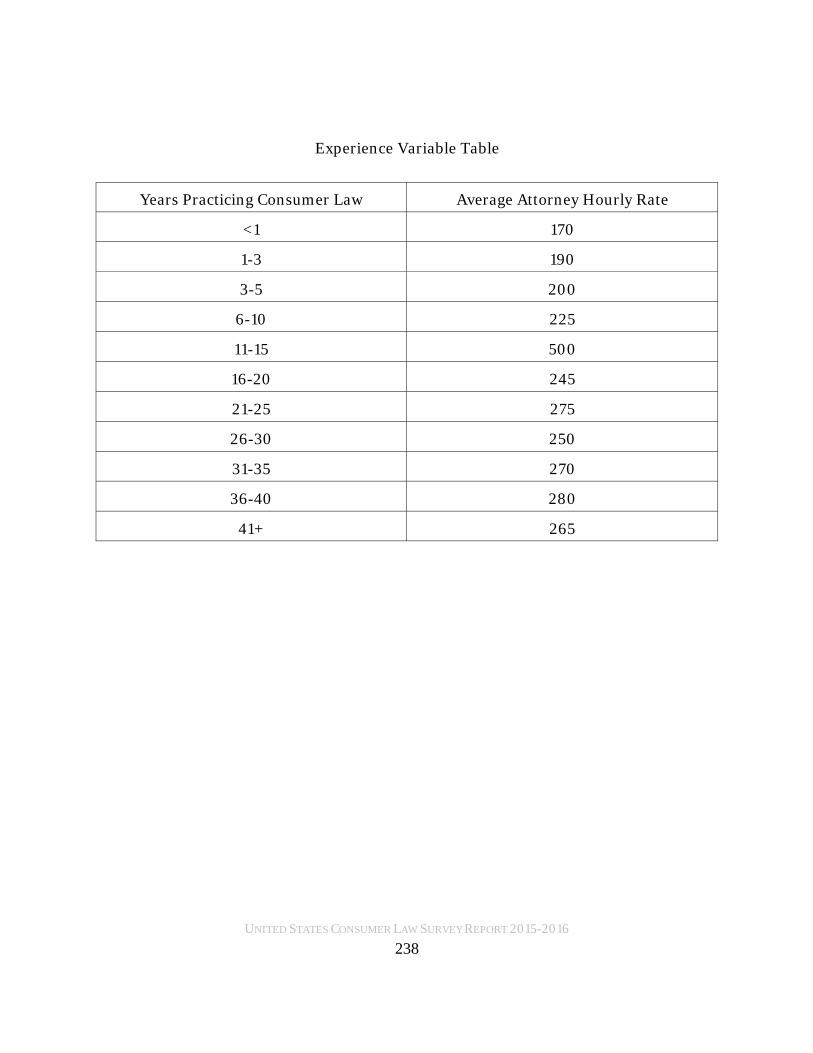
UNITED STATES CONSUMER LAW SURVEY REPORT 2015-2016
Experience Variable Table
Years Practicing Consumer Law Average Attorney Hourly Rate
<1 170
1-3 190
3-5 200
6-10 225
11-15 500
16-20 245
21-25 275
26-30 250
31-35 270
36-40 280
41+ 265
238

UNITED STATES CONSUMER LAW SURVEY REPORT 2015-2016
Iowa, Dubuque
Firm Size 2.0
Median Years in Practice 24.0
Concentration of Practice in Consumer Law 50.0
Primary Practice Area Consumer Law
Secondary Practice Area Bankruptcy
Last Time Rate Change Occurred (months) 16.8
Median Number of Paralegals in Firm 1.0
Average Paralegal Rate for All Paralegals 104
Average Attorney Rate for All Attorneys 315
25% Median Attorney Rate for All Attorneys 240
Median Attorney Rate for All Attorneys 250
75% Median Attorney Rate for All Attorneys 400
95% Median Attorney Rate for All Attorneys 500
Median Rate for Practice Areas
Median
Attorneys Handling Bankruptcy Cases 250
Attorneys Handling Class Action Cases 325
Attorneys Handling Credit Rights Cases 325
Attorneys Handling Mortgage Cases 325
Attorneys Handling Vehicle Cases 275
Attorneys Handling TCPA Cases 500
Attorneys Handling Other Cases 325
239

UNITED STATES CONSUMER LAW SURVEY REPORT 2015-2016
Experience Variable Table
Years Practicing Consumer Law Average Attorney Hourly Rate
<1 170
1-3 190
3-5 200
6-10 240
11-15 500
16-20 245
21-25 288
26-30 250
31-35 250
36-40 280
41+ 265
240

UNITED STATES CONSUMER LAW SURVEY REPORT 2015-2016
Kansas, Kansas City
Firm Size 3.2
Median Years in Practice 5.0
Concentration of Practice in Consumer Law 96.7
Primary Practice Area Consumer Law
Secondary Practice Area Bankruptcy
Last Time Rate Change Occurred (months) 10.7
Median Number of Paralegals in Firm 1.2
Average Paralegal Rate for All Paralegals 130
Average Attorney Rate for All Attorneys 400
25% Median Attorney Rate for All Attorneys 315
Median Attorney Rate for All Attorneys 400
75% Median Attorney Rate for All Attorneys 500
95% Median Attorney Rate for All Attorneys 725
Median Rate for Practice Areas
Median
Attorneys Handling Bankruptcy Cases 200
Attorneys Handling Class Action Cases 350
Attorneys Handling Credit Rights Cases 350
Attorneys Handling Mortgage Cases 350
Attorneys Handling Vehicle Cases 325
Attorneys Handling TCPA Cases 350
Attorneys Handling Other Cases 350
241
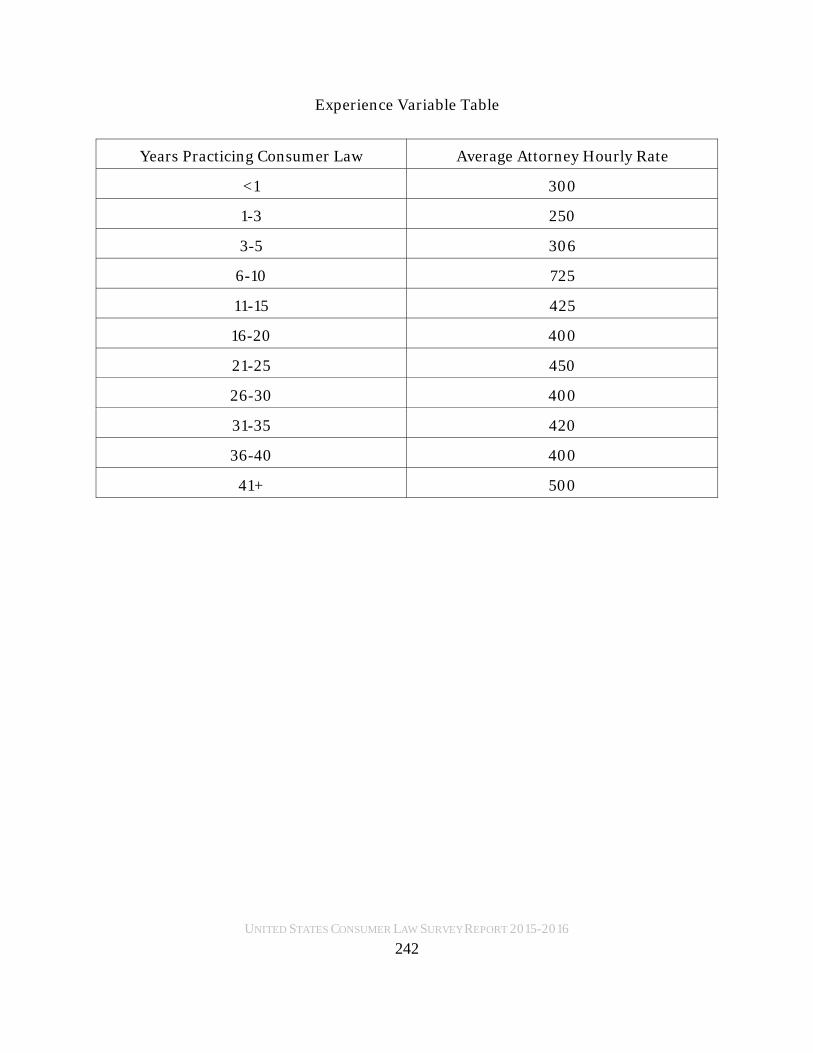
UNITED STATES CONSUMER LAW SURVEY REPORT 2015-2016
Experience Variable Table
Years Practicing Consumer Law Average Attorney Hourly Rate
<1 300
1-3 250
3-5 306
6-10 725
11-15 425
16-20 400
21-25 450
26-30 400
31-35 420
36-40 400
41+ 500
242

UNITED STATES CONSUMER LAW SURVEY REPORT 2015-2016
Kansas, Wichita
Firm Size 3.0
Median Years in Practice 16.8
Concentration of Practice in Consumer Law 96.0
Primary Practice Area Consumer Law
Secondary Practice Area General Practice
Last Time Rate Change Occurred (months) 9.6
Median Number of Paralegals in Firm 1.4
Average Paralegal Rate for All Paralegals 148
Average Attorney Rate for All Attorneys 485
25% Median Attorney Rate for All Attorneys 300
Median Attorney Rate for All Attorneys 500
75% Median Attorney Rate for All Attorneys 575
95% Median Attorney Rate for All Attorneys 725
Median Rate for Practice Areas
Median
Attorneys Handling Bankruptcy Cases 500
Attorneys Handling Class Action Cases 425
Attorneys Handling Credit Rights Cases 500
Attorneys Handling Mortgage Cases 500
Attorneys Handling Vehicle Cases 350
Attorneys Handling TCPA Cases 425
Attorneys Handling Other Cases 350
243

UNITED STATES CONSUMER LAW SURVEY REPORT 2015-2016
Experience Variable Table
Years Practicing Consumer Law Average Attorney Hourly Rate
<1 190
1-3 225
3-5 350
6-10 725
11-15 425
16-20 400
21-25 450
26-30 450
31-35 475
36-40 410
41+ 500
244

UNITED STATES CONSUMER LAW SURVEY REPORT 2015-2016
Kentucky, Lexington
Firm Size 2.5
Median Years in Practice 12.0
Concentration of Practice in Consumer Law 92.5
Primary Practice Area Consumer Law
Secondary Practice Area General Practice
Last Time Rate Change Occurred (months) 12.0
Median Number of Paralegals in Firm 2.75
Average Paralegal Rate for All Paralegals 110
Average Attorney Rate for All Attorneys 375
25% Median Attorney Rate for All Attorneys 200
Median Attorney Rate for All Attorneys 350
75% Median Attorney Rate for All Attorneys 475
95% Median Attorney Rate for All Attorneys 600
Median Rate for Practice Areas
Median
Attorneys Handling Bankruptcy Cases 200
Attorneys Handling Class Action Cases 475
Attorneys Handling Credit Rights Cases 275
Attorneys Handling Mortgage Cases 200
Attorneys Handling Vehicle Cases 350
Attorneys Handling TCPA Cases 200
Attorneys Handling Other Cases 600
245
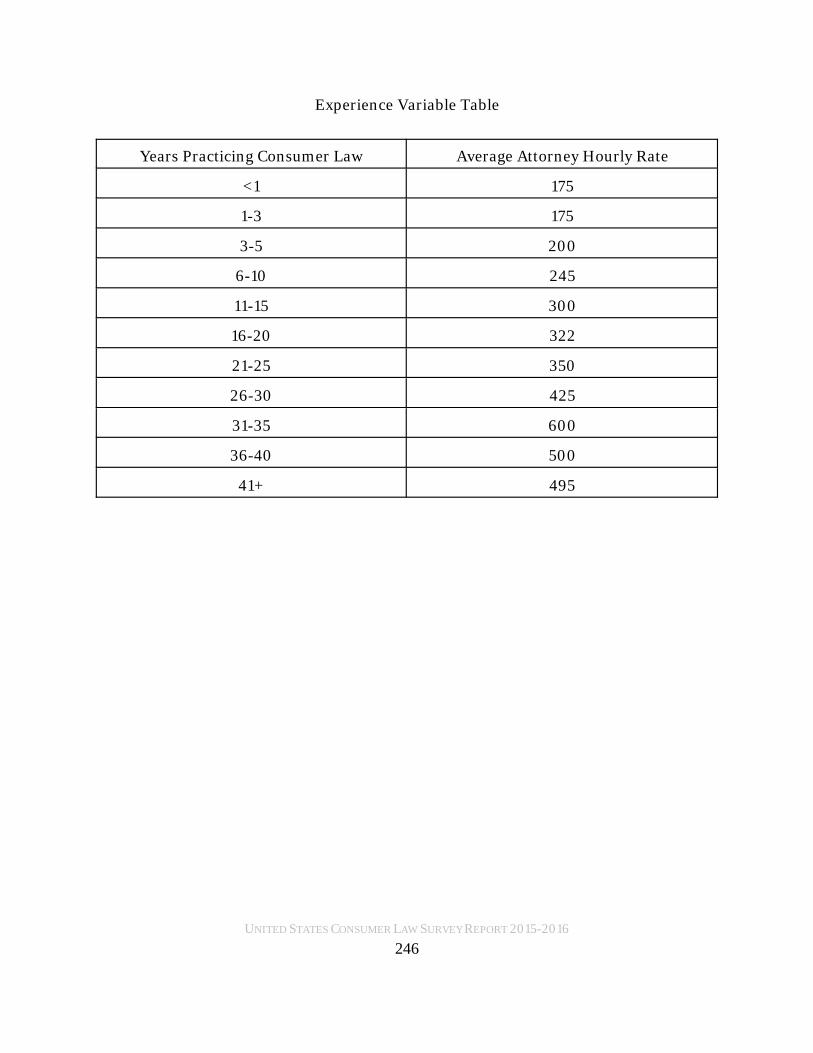
UNITED STATES CONSUMER LAW SURVEY REPORT 2015-2016
Experience Variable Table
Years Practicing Consumer Law Average Attorney Hourly Rate
<1 175
1-3 175
3-5 200
6-10 245
11-15 300
16-20 322
21-25 350
26-30 425
31-35 600
36-40 500
41+ 495
246

UNITED STATES CONSUMER LAW SURVEY REPORT 2015-2016
Kentucky, Louisville
Firm Size 2.25
Median Years in Practice 31.0
Concentration of Practice in Consumer Law 85.5
Primary Practice Area Consumer Law
Secondary Practice Area Bankruptcy
Last Time Rate Change Occurred (months) 24.0
Median Number of Paralegals in Firm 2.0
Average Paralegal Rate for All Paralegals 98
Average Attorney Rate for All Attorneys 325
25% Median Attorney Rate for All Attorneys 225
Median Attorney Rate for All Attorneys 368
75% Median Attorney Rate for All Attorneys 450
95% Median Attorney Rate for All Attorneys 600
Median Rate for Practice Areas
Median
Attorneys Handling Bankruptcy Cases 225
Attorneys Handling Class Action Cases 450
Attorneys Handling Credit Rights Cases 300
Attorneys Handling Mortgage Cases 225
Attorneys Handling Vehicle Cases 325
Attorneys Handling TCPA Cases 325
Attorneys Handling Other Cases 600
247

UNITED STATES CONSUMER LAW SURVEY REPORT 2015-2016
Experience Variable Table
Years Practicing Consumer Law Average Attorney Hourly Rate
<1 175
1-3 205
3-5 255
6-10 295
11-15 350
16-20 362
21-25 380
26-30 410
31-35 413
36-40 400
41+ 300
248

UNITED STATES CONSUMER LAW SURVEY REPORT 2015-2016
Louisiana, Shreveport
Firm Size 2.0
Median Years in Practice 10.0
Concentration of Practice in Consumer Law 76.7
Primary Practice Area Bankruptcy
Secondary Practice Area Consumer Law
Last Time Rate Change Occurred (months) 16.0
Median Number of Paralegals in Firm 1.7
Average Paralegal Rate for All Paralegals 120
Average Attorney Rate for All Attorneys 433
25% Median Attorney Rate for All Attorneys 380
Median Attorney Rate for All Attorneys 400
75% Median Attorney Rate for All Attorneys 450
95% Median Attorney Rate for All Attorneys 500
Median Rate for Practice Areas
Median
Attorneys Handling Bankruptcy Cases 400
Attorneys Handling Class Action Cases 400
Attorneys Handling Credit Rights Cases 400
Attorneys Handling Mortgage Cases 400
Attorneys Handling Vehicle Cases 400
Attorneys Handling TCPA Cases 400
Attorneys Handling Other Cases 400
249

UNITED STATES CONSUMER LAW SURVEY REPORT 2015-2016
Experience Variable Table
Years Practicing Consumer Law Average Attorney Hourly Rate
<1 170
1-3 175
3-5 220
6-10 400
11-15 350
16-20 350
21-25 385
26-30 405
31-35 425
36-40 490
41+ 500
250

UNITED STATES CONSUMER LAW SURVEY REPORT 2015-2016
Maryland, Baltimore
Firm Size 2.5
Median Years in Practice 16.0
Concentration of Practice in Consumer Law 61.0
Primary Practice Area Consumer Law
Secondary Practice Area Bankruptcy
Last Time Rate Change Occurred (months) 12.0
Median Number of Paralegals in Firm 2.5
Average Paralegal Rate for All Paralegals 113
Average Attorney Rate for All Attorneys 420
25% Median Attorney Rate for All Attorneys 275
Median Attorney Rate for All Attorneys 450
75% Median Attorney Rate for All Attorneys 525
95% Median Attorney Rate for All Attorneys 613
Median Rate for Practice Areas
Median
Attorneys Handling Bankruptcy Cases 425
Attorneys Handling Class Action Cases 450
Attorneys Handling Credit Rights Cases 450
Attorneys Handling Mortgage Cases 450
Attorneys Handling Vehicle Cases 275
Attorneys Handling TCPA Cases 450
Attorneys Handling Other Cases 450
251

UNITED STATES CONSUMER LAW SURVEY REPORT 2015-2016
Experience Variable Table
Years Practicing Consumer Law Average Attorney Hourly Rate
<1 200
1-3 225
3-5 225
6-10 375
11-15 513
16-20 450
21-25 550
26-30 388
31-35 500
36-40 400
41+ 425
252

UNITED STATES CONSUMER LAW SURVEY REPORT 2015-2016
Massachusetts, Boston - Cambridge
Firm Size 2.6
Median Years in Practice 27.0
Concentration of Practice in Consumer Law 80.0
Primary Practice Area Consumer Law
Secondary Practice Area Bankruptcy
Last Time Rate Change Occurred (months) 15.8
Median Number of Paralegals in Firm 1.3
Average Paralegal Rate for All Paralegals 97
Average Attorney Rate for All Attorneys 463
25% Median Attorney Rate for All Attorneys 325
Median Attorney Rate for All Attorneys 400
75% Median Attorney Rate for All Attorneys 663
95% Median Attorney Rate for All Attorneys 700
Median Rate for Practice Areas
Median
Attorneys Handling Bankruptcy Cases 350
Attorneys Handling Class Action Cases 600
Attorneys Handling Credit Rights Cases 400
Attorneys Handling Mortgage Cases 625
Attorneys Handling Vehicle Cases 375
Attorneys Handling TCPA Cases 500
Attorneys Handling Other Cases 500
253

UNITED STATES CONSUMER LAW SURVEY REPORT 2015-2016
Experience Variable Table
Years Practicing Consumer Law Average Attorney Hourly Rate
<1 200
1-3 245
3-5 263
6-10 250
11-15 400
16-20 410
21-25 363
26-30 575
31-35 600
36-40 525
41+ 500
254

UNITED STATES CONSUMER LAW SURVEY REPORT 2015-2016
Massachusetts, Springfield
Firm Size 2.8
Median Years in Practice 32.0
Concentration of Practice in Consumer Law 81.0
Primary Practice Area Consumer Law
Secondary Practice Area Bankruptcy
Last Time Rate Change Occurred (months) 13.8
Median Number of Paralegals in Firm 3.0
Average Paralegal Rate for All Paralegals 136
Average Attorney Rate for All Attorneys 538
25% Median Attorney Rate for All Attorneys 375
Median Attorney Rate for All Attorneys 600
75% Median Attorney Rate for All Attorneys 675
95% Median Attorney Rate for All Attorneys 725
Median Rate for Practice Areas
Median
Attorneys Handling Bankruptcy Cases 350
Attorneys Handling Class Action Cases 625
Attorneys Handling Credit Rights Cases 600
Attorneys Handling Mortgage Cases 675
Attorneys Handling Vehicle Cases 500
Attorneys Handling TCPA Cases 550
Attorneys Handling Other Cases 600
255

UNITED STATES CONSUMER LAW SURVEY REPORT 2015-2016
Experience Variable Table
Years Practicing Consumer Law Average Attorney Hourly Rate
<1 200
1-3 245
3-5 263
6-10 225
11-15 675
16-20 410
21-25 350
26-30 663
31-35 600
36-40 625
41+ 500
256

UNITED STATES CONSUMER LAW SURVEY REPORT 2015-2016
Michigan, Detroit
Firm Size 2.9
Median Years in Practice 13.5
Concentration of Practice in Consumer Law 92.8
Primary Practice Area Consumer Law
Secondary Practice Area Bankruptcy
Last Time Rate Change Occurred (months) 21.0
Median Number of Paralegals in Firm 1.9
Average Paralegal Rate for All Paralegals 89
Average Attorney Rate for All Attorneys 342
25% Median Attorney Rate for All Attorneys 238
Median Attorney Rate for All Attorneys 300
75% Median Attorney Rate for All Attorneys 375
95% Median Attorney Rate for All Attorneys 700
Median Rate for Practice Areas
Median
Attorneys Handling Bankruptcy Cases 263
Attorneys Handling Class Action Cases 350
Attorneys Handling Credit Rights Cases 325
Attorneys Handling Mortgage Cases 683
Attorneys Handling Vehicle Cases 300
Attorneys Handling TCPA Cases 338
Attorneys Handling Other Cases 225
257

UNITED STATES CONSUMER LAW SURVEY REPORT 2015-2016
Experience Variable Table
Years Practicing Consumer Law Average Attorney Hourly Rate
<1 200
1-3 231
3-5 263
6-10 263
11-15 444
16-20 350
21-25 325
26-30 445
31-35 475
36-40 500
41+ 225
258
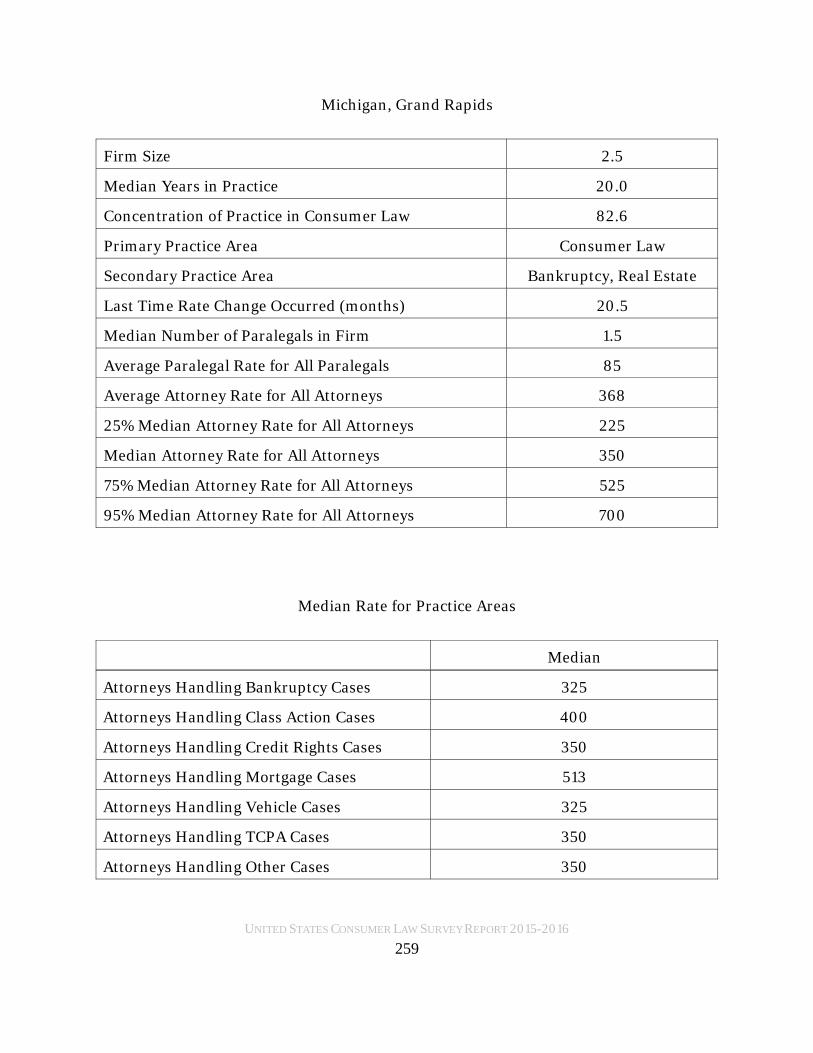
UNITED STATES CONSUMER LAW SURVEY REPORT 2015-2016
Michigan, Grand Rapids
Firm Size 2.5
Median Years in Practice 20.0
Concentration of Practice in Consumer Law 82.6
Primary Practice Area Consumer Law
Secondary Practice Area Bankruptcy, Real Estate
Last Time Rate Change Occurred (months) 20.5
Median Number of Paralegals in Firm 1.5
Average Paralegal Rate for All Paralegals 85
Average Attorney Rate for All Attorneys 368
25% Median Attorney Rate for All Attorneys 225
Median Attorney Rate for All Attorneys 350
75% Median Attorney Rate for All Attorneys 525
95% Median Attorney Rate for All Attorneys 700
Median Rate for Practice Areas
Median
Attorneys Handling Bankruptcy Cases 325
Attorneys Handling Class Action Cases 400
Attorneys Handling Credit Rights Cases 350
Attorneys Handling Mortgage Cases 513
Attorneys Handling Vehicle Cases 325
Attorneys Handling TCPA Cases 350
Attorneys Handling Other Cases 350
259

UNITED STATES CONSUMER LAW SURVEY REPORT 2015-2016
Experience Variable Table
Years Practicing Consumer Law Average Attorney Hourly Rate
<1 200
1-3 200
3-5 275
6-10 306
11-15 492
16-20 319
21-25 425
26-30 450
31-35 400
36-40 458
41+ 225
260

UNITED STATES CONSUMER LAW SURVEY REPORT 2015-2016
Michigan, Lansing
Firm Size 2.3
Median Years in Practice 20.0
Concentration of Practice in Consumer Law 92.8
Primary Practice Area Consumer Law
Secondary Practice Area General Practice
Last Time Rate Change Occurred (months) 24.7
Median Number of Paralegals in Firm 1.5
Average Paralegal Rate for All Paralegals 85
Average Attorney Rate for All Attorneys 379
25% Median Attorney Rate for All Attorneys 300
Median Attorney Rate for All Attorneys 350
75% Median Attorney Rate for All Attorneys 425
95% Median Attorney Rate for All Attorneys 700
Median Rate for Practice Areas
Median
Attorneys Handling Bankruptcy Cases 275
Attorneys Handling Class Action Cases 400
Attorneys Handling Credit Rights Cases 350
Attorneys Handling Mortgage Cases 513
Attorneys Handling Vehicle Cases 350
Attorneys Handling TCPA Cases 363
Attorneys Handling Other Cases 225
261

UNITED STATES CONSUMER LAW SURVEY REPORT 2015-2016
Experience Variable Table
Years Practicing Consumer Law Average Attorney Hourly Rate
<1 200
1-3 275
3-5 275
6-10 350
11-15 444
16-20 319
21-25 400
26-30 450
31-35 475
36-40 458
41+ 225
262

UNITED STATES CONSUMER LAW SURVEY REPORT 2015-2016
Michigan, Marquette
Firm Size 2.6
Median Years in Practice 20.0
Concentration of Practice in Consumer Law 96.3
Primary Practice Area Consumer Law
Secondary Practice Area General Practice
Last Time Rate Change Occurred (months) 27.4
Median Number of Paralegals in Firm 1.9
Average Paralegal Rate for All Paralegals 72
Average Attorney Rate for All Attorneys 403
25% Median Attorney Rate for All Attorneys 300
Median Attorney Rate for All Attorneys 375
75% Median Attorney Rate for All Attorneys 450
95% Median Attorney Rate for All Attorneys 700
Median Rate for Practice Areas
Median
Attorneys Handling Bankruptcy Cases 275
Attorneys Handling Class Action Cases 450
Attorneys Handling Credit Rights Cases 425
Attorneys Handling Mortgage Cases 500
Attorneys Handling Vehicle Cases 350
Attorneys Handling TCPA Cases 425
Attorneys Handling Other Cases 375
263

UNITED STATES CONSUMER LAW SURVEY REPORT 2015-2016
Experience Variable Table
Years Practicing Consumer Law Average Attorney Hourly Rate
<1 200
1-3 275
3-5 275
6-10 350
11-15 444
16-20 319
21-25 400
26-30 450
31-35 475
36-40 458
41+ 225
264

UNITED STATES CONSUMER LAW SURVEY REPORT 2015-2016
Minnesota, Minneapolis - St Paul
Firm Size 2.4
Median Years in Practice 12.5
Concentration of Practice in Consumer Law 92.5
Primary Practice Area Consumer Law
Secondary Practice Area Bankruptcy
Last Time Rate Change Occurred (months) 9.8
Median Number of Paralegals in Firm 1.5
Average Paralegal Rate for All Paralegals 98
Average Attorney Rate for All Attorneys 406
25% Median Attorney Rate for All Attorneys 325
Median Attorney Rate for All Attorneys 350
75% Median Attorney Rate for All Attorneys 500
95% Median Attorney Rate for All Attorneys 650
Median Rate for Practice Areas
Median
Attorneys Handling Bankruptcy Cases 350
Attorneys Handling Class Action Cases 675
Attorneys Handling Credit Rights Cases 350
Attorneys Handling Mortgage Cases 525
Attorneys Handling Vehicle Cases 350
Attorneys Handling TCPA Cases 338
Attorneys Handling Other Cases 350
265
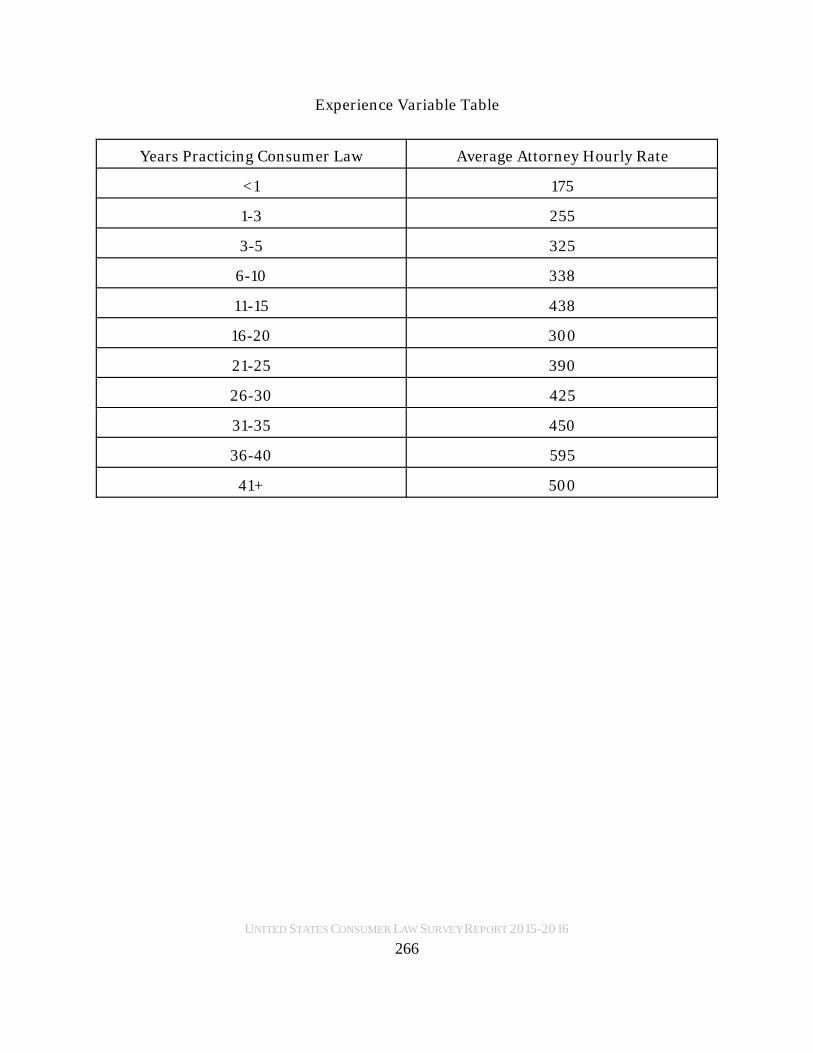
UNITED STATES CONSUMER LAW SURVEY REPORT 2015-2016
Experience Variable Table
Years Practicing Consumer Law Average Attorney Hourly Rate
<1 175
1-3 255
3-5 325
6-10 338
11-15 438
16-20 300
21-25 390
26-30 425
31-35 450
36-40 595
41+ 500
266

UNITED STATES CONSUMER LAW SURVEY REPORT 2015-2016
Mississippi, Jackson
Firm Size 1.3
Median Years in Practice 21.0
Concentration of Practice in Consumer Law 83.3
Primary Practice Area Consumer Law
Secondary Practice Area General Practice
Last Time Rate Change Occurred (months) 20.0
Median Number of Paralegals in Firm 1.0
Average Paralegal Rate for All Paralegals 125
Average Attorney Rate for All Attorneys 367
25% Median Attorney Rate for All Attorneys 300
Median Attorney Rate for All Attorneys 325
75% Median Attorney Rate for All Attorneys 400
95% Median Attorney Rate for All Attorneys 475
Median Rate for Practice Areas
Median
Attorneys Handling Bankruptcy Cases 325
Attorneys Handling Class Action Cases 325
Attorneys Handling Credit Rights Cases 400
Attorneys Handling Mortgage Cases 325
Attorneys Handling Vehicle Cases 388
Attorneys Handling TCPA Cases 325
Attorneys Handling Other Cases 475
267

UNITED STATES CONSUMER LAW SURVEY REPORT 2015-2016
Experience Variable Table
Years Practicing Consumer Law Average Attorney Hourly Rate
<1 175
1-3 200
3-5 265
6-10 325
11-15 350
16-20 378
21-25 363
26-30 395
31-35 420
36-40 400
41+ 315
268

UNITED STATES CONSUMER LAW SURVEY REPORT 2015-2016
Missouri, Columbia
Firm Size 3.2
Median Years in Practice 13.6
Concentration of Practice in Consumer Law 96.6
Primary Practice Area Consumer Law
Secondary Practice Area General Practice
Last Time Rate Change Occurred (months) 16.7
Median Number of Paralegals in Firm 2.1
Average Paralegal Rate for All Paralegals 132
Average Attorney Rate for All Attorneys 436
25% Median Attorney Rate for All Attorneys 325
Median Attorney Rate for All Attorneys 359
75% Median Attorney Rate for All Attorneys 525
95% Median Attorney Rate for All Attorneys 725
Median Rate for Practice Areas
Median
Attorneys Handling Bankruptcy Cases 350
Attorneys Handling Class Action Cases 350
Attorneys Handling Credit Rights Cases 425
Attorneys Handling Mortgage Cases 350
Attorneys Handling Vehicle Cases 350
Attorneys Handling TCPA Cases 425
Attorneys Handling Other Cases 325
269
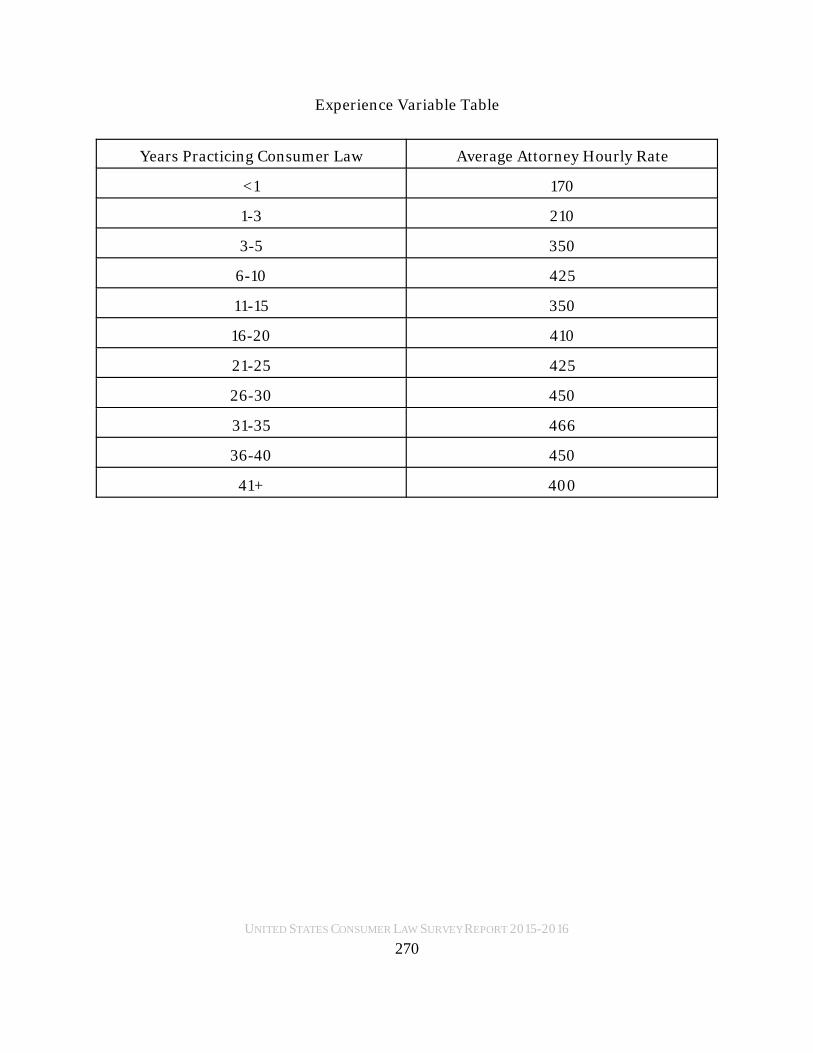
UNITED STATES CONSUMER LAW SURVEY REPORT 2015-2016
Experience Variable Table
Years Practicing Consumer Law Average Attorney Hourly Rate
<1 170
1-3 210
3-5 350
6-10 425
11-15 350
16-20 410
21-25 425
26-30 450
31-35 466
36-40 450
41+ 400
270

UNITED STATES CONSUMER LAW SURVEY REPORT 2015-2016
Missouri, Kansas City
Firm Size 3.2
Median Years in Practice 8.0
Concentration of Practice in Consumer Law 91.5
Primary Practice Area Consumer Law
Secondary Practice Area Bankruptcy
Last Time Rate Change Occurred (months) 14.8
Median Number of Paralegals in Firm 1.8
Average Paralegal Rate for All Paralegals 108
Average Attorney Rate for All Attorneys 371
25% Median Attorney Rate for All Attorneys 300
Median Attorney Rate for All Attorneys 350
75% Median Attorney Rate for All Attorneys 425
95% Median Attorney Rate for All Attorneys 725
Median Rate for Practice Areas
Median
Attorneys Handling Bankruptcy Cases 225
Attorneys Handling Class Action Cases 350
Attorneys Handling Credit Rights Cases 350
Attorneys Handling Mortgage Cases 388
Attorneys Handling Vehicle Cases 338
Attorneys Handling TCPA Cases 355
Attorneys Handling Other Cases 300
271

UNITED STATES CONSUMER LAW SURVEY REPORT 2015-2016
Experience Variable Table
Years Practicing Consumer Law Average Attorney Hourly Rate
<1 300
1-3 233
3-5 306
6-10 725
11-15 433
16-20 425
21-25 300
26-30 350
31-35 345
36-40 350
41+ 310
272

UNITED STATES CONSUMER LAW SURVEY REPORT 2015-2016
Missouri, Springfield
Firm Size 3.3
Median Years in Practice 11.0
Concentration of Practice in Consumer Law 84.0
Primary Practice Area Consumer Law
Secondary Practice Area Bankruptcy
Last Time Rate Change Occurred (months) 14.0
Median Number of Paralegals in Firm 1.9
Average Paralegal Rate for All Paralegals 107
Average Attorney Rate for All Attorneys 362
25% Median Attorney Rate for All Attorneys 275
Median Attorney Rate for All Attorneys 350
75% Median Attorney Rate for All Attorneys 450
95% Median Attorney Rate for All Attorneys 725
Median Rate for Practice Areas
Median
Attorneys Handling Bankruptcy Cases 200
Attorneys Handling Class Action Cases 350
Attorneys Handling Credit Rights Cases 350
Attorneys Handling Mortgage Cases 350
Attorneys Handling Vehicle Cases 350
Attorneys Handling TCPA Cases 350
Attorneys Handling Other Cases 300
273

UNITED STATES CONSUMER LAW SURVEY REPORT 2015-2016
Experience Variable Table
Years Practicing Consumer Law Average Attorney Hourly Rate
<1 300
1-3 233
3-5 306
6-10 725
11-15 363
16-20 438
21-25 300
26-30 350
31-35 345
36-40 350
41+ 310
274

UNITED STATES CONSUMER LAW SURVEY REPORT 2015-2016
Missouri, St Louis
Firm Size 3.6
Median Years in Practice 8.0
Concentration of Practice in Consumer Law 92.7
Primary Practice Area Consumer Law
Secondary Practice Area Personal Injury
Last Time Rate Change Occurred (months) 21.3
Median Number of Paralegals in Firm 1.9
Average Paralegal Rate for All Paralegals 111
Average Attorney Rate for All Attorneys 377
25% Median Attorney Rate for All Attorneys 300
Median Attorney Rate for All Attorneys 350
75% Median Attorney Rate for All Attorneys 475
95% Median Attorney Rate for All Attorneys 725
Median Rate for Practice Areas
Median
Attorneys Handling Bankruptcy Cases 200
Attorneys Handling Class Action Cases 350
Attorneys Handling Credit Rights Cases 338
Attorneys Handling Mortgage Cases 350
Attorneys Handling Vehicle Cases 325
Attorneys Handling TCPA Cases 350
Attorneys Handling Other Cases 300
275

UNITED STATES CONSUMER LAW SURVEY REPORT 2015-2016
Experience Variable Table
Years Practicing Consumer
LawAverage Attorney Hourly Rate
<1 300
1-3 250
3-5 306
6-10 425
11-15 400
16-20 400
21-25 345
26-30 405
31-35 425
36-40 385
41+ 350
276

UNITED STATES CONSUMER LAW SURVEY REPORT 2015-2016
Nebraska, Lincoln
Firm Size 1.7
Median Years in Practice 24.0
Concentration of Practice in Consumer Law 73.3
Primary Practice Area Consumer Law
Secondary Practice Area Bankruptcy
Last Time Rate Change Occurred (months) 9.0
Median Number of Paralegals in Firm 1.0
Average Paralegal Rate for All Paralegals 125
Average Attorney Rate for All Attorneys 350
25% Median Attorney Rate for All Attorneys 250
Median Attorney Rate for All Attorneys 325
75% Median Attorney Rate for All Attorneys 400
95% Median Attorney Rate for All Attorneys 450
Median Rates for Practice Areas
Median
Attorneys Handling Bankruptcy Cases 275
Attorneys Handling Class Action Cases 388
Attorneys Handling Credit Rights Cases 325
Attorneys Handling Mortgage Cases 275
Attorneys Handling Vehicle Cases 350
Attorneys Handling TCPA Cases 450
Attorneys Handling Other Cases 350
277

UNITED STATES CONSUMER LAW SURVEY REPORT 2015-2016
Experience Variable Table
Years Practicing Consumer Law Average Attorney Hourly Rate
<1 225
1-3 225
3-5 275
6-10 300
11-15 450
16-20 325
21-25 325
26-30 350
31-35 500
36-40 550
41+ 500
278

UNITED STATES CONSUMER LAW SURVEY REPORT 2015-2016
Nebraska, Omaha
Firm Size 1.7
Median Years in Practice 22.5
Concentration of Practice in Consumer Law 75.0
Primary Practice Area Consumer Law
Secondary Practice Area Bankruptcy
Last Time Rate Change Occurred (months) 9.0
Median Number of Paralegals in Firm .5
Average Paralegal Rate for All Paralegals 87
Average Attorney Rate for All Attorneys 367
25% Median Attorney Rate for All Attorneys 275
Median Attorney Rate for All Attorneys 333
75% Median Attorney Rate for All Attorneys 500
95% Median Attorney Rate for All Attorneys 550
Median Rate for Practice Areas
Median
Attorneys Handling Bankruptcy Cases 275
Attorneys Handling Class Action Cases 333
Attorneys Handling Credit Rights Cases 333
Attorneys Handling Mortgage Cases 275
Attorneys Handling Vehicle Cases 333
Attorneys Handling TCPA Cases 500
Attorneys Handling Other Cases 333
279
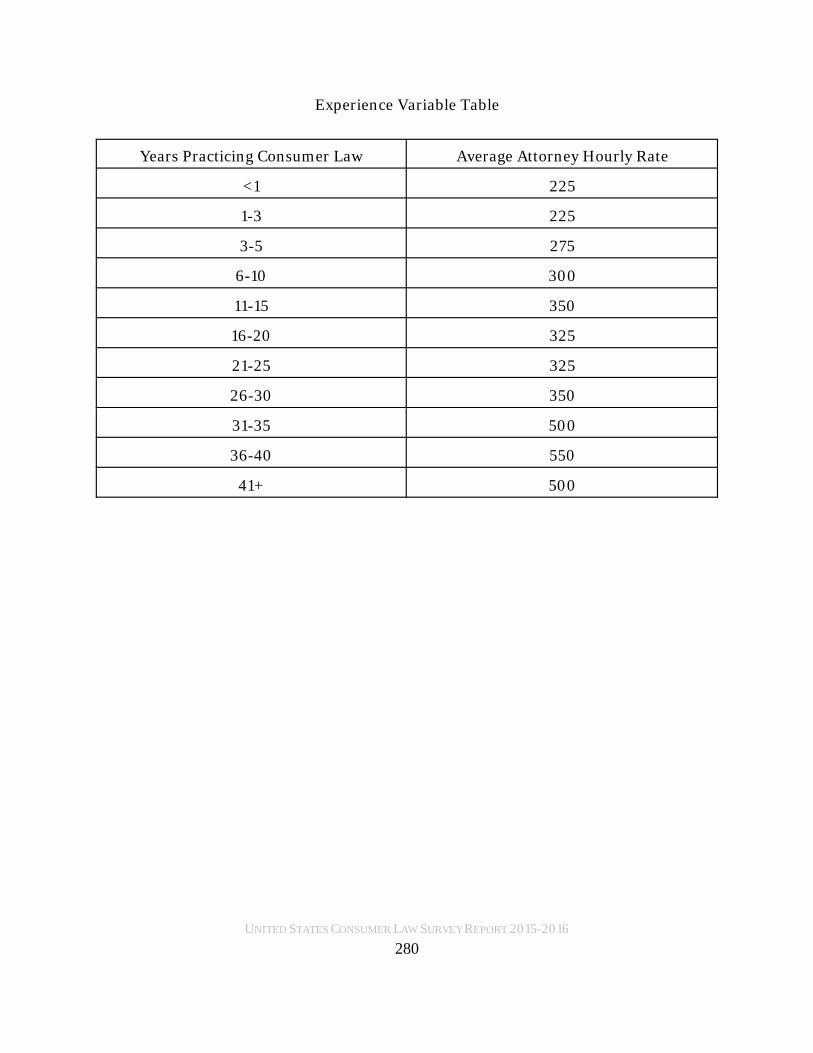
UNITED STATES CONSUMER LAW SURVEY REPORT 2015-2016
Experience Variable Table
Years Practicing Consumer Law Average Attorney Hourly Rate
<1 225
1-3 225
3-5 275
6-10 300
11-15 350
16-20 325
21-25 325
26-30 350
31-35 500
36-40 550
41+ 500
280

UNITED STATES CONSUMER LAW SURVEY REPORT 2015-2016
Nevada, Las Vegas
Firm Size 4.8
Median Years in Practice 12.0
Concentration of Practice in Consumer Law 100.0
Primary Practice Area Consumer Law
Secondary Practice Area General Practice
Last Time Rate Change Occurred (months) 13.2
Median Number of Paralegals in Firm 4.0
Average Paralegal Rate for All Paralegals 144
Average Attorney Rate for All Attorneys 420
25% Median Attorney Rate for All Attorneys 350
Median Attorney Rate for All Attorneys 450
75% Median Attorney Rate for All Attorneys 485
95% Median Attorney Rate for All Attorneys 500
Median Rate for Practice Areas
Median
Attorneys Handling Bankruptcy Cases 450
Attorneys Handling Class Action Cases 450
Attorneys Handling Credit Rights Cases 450
Attorneys Handling Mortgage Cases 450
Attorneys Handling Vehicle Cases 450
Attorneys Handling TCPA Cases 450
Attorneys Handling Other Cases 450
281

UNITED STATES CONSUMER LAW SURVEY REPORT 2015-2016
Experience Variable Table
Years Practicing Consumer Law Average Attorney Hourly Rate
<1 250
1-3 275
3-5 290
6-10 325
11-15 450
16-20 440
21-25 465
26-30 450
31-35 500
36-40 525
41+ 500
282

UNITED STATES CONSUMER LAW SURVEY REPORT 2015-2016
Nevada, Reno - Carson City
Firm Size 4.8
Median Years in Practice 12.0
Concentration of Practice in Consumer Law 100.0
Primary Practice Area Consumer Law
Secondary Practice Area General Practice
Last Time Rate Change Occurred (months) 13.2
Median Number of Paralegals in Firm 4.0
Average Paralegal Rate for All Paralegals 144
Average Attorney Rate for All Attorneys 420
25% Median Attorney Rate for All Attorneys 350
Median Attorney Rate for All Attorneys 450
75% Median Attorney Rate for All Attorneys 485
95% Median Attorney Rate for All Attorneys 500
Median Rate for Practice Areas
Median
Attorneys Handling Bankruptcy Cases 450
Attorneys Handling Class Action Cases 450
Attorneys Handling Credit Rights Cases 450
Attorneys Handling Mortgage Cases 450
Attorneys Handling Vehicle Cases 450
Attorneys Handling TCPA Cases 450
Attorneys Handling Other Cases 450
283

UNITED STATES CONSUMER LAW SURVEY REPORT 2015-2016
Experience Variable Table
Years Practicing Consumer Law Average Attorney Hourly Rate
<1 250
1-3 275
3-5 290
6-10 325
11-15 450
16-20 440
21-25 465
26-30 450
31-35 500
36-40 525
41+ 500
284
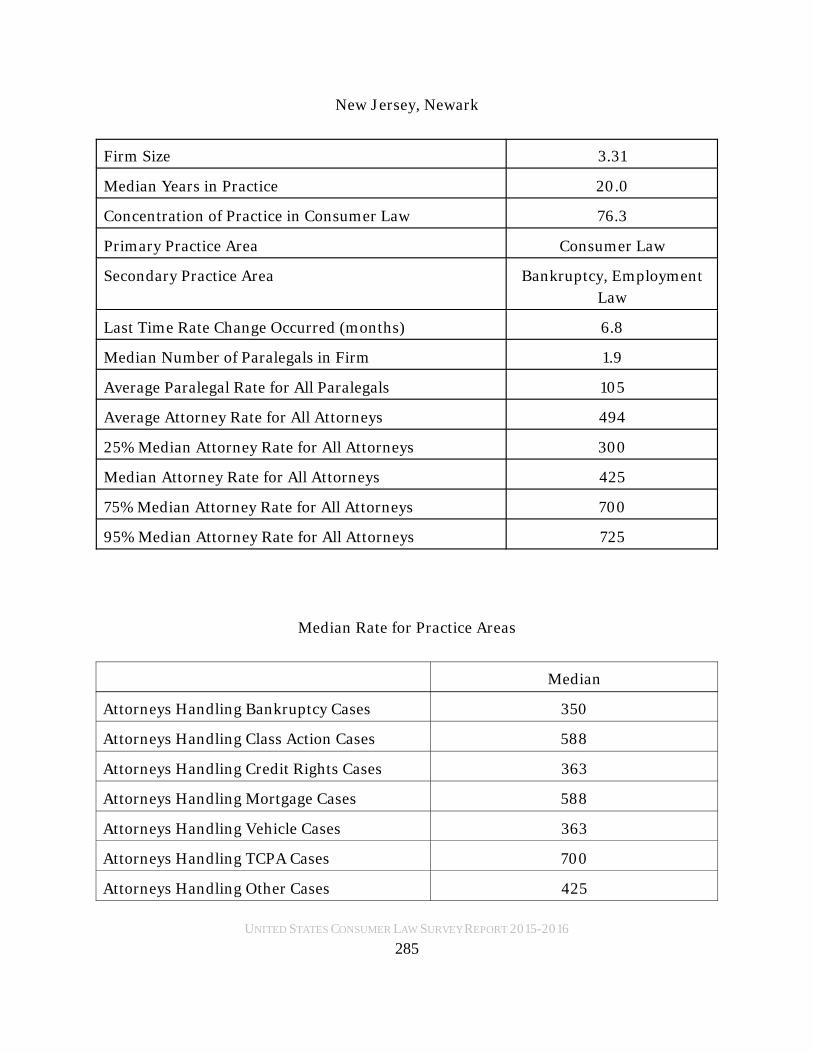
UNITED STATES CONSUMER LAW SURVEY REPORT 2015-2016
New Jersey, Newark
Firm Size 3.31
Median Years in Practice 20.0
Concentration of Practice in Consumer Law 76.3
Primary Practice Area Consumer Law
Secondary Practice Area Bankruptcy, Employment
Law
Last Time Rate Change Occurred (months) 6.8
Median Number of Paralegals in Firm 1.9
Average Paralegal Rate for All Paralegals 105
Average Attorney Rate for All Attorneys 494
25% Median Attorney Rate for All Attorneys 300
Median Attorney Rate for All Attorneys 425
75% Median Attorney Rate for All Attorneys 700
95% Median Attorney Rate for All Attorneys 725
Median Rate for Practice Areas
Median
Attorneys Handling Bankruptcy Cases 350
Attorneys Handling Class Action Cases 588
Attorneys Handling Credit Rights Cases 363
Attorneys Handling Mortgage Cases 588
Attorneys Handling Vehicle Cases 363
Attorneys Handling TCPA Cases 700
Attorneys Handling Other Cases 425
285
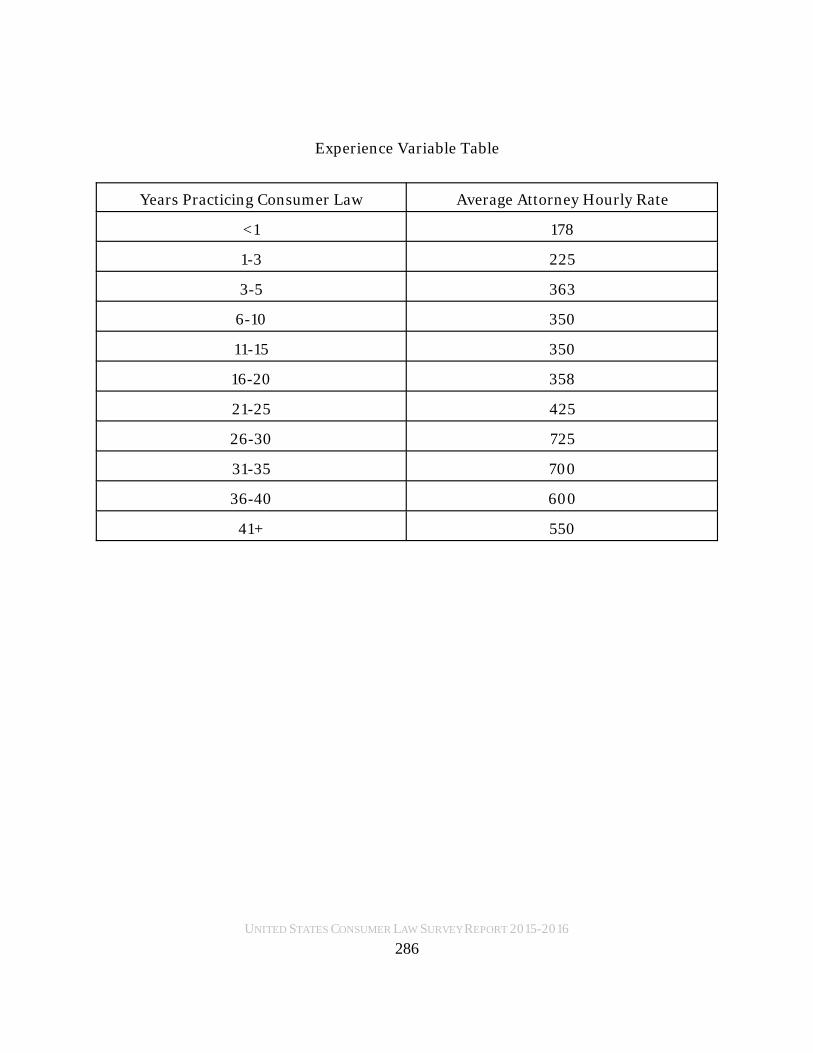
UNITED STATES CONSUMER LAW SURVEY REPORT 2015-2016
Experience Variable Table
Years Practicing Consumer Law Average Attorney Hourly Rate
<1 178
1-3 225
3-5 363
6-10 350
11-15 350
16-20 358
21-25 425
26-30 725
31-35 700
36-40 600
41+ 550
286

UNITED STATES CONSUMER LAW SURVEY REPORT 2015-2016
New Jersey, Trenton
Firm Size 2.3
Median Years in Practice 22.0
Concentration of Practice in Consumer Law 88.7
Primary Practice Area Consumer Law
Secondary Practice Area Employment Law
Last Time Rate Change Occurred (months) 10.5
Median Number of Paralegals in Firm 2.1
Average Paralegal Rate for All Paralegals 134
Average Attorney Rate for All Attorneys 600
25% Median Attorney Rate for All Attorneys 459
Median Attorney Rate for All Attorneys 675
75% Median Attorney Rate for All Attorneys 700
95% Median Attorney Rate for All Attorneys 725
Median Rate for Practice Areas
Median
Attorneys Handling Bankruptcy Cases 675
Attorneys Handling Class Action Cases 675
Attorneys Handling Credit Rights Cases 675
Attorneys Handling Mortgage Cases 688
Attorneys Handling Vehicle Cases 450
Attorneys Handling TCPA Cases 700
Attorneys Handling Other Cases 675
287

UNITED STATES CONSUMER LAW SURVEY REPORT 2015-2016
Experience Variable Table
Years Practicing Consumer Law Average Attorney Hourly Rate
<1 275
1-3 300
3-5 375
6-10 400
11-15 675
16-20 575
21-25 450
26-30 725
31-35 700
36-40 700
41+ 650
288
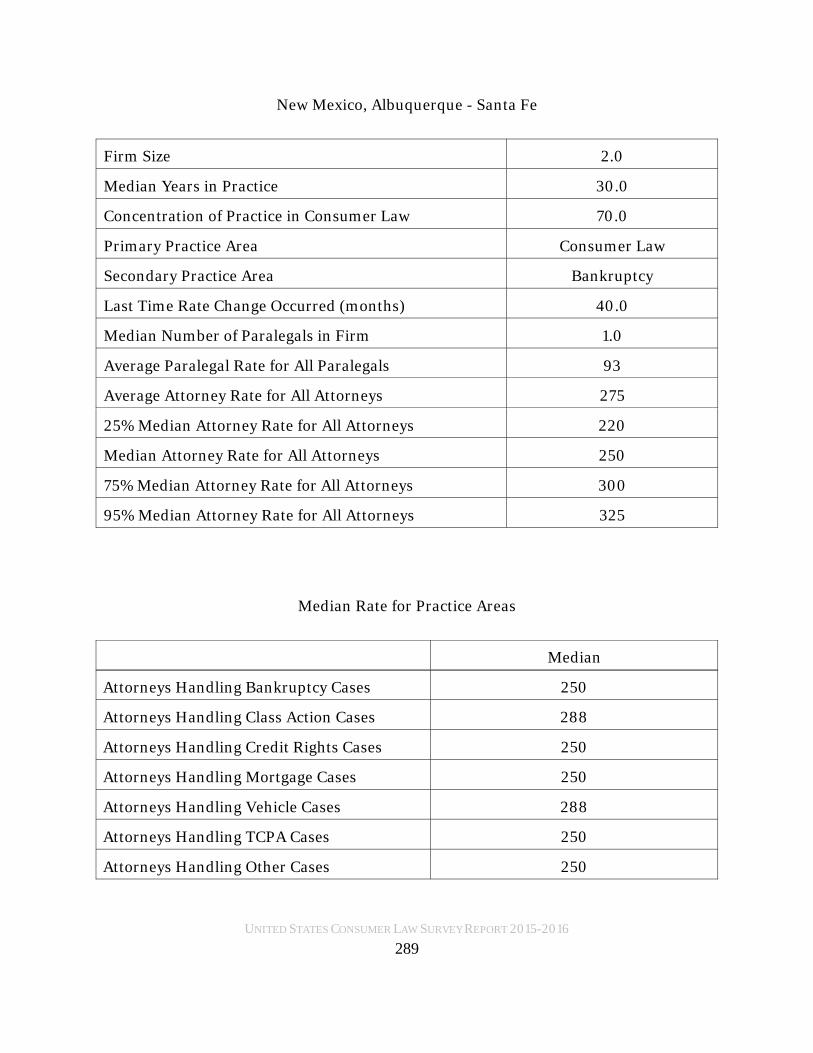
UNITED STATES CONSUMER LAW SURVEY REPORT 2015-2016
New Mexico, Albuquerque - Santa Fe
Firm Size 2.0
Median Years in Practice 30.0
Concentration of Practice in Consumer Law 70.0
Primary Practice Area Consumer Law
Secondary Practice Area Bankruptcy
Last Time Rate Change Occurred (months) 40.0
Median Number of Paralegals in Firm 1.0
Average Paralegal Rate for All Paralegals 93
Average Attorney Rate for All Attorneys 275
25% Median Attorney Rate for All Attorneys 220
Median Attorney Rate for All Attorneys 250
75% Median Attorney Rate for All Attorneys 300
95% Median Attorney Rate for All Attorneys 325
Median Rate for Practice Areas
Median
Attorneys Handling Bankruptcy Cases 250
Attorneys Handling Class Action Cases 288
Attorneys Handling Credit Rights Cases 250
Attorneys Handling Mortgage Cases 250
Attorneys Handling Vehicle Cases 288
Attorneys Handling TCPA Cases 250
Attorneys Handling Other Cases 250
289
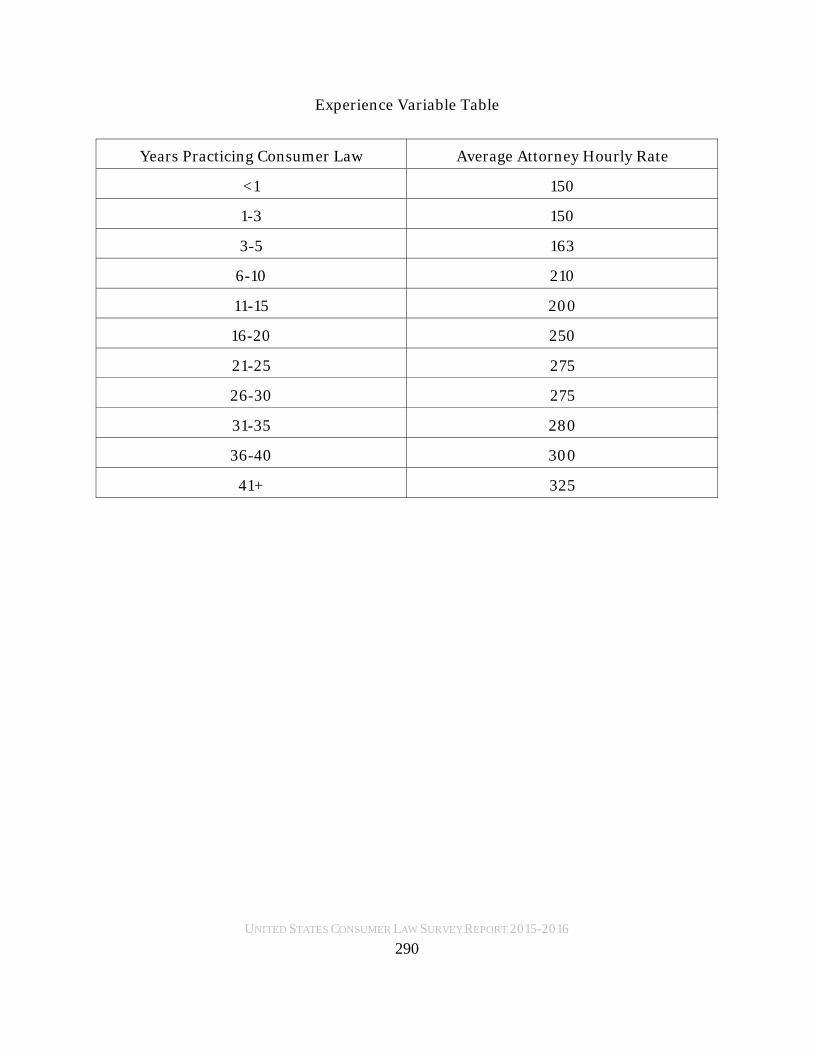
UNITED STATES CONSUMER LAW SURVEY REPORT 2015-2016
Experience Variable Table
Years Practicing Consumer Law Average Attorney Hourly Rate
<1 150
1-3 150
3-5 163
6-10 210
11-15 200
16-20 250
21-25 275
26-30 275
31-35 280
36-40 300
41+ 325
290

UNITED STATES CONSUMER LAW SURVEY REPORT 2015-2016
New York, Albany - Schenectady
Firm Size 2.1
Median Years in Practice 15.0
Concentration of Practice in Consumer Law 82.7
Primary Practice Area Consumer Law
Secondary Practice Area Employment Law
Last Time Rate Change Occurred (months) 13.9
Median Number of Paralegals in Firm 3.1
Average Paralegal Rate for All Paralegals 136
Average Attorney Rate for All Attorneys 509
25% Median Attorney Rate for All Attorneys 400
Median Attorney Rate for All Attorneys 538
75% Median Attorney Rate for All Attorneys 700
95% Median Attorney Rate for All Attorneys 725
Median Rate for Practice Areas
Median
Attorneys Handling Bankruptcy Cases 300
Attorneys Handling Class Action Cases 600
Attorneys Handling Credit Rights Cases 425
Attorneys Handling Mortgage Cases 688
Attorneys Handling Vehicle Cases 425
Attorneys Handling TCPA Cases 425
Attorneys Handling Other Cases 663
291

UNITED STATES CONSUMER LAW SURVEY REPORT 2015-2016
Experience Variable Table
Years Practicing Consumer Law Average Attorney Hourly Rate
<1 245
1-3 300
3-5 300
6-10 375
11-15 420
16-20 700
21-25 550
26-30 725
31-35 663
36-40 638
41+ 375
292
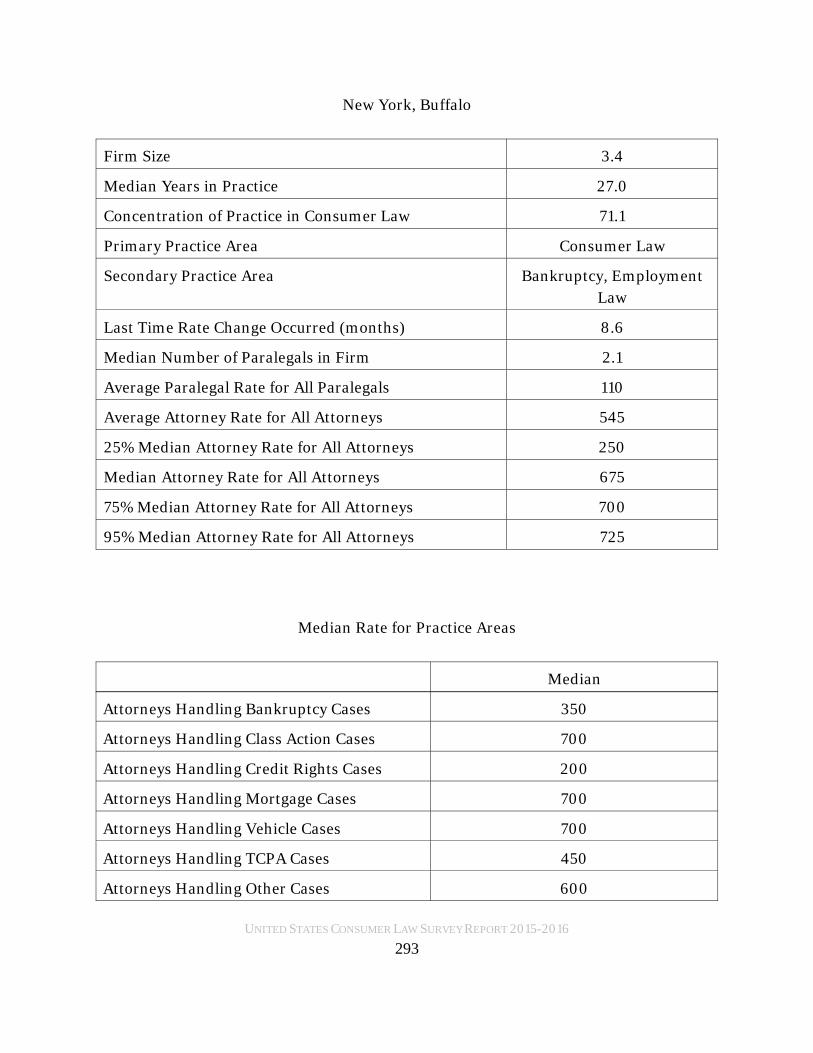
UNITED STATES CONSUMER LAW SURVEY REPORT 2015-2016
New York, Buffalo
Firm Size 3.4
Median Years in Practice 27.0
Concentration of Practice in Consumer Law 71.1
Primary Practice Area Consumer Law
Secondary Practice Area Bankruptcy, Employment
Law
Last Time Rate Change Occurred (months) 8.6
Median Number of Paralegals in Firm 2.1
Average Paralegal Rate for All Paralegals 110
Average Attorney Rate for All Attorneys 545
25% Median Attorney Rate for All Attorneys 250
Median Attorney Rate for All Attorneys 675
75% Median Attorney Rate for All Attorneys 700
95% Median Attorney Rate for All Attorneys 725
Median Rate for Practice Areas
Median
Attorneys Handling Bankruptcy Cases 350
Attorneys Handling Class Action Cases 700
Attorneys Handling Credit Rights Cases 200
Attorneys Handling Mortgage Cases 700
Attorneys Handling Vehicle Cases 700
Attorneys Handling TCPA Cases 450
Attorneys Handling Other Cases 600
293

UNITED STATES CONSUMER LAW SURVEY REPORT 2015-2016
Experience Variable Table
Years Practicing Consumer Law Average Attorney Hourly Rate
<1 200
1-3 200
3-5 200
6-10 265
11-15 350
16-20 675
21-25 500
26-30 725
31-35 475
36-40 713
41+ 550
294

UNITED STATES CONSUMER LAW SURVEY REPORT 2015-2016
New York, New York City
Firm Size 2.7
Median Years in Practice 19.0
Concentration of Practice in Consumer Law 86.1
Primary Practice Area Consumer Law
Secondary Practice Area Bankruptcy
Last Time Rate Change Occurred (months) 16.1
Median Number of Paralegals in Firm 2.8
Average Paralegal Rate for All Paralegals 108
Average Attorney Rate for All Attorneys 490
25% Median Attorney Rate for All Attorneys 350
Median Attorney Rate for All Attorneys 500
75% Median Attorney Rate for All Attorneys 675
95% Median Attorney Rate for All Attorneys 725
Median Rate for Practice Areas
Median
Attorneys Handling Bankruptcy Cases 500
Attorneys Handling Class Action Cases 575
Attorneys Handling Credit Rights Cases 413
Attorneys Handling Mortgage Cases 588
Attorneys Handling Vehicle Cases 425
Attorneys Handling TCPA Cases 413
Attorneys Handling Other Cases 600
295

UNITED STATES CONSUMER LAW SURVEY REPORT 2015-2016
Experience Variable Table
Years Practicing Consumer Law Average Attorney Hourly Rate
<1 300
1-3 300
3-5 300
6-10 338
11-15 413
16-20 567
21-25 583
26-30 725
31-35 544
36-40 638
41+ 375
296

UNITED STATES CONSUMER LAW SURVEY REPORT 2015-2016
New York, Rochester
Firm Size 3.1
Median Years in Practice 27.0
Concentration of Practice in Consumer Law 72.7
Primary Practice Area Consumer Law
Secondary Practice Area Bankruptcy
Last Time Rate Change Occurred (months) 13.2
Median Number of Paralegals in Firm 1.7
Average Paralegal Rate for All Paralegals 89
Average Attorney Rate for All Attorneys 505
25% Median Attorney Rate for All Attorneys 275
Median Attorney Rate for All Attorneys 500
75% Median Attorney Rate for All Attorneys 700
95% Median Attorney Rate for All Attorneys 725
Median Rate for Practice Areas
Median
Attorneys Handling Bankruptcy Cases 375
Attorneys Handling Class Action Cases 600
Attorneys Handling Credit Rights Cases 400
Attorneys Handling Mortgage Cases 500
Attorneys Handling Vehicle Cases 475
Attorneys Handling TCPA Cases 400
Attorneys Handling Other Cases 550
297

UNITED STATES CONSUMER LAW SURVEY REPORT 2015-2016
Experience Variable Table
Years Practicing Consumer Law Average Attorney Hourly Rate
<1 185
1-3 200
3-5 200
6-10 350
11-15 405
16-20 550
21-25 575
26-30 725
31-35 475
36-40 642
41+ 500
298

UNITED STATES CONSUMER LAW SURVEY REPORT 2015-2016
New York, Syracuse
Firm Size 4.0
Median Years in Practice 24.0
Concentration of Practice in Consumer Law 91.2
Primary Practice Area Consumer Law
Secondary Practice Area Employment Law
Last Time Rate Change Occurred (months) 10.5
Median Number of Paralegals in Firm 3.1
Average Paralegal Rate for All Paralegals 179
Average Attorney Rate for All Attorneys 628
25% Median Attorney Rate for All Attorneys 550
Median Attorney Rate for All Attorneys 688
75% Median Attorney Rate for All Attorneys 700
95% Median Attorney Rate for All Attorneys 725
Median Rate for Practice Areas
Median
Attorneys Handling Bankruptcy Cases 688
Attorneys Handling Class Action Cases 700
Attorneys Handling Credit Rights Cases 675
Attorneys Handling Mortgage Cases 700
Attorneys Handling Vehicle Cases 700
Attorneys Handling TCPA Cases 550
Attorneys Handling Other Cases 600
299

UNITED STATES CONSUMER LAW SURVEY REPORT 2015-2016
Experience Variable Table
Years Practicing Consumer Law Average Attorney Hourly Rate
<1 250
1-3 275
3-5 300
6-10 325
11-15 675
16-20 725
21-25 550
26-30 725
31-35 600
36-40 700
41+ 700
300

UNITED STATES CONSUMER LAW SURVEY REPORT 2015-2016
North Carolina, Charlotte
Firm Size 2.4
Median Years in Practice 19.0
Concentration of Practice in Consumer Law 56.7
Primary Practice Area Bankruptcy
Secondary Practice Area Consumer Law
Last Time Rate Change Occurred (months) 22.6
Median Number of Paralegals in Firm 2.0
Average Paralegal Rate for All Paralegals 83
Average Attorney Rate for All Attorneys 322
25% Median Attorney Rate for All Attorneys 250
Median Attorney Rate for All Attorneys 275
75% Median Attorney Rate for All Attorneys 350
95% Median Attorney Rate for All Attorneys 650
Median Rate for Practice Areas
Median
Attorneys Handling Bankruptcy Cases 263
Attorneys Handling Class Action Cases 350
Attorneys Handling Credit Rights Cases 300
Attorneys Handling Mortgage Cases 263
Attorneys Handling Vehicle Cases 300
Attorneys Handling TCPA Cases 350
Attorneys Handling Other Cases 275
301

UNITED STATES CONSUMER LAW SURVEY REPORT 2015-2016
Experience Variable Table
Years Practicing Consumer Law Average Attorney Hourly Rate
<1 175
1-3 225
3-5 225
6-10 292
11-15 363
16-20 300
21-25 275
26-30 267
31-35 300
36-40 343
41+ 360
302

UNITED STATES CONSUMER LAW SURVEY REPORT 2015-2016
North Carolina, Greensboro
Firm Size 2.3
Median Years in Practice 13.0
Concentration of Practice in Consumer Law 55.8
Primary Practice Area Bankruptcy
Secondary Practice Area Consumer Law
Last Time Rate Change Occurred (months) 20.2
Median Number of Paralegals in Firm 1.7
Average Paralegal Rate for All Paralegals 82
Average Attorney Rate for All Attorneys 290
25% Median Attorney Rate for All Attorneys 240
Median Attorney Rate for All Attorneys 250
75% Median Attorney Rate for All Attorneys 300
95% Median Attorney Rate for All Attorneys 675
Median Rate for Practice Areas
Median
Attorneys Handling Bankruptcy Cases 250
Attorneys Handling Class Action Cases 488
Attorneys Handling Credit Rights Cases 250
Attorneys Handling Mortgage Cases 300
Attorneys Handling Vehicle Cases 275
Attorneys Handling TCPA Cases 250
Attorneys Handling Other Cases 275
303

UNITED STATES CONSUMER LAW SURVEY REPORT 2015-2016
Experience Variable Table
Years Practicing Consumer Law Average Attorney Hourly Rate
<1 180
1-3 225
3-5 225
6-10 275
11-15 381
16-20 263
21-25 275
26-30 250
31-35 280
36-40 275
41+ 260
304

UNITED STATES CONSUMER LAW SURVEY REPORT 2015-2016
North Carolina, Raleigh
Firm Size 2.3
Median Years in Practice 13.0
Concentration of Practice in Consumer Law 65.8
Primary Practice Area Bankruptcy
Secondary Practice Area Consumer Law
Last Time Rate Change Occurred (months) 20.2
Median Number of Paralegals in Firm 1.7
Average Paralegal Rate for All Paralegals 84
Average Attorney Rate for All Attorneys 290
25% Median Attorney Rate for All Attorneys 240
Median Attorney Rate for All Attorneys 250
75% Median Attorney Rate for All Attorneys 300
95% Median Attorney Rate for All Attorneys 350
Median Rate for Practice Areas
Median
Attorneys Handling Bankruptcy Cases 250
Attorneys Handling Class Action Cases 300
Attorneys Handling Credit Rights Cases 250
Attorneys Handling Mortgage Cases 250
Attorneys Handling Vehicle Cases 275
Attorneys Handling TCPA Cases 250
Attorneys Handling Other Cases 250
305

UNITED STATES CONSUMER LAW SURVEY REPORT 2015-2016
Experience Variable Table
Years Practicing Consumer Law Average Attorney Hourly Rate
<1 175
1-3 225
3-5 225
6-10 275
11-15 381
16-20 263
21-25 265
26-30 300
31-35 325
36-40 300
41+ 300
306
UNITED STATES CONSUMER LAW SURVEY REPORT 2015-2016
Ohio, Cincinnati
Firm Size 2.1
Median Years in Practice 22.0
Concentration of Practice in Consumer Law 90.2
Primary Practice Area Consumer Law
Secondary Practice Area Bankruptcy, Domestic
Relations
Last Time Rate Change Occurred (months) 23.6
Median Number of Paralegals in Firm 2.0
Average Paralegal Rate for All Paralegals 80
Average Attorney Rate for All Attorneys 366
25% Median Attorney Rate for All Attorneys 300
Median Attorney Rate for All Attorneys 338
75% Median Attorney Rate for All Attorneys 475
95% Median Attorney Rate for All Attorneys 525
Median Rate for Practice Areas
Median
Attorneys Handling Bankruptcy Cases 325
Attorneys Handling Class Action Cases 400
Attorneys Handling Credit Rights Cases 325
Attorneys Handling Mortgage Cases 325
Attorneys Handling Vehicle Cases 300
Attorneys Handling TCPA Cases 488
Attorneys Handling Other Cases 325
307

UNITED STATES CONSUMER LAW SURVEY REPORT 2015-2016
Experience Variable Table
Years Practicing Consumer Law Average Attorney Hourly Rate
<1 200
1-3 225
3-5 250
6-10 300
11-15 425
16-20 442
21-25 342
26-30 400
31-35 385
36-40 425
41+ 365
308

UNITED STATES CONSUMER LAW SURVEY REPORT 2015-2016
Ohio, Cleveland
Firm Size 2.3
Median Years in Practice 22.0
Concentration of Practice in Consumer Law 93.8
Primary Practice Area Consumer Law
Secondary Practice Area General Practice
Last Time Rate Change Occurred (months) 19.7
Median Number of Paralegals in Firm 1.0
Average Paralegal Rate for All Paralegals 89
Average Attorney Rate for All Attorneys 416
25% Median Attorney Rate for All Attorneys 300
Median Attorney Rate for All Attorneys 425
75% Median Attorney Rate for All Attorneys 500
95% Median Attorney Rate for All Attorneys 650
Median Rate for Practice Areas
Median
Attorneys Handling Bankruptcy Cases 312
Attorneys Handling Class Action Cases 488
Attorneys Handling Credit Rights Cases 450
Attorneys Handling Mortgage Cases 450
Attorneys Handling Vehicle Cases 350
Attorneys Handling TCPA Cases 475
Attorneys Handling Other Cases 475
309

UNITED STATES CONSUMER LAW SURVEY REPORT 2015-2016
Experience Variable Table
Years Practicing Consumer Law Average Attorney Hourly Rate
<1 225
1-3 250
3-5 250
6-10 300
11-15 442
16-20 417
21-25 400
26-30 418
31-35 450
36-40 467
41+ 433
310

UNITED STATES CONSUMER LAW SURVEY REPORT 2015-2016
Ohio, Columbus
Firm Size 2.9
Median Years in Practice 18.0
Concentration of Practice in Consumer Law 91.2
Primary Practice Area Consumer Law
Secondary Practice Area Bankruptcy
Last Time Rate Change Occurred (months) 15.5
Median Number of Paralegals in Firm 3.0
Average Paralegal Rate for All Paralegals 80
Average Attorney Rate for All Attorneys 352
25% Median Attorney Rate for All Attorneys 300
Median Attorney Rate for All Attorneys 350
75% Median Attorney Rate for All Attorneys 500
95% Median Attorney Rate for All Attorneys 600
Median Rate for Practice Areas
Median
Attorneys Handling Bankruptcy Cases 288
Attorneys Handling Class Action Cases 475
Attorneys Handling Credit Rights Cases 375
Attorneys Handling Mortgage Cases 338
Attorneys Handling Vehicle Cases 375
Attorneys Handling TCPA Cases 475
Attorneys Handling Other Cases 250
311
UNITED STATES CONSUMER LAW SURVEY REPORT 2015-2016
Experience Variable Table
Years Practicing Consumer Law Average Attorney Hourly Rate
<1 250
1-3 300
3-5 375
6-10 300
11-15 425
16-20 442
21-25 417
26-30 300
31-35 275
36-40 500
41+ 650
312

UNITED STATES CONSUMER LAW SURVEY REPORT 2015-2016
Ohio, Toledo
Firm Size 2.4
Median Years in Practice 21.5
Concentration of Practice in Consumer Law 86.4
Primary Practice Area Consumer Law
Secondary Practice Area General Practice
Last Time Rate Change Occurred (months) 19.7
Median Number of Paralegals in Firm 1.1
Average Paralegal Rate for All Paralegals 93
Average Attorney Rate for All Attorneys 421
25% Median Attorney Rate for All Attorneys 300
Median Attorney Rate for All Attorneys 433
75% Median Attorney Rate for All Attorneys 500
95% Median Attorney Rate for All Attorneys 650
Median Rate for Practice Areas
Median
Attorneys Handling Bankruptcy Cases 312
Attorneys Handling Class Action Cases 500
Attorneys Handling Credit Rights Cases 475
Attorneys Handling Mortgage Cases 450
Attorneys Handling Vehicle Cases 350
Attorneys Handling TCPA Cases 483
Attorneys Handling Other Cases 475
313

UNITED STATES CONSUMER LAW SURVEY REPORT 2015-2016
Experience Variable Table
Years Practicing Consumer Law Average Attorney Hourly Rate
<1 225
1-3 250
3-5 250
6-10 300
11-15 475
16-20 475
21-25 425
26-30 433
31-35 450
36-40 450
41+ 500
314

UNITED STATES CONSUMER LAW SURVEY REPORT 2015-2016
Oklahoma, Oklahoma City
Firm Size 1.7
Median Years in Practice 14.0
Concentration of Practice in Consumer Law 61.4
Primary Practice Area Consumer Law
Secondary Practice Area Bankruptcy
Last Time Rate Change Occurred (months) 14.6
Median Number of Paralegals in Firm .3
Average Paralegal Rate for All Paralegals 100
Average Attorney Rate for All Attorneys 247
25% Median Attorney Rate for All Attorneys 225
Median Attorney Rate for All Attorneys 300
75% Median Attorney Rate for All Attorneys 350
95% Median Attorney Rate for All Attorneys 375
Median Rate for Practice Areas
Median
Attorneys Handling Bankruptcy Cases 250
Attorneys Handling Class Action Cases 300
Attorneys Handling Credit Rights Cases 300
Attorneys Handling Mortgage Cases 250
Attorneys Handling Vehicle Cases 300
Attorneys Handling TCPA Cases 300
Attorneys Handling Other Cases 250
315

UNITED STATES CONSUMER LAW SURVEY REPORT 2015-2016
Experience Variable Table
Years Practicing Consumer Law Average Attorney Hourly Rate
<1 200
1-3 250
3-5 275
6-10 310
11-15 342
16-20 250
21-25 300
26-30 383
31-35 375
36-40 375
41+ 350
316
UNITED STATES CONSUMER LAW SURVEY REPORT 2015-2016
Oklahoma, Tulsa
Firm Size 2.1
Median Years in Practice 16.0
Concentration of Practice in Consumer Law 61.4
Primary Practice Area Consumer Law
Secondary Practice Area Bankruptcy
Last Time Rate Change Occurred (months) 8.6
Median Number of Paralegals in Firm .71
Average Paralegal Rate for All Paralegals 108
Average Attorney Rate for All Attorneys 289
25% Median Attorney Rate for All Attorneys 300
Median Attorney Rate for All Attorneys 325
75% Median Attorney Rate for All Attorneys 375
95% Median Attorney Rate for All Attorneys 500
Median Rate for Practice Areas
Median
Attorneys Handling Bankruptcy Cases 250
Attorneys Handling Class Action Cases 300
Attorneys Handling Credit Rights Cases 388
Attorneys Handling Mortgage Cases 300
Attorneys Handling Vehicle Cases 300
Attorneys Handling TCPA Cases 300
Attorneys Handling Other Cases 300
317

UNITED STATES CONSUMER LAW SURVEY REPORT 2015-2016
Experience Variable Table
Years Practicing Consumer Law Average Attorney Hourly Rate
<1 150
1-3 220
3-5 250
6-10 275
11-15 342
16-20 240
21-25 300
26-30 500
31-35 450
36-40 400
41+ 410
318
UNITED STATES CONSUMER LAW SURVEY REPORT 2015-2016
Oregon, Eugene
Firm Size 2.6
Median Years in Practice 13.0
Concentration of Practice in Consumer Law 91.2
Primary Practice Area Consumer Law
Secondary Practice Area Bankruptcy
Last Time Rate Change Occurred (months) 18.4
Median Number of Paralegals in Firm .9
Average Paralegal Rate for All Paralegals 64
Average Attorney Rate for All Attorneys 411
25% Median Attorney Rate for All Attorneys 300
Median Attorney Rate for All Attorneys 375
75% Median Attorney Rate for All Attorneys 550
95% Median Attorney Rate for All Attorneys 725
Median Rate for Practice Areas
Median
Attorneys Handling Bankruptcy Cases 325
Attorneys Handling Class Action Cases 400
Attorneys Handling Credit Rights Cases 363
Attorneys Handling Mortgage Cases 325
Attorneys Handling Vehicle Cases 300
Attorneys Handling TCPA Cases 375
Attorneys Handling Other Cases 400
319

UNITED STATES CONSUMER LAW SURVEY REPORT 2015-2016
Experience Variable Table
Years Practicing Consumer Law Average Attorney Hourly Rate
<1 225
1-3 225
3-5 275
6-10 370
11-15 317
16-20 400
21-25 455
26-30 550
31-35 250
36-40 583
41+ 500
320

UNITED STATES CONSUMER LAW SURVEY REPORT 2015-2016
Oregon, Portland
Firm Size 2.6
Median Years in Practice 13.0
Concentration of Practice in Consumer Law 91.2
Primary Practice Area Consumer Law
Secondary Practice Area Bankruptcy
Last Time Rate Change Occurred (months) 18.4
Median Number of Paralegals in Firm .9
Average Paralegal Rate for All Paralegals 64
Average Attorney Rate for All Attorneys 411
25% Median Attorney Rate for All Attorneys 300
Median Attorney Rate for All Attorneys 375
75% Median Attorney Rate for All Attorneys 550
95% Median Attorney Rate for All Attorneys 725
Median Rate for Practice Areas
Median
Attorneys Handling Bankruptcy Cases 325
Attorneys Handling Class Action Cases 400
Attorneys Handling Credit Rights Cases 363
Attorneys Handling Mortgage Cases 325
Attorneys Handling Vehicle Cases 300
Attorneys Handling TCPA Cases 375
Attorneys Handling Other Cases 400
321

UNITED STATES CONSUMER LAW SURVEY REPORT 2015-2016
Experience Variable Table
Years Practicing Consumer Law Average Attorney Hourly Rate
<1 225
1-3 225
3-5 275
6-10 370
11-15 317
16-20 400
21-25 455
26-30 550
31-35 250
36-40 583
41+ 500
322

UNITED STATES CONSUMER LAW SURVEY REPORT 2015-2016
Pennsylvania, Philadelphia
Firm Size 2.5
Median Years in Practice 19.0
Concentration of Practice in Consumer Law 92.3
Primary Practice Area Consumer Law
Secondary Practice Area Bankruptcy
Last Time Rate Change Occurred (months) 16.9
Median Number of Paralegals in Firm 2.1
Average Paralegal Rate for All Paralegals 112
Average Attorney Rate for All Attorneys 444
25% Median Attorney Rate for All Attorneys 325
Median Attorney Rate for All Attorneys 388
75% Median Attorney Rate for All Attorneys 625
95% Median Attorney Rate for All Attorneys 725
Median Rate for Practice Areas
Median
Attorneys Handling Bankruptcy Cases 325
Attorneys Handling Class Action Cases 625
Attorneys Handling Credit Rights Cases 363
Attorneys Handling Mortgage Cases 375
Attorneys Handling Vehicle Cases 425
Attorneys Handling TCPA Cases 450
Attorneys Handling Other Cases 475
323

UNITED STATES CONSUMER LAW SURVEY REPORT 2015-2016
Experience Variable Table
Years Practicing Consumer Law Average Attorney Hourly Rate
<1 200
1-3 245
3-5 260
6-10 395
11-15 411
16-20 400
21-25 550
26-30 725
31-35 556
36-40 467
41+ 425
324

UNITED STATES CONSUMER LAW SURVEY REPORT 2015-2016
Pennsylvania, Pittsburgh
Firm Size 2.6
Median Years in Practice 20.0
Concentration of Practice in Consumer Law 90.8
Primary Practice Area Consumer Law
Secondary Practice Area Other
Last Time Rate Change Occurred (months) 13.9
Median Number of Paralegals in Firm 1.5
Average Paralegal Rate for All Paralegals 128
Average Attorney Rate for All Attorneys 487
25% Median Attorney Rate for All Attorneys 350
Median Attorney Rate for All Attorneys 450
75% Median Attorney Rate for All Attorneys 675
95% Median Attorney Rate for All Attorneys 725
Median Rate for Practice Areas
Median
Attorneys Handling Bankruptcy Cases 300
Attorneys Handling Class Action Cases 600
Attorneys Handling Credit Rights Cases 450
Attorneys Handling Mortgage Cases 588
Attorneys Handling Vehicle Cases 450
Attorneys Handling TCPA Cases 500
Attorneys Handling Other Cases 600
325
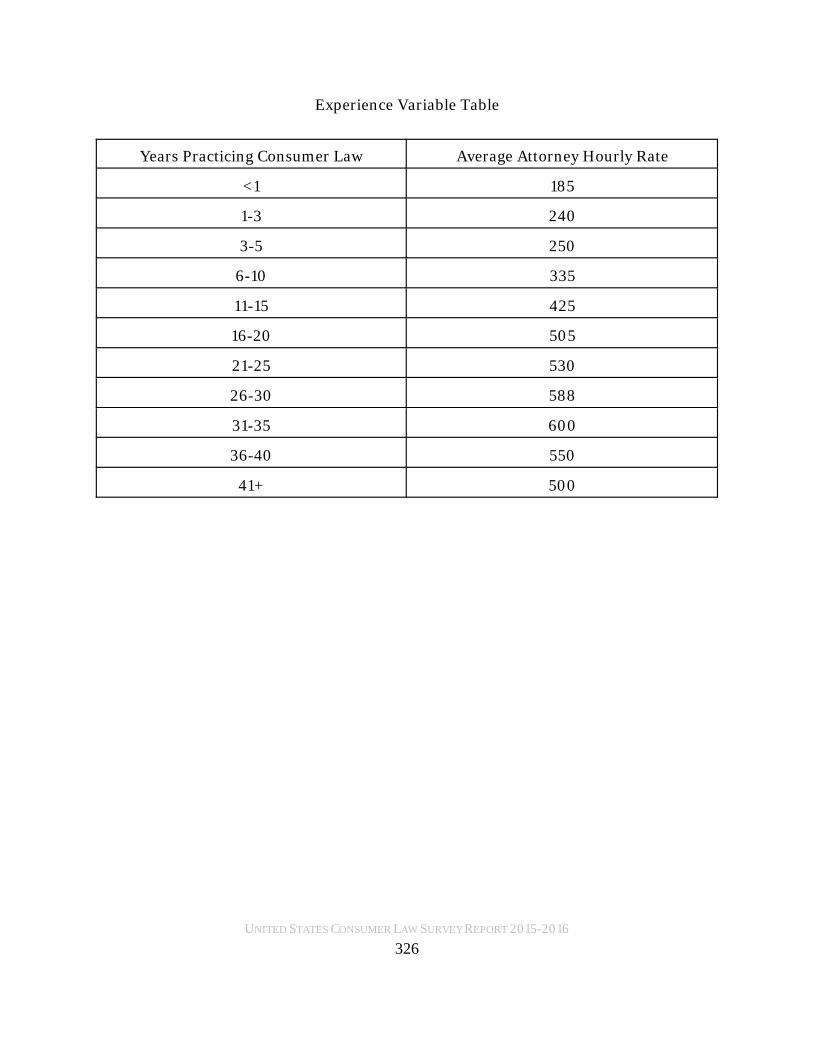
UNITED STATES CONSUMER LAW SURVEY REPORT 2015-2016
Experience Variable Table
Years Practicing Consumer Law Average Attorney Hourly Rate
<1 185
1-3 240
3-5 250
6-10 335
11-15 425
16-20 505
21-25 530
26-30 588
31-35 600
36-40 550
41+ 500
326

UNITED STATES CONSUMER LAW SURVEY REPORT 2015-2016
Pennsylvania, Scranton
Firm Size 2.6
Median Years in Practice 20.0
Concentration of Practice in Consumer Law 90.8
Primary Practice Area Consumer Law
Secondary Practice Area Other
Last Time Rate Change Occurred (months) 13.9
Median Number of Paralegals in Firm 1.5
Average Paralegal Rate for All Paralegals 128
Average Attorney Rate for All Attorneys 487
25% Median Attorney Rate for All Attorneys 350
Median Attorney Rate for All Attorneys 450
75% Median Attorney Rate for All Attorneys 675
95% Median Attorney Rate for All Attorneys 725
Median Rate for Practice Areas
Median
Attorneys Handling Bankruptcy Cases 300
Attorneys Handling Class Action Cases 600
Attorneys Handling Credit Rights Cases 450
Attorneys Handling Mortgage Cases 588
Attorneys Handling Vehicle Cases 450
Attorneys Handling TCPA Cases 500
Attorneys Handling Other Cases 600
327

UNITED STATES CONSUMER LAW SURVEY REPORT 2015-2016
Experience Variable Table
Years Practicing Consumer Law Average Attorney Hourly Rate
<1 185
1-3 240
3-5 250
6-10 335
11-15 425
16-20 505
21-25 530
26-30 588
31-35 600
36-40 550
41+ 500
328

UNITED STATES CONSUMER LAW SURVEY REPORT 2015-2016
Rhode Island, Providence
Firm Size 2.3
Median Years in Practice 37.5
Concentration of Practice in Consumer Law 70.0
Primary Practice Area Consumer Law
Secondary Practice Area Bankruptcy
Last Time Rate Change Occurred (months) 7.5
Median Number of Paralegals in Firm 3.0
Average Paralegal Rate for All Paralegals 136
Average Attorney Rate for All Attorneys 538
25% Median Attorney Rate for All Attorneys 350
Median Attorney Rate for All Attorneys 550
75% Median Attorney Rate for All Attorneys 600
95% Median Attorney Rate for All Attorneys 700
Median Rate for Practice Areas
Median
Attorneys Handling Bankruptcy Cases 350
Attorneys Handling Class Action Cases 600
Attorneys Handling Credit Rights Cases 700
Attorneys Handling Mortgage Cases 700
Attorneys Handling Vehicle Cases 700
Attorneys Handling TCPA Cases 600
Attorneys Handling Other Cases 600
329

UNITED STATES CONSUMER LAW SURVEY REPORT 2015-2016
Experience Variable Table
Years Practicing Consumer Law Average Attorney Hourly Rate
<1 175
1-3 180
3-5 225
6-10 275
11-15 278
16-20 305
21-25 350
26-30 470
31-35 600
36-40 700
41+ 500
330

UNITED STATES CONSUMER LAW SURVEY REPORT 2015-2016
Tennessee, Knoxville
Firm Size 2.0
Median Years in Practice 21.0
Concentration of Practice in Consumer Law 77.1
Primary Practice Area Consumer Law
Secondary Practice Area Bankruptcy
Last Time Rate Change Occurred (Months) 11.2
Median Number of Paralegals in Firm 1.4
Average Paralegal Rate for All Paralegals 125
Average Attorney Rate for All Attorneys 447
25% Median Attorney Rate for All Attorneys 270
Median Attorney Rate for All Attorneys 475
75% Median Rate for All Attorneys 600
95% Median Rate for All Attorneys 675
Median Rate for Practice Areas
Median
Attorneys Handling Bankruptcy Cases 250
Attorneys Handling Class Action Cases 475
Attorneys Handling Credit Rights Cases 513
Attorneys Handling Mortgage Cases 638
Attorneys Handling Vehicle Cases 388
Attorneys Handling TCPA Cases 550
Attorneys Handling Other Cases 475
331

UNITED STATES CONSUMER LAW SURVEY REPORT 2015-2016
Experience Variable Table
Years Practicing Consumer Law Average Attorney Hourly Rate
<1 175
1-3 225
3-5 275
6-10 300
11-15 675
16-20 250
21-25 475
26-30 433
31-35 438
36-40 450
41+ 375
332

UNITED STATES CONSUMER LAW SURVEY REPORT 2015-2016
Tennessee, Memphis
Firm Size 1.9
Median Years in Practice 22.5
Concentration of Practice in Consumer Law 52.5
Primary Practice Area Consumer Law
Secondary Practice Area Bankruptcy
Last Time Rate Change Occurred (Months) 29.3
Median Number of Paralegals in Firm 1.5
Average Paralegal Rate for All Paralegals 94
Average Attorney Rate for All Attorneys 363
25% Median Attorney Rate for All Attorneys 250
Median Attorney Rate for All Attorneys 283
75% Median Rate for All Attorneys 600
95% Median Rate for All Attorneys 675
Median Rate for Practice Areas
Median
Attorneys Handling Bankruptcy Cases 263
Attorneys Handling Class Action Cases 638
Attorneys Handling Credit Rights Cases 288
Attorneys Handling Mortgage Cases 600
Attorneys Handling Vehicle Cases 288
Attorneys Handling TCPA Cases 300
Attorneys Handling Other Cases 288
333

UNITED STATES CONSUMER LAW SURVEY REPORT 2015-2016
Experience Variable Table
Years Practicing Consumer Law Average Attorney Hourly Rate
<1 175
1-3 175
3-5 200
6-10 250
11-15 300
16-20 275
21-25 300
26-30 600
31-35 405
36-40 250
41+ 250
334

UNITED STATES CONSUMER LAW SURVEY REPORT 2015-2016
Tennessee, Nashville
Firm Size 2.0
Median Years in Practice 21.0
Concentration of Practice in Consumer Law 82.0
Primary Practice Area Consumer Law
Secondary Practice Area General Practice
Last Time Rate Change Occurred (Months) 9.6
Median Number of Paralegals in Firm 1.0
Average Paralegal Rate for All Paralegals 155
Average Attorney Rate for All Attorneys 455
25% Median Attorney Rate for All Attorneys 290
Median Attorney Rate for All Attorneys 475
75% Median Rate for All Attorneys 610
95% Median Rate for All Attorneys 675
Median Rate for Practice Areas
Median
Attorneys Handling Bankruptcy Cases 263
Attorneys Handling Class Action Cases 388
Attorneys Handling Credit Rights Cases 513
Attorneys Handling Mortgage Cases 675
Attorneys Handling Vehicle Cases 388
Attorneys Handling TCPA Cases 413
Attorneys Handling Other Cases 475
335
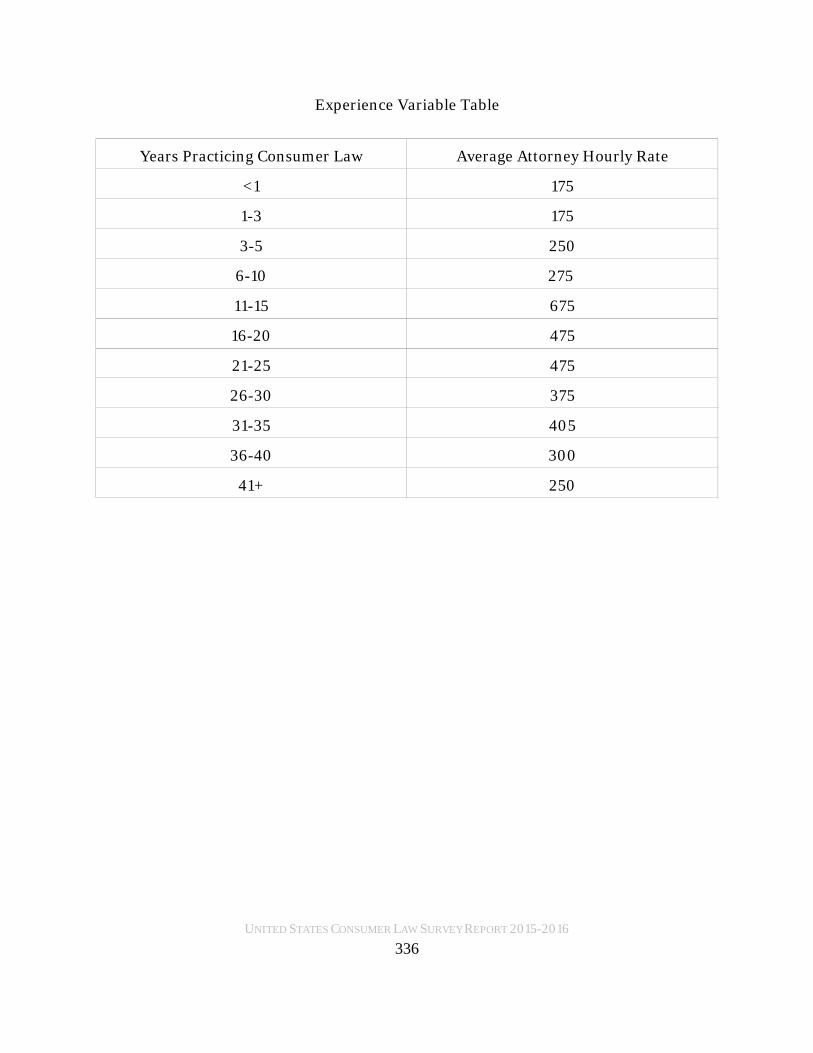
UNITED STATES CONSUMER LAW SURVEY REPORT 2015-2016
Experience Variable Table
Years Practicing Consumer Law Average Attorney Hourly Rate
<1 175
1-3 175
3-5 250
6-10 275
11-15 675
16-20 475
21-25 475
26-30 375
31-35 405
36-40 300
41+ 250
336
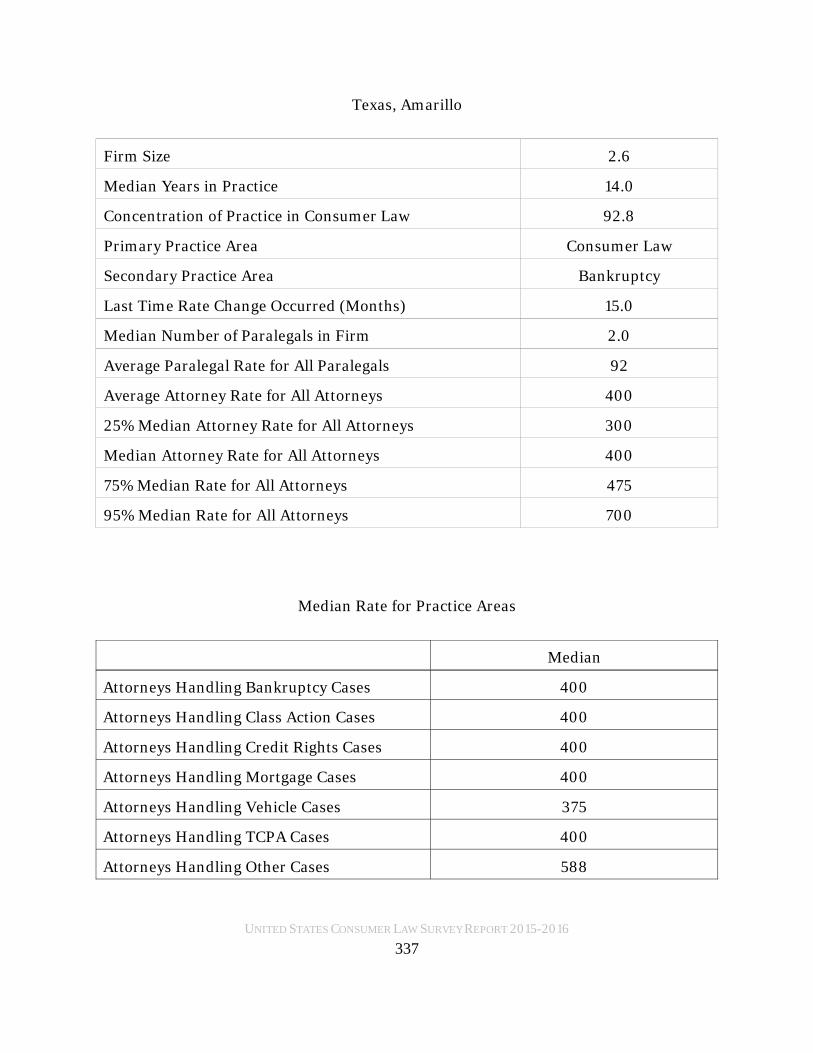
UNITED STATES CONSUMER LAW SURVEY REPORT 2015-2016
Texas, Amarillo
Firm Size 2.6
Median Years in Practice 14.0
Concentration of Practice in Consumer Law 92.8
Primary Practice Area Consumer Law
Secondary Practice Area Bankruptcy
Last Time Rate Change Occurred (Months) 15.0
Median Number of Paralegals in Firm 2.0
Average Paralegal Rate for All Paralegals 92
Average Attorney Rate for All Attorneys 400
25% Median Attorney Rate for All Attorneys 300
Median Attorney Rate for All Attorneys 400
75% Median Rate for All Attorneys 475
95% Median Rate for All Attorneys 700
Median Rate for Practice Areas
Median
Attorneys Handling Bankruptcy Cases 400
Attorneys Handling Class Action Cases 400
Attorneys Handling Credit Rights Cases 400
Attorneys Handling Mortgage Cases 400
Attorneys Handling Vehicle Cases 375
Attorneys Handling TCPA Cases 400
Attorneys Handling Other Cases 588
337

UNITED STATES CONSUMER LAW SURVEY REPORT 2015-2016
Experience Variable Table
Years Practicing Consumer Law Average Attorney Hourly Rate
<1 150
1-3 150
3-5 150
6-10 325
11-15 446
16-20 450
21-25 413
26-30 300
31-35 450
36-40 713
41+ 650
338

UNITED STATES CONSUMER LAW SURVEY REPORT 2015-2016
Texas, Austin
Firm Size 2.0
Median Years in Practice 14.0
Concentration of Practice in Consumer Law 70.3
Primary Practice Area Consumer Law
Secondary Practice Area Bankruptcy
Last Time Rate Change Occurred (months) 14.0
Median Number of Paralegals in Firm 2.0
Average Paralegal Rate for All Paralegals 111
Average Attorney Rate for All Attorneys 465
25% Median Attorney Rate for All Attorneys 325
Median Attorney Rate for All Attorneys 430
75% Median Attorney Rate for All Attorneys 525
95% Median Attorney Rate for All Attorneys 725
Median Rate for Practice Areas
Median
Attorneys Handling Bankruptcy Cases 400
Attorneys Handling Class Action Cases 510
Attorneys Handling Credit Rights Cases 440
Attorneys Handling Mortgage Cases 425
Attorneys Handling Vehicle Cases 430
Attorneys Handling TCPA Cases 425
Attorneys Handling Other Cases 475
339

UNITED STATES CONSUMER LAW SURVEY REPORT 2015-2016
Experience Variable Table
Years Practicing Consumer Law Average Attorney Hourly Rate
<1 180
1-3 200
3-5 350
6-10 375
11-15 510
16-20 550
21-25 500
26-30 505
31-35 526
36-40 725
41+ 725
340

UNITED STATES CONSUMER LAW SURVEY REPORT 2015-2016
Texas, Dallas – Fort Worth
Firm Size 2.6
Median Years in Practice 12.0
Concentration of Practice in Consumer Law 92.8
Primary Practice Area Consumer Law
Secondary Practice Area Bankruptcy
Last Time Rate Change Occurred (months) 19.6
Median Number of Paralegals in Firm 2.1
Average Paralegal Rate for All Paralegals 80
Average Attorney Rate for All Attorneys 382
25% Median Attorney Rate for All Attorneys 300
Median Attorney Rate for All Attorneys 400
75% Median Attorney Rate for All Attorneys 450
95% Median Attorney Rate for All Attorneys 700
Median Rate for Practice Areas
Median
Attorneys Handling Bankruptcy Cases 350
Attorneys Handling Class Action Cases 400
Attorneys Handling Credit Rights Cases 400
Attorneys Handling Cases 350
Attorneys Handling Vehicle Cases 388
Attorneys Handling TCPA Cases 400
Attorneys Handling Other Cases 400
341

UNITED STATES CONSUMER LAW SURVEY REPORT 2015-2016
Experience Variable Table
Years Practicing Consumer Law Average Attorney Hourly Rate
<1 175
1-3 205
3-5 225
6-10 350
11-15 433
16-20 400
21-25 367
26-30 300
31-35 500
36-40 700
41+ 700
342

UNITED STATES CONSUMER LAW SURVEY REPORT 2015-2016
Texas, Houston
Firm Size 2.6
Median Years in Practice 11.0
Concentration of Practice in Consumer Law 70.1
Primary Practice Area Consumer Law
Secondary Practice Area Bankruptcy
Last Time Rate Change Occurred (months) 16.3
Median Number of Paralegals in Firm 2.0
Average Paralegal Rate for All Paralegals 89
Average Attorney Rate for All Attorneys 372
25% Median Attorney Rate for All Attorneys 300
Median Attorney Rate for All Attorneys 350
75% Median Attorney Rate for All Attorneys 450
95% Median Attorney Rate for All Attorneys 700
Median Rate for Practice Areas
Median
Attorneys Handling Bankruptcy Cases 350
Attorneys Handling Class Action Cases 388
Attorneys Handling Credit Rights Cases 375
Attorneys Handling Mortgage Cases 350
Attorneys Handling Vehicle Cases 375
Attorneys Handling TCPA Cases 375
Attorneys Handling Other Cases 350
343

UNITED STATES CONSUMER LAW SURVEY REPORT 2015-2016
Experience Variable Table
Years Practicing Consumer Law Average Attorney Hourly Rate
<1 150
1-3 150
3-5 288
6-10 311
11-15 439
16-20 400
21-25 350
26-30 393
31-35 433
36-40 700
41+ 725
344

UNITED STATES CONSUMER LAW SURVEY REPORT 2015-2016
Texas, San Antonio
Firm Size 2.6
Median Years in Practice 11.5
Concentration of Practice in Consumer Law 70.3
Primary Practice Area Consumer Law
Secondary Practice Area Bankruptcy
Last Time Rate Change Occurred (months) 16.0
Median Number of Paralegals in Firm 1.9
Average Paralegal Rate for All Paralegals 93
Average Attorney Rate for All Attorneys 388
25% Median Attorney Rate for All Attorneys 275
Median Attorney Rate for All Attorneys 363
75% Median Attorney Rate for All Attorneys 450
95% Median Attorney Rate for All Attorneys 700
Median Rate for Practice Areas
Median
Attorneys Handling Bankruptcy Cases 350
Attorneys Handling Class Action Cases 425
Attorneys Handling Credit Rights Cases 375
Attorneys Handling Mortgage Cases 350
Attorneys Handling Vehicle Cases 375
Attorneys Handling TCPA Cases 375
Attorneys Handling Other Cases 400
345

UNITED STATES CONSUMER LAW SURVEY REPORT 2015-2016
Experience Variable Table
Years Practicing Consumer Law Average Attorney Hourly Rate
<1 150
1-3 150
3-5 292
6-10 310
11-15 439
16-20 415
21-25 417
26-30 420
31-35 438
36-40 713
41+ 550
346

UNITED STATES CONSUMER LAW SURVEY REPORT 2015-2016
Virginia, Richmond
Firm Size 2.3
Median Years in Practice 20.0
Concentration of Practice in Consumer Law 80.0
Primary Practice Area Consumer Law
Secondary Practice Area General Practice
Last Time Rate Change Occurred (months) 9.0
Median Number of Paralegals in Firm 1.5
Average Paralegal Rate for All Paralegals 163
Average Attorney Rate for All Attorneys 419
25% Median Attorney Rate for All Attorneys 250
Median Attorney Rate for All Attorneys 375
75% Median Attorney Rate for All Attorneys 450
95% Median Attorney Rate for All Attorneys 675
Median Rate for Practice Areas
Median
Attorneys Handling Bankruptcy Cases 300
Attorneys Handling Class Action Cases 563
Attorneys Handling Credit Rights Cases 375
Attorneys Handling Mortgage Cases 563
Attorneys Handling Vehicle Cases 300
Attorneys Handling TCPA Cases 300
Attorneys Handling Other Cases 325
347

UNITED STATES CONSUMER LAW SURVEY REPORT 2015-2016
Experience Variable Table
Years Practicing Consumer Law Average Attorney Hourly Rate
<1 180
1-3 250
3-5 325
6-10 385
11-15 675
16-20 404
21-25 450
26-30 425
31-35 450
36-40 300
41+ 350
348
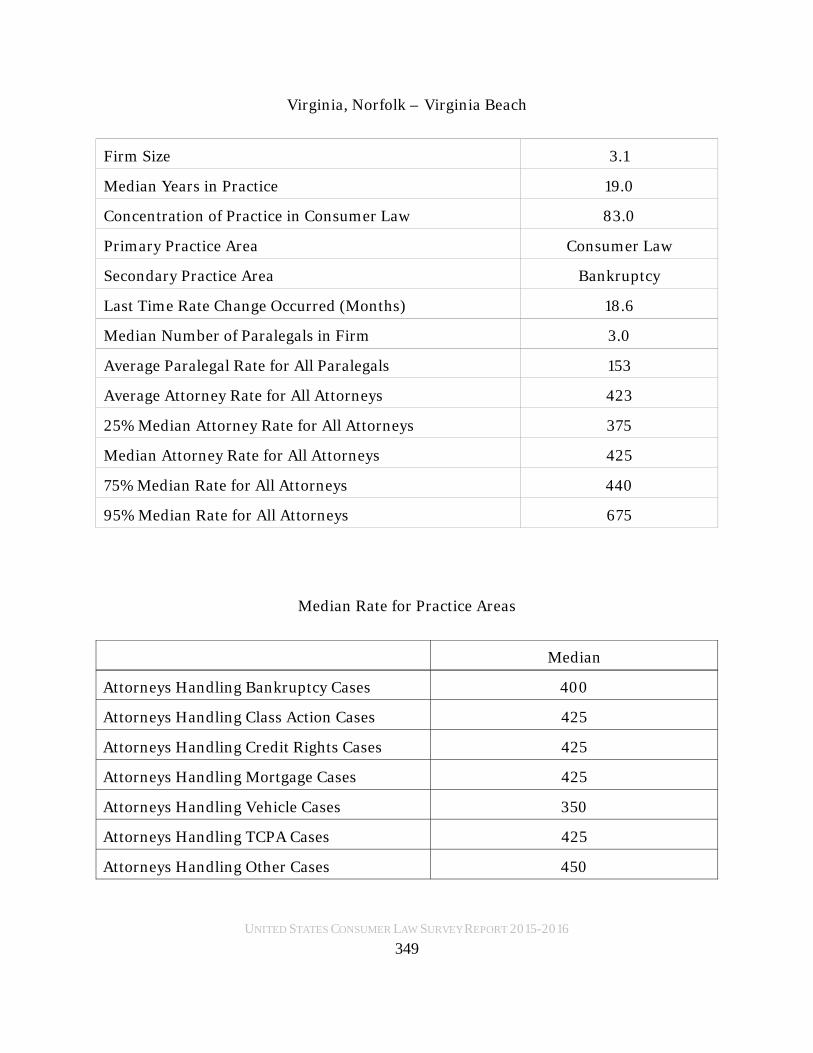
UNITED STATES CONSUMER LAW SURVEY REPORT 2015-2016
Virginia, Norfolk – Virginia Beach
Firm Size 3.1
Median Years in Practice 19.0
Concentration of Practice in Consumer Law 83.0
Primary Practice Area Consumer Law
Secondary Practice Area Bankruptcy
Last Time Rate Change Occurred (Months) 18.6
Median Number of Paralegals in Firm 3.0
Average Paralegal Rate for All Paralegals 153
Average Attorney Rate for All Attorneys 423
25% Median Attorney Rate for All Attorneys 375
Median Attorney Rate for All Attorneys 425
75% Median Rate for All Attorneys 440
95% Median Rate for All Attorneys 675
Median Rate for Practice Areas
Median
Attorneys Handling Bankruptcy Cases 400
Attorneys Handling Class Action Cases 425
Attorneys Handling Credit Rights Cases 425
Attorneys Handling Mortgage Cases 425
Attorneys Handling Vehicle Cases 350
Attorneys Handling TCPA Cases 425
Attorneys Handling Other Cases 450
349

UNITED STATES CONSUMER LAW SURVEY REPORT 2015-2016
Experience Variable Table
Years Practicing Consumer Law Average Attorney Hourly Rate
<1 175
1-3 250
3-5 270
6-10 325
11-15 675
16-20 404
21-25 450
26-30 425
31-35 450
36-40 450
41+ 355
350

UNITED STATES CONSUMER LAW SURVEY REPORT 2015-2016
Washington, Seattle - Tacoma
Firm Size 2.4
Median Years in Practice 22.0
Concentration of Practice in Consumer Law 75.8
Primary Practice Area Consumer Law
Secondary Practice Area Bankruptcy
Last Time Rate Change Occurred (Months) 22.5
Median Number of Paralegals in Firm 1.9
Average Paralegal Rate for All Paralegals 78
Average Attorney Rate for All Attorneys 383
25% Median Attorney Rate for All Attorneys 275
Median Attorney Rate for All Attorneys 338
75% Median Rate for All Attorneys 475
95% Median Rate for All Attorneys 700
Median Rate for Practice Areas
Median
Attorneys Handling Bankruptcy Cases 300
Attorneys Handling Class Action Cases 575
Attorneys Handling Credit Rights Cases 350
Attorneys Handling Mortgage Cases 488
Attorneys Handling Vehicle Cases 375
Attorneys Handling TCPA Cases 538
Attorneys Handling Other Cases 275
351

UNITED STATES CONSUMER LAW SURVEY REPORT 2015-2016
Experience Variable Table
Years Practicing Consumer Law Average Attorney Hourly Rate
<1 200
1-3 200
3-5 260
6-10 325
11-15 513
16-20 500
21-25 500
26-30 250
31-35 300
36-40 475
41+ 375
352

UNITED STATES CONSUMER LAW SURVEY REPORT 2015-2016
Washington, Spokane
Firm Size 2.1
Median Years in Practice 11.0
Concentration of Practice in Consumer Law 91.4
Primary Practice Area Consumer Law
Secondary Practice Area Other
Last Time Rate Change Occurred (Months) 16.3
Median Number of Paralegals in Firm 2.0
Average Paralegal Rate for All Paralegals 98
Average Attorney Rate for All Attorneys 429
25% Median Attorney Rate for All Attorneys 250
Median Attorney Rate for All Attorneys 350
75% Median Rate for All Attorneys 575
95% Median Rate for All Attorneys 700
Median Rate for Practice Areas
Median
Attorneys Handling Bankruptcy Cases 250
Attorneys Handling Class Action Cases 525
Attorneys Handling Credit Rights Cases 363
Attorneys Handling Mortgage Cases 688
Attorneys Handling Vehicle Cases 375
Attorneys Handling TCPA Cases 375
Attorneys Handling Other Cases 250
353

UNITED STATES CONSUMER LAW SURVEY REPORT 2015-2016
Experience Variable Table
Years Practicing Consumer Law Average Attorney Hourly Rate
<1 200
1-3 225
3-5 288
6-10 325
11-15 513
16-20 500
21-25 500
26-30 250
31-35 300
36-40 700
41+ 375
354

UNITED STATES CONSUMER LAW SURVEY REPORT 2015-2016
Wisconsin, Eau Claire
Firm Size 2.1
Median Years in Practice 20.0
Concentration of Practice in Consumer Law 89.4
Primary Practice Area Consumer Law
Secondary Practice Area Criminal Law, Securities
Last Time Rate Change Occurred (Months) 13.7
Median Number of Paralegals in Firm 2.0
Average Paralegal Rate for All Paralegals 92
Average Attorney Rate for All Attorneys 419
25% Median Attorney Rate for All Attorneys 325
Median Attorney Rate for All Attorneys 425
75% Median Attorney Rate for All Attorneys 500
95% Median Attorney Rate for All Attorneys 700
Median Rate for Practice Areas
Median
Attorneys Handling Bankruptcy Cases 275
Attorneys Handling Class Action Cases 675
Attorneys Handling Credit Rights Cases 425
Attorneys Handling Mortgage Cases 488
Attorneys Handling Vehicle Cases 425
Attorneys Handling TCPA Cases 425
Attorneys Handling Other Cases 425
355

UNITED STATES CONSUMER LAW SURVEY REPORT 2015-2016
Experience Variable Table
Years Practicing Consumer Law Average Attorney Hourly Rate
<1 250
1-3 250
3-5 325
6-10 325
11-15 388
16-20 475
21-25 350
26-30 425
31-35 425
36-40 700
41+ 500
356
UNITED STATES CONSUMER LAW SURVEY REPORT 2015-2016
Wisconsin, Milwaukee
Firm Size 2.4
Median Years in Practice 25.0
Concentration of Practice in Consumer Law 92.7
Primary Practice Area Consumer Law
Secondary Practice Area Bankruptcy
Last Time Rate Change Occurred (Months) 11.1
Median Number of Paralegals in Firm 2.0
Average Paralegal Rate for All Paralegals 103
Average Attorney Rate for All Attorneys 437
25% Median Attorney Rate for All Attorneys 350
Median Attorney Rate for All Attorneys 425
75% Median Attorney Rate for All Attorneys 490
95% Median Attorney Rate for All Attorneys 700
Median Rate for Practice Areas
Median
Attorneys Handling Bankruptcy Cases 300
Attorneys Handling Class Action Cases 575
Attorneys Handling Credit Rights Cases 350
Attorneys Handling Mortgage Cases 488
Attorneys Handling Vehicle Cases 375
Attorneys Handling TCPA Cases 538
Attorneys Handling Other Cases 275
357
UNITED STATES CONSUMER LAW SURVEY REPORT 2015-2016
Experience Variable Table
Years Practicing Consumer Law Average Attorney Hourly Rate
<1 250
1-3 250
3-5 325
6-10 300
11-15 563
16-20 475
21-25 350
26-30 425
31-35 425
36-40 538
41+ 500
358
UNITED STATES CONSUMER LAW SURVEY REPORT 2015-2016
5. Survey Techniques
Surveys are widely considered to be important tools in any evaluation process.
There are fundamentally two types of surveys: open ended questioning and closed ended
questioning.
Open ended questions allow the responder to respond in any manner at all with
no definite answer. Close ended questions provide a limited number of possible answers
from which a response can be chosen by the responder. Because open ended questions
allow for an unlimited response, they can lead to a subjective analysis and the results are
almost always more difficult to interpret and quantify for analysis.
Close ended questions, however, lend their responses to easy statistical analysis.
There are five types of close ended questions.
A Likert-scale question allows for responses on a scale and allows a responder to
state their feelings about an issue, such as strongly agree to strongly disagree. Multiple
choice questions allow the responder to select from a finite number of responses.
Ordinal questions ask the responder to rate things in relation to each other, such as
selecting the most important to the least important responses about an issue.
Categorical questions first place the responder in a category and then poses questions
based on those categories, such as preceding questions with the initial inquiry of
whether the responder is male or female. Numerical questions are used when the
answer must be a real number.
Different types of questions are used in survey work so that different types of
results analyses may be conducted, but the most common survey techniques are the
numerical and the multiple choice question because of the ease with which conclusions
may be derived from the raw data.
This survey used numerical questions and two multiple choice questions. This
allows for precise responses that can readily be cataloged and statistically interpreted.
359
UNITED STATES CONSUMER LAW SURVEY REPORT 2015-2016
6. Cases Employing Use of Prior Editions of this Survey Report
Since 1999, when the data in this Survey Report first began to be compiled, the
Survey Report has undergone various revisions in both substance and data analysis.
Each revision resulted in further refinement of both the data as gathered and the final
Survey Report as published. As various Courts considered previously published Survey
Reports in years past, refinements in data gathering, analysis, and reporting were made
periodically to both achieve improvements and address judicial commentary and
criticism.
This continued refinement resulted in a major revision in data gathering,
analysis, and reporting that occurred with the publishing of the United States Consumer
Law Attorney Fee Survey for 2013-2014. That edition of the Survey Report added
detailed reporting on specific geocentric data from 29 states and the District of
Columbia and 46 greater metropolitan areas.
This new 2015-2016 edition of the Survey Report takes the analyses one step
further by broadening the coverage to all 50 states, the District of Columbia and the U.S.
Territories of Puerto Rico and the U.S. Virgin Islands along with 98 high-population
greater metropolitan areas.
While Courts frequently look to an attorney’s normal hourly rate in making fee
determinations, Courts may also consider market rates in the attorney’s community,
either in the absence of a stated hourly rate for the fee applicant or in addition to it.
Reasonable hourly rates are to be determined on the basis of
market rates for services rendered. An "attorney's actual
billing rate for comparable work is 'presumptively
appropriate' to use as the market rate." People Who Care v.
Rockford Bd. of Educ. Sch. Dist. No. 205, 90 F.3d 1307, 1310
(7th Cir., 1996). If the attorney has no actual billing rate, "the
court should look to the next best evidence – the rate
charged by lawyers in the community of 'reasonably
comparable skill, experience and reputation.'" Id. (quoting
Blum v. Stenson, 465 U.S. 886, 892, 895 n. 11 (1984)); see
also Spegon v. The Catholic Bishop of Chi., 175 F.3d 544, 556
(7th Cir., 1999).
360
UNITED STATES CONSUMER LAW SURVEY REPORT 2015-2016
Sierra Club v. Jackson, 2013 U.S. Dist. LEXIS 137217, *5, 2013 WL 5409036 (W.D.
Wis., Sept. 25, 2013)
Nevertheless,
"the attorney's actual billing rate for comparable work is
presumptively appropriate to use as the market rate." 175
F.3d at 555 (quoting People Who Care v. Rockford Bd. Of
Educ. School Dist. No. 205, 90 F.3d 1307, 1310 (7th Cir.
1996)). [**10] Only if an attorney is unable to provide
evidence of her actual billing rates should a district court
look to other evidence, including "rates similar experienced
attorneys in the community charge paying clients for similar
work." 175 F.3d at 555. Therefore, SIU is correct in asserting
that looking to the southern Illinois legal community's rate
would have been appropriate, but only if the district court
provided an adequate reason to use a rate other than the
presumed market rate, i.e., the appellants' market rate.
However, just because the proffered rate is higher than the
local rate does not mean that a district court may freely
adjust that rate downward. When a [*744] local attorney
has market rates that are higher than the local average,"[a]
judge who departs from this presumptive rate must have
some reason other than the ability to identify a different
average rate in the community." Gusman, 986 F.2d at 1151.
Similarly, if an out-of-town attorney has a higher hourly rate
than local practitioners, district courts should defer to the
out-of-town attorney's rate when calculating the lodestar
amount, though if "local attorneys could do as well, and there
is no other [**11] reason to have them performed by the
former, then the judge, in his discretion, might allow only an
hourly rate which local attorneys would have charged for the
same service."
Mathur v. Bd. of Trs. of S. Ill. Univ., 317 F.3d 738, 743-744, 2003 U.S. App. LEXIS 1055,
*9-11, 90 Fair Empl. Prac. Cas. (BNA) 1537, 84 Empl. Prac. Dec. (CCH) P41,400 (7th Cir.
Ill., Jan. 24, 2003)
361
UNITED STATES CONSUMER LAW SURVEY REPORT 2015-2016
In looking at the market rates in the applicant’s community, Courts frequently
consider and use survey data in their decision-making involving fee disputes, finding it
an economical and impartial means of determining contested fee issues.
When two metropolitan areas are near each other, their hourly rates may be
found to be comparable. See, Arana v. Monterey Fin. Servs., 2016 U.S. Dist. LEXIS
46111, *6, 2016 WL 1324269 (S.D. Cal., Apr. 5, 2016) (“Of all the hourly rate evidence
submitted by the parties, the most relevant is the Consumer Fee Survey's data for first
year Los Angeles, California consumer law attorneys. Of all the cities represented in the
Consumer Fee Survey, Los Angeles is the one that's geographically closest to San Diego.
The Court's independent research suggests that Los Angeles and San Diego rates are
similar.....”).
Some of the cases using the U.S. Consumer Law Attorney Fee Survey Report
when deciding attorney fee disputes in Consumer Law cases, include the following.
In re Sears, 2016 U.S. Dist. LEXIS 124235, 2016 WL 4765679 (N.D. E.D., Ill.,
Sep. 13, 2016) (a class action case considering the Laffey Matrix, the National Law
Journal Survey and the 2013-2014 U.S. Consumer Law Attorney Fee Survey and using
the median rate schedules for Chicago area survey data contained in the 2013-2014
Report in conjunction with both the Matrix and the NLJ survey).
Reid v. Unilever United States, Inc., 2015 U.S. Dist. LEXIS 75383, *50, 2015 WL
3653318 (N.D. Ill., June 10, 2015) (a class action case finding the Laffey Matrix rates to
be supported by the Chicago area survey data contained in the 2010-2011 Report;
“However, because the Matrix rate recommended here is supported by the
Chicago-specific rates contained in the Report, the Court concludes that it is
reasonable.”).
Crafton v. Law Firm of Jonathan B. Levine, 2014 U.S. Dist. LEXIS 29690, 2014
WL 907423 (E.D. Wis., Mar. 7, 2014) (“Several courts in this District have recognized
the Fee Survey as a reliable resource in determining the reasonableness of an attorney's
hourly rate, particularly in conjunction with consideration of counsel's experience. See
Moreland v. Dorsey Thornton & Assocs., LLC, 2011 U.S. Dist. LEXIS 54487, 2011 WL
1980282, *3 (E.D. Wis., May 20, 2011) (relying on counsel's website, which lists the
attorney profiles, along with the United States Consumer Law Attorney Fee Survey in
determining that the requested hourly rate was reasonable); House v. Shapiro & Price,
2011 U.S. Dist. LEXIS 38322, 2011 WL 1219247 (E.D. Wis., Mar. 30, 2011) (same);
362
UNITED STATES CONSUMER LAW SURVEY REPORT 2015-2016
Suleski v. Bryant Lafayette & Assocs., 2010 U.S. Dist. LEXIS 55353, 2010 WL 1904968
(E.D. Wis., May 10, 2010) (same).”)
Davis v. Hollins Law, 25 F.Supp.3d 1292, 2014 U.S. Dist. LEXIS 81024, 2014 WL
2619651 (E.D. Cal., Jun. 12, 2014) (“Plaintiff also relies on the United States Consumer
Law Attorney Fee Survey Report 2010-2011 * * * The court has reviewed the
methodology underlying the Survey, and finds it credible.”).
Decker v. Transworld Systems, Inc., 2009 U.S. Dist. LEXIS 78987, 2009 WL
2916819, N.D., Ill., Sept. 01, 2009 (finding results in the 2007 United States Consumer
Law Attorney Fee Survey Report to be supported by the Laffey Matrix).
Beach v. LVNV Funding, LLC, 2013 U.S. Dist. LEXIS 162926, 2013 WL 6048989
(E.D. Wis., Nov. 15, 2013) (“... several courts in this District have recognized the Fee
Survey as a reliable resource in determining the reasonableness of an attorney's hourly
rate, particularly in conjunction with consideration of counsel's experience.”).
Dibish v. Ameriprise Fin. Servs., 2015 Pa. Dist. & Cnty. Dec. LEXIS 432, *17-18
(Pa. C.P., Mar. 23, 2015) (“In setting Mr. Behrend's rate at $350 per hour, I considered
all of the materials [18] submitted by the parties. The most objective document, and
therefore what I considered most important in my analysis, was the "United Sates
Consumer Law Attorney Fee Survey Report 2010-2011,".....).
Lockmon v. Thomas F. Farrell, P.C., 2012 U.S. Dist. LEXIS 178661, 2012 WL
6590426, at *3 (D. Colo., Dec. 18, 2012) ("the Court finds that the average rates set forth
in the [Consumer Law Attorney Fee] Survey are reasonable”).
LaFountain, Jr v. Paul Benton Motors of North Carolina, LLC, 2010 U.S. Dist.
LEXIS 121631, 2010 WL 4457057 (E.D. NC, Nov. 5, 2010) (Senior U.S. District Judge
James C. Fox specifically finds the U.S. Consumer Law Attorney Fee Survey Report to
be persuasive, after rejecting the National Law Journal’s fee survey and the U.S.
Attorney’s Laffey Matrix as unpersuasive in consumer law cases: “The court does,
however, find the evidence in the United States Consumer Law Attorney Fee Survey to
be persuasive”).
Ramirez v. N. Am. Asset Servs., LLC, 2012 U.S. Dist. LEXIS 54641 (C.D. Cal.,
Apr. 9, 2012) (stating that the argument opposing the Survey was “untethered” to reality
in light of the Survey report’s resulting data).
363
UNITED STATES CONSUMER LAW SURVEY REPORT 2015-2016
Lindenbaum v. NCO Fin. Sys., 2011 U.S. Dist. LEXIS 78069, 2011 WL 2848748
(E.D. Pa., July 19, 2011) (using both the U.S. Consumer Law Attorney Fee Survey
Report and the U.S. Attorney’s Laffey Matrix in determining a fee award).
Suleski v. Bryant Lafayette & Associates, 2010 U.S. Dist. LEXIS 55353, 2010 WL
1904968 (E.D. Wis., May 10, 2010) (“However, the United States Consumer Law
Attorney Fee Survey for 2008-09 for the Midwest and California, see
www.consumerlaw.org/feesurvey (last visited May 7, 2010), supports the
reasonableness of the hourly rates sought by counsel in light of their experience”).
Vahidy v. Transworld Systems, Inc., 2009 U.S. Dist. LEXIS 78984, 2009 WL
2916825 (N.D. Ill., September 01, 2009) (finding results in the 2007 United States
Consumer Law Attorney Fee Survey Report to be “supported by the Laffey Matrix”).
Bratton v. Thomas Law Firm PC, 943 F. Supp. 2d 897 (N.D. Ind. 2013) (“In
Moore v. Midland Credit Mgmt., Inc., 2012 U.S. Dist. LEXIS 176600, 2012 WL 6217597
(N.D. Ind. Dec. 12, 2012), this Court recently analyzed the applicability of both the
Consumer Law Attorney Fee Survey Report and the Laffey Matrix. [904] The Court
found that the Report "provides a general range for billing rates that is useful as one
factor in a court's multi-factor analysis." 2012 U.S. Dist. LEXIS 176600, [WL] at *4.”).
Beach v. LVNV Funding, LLC, 2013 U.S. Dist. LEXIS 162926, 2013 WL 6048989
(E.D. Wis. Nov. 15, 2013). (“As Beach points out, several courts in this District have
recognized the Fee Survey as a reliable resource in determining the reasonableness of an
attorney's hourly rate, particularly in conjunction with consideration of counsel's
experience.”).
Cases Listed by State or Other Jurisdiction
A more comprehensive listing of cases using the U.S. Consumer Law Attorney
Fee Survey Report when deciding attorney fee disputes in Consumer Law cases includes
those on the following list.
Alabama
Hicks v City of Tuscaloosa, 2016 U.S. Dist. LEXIS 174579, 2016 WL 7029827
(N.D., Alabama, May 24, 2016) (in Discrimination under Family and Medical Leave Act
case, awarding $154,192.50 in fees to prevailing plaintiff).
364

UNITED STATES CONSUMER LAW SURVEY REPORT 2015-2016
Jordan v City of Birmingham, 2015 U.S. Dist. LEXIS 183532, 2015 WL
12830455 (N.D. Alabama, June 22, 2015) (in hostile work environment case under
EEOC, requested fees of $61,850 awarded to Plaintiff as supported by Survey Report).
Arizona
Savage v NIC, Inc., 2010 U.S. Dist. LEXIS 60311, 2010 WL 2347028 (D. Ariz.,
June 9, 2010).
Shelago v. Marshall & Ziolkowski Enterprise, LLC, 2009 U.S. Dist. LEXIS
38940, 2009 WL 1097534 (D. Ariz., 2009., April 22, 2009).
California
Medina v. South Coast Car Co., 2017 Cal. App. LEXIS 820, 2017 WL 4247131
(C.A., 4th App Dist, Div. One, Sept 19, 2017).
Hollandsworth v McDowell, 2015 WL 12830177 (Cal. Super., May 20, 2015).
California, E.D.
Uhl v. Colvin, 2016 U.S. Dist. LEXIS 78779, 2016 WL 3361800 (E.D. Cal., June
16, 2016).
Davis v. Hollins Law, 25 F.Supp.3d 1292, 2014 U.S. Dist. LEXIS 81024, 10-12
(E.D. Cal., June 12, 2014).
Broad. Music Inc. v. Antigua Cantina & Grill, LLC, 2013 U.S. Dist. LEXIS 72122,
2013 WL 2244641 (E.D. Cal., May 20, 2013).
California, C.D.
Ramirez v. N. Am. Asset Servs., LLC, 2012 U.S. Dist. LEXIS 54641, 2012 WL
1228086 (C.D. Cal., Apr. 9, 2012)
Krapf v Nationwide Credit, Inc., 2010 U.S. Dist. LEXIS 116689, 2010 WL
4261444 (C.D. Cal., October 21, 2010).
365

UNITED STATES CONSUMER LAW SURVEY REPORT 2015-2016
California, N.D.
Senah, Inc. v. Xi'an Forstar S&T Co, 2016 U.S. Dist. LEXIS 72293, 2016 WL
3092099 (N.D. Cal., June 2, 2016).
Klein v. Law Offices of D. Scott Carruthers, 2015 U.S. Dist. LEXIS 75269, 2015
WL 3626946 (N.D. Cal., June 10, 2015).
Hampton v. Colvin, 2015 U.S. Dist. LEXIS 53630, 2015 WL 1884313 (N.D. Cal.,
Apr. 23, 2015).
Brown v. Mandarich Law Group, LLP, 2014 U.S. Dist. LEXIS 47020, 2014 WL
1340211 (N.D. Cal., Apr. 2, 2014).
Castro v. Commercial Recovery Sys., 2014 U.S. Dist. LEXIS 33675 (N.D. Cal.,
Mar. 13, 2014).
Stephenson v Neutrogena Corporation, 2013 WL12310811 (N.D.Cal., Aug. 22,
2013).
Garcia v. Resurgent Capital Servs., 2012 U.S. Dist. LEXIS 123889, 2012 WL
3778852 (N.D. Cal., Aug. 30, 2012).
California, S.D.
Arana v. Monterey Fin. Servs., 2016 U.S. Dist. LEXIS 46111, 2016 WL 1324269
(S.D. Cal., Apr. 5, 2016).
Nguyen v. HOVG, LLC, 2015 U.S. Dist. LEXIS 124019, 2015 WL 5476254 (S.D.
Cal., Sept. 15, 2015).
De La Torre v. Legal Recovery Law Office, 2014 U.S. Dist. LEXIS 128220, 2014
WL 4547035 (S.D. Cal., Sept. 12, 2014).
Verdun v. I.C. Sys., 2014 U.S. Dist. LEXIS 52238, 2014 WL 1456295 (S.D. Cal.,
Apr. 14, 2014).
Diaz v. Kubler Corp., 2014 WL 12789109 (S.D. Cal., Mar. 26, 2014).
366

UNITED STATES CONSUMER LAW SURVEY REPORT 2015-2016
Delalat v. Syndicated Office Sys., 2014 U.S. Dist. LEXIS 33756, 2014 WL 930162
(S.D. Cal., Jan. 28, 2014).
Crawford v. Dynamic Recovery Servs., 2014 U.S. Dist. LEXIS 4057, 2014 WL
130458 (S.D. Cal., Jan. 10, 2014).
Breidenbach v. Experian, 2013 U.S. Dist. LEXIS 82093, 2013 WL 2631368 (S.D.
Cal., June 11, 2013).
Colorado
Harper v. Stellar Recovery, Inc., 2015 U.S. Dist. LEXIS 154479, 2015 WL
7253239 (D. Colo., Nov. 16, 2015).
Villanueva v Account Discovery Systems, LLC, 77 F.Supp.3d 1058 (D. Colorado,
2015).
Crapnell v. Dillon Cos., 2015 U.S. Dist. LEXIS 96184, 2015 WL 4484469 (D.
Colo., July 22, 2015).
Gregg v. N.A.R., Inc., 2014 U.S. Dist. LEXIS 32017, 2014 WL 959412 (D. Colo.,
Mar. 12, 2014).
Reichers v. Del. Asset Mgmt., LLC, 2013 U.S. Dist. LEXIS 164981, 2013 WL
6096136 (D. Colo., Nov. 20, 2013).
Rodriguez v. Luchey & Mitchell Recovery Solutions, LLC, 2013 U.S. Dist. LEXIS
164285, 2013 WL 6068458 (D. Colo., Nov. 18, 2013).
Andalam v. Trizetto Group, 2013 U.S. Dist. LEXIS 159656, 2013 WL 5952012 (D.
Colo., Nov. 7, 2013).
Bock v. APIM, LLC, 2013 U.S. Dist. LEXIS 176648 (D. Colo., Nov. 7, 2013).
Peterson-Hooks v. First Integral Recovery, LLC, 2013 U.S. Dist. LEXIS 73907,
2013 WL 229544 (D. Colo., May 24, 2013).
Scadden v. Weinberg, Stein & Associates, LLC, 2013 U.S. Dist. LEXIS 57939,
367

UNITED STATES CONSUMER LAW SURVEY REPORT 2015-2016
2013 WL 1751294, at *6 (D. Colo., Apr. 23, 2013).
Lockmon v. Thomas F. Farrell, P.C., 2012 U.S. Dist. LEXIS 178661, 2012 WL
6590426, at *3 (D. Colo., Dec. 18, 2012).
Anderson v. Nat'l Credit Sys.,2010 U.S. Dist. LEXIS 134268 (D. Colo., Dec. 1,
2010).
Florida, M.D.
Alvarado v Featured Mediation, LLC, 2017 U.S. Dist. LEXIS 88022, 2017 WL
2480606 (M.D. Fla., Jun. 8, 2017).
Santarlas v. Steube, 2017 U.S. Dist. LEXIS 383 (M.D. Fla., Jan. 3, 2017).
Lane v. Accredited Collection Agency, Inc., 2014 U.S. Dist. LEXIS 58502, 2014
WL 1685677 (M.D. Fla. Apr. 25, 2014).
Renninger v Phillips & Cohen Associates, Ltd, 2010 U.S. Dist. LEXIS 92736,
2010 WL 3259417 (M.D. Fla., August 18, 2010).
Florida, S.D.
Ponce v. BCA Financial Services, Inc., 2012 WL 13008156 (S.D. Fla., September
20, 2012).
Sandin v. United Collection Bureau, Inc., 2009 U.S. Dist. LEXIS 71945, 2009 WL
2500408 (S.D. Fla.,August 14, 2009).
Georgia, M.D.
Herbert v. Wallet Recovery Ltd., 2014 U.S. Dist. LEXIS 57012, 2014 WL 1653490
(M.D. Ga., Apr. 24, 2014).
Idaho
Lecoultre v. Takhar Collection Servs., 2013 U.S. Dist. LEXIS 96443, 2013 WL
3458072 (D. Idaho, July 9, 2013).
368

UNITED STATES CONSUMER LAW SURVEY REPORT 2015-2016
Illinois, N.D.
In re Sears, 2016 U.S. Dist. LEXIS 124235, 2016 WL 4765679 (N.D. E.D. Ill., Sep.
13, 2016)
Fricano v. LVNV Funding, LLC, 2015 U.S. Dist. LEXIS 121654, 2015 WL 5331711
(N.D. E.D. Ill., Sept. 8, 2015).
Reid v. Unilever United States, Inc., 2015 U.D. Dist. LEXIS 75383, 2015 WL
3653318 (N.D. E.D. Ill., June 10, 2015).
Decker v. Transworld Systems, Inc., 2009 U.S. Dist. LEXIS 78987, 2009 WL
2916819 (N.D. W.D. Ill., September 01, 2009.
Vahidy v. Transworld Systems, Inc., 2009 U.S. Dist. LEXIS 78984, 2009 WL
2916825 (N.D. W.D. Ill., September 01, 2009).
Illinois, S.D.
Anderson v. Specified Credit Ass'n, 2011 U.S. Dist. LEXIS 62410, 2011 WL
2414867 (S.D. Ill., June 10, 2011).
Indiana, N.D.
Bratton v. Thomas Law Firm PC, 943 F. Supp. 2d 897 (N.D., Ind. 2013).
Moore v. Midland Credit Mgmt., 2012 U.S. Dist. LEXIS 176600, 2012 WL
6217597 (N.D. Ind., Dec. 12, 2012).
Michigan, E.D.
Green v. Nationwide Arbitration Servs., LLC, 2017 U.S. Dist. LEXIS 216557
(E.D. S.D., Mich., Dec. 22, 2017).
Minnesota
Green v. BMW of North America, LLC, 2013 WL 9862198 (Minn.Dist.Ct., Nov.
20, 2013).
369

UNITED STATES CONSUMER LAW SURVEY REPORT 2015-2016
Nevada
Mandler v. Colvin, 2016 U.S. Dist. LEXIS 16226, 2016 WL 526217 (D. Nev., Feb.
9, 2016).
Silver State Broad., LLC v. Beasley FM Acquisition, 2015 U.S. Dist. LEXIS
34032, 2015 WL 1186461 (D. Nev. Mar. 16, 2015).
Feely v. Carrington Mortg. Services., LLC, 2014 U.S. Dist. LEXIS 161626, 2014
WL 6388788 (D. Nev., Nov. 14, 2014).
Schneider v. Social Security Administration, 2014 U.S. Dist. LEXIS 119553, 2014
WL 4251590 (D. Nev., Aug. 27, 2014).
New Jersey
Doyle v Midland Credit Management, Inc., 2017 U.S. Dist. LEXIS 215290, 2017
WL 6944789 (D. N.J., Dec 1, 2017).
Bukowski v Kia Motors America, Inc., 2014 WL 5113759 (N.J. Super.L., Sept. 4,
2014).
North Carolina, E.D.
LaFountain, Jr v. Paul Benton Motors of North Carolina, LLC, 2010 U.S. Dist.
LEXIS 121631, 2010 WL 4457057 (ED NC, November 5, 2010).
Ohio
Fabish v Harnak, 2015-Ohio-4777, 2015 Ohio App. LEXIS 4671, 2015 WL
7357189 (CA 5th App Dist, Delaware Co, Nov. 19, 2015).
Adam Beverly v Student Loan Relief Organization LLC (Unreported, Huron Co
CP, Final Judgment Entry, May 12, 2015; see National Collegiate Student Loan Trust
2003-1, 2014-Ohio-4346, 2014 WL 4824355, Sep. 30, 2014, for related case).
Ohio, N.D.
370

UNITED STATES CONSUMER LAW SURVEY REPORT 2015-2016
Mohn v. Goll, 2016 U.S. Dist. LEXIS 43866, 2016 WL 1258578 (N.D. E.D. Ohio,
Mar. 31, 2016) (negatively noting the Ohio State Bar Association’s similar survey to be
based on “a very small number of the relevant lawyers” in the jurisdiction at issue).
Ball v. Comm'r of Soc. Sec., 2013 U.S. Dist. LEXIS 129924 (N.D. E.D. Ohio, Aug.
12, 2013) (Social Security Disability Benefits Case); also see, 2013 WL 4874092 Slip
Order Of J. Oliver.
Coy v. Astrue, 2013 U.S. Dist. LEXIS 50328, 2013 WL 1411137 (N.D. E.D. Ohio,
Apr. 8, 2013).
Livingston v. Cavalry Portfolio Services, LLC, 2009 U.S. Dist. LEXIS 113274,
2009 WL 4724268 (N.D. Ohio, December 02, 2009).
Ohio, S.D.
Flaherty v. Portfolio Recovery Associates, LLC (Unreported, S.D. E.D. Ohio,
Order, Oct. 30, 2017, Case No. 2:16-cv-00085).
Simpson v. Comm'r of Soc. Sec., 2014 U.S. Dist. LEXIS 10875 (S.D. E.D. Ohio,
Jan. 29, 2014).
Wamsley v. Kemp Creditors Interchange Receivables Mgmt., LLC, 2010 U.S.
Dist. LEXIS 48454, 2010 WL 1610734 (S.D. E.D. Ohio, April 20, 2010) (using both the
national survey and the regional Survey Reports).
Paris v Regent Asset Mgmt Solutions, Inc., 2010 U.S. Dist. LEXIS 106183, 2010
WL 3910212 (S.D. W.D. Ohio, October 5, 2010).
Oregon
Kersten v. Quick Collect, Inc., 2015 U.S. Dist. LEXIS 58407, 2015 WL 1931137 (D.
Or. Apr. 27, 2015).
Pennsylvania
Dibish v. Ameriprise Fin. Servs., 2015 Pa. Dist. & Cnty. Dec. LEXIS 432, *17-18
(Pa. C.P., Mar. 23, 2015).
371

UNITED STATES CONSUMER LAW SURVEY REPORT 2015-2016
Pennsylvania, E.D.
Lindenbaum v. NCO Fin. Sys., 2011 U.S. Dist. LEXIS 78069, 2011 WL 2848748
(E.D. Pa., July 18, 2011).
Pennsylvania, U.S. Court of Federal Claims
Twerdok v Secretary of Health and Human Services, 2016 U.S. Claims LEXIS
1853, 2016 WL 7048036, U.S. Court of Federal Claims, Office of Special Masters, Aug. 4,
2016 (Survey Report held helpful in determining Erie, PA, hourly rate for attorney fee
award under National Vaccine Injury Compensation Program, the Vaccine Act, and
comparing Erie and Hershey, PA, hourly rates).
South Carolina
Green v. Momentum Motor Grp., LLC, 2018 U.S. Dist. LEXIS 122, 2018 WL
259091 (D. So. Carolina, Rock Hill Div., Jan. 2, 2018) (Full amount of fees granted).
Companion Life Ins Co v McCreary, et al, 2016 U.S. Dist. LEXIS 172433, 2016
WL 7115910 (D. So. Carolina, Columbia Div. Nov. 22, 2016) (Full amount of fees
granted; Survey Report supported requested rates in insurance policy proceeds dispute).
Tennessee, M.D.
McCutcheon v. Finkelstein Kern Steinberg & Cunningham, 2013 U.S. Dist.
LEXIS 121460, 2013 WL 4521016 (M.D. Tenn. Aug. 27, 2013).
Texas, S.D.
Szijjarto v. Farias, 2014 U.S. Dist. LEXIS 17406, 2014 WL 555122 (S.D. Tex. Feb.
12, 2014).
U.S. Virgin Islands
United States Postal Serv. Fed. Credit Union v. Edwin, 2018 U.S. Dist. LEXIS
31532, 2018 WL 1077291 (D. Virgin Islands, St. Croix Div. Feb. 27, 2018) (The Court in
this fee-shifting mortgage case sought out and considered the Consumer Price Index
Data, an article by Altman Weil, the 2015-2016 U.S. Consumer Law Attorney Fee Survey
372

UNITED STATES CONSUMER LAW SURVEY REPORT 2015-2016
Report, and a Florida Bar Survey and approved the requested hourly rates, which were
below the applicable Survey Report hourly rates).
West Virginia, S.D.
Pearson v. Prichard's Excavating & Mobile Home Transp., 2014 U.S. Dist.
LEXIS 16089, 2014 WL 534221 (S.D. W.Va. Feb. 10, 2014).
Koontz v. Wells Fargo N.A., 2013 U.S. Dist. LEXIS 45509, 2013 WL 1337260
(S.D. W. Va. Mar. 29, 2013).
Harmon v. Virtuoso Sourcing Group LLC, 2012 U.S. Dist. LEXIS 129770, 2012
WL 4018504 (S.D. W. Va. Sept. 12, 2012).
Washington
Merino v The State of Washington, et al, 2014 WL 12679683 (Wash.Super. Aug.
22, 2014).
Wisconsin, E.D.
Heling v. Creditors Collection Serv., 2017 U.S. Dist. LEXIS 89693, 2017 WL
2539785 (E.D. Wis. June 12, 2017).
Andersen v. Riverwalk Holdings Ltd., 2015 U.S. Dist. LEXIS 162403, 2015 WL
7862923 (E.D. Wis. Dec. 3, 2015).
Crafton v. Law Firm of Jonathan B. Levine, 2014 U.S. Dist. LEXIS 29690, 2014
WL 907423 (E.D. Wis. Mar. 7, 2014).
Beach v. LVNV Funding, LLC, 2013 U.S. Dist. LEXIS 162926, 2013 WL 6048989
(E.D. Wis., Nov. 15, 2013).
House v. Shapiro & Price, No. 10-CV-842, 2011 U.S. Dist. LEXIS 38322, 2011 WL
1219247 (E.D. Wis., Mar. 30, 2011).
Moreland v. Dorsey Thornton & Assocs., LLC, No. 10-CV-867, 2011 U.S. Dist.
LEXIS 54487, 2011 WL 1980282, *3 (E.D. Wis., May 20, 2011).
373
UNITED STATES CONSUMER LAW SURVEY REPORT 2015-2016
Suleski v. Bryant Lafayette & Associates, 2010 U.S. Dist. LEXIS 55353, 2010 WL
1904968 (E.D. Wis., May 10, 2010).
US Court of Federal Claims, Office of Special Masters
Twerdok v Secretary of Health and Human Services, *** Fed. Cl. ***, 2016 WL
7048036, U.S. Court of Federal Claims, Office of Special Masters, Aug. 4, 2016 (Survey
Report held helpful in determining Erie, PA, hourly rate for attorney fee award under
National Vaccine Injury Compensation Program, the Vaccine Act, and comparing Erie
and Hershey, PA, hourly rates).
US Dept of Justice, Executive Office for Immigration Review, Administrative Law
Judge
John A. Breda V. Kindred Braintree Hospital, LLC, 11 OCAHO 1225, 2014
OCAHO LEXIS 18, 2014 WL 4390663 (Aug 26, 2014, Chief Administrative Hearing
Officer Ellen K. Thomas).
US Dept of Labor, DOL Benefit Review Board, Administrative Law Judge
Terry Grimm V. Vortex Marine Construction/Signal Mutual Indemnity Assn., et
al, *** DOL Ben.Rev.Bd. ***, 2016 WL 7826580 (Dec. 28, 2016, DOL Ben.Rev.Bd.,
Administrative Law Judge Wm. Dorsey) (finding Los Angeles and San Francisco Survey
Report tables not relevant to San Diego market).
Commonwealth of Virginia Orders
VA Orders 2016-21 (July 13, 2016), Judicial Counsel of Virginia,
Recommendations of the Standing Committee on Commissioners of Accounts of the
Judicial Council of Virginia regarding changes to the existing Uniform Fee Schedule
Guideline for Commissioners of Account, Dec. 9, 2015 Report (2014 Survey sections
attached as Exhibit D).
American Arbitration Association
2016 AAA Consumer LEXIS 207 (Jul. 29, 2016) (Rescission of vehicle sales
agreement awarded plus attorney fees with citation to Survey Report).
374
UNITED STATES CONSUMER LAW SURVEY REPORT 2015-2016
In the Matter of the Arbitration Between [Claimant] V. [Respondent]
(Automotive Dealers and Gasoline Service Stations), 2016 WL 5105956 (Jul. 29, 2016).
Law Reviews and Other Secondary Materials Citing Survey Report
71 Vand. L. Rev. 121, Vanderbilt Law Review 2018, Adminization: Gatekeeping
Consumer Contracts, by Yonathan A. Arbel.
132 A.L.R.Fed. 477, Award of Attorneys’ Fees under 813(a)(3) of Fair Debt
Collection Practices Act (15 U.S.C.A. 1692k(a)(3)), by Robert F. Koets, J.D.
61 Drake L. Rev. 639, Drake Law Review 2013, DÉJÀ VU All over Again: Turner
V. Rogers and the Civil Right to Counsel, by Hon. David J. Dreyer.
15 N.Y.U.J. Legis. & Pub. Pol’y 759, NYU Journal of Legislation and Public Policy
2012, Collaborative Technology Improves Access to Justice, by Michael J. Wolf.
22 Va. J. Soc. Pol'y & L. 71, Virginia Journal of Social Policy and the Law, Winter
2015, Bridging the Gap Between Unmet Legal Needs and an Oversupply of Lawyers:
Creating Neighborhood Law Offices--the Philadelphia Experiment, by Jules Lobel and
Matthew Chapman.
63 Am. U. L. Rev. 87, American University Law Review, October 2013, Duke-ing
out Pattern or Practice after Wal-mart: the EEOC As Fist, by Angela D. Morrison.
18 Harv. Negot. L. Rev. 281, Harvard Negotiation Law Review, Spring 2013,
Renovating the Multi-door Courthouse: Designing Trial Court Dispute Resolution
Systems to Improve Results and Control Costs, by Barry Edwards.
Barbara Soleau v Illinois Dept. of Transp., Memorandum Opinion and Order,
Labor & Employment Law P 182132 (N.D. Illinois June 8, 2011).
Barbara Soleau v Illinois Dept. Of Transp., Amended Memorandum Opinion
and Order, Labor and Employment Law P 182153 (N.D. Illinois June 9, 2011).
Other Expert Opinions Citing Survey Report
In Re Southwest Airlines Voucher Litigation, 2014 WL 11115685 (N.D.Ill. June 4,
375

UNITED STATES CONSUMER LAW SURVEY REPORT 2015-2016
2014), Declaration by Colin B. Weir (Expert Witness) (Class Action Case).
Wallace v. Florida Dept. Of Education, 2010 WL 9067802 (Fla. Cir. Ct. June 2,
2010), Reply Affidavit of David M. Frank (Expert Witness) (Whistleblower Case).
Tamara Spikes and Beaumont Independent School District, 2015 WL 2450879
(E.D. Tex. January 6, 2015), Report or Affidavit of Kenneth W. Lewis (Expert Witness)
(Civil Rights & Constitutional Law Case).
Negative Cases on Survey Report’s Use
A listing of cases considering but not using the U.S. Consumer Law Attorney Fee
Survey Report when deciding attorney fee disputes in fee disputes in cases include those
on the following list. It should be noted that the depth and breadth of this Survey Report
has evolved over time and prior editions of this Survey Report were substantially
different from editions appearing after 2012 and thus any negative cases using prior
reports are likely to be distinguishable.
California
Brooks v. Sun Cash of Sd, 2018 U.S. Dist. LEXIS 20310, 2018 WL 747795 (S.D.
Cal. Feb. 7, 2018) (finding prior edition of Survey Report did not include specific data
for the district)(Editor’s Note: current edition includes this district data).
Valentin v. Grant Mercantile Agency, Inc., 2017 U.S. Dist. LEXIS 212185, 2017
WL 6604410 (E.D. Cal. Dec. 27, 2017) (following Fitzgerald v. Law Office of Curtis O.
Barnes and finding prior edition of Survey Report did not include specific data for the
district)(Editor’s Note: current Survey Report edition includes this district data).
Munoz v. Cal. Bus. Bureau, Inc., 2017 U.S. Dist. LEXIS 109855, 2017 WL
3009210 (E.D. Cal. July 14, 2017) (finding the 2013-2014 Survey Report did not include
specific FDCPA data)(Editor’s Note: current Survey Report edition includes this specific
data).
Forkum v. Co-Operative Adjustment Bureau, Inc., 2014 U.S. Dist. LEXIS
106912, 2014 WL 3827955 (N.D. Cal. Aug. 4, 2014) (applicant submitted Laffey Matrix
and 2010-2011 Survey Report); Forkum v. Co-Operative Adjustment Bureau, Inc., 2014
U.S. Dist. LEXIS 91148, 2014 WL 3101784 (N.D. Cal. July 3, 2014) (finding the Laffey
376
UNITED STATES CONSUMER LAW SURVEY REPORT 2015-2016
Matrix and the 2010-2011 Survey Report insufficient in geographically specific fee
data)(Editor’s Note: current Survey Report edition includes geocentric data).
Miranda v. Law Office of D. Scott Carruthers, 2012 U.S. Dist. LEXIS 2866, 2012
WL 78236 (E.D. Cal. Jan. 9, 2012) (finding the 2010-2011 Survey Report insufficient in
geographically specific fee data; in conflict with Davis v. Hollins Law, 25 F.Supp.3d
1292, 2014 U.S. Dist. LEXIS 81024, 10-12 (E.D. Cal. June 10, 2014))(Editor’s Note:
current Survey Report edition includes geocentric data).
Durham v. Cont'l Cent. Credit, 2011 U.S. Dist. LEXIS 148403, 2011 WL 6783193
(S.D. Cal. Dec. 27, 2011)) (finding the 2010-2011 Survey Report insufficient in
geographically specific fee data; in conflict with Davis v. Hollins Law, 25 F.Supp.3d
1292, 2014 U.S. Dist. LEXIS 81024, 10-12 (E.D. Cal. June 12, 2014))(Editor’s Note:
current Survey Report edition includes geocentric data).
Fitzgerald v. Law Office of Curtis O. Barnes, 2013 U.S. Dist. LEXIS 53642, 2013
WL 1627740 (E.D. Cal. Apr. 15, 2013) (finding the Laffey Matrix and the 2010-2011
Survey Report insufficient in geographically specific fee data; in conflict with Davis v.
Hollins Law, 25 F.Supp.3d 1292, 2014 U.S. Dist. LEXIS 81024, 10-12 (E.D. Cal. June 12,
2014))(Editor’s Note: current Survey Report edition includes geocentric data).
Colorado
Howard v. Midland Credit Mgmt., 2012 U.S. Dist. LEXIS 136209, 2012 WL
4359361 (D. Colo. Sept. 24, 2012) (finding the 2010-2011 Survey Report’s average
hourly rate by itself did not include the effect of degree of concentration or years in
practice of fee applicant)(Editor’s Note: current Survey Report edition includes this
data).
White v. Cavalry Portfolio Servs., LLC, 2012 U.S. Dist. LEXIS 35601, 2012 WL
899280 (D. Colo. Mar. 16, 2012) (finding the 2010-2011 Survey Report’s average hourly
rate by itself did not include the effect of degree of concentration or years in practice of
fee applicant)(Editor’s Note: current Survey Report edition includes this data).
Indiana
Grubbs v. Andrews & Cox, 2016 U.S. Dist. LEXIS 93643, *6; 2016 WL 3902591
(SD IN July 18, 2016) (“the Fee Survey is not particularized by subject matter or the
377

UNITED STATES CONSUMER LAW SURVEY REPORT 2015-2016
ability of the attorney; instead, it averages the rates charged by all attorneys in a
particular geographic area.”)(Editor’s Note: current Survey Report edition includes this
data).
Illinois
Farooq v. Portfolio Recovery, 2016 U.S. Dist. LEXIS 66180, 2016 WL 2909650
(N.D. Ill. May 19, 2016) (following Stockman v Global Credit & Collection Corp.; noting
the survey 2013-2014 results were “not particularized by subject matter or the ability of
the attorney”)(Editor’s Note: current Survey Report edition includes this data).
Stockman v. Global Credit & Collection Corp., 2015 U.S. Dist. LEXIS 111113, 2015
WL 4999851 (N.D. Ill. Aug. 21, 2015) (noting differing opinions on use of Survey Report
from District Court and stating the Survey Report was “not focused on lawyers who
handle cases similar to this one”)(Editor’s Note: current Survey Report edition includes
this data).
Michigan
Firneno v. Radner Law Grp., PLLC, 2017 U.S. Dist. LEXIS 136660, 2017 WL
3675613 (E.D. Mich. Aug. 25, 2017) (using the State Bar of Michigan Report as more
applicable to the specific locality at issue)(Editor’s Note: current Survey Report edition
includes geocentric data).
Minnesota
Mayo Foundation for Medical Education & Research, Mayo Clinic, Cerner
Corporation, Cerner Corporation v. Dr. Peter L. Elkin, M.D., 2014 WL 12527218 (D.C.
Minn. March 19, 2014) (in a statutory trade secret claim case, consumer law survey “
data ‘is of limited probative value’ because it relates to consumer law attorneys in the
Midwest region”).
New Jersey
Beneli v. Bca Fin. Servs., 2018 U.S. Dist. LEXIS 19191, 2018 WL 734673 (D.N.J.,
Feb. 6, 2018) (class action case mentioning Survey Report but using “lodestar
multiplier” calculation approach instead of hourly rate approach).
378

UNITED STATES CONSUMER LAW SURVEY REPORT 2015-2016
Westberry v. Commonwealth Fin. Sys., 2013 U.S. Dist. LEXIS 14381, 2013 WL
435948 (D.N.J. Feb. 4, 2013) (using prior hourly rate decisions and declining to use the
Laffey Matrix, the 2007 National Law Journal Billing Survey, and the 2010-2011 Survey
Report).
Freid v. Nat'l Action Fin. Servs., 2011 U.S. Dist. LEXIS 149668, 2011 WL
6934845 (D.N.J. Dec. 29, 2011) (finding the Laffey Matrix and the 2007 Survey Report
insufficient in geographically specific fee data)(Editor’s Note: current Survey Report
edition includes geocentric data).
Levy v. Global Credit & Collection Corp., 2011 U.S. Dist. LEXIS 124226, 2011 WL
5117855 (D.N.J. Oct. 27, 2011) (finding the Laffey Matrix and the 2007 Survey Report
insufficient in geographically specific fee data)(Editor’s Note: current Survey Report
edition includes geocentric data).
Weed-Schertzer v. Nudelman, 2011 U.S. Dist. LEXIS 108928, 2011 WL 4436553
(D.N.J. Sept. 23, 2011) (finding the Laffey Matrix insufficient in geographically specific
fee data and the 2007 Survey Report data not specific as to area of practice within
Consumer Law at issue in case)(Editor’s Note: current Survey Report edition includes
geocentric and area of practice data).
North Dakota
Hakkarainen v. Astrue, 2012 U.S. Dist. LEXIS 188466, 2012 WL 8420139 (N.D.
Ohio June 27, 2012); rev’d, 2013 WL 2950529 (Survey Report not applicable in Social
Security case with statutory cap on fees).
Ohio
Benyo v. Colvin, 188 Soc. Sec. Rep. Service 13, 2013 U.S. Dist. LEXIS 40179, 2013
WL 1195528 (N.D. Ohio 2013) (2010-2011 Survey Report held not helpful in Social
Security case).
Daniels v. Astrue, 185 Soc. Sec. Rep. Service 518, 2013 U.S. Dist. LEXIS 1418,
2013 WL 66083 (N.D. Ohio 2013) (2010-2011 Survey Report held not helpful in Social
Security case).
379

UNITED STATES CONSUMER LAW SURVEY REPORT 2015-2016
Keyes v. Astrue, 179 Soc. Sec. Rep. Service 346, 2012 U.S. Dist. LEXIS 88856,
2012 WL 2498892 (N.D. Ohio 2012) (2010-2011 Survey Report held not helpful in
Social Security case).
Oregon
Hooks ex rel. NLRB v. Int'l Longshore & Warehouse Union, Local 8, 2015 U.S.
Dist. LEXIS 28159 (D. Or. Mar. 9, 2015) (National Labor Relations Board case finding
the Laffey Matrix and the 2010-2011 Survey Report insufficient in geographically
specific fee data)(Editor’s Note: current Survey Report edition includes geocentric data).
Pennsylvania
Navarro v. Monarch Recovery Mgmt., 2014 U.S. Dist. LEXIS 84095, 2014 WL
2805244 (E.D. Pa. June 20, 2014) (finding the Laffey Matrix and the 2010-2011 Survey
Report insufficient in geographically specific fee data)(Editor’s Note: current Survey
Report edition includes geocentric data).
Zavodnick v. Gordon & Weisberg, P.C., 2012 U.S. Dist. LEXIS 78868, 2012 WL
2036493 (E.D. Pa. June 6, 2012) (finding the Laffey Matrix and the 2007 Survey Report
insufficient in geographically specific fee data)(Editor’s Note: current Survey Report
edition includes geocentric data).
Alexander v. NCO Fin. Sys., 2011 U.S. Dist. LEXIS 64211, 2011 WL 2415156 (E.D.
Pa. June 16, 2011) (mentioning the 2007 Survey Report but applying the local
Community Legal Services fee schedule).
Williams v. NCO Fin. Sys., 2011 U.S. Dist. LEXIS 50635 (E.D. Pa. May 10, 2011)
(finding the Laffey Matrix and the 2007 Survey Report insufficient in geographically
specific fee data)(Editor’s Note: current Survey Report edition includes geocentric data).
Tennessee
Lee v. Robinson, Reagan &Young PLLC, 2015 U.S. Dist. LEXIS 69096, *22, 2015
WL 3442097 (M.D. Tenn. May 28, 2015) (2010-2011 Survey Report and Laffey Matrix
when “submitted without guidance or specific argument by the plaintiff, are insufficient
to justify higher hourly rates”) (Editor’s Note: the rule from this case seems to be that it
is not enough to merely submit the Survey Report; some explanation should be made on
380

UNITED STATES CONSUMER LAW SURVEY REPORT 2015-2016
how it applies and where in the survey there can be found support for the hourly rate
requested by the movant).
Vermont
Brennan-Centrella v. Ritz-Craft Corp. of Pa., 2018 U.S. Dist. LEXIS 22308 (D.C.
Vermont, Feb. 12, 2018) (Survey Report not properly submitted, questioning accuracy of
state metropolitan hourly rate)(Editor’s Note: corrected, revised and updated data in
new 2015-2016 Survey Report edition dated Mar. 13, 2018).
Federal Court of Claims
Gonzalez v. Sec'y of HHS, 2015 U.S. Claims LEXIS 1833 (Fed. Cl. Nov. 10, 2015)
(Survey Report not used in National Vaccine Injury Compensation Program case, citing
Mooney v. Sec’y of HHS, infra).
Mooney v. Sec'y of HHS, 2014 U.S. Claims LEXIS 1526, 2014 WL 7715158 (Fed.
Cl. Dec. 29, 2014) (National Vaccine Injury Compensation Program case; applicant “did
not explain why ‘consumer law’ constitutes an apt comparison for fees purposes to
Vaccine Act litigation.” “Telling me why such comparisons are apt would be far more
helpful than simply asserting that they are.”)(Editor’s Note: the rule from this case
seems to be that some explanation must be made on how the area of Consumer Law is
similar to the area of law involved in a movant’s case at hand.)
381
UNITED STATES CONSUMER LAW SURVEY REPORT 2015-2016
7. Cases on Use of Survey Data
Additional considerations in using fee surveys may be relevant to a court’s
consideration in a particular case, including the following concepts drawn from the
illustrative cases below.
In determining whether a requested hourly rate is appropriate, a court may look
not only to past awards within the district, but the other submissions offered in support
of the award such as surveys and affidavits. See, Waldo v. Consumers Energy Co., 726
F.3d 802, 2013 U.S. App. LEXIS 16555, at *37, 2013 WL 4038747 at *12 (6th Cir. Aug. 9,
2013); also see, Sykes v. Anderson, 419 Fed.Appx. 615, 618 (6th Cir. 2011) ("[t]he
appropriate rate . . . is not necessarily the exact value sought by a particular firm, but is
rather the market rate in the venue sufficient to encourage competent representation.").
While different attorney fee surveys may exist for the Court’s consideration, the
question may be which “fee survey better served the purpose of assessing the skills,
experience and reputation of counsel” in a particular case. Strohl Systems Group, Inc. v.
Fallon, 2007 U.S. Dist. LEXIS 90830, 2007 WL 4323008 (E.D. Pa., Dec. 11, 2007), aff’d
372 Fed.Appx. 230 (Mar. 30, 2010).
Moreover, a fee survey may be approved as probative evidence of the
reasonableness of an hourly rate. Taylor v. USF-Red Star Express, Inc., 2005 U.S. Dist.
LEXIS 3599, 2005 WL 555371 (E.D.Pa., March 8, 2005), aff’d 212 Fed. Appx. 101
(2006).
However, the results of an attorney fee survey may be merely a starting point, a
piece of evidence that still should be shown to apply in a particular case. See, Ray v.
Secretary of Dept. Of Health and Human Services, 2006 WL 1006587 (Fed.Cl., March
30, 2006).
The cost of performing an individual fee survey and analysis may be recoverable.
It is a matter of first impression that a fee applicant would hire another
attorney to conduct a survey on her behalf. We cannot forget that
Luessenhop has the burden of proving that her Fee Application is based
upon prevailing market rates and that she has the right to present evidence
to support the rate she believes to be prevailing. Here, where we are
required to weigh the presumptive prevailing market rate district wide,
382

UNITED STATES CONSUMER LAW SURVEY REPORT 2015-2016
further pondering the geographical distance and economic disparities
between the Plattsburgh and Albany communities and Schneider's
relatively limited access to those attorneys who practice civil rights
litigation in Albany, we acknowledge that Luessenhop was left with little
option but to hire Mishler, an Albany attorney, to conduct a more
comprehensive survey on her behalf. Luessenhop seeks $787.50 for
Mishler's endeavors, which appears to be modest. Considering the amount
of time this Court spent to conduct a similar survey, we do not find this
amount to be unreasonable and will award it.
Luessenhop v. Clinton County, N.Y. 558 F.Supp.2d 247, 272 (N.D.N.Y., 2008).
Importantly, a fee survey is most useful when it surveys the general area of law at
hand in an applicant’s motion. Thus, the data from one type of survey may not be
applicable to a different area of law without some explanation by the applicant of why
the two areas of law are comparable. Nevertheless, more recent cases find guidance and
value even if the survey is not of the specific area of law at hand before the Court.
Mooney v. Sec’y of Health & Human Servs, 2014 U.S. Claims LEXIS 1526, 2014
WL 7715158, *3 n.9, *5 (Fed. Cl. Spec. Mstr. Dec. 29, 2014) (Referring to the Survey
Report in a fee motion brought under the National Vaccine Injury Compensation
Program but noting the absence of the proponent’s explanation why Consumer Law is
comparable to Vaccine Act litigation).
Gonzalez v. Secy. of Health & Human Services, 2015 WL 10435023, *9 (Fed. Cl.
Spec. Mstr. Nov. 10, 2015) (Referring to the Survey Report but not stating a reliance
upon it in a fee motion brought under the National Vaccine Injury Compensation
Program).
However, cases outside of Consumer Law have used the Survey Report, e.g.,
Twerdok v Secretary of Health and Human Services, 2016 WL 7048036 (U.S. Court of
Federal Claims, Office of Special Masters, Aug. 4, 2016) (Vaccine Act litigation); and
John A. Breda V. Kindred Braintree Hospital, LLC, 11 OCAHO 1225, 2014 OCAHO
LEXIS 18, 2014 WL 4390663 (Aug. 26, 2014) (Employment Discrimination).
Also, survey evidence of the forum geographic area may not be applicable if the
attorney’s work is performed outside of the forum area.
383
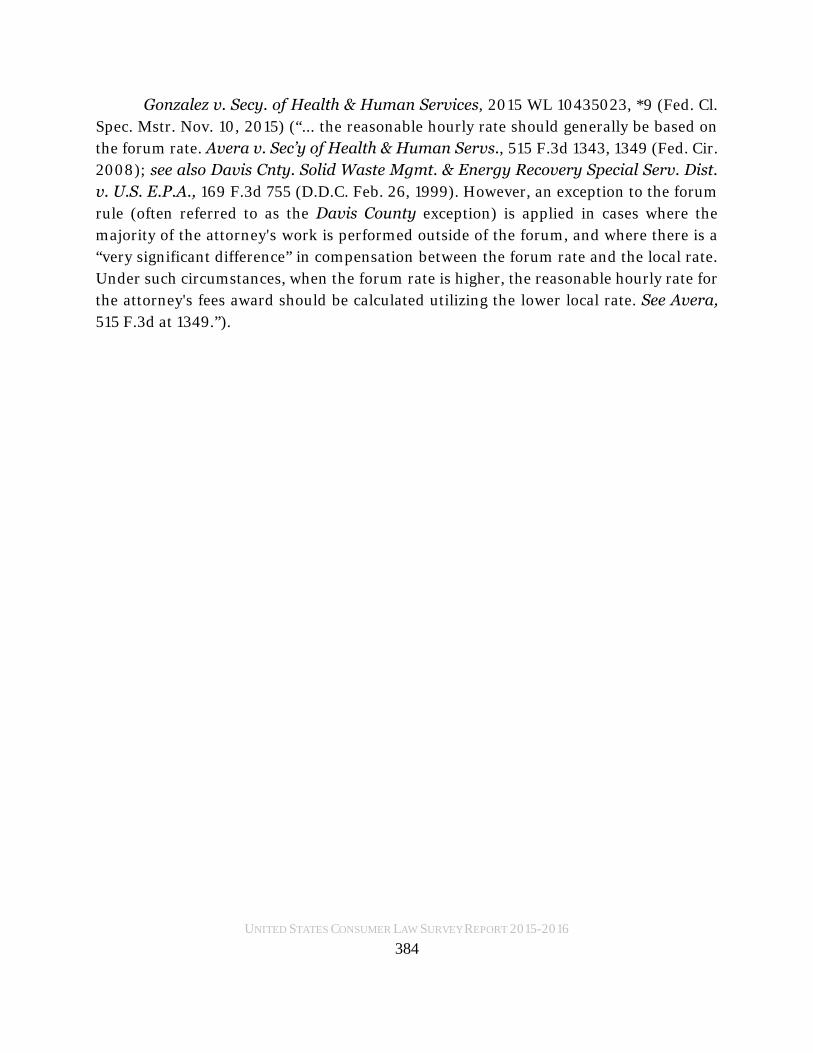
UNITED STATES CONSUMER LAW SURVEY REPORT 2015-2016
Gonzalez v. Secy. of Health & Human Services, 2015 WL 10435023, *9 (Fed. Cl.
Spec. Mstr. Nov. 10, 2015) (“... the reasonable hourly rate should generally be based on
the forum rate. Avera v. Sec’y of Health & Human Servs., 515 F.3d 1343, 1349 (Fed. Cir.
2008); see also Davis Cnty. Solid Waste Mgmt. & Energy Recovery Special Serv. Dist.
v. U.S. E.P.A., 169 F.3d 755 (D.D.C. Feb. 26, 1999). However, an exception to the forum
rule (often referred to as the Davis County exception) is applied in cases where the
majority of the attorney's work is performed outside of the forum, and where there is a
“very significant difference” in compensation between the forum rate and the local rate.
Under such circumstances, when the forum rate is higher, the reasonable hourly rate for
the attorney's fees award should be calculated utilizing the lower local rate. See Avera,
515 F.3d at 1349.”).
384

UNITED STATES CONSUMER LAW SURVEY REPORT 2015-2016
8. About the Editor
Ronald L. Burdge is an attorney and the founder of Burdge
Law Office Co L.A. in Dayton, Ohio. Mr. Burdge is in private
practice in Ohio, Kentucky and Indiana and elsewhere by pro hac
admission, and is a nationally known Consumer Law attorney. For
over a decade, Mr. Burdge has testified as an expert witness on
Consumer Law and Attorney Fee issues in numerous state and
federal courts. He is a member of the Total Practice Management
Association and numerous professional associations.
He has authored numerous articles and lectured widely on
Attorney Fee issues and Consumer Law and Consumer Trial
Practice, and is a member of the American Society of Legal Writers
and the Legal Writing Institute. Mr. Burdge has also lectured
widely at national and state Consumer Protection Law seminars before attorneys,
judges, and both public and business groups, and has testified before the Ohio
Legislature and its committees on Consumer Law issues.
He has served as Board Examiner for the National Board of Trial Advocacy and
has extensive Consumer Law trial and appellate experience in individual and class
action cases involving lenders, retail sales practices, defective products, and warranty
litigation. Since 2004, he remains the only Consumer Law attorney in Ohio who has
been named to Ohio Super Lawyer status by Law & Politics Magazine and Thomson
Reuters, and whose practice is entirely devoted to Consumer Law work for consumers.
Thomson Reuters is the world’s leading source of intelligent information for businesses
and professionals. In 2004, he was named Trial Lawyer of the Year by the National
Association of Consumer Advocates and in 2010 he was elected to a six year term on the
Board of the National Association of Consumer Advocates.
385

UNITED STATES CONSUMER LAW SURVEY REPORT 2015-2016
9. Recommendations for Future Survey Data
As always, we welcome your suggestions for improvements to the survey and this
Survey Report as we continue to gather useful information in the future.
Please email your suggestions to [email protected] or you may mail them
to Ronald L. Burdge, Esq., 8250 Washington Village Drive, Dayton, Ohio 45458.
Shortly after this report was published, the next survey data gathering time frame
was opened for participation for the next edition of the United States Consumer Law
Attorney Fee Survey Report. If you are an attorney who practices in the field of
Consumer Law to any degree, your participation in the next survey would benefit the
bar, practitioners and the Courts and would be greatly appreciated. You can do so by
going to the website AttorneyFeeStudy.com and clicking on the “Click Here to Take the
Survey Now” link.
Copyright © 2017, 2018 by R.L.Burdge
March 13, 2018
386

UNITED STATES CONSUMER LAW SURVEY REPORT 2015-2016
Appendix 1. 2015-2016 Survey Questions
The following pages contain the survey questions and possible answers to each
question.
387

UNITED STATES CONSUMER LAW SURVEY REPORT 2015-2016
388

UNITED STATES CONSUMER LAW SURVEY REPORT 2015-2016
389

UNITED STATES CONSUMER LAW SURVEY REPORT 2015-2016
390

UNITED STATES CONSUMER LAW SURVEY REPORT 2015-2016
Appendix 2. Geographic Area Definitions Used in Prior Survey Reports
In prior versions of the Unites States Consumer Law Attorney Fee Survey Reports
the data was compiled in twelve geographic regions, including several states identified
as their own region. This approach was based on three factors: the long-established
Altman-Weil3 regional tables, the quantity of Consumer Law attorneys that were readily
identified as practicing in each state, and the geographic proximity of any one state to a
nearby overall region.
For readers who wish to attempt to make comparisons of data in the prior reports
with the data provided in this 2015-2016 Survey Report, the following table lists the
regional state content by state name.
The twelve regions for this survey are:
Atlantic: DC, DE, NC, NJ, PA, VA, WV
California
Florida
Mid West: IA, IL, IN, KS, MI, MN, MO, ND, NE, SD, WI
New York
North East: CT, MA, MD, ME, NH, RI, VT
Ohio
Pacific: AK, HI, OR, WA
South: AL, AR, GA, KY, LA, MS, OK, SC, TN
Texas
US Territories: Puerto Rico, Guam, American Samoa, U.S. Virgin Islands
West: AZ, CO, ID, MT, NM, NV, UT, WY
3 Altman Weil, Inc. provides management consulting services exclusivelyto legal organizations. Its clients include law firms, law departments,governmental legal offices and legal vendors of all sizes and types throughoutNorth America, the U.K. and abroad. The Altman Weil website address ishttp://www.altmanweil.com/.
391

UNITED STATES CONSUMER LAW SURVEY REPORT 2015-2016
Appendix 3. Statement of Peer Review by The National Association of Legal Fee
Analysis
The following page contains the NALFA statement of its peer review opinions of
the United States Consumer Law Attorney Fee Survey Report 2015-2016.
392

UNITED STATES CONSUMER LAW SURVEY REPORT 2015-2016
393
UNITED STATES CONSUMER LAW SURVEY REPORT 2015-2016
Appendix 4. Table of Authorities
The following pages contain the Table of Authorities cited in this Survey Report.
394
UNITED STATES CONSUMER LAW SURVEY REPORT 2015-2016
TABLE OF AUTHORITIES
CASES
(Automotive Dealers and Gasoline Service Stations), 2016 WL 5105956 (Jul. 29, 2016)375
132 A.L.R.Fed. 477. . . . . . . . . . . . . . . . . . . . . . . . . . . . . . . . . . . . . . . . . . . . . . . . . . . . . . . . . 375
84 Empl. Prac. Dec. (CCH) P41,400 (7th Cir. Ill., Jan. 24, 2003) . . . . . . . . . . . . . . . . . . 361
90 Fair Empl. Prac. Casualty (BNA) 1537. . . . . . . . . . . . . . . . . . . . . . . . . . . . . . . . . . . . . . 361
Alexander v. NCO Fin. Sys., 2011 U.S. District LEXIS 64211, 2011 WL 2415156 (E.D. Pa.
June 16, 2011) . . . . . . . . . . . . . . . . . . . . . . . . . . . . . . . . . . . . . . . . . . . . . . . . . . . . . . . . . 380
Alvarado v Featured Mediation, LLC, 2017 U.S. District LEXIS 88022, 2017 WL
2480606 (M.D. Fla., Jun. 8, 2017) . . . . . . . . . . . . . . . . . . . . . . . . . . . . . . . . . . . . . . . . 368
Andalam v. Trizetto Group, 2013 U.S. District LEXIS 159656, 2013 WL 5952012 (D.
Colo., Nov. 7, 2013). . . . . . . . . . . . . . . . . . . . . . . . . . . . . . . . . . . . . . . . . . . . . . . . . . . . . 367
Andersen v. Riverwalk Holdings Limited, 2015 U.S. District LEXIS 162403, 2015 WL
7862923 (E.D. Wis. Dec. 3, 2015). . . . . . . . . . . . . . . . . . . . . . . . . . . . . . . . . . . . . . . . . 373
Anderson v. National Credit Sys.,2010 U.S. District LEXIS 134268 (D. Colo., Dec. 1,
2010) . . . . . . . . . . . . . . . . . . . . . . . . . . . . . . . . . . . . . . . . . . . . . . . . . . . . . . . . . . . . . . . . 368
Anderson v. Specified Credit Association, 2011 U.S. District LEXIS 62410, 2011 WL
2414867 (S.D. Ill., June 10, 2011) . . . . . . . . . . . . . . . . . . . . . . . . . . . . . . . . . . . . . . . . . 369
Arana v. Monterey Fin. Servs., 2016 U.S. District LEXIS 46111, 2016 WL 1324269 (S.D.
Cal., Apr. 5, 2016) . . . . . . . . . . . . . . . . . . . . . . . . . . . . . . . . . . . . . . . . . . . . . . . . . . 362, 366
Avera v. Secretary of Health and Human Servs., 515 F.3d 1343 (Fed. Cir. 2008) . . . . 384
Ball v. Commissioner of Social Sec., 2013 U.S. District LEXIS 129924 (N.D. Ohio, Aug.
395

UNITED STATES CONSUMER LAW SURVEY REPORT 2015-2016
12, 2013). . . . . . . . . . . . . . . . . . . . . . . . . . . . . . . . . . . . . . . . . . . . . . . . . . . . . . . . . . . . . . . 371
Barbara Soleau v Illinois Dept. Of Transp., Amended Memorandum Opinion and Order,
Labor and Employment Law P 182153 (N.D. Illinois June 9, 2011) . . . . . . . . . . . . . . 375
Barbara Soleau v Illinois Dept. of Transp., Memorandum Opinion and Order, Labor and
Employment Law P 182132 (N.D. Illinois June 8, 2011) . . . . . . . . . . . . . . . . . . . . . . . 375
Beach v. LVNV Funding, LLC, 2013 U.S. District LEXIS 162926, 2013 WL 6048989
(E.D. Wis., Nov. 15, 2013) . . . . . . . . . . . . . . . . . . . . . . . . . . . . . . . . . . . . . . . 363, 364, 373
Beneli v. Bca Fin. Servs., 2018 U.S. District LEXIS 19191, 2018 WL 734673 (D.N.J., Feb.
6, 2018) . . . . . . . . . . . . . . . . . . . . . . . . . . . . . . . . . . . . . . . . . . . . . . . . . . . . . . . . . . . . . . 378
Benyo v. Colvin, 188 Social Sec. Rep. Service 13, 2013 U.S. District LEXIS 40179, 2013
WL 1195528 (N.D. Ohio 2013) . . . . . . . . . . . . . . . . . . . . . . . . . . . . . . . . . . . . . . . . . . . 379
Blum v. Stenson, 465 U.S. 886 (1984) . . . . . . . . . . . . . . . . . . . . . . . . . . . . . . . . . . . . . . . 360
Bock v. APIM, LLC, 2013 U.S. District LEXIS 176648 (D. Colo., Nov. 7, 2013) . . . . . 367
Bratton v. Thomas Law Firm PC, 943 F. Supp. 2d 897 (N.D. Ind. 2013) . . . . . . . 364, 369
Breidenbach v. Experian, 2013 U.S. District LEXIS 82093, 2013 WL 2631368 (S.D. Cal.,
June 11, 2013) . . . . . . . . . . . . . . . . . . . . . . . . . . . . . . . . . . . . . . . . . . . . . . . . . . . . . . . . . 367
Brennan-Centrella v. Ritz-Craft Corporation of Pa., 2018 U.S. District LEXIS 22308
(D.C. Vermont, Feb. 12, 2018). . . . . . . . . . . . . . . . . . . . . . . . . . . . . . . . . . . . . . . . . . . . . 381
Broadcasting Music Incorporated v. Antigua Cantina and Grill, LLC, 2013 U.S. District
LEXIS 72122, 2013 WL 2244641 (E.D. Cal., May 20, 2013) . . . . . . . . . . . . . . . . . . . 365
Brooks v. Sun Cash of Sd, 2018 U.S. District LEXIS 20310, 2018 WL 747795 (S.D. Cal.
Feb. 7, 2018) . . . . . . . . . . . . . . . . . . . . . . . . . . . . . . . . . . . . . . . . . . . . . . . . . . . . . . . . . . 376
Brown v. Mandarich Law Group, LLP, 2014 U.S. District LEXIS 47020, 2014 WL
1340211 (N.D. Cal., Apr. 2, 2014) . . . . . . . . . . . . . . . . . . . . . . . . . . . . . . . . . . . . . . . . . 366
396

UNITED STATES CONSUMER LAW SURVEY REPORT 2015-2016
Bukowski v Kia Motors America, Inc., 2014 WL 5113759 (N.J. Super.L., Sept. 4, 2014)370
Castro v. Commercial Recovery Systems, 2014 U.S. District LEXIS 33675 (N.D. Cal.,
Maritime 13, 2014) . . . . . . . . . . . . . . . . . . . . . . . . . . . . . . . . . . . . . . . . . . . . . . . . . . . . . 366
Companion Life Ins Co v McCreary, et al, 2016 U.S. District LEXIS 172433, 2016 WL
7115910 (D. So. Carolina, Columbia Division Nov. 22, 2016) . . . . . . . . . . . . . . . . . . 372
Coy v. Astrue, 2013 U.S. District LEXIS 50328, 2013 WL 1411137 (N.D. Ohio Apr. 8,
2013) . . . . . . . . . . . . . . . . . . . . . . . . . . . . . . . . . . . . . . . . . . . . . . . . . . . . . . . . . . . . . . . . . 371
Crafton v. Law Firm of Jonathan B. Levine, 2014 U.S. District LEXIS 29690, 2014 WL
907423 (E.D. Wis., Maritime 7, 2014) . . . . . . . . . . . . . . . . . . . . . . . . . . . . . . . . . 362, 373
Crapnell v. Dillon Cos., 2015 U.S. District LEXIS 96184, 2015 WL 4484469 (D. Colo.,
July 22, 2015) . . . . . . . . . . . . . . . . . . . . . . . . . . . . . . . . . . . . . . . . . . . . . . . . . . . . . . . . . 367
Crawford v. Dynamic Recovery Servs., 2014 U.S. District LEXIS 4057, 2014 WL 130458
(S.D. Cal., Jan. 10, 2014) . . . . . . . . . . . . . . . . . . . . . . . . . . . . . . . . . . . . . . . . . . . . . . . . 367
DOL Ben.Rev.Bd. ***, 2016 WL 7826580 (Dec. 28, 2016, DOL Ben.Rev.Bd.,
Administrative Law Judge Wm. Dorsey) . . . . . . . . . . . . . . . . . . . . . . . . . . . . . . . 374, 377
Daniels v. Astrue, 185 Social Sec. Rep. Service 518, 2013 U.S. District LEXIS 1418, 2013
WL 66083 (N.D. Ohio 2013) . . . . . . . . . . . . . . . . . . . . . . . . . . . . . . . . . . . . . . . . . . . . . 379
Davis Cnty. Solid Waste Management and Energy Recovery Special Service District v.
U.S. E.P.A., 169 F.3d 755 (D.D.C. Feb. 26, 1999) . . . . . . . . . . . . . . . . . . . . . . . . . . . . 384
Davis v. Hollins Law, 25 F.Supp.3d 1292, 2014 U.S. District LEXIS 81024, 2014 WL
2619651 (E.D. Cal., Jun. 12, 2014) . . . . . . . . . . . . . . . . . . . . . . . . . . . . . . . . 363, 365, 377
De La Torre v. Legal Recovery Law Office, 2014 U.S. District LEXIS 128220, 2014 WL
4547035 (S.D. Cal., Sept. 12, 2014). . . . . . . . . . . . . . . . . . . . . . . . . . . . . . . . . . . . . . . . 366
Delalat v. Syndicated Office Sys., 2014 U.S. District LEXIS 33756, 2014 WL 930162
(S.D. Cal., Jan. 28, 2014) . . . . . . . . . . . . . . . . . . . . . . . . . . . . . . . . . . . . . . . . . . . . . . . . 367
397

UNITED STATES CONSUMER LAW SURVEY REPORT 2015-2016
Diaz v. Kubler Corp., 2014 WL 12789109 (S.D. Cal., Maritime 26, 2014) . . . . . . . . . . 366
Dibish v. Ameriprise Fin. Servs., 2015 Pa. District and Cnty. Dec. LEXIS 432, *17-18 (Pa.
C.P., Maritime 23, 2015) . . . . . . . . . . . . . . . . . . . . . . . . . . . . . . . . . . . . . . . . . . . . . . . . . 371
Durham v. Continental Central Credit, 2011 U.S. District LEXIS 148403, 2011 WL
6783193 (S.D. Cal. Dec. 27, 2011) . . . . . . . . . . . . . . . . . . . . . . . . . . . . . . . . . . . . . . . . . . 377
Farooq v. Portfolio Recovery, 2016 U.S. District LEXIS 66180, 2016 WL 2909650 (N.D.
Ill. May 19, 2016) . . . . . . . . . . . . . . . . . . . . . . . . . . . . . . . . . . . . . . . . . . . . . . . . . . . . . . 378
Feely v. Carrington Mortg. Services., LLC, 2014 U.S. District LEXIS 161626, 2014 WL
6388788 (D. Nev., Nov. 14, 2014). . . . . . . . . . . . . . . . . . . . . . . . . . . . . . . . . . . . . . . . . 370
Firneno v. Radner Law Grp., PLLC, 2017 U.S. District LEXIS 136660, 2017 WL 3675613
(E.D. Mich. Aug. 25, 2017). . . . . . . . . . . . . . . . . . . . . . . . . . . . . . . . . . . . . . . . . . . . . . . 378
Fitzgerald v. Law Office of Curtis O. Barnes, 2013 U.S. District LEXIS 53642, 2013 WL
1627740 (E.D. Cal. Apr. 15, 2013) . . . . . . . . . . . . . . . . . . . . . . . . . . . . . . . . . . . . . . . . . . 377
Forkum v. Co-Operative Adjustment Bureau, Inc., 2014 U.S. District LEXIS 106912,
2014 WL 3827955 (N.D. Cal. Aug. 4, 2014). . . . . . . . . . . . . . . . . . . . . . . . . . . . . . . . . 376
Freid v. National Action Fin. Servs., 2011 U.S. District LEXIS 149668, 2011 WL 6934845
(D.N.J. Dec. 29, 2011) . . . . . . . . . . . . . . . . . . . . . . . . . . . . . . . . . . . . . . . . . . . . . . . . . . 379
Fricano v. LVNV Funding, LLC, 2015 U.S. District LEXIS 121654, 2015 WL 5331711
(N.D. Ill., Sept. 8, 2015) . . . . . . . . . . . . . . . . . . . . . . . . . . . . . . . . . . . . . . . . . . . . . . . . . 369
Garcia v. Resurgent Capital Servs., 2012 U.S. District LEXIS 123889, 2012 WL 3778852
(N.D. Cal., Aug. 30, 2012) . . . . . . . . . . . . . . . . . . . . . . . . . . . . . . . . . . . . . . . . . . . . . . . 366
Gonzalez v. Secretary of HHS, 2015 U.S. Claims LEXIS 1833 (Fed. Cl. Nov. 10, 2015) 381
Gonzalez v. Secy. of Health and Human Services, 2015 WL 10435023 (Fed. Cl. Spec.
Mstr. Nov. 10, 2015) . . . . . . . . . . . . . . . . . . . . . . . . . . . . . . . . . . . . . . . . . . . . 383, 384, 391
Green v. BMW of North America, LLC, 2013 WL 9862198 (Minn.Dist.Ct., Nov. 20,
398
UNITED STATES CONSUMER LAW SURVEY REPORT 2015-2016
2013) . . . . . . . . . . . . . . . . . . . . . . . . . . . . . . . . . . . . . . . . . . . . . . . . . . . . . . . . 369, 371, 382
Green v. Momentum Motor Grp., LLC, 2018 U.S. District LEXIS 122, 2018 WL 259091
(D. So. Carolina, Rock Hill Division., Jan. 2, 2018) . . . . . . . . . . . . . . . . . . . . . . . . . . 372
Green v. Nationwide Arbitration Servs., LLC, 2017 U.S. District LEXIS 216557 (E.D.
Mich. Southern Division., Dec. 22, 2017). . . . . . . . . . . . . . . . . . . . . . . . . . . . . . . . . . . 369
Gregg v. N.A.R., Inc., 2014 U.S. District LEXIS 32017, 2014 WL 959412 (D. Colo.,
Maritime 12, 2014) . . . . . . . . . . . . . . . . . . . . . . . . . . . . . . . . . . . . . . . . . . . . . . . . . . . . . 367
Grubbs v. Andrews and Cox, 2016 U.S. District LEXIS 93643 . . . . . . . . . . . . . . . . . . . . 377
Hakkarainen v. Astrue, 2012 U.S. District LEXIS 188466, 2012 WL 8420139 (N.D. Ohio
June 27, 2012); rev’d, 2013 WL 2950529 (Survey Report not applicable in Social
Security case with statutory cap on fees) . . . . . . . . . . . . . . . . . . . . . . . . . . . . . . . . . . . 379
Hampton v. Colvin, 2015 U.S. District LEXIS 53630, 2015 WL 1884313 (N.D. Cal., Apr.
23, 2015) . . . . . . . . . . . . . . . . . . . . . . . . . . . . . . . . . . . . . . . . . . . . . . . . . . . . . . . . . . . . . 366
Harmon v. Virtuoso Sourcing Group LLC, 2012 U.S. District LEXIS 129770, 2012 WL
4018504 (S.D. Western Va. Sept. 12, 2012) . . . . . . . . . . . . . . . . . . . . . . . . . . . . . . . . . 373
Harper v. Stellar Recovery, Inc., 2015 U.S. District LEXIS 154479, 2015 WL 7253239 (D.
Colo., Nov. 16, 2015). . . . . . . . . . . . . . . . . . . . . . . . . . . . . . . . . . . . . . . . . . . . . . . . . . . . 367
Heling v. Creditors Collection Serv., 2017 U.S. District LEXIS 89693, 2017 WL 2539785
(E.D. Wis. June 12, 2017). . . . . . . . . . . . . . . . . . . . . . . . . . . . . . . . . . . . . . . . . . . . . . . . 373
Herbert v. Wallet Recovery Limited, 2014 U.S. District LEXIS 57012, 2014 WL 1653490
(M.D.Ga., Apr. 24, 2014) . . . . . . . . . . . . . . . . . . . . . . . . . . . . . . . . . . . . . . . . . . . . . . . . 368
Hicks v City of Tuscaloosa, 2016 U.S. District LEXIS 174579, 2016 WL 7029827 (N.D.,
Alabama, May 24, 2016) . . . . . . . . . . . . . . . . . . . . . . . . . . . . . . . . . . . . . . . . . . . . . . . . 364
Hollandsworth v McDowell, 2015 WL 12830177 (Cal.Super., May 20, 2015) . . . . . . . 365
Hooks ex rel. NLRB v. International Longshore and Warehouse Union, Local 8, 2015
399

UNITED STATES CONSUMER LAW SURVEY REPORT 2015-2016
U.S. District LEXIS 28159 (D. Or. Maritime 9, 2015) . . . . . . . . . . . . . . . . . . . . . . . . 380
House v. Shapiro and Price, 2011 U.S. District LEXIS 38322, 2011 WL 1219247 (E.D.
Wis., Maritime 30, 2011) . . . . . . . . . . . . . . . . . . . . . . . . . . . . . . . . . . . . . . . . . . . . . . . . 362
House v. Shapiro and Price, Number 10-CV-842, 2011 U.S. District LEXIS 38322, 2011
WL 1219247 (E.D. Wis., Maritime 30, 2011) . . . . . . . . . . . . . . . . . . . . . . . . . . . . . . . . 373
Howard v. Midland Credit Management, 2012 U.S. District LEXIS 136209, 2012 WL
4359361 (D. Colo. Sept. 24, 2012) . . . . . . . . . . . . . . . . . . . . . . . . . . . . . . . . . . . . . . . . . 377
Jordan v City of Birmingham, 2015 U.S. District LEXIS 183532, 2015 WL 12830455
(N.D. Alabama, June 22, 2015) . . . . . . . . . . . . . . . . . . . . . . . . . . . . . . . . . . . . . . . . . . . 365
Kersten v. Quick Collect, Inc., 2015 U.S. District LEXIS 58407, 2015 WL 1931137 (D. Or.
Apr. 27, 2015) . . . . . . . . . . . . . . . . . . . . . . . . . . . . . . . . . . . . . . . . . . . . . . . . . . . . . . . . . . 371
Keyes v. Astrue, 179 Social Sec. Rep. Service 346, 2012 U.S. District LEXIS 88856, 2012
WL 2498892 (N.D. Ohio 2012). . . . . . . . . . . . . . . . . . . . . . . . . . . . . . . . . . . . . . . . . . . 379
Klein v. Law Offices of D. Scott Carruthers, 2015 U.S. District LEXIS 75269, 2015 WL
3626946 (N.D. Cal., June 10, 2015) . . . . . . . . . . . . . . . . . . . . . . . . . . . . . . . . . . . . . . . 366
Koontz v. Wells Fargo N.A., 2013 U.S. District LEXIS 45509, 2013 WL 1337260 (S.D.
Western Va. Maritime 29, 2013). . . . . . . . . . . . . . . . . . . . . . . . . . . . . . . . . . . . . . . . . . 373
Krapf v Nationwide Credit, Incorporated, 2010 U.S. District LEXIS 116689, 2010 WL
4261444 (C.D. Cal., October 21, 2010) . . . . . . . . . . . . . . . . . . . . . . . . . . . . . . . . . . . . . 365
LaFountain, Jr v. Paul Benton Motors of North Carolina, LLC, 2010 U.S. District LEXIS
121631, 2010 WL 4457057 (E.D. NC, Nov. 5, 2010) . . . . . . . . . . . . . . . . . . 363, 370, 408
Lane v. Accredited Collection Agency, Inc., 2014 U.S. District LEXIS 58502, 2014 WL
1685677 (M.D.Fla. Apr. 25, 2014). . . . . . . . . . . . . . . . . . . . . . . . . . . . . . . . . . . . . . . . . 368
Lecoultre v. Takhar Collection Servs., 2013 U.S. District LEXIS 96443, 2013 WL
3458072 (D. Idaho, July 9, 2013) . . . . . . . . . . . . . . . . . . . . . . . . . . . . . . . . . . . . . . . . . 368
400

UNITED STATES CONSUMER LAW SURVEY REPORT 2015-2016
Levy v. Global Credit and Collection Corp., 2011 U.S. District LEXIS 124226, 2011 WL
5117855 (D.N.J. Oct. 27, 2011) . . . . . . . . . . . . . . . . . . . . . . . . . . . . . . . . . . . . . . . . . . . 379
Lindenbaum v. NCO Fin. Sys., 2011 U.S. District LEXIS 78069, 2011 WL 2848748 (E.D.
Pa., July 19, 2011) . . . . . . . . . . . . . . . . . . . . . . . . . . . . . . . . . . . . . . . . . . . . . . . . . . 364, 372
Livingston v. Cavalry Portfolio Services, LLC, 2009 U.S. District LEXIS 113274, 2009
WL 4724268 (N.D. Ohio, December 02, 2009) . . . . . . . . . . . . . . . . . . . . . . . . . . . . . . 371
Lockmon v. Thomas F. Farrell, P.C., 2012 U.S. District LEXIS 178661, 2012 WL
6590426 . . . . . . . . . . . . . . . . . . . . . . . . . . . . . . . . . . . . . . . . . . . . . . . . . . . . . 363, 364, 368
Luessenhop v. Clinton County, N.Y. 558 F.Supp.2d 247 (N.D.N.Y., 2008) . . . . . . . . 383
Mandler v. Colvin, 2016 U.S. District LEXIS 16226, 2016 WL 526217 (D. Nev., Feb. 9,
2016) . . . . . . . . . . . . . . . . . . . . . . . . . . . . . . . . . . . . . . . . . . . . . . . . . . . . . . . . . . . . . . . . 370
Mathur v. Board of Trs. of Southern Ill. Univ., 317 F.3d 738, 2003 U.S. App. LEXIS 1055361
Mayo Foundation for Medical Education and Research, Mayo Clinic, Cerner
Corporation, Cerner Corporation v. Dr. Peter L. Elkin, M.D., 2014 WL 12527218 (D.C.
Minn. March 19, 2014) . . . . . . . . . . . . . . . . . . . . . . . . . . . . . . . . . . . . . . . . . . . . . . . . . . 378
McCutcheon v. Finkelstein Kern Steinberg and Cunningham, 2013 U.S. District LEXIS
121460, 2013 WL 4521016 (M.D. Tenn. Aug. 27, 2013) . . . . . . . . . . . . . . . . . . . . . . . 372
Medina v. South Coast Car Company, 2017 Cal. App. LEXIS 820, 2017 WL 4247131
(C.A., 4th App Dist, Division One, Sept 19, 2017) . . . . . . . . . . . . . . . . . . . . . . . . . . . . 365
Merino v The State of Washington, et al, 2014 WL 12679683 (Wash.Super. Aug. 22,
2014). . . . . . . . . . . . . . . . . . . . . . . . . . . . . . . . . . . . . . . . . . . . . . . . . . . . . . . . . . . . . . . . . 373
Miranda v. Law Office of D. Scott Carruthers, 2012 U.S. District LEXIS 2866, 2012 WL
78236 (E.D. Cal. Jan. 9, 2012). . . . . . . . . . . . . . . . . . . . . . . . . . . . . . . . . . . . . . . . . . . . . 377
Mohn v. Goll, 2016 U.S. District LEXIS 43866, 2016 WL 1258578 (N.D. Ohio, Maritime
31, 2016). . . . . . . . . . . . . . . . . . . . . . . . . . . . . . . . . . . . . . . . . . . . . . . . . . . . . . . . . . . . . . . 371
401
UNITED STATES CONSUMER LAW SURVEY REPORT 2015-2016
Mooney v. Secretary of HHS, 2014 U.S. Claims LEXIS 1526, 2014 WL 7715158 (Fed. Cl.
Dec. 29, 2014) . . . . . . . . . . . . . . . . . . . . . . . . . . . . . . . . . . . . . . . . . . . . . . . . . . . . . . . . . . 381
Mooney v. Secretary of Health and Human Servs, 2014 U.S. Claims LEXIS 1526, 2014
WL 7715158 (Fed. Cl. Spec. Mstr. Dec. 29, 2014) . . . . . . . . . . . . . . . . . . . . . . . . . . . . 383
Moore v. Midland Credit Mgmt., 2012 U.S. District LEXIS 176600, 2012 WL 6217597
(N.D. Ind., Dec. 12, 2012) . . . . . . . . . . . . . . . . . . . . . . . . . . . . . . . . . . . . . . . . . . . . . . . 369
Moore v. Midland Credit Management., Inc., 2012 U.S. District LEXIS 176600, 2012 WL
6217597 (N.D. Ind. Dec. 12, 2012) . . . . . . . . . . . . . . . . . . . . . . . . . . . . . . . . . . . . . . . . 364
Moreland v. Dorsey Thornton and Assocs., LLC, 2011 U.S. District LEXIS 54487, 2011
WL 1980282 (E.D. Wis., May 20, 2011). . . . . . . . . . . . . . . . . . . . . . . . . . . . . . . . . . . . 362
Moreland v. Dorsey Thornton and Assocs., LLC, Number 10-CV-867, 2011 U.S. District
LEXIS 54487, 2011 WL 1980282 (E.D. Wis., May 20, 2011). . . . . . . . . . . . . . . . . . . 373
Munoz v. Cal. Business Bureau, Inc., 2017 U.S. District LEXIS 109855, 2017 WL
3009210 (E.D. Cal. July 14, 2017). . . . . . . . . . . . . . . . . . . . . . . . . . . . . . . . . . . . . . . . . 376
Navarro v. Monarch Recovery Mgmt., 2014 U.S. District LEXIS 84095, 2014 WL
2805244 (E.D. Pa. June 20, 2014) . . . . . . . . . . . . . . . . . . . . . . . . . . . . . . . . . . . . . . . . 380
Nguyen v. HOVG, LLC, 2015 U.S. District LEXIS 124019, 2015 WL 5476254 (S.D. Cal.,
Sept. 15, 2015) . . . . . . . . . . . . . . . . . . . . . . . . . . . . . . . . . . . . . . . . . . . . . . . . . . . . . . . . . 366
Paris v Regent Asset Mgmt Solutions, Incorporated, 2010 U.S. District LEXIS 106183,
2010 WL 3910212 (S.D. Ohio, October 5, 2010) . . . . . . . . . . . . . . . . . . . . . . . . . . . . . . 371
Pearson v. Prichard’s Excavating and Mobile Home Transp., 2014 U.S. District LEXIS
16089, 2014 WL 534221 (S.D. W.Va. Feb. 10, 2014) . . . . . . . . . . . . . . . . . . . . . . . . . 373
People Who Care v. Rockford Board Of Educational., School District Number 205, 90
F.3d 1307 (7th Cir. 1996) . . . . . . . . . . . . . . . . . . . . . . . . . . . . . . . . . . . . . . . . . . . . . . . . . 361
People Who Care v. Rockford Board of Educational., Schools District Number 205, 90
F.3d 1307 (7th Cir., 1996) . . . . . . . . . . . . . . . . . . . . . . . . . . . . . . . . . . . . . . . . . . . . . . . 360
402
UNITED STATES CONSUMER LAW SURVEY REPORT 2015-2016
Peterson-Hooks v. First Integral Recovery, LLC, 2013 U.S. District LEXIS 73907, 2013
WL 229544 (D. Colo., May 24, 2013) . . . . . . . . . . . . . . . . . . . . . . . . . . . . . . . . . . . . . . 367
Ponce v. BCA Financial Services, Incorporated, 2012 WL 13008156 (S.D.Fla., September
20, 2012) . . . . . . . . . . . . . . . . . . . . . . . . . . . . . . . . . . . . . . . . . . . . . . . . . . . . . . . . . . . . . 368
Ramirez v. Northern American Asset Servs., LLC, 2012 U.S. District LEXIS 54641 (C.D.
Cal., Apr. 9, 2012) . . . . . . . . . . . . . . . . . . . . . . . . . . . . . . . . . . . . . . . . . . . . . . . . . . 363, 365
Ray v. Secretary of Dept. Of Health and Human Services, 2006 WL 1006587 (Fed.Cl.,
March 30, 2006) . . . . . . . . . . . . . . . . . . . . . . . . . . . . . . . . . . . . . . . . . . . . . . . . . . . . . . . 382
Reichers v. Del. Asset Management., LLC, 2013 U.S. District LEXIS 164981, 2013 WL
6096136 (D. Colo., Nov. 20, 2013) . . . . . . . . . . . . . . . . . . . . . . . . . . . . . . . . . . . . . . . . 367
Reid v. Unilever United States, Inc., 2015 U.S. District LEXIS 75383, 2015 WL 3653318
(N.D. Ill., June 10, 2015) . . . . . . . . . . . . . . . . . . . . . . . . . . . . . . . . . . . . . . . . . . . . 362, 369
Renninger v Phillips and Cohen Associates, Ltd, 2010 U.S. District LEXIS 92736, 2010
WL 3259417 (M.D.Fla., August 18, 2010) . . . . . . . . . . . . . . . . . . . . . . . . . . . . . . . . . . 368
Rodriguez v. Luchey and Mitchell Recovery Solutions, LLC, 2013 U.S. District LEXIS
164285, 2013 WL 6068458 (D. Colo., Nov. 18, 2013) . . . . . . . . . . . . . . . . . . . . . . . . 367
Sandin v. United Collection Bureau, Incorporated, 2009 U.S. District LEXIS 71945,
2009 WL 2500408 (S.D.Fla.,August 14, 2009) . . . . . . . . . . . . . . . . . . . . . . . . . . . . . 368
Santarlas v. Steube, 2017 U.S. District LEXIS 383 (M.D.Fla., Jan. 3, 2017) . . . . . . . . 368
Savage v NIC, Incorporated, 2010 U.S. District LEXIS 60311, 2010 WL 2347028 (D.
Ariz., June 9, 2010). . . . . . . . . . . . . . . . . . . . . . . . . . . . . . . . . . . . . . . . . . . . . . . . . . . . . 365
Scadden v. Weinberg, Stein and Associates, LLC, 2013 U.S. District LEXIS 57939, 2013
WL 1751294 . . . . . . . . . . . . . . . . . . . . . . . . . . . . . . . . . . . . . . . . . . . . . . . . . . . . . . . . . . . 367
Schneider v. Social Security Administration, 2014 U.S. District LEXIS 119553, 2014 WL
4251590 (D. Nev., Aug. 27, 2014) . . . . . . . . . . . . . . . . . . . . . . . . . . . . . . . . . . . . . . . . . 370
403
UNITED STATES CONSUMER LAW SURVEY REPORT 2015-2016
In re Sears, 2016 U.S. District LEXIS 124235, 2016 WL 4765679 (N.D. E.D., Ill., Sep. 13,
2016). . . . . . . . . . . . . . . . . . . . . . . . . . . . . . . . . . . . . . . . . . . . . . . . . . . . . . . . . . . . . 362, 369
Senah, Incorporated v. Xi’an Forstar S&T Co, 2016 U.S. District LEXIS 72293, 2016 WL
3092099 (N.D. Cal., June 2, 2016). . . . . . . . . . . . . . . . . . . . . . . . . . . . . . . . . . . . . . . . 366
Shelago v. Marshall and Ziolkowski Enterprise, LLC, 2009 U.S. District LEXIS 38940,
2009 WL 1097534 (D.Ariz., 2009., April 22, 2009). . . . . . . . . . . . . . . . . . . . . . . . . . 365
Sierra Club v. Jackson, 2013 U.S. District LEXIS 137217, 2013 WL 5409036 (W.D. Wis.,
Sept. 25, 2013). . . . . . . . . . . . . . . . . . . . . . . . . . . . . . . . . . . . . . . . . . . . . . . . . . . . . . . . . . 361
Silver State Broadcasting., LLC v. Beasley FM Acquisition, 2015 U.S. District LEXIS
34032, 2015 WL 1186461 (D. Nev. Maritime 16, 2015) . . . . . . . . . . . . . . . . . . . . . . . 370
Simpson v. Commissioner of Social Sec., 2014 U.S. District LEXIS 10875 (S.D. Ohio,
Jan. 29, 2014) . . . . . . . . . . . . . . . . . . . . . . . . . . . . . . . . . . . . . . . . . . . . . . . . . . . . . . . . . . 371
In Re Southwest Airlines Voucher Litigation, 2014 WL 11115685 (N.D.Ill. June 4, 2014)375
Spegon v. The Catholic Bishop of Chi., 175 F.3d 544 (7th Cir., 1999) . . . . . . . . . . 360, 361
Stockman v. Global Credit and Collection Corp., 2015 U.S. District LEXIS 111113, 2015
WL 4999851 (N.D. Ill. Aug. 21, 2015) . . . . . . . . . . . . . . . . . . . . . . . . . . . . . . . . . . . . . 378
Strohl Systems Group, Incorporated v. Fallon, 2007 U.S. District LEXIS 90830, 2007
WL 4323008 (E.D. Pa., Dec. 11, 2007), aff’d 372 Fed.Appx. 230 (Mar. 30, 2010) . 382
Suleski v. Bryant Lafayette and Associates, 2010 U.S. District LEXIS 55353, 2010 WL
1904968 (E.D. Wis., May 10, 2010) . . . . . . . . . . . . . . . . . . . . . . . . . . . . . . . . . . . 364, 374
Suleski v. Bryant Lafayette and Assocs., 2010 U.S. District LEXIS 55353, 2010 WL
1904968 (E.D. Wis., May 10, 2010) . . . . . . . . . . . . . . . . . . . . . . . . . . . . . . . . . . . . . . . 363
Szijjarto v. Farias, 2014 U.S. District LEXIS 17406, 2014 WL 555122 (S.D. Tex. Feb. 12,
2014)
. . . . . . . . . . . . . . . . . . . . . . . . . . . . . . . . . . . . . . . . . . . . . . . . . . . . . . . . . . . . . . . . . . . . . . 372
404
UNITED STATES CONSUMER LAW SURVEY REPORT 2015-2016
Tamara Spikes and Beaumont Independent School District, 2015 WL 2450879 (E.D.
Tex. January 6, 2015) . . . . . . . . . . . . . . . . . . . . . . . . . . . . . . . . . . . . . . . . . . . . . . . . . . . 376
Taylor v. USF-Red Star Express, Incorporated, 2005 U.S. District LEXIS 3599, 2005
WL 555371 (E.D.Pa., March 8, 2005), aff’d 212 Federal Appx. 101 (2006) . . . . . . . 382
Twerdok v Secretary of Health and Human Services, 2016 WL 7048036 (U.S. Court of
Federal Claims, Office of Special Masters, Aug. 4, 2016). . . . . . . . . . . . . . . . . . . . . . 383
Uhl v. Colvin, 2016 U.S. District LEXIS 78779, 2016 WL 3361800 (E.D. Cal., June 16,
2016)
. . . . . . . . . . . . . . . . . . . . . . . . . . . . . . . . . . . . . . . . . . . . . . . . . . . . . . . . . . . . . . . . . . . . . . 365
United States Postal Service Federal Credit Union v. Edwin, 2018 U.S. District LEXIS
31532, 2018 WL 1077291 (D. Virgin Islands, Street Croix Division Feb. 27, 2018) 372
Vahidy v. Transworld Systems, Incorporated, 2009 U.S. District LEXIS 78984, 2009
WL 2916825 (N.D. Ill., September 01, 2009) . . . . . . . . . . . . . . . . . . . . . . . . . . . 364, 369
Valentin v. Grant Mercantile Agency, Inc., 2017 U.S. District LEXIS 212185, 2017 WL
6604410 (E.D. Cal. Dec. 27, 2017) . . . . . . . . . . . . . . . . . . . . . . . . . . . . . . . . . . . . . . . . 376
Verdun v. I.C. Sys., 2014 U.S. District LEXIS 52238, 2014 WL 1456295 (S.D. Cal., Apr.
14, 2014). . . . . . . . . . . . . . . . . . . . . . . . . . . . . . . . . . . . . . . . . . . . . . . . . . . . . . . . . . . . . . 366
Waldo v. Consumers Energy Company, 726 F.3d 802, 2013 U.S. App. LEXIS 16555. 382
Wallace v. Florida Dept. Of Education, 2010 WL 9067802 (Fla. Cir. Ct. June 2, 2010)376
Wamsley v. Kemp Creditors Interchange Receivables Management., LLC, 2010 U.S.
District LEXIS 48454, 2010 WL 1610734 (S.D. Ohio, April 20, 2010). . . . . . . . . . . . 371
Weed-Schertzer v. Nudelman, 2011 U.S. District LEXIS 108928, 2011 WL 4436553
(D.N.J. Sept. 23, 2011) . . . . . . . . . . . . . . . . . . . . . . . . . . . . . . . . . . . . . . . . . . . . . . . . . . 379
Westberry v. Commonwealth Fin. Sys., 2013 U.S. District LEXIS 14381, 2013 WL
435948 (D.N.J. Feb. 4, 2013) . . . . . . . . . . . . . . . . . . . . . . . . . . . . . . . . . . . . . . . . . . . . 379
405
UNITED STATES CONSUMER LAW SURVEY REPORT 2015-2016
White v. Cavalry Portfolio Servs., LLC, 2012 U.S. District LEXIS 35601, 2012 WL
899280 (D. Colo. Maritime 16, 2012) . . . . . . . . . . . . . . . . . . . . . . . . . . . . . . . . . . . . . . 377
Williams v. NCO Fin. Sys., 2011 U.S. District LEXIS 50635 (E.D. Pa. May 10, 2011) . 380
Zavodnick v. Gordon and Weisberg, P.C., 2012 U.S. District LEXIS 78868, 2012 WL
2036493 (E.D. Pa. June 6, 2012) . . . . . . . . . . . . . . . . . . . . . . . . . . . . . . . . . . . . . . . . . 380
STATUTES
15 U.S.C.A. 1692k(a)(3) . . . . . . . . . . . . . . . . . . . . . . . . . . . . . . . . . . . . . . . . . . . . . . . . . . . . 375
406
UNITED STATES CONSUMER LAW SURVEY REPORT 2015-2016
Copyright © 2017, 2018 by R.L.Burdge
March 13, 2018
407

Practicing Attorney and SurveyEditor, Ronald L Burdge
United States Consumer Law Attorney Fee Survey for 2015-2016
Attorneys in every state and the U.S. Territories took part in this national survey of
Consumer Law attorneys and their law practice economics. The results of this exhaustive and
peer reviewed survey continues the trend of being the most comprehensive since this
continuous research work began in 1999.
This Survey Report publishes the results of the United States Consumer Law Attorney
Fee Survey for 2015-2016. This Survey Report continues to be the only national survey of
Consumer Law practitioners in the United States. Since the first Survey Report was published
in 2000 the reported data has been used in more than 38 jurisdictions, including state and
federal courts, the U.S. Court of Federal Claims, the U.S. Department of Justice, the U.S.
Department of Labor, and the American Arbitration Association to determine reasonable
attorney fee rates, resulting in more than $8 million in awards across the United States.
The Survey Report provides data for the entire United States, Washington D.C., Puerto
Rico, the U.S. Virgin Islands, and 98 greater metropolitan areas. From Cape Coral, Florida to
Eugene, Oregon, from San Diego, California to Hartford, Connecticut, and points in between,
this survey provides hourly rates for attorneys and paralegals, average years in practice, and
far more information, with a Table of Authorities updated to March 13, 2018.
The data published here will help the bench, the
bar, and attorneys everywhere to understand the
economics of practicing law in the Consumer Law field
nationally.
In deciding a contested attorney fee motion in a
fee-shifting case, Senior United States District Judge
James C. Fox ruled that the U.S. Consumer Law Attorney
Fee Survey Report was more persuasive than the National
Law Journal’s fee survey and the U.S. Attorney’s Laffey
Matrix in Consumer Law cases. LaFountain, Jr v. Paul
Benton Motors of North Carolina, LLC, 2010 U.S. Dist.
LEXIS 121631, 2010 WL 4457057 (E.D. NC, Nov. 5, 2010).
You can download your own free
copy of this 408 page 2015-2016
Survey Report from NACA, NCLC,
NACBA web sites, scan the QR code
to the right, or by participating in
t h e n e x t s u r v e y . G o t o :
www.tinyurl.com/GetFeeSurvey