United States Air Force Environmental Restoration Program · PDF fileUnited States Air Force...
90
United States Air Force Environmental Restoration Program Guidance on Soil Vapor Extraction Optimization Prepared For Air Force Center for Environmental Excellence Brooks AFB, Texas June 2001 FINAL R M E I N E O A F C E N T ER FOR E N V N T A L E X C E L L E N C
Transcript of United States Air Force Environmental Restoration Program · PDF fileUnited States Air Force...

United States Air ForceEnvironmental Restoration Program
Guidance onSoil Vapor Extraction Optimization
Prepared For
Air Force Center for Environmental ExcellenceBrooks AFB, Texas
June 2001
FINAL
R MEI NE
O
A F CENTER FOR ENV NTAL EXCELLENC

Form SF298 Citation Data
Report Date("DD MON YYYY") 00062001
Report TypeN/A
Dates Covered (from... to)("DD MON YYYY")
Title and Subtitle United States Air Force Environmental Restoration ProgramGuidance on Soil Vapor Extraction Optimization
Contract or Grant Number
Program Element Number
Authors Project Number
Task Number
Work Unit Number
Performing Organization Name(s) and Address(es) Parsons Engineering Science Inc.
Performing Organization Number(s)
Sponsoring/Monitoring Agency Name(s) and Address(es) Air Force Center for Environmental Excellence Brooks AFB, TX
Monitoring Agency Acronym
Monitoring Agency Report Number(s)
Distribution/Availability Statement Approved for public release, distribution unlimited
Supplementary Notes
Abstract
Subject Terms
Document Classification unclassified
Classification of SF298 unclassified
Classification of Abstract unclassified
Limitation of Abstract unlimited
Number of Pages 89

ES-1 022/11.doc
EXECUTIVE SUMMARY
During this decade, the Department of Defense will spend over one billion dollars per
year on the operation, maintenance, and monitoring of environmental remediation
systems. This document was written to assist Air Force environmental managers and
consulting engineers who are responsible for the operation and monitoring of soil vapor
extraction (SVE) systems, and to promote the closure of sites where SVE systems have
achieved cleanup goals. Practical guidance is provided on performance monitoring and
the optimization of SVE systems so that remediation goals can be achieved in a cost-
effective manner. This document was prepared by Parsons Engineering Science Inc.
under the direction of the Technology Transfer Division of the Air Force Center for
Environmental Excellence (Contract No. F116323-94-D0024, D.O. 39).

-i- 022/11.doc
TABLE OF CONTENTS
Page
LIST OF ACRONYMS AND ABBREVIATIONS ...........................................................iv
EXECUTIVE SUMMARY ...........................................................................................ES-1
SECTION 1 - INTRODUCTION .................................................................................... 1-1
1.1 Purpose and Organization.................................................................................... 1-1 1.2 Background .......................................................................................................... 1-1
1.2.1 Technology Description...................................................................... 1-1 1.2.2 Proper Application of SVE ................................................................. 1-3
1.3 Enhancements to SVE.......................................................................................... 1-6 1.3.1 Thermal Enhancements....................................................................... 1-6 1.3.2 Dual-Phase Extraction......................................................................... 1-8 1.3.3 Soil Fracturing..................................................................................... 1-9
SECTION 2 - REFINED SITE CHARACTERIZATION............................................... 2-1
2.1 Objectives of Characterization............................................................................. 2-1 2.1.1 Key Elements of SVE Site Characterization....................................... 2-1 2.1.2 Developing Detailed Cross-Sections ................................................... 2-2
2.2 Advanced Site Characterization Tools................................................................. 2-2 2.2.1 Direct Push Soil and Soil Gas Sampling Methods .............................. 2-4 2.2.2 Continuous VOC and Permeability Logging ...................................... 2-6
2.3 Updating The Conceptual Site Model................................................................ 2-14 2.3.1 Source and Release Information ....................................................... 2-17 2.3.2 Geologic Characterization................................................................. 2-19 2.3.3 Contaminant Distribution, Transport and Fate.................................. 2-20 2.3.4 Risk Assessment Site Model............................................................. 2-20 2.3.5 SVE for Protection of Workers ......................................................... 2-21 2.3.6 Institutional Controls for Realignment and Closure Bases ............... 2-22
SECTION 3 - UNDERSTANDING SITE CLOSURE CRITERIA ................................ 3-1
3.1 Review of Remediation Goals ............................................................................. 3-1 3.1.1 Cleanup Goals Based on Groundwater Protection.............................. 3-2 3.1.2 Cleanup Goals Based on Commercial/Industrial Site-Specific
Risks.................................................................................................... 3-2 3.1.3 Developing a Closure Strategy............................................................ 3-4
-ii- 022/11.doc
TABLE OF CONTENTS (Continued)
Page
SECTION 4 - SYSTEM PERFORMANCE MONITORING ......................................... 4-1
4.1 Flow and Composition of Extracted Soil Gas...................................................... 4-2 4.2 Radius of Treatment Influence Based on Vacuum and Soil Gas
Chemistry............................................................................................................. 4-4 4.3 Equilibrium/Rebound Testing.............................................................................. 4-7 4.4 Respiration Measurements................................................................................... 4-9 4.5 Vapor Treatment Performance Monitoring ....................................................... 4-11
4.5.1 Basic Emission Testing ..................................................................... 4-11 4.5.2 Destruction Efficiency ...................................................................... 4-11 4.5.3 Unit Cost Effectiveness..................................................................... 4-13
SECTION 5 - OPTIMIZATION OF EXISTING SYSTEMS ......................................... 5-1
5.1 Inadequate Treatment of The Contaminated Soil Volume .................................. 5-2 5.1.1 Indicators............................................................................................. 5-2 5.1.2 Optimization Actions to Take ............................................................. 5-2
5.2 Slow Treatment of Low - Permeability Soils ...................................................... 5-4 5.2.1 Indicators............................................................................................. 5-4 5.2.2 Potential Optimization Actions ........................................................... 5-4
5.3 Submerged NAPL and Slow Groundwater Cleanup ........................................... 5-7 5.3.1 Indicators............................................................................................. 5-7 5.3.2 Possible Optimization Actions............................................................ 5-7
5.4 Inefficient or Mismatched Vapor Treatment ....................................................... 5-8 5.4.1 Indicators............................................................................................. 5-8 5.4.2 Possible Optimization Actions............................................................ 5-9
5.5 Other Performance Problems............................................................................. 5-10
SECTION 6 - SVE SHUTDOWN LEADING TO SITE CLOSURE ............................. 6-1
6.1 Data Requirements............................................................................................... 6-1
SECTION 7 - REFERENCES ......................................................................................... 7-1
APPENDICES
A - Calculate Soil Gas Contaminant Mass B - SVE Turn Off Criteria

-iii- 022/11.doc
TABLE OF CONTENTS (Continued)
LIST OF TABLES
No. Title Page
3.1 Example Screening Levels for Chlorinated Solvents .......................................... 3-3 4.1 SVE Performance Monitoring Requirements ...................................................... 4-2
FIGURES
No. Title Page
1.1 Basic In-Situ Soil Vapor Extraction System........................................................ 1-2 1.2 Volatile Organic Fate and Transport Processes ................................................... 1-4 1.3 Enhancements to SVE.......................................................................................... 1-7 2.1 Detailed Cross-Section for SVE Site Characterization........................................ 2-3 2.2 Single Use Direct Push Soil Gas Sampling Point................................................ 2-5 2.3 Membrane Interface Probe System Diagram....................................................... 2-8 2.4 Vertical Profile of VOCs and Soil Conductivity Produced by MIPS.................. 2-9 2.5 SimulProbe® Schematic for Cased Bore Hole Soil Gas Sampling................... 2-11 2.6 Vapor Monitoring Point Typical Construction Detail ....................................... 2-13 2.7 PneuLog™ Schematic ....................................................................................... 2-15 2.8 PneuLog™ Vertical Profile of Vent Well VOC and Permeability Zones ......... 2-16 2.9 Elements of a Conceptual Site Model (CSM).................................................... 2-18 3.1 SVE Site Closure Process .................................................................................... 3-5 4.1 VOC Removal vs. Time Plots.............................................................................. 4-3 4.2 Vent Well Flow Optimization Logic Diagram .................................................... 4-5 4.3 Typical Soil Gas Chemistry Response Curves .................................................... 4-8 4.4 Results of Equilibrium / Rebound Test.............................................................. 4-10 4.5 Estimation of Biodegradation at SVE Sites ....................................................... 4-12 5.1 Equilibrium/Rebound Indicators.......................................................................... 5-5 6.1 History of PCE Extraction at Vent Well.............................................................. 6-3 6.2 History of PCE Concentrations at VMPs............................................................. 6-3 6.3 Maximum vs. Average Soil Exposure Concentrations for TCE.......................... 6-6
-iv- 022/11.doc
LIST OF ACRONYMS AND ABBREVIATIONS
AFCEE Air Force Center for Environmental Excellence BESST Best Environmental Subsurface Sampling Technology, Inc. bgs below ground surface BRAC Base Realignment and Closure C Degree Celsius CPT cone penotrometer technology CSM conceptual site model DAF dilution attenuation factor DoD Department of Defense DNAPL Dense non-aqueous phase liquid DPE dual-phase extraction DQO Data quality objective ECD electron capture device EPA Environmental Protection Agency ER electrical resistance FID flame ionization detector Hg Mercury MCL maximum contaminant level MCLG Maximum contaminant level goal mS/m milliSiemen per meter mg/kg milligram per kilogram µg/L microgram per liter MIP membrane interface probe mm millimeter MPE multi-phase extraction NAPL non-aqueous phase liquid O&M Operations and maintenance PID photoionization detector ppmv Parts per million, volume per volume Praxis Praxis Environmental Technologies, Inc, PVC Polyvinyl chloride RCRA Resource Conservation and Recovery Act RF Respirable fraction RFH radio frequency heating RI/FS remedial investigation/feasibility study ROD Record of decision RPO remedial process optimization SPLAT SimulProbe® Latch Activated Tip SSL soil screening level SSTL site-specific target limit STOP SVE Termination or Optimization Process SVE soil vapor extraction SVOC Semivolatile organic compound

-v- 022/11.doc
TBD Technical Background Document TCE trichloroethene USACOE United States Army Corps of Engineers UST underground storage tank VMP vapor monitoring points VOC volatile organic compounds VW Vent well

022/736300/11.doc
1-1
SECTION 1
INTRODUCTION
1.1 PURPOSE AND ORGANIZATION
This document was written for Air Force environmental managers and consulting
engineers who are responsible for the operation and monitoring of soil vapor extraction
(SVE) systems, and eventual closure of sites where SVE systems are in use. The purpose
of the document is to provide practical guidance on the optimization of these systems so
that remediation goals can be achieved in a cost-effective manner. Five primary topics
will be presented. Section 2 describes the importance of accurate site characterization
and how new characterization methods can enhance and redefine the conceptual site
model and basis of design. Section 3 underscores the importance of a clear
understanding of site closure requirements and provides ideas for defining remediation
cleanup goals. Section 4 describes standard methods for monitoring the performance of
SVE systems. In Section 5, common performance problems are discussed as well as
methods of improving and optimizing the performance of these systems. Finally, Section
6 discusses various approaches for obtaining site closures.
1.2 BACKGROUND
1.2.1 Technology Description
Soil vapor extraction is the application of a vacuum to unsaturated (vadose zone) soils
to induce soil vapor flow toward extraction vent wells and remove volatile and some
semi-volatile contaminants from the soil (Figure 1.1). Once removed from the soil,
volatile organic compounds (VOCs) can either be released directly to the atmosphere or
removed/destroyed using an aboveground treatment process. On many sites, a vapor/
liquid separator is required to remove condensed water to protect the blower and improve
the operation of vapor treatment units. The need for vapor treatment is based on local air

Vapor TreatmentUnit/GACVacuum Pump
or BlowerFlowMeter
PressureGauge
Multi-LevelVapor Monitoring Points
Difficult to RemediateCapillary Fringe
Vapor LiquidSeparator
Figure 1.1
draw\svehandbk4.cdr aee p2 4/6/01
BASIC IN-SITU SOIL VAPOR EXTRACTION SYSTEM

022/736300/11.doc
1-3
discharge regulations. The progress of vadose zone remediation is normally monitored
using strategically placed soil vapor monitoring points or VMPs.
When air is drawn through the soil, it passes through soil pore spaces, and primarily
through pathways of low resistance (high permeability soils). Air that is drawn through
soils containing VOC vapors will remove these vapors and continue to vaporize adsorbed
and non-aqueous phase liquids (NAPLs). This is known as removal by advection and will
continue until all of the volatile adsorbed and liquid-phase contaminants are removed
from higher permeability soils. Contaminants in lower permeability soils will not be
removed by advection because soil vapors will preferentially flow through higher
permeability soils. Contaminants in lower permeability silts and clays must desorb and
diffuse into an advective flow path before they can be removed by the SVE system. If
the rate of diffusion is slow, the timeframe for removing VOCs will be significantly
extended (Environmental Protection Agency [EPA], 1991). Figure 1.2 illustrates how
contaminants are removed via advection and diffusion processes in the subsurface.
1.2.2 Proper Application of SVE
The proper application of the SVE technology is based on an evaluation of three
primary criteria: the risk mitigation requirement, contaminant properties, and soil
properties. Although a complete discussion of these design criteria is beyond the scope
of this document, a brief summary is provided here.
Risk Mitigation – The proper application of SVE requires a clear understanding of
the risks that require mitigation. The SVE system must be designed and operated to
accomplish one or more of these risk mitigation goals. There are three common risks that
could lead to a regulatory or voluntary cleanup of soils.
• A risk from direct contact with soils or soil vapors such as the exposure to a utility
installation worker to contaminated soils.
• A risk to groundwater based on the leaching of contaminants from soils.

VOLATILE ORGANIC FATEAND TRANSPORT PROCESSES
Figure 1.2
draw\svehandbk3.cdr aee p1 4/5/01
Source: after USEPA 1991C.
Air
Flo
w
Air
Flo
w
Vapor Flow
Vapor Flow
Vapor Flow Extraction Well
Ground Surface
Soil
(Advection)
Va
do
se
Zo
ne
(Diffusion)Massive
Clay
Sand
Sand
VadoseZone
Groundwater Zone
LNAPL
DNAPL
GroundwaterTable
Capillary Fringe
We
llS
cre
en
Air Flow
Air
Flo
w
Vapor Flow
NAPL
OrganicsAdsorbed
OrganicsDissolvedin Water
Air Laden with OrganicContaminants
Air Laden with OrganicContaminants
Organic Compounds
Organic Compounds
Free Organic Vaporin Pore Space
Diffusion Control
Advection Process
Diffusion Process
StronglyAdsorbedOrganics
VaporDiffusion
VaporDiffusion
Air
Flo
w
Air
Flo
w
AirFlo
w
Air
Flo
w
Vapor Flow
ClayParticles
Sand Particles
Sand
022/736300/11.doc
1-5
• An explosive risk in nearby structures and underground utilities from high levels
of volatile organics.
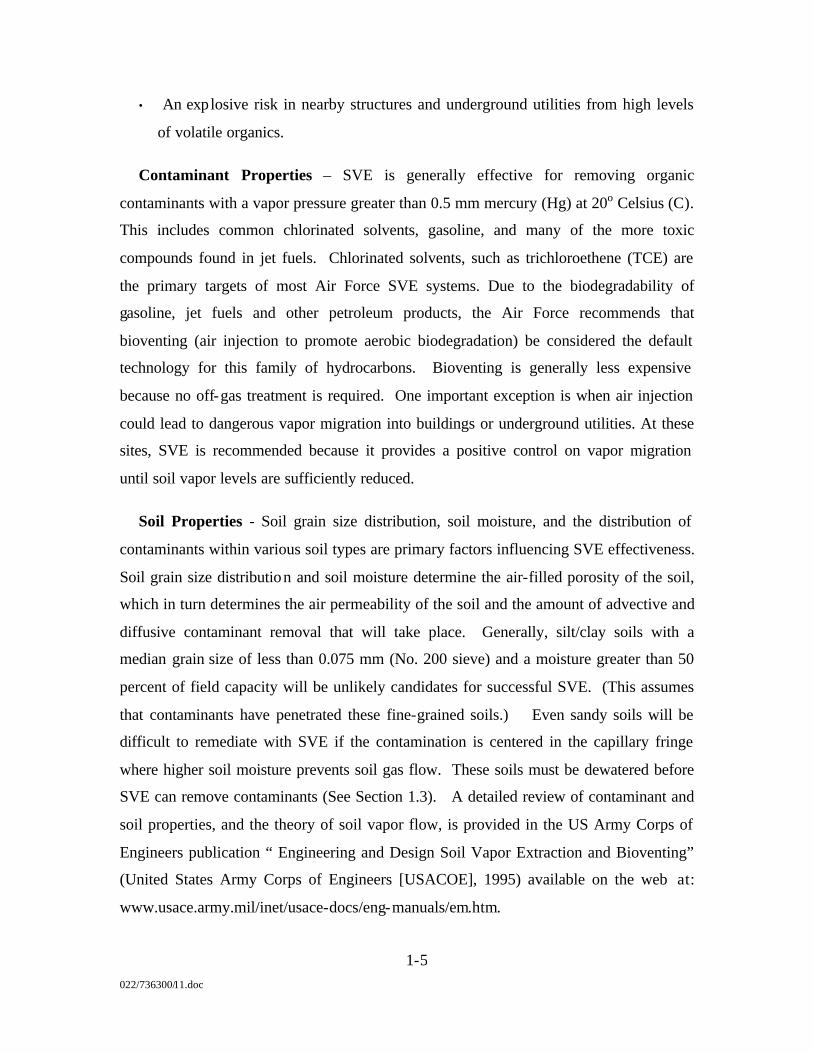
Contaminant Properties – SVE is generally effective for removing organic
contaminants with a vapor pressure greater than 0.5 mm mercury (Hg) at 20o Celsius (C).
This includes common chlorinated solvents, gasoline, and many of the more toxic
compounds found in jet fuels. Chlorinated solvents, such as trichloroethene (TCE) are
the primary targets of most Air Force SVE systems. Due to the biodegradability of
gasoline, jet fuels and other petroleum products, the Air Force recommends that
bioventing (air injection to promote aerobic biodegradation) be considered the default
technology for this family of hydrocarbons. Bioventing is generally less expensive
because no off-gas treatment is required. One important exception is when air injection
could lead to dangerous vapor migration into buildings or underground utilities. At these
sites, SVE is recommended because it provides a positive control on vapor migration
until soil vapor levels are sufficiently reduced.
Soil Properties - Soil grain size distribution, soil moisture, and the distribution of
contaminants within various soil types are primary factors influencing SVE effectiveness.
Soil grain size distribution and soil moisture determine the air-filled porosity of the soil,
which in turn determines the air permeability of the soil and the amount of advective and
diffusive contaminant removal that will take place. Generally, silt/clay soils with a
median grain size of less than 0.075 mm (No. 200 sieve) and a moisture greater than 50
percent of field capacity will be unlikely candidates for successful SVE. (This assumes
that contaminants have penetrated these fine-grained soils.) Even sandy soils will be
difficult to remediate with SVE if the contamination is centered in the capillary fringe
where higher soil moisture prevents soil gas flow. These soils must be dewatered before
SVE can remove contaminants (See Section 1.3). A detailed review of contaminant and
soil properties, and the theory of soil vapor flow, is provided in the US Army Corps of
Engineers publication “ Engineering and Design Soil Vapor Extraction and Bioventing”
(United States Army Corps of Engineers [USACOE], 1995) available on the web at:
www.usace.army.mil/inet/usace-docs/eng-manuals/em.htm.

022/736300/11.doc
1-6
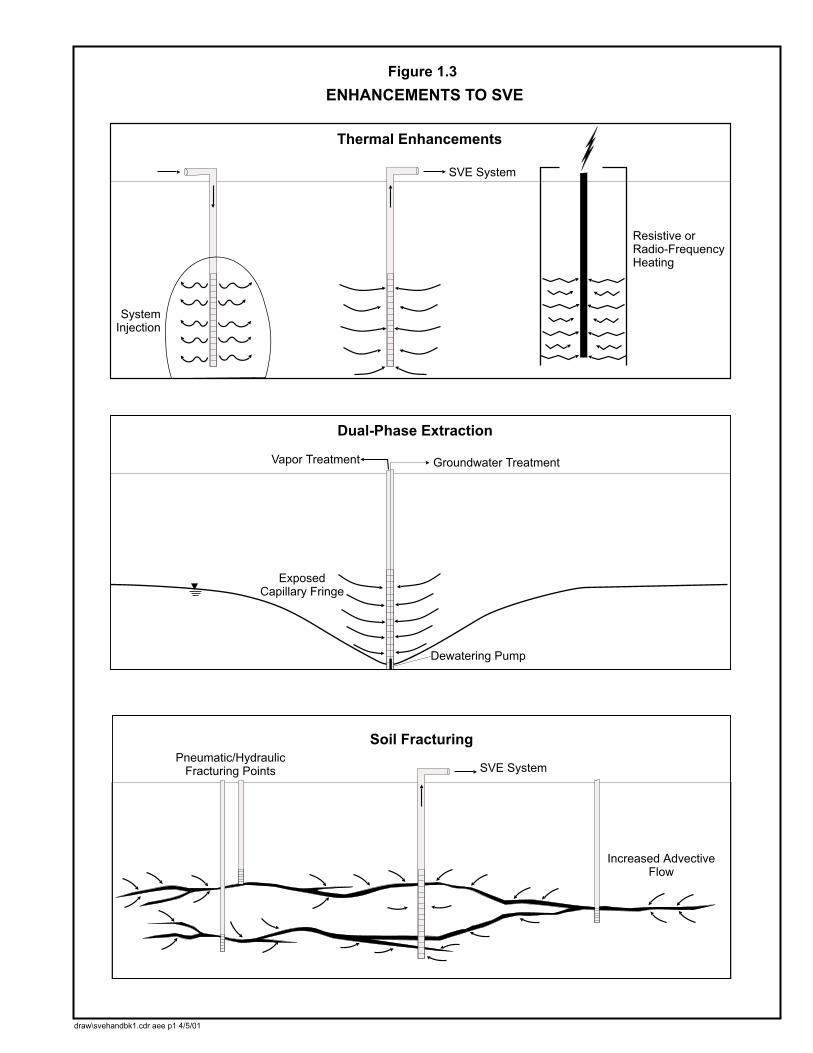
1.3 ENHANCEMENTS TO SVE
Several SVE enhancements have been developed to overcome limitations caused by
less than optimum contaminant and soil properties. This section provides an overview of
commonly applied SVE enhancements that have the potential to accelerate mass removal
and extend the application of this technology to semi-volatile contaminants and lower
permeability or saturated soils. Figure 1.3 illustrates several common enhancements to
SVE. The use of these enhancements to improve SVE effectiveness is also discussed in
Section 5.
1.3.1 Thermal Enhancements
Thermal enhancements for SVE include a number of technologies that increase the
volatilization of VOCs and semivolatile organic compounds (SVOCs), increase the air
permeability of the soil, and enhance gas-phase diffusion process. By increasing the
vapor pressure of a contaminant, the volatilization rate from liquid phase to vapor phase
accelerates, increasing the mass available for extraction by SVE. An increase in the air
permeability of the soil is due to the drying effects of heat, enhancing the vaporization
and extraction of moisture from the subsurface, and resulting in increased advection.
Gas-phase diffusion is typically much slower than advection and is often a rate-limiting
step in SVE. In diffusion-limited formations, increased temperature enhances the rate of
vapor transport from low permeability zones to regions of higher permeability. These
mechanisms allow thermal enhancement of SVE to increase overall mass removal of
contaminant or to shorten remediation times. Thermal processes will generally increase
the unit cost for mass removal.
Thermal enhancement technologies include steam or hot air injection, radio frequency
heating (radio frequency heating [RFH]), electrical resistance (ER) heating, and thermal
conduction heating. Steam injection technologies push contaminants ahead of a
condensate front. The steam continues to remove contaminants after the condensate front
has passed and heated soil vapor is removed with standard extraction wells. Soils of
medium to high permeability are required to allow the condensate front to move freely.
Hot air injection is similar to steam injection except the dry hot air removes moisture
SystemInjection
SVE System
Thermal Enhancements
ENHANCEMENTS TO SVE
Figure 1.3
Dual-Phase Extraction
Soil Fracturing
Resistive orRadio-FrequencyHeating
Vapor Treatment Groundwater Treatment
Dewatering Pump
ExposedCapillary Fringe
SVE SystemPneumatic/Hydraulic
Fracturing Points
Increased AdvectiveFlow
draw\svehandbk1.cdr aee p1 4/5/01

022/736300/11.doc
1-8
from the soil, increases air permeability, while volatilizing contaminants. RFH uses
antennae or electrodes that emit radio frequency waves to increase molecular motion
(similar to a kitchen microwave) and produce volumetric heating of the soil. ER heating
uses the soil as a conduction path for electrical current and the resistance of the soil is
used to create heat. Six-phase heating is the most common form of electrical resistance
(ER) heating applied to remediation sites. This method may be effective for low-
permeability soils in the vadose zone. As the native soil moisture is driven off, the
conductivity of the soil decreases, limiting the maximum temperature to approximately
100°C. Thermal conduction heating uses a heat source such as inserted hot metal rods to
directly transfer heat to the soil. Although this is a very simple method, it can be slow
and inefficient for large soil volumes. A more detailed discussion of thermal
enhancement is available in the EPA Analysis of Selected Enhancements for Soil Vapor
Extraction (EPA, 1997).
1.3.2 Dual-Phase Extraction
Dual-phase extraction (DPE) is the removal of contaminated soil vapor and
groundwater from a common extraction well. DPE enhances SVE by dewatering the
capillary fringe and smear zones and allowing air flow through previously moist or
saturated soils. In addition, simultaneous groundwater extraction prevents upwelling
typically associated with SVE. The lack of upwelling allows higher vacuums to be
applied and increases extraction rates of groundwater and soil vapor. The increased
groundwater extraction rates can also accelerate the removal of non-aqueous phase liquid
(NAPL) and dissolved groundwater contamination. Well and pump combinations that
also remove NAPL as a separate phase are defined as multi-phase extraction (MPE)
systems. The Air Force developed “Bioslurping” as an effective MPE method for free
product fuel recovery and vadose zone remediation. A more detailed discussion of DPE
and MPE enhancements of SVE is available in the EPA Analysis of Selected
Enhancements for Soil Vapor Extraction (EPA, 1997) and the “Engineering Evaluation
and Cost Analysis for Bioslurper Initiative Final Report” (Air Force Center for
Environmental Excellence [AFCEE], 1997).

022/736300/11.doc
1-9
1.3.3 Soil Fracturing
Soil fracturing enhances SVE by creating high permeability pathways in low-
permeability soils. These preferential flow pathways allow the effects of the applied
vacuum to propagate further from the extraction well, increasing the advective flow zone
round the well. Pneumatic and hydraulic fracturing are the primary methods that have
been used to enhance SVE. Pneumatic fracturing involves the injection of highly
pressurized air into the subsurface and is effective at enhancing existing fractures and
increasing the secondary fracture network. Hydraulic fracturing involves the injection of
water or slurry into the subsurface. The injected slurry may contain sand or other
granular materials used to hold open the new fractures. A more detailed discussion of
soil fracturing is available in the EPA Analysis of Selected Enhancements for Soil Vapor
Extraction (EPA, 1997).
022/736300/11.doc
2-1
SECTION 2
REFINED SITE CHARACTERIZATION
2.1 OBJECTIVES OF CHARACTERIZATION
This section describes additional site characterization techniques that can be used to
refine our understanding of the subsurface conditions that relate to the performance of
SVE systems. Standard methods of site characterization are not discussed in detail.
Instead, this section will focus on several specialized techniques that have the potential to
improve SVE performance. The objectives of SVE site characterization can be grouped
into three general statements:
• To define the source, the contaminated volume of soil, and the nature of
contamination (non-aqueous phase liquid or vapor).
• To define the capacity of the contaminated soil volume to transmit air and to
identify the permeability variations due to soil type and soil moisture.
• To use this information to create a conceptual site model that can be updated as the
SVE process moves forward.
2.1.1 Key Elements of SVE Site Characterization
The following site characterization information is required for all effective SVE
systems:
1. The volume of contaminated soil must be bounded by clean samples including
bottom samples that determine the extent of soil contamination below the water
table. Many SVE systems are ineffective at reducing groundwater contamination
because a significant fraction of the soil contamination is below the water table.

022/736300/11.doc
2-2
2. The source area containing NAPL contamination must be identified and
differentiated from areas with only vapor contamination. Locating extraction
wells near the center of the NAPL volume is a key to effective SVE.
3. The soil lithology must be defined by multiple boring logs to identify sand and
fine-grained layering. Soil samples should be analyzed for moisture content.
Grain size and soil moisture to determine the air permeability of the soil.
2.1.2 Developing Detailed Cross-Sections
This fundamental site information should be translated into several cross-sections of
the contaminated source area and any resulting smear zone. Figure 2.1 illustrates a
detailed cross-section for a TCE-contaminated site. Detailed cross-sections provide the
foundation of the conceptual site model described in Section 2.3.
2.2 ADVANCED SITE CHARACTERIZATION TOOLS
Many SVE systems can be successfully installed and operated based on the
fundamental site characterization information described above. Sites with permeable
sands and minimum silt/clay layering are generally predictable in their response to SVE
and are frequently remediated with a high degree of uniformity. Unfortunately, uniform
treatment is uncommon at many Air Force bases located on flat sedimentary deposits that
are characterized by soil layers of varying permeability.
Many SVE sites can benefit from the use of new and improved characterization tools
described in this section. One or more of these tools should be used during initial site
characterization, particularly at sites with layers of high and low permeability soils. The
additional site characterization information provided by these tools is also useful for
updating site conceptual site models and optimizing and improving existing SVE
systems. Some tools provide real time information and leave no permanent monitoring
points, making them useful for the initial characterization and filling in critical data gaps
in the conceptual model. Other tools provide permanent monitoring points or wells that
provide a standard reference for updating the conceptual site model or evaluating the
performance of a remediation system (Section 4.0).
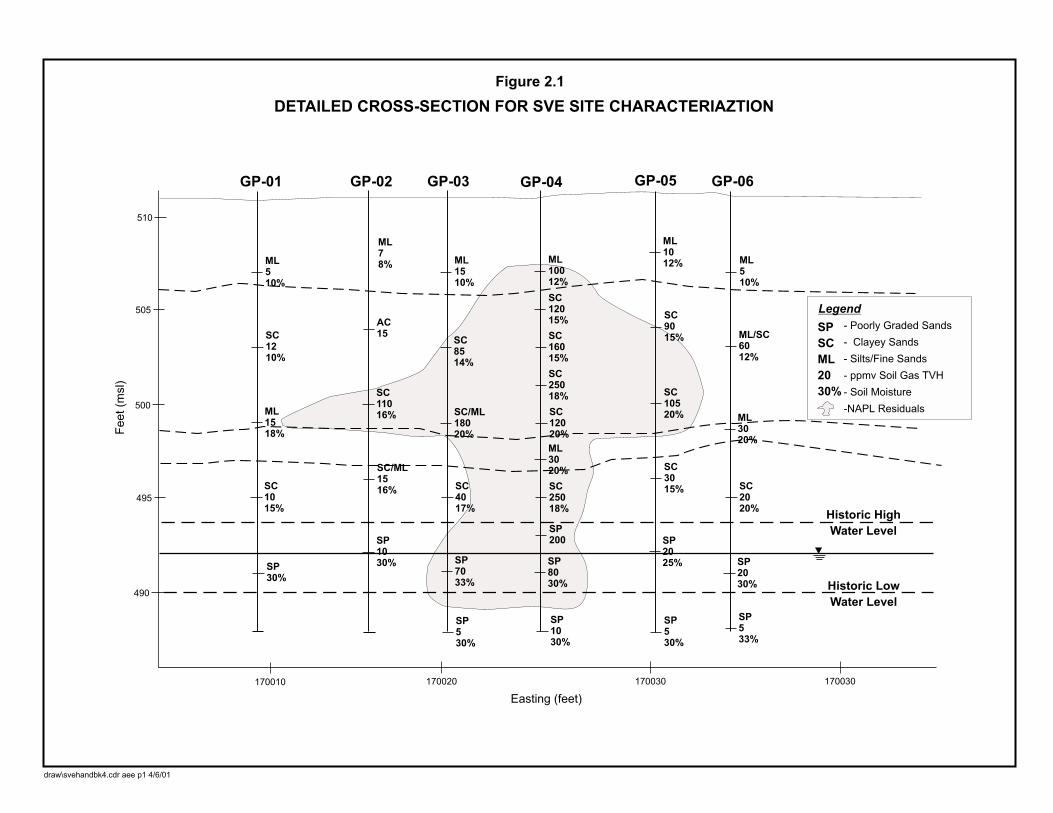
Figure 2.1
draw\svehandbk4.cdr aee p1 4/6/01
DETAILED CROSS-SECTION FOR SVE SITE CHARACTERIAZTION
GP-01 GP-02
ML510%
AC15
SC8514%
ML78%
GP-03 GP-04 GP-05 GP-06
SC1210%
ML1510%
ML1012%ML
10012%
ML510%
SC9015%
SC12015%
SC16015%
SC25018% SC
10520% ML
3020%
SC3015%
SP2025%SP
8030%
SP7033%
SP2030%
SP533%
SP530%
SP530%
SP1030%
SP1030%
SC2020%
SC12020%
ML3020%
SC25018%
SC11016% SC/ML
18020%
SC/ML1516%
ML1518%
SC1015%
SP30%
495
505
510
500
490
170010 170020 170030
Easting (feet)
Feet(m
sl)
Historic High
Water Level
Historic Low
Water Level
170030
SC4017%
SP200
ML/SC6012%
SP
SC
ML
20
30%
Legend
- Poorly Graded Sands
- Clayey Sands
- Silts/Fine Sands
- ppmv Soil Gas TVH
- Soil Moisture
-NAPL Residuals

022/736300/11.doc
2-4
2.2.1 Direct Push Soil and Soil Gas Sampling Methods
Direct push soil sampling tools such as the Geoprobe and the cone penotrometer
technology (CPT) units can be used to sample soil, soil gas, and install permanent vapor
monitoring points. Direct push technologies use hydraulically driven rods to advance
special soil or soil gas sampling tools to a desired depth. These tools can rapidly collect
soil cores or extract soil gas without creating soil cuttings that may require special
handling and disposal. In general, this equipment is smaller and is less labor intensive
than traditional drilling methods. Geoprobes® have traditionally been mounted on ¾ to
1-ton pickup trucks and have been successfully applied at sites with sandy, low density
soils where penetrations are required in the upper 100 feet of the soil. CPT rigs are larger
and heavier and are capable of pushing to greater depths through silt and clay soils.
Cobble and rock layers will significant limit the use of any type of direct push
technology. For shallow applications, direct push technologies can generally characterize
2 to 3 times the number of boring locations per day as compared to traditional hollow-
stem auger rigs.
Direct push units can collect a 2 – 4 foot soil core per rod stroke and can rapidly
collect a continuous soil core at each location. The continuous core provides an accurate
definition of varying grain sizes and moisture conditions and can be used to estimate air
permeability and improve SVE design and operations. At the surface, soil samples are
generally logged, screened for contamination using a flame ionization detector (FID) or
photoionization detector (PID), and selected samples packaged for laboratory VOC
analysis.
Modifications to the rod configuration of direct push equipment allows the collection
of soil gas samples in addition to soil cores. Special sampling tips with small-screened
sections are driven to the desired depth. A soil gas sample is then collected through
tubing that runs from the open borehole or screened tip to a small vacuum pump and
sampling device at the surface. Figure 2.2 is an example of a soil gas sampling tool.
Other direct push tools, such as the SimulProbe , can be used to collect several samples
within the same hole (see Section 2.2.2). The soil gas sample can be analyzed using a

SINGLE USE DIRECT PUSH SOIL GAS SAMPLING POINT
Source: GEOPROBE, 2000.
Expendabe DrivePoint
O-Ring
PRT ExpendabePoint Holder
Probe Rod
O-Ring
PRT Adapter
Tubing
A cross section of the PRT Systemshowing how soil gas (arrows) isdrawn through the inner tubingsystem.
A cross section of probe rods that are being driven todepth and then retracted to allow for soil gas sampling.The PRT adapter and tubing are now fed through therods and rotated to form a vacuum-tight connection atthe point holder. The result is a continuous run oftubing from the sample level to the surface.
Figure 2.2
draw\svehandbk2.cdr nap p1 4/2/01

022/736300/11.doc
2-6
handheld gas analyzer (FID or PID) or submitted for more specific analysis at a
laboratory.
Discrete soil gas monitoring points (Section 2.2.5) can be permanently installed using
direct push equipment. The monitoring points generally consist of a 0.5 to 0.75-inch
polyvinyl chloride (PVC) tube with a 6-inch soil gas collection screen at the bottom. The
entire VMP is installed inside of the hollow steel push rod. As the steel push rods are
withdrawn, the VMP remains in place. If direct push units cannot penetrate soils, more
traditional (and expensive) drilling methods can be used to install these points (see
Section 2.2.3). Discrete soil gas monitoring points are generally installed at various
depths within various soil types to determine the uniformity of SVE treatment. VMPs are
also installed in contaminated soils at varying distances from the vent wells (VWs) to
determine the radius of venting influence. Permanent VMPs are used to measure long-
term changes in vapor-phase contaminant concentrations, soil gas chemistry, and
pressure/vacuum response through the soil profile and across the site (Section 2.2.5).
2.2.2 Continuous VOC and Permeability Logging
In the past, continuous VOC logging required the field screening of split-spoon soil
cores (Section 2.2.3) and the laboratory analysis of selected samples. This method of
continuous VOC logging is relatively slow and the integrity of VOC samples taken from
open split spoons is always in question. Relative permeability was identified by analysis
of soil cores for grain size and moisture content. Recently, technologies have been
developed to continuously log VOC contamination and relative permeability in the
subsurface using direct push tools or logging tools that can be used with traditional
drilling techniques. These technologies provide either quantitative or qualitative results
depending on the tool and sample analysis method. The availability of this “high
resolution” data can provide important insights into the design of vent wells, subsurface
airflow patterns, and the progress toward cleanup. AFCEE recently completed an
evaluation of direct push and well logging tools and reported the results in “Final Results
Report for Soil Vapor Extraction Optimization Tools” (AFCEE, 2001).

022/736300/11.doc
2-7
Geoprobe's® membrane interface probes (MIPS) technology provides continuous
logging from a Dipole Conductivity Probe (determines soil conductivity) and a MIP
(determines volatile organic concentration) with respect to the probes depth. Figure 2.3
shows the configuration of the MIPS. The MIPS is driven into the ground at a rate of one
foot per minute using a Geoprobe® push rod. While the probe is being driven, the dipole
conductivity probe measures the soil conductivity (detectable range of 5 to 400
milliSiemen/meter [mS/m]). In general, these conductivity readings can be interpreted as
sand (low conductivity) or silts and clays (high conductivity). However, factors such as
soil moisture and cation/anion concentrations can also affect conductivity readings.
Dipole conductivity probe results can be compared to actual soil types (from boring logs)
to develop a correlation between soil conductivity and known lithology features.
The MIP consists of a heated section of stainless steel probe with a permeable
membrane that enhances VOCs partitioning across the membrane surface. After
partitioning across the membrane, the carrier gas transfers the VOCs to the detector at the
surface. The MIP system can be used in the saturated zone to detect residual NAPLs that
cannot be detected with standard soil gas techniques. The FID or PID detector readout is
semi-quantitative and is useful for determining relative VOC concentrations in the sub-
surface. The information provided by the conductivity probe and the MIP can be used to
develop a vertical profile of soil type and contaminant concentration zones for each
Geoprobe® push location. Figure 2.4 illustrates the results of a typical MIP profile
compared to a known boring log. Note the increase in conductivity indicating a less
permeable silty layer from 5 to 20 feet below ground surface (bgs). Note the increase in
VOCs (PID and electron capture device [ECD] readings) detected at 15 to 22 feet,
indicating that the silty sand layer at this interval is the primary source of residual VOCs
in this soil column. This information is very useful for designing vent well screens and
creating subsurface air flow that will result in minimum clean air dilution and maximum
VOC recovery.
The SimulProbe , produced by Best Environmental Subsurface Sampling Technology,
Inc. (BESST), can be used to collect soil gas samples and permeability information

MEMBRANE INTERFACE PROBESYSTEM DIAGRAM
Gas FlowTo Detector
Gas Flow
RegulatedCarrier Gas
Supply
Carrier GasSupply Tube
Carrier GasReturn Tube
PolymerMembrane
MembraneContact Zone
Soil ConductivityMeasurement Tip
Source: Christy, 1996.
Figure 2.3
draw\svehandbk1.cdr aee p2 4/5/01

0 100 200
Conductivity (mS/m)
0.0E+00 1.0E+05 2.0E+05
PID Response (µV)
0.0E+00 3.0E+06 6.0E+06
ECD Response (µV)
0
10
20
30
40
50
60
70
80
90
Lithology
Data Not Collected Due to Lithology
Dep
th(f
tb
gs)
Figure 2.4
draw\svehandbk8.cdr nap p2 4/25/01
VERTICAL PROFILE OF VOCs AND SOIL CONDUCTIVITY PRODUCED BY MIPS
Silt
Legend
Silt Sand
Cobble and Silt Sand
Bottom of Bore Hole@ 81.5 FT BGS

022/736300/11.doc
2-10
throughout the vertical soil profile with a CPT rig or traditional drilling methods. The
SimulProbe can be pushed to depth by the CPT rig or used like a traditional split spoon
with a drill rig. The SimulProbe can be pushed to depth, opened to expose the screen
and then used convey soil gas to the surface through a drop tube (Figure 2.5). The
sample is collected at the surface and can be analyzed in the field or at a laboratory for
qualitative or quantitative results. The SimulProbe can operate in three modes useful
for site characterization. These modes are:
• Soil and Soil Gas Sampling - soil gas is transported to the surface for analysis and
soil samples are collected from the same stratigraphic horizon.
• Continuous Soil Gas Sampling - device is driven continuously collecting soil gas
samples at multiple intervals and transporting them to the surface for analysis.
• SPLAT (SimulProbe Latch Activated Tip) - device is driven continually
collecting multiple soil gas samples and transporting them to the surface. A single
soil sample can be collected by unlatching the tip after which the device must be
retrieved.
In addition, permeability can be calculated by closely monitoring the pressure response at
the start of a soil gas extraction purge cycle with data logging pressure transducers
(Johnson, 1990). The SimulProbe can operate in conjunction with a CPT rig or
conventional drilling techniques making it more applicable for sites with deep
contamination or difficult soil stratigraphy.
2.2.3 Conventional Drilling Methods
Site characterization using conventional drilling methods has traditionally involved
driving a split spoon prior to a casing or auger. Soil samples are retrieved from intervals
in front of the casing/auger and field screened at the surface (frequency of sampling
varies by site). At the surface, the samples are logged for lithologic features and screened
for VOCs. Based on the results of the field screening, samples are collected for
laboratory analysis, analyzed for potential contaminants, grain size, and moisture content.

SimulProbe SCHEMATIC FORCASED BORE HOLE SOIL GAS SAMPLING
®
Source: BESST, Inc., 2001.
Probe lowered to bottomof bore hole throughhollow stem auger anddriven ahead of lead auger
Hollow Stem Auger
Vacuum Pump
Flow Meter
Rods
Gas Collection Tube
VacuumGauge
SimulProbe® is pulledback 20 inches to exposescreen. Soil Gas Flow fromFormation to Screen is360 Degrees
• SimulProbe® lowered inside of bore hole.
• Use down-hole wire line hammer orup-hole hammer rods.
• When drive distance is reached, pull Probeback one to two inches to open sliding driveshoe - to expose screened entry port.
• Turn on vacuum pump and purge line beforesampling.
• After line is purged, collect soil gas sampleor field screen.
Figure 2.5
draw\svehandbk2.cdr aee p1 4/5/01
022/736300/11.doc
2-12
Although the costs of conventional drilling are substantially higher then direct push
methods, these rigs can go deeper and overcome adverse soil conditions, including
cobbles and bedrock. Conventional drill rigs can quickly install nested VMPs and 2 to 4-
inch diameter VWs during the same mobilization.
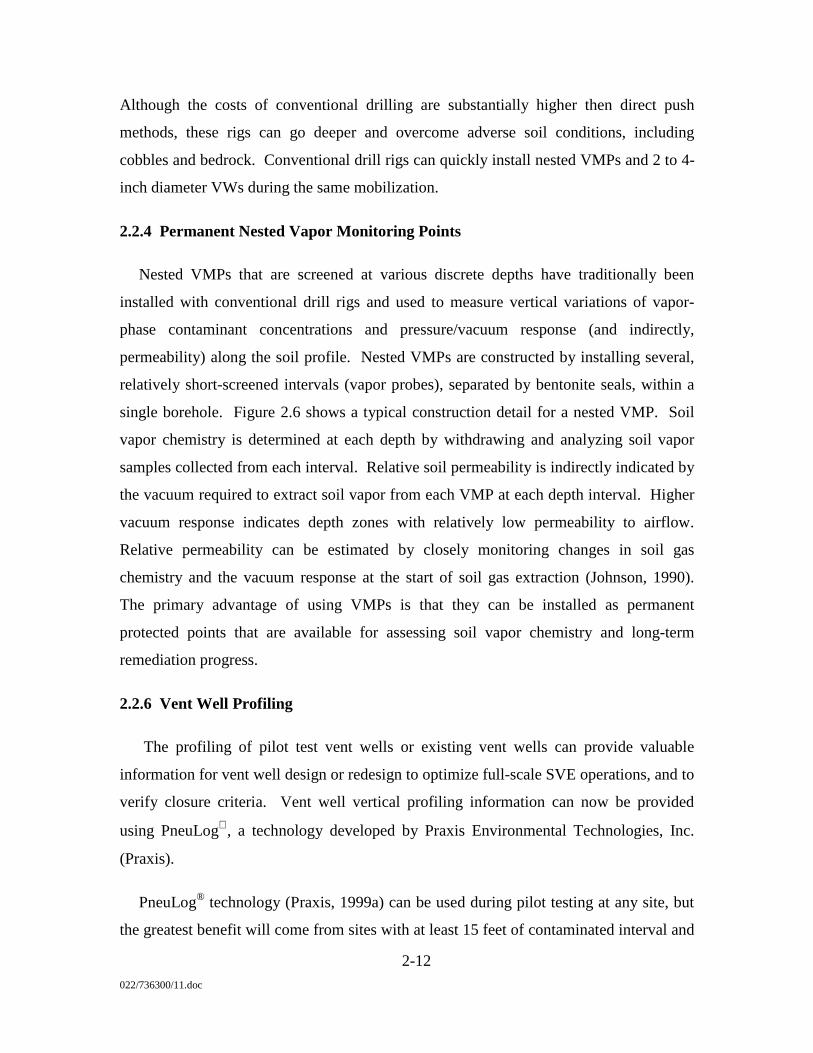
2.2.4 Permanent Nested Vapor Monitoring Points
Nested VMPs that are screened at various discrete depths have traditionally been
installed with conventional drill rigs and used to measure vertical variations of vapor-
phase contaminant concentrations and pressure/vacuum response (and indirectly,
permeability) along the soil profile. Nested VMPs are constructed by installing several,
relatively short-screened intervals (vapor probes), separated by bentonite seals, within a
single borehole. Figure 2.6 shows a typical construction detail for a nested VMP. Soil
vapor chemistry is determined at each depth by withdrawing and analyzing soil vapor
samples collected from each interval. Relative soil permeability is indirectly indicated by
the vacuum required to extract soil vapor from each VMP at each depth interval. Higher
vacuum response indicates depth zones with relatively low permeability to airflow.
Relative permeability can be estimated by closely monitoring changes in soil gas
chemistry and the vacuum response at the start of soil gas extraction (Johnson, 1990).
The primary advantage of using VMPs is that they can be installed as permanent
protected points that are available for assessing soil vapor chemistry and long-term
remediation progress.
2.2.6 Vent Well Profiling
The profiling of pilot test vent wells or existing vent wells can provide valuable
information for vent well design or redesign to optimize full-scale SVE operations, and to
verify closure criteria. Vent well vertical profiling information can now be provided
using PneuLog , a technology developed by Praxis Environmental Technologies, Inc.
(Praxis).
PneuLog® technology (Praxis, 1999a) can be used during pilot testing at any site, but
the greatest benefit will come from sites with at least 15 feet of contaminated interval and


022/736300/11.doc
2-14
layers of varying soil permeability. Pilot vent wells should be constructed with long
screens that extend through the entire contaminated interval. At existing SVE sites,
PneuLog® will be most useful for analyzing VWs with screened intervals of 10 feet or
more.
PneuLog® provides a continuous log of VOC concentrations and flow entering the
VW. PneuLog® data can be collected with the SVE system operating or at the end of
equilibration tests. Figure 2.7 is a diagram of the PneuLog® system. The flow sensor and
vapor sampler are raised and lowered within the well using an automated cable real while
a vacuum is being applied to the well. As the flow sensor moves through the well,
changes in flow can be attributed to specific soil intervals. The vapor sampler collects
vapors from just above the flow sensor. A Teflon sampling tube conveys a continuous
vapor sample to the surface were it is analyzed using a (PID. A mass balance is used to
determine the VOC production for each vertical interval within the well by analyzing the
change in flow and the change in contaminant concentration.
AFCEE has recently tested and used the PneuLog technology at ten sites to develop
detailed lithologic and contaminant cross-sections. Figure 2.8 illustrates a vertical profile
of VOC concentrations and flow entering three screens installed in a nested vent well.
These profiles are particularly useful for identifying productive and unproductive flow
intervals in the subsurface and for designing or redesigning vent wells to maximize VOC
removal while minimizing unwanted dilution air. Praxis has also developed numerical
models to assist site managers in interpreting equilibrium/rebound test data and for
predicting the timeframe required to remediate diffusion-limited zones. The use of
PneuLog to optimize existing systems is also discussed in Section 5.
2.3 UPDATING THE CONCEPTUAL SITE MODEL
An accurate conceptual site model (CSM) is critical to evaluating and optimizing SVE
systems and evaluating the degree of treatment (risk reduction) required. A complete
CSM should include a visual representation of contaminant source and release
information, site geology and hydrology, contaminant distribution, fate and transport
parameters, and risk assessment features such as current and future land use and potential

Source: Praxis Environmental Technology Inc., 5/1999.
Data Acquisition Systemand Real-TimeView of Data
Undisturbed Soil
Soil VaporVelocity Sensor
Tube for VaporSample Transfer
ExistingSVE Well
Vacuum onWellheadApplied by Blower
Cable AlignmentAssembly
Cable Real
VacuumPump
PID
Sand Pack
ExistingSVE Well
draw\svehandbk1.cdr aee p3 4/5/01
PneuLog™ SCHEMATIC
Figure 2.7

0
10
20
30
40
50
60
70
80
90
Lithology
Dep
th(f
tb
gs)
0 500 1000
Concentration (mg/m3)
ScreenIntervals
0.001 0.01 0.1 1
2Permeability (scfm/ft/in H O)
Figure 2.8
draw\svehandbk8.cdr nap p1 4/2501
PneuLog® VERTICAL PROFILE OF VENT WELL VOC AND PERMEABILITY ZONES
Silt
Legend
Silt Sand
Cobble and Silt Sand
Bottom of Bore Hole@ 81.5 FT BGS

022/736300/11.doc
2-17
exposure pathways and receptors. The CSM serves as the foundation for evaluating the
restoration potential of the site and the effectiveness of operating remediation systems. A
detailed CSM is also required to make informed decisions regarding SVE performance
criteria and evaluating the system effectiveness. AFCEE recommends that every site
manager prepare a visual CSM for each site they are responsible for. Figure 2.9
illustrates an outline of a typical CSM for a chlorinated-solvent-contaminated site.
The CSM will generally be developed as a part of the site investigation or feasibility
study phase of site remediation. Many SVE systems have been installed and are
operating without a well-defined CSM. Other SVE systems were designed based on an
initial CSM that requires updating based on recent operations and monitoring data.
Changes in land use, or changes in the enforcement of institutional controls, can also alter
the exposure and risk assumptions of the CSM. The CSM is intended to be a dynamic
representation of site conditions based on a continual influx of information from the site.
This section provides an overview of the key elements of a CSM, with emphasis on SVE
optimization.
2.3.1 Source and Release Information
The CSM should include a description of the source of contamination and what is
known about the timing and quantity of the release. Most site characterizations begin by
locating areas where contamination was released to the subsurface. In many cases, the
distinct source of contamination is known to be a former underground storage tank
(UST), disposal pit, fire training area, etc. However, many industrial source areas are
dispersed and difficult to find. For example, oil/water separators, and sanitary and storm
sewers have historically received chlorinated solvents from aircraft and other
maintenance shops. At these sites, it is often impossible to install an effective SVE
system because the source of contamination cannot be determined. Soil gas surveys can
be used to locate these dispersed source areas at sites with sandy, permeable soils.
However, at sites with low permeability soils, locating dispersed sources will often
require excavation and removal of contaminated soils along underground utilities.

Background Information
• Location of water supply wells.
• Ground-water classification.
• Nearby wellhead protection areas or sole-source aquifers.
• Locations of potential receptors exposure points.
• Hazardous soil vapor impacts.
FIGURE 2.9
ELEMENTS OF A CONCEPTUAL SITE MODEL (CSM)
Contaminant Source and Release Information
Risk Assessment
• Location, nature, and history of previous
contaminant releases or sources.
• Locations and characterizations of continuing
releases or sources.
• Locations of subsurface sources (e.g., NAPLs).
• Flux of contamination from NAPL.
• Current and future receptors.
• Exposure scenario’s.
• Completed pathways?
• Exposure concentrations.
Geologic and Hydrologic Information
• Description of regional and site geology.
• Physical properties of subsurface materials
(e.g., moisture porosity, bulk density).
• Stratigraphy, including thickness, lateral extent, contin-
uity of units, and presence of depositional features,
such as channel deposits, that may provide preferential
pathways for, or barriers to, contaminant transport.
• Geologic structures that may form preferential pathways
for NAPL migration or zones of accumulation.
• Depth to ground water.
• Hydraulic gradients (horizontal and vertical).
• Hydraulic properties of subsurface materials (e.g.,
hydraulic conductivity, storage coefficient, effective
porosity) and their directional variability (anisotropy).
• Spatial distribution of soil or bedrock physical/hydraulic
properties (degree of heterogeneity).
• Groundwater/surface water interactions.
Contaminant Distribution, Transport, and Fate Parameters
• Properties of NAPLs that affect transport (e.g., composition, effective constituent solubilities,
density, viscosity).
• Geochemical Indicators (aerobic/anaerobic).
• Phase distribution of each contaminant (gaseous, aqueous, sorbed, free-phase NAPL or
residual NAPL) in the unsaturated and saturated zones.
• Spatial distribution of subsurface contaminants in each phase in the unsaturated and
saturated zones.
• Estimates of subsurface contaminant mass.
• Temporal trends in contaminant concentrations in each phase.
• Partitioning coefficients and migration rates.
• Contaminant natural attenuation processes (destructive and non-destructive).
Source: Adapted from EPA, 1993.draw/svehandbk7.cdr nap 4/23/01
022/736300/11.doc
2-19
The timing and the amount of contaminant released are difficult to estimate.
Historical records on chemical use are difficult to obtain, and if they exist are generally
found in Phase I Installation Restoration Program documents developed in the early
1980’s. TCE was used by the Air Force for approximately 40 years before it was phased
out in the early 1980s. TCE has not been widely used at Air Force facilities for nearly 20
years. This fact is important when evaluating the fate and transport of chlorinated
solvents.
2.3.2 Geologic Characterization
The CSM should include a complete description of the site geology. At a minimum, the CSM
for an SVE site should include:
• A general description of site geology including major soil strata that are impacted
by or influence the migration of contaminants. Strata thickness, lateral extent,
continuity and depositional features should be described.
• Physical and chemical properties of subsurface materials such as sieve analysis,
bulk density, moisture, air porosity, and total organic carbon.
• Geologic or manmade features which may provide preferential migration of dense
non-aqueous phase liquids (DNAPLs), solvent vapors, or dissolved contaminants.
• Depth to groundwater, seasonal variations, recharge and discharge information
including interactions with surface waters.
The CSM should be updated to reflect current estimates of these properties based on
site remediation experience. For example, the air permeability and radius of vapor
extraction can be more accurately estimated after a SVE system has operated for several
months. Changes in vapor concentrations may not occur during short-term pilot testing,
but will become very apparent after a few months of SVE operation.

022/736300/11.doc
2-20
2.3.3 Contaminant Distribution, Transport and Fate
In addition to describing the source of contamination, the CSM should include a
summary of the chemical, physical, and biodegradation properties of key contaminants of
concern and describe their distribution, movement, and fate in the subsurface
environment. Existing vent wells and vapor monitoring points can provide valuable
insights into the movement and persistence of VOCs in various soil layers. If data gaps
remain, such as an understanding of where contaminants remain in the subsurface, this
data should be collected using the advanced characterization tools described in Section
2.2. At a minimum, the CSM should include:
• Chemical and physical properties of chlorinated compounds that impact subsurface
transport (e.g., partitioning coefficients, solubility, vapor pressure, Henry’s
Constant, density, viscosity)
• An estimate of the phase distribution of each contaminant (free-phase DNAPL,
sorbed, in soil vapor, or dissolved) in the saturated and unsaturated zone.
• A fate and transport model that describes how soil contaminants enter groundwater
and how SVE is intended to reduce leaching to groundwater (if appropriate).
• A description of what areas of the site or soil layers are most likely to create
diffusion-limited VOC removal constraints which will slow the site cleanup.
Equilibrium testing described in Section 5 can provide insights into where diffusion
limited removal is occurring.
• Evidence of contaminant natural attenuation processes (primarily biological
destruction).
2.3.4 Risk Assessment Site Model
Although the complexity of risk assessment will vary from one site to another and one
regulatory environment to another, there are several common elements that should be
included in every CSM:

022/736300/11.doc
2-21
• An analysis of potential receptors (current and future) that could be impacted by
contamination.
• An analysis of potential exposure pathways that could allow contaminants to
impact receptors.
• A determination of what level of contaminant exposure will present an
unacceptable risk to impacted receptors (risk-based cleanup goals).
• Measurement of contaminant concentrations at potential exposure points or
estimation of exposure point concentrations using fate and transport models. These
exposure concentrations are then compared to risk-based cleanup goals.
The reader is referred to other documents that have been developed to describe the risk
assessment process and how to develop risk-based cleanup goals for fuel and chlorinated
solvent sites (REF). The goal of site remediation is generally to find the most cost-
effective method of reducing present and future risk by combining three risk reduction
techniques:
• Chemical Source Reduction - Achieved by engineered removals such as
excavation and soil vapor extraction.
• Chemical Pathway Elimination - Examples include the vapor collection systems
installed around buildings, natural attenuation of a groundwater plume, or pumping
to stop the migration of contaminants toward downgradient receptors.
• Restrict/Protect Receptors - Land use controls such as site fencing, surface
capping, digging restrictions, protective clothing, and groundwater well restrictions
can eliminate chemical exposure until SVE can reduce the chemical source.
2.3.5 SVE for Protection of Workers
On most Air Force installations, the greatest potential for exposure to contaminated
soil and groundwater will occur during new building construction or utility repairs or
replacement. Soil vapor extraction provides a useful method of reducing the risk from the
022/736300/11.doc
2-22
most common Air Force soil contaminants, such as benzene and TCE. Application of
SVE near inhabited buildings and utility corridors can provide for the positive control
and collection of hazardous vapors. It is also important for supervisors of utility shops
and base construction planners be informed of the known areas of contamination so that
any excavation in these areas can be completed with careful air monitoring and proper
protective clothing.
2.3.6 Institutional Controls for Realignment and Closure Bases
On installations that are scheduled for closure or realignment, the question of future
land use becomes more critical. The future land use may differ from the current land use.
In such situations the most conservative expected land use should be used to complete the
site model. Industrial or commercial land use should be assumed unless residential land
use is specifically included in a future land use plan.
While most flightline areas on closure bases will remain in industrial/commercial land
use, formal deed or lease restrictions must be in place to ensure that the new landowner
(private or public) understands the extent of remaining contamination and the need to
restrict certain future activities or land uses. In general, Air Force Base Realignment and
Closure (BRAC) officials should seek risk-based closures of contaminated sites that
make maximum use of deed or lease restrictions to minimize the potential for future
human exposure to contaminants. The BRAC Environmental Program Fact Sheet
(Department of Defense [DoD] Policy on Institutional Controls) provides an overview of
institutional controls and how they can be applied during BRAC land transfers. This
guidance is available on the DoD BRAC Environmental Homepage at
http://www.dtic.mil/envIrodod/envbrac. mil.

022/736300/11.doc
3-1
SECTION 3
UNDERSTANDING SITE CLOSURE CRITERIA
3.1 REVIEW OF REMEDIATION GOALS
A clear understanding of the goals and objectives of a remediation project is an
essential first step in the SVE optimization process. Remediation projects often lose
continuity due to staff turnover in Air Force and regulatory agencies and changes in
operating contractors. Because it is impossible to judge the success or failure of a
remediation project without clearly defined goals, the SVE optimization process must
clearly identify these goals.
An understanding of the original remediation goal by the site manager and the
operation and maintenance (O&M) contractor is required to evaluate the merit of these
goals in light of changing conceptual site model (CSM) and new regulatory approaches.
An understanding of site cleanup goals is essential for SVE performance monitoring and
system optimization. Before initiating systems optimization, the site manager should
carefully review the key decision documents for the site. These could include remedial
investigation/feasibility study (RI/FS) reports, risk assessment summaries, remedial
action plans, record of decisions (RODs), Resource Conservation and Recovery Act
(RCRA) corrective action program records, and correspondence between the regulatory
community and the Air Force.
Regulatory Participation - Site remediation goals are closely tied to the regulatory
framework under which site remediation is being implemented. A good working
relationship with local regulators will be an important component of a successful SVE
project. If significant changes to remediation goals or the remedial approach are needed,
a technical expert from the responsible regulatory agency should be consulted along with
Air Force experts.

022/736300/11.doc
3-2
3.1.1 Cleanup Goals Based on Groundwater Protection
The most common and conservative soil remediation criteria are generally based on
the protection of groundwater. These criteria are based on the assumption that soil
contaminants will eventually leach into groundwater or surface water and degrade water
quality. The goal of groundwater protection is generally to prevent an aquifer from
being contaminated above drinking water maximum contaminant levels (MCLs).
Although many EPA regions and states have adopted groundwater protective cleanup
goals for soils, these goals are overly conservative if they “protect” unproductive shallow
aquifers or aquifers which are not considered drinking water resources. A less stringent
risk-based standard may be more appropriate for shallow aquifers that are not used for
drinking water.
The EPA has developed a standard approach for determining soil remediation criteria
based on protection of groundwater. The approach is described in the Soil Screening
Guidance: Technical Background Document (EPA, 1996) and provides default cleanup
criteria for soil. These default criteria are based on extensive modeling and verification
using EPA’s soil and groundwater database from over 300 sites across the United States.
The soil type, depth to groundwater, and size of site are all site-specific factors
influencing soil cleanup criteria. Table 3.1 - Scenario 3 lists conservative soil-to-
groundwater screening levels for several common Air Force contaminants assuming
residential use of groundwater. For the most conservative residential exposure scenario,
groundwater is used both for drinking and showering. Under this exposure scenario, the
soil cleanup goal for TCE would be 0.060 milligrams per kilogram (mg/kg).
3.1.2 Cleanup Goals Based on Commercial/Industrial Site-Specific Risks
Soil cleanup goals can also be based on the protection of excavation workers who
come into direct contact with contaminated soils, shallow groundwater and soil vapors.
These risk-based goals are also known as site-specific target limits (SSTLs) and are
generally calculated by risk assessment specialists using conservative exposure scenarios
for the site. Table 3.1 - Scenario 1 provides SSTLs assuming that a non-intrusive

022/736300/11.doc
3-3
TABLE 3.1 EXAMPLE SCREENING LEVELS FOR CHLORINATED SOLVENTS
Scenario 1 Scenario 2 Scenario 3 Nonintrusive Site Worker Intrusive Site Worker Resident Soil: ingestion, dermal, inhalation Soil: ingestion, dermal, inhalation Soil: ingestion, dermal, inhalation Groundwater: inhalation Groundwater: inhalation and dermal Groundwater: ingestion and inhalation Exposure: 250 day/year; 25 year Exposure: 60 day/year; 1 year Exposure: 350 day/year; 30 year
Chemical USEPA R9a/ Soil (mg/kg)b/
Soil-to-Groundwater
(mg/kg)
Groundwater (µg/L)c/
Soil (mg/kg)
Soil-to-Groundwater
(mg/kg)
Groundwater (µg/L)
USEPA R9 Soil
(mg/kg)
USEPA R9 (20 DAFd/)
Soil-to-Groundwater
(mg/kg)
USEPA R9 Tap Water
(µg/L)
1,1,1-Trichloroethane (N) 1.40E+03 8.05E+05 8.36E+07 2.88E+04 2.47E+03 2.57E+05 7.70E+02 2.00E+00 7.90E+02 1,1-Dichloroethene ( C) 1.20E-01 2.32E+01 2.83E+03 3.46E+01 1.03E+01 1.26E+03 5.40E-02 6.00E-02 4.60E-02 1,2-Dichloroethane (C ) 7.60E-01 1.98E+02 4.15E+04 2.10E+02 1.22E+02 2.55E+04 3.50E-01 2.00E-02 1.20E-01 1,2-Dichloroethene, total(N) 1.50E+02 2.79E+04 4.58E+06 1.34E+03 1.08E+03 1.78E+05 4.30E+01 4.00E-01 6.10E+01 Carbon tetrachloride (C ) 5.30E-01 1.25E+02 9.53E+03 1.34E+02 2.50E+01 1.90E+03 2.40E-01 7.00E-02 1.70E-01 Tetrachloroethene (C ) 1.90E+01 4.84E+03 4.19E+05 2.21E+03 2.52E+01 2.18E+03 5.70E+00 6.00E-02 1.10E+00 Trichloroethene (C ) 6.10E+00 2.30E+03 2.01E+05 1.24E+03 6.03E+02 5.27E+04 2.80E+00 6.00E-02 1.60E+00 Vinyl chloride (C ) 4.90E-02 1.04E+01 1.56E+03 1.43E+01 7.63E+00 1.15E+03 2.20E-02 1.00E-02 2.00E-02
a/ R9 = USEPA Region 9 b/ mg/kg = milligrams per kilogram c/ µg/L = micrograms per liter d/ DAF = Dilution Attenuation Factor

022/736300/11.doc
3-4
maintenance worker (such as a landscape technician) spends 250 days a year and 25 years
working over a contaminated site. Using these site-specific exposure assumptions, the
TCE cleanup goal for Scenario 1 is 6.1 mg/kg. Scenario 2 describes an excavation
worker who has a one-time exposure to soils and dermal contact with shallow
groundwater for 60 days. The short-term excavation worker scenario requires a TCE
cleanup goal of approximately 60 mg/kg. Based on this example, an additional 2 to 3
order-of-magnitude reduction in TCE is required if soil contamination represents a valid
threat to drinking water. Unfortunately, many Air Force bases with shallow,
unproductive, or non-potable aquifers have agreed to these unnecessary soil-to-
groundwater cleanup goals for their SVE systems. For existing SVE sites, where
groundwater is clearly not impacted, or the aquifer is not of drinking water quality,
AFCEE encourages site managers to review the basis of SVE cleanup goals and to work
with local regulatory officials to establish goals based on realistic site-specific risks.
3.1.3 DEVELOPING A CLOSURE STRATEGY
The purpose of a site closure strategy is to layout a logical sequence of monitoring
events and performance criteria that will result in the required risk reduction and eventual
shutdown of the SVE system. Figure 3.1 illustrates a typical site closure process for SVE
systems. Many Air Force SVE systems have been installed and are operating without a
coordinated closure strategy. Site managers are encouraged to use the information in this
document to develop a draft site closure strategy and to contact regulatory officials and
begin a dialogue on this important subject.
A site closure strategy begins with a written agreement with regulatory agencies
stating the final soil concentration desired for each contaminant of concern. Once
numeric cleanup goals have been established, the site closure strategy should define how
the SVE system will be monitored to determine progress toward cleanup goals
(performance monitoring discussed in Section 4), and how the soil will ultimately be
sampled to verify compliance with numeric cleanup goals (Section 6). Whenever
possible, these details should be discussed with regulatory agencies during the design

SVE SITE CLOSURE PROCESS
Figure 3.1
draw\svehandbk5.cdr aee p1 4/13/01
Define Cleanup Goals and SiteClosure / Sampling Procedures
in Remediation Decision Document
Collect Performance Data to TrackCleanup Progress Including Annual
Equilibrium / Rebound Testing
Use Advanced Characterizationand/or System Optimization
Methods to Identify and ImproveRemediation of Remaining VOCs
Use Soil Gas Data or Actual SoilSamples to Demonstrate Cleanup
Has Been Achieved
Continue to Operate System WhileSeeking Alternate Cleanup Goals orTechnical Infeasibility Assessment
DoEquilibrium
Soil Gas LevelsExceed Target
Soil Gas CleanupLevels
?
HasSystem
OptimizationImproved VOC
Removal?
No
Yes
Yes No

022/736300/11.doc
3-6
phase of the SVE project so that vapor monitoring points and pre-venting (baseline)
sampling can be coordinated with vent well installations.
As shown on Figure 3.1, the primary indicator of remediation progress for SVE
systems are equilibrium soil gas levels collected during equilibrium/rebound tests.
These tests are extremely useful in measuring remediation progress and for identifying
areas of the site requiring additional characterization and optimized treatment.

022/736300/11.doc
4-1
SECTION 4
SYSTEM PERFORMANCE MONITORING
The performance of SVE systems can be monitored using a variety of direct and
indirect measurements of subsurface contaminant removal. The most direct method, soil
sampling and analysis, is generally too expensive to be used for intermediate
measurements and is reserved for a final determination of suitability for site closure (See
Section 6). Fortunately, there are several less intrusive and expensive methods for
determining SVE remediation progress. This section discusses several common methods
for SVE performance evaluation including: the rate and composition of extracted soil
gas, changes in soil gas chemistry indicating treatment influence, equilibrium/rebound
testing of soil gas VOCs, and in situ respiration testing to account for biodegradation of
petroleum hydrocarbons. Finally, this section will briefly discuss performance
monitoring for aboveground vapor treatment systems. More general process monitoring
such as condensate control, blower and filter performance indicators, and vapor emission
testing are not covered in this document but should be covered in O&M manuals for the
system.
Table 4.1 defines a minimum level of performance monitoring that is recommended
for proper operation of SVE systems and is necessary to evaluate optimization
opportunities. Additional information on SVE performance monitoring can be found in
the Air Force Remedial Process Optimization Handbook (AFCEE, 1999), and the US
Army Corps of Engineers publication “ Engineering and Design Soil Vapor Extraction
and Bioventing” (USACOE, 1995) available on the web at: www.environmental.usace.
army.mil/library/guide/reschk/rsechk.html.

022/736300/11.doc
4-2
TABLE 4.1 SVE PERFORMANCE MONITORING REQUIREMENTS
Measurement Recommended Method Frequency
Total Extracted Flow Rate Flow Meter or Blower Curve Monthly
Extracted VOC Concentrations Collect Vapor Sample for Lab Monthly
System Effluent VOC Concentrations Collect Vapor Sample for Lab Monthly
Flow Rates From Each VW Thermal Anemometer Semi-annual
VOC Concentrations Each VW Handheld Gas Analyzers Semi-annual
Vacuum at Each VW Vacuum Gauge Semi-annual
TVH/O2/CO2 At VMPs Handheld Gas Analyzers Semi-annual
Equilibrium/Rebound Test
Using VWs/VMPs
Handheld VOC Analyzer
Collect Final Sample for Lab Analysis
Annual
Respiration Testing at VMPs* Handheld O2/CO2 Analyzer Annual
*Recommended for sites with petroleum hydrocarbons and mixtures of chlorinated and non-chlorinated hydrocarbons.
4.1 FLOW AND COMPOSITION OF EXTRACTED SOIL GAS
The most common method of assessing SVE performance has been to monitor the
flow and VOC concentrations in extracted soil gas. By collecting flow and extracted
concentration data over time, several conclusions can be drawn concerning the success of
mass removal and general performance of an SVE system. Most SVE systems have three
phases of performance: the initial pore volume removal characterized by relatively high
VOC levels, the evaporation phase characterized by removal of NAPL from more
permeable soil volumes, and the diffusion-limited phase characterized by low recovered
concentrations as VOCs slowly diffuse from low-permeability soils (AAEE, 1994).
Figure 4.1 shows concentration vs. time data for two sites with different SVE
performance profiles. Site A illustrates VOC removal from a site where the vast majority
of the NAPL is present in high permeability soils. Site B illustrates a site where low

VOC REMOVAL vs TIME PLOTS
Figure 4.1
draw\svehandbk5.cdr aee p2 4/13/01
Site A
300
200
100
100 200 300 400
Days
VO
CC
on
cen
trati
on
(pp
mv)
Site B
300
200
100
100 200 300 400
Days
VO
CC
on
cen
trati
on
(pp
mv)
Diffusion Limited Removal
InitialPore
VolumeRemoval
EvaporationPhase
022/736300/11.doc
4-4
permeability layers are creating slow, diffusion-limited removal. When concentration vs.
time data is combined with soil gas chemistry data and equilibrium/rebound testing from
specific VMPs and VWs, the unremediated (diffusion-limited) soil volume can often be
distinguished from the remediated areas of a site. Sections 4.2 and 4.3 provide additional
information on these techniques. Figure 4.2 provides a simple logic diagram for
optimizing extraction rates and monitoring the performance of individual vent wells.
This procedure will assist site managers in reducing overall flow rates to better match
diffusion limited VOC removal which occurs on most sites.
Overall, mass removal is generally calculated by multiplying average monthly flow
rate times the average monthly total VOC concentration. Flow rates can be measured by
pitot tubes, orifice plates, or by referring to the manufacturer’s blower curve for a given
pressure across the blower. VOC concentrations can be estimated using handheld gas
analyzers such as a FID, PID, or an ECD. For non-chlorinated hydrocarbons, the FID is
preferred. For chlorinated hydrocarbons the PID or ECD is preferred. In addition to total
VOC concentrations, indicator compounds are frequently selected to monitor system
performance. The selected indicator compound is generally the compound that is
expected to take the longest time to achieve its respective cleanup goal. A laboratory
analysis of extracted gas is required for determining concentrations of individual
indicator compounds such as benzene or TCE.
4.2 RADIUS OF TREATMENT INFLUENCE BASED ON VACUUM AND SOIL GAS CHEMISTRY
Determining the volume of the subsurface that is being treated by an SVE system can
be difficult. The most common method of estimating treatment influence has been to
measure the induced vacuum created in soils surrounding an extraction well. The
vacuum influence is measured at a number of discrete VMPs located at varying distances
and in varying soil types (layers). Vacuums are measured with the SVE system off and
then the system is turned on and vacuum increases are measured in VMPs overtime until
steady state is achieved. This method can provide good approximations of the radius of
vapor capture. Analytical and numerical flow models such as Hyperventilate and
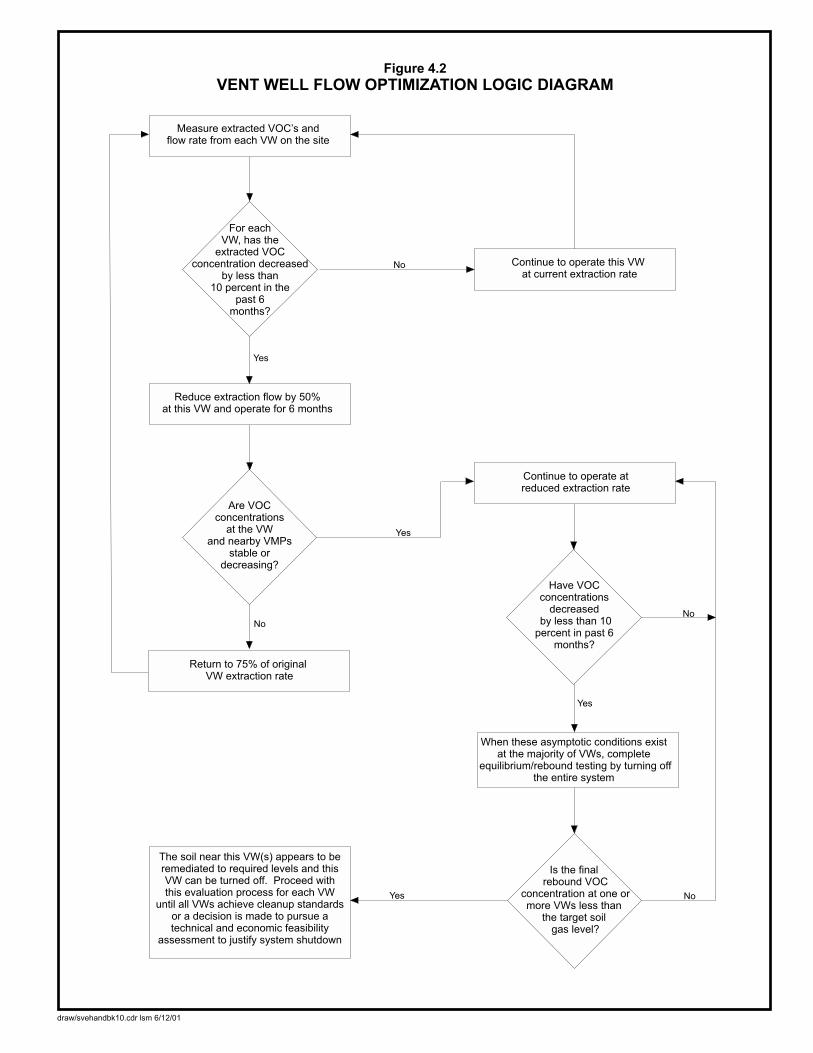
No
Measure extracted VOC’s andflow rate from each VW on the site
Continue to operate this VWat current extraction rate
No
Yes
Reduce extraction flow by 50%at this VW and operate for 6 months
Continue to operate atreduced extraction rate
Return to 75% of originalVW extraction rate
The soil near this VW(s) appears to beremediated to required levels and thisVW can be turned off. Proceed withthis evaluation process for each VW
until all VWs achieve cleanup standardsor a decision is made to pursue atechnical and economic feasibility
assessment to justify system shutdown
When these asymptotic conditions existat the majority of VWs, complete
equilibrium/rebound testing by turning offthe entire system
No
No
No
Yes
Yes
Yes
Yes
Figure 4.2
VENT WELL FLOW OPTIMIZATION LOGIC DIAGRAM
draw/svehandbk10.cdr lsm 6/12/01
For eachVW, has the
extracted VOCconcentration decreased
by less than10 percent in the
past 6months?
Are VOCconcentrations
at the VWand nearby VMPs
stable ordecreasing?
Is the finalrebound VOC
concentration at one ormore VWs less than
the target soilgas level?
Have VOCconcentrations
decreasedby less than 10
percent in past 6months?
022/736300/11.doc
4-6
VENT2D/VENT3D (USEPA, 1995) have been used to estimate and design the radius of
influence and flow rates for multiple vent well systems.
The use of vacuum data for vent well spacing and air permeability calculations and
flow design has come under criticism (DiGiulio and Varadhan, 2000). The authors have
recommended that numerical models be used to design a critical pore gas velocity (not
vacuum) throughout the soil volume. This approach requires the estimation or
measurement of 8 soil parameters within each soil type impacted by contamination.
While this method can provide more accurate SVE designs, it will require extensive site
characterization and additional costs for numerical modeling. However, the authors also
suggest a more rigorous approach consisting of a site-specific field-scale test. This test
requires the implementation of SVE for a sufficient duration to yield a decay in the
extracted concentration and decreases in concentration in surrounding VMPs. Typical
durations are on the order of weeks. Hence, the adequacy of well spacing can be assessed
after the initial operation of an SVE system, or an extended SVE pilot test, using the
performance data listed in Table 4.1, without excessive site characterization or numerical
modeling.
The Air Force recommends a combination of vacuum and soil gas chemistry
monitoring at multiple discrete VMPs as the most practical indication that a volume of
soil is being treated by an SVE system. Changes in vacuum and soil gas chemistry can
be easily measured in discrete VMPs located at varying distances and in varying soil
types. This method has been widely applied at bioventing sites and has been found to be
more reliable than vacuum methods alone in confirming the area of treatment influence.
To use this method, multiple VMPs should be in place before the SVE system is turned
on. Soil gas concentrations of oxygen, carbon dioxide and total volatile hydrocarbons
should be measured in each VMP before starting the extraction system. Once the system
is started, these measurements should be taken at 2, 4, 8, and 16 hours and then daily
intervals until soil gas chemistry stabilizes. At most waste sites, initial soil gas oxygen
will be depleted and carbon dioxide is elevated above levels found in clean background

022/736300/11.doc
4-7
soil gas (Background oxygen in soil gas is generally 18 – 20 percent. Background carbon
dioxide in soil gas is generally < 1 percent.)
Figure 4.3 illustrates a typical soil gas chemistry response for VMP-3 near the NAPL
source, and a VMP-6 outside of the NAPL source. In this case the SVE system is clearly
influencing both VMPs. More rapid changes in soil gas chemistry indicate areas of
relatively high permeability and pore gas velocity. Note that oxygen and carbon dioxide
will not be useful indicators if site contaminants are pure chlorinated solvents such as
TCE, which are resistant to aerobic biodegradation. This is an uncommon situation since
most chlorinated solvents were spilled with some non-chlorinated and highly degradable
hydrocarbons.
4.3 EQUILIBRIUM/REBOUND TESTING
Perhaps the most important indicator of SVE performance is the equilibrium/rebound
test. To collect equilibrium data, the treatment system must be turned off so that
contaminants that are sorbed or trapped within the soil matrix have an opportunity to
equilibrate with surrounding soil gas. Equilibration data provide the only accurate
assessment of soil remediation progress. Once an SVE system is operating, soil gas
concentrations at VMPs and VWs become diluted with soil gas from clean soils and give
an overly optimistic estimate of remaining concentrations. Even in contaminated soils,
desorption and diffusion are relatively slow processes and released contaminants become
highly diluted in the advective flow. Only when the soil vapor stops flowing can
equilibrium VOC levels be reestablished and compared to pre-venting VOC
concentrations.
The time period required to reach equilibrium is contaminant and soil-type specific.
Sandy soils will generally reach equilibrium in several weeks, while several months may
be required for highly-layered soils. Annual equilibrium testing is recommended. The
best time to complete an equilibrium test is when it can be scheduled concurrently with
system maintenance/modifications. The site-specific equilibration period can best be
determined by turning the system off and then using a handheld VOC analyzer to collect

TYPICAL SOIL GAS CHEMISTRYRESPONSE CURVES
Figure 4.3
draw\svehandbk12.cdr lsm p1 6/14/01
VMP-3 (Near Source)
12
8
4
2 4 6 8Days
Perc
en
tO
2
VMP-6 (Outside NAPL Source)
16
3
2
1
Perc
en
tC
Oan
dV
OC
s2
4
10
6
2
14
12
8
4
2 4 6 8Days
Perc
en
tO
2
16
3
2
1
Perc
en
tC
Oan
dV
OC
s2
4
10
6
2
14
20
18
BackgroundO Range2
BackgroundO Range2
O2
CO2
VOCs
O2
CO2
VOCs
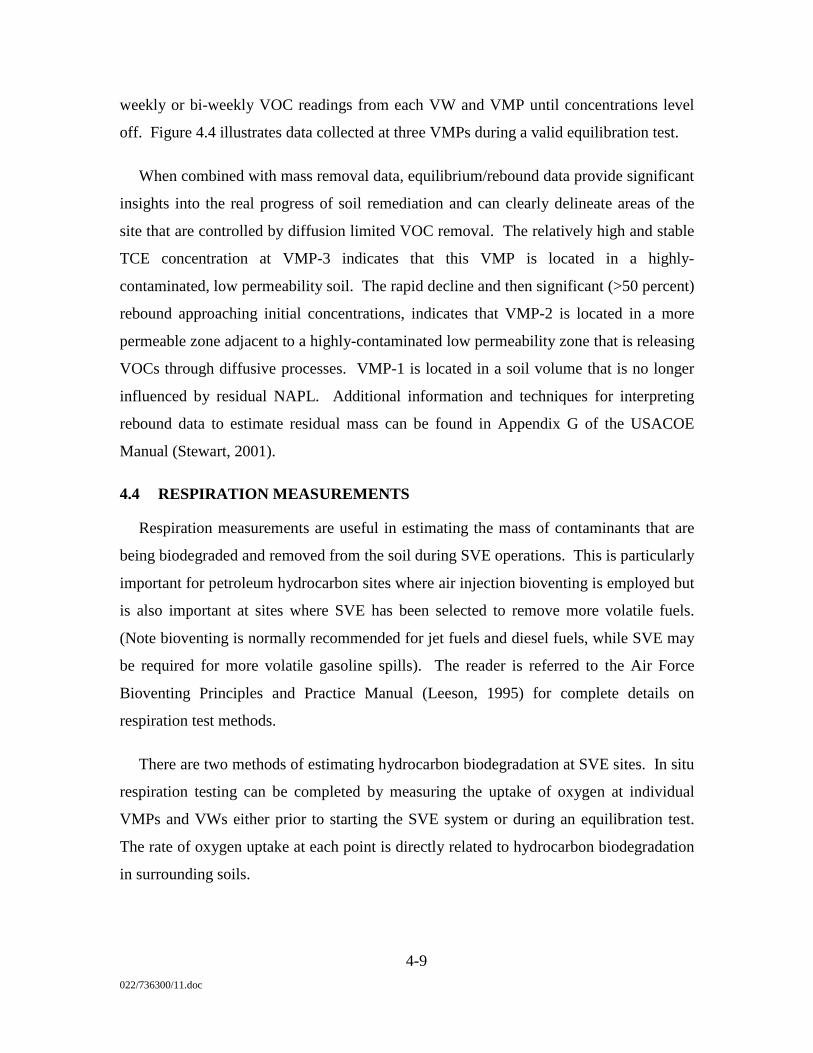
022/736300/11.doc
4-9
weekly or bi-weekly VOC readings from each VW and VMP until concentrations level
off. Figure 4.4 illustrates data collected at three VMPs during a valid equilibration test.
When combined with mass removal data, equilibrium/rebound data provide significant
insights into the real progress of soil remediation and can clearly delineate areas of the
site that are controlled by diffusion limited VOC removal. The relatively high and stable
TCE concentration at VMP-3 indicates that this VMP is located in a highly-
contaminated, low permeability soil. The rapid decline and then significant (>50 percent)
rebound approaching initial concentrations, indicates that VMP-2 is located in a more
permeable zone adjacent to a highly-contaminated low permeability zone that is releasing
VOCs through diffusive processes. VMP-1 is located in a soil volume that is no longer
influenced by residual NAPL. Additional information and techniques for interpreting
rebound data to estimate residual mass can be found in Appendix G of the USACOE
Manual (Stewart, 2001).
4.4 RESPIRATION MEASUREMENTS
Respiration measurements are useful in estimating the mass of contaminants that are
being biodegraded and removed from the soil during SVE operations. This is particularly
important for petroleum hydrocarbon sites where air injection bioventing is employed but
is also important at sites where SVE has been selected to remove more volatile fuels.
(Note bioventing is normally recommended for jet fuels and diesel fuels, while SVE may
be required for more volatile gasoline spills). The reader is referred to the Air Force
Bioventing Principles and Practice Manual (Leeson, 1995) for complete details on
respiration test methods.
There are two methods of estimating hydrocarbon biodegradation at SVE sites. In situ
respiration testing can be completed by measuring the uptake of oxygen at individual
VMPs and VWs either prior to starting the SVE system or during an equilibration test.
The rate of oxygen uptake at each point is directly related to hydrocarbon biodegradation
in surrounding soils.

RESULTS OF EQUILIBRIUM / REBOUND TEST
Figure 4.4
draw\svehandbk12.cdr lsm p2 6/14/01
150
100
50
100 200 300 400
Days of Operation
TC
E(p
pm
v)
200
500ShutDown
StartUp
Target Soil Gas Level
Start
VMP-3
VMP-2
VMP-1
EquilibriumPeriod

022/736300/11.doc
4-11
The second method of estimating biodegradation is completed with the SVE system
operating and requires 2-3 VMPs located in clean soils around the perimeter of the site to
provide background soil gas oxygen concentrations. By measuring the oxygen in the
extracted soil gas, and comparing it to the background soil gas oxygen levels, the steady-
state oxygen consumption in the contaminated soil volume can be estimated (Figure 4.5).
The Air Force Bioventing Principles and Practice Manual provides complete equations
for estimating the mass of hydrocarbon being degraded based on both respiration test
methods.
4.5 VAPOR TREATMENT PERFORMANCE MONITORING
Although not directly related to the removal of contaminants from the subsurface,
aboveground vapor treatment is often the most expensive component of the SVE system.
Vapor treatment can be accomplished via thermal technologies, activated carbon, or
biofilters. A complete understanding of the manufacturer’s performance monitoring
requirements is recommended. This section will discuss only the general performance
monitoring requirements of vapor treatment systems.
4.5.1 Basic Emission Testing
Basic emission testing requires that the treatment system effluent meet daily mass
limits such as pounds of total VOCs per day or pounds of TCE per day. Influent and
effluent gas sampling is often required on a weekly basis during the first month of
operation to determine the ability of the process to achieve emission limits. Monthly
monitoring is normally required once the initial treatment effectiveness is verified. Gas
samples are normally collected in a Summa canister or other heat resistant container and
can be analyzed with a total VOC analyzer or sent to a laboratory for specific compound
quantification.
4.5.2 Destruction Efficiency
Some regulatory agencies require that vapor treatment technologies attain a specified
destruction efficiency. Influent and effluent gas sampling is may be required on a daily
basis during the first week of operation to determine the ability of the process to achieve

O , Flow (Q)2VW
ESTIMATION OF BIODEGRADATION AT SVE SITES
O2BGO2BG
O2BG
O2BGO2BG
O2BG
Formula for Estimating Pounds of Hydrocarbons Biodgraded Each Day
Oxygen isconsumed assoil gaspasses throughsoil
Contaminatedsoil volumeundergoing
aerobicbiodegradation
Note: Aerobic biodegradation is normally associated with non-chlorinated hydrocarbons
This formula has been simplified for sea-level conditions and assumesthat 3.5 pounds of oxygen are required to degrade one pound ofhydrocarbon. Additional information is found in (Leeson, 1995).
O -2BG O2VW is generally 1-5%
O = % oxygen in background soil gas (averaged)2BG
M = mass of hydrocarbons biodegraded (lbs/day)bio
O = % oxygen in extracted soil gas2VW
Q = air extracted flow rate (ft /min)3
Figure 4.5
M = 34 Q (O - O )bio 2BG 2VW
100
draw\svehandbk12.cdr lsm p4 6/14/01
BackgroundVapor
MonitoringPoints

022/736300/11.doc
4-13
the desired destruction efficiency. Monthly monitoring of influent and effluent is
normally required once the initial destruction efficiency is verified. Gas samples are
normally collected in a Summa canister or other heat resistant container and can be
analyzed with a total VOC analyzer or sent to a laboratory for specific compound
quantification. For thermal systems, the temperature of the combustion chamber and
flow rates through the system may be required to maintain conditions that ensure the
specified destruction efficiency.
4.5.3 Unit Cost Effectiveness
The vapor treatment system should be evaluated to determine if it is the most
economical technology for the current flow and influent concentrations. As influent
concentrations decrease at SVE sites, the performance of most thermal technologies will
decline and greater amounts of auxiliary fuels will be required to maintain combustion
temperatures. Each month, the cost per pound of VOC destroyed should be calculated so
that this unit cost can be compared to the low-maintenance activated carbon option.
Carbon suppliers can provide timely quotes of the capital and O&M cost for a specific
influent VOC mixture. Activated carbon is often the most economical vapor treatment
method once a site enters the diffusion-limited phase of VOC removal.

022/736300/11.doc
5-1
SECTION 5
OPTIMIZATION OF EXISTING SYSTEMS
All SVE systems can benefit from some degree of optimization, and most optimization
opportunities are relatively easy to identify if the conceptual site model is accurate
(Section 2), cleanup goals are established (Section 3), and the appropriate performance
monitoring data has been collected (Section 4). The extent of optimization analysis will
vary based on the difficulty and the expected cost to achieve cleanup. For example, a
SVE system with three VWs, operating at a gasoline station where natural attenuation has
been selected as the groundwater remedy, will likely require 2 to 3 years of operation and
have relatively low O&M expenses. While some degree of optimization (such as varying
flow between VWs) will reduce treatment time, these small systems do not generally
require a separate remedial process optimization (RPO) project. In contrast, a system
with 20 vent wells, operating to reduce chlorinated solvent contamination entering a
drinking water aquifer, will likely require 5 to 15 years of operation and have much
higher O&M expenses. A more comprehensive RPO project may be justified for these
complex and expensive SVE systems.
The purpose of this section is to provide a variety of optimization methods that can be
applied to several of the most common performance problems. Not all optimization
methods will apply to an individual site. Additional details on the overall RPO process
are contained in the Air Force RPO Handbook (AFCEE, 1999) available on the AFCEE
website: www.afcee.brooks.af.mil/er/toolbox.htm.
The performance monitoring described in Section 4 will provide the necessary data to
determine if an SVE system is achieving or failing to accomplish its design goals.
Common performance problems can generally be defined by one or more of the
following conditions:
• Inadequate treatment of contaminated soil volume.

022/736300/11.doc
5-2
• Unacceptably slow treatment of low-permeability soils.
• Submerged NAPL and slow groundwater cleanup.
• Inefficient or mismatched vapor treatment systems.
The following sections describe general indicators of these common performance
problems and actions to improve or optimize the system when these problems occur.
5.1 INADEQUATE TREATMENT OF THE CONTAMINATED SOIL VOLUME
5.1.1 Indicators
• Some VMPs do not indicate a vacuum response during system startup
• Soil gas chemistry at some VMPs does not change during the first weeks of
extraction
• A high vacuum is required to retrieve a soil gas sample from a VMP
• Equilibrium/rebound testing indicates little or no decrease in VOC concentrations
when compared to initial concentrations at that VMP
• Large quantities of mobile NAPL are known to exist at the site above the water
table.
5.1.2 Optimization Actions to Take
• Check the VMP boring log to determine soil type and moisture content. If this is a
low-permeability soil, and it is difficult to retrieve a soil gas sample, the soil may
be too wet to transmit air. If soil moisture is associated with the capillary fringe,
dual-phase extraction may be needed to dewater the soil.
• If soil moisture is not associated with groundwater, and the entire low-
permeability layer is contaminated and greater than 2 feet thick, a thermal
enhancement such as respirable fraction (RF) or resistive heating may be required
to dewater and release VOCs.

022/736300/11.doc
5-3
• For a low-permeability layer that is less than 2 feet thick and surrounded by
permeable soils, advective flow may be able to slowly dry the soil and increase
both advective and diffusive processes in the low-permeability soils.
• If this level of site characterization detail is unavailable, consider completing a
direct push Geoprobe/MIPs or equivalent survey to determine soil type, soil
moisture and VOC distribution at multiple depths and locations across the site.
• If it is not difficult to retrieve a soil gas sample and initial soil moisture was less
than 15%, it is possible that the nearest VW is either too far from the nonresponsive
VMP or the flow rates are too low to impact this VMP. Increase the extraction rate
at the nearest VW and see if this creates a vacuum response or soil gas chemistry
change.
• It is possible for stagnation zones to form in areas that are under equal vacuum
influence of two or more VWs. To determine if a stagnation zone exists, turn off
one or more of the VWs that surround the nonresponsive VMP. If stagnation was
occurring, this should result in soil gas flow and vacuum and chemistry changes at
the VMP. Leaving the VMP open to the atmosphere during normal operations may
provide an air injection point and eliminate stagnation. Pulsing flow rates in the
surrounding VWs can also reduce stagnation.
• If the site is capped and shallow VMPs are the only ones not responding as
desired, the cap may be creating a stagnation zone at the surface and preventing
flow in the shallow vadose zone. Consider removing the cap.
• Use a Pneulog or equivalent device to provide a vertical profile of the flow and
VOC concentration entering VWs at the site. Determine if vent well design is
creating short-circuiting that is directing flow away from the nonresponsive VMP.
Use a packer system to reduce VW short-circuiting to direct more of the flow to the
nonresponsive depth interval. If necessary, install a new VW closer to the area of
concern or a VW that is screened at a more appropriate interval.

022/736300/11.doc
5-4
• The presence of mobile NAPL in any soil type will delay site remediation using
SVE. The process of volatilizing contaminants at ambient soil temperatures is time
consuming. Higher air flows to NAPL areas will accelerate volatilization but the
relationship is not linear. NAPLs located in perched lenses above the water table
can be remediated much faster using soil heating enhancements if the cost can be
justified by the shortened remediation time. Most thermal applications require less
than six months to complete. NAPLS at or below the water table are addressed in
Section 5.3.
5.2 SLOW TREATMENT OF LOW - PERMEABILITY SOILS
5.2.1 Indicators
• Slow changes in vacuum readings and soil gas chemistry at VMPs when the SVE
system is started up.
• Concentration vs. time plots at one or more VWs indicate asymptotic behavior
associated with diffusion-limited removal.
• Equilibrium/rebound testing of a VW or VMP located near or in low permeability
soils indicates that concentrations are still increasing weeks after system shut-
down. (A rapid rebound is more indicative of the normal volatilization of NAPLs in
soil.) Figure 5.1 illustrates the equilibrium rebound that could be expected from
low-permeability diffusion (VMP-3) and a NAPL source in higher permeability
soils (VMP-2).
• Lower volatility compounds such as naphthalene and higher volatility compounds
such as benzene seem to rebound in the same relative concentrations as pre-venting
concentrations.
5.2.2 Potential Optimization Actions
• If low-permeability zones are not well-defined, consider the use of advanced site
characterization tools such as Geoprobe MIPs, SimulProbe, or equivalent push
tool, to create a vertical profile of soil types and VOC concentrations vs. depth.

EQUILIBRIUM / REBOUND INDICATORS
Figure 5.1
draw\svehandbk12.cdr lsm p3 6/14/01
150
100
50
100 200 300 400
Days of Operation
TC
E(p
pm
v)
200
500ShutDown
StartUp
TypicalDiffusionRebound
Start
VMP-3
VMP-2
EquilibriumPeriod
VMP-3
VMP-2

022/736300/11.doc
5-6
• Consider the use of Pneulog or equivalent device for vertical profiling of existing
VWs during system operation and during an equilibrium/rebound test. This
information can be used to determine the vertical profile of advective and diffusive
layers. Additional short-screened VWs can be placed above or below diffusion-
limited zones and low flow rates used to minimize dilution.
• Without SVE enhancements such as soil heating or a successful fracturing effort,
most sites with significant low-permeability layering will require 5 to 10 times the
treatment time as sandy soils. Generally, the thicker and higher the moisture or
VOC levels in the silt or clay layer, the longer the remediation will take.
• If the soil is accessible by excavation, this option should always be reconsidered.
Smaller sites with less than 1000 cubic yards of NAPL impacted soils, and sites
that can be excavated without destroying high-cost structures, are often remediated
at a lower overall cost through excavation using aboveground soil treatment or
disposal.
• Higher flow rates or vacuums will generally not improve removal from low-
permeability soils. In fact, sites with relatively thin layers (<2 ft) of low
permeability soils surrounded by high-permeability sands can be more efficiently
remediated by using smaller blowers and lowering the flow rates. Accepting longer
operating times at lower flow rates with less frequent monitoring and sampling and,
if acceptable, no vapor abatement is often the most cost-effective strategy for these
sites.
• Alternating between VWs is another method of reducing the power and vapor
treatment requirement for these sites. Diffusion limitations will require extended
remediation times and lower flow rates may provide a more cost effective cleanup.
• Soil heating using steam will be difficult in low permeability soils due to the
negative impact of additional moisture. RF, resistive, and conductive heating are
all potential methods of increasing soil permeability and increasing VOC removal

022/736300/11.doc
5-7
rates. These methods are expensive and should only be considered after significant
feasibility testing.
• If diffusion is shown to be very slow, consider justifying closure with institutional
controls based on the low, site-specific risk of mass reaching a receptor (e.g.,
groundwater) at an unacceptable rate. This approach has been used successfully
within the EPA (DiGiulio et al., 1998).
5.3 SUBMERGED NAPL AND SLOW GROUNDWATER CLEANUP
5.3.1 Indicators
Although mass removal from an SVE system may be significant compared to the
initial estimate of contaminant mass at the site, the following indicators are common at
sites where NAPL is present in the capillary fringe and/or below the water table or where
dissolved groundwater concentrations are high:
• Equilibrium/rebound testing indicates that the greatest relative rebound is
occurring in VMPs located near the groundwater.
• Groundwater concentrations in the source area seem unaffected by mass removal
in the unsaturated zone.
5.3.2 Possible Optimization Actions
• SVE is only effective in unsaturated soils and must be modified to extend
treatment below the water table. Additional site characterization using a
Geoprobe MIPS or equivalent system is recommended to locate NAPL layers.
VMPs exhibiting unusual equilibrium rebound may be located over partially
submerged NAPL zones.
• Since light NAPLs generally reside at or slightly below the water table, multi-
phase extraction systems, such as Bioslurping, will be required to dewater and
expose light NAPLs to air flow. Multi-phase extraction will be most effective in
soils with moderate permeability, where air flow is possible and groundwater can

022/736300/11.doc
5-8
be drawn down without excessive pumping rates. The “Engineering Evaluation
and Cost Analysis for Bioslurper Initiative Final Report” (AFCEE, 1997) provides
details on testing, design and operation of MPE systems.
• Dense NAPLs located below the water table can be treated using dual-phase
extraction (DPE) systems if the soil volume can be adequately dewatered. The
effectiveness of DPE is limited to relatively shallow DNAPL penetrations and to
aquifers which produce significant drawdowns without excessive pumping rates.
Additional information on DPE can be found in the USEPA publication, “Multi-
Phase Extraction: State or Practice” (USEPA, 1999).
• Steam injection, RF and resistive heating have all been applied to DNAPL zones
below the water table. Heat is applied to the point where groundwater is boiled
away creating a steam front which can sweep VOCs from the soil (EPA, 1997).
These systems are most successful when applied in the upper five feet of the
aquifer, although deeper applications are possible. Rapid groundwater recharge can
absorb heat energy as fast as it can be applied resulting in limited steam formation.
• The relationship between the unsaturated zone DNAPL, saturated zone DNAPL,
and groundwater contamination must be well-described before any high-cost
thermal or dewatering options are considered. There are sites where submerged
DNAPL is unrecoverable with available technologies, and SVE will have little or
no impact on long-term groundwater contamination.
5.4 INEFFICIENT OR MISMATCHED VAPOR TREATMENT
5.4.1 Indicators
• System VOC concentrations vs. time indicate asymptotic, diffusion limited mass
removal
• One or more of the VWs are producing very low VOC concentrations.
• Auxiliary fuel use is increasing for thermal treatment units

022/736300/11.doc
5-9
• Granulated activated carbon is reaching breakthrough prematurely due to
excessive flow
• Unit cost for VOC treatment is too high or increasing
5.4.2 Possible Optimization Actions.
• Reduce extraction rates at VWs producing low levels of VOCs if equilibration
rebound testing indicates the VW is treating a diffusion-limited area.
• Turn off VWs that are producing low levels of VOCs and no longer produce a
rebound during equilibration tests.
• Increase flow at VWs that are producing higher VOC levels indicative of NAPL
impacted soils.
• Reduce the overall flow rate by using a smaller blower (assuming all NAPL
impacted soils can be influenced with the lower flow rate).
• After optimizing VW and overall flow rates, review the discharge limitations for
the site to determine if the current VOC removal rate qualifies as a de minimis
discharge that does not require treatment.
• If treatment is still required, determine if the existing vapor treatment system is
still appropriate for the new VOC concentration and flow rate.
• Evaluate the activated carbon option. Activated carbon may be cost effective for
many diffusion-limited sites with total VOC removal rates of less than 5 pounds per
day. Contact an activated carbon vendor with your flow and VOC concentration
data to obtain a quote on the capital and carbon replacement costs. Carbon
generally requires 20-30 percent of the maintenance labor as thermal systems.
• On fuel-contaminated sites with significant NAPL contamination, the use of
internal combustion engines has proven to be more efficient than other thermal

022/736300/11.doc
5-10
options when VOC levels remain above 10,000 parts per million, volume per
volume (ppmv) (AFCEE, 1994).
• If thermal oxidation or catalytic oxidation appears to be the most economical
system, ensure that any thermal system is properly sized for anticipated average
flow and VOC concentrations. Never size a unit based on maximum initial VOC
loading. When VOC levels are high, the flow rate should be reduced to provide an
average mass loading to the unit. As VOC concentrations drop the flow rate can be
increased to maintain the average VOC loading.
5.5 OTHER PERFORMANCE PROBLEMS
The performance of SVE systems can be impacted by changing site conditions such as
removal of an asphalt or concrete cover, excess precipitation, or a rising water table.
Each of these conditions can radically change soil moisture conditions and temporarily
impact the air permeability of the soil. A steadily rising water table may require that a
dual phase extraction systems be installed if soils at the water table require additional
treatment. In many western states, the water table may be dropping due to municipal or
agricultural water use. SVE systems in these areas will generally benefit from drier soil
conditions. The US Army Corps of Engineers publication “Engineering and Design Soil
Vapor Extraction and Bioventing” (USACOE, 1995) includes additional details on many
of the common performance problems caused by malfunctioning or improperly sized
equipment.

022/736300/11.doc
6-1
SECTION 6
SVE SHUTDOWN LEADING TO SITE CLOSURE
Site closure is an elusive goal for many remediation projects. At sites where SVE
systems are installed to prevent or reduce groundwater contamination, soil cleanup
criteria can be very difficult to achieve. While numerical soil standards may be included
in site decision documents, final soil sampling procedures and statistical methods for
determining compliance are rarely specified. Proving that soils have achieved a certain
level of cleanup can be an expensive and time-consuming task requiring regulatory
coordination and approval. This section will review key performance and site closure
data required for the closure process and explore several options for soil sampling and for
confirming cleanup.
6.1 DATA REQUIREMENTS
6.1.1 Establishing Target Soil Gas Concentrations
Because of the extreme difficulty in collecting representative samples for VOC
analysis and the loss of VOCs during all collection and analysis procedures, equilibrium
soil gas levels of VOCs measured at permanent or temporary VMPs provide the most
accurate estimate of VOC residuals in soil. Although recent advancements in soil
sampling, such as the EPA Method 5035 (Encore or equivalent method), have
improved VOC retention, soil gas samples provide an average VOC concentrations for
one cubic foot or more of soil while individual soil samples only provide information on
only a few cubic inches of soil.
In light of the improved VOC detection associated with in situ soil gas measurements,
AFCEE and most regulatory agencies are recommending that target soil gas
concentrations be established to serve as indicators or to confirm soil cleanup criteria
have been achieved. At equilibrium, the concentration of contaminants of concern in the
soil can be estimated by their concentrations in soil gas. Appendix A provides an
022/736300/11.doc
6-2
example of the calculation that can be used to relate soil cleanup criteria to target soil gas
concentrations.
Soil gas concentrations can be monitored inexpensively throughout the life of an SVE
project and can be substituted for expensive soil sampling for the final confirmation of
cleanup goals. Additionally, use of site-specific analytical results that are based on
simple equilibrium partitioning relationships to estimate residual contamination in soil,
particularly that which may pose a threat to underlying groundwater, is in keeping with
the technical basis of the soil screening levels (SSLs) developed by the USEPA (1996a,
b, and c). The SSLs are based on simple linear equilibrium partition equations, which are
used to estimate how much contaminant could migrate into overlying air exposure points
or into underlying groundwater. In practice, most risk-based numerical cleanup standards
will be based on similar conservative, simplifying assumptions. Consequently, soil gas
analytical data will generally provide the best approximation of the site conditions used
to develop most risk-based numerical cleanup standards. A more detailed summary of
the technical basis of the SSLs, as relevant to sampling for closure, is presented in
subsequent discussions in this section.
6.1.2 Evaluating System Performance Data
Much of the performance data described in Section 4 will be extremely useful for
developing the case for turning off an SVE system. Figure 6.1 shows a concentration
versus time curve for an SVE system that operated at a PCE-contaminated site for over
four years. This curve illustrates a nearly 1,000-fold decrease in PCE concentration at a
VW that was centered in the NAPL contaminated soil. Three equilibrium/rebound tests
were completed at this VW. Note that each post-rebound concentration was smaller than
the previous rebound test and the final equilibrium concentration remained below the
target soil gas concentration.
Figure 6.2 illustrates equilibrium soil gas levels of PCE measured in the three rebound
tests in four separate VMPs located at two depths. VMPs 1 and 2 are located in a silt
layer and VMPs 3 and 4 are located in a deeper sand layer. Data indicate that soils near

HISTORY OF PCE EXTRACTION AT VENT WELL
Figure 6.1
draw\svehandbk5.cdr aee p3 4/13/01
1000
100
10
200 400 600 800Days of Operation
PC
Ep
pm
v
HISTORY OF PCE CONCENTRATIONS AT VMPs
Figure 6.2
1000 1200
1000
100
10
200 400 600 800Days of Operation
PC
Ep
pm
v
1000 1200
Equilibrium / Rebound Tests
Equilibrium / Rebound Tests
VMP-3
VMP-2
VMP-1
VMP-4
Target Soil Gas Level

022/736300/11.doc
6-4
VMPs 3 and 4 were remediated during the first two years of SVE, while soils near VMPs
1 and 2 are at or slightly above the target soil gas concentration. These data are typical
for sites with a layer of lower permeability soil. Note that cleanup in the silty soil is
occurring but at a lower (diffusion-limited) rate than sandy soils. Based on these data
from the extracted soil gas and VMPs, regulatory officials could be notified that the soils
are approaching cleanup standards and final sampling plans could be discussed.
6.1.3 Final Soil Gas or Soil Sampling
If the final measure of cleanup will be based on analytical results from soil samples,
target soil gas concentrations also should be collected to monitor progress toward and
likely achievement of specific numerical cleanup criteria prior to soil sampling.
Irregardless of what type of sampling data are to be used to demonstrate compliance with
final cleanup criteria (e.g., soil gas data, soil sampling data), the final sampling event
should be planned with regulatory officials to ensure that the data are representative of
the targeted remediation area and are sufficient to support final decisions.
As part of the technical background material to the SSL guidance, the USEPA
developed information on sampling strategies designed to provide site-specific analytical
data suitable for direct comparison to “trigger levels” (e.g., action levels, SSLs,
preliminary remediation goals [PRGs]). The overall decision rule used to guide these
simplified comparisons is identical to that usually applied to demonstrate closure,
namely: if site-specific analytical data that are representative of the average exposure
concentration falls below the targeted numerical criteria, no additional remediation or
action is generally warranted (i.e., closure is a defensible option). Thus, the sampling
strategies recommended by the USEPA as part of the SSL guidance can be used to
summarize reasonable options for designing and optimizing a closure sampling plan for a
SVE-remediated site; however, final closure sampling plans will need to incorporate site-
specific data quality objectives (DQOs) and other requirements.
The first step in planning to sample for closure is defining the limits on decision
errors. To minimize the sampling intensity necessary to accurately determine the mean

022/736300/11.doc
6-5
concentration of subsurface soil contamination within a source with a specified level of
confidence (e.g., 95 percent), USEPA recommends the use of an operational decision rule
based on average concentrations within individual soil cores taken purposively in the
source and randomly across the treatment area. For each soil core (or VMP gas sample),
the mean concentration is defined as the depth-weighted average concentration within the
zone of contamination (USEPA, 1996c). Note that this is not a statistically-based
decision rule, which means that it will not be possible to statistically define decision
errors.
For subsurface soils, USEPA recommends characterizing the mean contaminant
concentration from each soil boring (or VMP gas sample) for direct comparison to
targeted numerical criteria (USEPA, 1996a). Characterizing the mean contaminant
concentration is the appropriate objective for subsurface sampling strategies because the
exposure potential associated with subsurface soils is limited by contaminant transport
upward into air or downward into groundwater. In cases where each VMP represents the
same subsurface soil interval, the average concentration is the simple arithmetic average
of the concentrations measure across the monitored zone. However, if the intervals are
not all the same length (e.g., due to complex stratigraphy), then the calculation of the
average concentration in the total core (or VMP) must account for the different lengths of
the intervals. Thus, the analytical data should be depth-weighted (USEPA, 1996c).
Simple equilibrium partitioning equations can then be used to estimate average residual
soil concentration. Figure 6.3 illustrates the difference between using maximum and
mean concentrations for risk-based cleanup decisions at a TCE-contaminated site.
Any site analytical data collected to demonstrate closure should be based on
knowledge of likely contamination patterns and subsurface conditions. This usually
means that samples should be collected from source areas targeted during SVE treatment.
At least 2 or 3 individual soil borings (or VMPs) should be used to estimate the mean
residual soil concentration within the SVE treatment area. However, closure sampling
should not be limited to purposive sampling in the source area, as such a sampling
strategy will interject bias into the data set; this bias could result in an overestimate of

FIGURE 6.3
MAXIMUM vs AVERAGE SOIL EXPOSURE CONCENTRATIONS FOR TCE
draw\svehandbook11.cdr lsm 6/13/2001
(<1)
(<1)
(<1)(<1)
(<1)
(<1)
(<1)
(<1)
(<1)
(<1)(<1)
(<1)
(3)
(2)
(3)
(6)
(5)(5)
(4)
(4)
(3)
(6)
(5)
(5)
(5)
(5)
(7)
(11)
(5)
(3)
(20)
(9)
(6)
(2)
(4)
(5)
(6)(4)
(3)
(4)
(3)
(2)
(2)
(1)
(2)
(2)
* Based on normal distribution
(3)
- 20 mg/kg
- 5.9 mg/kg
- 6.1 mg/kg
Sample Locations (depth 6-10 feet bgs.)
Legend
TCE Soil Concentration in mg/kg
Maximum Soil Concentration
Average Soil Concentrationat 95% UCL*
Non-Intrusive Site WorkerRisk Based Screening Level

022/736300/11.doc
6-7
potential risks, should a more detailed risk evaluation be completed in support of closure
at a site. In addition to other relevant DQOs, analytical quantitation limits should be less
than the most stringent targeted cleanup criteria.
6.2 Evaluating Contaminant Transport to Groundwater
In some cases, more detailed evaluations of the potential impact of remaining
contaminant residuals on underlying groundwater quality may be required. For example,
soil gas sampling may indicate that significant mass removal has taken place and that
most soil layers have achieved target soil gas levels. Unfortunately, a single low
permeability layer may contain residual contamination that causes the mean
concentration for that sampling location to be above targeted cleanup standards. Rather
than continue to operate the unproductive SVE system for additional years, a site-specific
evaluation of the potential effects of residual soil contamination on groundwater quality
may play an important role in the remedial decision process for the site. This site-
specific evaluation may be as simple as modifying the generic assumptions usually
imbedded within the soil-to-groundwater cleanup goal to be more representative of actual
site conditions, to as complex as constructing and completing a site-specific soils-to-
groundwater leaching model.
The soil-to-groundwater SSLs (also referred to as the migration to groundwater SSLs)
developed by the USEPA (1996c) incorporate both release of a contaminant in soil
leachate and transport of that contaminant through the soil and groundwater to a potential
receptor point. The SSL methodology incorporates a standard linear equilibrium
soil/water partition equation to estimate contaminant release in soil leachate and a simple
water-balance equation that calculates a dilution factor to account for dilution of soil
leachate in an aquifer. SSLs are then back-calculated from “acceptable” groundwater
concentrations (i.e., non-zero maximum contaminant level goals [MCLGs], MCLs, or
health-based levels).
The generic SSL methodology can be revised, as needed, to reflect more site-specific
information regarding the release and transport of contaminants in the subsurface. The

022/736300/11.doc
6-8
equations used to derive the migration to groundwater SSLs can be updated to reflect
site-specific values that are more representative of actual conditions than the default,
conservative parameter assumptions. Additionally, more complex unsaturated zone fate-
and-transport models can be used to define protective soil concentrations as more detailed
site-specific information is available. These more complex models are particularly
important when subsurface conditions are not adequately addressed by simple equations
(e.g., deep water tables; clay layers or other unsaturated zone characteristics that can
attenuate contaminants before they reach groundwater). Applying these more complex
models will more accurately define the risk of exposure via the migration to groundwater
pathway, which could lead to higher target cleanup criteria that provide the desired
degree of protection. However, these complex models can increase remediation-related
costs by increasing the effort needed to collect input data and complete the more detailed
site-specific evaluations.
The equations used to develop the generic soil-to-groundwater SSLs are based on
several conservative, simplifying assumptions – an infinite source, contamination
extending throughout the soil column, no biological or chemical degradation, and no
adsorption. There are several unsaturated zone models that are commercially available
that may be appropriate to more accurately represent more complex site conditions (and
amend subsurface cleanup goals, as necessary). Unsaturated models that could be used to
evaluate subsurface VOC transport include MULTIMED, VLEACH, and SESOIL. The
applications, assumptions, and input requirements for these (and other) models are fully
described in the Technical Background Document (TBD) to the SSL guidance (USEPA,
1996c); the following summaries are based on that information.
MULTIMED can be used to simulate direct infiltration to the unsaturated or saturated
zones. Transport in the unsaturated zone considers the effects of dispersion, adsorption,
volatilization, biodegradation, and first-order chemical decay. The saturated transport
module is one-dimensional, but considers three-dimensional dispersion, linear adsorption,
first-order decay, and dilution to recharge. This model can be configured to consider a
finite source assumption.

022/736300/11.doc
6-9
VLEACH is a one-dimensional, finite difference model developed to simulate the
transport of contaminants displaying linear partitioning behavior through the vadose zone
to the water table by aqueous advection and diffusion. Linear equilibrium partitioning
relationships are used to determine chemical concentrations; the model can be configured
to address a finite source.
SESOIL is a one-dimensional, finite difference model developed to evaluate the
transport of contaminants through the vadose zone. The model can be used to estimate
the rate of vertical contaminant transport and transformation through the soil to the
groundwater table. Fate processes that can be incorporated for VOCs include adsorption,
diffusion, volatilization, first-order chemical decay, and biodegradation.
Additional modeling solutions have been developed to estimate quantities of
remaining contamination based on equilibrium/rebound data (Stewart, 2001). These
models are useful in estimating remediation timeframes and the potential impact of
remaining VOC residuals on underlying groundwater.
6.3 Technical and Economic Feasibility Assessments
In some states, including California, very conservative soil-to-groundwater cleanup
standards have been enforced at Air Force SVE sites. After 5 to 10 years of operation,
many of these sites have failed to achieve these standards and are expecting additional
years of diffusion-limited recovery before standards can be achieved. Regulatory policies
have been written that allow sites with low VOC recovery rates to be turned off if certain
criteria are met. For example, if a groundwater system is expected to operate at a site for
decades, the additional leaching of low levels of VOCs may not add to the total
groundwater cleanup time. In this case the cost of continuing to operate the SVE system
may not be justified given the marginal benefit of VOC removal. In this case the
additional soil contaminant removal may be technically feasible but not economically
prudent. Under these circumstances, some regulatory agencies have allowed system
shutdown without reaching cleanup criteria. The Air Force is normally required to
demonstrate that the cost of removing additional VOCs from the soil is high compared to

022/736300/11.doc
6-10
the negligible benefit to groundwater quality. This approach known as SVE Termination
or Optimization Process (STOP), is being used at the former Castle AFB, CA, and is
provided in Appendix B.
022/736300/11.doc
7-1
SECTION 7
REFERENCES
AAEE, 1994. Innovative Site Remediation Technology: Soil Vapor Extraction.
American Academy of Environmental Engineers, Edited by William C. Anderson.
AFCEE, 1994. A Performance and Cost Evaluation of Internal Combustion Engineers
for Destruction of Hydrocarbon Vapors from Fuel-Contaminated Soils. Available
on the AFCEE website at www.afcee.brooks.af.mil/er/toolbox.htm.
AFCEE, 1997. Engineering Evaluation and Cost Analysis For Bioslurping Initiative.
Available on the AFCEE website at www.afcee.brooks.af.mil/er/toolbox.htm.
AFCEE, 1999. Remedial Process Optimization Handbook. Draft Final. Available on
the AFCEE website at www.afcee.brooks.af.mil/er/toolbox.htm.
AFCEE, 2001. Final Results Report for Soil Vapor Extraction Optimization Tools.
DiGiulio, D.C., M.L. Brusseau and V. Ravi. Use of Diffusion Modeling to Aid
Assessment of Rate-Limited Vapor Transport for SVE Closure. pp. 155-160, in
Physical, Chemical, and Thermal Technologies: Remediation of Chlorinated and
Recalcitrant Compounds, Wickramanayake, G.B., and R.E. Hinchee (eds.), 1998,
Battelle Press, Columbus, OH.
DiGiulio, D.C., Varadham R. 2000. Limitations of ROI Testing for Venting Design:
Description of an Alternative Approach Based on Attainment of a Critical Pore-
Gas Velocity in Contaminated Media. Ground Water Monitoring and
Remediation. Vol XXI, No. 1, pp 97-114, Winter 2001.

022/736300/11.doc
7-2
Johnson, P.C., C.C. Stanley, M.W. Kemblowski, D.L. Beyers and J.D. Colhart. 1990. A
Practical Approach to the Design, Operation and Monitoring of In-Situ Soil
Venting Systems. Ground Water Monitoring Review. V10, no. 2, pp. 159 – 178.
Leeson, 1995. Air Force Bioventing Principles and Practice Manual, Sept 1995.
Available on the AFCEE website at www.afcee.brooks.af.mil/er/toolbox.htm.
Praxis Environmental Technologies, Inc., 2000. Demonstration of Characterization
Progressing to Remediation (CPR): Beale, Griffis, and Nellis Air Force
Installations and Demonstration of Soil Vapor Extraction Optimization: Beale,
Castle, George, Mather, McClellan and Norton Air Force Installations, prepared
for AFCEE.
Stewart, L.D. 2001. Appendix G of Engineering and Design Soil Vapor Extraction and
Bioventing. US Army Corps of Engineers Manual No. 1110-1-4001. In
publication review.
USACOE, 1995. Engineering and Design Soil Vapor Extraction and Bioventing. US
Army Corps of Engineers Manual No. 1110-1-4001. (November).
USEPA, 1991. Guide for Conducting Treatability Studies Under CERCLA, Soil Vapor
Extraction. EPA/540/2-91/019A.
United States Environmental Protection Agency, 1996a. Soil Screening Guidance: Fact
Sheet. Office of Emergency and Remedial Response, Washington, D.C. EPA
540/F-95/041 (June).
United States Environmental Protection Agency, 1996b. Soil Screening Guidance:
User’s Guide. Office of Emergency and Remedial Response, Washington, D.C.
EPA 540/R-96/018 (July).
United States Environmental Protection Agency, 1996c. Soil Screening Guidance:
Technical Background Document. Office of Emergency and Remedial Response,
Washington, D.C. EPA/540/R-96/128.

022/736300/11.doc
7-3
USEPA, 1995. Review of Mathematical Modeling for Evaluation of SVE Systems.
EPA/540/R-95/513.
USEPA, 1999. Multi-Phase Extraction: State of Practice. EPA/542/R-99/004.

APPENDIX A
CALCULATE SOIL GAS CONTAMINANT MASS
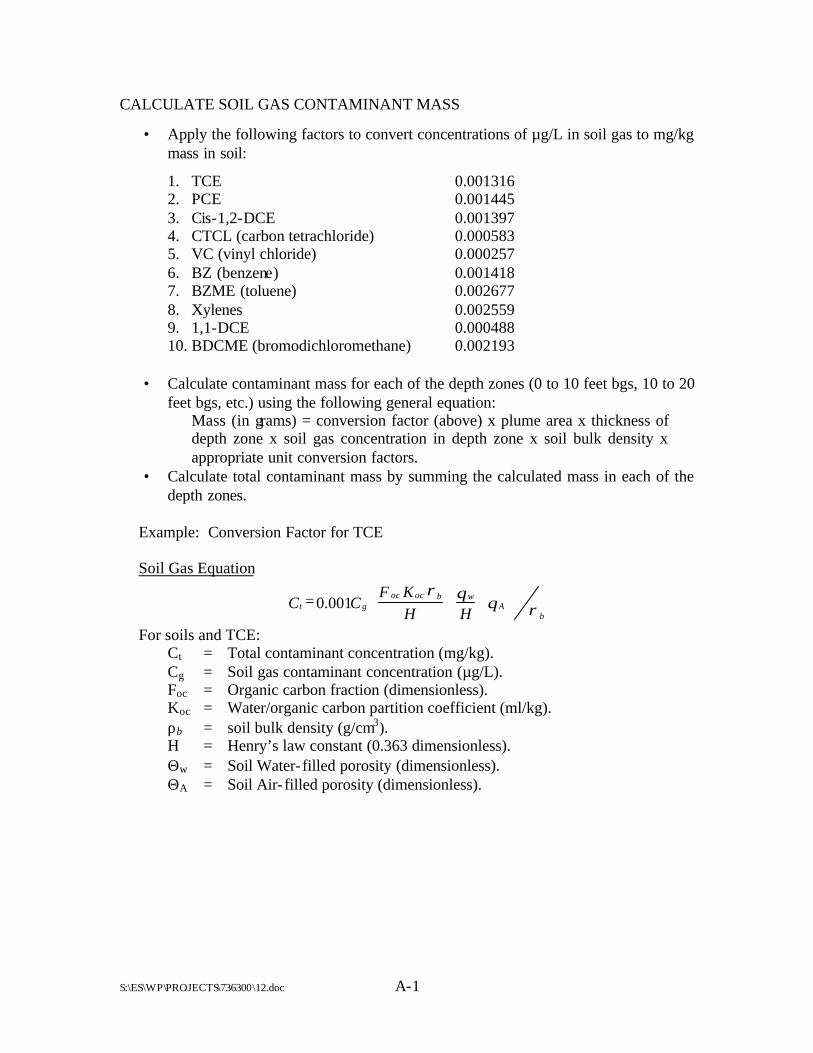
S:\ES\WP\PROJECTS\736300\12.doc A-1
CALCULATE SOIL GAS CONTAMINANT MASS
• Apply the following factors to convert concentrations of µg/L in soil gas to mg/kg mass in soil:
1. TCE 0.001316 2. PCE 0.001445 3. Cis-1,2-DCE 0.001397 4. CTCL (carbon tetrachloride) 0.000583 5. VC (vinyl chloride) 0.000257 6. BZ (benzene) 0.001418 7. BZME (toluene) 0.002677 8. Xylenes 0.002559 9. 1,1-DCE 0.000488 10. BDCME (bromodichloromethane) 0.002193
• Calculate contaminant mass for each of the depth zones (0 to 10 feet bgs, 10 to 20
feet bgs, etc.) using the following general equation: Mass (in grams) = conversion factor (above) x plume area x thickness of depth zone x soil gas concentration in depth zone x soil bulk density x appropriate unit conversion factors.
• Calculate total contaminant mass by summing the calculated mass in each of the depth zones.
Example: Conversion Factor for TCE Soil Gas Equation
ρθθρb
Awbococ
gt HHKF
CC
++= 001.0
For soils and TCE: Ct = Total contaminant concentration (mg/kg). Cg = Soil gas contaminant concentration (µg/L). Foc = Organic carbon fraction (dimensionless). Koc = Water/organic carbon partition coefficient (ml/kg). ρb = soil bulk density (g/cm3). H = Henry’s law constant (0.363 dimensionless). Θw = Soil Water- filled porosity (dimensionless). ΘA = Soil Air- filled porosity (dimensionless).

APPENDIX B
SVE TURN OFF CRITERIA