United Nations Development Programme County: Regional ... · PDF fileUnited Nations...
113
Revised: 14 March, 2012 i United Nations Development Programme County: Regional (Sabah, Malaysia) PROJECT DOCUMENT Project Title: Biodiversity conservation in multiple-use forest landscapes in Sabah, Malaysia UNDAF Outcome(s): UNDP Strategic Plan Environment and Sustainable Development Primary Programme Outcome: Mobilizing environmental financing UNDP Strategic Plan Secondary Outcome: Mainstreaming environment and energy Expected CP Outcomes: Outcome 3: enhancing environmental management of biodiversity and natural resources. Expected CPAP Outputs: Improved capacity of stakeholders in environmental management Executing Entity / Implementing Partner: MINISTRY OF NATURAL RESOURCE AND ENVIRONMENT, MALAYSIA; STATE ECONOMIC PLANNING UNIT, SABAH Implementing Entity/Responsible Partners: Sabah Forestry Department Sabah is one of the thirteen states of Malaysia and is located in the northern part of the island of Borneo. Under a mild climate and supported by a diversity of soils, the biodiversity of Sabah is exceptionally high, helping to earn Malaysia its status as one of 17 mega-diversity countries. Among Southeast Asian countries, Malaysia’s biodiversity in terms of plants, mammals, birds, reptiles and amphibians is ranked fourth after Indonesia, China and Papua New Guinea. Most of Sabah’s biodiversity is found in the forest reserves, which occupy about half of its total landmass of 7.34 million hectares. Sabah’s forest reserves are an integral part of the 20 million hectares of equatorial rainforests demarcated under the ‘Heart of Borneo’ tri-government (Malaysia, Indonesia and Brunei Darussalam) initiative aiming at conserving and managing the tropical forest biodiversity sustainably. Over the last 30 years, Sabah has experienced rapid economic growth relying heavily on its forest resources to finance its socio-economic development programmes. There had been an acceleration of forest conversion, particularly outside the forest reserves, as well as forest degradation within the forest reserves associated with overharvesting of resources. These trends have resulted in the progressive loss and degradation of much of the biodiversity in the forest landscape. Protected areas are becoming increasingly isolated, thus decreasing prospects for viability of species. The proposed 261,264 ha project landscape represents one such landscape, which forms an important connecting landmass to three renowned protected areas in Sabah; the Maliau Basin Conservation Area (58,840 ha) to the West, the Danum Valley Conservation Areas (43,800 ha) to the East, and the Imbak Canyon Conservation Areas (16,750 ha) to the North. The project landscape constitutes a connecting landscape that is utilized for timber production (69% of total area), industrial tree plantation (16%), rehabilitated forests by enrichment planting (6%) and conservation purposes (6%). This landuse mix is an emerging trend in the forest reserves of Sabah driven by: (i) the comparative disadvantage in crop gestation periods between growing trees and agriculture crops, (ii) low rent capture, and: (iii) incoherent enforcement associated with the lack of expertise in multiple-use forest landscapes. Under a business-as-usual scenario, the above protected areas will become increasingly vulnerable to fire during prolonged droughts potentially from the surrounding degraded forests. The objective of the project is to bring the landuses in the connecting landscape and protected areas under a common and integrated management umbrella strategy in order to mainstream biodiversity, ecosystem functions and resilience, while enabling ongoing sustainable uses. The project will meet this objective by achieving three interconnected outcomes: (1) provisioning of an enabling environment for optimized multiple use planning, financing, management and protection of forest landscapes; (2) demonstration of multiple-use forest landscape planning and management system, and (3) demonstration of innovative sustainable financing methods for multiple-use forest landscape management. Assistance provided by GEF will strengthen the conservation of the largest area of mostly contiguous forest in Sabah, and one of the most important remaining forest landscapes in the Heart of Borneo. GEF’s int ervention amounts to USD4.4 million against USD 19.5 million from the Government of Malaysia and co-financing from implementing partners. The project is expected to serve as a model to draw lessons learnt in best practices for replication in other forest landscapes within Sabah and in other parts of Malaysia and the Heart of Borneo.
Transcript of United Nations Development Programme County: Regional ... · PDF fileUnited Nations...

Revised: 14 March, 2012
i
United Nations Development Programme
County: Regional (Sabah, Malaysia)
PROJECT DOCUMENT
Project Title: Biodiversity conservation in multiple-use forest landscapes in Sabah, Malaysia
UNDAF Outcome(s): UNDP Strategic Plan Environment and Sustainable Development Primary Programme Outcome: Mobilizing environmental financing
UNDP Strategic Plan Secondary Outcome: Mainstreaming environment and energy
Expected CP Outcomes: Outcome 3: enhancing environmental management of biodiversity and natural resources.
Expected CPAP Outputs: Improved capacity of stakeholders in environmental management Executing Entity / Implementing Partner: MINISTRY OF NATURAL RESOURCE AND ENVIRONMENT, MALAYSIA; STATE ECONOMIC
PLANNING UNIT, SABAH
Implementing Entity/Responsible Partners: Sabah Forestry Department
Sabah is one of the thirteen states of Malaysia and is located in the northern part of the island of Borneo. Under a mild
climate and supported by a diversity of soils, the biodiversity of Sabah is exceptionally high, helping to earn Malaysia
its status as one of 17 mega-diversity countries. Among Southeast Asian countries, Malaysia’s biodiversity in terms of
plants, mammals, birds, reptiles and amphibians is ranked fourth after Indonesia, China and Papua New Guinea. Most
of Sabah’s biodiversity is found in the forest reserves, which occupy about half of its total landmass of 7.34 million
hectares. Sabah’s forest reserves are an integral part of the 20 million hectares of equatorial rainforests demarcated
under the ‘Heart of Borneo’ tri-government (Malaysia, Indonesia and Brunei Darussalam) initiative aiming at
conserving and managing the tropical forest biodiversity sustainably.
Over the last 30 years, Sabah has experienced rapid economic growth relying heavily on its forest resources to finance
its socio-economic development programmes. There had been an acceleration of forest conversion, particularly outside
the forest reserves, as well as forest degradation within the forest reserves associated with overharvesting of resources.
These trends have resulted in the progressive loss and degradation of much of the biodiversity in the forest landscape.
Protected areas are becoming increasingly isolated, thus decreasing prospects for viability of species.
The proposed 261,264 ha project landscape represents one such landscape, which forms an important connecting
landmass to three renowned protected areas in Sabah; the Maliau Basin Conservation Area (58,840 ha) to the West, the
Danum Valley Conservation Areas (43,800 ha) to the East, and the Imbak Canyon Conservation Areas (16,750 ha) to
the North. The project landscape constitutes a connecting landscape that is utilized for timber production (69% of total
area), industrial tree plantation (16%), rehabilitated forests by enrichment planting (6%) and conservation purposes
(6%). This landuse mix is an emerging trend in the forest reserves of Sabah driven by: (i) the comparative disadvantage
in crop gestation periods between growing trees and agriculture crops, (ii) low rent capture, and: (iii) incoherent
enforcement associated with the lack of expertise in multiple-use forest landscapes. Under a business-as-usual scenario,
the above protected areas will become increasingly vulnerable to fire during prolonged droughts potentially from the
surrounding degraded forests.
The objective of the project is to bring the landuses in the connecting landscape and protected areas under a common
and integrated management umbrella strategy in order to mainstream biodiversity, ecosystem functions and resilience,
while enabling ongoing sustainable uses. The project will meet this objective by achieving three interconnected
outcomes: (1) provisioning of an enabling environment for optimized multiple use planning, financing, management
and protection of forest landscapes; (2) demonstration of multiple-use forest landscape planning and management
system, and (3) demonstration of innovative sustainable financing methods for multiple-use forest landscape
management. Assistance provided by GEF will strengthen the conservation of the largest area of mostly contiguous
forest in Sabah, and one of the most important remaining forest landscapes in the Heart of Borneo. GEF’s intervention
amounts to USD4.4 million against USD 19.5 million from the Government of Malaysia and co-financing from
implementing partners. The project is expected to serve as a model to draw lessons learnt in best practices for
replication in other forest landscapes within Sabah and in other parts of Malaysia and the Heart of Borneo.

Revised: 14 March, 2012
ii
Programme Period: 2012-2018
Atlas Award ID: TBD
Project ID: TBD
PIMS #: 4186
Start date: May 2012
End Date: May 2018
Management Arrangement: NIM
PAC Meeting Date: January, 2012
Total budget: US$ 23,900,000
Allocated resources:
GEF: US $ 4,400,000
Co-financing: US $ 19,500,000 o Sabah Forest Department : US$ 15,000,000 o Sabah Foundation: US$ 4,400,000
o WWF US$ 100,000
Agreed by (Government):
Date/Month/Year
Agreed by (Executing Entity/Implementing Partner):
Date/Month/Year
Agreed by (UNDP):
Date/Month/Year

Revised: 14 March, 2012
iii
Table of Contents
LIST OF TABLES ........................................................................................................................ V
LIST OF FIGURES ...................................................................................................................... V
LIST OF ANNEXES ..................................................................................................................... V
LIST OF ACRONYMS AND ABBREVIATIONS ................................................................... VI
PART I: SITUATION ANALYSIS .......................................................................................... 1
1.1 Context and global significance ......................................................................................... 1
1.2 Threats and underlying causes ......................................................................................... 23
1.3 Long-term solution and barriers....................................................................................... 28
1.4 Stakeholder Analysis ....................................................................................................... 30
1.5 Baseline Analysis ............................................................................................................. 30
PART II: PROJECT STRATEGY .......................................................................................... 38
2.1 Project Rationale and Policy Conformity ........................................................................ 38
2.2 Country ownership: country eligibility and country drivenness ...................................... 39
2.3 Design principles and strategic considerations ................................................................ 40
2.4 Project Objective, Outcomes and Outputs / Activities .................................................... 41
2.5 Key Indicators, Risks and Assumptions .......................................................................... 48
2.6 Financial modality ........................................................................................................... 52
2.7 Cost effectiveness ............................................................................................................ 52
2.8 Sustainability ................................................................................................................... 53
2.9 Replicability ..................................................................................................................... 53
2.10 Coordination with Relevant Programs ............................................................................. 54
2.11 Incremental Reasoning and Expected Global, National and Local Benefits ................... 54
PART III: MANAGEMENT ARRANGEMENTS .................................................................. 56
PART IV: MONITORING AND EVALUATION FRAMEWORK ..................................... 58
PART V: LEGAL CONTEXT ................................................................................................. 61
PART VI: STRATEGIC RESULTS FRAMEWORK (SRF) ................................................. 63
PART VII: TOTAL BUDGET AND WORK PLAN ................................................................ 68
OBJECTIVE OF THE MODEL .................................................................................................. 88
REVIEW OF EXISTING LANDSCAPE LAND USE MODELS AND THEIR SUITABILITY
TO THE SITE ........................................................................................................... 88
InVEST ..................................................................................................................................... 89

Revised: 14 March, 2012
iv
CONCLUSION ............................................................................................................................. 92
1. OVERVIEW OF FINANCING MECHANISM ................................................... 96
2. REDD ........................................................................................................................ 97
Background ................................................................................................................................ 97
Initiatives in Malaysia ............................................................................................................... 97
Applicability to demonstration project ...................................................................................... 98
3. BIODIVERSITY OFFSETS ................................................................................... 98
Background ................................................................................................................................ 98
Initiatives in Malaysia ............................................................................................................. 100
Applicability to project site ...................................................................................................... 101
4. PES .......................................................................................................................... 102
Background .............................................................................................................................. 102
Initiatives in Malaysia ............................................................................................................. 102
Applicability to project site ...................................................................................................... 102
5. OTHERS ................................................................................................................. 102
Timber concessions and royalties ............................................................................................ 103
Accessing price premiums through certification bodies. ......................................................... 103
Biodiversity / Conservation Fund ............................................................................................ 104
Tourism revenues ..................................................................................................................... 104
6. BENEFIT SHARING ............................................................................................ 104
7. CONCLUSIONS .................................................................................................... 104

Revised: 14 March, 2012
v
List of Tables
Table 1. List of endangered fauna species in CITES........................................................................................... 5 Table 2. Landuses classification and trend in Sabah (2003-2009) ...................................................................... 7 Table 3. Export of major commodities from Sabah (2005-2009)...................................................................... 10 Table 4. Export of timber products from Sabah (2005-2009) .......................................................................... 12 Table 5. Summary of information available to inform valuation of ecosystem service ................................... 17 Table 6. Protected areas in Sabah .................................................................................................................... 19 Table 7. Forest plantation and restoration in Sabah’s forest reserves .............................................................. 25 Table 8. Key Stakeholders, their roles and responsibilities and involvement in the project ............................ 31 Table 9. Sustainable Forest Management Licensees in Sabah .......................................................................... 34 Table 10. Project indicators and targets ............................................................................................................. 48 Table 11. Risks facing the project and risk mitigation strategy. ........................ Error! Bookmark not defined. Table 12. Monitoring and Evaluation (M&E) Work Plan and Budget .............................................................. 59
List of Figures
Figure 1: Location map of Sabah and areas (item 14, 15, 16, 17, 18) included under the Heart of Borneo
(HoB) initiative. ................................................................................................................................................... 2 Figure 2: Yayasan Sabah Concession Area and project landscape in Sabah, Malaysia ...................................... 3 Figure 3. Trend in oil palm plantation development in Sabah (1980-2008). ....................................................... 8 Figure 4: Landuses within and adjacent to project landscape ........................................................................... 15 Figure 5. Project organization chart ................................................................................................................. 57
List of Annexes
Annex 1: Terms of reference for project staff and consultants.......................................................................... 70 Annex 2: Stakeholder involvement plan .......................................................................................................... 77 Annex 3: Summary inputs of stakeholders' validation workshop .................................................................... 81 Annex 4: Baseline METT scores ...................................................................................................................... 84 Annex 5: Capacity scorecards ........................................................................................................................... 85 Annex 7: Co-financing agreements .................................................................................................................. 93
Annex 8: Analysis of options for revenue generation……………………........................................................92

Revised: 14 March, 2012
vi
List of Acronyms and Abbreviations
ADB Asian Development Plan
APR Annual Project Review
AWP Annual Work Plan
BD-SO GEF Biodiversity Strategic Objectives
BD-SP UNDP Biodiversity Strategic Plan
BCT Borneo Conservation Trust
BBOP Business of Biodiversity Offset Programme
CBD Convention of Biodiversity
CHP Comprehensive Harvest Plan
CITIES Convention on International Trade in Endangered Species
CPAP UNDP Country Programme Action Plan
CTA Chief Technical Advisor
DBH Diameter at Breast Height
DID Department of Irrigation and Drainage, Sabah
DO District Officer
DVCA Danum Valley Conservation Area
EA Executing Agency
EE Executing Entity
ENSO El Nino Southern Oscillation
EPD Environment Protection Department, Sabah
ERC UNDP Evaluation Resource Centre
ESA Ecosystem Service Approach
FCCC Framework Convention on Climate Change
FMP Forest Management Plan
FMU Forest Management Unit
FRIM Forest Research Institute Malaysia
FSC Forest Stewardship Council
GEF Global Environment Facility
GDP Gross Domestic Product
GFTN WWF-Global Forest and Trade Network
GoM Government of Malaysia
GTZ Deutsche Gessellschaft fur Internationale Zusammenarbeit
HCVF High Conservation Value Forest
HoB Heart of Borneo Programme
IA Implementing Agency
ICCA Imbak Canyon Conservation Area
ICSB Innoprise Corporation Sdn. Bhd
IE Implementing Entity
INIKEA Innoprise-IKEA Forest Rehabilitation Project
INFAPRO Innoprise Forest Absorbing Project
ITP Industrial Tree Plantation
JICA Japan International Corporation Agency
LEAP Land Empowerment and Animals People
LCC Land Capability Classification
LFC Luasong Forestry Centre
MDF Mixed Dipterocarp Forest
MDP Malaysia Development Plan
MBCA Maliau Basin Conservation Area
METT Management Efficiency Tracking Tool
M&E Monitoring and Evaluation
MoA Memorandum of Agreement
MoU Memorandum of Understanding
MoV Means of Verifications
MoFS Ministry of Finance, Sabah
MTE Mid-Term Evaluation
MUFLM Multiple-Use Forest Landscape Management
MRED Ministry of Rural and Entrepreneurial Development, Sabah
MTDEST Ministry of Tourism and Environment Science and Technology, Sabah
NAP National Agriculture Policy
NC National Consultants

Revised: 14 March, 2012
vii
NEP New England Power, USA
NFC National Forestry Council
NFM Natural Forest Management
NGOs Non-government organizations
NIM UNDP National Implementation
NKEA National Key Economic Areas
NPD National Project Director
NPV Net Present Value
NRE Ministry of Natural Resources and Environment, Malaysia
NROS Natural Resource Office, Sabah
NWFP Non-Wood Forest Products
OPPS Outline Perspective Plan of Sabah
OWP Operational Work Plan
PA Protected Areas
PAC Project Advisory Committee
PACOS Partners of Community Organizations
PB Project Board
PES Payment for Ecosystem Services
PIR Project Implementation Review
PM Project Manager
PMU Project Management Unit
POC Project Organizing Committee
PPG Project Preparation Grant
PPR Project Progress Report
RCU UNDP Regional Coordinating Unit
REDD Reduced Emission from Deforestation and Degradation
RM Malaysian Ringgit
RIL Reduced Impact Logging
RBJ Rakyat Berjaya Sdn. Bhd.
RS Royal Society, UK
RSPO Roundtable Sustainable Palm Oil
SAP Sabah Agriculture Policy
SBC Sabah Biodiversity Center
SBBA Standard Basic Assistance Agreement
SBC Sabah Biodiversity Council
SC Steering Committee
SEPU State Economic Planning Unit, Sabah
SFD Sabah Forestry Department
SFM Sustainable Forest Management
SFMLA Sustainable Forest Management Licence Agreement
SRF Strategic Result Framework
SSC Soil Suitability Class
SWD Sabah Wildlife Department
SUAS Swedish University of Agricultural Sciences
TEV Total Economic Valuation
TF Task Force
TLAS Timber Legality Assurance System
TOR Terms of Reference
UMS Universiti Malaysia Sabah
UNDP United Nation Development Programme
UNDP-CO UNDP-Country Office
UPM Universiti Putra Malaysia
WWF World Wildlife Fund for Nature
YS Yayasan Sabah/Sabah Foundation
YSCA Yayasan Sabah Concession Area

Revised: 14 March, 2012
1
PART I: SITUATION ANALYSIS
1.1 Context and global significance
1. This section presents the context and global significance for the present project. It includes the following
sub-sections: environmental context; global significance; environmental economic and socio-economic
context; protected area system context, and; institutional and policy context. Each sub-section provides a
state-level (and in some cases national-level) overview of the issue, together with, in relevant sub-
sections, specific information regarding the pilot project landscape.
ENVIRONMENTAL CONTEXT
2. Sabah is one of the thirteen states of Malaysia and is located in the northern part of the island of Borneo,
between latitudes 3o to 5
o N and longitudes 119
o to 123
o E (Figure 1). With a land area of 7.49 million
ha, Sabah occupies about one tenth of the island of Borneo, and is bounded by Sarawak (the second
Malaysian State on Borneo Island) and Brunei to the west, and by Indonesian Kalimantan to the south. It
is neighbor to the Philippines to the northeast, Indonesia to the south and Brunei and Indo-China to the
west. Sabah is largely surrounded by water, with the South China Sea bordering the West, the Sulu Sea
to the Northeast, and the Pacific Ocean further to the East. With 90% of Sabah’s border formed by water,
its climate is heavily influenced by the sea.
3. Sabah’s climate is warm and humid throughout the year. Mean daily temperature based on a 5-year
average (2005-2009) is between 24 and 31oC with relative humidity at 83% (Sabah Statistics
Department, 20101). The annual rainfall recorded for the same period was 3,022 mm. Monthly
temperatures and rainfalls are influenced by two monsoon seasons: the northeast monsoon from October
to March and the southeast monsoon from May to September. Periods of drought have become more
frequent over the last four decades; there have been eight prolonged drought incidents since 1965
associated with the El Nino Southern Oscillation ENSO phenomenon (Yayasan Sabah, 20032).
4. Sabah can be divided into four main physiographic regions, oriented in a north-south direction
(Government of Sabah, 19883). The Western Lowlands include the foothills, plains and islands to the
west of the Crocker Range. The soils in this area are derived from parent materials of coralline
limestone, beach deposits and alluvium. The Western Cordillera comprises a belt of mountainous
country about 80 km in width parallel to the west coast and includes the Crocker, Trusmadi, Witti and
Maligan ranges and associated inter-montane plains and valleys. Soils here are derived from sedimentary
rocks, including shales, mudstones and sandstones. The Central Uplands, comprising extensive tracts of
mountainous country to the east of the Western Cordillera, include the Labuk, Kuamut, Segama and
Tawau highlands. Parent materials of the soils in this area are derived from igneous and volcanic rocks.
The Eastern Lowlands stretch from the Bengkoka Peninsula in the north to the Semporna Peninsula in
the south, and include extensive tracts of moderate to low hills, the broad valleys of the Sugut, Labuk,
Kinabatangan and Segama rivers and extensive deltas.
5. The project landscape is located near the east coast of Sabah between latitude 4oN and 5
oN and longitude
110o 2’E and 110
o 3’E (Figure 2). It consists of a 261,264 ha landscape, and represents 26% of the one
million hectares Yayasan Sabah Concession Area (YSCA). Within the landscape, the dipterocarps and
heath forests occupy 44% or 115,760 ha of the total area and are located in the (300<750m) southern and
central highlands (see Map 3). The next dominant forest type is the upland dipterocarp forests,
representing 41% or 106,511 ha, which are mostly found in the northern and eastern regions. The
remaining area consists of lowland dipterocarp (13% or 32,884 ha) and upland kerangas forests (0.1% or
316 ha).
1 Sabah Statistics Department, 2010. Yearbook of Statistics Sabah 2009. 2 Yayasan Sabah, 2003. Strategic Management Plan for Maliau Basin Conservation Areas, Sabah, Malaysia. Yayasan Sabah. 3 Government of Sabah, 1988. Sabah Coastal Zone Profile. http://www.iczm.sabah.gov.my.

Revised: 14 March, 2012
2
GLOBAL SIGNIFICANCE
6. Under a mild climate that rains all year round, and supported by a diversity of soils, the flora and fauna
diversity of Sabah is exceptionally high, helping to earn Malaysia its status as one of 17 mega-diversity
countries (Mittermeier et al. 19974). Among Southeast Asian countries, Malaysia’s biodiversity in terms
of plants, mammals, birds, reptiles and amphibians is ranked fourth after Indonesia, China and Papua
New Guinea. The entire state of Sabah falls within the WWF Global 200 Borneo Lowland and Montane
Forest Ecoregion and the Sundaland Global Biodiversity Hotspot.
7. Most of Sabah’s forests are located within a larger ecological area which has become known as the
“Heart of Borneo (HoB).” This area contains some 200,000 km2 of ecologically interconnected rainforest
in the Indonesian province of Kalimantan, the East Malaysian states of Sabah and Sarawak and the
nation of Brunei Darussalam. The HoB occupies approximately 30% of Borneo’s land area and houses a
diversity of plants and animals endemic to the island. This natural heritage also provides goods and
services critical to the people of Borneo.
Figure 1: Location map of Sabah and areas (item 14, 15, 16, 17, 18) included under the Heart of Borneo
(HoB) initiative.
4 Mittermeier, R.A., Robles-Gil, P. and Mittermeier, C.G. 1997. Megadiversity. Earth’s Biologically Wealthiest Nations. CEMEX/Agrupaciaon Sierra
Madre, Mexico City..

Revised: 14 March, 2012
3
Figure 2: Yayasan Sabah Concession Area and project landscape in Sabah, Malaysia
8. Sabah’s flora is estimated to comprise over 6,000 species of flowering plants, 650 species of ferns, and
2,000 species of orchids. These estimates are nearly half of those reported for Malaysia as a whole, and
many species are endemic to Sabah. Among these are over 267 genera of plant species that can reach
timber size in the family Dipterocarpaceae (Wood and Meijer, 19645). Eight of these genera (Shorea,
Parashorea, Hopea, Dipterocarpus, Dryobalanops, Anisoptera, Vatica and Cotylelobim), comprising
160 species in the Dipterocarpaceae family, are currently of commercial value.
9. In its pristine form, dipterocarp forest is characterized by five canopy layers. Near the ground is the
herbaceous layer reaching up to a meter high. Overshadowing the herbaceous layer is a scattered layer of
shrubs that can reach 3 m in height. Above the shrub layer are the understory trees. Next is the canopy
layer, comprising most of the larger trees. The emergent layer, which grows above the main canopy and
reaches up to 40-60 m height, is where most of the commercial species are found. The species
composition in this forest type varies with locations along slope gradient and ecological niche.
5 Wood, G.H.S. and Meijer, W. 1964. Dipterocarps of Sabah. Sabah Forest Record No.5. Forestry Department, Sabah, Malaysia.

Revised: 14 March, 2012
4
10. It has been reported that at least 132 species of flowering plants in 101 genera and 53 families thrive in
Sabah’s lowland mixed dipterocarp forest (MDF) below 750 m a.m.s.l. (Latiff et al., 20056). The
dominant families are Rubiaceae (31% by species), Euphorbiaceae (17%), Annonaceae (32%) and
Dipterocarpaceae (20%). Dipterocarpaceae are most abundant among trees above 10 cm diameter at
breast height (DBH), followed by Rubiaceae, Euphorbiaceae and Mytaceae (Jumaat Adam, 20057).
Commercial species in the emergent canopy layer include Shorea spp., Parashorea spp., Dipterocarpus
spp., Dryobalanop spp., Hopea sp., Vatica spp., while the non-dipterocarps include the Podocarpus spp.
and others. In elevations above 750m, where the soils are derived from ultrabasic rocks, the Shorea spp.
and the Dryobalanops spp. are generally absent.
11. The wildlife population is exceptionally rich. Sabah supports 189 species of land mammals, 42 of which
are endemic to Borneo. Globally significant species include the Orang-utan, Proboscis monkey, Sun
bear, Banteng/Tembadau, Sumatran rhino, Borneo elephant and Clouded leopard. It has been estimated
that not more than 12,000 Orang-utan survive in Sabah, and their numbers have continued to decline in
recent years (Rijksen and Meijaard, 19998; Ancrenaz et al., 2004
9; Alfred et al., 2010
10). Of the
approximately 2,000 pygmy elephants in Borneo (Malaysia and Indonesia), about half currently live in
the central region of Sabah. The vertebrate fauna is exceptionally rich with records of over 120 species
of mammals, 300 birds, 72 reptiles, 56 amphibians and 37 fishes. In addition to pygmy elephants, of
particular significance are populations of 10 species of primates, including the endemic Proboscis
monkeys, as well as Orang-utan, Clouded Leopards, Sumatran Rhinoceros and Malayan Sun Bears. The
population of Sumatran Rhino has been estimated at 9-16 individuals. These large mammals are of
special conservation interest because most species are relatively sensitive to timber harvesting
disturbance (Payne and Raymond, 200611
). For example, primate abundance has declined in the recent
past mainly as a result of extreme habitat degradation and fragmentation due to timber harvesting
(Ancrenaz et al., 200312
). These large mammals require extensive forest areas to support viable breeding
populations.
12. The avifauna is made-up of 540 species of birds representing 60 families, 1000 species of butterflies and
500 species of moths recorded. In addition, 100 species of reptiles, 80 species of amphibians and more
than 100 species of freshwater fishes have been described. These species are found in both primary and
disturbed forests.
13. Much of Sabah’s flora and fauna biodiversity remains to be identified, especially amongst lower plants
such as the bryophytes, algae, lichens and fungi. The rate of discovery of new species over the last 10
years following scientific expeditions within protected areas is roughly 10% of the total flora and fauna
collections.
14. Within the project landscape, the lowland dipterocarp forests are especially rich in tree species, with 814
species of woody plants of 1 cm diameter and larger found (Newbery et al., 1992)13
. Endemic, rare and
threatened species of flora within the project landscape include the protected polod palm species (Arenga
undulatifolia) and the elephant ear orchid (Phalaenopsis gigantea).
6 Latiff, A., Zainudin Ibrahim, A., Sukup Akin, Zainal Awang and Mat-Salleh, K. 2005. On the flowering plants of Gunung Danum, Danum Valley
Conservation Area. In Laily, B. Din, Muhammad Yahya, Norhayati, A., Nizam, M.S., Sinun, W. and Latiff, A. (eds.): Danum Vally Conservation Area: hysical, Biological and Social Environments.
7 Jumaat, H.A. 2005. Tree species composition at the Borneo Jungle Lodge. In Laily, B. Din, Muhammad Yahya, Norhayati, A., Nizam, M.S., Sinun,
W. and Latiff, A. (eds.): Danum Vally Conservation Area: hysical, Biological and Social Environments. 8 Rijksen, H.D. and Meijaard, E. 1999. Our vanishing relative: the status of wild orang utans at the close of the 20th century. Tropenbos publications,
the Netherlands. 9 Ancrenaz, M., Dg. Suzita Sheena James, Sinyor, J. and Maklarin Hj. Lakim. 2004. Orang-utan surveys in Crocker Range Park. In Maryati, M.
Hamzah, Zulhazman, Tachi, T. and Nais, J. 2004. Crocker Range Scientific Expedition 2002. 10 Alfred, R., Koh, S., Lee, S.K., Ambu, L.,D. and Sharma, S.K. 2010. The Status of Orang-utan density and population size in Seven key orang-utan
habitats in Sabah. Submitted to American Journal of Primatology 11 Payne, J. and Raymond, A. 2006. Orang-utans in Ulu Segama-Malua Forest Reserves (USM): Background perspective and summary of currently
available information and issues. Unpublished Report. 12 Sawang, A., Suali, M., Ahmad, E., Abd. Razak Saharon, Lackman-Ancrenz, I. and Ancrenz, M. 2006. Orang-utan and Gibbon populations in the
forests of Lower Segama. In Maryati Mohamad, Bernard, H., Sofian Abu Bakar and Matsunaga, R. (eds.): Lower Segama Scientific Expedition. Universiti Malysia Sabah.
13 Newberry, D., McC., Campbell, E.J.F., Lee, Y.F., Ridsdale, C.E. and Still, M.J. 1992. Primary Lowland Dipterocarp Forest at Danum Valley, Sabah,
Malaysia: Structure, Relative Abundance and Family Composition. Phil. Transaction of the Royal Society Series B, Vol.335: 341-356.

Revised: 14 March, 2012
5
15. The project landscape is highly significant in terms of global biodiversity. As shown in Table 1 below,
six out of seven of Sabah’s globally threatened fauna species are present within the landscape. Its
lowland dipterocarp forests are particularly rich in species diversity, with 814 species of woody plants of
1 cm diameter and larger found in a 50 hectare area. Endemic, rare and threatened species within the
project landscape include the protected gaharu timber (Aquilaria borniensis). About half of the pygmy
elephant population in Borneo (Malaysia and Indonesia) currently lives in the central forest reserves area
of Sabah. Orang-utans, numbering approximately 700, and rhinoceros also share the same habitat.
16. The significance of these forests will be critical to the persistence of the long-term global benefits
generated by the area, in particular their ability to support high levels of biodiversity while helping to
mitigate climate change. The area provides connectivity to and buffers critical storehouses of,
biodiversity found within neighboring PAs. This latter function becomes of special importance within a
context of climate change, when ecosystem resilience cannot be maintained by focusing on relatively
small and increasingly isolated protected areas, but instead requires a matrix of compatible surrounding
land uses. Potential climate change impacts on species composition and ecosystem function further
increase the importance of these interconnecting landscape areas for the ecological sustainability of the
conservation areas.
Table 1. List of endangered fauna species in CITES
ENVIRONMENTAL ECONOMIC, SOCIO-ECONOMIC AND LAND USE CONTEXT
17. In order to understand both the environmental and socio-economics of biodiversity conservation and
resource use in Sabah, it is useful first to review trends in land use allocations, including past, present
and future land use breakdowns.
18. Land use allocation in Sabah is guided by the Land Capability Classification (LCC) (Acres, et al., 1975).
The LCC classifies land according to its relative economic capability and based on ground slope, and soil
physical and chemical properties. LCC I is allocated for mining of minerals; LCC II and III for
agriculture development differentiated according to a range of crops to be cultivated, LCC IV for
forestry uses and LCC V for hydrological and wildlife conservation. Within the LCC, land for
agriculture development is based on five soil suitability classes (SSC): SSC 1 to 3 are best suited for
agriculture, SSC 4 for forestry and SSC 5 for conservation of water and wildlife.
No Wildlife Scientific name Status in Red List Population
trend in Sabah
Present in
Project
landscape
1 Orang-utan Pongo pygmaeus Endangered Decreasing Yes
2 Bornean
Elephant
Elephas maximus
borneensis Endangered Decreasing Yes
3 Sumatran
Rhinoceros
Dicerorhinus
sumatrensis
Critically
Endangered Decreasing Not confirm
4 Clouded leopard Neofelis
nebulosa Vulnerable Decreasing Yes
5 Proboscis
monkey Nasalis larvatus Endangered Decreasing Yes
6 Sun bear Helarctos
malayanus Vulnerable Decreasing Yes
7 Tembadau Bos javanicus Endangered Decreasing Yes

Revised: 14 March, 2012
6
19. Based on the LCC and SSC guidelines, Sabah’s land area has been divided into four land use classes (see
Table 2). Forest Reserves cover the largest area of the four classes, occupying 3.60 million ha, or 48% of
Sabah’s 7.49 million ha. landmass. The main use of the Forest Reserves is forestry development.
Stateland, which is mainly used for agriculture, occupies 3.48 million ha, or 46% of the total landmass.
Wildlife Sanctuaries and Sabah Parks cover the remaining 5%, at 152,828 ha (2%) and 245,172 ha (3%)
respectively. Among these four land uses, Stateland and to a lesser extent Forest Reserves are witnessing
rapid land use change—mainly conversion to oil palm—encouraged by the National Agricultural Policy
(NAP3) and the Sabah Agricultural Policy 2 (SAP2). It is upon the remaining forests within these land
use categories14
that most of the deforestation and degradation debate is focused.
20. The following sub-sections look in detail at Sabah’s two major land uses, namely agriculture and forestry
and associated use and non-use values, along with the tourism sector. The discussion is aimed at
quantifying important and ongoing state-wide trends in land use change associated with, on the one hand,
economic growth and development and, on the other hand, deforestation, degradation and habitat loss. A
final sub-section looks at land uses in and around the project landscape, which are affected by, and also
illustrate, the state-wide trends discussed below.
Agriculture
21. Agriculture is one of the most important economic sectors in Sabah, contributing c. 38% of the State’s
GDP in 2009. Growth in the sector has been fueled by a combination of factors, including Malaysia’s
National/State Agriculture Policy (NAP2 and SAP2)15
, buoyant market prices for the main agriculture
commodities and physical expansion of agriculture plantations.
22. Agricultural land use in Sabah has expanded at a fast pace. In 1970, the total area of land cultivated with
various agricultural crops was 263,399 ha; this figure increased to 564,000 ha by 1980, to 1,000,000 ha
by 1990, and to 1,182,000 by 2000. This represents an annual growth rate of 11% or 31,000 ha per
annum (Government of Sabah, 200816
). Nearly all agricultural expansion takes place on what had
theretofore been forested land. By 2009, about 67% or 1.47 million ha of the 2.2 million ha of Stateland
deemed suitable for agriculture development had already been developed into various agriculture
plantations (Government of Sabah, 199817
; Table 2). Thus, approximately 730,000 ha of largely forested
Stateland remain available and designated for conversion to agriculture.
23. Sabah’s main agricultural crops are oil palm, rubber, paddy, cocoa and coconut. Oil palm was first
established in Sabah in 1961 with a mere 2,000 ha, but rose to 40,000 ha in 1970, 100,000 ha in 1980,
281,000 ha in 1990, 630,000 ha in 1995, and 980,000 ha in 2000 (Figure 3; State Government of Sabah,
200818
). As of 2009, a total of 1,330,364 ha, or 90% of developed agriculture land, was covered by oil
palm (Table 2). With the price of crude palm oil rising recently to a record high, oil palm plantations in
Sabah will no doubt continue to expand.
24. Other agricultural crops include rubber, paddy, cocoa and coconut. Rubber was the golden crop of
Malaysia in the 1960s and 1970s. Total land area cultivated with rubber for the period 1964-1983 was
105,000 ha. This figure dropped to 85,000-88,000 ha between 1984 and 2001 due to a shift to oil palm.
Area opened for rubber continued to show a decline in the last seven years (2003-2008), and is now
estimated at 75,082 ha. Total area of cocoa cultivation was 4,000 ha in 1970 rising to 60,000 ha in 1980.
Planting expanded further reaching 205,000 ha in 1990. As with the rubber situation, cocoa plantations
shrank, reaching only 21,000 ha in 2004. The rapid expansion and decline in cocoa cultivation was
fuelled by fluctuating cocoa prices. Currently, cocoa plantations cover only 8,399 ha, a figure which is
expected to remain relatively stable for the near future. Land area planted with coconut in Sabah was
substantial in 1963 at 40,000 ha increasing to 61,000 ha in 1972. Coconut is cultivated mainly for copra
as an export commodity, but market demand is not high. Total coconut plantation in 2003 was 20,836 ha
and registered a steady decline to 18.875 ha by 2009 (Table 2). Paddy occupies about 38,936 ha in 2009.
14 Most statelands are covered by forest prior to their conversion to oil palm. 15 NAP policy aims to set in place the enabling environment and supportive measures to promote growth in the agricultural sector. 16
State Government of Sabah, 2008. Sabah Land Utilization Policy Study: Interim Report. 17 Government of Sabah. 1998. Sabah coastal zone profile 1988. 18 State Government of Sabah, 2008. Sabah Land Utilization Policy Study: Interim Report.

Revised: 14 March, 2012
7
Table 2. Landuses classification and trend in Sabah (2003-2009)
2003 %Tot %sTot 2004 %Tot %STot 2005 %Tot %STot 2006 %Tot %STot 2007 %Tot %STot 2008 %Tot %STot 2009 %Tot %STot
1. Stateland* 3,378,751 45.8% 3,378,751 45.8% 3,495,052 46.7% 3,494,354 46.7% 3,484,697 46.5% 3,484,697 46.5% 3,484,697 46.5%
1.1 Agiculture 1,227,996 16.7% 36.3% 1,280,928 17.4% 37.9% 1,369,823 18.3% 39.2% 1,384,902 18.5% 39.6% 1,449,506 19.4% 41.6% 1,471,656 19.7% 42.2% 1,471,656 19.7% 42.2%
Wet Paddy 36,346 0.5% 1.1% 36,003 0.5% 1.1% 35,822 0.5% 1.0% 34,104 0.5% 1.0% 32,866 0.4% 0.9% 33,746 0.5% 1.0% 33,746 0.5% 1.0%
Dry Paddy 4,869 0.1% 0.1% 4,819 0.1% 0.1% 3,809 0.1% 0.1% 5,467 0.1% 0.2% 3,468 0.0% 0.1% 5,190 0.1% 0.1% 5,190 0.1% 0.1%
Rubber 63,887 0.9% 1.9% 64,593 0.9% 1.9% 66,367 0.9% 1.9% 70,367 0.9% 2.0% 73,293 1.0% 2.1% 75,082 1.0% 2.2% 75,082 1.0% 2.2%
Cocoa 25,287 0.3% 0.7% 21,020 0.3% 0.6% 14,440 0.2% 0.4% 11,446 0.2% 0.3% 9,691 0.1% 0.3% 8,399 0.1% 0.2% 8,399 0.1% 0.2%
Coconut 20,836 0.3% 0.6% 21,084 0.3% 0.6% 20,975 0.3% 0.6% 18,727 0.3% 0.5% 18,673 0.2% 0.5% 18,875 0.3% 0.5% 18,875 0.3% 0.5%
Oil Palm 1,076,771 14.6% 31.9% 1,133,409 15.4% 33.5% 1,228,410 16.4% 35.1% 1,244,791 16.6% 35.6% 1,311,515 17.5% 37.6% 1,330,364 17.8% 38.2% 1,330,364 17.8% 38.2%
1.2 Others** 2,150,755 29.2% 63.7% 2,097,823 28.5% 62.1% 2,125,229 28.4% 60.8% 2,109,452 28.2% 60.4% 2,035,191 27.2% 58.4% 2,013,041 26.9% 57.8% 2,013,041 26.9% 57.8%
2. Forest Reserves 3,594,516 48.8% 3,594,516 48.8% 3,594,512 48.0% 3,595,210 48.0% 3,604,867 48.1% 3,604,867 48.1% 3,604,867 48.1%
Class 1: Protection 342,150 4.6% 9.5% 342,150 4.6% 9.5% 342,150 4.6% 9.5% 342,848 4.6% 9.5% 348,016 4.6% 9.7% 364,766 4.9% 10.1% 364,766 4.9% 10.1%
Class 2: Commercial 2,683,480 36.4% 74.7% 2,683,480 36.4% 74.7% 2,683,480 35.8% 74.7% 2,683,480 35.8% 74.6% 2,682,636 35.8% 74.4% 2,665,886 35.6% 74.0% 2,665,886 35.6% 74.0%
Class 3: Domestic 7,355 0.1% 0.2% 7,355 0.1% 0.2% 7,355 0.1% 0.2% 7,355 0.1% 0.2% 7,355 0.1% 0.2% 7,355 0.1% 0.2% 7,355 0.1% 0.2%
Class 4: Amenity 20,940 0.3% 0.6% 20,940 0.3% 0.6% 21,086 0.3% 0.6% 21,086 0.3% 0.6% 21,284 0.3% 0.6% 21,284 0.3% 0.6% 21,284 0.3% 0.6%
Class 5: Mangrove 316,024 4.3% 8.8% 316,024 4.3% 8.8% 315,874 4.2% 8.8% 315,874 4.2% 8.8% 320,522 4.3% 8.9% 320,522 4.3% 8.9% 320,522 4.3% 8.9%
Class 6: VJR 91,914 1.2% 2.6% 91,914 1.2% 2.6% 91,914 1.2% 2.6% 91,914 1.2% 2.6% 92,401 1.2% 2.6% 92,401 1.2% 2.6% 92,401 1.2% 2.6%
Class 7: Wildlife 132,653 1.8% 3.7% 132,653 1.8% 3.7% 132,653 1.8% 3.7% 132,653 1.8% 3.7% 132,653 1.8% 3.7% 132,653 1.8% 3.7% 132,653 1.8% 3.7%
3. Wildlife Sanctuary 152,828 2.1% 100% 152,828 2.1% 100% 152,828 2.0% 100% 152,828 2.0% 100% 152,828 2.0% 100% 152,828 2.0% 100% 152,828 2.0% 100%
4. National Parks 245,172 3.3% 100% 245,172 3.3% 100% 245,172 3.3% 100% 245,172 3.3% 100% 245,172 3.3% 100% 245,172 3.3% 100% 245,172 3.3% 100%
TOTAL SABAH 7,371,267 7,371,267 7,487,564 7,487,564 7,487,564 7,487,564 7,487,564
* Sum of 1.1 and 1.2
** Includes water bodies and land under State Control
YEAR

Revised: 14 March, 2012
8
Figure 3. Trend in oil palm plantation development in Sabah (1980-2008).
0
200000
400000
600000
800000
1000000
1200000
1400000
19
61
1
97
0
19
75
1
97
6
19
77
1
97
8
19
79
1
98
0
19
81
1
98
2
19
83
1
98
4
19
85
1
98
6
19
87
1
98
8
19
89
1
99
0
19
91
1
99
2
19
93
1
99
4
19
95
1
99
6
19
97
1
99
8
19
99
2
00
0
20
01
2
00
2
20
03
2
00
4
20
05
2
00
6
20
07
2
00
8

Revised: 14 March, 2012
9
25. Of these, 90% are wet paddy located within the major flood plains along the west coast of Sabah. Wet
paddy expansion into the interior of Sabah is restricted by poor irrigation. Hence, hill paddy has been
promoted in rural interiors at household scale. Other crops include tea, coffee, ginger and vegetables.
These crops are cultivated in small scales, each covering less than 2,000 ha.
26. The physical expansion of agricultural land in Sabah corresponds with rapid increases in earnings from
cultivated crops. Among them, oil palm has consistently commanded top export earnings over the last
five decades. In 2009, oil palm earned RM13.8 billion, representing 34% of the state GDP of RM37.2
billion for the main agricultural crops, followed by rubber at RM367 million (1%), and cocoa at RM29
million (0.1%) (Table 3). From 1970-1995, the production and export of crude palm oil (CPO) rose
from 28,197 tonnes to 673,858 tonnes. By 2009, Sabah recorded a crude palm oil production of 5.72
million tonnes. Export earnings have also risen: RM8.2 billion in 2005; RM9.1 billion in 2006; RM14.3
billion in 2007; RM19.0 billion in 2008 and RM13.8 billion in 2009.
27. Besides GDP earning, the agriculture sector has contributed substantially to Sabah’s socio-economic
development, particularly in terms of employment creation. In 2009, the agriculture and forestry sector
employed 365,300 people representing 29% of all employed persons in Sabah (Department of Statistics
Malaysia, 200919
). Assuming that 60% of the remaining 730,000 ha of undeveloped agriculture land
were cultivated with oil palm, this would generate 55,000 new agricultural jobs on the basis that each
1,000 ha requires approximately 125 workers. Large-scale employment in the sector also creates
business spin-offs in the building, materials and food supply chain, benefitting municipal and local
industries.
28. The agriculture sector has been identified as one of 12 National Key Economic Areas (NKEA) for the
Nation under the 10th Malaysia Plan and will continue to expand. This means that oil palm plantations
20
are expected to expand heavily into the remaining 730,000 ha of Stateland. The continuing conversion of
Stateland to oil palm will further reduce forest cover, and increase forest fragmentation. The impacts of
habitat loss and fragmentation on biodiversity will be heightened by the extremely limited value of oil
palm for wildlife in terms of offering connectivity among increasingly fragmented forest areas. Thus, as
conversions within Stateland proceed, Forest Reserves will need to bear an increasing responsibility for
maintaining connectivity between remaining natural habitats, including protected areas.
29. While there has so far not been any agricultural conversion occurring within the project landscape itself,
a significant oil palm development is taking place in an area located to the immediate southeast and
bordering the project area.
Forestry, forest products and values associated with standing forests
30. In contrast to the agriculture sector, Sabah’s forest lands provide a broader range of values, including
both use and non-use values. Unfortunately, not all of these values are easily monetized.
31. Forest Reserves occupy 3.60 million ha or 48% of the total area of Sabah (Table 2). There are seven
classes of forest reserves (see Table 2 for area by class breakdowns), as follows:
Protected forest reserves (Class I) are for maintenance of ecosystem services and functions (e.g.
climate and hydrological regulation);
Commercial forest reserves (Class II) are the most extensive by area totaling 2.67 million ha, where
the bulk of which is for timber production;
Domestic forest reserves (Class III) are for local people to gather firewood and building materials
collections only for subsistence living;
Amenity forest reserves (Class IV) are for recreation purposes within local districts;
Mangrove forest reserves (Class V) are for the protection of the mangrove ecosystem as a source of
food (fish, prawns and crabs) for local communities;
19
Department of Statistics, Malaysia. 2011. Labour Force Survey Time Series Data 2001-2009. 20
The oil palm sector is currently the number one agriculture sub-sector in Malaysia, and is Malaysia’s fourth most important overall sector in terms of
income.

Revised: 14 March, 2012
10
Table 3. Export of major commodities from Sabah (2005-2009)
(a) By production (tonnes)
(a) By export value (RM)
YearTotal Export
(tonnes)Palm Oil (tonnes) %Tot
Palm Kernal Oil
(tonne)Rubber (tonne)
Cocoa Beans
(tonne)
2005 5,607,450,000 5,010,158,000 89.3% 512,673,000 74,164,000 10,455,000
2006 6,026,148,000 5,410,658,000 89.8% 535,319,000 71,579,000 8,592,000
2007 6,122,175,000 5,501,864,000 89.9% 547,212,000 64,407,000 8,692,000
2008 6,364,875,000 5,731,802,000 90.1% 568,776,000 61,168,000 3,129,000
2009 6,326,583,000 5,723,510,000 90.5% 536,160,000 63,494,000 3,419,000
1.0%
8.9%
8.9%
0.05%
0.05%
8.9%
8.5% 1.0%
%Tot
0.19%
0.14%
0.14%
%Tot
9.1%
%Tot
1.3%
1.2%
1.1%
YearTotal Export Sabah
(RM)Total (RM) %Sabah Palm Oil (RM)
%To
t%Sabah
Palm Kernal Oil
(RM)
%To
t%Sabah Rubber (RM) %Tot %Sabah
Cocoa Beans
(RM)%Tot %Sabah
2005 23,883,246,000 8,527,899,000 36% 7,052,417,000 83% 30% 1,135,131,000 13% 5% 283,396,000 3% 1.2% 56,955,000 1% 0.2%
2006 27,002,478,000 9,629,133,000 36% 8,060,566,000 84% 30% 1,035,850,000 11% 4% 489,050,000 5% 1.8% 43,667,000 0% 0.2%
2007 33,603,884,000 14,789,964,000 44% 12,784,959,000 86% 38% 1,503,376,000 10% 4% 453,635,000 3% 1.3% 47,994,000 0% 0.1%
2008 48,146,184,000 19,553,755,000 41% 16,976,598,000 87% 35% 2,028,709,000 10% 4% 525,157,000 3% 1.1% 23,291,000 0% 0.0%
2009 37,178,141,000 14,208,610,000 38% 12,576,569,000 89% 34% 1,235,952,000 9% 3% 366,927,000 3% 1.0% 29,162,000 0% 0.1%

Revised: 14 March, 2012
11
Virgin Jungle Reserves (Class VI) are primary forest that has been set aside for scientific research
and educational purposes;
Wildlife reserves (Class VII) are conserved as wildlife sanctuaries.
32. A significant portion of the use values comes from the Class II Commercial forest reserves, which are
equivalent to 74% of total forest reserve area and some 36% of Sabah’s overall land area. The most
important use value is, unsurprisingly, timber. In 2009, total timber export earnings were RM2.7 billion,
representing 7% of Sabah’s total export earnings of RM37.2 billion (Table 4). Plywood commands the
highest earnings, with 49% of total export earnings, followed by sawn timber (26%), sawlogs (10%),
timber mouldings (6%), veneer (5%), and laminated wood (4%). Timber export earnings in 2009
registered a drop against previous years.
33. In volume terms, timber export earnings corresponded to a total production of 1.2 million m3 in 2009,
with plywood representing 81% of the total wood output, veneer (7%), laminated wood (7%) and
wooden mouldings (5%). Total timber production from planted forests was 4.72 million m3 valued at
RM22.5 million. Annual timber production for the period 2005-2009 has been on a declining trend,
which is likely to continue into the future, yet it will continue to contribute significantly to Sabah’s
economy.
A significant portion of timber is processed locally. Currently, there are 122 sawmills, 38 veneer /
plywood processing plants, 70 particle board mills, 2 paper mills, 1 chip mill, 2 wood preservative
plants, 12 kiln dried plants, and 44 kiln dried plants. These forestry industries employ a total of 43,432
people. Additional economic spin-offs from these are business opportunities in the food and material
supply chain, medical and tourism benefits.
34. Non-wood forest products (NWFPs) are a second significant use value associated with forested lands,
and are an important source of income for rural communities in Sabah. The most significant NWFP is
rattan. Seven of the world’s 13 genera of rattan, comprising some 50 species, are found in the natural
forests of Sabah. The most important genera of commercial value are Calamus, Kortalsia, Daemonorops
and Plectocomia (Dransfield, 198421
). Rattan has multiple uses, including for making furniture parts, fish
traps, baskets, mats, hats and walking sticks (Dransfield and Manokaran, 199322
). In 1987, Sabah
exported 6,340 tonnes of rattan worth RM22 million. By 2008, however, the production of rattan from
natural forests had been dramatically reduced to 141 tonnes—a collapse associated with the reduction in
primary forests. Nevertheless, rattan continues to play an important role in the livelihood of local
communities.
35. Medicinal plants remain an important category of NWFPs for Sabah’s population. In a survey of 22
village households living adjacent to the Crocker Range along the west coast of Sabah, 21 of the
households collected and used wild medicinal plants for healthcare needs (Anderson et al., 200323
). A
total of 110 specimens representing 40 families were identified, most of which come from secondary
forests. Another study on the traditional use of medicinal plants in Lower Segama reported that the
Tidong communities collected medicinal plants from forests that include sambung (Blumea balsamifera),
tongkat Ali (Eurycoma longifolia), daun ular (Cratoxylum sp.), lampuyang (Zingeber sp.), asuk-asuk,
kacip Fatimah, lampunis, imbakawan, kengei and lasing to treat gastritis, stomach ache, light injury,
snakebite, fever, headache, and hypertension (Poukin et al., 200624
). The value of these medicinal plants
has not been estimated, but the world trade in raw materials for botanical medicines, vitamins and
minerals was estimated at US$8 billion, and most of these come from tropical forests (Ten Kate and
Laird, 199925
).
21 Dransfield, J. 1984. The rattans of Sabah. Forest Record no. 13. Sabah Forestry Department, Malaysia. 182 pp. 22 Dransfield, J.and Manokaran, N. 1993. Ratans. Plant resources of Southeast Asia. Wageningen. 137 pp. 23 Andersen, J., Nilsson, C., de Richelieu, T., Fridriksdottir, H., Gobilick, J., Mertz, O. and Gausset, Q. 2003. Local use of forest products in
Kuyongon, Sabah, Malaysia. ASEAN Review of Biodiversity and Environmental Conservation. 24 Poukin, E., Maryati, M., Sofian Abu Bakar and Intan Azirah Abdul Rahman. 2006. Traditional use of medicinal plants among the Tidong
Communities in Lower Segama. In Maryati, M., Bernard, H., Sofian Abu Bakar, Matsunaga, R. (eds.): Lower Segama Scientific Expedition.
Universiti Malaysia Sabah. 25 Ten Kate, K. and Laird, S.A. 1999. Commercial use of Biodiversity: Access to genetic resources and benefit sharing. Earthscan Publication Ltd.

Revised: 14 March, 2012
12
Table 4. Export of timber products from Sabah (2005-2009)
(a) By volume (m3)
(b) By value (RM)
YearTotal Timber
Export (m3)
Sawlogs (m3) %Tot
Sawntimber
(m3)Veneer (m3) Plywood (m3)
Laminated Wood
(m3)
Wooden
Mouldings (m3)
2005 1,664,214,000 1,205,000 0.07% 647,000 125,713,000 1,389,651,000 108,973,000 38,025,000
2006 1,590,008,000 903,000 0.06% 603,000 94,703,000 1,348,334,000 101,023,000 44,442,000
2007 1,653,689,000 950,000 0.06% 603,000 98,237,000 1,383,171,000 106,724,000 64,004,000
2008 1,359,934,000 596,000 0.04% 531,000 98,351,000 1,123,510,000 93,430,000 43,516,000
2009 1,214,525,000 485,000 0.04% 455,000 97,787,000 991,268,000 68,761,000 55,769,000 0.0%
%Tot
0.0%
0.0%
0.0%
0.0%
81.6%
%Tot
7.6%
6.0%
5.9%
7.2%
8.1%
%Tot
83.5%
84.8%
83.6%
82.6%
4.6%
%Tot
6.5%
6.4%
6.5%
6.9%
5.7%
%Tot
2.8%
3.9%
2.3%
3.2%
YearTotal Export
Sabah (RM)
Total Timber
Export (RM)
%Saba
h
Sawlogs
(RM)%Tot %Sabah
Sawntimber
(RM)%Tot %Sabah Veneer (RM) %Tot %Sabah Plywood (RM) %Tot %Sabah
Laminated Wood
(RM)%Tot %Sabah
Wooden
Mouldings (RM)
%To
t%Sabah
2005 23,883,246,000 3,435,743,000 14% 591,810,000 17% 2% 822,497,000 24% 3% 145,643,000 4% 1% 1,661,703,000 48% 7% 132,378,000 4% 1% 81,712,000 2% 0%
2006 27,002,478,000 3,585,815,000 13% 457,056,000 13% 2% 870,277,000 24% 3% 126,215,000 4% 0% 1,898,147,000 53% 7% 129,927,000 4% 0% 104,193,000 3% 0%
2007 33,603,884,000 3,745,914,000 11% 454,604,000 12% 1% 938,051,000 25% 3% 133,904,000 4% 0% 1,903,437,000 51% 6% 134,478,000 4% 0% 181,440,000 5% 1%
2008 48,146,184,000 3,132,800,000 7% 345,863,000 11% 1% 853,399,000 27% 2% 131,673,000 4% 0% 1,544,654,000 49% 3% 128,182,000 4% 0% 129,029,000 4% 0%
2009 37,178,141,000 2,701,219,000 7% 262,580,000 10% 1% 715,747,000 26% 2% 132,122,000 5% 0% 1,311,382,000 49% 4% 106,385,000 4% 0% 173,003,000 6% 0%

Revised: 14 March, 2012
13
36. Other NWFPs in demand includes a highly priced resin extracted from gaharu wood (Aquilaria
malaccensis), which is used for making essential oils. Lower grades of essential oil from this species
fetch between US$19 and US$9,589/kg (Chakrabarty et al., 199426
). More expensive grades can sell for
up to US$27,400/kg. Gaharu contributed between RM222 and RM338 or 33-38% of the total income of
those rural households being surveyed in Malaysia (Lim et al., 200727
). The extremely high price paid for
gaharu had motivated indiscriminate felling of the tree in protected areas such as the Maliau Basin
Conservation area; as a result, the tree is facing extinction in Sabah. Hence, extraction of this species has
been prohibited under the Sabah Forest Enactment (1968) since 1994, and its trade is also banned under
the Convention in International Trade in Endangered Species (CITES).
37. Forest lands also provide a potentially sustainable source of wildlife products. A number of these species
are hunted for game, as well as for their meat, skins, hides, medicinal value and for use as decorative
items. The estimated total revenue from wildlife products in 1988 amounted to about RM 6 million
(Sabah Statistics Department, 198828
). However, this figure represents only a small fraction of the total
value of wildlife consumptive use, as wildlife is rarely sold in markets, but typically consumed as
household food (Stuebing et al., 199329
) or traded illegally. The illegal wildlife trade includes live pets,
hunting trophies, fashion accessories, cultural artifacts, ingredients for traditional medicine and wild
meat (The Star Online, 201030
). For example, sun bears are sought after as pets priced at US$15-240 per
animal, for medicine at US$10-55 per gall bladder and as decorative trophies at US$250 per paw
(Meijaard, 199931
).
38. In the category of non-use values, the forests of Sabah also provide vital ecological services, such as
water supply, flood control, carbon sequestration and climate regulation. There are 19 river basins in
Sabah, most of which are located in the upland regions in the interior of Sabah. These water catchments
contain pristine forests that are important in regulating the hydrological cycle. The Kinabatangan river
basin on the East Coast is the largest, covering an area of 15,385 km2, followed by the Padas river basin
on the west coast which covers an area of 8,726 km2. There are 13 main rivers in these 19 river basins. At
560 km in length, the Kinabatangan River draining much of the eastern region of Sabah is the longest in
Sabah, and the second longest river in Malaysia. The Kinabatangan basin was identified by a 2011 study
commissioned by WWF as one of two river basins in Sabah where pilot studies should be undertaken to
test the business case for implementing payment for watershed services32
. On the west coast, the Padas
river is being utilized for hydro-electricity generation and provides approximately 340,000 MWh or 30%
of Sabah’s total electricity requirements. More than 90% of the water from these river basins is utilized
for residential, industrial and irrigation in the agriculture sector (Government of Sabah, 199833
). Many
Malaysian rivers also have high recreation value. For example, the upper Padas river and Kiulus river are
popular for white water rafting. Traditionally, most rivers in Sabah are utilized by rural riverine
populations for daily consumptive uses, and as means of travelling.
39. The State has yet to capitalize on the various goods and services provided through payment for
ecosystem services (PES) mechanisms. For example, a study commissioned by the Sabah Forestry
Department in 2009 estimated that the 3.6 million ha forest reserves holds ca. 566 million tonnes of
carbon with a potential value of US$2.8 billion (valued at US$5/tonne of CO2). Sabah has pioneered two
carbon offset projects on a bilateral arrangement. It has been estimated that primary forests in the east
coast of Sabah within the Ulu Segama Forest Reserve hold a carbon stock of ca. 400 Mg C/ha, which
was reduced by half to 200 Mg C/ha following timber harvesting (Tay, 199934
). Studies by Kitayama et
al. (201035
) for Deramakot Forest Reserve in Sabah reported similar values for logged forests of between
126 and 162 Mg C/ha. Applying a conservative price for carbon at USD10/Mg CO2 or USD36.7/Mg C,
26 Chakrabarty K, Kumar A & Menon V (1994), Trade in Agarwood. Traffic India and WWF-India, New Delhi. 27 Lim, H.F., Parid, M.M. & Chang, Y.S. 2007. The contribution of gaharu to harvesting to household economy. MOSTI project no. 04-03-10-SF0020. 28 Sabah Statistic Department, 1988. Year book of statistics Sabah 1988. 29 Stuebing, R.B., Gasis, J. and Lee, B.H. 1993. Economic exploitation of wildlife in Sabah: an ecological perspective. Sabah Museum Journal 1:73-87 30 The Star Online, 2010. Illegal wildlife trade is still rife in Sabah. 15 December 2010. 31 Meijaard, E. 1999. Human imposed threats to sun bear in Borneo. Urus. 11: 185-192. 32Witteveen Bos Indonesia, 2011. Quick Scan watershed services, Heart of Borneo, Report to WWF. 33 Government of Sabah. 1998. Sabah coastal zone profile 1988. 34 Tay, J. 1999. Economics of reduced impact logging in Sabah, Malaysia. PhD. Thesis. University of North Wales, Bangor, UK. 35 Kitayama, K., Imai, N., Titin, J., Ong, R., Chung, A. and Lee, Y.F. 2010. Options to maximize the benefits of REDD+ in Sabah: Suggestions based
on a case study in Deramakot.

Revised: 14 March, 2012
14
the carbon value per hectare for primary and secondary forests would be USD14,680 and USD4,624,
respectively.
Tourism
40. Tourism is envisaged to be a key economic driver for the services sector in Sabah being the third highest
contributor to the state’s economy after agriculture and manufacturing. It contributed 7.4% of Sabah’s
GDP in the 8th Malaysia Plan and 10% in the 9
th Malaysia Plan. Growth in Sabah’s ecotourism sector is
evidenced in the visitors’ statistics and receipts. In 2005, Sabah recorded arrivals of 1.29 million, which
had doubled to 2.50 million by 2010 registering a compounded growth rate of 10% per annum. Sabah
tourism also recorded strong growth in tourism receipts with an annual compounded growth rate of
27.4% over the last five years36
. Per capita international tourist spending of RM2,517 is also higher than
the national average of RM2,067; its compounded annual growth rate is three times the growth rate
recorded by Malaysia –5.05% vs. 1.60%. Tourism receipts are projected to increase to RM8 billion in
2012 and RM48.5 billion by 2025.
41. Sabah’s tourism strength lies mainly in its nature attractions, underpinned by many nature and wildlife
conservation areas and parks. A survey undertaken in 1994 reported that 69% of that year’s 450,120
visitors were attracted to Sabah’s nature, flora and wildlife37
. Major nature destinations include the
UNESCO World Heritage Mount Kinabalu Park, Sepilok Orang-utan Rehabilitation Centre, Lower
Kinabatangan / Sukau Wetlands, Tabin Wildlife Sanctuary, Gomatong Cave, Maliau Basin, Danum
Valley, Tawau Hills Park, and Poring Hot Spring. Sabah is also endowed with many islands off its coast
which include the Tunku Abdul Rahman Marine Park, Sapi Island, Manukan Island, Mamutik Island,
Pulau Tiga, and Selingan Turtle Island.
42. Hence, the focus of Sabah’s tourism strategy under the 10th Malaysia Plan will be to strengthen eco-
tourism development38
. In moving forward, the existing network of protected areas will be enhanced and
new nature sites will be developed to showcase the biodiversity of Sabah’s rainforests, marine and fresh
water habitats, and their associated flora and fauna. These developments will be guided by careful
planning and management consistent with the Sabah Tourism Development Policy.
Forestry, agriculture and other land uses in and around the project landscape
43. The project landscape covers 261,264 ha and represents 25% of the overall area managed by Yayasan
Sabah. The broader Yayasan Sabah Conservation Area (YSCA) consists of 1,007,073 ha, 77% or
778,083 ha. of which are Class II Commercial forest reserves that have been logged from the early 1970s
except areas allocated for water catchment, water falls and rafflesia reserves. Of these 778,083 ha, 39%
or 396,696 ha, are under natural forest management (NFM) where timber harvesting remains active in
some parts. Another 32% or 322,873 ha have been locked-up under collaborative arrangements with
third parties involving enrichment planting, research and recreation. Total area set aside under strict
protection represents 17% or 168,087 ha of the YSCA. Areas thus far earmarked for tree and rubber
plantations occupy 5% or 48,697 ha of the YSCA. Another 11% or 109,600 ha is being developed into
oil palm plantation under a separate licence and subsidiary company (Benta Wawasan Sdn. Bhd.) under
YS management.
44. The present landuses within the project landscape itself are as follows (see also Figure 4 below):
a) 180,426 ha (69% of the Project landscape) of Class II Commercial forest reserves designated as
natural forest management (NFM) area. This area is a contiguous block running in a northeast-
southwest orientation in the west of the project landscape. The northern half of this area falls within
Forest Management Unit 23 (FMU23) and the southern half in FMU24; both FMUs fall within the
Gunung Rara Forest Reserve. This forest reserve shares a common boundary with the Maliau Basin
Conservation Area to the West, and the Imbak Canyon Conservation Area to the North.
36 Institute for Development Studies, 2007. Sabah Development Corridor Socio-Economic Blueprint. 37
Government of Sabah, 1998. Sabah Coastal Zone Profile. 38 Keynote address by YB Datuk Masidi Anjun, the Minister of Tourism, Culture and Environment, Sabah. http://www.itc.gov.my/media/

Revised: 14 March, 2012
15
Figure
4:
Landuses within and adjacent to project landscape

Revised: 14 March, 2012
16
b) 43,821 ha (16%) of Industrial Tree Plantation (ITP) located in the south-eastern part of the project
landscape. Most of this area is within FMU26 of the Kalabakan Forest Reserve and is being planted
with rubber and acacia.
c) 18,500 ha (6%) of degraded forests that are in the process of being planted with indigenous tree
species by enrichment planting. The area is located in a contiguous block in the lower eastern part of
the project landscape within FMU26 of the Kalabakan Forest Reserve;
d) 18,517 ha (6%) under various forms of conservation for Water Catchment (5,530 ha), Virgin Jungle
Reserves (2,656 ha), long-term research plots (SUAS: 3,300 ha; RIL: 2,665 ha), Wildlife Corridors
(INIKEA-Luasong: 4,632 ha; SUAS-Maliau: 1,000 ha) and Salt Lick (2,149 ha).
45. Major land uses adjacent to the project landscape, but within the broader YSCA are as follows;
a) 132,640 ha of Class I Protection Forest Reserves in three separate blocks i.e., the Maliau Basin
Conservation Area (58,840 ha) to the West, the Danum Valley Conservation Area (43,800 ha) in the
East and the Imbak Canyon Conservation Area (16,750 ha) in the North. These areas contain some of
the largest and most globally significant biodiversity in Southeast Asia.
b) 109,500 ha of logged-over forests 80% of which has been developed into oil palm plantation. The
plantation is separated into two blocks; the larger block, known as Benta I contains 79,400 ha and has
a common boundary with the project landscape on the east. A smaller block, Benta II, is located
adjacent to the southern part of the project landscape and covers 30,200 ha.
46. The present land uses within the project landscape reflect an emerging multiple-use trend within Sabah’s
forest reserves. The motivation to replace natural forests with fast growing plantations is based on the
more rapid return on investment associated with latter’s comparatively short gestation period. Exotic tree
species such as acacia, gmelina or eucalyptus takes 10-15 years to mature for sawlog, while indigenous
tree species can take up to 60 years to mature. Rubber grown for latex is tappable in 6 years and annually
thereafter until age 25, at which point the tree can be harvested for its timber
47. Within the project landscape, a production forest contractor may be allocated one or more coupes
ranging from 2,000 to 5,000 ha. The maximum tenure of these contracts is 5-years, but they are
renewable on a case-by-case basis. There are presently seven coupes active within the project
landscape’s NFM area. Of these, three are expiring in 2011, one in 2013 and two in 2014. These coupes
range from 830 to 7,699 ha.
48. The economic value of the provisioning and regulating services provided by the target landscape is
summarized in Table 5. It should be noted that often the valuation of ecosystem services, especially

Revised: 14 March, 2012
17
Table 5. Summary of information available to inform valuation of ecosystem service
Type of Ecosystem
Service
Economic benefit /
outcome Economic Valuation
Pro
vis
ion
ing
Ser
vic
es
Timber Timber Timber (NFM): RM5,412/ha (gross) at sales value of
RM164/m3 and harvestable volume of 33m
3/ha. Sales
volume for 2010 at 1,968,253 m3 corresponding to sales
value of RM322,236,193. Harvestable volume based on
CHP for YT2/08 at 32.67 m3/ha.
Rubber: Financial analysis - NPV of RM24,506.678 and an
IRR of 11% (22 year project period). This equates to RM
3,930 per ha NPV over 22 years and is based on rubber
production (from year 10) and wood in year 16). See
Nicohandal SDN. BHD (undated).
Acacia: RM 21,036/ha (US$6,857) (8 year rotation, rough,
undiscounted estimate of net financial returns at year 8)
NTFPs Fuelwood,
construction
products, food,
medicines
No quantitative information on the collection of NTFPs
Genetics Variety in the forest
flora and fauna gene
pool
Service first needs to be defined quantitatively
Ornamental
resources
Ornamental
resources
Service first needs to be defined quantitatively
Reg
ula
tin
g S
erv
ices
Regulation of
GHGs
Carbon sequestration No site specific data. Estimates from Sabah:
Primary forests: US$14,680/ha/year
Secondary forests:US$4,624/ha/year
Micro-climate
regulation
May effect rainfall &
moderate local
temperature extremes
This service needs to be defined and quantified for the
target landscape before valuation is possible (bio-physical
data required)
Water
regulation
Flood protection As above
Water quality
maintenance (for
drinking water,
fisheries,
hydropower)
As above
Erosion
control
Sediment retention
(can benefit
reservoirs and
treatment plants)
As above
Educational Education Education service needs to be defined. Could be partly
based on research expenditures
Recreation
and
ecotourism
Recreational hunting,
birdwatching, hiking,
ecotourism
Tourism plan needs to be developed including carrying
capacity and proposed fees and charges
Biodiversity
non-use
Non-use value Flora and Fauna needs to be quantified and determined to
what extent it is of regional / global significance

Revised: 14 March, 2012
18
regulating services, is not possible due to missing bio-physical data. Unsurprisingly, timber commands
the highest gross net present value of RM30,378/ha among the provisioning services. The NPV for
timber from natural forest is estimated at RM5,412/ha at a harvestable volume of 33m3/ha valued at
RM164/m3. Acacia is planted for sawlog on an 8-year rotation yielding an NPV of RM21,036/ha
(undiscounted). Rubber is grown for latex and wood over a gestation of 22 years with an NPV of
RM3,930/ha. Carbon value in primary forest was estimated at RM51,380/ha/yr (US$14,680 at exchange
rate of US$1=RM3.50), while for secondary forest at RM16,184/ha/yr (US$4,624/ha/yr).
PROTECTED AREA SYSTEMS CONTEXT
49. Many of the key environmental values described in the forgoing section—in particular those related to
water, carbon and biodiversity values—can be conserved through Sabah’s protected area systems. The
following description is confined to the terrestrial protected sub-system of relevance to this project.
50. Terrestrial Protected Areas (PA) in Sabah have their origins in the 1950s, and currently cover some 1.36
million ha., or 18.6% of Sabah’s total land mass of (see Table 6). Protected areas in Sabah are
established by a legislative process initiated by the respective government/statutory bodies through
powers conferred under their respective enactments. There are three governmental bodies having such
authority: Sabah Parks, the Sabah Wildlife Department and the Forest Department. These are described
in turn below.
51. According to the Sabah Parks Enactment 1984, Sabah Parks is responsible for constituting,
administering, and financing all State Parks and Reserves in Sabah. To date, Sabah Parks has established
a total of 243,216 ha of protected areas at various locations in Sabah for education, research and
recreational use. The primary uses in the State Parks are recreation, education and research.
52. Wildlife conservation in Sabah is under the jurisdiction of the Sabah Wildlife Department, whose
enactment (Wildlife Conservation Enactment 1997) provides for three types of protected areas. These
are: (i) Conservation Areas, designed for fast and flexible protection of wildlife and habitats; (ii) Wildlife
Sanctuaries, the strongest conservation category for fauna, flora, genetic resources and habitats, and (iii)
Wildlife Hunting Areas intended for animal population management by regulated hunting (Sabah
Wildlife Department, 201039
). Currently, a number of nature areas have been gazetted under the
provisions totaling 162,636 ha.
53. Under the Forest Enactment (1968), the Forest Department is responsible for seven classes of forest
reserves40
(Table 6). Four of these (see Table 6 below) are strict protection areas with no destructive
activities allowed within them. The first of these is the Class I Protected Forests, which are under strict
protection for education, research and recreation purposes. These include Danum Valley (43,800 ha),
Maliau Basin (58,840 ha) and Imbak Canyon (30,000 ha) Conservation Areas (all of which either border,
or are near to, the project landscape and are within the YSCA). These conservation areas received further
legislative protection under the State Natural Heritage Law. The three remaining forest reserve classes
subject to strict protection are: (i) Class V, which consists of mangrove areas protected as breeding areas
for aquatic and fauna habitat; (ii) Class VI Virgin Jungle Reserves (VJRs), which are small (<1,000 ha.),
fragmented nature reserves that were left unlogged due to their location in steep, rocky and otherwise
inaccessible terrain and that are now used for education, research and recreation. The present
management provision in most VJRs is in the form of protecting them from encroachment. (iii) Class VII,
protected areas for wildlife conservation. Altogether, 56 reserves covering 910,342 ha. are classified
within these four strict protection reserve classes.
54. As noted above, the area immediately surrounding the project landscape includes several of the key
protected areas in Sabah. The Maliau Basin Conservation Area - known to many as Sabah’s lost world - is
isolated from other areas due to its rugged topography. Its unique geomorphic processes are exemplified
by the steep escarpment rising to 1,700 m to the rim of a basin from within Maliau. Scientists believe that
39 Sabah Wildlife Department, 2010. Protected areas in Sabah. http://www.wildlife.sabah.gov.my/WildlifeEcotourism.htm 40 See para. 30 above for descriptions of each of these classes.

Revised: 14 March, 2012
19
Table 6. Protected areas in Sabah
Management
authority
PA type Protected Areas (PAs) Area (Ha):
Terrestrial
Area (ha):
Marine
Area (ha)
Total
Sabah Parks
Terrestrial Kinabalu Park, Tawau Hills Park, Crocker
Range Park,
243,216 243,216
Marine Tunku Abdul Rahman Park, Turtle Island
Park, Pulau Tiga Park, Tun SakaranPark,
Tun Mustapha Park
1,032,61
3
1,032,613
Sabah
Wildlife
Terrestrial Tabin Wildlife Sanctuary, Lower
Kinabatangan, Sipadan, Kota Belud,
Mantanani Kecil, KK Bird Sanctuary,
162,636 162,636
Marine Sugud Islands Conservation 46,300 46,300
Sabah
Forestry
Department
Class I
protected
forest
Bald Hill, Balembangan, Bidu-bidu,
Gemok Hill, Gomantong, Gunung
Lumaku, Kelawat, Leila, Limau-limauan,
Lipaso, Mt. Cochrane,Mt. Conner, Mt.
Walker, Pababag,Quoin Hill, Segarong,
Selangan Island, Sosopodon, Tanjong
Nagas, Tambalugu, Tawai, Tenompok,
Timbun Mata, Tinagat, Ulu Telupid,
Mandamai, Mount Pock, Mt. Hatton,
Binsuluk, Gunong Lumaku, Klias, Sungai
Serudong, Lamag, Mt. Wullersdoft, Mt.
Andrassy, Ulu Kalumpang, Bukit Kuamus,
Botitian, Bengkoka, Bukit Taviu,
Silabukan, Danum Valley, Maliau Basin,
Sapagaya, Gomantong-Geluang-Gesusu,
Bukit Hampuan , Bukau Api-Api, Ganui,
Sipitang, Imbak Canyon, Sungai Tongod,
Pulau Saga, Saddle & Laila, Gana, Sungai
Kiluyu, Gunung Tinkar, Banggi, Dalit,
Trusmadi
466.757 466.757
Class V
mangrove
Pulau Malawali, Sg. Lasun/Pulau Evans 320,522 320,522
Class VI
Virgin
Jungle
Reserves
Taman Botanikal Sepilok, Kerangas,
Merisuli, Lajong, Siaugau and Mesapol,
Milian Labau, Kretam, Lungmanis,
Melawaring, Kitabu, Loro, Sg. Simpang,
Garinono, Labuk Road, Umas-Umas,
Rafflesia, Ulu Sepapayau, Sg. Lokan,
Mengal
92,401 92,401
Class VII,
Wildlife
reserve
Tabin Wildlife Sanctuaryong, 132,653 132,653
Total 1,418,185 1,078,913 2,497,098

Revised: 14 March, 2012
20
the crater was made through sedimentary forces over 15 million years ago, combined with major
geological shifts, creating more than 30 spectacular waterfalls in the valley. Maliau Basin is an area of
incredible biodiversity featuring areas of lowland rainforest, heath forests and oak conifer, with cloud
forests on the higher elevations. With over 1,800 species of plant being recorded here including 80 species
of orchid and six endemic pitcher plants, it is one of the rare sites in Sabah that is home to the rare
rafflesia. Some of the world’s most rare and endangered wildlife species are also found here including the
Sumatran Rhinoceros, wild buffalo (Banteng), Orang Utan and Proboscis monkey.
55. Of similar conservation significance to Maliau Basin is Danum Valley Conservation Area (DVCA). The
area contains some of the oldest geological, structural and geomorphological history of the central part of
Sabah. DVCA occupies much of the upper catchments of the Segama River, and comprise mostly rugged
terrain between 150 and 1,000 m a.s.l. It is entirely primary forest dominated by trees in the family
Dipterocarpacea, where 20 of the 59 plant genera are endemic to Danum. The vertebrate fauna of DVCA
is equally rich with records of over 120 species of mammals, 300 birds, 72 reptiles, 56 amphibians and 37
fishes. Of particular significance are populations of 10 species of primates including the orang utan and
proboscis monkey as well as clouded leopard, Malayan sun bear and Borneo pigmy elephant. A small
number of Sumatran rhino also survive, making DVCA one of the only two or three such sites known in
Borneo.
56. Imbak Canyon is a 25 km long valley hemmed in on three sides by sandstone ridges rising o 1,120 m.
This unique geological feature serves as an important catchment area for the Imbak River, which drains
into the Melian River and the Kinabatangan river system. The Canyon is one of the few contiguous blocks
of undisturbed tropical rainforests, and is still largely unexplored. Small scientific expeditions to the area
have found that Imbak Canyon is refuge to a number of new flora and fauna species. Its faunal
composition includes the Sun bears, pigmy elephants and rare bird species such as the Oriental Darter and
Helmeted Hornbill.
SUSTAINABLE FINANCE CONTEXT
57. Annex 4 provides the baseline results for the financial scorecard.
58. The main source of funding for forest management in Sabah, including management of Class I and other
strict protection forest reserves, is the revenues generated by production forest concessions.41
This is
unsurprising, given that such royalties represent about 75% of total forest sector revenues. However, these
revenues are declining; state-wide, revenue from the forestry sector has declined over the last three years
from RM551 million in 2007 to RM345 million in 2009, due to a corresponding decline in forest harvests
(Sabah Forestry Department, 2009)42
. Conversely, forest management expenditures have increased from
RM78 million to M95 million for the same years; taken together, these trends are clearly unsustainable.
With the ongoing decline in timber resources from natural forests, forest sector revenues are very likely to
decline further, leading to increasing pressure being placed on forest sector, including conservation,
budgets.
59. An essential component of sustainable forest finance is that operations must generate optimal rent
capture. The main source of funding for the project landscape comes from revenues generated from the
sales of timber from the NFM areas. Timber rent captured by YS is at a fixed rate of RM80 m3 paid by
sub-contractors who hold the timber marketing rights. By surrendering the marketing rights to these
contractors, rent capture is therefore not maximized by YS. On the other hand, production forest
contractors tend to maximize profit by increasing production output.
60. The annual operating budget for the project landscape is approximately RM11-12 million. The approved
expenditure budget for 2011 was RM11.4 million. A high proportion of the budget is allocated to
41
To be clear, logging is not permitted within the strict protection reserves themselves; however, revenues generated by logging within Class II reserves currently represents
a major portion of SFD funding, and therefore a key, albeit indirect, source of financing for management of strict protection reserves. 42 Sabah Forestry Department, 2009. Annual Report 2009.
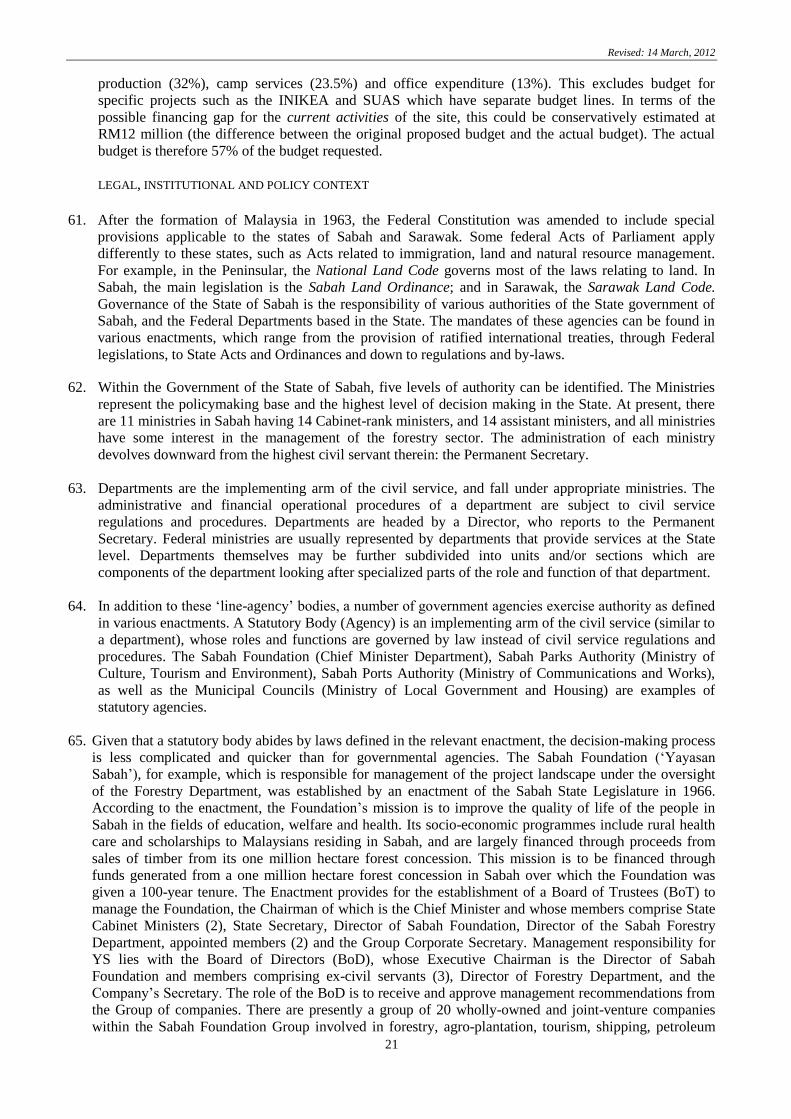
Revised: 14 March, 2012
21
production (32%), camp services (23.5%) and office expenditure (13%). This excludes budget for
specific projects such as the INIKEA and SUAS which have separate budget lines. In terms of the
possible financing gap for the current activities of the site, this could be conservatively estimated at
RM12 million (the difference between the original proposed budget and the actual budget). The actual
budget is therefore 57% of the budget requested.
LEGAL, INSTITUTIONAL AND POLICY CONTEXT
61. After the formation of Malaysia in 1963, the Federal Constitution was amended to include special
provisions applicable to the states of Sabah and Sarawak. Some federal Acts of Parliament apply
differently to these states, such as Acts related to immigration, land and natural resource management.
For example, in the Peninsular, the National Land Code governs most of the laws relating to land. In
Sabah, the main legislation is the Sabah Land Ordinance; and in Sarawak, the Sarawak Land Code.
Governance of the State of Sabah is the responsibility of various authorities of the State government of
Sabah, and the Federal Departments based in the State. The mandates of these agencies can be found in
various enactments, which range from the provision of ratified international treaties, through Federal
legislations, to State Acts and Ordinances and down to regulations and by-laws.
62. Within the Government of the State of Sabah, five levels of authority can be identified. The Ministries
represent the policymaking base and the highest level of decision making in the State. At present, there
are 11 ministries in Sabah having 14 Cabinet-rank ministers, and 14 assistant ministers, and all ministries
have some interest in the management of the forestry sector. The administration of each ministry
devolves downward from the highest civil servant therein: the Permanent Secretary.
63. Departments are the implementing arm of the civil service, and fall under appropriate ministries. The
administrative and financial operational procedures of a department are subject to civil service
regulations and procedures. Departments are headed by a Director, who reports to the Permanent
Secretary. Federal ministries are usually represented by departments that provide services at the State
level. Departments themselves may be further subdivided into units and/or sections which are
components of the department looking after specialized parts of the role and function of that department.
64. In addition to these ‘line-agency’ bodies, a number of government agencies exercise authority as defined
in various enactments. A Statutory Body (Agency) is an implementing arm of the civil service (similar to
a department), whose roles and functions are governed by law instead of civil service regulations and
procedures. The Sabah Foundation (Chief Minister Department), Sabah Parks Authority (Ministry of
Culture, Tourism and Environment), Sabah Ports Authority (Ministry of Communications and Works),
as well as the Municipal Councils (Ministry of Local Government and Housing) are examples of
statutory agencies.
65. Given that a statutory body abides by laws defined in the relevant enactment, the decision-making process
is less complicated and quicker than for governmental agencies. The Sabah Foundation (‘Yayasan
Sabah’), for example, which is responsible for management of the project landscape under the oversight
of the Forestry Department, was established by an enactment of the Sabah State Legislature in 1966.
According to the enactment, the Foundation’s mission is to improve the quality of life of the people in
Sabah in the fields of education, welfare and health. Its socio-economic programmes include rural health
care and scholarships to Malaysians residing in Sabah, and are largely financed through proceeds from
sales of timber from its one million hectare forest concession. This mission is to be financed through
funds generated from a one million hectare forest concession in Sabah over which the Foundation was
given a 100-year tenure. The Enactment provides for the establishment of a Board of Trustees (BoT) to
manage the Foundation, the Chairman of which is the Chief Minister and whose members comprise State
Cabinet Ministers (2), State Secretary, Director of Sabah Foundation, Director of the Sabah Forestry
Department, appointed members (2) and the Group Corporate Secretary. Management responsibility for
YS lies with the Board of Directors (BoD), whose Executive Chairman is the Director of Sabah
Foundation and members comprising ex-civil servants (3), Director of Forestry Department, and the
Company’s Secretary. The role of the BoD is to receive and approve management recommendations from
the Group of companies. There are presently a group of 20 wholly-owned and joint-venture companies
within the Sabah Foundation Group involved in forestry, agro-plantation, tourism, shipping, petroleum

Revised: 14 March, 2012
22
and gas, biotechnology, fisheries and food property and glue manufacturing. The companies under the
Group are placed under a management holding company known as Innoprise Corporation Sdn Bhd
(ICSB).
66. Under the Co-operative Act (1993), an agency (not necessarily an implementing agency) can be
established, whose role would be to cater for the interest of special groups (for example: farmers,
fishermen). It is also possible for agencies to be created under informal mechanisms directly by the
Cabinet, government committees, local authorities, etc.
67. Some Federal enactments deal only with issues specific to the State, but normally Federal statutes confer
certain mandates on Federal ministries, which then carry out such mandates within Sabah through their
departments in the State. For example, in environmental protection, the mandate for demanding and
evaluating Environmental Impact Assessment (EIA) rests with the Federal Department of the
Environment (although in future the State Department may assume responsibility). Nevertheless, all
commitments of the GOM in multilateral environmental agreements are implemented by the Federal
Ministry of Natural Resources and Environment through these State agencies.
68. The State enacts its own laws and ordinances, which provide the mandates for the State ministries and
agencies. These in turn may be empowered to draw up regulations and bylaws to execute their duties
effectively.
69. The Sabah Forestry Department has overall jurisdiction over forestry matters within the 3.6 million ha of
forest reserves in Sabah under the provision of the Sabah Forest Enactment (1968), which is the principal
forestry law in Sabah. The Forest Enactment provides for forest reserves, and their use and management,
as well as for control of cutting and removal of forest produce from state land. In addition to the Forest
Enactment (1968), the planning of state forest is guided by the State Forest Policy first adopted in 1954
with further amendments made in 1974. The State Forest Policy describes the role and functions of
forests, their contribution in maximizing social, economic and environmental benefits for the State, and
principles of sound forest management.
70. The Sabah Forestry Department is headed by a Director, who reports to the Chief Minister coordinated
through the Permanent Secretary of the State Natural Resource Unit under the Chief Minister
Department. The Director is assisted by four Deputies in charge of forest sector planning, development,
management, and research respectively, and 15 Divisional Heads based in the Headquarters in Sandakan.
Day-to-day forestry operations are administered by 27 District Forest Officers. As of 2008, the
Department has a total of 1,844 staffs comprising of 1,165 permanent posts, 37 temporary posts and 461
open vote posts and 181 contract posts (Sabah Forestry Department, 200943
).
71. In addition to the Forest Department, two other State bodies share jurisdiction over Sabah’s forests. The
first of these is the Sabah Biodiversity Council (SBC), whose functions are guided by the Sabah
Biodiversity Enactment (2000). SBC was established by the Sabah State Legislature to safeguard the
biodiversity and biological resources of the State. It is supported by a Secretariat known as the Sabah
Biodiversity Centre (SaBC), which was established in 2008. SaBC is headed by a Director and has a
management team of 10 people.
72. The second state body with forest-related responsibilities is the Sabah Wildlife Department (SWD),
which is responsible for implementation of the Sabah Wildlife Enactment (1997). Under this enactment,
SWD has jurisdiction over the management of wildlife within both state land and forest reserves,
including wildlife sanctuaries and other protected areas. The Department also coordinates and
implements CITES, and other international, national and bilateral agreements. Administratively, the
SWD is under the Ministry of Tourism Development, Environment, Science and Technology
(MTDEST); it is headed by a Director, who is supported by 229 staff spread across five regions (West
Coast and Kudat, Keningau, Sandakan, Lahad Datu and Tawau).
43 Sabah Forestry Department, 2009. Annual report 2010.
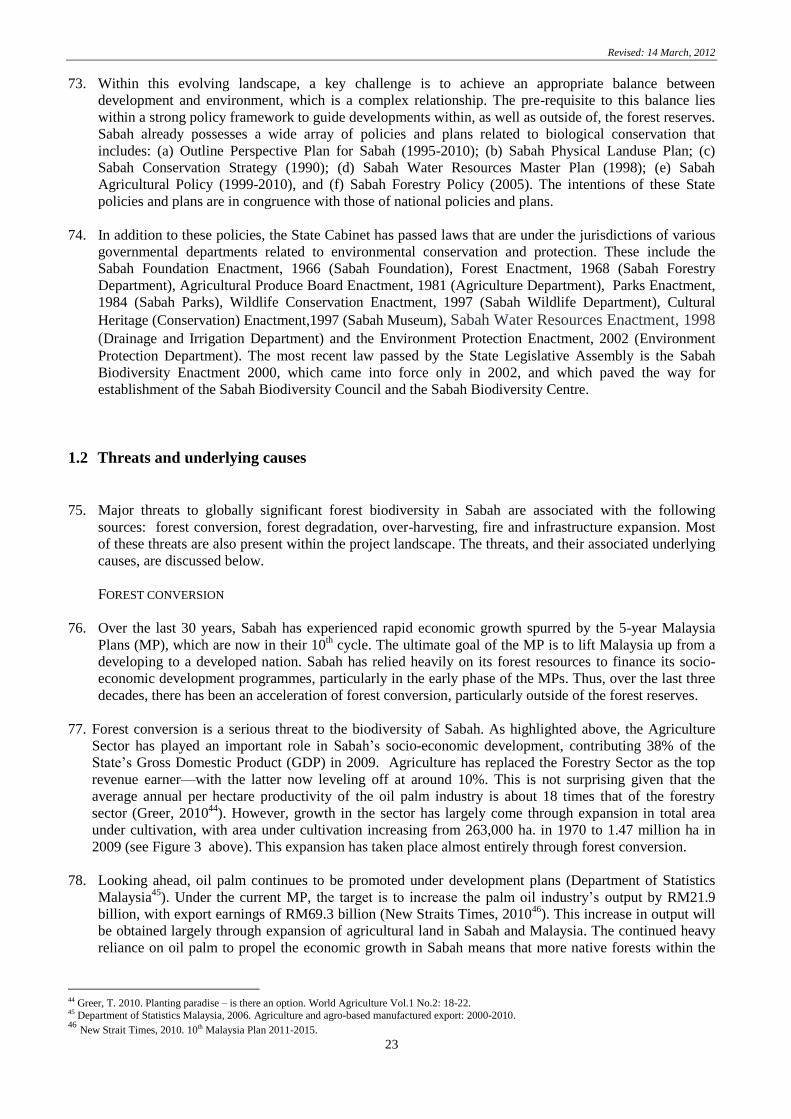
Revised: 14 March, 2012
23
73. Within this evolving landscape, a key challenge is to achieve an appropriate balance between
development and environment, which is a complex relationship. The pre-requisite to this balance lies
within a strong policy framework to guide developments within, as well as outside of, the forest reserves.
Sabah already possesses a wide array of policies and plans related to biological conservation that
includes: (a) Outline Perspective Plan for Sabah (1995-2010); (b) Sabah Physical Landuse Plan; (c)
Sabah Conservation Strategy (1990); (d) Sabah Water Resources Master Plan (1998); (e) Sabah
Agricultural Policy (1999-2010), and (f) Sabah Forestry Policy (2005). The intentions of these State
policies and plans are in congruence with those of national policies and plans.
74. In addition to these policies, the State Cabinet has passed laws that are under the jurisdictions of various
governmental departments related to environmental conservation and protection. These include the
Sabah Foundation Enactment, 1966 (Sabah Foundation), Forest Enactment, 1968 (Sabah Forestry
Department), Agricultural Produce Board Enactment, 1981 (Agriculture Department), Parks Enactment,
1984 (Sabah Parks), Wildlife Conservation Enactment, 1997 (Sabah Wildlife Department), Cultural
Heritage (Conservation) Enactment,1997 (Sabah Museum), Sabah Water Resources Enactment, 1998
(Drainage and Irrigation Department) and the Environment Protection Enactment, 2002 (Environment
Protection Department). The most recent law passed by the State Legislative Assembly is the Sabah
Biodiversity Enactment 2000, which came into force only in 2002, and which paved the way for
establishment of the Sabah Biodiversity Council and the Sabah Biodiversity Centre.
1.2 Threats and underlying causes
75. Major threats to globally significant forest biodiversity in Sabah are associated with the following
sources: forest conversion, forest degradation, over-harvesting, fire and infrastructure expansion. Most
of these threats are also present within the project landscape. The threats, and their associated underlying
causes, are discussed below.
FOREST CONVERSION
76. Over the last 30 years, Sabah has experienced rapid economic growth spurred by the 5-year Malaysia
Plans (MP), which are now in their 10th cycle. The ultimate goal of the MP is to lift Malaysia up from a
developing to a developed nation. Sabah has relied heavily on its forest resources to finance its socio-
economic development programmes, particularly in the early phase of the MPs. Thus, over the last three
decades, there has been an acceleration of forest conversion, particularly outside of the forest reserves.
77. Forest conversion is a serious threat to the biodiversity of Sabah. As highlighted above, the Agriculture
Sector has played an important role in Sabah’s socio-economic development, contributing 38% of the
State’s Gross Domestic Product (GDP) in 2009. Agriculture has replaced the Forestry Sector as the top
revenue earner—with the latter now leveling off at around 10%. This is not surprising given that the
average annual per hectare productivity of the oil palm industry is about 18 times that of the forestry
sector (Greer, 201044
). However, growth in the sector has largely come through expansion in total area
under cultivation, with area under cultivation increasing from 263,000 ha. in 1970 to 1.47 million ha in
2009 (see Figure 3 above). This expansion has taken place almost entirely through forest conversion.
78. Looking ahead, oil palm continues to be promoted under development plans (Department of Statistics
Malaysia45
). Under the current MP, the target is to increase the palm oil industry’s output by RM21.9
billion, with export earnings of RM69.3 billion (New Straits Times, 201046
). This increase in output will
be obtained largely through expansion of agricultural land in Sabah and Malaysia. The continued heavy
reliance on oil palm to propel the economic growth in Sabah means that more native forests within the
44 Greer, T. 2010. Planting paradise – is there an option. World Agriculture Vol.1 No.2: 18-22. 45 Department of Statistics Malaysia, 2006. Agriculture and agro-based manufactured export: 2000-2010. 46
New Strait Times, 2010. 10th Malaysia Plan 2011-2015.

Revised: 14 March, 2012
24
remaining 730,000 ha of undeveloped Stateland will be cleared, thereby reducing habitat while
increasing the degree of forest fragmentation.
79. Forest conversion for agriculture is also occurring within the forest reserves, albeit at a smaller scale
compared to Stateland. The Forest Enactment (1968) allows for the conversion of native forests to tree
plantations only in cases where the area in question contains a low growing stock of commercial tree
species. At the end of 2009, total forest that had been either restored or replanted in Sabah was
326,976 ha (Table 7). Of these, 61% or 199,257 ha of native forest were clear-felled and converted into
mono- or mixed-species exotic tree plantation; 32% or 104,110 ha of logged-over forests were treated
with climber cutting, and 7% or 23,608 ha of logged or burnt forests were enriched with new native tree
seedlings planted between buffers of natural forest strips. The maximum extent of forest plantation
development in the Class II Commercial Forest Reserves has been set at 500,000 ha according to a Sabah
Forestry Department directive. However, even meeting this limit would imply conversion of nearly 20%
of existing Class II forest reserves to tree plantations..
80. The decision as to which rehabilitation or conversion option to choose is largely made on financial
grounds. Climber-cutting is the least expensive compared to replanting, provided that the forest still
contains sufficient stock of natural regeneration. Otherwise, areas that contained low natural regeneration
or have been burnt are generally re-stocked through planting. In this case, mono- or mixed-species fast-
with growing tree plantation is generally the preferred option, because it takes only 8-12 years to mature
compared native tree species that requires 60-80 years. Fast-growing tree plantations also provide
intermittent streams of revenues over the rotation of natural forest, which requires 60-80 years before
harvest can be made. In recent years, enrichment planting using native tree species has begun to find
favour, due to its lower investment cost relative to clear-fell planting, and its advantages in meeting
conservation objectives. Although rattan was used in enrichment planting, it is now out of favour in
Sabah because of its low harvest yield and financial return.
81. The addition of rubber to the list of approved ‘tree’ crops in the last five years has made it more
attractive to establish forest plantations in Sabah. Prior to this addition, the approved tree crops for forest
plantation were restricted to fast growing exotic tree species (e.g. Acacia spp., Gmelina spp., Eucalyptus
spp.) or species of native origins (e.g. the dipterocarps). These crops offer significant return on
investment at the cost of long-term loss of significant amounts of natural capital. To date, total forest
reserves approved for rubber and oil palm plantations are c. 20,000 ha, and 110,000 ha, respectively.
82. Part of the future forest plantation development described above will likely be located within the
proposed project landscape, but the extent remains to be determined. The threat of continuing conversion
at the project landscape is therefore a very real one. About 90% of the site has been logged at least once,
rendering the site in need of intensive silviculture such as climber cutting or replanting. Unless this is
done, the present degraded forests will take a long time (>60 years) to become productive again, and
therefore risk instead to be converted into short-rotation (8-12 years) industrial tree plantations. As
discussed above, the latter approach has certain advantages from a strictly financial point of view.
83. One important underlying cause of conversion relates to the fact that forestry projects typically have to
deal with crops that mature at different times. For example, oil palm matures in 3 years and is ready for
harvest in the fourth year and thereafter until age 25, acacia trees mature in 6 years for pulplog and 12
years for sawlogs, and rubber trees produce latex in 6 years and harvestable wood at the end of 25 years.
These crops have relatively short gestation periods compared with dipterocarps, which take 60-80 years
to mature. The different crop gestation periods affect the return on investments in financial analysis due
to the effect of time on discounting. Oil palm is the most profitable largely because it starts producing in
the fourth year, which is much faster than any of the other crops. The yield per hectare is between 25-30
tonnes per ha and is typically priced between RM300 and RM700 per tonne. The internal rate of return
(IRR) for oil palm had been estimated at between 35 and 68%, which is three to five times more than

Revised: 14 March, 2012
25
Table 7. Forest plantation and restoration in Sabah’s forest reserves
Fast High Rattan Total Native Natural Total Grand
Growing Value Planted Species Regeneration Restored Total (Ha)
(1) (2) (3) (4) (5) (6) (7) (8)
A: Sabah Forestry Department:
1 District Forestry Office 106.69 608 0 714.69 0 0 0 714.69
2 Forest Research Centre 118.11 72.61 5.43 196.15 0 0 0 196.15
3 Tangkulap/Pinangah FR (FMU17) (Tamoi) 0 0 0 0 303 15,793.00 16,096.00 16,096.00
4 Sapulut FR (FMU25) 0 363.62 0 363.62 364 603 967 1,330.62
5 Deramakot FR (FMU19A) (Balat) 0 0 0 0 1,222.58 13,023.17 14,245.75 14,245.75
6 Ulu Kalumpang/Wullersdorf FR 0 0 0 0 156.32 0 156.32 156.32
7 Timimbang/Botitian FR 0 0 0 0 69 1,375.00 1,444.00 1,444.00
Sub-Total 224.8 1044.23 5.43 1274.46 2114.9 30794.17 32909.07 34183.53
B: Yayasan Sabah
1 ICSB (Luasong) 0 860.83 0 860.83 0 0 0 860.83
2 PISP (Luasong) 28.06 27.2 0 55.26 0 0 0 55.26
3 Forest Regeneration & Research (Danum) 6.3 131.2 0 137.5 0 100 100 237.5
4 Danum (INFAPRO) 0 0 0 0 6,046.00 5,465.50 11,511.50 11,511.50
5 Inikea Project (Kalabakan) 0 0 0 0 7,786.30 593.1 8,379.40 8,379.40
6 USM Project 0 0 0 0 1,101.00 12,204.00 13,305.00 13,305.00
Sub-Total 34.36 1019.23 0 1053.59 14933.3 18362.6 33295.9 34349.49
C: SFMLA Holders
1 Sabah Forest Industries S/B (FMU7) 43,506.24 0 0 43,506.24 1,127.00 723.83 1,850.83 45,357.07
2 KTS Plantation S/B (FMU19B) 116 2,163.00 0 2,279.00 2,918.00 9,363.58 12,281.58 14,560.58
3 Total Degree S/B (FMU18B) 0 2,369.87 0 2,369.87 0 0 0 2,369.87
4 Tabung Haji (Bonggaya Sdn Bhd)(FMU18A) 0 2,339.20 0 2,339.20 0 0 0 2,339.20
5 TSH S/B (FMU4) 4,972.00 1,043.00 0 6,015.00 54 13,249.00 13,303.00 19,318.00
6 KM Hybrid (FMU11) 1,090.90 16.3 0 1,107.20 0 0 0 1,107.20
7 Bornion Timber S/B (FMU11) 669.31 3,353.12 0 4,022.43 24 7,550.22 7,574.22 11,596.65
8 Timberwell Berhad (FMU3) 1,939.98 479.37 0 2,419.35 0 12,332.00 12,332.00 14,751.35
9 Sapulut Forest Development S/B (FMU14) 4,185.10 1,142.61 0 5,327.71 32 6,382.74 6,414.74 11,742.45
10 Anika Desiran (FMU5) 0 0 0 0 0 2,487.00 2,487.00 2,487.00
11 Lebihasil Sdn Bhd (FMU17) 684.93 29.14 0 714.07 0 0 0 714.07
12 Maxland S/B (FMU17A) 110 0 0 110 0 168 168 278
13 Eco-Plantations S/B (FMU2) 0 61 0 61 0 2,698.00 2,698.00 2,759.00
14 Benta Wawasan S/B 10,595.00 0 0 10,595.00 0 0 0 10,595.00
Sub-Total 67,869.46 12,996.61 0.00 80,866.07 4,155.00 54,954.37 59,109.37 139,975.44
D: Agencies/Companies
2 Sabah Softwood S/B 24,224.20 1,079.34 0 25,303.54 0 0 0 25,303.54
3 Ladang Jati Keningau S/B 15.18 1,467.82 0 1,483.00 0 0 0 1,483.00
4 Boonrich S/B 12.15 634 0 646.15 0 0 0 646.15
5 SAFODA
a) SAFODA Project 10,728.18 76.7 2,399.00 13,203.88 0 0 0 13,203.88
b) SAFODA Scheme 1,277.30 0 0 1,277.30 0 0 0 1,277.30
6 Syarikat Lak S/B 117 0 0 117 0 0 0 117
7 Syarikat Justin Enterprise S/B 0 121 0 121 0 0 0 121
8 Terusan Enterprise S/B 0 81 0 81 0 0 0 81
9 Kebun Rimau S/B
a) Kebun Sg. Balung 37.63 168.35 0 205.98 0 0 0 205.98
b) Kebun Rimau Estate 0 6.84 0 6.84 0 0 0 6.84
Sub-Total 36,411.64 3,635.05 2,399.00 42,445.69 0.00 0.00 0.00 42,445.69
E: Lembaga Industri Getah Sabah (LIGS)
Sub-Total 0 76,021.69 0 76,021.69 0 0 0 76,021.69
Grand Total 104,540.26 94,716.81 2,404.43 201,661.50 21,203.20 104,111.14 125,314.34 326,975.84
1&2: Clear fell and plant 199,257.07 Ha 60.9%
3&5: Enrichment Planting in degraed forests 23,607.63 Ha 7.2%
6: Liberation thinning 104,111.14 Ha 31.8%
Forest Plantation (Ha) Forest Restoration (Ha)

Revised: 14 March, 2012
26
other tree crops (Bacha & Rodriquez, 200747
; Noormahayu1 et al.48
). A comparative financial analysis of
rubber, sentang, teak and acacia showed investment returns of 11%, 16%, 17% and 15%, respectively
(Krisnapillay, 199849
). Financial factors thus favor short rotation crops over long-rotation crops, a fact
which increases the likelihood that natural forests will continue to be cleared and replaced with
monoculture plantations if left to strictly free market forces.
TIMBER HARVESTING AND OTHER CAUSES OF FOREST DEGRADATION
84. Forest degradation associated with unsustainable timber harvesting practices (including illegal
harvesting) is the most extensive form of forest disturbance in Sabah. Prior to stricter enforcement
beginning in 1997, timber harvesting damages were relatively high. The most obvious damages caused
by log extraction operations are the open spaces created in the forest area, where up to 40% of a logged
forest can be occupied by roads, skid trails, log yards and camp areas (Lanly, 198250
). Vines quickly
infest these open spaces hindering natural regeneration (Fox, 196851
). Consequently, future growing
stock is substantially reduced. Soil in these open spaces is usually compacted because of the repeated
passes made by heavy bulldozers (Dias and Nortcliff, 198552
). This greatly increases the water run-off
and the flow of eroded sediments into rivers and streams (Gilmour, 198253
). In harvesting 4-15 trees
representing only 2-10% of the total number growing from a hectare of forest, it has been reported that
approximately 50-60% of the remaining trees are damaged (Marns and Jonkers, 198254
; Tay et al,
200155
). Of particular concern now are the extensive areas that had been logged previously with
unsupervised harvesting that need intensive silviculture treatments to restore their ecosystem functions
and vitality. This will have implications on the economics and appropriate financial instrument (e.g.
REDD+) to support forest restoration works.
85. Timber harvesting is not the only cause of degradation, however, though it is often a precursor to other
problems. Over-harvesting of forest resources, including flora and fauna for trade and domestic use, has
also contributed to habitat degradation and to reductions in species populations. Among the most sought
after trees is Gaharu, which is highly prized for its resin for the perfume industry. Others include dammar
or resin of Agathis spp. and dipterocarps such as the Dipterocarpus spp. Hunting for Sumatran
rhinoceros body-parts and wild buffalo (tembadau) meat and trophies is a pervasive problem. These
hunting intrusions by outsiders, as well as by timber harvesting workers and gatherers of forest products
on a continuing basis, seeking ungulates and other animals, have depressed wildlife populations in
Sabah.
86. Degraded natural and planted forests are particularly vulnerable to fire during prolonged droughts
(Woods, 198956
; Goldammer et al., 200257
). Timber harvesting creates a more open forest structure that
leads to increased evaporation and desiccation during droughts, and to additional fuel in the form of
harvest debris. The combination of increased desiccation and fuel load in the undergrowth make the
forest more vulnerable to fire. Apart from these direct effects, timber harvesting also makes forests more
accessible, thereby increasing fire risk through human activities such as slash-and-burn agriculture. In
Sabah, an estimated one million ha of natural forests were damaged by fire related to the 1982/1983 El
47 Bacha, C.J.C. & Rodriquez, L.C.E. 2007. Profitability and social impacts of reduced impact logging in the Tapajos National Forest, Brazil – a case
study. Ecological Economics, 63(1), 70–77. 48 M.N. Noormahayu1, A.R. Khalid1 and M.A. Elsadig2 49 Krishnapillay, D.B. 1998. Case study of the tropical forest plantation in Malaysia. FAO Working Paper FP23. [These IRRs assumed the end products
being sawlogs, prices and costs valued at 1998 and gestation periods of between 15-20 years]. 50 Landly, J.P. 1982. Tropical Forest Resources, FAO Forestry Paper 30. FAO, Rome. 51 Fox, J.E.D. 1968. Logging damage and the influence of climber cutting prior to logging in the lowland dipterocarp forest in Sabah. Malayan Forester
31: 326-47. 52 Dias, A.C.C.P. and Nortcliff, S. 1985. Effects of tractor passes on the physical properties of an oxisol in the Brazilian Amazon. Tropical Agriculture
(Trinidad) 62: 561-577. 53 Gilmour, D.A. 1977. Effects of rainforest logging and clearing on water yield and quality in a high rainfall zone of northestern Queensland. 54 Marn, H.M. and Jonkers, W. 1982. Logging damage in tropical high forest. UNDP/FAO Working paper no. 5. FO:MAL/76/008. Sarawak Forestry
Department, Malaysia. 55 Tay, J., Healey, J. and Price, C. 2001. Financial assessment of reduced impact logging in Sabah, Malaysia. International Conference on the
application of Reduced Impact Logging to advance Sustainable Forest Management. Kuching, Sarawak. 56 Woods, P. 1989. Effects of logging, drought and fire on structure and composition of tropical rainforests in Sabah, Malaysia. Biotropica 21: 290-
298. 57 Goldammer, J.G., Seibert, B. and Schindele, W. 2002. Fire in Dipterocarp forest. Dipterocarp forest ecosystem: Towards Sustainable forest
management. http://

Revised: 14 March, 2012
27
Nino event, of which 85% were logged forests and 15% primary forests (Beaman et al. 198558
). The
rates of tree mortality after fire ranged from 38 to 94% in logged forests, and from 19 to 71% in
unlogged forest (Woods, 1989). For saplings, rates of mortality of original species exceeded 80% in both
forest types. In the same site, fires had a significant negative impact on the seed-bank and seedlings in
burnt logged forest, which did little to assist the recovery of the original species (Woods 1987, 1989). As
yet, there has not been any major fire damage reported on any large-scale forest plantation in Sabah.
However, monoculture forest plantations are vulnerable to fire risk because of the fewer species, and
much smaller diameter and evenly distributed trees per hectare that present a drier environment ideal for
fire breakouts (Barber and Schweithelm, 200059
). Thus, the presence of degraded forests and
monoculture plantations surrounding the edges of protected areas presents a significant threat to their
future, and would be catastrophic for all the components of biodiversity in the area in the event of a
major fire outbreak.
87. Finally, infrastructure development, especially road networks for harvesting, affects biodiversity both
directly and indirectly. The direct impact of these roads is to facilitate access to forests, which leads to
disturbance, pollution and encroachment upon biodiversity-rich ecosystems. Indirectly, they may attract
satellite developments or settlements that can cause fragmentation of species-rich habitats.
88. Like many of Sabah’s forests, the project landscape has suffered from timber harvesting disturbance.
Areas that have been logged twice face the follow-up threat of being converted to monoculture
plantations, for two main reasons. First, the altered forest structure no longer provides a suitable
environment for shade-tolerant indigenous trees to grow due to high light intensity. Second, there is an
absence of future harvest trees in these areas due to excessive harvesting damages. Both of these factors
contribute to making conversion substantially more financially profitable than other alternatives.
89. The above-described factors are leading to further forest fragmentation, putting at risk the survival of key
migratory wildlife species such as elephants, rhinoceros and hornbills. Over-extraction of timber
resources is likely to impair ecosystem recovery and result in the loss of forest ecosystem functions.
Intensive timber harvesting at the headwaters is known to increase sedimentation, affecting water quality
and aquatic wildlife in the river systems. The substitution of fast-growing tree plantations for natural
forest increases fire risks at the project landscape. Finally, poaching is endangering existing populations
of Orang-utans, rhinos, elephants and reptiles.
90. If these activities in the production landscape proceed according to business-as-usual, the ability of
Maliau, Danum and Imbak conservation area systems to achieve their intended conservation outcomes
will be significantly jeopardized. Although the 261,264 ha project landscape remains today an important
ecological corridor for plants and wildlife, the predictable impacts from the business-as-usual activities
are loss of biodiversity and connectivity among existing PAs, threatening the latter with becoming
ecological islands.
91. Areas within the project landscape that have high conservation values (HCV) are at particular risk of
irreversible loss related to timber harvesting. A recent assessment of HCV within the project landscape
found that FMU 23 and FMU24 contained 19 and 37 endemic plant species, respectively (WWF60
). In
terms of fauna, there were nine endemic species in FMU 23, and 14 in FMU24. These FMUs also
provide food, shelter, water and temporary refuge for wildlife entering and living in nearby protected
areas such as the Imbak Canyon Conservation Area and Maliau Basin Conservation Area. In addition,
the HCV team identified several rivers and streams in YT 3/08 and YT 4/08 as providing critical
ecosystem services.
92. The impact of forest disturbance can also be inferred from the wildlife population presence within the
YSCA. A recent estimate by Alfred et al., (201061
) reported that elephant concentration in the
58 Beaman, R. S., Beaman, J. H., Marsh, C., and Woods, P. 1985. Drought and forest fires in Sabah 1983. Sabah Society Journal 8:10–30. 59 Barber, C.V. and Schweithelm, J. 2000. Trail by Fire: Forest fires and forest policy in Indonesia’s era of crisis and reform. World Resources
Institute. 60 WWF. 2011. High Conservation Value Forest Assessment of Forest Management Unit 23 and 24 in Kalabakan Forest Reserve, Sabah. 61 Alfred, R., Ahmad, A.H., Payne, J., Williams, C. and Ambu, L. 2010. Density and population estimation of the Bornean elephants in Sabah. Journal
of Biological Science 10(2): 92-102.

Revised: 14 March, 2012
28
Kalabakan-Sapulut-Maliau Range located within the project landscape had increased from 0.01 to 0.28
animal km2, respectively (Figure 9). A significant increase in Orang-utan concentration was also
observed in the north-eastern Gunung Rara and eastern part of the Kalabakan Forest Reserves (Ancrenaz,
2005; Alfred, 2010; Figure 10). Sumatran rhino have been reported in the greater Danum valley area and
greater Maliau Basin conservation areas. In May 2004, footprints of rhino were found in the Imbak
Canyon conservation area. A female rhino was found killed at the southern part of the SUAS project area
(FMU25) in March 2001. Follow-up surveys found evidence of another rhino still roaming in the same
area. There is a possibility that the project landscape is used by rhino to move within the three
conservation areas. In addition, the endemic wild buffalo Tembadau (Banteng) were found in the
Brantian area including the greater Maliau Basin Conservation Area. There is a strong likelihood that the
Tembadau also roams the project landscape although the exact density and size of the population within
the project landscape remain unknown.
1.3 Long-term solution and barriers
93. The long-term solution to the above threats and their underlying causes is a landscape management
approach which nests PAs within a matrix of conservation-compatible land uses in order to maintain
biodiversity, ecosystem functions and resilience. Under any financially realistic version of this solution,
the PAs and connecting landscape areas must also generate the large majority of revenues needed for
their own optimal management.
94. The barriers described below are preventing the emergence of the above-defined long-term solution and
in so doing are compromising both forest resource sustainability and biodiversity conservation:
INADEQUATE POLICY FRAMEWORK, WEAK INSTITUTIONS AND LIMITED TECHNICAL CAPACITIES AT STATE
LEVEL
95. There is currently neither an adequate enabling environment for landscape-level, multiple use forest
management and financing in Sabah nor sufficient qualified staff to manage such a system. Specific
barriers include: (i) no regulatory or planning framework for defining a set of landscape-level
conservation and sustainable use objectives, activities, budgets, indicators, etc.; (ii) no framework for
managing that landscape according to the defined objectives; (iii) no policies / regulations for generating
and/or reinjecting revenues from anything other than timber; (iv) no guidelines or policies for multiple
use forest landscape planning, management or conservation; (v) limited technical capacities to
implement multiple use strategies, and; (vi) inadequate systems of monitoring and enforcement.
Incoherent enforcement
96. Weak enforcement of forest laws is one of the root causes of failures in sustainable forest management
worldwide (Poor, 199262
). In the context of Sabah, weak enforcement can be traced back to political
pressures and interference, and a lack of necessary human, financial and managerial capacity to
effectively enforce forest law compliance. Successful strategies to enforce forest laws also rely on a
sound knowledge of the resource base, its utilization and market value. When forest inventories data is
outdated and inadequately checked, it may lead to overestimation of annual allowable cut. Without
information on industrial capacities and/or utilization efficiencies, it is difficult to judge the extent to
which illegal wood is being utilized. Similarly, low rent capture entrenched through mutually exclusive
concessions demoralizes staff from effectively carrying out their surveillance duties. Improving law
compliance therefore requires a coherent approach to surveillance.
97. The number of reported forest offences between 2003 and 2009 averaged 259 cases. The highest
occurred in 2005 with 331 cases, and the least in 2007 with 202 cases. Since 2007, the number of
reported forest offences has been on the rise. In 2009, there were 276 cases ranging from breach of
licences (48%), encroachment (23%), illegal possession (22%), and illegal timber harvesting (7%)
62 Poor, D. 1992. No timber without trees: Sustainability in the Tropical Forest. Earthscan Publicains Ltd. London. 252 pp

Revised: 14 March, 2012
29
(Sabah Forestry Department, 2009)63
. Total fines associated with these offences were valued at RM1.2
million. It is difficult to ascertain whether the increase in the number of reported cases implies more
effective enforcement or otherwise. In view of the relatively high number of reported cases, forest law
enforcement in Sabah needs to be strengthened.
INADEQUATE AND FRAGMENTED MANAGEMENT APPROACH, INCLUDING INEFFICIENT REGULATION OF
TIMBER HARVESTING AT PROJECT TARGET LANDSCAPE
98. Management of the forest landscape within which the proposed project landscape is located is based on
an outdated management plan developed by the Sabah Foundation nearly three decades ago. Under this
plan, over-harvesting of timber resources has taken place in areas where timber extraction has been
permitted, which has contributed to fragmentation of the area’s landscape. The issuance of harvesting
permits is often connected to a need for additional state revenues. Inefficient harvesting regimes do not
provide sustainable revenue streams, resulting in further pressure for forest conversion to agriculture (e.g.
oil palm). State Government regulations require a Forest Management Plan (FMP) based on Sustainable
Forest Management (SFM) principles for production forest landscapes. Specific management related
barriers include: (i) limited information about biodiversity distribution within the site area, needed for
zoning; (ii) lack of knowledge of the implications of alternative land use combination; (iii) inadequate
monitoring, needed for adaptive management, and; (iv) gaps in operating capacities and approaches
needed for integrated, adaptive management of the overall landscape.
FAILURE TO ADEQUATELY MONETIZE AND RE-INVEST A BROAD STREAM OF BENEFITS ARISING FROM
FOREST RESOURCES
99. Under the Federal Constitution of Malaysia, the legislative and executive authority over forest is a State
responsibility (Sabah Forestry Department, 1989). The State, in turn, relies extensively on revenues
generated from the forestry sector to finance its socio-economic development programs. Despite this
reliance, there is a widespread failure to monetize or otherwise ‘capture’ an adequate portion of the
economic, social and environmental benefits produced by these forests. These include both timber values
as well as values associated with a range of ecosystem services.
100. In the case of timber values, timber rent appropriation is legalized through awards of timber concessions
to companies by negotiated tender. These companies then harvest the timber and appropriate the
difference between the cost of extracting the timber (royalties plus normal profit) and the market price.
The difference between the two is typically large and represents the share of economic rent not captured
by the State but rather appropriated by timber concessionaires (Brown, u.d.64
). According to Brown, u.d.,
timber rent not captured per cubic meter of mixed tropical hardwoods in Sabah averaged USD5/m3
(range: USD18-90/m3) for the period 1970-1998, compared with Sarawak at USD80/m
3 (range: USD1-
160/m3) and Indonesia at USD60/m
3 (range: USD1-120/m
3). Low timber rent capture for mixed tropical
hardwoods in Sabah is still prevailing, as revealed in a comparison of log prices between forest
concessions managed by the Sabah Forestry Department (RM141/m3), para-statal concessionaire
(RM99/m3) and private concessionaires (RM104/m
3; Kollert and Lagan, 2005
65). By transferring a sizable
portion of the rents to the private sector through exclusive contracts, rents become unavailable for
reinvestment into projects that promote sustainable management of forests (Vincent and Gillis, 199866
).
Low stumpage fees encourage both higher levels of harvesting, i.e., overharvesting, and higher levels of
consumption of wood products because of excessive cutting (Poter, u.d.67
).
101. While timber values, or rents, are thus only partially captured, there is also a broader failure to capture
values associated with a range of ecosystem services, e.g., regulation of local and global climate,
63
Sabah Forestry Department, 2009. Annual Report 2009. 64 Brown, D.W. u.d. Why governments failed to capture economic rent. Centre of Policy Initiatives. http://www.cpasia.org. 65 Kollert, W. and Lagan, P. 2005. Do certified tropical logs fetched a market premium? A comparison price analysis from Sabah, Malaysia. XXII
World Congress, Brisbane, Australia. 66 Vincent, J. 1990. Rent capture and the feasibility of tropical forest management. Land Economics 66(2). 67 Porter, G. u.d. Natural resources subsidies, trade and environment: The cases of forests and fisheries. Centre of International Environment Law.

Revised: 14 March, 2012
30
aesthetics and eco-tourism, protection from natural disasters, water regulation and biodiversity. Although
several innovative opportunities for generating revenues based on these values exist, including
mechanisms such as REDD Plus, biodiversity banking, sustainable timber certification and NTFPs, these
opportunities have yet to be fully explored or taken advantage of. Specific barriers to successfully
harnessing these revenue-generating opportunities include the following: (i) lack of capacity to define,
develop and manage new revenue generating opportunities; (ii) lack of mechanisms for investing financial
resources generated into protected area and landscape-level conservation and management; (iii) in the
case of REDD Plus, barriers include the absence of a national policy framework for generating and
trading REDD or REDD Plus credits and inadequate capacities to quantify changes in carbon stocks in
state forests. A critical result is that simply opening an area up to timber harvesting may end up being
seen as the easier solution when additional revenues are needed.
102. The failure to tap into new revenue generating opportunities has important implications for funding of
management efforts. The Sabah Forestry Department estimates that baseline management and protection
of the state’s Forest Reserves (totaling 3.6 million hectares) requires approximately RM27.78
(approximately US $8.00) per hectare per annum. This is equivalent to slightly more than USD2 million
per annum for the project landscape. More effective management regimes will require additional
resources to develop and pilot, even if they ultimately result in lower per-hectare management costs over
the long term due to higher efficiency. The current funding gap is estimated to be in excess of 50%.
1.4 Stakeholder Analysis
103. The Sabah Forestry Department (SFD) will be the main agency responsible for developing and managing
the implementation of the project. At the national level, the Ministry of Natural Resource and
Environment (MNRE) will provide overall project governance, administrative and technical advice in
line with its commitment to GEF as the Operational Focal Point in Malaysia. At the state level, the
State (of Sabah) Economic Planning Unit (SEPU) shall advise on governing policy matters, regulations,
procedures and budgetary matters in the facilitation and delivery of the project. The Sabah Foundation
(SF) is responsible for implementing project activities at the site level with guidance from SFD. SFD
will also work in partnership with local governments, NGOs, and relevant communities in strengthening
their capacity as managers of a multiple-use forest landscape. The major categories of stakeholders, their
roles and responsibilities and their involvement in the Project are summarized in Table 8.
1.5 Baseline Analysis
104. This section presents recent, ongoing and planned actions in the absence of the present project. It is
organized into sub-sections according to the project’s three main areas of analysis and intervention, i.e.,
policy, forest management and sustainable finance. These sub-sections may be read in conjunction with
section 1.3 above which presents ongoing barriers in each of these areas. A final sub-section presents a
baseline scenario of developments likely to occur in the absence of the present project.
POLICY
105. Recognizing the need to put in place a system of good forestry practices, the Sabah Forestry Department
engaged the technical assistance of the German Government through GTZ in 1989 to develop a system
to ensure sustainable management of the 2.6 million ha Class II Commercial forest reserves. This
assistance is in line with the Sabah Forestry Policy to achieve sustainable management of the state’s
forest reserves by ensuring proper utilization of its forest resources through proper planning and forest
development programmes in accordance with approved silvicultural practices to optimize productivity of
the permanent forest reserves. The system includes a planning framework executed at two levels:
State/Forest Sector and Forest Enterprise levels. At the State/Forest Sector level, the overall economic,
ecological and social framework was evaluated and a strategic plan prepared. Implementation of this
strategic plan at the Forest Enterprise level is guided by a 10-year forest management plan. The Sabah
Forestry Department’s approach to improving the status/condition of the 2.6 million ha production forest

Revised: 14 March, 2012
31
was through the development of a pilot project (i.e. the Deramakot Sustainable Forest Management
Model) to be replicated on a wider scale in the forest management units (FMUs). While the forest
planning system has been successfully introduced and adopted by the FMU holders, the effectiveness of
the system is yet to be proven by a third-party certification of the FMUs in Sabah as well-managed
similar to that conferred to the Deramakot Sustainable Forest Management Project.
Table 8. Key Stakeholders, their roles and responsibilities and involvement in the project
Stakeholder Roles and Responsibilities Involvement in the Project
Ministry of Natural
Resources and
Environment (NRE)
This Ministry is responsible for the
management of natural resources and
environment in Malaysia. They are
empowered to legislate policy and law on
natural resource and environment
management through nine Departments under
their jurisdiction. They also monitor the
implementation of these policy instruments to
ensure effectiveness in application.
NRE will be represented in the Project
Board (PB) as one of the Senior
Suppliers, and will provide guidance
on project coordination and
management in line with national
policies and objectives
Natural Resource Office
(NRO), Sabah
NRO is under the Chief Minister Department
of Sabah overseeing the planning of natural
resources (Land, Forestry, Mining, Water)
and development. It is headed by a Natural
Resource Secretary
NRO will be the Executive Chair of the
PB in facilitating and ensuring that the
project activities are achieved as
planned.
State Economic Planning
Unit (SEPU)
SEPU is under the Chief Minister Department
of Sabah, and is responsible for the planning
and coordination of all State’s Development
Programme
SEPU will act as the extension arm of
MNRE in monitoring and coordinating
the implementation of the project
activities.
Ministry of Finance, Sabah
(MoFS)
The Ministry of Finance manages the state
revenues, expenditures and funds in ensuring
a healthy financial reserve.
MoFS will provide advice on financial
management of the project.
Ministry of Rural and
Entrepreneurial
Development, Sabah
(MRED)
MRED is responsible for the improvement of
the standard and quality of life in the rural. Its
mission is to ascertain that rural development
programs are planned and implemented
efficiently and effectively.
MRED will be a partner of the project,
and will provide technical advice on
aspects of community developments in
line with national/state planned rural
development programs.
Ministry of Tourism and
Environment Science and
Technology, Sabah
(MTEST)
MTEST is in-charge of State’s tourism
development and environmental management.
This Ministry is also in-charge of the Sabah
Wildlife Department (SWD) and the State
Tourism Board.
MTEST will be a partner of the Project
in providing policy advice on tourism
and environmental management as
well as identifying opportunities for
ecotourism development.
Sabah Forestry Department
(SFD)
SFD is the central agency responsible for
forestry in Sabah.
SFD is the Senior Supplier in the PB
being the proponent and implementing
agency for the Project. They will be
responsible for managing the Project.
SFD will be act as the executive
secretary to the PB.
Sabah Biodiversity Centre
(SaBC)
The central agency responsible for overall
biodiversity protection and safety in Sabah.
SBC will be represented in the PB to
provide policy and technical advice on
biodiversity developments.
Sabah Wildlife Department
(SWD)
SWD is responsible for the implementation of
the Sabah Wildlife Conservation Enactment,
1997. The Department also implements the
Convention on International Trade in
Endangered Species of Wild Fauna and Flora
(CITES) as well as contribute to the
implementation of the International
Convention of Biological Diversity (CBD)
and a number of other international, regional
and bilateral agreements.
SWD will provide support in terms of
technical inputs on aspects of wildlife
conservation and management within
the project landscape.
Environment Protection
Department (EPD)
EPD is a regulatory body that advises the
State Government on aspects of
EPD will be an important partner in
providing technical advice on aspects

Revised: 14 March, 2012
32
Stakeholder Roles and Responsibilities Involvement in the Project
environmental management in Sabah. It also
monitors environmental impacts on all land
developments including forestry.
of environment policy development,
process and implementation.
Department of Irrigation
and Drainage (DID)
This Department is responsible for the
planning of irrigation infrastructures in
agricultural land development. DID’s role
also covers the development and management
of the state’s water resources under the Water
Resources Enactment 1988
DID will be represented in the PB
whose role will be to provide technical
advice/support on water resource
planning and development, in
particular, PES within the project
landscape.
District Forest Offices of
Kalabakan
They have jurisdictions in areas where the
project is located. They have existing
mandates to sustainably manage their
resources and promote biodiversity conservation.
They will take part in the management
of multiple-use forest landscape
management under their jurisdiction.
UNDP Malaysia UNDP will be the implementing agency of
the GEF and facilitates the development,
review and submission of projects for GEF
financing. It also monitors the implementation
of the UNDP Country Program. It also
catalyzes the support of other donors in
fulfilling the government responsibilities
under the CBD and in implementation of GEF
projects
The UNDP Country Office (UNDP-
CO) is responsible for the successful
management and delivery of
programme outcomes and monitoring
of interdependencies between projects
and managing changes within and
among projects. They will be
represented in the PB as one of the
members of the Senior Suppliers.
Sabah Foundation/Yayasan
Sabah (YS)
YS is a statutory body and holds a 100-year
long term licence to one million hectares of
forest concession in Sabah. The proposed
project landscape is located within the YS
forest concession.
YS is one of the senior suppliers of the
PB.
National NGO such as the
World Wildlife Fund –
Malaysia (WWF)
WWF-Malaysia has an MoU (2010-2015)
with the project proponent (SFD) to obtain
credible certification for FMU23, 24 and 26
within the project landscape. They are active
partner in advocacy for strengthening forest
management and financing through REDD.
WWF will be a co-financier and an
implementing partners of the Project in
the sites. A representative of WWF
will be selected to be a member of the
PB.
Local NGOs
NGO HUTAN
Land Empowerment and
Animals People (LEAP)
Borneo Conservation
Trust (BCT)
Partners of Community
Organizations (PACOS)
Borneo Rhino Alliance
(BORA)
These local-based NGOs have on-going
partnerships with State departments and/or
international organizations in conservation
efforts in Sabah with main focus in forests
and people. The also undertake studies to
provide scientific basis for sustaining the
supply, utilization and management of natural
resources.
These NGOs will be appointed as
implementing partners of the Project if
they have on-going activities or
interests in supporting the
implementation of selected activities
within the project landscape. Where
possible, these NGOs will provide co-
financing to support project activities.
A representative from these NGOs will
be selected to be a member of the PB.
Local communities The nearest communities living close to the
project landscape is located 40 km from the
project landscape. Most of these
communities practice modern lifestyle,
although they still collect and hunt for food in
the forest. They get their water from rain or
gravity feed from spring or rivers. Many also
farm lands by practicing traditional slash and
burn.
They will take an active role in
providing local knowledge related to
the socio-economic development and
management of the project landscape.
Business and Biodiversity
Offset Programme (BBOP)
BBOP is a private entity specializing in
biodiversity offsets in partnership with 40+
leading organizations and individuals around
the world.
BBOP will assist in the development of
policies to enable the introduction of
biodiversity offsets within the project
landscape.
Academic and Research
Institutions Universiti Malaysia Sabah
(UMS)
Swedish University of
They undertake research and other advocacy
activities within or outside Sabah in
sustainable forest management, forest
rehabilitation and protected area management.
These academic and research institutions also
They will be involved in the conduct of
scientific research and/or surveys in
addressing knowledge gaps on the
project. They will also provide their
expertise in advisory/technical support

Revised: 14 March, 2012
33
Stakeholder Roles and Responsibilities Involvement in the Project Agricultural Sciences
(SUAS)
Royal Society of London
(RS)
Forest Research Institute
Malaysia (FRIM)
work with their respective partners in
education, research and training.
to selected Project activities.
106. In recognizing the value of forests as a natural asset, the State Government of Sabah has set a target of
maintaining at least 55% of the land under permanent forest reserves (Greer, 2010)68
. As at 2009, a total
of 3.6 million ha or 48% of the total landmass of Sabah was under seven classes of forest reserves
(Table 2). As discussed above, within these seven classes of forest reserves, Class I, V, VI and VII are
under strict protection and together represents 12% of the total forest reserves in Sabah.
107. Recently, a policy aimed at achieving no net loss of biodiversity from development activities has been
under consideration. It follows the notion that biodiversity loss in the site developed can be conserved in
an offset site with ecological equivalence. At present, no net loss and biodiversity offsets are new
concepts for Sabah which would require changes in the policy framework to be implemented.
LANDSCAPE PLANNING AND MANAGEMENT SYSTEMS
108. The rapid expansion of large-scale oil palm plantations by the agriculture sector has naturally put
pressure on the environment and on society, despite its apparent economic advantages. Stricter operating
standards have been initiated by the Roundtable on Sustainable Palm Oil (RSPO) to help advance the
production, procurement and use of sustainable oil palm products (Greer, 2010). This initiative does not,
however, compensate for the fact that biodiversity is invariably lost through forest conversion due to
palm oil expansion.
109. Currently, planning and management of Sabah’s forest reserves is privatized to forest companies in
compliance with the Malaysia Incorporated Concept and the signing of the Sustainable Forest
Management Licence Agreement with the consent of the State Government. Of the 20 forest companies
operating in the State, 10 hold Sustainable Forest Management License Agreements (SFMLA/97) with a
tenure of 100 years starting in 1997 (Table 9). Each of these companies is allocated one or more FMUs
ranging from 10,000 to 100,000 ha. Each FMU may cover an entire forest reserve or overlapping forest
reserves. The total land holding under SFMLA/97 is 1.55 million ha, covering 58% of Class 2
Commercial forest reserves. Of the 10 SFMLA/97 holders, the Sabah Foundation (SF) or Yayasan Sabah
(YS) holds the lion’s share; it is responsible for 8 FMUs (15, 16, 20, 21, 22, 23, 24, and 26) containing
778,083 ha (excluding Danum, Maliau and Imbak Conservation Areas which are also under YS
management).
110. The primary use within most FMUs is timber extraction. In recognizing the need to manage these
production forests on a sustainable basis, the Sabah Forestry Department in 1997 made it mandatory at
the state-level for all FMU holders to adopt reduced impact logging (RIL) techniques to extract timber.
This paves the way for getting all FMUs in Sabah certified by a third party as well-managed forests by
2014 (Sabah Forestry Department, 2010)69
. Fourteen years after the introduction of RIL, however, the
total area that has been harvested with RIL remains low.
111. At project landscape level, several efforts have been undertaken in recent years to encourage sustainable
forestry. Since 2006, YS has begun to adopt RIL techniques that require intensive mapping of the harvest
area prior to harvesting. This is followed by harvesting practices that reduced incidental damages
through directional felling, limiting movement of bulldozers during log skidding, and removal of
temporary infrastructures after work is completed to minimize disturbances to water bodies and/or
poaching. However, the practice of RIL within the project landscape covers less than 10% of the total
NFM area because of frequent changes in contractors, many of whom lack experience in implementing
RIL.
68
Greer, T. 2010. Planting paradise – is there an option? World Agriculture. Vol 2: 18-22. 69
Sabah Forestry Department, 2010. Sabah REDD Update. http://www.gcftaskforce.org/documents.html

Revised: 14 March, 2012
34
Table 9. Sustainable Forest Management Licensees in Sabah
FMU No. Licence Licensee Area (HaO Forest Reserve Area (Ha)
8, 13 SFMLA.01/97 Idris Hydraulic (Malaysia) Bhd 234,552 a) Sg. Tagul 105,769
b) Sg. Telekosang 14,560
c) Sg. Kabu 14,280
d) Ulu Sg Pada 14,160
e) sg Tamalasak 10,312
f) Sg Salilir 7,746
Sapulut 67,725
11 SFMLA.03/97 Bornion Timber Sdn Bhd 108,665 a) Sapulut 30,877
b) Ulu Sg Milian 77,788
14 SFMLA.04/97 Sapulut Forest Deveopment Sdn Bhd 95,300 Sapulut 95,300
4 SFMLA.07/97 TSH Resources Sdn Bhd 123,385 Ulu Tongod 123,385
2 SFMLA.05/97 Eco-Plantation Sdn Bhd 94,227 a) Paitan 70,900
b) Sugut 23,327
3 SFMLA.06/97 Timberwell Sdn Bhd 71,293 Lingkabau 71,293
15, 16, SFMLA.09/97 Yayasan Sabah 703,049 a) Sg. Pinangah 174,902
20, 21, b) Kuamut 116,471
22, 23, c) Ulu Segama 952
24, 26 d) Gunung Rara 169,626
e) Ulu Segama1 202,856
f) Malua 33,969
g) Kawang Gibong 707
h) Merisuli 552
i) Sepagaya2 2,316
j) Sepagaya 698
5 SFMLA.10/97 Anika Desiran Sdn Bhd 101,161 Trusmadi 101,161
18A SFMLA.11/97 Lembaga Urusan Tabung Haji 10,117 Bongaya 10,117
18C SFMLA.12/97 Total Degree Sdn Bhd (USIA) 4,047 Bongaya 4,047
Sub-Total 1,545,796 58.0%
11 SFMLA.01/2004 K.M.Hybrid Plantation Sdn. Bhd. 1,666 Sook Plain 1,666
17A SFMLA.01/2005 Lebihasil Sdn Bhd 1,000 Sg. Pinangah 1,000
17A SFMLA.01/2007 Maxland Sdn Bhd 1,000 Sg. Pinangah 1,000
6 SFMLA.02/2007 Borneo Sulaman Cove Sdn Bhd 488 Sulaiman Lake 488
2 SFMLA.01/2008 Jaya Kuik Sdn Bhd 1,000 Jambongan 1,000
7 SFMLA.03/2008 Borneo Eco Healing Centre Sdn Bhd 173 Pulau Berhala 173
Sub-Total 5,327 0.20%
18 JP(SBN)01/2007 Silam Forest Products Sdn Bhd 31,126 Bongaya 31,126
19B JP(SLK)125/93 KTS Plantation Sdn Bhd 57,247 Segalid Lokan 57,247
7 JP(KSG)108/96 Sabah Forest Industries Sdn Bhd 276,622 a) Sipitang 245,764
b) Ulu Padas 30,858
21, 22 JP(TKA)122/96 Benta Wawasan 176,810 a) Gunung Rara 144,310
23, 24, 26 b) Kalabakan 32,500
19 Deramakot 55,083 Deramakot 55,083
17A Tangkulap/Pinangah 48,020 a) Tangkulap 27,500
b) Pinangah 20,520
17B Sg Pinangah 15,315 Pinangah 15,315
17C Mangkuwagu 8,355 Sg Mangkuwagu 8,355
10 Trusmadi 76,692 Trusmadi 76,692
18 Timimbang-Botition 13,610 a) Timimbang 11,465
b) Botition 2,145
22, 27 Ulu Kalumpang 54,886 a) Ulu Kalumpang 51,118
b) Kalumpang VJR 3,768
20 Pin-Supu 4,696 Pin-Sipu 4,696
2 Bengkoka-Tambalugu 6,467 a) Bengkoka 6,270
b) Tambalugu 197
1 Banggi 11,206 Banggi 11,206
25 Kalabakan-Sapulut 127,625 a) Kalabakan 72,095
b) Sapulut 47,600
c) Sg Serudong 7,930
9,13 Others 151,003 151,003
Sub-Total 1,114,763 41.8%
Grand Total 2,665,886
a Under Ulu Segama-Malua Sustainable Forest Management Project (Source: SFD, 2008)
b Part of Yayasan Sabah Forest Concession
c Formally part of Yayasan Sabah Forest Concession now under Sabah Forestry Department

Revised: 14 March, 2012
35
112. The RIL techniques developed in 1992 were linked to carbon offset. By reducing timber harvesting
damage by 50%, the project reduced carbon emissions compared with the impact of conventional timber
harvesting practices within the YSCA. It was estimated that RIL would reduce CO2 emissions by 40
tonnes/ha over 60 years (Pinard and Putz, 1996). In the same year, the Sabah Foundation concluded a
deal with a consortium of Utilities Companies in the Netherlands to reforest 25,000 ha of degraded
forests by enrichment planting. The Innoprise-Forest Absorbing project (INFAPRO) is estimated to
sequester 350,000 tonnes of CO2, or 14 tonnes/ha, over 60 years.
113. The INIKEA rehabilitation project is a joint-venture between Yayasan Sabah and the Swedish
conglomerate IKEA aimed at enriching burnt and logged forests with indigenous tree species. It is
located in an enclave surrounded by ITP in the north, east, west and further south with oil palm
plantation. The project adopts a phased development approach based on a renewable 3-year contract. In
the case of rubber, a total of 6,235 ha (gross area) had been identified in the eastern portion of the ITP
area with tenureship ranging from 15 to 30 years. The remaining area outside the rubber plantation is
designated for acacia, but the tenure has not yet been determined as development has not started. Total
planted area represents only 5% of the ITP area depending on funding availability. It is now in its 3rd
Phase of Development since 1988. To date, a total of 10,000 ha have been successfully enriched with c.
60 species of dipterocarps and fruit trees. Planting spacing is 10 x 2m separated by a natural vegetation
buffer, which results in an estimated stand density of 333 trees/ha. Planting is only necessary in the
absence natural seedlings; hence, the mean number of seedlings planted per hectare is between 160-200
trees. An important component of this project is that planted seedlings will be monitored and maintained
for 10 years after first planting. Planted areas remain contractually binding until harvestable age at year
60. The mean survival rate of 10-year old planting is between 60 and 70%. An important lesson learnt of
from this project is that it is technically feasible to use indigenous tree species for restoring degraded
natural forests in Sabah (Garcia and Falck, 200370
)
114. While these planned landuses reflect YS’s management strategy to generate revenues to sustain its
operation and address a decline in future timber supply, the integration of biodiversity concerns in
landscape planning and development remains weak.
115. Under the baseline, landuse planning within the proposed site lacks coherence. This weakness is clearly
reflected in the absence of a consolidated management plan for the entire YSCA landscape. To date, the
on-going operations in FMUs 23, 24 and 26 lacks coordination. Prior to 1997, the management of YSCA
was guided by the Yayasan Sabah Forest Management Plan 1984. In the main, the Strategic Plan
identified primary landuses based on biophysical features into production, conservation and plantation
zones within the YSCA. The focus of the Plan, however, was on the sustainable utilization of the timber
resources to be managed on an 80-year rotation. The YSFMP 1984 is now outdated because re-logging
was undertaken prior to the maturity of the 80-year rotation.
116. A serious effort to bring the project landscape under sustainable management has begun in the form of a
collaborative effort between the SFD and WWF-Malaysia. In an MoU signed on the 8th October 2010,
the two parties agreed to participate in the WWF Global Forest and Trade Network-Malaysia (GFTN-
Malaysia) initiative to create an accessible framework for certified wood from FMU23, 24 and 26 (SFD,
201071
). A key output from this collaborative effort will be an action plan that meets the objectives of
obtaining credible certification of the FMUs through improved forest management, provisioning of
market incentives and capacity building within a timeframe of five years from 2010.
SUSTAINABLE FINANCE
117. The Sabah Forestry Department has been pursuing alternative sources of revenue to support its
operations. One of these sources of revenues is linked to Reducing Emissions from Deforestation and
70
Garcia, C. and Falck, J. 2003. How can silviculturists support the natural process of recovery in tropical rain forests degraded by logging and wild
fire ? http://aseanbiodiversity.info/Abstract/52001395.pdf 71 Sabah Forestry Department, 2010. Memorandum of Understanding between the State Government of Sabah and WWF-Malaysia Global Forest Trade
Network-Malaysia.

Revised: 14 March, 2012
36
Degradation (REDD). Early preparatory works related to REDD readiness for Sabah initiated by SFD
have included formulation of REDD policy at the State level, including modalities and sources of
financing. Initial work undertaken by the Sabah Forestry Department to attract REDD investment
includes: (a) commissioning a third party to quantify the carbon potential in the 3.6 million ha forest
reserves, which was estimated at 566 million tonnes worth US$2.8 billion (Sabah Forestry Department,
2010)72
; (b) requesting the state cabinet to identify carbon as a forest product in order to establish
ownership of carbon; (c) adopting best practices (e.g. RIL) to reduce carbon emissions linked to timber
harvesting; and (d) accelerate forest rehabilitation programme in disturbed forests now reported to be
125,000 ha. In addition, Sabah has also established a bio-banking facility through the sales of
Biodiversity Conservation Certificates, and to date a total of 21,500 certificates have been sold. These
initiatives remain at experimental scales; their real impact would only be realized if they are replicated at
state level.
118. In early 2011, the European Union (EU) indicated its willingness to support the State of Sabah through a
programme addressing climate change through sustainable forest management and community
development (SFD, 201173
). The Programme envisages intervention at policy level to complement Sabah
Government activities, and to raise capacities to finalize institutional arrangements and policy reforms
for REDD+. More importantly, the Programme would provide assistance to local communities and other
forest-dependent communities in pilot areas in Sabah to sustainably manage forest resources through
implementation of reforestation and conservation schemes, as well as alternative livelihood scheme. The
long term goal is to contribute to economic development of the target beneficiary groups while at the
same time contributing to reducing the rate of deforestation and associated carbon emission. The
Programme will be supported by a contribution from the EU of €4 million over a period of four years
(2013-2016), together with co-financing from the Sabah Government and/or local stakeholders.
119. Recognizing the importance of water services in Sabah, the State Government, through the Department
of Irrigation and Drainage (DID), is preparing a payment scheme for maintaining watershed services
under the provision of Water Resources Act, 2002. The proposed scheme is based on the costs of
maintaining an acceptable level of water quality for consumptive and recreational uses. The watershed
management costs are derived from the polluters’ costs from the public and private sectors who would be
adopting environment-friendly practices in their timber harvesting or farming activities over the
business-as-usual approach. Potential buyers under this scheme include public sector organizations under
the Agriculture, Forestry, Transportation, Tourism and Energy Ministries, as well as the private sector.
120. The potential for payment for water services in Sabah is also being pursued under the Heart of Borneo
(HoB) programme involving the governments of Malaysia, Indonesia and Brunei Darussalam within the
island of Borneo74
. This tri-governmental initiative is supported by WWF-CARE-IIED under a larger
mandate of securing sustainable sources of finance to move economies of the three countries to a low
carbon and green foundation through strengthening of policy/legislation, provisioning of incentive
schemes and building capacity. Under this initiative, payments for water use may come from
hydroelectric power suppliers, large industrial users, municipal water suppliers, and irrigation water
users to improve water quality and habitat restoration in the watershed.
121. Also under the HoB initiative, Sabah has featured in a “Feasibility Assessment Report for Financing the
Heart of Borneo Landscape: Malaysia (Sabah and Sarawak).”75
The report represents the first (scoping)
stage of HoB’s sustainable financing component, having identified donor, national/domestic and market
based financing options for delivering the Heart of Borneo goals. A synthesis of the Malaysia report was
combined with national reports from Indonesia and Brunei sustainable financing reports into the
“Financing the Heart of Borneo: A Partnership Approach to Economic Sustainability” which was official
released by the three governments at the UNCBD COP 10 in Nagoya, Japan. The priorities and
72
Sabah Forestry Department, 2010. Sabah REDD Update. http://www.gcftaskforce.org/documents.html 73 Sabah Forestry Department, 2011. Information note on programme formulation process on tackling climate change through sustainable forest
management and community development in Sabah 74 Anon. u.d. Financing the Heart of Borneo: A partnership approach to economic sustainability. 75 “WWF and Starling Resources. April 2010. “Feasibility Assessment Report for Financing the Heart of Borneo Landscape: Malaysia
(Sabah and Sarawak)”. Also see “Financing the Heart of Borneo: A Partnership Approach to Economic Sustainability”

Revised: 14 March, 2012
37
recommendations of the “Financing the Heart of Borneo” have led to additional analysis which is
currently underway, the objectives of which include: (i) strengthening the enabling conditions for
financing a sustainable landscape; (ii) assessing the full costs of sustainable landscape management, and
(iii) assessing feasible sources of finance. This stage will culminate in 2012 with a report on the
economics of ecosystems and biodiversity, and investing in green growth, in the HoB. This latter report
will include a modeling component under which various growth scenarios—including scenarios for
green growth based on REDD+ and other mechanisms—are being compared. Follow up stages will
support the design and implementation of financing strategies for operational plans to guide the
management of an economically viable and sustainable HoB landscape.
122. As far as PA finance is concerned, while making clear progress in terms of expanding the networks of
protected areas, the respective agencies are aware that effective management of these PAs requires
adequate funding, along with increased attention to manage these areas sustainably. In addressing these
issues, the respective agencies have initiated numerous partnerships with donors and non-governmental
organizations (NGOs). For example, Sabah Parks is collaborating with the Japan International
Corporation Agency (JICA) in receiving technical assistance and capacity building. Similarly, the Sabah
Wildlife Department is working closely with NGOs such as WWF-Malaysia, HUTAN and Borneo
Conservation Trusts (BCT) in wildlife protection and management. Thus far, coordination among these
agencies has been well managed.
BASELINE SCENARIO
123. Currently, land zoned for agriculture in Sabah totals 2.2 million ha, of which about 1.33 million ha has
already been converted from forest to oil palm. This massive transformation in land use is expected to
continue in the years ahead within the remaining 700,000 ha of agriculture land, as long as oil palm
markets remain strong.
124. By comparison to statelands, changes in the extent of forest reserves in Sabah in the last decade have
been trivial. The shortfall of 7% or 0.52 million ha against the 55% target remains to be fulfilled from
outside the forest reserves through gazettement and, where necessary, afforestation of Stateland. It also
means that there is little room for conversion of natural forests within the forest reserves for other non-
tree crops except for those already being converted. The target of 55% is set against a backdrop of a
rapidly changing landscape in Sabah, particularly outside of the forest reserves. As already noted, in the
last decade, land for agricultural development had expanded rapidly.
125. At this stage, the fate of Sabah’s forest lies not so much with the 2.2 million ha of land either in use by,
or allocated for, the agricultural sector, but primarily with the fate of the permanent forest reserves. In
the short term these forests may be relatively secure, however it is the long term that is of concern. With
land increasingly valued by utility, it may seem untenable to keep such a large land bank as forests
unless values and sources of revenue are realized sustainably. In-roads by large-scale oil palm
development have already occurred within Class II Production forest reserves, totaling about 100,000 ha
and representing 3% of total forest reserve area. The scale of future intrusion is difficult to forecast other
than the 500,000 ha already earmarked for conversion, but for now it is primarily constrained by the
physical features of Sabah’s landscape, whereby most permanent forest reserves are located in steep
areas or ridges and remote areas. This fact will put a ‘natural’ brake on conversion, given that land
preparation for oil palm development requires mechanized land clearing, which is not economically
feasible in steep areas.
126. If activities in the production landscape proceed according to business-as-usual (see site-level threats
description above), the ability of Maliau, Danum and Imbak conservation area systems to achieve their
intended conservation outcomes will be significantly jeopardized. These areas would become ecological
islands lacking appeal to a visitor whose access to these areas must pass through the conservation-
incompatible production landscape. More importantly, the 261,264 ha project landscape is an important
ecological corridor for plants and wildlife; thus, the predictable impacts from the business-as-usual
activities are loss of biodiversity and connectivity among existing PAs.

Revised: 14 March, 2012
38
PART II: PROJECT STRATEGY
2.1 Project Rationale and Policy Conformity
PROJECT RATIONALE
127. Sabah has been an avid proponent of Sustainable Forest Management (SFM) since 1997. This is a logical
move given that 50% of its land bank is locked up as forest reserves. These forest reserves offer a variety
of goods and services that will benefit future generations of Malaysians living in Sabah.
128. Based on recognition of the importance of the forest heritage in providing various goods and services, a
multiple-use forest management (MUFM) approach has been adopted as one of the potential
conservation and development alternatives to contemporary forest management approach that tends to
focus only on a limited range of forest uses, in particular, timber benefit. A growing global population
has also increased the need for food, medicine, clean air, water and recreation—the main sources of
which are natural forests (Baskent and Yolasigmaz, 200076
).
129. An important element of an MUFM approach is a greater emphasis on, and integration of, biodiversity
conservation within the management of a ‘functional landscape’. A functional landscape refers to the
capacity of an area to maintain healthy, viable targets and sustain key ecological processes within their
natural ranges of variability over the long term (Poiani and Richter, u.d.77
). Another key element is that
of sustainable financing, which involves ensuring adequate levels of revenue generation and retention so
that management of the landscape is not dependent on external subventions / subsidies.78
130. At the outset, the above described approach appears to be relatively simple to implement. In reality,
however, managing a multiple-use forest landscape while conserving its biodiversity and ecological
functions requires an enormous effort to strike an optimal balance among the competing landuses in
terms of social, ecological and economic objectives79
. Both biodiversity as well as financing goals are
linked to land use choices, various combinations of which will lead to alternative financial and
conservation outcomes. As a result, modeling of alternative land use choices becomes an additional,
important factor in the planning process. Successful cases of MUFM in the Asia Pacific are few, and
non-existent in Sabah. On the contrary, unplanned landuses within multiple-use forest landscapes are
many, and likely to degrade further the inherent landscape biodiversity and ecological functions, while
failing to be financially sustainable. The root causes of these ad-hoc uses are associated with a complex
web of political and economic drivers.
131. The proposed project landscape of 261,264 ha exemplifies a multiple-use forest landscape that lacks the
necessary synergy in mainstreaming biodiversity in terms of landscape connectivity, management
control, and sustainable financing. It includes areas under a variety of management designations and uses
namely: 180,426 ha of Production Forest Reserves, 43,821 ha of Industrial Tree Plantations, 18,500 ha of
enrichment planting, and 18,517 ha of conservation forests. Major landuses adjacent to the proposed
project landscape, and in theory under common management within the YSCA, include 132,640 of
Protected Forest Reserves and 109,500 ha of oil palm plantations.
76 Baskent, E.Z. and Yolasigmaz, H.A. 2000. Exploring the concept of a forest landscape management paradigm. Turkish Journal of Agriculture
Forest 24:443-451. 77 Poiani, K. and Richter, B. u.d. Functional landscapes and the conservation of biodiversity. Working papers in Conservation Science #1. The
Nature Conservancy. 78
Indeed, in the case of YS holdings as a whole, the expectation is that the area will generate surpluses for investment in
socio-economic programmes benefitting local populations. 79 For a discussion of modeling of alternative land use combinations in forest landscapes, see , e.g., Polasky, Stephen, et.al. 2008. Where to put things?
Spatial land management to sustain biodiversity and economic returns. Biological Conservation 141: 1505-1524. See also Nelson et. al. 2009.
Modeling multiple ecosystem services, biodiversity conservation, commodity production, and tradeoffs at landscape levels. Frontiers in Ecology
and the.Environment; 7 (1 ): 4–11
Revised: 14 March, 2012
39
132. Hence, the primary objective of the proposed project is to institutionalize a multiple-use forest landscape
planning and management model which brings the management of critical protected areas and
connecting landscapes under a common management umbrella, implementation of which is sustainably
funded by revenues generated within the area.
133. Assistance provided by GEF will strengthen the conservation of the largest area of mostly contiguous
forest in Sabah, and one of the most important remaining forest landscapes in the Heart of Borneo.
Extensive global benefits are expected given the high levels of biodiversity within the project landscape.
Improved management of this critical landscape will reduce pressures on three globally-recognized
conservation areas located adjacent to the proposed project target landscape: Danum Valley, Maliau
Basin and Imbak Canyon, which together encompass 119,390 ha of irreplaceable tropical forest. The
project will lead to increased viability within the project landscape of globally threatened species such as
orang-utan, proboscis monkey, sun bear, pygmy elephant and others. Threats to the globally-significant
biodiversity of the area will be reduced in the following ways: (i) increased resilience of ecosystems
through enhanced connectivity and reduced risk of forest fires (the threat of which is expected to
increase with climate change); (ii) conservation of habitat and constituent biodiversity within landscape
areas connecting PAs; (iii) reduced threats to BD in PAs that arise outside their boundaries, such as the
loss of vital animal migration routes; (iv) expansion of PAs, which would bring c. 50,000 ha under
enhanced protection, and; (v) enhanced management effectiveness, linked to a combination of increased
financial resources and improved cost effectiveness of spending. Additional global benefits will be
generated by a demonstration effect through which financial and management models developed were
disseminated and adopted in other parts of the Heart of Borneo.
POLICY CONFORMITY
134. The Project is designed to respond to GEF Strategic Objective BD-SO1, which is to catalyze the
sustainability of protected areas. Within this Strategic objective, the project will support biodiversity
strategic programs (SP3) in strengthening terrestrial PA networks, and SP1 in sustainability financing of
PA systems at the National Level. Among the planned activities, the Project will create biodiversity
corridors and, if necessary, additional protected areas, to strengthen the system of PAs in the State of
Sabah. The resulting improved ecological integrity of the PAs will contribute to the objectives of BD-
SP3. Component 3 outputs on Sustainable Financing are consistent with BD-SP1. These will create
sufficient and predictable revenue flows in the State with the approaches having the potential for
replication in other PAs in the State and nationally to address system-wide concerns.
135. The project will also ensure that biodiversity conservation will be incorporated into broader forest policy
and regulatory frameworks in the proposed demonstration forest landscape. The outcome and outputs
specified in Component 2: Multiple-use Forest Landscape Planning and Management are consistent with
SP4: Strengthening the policy and regulatory framework for mainstreaming biodiversity, which falls
within GEF Biodiversity Strategic Objective BD-SO2 - to mainstream biodiversity in production
landscapes/seascapes and sectors.
2.2 Country ownership: country eligibility and country drivenness
136. The proposed Project is consistent with Malaysia’s National Policy on Biological Diversity (1998), in
particular, Strategy 15: Establish Funding Mechanisms; Strategy 4: Strengthen the Institutional
Framework for Biological Diversity Management; and Strategy 6: Integrate Biological Diversity
Considerations into Sectoral Planning Strategies. The proposed Project is also anchored on Sabah’s
policies. The Outline Perspective Plan (OPPS), covering the period 1995-2010, aims to create a socially
and politically stable environment through efficient management of the State’s economy. Item 4.6 of this
Plan highlights the State’s intention to ensure reliable and sustainable raw material supply, implying the
formulation of sensible and effective conservation strategies for natural resources such as forests, land
and marine life. In pursuance of these policies and plans, the State has set aside about 3.6 million ha or
48.14% of Sabah’s total land area as Permanent Forest Estates (PFE). In order to achieve the dual

Revised: 14 March, 2012
40
objectives of economic utilization and environmental conservation, the PFE are further designated into
seven classes of forest reserves, i.e., protection, production, domestic, amenity, mangrove, virgin jungle
and wildlife forest.
137. The drive for SFM in Sabah followed from its successful implementation in Deramakot Sustainable
Forest Management Model which was awarded an internationally recognized “well-managed forest”
certificate by the Forest Stewardship Council (FSC) in 1997. The recognition provided the impetus for
the State to replicate the Deramakot model in all Class II commercial forest reserves covering
approximately 2.67 million ha. It has now directed all concessions to obtain certification from any
credible internationally-accepted schemes by 2014.
138. With Sabah as one of the key areas for the trilateral Heart of Borneo (HoB) Initiative, the project will
support the enhancement of the State’s strategy for this initiative and will thereby contribute to
Malaysia’s strategy as a whole. The project area is considered an important component of the HoB
initiative which focuses on the following three priorities: (i) maintenance of forest connectivity through
the strengthening of the Protected Area Network; (ii) establishment of sustainably managed forested
corridors connecting these areas; and (iii) the opportunity for enhanced transboundary co-operation.
Through the HoB initiative, the project will coordinate closely with the Sustainable Forest and
Biodiversity Management in (the Indonesian side of) Borneo, a project concept for Indonesia that was
recently approved by GEF Council with Asian Development Bank (ADB) as the lead agency.
2.3 Design principles and strategic considerations
139. The design principles of the proposed project follow the guidance of the GEF-4 strategic framework
under the biodiversity portfolio in mainstreaming biodiversity in production landscapes and sectors. This
will contribute to internalizing the goals of biodiversity conservation and sustainable use of biological
resources into economic sectors and development models, policies and programs.
140. GEF’s intervention will focus on removal of barriers to sustainable management of the project landscape,
while generating spin-off benefits to adjacent protected areas networks. Barriers were defined as the sub-
optimal functioning of three components of biodiversity conservation in a multiple-use forest landscape
in Sabah. Funds provided under GEF will be used to finance the incremental costs of measures to
mainstream biodiversity without subsidizing the costs of enterprises in doing regular business and taking
due precautions to ensure the sustainability of outcomes. As per GEF practice, no GEF funds will be
used to support any form of timber harvesting.
141. Mainstreaming activities will fall under the following approaches:
influencing the policy framework governing the forest management sector, including
sustainable finance work aimed at altering incentives;
enhancing capacity to address biodiversity management needs in forest management sector by
building management expertise, tools, capacity to account for and monetise natural capital, etc.
operationalising integrated multiple use forest land management models, working with
champions in the forest management sector
sensitizing decision makers to the need for increased investment in biodiversity-friendly
production practices, etc.
142. The project design will take full advantage of the existing national and state-level linkages, set up under
the Ministry of Natural Resources and Environment (NRE), State Economic Planning Unit (SEPU) and
State Forestry Department (SFD). Both MRE and SEPU will act as coordinating bodies dealing with
international and domestic affairs related to project approvals, coordination, monitoring and reporting.
The Executing body is the SFD, which has jurisdiction over state forestry matters in accordance with the
Federal Constitution of Malaysia (1957). State and National forestry objectives are streamlined under the
National Forestry Council (NFC) that falls within the ambit of the National Land Council (NLC) whose
chair is with the State-Federal Minister.

Revised: 14 March, 2012
41
143. The project’s scope and catalytic approach is designed to unify support to sustainable landuse in the
project area, while stimulating new, additional coordinated support. The approach will be further
strengthened through a strong reliance on partnerships with donors and other stakeholders across the
region that are active in support to sustainable forest management of production landscapes and PAs
and/or PA finance, as a means of covering more ground and stimulating further replication.
144. The project will serve as a model to catalyze innovation in processes and increase management know-
how in achieving an optimal balance across potentially competing uses, one which maximizes economic,
social and environmental benefits to society. Lessons from the project will be used to develop guidelines
and best practices to upscale the approach in other forest landscapes within the State and in other parts of
Malaysia and the Heart of Borneo.
2.4 Project Objective, Outcomes and Outputs / Activities
145. The project objective is to institutionalize a multiple-use forest landscape planning and management
model which brings the management of critical protected areas and connecting landscapes under a
common management umbrella that is sustainably funded by revenues generated within the area. The
project proposes to achieve its objective through three interconnected and complementary components.
The first component focuses on strengthening Sabah’s policy framework to mainstream biodiversity and
to finance its conservation within the multiple-use forest landscape, along with support to improved
institutional capacity. The second component involves demonstrating how to operationalize the multiple-
use forest landscape management concept, with lessons learnt to be made available for replication
throughout Sabah and elsewhere. The third component focuses on developing innovative sustainable
financing options appropriate to the landuses within the project landscape.
Component 1: An enabling environment for optimized, multiple-use planning, financing,
management and protection of forest landscapes
146. Under Component 1, GEF support will focus on ensuring that multiple use forest landscape
management systems are designed, managed and financed in ways that ensure the conservation of
biodiversity. This will include support for the development and implementation of policies aimed at
achieving no net loss (NNL) /net gain in biodiversity through fact-finding, evaluation of policy options,
development of the necessary biodiversity information, policy formulation and system design and
capacity building. The Sabah Forestry Department believes that there are merits in the adoption of NNL
initiative particularly to promote conservation in the State, and capturing innovative funding through this
venture (Sabah Forestry Department, 201080
). GEF will also support is the creation of an enabling
environment to permit the introduction and implementation of innovative sustainable funding through
REDD+, bio-banking and PES mechanisms. There are five inter-connected outputs under this component.
Output 1.1 New State-level policies and regulations for implementing NNL/NG and incorporating
biodiversity and ecological function conservation objectives into the integrated planning and
management of forest protected areas and surrounding or connecting landscapes
147. The project will support changes in the regulatory and planning framework needed to enable
enhanced conservation of forest ecosystems and biodiversity. This will include support for revised
policies, regulations and administrative processes needed to put in place no net loss / net gain (NNL/NG)
policies. In addition, GEF will support the establishment of a landscape-level planning mechanism which
incorporates and integrates biodiversity and ecological function conservation objectives into the planning
and management of forest protected areas and surrounding landscapes. This output will be mainly co-
financed, with a limited amount of GEF funding for the development of the policy options.
148. This output will draw upon experiences from the Sabah Biodiversity Centre, Sabah Park, Sabah Forestry
Department, Wildlife Department, Environmental Protection Department and the Ministry of Science
80 Sabah Forestry Department, 2010. Sabah no net loss workshop. 17-18 June 2010. Sandakan, Sabah.

Revised: 14 March, 2012
42
and Technology Unit. Other relevant stakeholders include non-governmental organizations such as
WWF-Malaysia, HUTAN, Borneo Conservation Trust (BCT) and Land Empowerment Animals People
(LEAP). The project will include a consultation process with stakeholders to discuss the proposed
regulatory and policy amendments, seek consensus and support and identify champions who will lead the
advocacy. Finally, it should be noted that the Sabah Forestry Department has already started work on this
output at the state-level process in collaboration with BBOP and WWF-Malaysia.
Output 1.2 New state-level policies and regulations for generating and disbursing revenues at landscape
level from innovative financing mechanisms
149. GEF support will contribute to the development of a transparent and credible system of revenue
generation, disbursement and re-injection to sustainable forest management and PAs in the surrounding
landscapes. Three revenue generation mechanisms will be supported: (i) REDD+, (ii) biodiversity offsets
and (iii) PES. GEF support will address key constraints related to existing policy and regulations in
increasing and diversifying new sources of revenues for PAs and mainstreaming of biodiversity in
production forests. The output will also support the development of mechanisms for disbursing and
allocating revenues generated from new sources. Both elements will help to enable site-level work under
Outcomes 2 and 3. The intention is to ensure that these funds are used effectively in support of
biodiversity conservation, are distributed efficiently between stakeholder groups and project landscapes,
and are administered and managed in a transparent and accountable manner.
Output 1.3 Enhanced capacities of staff at institutional levels to design, implement and manage/oversee
multiple-use, landscape level forest management and sustainable financing schemes, including enhanced
capacities to monitor ecosystem service markets
150. A program for capacity development will be developed based on the findings of the capacity scorecard
(see Annex 5). The results of the capacity assessment will serve as starting points for defining a capacity
building program for key stakeholders. The training will address barriers that limit institutional capacity
to effectively support the functioning of multiple-use forest landscape management. The project will
address systemic gaps and barriers in order to enable: (i) the main government agency, i.e., Sabah
Forestry Department (SFD) and its regional offices, to support mainstreaming of biodiversity in
production forest landscapes and an expanded area of PAs; (ii) local governmental agencies such as the
State Economic Planning Unit (SEPU), State Natural Resource Office (NROS), Ministry of Finance
(MoFS), Sabah Biodiversity Centre (SBC), Environment Protection Department (EPD), Sabah Wildlife
Department (SWD) and Department of Irrigation and Drainage (DID) to support such efforts in kind and
through the budgetary process; (iii) private sector or statutory bodies, in particular, the Sabah Foundation
(YS), to improve their human capacities in planning, managing and protecting multiple-use forest
landscapes, and (iv) non-governmental agencies to improve their capacity.
151. GEF support will, in particular, be provided to improve the awareness, skills and competence of staff at
three management levels: (1) senior policy makers in government; (2) senior executives in corporations;
and (3) technical specialists in government, companies, environmental consultants, universities, research
institutes, NGOs. Each training sessions for the respective group will last 2 to 3 days depending on
lessons learnt from previous workshop. In addition to the technical training, GEF support will include
intra- and inter-organizational team building sessions as part of an annual event for sharing of lessons
and/or good practices in multiple-use forest landscape management. The team building sessions will
facilitate a closer rapport among staff, enhanced exchanges among practitioners and managers in
understanding significant threats to biodiversity, and will serve as a basis for a shared corporate vision.
152. A key element of the capacity building effort, both direct for practitioners and in the form of reporting
lessons learned for policy makers, etc., will be the emphasis placed on biodiversity and ecosystem
monitoring. Responsibility for monitoring of impact indicators employed by the project (see Annex A,
Project Results Framework) will rest with SFD and YS. Key staff will be given training in methods
needed to effectively monitor and report on all project indicators; following the project, these findings
will serve as the basis for long-term impact monitoring within the project landscape, while skills learned
will be replicated in monitoring of other landscapes in Sabah. In addition, training will be provided in
field operations associated with effective regulatory enforcement. This will link closely to, and

Revised: 14 March, 2012
43
complement the implementation of, Output 1.4, which focuses on enhanced systems for compliance
monitoring and enforcement.
Output 1.4 Enhanced cost-effective systems for compliance monitoring and enforcement of multiple-use
forest regulations81
153. The project will support the adaptation of existing environmental monitoring and enforcement systems
for optimized operation within a system of multiple-use forest landscape management. Baseline
monitoring and enforcement systems to be revised include: (i) compliance audit of Sustainable Forest
Management Licence Agreement (SFMLA), (ii) Timber Legality Assurance System (TLAS), (iii) forest
certification system, (iv) Environmental Compliance Audit, and (v) forest operation compliance audit .
In addition, METT will be used as a tool for measuring baseline effectiveness in staff capacity,
management efficiency and budget lines for comparison among sites (e.g. Maliau, Danum and Imbak).
154. New cost-effective M&E systems developed under this output will be piloted within the project target
landscape82
in order to determine whether field-level operations are within compliance and whether the
standards themselves need to be adjusted / strengthened through an iterative, adaptive management
approach. Where feasible, cost benefit considerations would be applied to such regulatory tightening
efforts.
155. Key characteristics of the M&E system will include the following: (i) it will be relatively simple to use
and easy to analyze for decision-making and adaptive management; (ii) it will be pragmatic, taking
account of local conditions and limitations; and (iii) it will reflect the local practices that are already
being undertaken in specific sites, with flexibility to further improve the system. Lessons learnt will then
be translated into a manual and a training program.
156. A program for orientation and training will be conducted to ensure sufficient understanding of the M&E
systems to keep track of progress and feedback. Information generated by the M&E frameworks at site
level will be linked with the indicators to be established under Outcome 1.3 on capacity building. A pool
of potential trainers will be identified from amongst key stakeholders and will be trained as instructors to
maintain a sustainable M&E system.
Output 1.5 State and national guidelines and operational policies for multiple-use forest landscape
planning, management and conservation that build on the lessons learned from work at the target
landscapes83
157. The land use trend within the permanent forest reserves in Malaysia is moving towards multiple-uses
(natural forest management, industrial tree plantation, rubber plantation, enrichment planting, etc).
However, management practices within the forest management units are lagging, leading to the loss of
biodiversity. This project focuses on optimizing biodiversity over a large forest landscape with multiple-
uses that need to be undertaken with appropriate scale and intensity. Having state-level guidelines for
multiple-use landscape planning would help to ensure consistency in decision making regarding landuses
within forest reserves. It will complement and build on the guidelines that have been developed for
RIL/INIKEA/SUAS, which are site-specific projects.
158. The project will support the preparation of national/state guidelines and operational policies related to
multiple-use forest landscape planning, management and conservation. These guidelines/ policies will
build on lessons being learned at the target landscape. The scope to be covered by the national/state
guidelines would include, but not be limited to, the following: (i) the guiding policy within the
national/state framework; (ii) management objectives of the project landscape; (iii) the strengthened
structure of the Management Committee and related sub-bodies to manage specific aspects of the
production forest landscape; (iv) definition of the specific roles, powers and functions of the
Management Committee, and; (v) the day-to-day management of the area.
81 This output will be fully co-financed. 82 See Output 2.3 description. 83 This output will be fully co-financed

Revised: 14 March, 2012
44
159. Operational manuals will be prepared for each type of planning and management arrangements, namely:
(i) planning framework; (ii) technical guides for the setting up and functioning of target landscape, (iii)
manuals for implementing specific mechanisms, and; (iv) toolkits for auditing M&E system. Assistance
will also be provided in enabling wider understanding and support for multiple-use forest landscape
planning and management by other stakeholders through preparation and dissemination of corporate
leaflets and information packs.
Component 2: Demonstration of multiple-use forest landscape planning and management
system
156. Under this component, the project will define and work to implement an optimal mix of production and
conservation land uses within the target landscape.84
In order to do this, GEF support will be utilized to:
(i) select/develop and implement an environmental economic land use planning model that incorporates
biodiversity and ecosystem function targets within the forest landscape; (ii) prepare a landscape
management plan based on a combination of land uses selected using the model, and; (iii) support pilot
implementation of the landscape-level management plan. As a result of project activities, species and
ecosystem biodiversity will be conserved in 261,264 ha of the Kalabakan-Gunung Rara area within a
sustainably managed forest landscape, and pressure on the adjacent conservation areas will be decreased.
Output 2.1 Economic model to determine optimal mix of production and conservation land uses to
maximize sustainable revenues from, and conservation of, the demonstration landscape
157. Forest landscape level planning requires assessment and implicit valuation of tradeoffs among timber
production, recreation, water quality, and strict habitat conservation for wildlife. GEF support will
demonstrate a method that combines economic and ecological models in a dynamic and spatial analysis
to evaluate land use decisions and cost-effective alternatives among competing land uses. Two candidate
models were short-listed during the PPG (see Annex G for details of the assessment): (i) InVEST, which
is being applied by WWF and partners in the Heart of Borneo project and (ii) CBioD, which is being
developed with GEF support in Peninsular Malaysia.85
A final decision regarding which of these
models—or possibly some combination of the two—should be applied in the project landscape will be
made during the first year of the project in consultation with a wide range of stakeholders.
158. Data collected under Output 2.1, together with values generated under Output 3.1, will be fed into the
selected landscape planning tool for defining an optimal land use plan and for estimating optimal site-
level expenditure levels. The planning model will include the following features: (i) spatial
considerations, because species populations depend upon the spatial pattern of habitat as well as the
extent of habitat; (ii) incorporate dynamics in the model because forests harvesting patterns generate
timbers stands of different ages. Economic analysis will thus help to determine the trade-offs between
agro-forestry expansion and the loss of forest cover, ecosystem functionality and biodiversity and to
identify a set of land uses—including revenue generating conservation options—which provide an
adequate and sustainable level of revenues while sharply reducing net impacts on biodiversity and
ecological functions, as compared with the baseline scenario. This will help to highlight the cost to
society of inaction (i.e., baseline scenario) and to inform conservation interventions in support of
financial sustainability of conservation areas. A training program will be conducted to ensure sufficient
understanding of the tool and to generate relevant information for analysis.
Output 2.2: Landscape-level management plan based on optimal combination of land uses including PAs
and sustainable production
159. At present, Sabah Forestry Department is responsible for developing the forest management plans for
individual FMUs. The plans include some targets related to biodiversity; however there is room for
84 SFD has confirmed during the PPG exercise that there will be no palm oil development within the project landscape, therefore this
land use option will be excluded from the analysis. 85 PIMS 1370 Conservation of Biodiversity Through Improved Forest Planning Tools Project.

Revised: 14 March, 2012
45
improving compliance monitoring systems for biodiversity/ecosystem safeguards based on clear and
robust biodiversity and ecosystem health indicators at the landscape level. The value added of landscape
level management planning lies in the ability it provides to take larger-scale ecological factors into
account while making land use decisions across a variety of productive and conservation units. The
global biodiversity benefits of such an approach are due to the richness and significance of the target
landscape and its role as a biological corridor connecting three important conservation areas.
160. The development of the target landscape-level plan will begin with assessment and mapping of
biodiversity targets within the project landscape, in particular, their importance to ecological
sustainability and functioning. GEF support will include a biodiversity assessment of the project
landscape to identify biodiversity targets, support classification of habitat types, application of offsets
and biodiversity banking, assurances for long-term outcomes that account for pressures from economic
drivers and climate change, site selection and potential designation of biodiversity/carbon credit types.
Based on these biodiversity overlays, and utilizing the land use model developed under Output 2.1, a set
of possible alternative management interventions will be identified. The features and elements of the
resulting landscape-level management plan will include a description of the landuse zones, forest
resource base, management standards and programmes, organization, manpower requirements, and
implementation schedule and control. In particular, it will emphasise biodiversity conservation goals and
sustainable management of natural resources. Development of the plan will offer an opportunity to
design and test a process for seeking consensus with key stakeholders on the management objectives of
the multiple-use forest landscape.
Output 2.3: Pilot, adaptive implementation of landscape-level management plan, including new PA
establishment and implementation of sustainable use management system based on sustainable off-take,
monitoring and enforcement
161. Under this output, the project will demonstrate the feasibility of the multiple-use forest landscape model
developed under Output 2.1 to support adaptive management of the target landscape based on the
landscape-level management plan developed under Output 2.2. A first step will be development of a
work plan and operational system on the ground for implementation of the management plan. This will
include allocation of necessary human resources and budget for the management actions. GEF support
will be used to operationalize new ideas and systems prescribed in the landscape-level management plan
at a pilot scale prior to scaling-up operations to gauge lessons learnt from these pilot efforts. The pilot
work will develop new technology, transfer of technology, transfer of skills and/or determine indicative
costs of scaled-up operations.
162. Pilot application of enhanced M&E systems will also take place under the management plan. This will
include a combination of desk and field work through which increased volumes and enhanced quality of
field-level data will be gathered, analysed and compared with baseline standards in order to determine
whether field-level operations are conforming to existing laws, regulations and standards. These will
include both process and impact indicators aimed at assessing both compliance as well as at fine tuning
the standards themselves. Thus, for example, it may be determined that despite compliance with existing
standards, biodiversity and/or ecosystem function indicators were in decline; in this case, the standards
themselves would need to be adjusted through an iterative, adaptive management approach. Where
feasible, cost benefit considerations would be applied to such regulatory tightening efforts.
163. Finally, based on the model / management plan, the project will undertake the defined steps to legally
designate at least 50,000 ha. of new conservation areas within the project landscape. The process will
begin with an inventory of sites that should be designated as conservation areas. Selection of the sites
will be based on biodiversity importance of the sites, connectivity, provision of ecosystem services, etc.
Regional offices of SFD, including national and local NGOs, will be encouraged to nominate these areas
according to existing or new procedures to be developed under Output 1.1. Selection criteria will be
based on existing laws and/or lessons learnt during the process in Output 1.1. Development of a
biodiversity and habitat condition monitoring system as well as development of management
infrastructure will be supported. Where appropriate, habitat rehabilitation will be conducted with the
aim of restoring natural wildlife habitats.

Revised: 14 March, 2012
46
164. Support will be provided for reviewing and updating the workplan under the management plan through a
participatory process. At the same time, existing guidelines and procedures for preparing management
plans will be reviewed to improve the quality and the scientific basis upon which the plans were formed,
as well as to enhance the quality and ownership in the plan. The latter’s involvement will be secured by
developing procedures for harmonizing the landscape-level management plan with the regional and
State’s development and physical framework plans, as well as the sectoral development plans of other
government agencies. To improve the review process, the implementing agency will be supported in
developing appropriate standards for review of the management plans.
Component 3: Sustainable financing of protected areas and associated forest landscape areas
demonstrated at the pilot site
165. Under this outcome, the project will support the design and development of three alternative revenue
generation schemes and disbursement using pilot modalities of REDD+, biodiversity offset, and PES
corresponding to output 2.4 for scaling-up to the whole project landscape. A range of activities
associated with pilot implementation of these instruments will be supported under this component,
including: identification of exact location, buyers and sellers and stakeholders for different mechanisms;
design, negotiation and formalization and operationalisation of the mechanisms; development of a robust
mechanism for monitoring, reporting and verification of services, and payment distribution mechanisms;
and support for communication and capacity building of decision makers, state government officials and
local stakeholders, including communities.86
A program of capacity building will be supported to
develop, implement and manage these mechanisms and instruments in a systematic and transparent
manner. The overall aim will be to increase the amount of funding flowing to multiple-use forest
landscape authorities while also providing financial incentives for other stakeholders to participate more
actively in biodiversity conservation. The outcomes and outputs for this component are described below.
Output 3.1: Environmental economic and financial analyses of actual and potential land use scenarios
incorporating estimates of landscape level total economic value, including ecosystem services,
conservation and other values
166. This output will investigate the economics of different land uses, their financial and socio-economic
benefits and their environmental costs. These estimates will be used to calculate the environmental
economic costs and benefits, as well as the revenue generation potential, associated with different mixes
of land uses within the landscape, comparing trade-offs between baseline and alternative mixture of
landuses with in the project landscape. It will estimate the total economic benefits of different scenarios
in the landscape, including direct and indirect use values, option value and bequest value. The findings of
the analysis will be used in estimating parameters for the model being developed under Output 2.1, and
will thereby influence land use decisions and the content of the landscape management plan in the
direction of enhanced conservation. In physical terms, the analysis will thus support a tool for reducing
the environmental economic impacts on biodiversity and ecological functions and loss of natural capital,
associated with the combined set of land uses throughout the landscape, as compared with a baseline
scenario. The analysis will also help to optimize the location of potential revenue generating
mechanisms, with the goal of channelling additional revenues to conservation. As an integral part of this
output, training will be provided on the application of economic and financial tools for landscape
86 In the target landscape, there are only a small number of resident workers. The three adjacent conservation areas have no local
communities per se within the reserves except for a small number of workers. Altogether, there are approximately 2,000 people in the
neighbouring communities. The nearest local communities are living in Kalabakan district, which is located 80 km from the project
site. While most of the conservation actions related to the PES mechanism in the landscape are likely to be carried out by Sabah
Foundation employees, there will be increased job opportunities for local communities for certain activities, e.g., planting riparian
reserve. In addition, the livelihood of many communities is dependent on river water, whose upper watershed is located within the
project site, as well as ecotourism resources within the three adjacent conservation areas. Therefore, the project will benefit these
distant communities by significantly reducing pressure on biodiversity within the protected areas, as well as by ensuring sustainable
supply of ecosystem services. During the detailed design of the PES mechanisms, the project will ensure full involvement of the local
communities (beyond the target landscape where applicable) or relevant stakeholder, and ensure equitable and transparent benefit
sharing.

Revised: 14 March, 2012
47
planning. GEF funds will bring in the incremental expertise for quantifying and valuing the true
economic benefits of various land uses including environmental costs and costs of conservation actions.
Output 3.2: Pilot implementation of revenue generating mechanisms
167. A preliminary environmental economic analysis has been undertaken at the project landscape level
during the Project Preparation Grant (PPG) to highlight the cost of inaction (i.e. baseline scenario) and to
pre-assess the feasibility of potential interventions in support of financial sustainability. Based on this
work, three revenue generating options have been identified as being most promising for pilot
implementation. These are: (i) biodiversity offsets / biobanking, (ii) PES, (iii) REDD+.
168. The main objective of this output will be to develop and implement a detailed, landscape-level strategy
for diversifying revenue generation away from traditional sources (i.e. timber revenue). This will be
achieved through a combination of innovative financing mechanisms associated with REDD+,
biodiversity offsets and PES mechanisms. Detailed scoping and market studies will finalize the selection,
design and matching between specific locations with the project landscape area and instruments. During
the detailed design of the PES mechanisms, the project will ensure full involvement of the local
communities (beyond the target landscape where applicable) or relevant stakeholders, and ensure equitable and
transparent benefit sharing. Following this step, the selected schemes will be operationalized at pilot
scales. A range of activities associated with pilot implementation of these instruments will be supported
including: identification of exact location, buyers and sellers and stakeholders for different mechanisms;
design, negotiation and formalization and operationalization of the mechanisms; development of a robust
mechanism for monitoring, reporting and verification of services, and payment distribution mechanisms;
and support for communication and capacity building of decision makers, state government officials and
local stakeholders, including communities.
169. By the end of the project, three revenue generating mechanisms, including REDD+ / carbon, biodiversity
offsets and PES, have been designed and piloted, with total annual revenues projected to reach at least
50% of optimal management costs within five years following project In addition to these site-level
benefits, the results will generate lessons learnt in developing policy guidelines and scaling-up
imperatives with respect to administrative, financial and operational jurisdictions (ref. Outcome 1).87
Output 3.3 Detailed operating and financial agreements between SFD and private sector and other
partners
170. It is essential that all new arrangements made under the project are documented in legally-binding
memoranda of agreement (MOA) with measurable performance indicators for future references. The
scope of each MoA should include, but not be limited to the following: the parties involved, purpose,
duration, parties’ obligations, financial arrangements, and termination clauses. GEF support will be used
to support the preparation and execution of these MoAs.
Output 3.4: Financial accounting and monitoring of agreements
171. A transparent and coordinated accounting and monitoring system will be put in place. This will include:
(i) systems for receipt, record and reporting on financial performance; (ii) operational and efficient
disbursement, (iii) third-party audit procedure of appropriate scale and intensity, and (iv) link measurable
performance indicators to financial management. Accounting data will be packaged and presented in
ways that contribute to system-level decision making, planning and budgeting. This aspect of the work
will require capacity building of individuals and institutions in various areas of financial management.
Training in the use of the full system will be provided.
172. A reporting and evaluation system will be developed to report on how effectively landscape managers
use their finances in achieving their stated objectives. This will include both system and site-level
management effectiveness assessments and will serve as an important mechanism for linking financial
87
Notwithstanding the above, should landscape-level data gathering determine that other revenue-generating options may be of equal
or greater sustainable benefit than the three selected above, such instruments may be incorporated into the project strategy as part of an
adaptive management approach.

Revised: 14 March, 2012
48
and management performance. It will also support annual reviews in which site level re-allocations will
be possible. As a result, landscape revenues and expenditures will be fully and accurately reported by
landscape authorities to stakeholders.
Output 3.5 Tested and operational systems for allocation and re-injection of revenues into PAs and
landscape level management
173. GEF will support the development of mechanisms for allocating and disbursing the revenues generated
by activities within the project landscape. The intention is to ensure that these funds are used effectively
in support of biodiversity conservation, are distributed efficiently between stakeholder groups and PA
sites, and are administered and managed in a transparent and accountable manner.
174. Under this Output, training courses will be designed and delivered to relevant key stakeholders that deal
with identifying, designing, marketing and implementing new PA revenue generation and disbursement
mechanisms. At least one national-level course and one course at the state level will be held. These will
provide valuable opportunities to communicate and share the project’s approach and experiences with
others from different states. At the site level, targeted training will be provided on the design and
implementation of the revenue mechanisms which have been selected for development by the project.
Output 3.6: Tested and operational financial systems for benefit-sharing
175. This Output will ensure that there is in place an agreed arrangement where benefits and costs are shared
among relevant stakeholders including Sabah Forestry Department, Sabah Foundation and potential
investors. A first step will be to estimate budgetary requirements for effectively implementing the
management plans. Resource mobilization plans will then be prepared which will consist of a
combination of traditional funding sources such as contributions from Sabah Foundation, budgetary
allocations from the State Government, and funds raised by NGOs working at the site, along with other
innovative revenue generating mechanisms. In-kind contributions from other sources will also be
harnessed. Similarly, arrangements will be made for benefit-sharing arising from revenue generation
related to carbon or biodiversity offsets or other financial instruments.
Output 3.7: Adaptive financial management, including shifting balance of desired uses based on
changes in ecosystem markets
176. There will be a periodic review of the financial management system put in place by the project in line
with Output 3.4. The review system intended will draw lessons learnt from credible institutions in the
region, national or state practices. This will serve as an important link for adapting present financial
arrangements with site level re-allocations in terms of changing desired land uses. As a result, revenues
and expenditures will be accurately reported by landscape authorities to stakeholders.
2.5 Key Indicators, Risks and Assumptions
160. The complete project indicators are detailed in the Result Framework in Section II of this Project
Document. Key indicators and targets by components are listed in Table 10.
Table 10. Project indicators and targets
Project Strategy Objectively verifiable
Indicators Target
Objective: To
institutionalize a
multiple-use forest
landscape planning
and management
model which brings
the management of
critical protected
areas and connecting
Conservation of globally
and nationally significant
biodiversity within project
landscape
Genetic, species and ecosystem diversity conserved in
approximately 261,000 ha. of the Kalabakan-Gunung Rara
area, within a sustainably-managed forest landscape of 393,544
ha, including adjacent protected areas
By end of project, at least 50,000 ha of project landscape
established as new Class I Protected Forest
Increase in wildlife populations within the project landscape,
together with those at adjacent protected areas;

Revised: 14 March, 2012
49
Project Strategy Objectively verifiable
Indicators Target
landscapes under a
common management
umbrella,
implementation of
which is sustainably
funded by revenues
generated within the
area
Category Baseline EOP Target
A. Elephants 0.5-1.0 1.0-1.5
B. Organg utan 0.5-1.0 2.0-3.5
C. Sun Bear <1.0 or >3.0 >2.0
D. Clouded Leopard <1.0 or >3.0 >2.0
Unit: Individuals / km2
No net loss in levels of biodiversity and other ecosystem
functions, i.e. full maintenance of natural capital within project
landscape over project period, with plan in place for continued
maintenance
No decrease in primary forest areas
A 25% increase annual increase in the budget allocation for
Class I Protected Forest Reserves
Level of functionality of
biodiversity-friendly,
multiple use forest
management systems in
Sabah
Project landscape is being managed in a manner that
demonstrates the technical, economic and financial feasibility
of the new management approach
An enabling policy and regulatory environment ready to
facilitate expansion / replication of the model (i) to other forest
landscapes in Sabah that include (or will include) protected
forest reserves, and (ii) to other PA sub-systems in Sabah.
The Sabah Forestry Department and Yayasan Sabah have
enhanced capacities and experience with the model needed to
enable its maintenance and replication
End of Project target: Category SFD YS
A. Enabling environment 83 87
B. Leadership 87 100
C. Knowledge 75 90
D. Accountability 66 81
Overall Mean Score 78 90
Sabah Forest Department
investment in Class 1
forest reserve planning and
management
End of project targets
Component 1: An
enabling
environment for
optimized multiple
use planning,
financing,
management and
protection of forest
landscapes
Component 1
(cont.): An enabling
environment for
optimized multiple
use planning,
financing,
management and
protection of forest
State-level system for
ensuring no net loss (NNL)
of biodiversity from
existing forest landscapes
By end of Y2, state-level policies and regulations for planning
and managing multiple-use forest landscape finalized
State-level system in place by end of year 6 (Y6)
State-level policies and
regulations for generating
revenues from innovative
financing mechanisms and
re-investing into PA and
sustainable, multiple use
forest management
By end of Y5, new state-level policies and regulations in place
for generating and reinvesting revenues from innovative
financing mechanisms
Capacities of staff within
relevant state level
Government departments
(NROS, SEPU, SFD, YS,
SBC, SWD, DID, EPD) to
design, implement and
manage / oversee
biodiversity-friendly
multiple-use, landscape-
level forest management
and sustainable financing
A 30% increase in multiple-use, landscape-level forestry, forest
conservation and financial management capacities of SFD,
NROS, SEPU,YS, DID, EPD

Revised: 14 March, 2012
50
Project Strategy Objectively verifiable
Indicators Target
landscapes
schemes, and to monitor
ecosystem service markets
Improved law enforcement
effectiveness
Increase in the ratio of number of fines collected relative to law
enforcement efforts.
Systems for compliance,
monitoring and
enforcement of multiple
use forest regulations.
By end of project, a revised and updated set of regulations and
guidelines for compliance monitoring and enforcement within
a multiple use context that includes innovative revenue
generating instruments
State and national
guidelines and operational
policies for multiple-use
forest landscape planning,
management and
conservation
By end of Y3, policy and guidelines specific to multiple-use
forest landscape established
Development of multiple-
use forest landscape
planning, management and
conservation systems
within project
demonstration area
By end of Y1, biodiversity overlay completed
By end of year 3, economic model selected and applied in
landscape planning
By end of Y3, landscape-level management plan completed
Implementation of
landscape-level
management plan
New PA establishment (ecological corridors, watershed, salt
lick)
Sustainable use management system based on sustainable off-
take, no net loss, monitoring and enforcement
Component 2:
Multiple-use forest
landscape planning
and management
system
demonstrated at
pilot site
Habitat conserved and
degradation reduced under
management plan
Land use for agricultural production at least 60% lower
compared with baseline scenario
Use of innovative revenue
mechanisms for revenue-
generating conservation
By end of Y2, optimal land use matrix, based on environmental
economic considerations within project landscape, are
determined
By end of project, three revenue generating mechanisms,
including REDD+ / carbon, biodiversity offsets and PES, have
been designed and piloted, with total annual revenues projected
to reach at least 50% of optimal management costs within five
years following project completion
Management budgets, as %
of optimal management
costs
Annual revenues available for sustainable, multiple use
management and conservation equivalent to 80% of estimated
optimal landscape level management costs and on upward trend
Component 3:
Sustainable
financing of
protected areas and
associated forest
landscape areas
demonstrated at
the pilot site
Use of innovative revenue
mechanisms for revenue-
generating conservation
Adaptive system in place by Y2
Management budgets, as %
of optimal management
costs
Annual revenues available for sustainable, multiple use
management and conservation equivalent to 80% of estimated
optimal landscape level management costs and on upward trend
An effective financial/
accounting system for fund
management and
disbursement
Adaptive system in place by Y2
161. Table 11 presents the risks facing the project, together with risk mitigation strategies.
TABLE 11. RISKS FACING THE PROJECT AND RISK MITIGATION STRATEGY.

Revised: 14 March, 2012
51
RISK RISK RATING RISK MITIGATION MEASURES
Conflicts between conservation and
development in State planning.
Support for multiple-use forest
landscape management will be weak
primarily from the private sector
thereby increasing the possibility that
more areas will be converted to non-
forest based uses that will compromise
biodiversity conservation.
Medium
The Project will collaborate closely with all stakeholders
including the private sector from the start of Project inception
and implementation. Stakeholders will be fully involved in the
process for developing policies and regulations in support of
NNL/NG as well as for the novel financing mechanisms. The
general approach will be participatory with defined roles and
responsibilities of the partners. Key stakeholders will include
the state economic planning unit, different sector departments at
the state level, the private sector that depends on land resources
such as agriculture, plantation, forestry, tourism, and workers
and management units in the target landscape and adjacent
conservation areas, locally operating NGOs, subcontractors in
the landscape, beneficiaries of ecosystem services which would
include distant communities, among others.
Political pressure and interferences
will prevent stakeholders from rational
utilisation of natural resources
compatible with biodiversity
conservation goals.
Medium
In the context of the project, “political pressures and
interferences” in Sabah are manifested in the subtle form of
assigning management rights of landuses to political patronage.
The project’s strategy to mitigate this risk is to create a
transparent process of forest planning and management through
third party involvement. The international presence created by
the UNDP/GEF supported project will be absolutely critical in
this regard in raising the profile of the issue and serving this
reform process. The project will act as a lever to further increase
the commitment at different bureaucratic levels to improving the
situation.
Site level improvement in the target
landscape is causing a “leakage
problem”, causing additional
deforestation/degradation in other
areas under YS or SFD management. Medium
This risk is considered especially significant in the case of YS,
which has approximately one million ha. under management. It
has been mitigated partly already by the selection of the target
landscape, which is believed to be of greater biodiversity
significance than other YS areas. Thus, leakage or shifting of
conversion pressures would still result in net biodiversity gains.
Nevertheless, it will be important for SFD to move quickly to
ensure rapid uptake and replication of the model / approach,
once it has been shown to be a successful one.
International REDD Plus process does
not progress fast enough and loses the
confidence among the project
stakeholders. Medium
The project will play close attention to the process through
which a REDD+ compliance market may be expected to
emerge. It will include consideration of voluntary markets as an
alternative, while bearing in mind that carbon prices remain low
there. It will investigate options for ‘stacking’ credits for
multiple (carbon, biodiversity) services. Finally, the project’s
emphasis on adaptive management means that strategies are not
written in stone.
Poor cooperation among government
agencies will prevent the formulation
of supporting policy reforms and
institutional strengthening towards
multiple-use forest landscape
management.
Low
Consultations have been undertaken among the key government
stakeholders in the State and their endorsement has been
secured. The dialogue will continue during full project
implementation. The project will maintain close ties with the
HoB process, which has helped substantially, together with
efforts by SFD, to raise the prominence of green growth issues.
As a result, it is becoming increasingly difficult for other
government agencies to pursue business as usual patterns of
development.
Lack of suitable qualified personnel to
act as local counterparts in planning,
management and execution of project
programmes Low
This risk will be minimized by engaging key stakeholders in the
selection of suitable personnel to be involved in the project
planning and management. Training and on the job training /
and capacity building will be a significant project activity to
instill new skills and competencies among PA system staff.

Revised: 14 March, 2012
52
RISK RISK RATING RISK MITIGATION MEASURES
Climate change undermines the
conservation objectives of the Project
Low
The Project will work to address the anticipated negative
impacts of climate change by increasing resilience of the forest
landscape. The adaptive management approach will ensure
project resilience to all changes (not limited to climate-related
changes) that will occur in the future.
Market-based biodiversity, carbon and
PES does not develop despite the
development of regulations and
guidelines
Low
Malaysia is a signatory to several international conventions
including the Convention on biodiversity and Framework of
Convention on Climate Change. There are currently strong
interests to develop market-based forestry instruments in
Malaysia by governmental (NRE) and non-governmental
organization (e.g. WWF). It is expected that the multi-
stakeholder coordination process of the project will contribute to
the understanding and development of a market-based
instruments. As noted above, in case market-based mechanisms
are slow to emerge, the project will look to voluntary schemes.
2.6 Financial modality
162. GEF funds will be used to address the identified threats and barriers to biodiversity conservation in the
wider forest landscape in the proposed project landscape by means of technical assistance. This type of
financing is considered appropriate to develop system and site level capacities related to multiple-use
forest landscape management. The barriers identified concern weak capacities, lack of support systems
and associated mechanisms can be addressed through the development of appropriate tools,
methodologies, and testing these in key policies and programs of multiple-use forest management.
These would require a high degree of technical inputs, as well as training of staff in their use.
163. GEF technical funds will be closely tied to co-financed investment in policy development and technical
support provided through BBOP, WWF and/or other potential partners. This will help to mainstream
and synergize ongoing similar efforts towards sustainable forest management.
2.7 Cost effectiveness
170. The project is considered cost effective as it takes a landscape-level management and sustainable
financing approach to addressing the challenge of PA ecological and financial sustainability. This
contrasts with a more traditional, PA-centric approach which might have focused more narrowly on PA
expansion, increased PA management effectiveness or PA financing. The opportunity for taking a
landscape-level approach is based partly on the fact that a single managing entity, the Sabah Forest
Department, is responsible for managing both PAs and surrounding landscapes. By integrating PA
management within broader landscape level processes, the project enables a cost-effective approach to
generating and allocating financial resources. On the revenue generation side, opportunities for
innovative mechanisms like REDD Plus will be pursued in the knowledge that benefits will help to
support PAs, both directly via financial transfers as well as indirectly via reduced land conversion and
enhanced biodiversity management in the adjacent landscape. This greatly expands theopportunities as
compared with looking at PA financing opportunities within PAs only. Expanding geographically the
zone within which revenue generation can help to support PA management greatly increases the
likelihood that a sustainable combination of mechanisms can be identified, compared with a situation in
which PA borders also represent the borders for financial innovation.
171. In addition, the project is considered cost effective as 81% of the GEF funding is directly linked to
implementation on the ground. Cost effectiveness is assured through the combination of the state level
systemic capacity enhancement for sustainability and landscape level implementation which can be
applied to other landscape in the state and beyond.

Revised: 14 March, 2012
53
2.8 Sustainability
164. Environmental sustainability: The project will support the long-term viability of globally significant
biodiversity in Sabah by improving the regulatory, planning, institutional, and financial frameworks for
an emerging multiple-use forest landscape with spin-off benefits to neighbouring protected areas. The
project results would include the removal of existing barriers and the mitigation of negative impacts of
key threats to sustainability of the environment. Strengthening the planning and management
framework within the project landscape should result in the retention of valuable ecosystem services
and significantly improved resilience to impending climate change impact. Both of these represent
meaningful conributions to long-term environmental sustainability.
165. Financial sustainability: The project is designed to catalyze sustainable financing by capturing new
sources of revenues in REDD+, biodiversity offset/no net loss and PES mechanisms by developing pilot
modalities matching to existing landuses (natural forest management, industrial tree plantation,
conservation forest). The main products from these mechanisms are carbon, biodiversity and water,
which link to climate change mitigation/adaptation; having a much longer outlook than traditional
timber product. The revenue cycles for these non-traditional commodities are also different from
traditional timber products. For example, carbon benefit from wood is immediate while timber product
is deferred until it matures. This helps to ensure a sustained stream of revenues throughout the lifespan
of the project. A key assumption in making this a reality is that all key stakeholders have the capacity to
plan, manage and monitor these revenue generating modalities in perpetuity. This anticipated gap is
addressed by GEF investments in capacity building of human resources and financial management
system capabilities. This will further ensure the ultimate result of a financially stable framework being
replicated elsewhere.
166. Institutional sustainability: Building institutional sustainability through improved legislation,
administration and financial processes is paramount to this project’s investment. Direct capacity
building will take place through training programs by mobilizing GEF fund. In-direct capacity building
will result from implementation of various project activities. Much of the project’s efforts are focused
upon providing institutions with the tools required for long-term institutional integrity. For example,
strengthening the legislation framework in Component I will alleviate current institutional
inconsistences that will enhance biodiversity mainstreaming of the project. Similarly, the provision of
training in administering the financial system will help ensure institutional sustainability.
167. Social sustainability: The project preparatory phase has benefitted from very active stakeholder
involvement from the governmental and non-governmental organizations. This cooperative and
inclusive approach set the stage for continued social sustainability. Additionally, the creation of a
Project Board in the management arrangement comprising members from the national/state level
governmental and non-governmental organizations provide an avenue for significant issues, including
social issues, to be addressed at the highest level of decision-making. The proposed management
arrangement will also gained from the lessons learnt by key stakeholders on related social issues outside
the project boundary to be applied in the project as well as co-financing support on related activity. This
will result in a much more cohesive and well-funded framework for achieving social sustainability.
2.9 Replicability
168. The alternative scenario has been designed for a wider adoption within Sabah including the YS forest
concession, and elsewhere in Malaysia and possibly in the ASEAN region. More specifically, the
Project has a strong element in building capacity for improved multiple-use landscape management so
that appropriate technologies, tools, methods and management models can be broadcast to other sites.
Thereby enhancing overall sustainable forest management in the country. Other areas where Project has
high potential for replication would be in the development of sustainable financing mechanisms that
will be demonstrated on site.

Revised: 14 March, 2012
54
2.10 Coordination with Relevant Programs
169. The Project will coordinate closely with the Sustainable Forest and Biodiversity Management in
Kalimantan Borneo under the HoB initiative that was recently approved by GEF Council with ADB as
the lead agency. In addition, this Project will also coordinate with other relevant projects in GEF’s
Biodiversity and SFM portfolio, particularly those implemented by UNDP.
170. The Project will collaborate with other ongoing forest management related initiatives within and
adjacent to the Project landscape. The first is the Innoprise – IKEA Forest Rehabilitation Project
(INIKEA), which started in 1998; the project is aimed at assisting forest recovery in a degraded part of
the Kalabakan Forest Reserve totaling 18,500 ha. The Sow-A-Seed Foundation is formed by IKEA,
Sweden which contributes some of the financial assistance while the Sabah Foundation manages
implements the project. The second is the RBJ/Swedish University Agricultural Science (SUAS)
Project which began in 1990 undertook operational experiments on directional felling and pre-felling
climber cutting as a means of reducing damage to the residual forest stand during harvesting. The
experimental plots have been measured every two years since the project started. The third is the
RBJ/New England Power (NEP) collaborative Reduced Impact Logging (RIL) Project which
commenced in 1992 is an investment project in the planning of skid trails, directional marking and
felling of trees so as to reduce damage and soil disturbance to a minimum. It is meant to offset CO2
emissions from (New England Power) NEP’s coal-fired power stations.
171. The Project will also work with the biodiversity conservation-related initiatives such as those in the
Maliau Basin Conservation Area (MBCA), Danum Valley Conservation Area (DVCA), virgin jungle
reserves, saltlick reserves, wildlife corridors linking the conservation areas and the forest reserves
managed under NFM.
172. Finally, the Project will coordinate closely with the Heart of Borneo (HoB) Initiative, including ongoing
efforts supported by WWF to develop and test economic models of green growth, and to design and
implement sustainable financing strategies, in the HoB landscape
2.11 Incremental Reasoning and Expected Global, National and Local Benefits
INCREMENTAL REASONING
172. Under the baseline scenario, financing for natural resource management, including management by SFD
of nearly 500,000 ha. of Class I Protected Forest in Sabah, would continue to depend largely on revenues
generated by large-scale forest conversion for agro-industrial uses such as oil palm, along with revenues
from timber harvesting. This would result in the continued conversion or degradation of much of the
remaining high-value tropical forest landscapes, including a significant proportion of the Heart of
Borneo. In the absence of a sustainably managed productive forest landscape to connect them, existing
protected areas would be increasingly isolated within an ecologically fragmented landscape, with
substantially decreased prospects for viability of globally significant species. Under most likely climate
change scenarios, increasingly isolated PAs would lack the resilience to withstand stressors such as
increased frequency and severity of wildfires and changes in habitat composition and species range. The
long term outlook for adjacent PAs such as Danum, Maliau and Imbak Conservation Areas would be
bleak.
173. Baseline efforts to manage the target project landscape include support from WWF for forest
certification and PA management, as well as management efforts of SFD and YS. While state-level
efforts are underway to introduce innovative financing mechanisms, including work on REDD+, bio-
banking and PES, under the baseline these efforts—which are mainly taking place outside of the target
project landscape—do not appear to be sufficient to substantially alter the development trajectory and
sustainable financing challenges facing the target landscape and others like it in Sabah. The resulting
impact on globally significant biodiversity found within both the connecting landscapes as well as within
the still partially connected PAs, would be severe.

Revised: 14 March, 2012
55
174. Under the alternative scenario, the outlook for globally threatened species in the target landscape and
beyond will be substantially enhanced in three main respects:
The enabling environment for optimized, multiple-use planning, financing, management and
protection of forest landscapes will be markedly strengthened through incremental efforts
leading to state-level policies for revenue generating mechanisms such as REDD+, NNL/NG
and bio-banking, together with new systems for landscape-level, conservation-oriented
planning.
A multiple use forest landscape planning and management system will have been demonstrated
within a critical 261,000 ha. landscape connecting some of Sabah’s most important and
biodiversity-rich landscapes. The system will be designed to optimize land use decisions—
including revenue generating conservation-based land uses—to provide an adequate and
sustainable level of revenues while sharply reducing net impacts on biodiversity and ecological
functions, as compared with the baseline scenario.
Sustainable financing of protected areas and connecting forest landscapes will be demonstrated
through pilot implementation of three revenue generating mechanisms—REDD+, PES and bio-
banking, with increased revenues contributing both to enhanced budget resources for
surrounding PAs as well as reduced pressures for conversion within the landscape. Increased
revenue generation from standing forests will sharply reduce the revenue gap between forest
conversion and conservation, thus increasing the financial feasibility to the SFD and the State of
conserving large areas of globally-significant forest landscapes.
175. Overall, as a result of the project, habitat and biodiversity within landscape areas will be better
conserved. PA ecological sustainability will be enhanced though increased resilience associated with
enhanced connectivity and reduced risk of forest fires, with particular benefits to migratory species. PAs
will be expanded and their management effectiveness increased. In species terms, project efforts are
expected to lead to increased viability within the project site of globally threatened species such as
orang-utan, proboscis monkey, sun bear, pygmy elephant and others. An expected demonstration effect
would result in financial and management models developed under the project being disseminated and
adopted in other parts of the Heart of Borneo.
EXPECTED GLOBAL, NATIONAL AND LOCAL BENEFITS
173. The site is highly significant in terms of global biodiversity. Its lowland dipterocarp forests are
particularly rich in species diversity, with 814 species of woody plants of 1 cm diameter and larger
found in a 50 hectare area. Endemic, rare and threatened species within the project area include the
protected gaharu timber (Aquilaria borniensis). About half of the pygmy elephant population in Borneo
(Malaysia and Indonesia) currently lives in the central forest reserves area of Sabah. Orang-utans,
numbering approximately 700, and rhinoceros also share the same habitat. The significance of these
forests will be critical to the persistence of the long-term global benefits generated by the area, in
particular their ability to support high levels of biodiversity while helping to mitigate climate change.
174. The global significance of the project landscape lies in the regulation of climate and water provisioning.
Forests sequester carbon dioxide from the atmosphere through photosynthesis. In the process, carbon is
fixed in living biomass. This phenomenon cools the earth as the presence of access concentration of
carbon dioxide in the atmosphere would increase warming to the detriment of the productivity and health
of the world’s ecosystems that are already under stress from current levels of population and economic
activity (Schlaepfer, 199388
). Among the greenhouse gases, carbon dioxide makes up the largest
proportion accounting to 55% of the warming effect of greenhouse gases. In addition to climate
regulation, the target landscape contains several major rivers (e.g. Segama River and Kuamut River) that
provide important source of water for livelihood further downstreams (e.g. Kalabakan village). These
rivers make up the upper tributaries of larger rivers such as the Kinabtangan river on the east coast of
Sabah which drains into the South China Sea that support a rich marine life. While the significance of
88 Schlaepfer, E., 1993. Long-term implications of climate change and air pollution on forest ecosystems. IUFRO World Series. 132 pp.
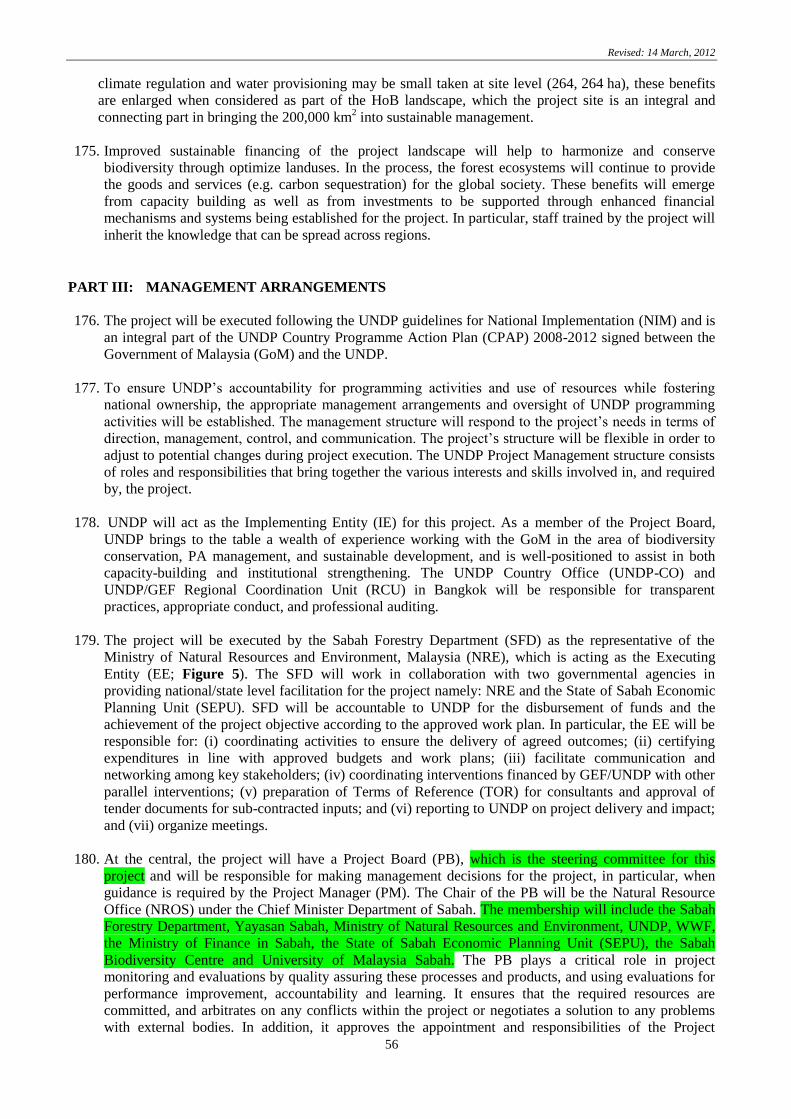
Revised: 14 March, 2012
56
climate regulation and water provisioning may be small taken at site level (264, 264 ha), these benefits
are enlarged when considered as part of the HoB landscape, which the project site is an integral and
connecting part in bringing the 200,000 km2 into sustainable management.
175. Improved sustainable financing of the project landscape will help to harmonize and conserve
biodiversity through optimize landuses. In the process, the forest ecosystems will continue to provide
the goods and services (e.g. carbon sequestration) for the global society. These benefits will emerge
from capacity building as well as from investments to be supported through enhanced financial
mechanisms and systems being established for the project. In particular, staff trained by the project will
inherit the knowledge that can be spread across regions.
PART III: MANAGEMENT ARRANGEMENTS
176. The project will be executed following the UNDP guidelines for National Implementation (NIM) and is
an integral part of the UNDP Country Programme Action Plan (CPAP) 2008-2012 signed between the
Government of Malaysia (GoM) and the UNDP.
177. To ensure UNDP’s accountability for programming activities and use of resources while fostering
national ownership, the appropriate management arrangements and oversight of UNDP programming
activities will be established. The management structure will respond to the project’s needs in terms of
direction, management, control, and communication. The project’s structure will be flexible in order to
adjust to potential changes during project execution. The UNDP Project Management structure consists
of roles and responsibilities that bring together the various interests and skills involved in, and required
by, the project.
178. UNDP will act as the Implementing Entity (IE) for this project. As a member of the Project Board,
UNDP brings to the table a wealth of experience working with the GoM in the area of biodiversity
conservation, PA management, and sustainable development, and is well-positioned to assist in both
capacity-building and institutional strengthening. The UNDP Country Office (UNDP-CO) and
UNDP/GEF Regional Coordination Unit (RCU) in Bangkok will be responsible for transparent
practices, appropriate conduct, and professional auditing.
179. The project will be executed by the Sabah Forestry Department (SFD) as the representative of the
Ministry of Natural Resources and Environment, Malaysia (NRE), which is acting as the Executing
Entity (EE; Figure 5). The SFD will work in collaboration with two governmental agencies in
providing national/state level facilitation for the project namely: NRE and the State of Sabah Economic
Planning Unit (SEPU). SFD will be accountable to UNDP for the disbursement of funds and the
achievement of the project objective according to the approved work plan. In particular, the EE will be
responsible for: (i) coordinating activities to ensure the delivery of agreed outcomes; (ii) certifying
expenditures in line with approved budgets and work plans; (iii) facilitate communication and
networking among key stakeholders; (iv) coordinating interventions financed by GEF/UNDP with other
parallel interventions; (v) preparation of Terms of Reference (TOR) for consultants and approval of
tender documents for sub-contracted inputs; and (vi) reporting to UNDP on project delivery and impact;
and (vii) organize meetings.
180. At the central, the project will have a Project Board (PB), which is the steering committee for this
project and will be responsible for making management decisions for the project, in particular, when
guidance is required by the Project Manager (PM). The Chair of the PB will be the Natural Resource
Office (NROS) under the Chief Minister Department of Sabah. The membership will include the Sabah
Forestry Department, Yayasan Sabah, Ministry of Natural Resources and Environment, UNDP, WWF,
the Ministry of Finance in Sabah, the State of Sabah Economic Planning Unit (SEPU), the Sabah
Biodiversity Centre and University of Malaysia Sabah. The PB plays a critical role in project
monitoring and evaluations by quality assuring these processes and products, and using evaluations for
performance improvement, accountability and learning. It ensures that the required resources are
committed, and arbitrates on any conflicts within the project or negotiates a solution to any problems
with external bodies. In addition, it approves the appointment and responsibilities of the Project
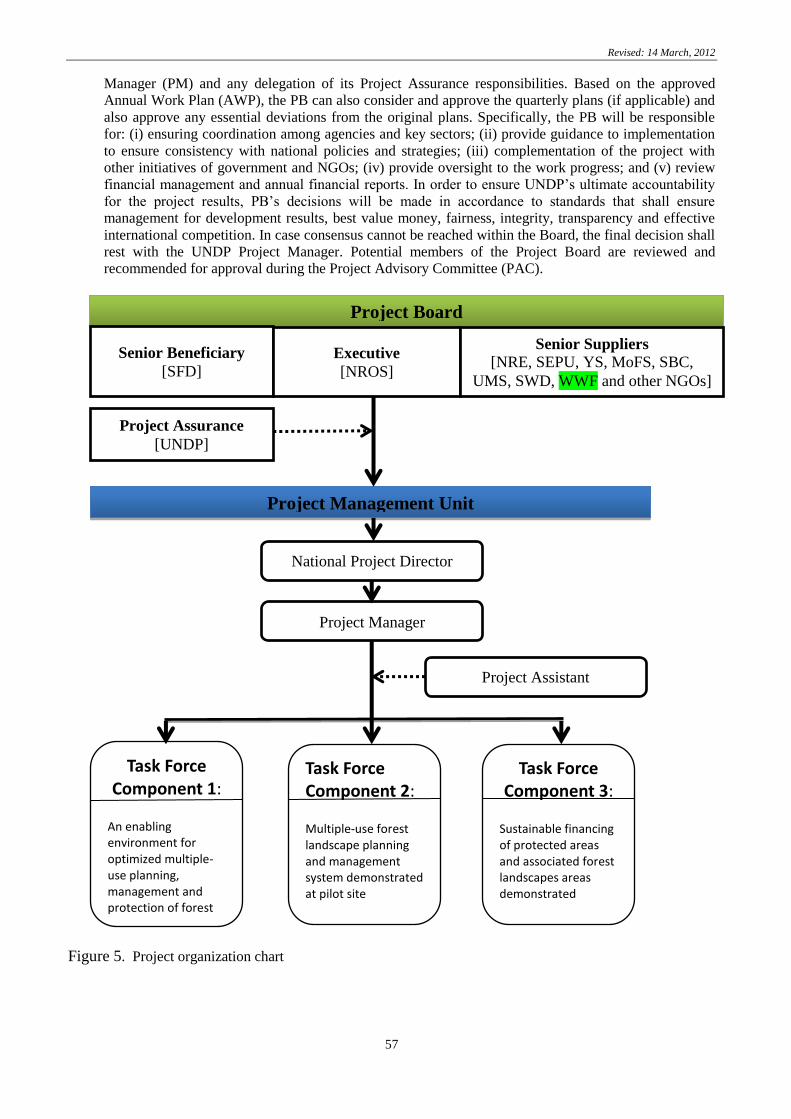
Revised: 14 March, 2012
57
Manager (PM) and any delegation of its Project Assurance responsibilities. Based on the approved
Annual Work Plan (AWP), the PB can also consider and approve the quarterly plans (if applicable) and
also approve any essential deviations from the original plans. Specifically, the PB will be responsible
for: (i) ensuring coordination among agencies and key sectors; (ii) provide guidance to implementation
to ensure consistency with national policies and strategies; (iii) complementation of the project with
other initiatives of government and NGOs; (iv) provide oversight to the work progress; and (v) review
financial management and annual financial reports. In order to ensure UNDP’s ultimate accountability
for the project results, PB’s decisions will be made in accordance to standards that shall ensure
management for development results, best value money, fairness, integrity, transparency and effective
international competition. In case consensus cannot be reached within the Board, the final decision shall
rest with the UNDP Project Manager. Potential members of the Project Board are reviewed and
recommended for approval during the Project Advisory Committee (PAC).
Figure 5. Project organization chart
Project Board
Senior Beneficiary
[SFD]
Executive
[NROS]
Senior Suppliers
[NRE, SEPU, YS, MoFS, SBC,
UMS, SWD, WWF and other NGOs]
Project Management Unit
Project Assurance
[UNDP]
Task Force Component 1:
An enabling environment for optimized multiple-use planning, management and protection of forest landscapes
Task Force Component 2:
Multiple-use forest landscape planning and management system demonstrated at pilot site
Task Force Component 3:
Sustainable financing of protected areas and associated forest landscapes areas demonstrated
National Project Director
Project Manager
Project Assistant

Revised: 14 March, 2012
58
181. A Project Management Unit (PMU) will be responsible for directing, supervising and coordinating the
project implementation. The PMU will be located in SFD. The day-to-day operations will be carried out
by a management team of the Sabah Foundation. The PMU will consist of the National Project Director
(NPD), Project Manager and the Project Assistant.
182. In terms of key project staff, a senior SFD staff will be appointed as the NPD whose counterpart is the
Project Manager contracted to the Project. The NPD and PM will be responsible for the day-to-day
project implementation, leading and managing the PMU. In addition to the PM, the PMU will be
supported by one project assistant. The responsibilities of the PMU are to: (i) ensure that the work plan
is implemented as planned on a timely manner; (ii) direct resources to procure and deliver the project
outcomes; (iii) monitor the activities of the site coordination units; (iv) facilitate the administrative and
technical requirements of the project; and (v) report work progress to the PSC on a quarterly basis.
PART IV: MONITORING AND EVALUATION FRAMEWORK
183. The project will be monitored through the following Monitoring and Evaluation (M&E) activities. The
M&E budget is provided in Table 12.
184. Project start: A Project Inception Workshop will be held within the first two months of project start
with those with assigned roles in the project organization structure, UNDP Country Office (UNDP-CO),
and where appropriate/feasible, regional technical policy and programme advisors as well as other
stakeholders. The Inception Workshop is crucial to building ownership for the project results and to
plan the first year annual work plan. The Inception Workshop should address a number of key issues
including:
a) Assist all partners to fully understand and take ownership of the project.
b) Describe the roles, support services and complementary responsibilities of UNDP-CO and RCU
staff vis à vis the project team.
c) Discuss the roles, functions, and responsibilities within the project's decision-making structures,
including reporting and communication lines, and conflict resolution mechanisms.
d) Finalize the first annual work plan based on the project results framework and the relevant GEF
Tracking Tool.
e) Review and agree on the indicators, targets and their means of verification (MoV), and recheck
assumptions and risks.
f) Provide a detailed overview of reporting, M&E requirements. The M&E work plan and budget
should be agreed and scheduled.
g) Discuss financial reporting procedures and obligations, and arrangements for annual audit.
h) Plan and schedule Project Board meetings.
i) Clarify the roles and responsibilities of all project organisation structures
j) Determine the scheduled of meetings taking into consideration that the first PB meeting should be
held within the first 12 months following the inception workshop.
185. An Inception Workshop report is a key reference document and must be prepared and shared with
participants to formalize various agreements and plans decided during the meeting.
186. Quarterly: Progress made shall be monitored in the UNDP Enhanced Results Based Management
Platform.
187. Based on the initial risk analysis submitted, the risk log shall be regularly updated in ATLAS. Risks
become critical when the impact and probability are high. Note that for UNDP GEF projects, all
financial risks associated with financial instruments such as revolving funds, microfinance schemes, or
capitalization of ESCOs are automatically classified as critical on the basis of their innovative nature
(high impact and uncertainty due to no previous experience justifies classification as critical).

Revised: 14 March, 2012
59
Table 12. Monitoring and Evaluation (M&E) Work Plan and Budget
M&E activity Responsible Parties Budget US$ Time frame
Inception Workshop NPD/CTA
UNDP-CO/UNDP GEF 10,000
Within first two months of
project start up
Inception Report Project Team
UNDP-CO None
Immediately following IW
Measurement of Means
of Verification (MoV)
for Project Results
NPD will oversee the hiring of
specific studies and institutions, and
delegate responsibilities to relevant
team members
15,000
(To be finalized in
Inception Workshop)
Start, mid and end of project
Measurement of MoV
for Project Progress
Outputs and
Performance
Oversight by Project GEF
Technical Advisor and NPD
Measurements by regional field
officers, and local IAs
32,000
(8,000/year x 5 years;
To be determined as part
of the AWP preparation)
Annually prior to APR/PIR
and to the definition of
annual work plans
APR and PIR Project Team
UNDP-CO/UNDP-GEF None
Annually
Annual Reviews Government Counterparts
UNDP-CO
Project team
UNDP-GEF RCU
None
Every year, upon receipt of
APR
Project Meetings National Project Director
UNDP CO None
Following Project IW and
subsequently once a year
Periodic status reports Project Team 5,000
To be determined by Project
team and UNDP CO
Technical reports Project Team
Hired consultants as needed 15,000
To be determined by Project
Team and UNDP-CO
Mid-term External
Evaluation
Project Team
UNDP-CO/UNDP-GEF RCU
External Consultants
30,000
At the mid-point of project
implementation.
Final External
Evaluation
Project team,
UNDP-CO/UNDP-GEF RCU
External Consultants
30,000
At the end of project
implementation
Terminal Report Project Team
UNDP-CO
External Consultant
5,000
At least one month before
the end of the project
Lessons learned Project Team
UNDP-GEF RCU
15,000
(@3,000/year)
Yearly
Audit UNDP-CO
Project Team
15,000
(@ $2,500/year)
Yearly
Visits to field sites
(UNDP staff travel
costs to be charged to
IA fees)
UNDP-CO
UNDP-GEF RCU
Government representatives
Paid from IA fees and
operational budget
Yearly
TOTAL INDICATIVE COST
(Excluding project team staff time and UNDP staff and travel
expenses)
US$ 172,000

Revised: 14 March, 2012
60
188. Based on the information recorded in Atlas, a Project Progress Reports (PPR) can be generated in the
Executive Snapshot.
189. Other ATLAS logs can be used to monitor issues and lessons learned. The use of these functions is a
key indicator in the UNDP Executive Balanced Scorecard.
190. Annually: Annual Project Review/Project Implementation Reports (APR/PIR): This key report is
prepared to monitor progress made since project start and in particular for the previous reporting period
(30 June to 1 July). The APR/PIR combines both UNDP and GEF reporting requirements.
191. The APR/PIR includes, but is not limited to, reporting on the following:
a) Progress made toward project objective and project outcomes - each with indicators, baseline data
and end-of-project targets (cumulative)
b) Project outputs delivered per project outcome (annual).
c) Lesson learned/good practice.
d) AWP and other expenditure reports
e) Risk and adaptive management
f) ATLAS QPR
g) Portfolio level indicators (i.e. GEF focal area tracking tools) are used by most focal areas on an
annual basis as well.
192. Periodic Monitoring through site visits: UNDP CO and the UNDP RCU will conduct visits to project
landscapes based on the agreed schedule in the project's Inception Report/Annual Work Plan to assess
first hand project progress. Other members of the Project Board may also join these visits. A Field Visit
Report/BTOR will be prepared by the CO and UNDP RCU and will be circulated no less than one
month after the visit to the project team and Project Board members.
193. Mid-term of project cycle: The project will undergo an independent Mid-Term Evaluation at the mid-
point of project implementation (insert date). The Mid-Term Evaluation will determine progress being
made toward the achievement of outcomes and will identify course correction if needed. It will focus on
the effectiveness, efficiency and timeliness of project implementation; will highlight issues requiring
decisions and actions; and will present initial lessons learned about project design, implementation and
management. Findings of this review will be incorporated as recommendations for enhanced
implementation during the final half of the project’s term. The organization, terms of reference and
timing of the mid-term evaluation will be decided after consultation between the parties to the project
document. The Terms of Reference for this Mid-term evaluation will be prepared by the UNDP CO
based on guidance from the Regional Coordinating Unit and UNDP-GEF. The management response
and the evaluation will be uploaded to UNDP corporate systems, in particular the UNDP Evaluation
Office Evaluation Resource Center (ERC).
194. The relevant GEF Focal Area Tracking Tools will also be completed during the mid-term evaluation
cycle. End of Project: An independent Final Evaluation will take place three months prior to the final
Project Board meeting and will be undertaken in accordance with UNDP and GEF guidance. The final
evaluation will focus on the delivery of the project’s results as initially planned (and as corrected after
the mid-term evaluation, if any such correction took place). The final evaluation will look at impact
and sustainability of results, including the contribution to capacity development and the achievement of
global environmental benefits/goals. The Terms of Reference for this evaluation will be prepared by the
UNDP CO based on guidance from the Regional Coordinating Unit and UNDP-GEF.
195. The Terminal Evaluation should also provide recommendations for follow-up activities and requires a
management response which should be uploaded to PIMS and to the UNDP Evaluation Office
Evaluation Resource Center (ERC).
196. The relevant GEF Focal Area Tracking Tools will also be completed during the final evaluation.

Revised: 14 March, 2012
61
197. During the last three months, the project team will prepare the Project Terminal Report. This
comprehensive report will summarize the results achieved (objectives, outcomes, outputs), lessons
learned, problems met and areas where results may not have been achieved. It will also lay out
recommendations for any further steps that may need to be taken to ensure sustainability and
replicability of the project’s results.
198. Audit arrangement: The Government will provide the Resident Representative with certified periodic
financial statements, and with an annual audit of the financial statements relating to the status of
UNDP (including GEF) funds according to the established procedures set out in the Programming and
Finance manuals. The Audit will be conducted by a special and certified audit firm.UNDP will be
responsible for making audit arrangements for the project in communication with the Project
Implementing Partner. UNDP and the project Implementing Partner will provide audit management
responses and the Project Manager and project support team will address audit recommendations. As a
part of its oversight function, UNDP will conduct audit spot checks at least two times a year
199. Learning and knowledge sharing: Results from the project will be disseminated within and beyond
the project intervention zone through existing information sharing networks and forums.
200. The project will identify and participate, as relevant and appropriate, in scientific, policy-based and/or
any other networks, which may be of benefit to project implementation though lessons learned. The
project will identify, analyze, and share lessons learned that might be beneficial in the design and
implementation of similar future projects.
201. Finally, there will be a two-way flow of information between this project and other projects of a similar
focus.
202. Communications and visibility requirements: Full compliance is required with UNDP’s Branding
Guidelines. These can be accessed at http://intra.undp.org/coa/branding.shtml, and specific guidelines
on UNDP logo use can be accessed at: http://intra.undp.org/branding/useOfLogo.html. Amongst other
things, these guidelines describe when and how the UNDP logo needs to be used, as well as how the
logos of donors to UNDP projects needs to be used. For the avoidance of any doubt, when logo use is
required, the UNDP logo needs to be used alongside the GEF logo. The GEF logo can be accessed at:
http://www.thegef.org/gef/GEF_logo. The UNDP logo can be accessed at http://intra.undp.org/coa/
branding.shtml.
203. Full compliance is also required with the GEF’s Communication and Visibility Guidelines (the “GEF
Guidelines”). The GEF Guidelines can be accessed at: http://www.thegef.org/gef/
sites/thegef.org/files/documents/C.40.08_Branding_the_GEF%20final_0.pdf. Amongst other things,
the GEF Guidelines describe when and how the GEF logo needs to be used in project publications,
vehicles, supplies and other project equipment. The GEF Guidelines also describe other GEF
promotional requirements regarding press releases, press conferences, press visits, visits by Government
officials, productions and other promotional items.
204. Where other agencies and project partners have provided support through co-financing, their branding
policies and requirements should be similarly applied.
PART V: LEGAL CONTEXT
205. This Project Document shall be the instrument referred to as such in Article I of the Standard Basic
Assistance Agreement (SBAA) between the Government of Malaysia and the UNDP Programme,
signed by the parties on (date).
206. Consistent with the Article III of the SBAA, the responsibility for the safety and security of the
executing agency and its personnel and propert, and of UNDP’s propert in the executing agency’s
custody, rests with the executing agency. The executing agency shall:

Revised: 14 March, 2012
62
Put in place an appropriate security plan and maintain the security plan, taking into account the
security situation in the country where the project is being carried out;
Assume all risks and liabilities related to the executing agency’s security, and the full implementation
of the security plan.
207. UNDP reserves the right to verify whether such a plan is in place, and to suggest modifications to the
plan when necessary. Failure to maintain and implement an appropriate security plan as required
hereunder shall be deemed a breach of this agreement.
208. The executing agency agrees to undertake all reasonable efforts to ensure that none of the UNDP funds
received pursuant to the Project Document are used to provide support to individuals or entities
associated with terrorism and that the recipients of any amounts provided by UNDP hereunder do not
appear on the list maintained by the Security Council Committee established pursuant to resolution
1267 (1999). The list can be accessed via http://www.un.org/Docs/sc/committees/1267/1267
ListEng.htm. This provision must be included in all sub-contracts or susb-agreements entered into under
this Project Document.

Revised: 14 March, 2012
63
PART VI: STRATEGIC RESULTS FRAMEWORK (SRF)
Project Strategy Objectively verifiable
Indicators Baseline Target
Sources of
Verification
Risks and
Assumptions
Objective: To
institutionalize a
multiple-use forest
landscape planning
and management
model which brings
the management of
critical protected areas
and connecting
landscapes under a
common management
umbrella,
implementation of
which is sustainably
funded by revenues
generated within the
area
Conservation of globally
and nationally significant
biodiversity within project
landscape
Biodiversity is being depleted at
project landscape level, due to
habitat loss, degradation and
fragmentation
Genetic, species and ecosystem diversity
conserved in approximately 261,000 ha.
of the Kalabakan-Gunung Rara area,
within a sustainably-managed forest
landscape of 393,544 ha, including
adjacent protected areas
Ecosystem
monitoring data in
M&E system
Project landscape currently
contains no Class I Protected
Forest
By end of project, at least 50,000 ha of
project landscape established as new
Class I Protected Forest
Working paper and
Government Gazette
Clearance of final
proposal by
Government of Sabah
Wildlife populations within the
project landscape, together with
those at adjacent protected areas,
are currently estimated at; Category Ind/km2
A. Elephants 0.5-1.0
B. Organg utan 0.5-1.0
C. Sun Bear <1.0 or >3.0
D. Clouded
Leopard <1.0 or >3.0
Category Ind/km2
A. Elephants 1.0-1.5
B. Organg utan 2.0-3.5
C. Sun Bear >2.0
D. Clouded Leopard >2.0
Ecosystem
monitoring data
Exogenous factors,
e.g., degradation in
other forest areas, are
not driving elephants
into the area
Natural capital being lost through
habitat conversion and
degradation
Different types of forests in the
project landscape:
Forest Types Ha
a. Primary forest 18,517
b. Secondary forests 242,747
No net loss in levels of biodiversity and
other ecosystem functions, i.e. full
maintenance of natural capital within
project landscape over project period,
with plan in place for continued
maintenance
No decrease in primary forest areas
A 30% increase annual increase in the
budget allocation for Class I Protected
Forest Reserves
Environmental
economic reports;
Landscape
management plan
Site-level
deforestation /
degradation process is
not ‘leaking’ into
other areas under YS
or FD management
Level of functionality of
biodiversity-friendly,
multiple use forest
management systems in
Sabah has no functional,
biodiversity friendly, multiple
use forest management systems
Project landscape is being managed in a
manner that demonstrates the technical,
economic and financial feasibility of the
new management approach
Combined impact
of outcome 2 & 3
indicators

Revised: 14 March, 2012
64
Project Strategy Objectively verifiable
Indicators Baseline Target
Sources of
Verification
Risks and
Assumptions
Objective (cont.): To
institutionalize a
multiple-use forest
landscape planning
and management
model which brings
the management of
critical protected areas
and connecting
landscapes under a
common management
umbrella,
implementation of
which is sustainably
funded by revenues
generated within the
area
Sabah
Capacity Scorecard:
Category SFD YS A. Enabling
environment 64 67
B. Leadership 67 80
C. Knowledge 56 69
D. Accountability 51 62
Overall Mean Score 59 69
An enabling policy and regulatory
environment ready to facilitate expansion
/ replication of the model (i) to other
forest landscapes in Sabah that include
(or will include) protected forest reserves,
and (ii) to other PA sub-systems in
Sabah.
Policy and
regulatory changes
(see Outcome 1
indicators)
Entrenched interests
associated with
‘business-as-usual’
are not successful in
slowing the expansion
of the new approach
The Sabah Forestry Department and
Yayasan Sabah have enhanced capacities
and experience with the model needed to
enable its maintenance and replication
End of Project target (30% over baseline): Category SFD YS
A. Enabling environment 83 87
B. Leadership 87 100
C. Knowledge 75 90
D. Accountability 66 81
Overall Mean Score 78 90
Capacity
assessment
scorecard
Turnover among
trained staff remains
minimal
Sabah Forest Department
investment in Class 1 forest
reserve planning and
management
RM25 million for 58 Class I
Protected Forest Reserves
totalling 466,757 ha
By end of Y5, the Sabah Forest
Department investment in Class 1 forest
is at least 25% more than the baseline
Financial
scorecards
Component 1: An
enabling
environment for
optimized multiple
use planning,
financing,
management and
protection of forest
landscapes
State-level system for
ensuring no net loss (NNL)
of biodiversity from
existing forest landscapes
NNL is a new concept for Sabah By end of Y2, state-level policies and
regulations supporting NNL finalized
State-level NNL system in place by end
of year 6 (Y6)
Records of workshop
proceedings and
consultations
National, regional and
local level support is
maintained
State-level policies and
regulations for generating
revenues from innovative
financing mechanisms and
re-investing into PA and
sustainable multiple-use
No policies or regulations
By end of Y5, new state-level policies
and regulations in place for generating
and reinvesting revenues from innovative
financing mechanisms
Policy reports and
administrative
guidelines
Willingness of
relevant stakeholders
to incorporate the
results

Revised: 14 March, 2012
65
Project Strategy Objectively verifiable
Indicators Baseline Target
Sources of
Verification
Risks and
Assumptions
Component 1 (cont.):
An enabling
environment for
optimized multiple
use planning,
financing,
management and
protection of forest
landscapes
forest landscape planning
and management
Capacities of staff within
relevant state level
Government departments
(NROS, SEPU, SFD, YS,
SBC, SWD, DID, EPD) to
design, implement and
manage / oversee
biodiversity-friendly
multiple-use, landscape-
level forest management
and sustainable financing
schemes, and to monitor
ecosystem service markets
Limited capacities and
experience of forest managers
A 30% increase in multiple-use,
landscape-level forestry, forest
conservation and financial management
capacities of SFD, NROS, SEPU,YS,
DID, EPD
Capacity scorecard
Project staff and
counterparts are
secured and retained
throughout project
lifespan
Improved law enforcement
effectiveness
Law enforcement in the
landscape is done by SFD and
YS staff by means of mobile
inspection and checkpoint at
point of entry to the
landscape. There are 60 law
enforcement staff and patrolling
is conducted on a daily basis. Of
these 60, half have been awarded
honorary wildlife warden status
with powers of arrest. In 2010,
there were less than five cases of
fines.
Increase in the ratio of number of fines
collected relative to law enforcement
efforts.
Patrol and law
enforcement record
Systems for compliance,
monitoring and enforcement
of multiple use forest
regulations.
Generic M&E guidelines, no
training materials
By end of project, a revised and updated
set of regulations and guidelines for
compliance monitoring and enforcement
within a multiple use context that
includes innovative revenue generating
instruments
Guidelines,
regulatory updates
New regulations are
fully implemented by
trained staff
State and national
guidelines and operational
Sustainable Forest Management
License Agreement (SFMLA) By end of Y3, policy and guidelines
specific to multiple-use forest landscape
Policy and
Operational
Decision-makers at
central and site levels

Revised: 14 March, 2012
66
Project Strategy Objectively verifiable
Indicators Baseline Target
Sources of
Verification
Risks and
Assumptions
policies for multiple-use
forest landscape planning,
management and
conservation
established Guidelines
documents
are supportive and
willing to implement
policies and
guidelines
Component 2:
Multiple-use forest
landscape planning
and management
system
demonstrated at
pilot site
Component 2 (cont.):
Multiple-use forest
landscape planning
and management
system
demonstrated at
pilot site
Development of multiple-
use forest landscape
planning, management and
conservation systems within
project demonstration area
No multiple use planning,
management or conservation
systems in use at site
Fragmented and out-dated
collection of forest data in EIA
reports
By end of Y1, biodiversity overlay
completed
By end of year 3, economic model
selected and applied in landscape
planning
By end of Y3, landscape-level
management plan completed
Technical report
and maps of
biodiversity
concentration
Multiple-use
landscape
economic model
Landscape-level
management plan
Processes of approval
to collect satellite
images
Availability of
resources to
implement work plan
Implementation of
landscape-level
management plan
No plan / implementation
New PA establishment (ecological
corridors, watershed, salt lick)
Sustainable-use management system
based on sustainable off-take, no net loss,
monitoring and enforcement
Habitat conserved and
degradation reduced under
management plan
Forest plantation occupies 15%
of total project landscape;
baseline scenario to be
determined as part of model
development
Land use for agricultural production at
least 60% lower compared with baseline
scenario
Economic modeling
output
Decision-makers are
supportive of policy
outcome
Component 3:
Sustainable
financing of
protected areas and
associated forest
landscape areas
demonstrated at the
pilot site
Use of innovative revenue
mechanisms for revenue-
generating conservation
Only revenue generation is from
timber concessions; other
ecosystem services remain un-
monetized, leading to over-
harvesting and/or inappropriate
timber harvesting methods
By end of Y2, optimal landuse matrix,
based on environmental economic
considerations within project landscape,
are determined
By end of project, three revenue
generating mechanisms, including
REDD+ / carbon, biodiversity offsets and
PES, have been designed and piloted,
with total annual revenues projected to
reach at least 50% of optimal
management costs within five years
Technical report
Demonstration/pilot
sites
Plan of Operations
for pilot projects
Financial report
National, regional and
local level support is
maintained

Revised: 14 March, 2012
67
Project Strategy Objectively verifiable
Indicators Baseline Target
Sources of
Verification
Risks and
Assumptions
following project completion
Management budgets, as %
of optimal management
costs
RM11.4 million (2010) budget
represents approximately 57% of
optimal management costs (latter
to be updated based on revised
estimate of optimal management
costs)
Annual revenues available for
sustainable, multiple use management
and conservation equivalent to 80% of
estimated optimal landscape level
management costs and on upward trend
YS Annual financial
reports
An effective financial/
accounting system for fund
management and
disbursement
Financial/accounting system at
SFD and YS Adaptive system in place by Y2 Operation manuals
Specific expertise
available to establish
system and conduct
training

68
PART VII: TOTAL BUDGET AND WORK PLAN
(A) Total Budget
Short Title: PIMS 4186 Borneo Forest
Award ID: [to be added when the budget is entered into Atlas]
Award Title: [to be added when the budget is entered into Atlas]
Business Unit: MYS10
Project Title: Biodiversity Conservation in Multiple-Use Forest Landscapes in Sabah, Malaysia
Implementing Partner
(Executing Agency)
Sabah Forestry Department, Government of Sabah, Malaysia
GEF
Outcome/Atlas
Activty
Respon
sible
Party/
Implem
enting
Agency
Fund
Identit
y
Donor
Name
Atlas
Budgetary
Account
Code
Atlas Budgetary
Description
Amount
(USD)
Amount
(USD)
Amount
(USD)
Amount
(USD)
Amount
(USD)
Amount
(USD) Total
USD
See
Budget
Notes
Year 1 Year 2 Year 3 Year 4 Year 5 Year 6
Co
mp
on
ent
1:
An
en
ab
lin
g e
nv
iron
men
t fo
r
op
tim
ized
mu
ltip
le-u
se
pla
nn
ing,
fin
an
cin
g,
ma
na
gem
ent
an
d p
rote
ctio
n o
f
fore
st l
an
dsc
ap
es
SFD 62000 GEF
71200 Local Consultants 4,000 4,000 4,000 0 0 0 12,000 1
71600 Travel 0 72,000 12,000 0 0 0 84,000 2
72100 Contractual Services
-company 50,000 186,000 136,000 0 0 0 372,000 3
72200 Equipment 5,000 5,000 5,000 5,000 5,000 5,000 30,000 4
74200 Printing &
Publications 4,000 4,000 4,000 4,000 4,000 4,000 24,000 5
75700 Training/Workshops/
Conf 19,000 19,000 10,000 10,000 10,000 10,000 78,000 6
Total Component 1 82,000 290,000 171,000 19,000 19,000 19,000 600,000
Co
mp
on
ent
2
Mu
ltip
le-u
se f
ore
st l
an
dsc
ap
e
pla
nn
ing a
nd
ma
na
gem
ent
syst
em d
emo
nst
rate
d a
t p
ilo
t
site
SFD 62000 GEF
71200 International
Consultants 0 72,000 0 0 0 0 72,000 7
71300 Local Consultants 0 48,000 48,000 0 24,000 0 120,000 8
71600 Travel 0 59,000 9,000 0 0 0 68,000 9
72100 Contractual Services
- company 100,000 406,500 406,500 406,500 306,500 0 1,626,000 10
72200 Equipment 5,000 5,000 5,000 5,000 5,000 5,000 30,000 11
74200 Printing &
Publications 4,000 4,000 4,000 4,000 4,000 4,000 24,000 12
75700 Training/Workshops/ 18,000 18,000 24,000 0 0 0 60,000 13

69
Conf
Total Component 2 127,000 612,500 496,500 415,500 339,500 9,000 2,000,000
Co
mp
on
ent
3
Su
sta
ina
ble
fin
an
cin
g o
f p
rote
cted
are
as
an
d a
sso
cia
ted
fo
rest
la
nd
sca
pe
are
as
dem
on
stra
ted
at
the
pil
ot
site
SFD 62000 GEF
71200 International
Consultants 48,000 72,000 36,000 0 0 0 156,000 14
71300 Local Consultants 48,000 0 0 0 0 0 48,000 15
71600 Travel 0 52,000 1,500 0 0 0 53,500 16
72100 Contractual Services
- company 0 345,000 345,000 346,000 0 0 1,036,000 17
72200 Equipment 4,750 4,750 4,750 4,750 4,750 4,750 28,500 18
74200 Printing &
Publications 4,000 4,000 4,000 4,000 4,000 4,000 24,000 19
75700 Training/Workshops/
Conf 18,000 18,000 18,000 0 0 0 54,000 20
Total Component 3 122,750 495,750 409,250 354,750 8,750 8,750 1,400,000
Pro
ject
Ma
nag
emen
t
Un
it
SFD 62000 GEF
71200 International
Consultant 8,000 7,000 0 18,000 0 18,000 51,000 21
71300 Local Consultant 30,000 55,000 55,000 55,000 55,000 75,000 325,000 22
71600 Travel 2,500 500 500 2,500 500 2,500 9,000 23
74100 Audit 0 2,500 2,500 2,500 2,500 5,000 15,000 24
Total Project MGT 40,500 65,000 58,000 78,000 58,000 100,500 400,000
PROJECT TOTAL
372,250
1,463,250
1,134,750
867,250
425,250
137,250
4,400,000
Summary of Funds
Amount Amount Amount Amount Amount Amount Total
% of
Total Year 1 Year 2 Year 3 Year 4 Year 5 Year 6
GEF 372,250 1,463,250 1,134,750 867,250 425,250 137,250 4,400,000 18%
Government of
Malaysia 2,100,000 4,200,000 5,600,000 4,200,000 2,300,000 1,000,000 19,400,000 81%
WWF 50,000 50,000 0 0 0 0 100,000 1%
TOTAL 2,522,250 5,713,250 6,734,750 5,067,250 2,725,250 1,137,250 23,900,000 100%

70
General Cost Factors:
(a) International Consultant (IC) is budgeted at $3,000 per week.
(b) National Consultant (NC) is budgeted at $2000 per week. 89
(c) Short-term consultancy is herein defined as work that last no more than 12 months
(d) Long-term consultancy is defined as work that requires more than 12 months of completion
(e) Unless otherwise stated, total budget allocation per item is GEF funded only
Component 1: An enabling environment for optimized multiple use planning, financing, management and
protection of forest landscapes
1. Local consultancy services (USD12,000 consisting of 6 weeks of short-term support; for travel and per diem costs,
see travel budget):
Training needs identification, design and step-wise approach training on all aspects of multiple-use forest
landscape planning and management in support of Output 1.3 (USD12,000 consisting of 6 weeks on a split
training schedules).
2. International airfares and per diems for international consultants; local travel for consultants, service
providers, project activity implementers and participants for meetings, trainings and other stakeholder
consultations in support of the outputs under component 1. All air travel provisions are budgeted on
economy class. (USD 84,000)
3. Contractual services for firms, institutions and/or NGOs for the following (GEF=USD372,000 +
GoM=1,300,000 = USD1,672,000):
Development of appropriate policy options on biodiversity offset/no net loss in support of Output 1.1.
(GEF=USD87,000 + GoM=USD270,000 = USD357,000);
Development of state-level policies and regulations for generating revenues from REDD+ in support of
Output 1.2 (GEF=USD97,000 + GoM=USD 400,000 = USD497,000);
Development of state-level policies and regulations for generating revenues from Bio-banking in support
of Output 1.2 (GEF=USD87,000 + GoM=USD100,000 = USD187,000);
Development of state-level policies and regulations for generating revenues from PES (GEF=USD101,000
+ GoM=USD280,000 = USD381,000) in support of Output 1.2.
4. IT equipment (LAN services, computer equipment) for the storage and delivery of digital information/data
for project activity use (USD30,000).
5. Printing and Publications (USD24,000)
Printing and publications of reports, maps, legal documents and fees on this project component (USD18,000
@ USD3,000 per year x 6 yrs).
Printing of pamphlets, newspaper articles, and corporate brochures for public awareness building
campaign (USD6,000 @ USD1,000 per yr for 6 yrs).
6. Training and stakeholder consultation/decision making/advocacy meetings to support the following;
(USD78,000 consisting of 15 individual sessions over 6 years including travel and per diem):
Stakeholders’ consultation and decision makingmeetings on REDD, biobanking and PES (USD18,000 @
US$6,000 per session per year for 3 yrs);
Site-level consultations and training sessions for field staff (USD60,000 @ USD5,000 per session @ 2 sessions
per year for 6 yrs).
89 Rates are in line with the rates paid by UNDP in Malaysia as per the UNDP rate sheet.

71
Component 2: Multiple-use forest landscape planning and management system demonstrated at pilot site.
7. International Consultancy Services
Support to development of an integrated ecological-economic model for determining the optimal landuse
matrix within the project site in support of Output 2.2 (USD72,000 consisting of 24 weeks on a short-term
basis).
8. Local Consultancy Services; (USD120,000 for a total of 60 weeks consisting of short-term support):
Support to economics of landuse study (ref. Output 2.2) (USD48,000 consisting of 24 weeks of long-term
support)
Evaluation of the extent of biodiversity mainstreaming covered in existing policy framework, management
plans and operational plans for guidance to the preparation of the landscape-level management plan in
support of Output 2.3 and 2.5 (USD24,000 consisting of 12 weeks of short-term support)
Revision of existing legal provisions, legal process and administrative procedures for the creation of new
conservation areas within the project landscape, and to draft legislation or amended administrative
regulations to provide enabling policy for state/national endorsement in support of Output 2.4 (USD24,000
consisting of 12 weeks of short-term support)
9. International airfares and per diems for international consultants; local travel for consultants, service
providers, project activity implementers and participants for meetings, trainings and other stakeholder
consultations in support of the outputs under component 2. All air travel provisions are budgeted on
economy class. (USD 68,000).
10. Contractual Services for firms institutions and/or NGOs in support of the following; (GEF=USD1,626,000 +
GoM=USD4,500,000 = USD6,162,000 for site-level activities)
Economic analysis of alternative landuses within target landscape in support of Output 2.1
(GEF=USD106,000)
Development of economic model for land use decision-making, including associated capacity building in
support of Output 2.1 (GEF=USD150,000)
Development of landscape level management plan including landscape biodiversity mapping and digital
data in support of Output 2.2 (GEF=USD430,000).
Operationalisation of on-the-ground landscape management system based on the landscape-level
management plan and adaptive management to improve habitat conditions, reduce natural capital loss and
to increase financing for biodiversity conservation in support of Output 2.3 (GEF=USD440,000 +
GoM=USD1,500,000 = USD1,940,000)
Establishment of new PA and biodiversity corridors to enhance connectivity and habitat conditions of the
target landscape in support of Output 2.3 (GEF= USD 500,000 + GoM=USD,1,500,000 =
USD2,000,000)
11. IT equipment to to support decision making tools and biodiversity monitoring by the Sabah Forest
Department, the Sabah Foundation, and other relevant partners on the ground (USD30,000).
12. Printing and Publications (USD24,000)
Printing and publications of reports, maps, legal documents and fees on this project component
(USD18,000 @ USD3,000 per year x 6 yrs).
Printing of pamphlets, newspaper articles, and corporate brochures for public awareness building
campaign (USD6,000 @ USD1,000 per yr for 6 yrs).
13. Training and advocacy and consultation meetings; (USD60,000 for 10 split sessions @ USD6,000 per
session)
1 stakeholder consultation and decision making fora and meetings during preparation of management plan
(USD6,000);

72
3 training programmess to transfer skills on biodiversity mapping/analysis, landuse economic modeling
and protected area management (USD54,000).
Component 3: Sustainable financing of protected areas and associated forest landscape areas demonstrated
14. International Consultancy Services (USD156,000 consisting of 47 weeks of short-term support):
Estimation of the Total Economic Value (TEV) of actual versus potential landuse scenarios, and scoping
on optimal mix of revenue generation mechanisms for sustainable financing in support of Output 3.1 and
3.2 (USD72,000 for 24 weeks of short-term support);
Preparation of operating and financial memorandum of agreements between project partners and
stakeholders in support of Output 3.3 and 3.4 (USD12,000 for 4 weeks of short-term support);
Development of a customized financial accounting and monitoring system for allocation, benefit-sharing
and re-injection of revenues into PAs and landscape-level management in support of Output 3.5
(USD36,000 for 12 weeks of short-term support).
Development of benefit-sharing policy and mechanisms for new revenue generation schemes in support of
Output 3.6 (USD36,000 consisting of 12 weeks of short-term support).
15. Local Consultancy Services
Assessment economic trade-offs in capping natural production area to 25% of total landscape in support of
mainstreaming biodiversity under Output 3.1 (USD48,000 consisting of 24 weeks of short-term support).
16. International airfares and per diems for international consultants; local travel for consultants, service
providers, project activity implementers and participants for meetings, trainings and other stakeholder
consultations in support of the outputs under component 3. All air travel provisions are budgeted on
economy class (USD53,500)
17. Contractual Services by firms, institutions and/or NGOs institutions and/or NGOs to support Output 3.2;
(GEF=USD1,036,000 + GoM=USD1,600,000 = USD2,636,000):
Diversification of revenue sources and increase of revenue from the target landscape through the pilot
scheme of new revenue generation mechanism on REDD (GEF=USD345,333 + GoM=USD533,333 =
USD878,666);
Diversification of revenue sources and increase of revenue from the target landscape through new revenue
generation mechanism on biobanking (GEF=USD345,333 + GoM=USD533,333 = USD878,666);
Diversification of revenue sources and increase of revenue from the target landscape through the pilot
scheme of new revenue generation mechanism on PES (GEF=USD345,333 + GoM=USD533,333 =
USD878,666)
18. Equipment to support on the ground implementation of the pilots (USD28,500).
19. Printing and Publications (USD24,000)
Printing and publications of reports, maps, legal documents and fees on this project component
(USD18,000 @ USD3,000 per year x 6 yrs).
Printing of pamphlets, newspaper articles, and corporate brochures for public awareness building
campaign (USD6,000 @ USD1,000 per yr for 6 yrs).
20. Training and advocacy/consultation/decision making meetings for the following (USD54,000 for 9 sessions
in split schedules);
3 operational trainings on Financial and Accounting System;
2 Site-level trainings on pilot revenue schemes;
2 Small local training sessions on developing managerial skills for project staff;
2 Stakeholders’ consultation with respect to developing pilot revenue schemes.
73
Project Management Unit:
21. International Consultancy Services (51,000 consisting of 17 weeks of short-term support):
Inception Support Forest Landscape Management Specialist (USD 15,000 for 5 weeks of short-term
support);
Project Evaluation Expert (USD36,000 for 12 weeks of short-term support);
22. Project Management Staff ( GEF = USD 325,000 + GoM = USD 86,400 = USD 411,400 )
Project Manager (USD252,000 @ USD3,500/month x 12 mo x 6 yrs)
Project Assistant to provide overall coordination support to the Project Management Unit (USD73,000 @
USD1,014/mo x 1 psn x 12 mo/yr x 6 yrs)
Administrative/Finance Officer (GoM=USD72,000 @ USD1,000/mo x 1 psn x 12mo/yr x 6 yrs)
Administrative clerk (GoM=USD14,400 @ USD200/mo x 1 psn x 12 mo/yr x 6 yrs).
23. Travel and per diem for PMU staff to attend meetings and official site visits (USD9,000)
24. Project audits (USD15,000 @ USD2,500 per yr x 6 yrs)

74
ANNEX 1: TERMS OF REFERENCE FOR PROJECT STAFF AND CONSULTANTS
Overview of Inputs from Technical Assistance Consultants financed by GEF
Position Titles USD/psn
week*
Est. psn
weeks** Tasks to be performed
Local
Project Management
Project Manager 875 288 Role: Overall-in-charge of project operational affairs in ensuring timely and
quality delivery of project activities/outputs.
Reporting Relationship: Reports directly to the NPD, and ultimately to the
Project Board (PB)
Duties and Responsibilities:
Assist in setting technical direction to Project and its activities
Assist in overall project planning and reporting on results to stakeholders
Prepare TOR of national and international Consultants and subcontractors
Coordinate inputs of various consultants and sub-contractors to deliver
desired results
Coordinate with stakeholders to secure their active participation
Review lessons and experiences of Project and present results in a forum
Prepare report of findings for wider sharing with policy makers
Assist NPD in preparing and providing technical, work and budget reports
Project Assistant 253 288 Role: Overall-in-charge of project administration matters.
Reporting Relationship: Reports directly to the Project Manager, and
ultimately to the NPD
Duties and Responsibilities:
Prepare relevant Memorandum Circulars and/or other administrative
regulations to improve operations and logistic support to project team
Managing schedules and project implementation Undertaking secretariat
services to specific project activities
Providing limited backup support to the team
Providing financial and limited backup support to the project team
Executing financial and budgetary tasks and related activities
Component 1: An enabling environment for optimized multiple-use planning, financing, management and protection of forest landscapes
Trainer for
Institutional/Capacity
Building
(National/Local)
Component 1 Output
1.3
2,000 6 Role: Identify, design and implement step-wise approach training
programmes in support of multiple-use forest landscape goal
Reporting Relationship: Reports directly to the Project Manager, and
ultimately to the NPD
Scope of Work
Assess capacity of SFD and key stakeholders to support management of
multiple-use forest landscape management system
Prepare a capacity building program for key stakeholders in project team,
and conduct consultations to engender participation and ownership
Review Project documentation, procedures, technical reports, in preparing
training modules and learning guides
Prepare timetables and resource requirements to implement the plan, and
monitoring and evaluation requirements to keep track of progress and
evaluate outcomes
Component 2: Multiple-use forest landscape planning and management system demonstrated at pilot site
Landuse Agronomist
(National)
Component 2 Output
2.1
2,000 24 Role: Undertake an economic landuse study on crop-site matching
Reporting Relationship: Reports directly to the Project Manager, and
ultimately to the NPD
Scope of Work:
Undertake soil survey to match crops to site suitability
Determine extent of tree/agriculture plantation developments within
project landscape, and draw implications on overall project objectives
Develop optimal landuse strategy to meet project objectives

75
Position Titles USD/psn
week*
Est. psn
weeks** Tasks to be performed
Management Plan
Reviewer
(National)
Component 2 Output
2.2 and 2.3
2,000 12 Role: Review of existing management plans to determine the extent to which
biodiversity mainstreaming have been considered
Reporting Relationship: Reports directly to the Project Manager, and
ultimately to the NPD
Scope of Work
Review existing provisions (legal, administrative, technical) in existing
management plans and provisions for biodiversity mainstreaming
Consult with relevant stakeholders on the legal, administrative and
technical requirements for the preparation of the management plan
Identify the context, environment and gaps in the preparation of a
multiple-use forest management landscape plan
Prepare a budget of the prescribed activities to prepare a multiple-use
forest landscape management plan
PA Planning and
Management Expert
(National)
Component 2 Output
2.3
2,000 24 Role: Develop new conservation areas within project landscape
Reporting Relationship: Reports directly to the Project Manager, and
ultimately to the NPD
Scope of Work:
Review existing policies relevant to creation of protected areas
Consult with stakeholders on the legal, administrative and legislative
process on new protected area
Prepare working papers for approval by the State Cabinet in creating new
PA within project landscape
Component 3: Sustainable financing of protected areas and associated forest landscape areas demonstrated at the pilot site
Natural Forest
Planning Expert
(National)
Component 3 Output
3.1
2,000 24 Role: Assess feasibility of capping harvesting within natural forest
management area in mainstreaming biodiversity
Reporting Relationship: Reports directly to the Project Manager
Scope of Work:
Review existing forest rules and regulations on harvesting licensing,
permits and rights, practices and impacts within project landscape
Review existing timber pricing, sales and marketing structure at project
landscape
Assess the economic implications of placing a harvesting cap by area of
less than 25% or as appropriate within the project landscape
Prepare a policy paper on best modality and scenarios that offers the
optimal timber rent capture at project landscape International
Project Management
Inception Support
Forest Landscape
Management
Specialist
3,000 5 Role: Support the SDF and the PMU during the inception phase of the
project
Reporting Relationship: Reports to the NPD
Duties and Responsibilities:
Provide technical guidance during the inception phase of the project ,
including: support for development of the Inception Report, establishment of
baselines and M&E mechanisms; development of the annual workplan;
development of terms of reference for technical consultancies and contractual
services, initial awareness raising and capacity development of stakeholders.
Evaluation Experts 3,000 12 Role: Undertake evaluation of project physical progress, achievements and
impacts in accordance to UNDP/GEF standard procedures
Reporting Relationship: Reports to the Project Board
Duties and Responsibilities:
Work with local evaluation consultants to assess the mid-term and final
project progress, achievement of results and impacts.
Prepare evaluation reports, discuss with project team, government and
UNDP personnel, and participate in discussions to extract lessons
Component 2: Multiple-use forest landscape planning and management system demonstrated at pilot site
Economic Landscape 3,000 24 Role: Develop landuse matrix model within the project site

76
Position Titles USD/psn
week*
Est. psn
weeks** Tasks to be performed
Modeler
(International)
Component 2 Output
2.1
Reporting Relationship: Reports directly to the Project Manager, and
ultimately to the NPD
Scope of Work
Develop a landscape planning tool that incorporates biological and
economic parameters in modeling scenarios that offers the best optimal
landuse matrix within project landscape
Undertake/coordinate data collection for enabling modeling
Communicate findings to local and national stakeholders through
workshops
Develop and conduct training to enhance existing capacity
Component 3: Sustainable financing of protected areas and associated forest landscape areas demonstrated at the pilot site
Environmental
Economist
(International)
Component 3 Output
3.1
3,000 24 Role: Compare the environmental economic trade-offs between baseline and
alternative landuses within the project landscape
Reporting Relationship: Reports directly to the Project Manager
Scope of Work:
Assess the total economic value of baseline versus alternative landuse
scenarios
Scoping on optimal mix of revenue generation mechanisms
Indicate the funding gaps to be leveraged against investments to be raised
internally, co-finance and/or through the market
Legal Expert
(International)
Component 3 Output
3.3
3,000 4 Role: Ensuring all MoUs/MoAs to be executed are in accordance with proper
procedures
Reporting Relationship: Reports directly to the Project Manager
Scope of Work:
Prepare legal document for all new arrangements under the project
Vet third-party memorandum of understanding/agreements to ensure
appropriateness
Provide legal advice on matters concerning project arrangements
Financial/Accounting
System Specialist
(International)
Component 3 Output
3.4 and 3.7
3,000 12 Role: Develop a transparent and coordinated accounting and monitoring
system
Reporting Relationship: Reports directly to the Project Manager
Scope of Work:
Prepare guidelines on tendering procedure
Develop a system of recording financial receipts and expenditure
Develop an effective financial system of disbursing funds
Develop a financial reporting system that links to measurable performance
indicators to aid decision making, planning and budgeting
Specify a periodic review schedule of the financial management system
Provide training in the use of the full system
Benefit-sharing
Stewardship
Specialist
(International)
Component 3 Output
3.6
3,000 12 Role: Develop an operational financial systems for benefit-sharing
Reporting Relationship: Reports directly to the Project Manager
Scope of Work:
Prepare budgetary requirements for implementing management plans
Prepare a resource mobilization plans from internal and external sources
Prepare guidelines for a benefit-sharing arising from revenue generation.

77
ANNEX 2: STAKEHOLDER INVOLVEMENT PLAN
Stakeholder Identification
The Sabah Forestry Department (SFD) is the project proponent, and the implementing agency of the Project.
Its role as implementing agency will be supplemented by the UNDP-Country Office (UNDP-CO) in Malaysia,
Ministry of Natural Resources and Environment (NRE) at the National level, State Economic Planning Unit
(SEPU) and Natural Resources Office (NROs) of the Chief Minister Department at the State level. It will also
work in partnerships with the Sabah Biodiversity Centre (SBC), Sabah Foundation/Yayasan Sabah (YS) and
appointed NGOs to strengthen its capacity as implementing agency. These institutions will be represented at
the Project Board (PB). In addition to these key stakeholders, SFD will work in partnerships with State
Ministries State Departments, District Offices, Academic/Research institutes and local NGOs and
communities in meeting the project objectives. Table A below describes the major categories of stakeholders,
their roles and responsibilities and their involvement in the Project.
Table A. Key Stakeholders, their Roles and Responsibilities and Involvement in the Project.
Stakeholder Roles and Responsibilities Involvement in the Project
Ministry of Natural Resources
and Environment (NRE)
This Ministry is responsible for the
management of natural resources and
environment in Malaysia. They are
empowered to legislate policy and law on
natural resource and environment
management through nine Departments under
their jurisdiction. They also monitor the
implementation of these policy instruments to
ensure effectiveness in application.
NRE will be represented in the Project
Board (PB) as one of the Senior
Suppliers, and will provide guidance
on project coordination and
management in line with national
policies and objectives
Natural Resource Office
(NRO), Sabah
NRO is under the Chief Minister Department
of Sabah overseeing the planning of natural
resources (Land, Forestry, Mining, Water)
and development. It is headed by a Natural
Resource Secretary
NRO will be the Executive Chair of the
PB in facilitating and ensuring that the
project activities are achieved as
planned.
State Economic Planning Unit
(SEPU)
SEPU is under the Chief Minister
Department of Sabah, and is responsible for
the planning and coordination of all State’s
Development Programme
SEPU will act as extension of MNRE
in monitoring and coordinating
implementation of the project activities
in line with State’s development plan
and policies.
Ministry of Finance, Sabah
(MoFS)
The Ministry of Finance manages the state
revenues, expenditures and funds in ensuring
a healthy financial reserve.
MoFS provide advice on financial
management of the project.
Ministry of Rural and
Entrepreneurial Development,
Sabah (MRED)
MRED is responsible for the improvement of
the standard and quality of life in the rural. Its
mission is to ascertain that rural development
programs are planned and implemented
efficiently and effectively.
MRED will be a partner of the project,
and will provide technical advice on
aspects of community developments in
line with national/state planned rural
development programs.
Ministry of Tourism and
Environment Science and
Technology, Sabah (MTEST)
MTEST is in-charge of State’s tourism
development and environmental
management. This Ministry is also in-charge
of the Sabah Wildlife Department (SWD) and
the State Tourism Board.
MTEST will be a partner of the Project
in providing policy advice on tourism
and environmental management as
well as identifying opportunities for
ecotourism development.
Sabah Forestry Department
(SFD)
SFD is the central agency responsible for
forestry in Sabah.
SFD is the Senior Supplier in the PB
being the proponent and implementing
agency for the Project. They will be
responsible for managing the Project.
SFD will be act as the executive
secretary to the PB.
Sabah Biodiversity Centre
(SaBC)
The central agency responsible for overall
biodiversity protection and safety in Sabah.
SBC will be represented in the PB to
provide policy and technical advice on
biodiversity developments.

78
Stakeholder Roles and Responsibilities Involvement in the Project
Sabah Wildlife Department
(SWD)
SWD is responsible for the implementation
of the Sabah Wildlife Conservation
Enactment, 1997. Under the provision of the
Enactment, the Department is entrusted to
manage wildlife habitat and utilization in
Sabah. The Department also implements the
Convention on International Trade in
Endangered Species of Wild Fauna and Flora
(CITES) as well as contribute to the
implementation of the International
Convention of Biological Diversity (CBD)
and a number of other international, regional
and bilateral agreements.
SWD will provide support in terms of
technical inputs on aspects of wildlife
conservation and management within
the project landscape.
Department of Irrigation and
Drainage (DID)
This Department is responsible for the
planning of irrigation infrastructures in
agricultural land development. DID’s role
also covers the development and management
of the state’s water resources under the Water
Resources Enactment 1988
DID will be represented in the PB
whose role will be to provide technical
advice/support on water resource
planning and development, in
particular, PES within the project
landscape.
District Forest Offices of
Kalabakan
They have jurisdictions in areas where the
project is located. They have existing
mandates to sustainably manage their
resources and promote biodiversity conservation.
They will take an active role in the
management of multiple-use forest
landscape management under their
jurisdiction.
UNDP Malaysia UNDP will be the implementing agency of
the GEF and facilitates the development,
review and submission of projects for GEF
financing. It also monitors the
implementation of the UNDP Country
Program. It also catalyzes the support of
other donors in fulfilling the government
responsibilities under the CBD and in
implementation of GEF projects
The UNDP Country Office (UNDP-
CO) is responsible for the successful
management and delivery of
programme outcomes and monitoring
of interdependencies between projects
and managing changes within and
among projects. They will be
represented in the PB as one of the
members of the Senior Suppliers.
Sabah Foundation/Yayasan
Sabah (YS)
YS is a statutory body who holds a 100-year
licence to one million hectares of forest
concession in Sabah. The project landscape
is located within the YS forest concession.
YS is one of the senior suppliers of the
PB.
National NGO such as the
World Wildlife Fund –
Malaysia (WWF)
WWF-Malaysia has an MoU (2010-2015)
with the project proponent (SFD) to obtain
credible certification for FMU23, 24 and 26
within the project landscape. They are active
partner in advocacy for strengthening forest
management and financing through REDD.
This NGO will provide co-financing
for the Project, and as implementing
partners of the Project. A
representative of WWF will be selected
to be a member of the PB.
Local NGOs
NGO HUTAN
Land Empowerment and
Animals People (LEAP)
Borneo Conservation Trust
(BCT)
Partners of Community
Organizations (PACOS)
Borneo Rhino Alliance
(BORA)
These local-based NGOs have on-going
partnerships with State departments and/or
international organizations in conservation
efforts in Sabah with main focus in forests
and people. The also undertake studies to
provide scientific basis for sustaining the
supply, utilization and management of natural
resources.
These NGOs will be appointed as
implementing partners of the Project if
they have on-going activities or
interests in supporting the
implementation of selected activities
within the project landscape. Where
possible, these NGOs will provide co-
financing to support project activities.
A representative from these NGOs will
be selected to be a member of the PB.
Local communities These local communities are living within or
in the fringes of the project landscapes. While
most have modern living lifestyle, some
groups still collect and hunt for food in the
forest. They get their water from rain or
gravity feed from spring or rivers. Many also
farm lands by practicing traditional slash and
burn.
They will take an active role in
providing local knowledge related to
the socio-economic development and
management of the project landscape.
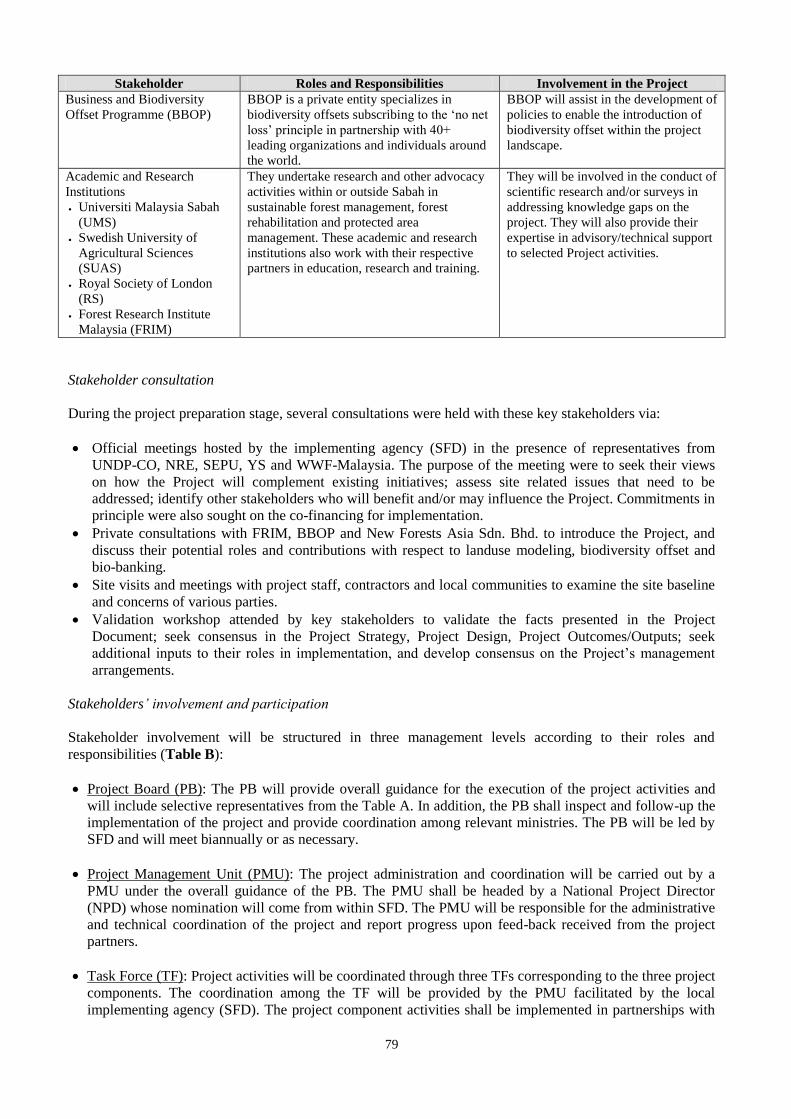
79
Stakeholder Roles and Responsibilities Involvement in the Project
Business and Biodiversity
Offset Programme (BBOP)
BBOP is a private entity specializes in
biodiversity offsets subscribing to the ‘no net
loss’ principle in partnership with 40+
leading organizations and individuals around
the world.
BBOP will assist in the development of
policies to enable the introduction of
biodiversity offset within the project
landscape.
Academic and Research
Institutions
Universiti Malaysia Sabah
(UMS)
Swedish University of
Agricultural Sciences
(SUAS)
Royal Society of London
(RS)
Forest Research Institute
Malaysia (FRIM)
They undertake research and other advocacy
activities within or outside Sabah in
sustainable forest management, forest
rehabilitation and protected area
management. These academic and research
institutions also work with their respective
partners in education, research and training.
They will be involved in the conduct of
scientific research and/or surveys in
addressing knowledge gaps on the
project. They will also provide their
expertise in advisory/technical support
to selected Project activities.
Stakeholder consultation
During the project preparation stage, several consultations were held with these key stakeholders via:
Official meetings hosted by the implementing agency (SFD) in the presence of representatives from
UNDP-CO, NRE, SEPU, YS and WWF-Malaysia. The purpose of the meeting were to seek their views
on how the Project will complement existing initiatives; assess site related issues that need to be
addressed; identify other stakeholders who will benefit and/or may influence the Project. Commitments in
principle were also sought on the co-financing for implementation.
Private consultations with FRIM, BBOP and New Forests Asia Sdn. Bhd. to introduce the Project, and
discuss their potential roles and contributions with respect to landuse modeling, biodiversity offset and
bio-banking.
Site visits and meetings with project staff, contractors and local communities to examine the site baseline
and concerns of various parties.
Validation workshop attended by key stakeholders to validate the facts presented in the Project
Document; seek consensus in the Project Strategy, Project Design, Project Outcomes/Outputs; seek
additional inputs to their roles in implementation, and develop consensus on the Project’s management
arrangements.
Stakeholders’ involvement and participation
Stakeholder involvement will be structured in three management levels according to their roles and
responsibilities (Table B):
Project Board (PB): The PB will provide overall guidance for the execution of the project activities and
will include selective representatives from the Table A. In addition, the PB shall inspect and follow-up the
implementation of the project and provide coordination among relevant ministries. The PB will be led by
SFD and will meet biannually or as necessary.
Project Management Unit (PMU): The project administration and coordination will be carried out by a
PMU under the overall guidance of the PB. The PMU shall be headed by a National Project Director
(NPD) whose nomination will come from within SFD. The PMU will be responsible for the administrative
and technical coordination of the project and report progress upon feed-back received from the project
partners.
Task Force (TF): Project activities will be coordinated through three TFs corresponding to the three project
components. The coordination among the TF will be provided by the PMU facilitated by the local
implementing agency (SFD). The project component activities shall be implemented in partnerships with

80
the relevant partner institutions listed in Table B to achieve a broad-based stakeholder participation. The
TFs will meet at least once a year or at appropriate frequency.
PB and PMU will be located in Sandakan to ensure coordination among stakeholder organizations at central
level during the project period. The PMU and the PB will be instrumental in conveying the
messages/outcomes of actual site work to relevant central bodies and make use of them in developing new
policies. The TFs will be locally based at the project landscape and directly responsible for overseeing the
activities on the ground.
Table B: Members of PB, PMU and TFs.
Project Board (PB) Project Management Unit (PMU) Task Forces Partners
(TFPs)
1. Natural Resource Office,
Sabah (NROS)
2. Sabah Forestry Department
(SFD)
3. UNDP-Country Office
(UNDP-CO)
4. Ministry of Natural Resources
and Environment (NRE)
5. State Economic Planning Unit
(SEPU)
6. Ministry of Finance, Sabah
(MoFS)
7. Sabah Biodiversity Centre
(SBC)
8. Sabah Foundation/Yayasan
Sabah (YS)
9. Universiti Malaysia Sabah
(UMS)
10. World Wildlife Fund for
Nature-Malaysia (WWF-
Malaysia)
11. Local NGO (To be appointed)
1. National Project Director
2. Project Manager
3. Project Coordinator
4. Project Assurance Manager
1. Ministry of Rural and
Entrepreneurial Development,
Sabah (MRED)
2. Ministry of Tourism and
Environment Science and
Technology, Sabah (MTEST)
3. Sabah Wildlife Department
4. Environment Protection
Department (EPD)
5. Department of Irrigation and
Drainage (DID)
6. Local communities
7. NGO HUTAN
8. NGO Land Empowerment and
Animals People (LEAP)
9. NGO Borneo Conservation
Trust (BCT)
10. NGO Partners of Community
Organizations (PACOS)
11. NGO Borneo Rhino Alliance
(BORA)
12. Business and Biodiversity
Offset Programme (BBOP)
13. Swedish University of
Agricultural Sciences (SUAS)
14. Royal Society of London (RS)
15. Forest Research Institute
Malaysia (FRIM)
The proposed management arrangement is designed to harness the strengths and synergies of existing
institutions in overall project guidance, coordination and management. The composition of the institutional
members was chosen on the basis of shared goals in sustainable forest management; possessing on-going
activities within the project landscape to build synergy and avoid duplication of efforts. An important
consideration is deriving co-financing benefits from prospective institutional partners from the government
sector, private sector and/or international/national/local NGOs. The proposed arrangement is deemed to be
effective in resolving issues arising from within or outside the project, and in communicating the project
achievements to affiliates of member institutions. The PMU will enter into a Memorandum of Agreement
with these project partners specifying the purpose, duration, and other obligations to be performed during the
agreed period.
Stakeholders will benefit from their participation through capacity building provided by the project. This
opportunity is a key strategic intervention of the project in enabling and smoothen the process of project
scaling-up to state, national, regional or international levels.

81
ANNEX 3: SUMMARY INPUTS OF STAKEHOLDERS' VALIDATION WORKSHOP
Component 1: An enabling environment for optimized, multiple-use planning, financing, management and protection of forest landscapes.
General Outputs Baseline Targets
Group members:
1. Yap Siew Fah (DID)
2. Hajah Shamsiah Hj Jirat (SEPU)
3. Hazlyn Liaw (EPD)
4. Mohd Nizam Bin Awang (LSD)
5. Ivy Any (WWF)
6. Javin Tan (WWF)
7. Diana Anthony (WWF)
8. Juswinder Kaur Kler (LEAP)
Output 1.1:
Generally OK (√)
Is this output suggests a review of the existing policies? (Yes)
Timeframe (Y2) is too short to seek cabinet approval (As per SFD/BBOP
work plan)
para 140 needs further clarification on the NGOs who have signed MoA on
co-financing of output 1.1 (√)
New policies and regulations may not solve real issue (?)
Output 1.2:
May face resistance due to ‘killer assumption’ that State will adopt this
output (See assumption on NNL/REDD/BioD offset/PES in Strategic Results
Framework)
Suggest to establish a National Steering Committee on REDD in view that
natural resources (land, water and forests) in Sabah are under State’s purview
(To be taken-up at project implementation)
Need clarification on transparency (?)
Output 1.3:
Assumes sufficient resources are provided (Included in assumption)
How to solve if Departments do not have sufficient/competent staff? (included
in assumption)
List of stakeholders to include Ministry of Finance (MoF), SEPU, NRO,
SWD, EPD, DID (√)
Output 1.4:
Replace ‘cost-effective’ system with ‘effective system’ because an effective
system may be costly (Retain as is - the aim is to strive for cost-effective
system)
Suggest to use other tools in addition to METT to measure baseline for
multiple-use forest landscape management (√) : SFMLA, Environmental
Compliance Report (ECR) for EIA, RIL, TLAS, FSC
Clarify M&E in para 144 & 145 (√)
Output 1.5:
Annotations 81 & 82 should reflect further explanation and not co-financing
(√)
Define NNL and its relation to BioD
offsets (√)
Define “Multiple-use forest
landscapes” (re-para 120)
Town & Country Planning have no
role in forest reserve management (√)
Lacks in number and competent
human capital (√)
Time commitment of partners is
not taken into account (included
in assumption)
Too optimistic on time frame
(Policy gaps will be identified by
Y1. By Y2, policy options on
NNL, REDD, Biod offset, etc
determined. Submit for cabinet’s
approval by Y3. These policies
will be the basis of writing the
management plan deemed ready
by Y3)
Why 30% for staff capacity
building ? (Based on capacity
scorecard guideline)
Correlate description in para 142
and 143 with the target (√)
Component 2: Demonstration Of Multiple-Use Forest Landscape Planning and Management System
General Outputs Baseline Targets

82
Group members:
1. Dr. Arthur Chung (SFD)
2. Chia Fui Ree
3. Andrew Garcia (YS)
4. Charles Garcia (YS)
5. Isabelo Garcia (BRL)
6. Andy Hatfield (WWF)
7. Kennesh Manokaran (Hutan)
8. Raymond Alfred (BCT)
9. Dr. Mathew Potts (FRIM)
10. Jason Lim (GFS)
para 34: Include Malua Bio-Banking
in the project document (See para 89)
para 46: Working with local and
international NGOs e.g. WWF
(Added HUTAN and BCT)
para 52: Suggests to use Co-operative
Act 1993 instead of Co-operative
Societies Ordinance (1958) (√)
para 62: Update forest plantation data
(As per latest data in SFD’s annual
report 2010).
para 62: Revert rehabilitation and
forest plantation (√)
para 149 (ii): Suggests to change
“landuse planning model” to
“mitigation measure” (Retain - the
project will adopt a landscape
planning tool to determine the optimal
landuse matrix within the project)
Is it possible to change the landuse
(e.g ITP area) within the project area?
(It is possible according to SFD with
valid justifications)
Output 2.1:
Suggest to strengthen monitoring and enforcement to achieve this output
(Captured in output 1.4)
Include work on HCVF by WWF (√)
Related issues in this output ;
Connectivity (Captured in para 113)
Lack of expertise (Captured in output 1.3)
Lack of resources (Captured in output 1.3)
Policy and funding issues (Capture in Components 1and 3)
Output 2.2:
Careful with the use of “maximize” in the title whereby limiting level from
stakeholders (√)
para 152: change “agriculture” to “tree plantation” (√)
Concern about feasibility and practicality in para 152 (Addressed during
project Implementation)
Need data from reliable sources i.e. ITP, BioD Credit, Ecotourism, Timber
Harvesting (Addressed during project implementation)
Inaccurate data partly because of limited funding (Addressed during project
implementation)
Lack of data (Addressed during project implementation)
Output 2.3:
FMP a pre-requisite to landscape management plan (√)
More stakeholder consultations (captured in output 1.3)
Output 2.4
Suggest to change ‘PA’ to ‘Conservation Area’ (PIF provides for PA and/or
Ecological Corridors)
Inconsistent definition for ‘protected areas’ on para 41 and 45 (Retained -
para 41 gives an overview of PAs in Sabah while para 45 defines protected
areas within forest reserves)
Output 2.5
Includes the following documents in this output:
FMP, AWP, PDP, FD quarterly report, SEIA for timber
harvesting/plantation, Auditing report, HCVF report, SWD/ BCT report on
Sabah Ecological Corridor for Wildlife (Captured in output 1.4)
- Illegal settlement near Luasong i.e. Kg Mukangdut (To be addressed during
project implementation)
Replace “Agroforestry” to “Tree
Plantation” product (√).
RIL is practiced in 100% in NFM area
since 2011 (√)
BioD overlay to be completed by
Y2 instead of Y1 (Retained –
biodiversity overlay must be
completed in Y1 for landscape
planning)
Economic Model to be
completed by 3½ years (Retained
– economic model to be
completed sooner for landscape
planning)
Landscape-level Management
plan by end of year 4 (Retained
based on original work plan for
biodiversity overlays and
economic modeling)
New PAs (PA and/or ecological
corridors, watershed, salt licks,
etc)
Sustainable use management
system
Replace ‘agricultural’ with ‘tree’
plantation (√)
Practice of RIL – 100% within
NFM area
Component 3: Sustainable financing of protected areas and associated forest landscape areas demonstrated at the pilot site
General Outputs Baseline Targets
Group Representatives: Output 3.1 Includes adaptive financial Ensure targets of outcome 3 are

83
1. Masturah Sulaiman (YS)
2. Dr. Anna van Paddenburg (WWF)
3. Cynthia Chin (WWF)
para 10 & 32: statistics on fauna are
inconsistent (√)
Component 3 needs to:
build on SFD’s initiatives on
sustainable financing for HoB (√)
include sustainable financing
approach as UNDP Project only
supports assessment for the most
appropriate economic model( √)
includes SFD’s Initiative on
REDD+ framework (√)
Stakeholders’ to include (Capture in
Table 9):
a) Government – SFD, EPD, SWD,
SEPU, JKM/Finance, SEDIA/ IDS,
District Office (√)
b) Private sectors – YS, production
forest contractors, Biobanking
investors, REDD + Finance
Investors
c) NGOs – PACOS, WWF, HUTAN,
LEAP (√)
d) Local communities – JKKK
e) International Aid agencies
para 158: Clarify whether funding gap is opportunity costs (?)
para 158: The assessed scenario is RIL, what about other landuses?
(Captured in output 2.2)
Include social values in output 3.1 (Integral part of economic analysis)
Output 3.2
para 159: should not be limited to revenue generating mechanism but also to
include fiscal and economic instruments i.e. provides incentives to Green
Business who maintain natural capital stock (Captured in output 1.1)
Output 3.3
para 160: MOA should include measurable performance indicator (√)
Output 3.4
para 161: Add to (iv) Link measurable performance indicators to financial
management (√)
Output 3.5
tested and operational systems for allocation, re-injection and scaling up of
revenues into PES include degraded areas, landscapes level management
(Retained-degraded areas is part of the project landscape)
Output 3.6
Does output 3.6 include local community forest management in the financing
agreements? (There is no local community residing within the project
landscape)
Will local communities on the site receive incentives? (There is no local
community residing within the project landscape)
Output 3.7
Link output 3.7 to performance indicators on the ground (To be addressed at
project implementation)
management based on changes in
enabling policies (√)
based on environmental
economic consideration at state
level not just project landscape.
Target should show the benefit
of this project to the economy of
Sabah (Outcomes1.1, 1.4 and 1.5
are state-level processes)
Targets reflect actual changes of
natural capital stock on the
ground (CO2, Bio-D, H2O,
tc.)(Addressed in output 2.4)
Assumes that decision makers
are supportive of policy outcome
(Captured in Strategic Results
Framework)
Assumes that stakeholders
include local communities
benefit sharing arrangement
(Captured in Strategic Results
Framework)

84
ANNEX 4: BASELINE METT SCORES
A Location
B Name of Protected Area Danum Maliau Imbak
C Date of establishment 1995 2009 2010
D Size (Ha) 43,800 58,840 16,750
E Baseline Assessement (Score of 0 to 3)
1 Legal status: Does the protected area have legal status (or in the case of private reserves is covered by a covenant or similar)? 3 3 3
2 Protected area regulations: Are appropriate regulations in place to control land use and activities (e.g. hunting)? 3 2 2
3 Law Enforcement: Can staff (i.e. those with responsibility for managing the site) enforce protected area rules well enough? 2 2 3
4 Protected area objectives: Is management undertaken according to agreed objectives? 3 3 3
5 Protected area design: Is the protected area the right size and shape to protect species, habitats, ecological processes and water atchments of key conservation concern? 2 2 2
6 Protected area boundary demarcation: Is the boundary known and demarcated? 3 3 1
7 Management plan: Is there a management plan and is it being implemented? 3 3 1
7a Planning process: The planning process allows adequate opportunity for key stakeholders to influence the management plan 1 1 1
7b Planning process: There is an established schedule and process for periodic review and updating of the management plan 1 1 1
7c Planning process: The results of monitoring, research and evaluation are routinely incorporated into planning 1 1 1
8 Regular work plan: Is there a regular work plan and is it being implemented 3 3 3
9 Resource inventory: Do you have enough information to manage the area? 3 3 2
10 Protection systems: Are systems in place to control access/resource use in the protected area? 3 3 3
11 Research: Is there a programme of management-orientated survey and research work? 3 3 3
12 Resource management: Is active resource management being undertaken? 2 2 1
13 Staff numbers: Are there enough people employed to manage the protected area? 3 3 3
14 Staff training: Are staff adequately trained to fulfill management objectives? 2 2 2
15 Current budget: Is the current budget sufficient? 2 2 2
16 Security of budget: Is the budget secure? 2 2 2
17 Management of budget: Is the budget managed to meet critical management needs? 2 2 2
18 Equipment: Is equipment sufficient for management needs? 2 2 1
19 Maintenance of equipment: Is equipment adequately maintained? 3 3 2
20 Education and awareness: Is there a planned education programme linked to the objectives and needs? 3 3 3
21 Planning for land and water use: Does land and water use planning recognise the protected area and aid the achievement of objectives? 2 2 2
21a Planning and management in the catchment or landscape containing the protected area incorporates provision for adequate environmental conditions. 1 1 1
21b Land and water planning for habitat conservation: Management of corridors linking the protected area provides for wildlife passage to key habitats outside the protected area. 1 1 0
21c Planning adresses ecosystem-specific needs and/or the needs of particular species of concern at an ecosystem scale 1 1 1
22 State and commercial neighbours:Is there co-operation with adjacent land and water users? 2 3 2
23 Indigenous people: Do indigenous and traditional peoples resident or regularly using the protected area have input to management decisions? 1 1 1
24 Local communities: Do local communities resident or near the protected area have input to management decisions? 1 1 1
24a Impact on communities: There is open communication and trust between local and/or indigenous people, stakeholders and protected area managers 1 1 1
24b Impact on communities: Programmes to enhance community welfare, while conserving protected area resources, are being implemented 1 1 1
24c Impact on communities: Local and/or indigenous people actively support the protected area 1 1 0
25 Economic benefit: Is the protected area providing economic benefits to local communities, e.g. income, employment, payment for environmental services? 2 3 2
26 Monitoring and evaluation: Are management activities monitored against performance? 3 3 2
27 Visitor facilities: Are visitor facilities adequate? 3 3 1
28 Commercial tourism operators: Do commercial tour operators contribute to protected area management? 3 3 3
29 Fees: If fees (i.e. entry fees or fines) are applied, do they help protected area management? 3 3 3
30 Condition of values: What is the condition of the important values of the protected area as compared to when it was first designated? 3 3 3
30a Condition of values: The assessment of the condition of values is based on research and/or monitoring 1 1 1
30b Condition of values Specific management programmes are being implemented to address threats to biodiversity, ecological and cultural values 1 1 1
30c Condition of values: Activities to maintain key biodiversity, ecological and cultural values are a routine part of park management 1 1 1
Percent of total : 87 88 74
Sabah, Malaysia
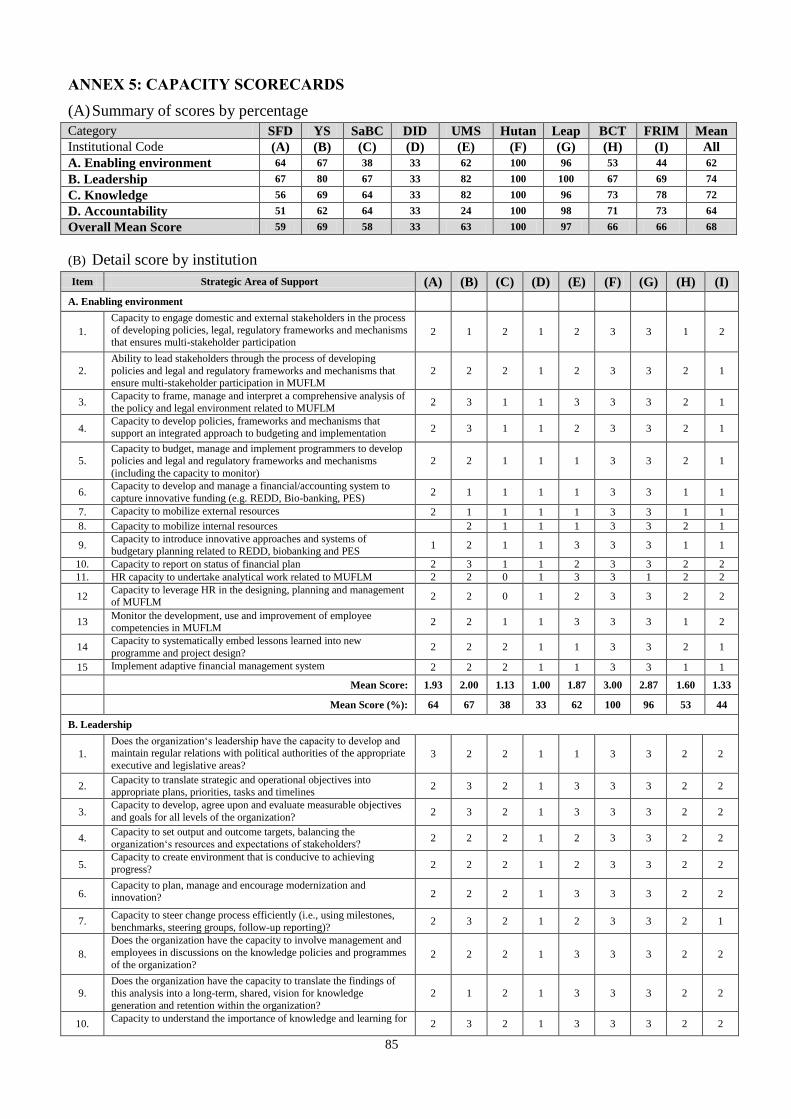
85
ANNEX 5: CAPACITY SCORECARDS
(A) Summary of scores by percentage
Category SFD YS SaBC DID UMS Hutan Leap BCT FRIM Mean
Institutional Code (A) (B) (C) (D) (E) (F) (G) (H) (I) All
A. Enabling environment 64 67 38 33 62 100 96 53 44 62
B. Leadership 67 80 67 33 82 100 100 67 69 74
C. Knowledge 56 69 64 33 82 100 96 73 78 72
D. Accountability 51 62 64 33 24 100 98 71 73 64
Overall Mean Score 59 69 58 33 63 100 97 66 66 68
(B) Detail score by institution
Item Strategic Area of Support (A) (B) (C) (D) (E) (F) (G) (H) (I)
A. Enabling environment
1.
Capacity to engage domestic and external stakeholders in the process
of developing policies, legal, regulatory frameworks and mechanisms that ensures multi-stakeholder participation
2 1 2 1 2 3 3 1 2
2.
Ability to lead stakeholders through the process of developing
policies and legal and regulatory frameworks and mechanisms that ensure multi-stakeholder participation in MUFLM
2 2 2 1 2 3 3 2 1
3. Capacity to frame, manage and interpret a comprehensive analysis of
the policy and legal environment related to MUFLM 2 3 1 1 3 3 3 2 1
4. Capacity to develop policies, frameworks and mechanisms that support an integrated approach to budgeting and implementation 2 3 1 1 2 3 3 2 1
5.
Capacity to budget, manage and implement programmers to develop
policies and legal and regulatory frameworks and mechanisms
(including the capacity to monitor)
2 2 1 1 1 3 3 2 1
6. Capacity to develop and manage a financial/accounting system to
capture innovative funding (e.g. REDD, Bio-banking, PES) 2 1 1 1 1 3 3 1 1
7. Capacity to mobilize external resources 2 1 1 1 1 3 3 1 1
8. Capacity to mobilize internal resources
2 1 1 1 3 3 2 1
9. Capacity to introduce innovative approaches and systems of
budgetary planning related to REDD, biobanking and PES 1 2 1 1 3 3 3 1 1
10. Capacity to report on status of financial plan 2 3 1 1 2 3 3 2 2
11. HR capacity to undertake analytical work related to MUFLM 2 2 0 1 3 3 1 2 2
12 Capacity to leverage HR in the designing, planning and management of MUFLM
2 2 0 1 2 3 3 2 2
13 Monitor the development, use and improvement of employee competencies in MUFLM
2 2 1 1 3 3 3 1 2
14 Capacity to systematically embed lessons learned into new
programme and project design? 2 2 2 1 1 3 3 2 1
15 Implement adaptive financial management system 2 2 2 1 1 3 3 1 1
Mean Score: 1.93 2.00 1.13 1.00 1.87 3.00 2.87 1.60 1.33
Mean Score (%): 64 67 38 33 62 100 96 53 44
B. Leadership
1.
Does the organization‘s leadership have the capacity to develop and maintain regular relations with political authorities of the appropriate
executive and legislative areas? 3 2 2 1 1 3 3 2 2
2. Capacity to translate strategic and operational objectives into appropriate plans, priorities, tasks and timelines
2 3 2 1 3 3 3 2 2
3. Capacity to develop, agree upon and evaluate measurable objectives
and goals for all levels of the organization? 2 3 2 1 3 3 3 2 2
4. Capacity to set output and outcome targets, balancing the organization‘s resources and expectations of stakeholders?
2 2 2 1 2 3 3 2 2
5. Capacity to create environment that is conducive to achieving
progress? 2 2 2 1 2 3 3 2 2
6. Capacity to plan, manage and encourage modernization and innovation? 2 2 2 1 3 3 3 2 2
7. Capacity to steer change process efficiently (i.e., using milestones,
benchmarks, steering groups, follow-up reporting)? 2 3 2 1 2 3 3 2 1
8.
Does the organization have the capacity to involve management and
employees in discussions on the knowledge policies and programmes
of the organization? 2 2 2 1 3 3 3 2 2
9.
Does the organization have the capacity to translate the findings of
this analysis into a long-term, shared, vision for knowledge
generation and retention within the organization?
2 1 2 1 3 3 3 2 2
10. Capacity to understand the importance of knowledge and learning for
2 3 2 1 3 3 3 2 2

86
Item Strategic Area of Support (A) (B) (C) (D) (E) (F) (G) (H) (I)
the success of the organization/organizational development?
11. Capacity to identify which type of knowledge or training would be
most appropriate to meet its vision? 2 3 2 1 3 3 3 2 2
12. Capacity to mobilize and manage the resources needed to implement their knowledge/skills development strategy?
2 3 2 1 3 3 3 2 2
13. Capacity to develop a training plan based on current and future
organizational and individual needs? 2 3 2 1 3 3 3 2 2
14. Does the organization have the capacity to ensure that new hires are
supported and assisted, e.g., through coaching, tutoring? 2 2 2 1 2 3 3 2 3
15. Does the organization have the capacity to ensure that leadership skills are developed throughout the organization? 1 2 2 1 1 3 3 2 3
Mean Score: 2.00 2.40 2.00 1.00 2.47 3.00 3.00 2.00 2.07
Mean Score (%): 67 80 67 33 82 100 100 67 69
C. Knowledge
1.
Does the organization have the capacity to engage stakeholders throughout the process of developing and managing policies and
reforms for knowledge generation and retention, through education,
training and learning?
2 2 2 1 3 3 3 2 2
2. Capacity to engage in exchanges with other organization to benefit
from the sharing of ideas 2 3 2 1 3 3 3 2 3
3. Promote an ongoing dialogue between management and staff on
knowledge, training and learning needs 2 2 2 1 3 3 3 2 3
4. Capacity to frame, manage and interpret a comprehensive stock-taking and analysis of its knowledge and training assets and needs
1 2 2 1 2 3 2 2 2
5. Capacity to priorities knowledge and learning and integrate it into its
organizational vision? 2 2 2 1 2 3 3 2 2
6. Capacity to mobilize and manage the resources needed to implement their knowledge/skills development strategy
2 2 2 1 3 3 3 3 2
7. Capacity to incorporate knowledge/skills development activities into
its budget 2 2 2 1 3 3 3 2 2
8. Capacity to manage the budget for knowledge/skills development 2 3 2 1 3 3 3 2 3
9. Capacity to identify opportunities for partnership and develop
partnerships 2 3 2 1 2 3 3 2 2
10. Capacity to evaluate the outputs and outcomes of its knowledge
development/skills strategy 1 1 2 1 2 3 2 3 2
11.
Does the organization have the capacity to design and use feedback systems (ensure link between M&E findings and decision-making
processes) 1 1 1 1 1 3 3 3 1
12. Develop a training plan based on current and future organizational
and individual needs 2 2 2 1 3 3 3 2 2
13. Capacity to ensure that new hires are supported and assisted, e.g.,
through coaching, tutoring 2 2 2 1 2 3 3 2 3
14. Capacity to leverage modern training methods, e.g., multi-media
approach, on the job training, eLearning 1 2 2 1 3 3 3 2 3
15. Capacity to ensure that training and development plans are developed
and monitored for all employees 1 2 2 1 2 3 3 2 3
Mean Score: 1.67 2.07 1.93 1.00 2.47 3.00 2.87 2.20 2.33
Mean Score (%): 56 69 64 33 82 100 96 73 78
D. Accountability
1.
Do authorities have the capacity to develop clear and transparent
policies, legal and regulatory frameworks and mechanisms that
ensure accountability (e.g., of national government, local government, policies for procurement of goods and services)?
3 2 3 1 2 3 3 2 2
2.
Do authorities have the capacity to comply with international agreements, frameworks, norms, standards related to public sector
accountability? 2 2 3 1 1 3 3 2 2
3. Do authorities have the capacity to strengthen national and/or local
accountability organizations? 1 2 2 1 0 3 3 3 2
4. Capacity to develop and manage accountability mechanisms to ensure formulation of clear and transparent policies and strategies
2 1 2 1 0 3 3 3 2
5. Capacity to design and use systems for recording and processing
sector-relevant data 1 1 1 1 1 3 2 2 3
6.
Capacity to frame, manage and interpret a comprehensive analysis of the accountability mechanism environment 1 1 1 1 0 3 3 2 1
7. Capacity to design a financial accounting system for MUFLM 1 2 1 1 0 3 3 1 3
8. Capacity to develop accountability mechanisms that ensure multi-stakeholder participation
1 2 2 1 0 3 3 2 2

87
Item Strategic Area of Support (A) (B) (C) (D) (E) (F) (G) (H) (I)
9. Capacity to lead stakeholders through the process of developing
accountability mechanisms for MUFLM 2 2 2 1 0 3 3 2 2
10. Capacity to manage accountability mechanisms regarding programme budgeting, management and implementation 2 2 2 1 0 3 3 3 2
11. Capacity to monitor accountability mechanisms for evaluation 1 2 2 1 1 3 3 1 3
12. Do authorities have the capacity to evaluate the development and
implementation of accountability mechanisms? 1 1 2 1 1 3 3 2 2
13. Capacity to undertake independent audits of accounting system 2 3 2 1 1 3 3 2 2
14. Capacity to publish procedures and criteria for administrative
decisions in local language(s) 1 3 2 1 2 3 3 2 2
15.
Ensure transparency of the organization, including decision-making
and developments, e.g., by publishing annual reports, holding press
conferences, posting information on the internet 2 2 2 1 2 3 3 3 3
Mean Score: 1.53 1.87 1.93 1.00 0.73 3.00 2.93 2.13 2.20
Mean Score (%): 51 62 64 33 24 100 98 71 73
Overall Mean Score: 1.78 2.08 1.75 1.00 1.88 3.00 2.92 1.98 1.98
Overall Mean Score (%): 59 69 58 33 63 100 97 66 66
Note: Scored from 0 to 3 (Worst=0, Marginal=1, Satisfactory=2, Best=3)
SFD=Sabah Forestry Department; YS=Yayasan Sabah; SaBC=Sabah Biodiversity Centre; DID=Department of Irrigation and Drainage; UMS=Universiti
Malaysia Sabah; Hutan=Hutan NGO; Leap: Land Empowerment and Animals People (NGO); BCT=Borneo Conservation Trust (BCT); FRIM=Forest
Research Institute Malaysia

88
ANNEX 6: DEVELOPING A LANDSCAPE MODEL
Objective of the model
The objective of the proposed landscape-level land use model is to determine for the demonstration site as a
whole the optimal mix of land uses after taking into considering the full range of benefits provided by each
parcel of land. The model to be adopted for the site will provide managers and decision makers with a
sophisticated management tool, which can be used to compare different land use and management options for
the landscape.
‘Optimal’ land use can be defined in different ways and the decision criteria (objectives) against which
different land uses are assessed should be developed collaboratively with stakeholders during project
implementation. To provide some examples, ‘optimal’ could be defined as the land use mix with the highest
net present values (NPV), or be the most cost-effective way of reaching some determined standard (e.g.,
setting aside x % of the area for biodiversity conservation), or the land use mix with the highest NPV subject
to x% of area set aside for biodiversity protection; or the land use that maximises biodiversity protection.
It is assumed that the project would not build a model from scratch but rather develop existing models as
appropriate. There would therefore be a budget for model development, which would be used to customise
the model selected to the particular needs of the demonstration site and for Sabah and Malaysia generally.
The model developed is expected include the following features:
The model will take into account all of the key ecosystem services identified for the area – namely
timber, carbon, water flow regulation and quality provision, biodiversity, tourism (see Section 3
which provides an initial assessment of the ecosystem services provided by the demonstration site).
The model will allow the users to analyse the trade-offs between different land uses – for example
carbon versus timber.
The model will be able to analyse options for managing the site that account for the area’s
biodiversity, and account for the impact of the demonstration site on the biodiversity within the
protected areas that surround the site. This requires the model to incorporate external costs into the
analysis.
The model will include oil palm for comparative analysis and to facilitate its replications and use in
other parts of Sabah.
The model will be user friendly
The model will be developed with its replication to other sites in Sabah and the region in mind. Other final features for the model should be agreed with key stakeholders at the outset of the project.
Review of existing landscape land use models and their suitability to the site
A review of five existing landscape models was undertaken to assess their applicability to the demonstration
site (Polansky et al, 2007, Koh and Ghazoul 2010, The Landscape Management System project, the Integrated
Valuation of Ecosystem Services and Tradeoffs model (InVEST) and the CBiod model). A table
summarising these studies is presented in Appendix 1. This table provides a high level description of each
model, an overview of how the model works and its data requirements and a statement on its applicability to
the study site. Following this review the two models considered to be the strongest candidates for application
at the site were selected for more detailed analysis: InVEST, which is being applied by WWF in the Heart of Borneo (HoB) and
CBioD, which is being developed in Peninsula Malaysia.
This are both model that have a broad focus (i.e. they can potentially assess the full range of forest ecosystem
services and are being tested in the region. The other models are either focussed on temperate forest
(Polansky et al, 2007 and The Landscape Management System project), have a narrow focus (e.g. Koh and
Ghazoul 2010 is focussed on oil palm production and Polansky et al 2007 only covers marketed goods) or
lack desirable features for the model to be adopted at the site (e.g., Polansky et al 2007 only offer a static
analysis).
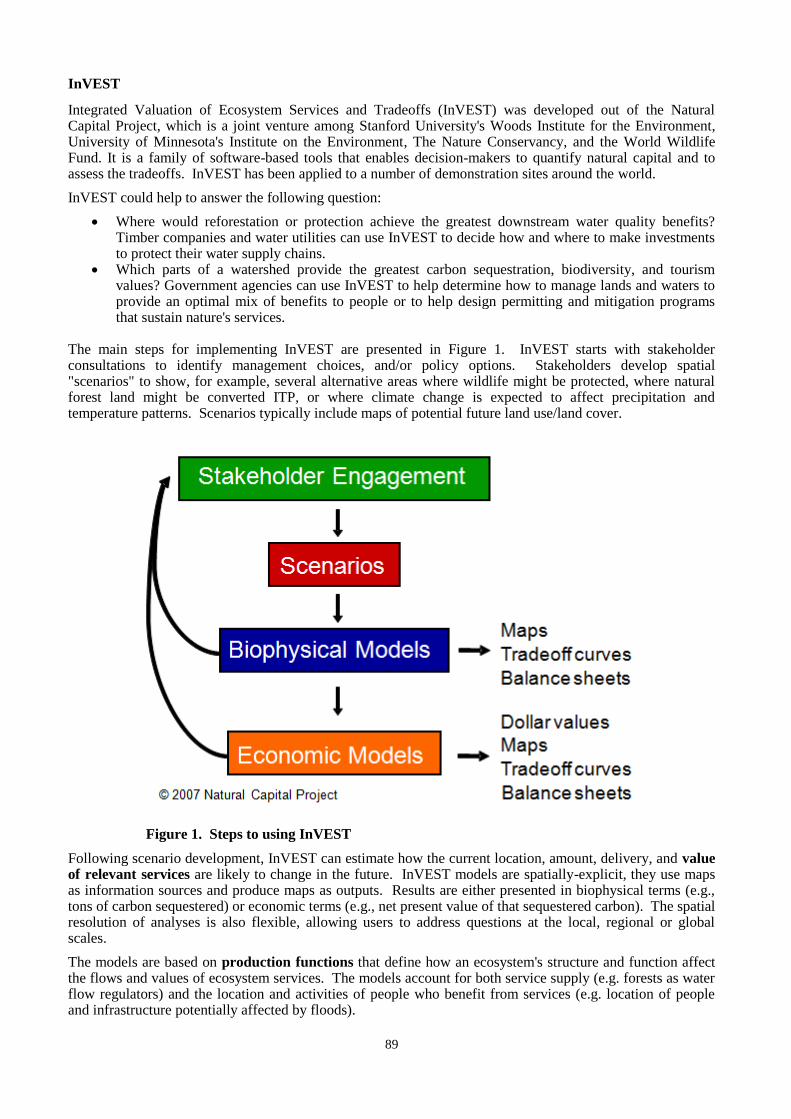
89
InVEST
Integrated Valuation of Ecosystem Services and Tradeoffs (InVEST) was developed out of the Natural Capital Project, which is a joint venture among Stanford University's Woods Institute for the Environment, University of Minnesota's Institute on the Environment, The Nature Conservancy, and the World Wildlife Fund. It is a family of software-based tools that enables decision-makers to quantify natural capital and to assess the tradeoffs. InVEST has been applied to a number of demonstration sites around the world.
InVEST could help to answer the following question:
Where would reforestation or protection achieve the greatest downstream water quality benefits? Timber companies and water utilities can use InVEST to decide how and where to make investments to protect their water supply chains.
Which parts of a watershed provide the greatest carbon sequestration, biodiversity, and tourism values? Government agencies can use InVEST to help determine how to manage lands and waters to provide an optimal mix of benefits to people or to help design permitting and mitigation programs that sustain nature's services.
The main steps for implementing InVEST are presented in Figure 1. InVEST starts with stakeholder consultations to identify management choices, and/or policy options. Stakeholders develop spatial "scenarios" to show, for example, several alternative areas where wildlife might be protected, where natural forest land might be converted ITP, or where climate change is expected to affect precipitation and temperature patterns. Scenarios typically include maps of potential future land use/land cover.
Figure 1. Steps to using InVEST
Following scenario development, InVEST can estimate how the current location, amount, delivery, and value of relevant services are likely to change in the future. InVEST models are spatially-explicit, they use maps as information sources and produce maps as outputs. Results are either presented in biophysical terms (e.g., tons of carbon sequestered) or economic terms (e.g., net present value of that sequestered carbon). The spatial resolution of analyses is also flexible, allowing users to address questions at the local, regional or global scales.
The models are based on production functions that define how an ecosystem's structure and function affect the flows and values of ecosystem services. The models account for both service supply (e.g. forests as water flow regulators) and the location and activities of people who benefit from services (e.g. location of people and infrastructure potentially affected by floods).

90
To run InVEST the following software is required: ArcGIS 9.2 (at least service pack 2); an ArcInfo level license to run one of the hydrology modules; installation of Spatial Analyst extension; and Python 2.4 or higher, which is typically installed automatically as part of ArcGIS. Running InVEST requires skills in ArcGIS.
A User's Guide is available on line which takes the user through the steps required to install and run the tools, provides some of the theory behind each model and describes the input data requirements and how to interpret output results.
Application in the HoB. WWF are applying the InVEST model in the HoB to analyse where services exist,
such as water regulation, carbon and biodiversity provision, to support development of financing mechanisms
and to promote the implementation of a ‘green economy’ in the area. They have undertaken a high level
assessment of the whole area using a 250m satellite image.
They are currently working in a site in Kalimantan at a 25m x 25m scale, where they are simulating what the
landscape would look like in 20 years under a Business as Usual Scenario compared to a scenario that factors
in green economy policies. In Sabah they have selected the demonstration site as their study area. Work to
date for the demonstration site includes a rapid assessment of different watersheds in Sabah to outline
different basins and identify potential PES type schemes. The next phase of the work includes a proposed
workshop in July/August 2011 to explain their work in Indonesia and seek agreement for the application of
InVEST at the demonstration site.
This work could feed into the proposed GEF project. It would build the foundation for further assessment.
WWF intend to feed the outputs of InVEST into a separate economic model, due to the fact that InVEST is
foremost a geo-spatial model and not suited to detailed economic analysis. The economic models that they
will use are yet to be identified.
The CBioD Project
The Conservation of Biodiversity through improved forest planning tools (CBioD) project is developing a
forest landscape optimisation tool. The project is addressing the issue of biodiversity, landscape and the
loss of forest services in production forests. This is in recognition of the fact that effective biodiversity
conservation strategies must integrate biodiversity considerations into the management of timber production
forests—especially those that are adjacent to protected areas or include species that are not well-represented
elsewhere. The context within which the model is being developed therefore matches well with the context of
the demonstration site and the objective of the proposed GEF project to ensure management at the landscape
scale protects biodiversity both within the demonstration site and in existing protected areas near to the
demonstration site.
The study will produce decision making tools and methods to ensure biodiversity is given optimal
consideration in production forest and is due to complete around May 2013. The CBioD Project site is
located in the Temenggor Forest Reserve’s Perak Integrated Timber Complex (PITC) concession area.
The project is funded by the International Tropical Timber Organisation (ITTO) and the Global Environment
Facility (GEF) through the UNDP. Project partners include the Ministry of Natural Resources and
Environment, Malaysia (executing agency) and the Forest Research Institute of Malaysia (FRIM). The
Federal Forestry Department and the Malaysian Timber Certification Council play a major role in the CBioD
Project as tools and methods created through this project will be implemented by these agencies.
It is envisaged that at the end of the CBioD Project the following objectives will be achieved i) methods of
assessing biodiversity and economic valuation of the forest; ii) better understanding of harvesting impacts on
biodiversity; iii) decision making models for policy makers in the management of production forests with due
consideration given to biodiversity; iv) capacity building of local counterparts and forest managers in the use
of such tools; and, v) the dissemination of knowledge to other tropical countries enhancing Malaysia's role as
a pioneer in tropical forests management (FRIM, 2007).
It is not possible to fully review this model as it is still in the development phase. However, The CBioD
project will develop and evaluate a range of decision making tools and methods for (i) assessing biodiversity,
(ii) valuing goods and services associated with biodiversity, and (iii) evaluating spatial tradeoffs between
timber production and biodiversity conservation.

91
In the case of biodiversity assessment, the project will develop and evaluate new sampling methods for
estimating the biodiversity in a region from a small number of forest inventory plots. This system will include
guidelines for establishing the plots and statistically analysing their data.
Economic models are being developed for watershed services, recreation and passive use that can be
integrated into the forest management model. The watershed services study consists of three related studies:
econometric modeling of the impacts of forests on watershed services; analysis of the opportunity cost of
supplying watershed services; and, the analysis of the benefits of watershed services. The objectives of the
studies on recreation and passive use are to demonstrate the application of state-of-the-art research methods
and to investigate the impacts of deviations from first-best practices on the accuracy and precision of benefit
estimates and the costs of applying the methods. The data is based on in-person surveys of nearly 1,300
households in Kuala Lumpur and the surrounding state of Selangor. The passive use module adopted a
Choice Experiment as its valuation approach and is focused on a specific site, the 300,000-hectare Belum-
Temengor forest complex in northern Peninsular Malaysia. One of the recreation modules also uses choice
experiments. A second recreation module collected information on the number and cost of actual household
visits to existing forest parks and other outdoor recreation sites during the past 12 months. This information
was used to develop a multiple-site travel-cost model. The value estimates from the two recreation modules
are best viewed as estimates of the benefits of protecting forests against timber harvesting, which is prohibited
in forest parks in Malaysia.
In recognition of the variability across tropical developing countries in terms of forest characteristics,
available ecological and economic data, and forest planning and management procedures the CBioD Project is
proposing a hierarchy of tools, ranging from complex (and more data and human-resource demanding) to the
simpler. The research aims to quantify the accuracy and precision lost when the simpler methods are adopted.
This will provide forestry departments and conservation organisations with a larger menu of tools to chose
from and information on their reliability.
At the end of the CBioD Project the tools listed below are to be available for relevant government agencies,
notably FRIM, the Forestry Department and MTCC and the industry notably PITC.
I. Computerised system and database for recording and managing biodiversity
II. Efficient statistical methods for estimating biodiversity from small samples
III. Improved methods for assessing biodiversity
IV. Improved understanding of the overall impacts of timber harvesting on biodiversity
V. Models that relate economic values associated with biodiversity to ecological and socioeconomic
factors that influence them
VI. Improved models for predicting biodiversity taking into account timber harvesting systems and
locations
VII. Harvesting protocols and technology that would conserve or protect biodiversity
VIII. Improved forest planning model for allocation of lands between protection and production
taking into consideration biodiversity and economic benefits and costs
IX. Increased skills and capacity of local counterparts in all aspects of the research
X. Dissemination of the tools and methods to other countries
The forest planning model combines scenario analysis and an optimisation tool in order to encourage use. The
scenarios could be analysed quickly, while an optimisation exercise would be more complex. The model can
be used to ask how to meet constraints and maximise objectives. For example it could be used to meet an
economic objective such as a timber commodity target, or to maximise NPV subject to constraints such as
meeting a biodiversity objective or to maximise biodiversity subject to a timber threshold. The model will
also include a gold programme – where the user can set targets and see how possible it is to achieve the
targets. The model will be most suitable for large areas of 10,000-100,000 ha.
Limitations of the model are:
It does not look at different types of timber harvesting, for example different types of RIL. Therefore
if this is important at the proposed study site the model would need to be adapted to do this
It does not consider the tradeoffs between forest and other types of land use (housing, industrial
development). This is due to the fact that the forest estate is fairly stable in Peninsular Malaysia, and

92
therefore the key question is where to log and where to protect, and what you need to protect from
(i.e. unsustainable harvesting or poaching).
Valuation is done from the point of view of Malaysia (for example the value of ecotourism to
Malaysians, not to foreigners). The model does not include global values. These are likely to be
important in the proposed study site therefore model would need to be adapted to account for this.
The tools will be web based, so only depend on internet access. The style is very map orientated so that the
information is easy for people to visualise. It will be possible to open the map of an area and see what is
happening in each compartment. It is understood that it would be easy to customise the model for use at the
demonstration site.
Data requirements for the model include: current land use, timber stock, age of timber, topography, elevation,
rainfall, location of protected areas, carbon stock, on the ground biodiversity assessment if possible otherwise
general ecological principles can be applied.
The expertise needed to implement the CBioD model is likely to include:
An excellent GIS Modeller (analyst) / database administrator with a strong understanding of data
models and how to work at spatial scales.
PhD trained ecologist
Economist
A trainer to provide front end user support
An implementer (computer science expert) to deep code the tool as appropriate.
Conclusion
The choice of model to be adopted for the demonstration site should be agreed with stakeholders at the outset
of the project, based on a common understanding of the features of each tool and the priority requirements for
the demonstration site. The following table presents an overview of the pros and cons of the two models.
Table 1. Overview of the Pros and Cos of InVEST and CBioD
InVEST CBioD
Pros Cons Pros Cons
Good for scoping broad
policy issues, and for linking
analysis to financing options,
which is an important aspect
of proposed GEF project
Only runs in Arc map, and all
data layers are required to run
the model
Web based and only internet
access required for use.
Not possible to fully review
model as still in development
Good for spatial analysis InVEST is hard coded and
therefore hard to customise
Would be possible to customise
for the demonstration site
Has limitations – not focussed on
different types of timber
harvesting, and does not consider
global values, but could be
adapted to do so
Good for carbon, biodiversity
and agroforestry analysis
Not an optimisation tool,
therefore may not achieve the
goals of the project as laid out
in the Project Identification
Form (PIF)
An optimisation tool, also
capable of analysing scenarios
(tradeoffs)
Flexibility in terms of scale –
can be used to analysis 250m
or 1m parcels.
Economic models need
development.
Economic models being
developed which can be
generally applied and which
assess reliability of results
Has been applied in a
number of demonstration
sites
Additional hydrological model
needed to map sediment
deposits
Data intensive InVEST
developed in the US and spatial
data may be hard to come by in
developing countries, although
data has apparently not been a
problem in Indonesia.
Not good for undertaking
detailed analysis

93
ANNEX 6: CO-FINANCING AGREEMENTS

94

95

96
ANNEX 8: ANALYSIS OF OPTIONS FOR REVENUE GENERATION
1. Overview of financing mechanism
A key component of the proposed project is to identify new and innovative financing arrangements
for the demonstration site and to trial them within the project period. Underpinning the identification
of appropriate financing mechanisms is a clear scientific understanding of the services being provided
by the forest, a quantification of this service (in biophysical terms) and an understanding of its
economic value and of the beneficiaries. Potential services provided at the demonstration site are (in
addition to timber) – provision of clean water, regulation of water flows, carbon sequestration,
biodiversity benefits, tourism benefits and cultural services.
A typology of potential financing mechanism is provided in Table 1. This categorises potential
mechanisms into external flows, mechanism for generating funding such as taxes, and market based
charges. At present the site is financed through budget allocations from the Malaysian government,
donor support for specific projects and revenue from timber charges such as royalties.
Table 1. Typology of potential financing mechanisms.
External flows Generating funding Market based charges
Domestic government / donor
assistance
Private voluntary donations
Environmental funds & debt
for nature swaps.
Licensing and Royalty
fees
Fiscal instruments
Benefit & revenue sharing
Cost sharing
Investment, credit &
enterprise funds
Tourism charges
Resource-use fees
Payments for Ecosystem
services (PES)
Mitigation banking and
biodiversity offsets
REDD
Source: Adapted from IUCN, 2006
The PIF identifies the following barriers to the successful harnessing of revenue-generating
opportunities: (i) lack of capacity to define, develop and manage new revenue generating
opportunities; (ii) lack of mechanisms for investing financial resources generated into protected area
and landscape-level conservation and management; (iii) in the case of REDD Plus, barriers include
the absence of a national policy framework for generating and trading REDD or REDD Plus credits
and inadequate capacities to quantify changes in carbon stocks in state forests.
The sections below discuss some of these potential financing options and their applicability to the
demonstration site. The focus is on REDD, Biodiversity offsets and PES, as innovative approaches
that may present new and innovative financing for the site.
Additional information may be found in a report by WWF on the financing in the Heart of Borneo
(HoB) (WWF, 2010).

97
2. REDD
Background
Reducing emission from deforestation and forest degradation (REDD) is a payment scheme designed
to compensate landowners for the value of carbon stored in their forest that would otherwise be
released into the atmosphere. REDD+ additionally recognises efforts for reforestation and sustainable
forestry. Examples of REDD+ programmes include payments to landowners who reduce their carbon
emissions from logging natural forests through sustainable forest management, reduced impact
logging, or forest restoration and conservation. REDD+ currently operates via the voluntary carbon
markets, however, efforts are underway to formalise an international mechanism for REDD+.
The forests and peat lands of Borneo are very effective carbon stores, with an average of 230 tonnes
per ha in above ground biomass, and 2,400 tonnes per ha in below ground peat soils; most of this is
released by deforestation and land degradation (Paoli et al. 2010).
Initiatives in Malaysia
Sabah is leading the way on REDD in Malaysia. The State Government of Sabah is in the process of
developing a state-wide REDD+ framework. They are working with WWF to develop carbon
accounting methodologies, design the institutional framework and develop financing mechanisms. In
November 2010, WWF and the State Government of Sabah co-hosted an international conference
entitled: Forest and Climate Change: Decoding and Realising REDD+ in the Heart of Borneo. The
conference was attended by nearly 500 participants from government, the private sector and civil
society. The aim of the conference was to raise awareness of the forest’s role in mitigating climate
change and how mechanisms such as REDD can add tangible value to forest protection and
sustainable development efforts.
There are two REDD+ pilot projects in Sabah set up by YS in 1992:
The Innoprise Forest Absorbing (INFAPRO) project involves a consortium of Utilities
Companies in the Netherlands and is rehabilitating 25,000 ha of degraded forest through
enrichment planting. The project is estimated to sequester 350,000 tonnes of CO2 over 60
years. Following restoration the forest will be sustainably managed for timber and other forest
products. It also serves as a buffer for the adjacent Danum Valley Conservation Area. The
sale of carbon credits has been slow to date, however the site has recently been approved
under the Voluntary Carbon Standard (VCS) and it is anticipated that carbon credits will now
be much easier to sell. Carbon credits on the voluntary markets are currently selling for
around US$11 ton/ha.
An agreement with the New England Power Companies of USA to reduce logging damage
by 50%, thereby gaining incremental carbon. This reduced impact logging (RIL) project is
estimated to reduce emissions of CO2 by 40 tonnes over 60 years.
In addition there is the Rimba Raya Conservation project covering 91,000 ha in Central Kalimantan
that is currently selling carbon credits through the voluntary market to Gazprom Marketing &
Trading. The area was purchased by Infinite EARTH to avoid forest clearance.
The EU has pledged 4 million Euros for REDD development and implementation (it is not clear if the
fund is for Sabah or for Malaysia in general). This funding should become available in 2013, with
bidding open to consultants in 2012.

98
Applicability to demonstration project
In order to claim REDD payments, the benefits of alternative management have to be projected
against the current activity at the site (the baseline). For example if the baseline is conventional
logging a move to RIL could qualify for carbon credits. The opportunities are therefore limited for
forests that are already reported to be sustainably managed.
In the NFM area the site is already practicing RIL, so it is likely to be hard to claim REDD credits.
However it may be possible to qualify under the Voluntary Carbon Standard for the introduction of
improved forest management against the current baseline; this approach is also being explored for
Malua. The demonstration site could benefit from the lessons learnt at the INFAPRO, which has
recently been through the process of VSC approval. Any areas designated as protected areas in the
NFM could qualify for REDD+ finance.
In the ITP area carbon credits could be claimed if plantation forestry was stopped and the area
rehabilitated.
Further study of the site and the results of the state-wide REDD+ framework may lead to the
identification of further opportunities for the site, which are not apparent at this stage.
3. Biodiversity Offsets
Background90
Biodiversity markets are a potentially powerful tool for internalising traditionally externalized costs
and compensating good practices. For example, if a business has to pay to mitigate its residual impact
on a rare animal or plant, it either has to bear the cost of mitigation or develop elsewhere to avoid this
cost. Conversely, if landowners can be compensated financially for protecting or enhancing a rare
animal or plant habitat there will be an economic incentive to protect habitat.
Payment systems for biodiversity compensation include: biodiversity offsets, mitigation banking,
conservation banking, habitat credit trading, fish habitat compensation, BioBanking, complementary
remediation, conservation certificates. Some are based on compliance with regulation while others are
done voluntarily for ethical, competitive, or pre-compliance reasons. They all aim to reduce
biodiversity loss and build the cost of biodiversity impacts into economic decisions through markets
or market-like instruments and payments
While an offset that attempts to achieve no net loss is preferable from an ecological and social
standpoint, less comprehensive forms of impact compensation, in which funds are set aside for
biodiversity management or valuable biodiversity is protected elsewhere, can be a first step towards
better biodiversity footprint management or even eventually a regulated offset system.
There are around 39 existing compensatory mitigation programs around the world, ranging from
programs with active mitigation banking of biodiversity credits to programs channeling development
impact fees to policies that drive one-off offsets. There are another 25 programs in various stages of
development or investigation. Within each active offset program, there are numerous individual offset
sites, including over 600 mitigation banks worldwide.
The global annual market size is at least US$1.8-2.9 billion. It is likely to be much more than this, as
80% of existing programs are not transparent enough to estimate their market size. There are at least
86,000 hectares of land under some sort of conservation management or permanent legal protection
per year.
90 This section is based on Marsden et al 2010.

99
Four offset programs exist in Asia, with another four in early development. Annual payments equal
$390 million and roughly 26,000 hectares are protected or restored annually. Asian offset-like
programs come mostly under the Environmental Impact Assessment, with EIA laws in Japan, South
Korea, China, Mongolia, Pakistan, Thailand, Malaysia, Russia and India.
Box 1 presents definitions for commonly used biodiversity offset terms.
Box 1. Biodiversity Offsets - Definitions
Compensatory Mitigation– the restoration, creation, enhancement, and/or in certain circumstances
preservation of natural resources for the purposes of offsetting adverse impacts which remain after all
appropriate and practicable avoidance and minimization has been achieved. Compensatory mitigation represents
a spectrum of practices that range from rigorous and measurable biodiversity offsets to less direct efforts to
compensate for impacts through financial donations and land protection.
Mitigation Hierarchy – avoidance, minimization, rehabilitation / restoration (sometimes termed mitigation),
offset.
One-off offset – ‘do-it-yourself’ offsetting conducted by the developer or a subcontractor. Known as ‘permittee
responsible mitigation’ in the United States.
Compensation Fund – a third-party mechanism that collects and administers fees from developers to offset
their impacts to biodiversity. The money may go directly towards compensating biodiversity loss, or to more
indirect biodiversity-related projects (i.e. funding protected area management, research).
Mitigation Bank (“bank”)–a site, or suite of sites, where resources (e.g., wetlands, streams, habitat, species)
are restored, established, enhanced and/or preserved for the purpose of providing compensatory mitigation for
impacts. In general, a mitigation bank sells compensatory mitigation credits to developers whose obligation to
provide compensatory mitigation is then transferred to the mitigation bank sponsor.
Credit – a unit of measure representing the environmental commodity that is able to be traded (this can be
functional or measure of area), based on the environmental activity.
No Net Loss - A target for a development project in which the impacts on biodiversity caused by the project are
balanced or outweighed by measures taken to avoid and minimize the project’s impacts, to undertake restoration
and finally to offset the residual impacts, so that no loss remains. Where the gain exceeds the loss, the term ‘net
gain’ may be used.
Like-for-Like - conservation (through the biodiversity offset) of the same type of biodiversity as that affected
by the project. Also referred to as in-kind.
Environmental Impact Assessment - a formalized process, including public consultation, in which all relevant
environmental consequences of a project are identified and assessed before authorization is given.
Marsden et al 2010. Adapted from BBOP, 2009,5 Gane, 2009,6 US EPA, US ACE 20087
There is evidence that Biobanks are a better solution for biodiversity conservation than protecting
small fragmented areas. Edwards et al (2010) report on the abundance and diversity of birds within oil
palm plantations, fragments and contiguous forest based on field work conducted in the Ulu Segama-
Malua Forest Reserve and oil Palm estates in Sabah. Abundance of imperilled bird species were 60
times lower in fragments and 200 times lower in oil palm than in contiguous forest. Forest fragments
also did not increase bird abundance in adjacent oil palms, had lower species richness than contiguous
forest, and had avifanunal composition that was similar to oil palm than to contiguous forest. Only
birds were studied as a reasonable indicator across taxa. The data suggests that retaining contiguous
forest wherever possible in southeast Asia would be the most effective strategy for conserving
biodiversity. Furthermore if forest fragments are to be preserved within plantations (or other forest
landscape) then larger fragments are more beneficial than smaller ones. For palm-oil companies, who
are currently expending funds to make existing oil palm plantations more wildlife friendly, funding
should be directed toward bio-banking schemes that protect contiguous forest outside of the
agricultural matrix

100
Initiatives in Malaysia
In 2008, the government of Sabah, Malaysia collaborated with the Eco Products Fund, a private
equity investment vehicle jointly managed by New Forests Inc. and Equator Environmental, LLC, to
invest up to US$10 million in the restoration and maintenance of 34,000 hectares of rainforest in a
project called the Malua BioBank. The project aims to enable the long-term (and potentially
permanent) protection of biodiversity via a voluntary purchase.
The Malua BioBank sells Biodiversity Conservation Certificates (BCCs) at US$10 each representing
100 m2
of forest, which is used to finance rainforest restoration and protection. A proportion of the
revenues from BCCs (20%) are used to endow a trust fund (Malua Trust), thereby providing finance
for ongoing investment. At the end of the 50 years when the endowment is fully capitalized, it could
be used to renew the conservation lease or, if the area is no longer at risk, the money could be
allocated to priority areas for conservation.
If all BCCs are sold for the 34,000 ha area the project has the potential to earn US$34million. The
initiative aims to attract private / voluntary capital. Credit buyers are expected to be companies that
use palm oil in their products, including soap and biofuel producers. To date credits have been sold to
logging companies that logged Malua and to retail e.g., Tetley tea which offers tokens to customers
buying its tea that can be used to claim a square metre of Malua forest.
At present the demand for credit is driven by voluntary interest, however, there is interest in
implementing no Net Loss Legislation in Sabah. This includes interest in exploring a third-party
mitigation system. Such a program could be based on the Environmental Protection Enactment (EPE)
of 2002, which includes the first steps towards creating a habitat mitigation banking market by
requiring mitigation for environmental impacts. If implemented, such legislation would create a
strong market for biodiversity credits in Sabah.
The Government likes the idea of biodiversity offsets, but there are some concerns regarding costs.
Extensive stakeholder consultation (including government departments, companies, conservation
organisation) will be needed before any program is implemented. They are keen to implement a pilot
biodiversity offset project ahead of legislation. This would inform the legislative process and test how
the approach could work both biologically and financially.
The Business and Biodiversity Offsets Programme (BBOP), a sister initiative of Forest Trends, is
an international partnership of more than 40 leading conservation and civil society organizations,
companies, governments and financial institutions. BBOP is developing and trialing best management
practices at a portfolio of biodiversity offset pilot sites; disseminating guidelines, methodologies and
ultimately standards for biodiversity offsets; and supporting governments in the development of
policy on biodiversity offsets91
. A workshop on biodiversity offsets was held in Sabah in June 2010
and attended by BBOP.
The Sabah Government is entering into a 2 year MOU with BBOP to develop the ‘No Net Loss’
policy in the State. The demonstration site is considered a potential pilot study site. In addition to
WWF and BBOP, New Forest Asia92
has also expressed interest to be a party to the development of a
‘Non Net Loss’ policy in the State.
91 BBOP’s toolkit for biodiversity offset design and implementation can be found at http://bbop.forest-trends.org/
guidelines/.
92 New Forest Asia Sdn Bhd is a forestry investment and advisory company incorporated in Malaysia and part of the
International New Forests group. It manages the Malua Biobank and is seeking to develop credible compensatory mitigation
solutions for the oil palm and other industries.

101
Applicability to project site
It is not evident at this stage that the market is strong enough to support a second BioBank in Sabah,
and what part of the demonstration site could be allocated for this purpose if up for discussion. The
Maliua Basin buffer zone could be considered, as this would support / increase conservation efforts
within the MBCA. The InIkea project may also be able to sell biodiversity credits. However, no
baseline assessment was made of the level of biodiversity before the project, so it may be difficult to
state the level of biodiversity improvement. Protecting fragmented areas are unlikely to maximise
biodiversity conservation efforts within the demonstration site landscape.
One option is to support the Malua BioBank in the first instance, perhaps through the purchase of
credits to offset biodiversity impacts in the ITP area. Within the ITP area, areas of high conservation
could be set aside, while unavoidable impacts could be offset through the purchase of credits from
Malua BioBank. This would be a flow of revenue out of the area, and effectively a redistribution of
revenue as the ITP area is managed by YS. However, on a State wide scale strengthening the
protection of existing sites may be preferable to designating new conservation areas. The role of the
project would then be to quantify the unavoidable impacts in order for them to be offset.
If biodiversity offsetting becomes a statutory requirement in Sabah the market could be much
developed within the next 5 years as oil palm and other companies seek avenues to offset their
impacts on biodiversity (see Box 2). This could mean that it would be economically viable to
conserve more areas within the demonstration site, as there would be a strong market for the purchase
of offset credits.
BBOP do not have a concrete proposal or funding at the moment but plan to start with policy
alignment. The SFD are supportive of BBOP being involved in the proposed GEF project.
Box 2. Innovative financing of Oil Palm
The Princes Rainforest Project recently released two reports on how the palm oil sector could benefit from
REDD+ credits in the future through either swapping concessions granted on idle lands or through productivity
gains. These proposals are at an early stage of development but may provide interesting alternative revenue
opportunities for palm oil companies. www.rainforestsos.org/wp-content/uploads/pdfs/REDD-and-Agriculture-
Proposed-Solutions-from-Private-Sector.pdf
A large palm oil producer in Sabah is working to develop a Clean Development Mechanism (CDM) project at
one of their palm oil mills. The project hopes to avoid the equivalent of 130,000 tonnes of carbon emissions
over 7 years through wastewater treatment and biogas generation, at current carbon prices this would be worth
more than US$ 2 million.
There is also a project proposal to design and pilot test a compensation mechanism based on Biodiversity
Banking. The Round tables on Sustainable Palm Oil (RSPO) has established a certification schemes for
growers. Certified plantations must not have been established on areas providing High Conservation Value
(HCV) after November 2007. The period between November 2005 and November 2007 is recognised as a
transition period. HCV cleared during this period can potentially be certified but only if acceptable
compensation for the conservation value loss is provided. The RSPO estimates that hundreds of thousands of
hectares of forest were converted in Malaysia and Indonesia during this period. The project partners (led by
New Forest Asia) intend to work together to develop and test a biodiversity offset-type compensation
mechanism to enable RSPO members to fully compensate for clearance in the 2005-2007 period.

102
4. PES
Background
Payments for Ecosystem Services (PES) are contractual and voluntary transactions where a 'buyer' agrees to pay a 'seller' conditional on delivery of an ecosystem service, or implementation of a land use or management practice likely to secure that service.
For example a PES might create a financial incentive to protect, restore, or sustain ecosystem services provided by watersheds. Hydrological services include flood control, regulation of water supply, water purification, and erosion control. Establishing PES often takes years, requiring detailed studies to define the service being provided (this is crucial for a credible PES), estimate its value and undertake extensive stakeholder engagement to build trust and commitment.
Initiatives in Malaysia
There is a growing interest in PES in Peninsular Malaysia where a PES scoping study is currently
underway by UNDP with the Government’s Economic Planning Unit (EPU). This study will set out a
policy for the development of PES in Malaysia and outline site’s providing concrete examples, sites
with good potential and sites offering longer term opportunities. This study should be completed by
the end of 2011, and there would be scope for a similar study to be undertaken in Sabah under the
proposed GEF project.
WWF commissioned a study to scope out possible watershed services in Sabah and Sarawak
(Witteveen Bos Indonesia, 2011). They identified seven basins as potential pilot sites to test the
business case for implementing payments for watershed services. These include the Labuk and
Kintabatagan river basins in Sabah.
Applicability to project site
A first step in developing a PES type mechanism at site level will be to assess the ecosystem services
provided by the site and their beneficiaries. This data will in any case be gathered as part of the
development of the economic model and landscape-level management plan for the demonstration site.
5. Others
Non-wood forest products (NWFPs)
Non-wood forest products (NWFPs) are a second significant use value associated with forested lands,
and are an important source of income for rural communities in Sabah. The most significant NWFP is
rattan. Seven of the world’s 13 genera of rattan, comprising some 50 species, are found in the natural
forests of Sabah. The most important genera of commercial value are Calamus, Kortalsia,
Daemonorops and Plectocomia (Dransfield, 198493
). Rattan has multiple uses, including for making
furniture parts, fish traps, baskets, mats, hats and walking sticks (Dransfield and Manokaran, 199394
).
In 1987, Sabah exported 6,340 tonnes of rattan worth RM22 million. By 2008, however, the
production of rattan from natural forests had been dramatically reduced to 141 tonnes—a collapse
associated with the reduction in primary forests. Nevertheless, rattan continues to play an important
role in the livelihood of local communities.
Medicinal plants remain an important category of NWFPs for Sabah’s population. In a survey of 22
village households living adjacent to the Crocker Range along the west coast of Sabah, 21 of the
households collected and used wild medicinal plants for healthcare needs (Anderson et al., 200395
). A
total of 110 specimens representing 40 families were identified, most of which come from secondary
93 Dransfield, J. 1984. The rattans of Sabah. Forest Record no. 13. Sabah Forestry Department, Malaysia. 182 pp. 94 Dransfield, J.and Manokaran, N. 1993. Ratans. Plant resources of Southeast Asia. Wageningen. 137 pp.
95 Andersen, J., Nilsson, C., de Richelieu, T., Fridriksdottir, H., Gobilick, J., Mertz, O. and Gausset, Q. 2003. Local use of forest products in Kuyongon, Sabah, Malaysia. ASEAN Review of Biodiversity and Environmental Conservation.

103
forests. Another study on the traditional use of medicinal plants in Lower Segama reported that the
Tidong communities collected medicinal plants from forests that include sambung (Blumea
balsamifera), tongkat Ali (Eurycoma longifolia), daun ular (Cratoxylum sp.), lampuyang (Zingeber
sp.), asuk-asuk, kacip Fatimah, lampunis, imbakawan, kengei and lasing to treat gastritis, stomach
ache, light injury, snakebite, fever, headache, and hypertension (Poukin et al., 200696
). The value of
these medicinal plants has not been estimated, but the world trade in raw materials for botanical
medicines, vitamins and minerals was estimated at US$8 billion, and most of these come from
tropical forests (Ten Kate and Laird, 199997
).
As far as the project site is concerned, people in Kg Fajar Harapan Luasong reportedly use the forest
for building materials, fishing and medicine. While this service is present, the level of NTFP collection
activity is considered to be low. A survey of households in the village would be helpful to provide more
information regarding these activities and their associated values.
Bioprospecting
Bioprospecting involves searching for, collecting, and deriving genetic material from samples of
biodiversity that can be used in commercialized pharmaceutical, agricultural, industrial, or chemical
processing end products. Since 1991, the Convention on Biological Diversity (CBD) has embodied
the principles of compensated bioprospecting globally.
While it is possible that the site may have products of high commercial medicinal value (given its
high biodiversity), there is a long lead time in bringing these products to market etc. and thus to
generate a revenue stream. For this reason, it is not being prioritised in the case of the site landscape.
Timber concessions and royalties
Timber royalties and other payments are already formalised within the area and will continue to
provide a source of revenue. However there is scope to improve rent capture by the SFD, who
according to Brown, u.d., did not capture on average US$5/m3 of mixed tropical hardwoods for the
period 1970-1998, compared with US$80/m3 in Sarawak and USD60/m
3 in Indonesia. The failure to
capture a sizable portion of the economic rent means there is less money for the SFD to reinvestment
in projects that promote sustainable forest management (Vincent and Gillis, 1998), while low
stumpage fees encourage higher levels of harvesting and consumption of wood products through
excessive cutting (Poter, u.d).
Accessing price premiums through certification bodies.
Certification is one of the eventual aims for the area and the SFD is already working with the FSC to
develop certification schemes for well managed plantation areas. Certified sites may be able to enjoy
a price premium. WWF-Malaysia has an MoU (2010-2015) with the project proponent (SFD) to
obtain credible certification for FMU23, 24 and 26 within the project landscape
96 Poukin, E., Maryati, M., Sofian Abu Bakar and Intan Azirah Abdul Rahman. 2006. Traditional use of medicinal plants among the Tidong
Communities in Lower Segama. In Maryati, M., Bernard, H., Sofian Abu Bakar, Matsunaga, R. (eds.): Lower Segama Scientific
Expedition. Universiti Malaysia Sabah. 97 Ten Kate, K. and Laird, S.A. 1999. Commercial use of Biodiversity: Access to genetic resources and benefit sharing. Earthscan
Publication Ltd.

104
Biodiversity / Conservation Fund
EPU is considering a generic biodiversity fund, through which state government’s can ask for money
to support biodiversity if they have a management plan and strategy for a site.
Tourism revenues
It should be possible to derive some revenue from tourist fees and charges at the proposed tourism
developed area. This is considered to be highly feasible given that a tourism development area has
already been designated for the site, and its proximity to the Maliua Basin Research Area which
currently attracts around 2,500 visitors a year, as discussed in section 3.2.3. The facilities and tourism
experience to be offered by the area are not yet defined, so pending development of a tourism plan for
the designated site, and potentially other sites, it is not possible to predict the scale of tourism
revenues.
6. Benefit sharing
An important aspect of forest management at the demonstration site is the introduction of mechanisms
for the disbursement of revenue among local communities such that the benefits derived from the site
are shared equitably. This is often a key issue in the management of protected areas, and may be
relevant in this respect if a part of the demonstrated site is protected. The ethos of YS is very much
one of benefit sharing given its remit to fund improvements in socio-economic welfare in Sabah
through the sale of timber within its concessions areas. To date it has supported programs in rural
health care and education. Existing programs within the demonstration site also have a strong social
focus, such as the INIKEA project (see section 2). PES mechanism can promote benefits sharing,
although their feasibility at the demonstration site is yet to be determined. Other benefit sharing
mechanism may be identified by the project.
7. Conclusions
The potential for incremental, sustainable financial flows from the demonstration landscape remains
potentially significant, though difficult to quantify precisely without further investigation. There are
various avenues to explore and the site is well placed to develop sustainable financing options given
the existing precedents in Sabah and the Government’s demonstrated support for REDD+,
biodiversity offsets, etc . Additional work in this area will be conducted during the full project as part
of the work to develop an economic model, landscape management plan and, of course, revenue
generating instruments. This will include consideration of alternative land use options which build in
realistic financial flows based on concrete scientific and economic evidence.
Based on present knowledge, it is recommended that the project focus its efforts on three potential
instruments within the landscape, namely REDD+, PEW/PWS and biodiversity offsets / banking.
However, should landscape-level data gathering determine that other revenue-generating options may
be of equal or greater sustainable benefit than the three selected above, such instruments should be
incorporated into the project strategy as part of an adaptive management approach.

105
Table 2. Opening the discussion on alternative land uses and their potential financing
Current Forest Land Use Alternative use / management Potential Financing
Natural
Forest
Management
(180,426ha)
RIL
Non-buffer zone
areas
Silviculture or other improved forest management
(likely to be expensive)
It is estimated that the natural forest will all be logged
by 2014 and therefore there is a need to identify
alternative revenue sources. Logging the area for a
third time could be considered, although the
economics of the second time logging have already
been described as ‘marginal’.
May qualify for Voluntary Carbon Market
Buffer Zone 1 Class 1 Forest reserve. Rehabilitate and protect from
harvesting
Community using the forest in the north, which
may help to achieve REDD+
Biodiversity offsets
Buffer Zone 11 More intervention (planting) to restore area degraded
by two rounds of logging
REDD+ ?
Industrial Tree Plantations
(43,821hs)
Acacia, Rubber & Teak
(i)Set aside areas of high conservation and offset
unavoidable impacts
(i) Stop plantation forest and rehabilitate area to
natural forest
(i) (i) Offset unavoidable impact (from Malua
biobank). However this would be a financial flow
out of the area. ITP is managed by YS, who
would be responsible for paying the offset,
therefore a redistribution in revenue, but means
land uses are correctly priced.
(ii) Stop plantation forestry and claim carbon
credits
Rehabilitation area /
Enrichment planting
(18,500 ha)
INIKEA
Not clear what will happen to the site after the project.
Could be used as a research area or for research
tourism
Doesn’t qualify for REDD, as set up to improve
biodiversity.
Biodiversity offsets could be explored
Biodiversity offsets
Research grants
Tourism revenue
Conservation
forests
(18,517ha)
Water
catchment
A lot more information required to define
hydrological services, which are very site specific
PES ??
Virgin Jungle Currently small fragmented areas
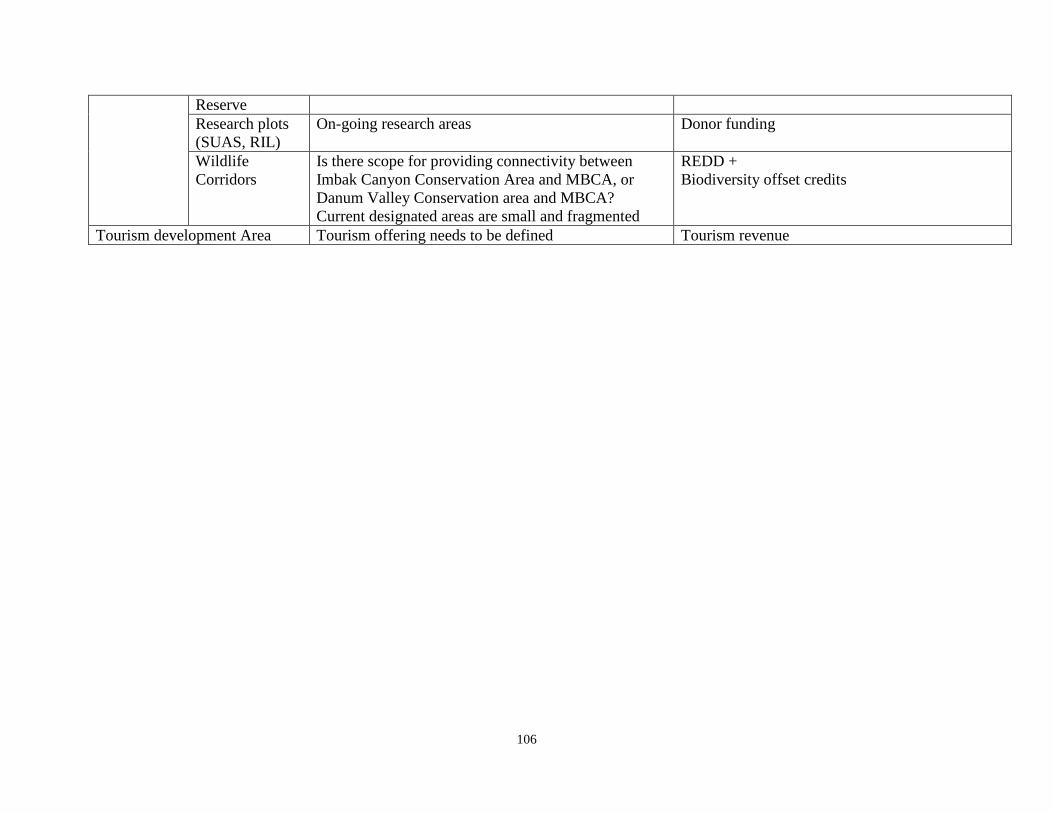
106
Reserve
Research plots
(SUAS, RIL)
On-going research areas Donor funding
Wildlife
Corridors
Is there scope for providing connectivity between
Imbak Canyon Conservation Area and MBCA, or
Danum Valley Conservation area and MBCA?
Current designated areas are small and fragmented
REDD +
Biodiversity offset credits
Tourism development Area Tourism offering needs to be defined Tourism revenue