UNIT 8 STUDY SHEET POLYNOMIAL FUNCTIONS KEY · PDF fileUNIT 8 STUDY SHEET – POLYNOMIAL...
10
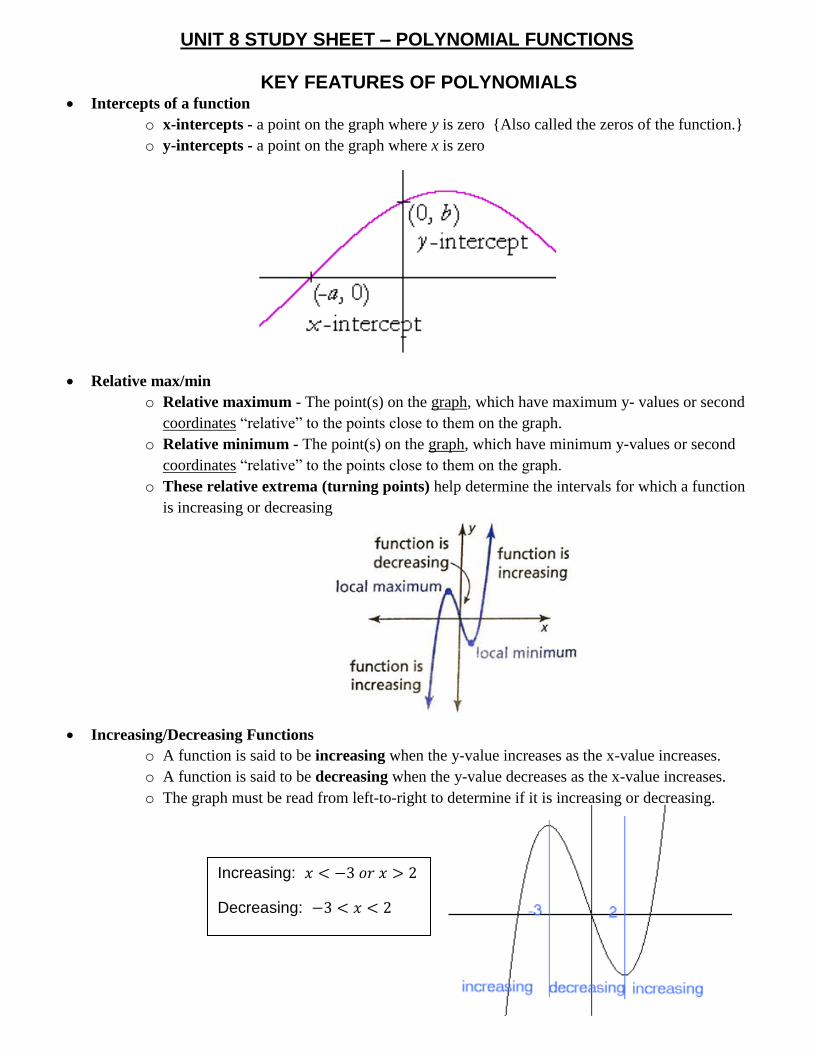
UNIT 8 STUDY SHEET – POLYNOMIAL FUNCTIONS KEY FEATURES OF POLYNOMIALS Intercepts of a function o x-intercepts - a point on the graph where y is zero {Also called the zeros of the function.} o y-intercepts - a point on the graph where x is zero Relative max/min o Relative maximum - The point(s) on the graph, which have maximum y- values or second coordinates “relative” to the points close to them on the graph. o Relative minimum - The point(s) on the graph, which have minimum y-values or second coordinates “relative” to the points close to them on the graph. o These relative extrema (turning points) help determine the intervals for which a function is increasing or decreasing Increasing/Decreasing Functions o A function is said to be increasing when the y-value increases as the x-value increases. o A function is said to be decreasing when the y-value decreases as the x-value increases. o The graph must be read from left-to-right to determine if it is increasing or decreasing. Increasing: Decreasing:
Transcript of UNIT 8 STUDY SHEET POLYNOMIAL FUNCTIONS KEY · PDF fileUNIT 8 STUDY SHEET – POLYNOMIAL...
UNIT 8 STUDY SHEET – POLYNOMIAL FUNCTIONS
KEY FEATURES OF POLYNOMIALS Intercepts of a function
o x-intercepts - a point on the graph where y is zero {Also called the zeros of the function.}
o y-intercepts - a point on the graph where x is zero
Relative max/min
o Relative maximum - The point(s) on the graph, which have maximum y- values or second
coordinates “relative” to the points close to them on the graph.
o Relative minimum - The point(s) on the graph, which have minimum y-values or second
coordinates “relative” to the points close to them on the graph.
o These relative extrema (turning points) help determine the intervals for which a function
is increasing or decreasing
Increasing/Decreasing Functions
o A function is said to be increasing when the y-value increases as the x-value increases.
o A function is said to be decreasing when the y-value decreases as the x-value increases.
o The graph must be read from left-to-right to determine if it is increasing or decreasing.
Increasing:
Decreasing:
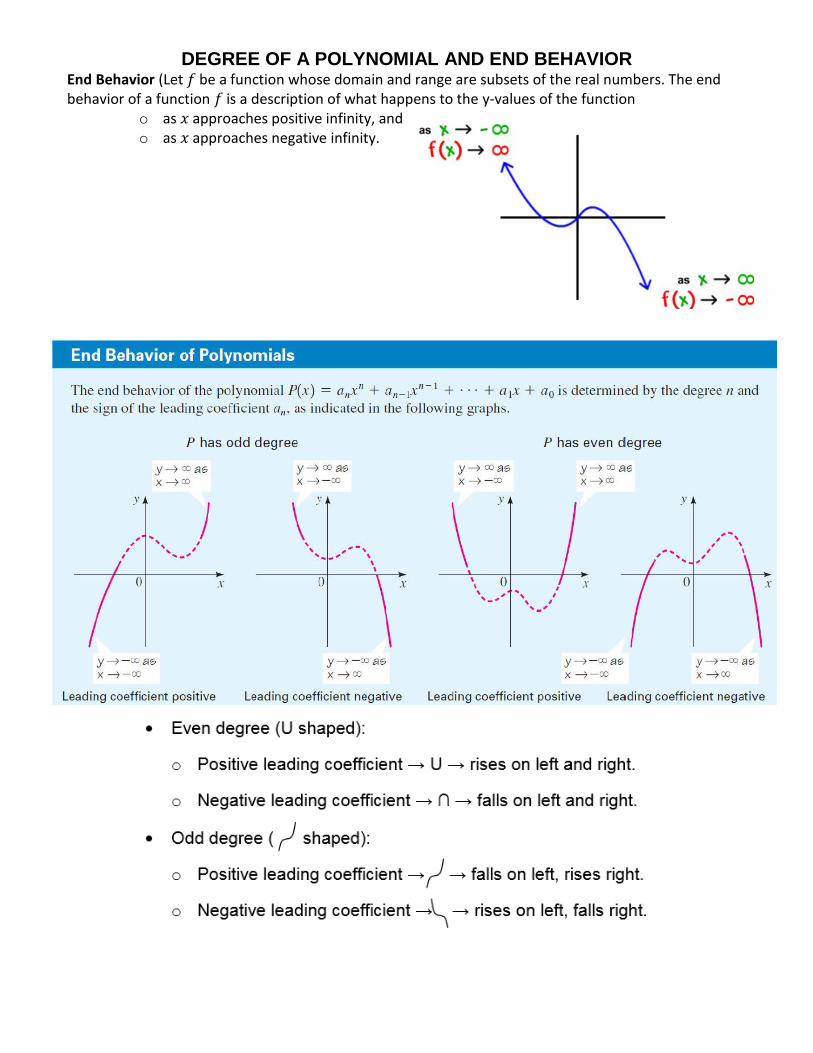
DEGREE OF A POLYNOMIAL AND END BEHAVIOR End Behavior (Let 𝑓 be a function whose domain and range are subsets of the real numbers. The end behavior of a function 𝑓 is a description of what happens to the y-values of the function
o as approaches positive infinity, and o as approaches negative infinity.
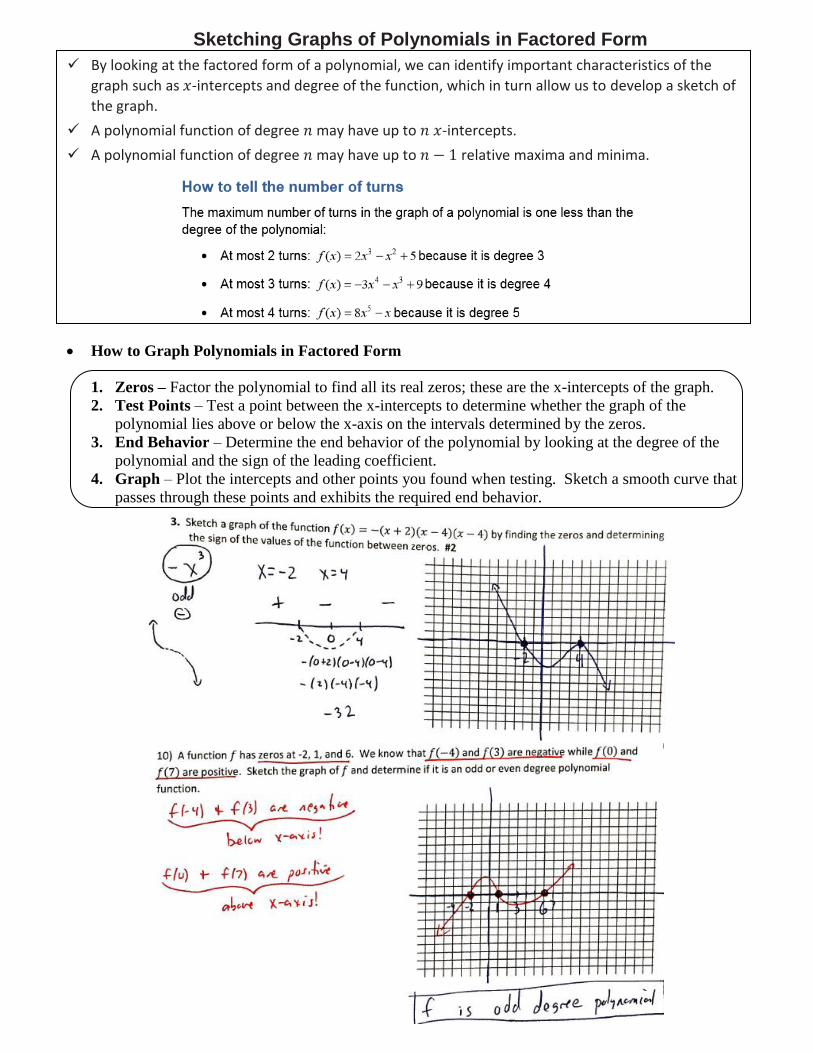
Sketching Graphs of Polynomials in Factored Form
By looking at the factored form of a polynomial, we can identify important characteristics of the
graph such as -intercepts and degree of the function, which in turn allow us to develop a sketch of
the graph.
A polynomial function of degree may have up to -intercepts.
A polynomial function of degree may have up to relative maxima and minima.
How to Graph Polynomials in Factored Form
1. Zeros – Factor the polynomial to find all its real zeros; these are the x-intercepts of the graph.
2. Test Points – Test a point between the x-intercepts to determine whether the graph of the
polynomial lies above or below the x-axis on the intervals determined by the zeros.
3. End Behavior – Determine the end behavior of the polynomial by looking at the degree of the
polynomial and the sign of the leading coefficient.
4. Graph – Plot the intercepts and other points you found when testing. Sketch a smooth curve that
passes through these points and exhibits the required end behavior.
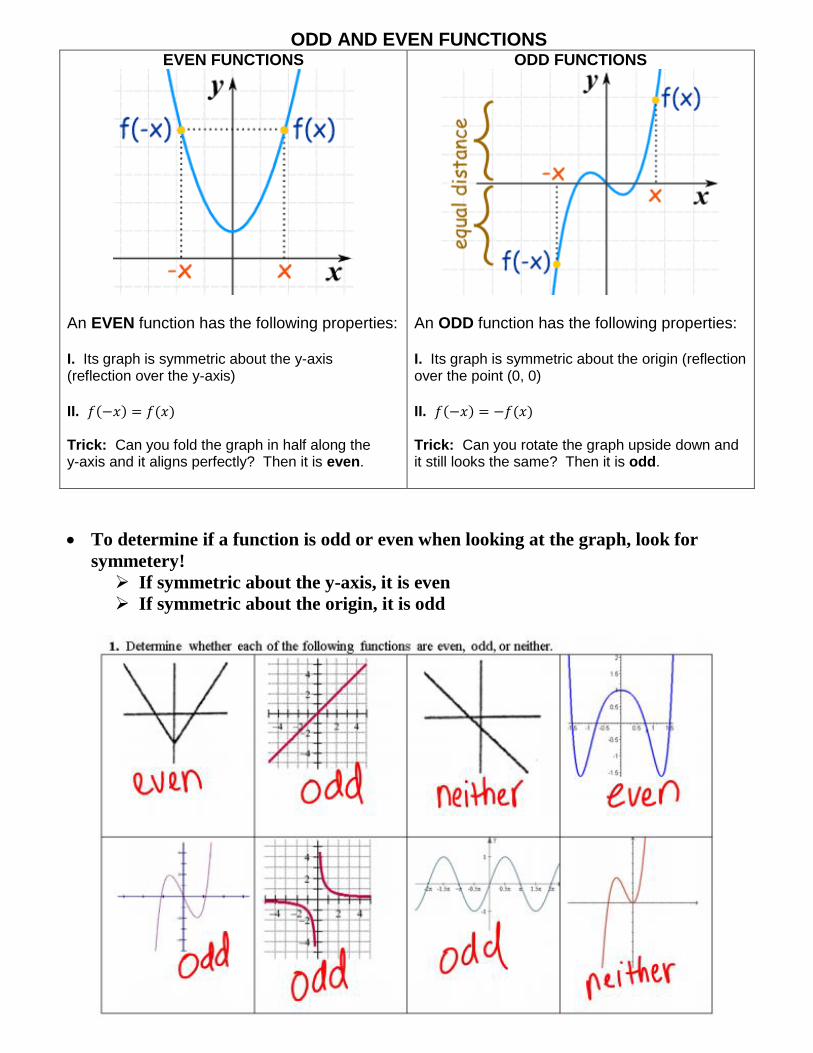
ODD AND EVEN FUNCTIONS EVEN FUNCTIONS
An EVEN function has the following properties: I. Its graph is symmetric about the y-axis (reflection over the y-axis)
II. 𝑓( ) 𝑓( ) Trick: Can you fold the graph in half along the y-axis and it aligns perfectly? Then it is even.
ODD FUNCTIONS
An ODD function has the following properties: I. Its graph is symmetric about the origin (reflection over the point (0, 0)
II. 𝑓( ) 𝑓( ) Trick: Can you rotate the graph upside down and it still looks the same? Then it is odd.
To determine if a function is odd or even when looking at the graph, look for
symmetery!
If symmetric about the y-axis, it is even
If symmetric about the origin, it is odd
ODD AND EVEN FUNCTIONS (Continued)
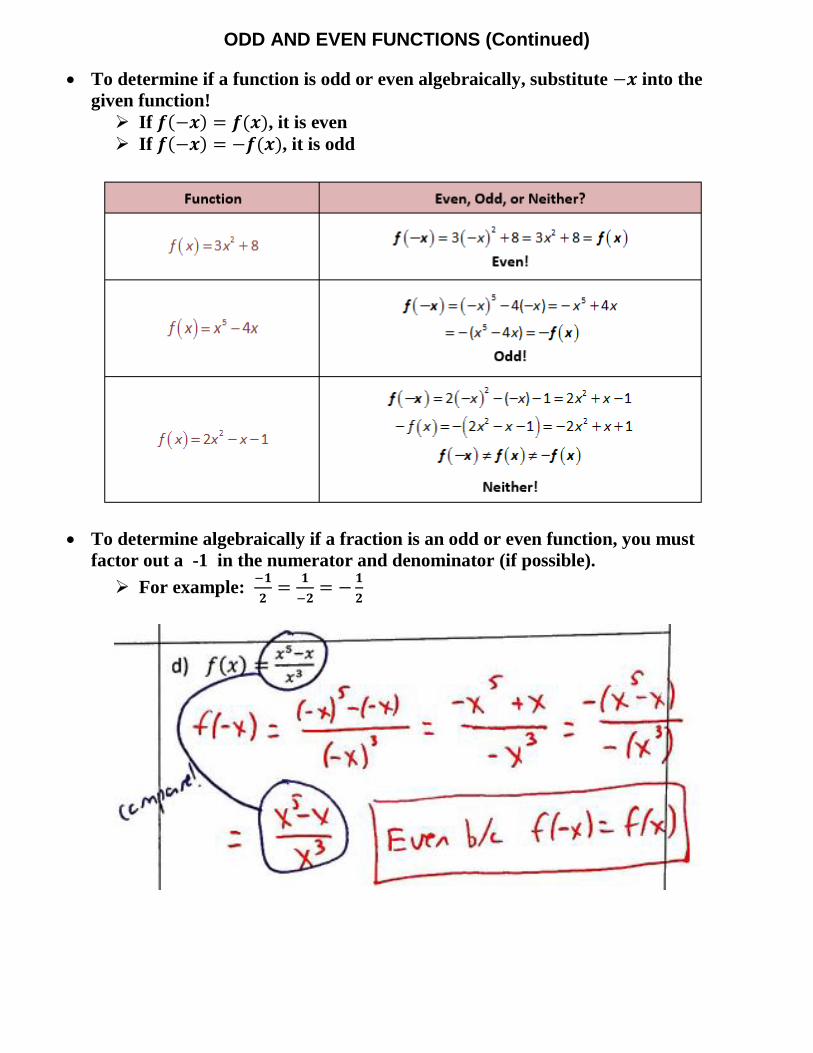
To determine if a function is odd or even algebraically, substitute into the
given function!
If ( ) ( ), it is even
If ( ) ( ), it is odd
To determine algebraically if a fraction is an odd or even function, you must
factor out a -1 in the numerator and denominator (if possible).
For example:
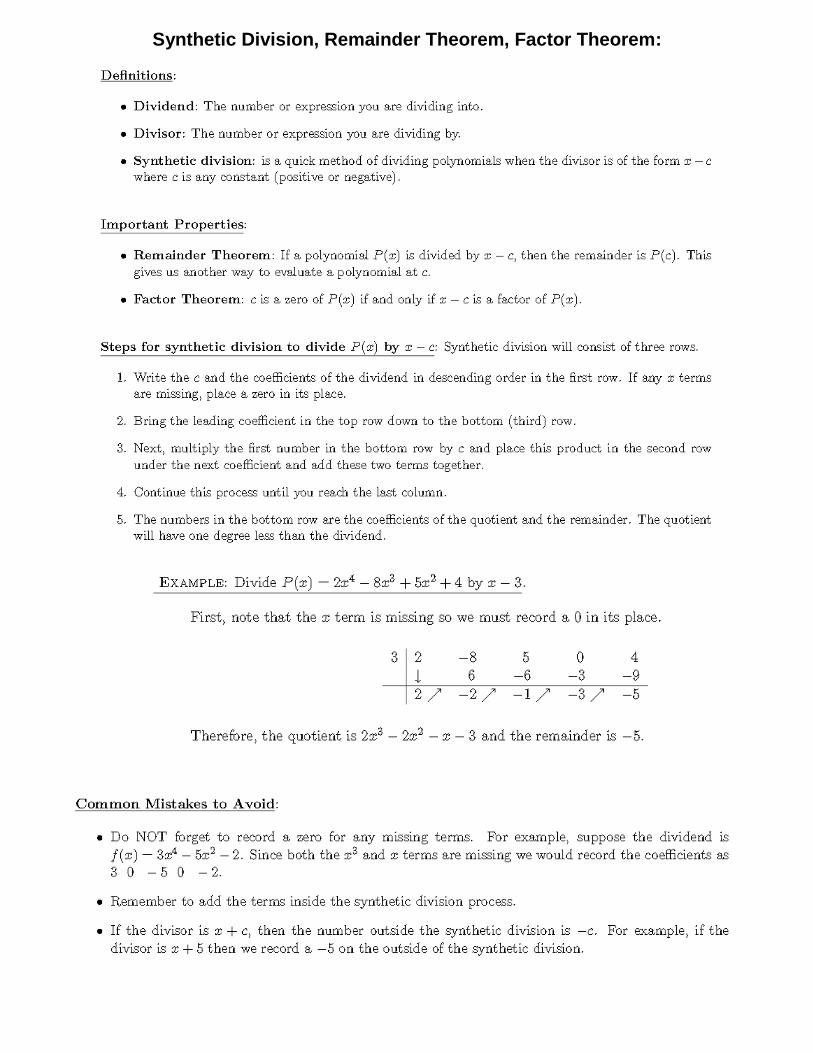
Synthetic Division, Remainder Theorem, Factor Theorem:
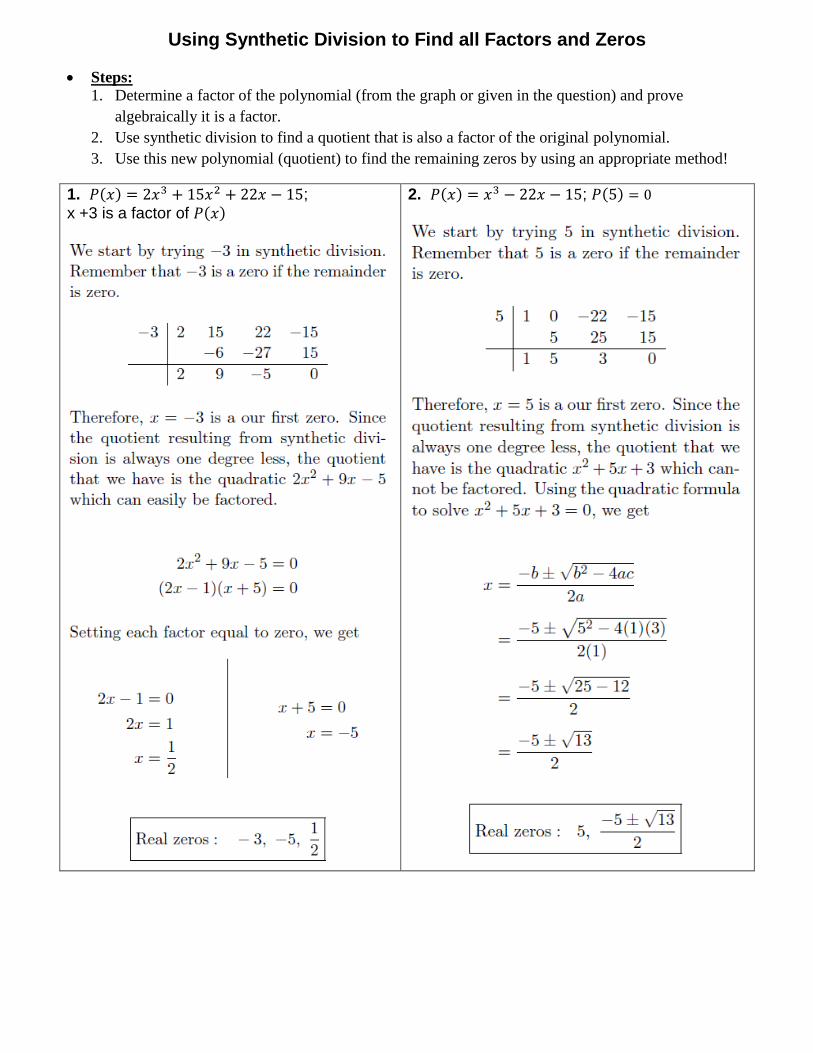
Using Synthetic Division to Find all Factors and Zeros
Steps:
1. Determine a factor of the polynomial (from the graph or given in the question) and prove
algebraically it is a factor.
2. Use synthetic division to find a quotient that is also a factor of the original polynomial.
3. Use this new polynomial (quotient) to find the remaining zeros by using an appropriate method!
1. ( ) ;
x +3 is a factor of ( )
2. ( ) ; ( )
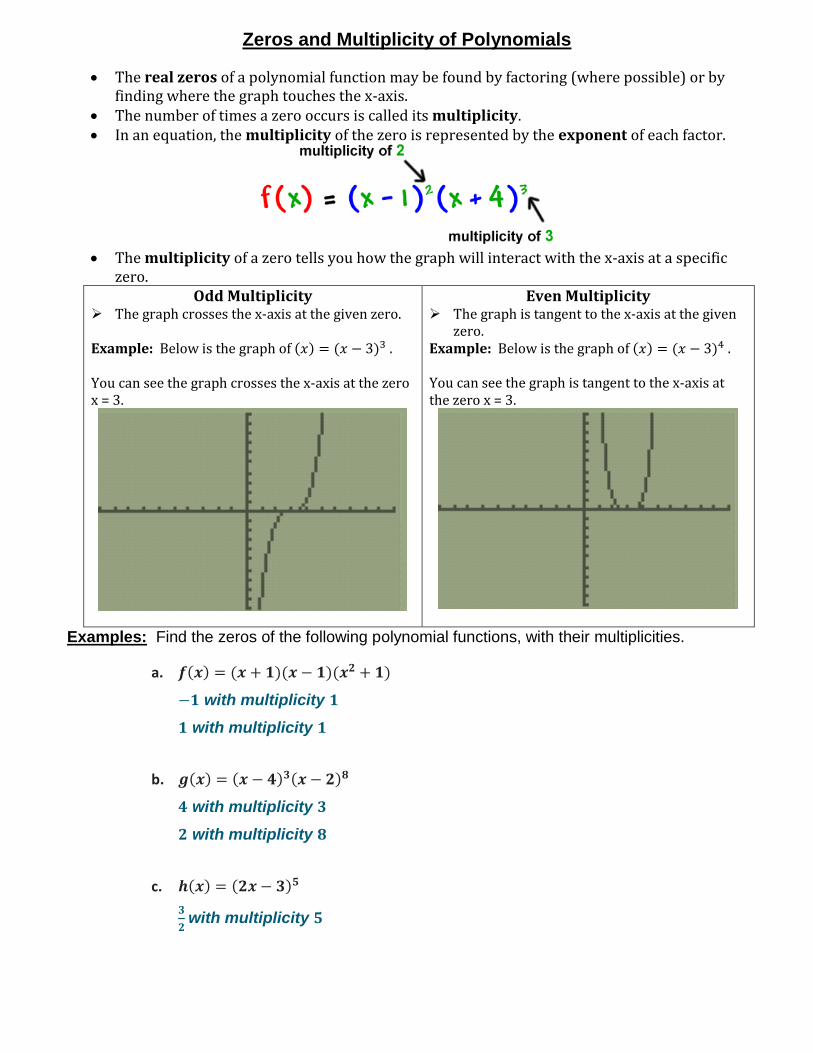
Zeros and Multiplicity of Polynomials
The real zeros of a polynomial function may be found by factoring (where possible) or by finding where the graph touches the x-axis.
The number of times a zero occurs is called its multiplicity. In an equation, the multiplicity of the zero is represented by the exponent of each factor.
The multiplicity of a zero tells you how the graph will interact with the x-axis at a specific
zero. Odd Multiplicity
The graph crosses the x-axis at the given zero. Example: Below is the graph of ( ) ( ) . You can see the graph crosses the x-axis at the zero x = 3.
Even Multiplicity The graph is tangent to the x-axis at the given
zero. Example: Below is the graph of ( ) ( ) . You can see the graph is tangent to the x-axis at the zero x = 3.
Examples: Find the zeros of the following polynomial functions, with their multiplicities.
a. ( ) ( )( )( )
with multiplicity
with multiplicity
b. ( ) ( ) ( )
with multiplicity
with multiplicity
c. ( ) ( )
with multiplicity
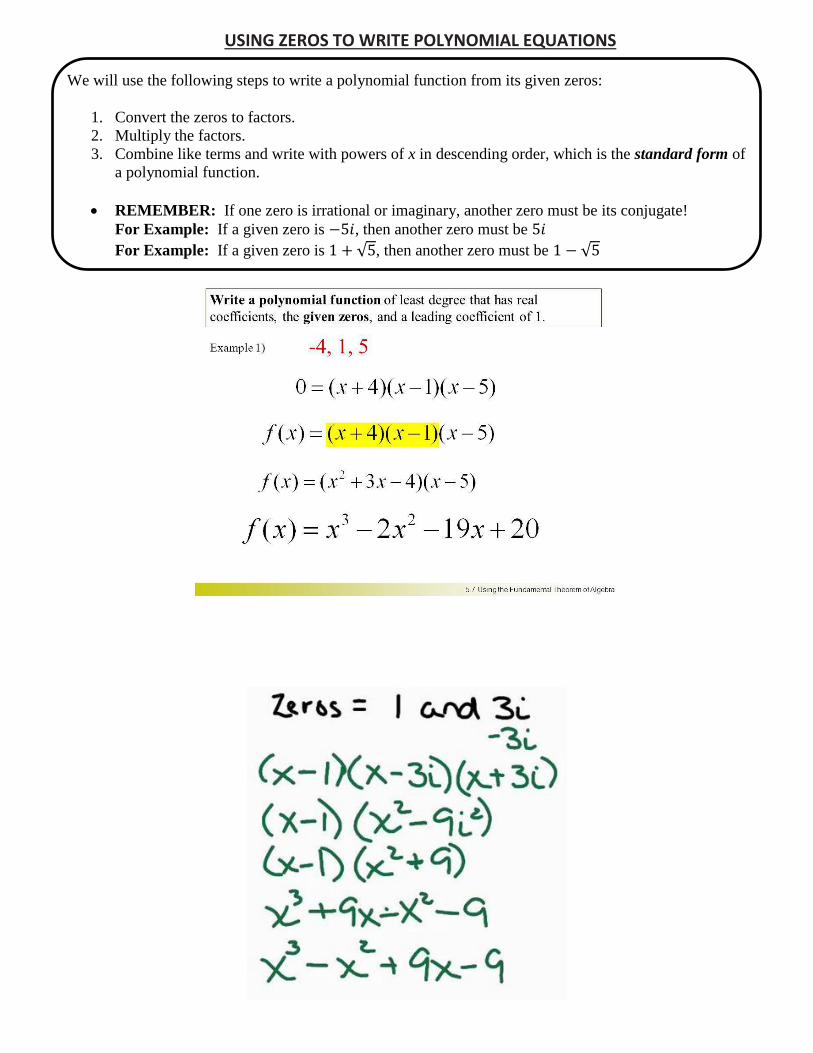
USING ZEROS TO WRITE POLYNOMIAL EQUATIONS
We will use the following steps to write a polynomial function from its given zeros:
1. Convert the zeros to factors.
2. Multiply the factors.
3. Combine like terms and write with powers of x in descending order, which is the standard form of
a polynomial function.
REMEMBER: If one zero is irrational or imaginary, another zero must be its conjugate!
For Example: If a given zero is , then another zero must be
For Example: If a given zero is √ , then another zero must be √
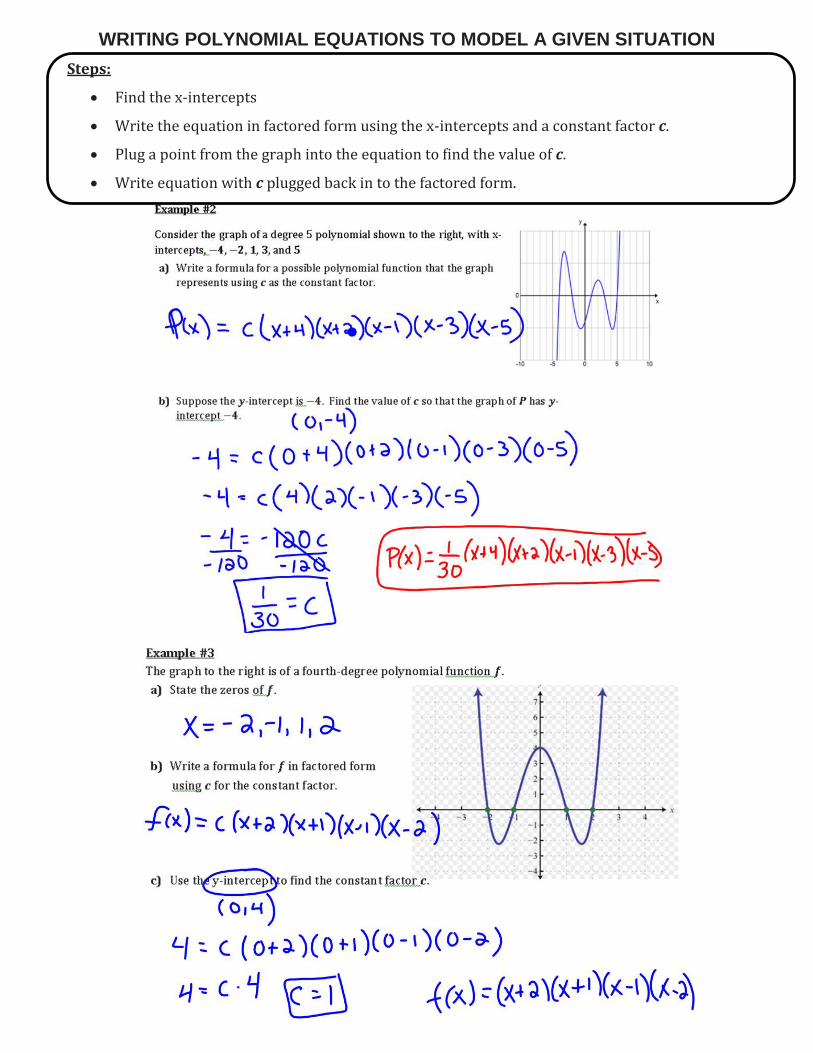
WRITING POLYNOMIAL EQUATIONS TO MODEL A GIVEN SITUATION
Steps:
Find the x-intercepts
Write the equation in factored form using the x-intercepts and a constant factor c.
Plug a point from the graph into the equation to find the value of c.
Write equation with c plugged back in to the factored form.