UNIT 4: MODELING AND ANALYZING EXPONENTIAL FUNCTIONS ... · Unit 4: Modeling and Analyzing...
29
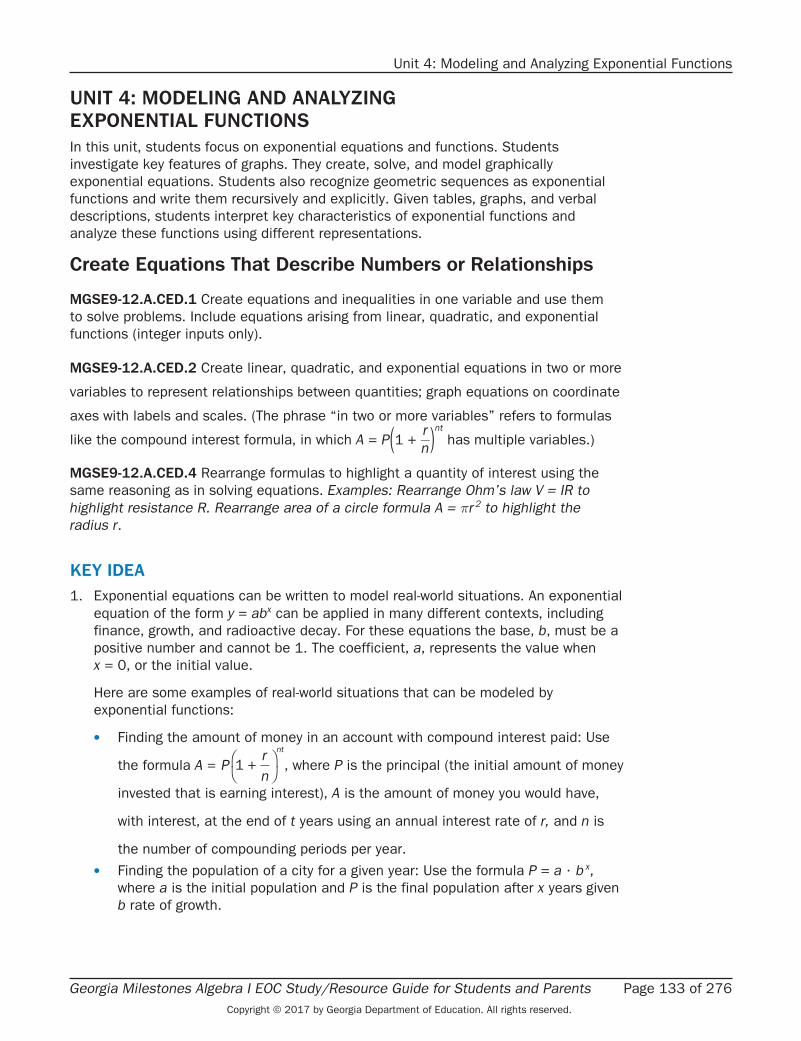
Georgia Milestones Algebra I EOC Study/Resource Guide for Students and Parents Page 133 of 276 Copyright © 2017 by Georgia Department of Education. All rights reserved. Unit 4: Modeling and Analyzing Exponential Functions UNIT 4: MODELING AND ANALYZING EXPONENTIAL FUNCTIONS In this unit, students focus on exponential equations and functions. Students investigate key features of graphs. They create, solve, and model graphically exponential equations. Students also recognize geometric sequences as exponential functions and write them recursively and explicitly. Given tables, graphs, and verbal descriptions, students interpret key characteristics of exponential functions and analyze these functions using different representations. Create Equations That Describe Numbers or Relationships MGSE9-12ACED1 Create equations and inequalities in one variable and use them to solve problems. Include equations arising from linear, quadratic, and exponential functions (integer inputs only). MGSE9-12ACED2 Create linear, quadratic, and exponential equations in two or more variables to represent relationships between quantities; graph equations on coordinate axes with labels and scales. (The phrase “in two or more variables” refers to formulas like the compound interest formula, in which A = P ( 1 + r __ n ) nt has multiple variables.) MGSE9-12ACED4 Rearrange formulas to highlight a quantity of interest using the same reasoning as in solving equations. Examples: Rearrange Ohm’s law V = IR to highlight resistance R. Rearrange area of a circle formula A = πr 2 to highlight the radius r. KEY IDEA 1. Exponential equations can be written to model real-world situations. An exponential equation of the form y = ab x can be applied in many different contexts, including finance, growth, and radioactive decay. For these equations the base, b, must be a positive number and cannot be 1. The coefficient, a, represents the value when x = 0, or the initial value. Here are some examples of real-world situations that can be modeled by exponential functions: • Finding the amount of money in an account with compound interest paid: Use the formula A = 1+ P r n nt , where P is the principal (the initial amount of money invested that is earning interest), A is the amount of money you would have, with interest, at the end of t years using an annual interest rate of r, and n is the number of compounding periods per year. • Finding the population of a city for a given year: Use the formula P = a · b x , where a is the initial population and P is the final population after x years given b rate of growth.
-
Upload
truongminh -
Category
Documents
-
view
271 -
download
0
Transcript of UNIT 4: MODELING AND ANALYZING EXPONENTIAL FUNCTIONS ... · Unit 4: Modeling and Analyzing...
Georgia Milestones Algebra I EOC Study/Resource Guide for Students and Parents Page 133 of 276Copyright © 2017 by Georgia Department of Education. All rights reserved.
Unit 4: Modeling and Analyzing Exponential Functions
UNIT 4: MODELING AND ANALYZING EXPONENTIAL FUNCTIONSIn this unit, students focus on exponential equations and functions. Students investigate key features of graphs. They create, solve, and model graphically exponential equations. Students also recognize geometric sequences as exponential functions and write them recursively and explicitly. Given tables, graphs, and verbal descriptions, students interpret key characteristics of exponential functions and analyze these functions using different representations.
Create Equations That Describe Numbers or Relationships
MGSE9-12 .A .CED .1 Create equations and inequalities in one variable and use them to solve problems. Include equations arising from linear, quadratic, and exponential functions (integer inputs only).
MGSE9-12 .A .CED .2 Create linear, quadratic, and exponential equations in two or more
variables to represent relationships between quantities; graph equations on coordinate
axes with labels and scales. (The phrase “in two or more variables” refers to formulas
like the compound interest formula, in which A = P (1 + r __ n ) nt
has multiple variables.)
MGSE9-12 .A .CED .4 Rearrange formulas to highlight a quantity of interest using the same reasoning as in solving equations. Examples: Rearrange Ohm’s law V = IR to highlight resistance R. Rearrange area of a circle formula A = πr 2 to highlight the radius r.
KEY IDEA1. Exponential equations can be written to model real-world situations. An exponential
equation of the form y = abx can be applied in many different contexts, including finance, growth, and radioactive decay. For these equations the base, b, must be a positive number and cannot be 1. The coefficient, a, represents the value when x = 0, or the initial value.
Here are some examples of real-world situations that can be modeled by exponential functions:
• Finding the amount of money in an account with compound interest paid: Use
the formula A = 1 +Prn
nt
, where P is the principal (the initial amount of money
invested that is earning interest), A is the amount of money you would have,
with interest, at the end of t years using an annual interest rate of r, and n is
the number of compounding periods per year.
• Finding the population of a city for a given year: Use the formula P = a · b x, where a is the initial population and P is the final population after x years given b rate of growth.
Page 134 of 276 Georgia Milestones Algebra I EOC Study/Resource Guide for Students and ParentsCopyright © 2017 by Georgia Department of Education. All rights reserved.
Unit 4: Modeling and Analyzing Exponential Functions
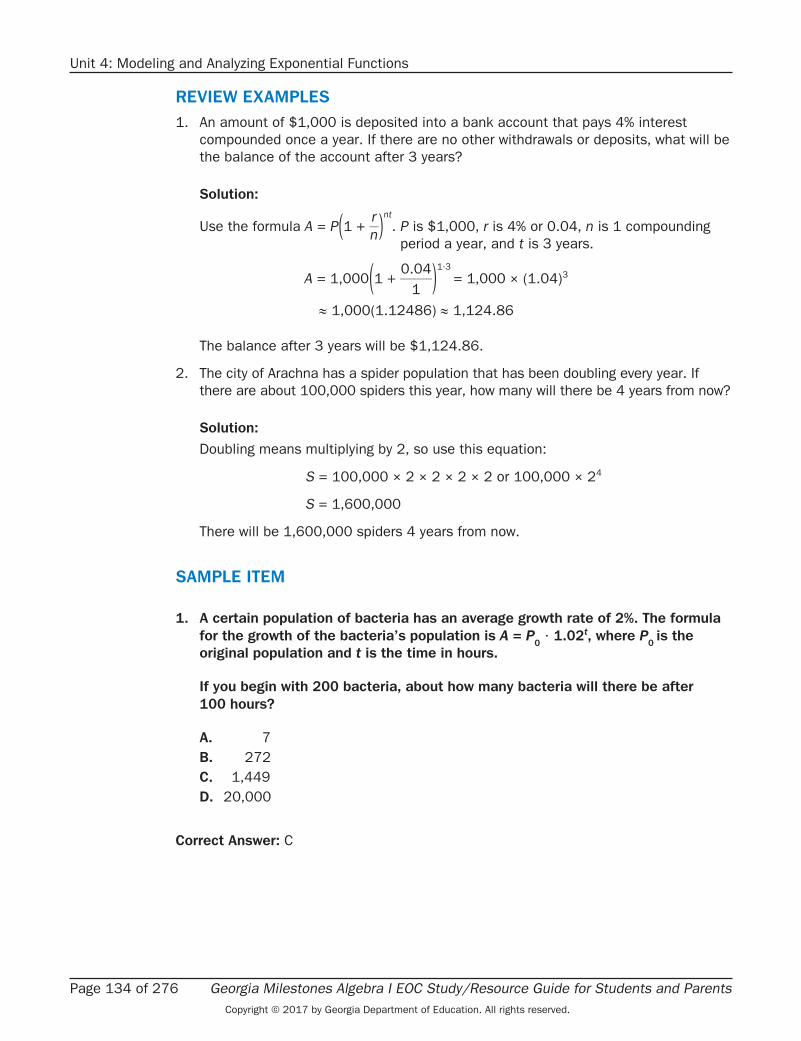
REVIEW EXAMPLES1. An amount of $1,000 is deposited into a bank account that pays 4% interest
compounded once a year. If there are no other withdrawals or deposits, what will be the balance of the account after 3 years?
Solution:
Use the formula A = P (1 + r __ n ) nt
. P is $1,000, r is 4% or 0.04, n is 1 compounding period a year, and t is 3 years.
A = 1,000 (1 + 0.04
_____ 1
) 1·3 = 1,000 × (1.04)3
≈ 1,000(1.12486) ≈ 1,124.86
The balance after 3 years will be $1,124.86.
2. The city of Arachna has a spider population that has been doubling every year. If there are about 100,000 spiders this year, how many will there be 4 years from now?
Solution: Doubling means multiplying by 2, so use this equation:
S = 100,000 × 2 × 2 × 2 × 2 or 100,000 × 24
S = 1,600,000
There will be 1,600,000 spiders 4 years from now.
SAMPLE ITEM
1 . A certain population of bacteria has an average growth rate of 2% . The formula for the growth of the bacteria’s population is A = P
0 · 1 .02t, where P
0 is the
original population and t is the time in hours .
If you begin with 200 bacteria, about how many bacteria will there be after 100 hours?
A . 7B . 272C . 1,449D . 20,000
Correct Answer: C
Georgia Milestones Algebra I EOC Study/Resource Guide for Students and Parents Page 135 of 276Copyright © 2017 by Georgia Department of Education. All rights reserved.
Unit 4: Modeling and Analyzing Exponential Functions
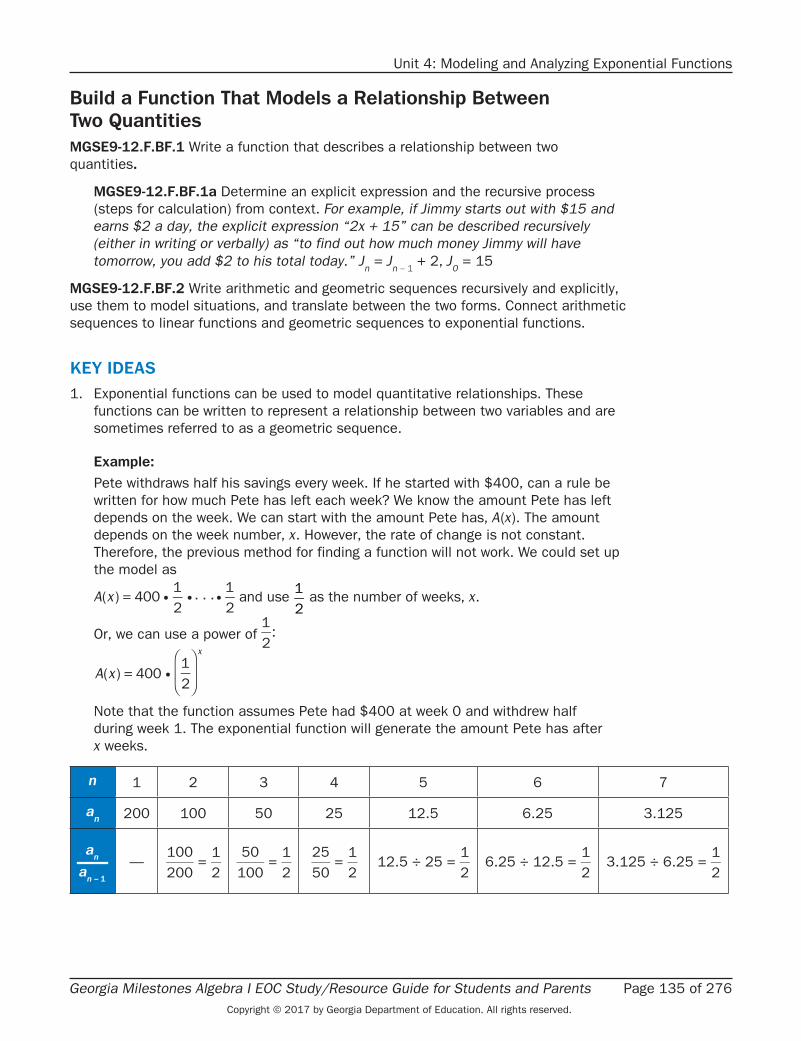
Build a Function That Models a Relationship Between Two QuantitiesMGSE9-12 .F .BF .1 Write a function that describes a relationship between two quantities .
MGSE9-12 .F .BF .1a Determine an explicit expression and the recursive process (steps for calculation) from context. For example, if Jimmy starts out with $15 and earns $2 a day, the explicit expression “2x + 15” can be described recursively (either in writing or verbally) as “to find out how much money Jimmy will have tomorrow, you add $2 to his total today.” J
n = J
n – 1 + 2, J
0 = 15
MGSE9-12 .F .BF .2 Write arithmetic and geometric sequences recursively and explicitly, use them to model situations, and translate between the two forms. Connect arithmetic sequences to linear functions and geometric sequences to exponential functions.
KEY IDEAS1. Exponential functions can be used to model quantitative relationships. These
functions can be written to represent a relationship between two variables and are sometimes referred to as a geometric sequence.
Example: Pete withdraws half his savings every week. If he started with $400, can a rule be written for how much Pete has left each week? We know the amount Pete has left depends on the week. We can start with the amount Pete has, A(x). The amount depends on the week number, x. However, the rate of change is not constant. Therefore, the previous method for finding a function will not work. We could set up the model as
· · ·A x( ) = 40012
. . . 12
and use 12
as the number of weeks, x.
Or, we can use a power of 12
:
·A x
x
( ) = 40012
Note that the function assumes Pete had $400 at week 0 and withdrew half during week 1. The exponential function will generate the amount Pete has after x weeks.
n 1 2 3 4 5 6 7
an 200 100 50 25 12.5 6.25 3.125
– 1
a
an
n
— 100
____ 200
= 1
__ 2
50 ____
100 =
1 __
2
25 ___
50 =
1 __
2 12.5 ÷ 25 =
1 __
2 6.25 ÷ 12.5 =
1 __
2 3.125 ÷ 6.25 =
1 __
2
Page 136 of 276 Georgia Milestones Algebra I EOC Study/Resource Guide for Students and ParentsCopyright © 2017 by Georgia Department of Education. All rights reserved.
Unit 4: Modeling and Analyzing Exponential Functions
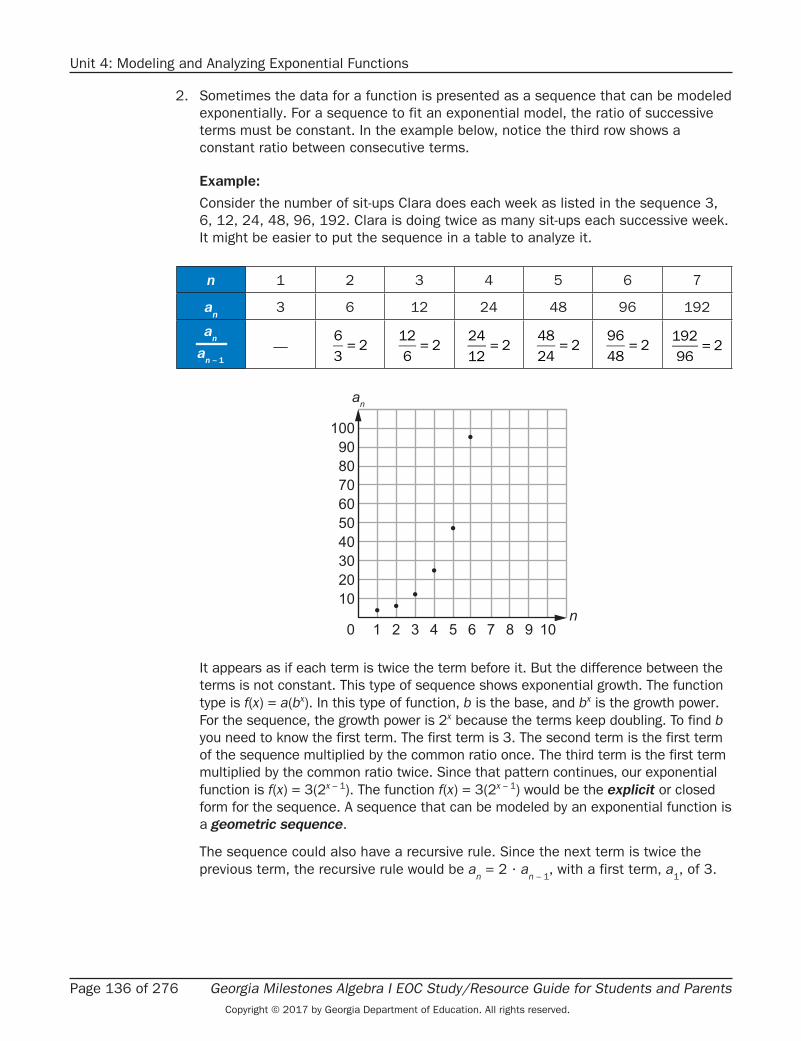
2. Sometimes the data for a function is presented as a sequence that can be modeled exponentially. For a sequence to fit an exponential model, the ratio of successive terms must be constant. In the example below, notice the third row shows a constant ratio between consecutive terms.
Example:
Consider the number of sit-ups Clara does each week as listed in the sequence 3, 6, 12, 24, 48, 96, 192. Clara is doing twice as many sit-ups each successive week. It might be easier to put the sequence in a table to analyze it.
n 1 2 3 4 5 6 7
an
3 6 12 24 48 96 192
– 1
a
an
n—
63
= 2126
= 22412
= 24824
= 29648
= 219296
= 2
an
n
100908070605040302010
0 1 2 3 4 5 6 7 8 9 10
It appears as if each term is twice the term before it. But the difference between the terms is not constant. This type of sequence shows exponential growth. The function type is f(x) = a(bx). In this type of function, b is the base, and bx is the growth power. For the sequence, the growth power is 2x because the terms keep doubling. To find b you need to know the first term. The first term is 3. The second term is the first term of the sequence multiplied by the common ratio once. The third term is the first term multiplied by the common ratio twice. Since that pattern continues, our exponential function is f(x) = 3(2x – 1). The function f(x) = 3(2x – 1) would be the explicit or closed form for the sequence. A sequence that can be modeled by an exponential function is a geometric sequence.
The sequence could also have a recursive rule. Since the next term is twice the previous term, the recursive rule would be a
n = 2 · a
n – 1, with a first term, a
1, of 3.
Georgia Milestones Algebra I EOC Study/Resource Guide for Students and Parents Page 137 of 276Copyright © 2017 by Georgia Department of Education. All rights reserved.
Unit 4: Modeling and Analyzing Exponential Functions
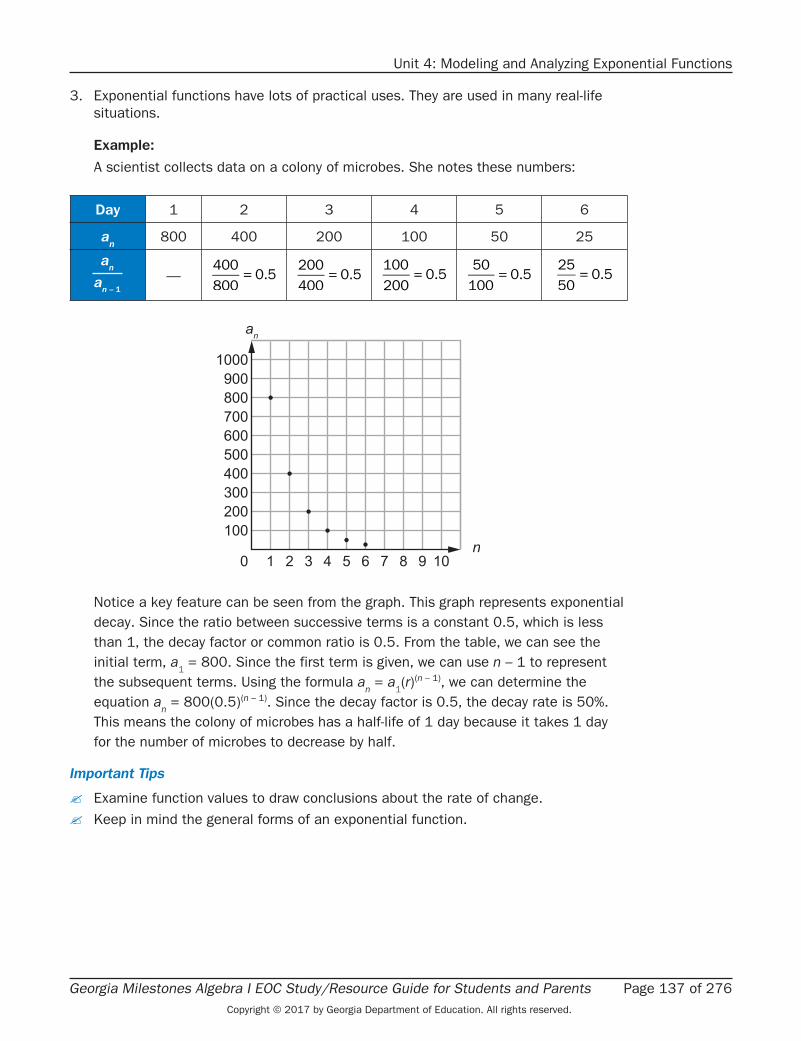
3. Exponential functions have lots of practical uses. They are used in many real-life situations.
Example:
A scientist collects data on a colony of microbes. She notes these numbers:
Day 1 2 3 4 5 6
an
800 400 200 100 50 25
– 1
a
an
n—
400800
= 0.5200400
= 0.5100200
= 0.550
100= 0.5
2550
= 0.5
an
n
1000900800700600500400300200100
0 1 2 3 4 5 6 7 8 9 10
Notice a key feature can be seen from the graph. This graph represents exponential decay. Since the ratio between successive terms is a constant 0.5, which is less than 1, the decay factor or common ratio is 0.5. From the table, we can see the initial term, a
1 = 800. Since the first term is given, we can use n – 1 to represent
the subsequent terms. Using the formula an = a
1(r)(n – 1), we can determine the
equation an = 800(0.5)(n – 1). Since the decay factor is 0.5, the decay rate is 50%.
This means the colony of microbes has a half-life of 1 day because it takes 1 day for the number of microbes to decrease by half.
Important Tips
Examine function values to draw conclusions about the rate of change. Keep in mind the general forms of an exponential function.
Page 138 of 276 Georgia Milestones Algebra I EOC Study/Resource Guide for Students and ParentsCopyright © 2017 by Georgia Department of Education. All rights reserved.
Unit 4: Modeling and Analyzing Exponential Functions
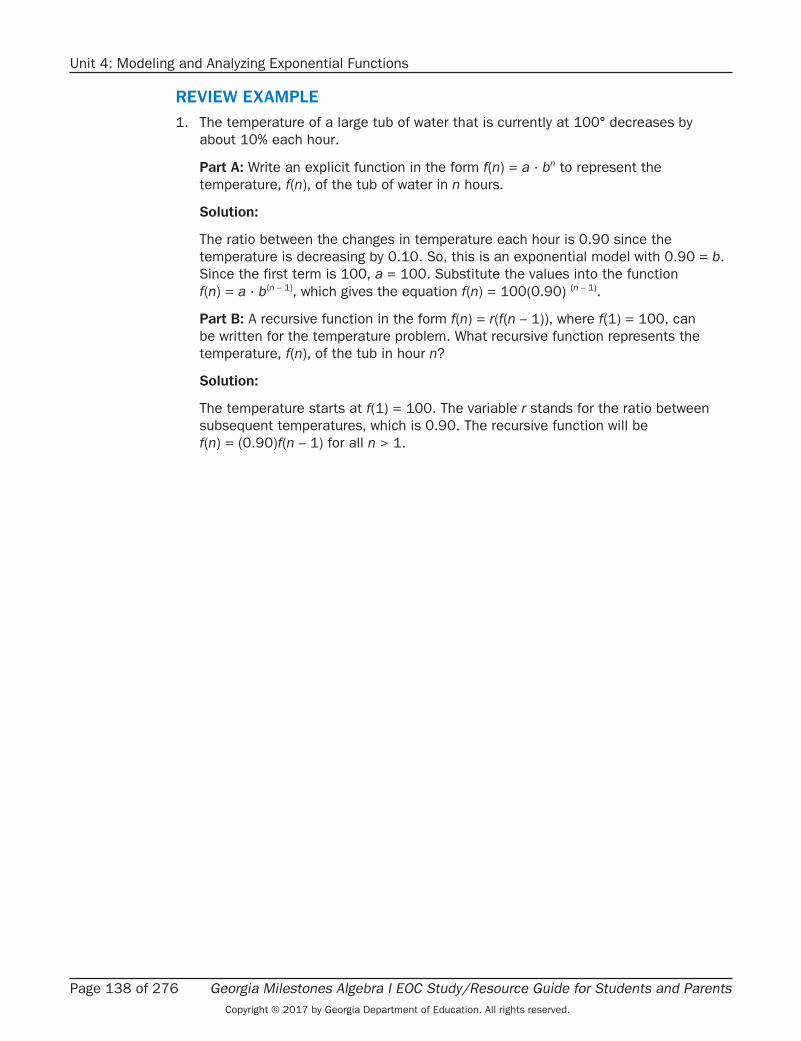
REVIEW EXAMPLE1. The temperature of a large tub of water that is currently at 100° decreases by
about 10% each hour.
Part A: Write an explicit function in the form f(n) = a · bn to represent the temperature, f(n), of the tub of water in n hours.
Solution:
The ratio between the changes in temperature each hour is 0.90 since the temperature is decreasing by 0.10. So, this is an exponential model with 0.90 = b. Since the first term is 100, a = 100. Substitute the values into the function f(n) = a · b(n – 1), which gives the equation f(n) = 100(0.90) (n – 1).
Part B: A recursive function in the form f(n) = r(f(n – 1)), where f(1) = 100, can be written for the temperature problem. What recursive function represents the temperature, f(n), of the tub in hour n?
Solution:
The temperature starts at f(1) = 100. The variable r stands for the ratio between subsequent temperatures, which is 0.90. The recursive function will be f(n) = (0.90)f(n – 1) for all n > 1.
Georgia Milestones Algebra I EOC Study/Resource Guide for Students and Parents Page 139 of 276Copyright © 2017 by Georgia Department of Education. All rights reserved.
Unit 4: Modeling and Analyzing Exponential Functions
SAMPLE ITEMS
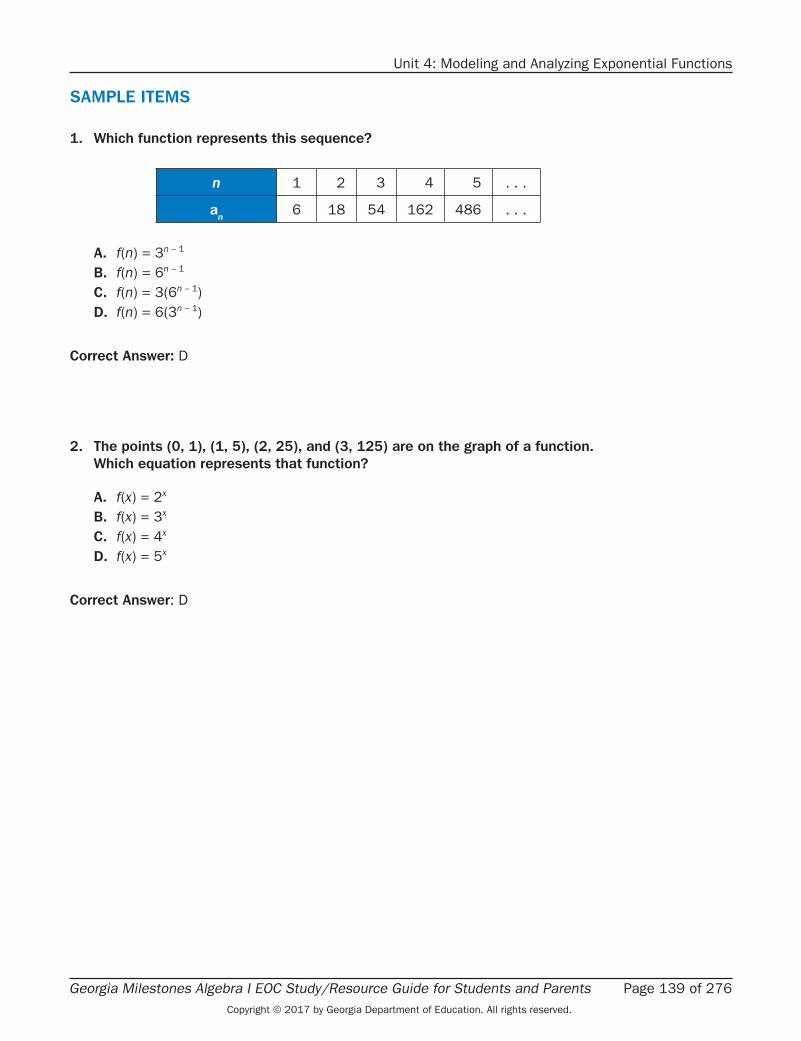
1 . Which function represents this sequence?
n 1 2 3 4 5 . . .
an
6 18 54 162 486 . . .
A . f(n) = 3n – 1
B . f(n) = 6n – 1
C . f(n) = 3(6n – 1)D . f(n) = 6(3n – 1)
Correct Answer: D
2 . The points (0, 1), (1, 5), (2, 25), and (3, 125) are on the graph of a function . Which equation represents that function?
A . f(x) = 2x
B . f(x) = 3x
C . f(x) = 4x
D . f(x) = 5x
Correct Answer: D
Page 140 of 276 Georgia Milestones Algebra I EOC Study/Resource Guide for Students and ParentsCopyright © 2017 by Georgia Department of Education. All rights reserved.
Unit 4: Modeling and Analyzing Exponential Functions
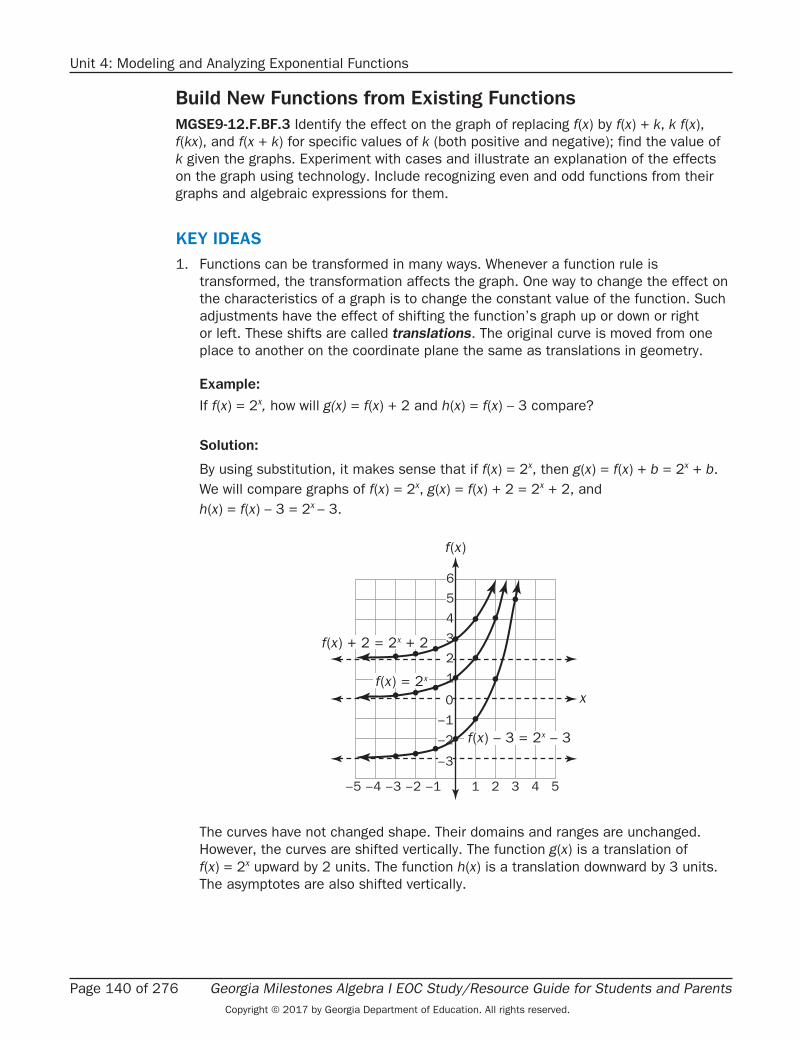
Build New Functions from Existing FunctionsMGSE9-12 .F .BF .3 Identify the effect on the graph of replacing f(x) by f(x) + k, k f(x), f(kx), and f(x + k) for specific values of k (both positive and negative); find the value of k given the graphs. Experiment with cases and illustrate an explanation of the effects on the graph using technology. Include recognizing even and odd functions from their graphs and algebraic expressions for them.
KEY IDEAS1. Functions can be transformed in many ways. Whenever a function rule is
transformed, the transformation affects the graph. One way to change the effect on the characteristics of a graph is to change the constant value of the function. Such adjustments have the effect of shifting the function’s graph up or down or right or left. These shifts are called translations. The original curve is moved from one place to another on the coordinate plane the same as translations in geometry.
Example:
If f(x) = 2x, how will g(x) = f(x) + 2 and h(x) = f(x) – 3 compare?
Solution:
By using substitution, it makes sense that if f(x) = 2x, then g(x) = f(x) + b = 2x + b. We will compare graphs of f(x) = 2x, g(x) = f(x) + 2 = 2x + 2, and h(x) = f(x) – 3 = 2x – 3.
3
4
5
6
2
1
–1
0
–3
–2
–4–5 –3 –2 –1 321 4 5
f(x)
x
f(x) + 2 = 2x + 2
f(x) – 3 = 2x – 3
f(x) = 2x
The curves have not changed shape. Their domains and ranges are unchanged. However, the curves are shifted vertically. The function g(x) is a translation of f(x) = 2x upward by 2 units. The function h(x) is a translation downward by 3 units. The asymptotes are also shifted vertically.
Georgia Milestones Algebra I EOC Study/Resource Guide for Students and Parents Page 141 of 276Copyright © 2017 by Georgia Department of Education. All rights reserved.
Unit 4: Modeling and Analyzing Exponential Functions
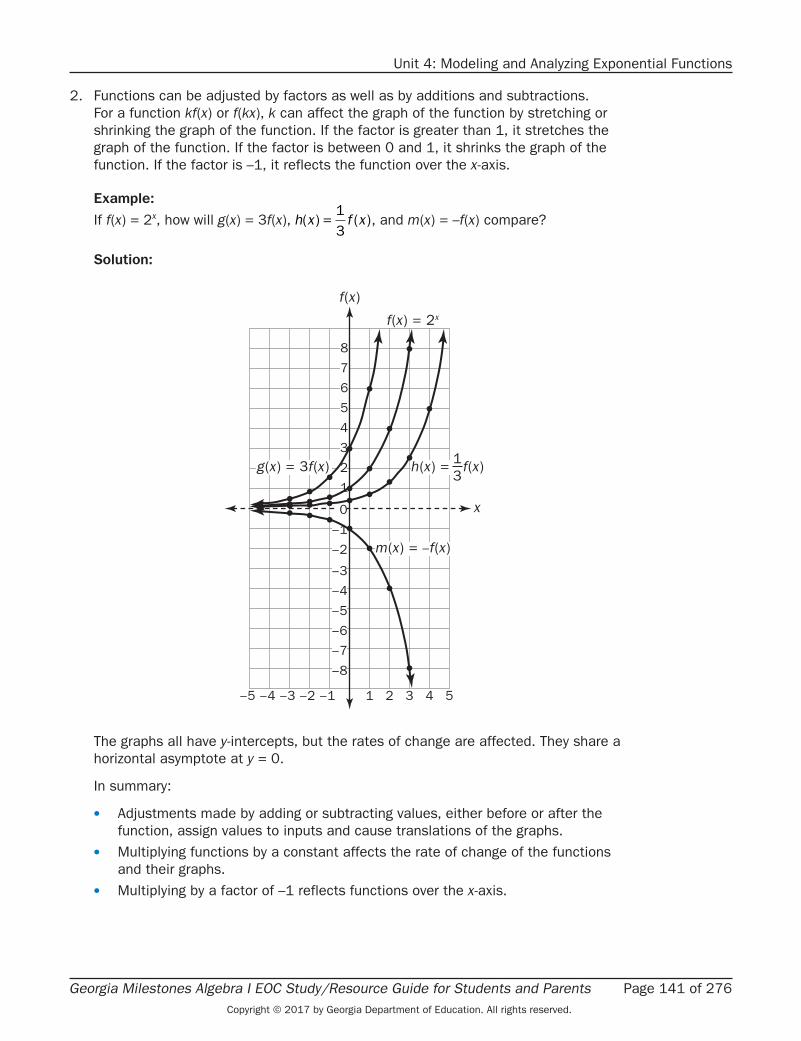
2. Functions can be adjusted by factors as well as by additions and subtractions. For a function kf(x) or f(kx), k can affect the graph of the function by stretching or shrinking the graph of the function. If the factor is greater than 1, it stretches the graph of the function. If the factor is between 0 and 1, it shrinks the graph of the function. If the factor is –1, it reflects the function over the x-axis.
Example:
If f(x) = 2x, how will g(x) = 3f(x), h x f x( ) =13
( ), and m(x) = –f(x) compare?
Solution:
3
4
5
6
7
8
2
1
–1
0
–3
–4
–5
–6
–8
–7
–2
–4–5 –3 –2 –1 321 4 5
f(x)
x
f(x) = 2x
g(x) = 3f(x)
m(x) = –f(x)
h(x) = f(x)13
The graphs all have y-intercepts, but the rates of change are affected. They share a horizontal asymptote at y = 0.
In summary:
• Adjustments made by adding or subtracting values, either before or after the function, assign values to inputs and cause translations of the graphs.
• Multiplying functions by a constant affects the rate of change of the functions and their graphs.
• Multiplying by a factor of –1 reflects functions over the x-axis.
Page 142 of 276 Georgia Milestones Algebra I EOC Study/Resource Guide for Students and ParentsCopyright © 2017 by Georgia Department of Education. All rights reserved.
Unit 4: Modeling and Analyzing Exponential Functions
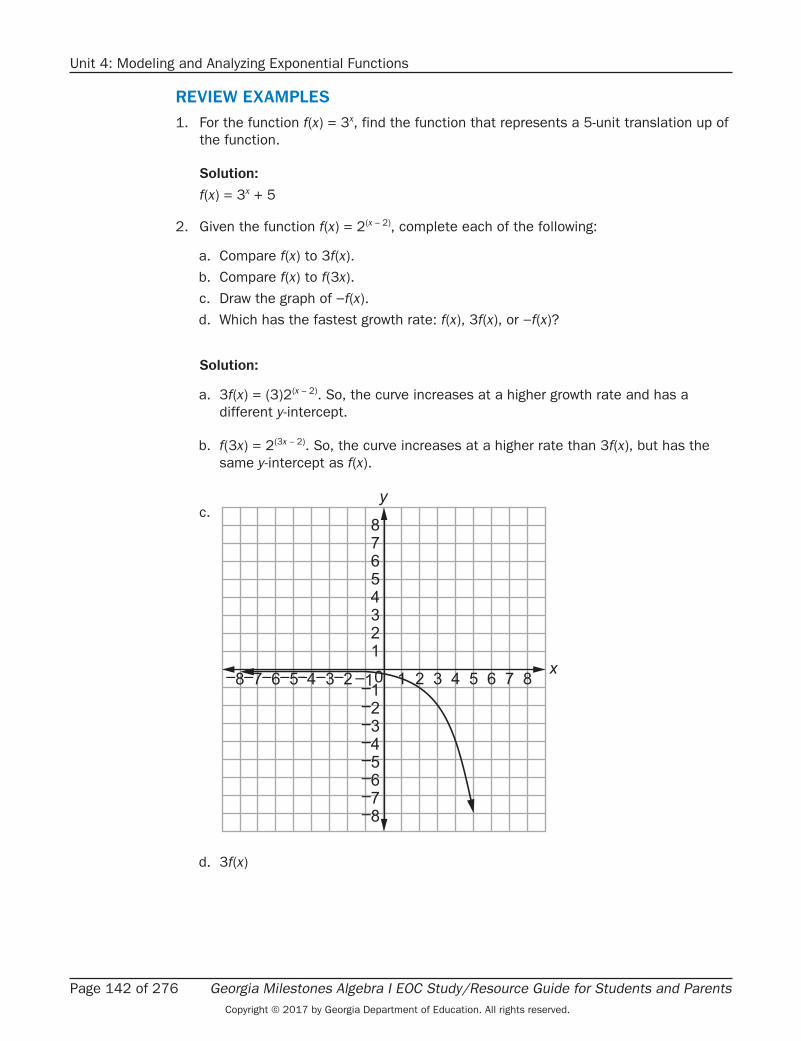
REVIEW EXAMPLES1. For the function f(x) = 3x, find the function that represents a 5-unit translation up of
the function.
Solution:
f(x) = 3x + 5
2. Given the function f(x) = 2(x – 2), complete each of the following:
a. Compare f(x) to 3f(x).b. Compare f(x) to f(3x).c. Draw the graph of −f(x).d. Which has the fastest growth rate: f(x), 3f(x), or −f(x)?
Solution:
a. 3f(x) = (3)2(x – 2). So, the curve increases at a higher growth rate and has a different y-intercept.
b. f(3x) = 2(3x – 2). So, the curve increases at a higher rate than 3f(x), but has the same y-intercept as f(x).
c.
0
87654321
21 3 4 5 6 87 x–1–2–3–4–5–6–7–8
–1–2–3–5–8–7 –4–6
y
d. 3f(x)
Georgia Milestones Algebra I EOC Study/Resource Guide for Students and Parents Page 143 of 276Copyright © 2017 by Georgia Department of Education. All rights reserved.
Unit 4: Modeling and Analyzing Exponential Functions
SAMPLE ITEMS
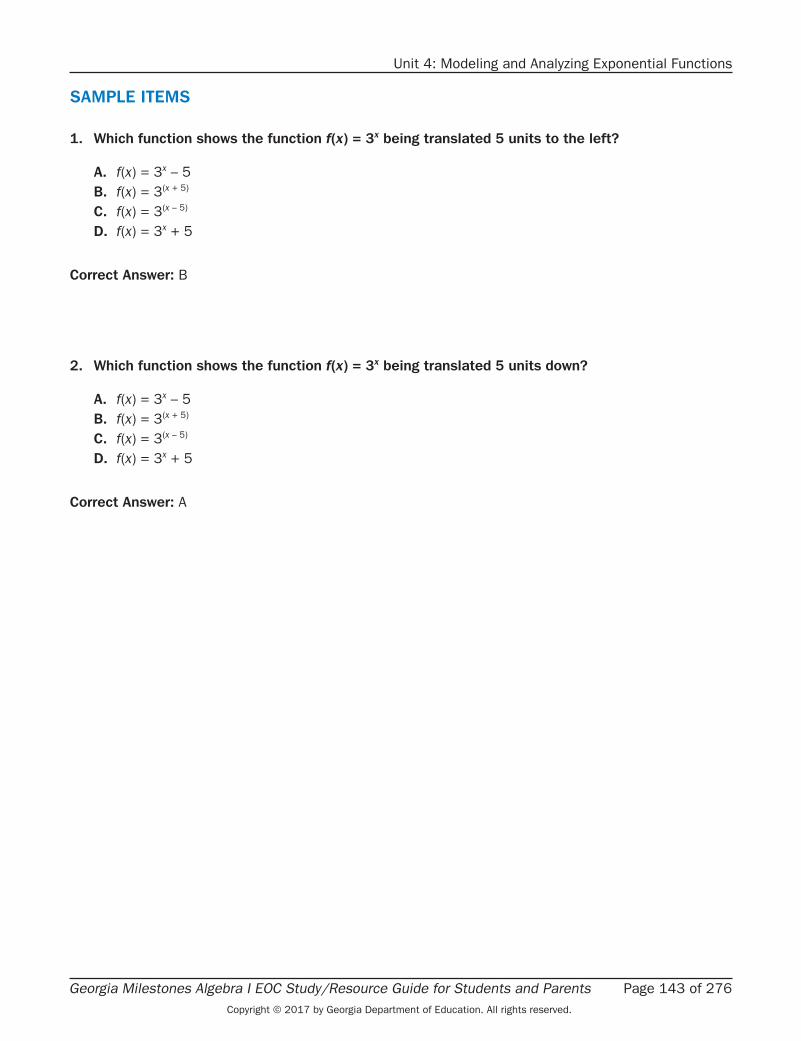
1 . Which function shows the function f(x) = 3x being translated 5 units to the left?
A . f(x) = 3x – 5B . f(x) = 3(x + 5)
C . f(x) = 3(x – 5)
D . f(x) = 3x + 5
Correct Answer: B
2 . Which function shows the function f(x) = 3x being translated 5 units down?
A . f(x) = 3x – 5B . f(x) = 3(x + 5)
C . f(x) = 3(x – 5)
D . f(x) = 3x + 5
Correct Answer: A

Page 144 of 276 Georgia Milestones Algebra I EOC Study/Resource Guide for Students and ParentsCopyright © 2017 by Georgia Department of Education. All rights reserved.
Unit 4: Modeling and Analyzing Exponential Functions
Understand the Concept of a Function and Use Function NotationMGSE9-12 .F .IF .1 Understand that a function from one set (the input, called the domain) to another set (the output, called the range) assigns to each element of the domain exactly one element of the range, i.e. each input value maps to exactly one output value. If f is a function, x is the input (an element of its domain), and f(x) is the output (an element of the range). Graphically, the graph is y = f(x).
MGSE9-12 .F .IF .2 Use function notation, evaluate functions for inputs in their domains, and interpret statements that use function notation in terms of a context.
MGSE9-12 .F .IF .3 Recognize that sequences are functions, sometimes defined recursively, whose domain is a subset of the integers. (Generally, the scope of high school math defines this subset as the set of natural numbers 1, 2, 3, 4, …) By graphing or calculating terms, students should be able to show how the recursive sequence a
1 = 2, a
n = 3 (an – 1) ; the sequence a
n = 2 (an – 1) ; and the function
f(x) = 2(3)(x – 1) (when x is a natural number) all define the same sequence.
KEY IDEAS1. There are many ways to show how pairs of quantities are related. Some of them are
shown below. • Mapping Diagrams
III
1
2
3
1
3
5
II
1
2
3
1
3
5
I
1
2
3
1234
• Sets of Ordered PairsSet I: {(1, 1), (1, 2), (2, 4), (3, 3)}
Set II: {(1, 1), (1, 5), (2, 3), (3, 3)}
Set III: {(1, 1), (2, 3), (3, 5)}
• Tables of Values
I II III
x y
1 1
1 2
2 4
3 3
x y
1 1
1 5
2 3
3 3
x y
1 1
2 3
3 5

Georgia Milestones Algebra I EOC Study/Resource Guide for Students and Parents Page 145 of 276Copyright © 2017 by Georgia Department of Education. All rights reserved.
Unit 4: Modeling and Analyzing Exponential Functions
The relationship shown in Mapping Diagram I, Set I, and Table I all represent the same paired numbers. Likewise, Mapping Diagram II, Set II, and Table II all represent the same quantities. The same goes for the third group of displays.
Notice the arrows in the mapping diagrams are all arranged from left to right. The numbers on the left side of the mapping diagrams are the same as the x-coordinates in the ordered pairs as well as the values in the first column of the tables. Those numbers are called the input values of a quantitative relationship and are known as the domain. The numbers on the right of the mapping diagrams, the y-coordinates in the ordered pairs, and the values in the second column of the table are the output, or range. Every number in the domain is assigned to at least one number of the range.
Mapping diagrams, ordered pairs, and tables of values are good to use when there are a limited number of input and output values. There are some instances when the domain has an infinite number of elements to be assigned. In those cases, it is better to use either an algebraic rule or a graph to show how pairs of values are related. Often we use equations as the algebraic rules for the relationships. The domain can be represented by the independent variable and the range can be represented by the dependent variable.
2. A function is a quantitative relationship where each member of the domain is assigned to exactly one member of the range. Of the relationships on the previous page, only III is a function. In I and II, there were members of the domain that were assigned to two elements of the range. In particular, in I, the value 1 of the domain was paired with 1 and 2 of the range. The relationship is a function if two values in the domain are related to the same value in the range.Consider the vertical line x = 2. Every point on the line has the same x-value and a different y-value. So the value of the domain is paired with infinitely many values of the range. This line is not a function. In fact, all vertical lines are not functions.
2
4
6
8
–2–2–4–6
–4–6
2 4 60 x–8
–8
8
y
Page 146 of 276 Georgia Milestones Algebra I EOC Study/Resource Guide for Students and ParentsCopyright © 2017 by Georgia Department of Education. All rights reserved.
Unit 4: Modeling and Analyzing Exponential Functions
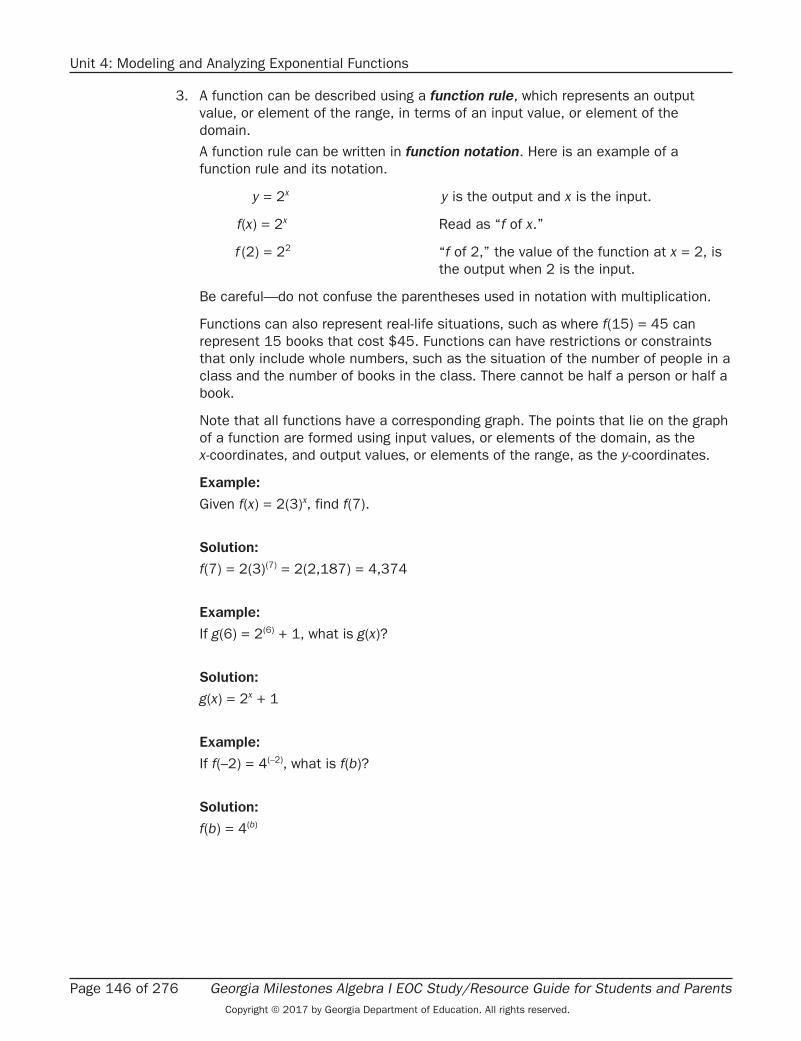
3. A function can be described using a function rule, which represents an output value, or element of the range, in terms of an input value, or element of the domain.A function rule can be written in function notation. Here is an example of a function rule and its notation.
y = 2x y is the output and x is the input.
f(x) = 2x Read as “f of x.”
f (2) = 22 “f of 2,” the value of the function at x = 2, is the output when 2 is the input.
Be careful—do not confuse the parentheses used in notation with multiplication.
Functions can also represent real-life situations, such as where f(15) = 45 can represent 15 books that cost $45. Functions can have restrictions or constraints that only include whole numbers, such as the situation of the number of people in a class and the number of books in the class. There cannot be half a person or half a book.
Note that all functions have a corresponding graph. The points that lie on the graph of a function are formed using input values, or elements of the domain, as the x-coordinates, and output values, or elements of the range, as the y-coordinates.
Example:
Given f(x) = 2(3)x, find f(7).
Solution:
f(7) = 2(3)(7) = 2(2,187) = 4,374
Example:
If g(6) = 2(6) + 1, what is g(x)?
Solution:
g(x) = 2x + 1
Example:
If f(–2) = 4(–2), what is f(b)?
Solution:
f(b) = 4(b)

Georgia Milestones Algebra I EOC Study/Resource Guide for Students and Parents Page 147 of 276Copyright © 2017 by Georgia Department of Education. All rights reserved.
Unit 4: Modeling and Analyzing Exponential Functions
Example:
Graph f(x) = 4(x) – 5.
Solution:
In the function rule f(x) = 4(x) – 5, f(x) is the same as y.
Then we can make a table of x (input) and y (output) values.
x f(x)
0 –4
0.5 –3
1 –1
2 11
The values in the rows of the table form ordered pairs. We plot those ordered pairs. If the domain is not specified, we connect the points. If the numbers in the domain are not specified, we assume that they are all real numbers. If the domain is specified, such as whole numbers only, then connecting the points is not needed.
0 5
5
x–5
–5
y
10
4. A sequence is an ordered list of numbers. Each number in the sequence is called a term. The terms are consecutive or are identified as the first term, second term, third term, and so on. The pattern in the sequence is revealed in the relationship between each term and its term number or in a term’s relationship to the previous term in the sequence.
Page 148 of 276 Georgia Milestones Algebra I EOC Study/Resource Guide for Students and ParentsCopyright © 2017 by Georgia Department of Education. All rights reserved.
Unit 4: Modeling and Analyzing Exponential Functions
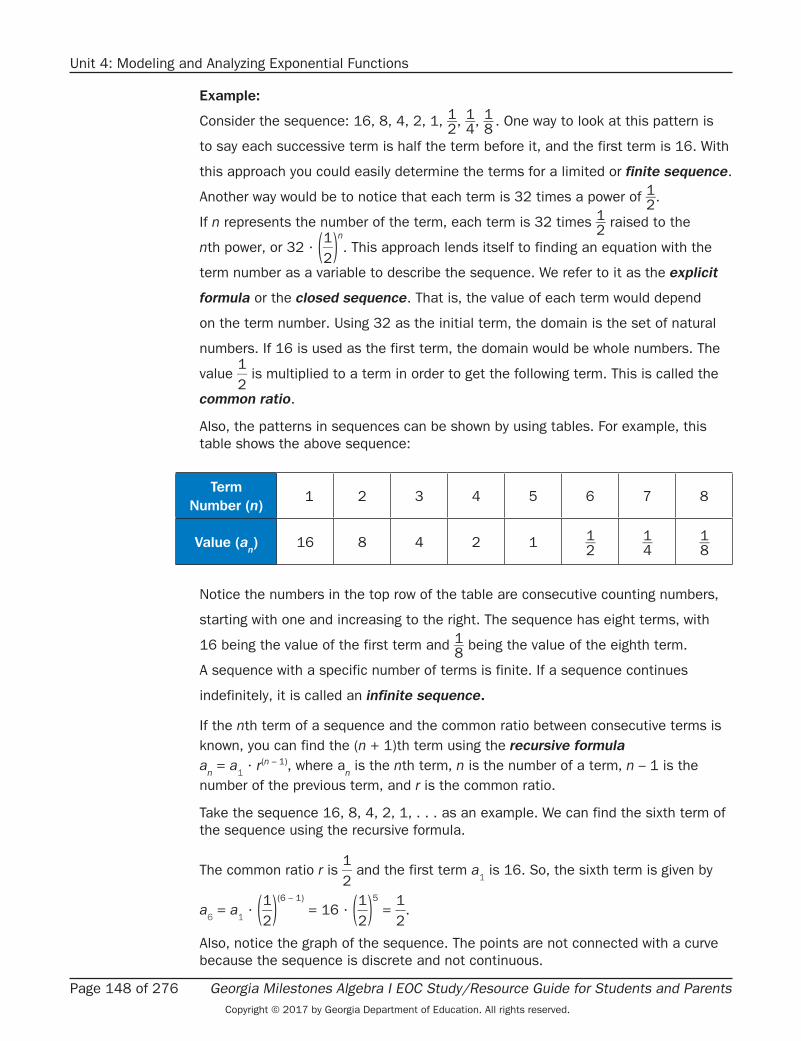
Example:
Consider the sequence: 16, 8, 4, 2, 1, 1 __ 2 , 1 __ 4 , 1 __ 8 . One way to look at this pattern is
to say each successive term is half the term before it, and the first term is 16. With
this approach you could easily determine the terms for a limited or finite sequence.
Another way would be to notice that each term is 32 times a power of 1 __ 2 .
If n represents the number of the term, each term is 32 times 1 __ 2 raised to the
nth power, or 32 · ( 1 __ 2
) n. This approach lends itself to finding an equation with the
term number as a variable to describe the sequence. We refer to it as the explicit
formula or the closed sequence. That is, the value of each term would depend
on the term number. Using 32 as the initial term, the domain is the set of natural
numbers. If 16 is used as the first term, the domain would be whole numbers. The
value 1
__ 2
is multiplied to a term in order to get the following term. This is called the
common ratio.
Also, the patterns in sequences can be shown by using tables. For example, this table shows the above sequence:
Term Number (n)
1 2 3 4 5 6 7 8
Value (an) 16 8 4 2 1 1 __ 2 1 __ 4 1 __ 8
Notice the numbers in the top row of the table are consecutive counting numbers,
starting with one and increasing to the right. The sequence has eight terms, with
16 being the value of the first term and 1 __ 8 being the value of the eighth term.
A sequence with a specific number of terms is finite. If a sequence continues
indefinitely, it is called an infinite sequence .
If the nth term of a sequence and the common ratio between consecutive terms is known, you can find the (n + 1)th term using the recursive formula a
n = a
1 · r(n – 1), where a
n is the nth term, n is the number of a term, n – 1 is the
number of the previous term, and r is the common ratio.
Take the sequence 16, 8, 4, 2, 1, . . . as an example. We can find the sixth term of the sequence using the recursive formula.
The common ratio r is 1
__ 2
and the first term a1 is 16. So, the sixth term is given by
a6 = a
1 · ( 1 __
2 ) (6 – 1)
= 16 · ( 1 __ 2
) 5 = 1
__ 2
.
Also, notice the graph of the sequence. The points are not connected with a curve because the sequence is discrete and not continuous.
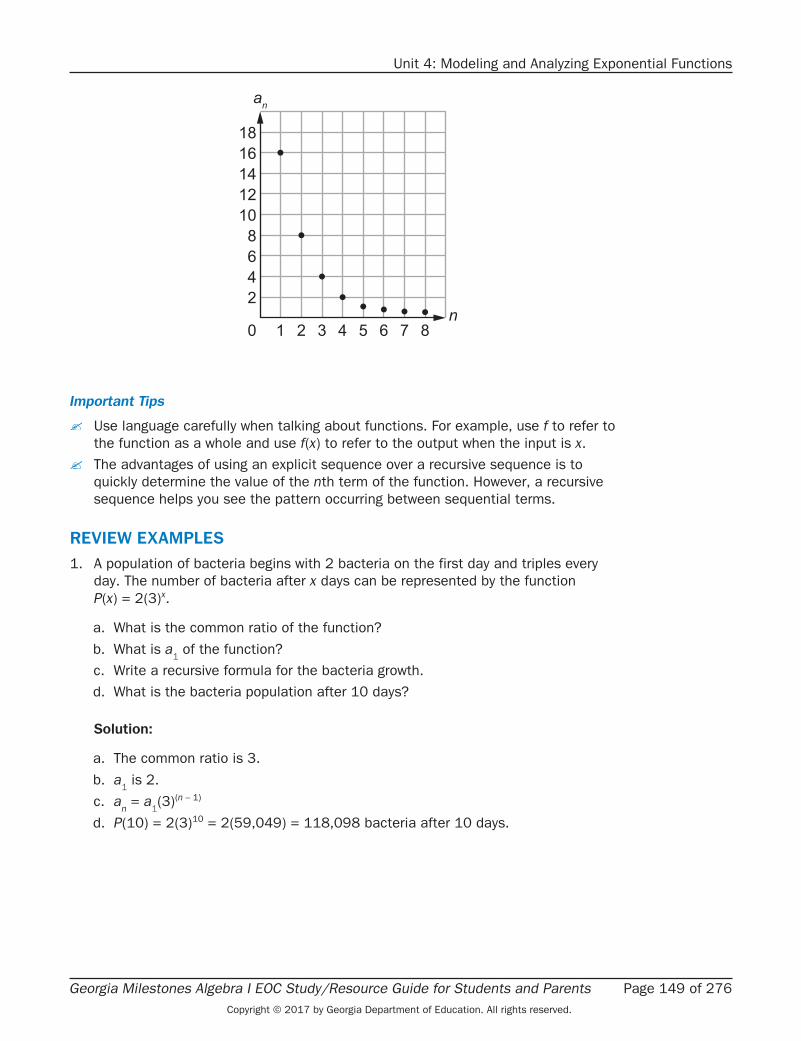
Georgia Milestones Algebra I EOC Study/Resource Guide for Students and Parents Page 149 of 276Copyright © 2017 by Georgia Department of Education. All rights reserved.
Unit 4: Modeling and Analyzing Exponential Functions
an
n
18161412108642
0 1 2 3 4 5 6 7 8
Important Tips
Use language carefully when talking about functions. For example, use f to refer to the function as a whole and use f(x) to refer to the output when the input is x.
The advantages of using an explicit sequence over a recursive sequence is to quickly determine the value of the nth term of the function. However, a recursive sequence helps you see the pattern occurring between sequential terms.
REVIEW EXAMPLES1. A population of bacteria begins with 2 bacteria on the first day and triples every
day. The number of bacteria after x days can be represented by the function P(x) = 2(3)x.
a. What is the common ratio of the function?
b. What is a1 of the function?
c. Write a recursive formula for the bacteria growth.d. What is the bacteria population after 10 days?
Solution:
a. The common ratio is 3.
b. a1 is 2.
c. an = a
1(3)(n – 1)
d. P(10) = 2(3)10 = 2(59,049) = 118,098 bacteria after 10 days.
Page 150 of 276 Georgia Milestones Algebra I EOC Study/Resource Guide for Students and ParentsCopyright © 2017 by Georgia Department of Education. All rights reserved.
Unit 4: Modeling and Analyzing Exponential Functions
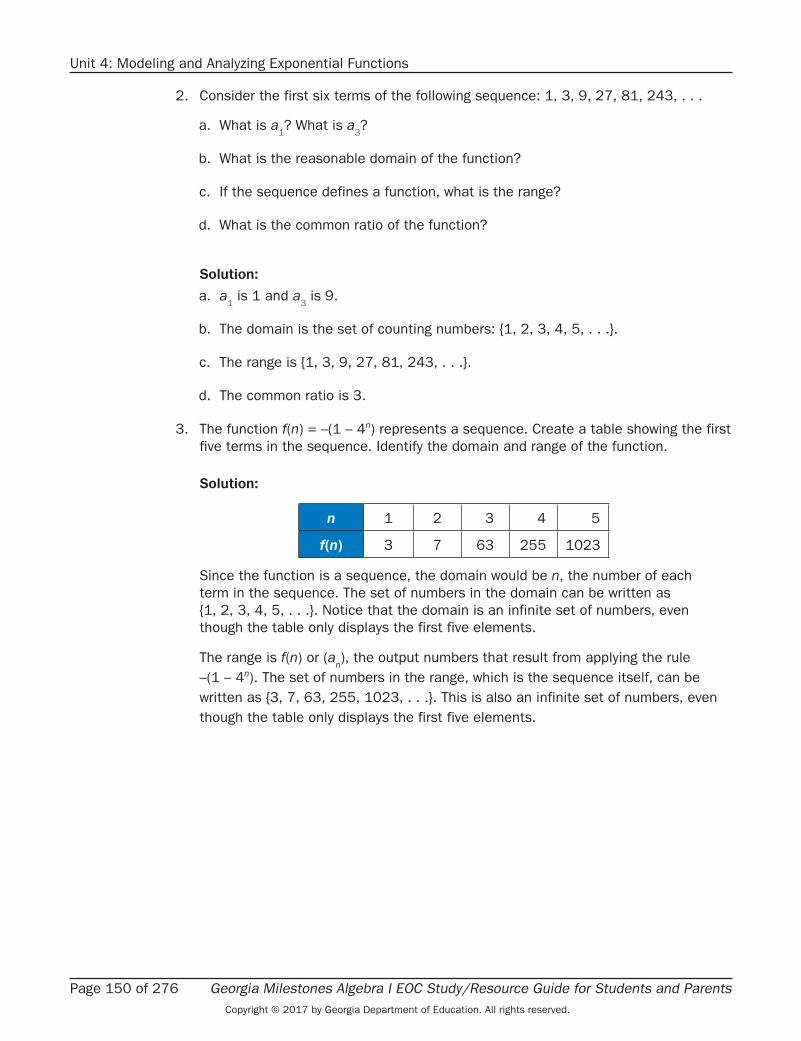
2. Consider the first six terms of the following sequence: 1, 3, 9, 27, 81, 243, . . .
a. What is a1? What is a
3?
b. What is the reasonable domain of the function?
c. If the sequence defines a function, what is the range?
d. What is the common ratio of the function?
Solution:
a. a1 is 1 and a
3 is 9.
b. The domain is the set of counting numbers: {1, 2, 3, 4, 5, . . .}.
c. The range is {1, 3, 9, 27, 81, 243, . . .}.
d. The common ratio is 3.
3. The function f(n) = –(1 – 4n) represents a sequence. Create a table showing the first five terms in the sequence. Identify the domain and range of the function.
Solution:
n 1 2 3 4 5
f(n) 3 7 63 255 1023
Since the function is a sequence, the domain would be n, the number of each term in the sequence. The set of numbers in the domain can be written as {1, 2, 3, 4, 5, . . .}. Notice that the domain is an infinite set of numbers, even though the table only displays the first five elements.
The range is f(n) or (an), the output numbers that result from applying the rule
–(1 – 4n). The set of numbers in the range, which is the sequence itself, can be written as {3, 7, 63, 255, 1023, . . .}. This is also an infinite set of numbers, even though the table only displays the first five elements.
Georgia Milestones Algebra I EOC Study/Resource Guide for Students and Parents Page 151 of 276Copyright © 2017 by Georgia Department of Education. All rights reserved.
Unit 4: Modeling and Analyzing Exponential Functions
SAMPLE ITEMS
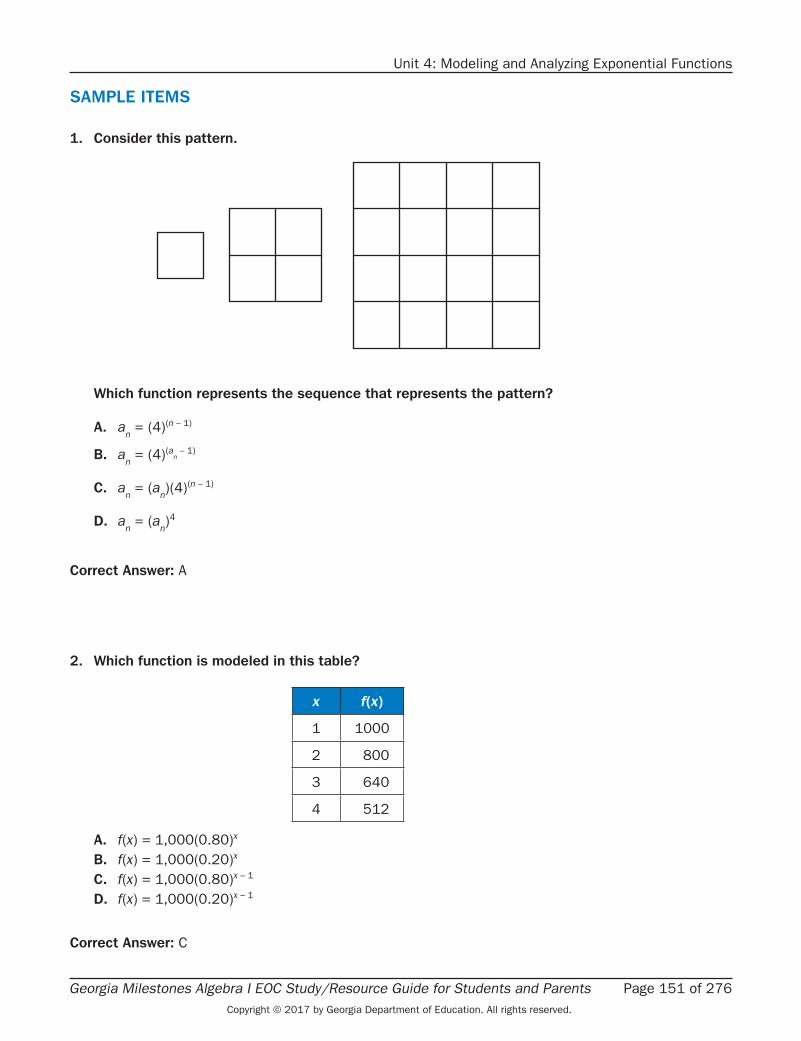
1 . Consider this pattern .
Which function represents the sequence that represents the pattern?
A . an = (4)(n – 1)
B . an = (4)(a
n – 1)
C . an = (a
n)(4)(n – 1)
D . an = (a
n)4
Correct Answer: A
2 . Which function is modeled in this table?
x f(x)
1 1000
2 800
3 640
4 512
A . f(x) = 1,000(0.80)x
B . f(x) = 1,000(0.20)x
C . f(x) = 1,000(0.80)x – 1
D . f(x) = 1,000(0.20)x – 1
Correct Answer: C
Page 152 of 276 Georgia Milestones Algebra I EOC Study/Resource Guide for Students and ParentsCopyright © 2017 by Georgia Department of Education. All rights reserved.
Unit 4: Modeling and Analyzing Exponential Functions
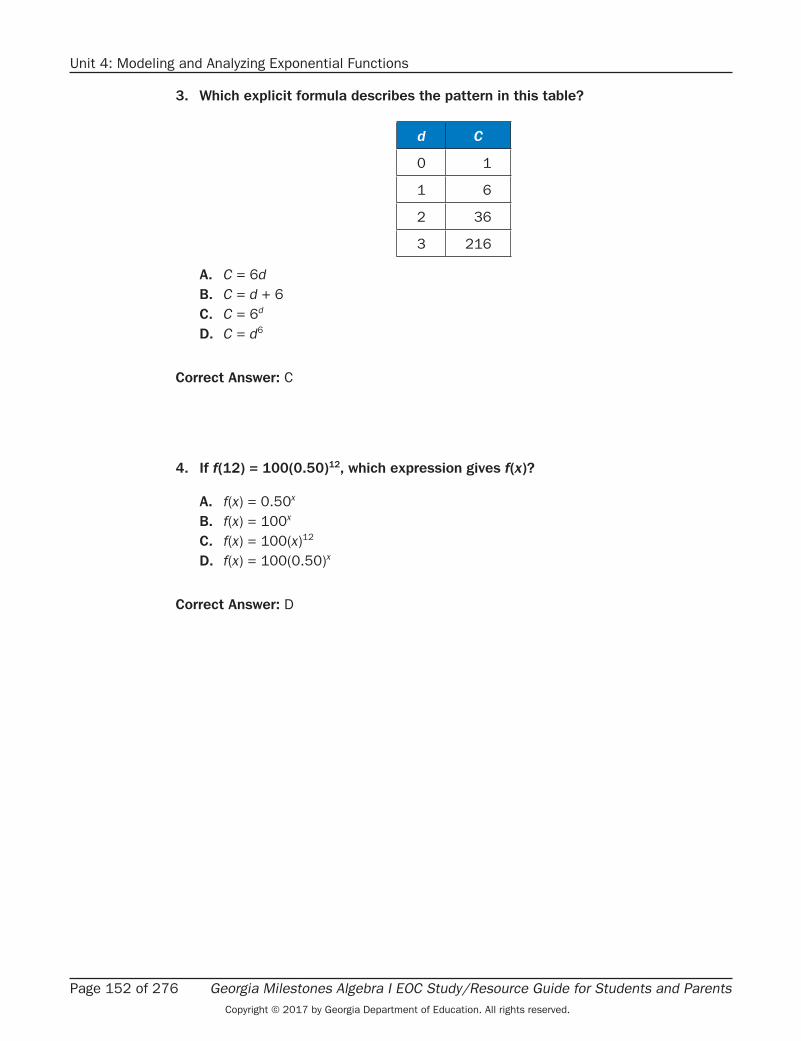
3 . Which explicit formula describes the pattern in this table?
d C
0 1
1 6
2 36
3 216
A . C = 6dB . C = d + 6C . C = 6d
D . C = d6
Correct Answer: C
4 . If f(12) = 100(0 .50)12, which expression gives f(x)?
A . f(x) = 0.50x
B . f(x) = 100x
C . f(x) = 100(x)12
D . f(x) = 100(0.50)x
Correct Answer: D
Georgia Milestones Algebra I EOC Study/Resource Guide for Students and Parents Page 153 of 276Copyright © 2017 by Georgia Department of Education. All rights reserved.
Unit 4: Modeling and Analyzing Exponential Functions
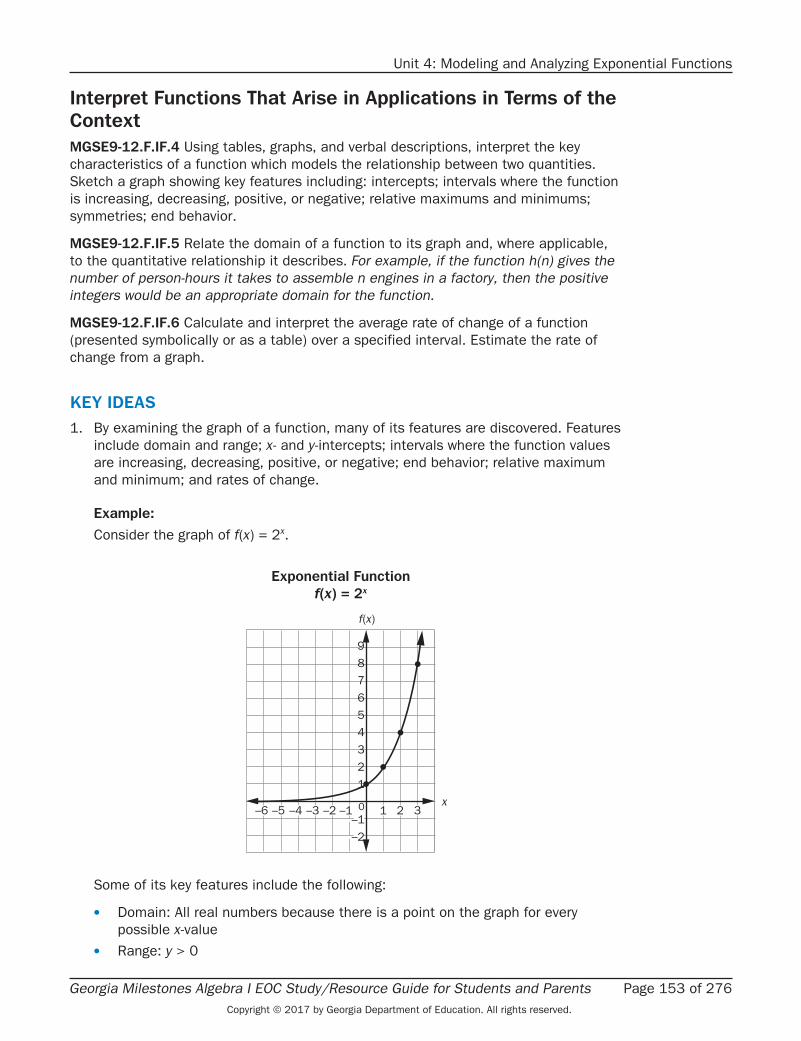
Interpret Functions That Arise in Applications in Terms of the ContextMGSE9-12 .F .IF .4 Using tables, graphs, and verbal descriptions, interpret the key characteristics of a function which models the relationship between two quantities. Sketch a graph showing key features including: intercepts; intervals where the function is increasing, decreasing, positive, or negative; relative maximums and minimums; symmetries; end behavior.
MGSE9-12 .F .IF .5 Relate the domain of a function to its graph and, where applicable, to the quantitative relationship it describes. For example, if the function h(n) gives the number of person-hours it takes to assemble n engines in a factory, then the positive integers would be an appropriate domain for the function.
MGSE9-12 .F .IF .6 Calculate and interpret the average rate of change of a function (presented symbolically or as a table) over a specified interval. Estimate the rate of change from a graph.
KEY IDEAS1. By examining the graph of a function, many of its features are discovered. Features
include domain and range; x- and y-intercepts; intervals where the function values are increasing, decreasing, positive, or negative; end behavior; relative maximum and minimum; and rates of change.
Example:
Consider the graph of f(x) = 2x.
x
f(x)
Exponential Functionf(x) = 2x
–6 –5 –4 –3 –2 –1 1 2 3
987654321
0–1–2
Some of its key features include the following:
• Domain: All real numbers because there is a point on the graph for every possible x-value
• Range: y > 0
Page 154 of 276 Georgia Milestones Algebra I EOC Study/Resource Guide for Students and ParentsCopyright © 2017 by Georgia Department of Education. All rights reserved.
Unit 4: Modeling and Analyzing Exponential Functions
• x-intercept: None • y-intercept: It appears to intersect the y-axis at 1. • Increasing: Always • Decreasing: Never • Positive: f(x) is positive for all x-values. • Negative: f(x) is never negative. • Rate of change: There is a variable rate of change, as the graph represents a
curve. The rate of change for the interval 1 ≤ x ≤ 2 is approximately 2 but is only 1 for 0 ≤ x ≤ 1.
• Asymptote: y = 0
2. Other features of functions can be discovered through examining their tables of values. The intercepts may appear in a table of values. From the differences of f(x)-values over various intervals, we can tell if a function grows at a constant rate of change. Some intervals could have a different rate of change than other intervals.
Important Tips
You could begin exploration of a new function by generating a table of values using a variety of numbers from the domain. Decide, based on the context, what kinds of numbers can be in the domain, and make sure to choose negative numbers or numbers expressed as fractions or decimals if such numbers are included in the domain.
You cannot always find exact values from a graph. Always check your answers using the equation.
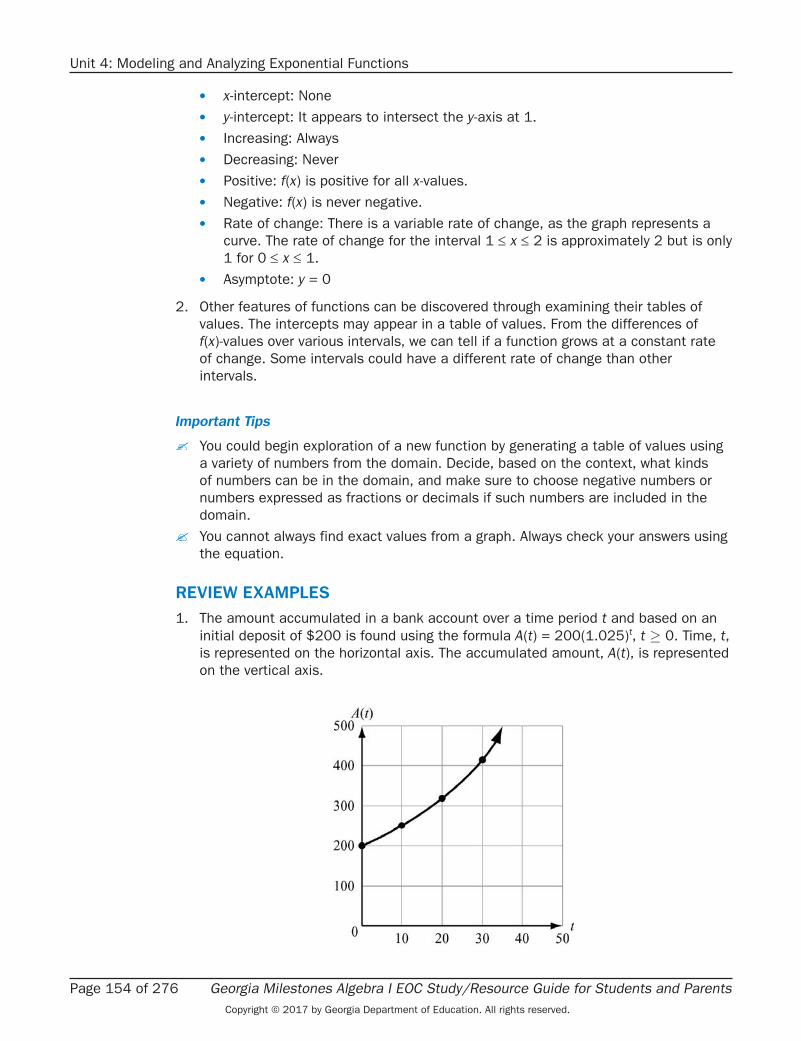
REVIEW EXAMPLES1. The amount accumulated in a bank account over a time period t and based on an
initial deposit of $200 is found using the formula A(t) = 200(1.025)t, t ≥ 0. Time, t, is represented on the horizontal axis. The accumulated amount, A(t), is represented on the vertical axis.

Georgia Milestones Algebra I EOC Study/Resource Guide for Students and Parents Page 155 of 276Copyright © 2017 by Georgia Department of Education. All rights reserved.
Unit 4: Modeling and Analyzing Exponential Functions
a. What are the intercepts of the function? b. What is the domain of the function? c. Why are all the t-values non-negative?d. What is the range of the function?
Solution:
a. There is no t-intercept because the bank account was never lower than $200. The function crosses the vertical axis at 200.
b. The domain is t ≥ 0. c. The t-values are all non-negative because they represent time, and time cannot
be negative.d. The range is A(t) ≥ 200.
2. Consider two exponential functions, f(x) = 3x and g(x) = x1
3 . Compare the key
features of the two functions.
Solution:
Both have the same domain (all real numbers), range ({y| y > 0}), and y-intercept
(0, 1). The function f(x) = 3x is an exponential growth function, while the function
g(x) = x1
3 is an exponential decay function.
6
7
8
9
5
4
2
3
0
1
–4–5 –3 –2 –1–1
321 4 5
y
x

Page 156 of 276 Georgia Milestones Algebra I EOC Study/Resource Guide for Students and ParentsCopyright © 2017 by Georgia Department of Education. All rights reserved.
Unit 4: Modeling and Analyzing Exponential Functions
SAMPLE ITEMS
1 . A population of squirrels doubles every year . Initially, there were 5 squirrels . A biologist studying the squirrels created a function to model their population growth: P(t) = 5(2t), where t is the time in years . The graph of the function is shown .
100
80
60
40
20
2.5–2.5 0–5–7.5 5 7.5
P(t)
t
What is the range of the function?
A . any real numberB . any whole number greater than 0C . any whole number greater than 5D . any whole number greater than or equal to 5
Correct Answer: D
Georgia Milestones Algebra I EOC Study/Resource Guide for Students and Parents Page 157 of 276Copyright © 2017 by Georgia Department of Education. All rights reserved.
Unit 4: Modeling and Analyzing Exponential Functions
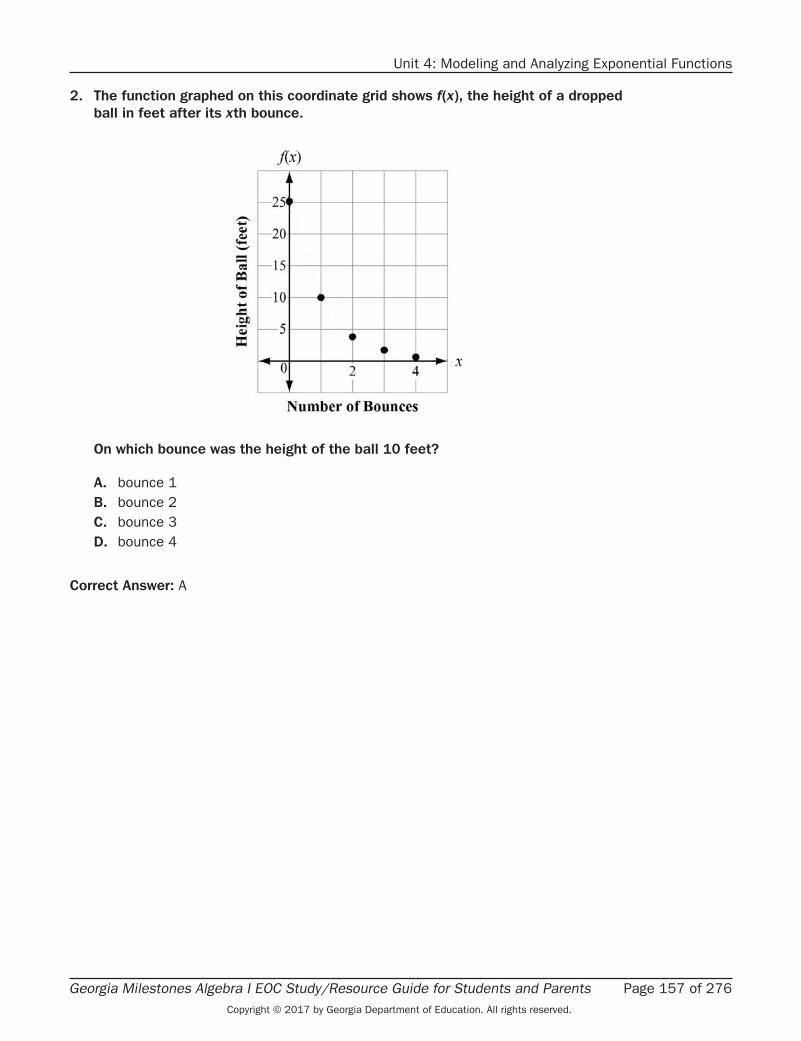
2 . The function graphed on this coordinate grid shows f(x), the height of a dropped ball in feet after its xth bounce .
On which bounce was the height of the ball 10 feet?
A . bounce 1B . bounce 2C . bounce 3D . bounce 4
Correct Answer: A

Page 158 of 276 Georgia Milestones Algebra I EOC Study/Resource Guide for Students and ParentsCopyright © 2017 by Georgia Department of Education. All rights reserved.
Unit 4: Modeling and Analyzing Exponential Functions
Analyze Functions Using Different RepresentationsMGSE9-12 .F .IF .7 Graph functions expressed symbolically and show key features of the graph, by hand in simple cases and using technology.
MGSE9-12 .F .IF .7a Graph linear and quadratic functions and show intercepts, maxima, and minima (as determined by the function or by context).
MGSE9-12 .F .IF .7e Graph exponential functions, showing intercepts and end behavior.
MGSE9-12 .F .IF .9 Compare properties of two functions each represented in a different way (algebraically, graphically, numerically in tables, or by verbal descriptions). For example, given a graph of one function and an algebraic expression for another, say which has the larger maximum.
KEY IDEA1. The different ways of representing a function also apply to exponential functions.
Exponential functions are built using powers. A power is the combination of a base with an exponent. For example, in the power 53, the base is 5 and the exponent is 3. A function with a power where the exponent is a variable is an exponential function. Exponential functions are of the form f(x) = abx, where a ≠ 0, b > 0, and b ≠ 1. In an exponential function, the base, b, is a constant and a is the coefficient.
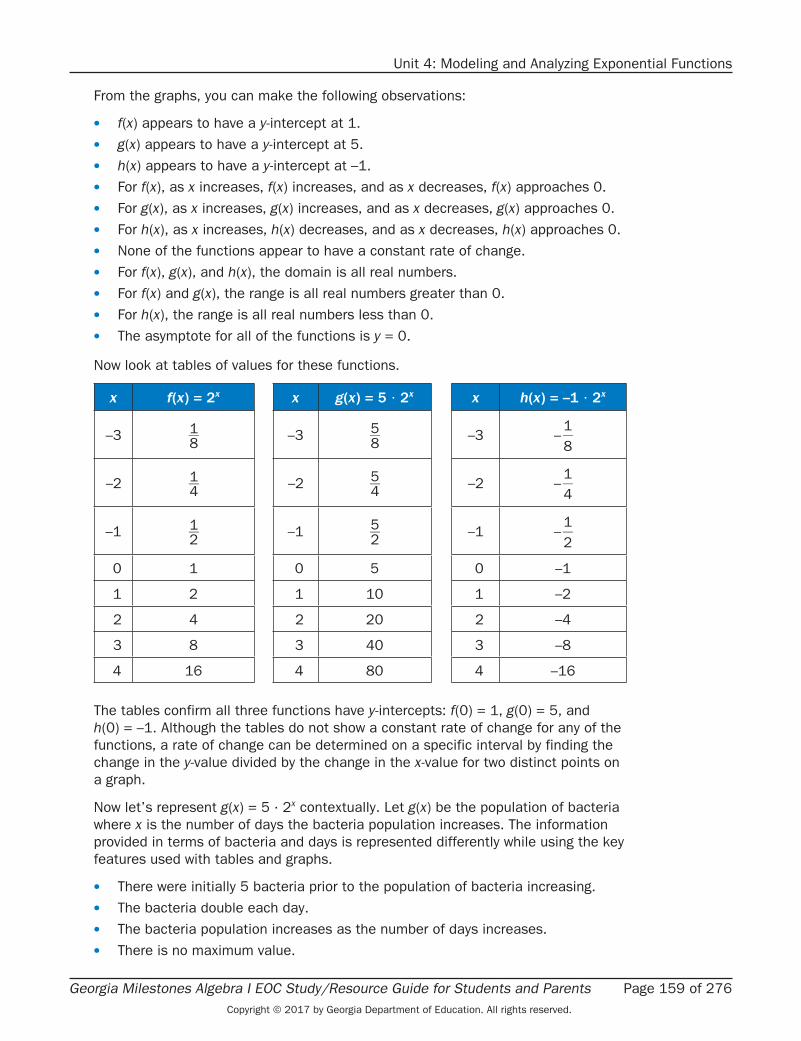
Example:
Consider f(x) = 2x, g(x) = 5 · 2x, and h(x) = –1 · 2x. For all three functions, f(x), g(x), and h(x), the base is 2. The coefficient in f(x) is 1, g(x) is 5, and h(x) is –1. The values of the coefficients cause the graphs to transform.
30
40
50
20
10
0–10
–30
–20
–50
–40
–10 –8 –6 –4 –2 642 8 10
y
x
h(x)
g(x) f(x)
Georgia Milestones Algebra I EOC Study/Resource Guide for Students and Parents Page 159 of 276Copyright © 2017 by Georgia Department of Education. All rights reserved.
Unit 4: Modeling and Analyzing Exponential Functions
From the graphs, you can make the following observations:
• f(x) appears to have a y-intercept at 1. • g(x) appears to have a y-intercept at 5. • h(x) appears to have a y-intercept at –1. • For f(x), as x increases, f(x) increases, and as x decreases, f(x) approaches 0. • For g(x), as x increases, g(x) increases, and as x decreases, g(x) approaches 0. • For h(x), as x increases, h(x) decreases, and as x decreases, h(x) approaches 0. • None of the functions appear to have a constant rate of change. • For f(x), g(x), and h(x), the domain is all real numbers. • For f(x) and g(x), the range is all real numbers greater than 0. • For h(x), the range is all real numbers less than 0. • The asymptote for all of the functions is y = 0.
Now look at tables of values for these functions.
x f(x) = 2x x g(x) = 5 · 2x x h(x) = –1 · 2x
–3 1 __ 8 –3 5 __ 8 –3 – 1
__ 8
–2 1 __ 4 –2 5 __ 4 –2 – 1
__ 4
–1 1 __ 2 –1 5 __ 2 –1 – 1
__ 2
0 1 0 5 0 –1
1 2 1 10 1 –2
2 4 2 20 2 –4
3 8 3 40 3 –8
4 16 4 80 4 –16
The tables confirm all three functions have y-intercepts: f(0) = 1, g(0) = 5, and h(0) = –1. Although the tables do not show a constant rate of change for any of the functions, a rate of change can be determined on a specific interval by finding the change in the y-value divided by the change in the x-value for two distinct points on a graph.
Now let’s represent g(x) = 5 · 2x contextually. Let g(x) be the population of bacteria where x is the number of days the bacteria population increases. The information provided in terms of bacteria and days is represented differently while using the key features used with tables and graphs.
• There were initially 5 bacteria prior to the population of bacteria increasing. • The bacteria double each day. • The bacteria population increases as the number of days increases. • There is no maximum value.
Page 160 of 276 Georgia Milestones Algebra I EOC Study/Resource Guide for Students and ParentsCopyright © 2017 by Georgia Department of Education. All rights reserved.
Unit 4: Modeling and Analyzing Exponential Functions
• The minimum value is 5 bacteria. • The number of bacteria will always range from 5 to infinity.
Important Tips
Remember the elements of the domain and the values obtained by substituting them into the function rule form the coordinates of the points that lie on the graph of a function.
Be familiar with important features of a function, such as intercepts, domain, range, minimums and maximums, end behavior, asymptotes, and periods of increasing and decreasing values.
Also notice how the value of the functions change as they transform. The value of g(–3) is 5 times more than f(–3) and the value h(–3) is the opposite value of f(–3).
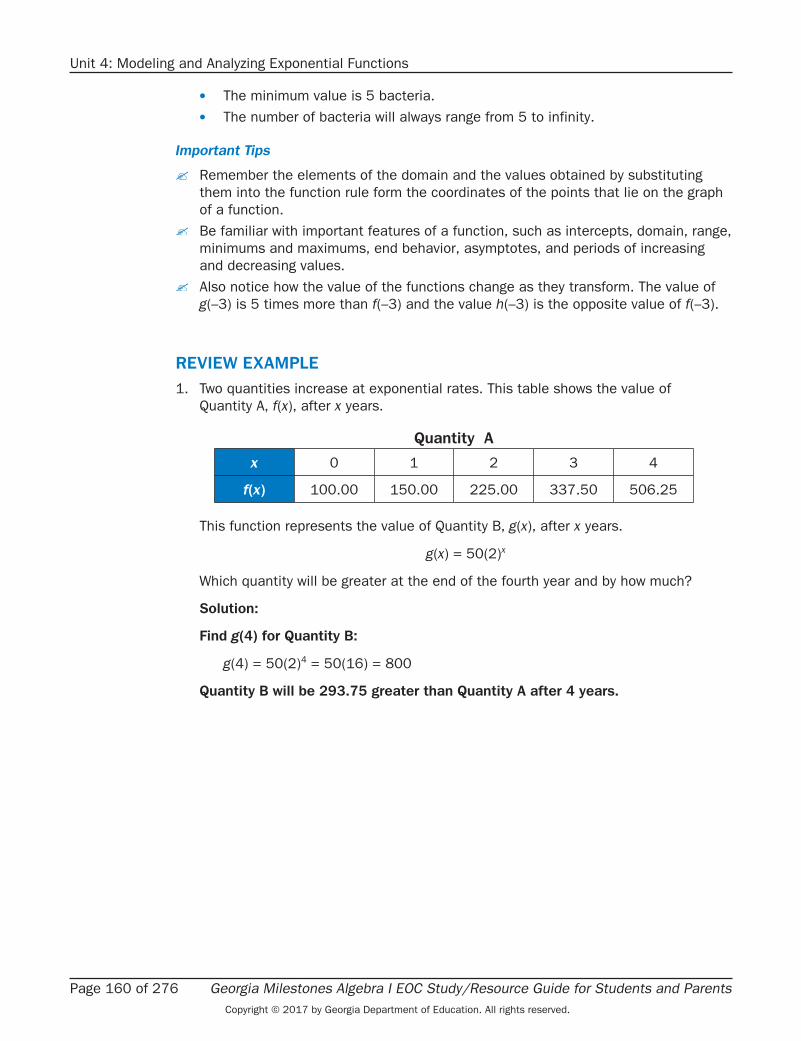
REVIEW EXAMPLE1. Two quantities increase at exponential rates. This table shows the value of
Quantity A, f(x), after x years.
Quantity A
x 0 1 2 3 4
f(x) 100.00 150.00 225.00 337.50 506.25
This function represents the value of Quantity B, g(x), after x years.
g(x) = 50(2)x
Which quantity will be greater at the end of the fourth year and by how much?
Solution:
Find g(4) for Quantity B:
g(4) = 50(2)4 = 50(16) = 800
Quantity B will be 293 .75 greater than Quantity A after 4 years .
Georgia Milestones Algebra I EOC Study/Resource Guide for Students and Parents Page 161 of 276Copyright © 2017 by Georgia Department of Education. All rights reserved.
Unit 4: Modeling and Analyzing Exponential Functions
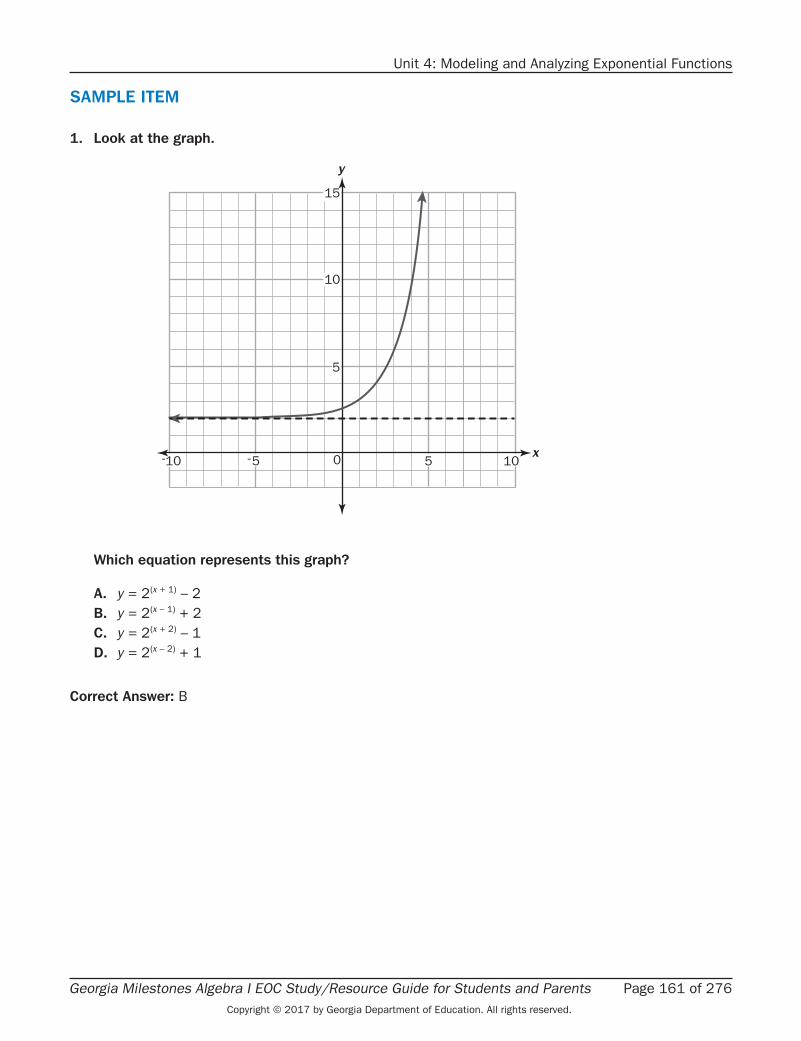
SAMPLE ITEM
1 . Look at the graph .
0-10 -5
5
10
15
x
y
5 10
Which equation represents this graph?
A . y = 2(x + 1) – 2 B . y = 2(x – 1) + 2C . y = 2(x + 2) – 1D . y = 2(x – 2) + 1
Correct Answer: B