Unit 4 Graphing and Analyzing Linear Functions
103
Unit 4 Graphing and Analyzing Linear Functions Michelle A. O’Malley League Academy of Communication Arts Greenville, South Carolina
-
Upload
octavius-ferrell -
Category
Documents
-
view
54 -
download
0
description
Unit 4 Graphing and Analyzing Linear Functions. Michelle A. O’Malley League Academy of Communication Arts Greenville, South Carolina. Standards for Learning Goal 4.1. - PowerPoint PPT Presentation
Transcript of Unit 4 Graphing and Analyzing Linear Functions

Unit 4 Graphing and Analyzing Linear
Functions
Michelle A. O’Malley
League Academy of Communication Arts
Greenville, South Carolina

Standards for Learning Goal 4.1
EA1.5: Demonstrate an understanding of algebraic relationships by using a variety of representations (including verbal, graphic, numerical, and symbolic)
EA3.1: Classify a relationship as being either a function or not a function when given data as a table, set or ordered pairs, or graph.

Essential Question for Learning Goal 4.1
What does a function look like?

Learning Goal 4.1 Notes In order to determine whether a relationship is
linear, you should focus on the rate of change in the relationship.
Linear relationships are characterized by a constant change in one variable associated with a constant change in the other variable.
That is, for each unit change in the independent quantity (variable), there is a constant change in the dependent quantity (variable).

Learning Goal 4.1 Notes A constant rate of change is what makes the line
“straight.” A constant increase in one variable compared to
the other is associated with straight lines having a positive slope.
A constant decrease in one variable as compared to the other is associated with straight lines having a negative slope.
Some linear functions are proportional and take the form of y=mx.
Some linear functions are non-proportional and take the form y=mx + b.

Learning Goal 4.1 Example 1: Linear or Non Linear? Phil is making a 3 foot by 4 foot banner for
the math club. Realizing that the banner is too small, he decides to increase each side. Phil must decide how the new dimensions will affect the cost of the materials. (cost versus area)
Non-Linear because the change in area is not constant

Learning Goal 4.1 Example 2: Linear or Non Linear?
A scuba diver is 120 feet below sea level. She knows that to avoid suffering from the bends, she must come up at a rate of 7 feet per minute (depth versus time).
Linear because the rate of change is constant

Learning Goal 4.1 Example 3: Linear or Non Linear?
The pattern in the first table is linear: The constant rate of change in the y is zero and the function is y=3.
The second pattern is also linear; the constant rate of change in y is -3 (for a unit change in x) and the function is y=-3x+1. Note: when finding the rate of change if the x-values do not increase in equal increments, as long as the rates of change (change in y/change in x) are equivalent (i.e. (-9/3 = -3/1 = -6/2 = -3), the function is linear.
The third pattern is not linear: for each 1 unit increase in x, the change in y is not constant.
X Y
-4 13
-1 4
0 1
1 -2
3 -8
7 -20
X Y
-2 3
-1 3
0 3
1 3
2 3
3 3
X Y
-2 4
-1 1
0 0
1 1
2 4
3 9
Table 1
Table 2
Table 3

Learning Goal 4.1 Essential Knowledge
Students should be able to identify that a constant rate of change is the criteria used to determine whether or not a relationship is linear.
Students should be able to determine if a relationship given in tabular form represents a linear function.
Students should be able to determine if a relationship given in verbal form represents a linear function.

Standards for Learning Goal 4.2
EA-5.6 Carry out a procedure to determine the slope of a line from data given tabularly, graphically, symbolically, and verbally.
EA-5.7 Apply the concept of slope as a rate of change to solve problems.

Essential Question for Learning Goal 4.2
What is slope?

Learning Goal 4.2 Notes Slope is usually represented by the letter m (from
the French, monter, which means “to go up”). A constant rate of change is called the slope of a
line. Slope is the ratio of vertical change to horizontal
change between points on the graph. Slope is defined as m = (y2 – y1)/(x2 – x1), where
(x1, y1) and (x2, y2) are points on the line.

Learning Goal 4.2 Notes Slope should also be considered in terms
of a ratio. Slope is the ratio for the differences in the x
and y coordinates of two points on the line. The ratio of vertical rise to horizontal run
(m=rise/run) Slope is a rate of change.

Learning Goal 4.2 Notes Slopes can be positive, which means rising to
the right. Slopes can be negative, which means falling to
the right. Slopes can be zero, which means the line will
be horizontal. Slopes can be Undefined, which are
sometimes referred to as “no slope” which should not be confused with zero slope.

Learning Goal 4.2 Notes For a line to have a positive slope, as the independent
quantity increases (or decreases), the dependent quantity increases (or decreases).
For a line to have a negative slope, as the independent quantity increases (or decreases), the dependent quantity decreases (or increases).
For a line to have a zero slope (equation y=constant), there is no change in the dependent quantity associated with any change in the independent quantity. (horizontal line)
For a line to have an undefined slope (equation x=constant), there is no change in the independent quantity associated with changes in the dependent quantity (no division by zero) (vertical line)

Learning Goal 4.2 Notes Slope has a proportional
nature. For example, for Y=3x+1
For each unit increase in x, y increases by 3
If x decreases by 10, y will decrease by 30
X Y=3x + 1
1 4
2 7
3 10
4 13
5 16
6 19
7 22
8 25
9 28
10 31
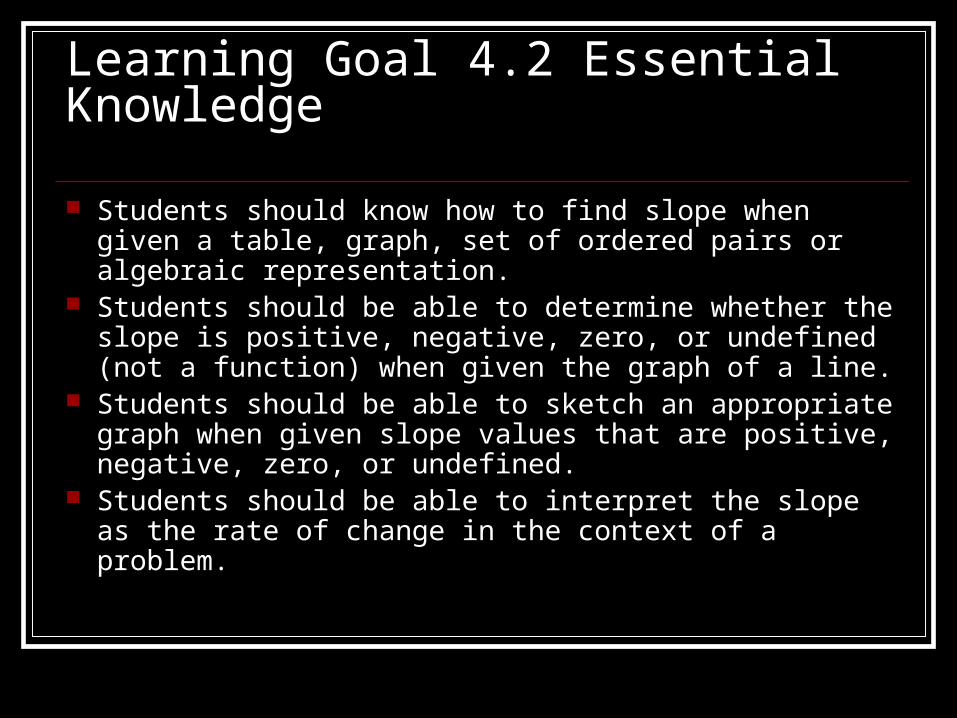
Learning Goal 4.2 Essential Knowledge
Students should know how to find slope when given a table, graph, set of ordered pairs or algebraic representation.
Students should be able to determine whether the slope is positive, negative, zero, or undefined (not a function) when given the graph of a line.
Students should be able to sketch an appropriate graph when given slope values that are positive, negative, zero, or undefined.
Students should be able to interpret the slope as the rate of change in the context of a problem.

Standards for Learning Goal 4.3 EA 1.3 Apply algebraic methods to solve
problems in real-world contexts. EA 1.5 Demonstrate an understanding of
algebraic relationships by using a variety of representations (including verbal, graphic, numerical, and symbolic).
EA 3.6 Classify a variation as either direct or inverse.
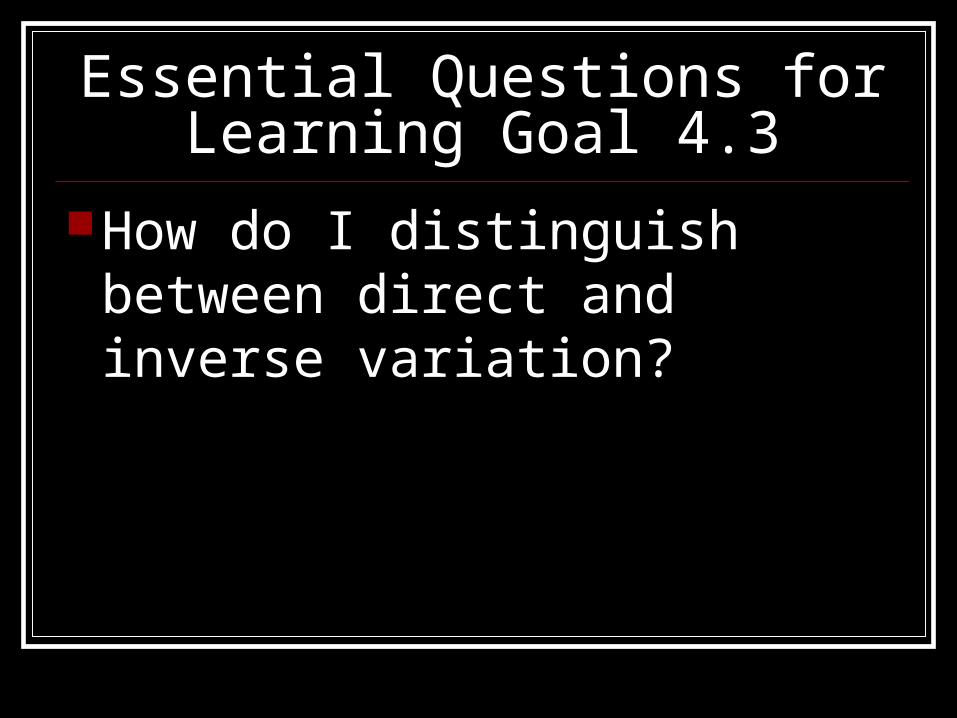
Essential Questions for Learning Goal 4.3
How do I distinguish between direct and inverse variation?
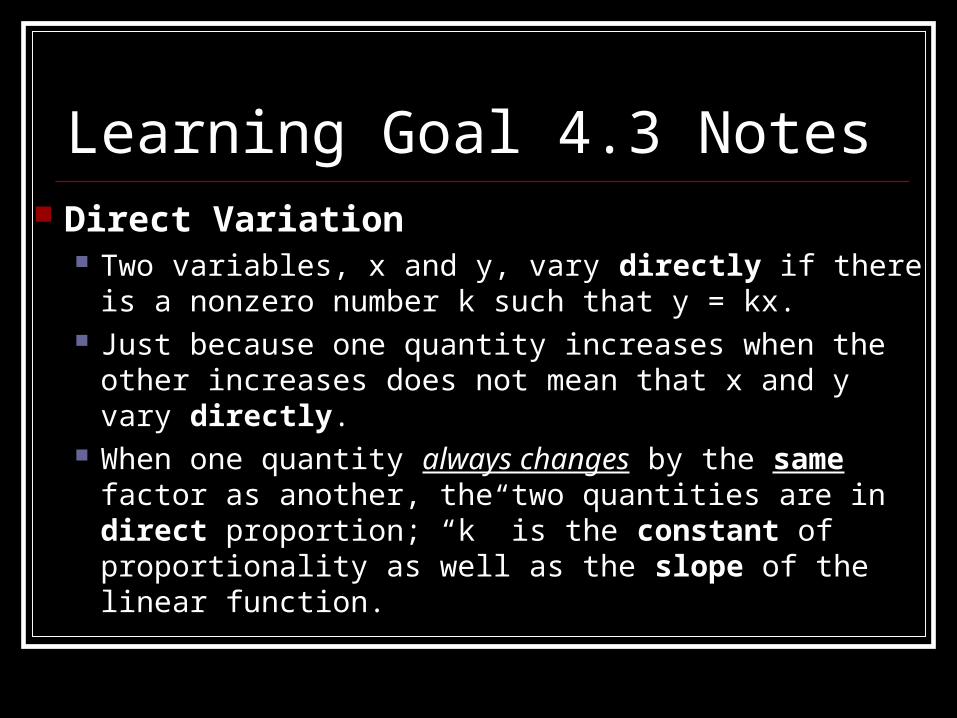
Learning Goal 4.3 Notes Direct Variation
Two variables, x and y, vary directly if there is a nonzero number k such that y = kx.
Just because one quantity increases when the other increases does not mean that x and y vary directly.
When one quantity always changes by the same factor as another, the two quantities are in direct proportion; “k” is the constant of proportionality as well as the slope of the linear function.

Learning Goal 4.3 Notes Inverse Variation
Two variables, x and y, vary inversely if there is a non-zero number k such that y = k/x, or xy = k (x ≠ 0)
Just because one quantity decreases as the other increases does not mean that the two quantities are inversely proportional.
When one quantity always decreases by the same factor as the other increases, the two quantities are inversely proportional.
If xy=9 and x is multiplied by 2, then y is divided by 2 in order to preserve the constant 9.

Learning Goal 4.3 Notes Although Direct Variation is a linear function, it will
be of the form y = mx, not y = mx + b because the y-intercept must be zero.
Given that the y-intercept must be zero, the graph will always go through the origin (0,0)
The Graphical representation of inverse variation is a hyperbola (curved line).
Inverse variation – the product of the two values remains constant as x increase, y decreases, or as x decreases, y increases.

Learning Goal 4.3 Essential Knowledge
Students should be able to determine whether the data demonstrates direct variation, inverse variation, or neither when given a graph, table, or real world application.
Students should be able to find the constant of variation, k, and write an equation that relates x to y when given function values.
Students should be able to find the constant of variation when given a direct or inverse variation graph.
Students should be able to sketch a graph of the function, when given a direct or inverse variation equation.
Students should be able to write an inverse or direct variation equation when given a verbal description.

Standards for Learning Goal 4.4 EA 1.5 Demonstrate an understanding of
algebraic relationships by using a variety of representations (including verbal, graphic, numerical, and symbolic).
EA 1.6 Understand how algebraic relationships can be represented in concrete models, pictorial models, and diagrams.
EA 4.6 Represent linear equations in multiple forms (including point-slope, slope-intercept, and standard).

Essential Questions for Learning Goal 4.4
How do I translate between the various algebraic forms of a linear function?

Learning Goal 4.4 Notes Equations of the form ax + by = cax + by = c
(standard form) and/or y = mx + by = mx + b (Slope-intercept form), or any equations that can be transformed into either of these two forms are linearlinear.

Learning Goal 4.4 Notes In the equation ax + by = c, if a = 0 then the
equation becomes y = c/b; this is the equation of a horizontal line.
In equation ax + by = c, if b = 0 then the equation becomes x = c/a; this is the equation of a vertical line.

Learning Goal 4.4 Notes A solution of an equation in two variables, x
and y, is an ordered pair (x, y) that makes the equation true.
The graph of an equation in x and y is the set of all points (x, y) that are solutions of the equation.
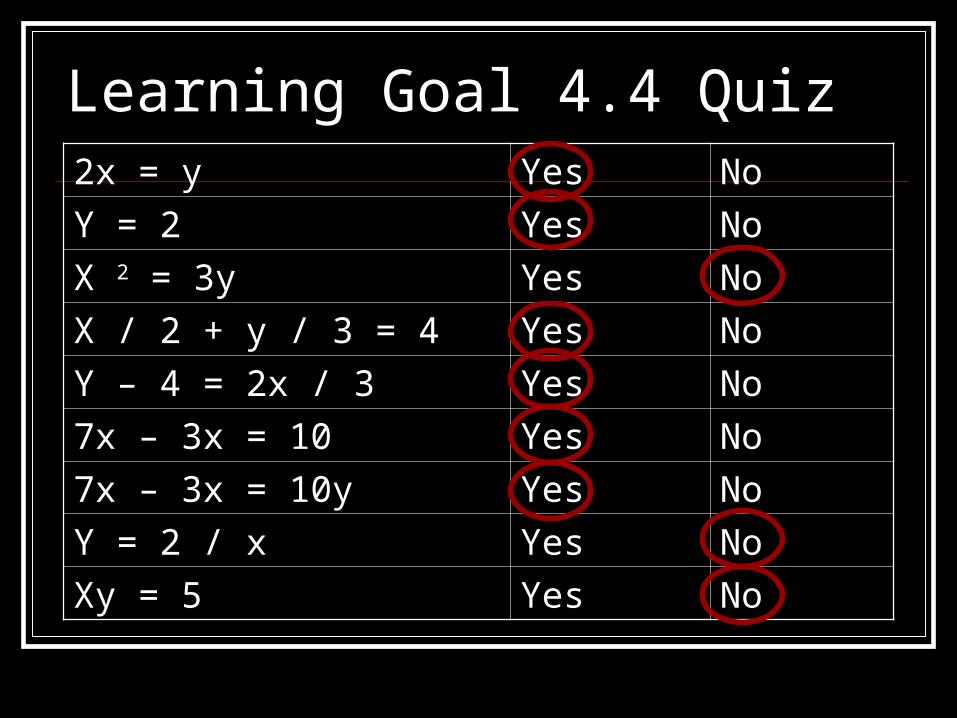
Learning Goal 4.4 Quiz2x = y Yes No
Y = 2 Yes No
X 2 = 3y Yes No
X / 2 + y / 3 = 4 Yes No
Y – 4 = 2x / 3 Yes No
7x – 3x = 10 Yes No
7x – 3x = 10y Yes No
Y = 2 / x Yes No
Xy = 5 Yes No
Learning Goal 4.4 Essential Knowledge
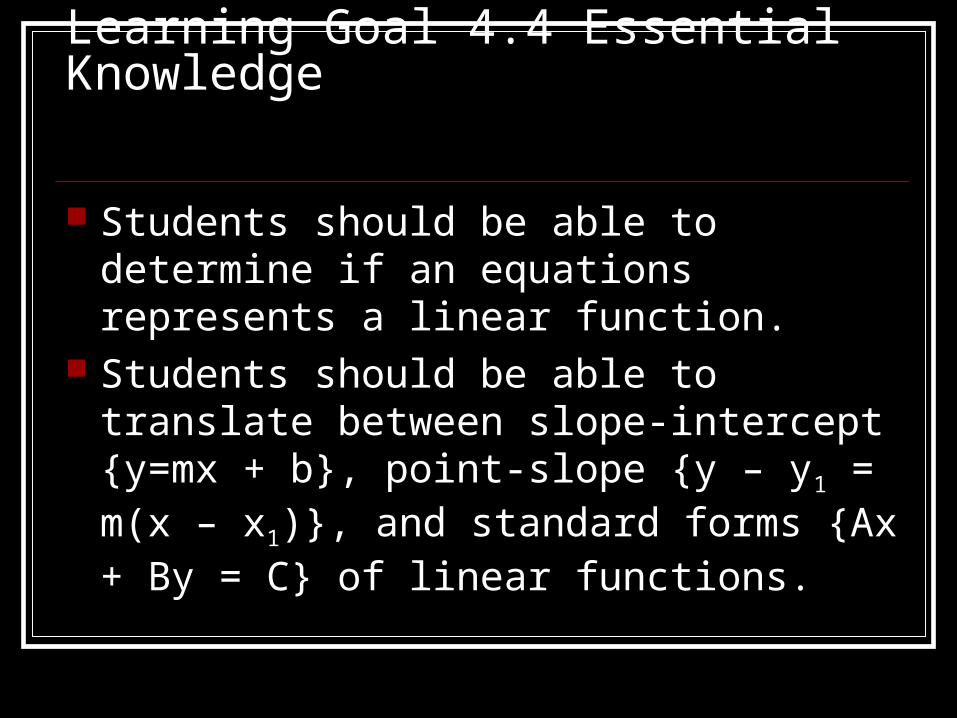
Students should be able to determine if an equations represents a linear function.
Students should be able to translate between slope-intercept {y=mx + b}, point-slope {y – y1 = m(x – x1)}, and standard forms {Ax + By = C} of linear functions.

Standards for Learning Goal 4.5 EA 1.1 Communicate a knowledge of algebraic
relationships by using mathematical terminology appropriately.
EA 1.3 Apply algebraic methods to solve problems in real-world contexts.
EA 5.5 Carry out a procedure to determine the x-intercept and y-intercept of lines from data given tabularly, graphically, symbolically, and verbally.

Essential Questions for Learning Goal 4.5
What do intercepts mean?

Learning Goal 4.5 Notes Essential knowledge and skills for this
unit: Be able to find the x and y intercepts of al ine
given the equation, table, or graph Be able to graph a line using the intercepts Be able to interpret the real world meaning of
the x and y intercepts

Learning Goal 4.5 Notes How do you find the x and y intercepts?
First you must have an equation For example, y = -3x + 48
The slope is -3 The y intercept is 48 – you know this because you know in
y=mx + b, b is the y intercept. Also, if you replace x with a 0, your equation will change to y=-3(0) + 48, which gives you y=48.
The x intercept can be found by substituting 0 for y; for example, 0 = -3x + 48, -48=-3x, divide by three to isolate x and your answer would be x = 16, which is the x intercept.

Learning Goal 4.5 Notes
If you are looking at coordinate pairs, (x,0) represents the x intercept and (0,y) represents the y intercept.
Which one of the numbers in the table on the right represent the x and y intercepts.
X Y
0 2
2 7
4 0
8 - 2
12 -7

Learning Goal 4.5 Notes
Intercepts cross the graph at a given point where one value is zero and the other is either the y or x value.
Vertical lines have no y intercepts and x is constant. (Note: A vertical line is not a function and the slope would be undefined)
Horizontal lines have no x intercept and y is constant. (Note: A horizontal line is a function and the slope would be zero.
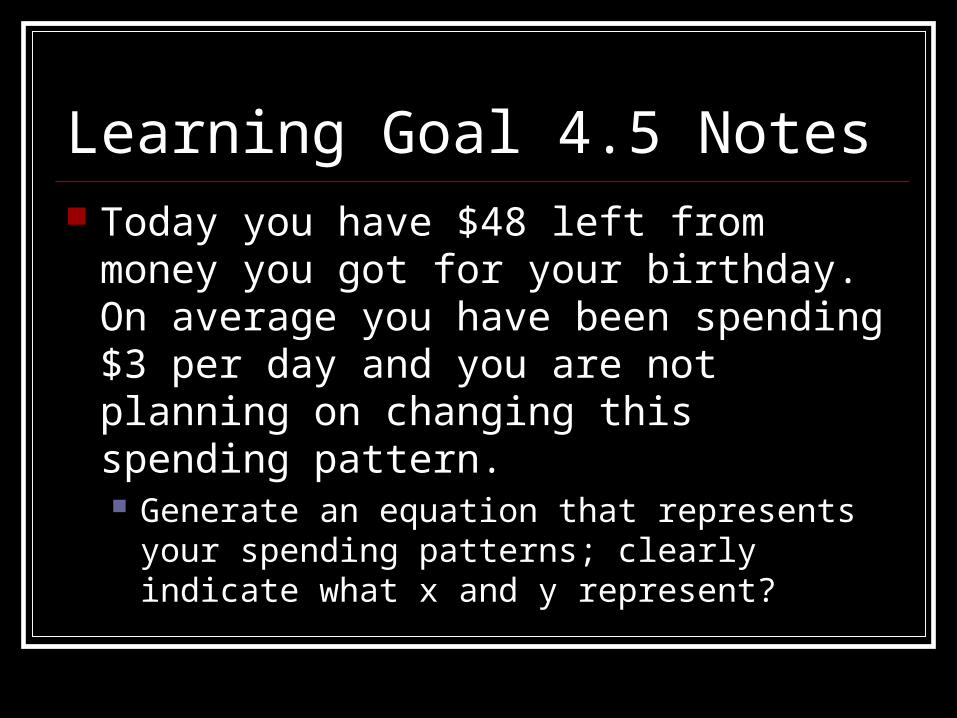
Learning Goal 4.5 Notes Today you have $48 left from money you
got for your birthday. On average you have been spending $3 per day and you are not planning on changing this spending pattern. Generate an equation that represents your
spending patterns; clearly indicate what x and y represent?

Learning Goal 4.5 Notes Today you have $48 left from money you got
for your birthday. On average you have been spending $3 per day and you are not planning on changing this spending pattern. Generate an equation that represents your spending
patterns; clearly indicate what x and y represent? Answer:
y will be the amount of birthday money $ and x will be the number of days
Y=-3x + 48

Learning Goal 4.5 Notes Today you have $48 left from money you
got for your birthday. On average you have been spending $3 per day and you are not planning on changing this spending pattern. Next, What is the slope of the equation? What
does the slope represent in general and in the context of this problem?

Learning Goal 4.5 Notes Today you have $48 left from money you got for
your birthday. On average you have been spending $3 per day and you are not planning on changing this spending pattern. Next, What is the slope of the equation? What does
the slope represent in general and in the context of this problem?
Answer: The slope is – 3, which is the amount of money spent per day

Learning Goal 4.5 Notes Today you have $48 left from money you
got for your birthday. On average you have been spending $3 per day and you are not planning on changing this spending pattern. Next, Identify the x intercept in this problem
situation and explain what it represents in this situation.

Learning Goal 4.5 Notes
Today you have $48 left from money you got for your birthday. On average you have been spending $3 per day and you are not planning on changing this spending pattern. Next, Identify the x intercept in this problem
situation and explain what it represents in this situation.
Answer: X intercept will be when the birthday money has been spent
– it is all gone. Y= -3x + 48, 0= -3x + 48, -48= -3x, isolate the variable by
dividing by -3, x = 16

Learning Goal 4.5 Notes Today you have $48 left from money you
got for your birthday. On average you have been spending $3 per day and you are not planning on changing this spending pattern. Next, Identify the y intercept in this problem
situation and explain what it represents in this situation.

Learning Goal 4.5 Notes Today you have $48 left from money you
got for your birthday. On average you have been spending $3 per day and you are not planning on changing this spending pattern. Next, Identify the y intercept in this problem
situation and explain what it represents in this situation.
Answer: The y intercept is the amount of birthday money that is
left at that particular day. Y = -3(0) + 48, y = 48

Graph of
Y = - 3x + 48
X intercept = 16
And Y intercept = 48
What does your graph look like?
Number of Days – x axis
Bir
thd
ay M
on
ey $
- y
axi
s
1 2 3 4 5 6 7 8 9 10 11 12 13 14 15 16
50
45
40
35
30
25
20
15
10
5
0

Purpose Statement based on Algebra 1 Learning Goal 4.6
Seventh and Eighth grade Algebra 1 students will be assessed on their ability to write and graph a linear equation using the slope-intercept form, with and without technology. Relate the slope-intercept form to transformations of the parent function y=x so that the teacher, parents, instructional coach, and principal can determine if the students have met the required Algebra 1 state standards that are represented in the Graphing and Analyzing Linear Equations Unit (Greenville County School District, 2010).

Standards for Learning Goal 4.6 EA 1.7 Understand how to represent algebraic
relationships by using tools such as handheld computing devices, spreadsheets, and computer algebra systems (CASs).
EA 3.5 Carry out a procedure to graph parent functions (including ).
EA 4.1 Carry out a procedure to write an equation of a line with a given slope and a y-intercept.
EA 4.2 Carry out a procedure to write an equation of a line with a given slope passing through a given point.

Standards for Learning Goal 4.6(Continued)
EA 5.1 Carry out a procedure to graph a line when given the equation of the line.
EA 5.2 Analyze the effects of changes in the slope, m, and the y-intercept, b, on the graph of y = mx + b.
EA 5.3 Carry out a procedure to graph the line with a given slope and a y-intercept.
EA 5.4 Carry out a procedure to graph the line with a given slope passing through a given point.

Essential Questions for Learning Goal 4.6
How do I use transformations to graph linear equations in slope intercept form?

Learning Goal 4.6 Notes Slope-intercept form of the linear equation
should be approached as transformations (slides, flips and stretches or compressions) to a parent function y = x.
Characteristics of a parent function y = x The x and y coordinates of ordered pairs are equal
and include but are not limited to (-1,-1), (0,0), (1,1), (5/2,5/2), ETC.
Slope = 1/1 = 1 Passes through the origin Bisect first and third quadrants creating 45 degree
angles
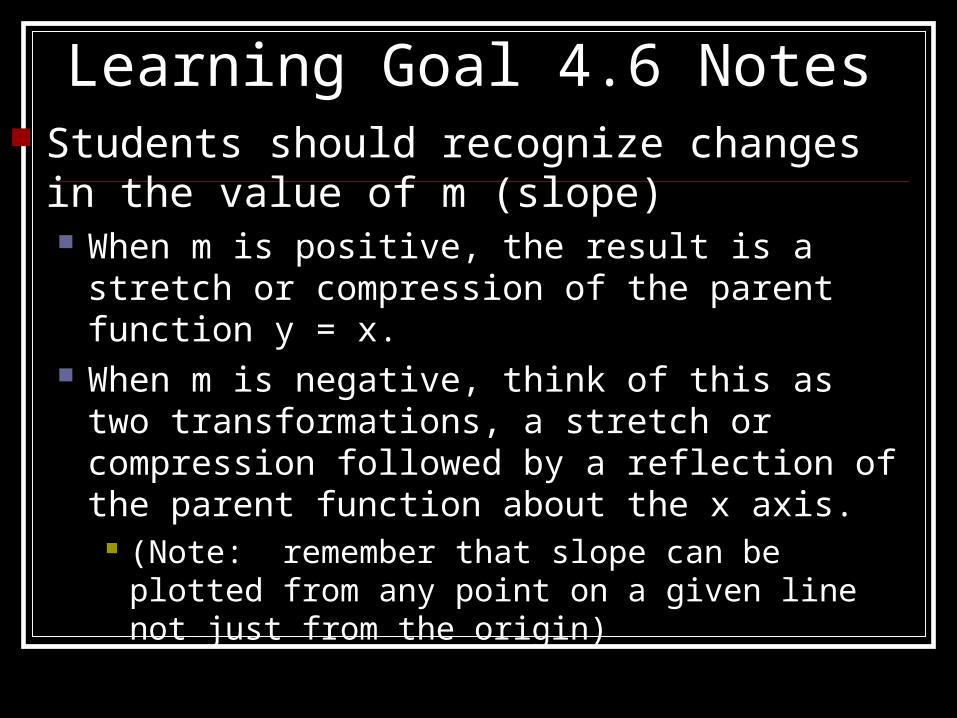
Learning Goal 4.6 Notes Students should recognize changes in the
value of m (slope) When m is positive, the result is a stretch or
compression of the parent function y = x. When m is negative, think of this as two
transformations, a stretch or compression followed by a reflection of the parent function about the x axis.
(Note: remember that slope can be plotted from any point on a given line not just from the origin)

Learning Goal 4.6 Notes Students should recognize changes in the
value of b (y intercept) Changes in the value of b results in vertical
translations of the function y = mx. If b is positive, the graph of y = mx shifts up b units If b is negative, the graph of y = mx shifts down b
units

Learning Goal 4.6 Notes
Students are to draw a graph representing the following:
Y = X Y = 2/3x Y = -2/3x Y = -2/3x + 4
Note: the above lines represent the changes in the parent function; however, they are closely placed on the grid but not exactly.

Learning Goal 4.6 Notes Practice problems:
1. If the graph of the equation y = 3x + 4 is shifted down 9 units, what is the equation of the new graph?
Draw the graph of a linear equation with negative slope that intersects the positive y axis and write the equation. Explain why your graph satisfies the given conditions.
A line passes through the point (4,2). Find at least five possible equations for this line.

Purpose Statement based on Algebra 1 Learning Goal 4.7
Seventh and Eighth grade Algebra 1 students will be assessed on their ability to use two points to graph and write the equation of the linear function that contain the given points so that the teacher, parents, instructional coach, and principal can determine if the students have met the required Algebra 1 state standards that are represented in the Graphing and Analyzing Linear Equations Unit (Greenville County School District, 2010).

Standards for Learning Goal 4.7 EA 1.3 Apply algebraic methods to solve
problems in real-world contexts. EA 4.3 Carry out a procedure to write an
equation of a line passing through two given points.
EA 5.1 Carry out a procedure to graph a line when given the equation of the line.

Essential Questions for Learning Goal 4.7
How do I use real-world data to write the equation of a line?

Learning Goal 4.7 Notes Essential knowledge and skills for this
unit: Students must be able to graph and write the
equation of a linear function given two points. Students must when given the graph of a linear
function, choose two points and write the equation of the function.

Can you find the equation of the
line?
Since you can find the slope of the line and you have a y-intercept, you can create an equation using slope-intercept or point-slope.
1 2 3 4 5 6 7 8 9 10 11 12 13 14 15 16
10
9
8
7
6
5
4
3
2
1
0Rise = -5 and Run = 4
Therefore, the slope is -5/4
Slope is -5/4 and the y-intercept is 5 therefore, the equation of the line is: y = -5/4x + 5
10
9
8
7
6
5
4
3
2
1
0
1 2 3 4 5 6 7 8 9 10 11 12 13 14 15 16
10
9
8
7
6
5
4
3
2
1
0
1 2 3 4 5 6 7 8 9 10 11 12 13 14 15 16 1 2 3 4 5 6 7 8 9 10 11 12 13 14 15 16 1 2 3 4 5 6 7 8 9 10 11 12 13 14 15 16
10
9
8
7
6
5
4
3
2
1
0
1 2 3 4 5 6 7 8 9 10 11 12 13 14 15 16
10
9
8
7
6
5
4
3
2
1
0
1 2 3 4 5 6 7 8 9 10 11 12 13 14 15 16
You can also use the slope formula by picking
two points on the line.
M=y2-y1/x2-x1
M=(5-0)/(0-4) = -5/4
(0,5))
(4,0))

Learning Goal 4.7 Notes Students need to make sure that they can find the equation of a
linear function by using slope-intercept as well as point-slope. To write an equation in Slope-intercept (y=mx+b), you need the
slope and the y-intercept. When slope = -5/4 and the y-intercept = 5 the slope intercept form is y= -5/4 + 5.
In point-slope you need two coordinate points (0,5) and (4,0) Step 1 find the slope using m=(y2-y1)/(x2-x1), m=(5-0)/(0-4) = -5/4 Next, choose one coordinate point and use the slope to create you
point-slope equation Y-y1=m(x-x1) Y-5=-5/4(x-0) Y-5=-5/4x Y=-5/4x + 5

Learning Goal 4.7 Notes Sample Problem
A candle that has been burning for two minutes is eight inches long. That same candle is seven and one-quarter inches long after burning three minutes. Assume that the candle will continue to burn at this same rate. Define a variable for the time since the candle was lit and use this variable to write a function for the length of the candle.
The above highlighted information in yellow represents the coordinate points for the linear equation. (5,7.25) and (2, 8)

Learning Goal 4.7 Notes Sample Problem (continued)
Now that you have two points, you can find the slope. m=(y2-y1)/(x2-x1), m=(8-7.25)/(2-5) = -1/4 Next, use one coordinate point and the slope to write the
point-slope equation.
Y-y1=m(x-x1) Y-8=-1/4(x-2) Y-8=-1/4x + 1/2 Y-8 +8 = -1/4x + ½ +8 y = -1/4x + 8 ½
Therefore, the y-intercept is 8 ½ inches

Learning Goal 4.7 Notes Sample Problem (continued)
A candle that has been burning for two minutes is eight inches long. That same candle is seven and one-quarter inches long after burning three minutes. Assume that the candle will continue to burn at this same rate. Define a variable for the time since the candle was lit and use this variable to write a function for the length of the candle.
Question 1: When will the candle completely burn itself out? This is the x-intercept
Y=-1/4x + 8 ½ 0=-1/4x +8 ½ -8 ½ = -1/4x (-4/1)(-17/2) = (-1/4x)(-4/1) 68/2 = x 34 = x The x-intercept is 34 minutes

Learning Goal 4.7 Notes Sample Problem (continued)
A candle that has been burning for two minutes is eight inches long. That same candle is seven and one-quarter inches long after burning three minutes. Assume that the candle will continue to burn at this same rate. Define a variable for the time since the candle was lit and use this variable to write a function for the length of the candle.
Question 2: How long will the candle be 20 minutes after it was lit according to this algebraic model?
Take you equation y=-1/4x + 8 ½ and put 20 in place of x.
Y=-1/4(20) + 8 ½ Y=-5 + 8 ½ Y= 3 ½ inches, which is the size of the candle after 20
minutes

Learning Goal 4.7 Notes Sample Problem (continued)
A candle that has been burning for two minutes is eight inches long. That same candle is seven and one-quarter inches long after burning three minutes. Assume that the candle will continue to burn at this same rate. Define a variable for the time since the candle was lit and use this variable to write a function for the length of the candle.
Question 3: How long was the candle when it was lit?
This would be your y-intercept which was 8 ½ inches

Learning Goal 4.7 Notes Sample Problem (continued)
A candle that has been burning for two minutes is eight inches long. That same candle is seven and one-quarter inches long after burning three minutes. Assume that the candle will continue to burn at this same rate. Define a variable for the time since the candle was lit and use this variable to write a function for the length of the candle.
Question 4: When will the candle be half of its original height?
17/4 – 17/2 = -1/4x + 17/2 – 17/2 17/4 – 34/4 = -1/4x -17/4 = -1/4x (-4/1)(-17/4) = (-1/4x) (-4/1) 17 = x

Can you graph the equation
y=-1/4x + 8 1/2
10
9
8
7
6
5
4
3
2
1
0
minutes
10
9
8
7
6
5
4
3
2
1
0
10
9
8
7
6
5
4
3
2
1
0
10
9
8
7
6
5
4
3
2
1
0
2 4 6 8 10 12 14 16 18 20 22 24 26 28 30 32 34
10
9
8
7
6
5
4
3
2
1
0
(2,8))
(5,7.25)
Hei
gh
t o
f C
and
leWhat is the Slope of this
equation?
What is the y intercept?
What is the x intercept?

Standards for Learning Goal 4.8 EA 4.2 Carry out a procedure to write an equation of a line with a
given slope passing through a given point. EA 4.3 Carry out a procedure to write an equation of a line passing
through two given points. EA 4.6 Represent linear equations in multiple forms (including
point-slope, slope-intercept, and standard). EA 5.1 Carry out a procedure to graph a line when given the
equation of the line. EA 5.3 Carry out a procedure to graph the line with a given slope
and a y-intercept. EA 5.4 Carry out a procedure to graph the line with a given slope
passing through a given point.

Essential Questions for Learning Goal 4.8
What does point-slope form of an equation tell me?

Learning Goal 4.8 Notes Essential knowledge and skills for this unit:
Students must be able to explain how any linear function in point-slope form can be obtained through transformations of the parent function y = x.
Students must be able to discuss the effect of changes of h, k, and m on the equation y – k = m (x – h)
Students must be able to write and graph the equation of the line in point-slope form, with and without technology when given a point and a slope, or two points.
Students must be able to convert a given equation to either of the other two forms.
Students must be able to write the equation in point-slope form when given the graph of a linear function.

Learning Goal 4.8 Notes In point-slope form, y-y1 = m(x-x1), m
represents the slope and (x1,y1) is a point on the line
A general form of the point-slope equation is y – k = m(x – h) where h is the horizontal shift and k is the vertical shift of the equation y = mx.
This means that the point (0,0) on y=mx is translated to (h,k).

Learning Goal 4.8 Notes Consider the following example when
thinking about transformations Y + 3 = 4(x – 5) or Y – (-3) = 4(x – (+5))
Order of operations on the independent variable x dictates that the parent function y=x is shifted 5 units to the right.
Next, the graph is stretched vertically by a factor of 4.
Finally, the graph is translated down 3 units. If the slope in this example was -4, then the graph
would have been reflected about the line x-axis before being shifted down 3 units.

Learning Goal 4.8 Notes Remember that when using point-slope
form either set of coordinate points can be substituted into the formula. y-y1 = m(x-x1) Slope of 2 Coordinates (1,1) and (3,5) y-1 = 2(x-1), y-1=2x-2, y=2x-1 y-5 = 2(x-3), y-5=2x-6, y=2x-1

Standards for Learning Goal 4.9 EA 1.5 Demonstrate an understanding of algebraic
relationships by using a variety of representations (including verbal, graphic, numerical, and symbolic).
EA 1.7 Understand how to represent algebraic relationships by using tools such as handheld computing devices, spreadsheets, and computer algebra systems (CASs).
EA 4.1 Carry out a procedure to write and equation of a line with a given slope and a y-intercept. (Extension)

Essential Questions for Learning Goal 4.9
How do I know if a point is a solution to a two variable inequality?

Learning Goal 4.9 Notes In order to graph an inequality in two
variables, the inequality should first be written in slope-intercept form.
When you graph an inequality, you are forming two half-planes whose boundary is the line that corresponds to the inequality.

Learning Goal 4.9 Notes When an inequality involves a > or <, graph
a dotted line to show that the points on the boundary line are not included in the solution set.

Learning Goal 4.9 Notes When an inequality involves ≤ or ≥, graph a
solid line to show that the points on the boundary line are included in the solution set.
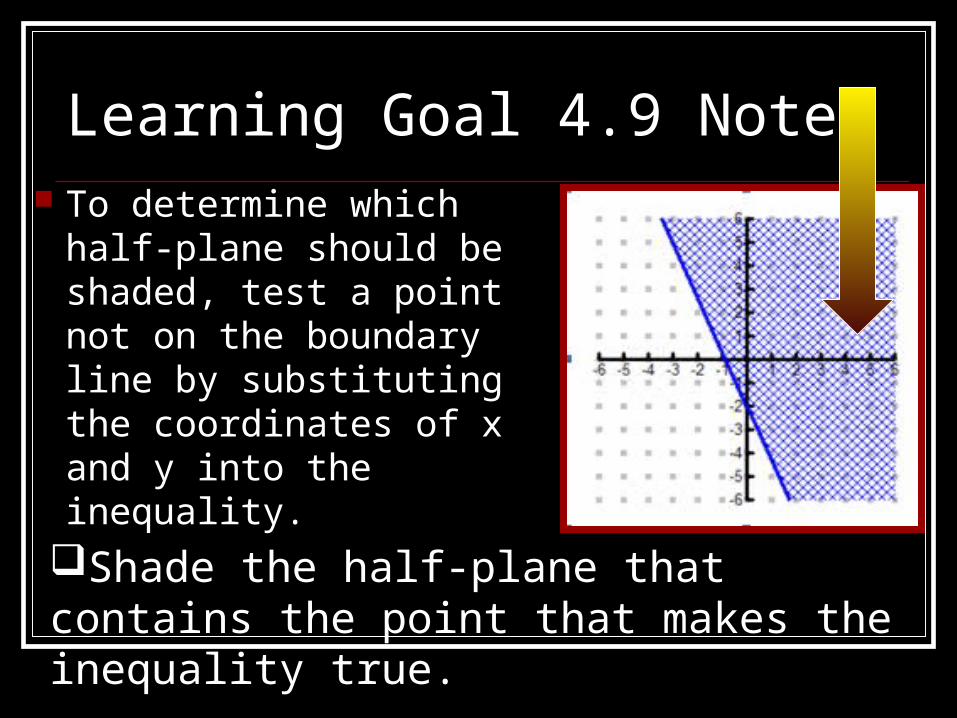
Learning Goal 4.9 Notes To determine which half-
plane should be shaded, test a point not on the boundary line by substituting the coordinates of x and y into the inequality.
Shade the half-plane that contains the point that makes the inequality true.

Learning Goal 4.9 Notes
All of the points (ordered pairs) in the half-plane will make the inequality true and constitute the solution set of the inequality.
The origin, (0,0), is the most convenient point to test, as long as the boundary line does not go contain the origin.

Essential Knowledge for Learning Goal 4.9 Students should be able to graph and shade an
inequality in two variables with and without technology.
Students should be able to write the corresponding inequality when given a graph.
Students should be able to test to determine whether it is a solution to a given inequality when given a point.
Standards for Learning Goal 4.10 EA 1.1 Communicate knowledge of algebraic relationships
by using mathematical terminology appropriately. EA 1.7 Understand how to represent algebraic
relationships by using tools such as handheld computing devices, spreadsheets, and computer algebra systems (CASs).
EA 5.1 Carry out a procedure to graph a line when given the equation of the line.
EA 5.8 Analyze the equations of two lines to determine whether the lines are perpendicular or parallel.

Essential Questions for Learning Goal 4.10
How do I write the equations of parallel and perpendicular lines?

Learning Goal 4.10 Notes Parallel lines have the same slopes and
different y-intercepts. Perpendicular lines have slopes that are
negative reciprocals, m1 · m2 = -1
Learning Goal 4.10 Notes To write the equation of a linear function
parallel to a given line through a given point, determine the slope of the given line and use this slope with the given point in either the slope-intercept or point-slope form.
To write the equation of a linear function perpendicular to a given line through a given point, determine the slope of the given line and use the negative reciprocal of this lsope with the given point in either the slope-intercept or point-slope form.
Learning Goal 4.10 Notes When graphing perpendicular lines on a
graphing calculator, it is necessary to use the ZoomSquare feature to ensure that the lines appear perpendicular.
Standards for Learning Goal 4.11 EA 1.2 Connect algebra with other branches of
mathematics. EA 1.5 Demonstrate an understanding of algebraic
relationships by using a variety of representations (including verbal, graphic, numerical, and symbolic).
EA 1.7 Understand how to represent algebraic relationships by using tools such as handheld computing devices, spreadsheets, and computer algebra systems (CASs).
EA 5.9 Analyze given information to write a linear function that models a given problem situation.

Essential Questions for Learning Goal 4.11
What does the solution to a corresponding one-variable linear equation mean?

Learning Goal 4.11 Notes The graphing calculator can be used to find the solutions of
one-variable equations using graphical and tabular methods. The Graphing Approach:
One way is to enter the left side of the equation in Y1, the right side in Y2, and graph.
The x-value of the point of intersection represents the solution to the original equation.
This point can be determined by using the Zoom and Trace features of the calculator.
The Tabular Approach: Another way is to use the tabular feature of the calculator. The x-value
where Y1 and Y2 are equal is the solution to the equation. To zoom-in to more precise values on the table, use the delta-table (Δ TBL)
command to adjust the increment. Solutions should be checked by substituting it into the original equation.

Learning Goal 4.11 Notes The graphing calculator can be used to find the
solutions of one-variable equations using graphical and tabular methods. One way is to enter the left side of the equation in Y1, the
right side in Y2, and graph. The x-value of the point of intersection represents the
solution to the original equation. This point can be determined by using the Zoom and Trace
features of the calculator.
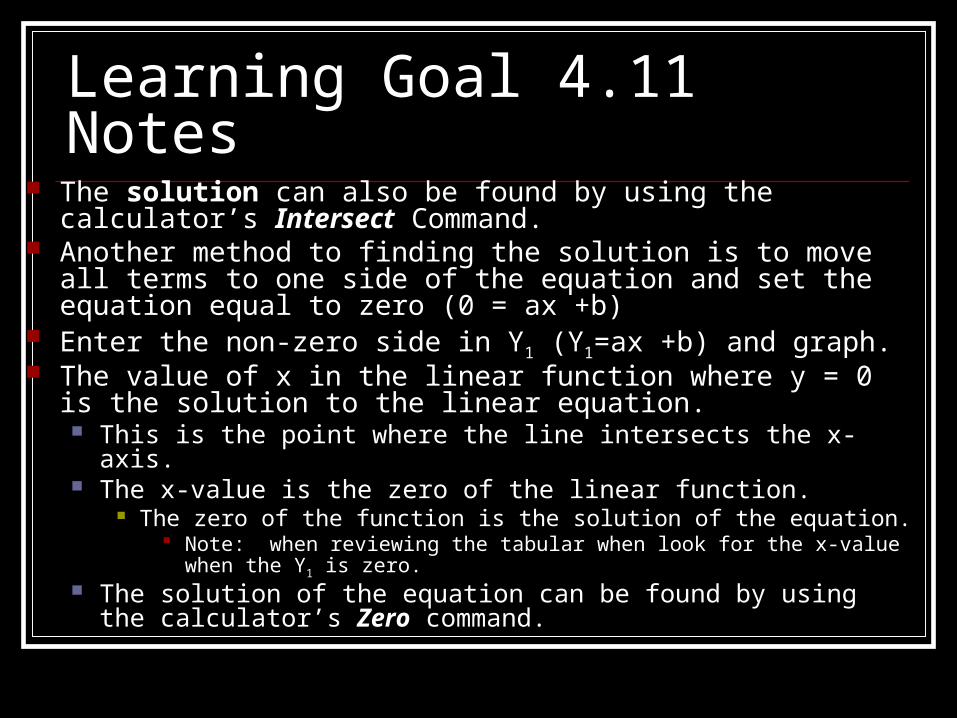
Learning Goal 4.11 Notes The solution can also be found by using the calculator’s
Intersect Command. Another method to finding the solution is to move all terms to one
side of the equation and set the equation equal to zero (0 = ax +b)
Enter the non-zero side in Y1 (Y1=ax +b) and graph. The value of x in the linear function where y = 0 is the solution to
the linear equation. This is the point where the line intersects the x-axis. The x-value is the zero of the linear function.
The zero of the function is the solution of the equation. Note: when reviewing the tabular when look for the x-value when the Y1 is
zero. The solution of the equation can be found by using the calculator’s
Zero command.
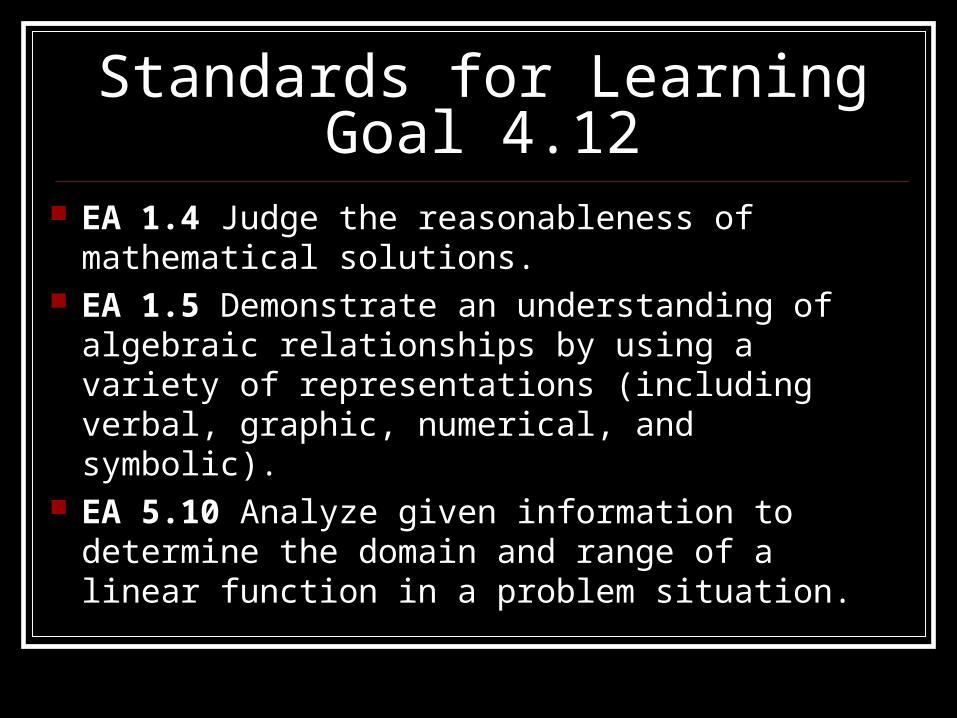
Standards for Learning Goal 4.12 EA 1.4 Judge the reasonableness of
mathematical solutions. EA 1.5 Demonstrate an understanding of
algebraic relationships by using a variety of representations (including verbal, graphic, numerical, and symbolic).
EA 5.10 Analyze given information to determine the domain and range of a linear function in a problem situation.

Essential Questions for Learning Goal 4.12
Are the domain values reasonable for the given situation?

Learning Goal 4.12 Notes
The domain of linear functions is the set of all real numbers, in many real-world situations the domain is limited to positive real numbers or whole numbers.

Standards for Learning Goal 4.13 EA 1.1 Communicate a knowledge of algebraic
relationships by using mathematical terminology appropriately.
EA 1.2 Connect algebra with other branches of mathematics.
EA 1.3 Apply algebraic methods to solve problems in real-world contexts.
EA 1.5 Demonstrate an understanding of algebraic relationships by using a variety of
representations (including verbal, graphic, numerical, and symbolic).

Standards for Learning Goal 4.13(Continued)
EA 1.7 Understand how to represent algebraic relationships by using tools such as handheld computing devices, spreadsheets, and computer algebra systems (CASs).
EA 4.4 Use a procedure to write an equation of a trend line from a given scatterplot.
EA 4.5 Analyze a scatterplot to make predictions.

Essential Questions for Learning Goal 4.13
How do I use a line of best fit?

Learning Goal 4.13 Notes
A scatter plot shows the relationship between two quantitative variables.
It gives a visual impression of how strongly x-values and y-values are related.
Scatter plots alone are not sufficient to make precise statements and draw conclusions from data.
A correlation coefficient is a numerical assessment of the strength of the relationship between x and y values in a set of ordered pairs; it ranges from -1 to 1.

Learning Goal 4.13 Notes
A strong linear relationship is indicated if the absolute value of the correlation coefficient (r) is close to 1.
If the value of (r) is close to zero, the relationship is not linear.
The value of correlation coefficient may appear on the calculator screen when linear regression is performed.

Learning Goal 4.13 Notes The association between two variables may be
described as positive correlation, negative correlation, or no correlation. Positive Correlation among data means that an increase in x
is associated with an increase in y. Negative Correlation among data means that as x increases,
y tends to decrease. No Correlation among data means that it is indicative of no
association between x and y; there is no tendency for y to either increase or decrease as x increases.
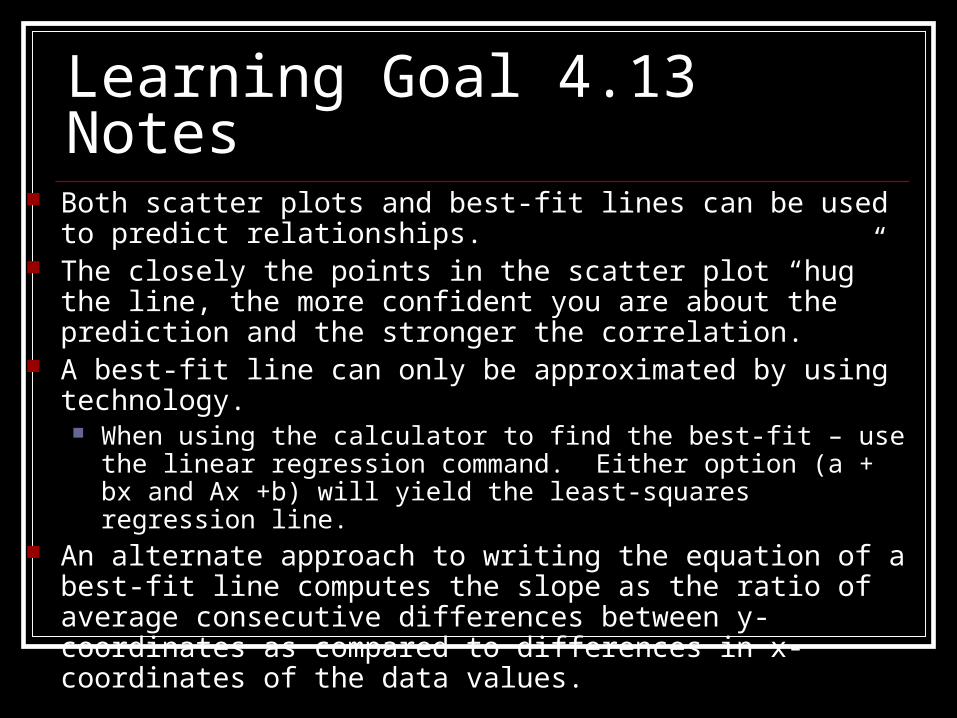
Learning Goal 4.13 Notes Both scatter plots and best-fit lines can be used to predict
relationships. The closely the points in the scatter plot “hug” the line, the more
confident you are about the prediction and the stronger the correlation.
A best-fit line can only be approximated by using technology. When using the calculator to find the best-fit – use the linear
regression command. Either option (a + bx and Ax +b) will yield the least-squares regression line.
An alternate approach to writing the equation of a best-fit line computes the slope as the ratio of average consecutive differences between y-coordinates as compared to differences in x-coordinates of the data values.

Learning Goal 4.13 NotesA strong correlation indicates that two sets of data are
related; however, it does not tell you why the two sets are related, or if changes in one set of data are causing the changes in the other set of data.
A best-fit line may be used to make predictions that are reasonable. When making predictions – use input values that are
reasonable, or close to the x values in the data being studied. For example, when predicting height from age, there are
limitations on both age and height that should be considered.

Work Cited Carter, John A., et. al. Glencoe
Mathematics Algebra I. New York: Glencoe/McGraw-Hill, 2003.
Greenville County Schools Math Curriculum Guide
Gizmos http://www.explorelearning.com