Unit 19: Analyzing Accelerated Life Test Dataweb.utk.edu/~leon/rel/Fall04pdfs/567Unit19.pdf · Unit...
71
10/23/2004 Unit 19 - Stat 567 - Ramón León 1 Unit 19: Analyzing Accelerated Life Test Data Notes largely based on “Statistical Methods for Reliability Data” by W.Q. Meeker and L. A. Escobar, Wiley, 1998 and on their class notes. Ramón V. León
Transcript of Unit 19: Analyzing Accelerated Life Test Dataweb.utk.edu/~leon/rel/Fall04pdfs/567Unit19.pdf · Unit...

10/23/2004 Unit 19 - Stat 567 - Ramón León 1
Unit 19: Analyzing Accelerated Life Test Data
Notes largely based on “Statistical Methods for Reliability Data”
by W.Q. Meeker and L. A. Escobar, Wiley, 1998 and on their class notes.
Ramón V. León

10/23/2004 Unit 19 - Stat 567 - Ramón León 2
Unit 19 Objectives
• Describe and illustrate nonparametric and graphical methods of analyzing and presenting accelerated life test data
• Describe and illustrate maximum likelihood methods of analyzing and making inferences from accelerated life test data
• Illustrate different kinds of data and ALT models• Discuss some specialized applications of
accelerated testing
10/23/2004 Unit 19 - Stat 567 - Ramón León 3
Example: Temperature-Accelerated Life Test on Device-A (from Hooper and Amster, 1990)
• Data – Singly right censored observations from temperature-
accelerated life test• Purpose
– To determine if the device would meet its hazard function objective at 10,000 and 30,000 hours at operating temperature of 10°C
• We will show how to fit an accelerated life regression model to these data to answer this and other questions

10/23/2004 Unit 19 - Stat 567 - Ramón León 4
Hours Versus Temperature Data from a Temperature-Accelerated Life Test on Device-A

10/23/2004 Unit 19 - Stat 567 - Ramón León 5
Device-A Hours Versus Temperature (Hooper and Amster 1990)

10/23/2004 Unit 19 - Stat 567 - Ramón León 6
ALT Data Plot
• Examine a scatter plot of lifetime versus stress data
• Use different symbols for censored observations
• Note: Heavy censoring makes it difficult to identify the form of the life/stress relationship from this plot
10/23/2004 Unit 19 - Stat 567 - Ramón León 7
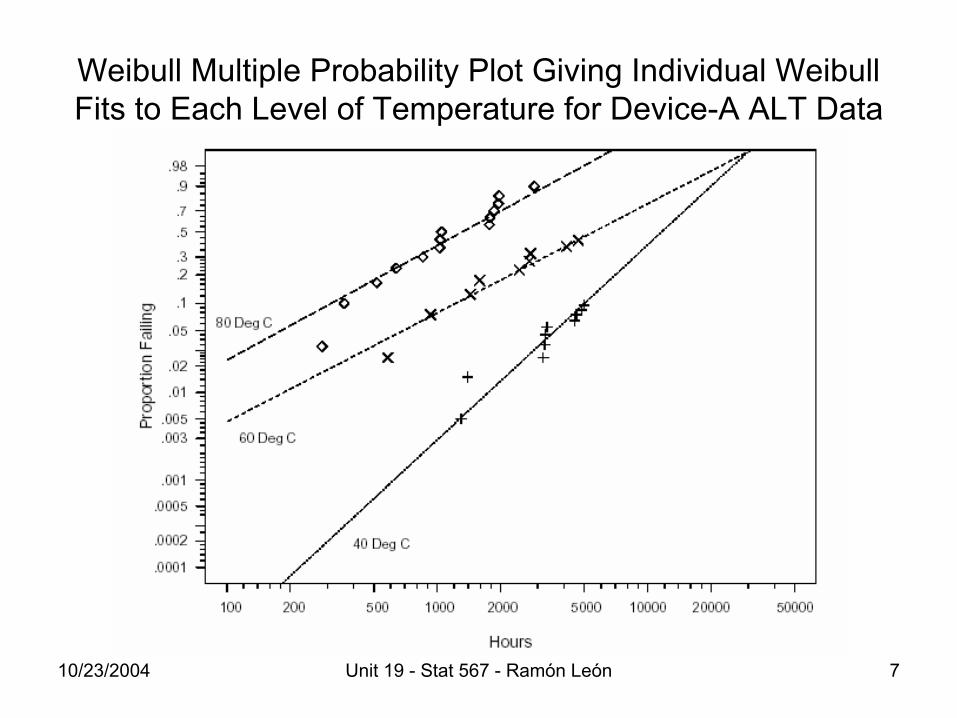
Weibull Multiple Probability Plot Giving Individual Weibull Fits to Each Level of Temperature for Device-A ALT Data
10/23/2004 Unit 19 - Stat 567 - Ramón León 8
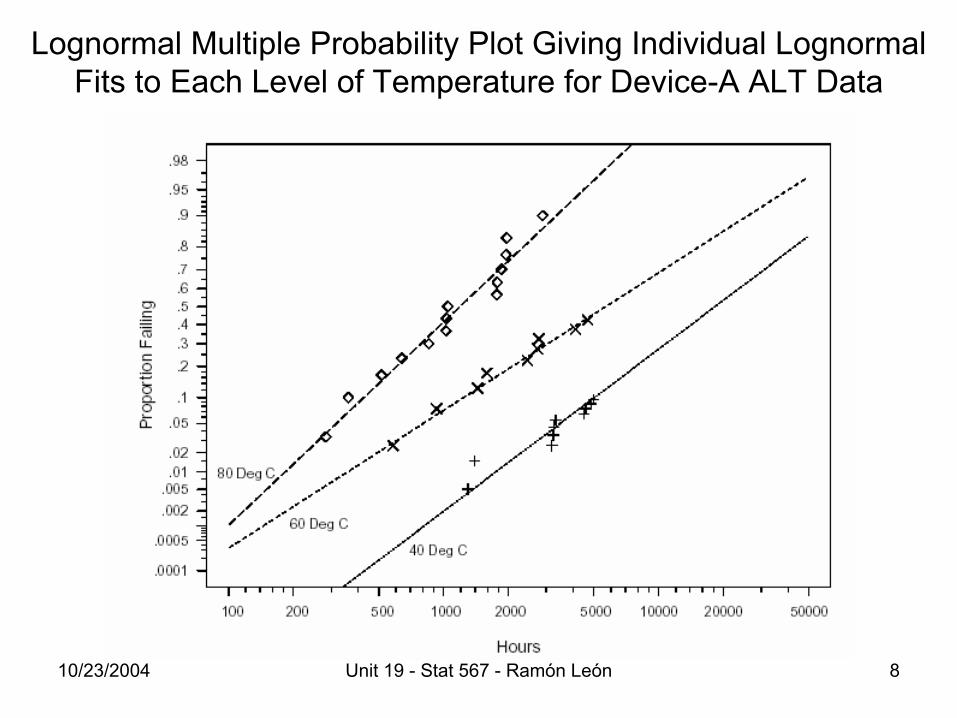
Lognormal Multiple Probability Plot Giving Individual Lognormal Fits to Each Level of Temperature for Device-A ALT Data

10/23/2004 Unit 19 - Stat 567 - Ramón León 9
ALT Multiple Probability Plot of Nonparametric Estimates at Individual Levels of Acceleration Variables
• Compute nonparametric estimates of F for each level of accelerating variable; plot on a single probability plot.
• Try to identify a distributional model that fits the data well at all of the stress-levels
• Note: Either the lognormal or the Weibull distribution model provides a reasonable description for the device-A data. But the lognormal distribution provides a better fit to the individual sub-experiments.
10/23/2004 Unit 19 - Stat 567 - Ramón León 10
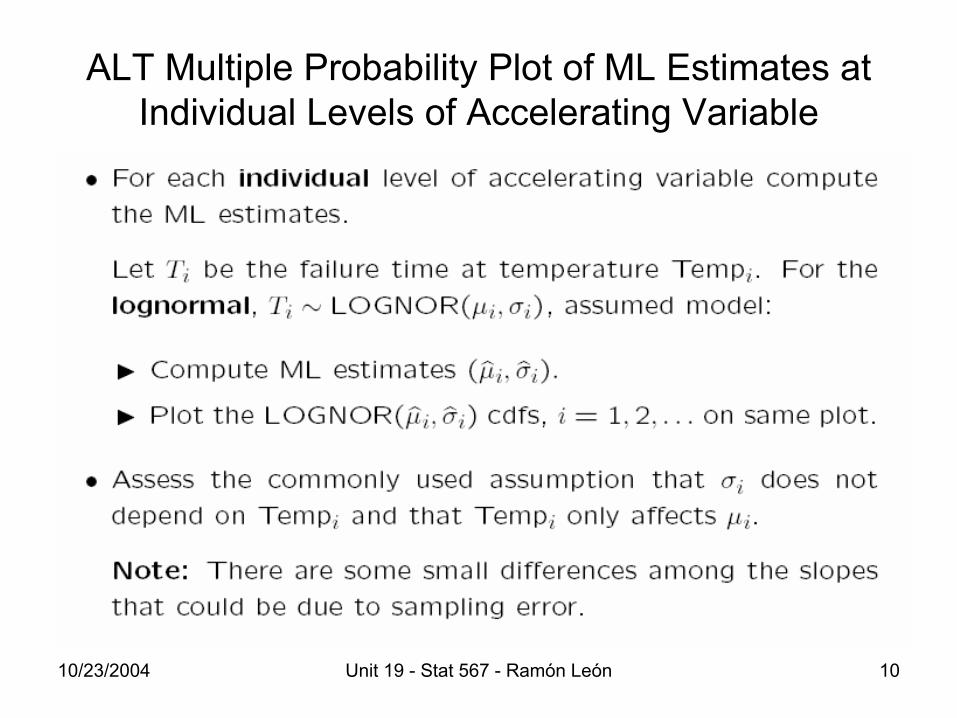
ALT Multiple Probability Plot of ML Estimates at Individual Levels of Accelerating Variable

10/23/2004 Unit 19 - Stat 567 - Ramón León 11
Device-A ALT Lognormal ML Estimation Results at Individual Temperatures
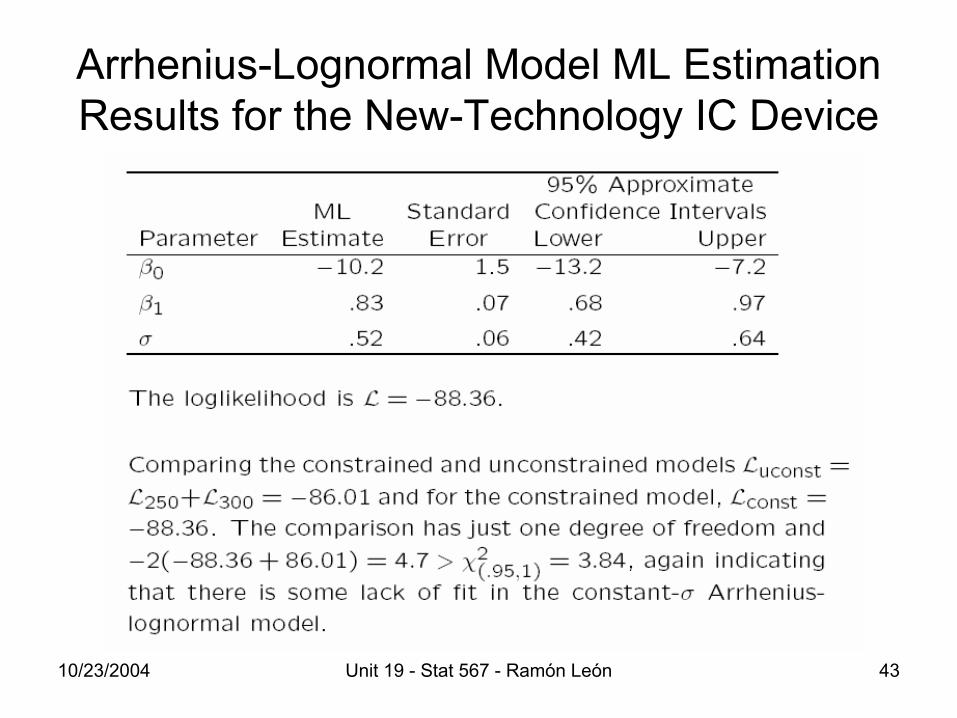
Total likelihood = -320.76
10/23/2004 Unit 19 - Stat 567 - Ramón León 12
Strategy for Analyzing ALT Data• For ALT data consisting of a number of sub-
experiments, each having been run at a particular set of conditions:– Examine the data graphically: Scatter and probability
plots.– Analyze individual sub-experiment data– Examine a multiple probability plot– Fit an overall model involving a life/stress relationship– Perform residual analysis and other diagnostic checks– Assess the reasonableness of using the ALT data to
make the desired inferences

10/23/2004 Unit 19 - Stat 567 - Ramón León 13
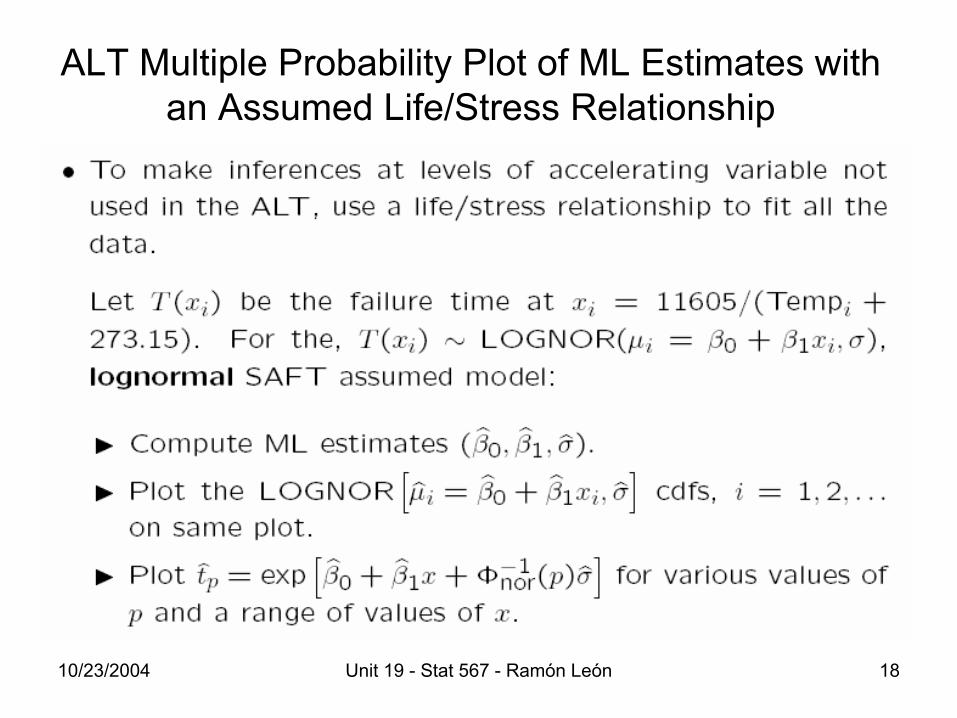
The Arrhenius-Lognormal Regression Model
10/23/2004 Unit 19 - Stat 567 - Ramón León 14
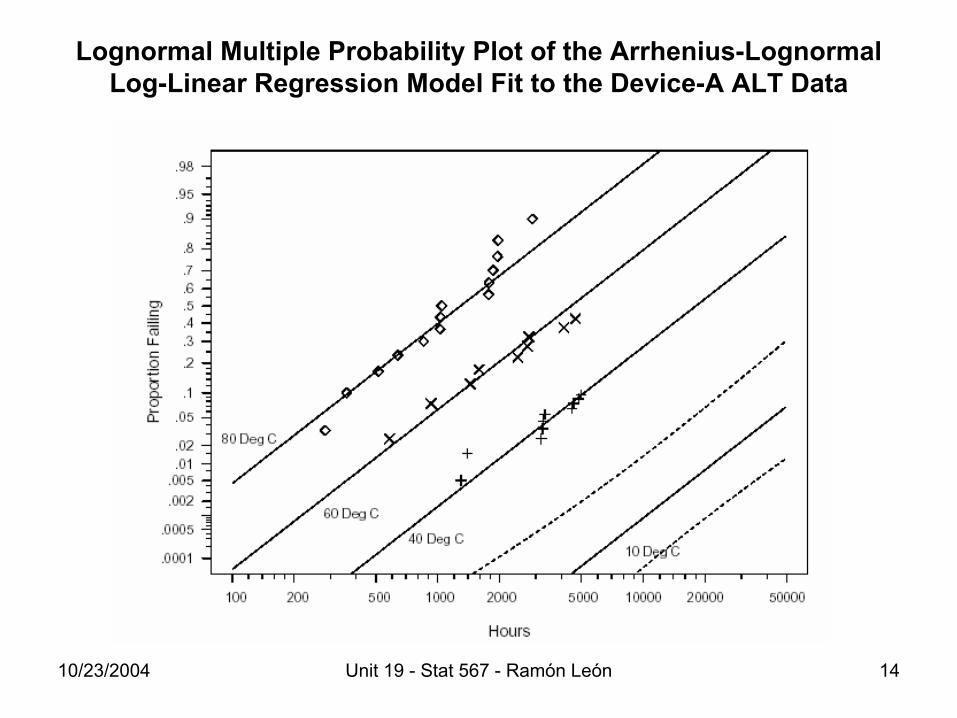
Lognormal Multiple Probability Plot of the Arrhenius-Lognormal Log-Linear Regression Model Fit to the Device-A ALT Data
10/23/2004 Unit 19 - Stat 567 - Ramón León 15
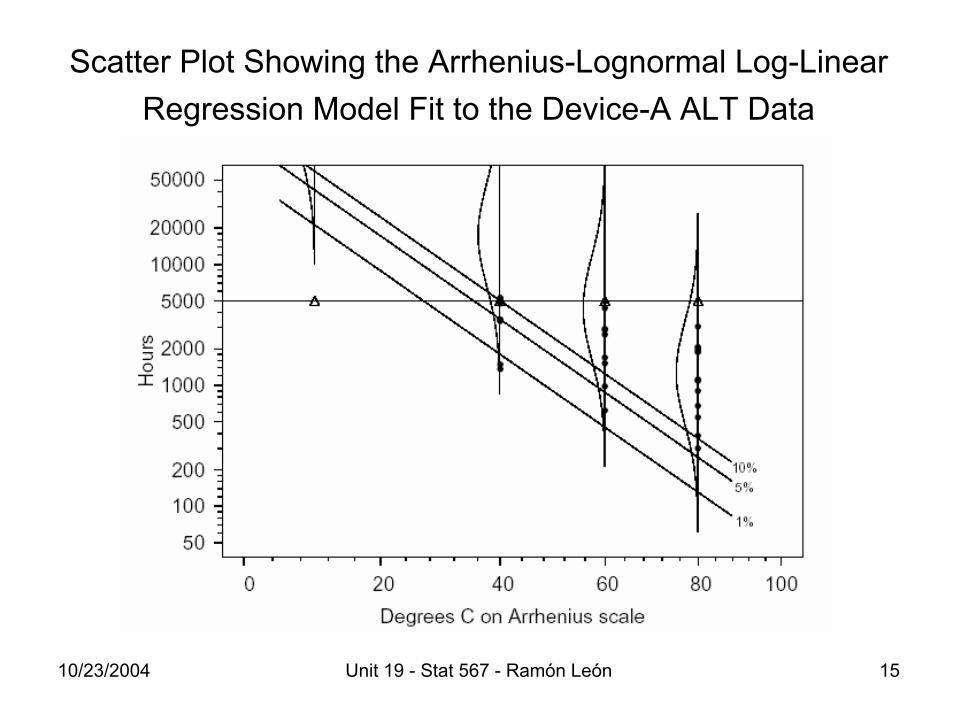
Scatter Plot Showing the Arrhenius-Lognormal Log-Linear Regression Model Fit to the Device-A ALT Data

10/23/2004 Unit 19 - Stat 567 - Ramón León 16
ML Estimation Results for the Device-A ALT Data and the Arrhenius-Lognormal Regression Model
10/23/2004 Unit 19 - Stat 567 - Ramón León 17
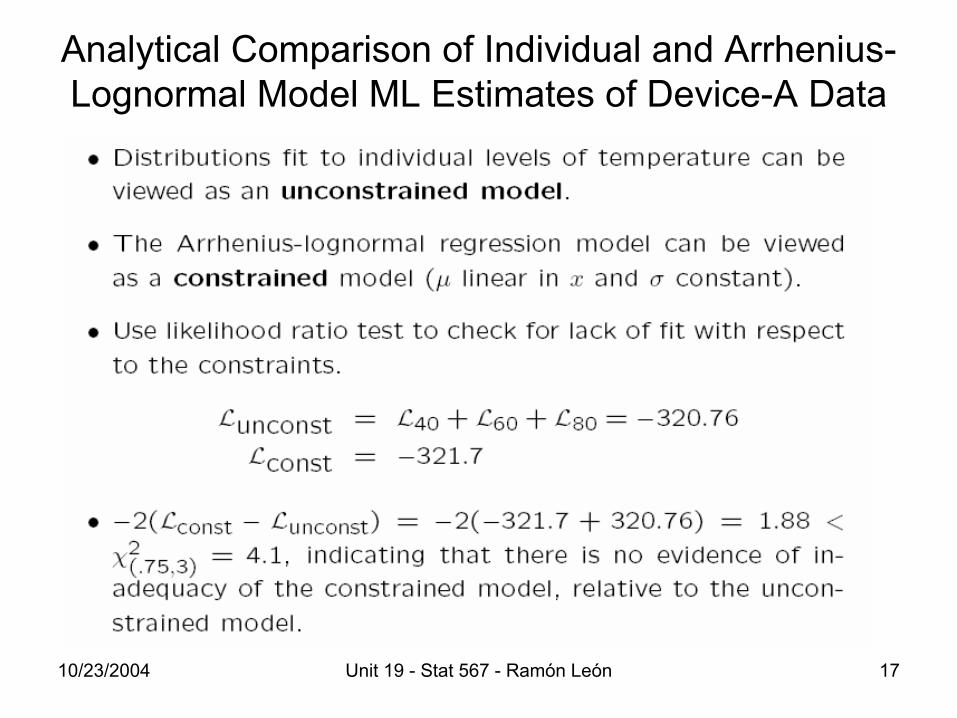
Analytical Comparison of Individual and Arrhenius-Lognormal Model ML Estimates of Device-A Data
10/23/2004 Unit 19 - Stat 567 - Ramón León 18
ALT Multiple Probability Plot of ML Estimates with an Assumed Life/Stress Relationship

10/23/2004 Unit 19 - Stat 567 - Ramón León 19
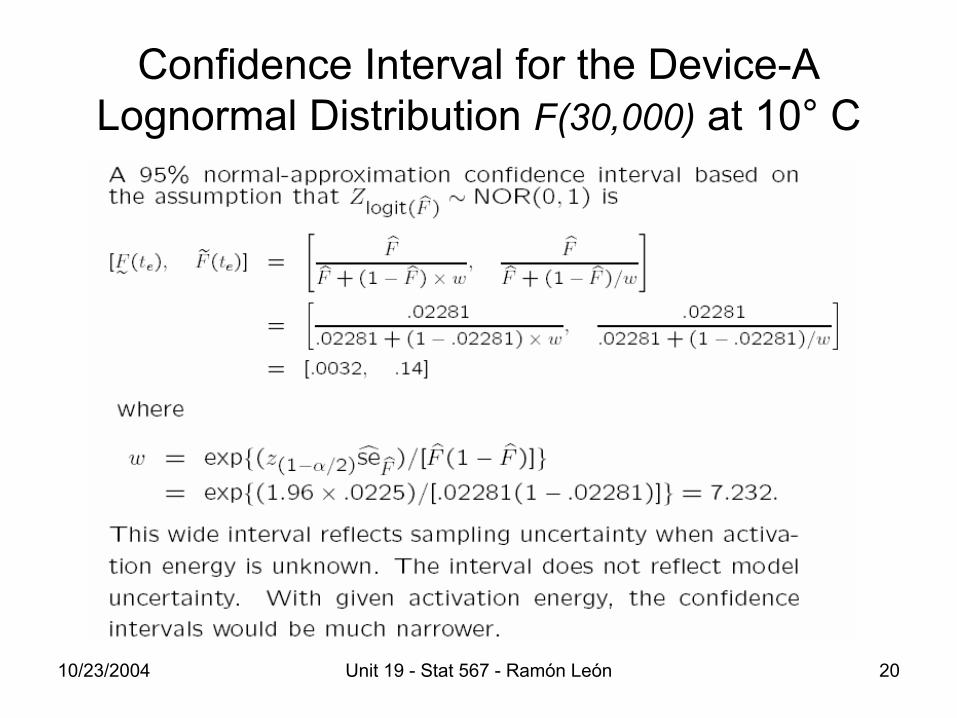
ML Estimation for the Device-A Lognormal Distribution F(30,000) at 10° C
Using Formula (17.11) in the textbook
10/23/2004 Unit 19 - Stat 567 - Ramón León 20
Confidence Interval for the Device-A Lognormal Distribution F(30,000) at 10° C
10/23/2004 Unit 19 - Stat 567 - Ramón León 21
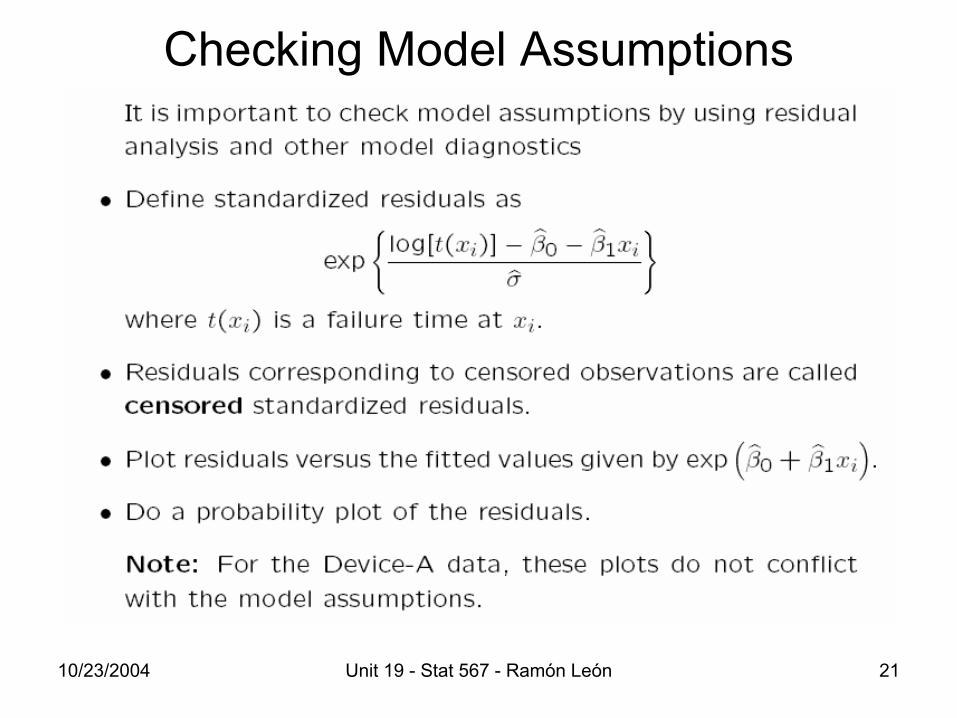
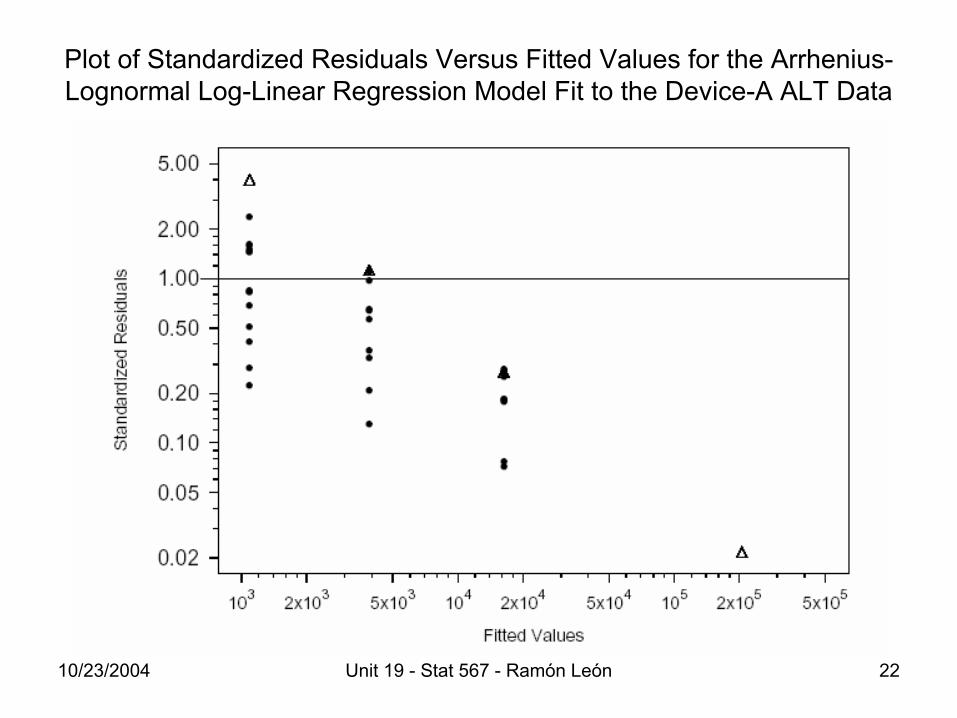
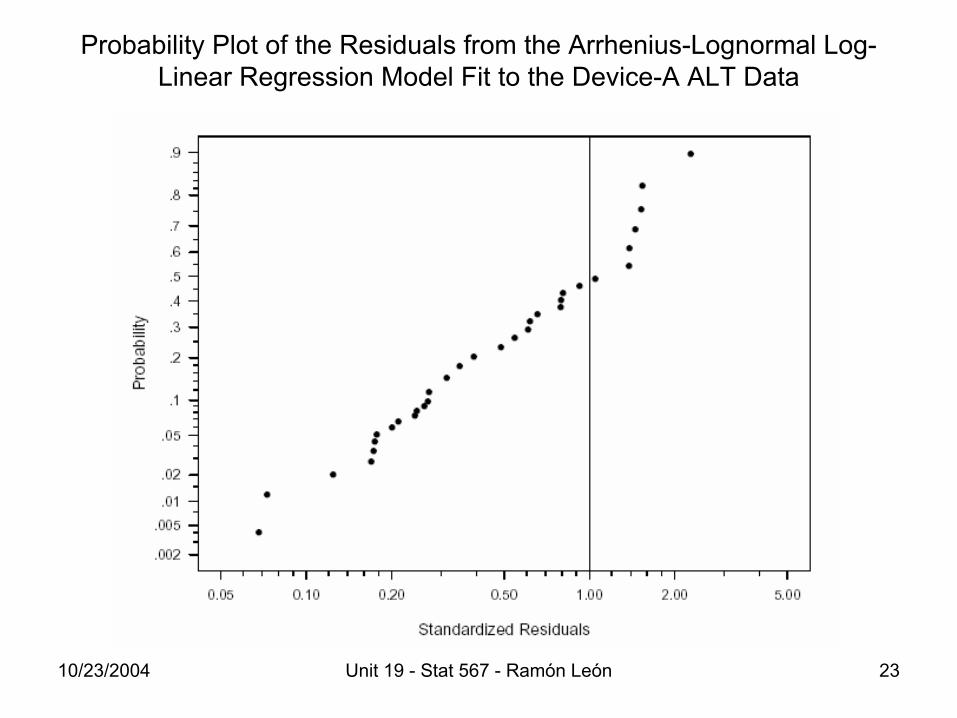
Checking Model Assumptions
10/23/2004 Unit 19 - Stat 567 - Ramón León 22
Plot of Standardized Residuals Versus Fitted Values for the Arrhenius-Lognormal Log-Linear Regression Model Fit to the Device-A ALT Data
10/23/2004 Unit 19 - Stat 567 - Ramón León 23
Probability Plot of the Residuals from the Arrhenius-Lognormal Log-Linear Regression Model Fit to the Device-A ALT Data
10/23/2004 Unit 19 - Stat 567 - Ramón León 24
Some Practical Suggestions• Build on previous experience with similar
products and materials• Use pilot experiments; evaluate the effect of
stress on degradation and life• Seek physical understanding of causes of failure• Use results from failure mode analysis• Seek physical justification for life/stress
relationships• Design tests to limit the amount of extrapolation
needed for desired inferences• See Nelson (1990)
10/23/2004 Unit 19 - Stat 567 - Ramón León 25
Inferences from AT Experiments• Inferences or predictions from ATs require
important assumptions about:– Focused correctly on relevant failure modes– Adequacy of AT model for extrapolation– AT manufacturing testing processes can be related to
actual manufacturing/use of product• Important sources of variability usually
overlooked• Deming would call ATs analytic studies
(See Hahn and Meeker, 1993, American Statistician)
10/23/2004 Unit 19 - Stat 567 - Ramón León 26
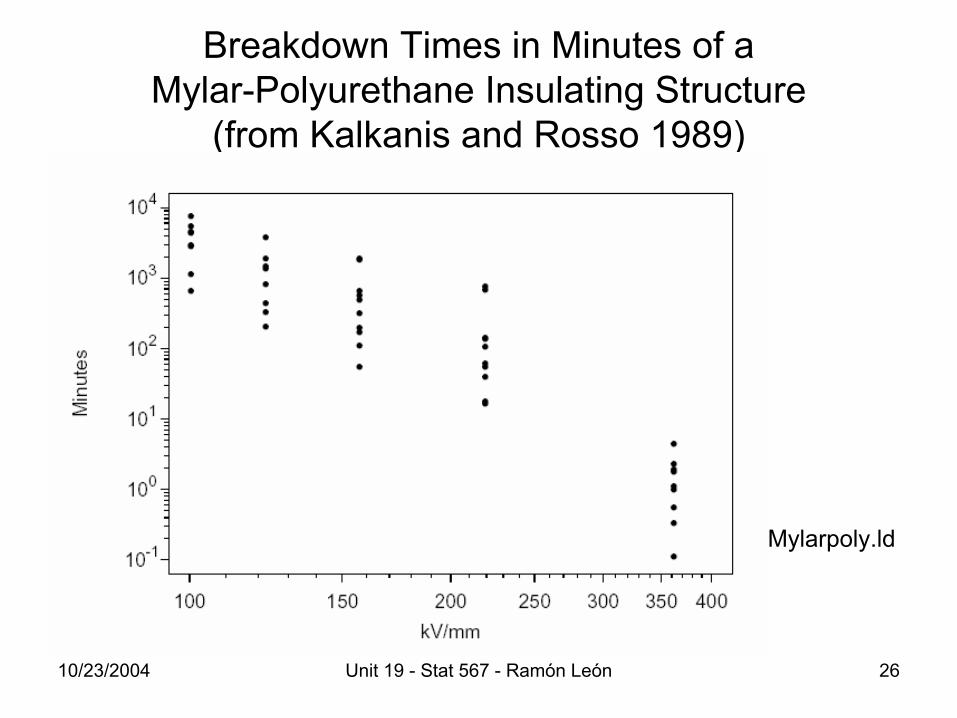
Breakdown Times in Minutes of a Mylar-Polyurethane Insulating Structure
(from Kalkanis and Rosso 1989)
Mylarpoly.ld

10/23/2004 Unit 19 - Stat 567 - Ramón León 27
Accelerated Life Test of a Mylar-Polyurethane Laminated Direct Current High Voltage Insulating Structure
• Data from Kalkanis and Rosso (1989)• Time to dielectric breakdown of units tested at 100.3,
122.4, 157.1, 219.0, and 361.4 kV/mm• Needed to evaluate the reliability of the insulating
structure and to estimate the life distribution at system design voltages (e.g. 50 kV/mm
• Except for the highest level of voltage, the relationship between log life and log voltage appears to be approximately linear
• Failure mechanism probably different at 361.4 kV/mm
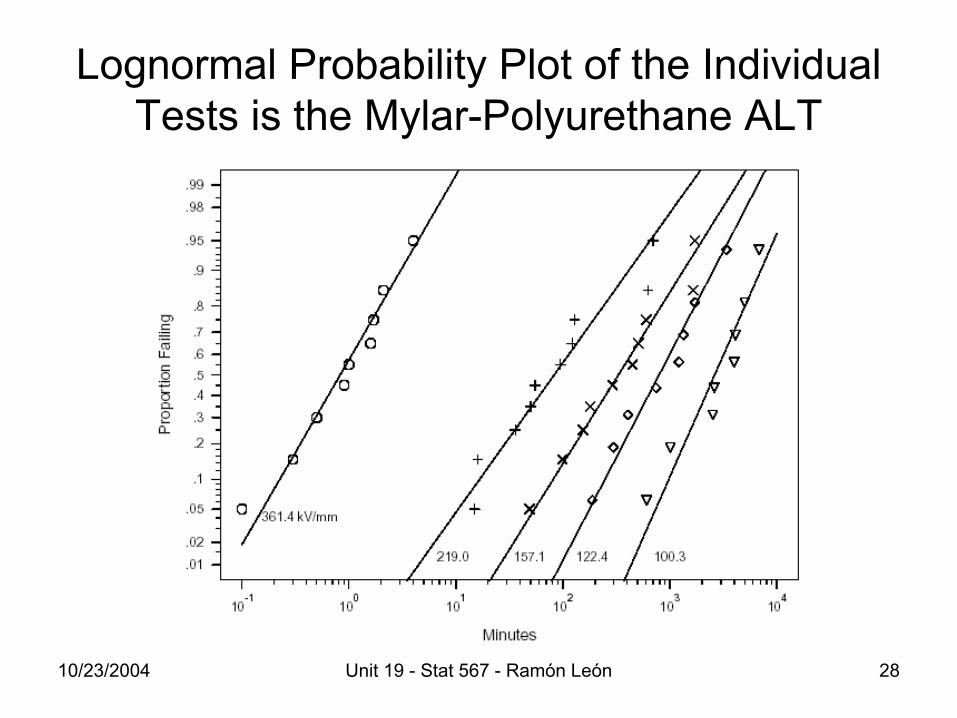
10/23/2004 Unit 19 - Stat 567 - Ramón León 28
Lognormal Probability Plot of the Individual Tests is the Mylar-Polyurethane ALT

10/23/2004 Unit 19 - Stat 567 - Ramón León 29
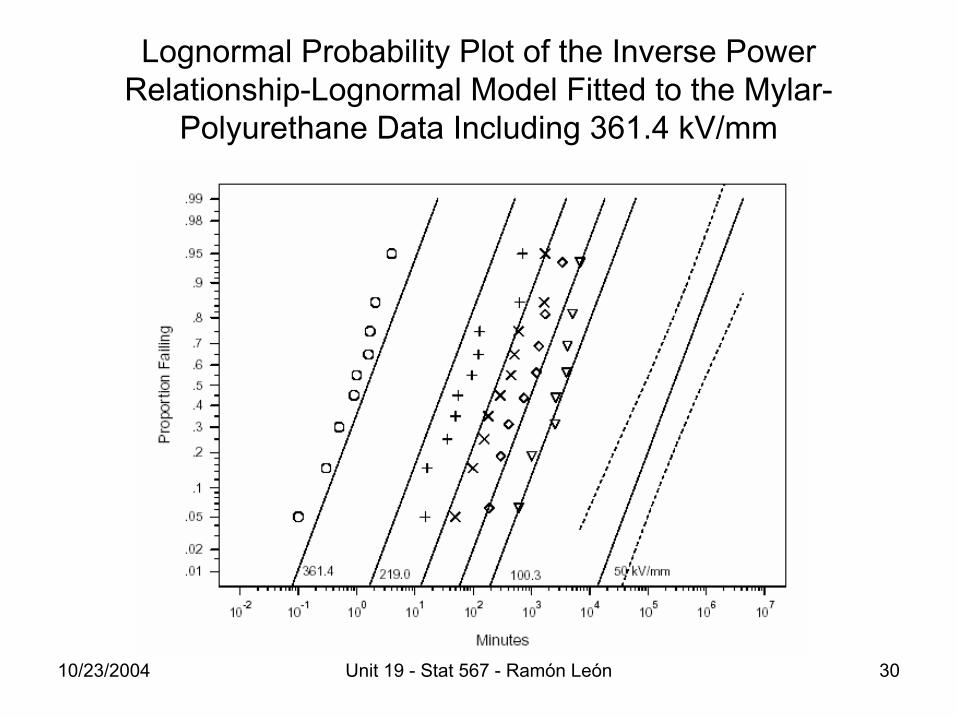
Inverse Power Relationship-Lognormal Model
10/23/2004 Unit 19 - Stat 567 - Ramón León 30
Lognormal Probability Plot of the Inverse Power Relationship-Lognormal Model Fitted to the Mylar-
Polyurethane Data Including 361.4 kV/mm
10/23/2004 Unit 19 - Stat 567 - Ramón León 31
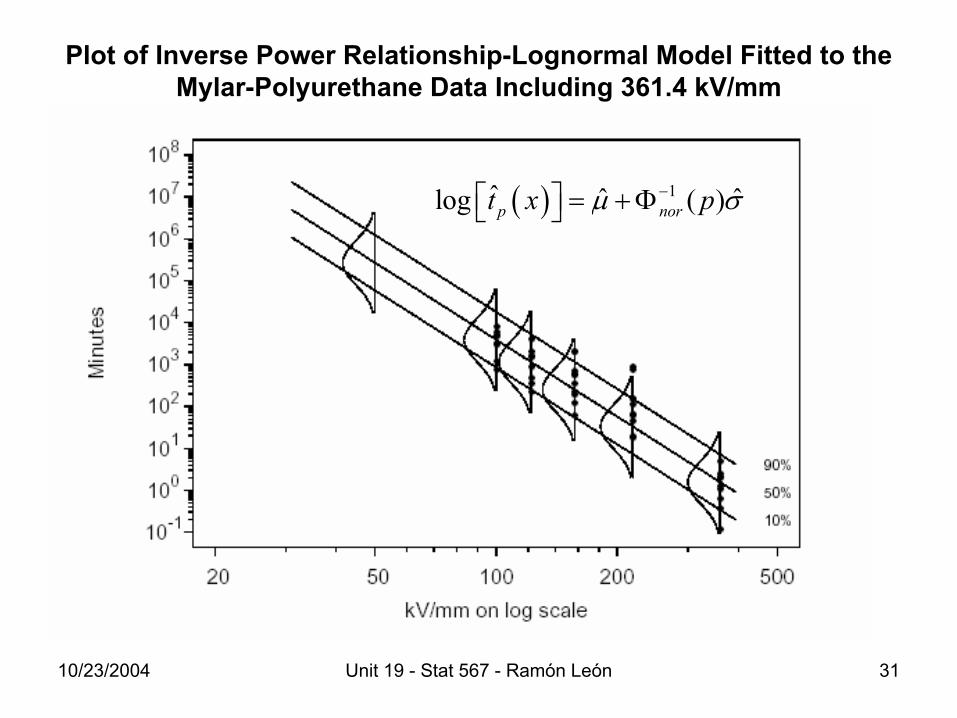
Plot of Inverse Power Relationship-Lognormal Model Fitted to the Mylar-Polyurethane Data Including 361.4 kV/mm
( ) 1ˆ ˆ ˆlog ( )p nort x pµ σ− = +Φ
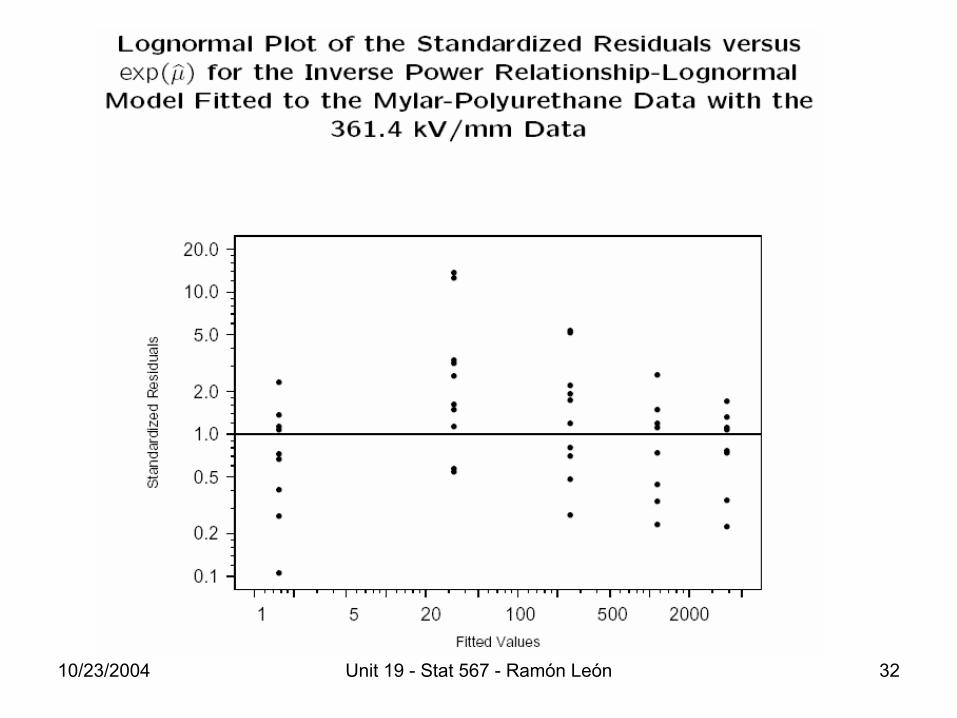
10/23/2004 Unit 19 - Stat 567 - Ramón León 32
10/23/2004 Unit 19 - Stat 567 - Ramón León 33
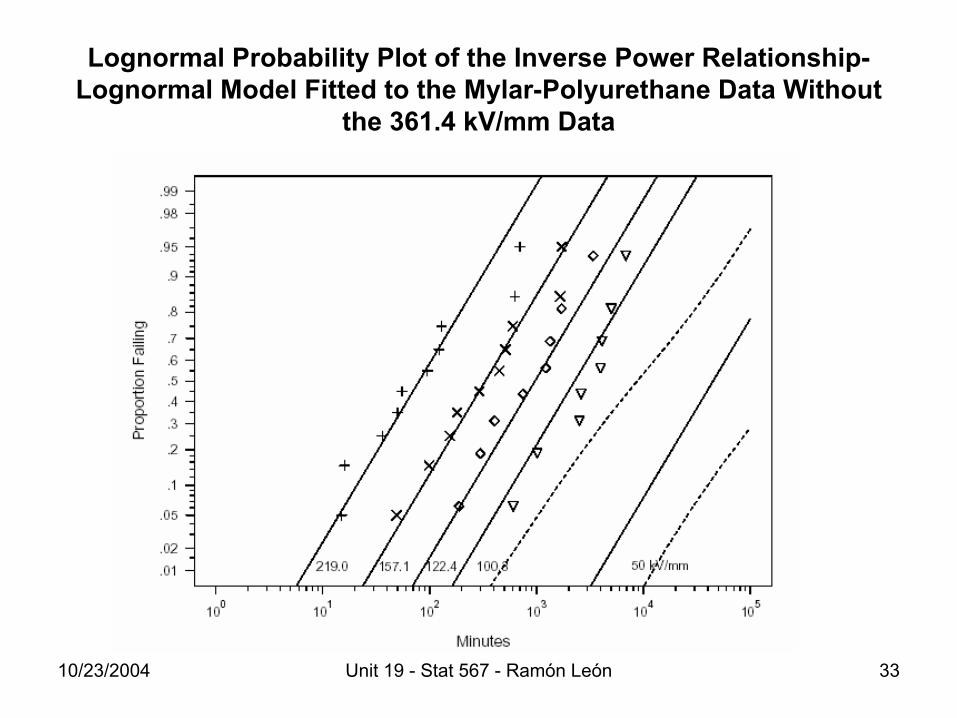
Lognormal Probability Plot of the Inverse Power Relationship-Lognormal Model Fitted to the Mylar-Polyurethane Data Without
the 361.4 kV/mm Data
10/23/2004 Unit 19 - Stat 567 - Ramón León 34
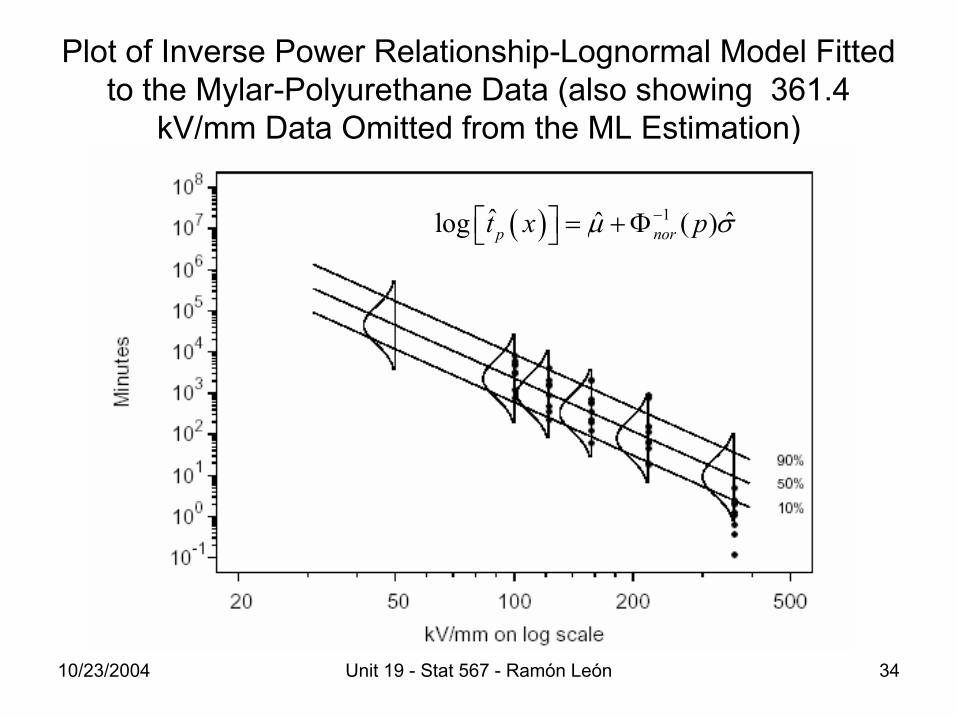
Plot of Inverse Power Relationship-Lognormal Model Fitted to the Mylar-Polyurethane Data (also showing 361.4
kV/mm Data Omitted from the ML Estimation)
( ) 1ˆ ˆ ˆlog ( )p nort x pµ σ− = +Φ
10/23/2004 Unit 19 - Stat 567 - Ramón León 35
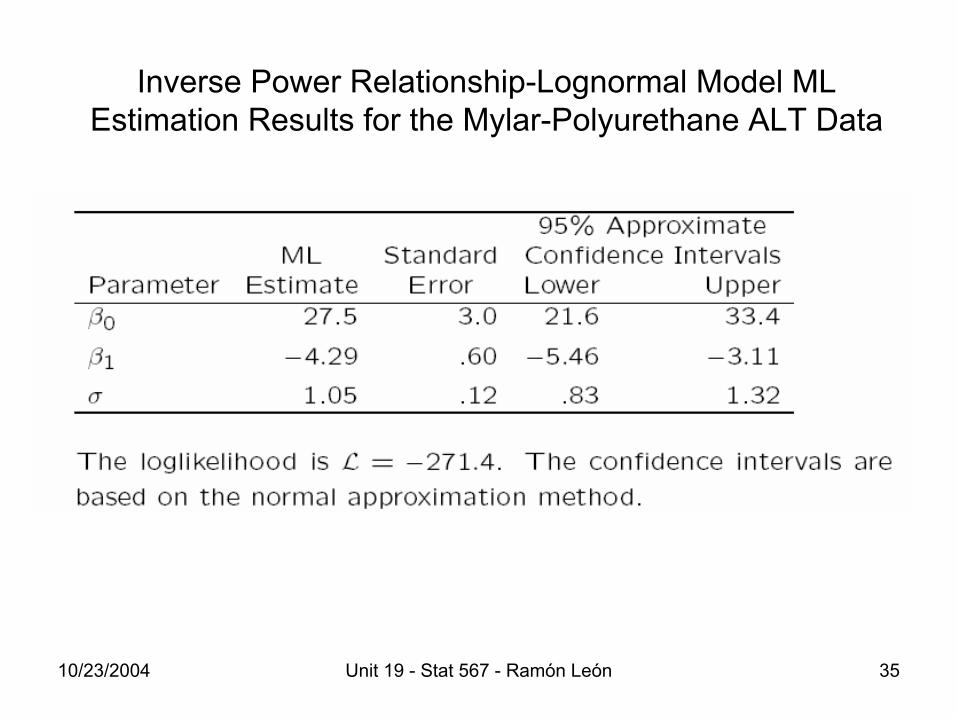
Inverse Power Relationship-Lognormal Model ML Estimation Results for the Mylar-Polyurethane ALT Data
10/23/2004 Unit 19 - Stat 567 - Ramón León 36
10/23/2004 Unit 19 - Stat 567 - Ramón León 37
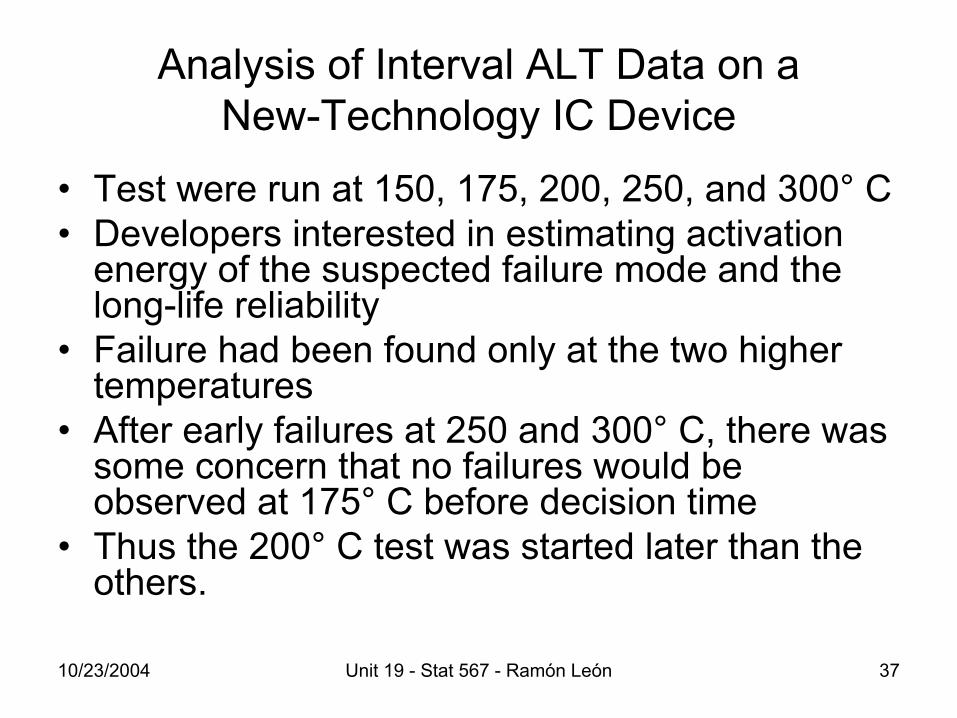
Analysis of Interval ALT Data on a New-Technology IC Device
• Test were run at 150, 175, 200, 250, and 300° C• Developers interested in estimating activation
energy of the suspected failure mode and the long-life reliability
• Failure had been found only at the two higher temperatures
• After early failures at 250 and 300° C, there was some concern that no failures would be observed at 175° C before decision time
• Thus the 200° C test was started later than the others.
10/23/2004 Unit 19 - Stat 567 - Ramón León 38
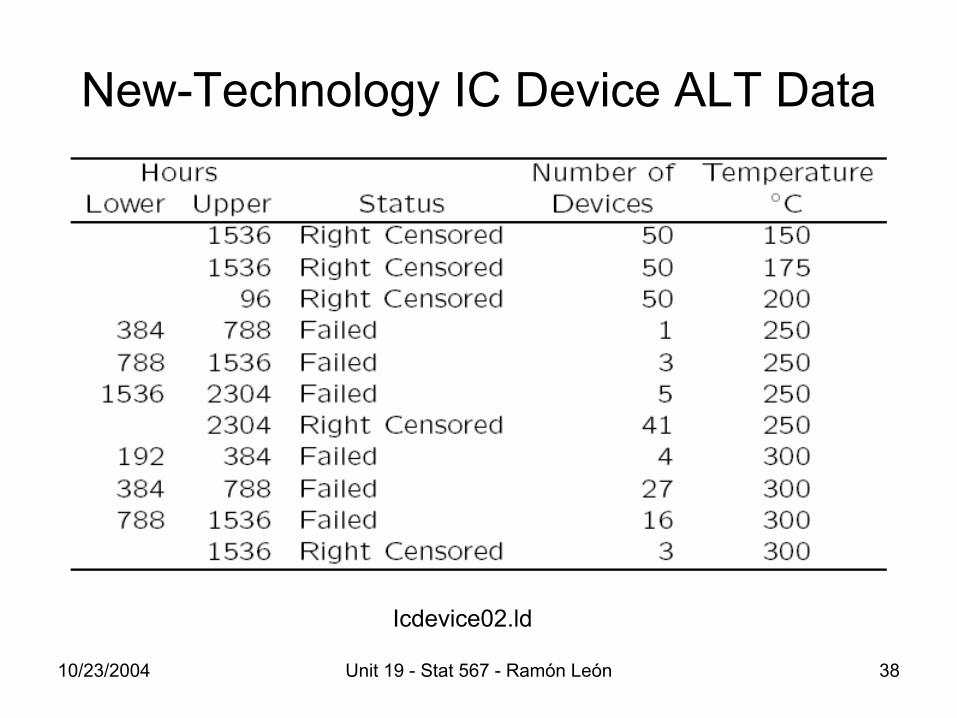
New-Technology IC Device ALT Data
Icdevice02.ld
10/23/2004 Unit 19 - Stat 567 - Ramón León 39
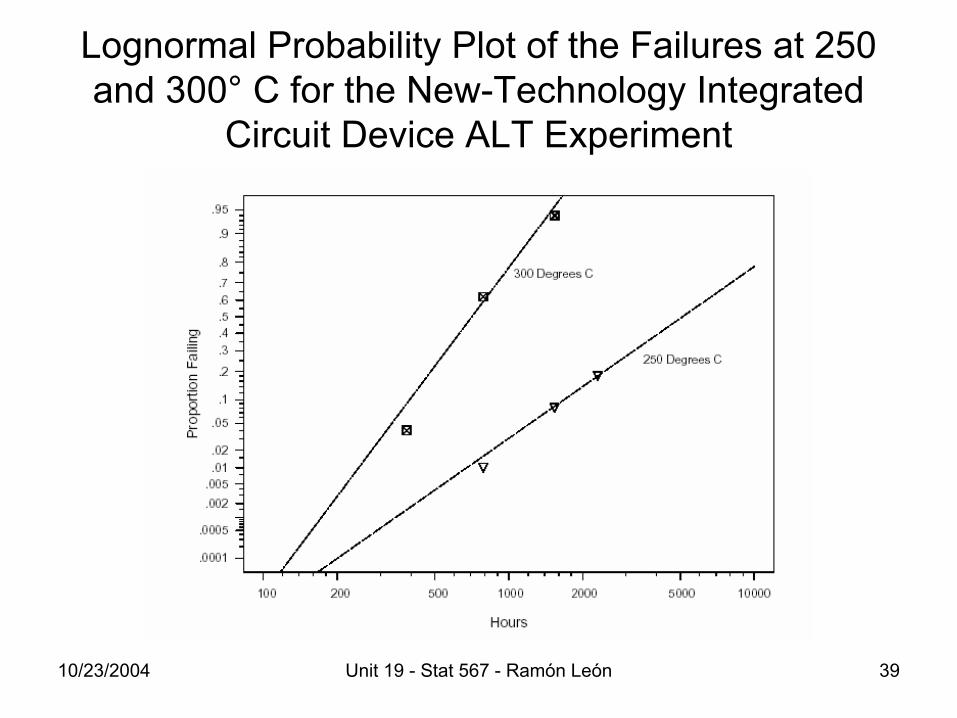
Lognormal Probability Plot of the Failures at 250 and 300° C for the New-Technology Integrated
Circuit Device ALT Experiment

10/23/2004 Unit 19 - Stat 567 - Ramón León 40
Individual Lognormal ML Estimation Results for the New-Technology IC Device

10/23/2004 Unit 19 - Stat 567 - Ramón León 41
SPLIDA LogLikelihood Output
10/23/2004 Unit 19 - Stat 567 - Ramón León 42
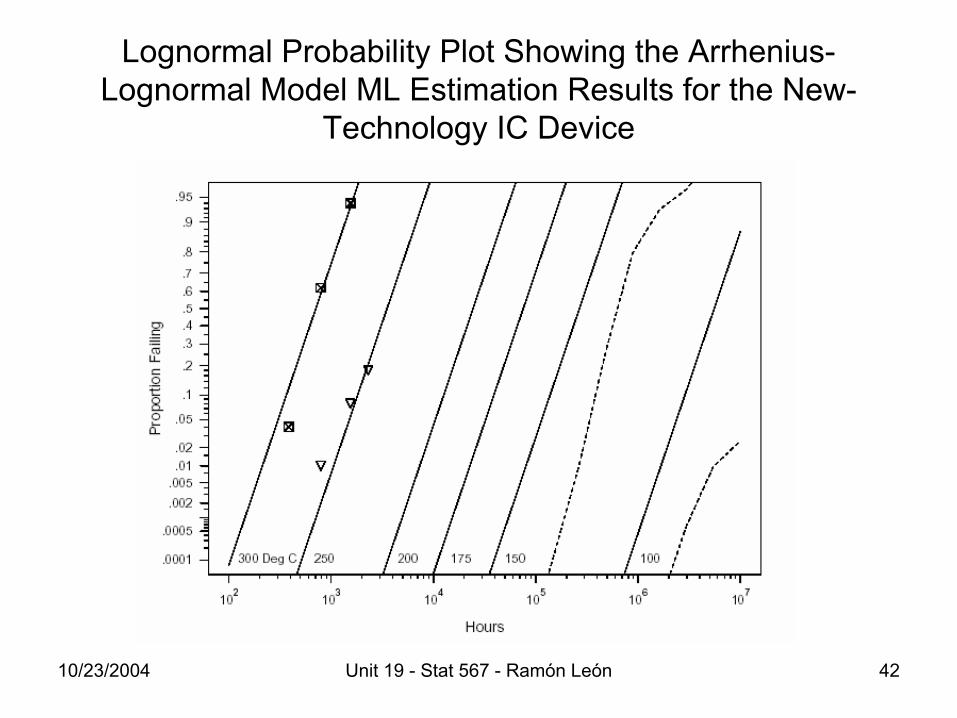
Lognormal Probability Plot Showing the Arrhenius-Lognormal Model ML Estimation Results for the New-
Technology IC Device
10/23/2004 Unit 19 - Stat 567 - Ramón León 43
Arrhenius-Lognormal Model ML Estimation Results for the New-Technology IC Device
10/23/2004 Unit 19 - Stat 567 - Ramón León 44
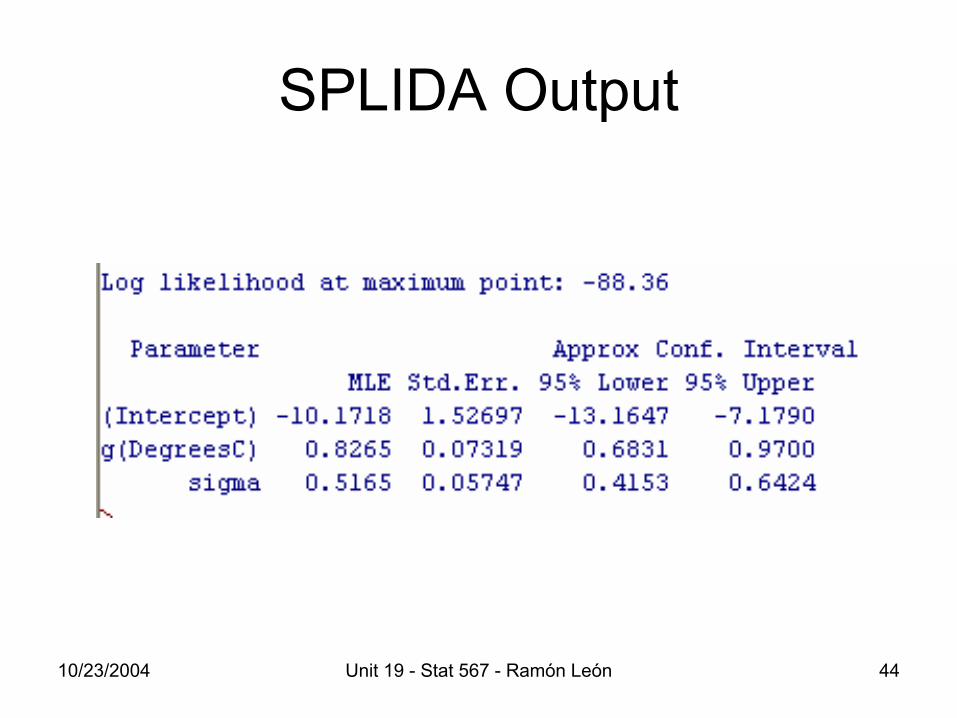
SPLIDA Output
10/23/2004 Unit 19 - Stat 567 - Ramón León 45
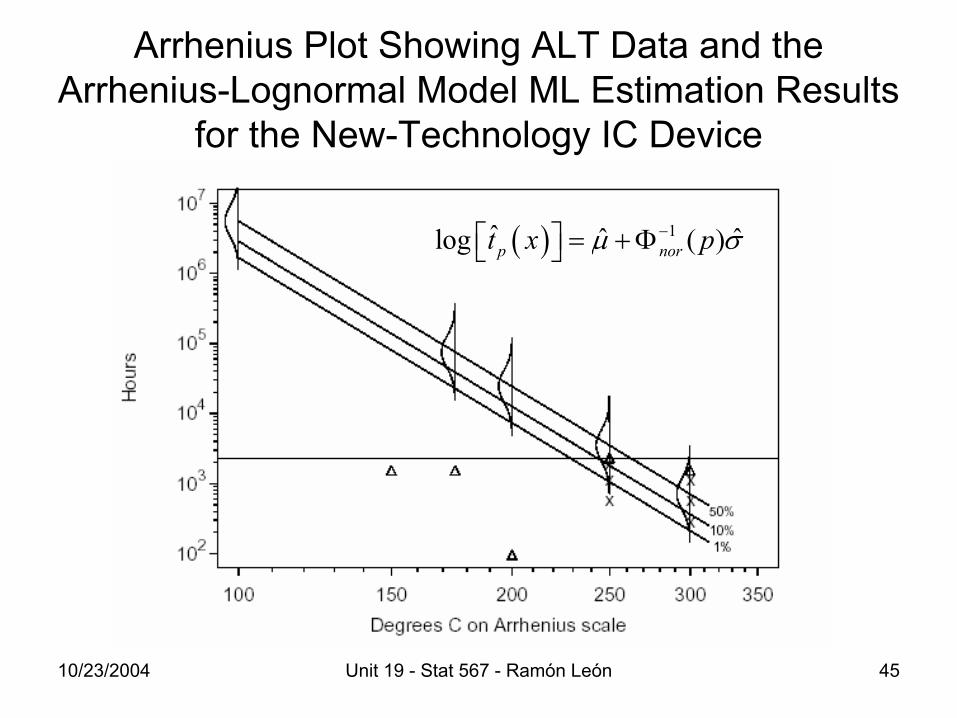
Arrhenius Plot Showing ALT Data and the Arrhenius-Lognormal Model ML Estimation Results
for the New-Technology IC Device
( ) 1ˆ ˆ ˆlog ( )p nort x pµ σ− = +Φ
10/23/2004 Unit 19 - Stat 567 - Ramón León 46
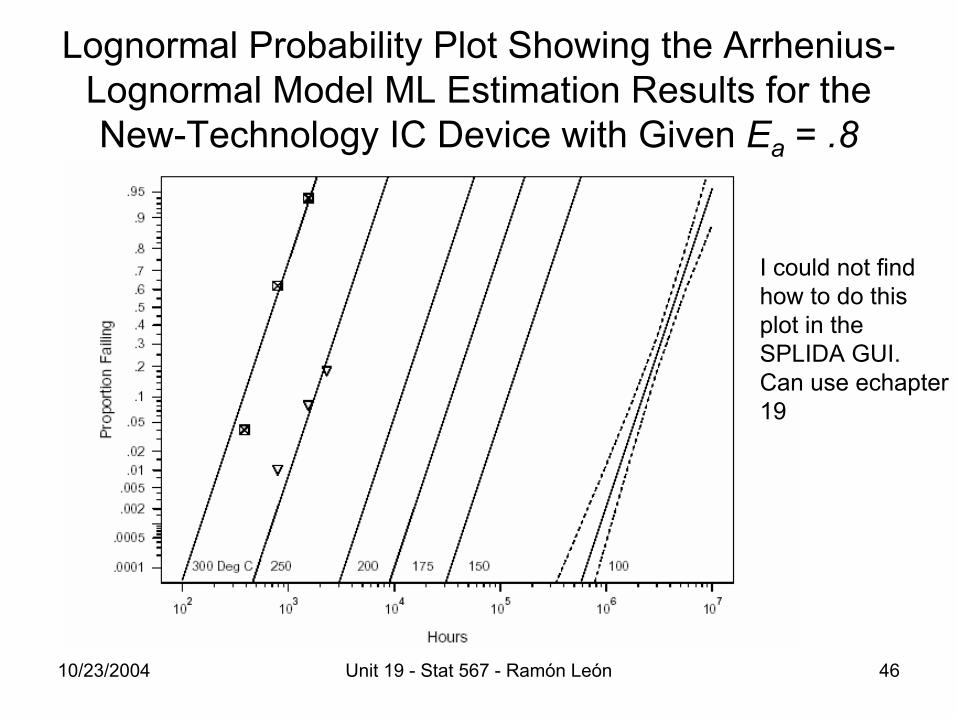
Lognormal Probability Plot Showing the Arrhenius-Lognormal Model ML Estimation Results for the New-Technology IC Device with Given Ea = .8
I could not findhow to do thisplot in theSPLIDA GUI.Can use echapter19
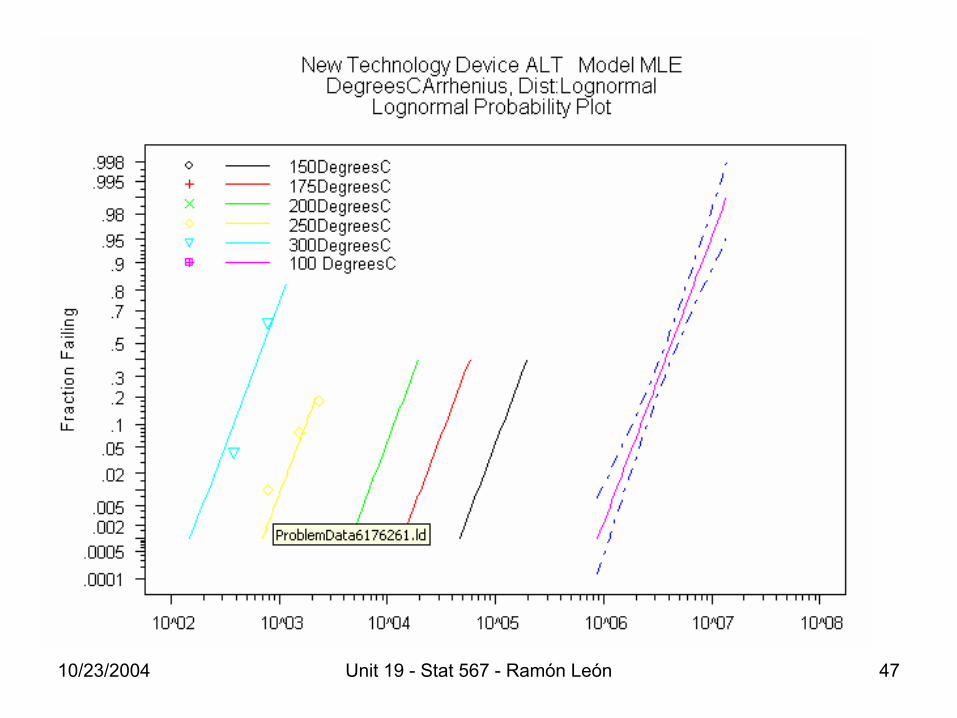
10/23/2004 Unit 19 - Stat 567 - Ramón León 47
10/23/2004 Unit 19 - Stat 567 - Ramón León 48
Pitfall 1: Multiple (Unrecognized) Failure Modes
• High levels of accelerating factors can induce failure modes that would not be observed at normal operating conditions (or otherwise change the life-acceleration factor relationship)
• Other failure modes, if not recognized in data analysis, can lead to incorrect conclusions
• Suggestions– Determine failure mode of failing units– Analyze failure modes separately
10/23/2004 Unit 19 - Stat 567 - Ramón León 49
Pitfall 2: Failure to Properly Quantify Uncertainty
• There is uncertainty in statistical estimates• Standard statistical confidence intervals quantify
uncertainty arising from limited data• Confidence intervals ignore model uncertainty
(which can be tremendously amplified by extrapolation in Accelerated Testing)
• Suggestions– Use confidence intervals to quantify statistical
uncertainty– Use sensitivity analysis to assess the effect of
departures from model assumptions and uncertainty in other inputs
10/23/2004 Unit 19 - Stat 567 - Ramón León 50
Pitfall 3: Multiple Time Scales• Composite material
– Chemical degradation over time changes material ductility – Stress cycles during use lead to initiation and growth of cracks
• Incandescent light bulbs– Filament evaporates during burn time– On-off cycles induce thermal and mechanical shocks that can lead
to fatigue cracks• Inkjet pen
– Real time (corrosion)– Characters or pages printed (ink supply, resistor degradation)– On/off cycles of a print operation (thermal cycling of substrate and
print head lamination)
10/23/2004 Unit 19 - Stat 567 - Ramón León 51
Dealing with Multiple Time Scales
Suggestions• Need to use the appropriate time scale(s)
for evaluation of each failure mechanism• With multiple time scales, understand ratio
or ratios of time scales that arise in actual use
• Plan ATs that will allow effective prediction of failure time distributions at desired ratio (or ratios) of time scales
10/23/2004 Unit 19 - Stat 567 - Ramón León 52
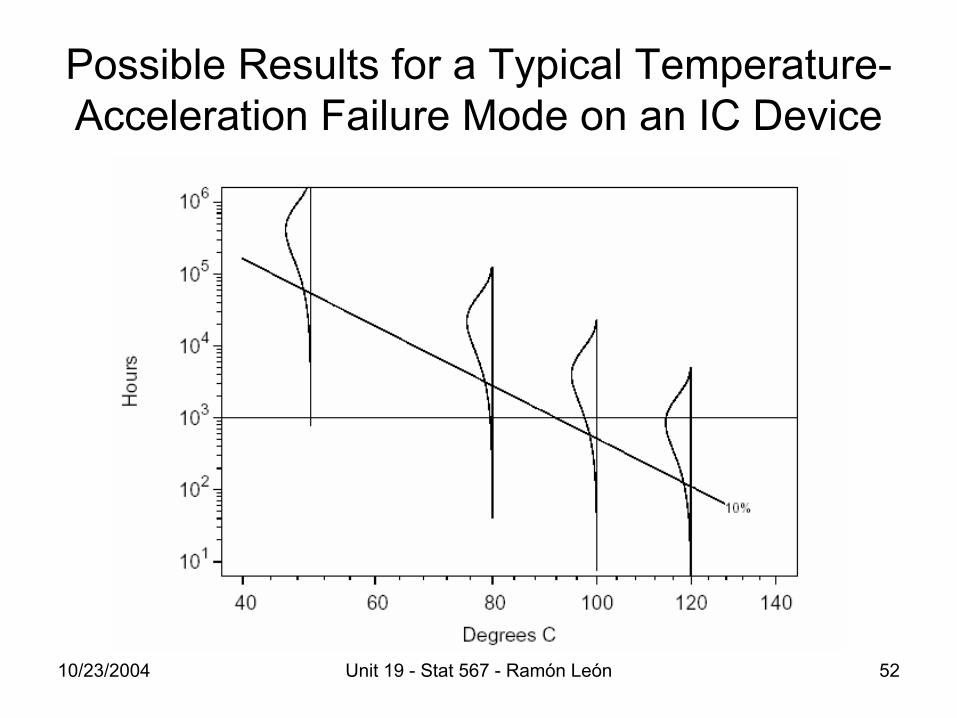
Possible Results for a Typical Temperature-Acceleration Failure Mode on an IC Device

10/23/2004 Unit 19 - Stat 567 - Ramón León 53
Unmasked Failure Mode with Lower Activation Energy
10/23/2004 Unit 19 - Stat 567 - Ramón León 54
Pitfall 4: Masked Failure Mode
• Accelerated test may focus on one known failure mode, masking another!
• Masked failure modes may be the first one to show up in the field
• Masked failure modes could dominate in the field• Suggestions
– Know (anticipate) different failure modes– Limit acceleration and test at levels of accelerating variables
such that each failure mode will be observed at two or more levels of the accelerating variable
– Identify failure modes of all failures– Analyze failure modes separately
10/23/2004 Unit 19 - Stat 567 - Ramón León 55
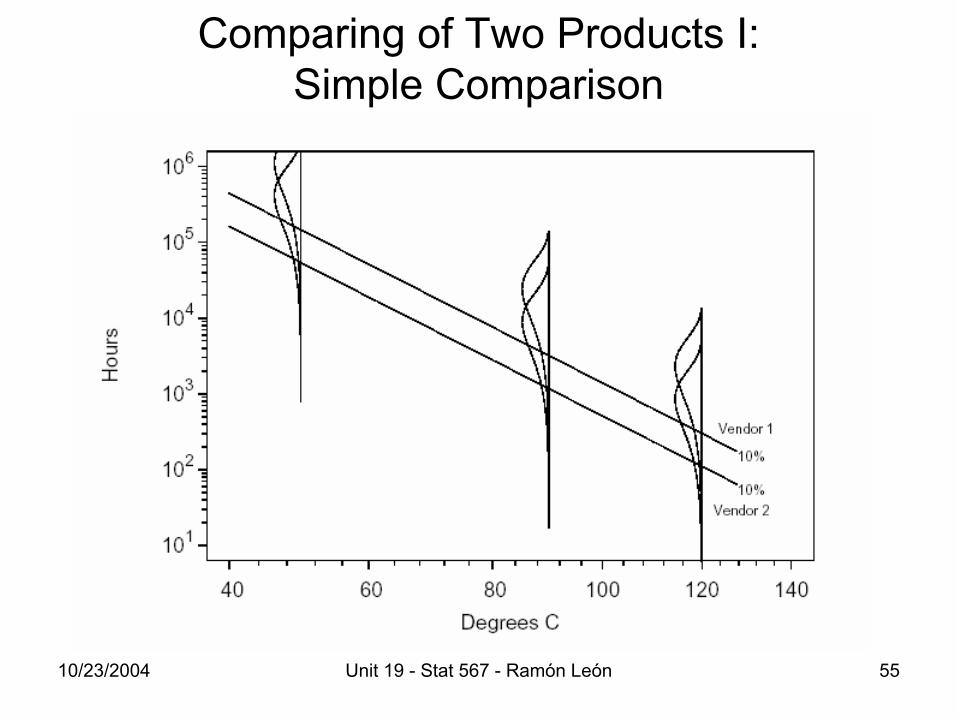
Comparing of Two Products I: Simple Comparison
10/23/2004 Unit 19 - Stat 567 - Ramón León 56
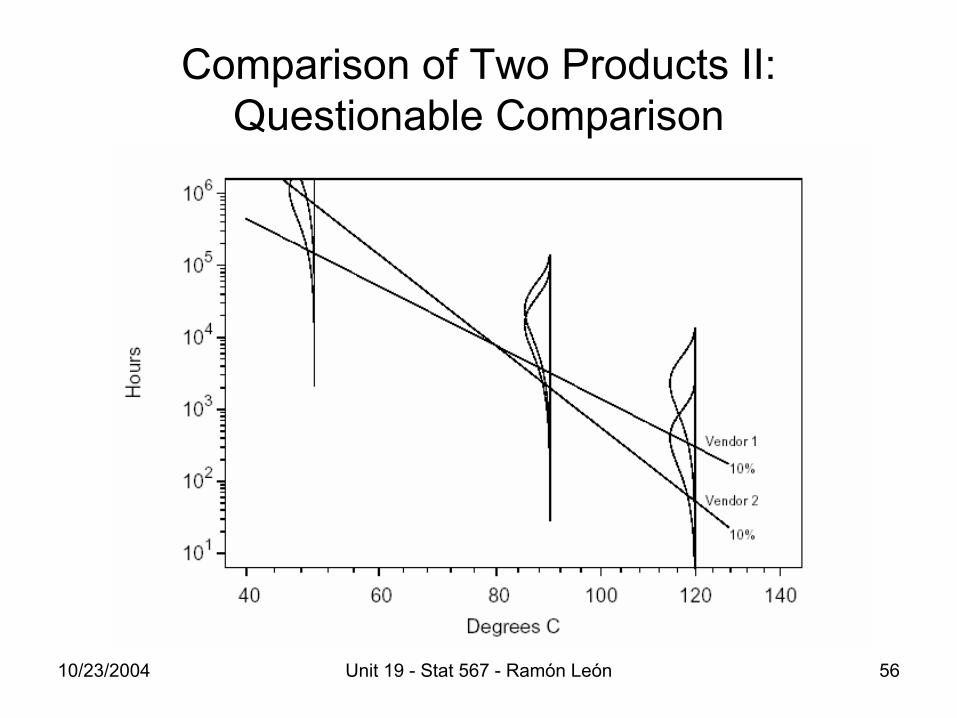
Comparison of Two Products II: Questionable Comparison
10/23/2004 Unit 19 - Stat 567 - Ramón León 57
Pitfall 5: Faulty Comparison• It is sometimes claimed that accelerated testing
is not useful for predicting reliability, but is useful for comparing alternatives
• Comparisons can, however, also be misleading• Beware of comparing products that have
different kinds of failures• Suggestions
– Know (anticipate) different failure modes– Identify failure modes of all failures– Analyze failure modes separately– Understand the physical reason for any differences
10/23/2004 Unit 19 - Stat 567 - Ramón León 58
Pitfall 6: Acceleration Factors Can Cause Deceleration!
• Increased temperature in an accelerated circuit-pack reliability audit resulted in fewer failures than in the field because of lower humidity in the accelerated test
• Higher than usual use rate of a mechanical device in an accelerated test inhibited a corrosion mechanism that eventually caused serious field problems
• Automobile air conditioners failed due to a material drying out degradation, lack of use in winter (not seen in continuous accelerated testing)
• Inkjet pens fail from infrequent use• Suggestion: Understand failure mechanisms and how
they are affected by experimental variables
10/23/2004 Unit 19 - Stat 567 - Ramón León 59
Pitfall 7: Untested Design/Production Changes• Lead-acid battery cell designed for 40 years of service• New epoxy seal to inhibit creep of electrolyte up to the
positive post • Accelerated life test described in published article
demonstrated 40 year life under normal operating conditions
• 200,000 units in service after 2 years of manufacturing • First failure after 2 years of service; third and fourth
failures followed shortly thereafter• Improper epoxy cure combined with charge/discharge
cycles hastened failure.• Entire population had to be replaced with a re-designed
cell
10/23/2004 Unit 19 - Stat 567 - Ramón León 60
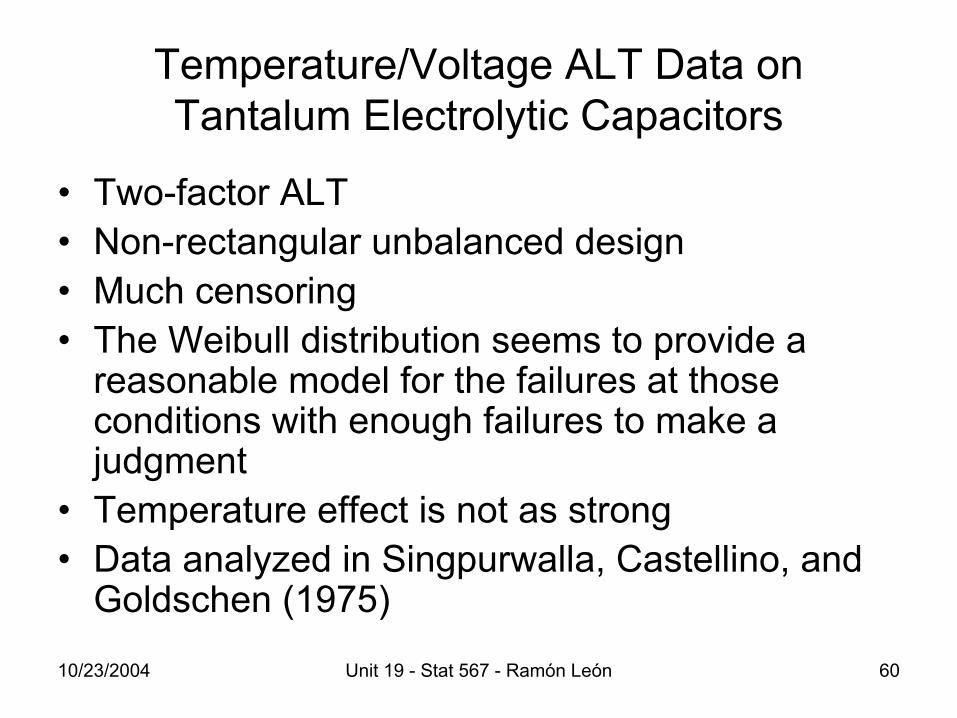
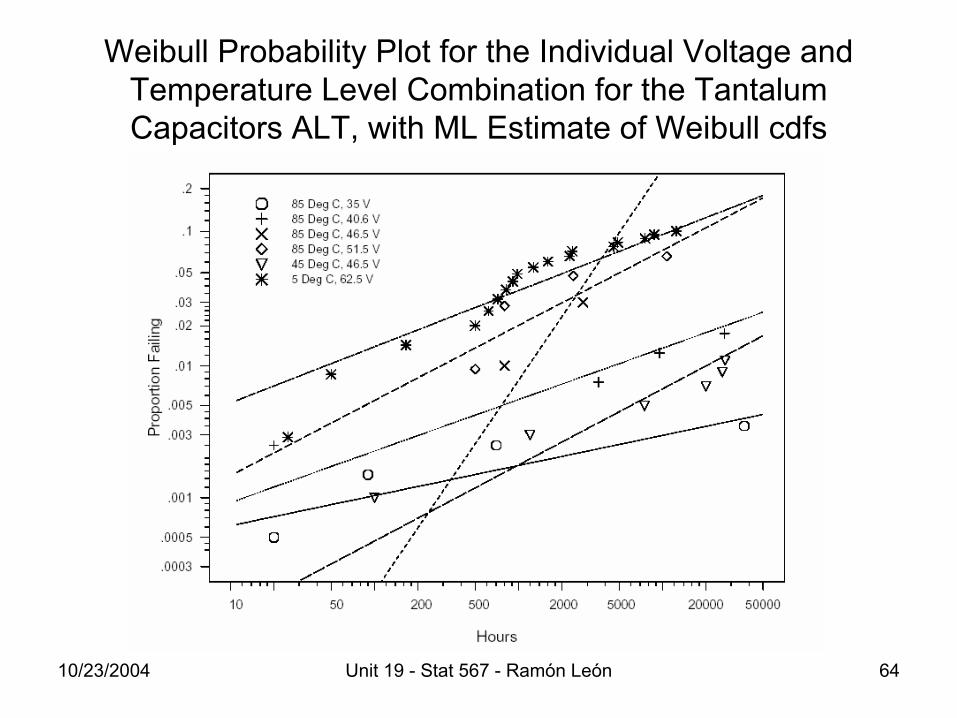
Temperature/Voltage ALT Data on Tantalum Electrolytic Capacitors
• Two-factor ALT• Non-rectangular unbalanced design• Much censoring• The Weibull distribution seems to provide a
reasonable model for the failures at those conditions with enough failures to make a judgment
• Temperature effect is not as strong• Data analyzed in Singpurwalla, Castellino, and
Goldschen (1975)
10/23/2004 Unit 19 - Stat 567 - Ramón León 61
10/23/2004 Unit 19 - Stat 567 - Ramón León 62
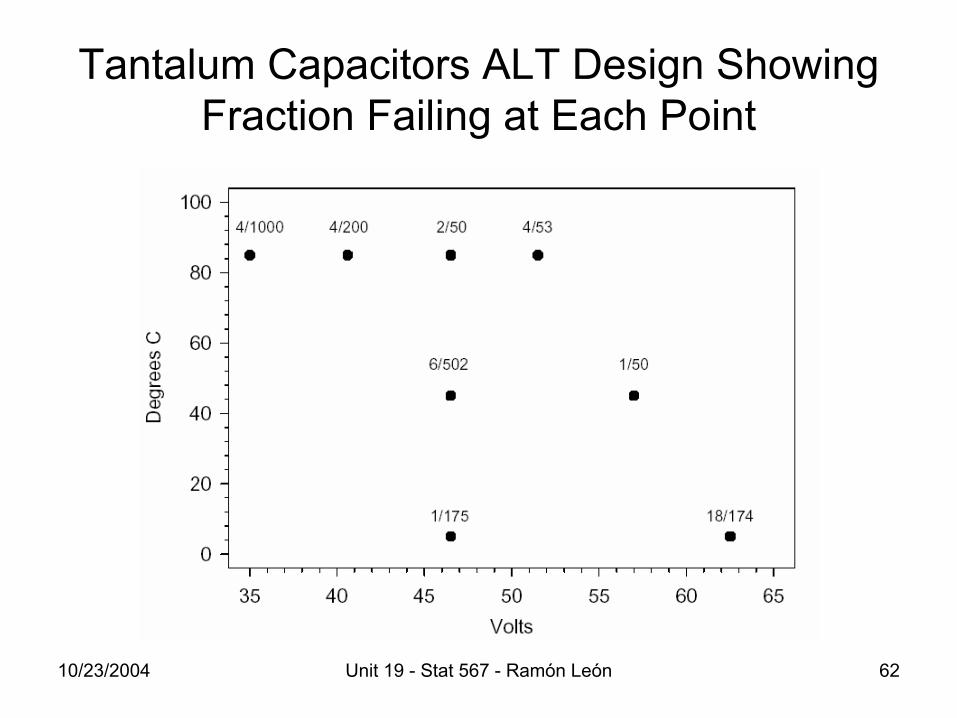
Tantalum Capacitors ALT Design Showing Fraction Failing at Each Point
10/23/2004 Unit 19 - Stat 567 - Ramón León 63
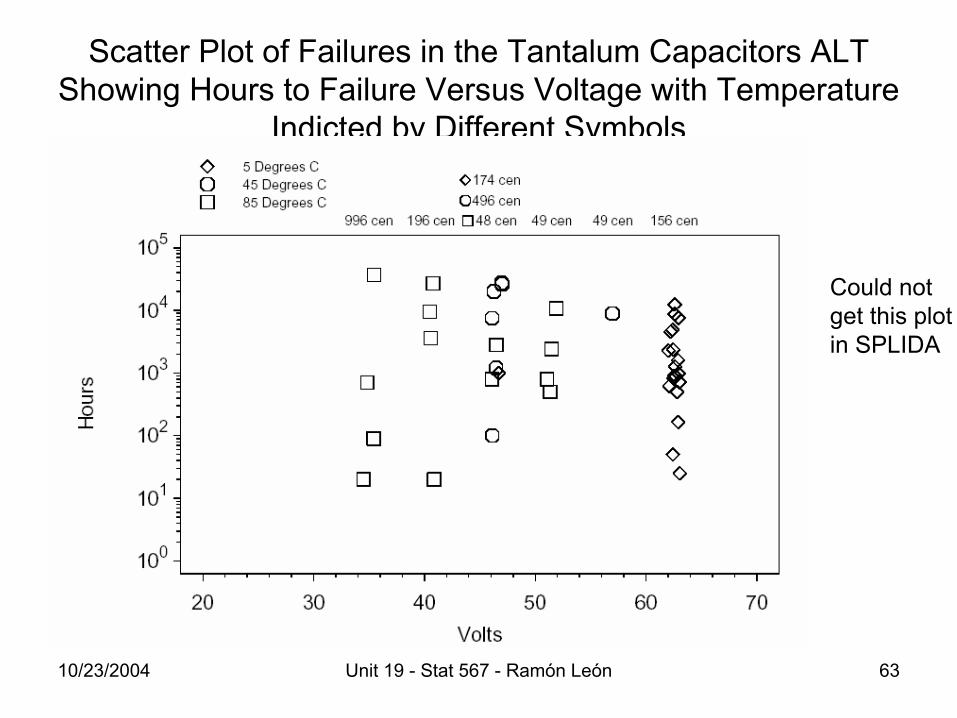
Scatter Plot of Failures in the Tantalum Capacitors ALT Showing Hours to Failure Versus Voltage with Temperature
Indicted by Different Symbols
Could notget this plotin SPLIDA
10/23/2004 Unit 19 - Stat 567 - Ramón León 64
Weibull Probability Plot for the Individual Voltage and Temperature Level Combination for the Tantalum Capacitors ALT, with ML Estimate of Weibull cdfs
10/23/2004 Unit 19 - Stat 567 - Ramón León 65
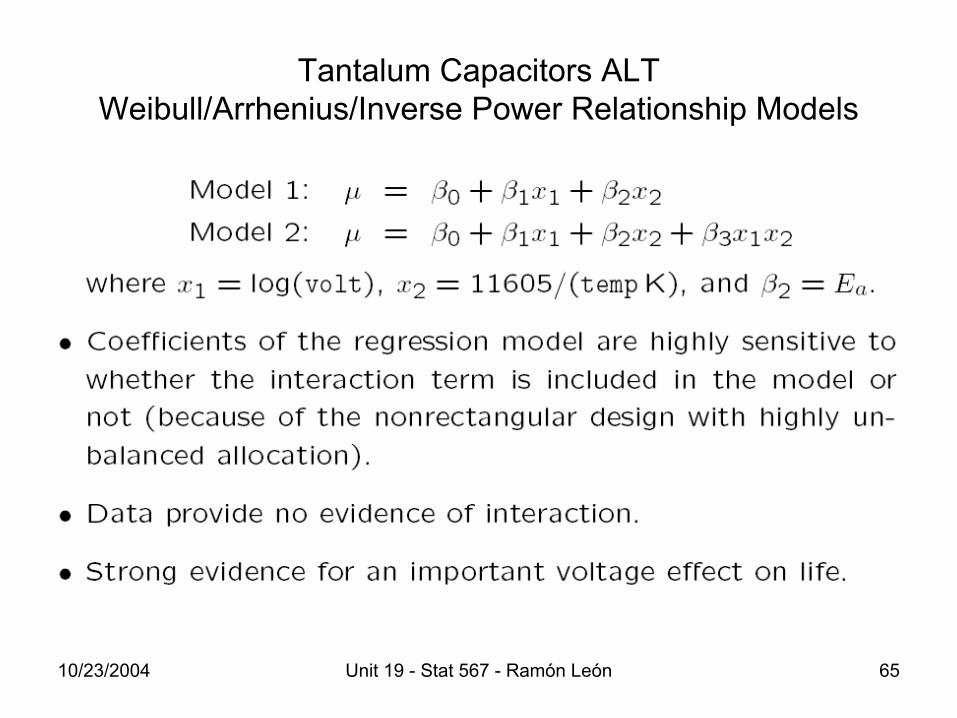
Tantalum Capacitors ALT Weibull/Arrhenius/Inverse Power Relationship Models
10/23/2004 Unit 19 - Stat 567 - Ramón León 66
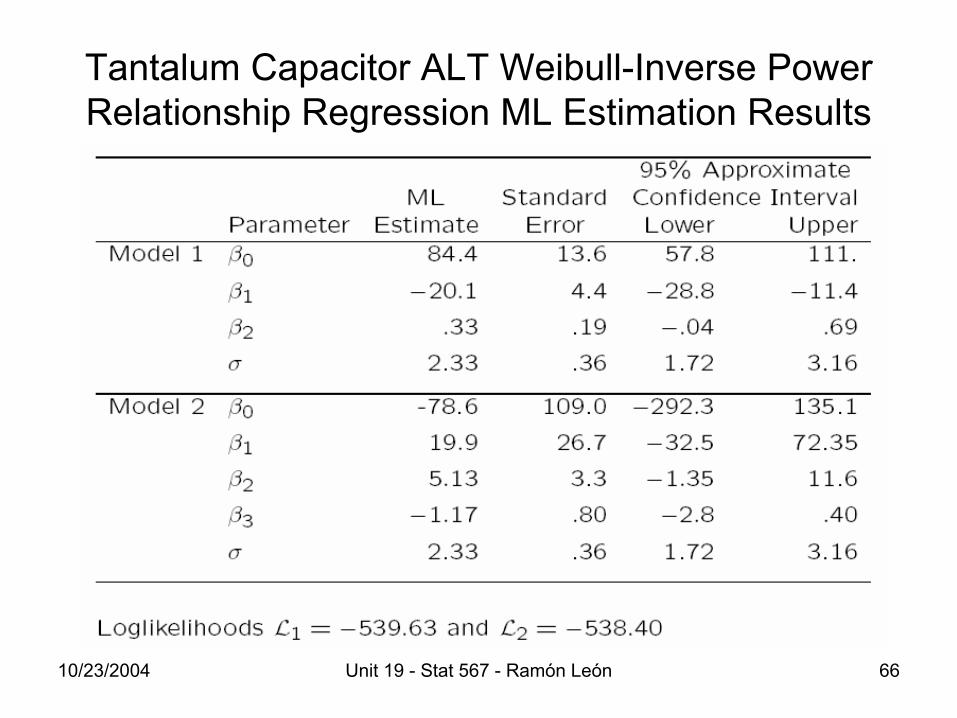
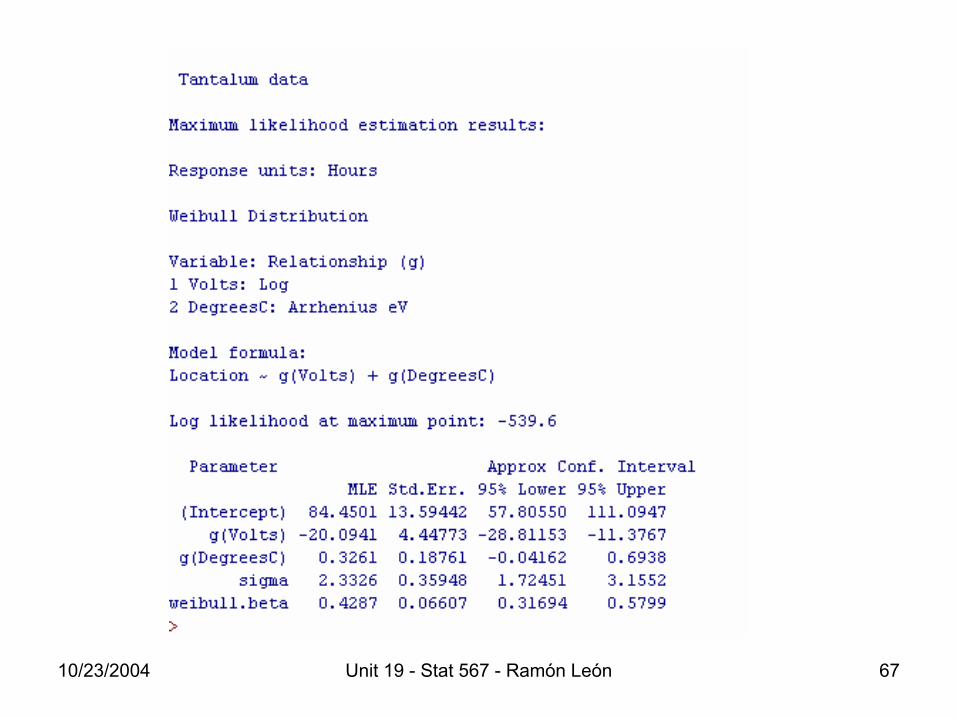
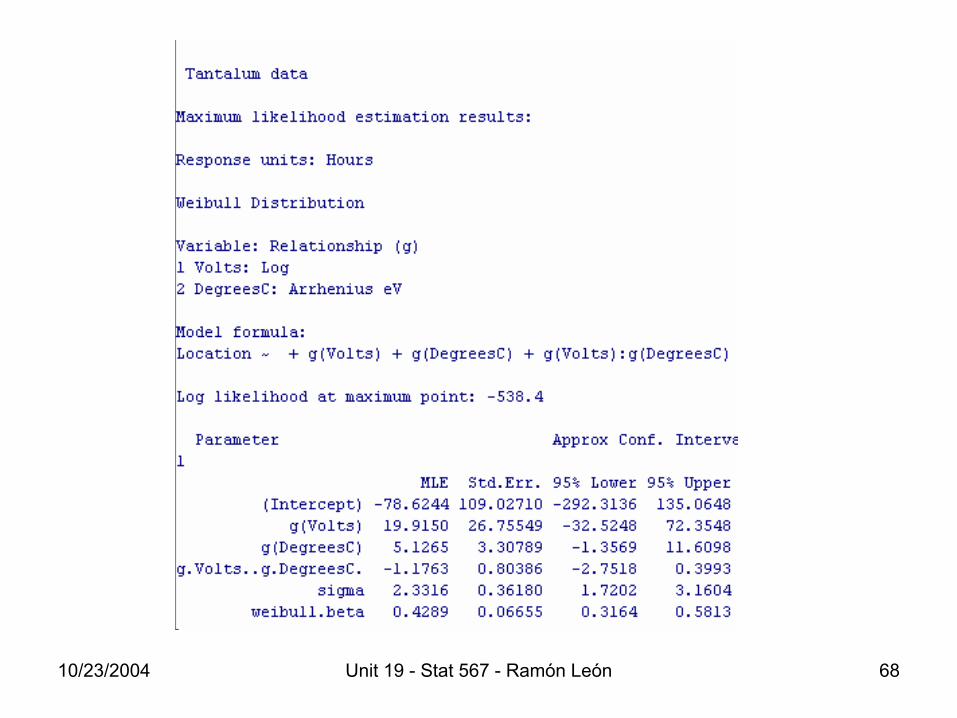
Tantalum Capacitor ALT Weibull-Inverse Power Relationship Regression ML Estimation Results
10/23/2004 Unit 19 - Stat 567 - Ramón León 67
10/23/2004 Unit 19 - Stat 567 - Ramón León 68
10/23/2004 Unit 19 - Stat 567 - Ramón León 69
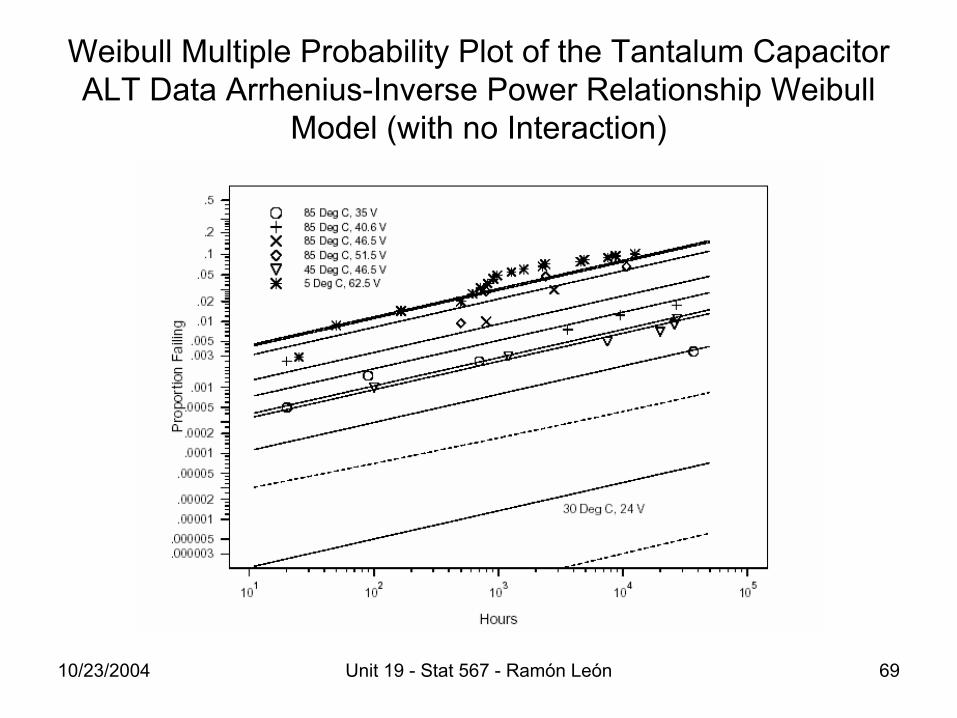
Weibull Multiple Probability Plot of the Tantalum Capacitor ALT Data Arrhenius-Inverse Power Relationship Weibull
Model (with no Interaction)
10/23/2004 Unit 19 - Stat 567 - Ramón León 70
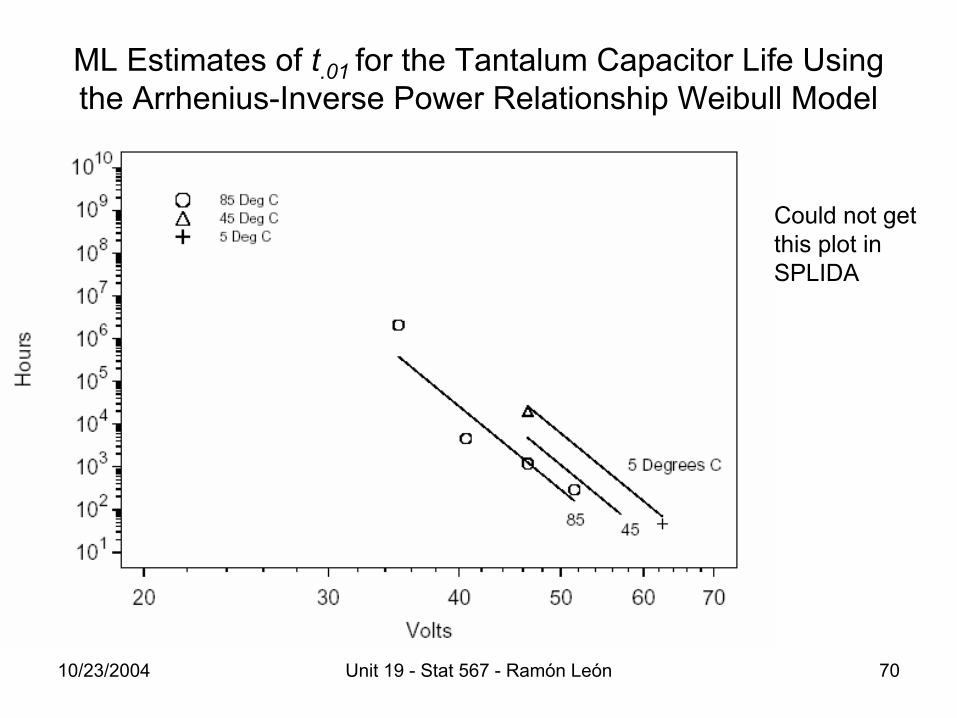
ML Estimates of t.01 for the Tantalum Capacitor Life Using the Arrhenius-Inverse Power Relationship Weibull Model
Could not getthis plot inSPLIDA

10/23/2004 Unit 19 - Stat 567 - Ramón León 71
Other Topics in Chapter 19
Discussion of • Highly accelerated life tests (HALT)• Environmental stress and STRIFE testing• Burn-in• Environmental stress screening