Unit 1 markets revision 2011.pdf
47
Markets, elasticity and taxation & subsidies
Transcript of Unit 1 markets revision 2011.pdf

Markets, elasticity and taxation & subsidies
The exam
Markets
Elasticity
Taxation
Subsidies

1 HOUR 30 MINUTES LONG- 50% AS- TOTAL 80 MARKS
Supported choice:
8 questions for 4 marks each
Total 32 marks
Spend no longer than 36 minutes here
Data question:
33% evaluation
5 questions
Total 48 marks
Spend 54 minutes here

The supported choice:
Definition: 1 – 2 marks
Diagram: 1 - 2 marks
Annotation: 1 - 3 marks
Application/calculation: 1 – 2 marks
Further analysis: 1 – 2 marks
KOs – 1 – 3 marks – refer to key!

The data response – 5 questions:
4 MARK QUESTION
▪ purely knowledge and application marks
▪ Define the terms in the question (1 – 2 marks)
▪ remember to apply your knowledge to the extract
6 MARK QUESTION
▪ purely knowledge and application marks
▪ Define the terms in the question (1 – 2 marks)
▪ remember to apply your knowledge and draw diagramsif they’re relevant

The data response cont:
10 MARK QUESTION
▪ Definition/knowledge – 1 mark
▪ Application, analysis & diagram – 5 marks
▪ 4 marks for evaluation: (2 + 2)
14 MARK QUESTION
▪ Identification, analysis & diagram – 8 marks
▪ 6 marks for evaluation: (2 + 2 + 2) safest
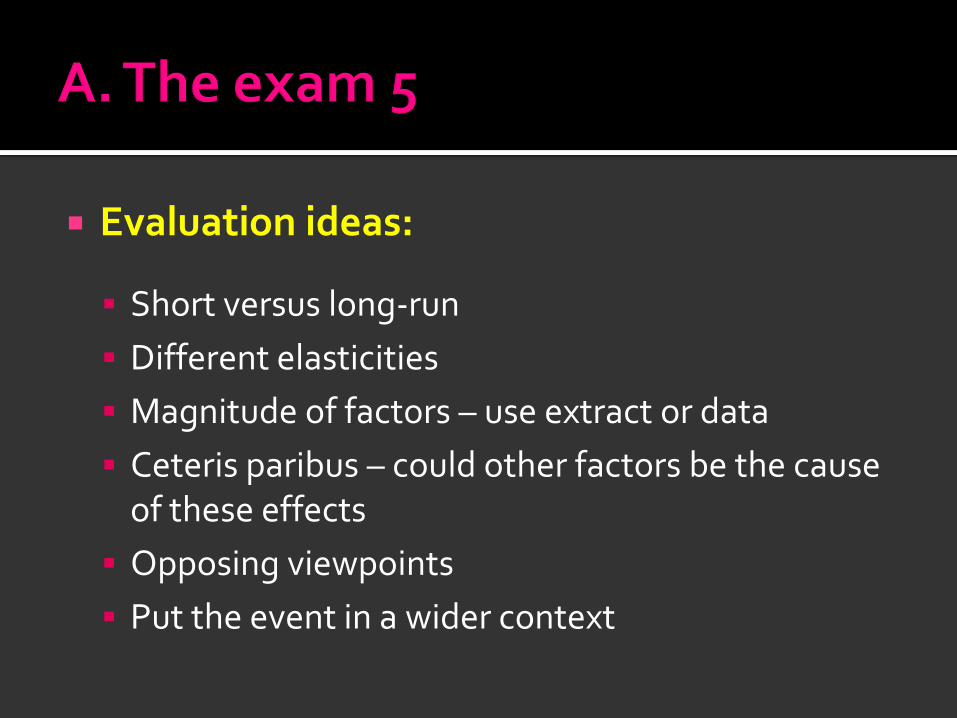
Evaluation ideas:
Short versus long-run
Different elasticities
Magnitude of factors – use extract or data
Ceteris paribus – could other factors be the cause of these effects
Opposing viewpoints
Put the event in a wider context


You should know:
Factors which shift demand Factors which shift supply Consumer & producer surplus Role of the price mechanism Application to markets:
Agriculture
Precious metals
Oil
Stock markets
Labour

Factors that shift demand & supply:
DEMAND SUPPLY
Income Production costs
Population Technology
Tastes Number of firms
Price of substitutes Weather
Price of complements Tax
Interest rates Subsidies
Expectations Firms’ objectives

Which of the following is most likely to cause the price of gold to fall without a shift in the demand curve?
A An increase in national income.
B A decrease in the price of silver.
C An increase in the wage of gold miners.
D A decrease in the cost of machinery used in gold-mining.

Factors that shift labour demand & supply:
LABOUR DEMAND LABOUR SUPPLY
Demand derived from changes to product demand
Changes to the working population, such as net migration
Change to final product’s price & so firm’s revenue
Changes to wages, income tax, working conditions
Labour productivity Regulations
Changes to capital prices Value of leisure time
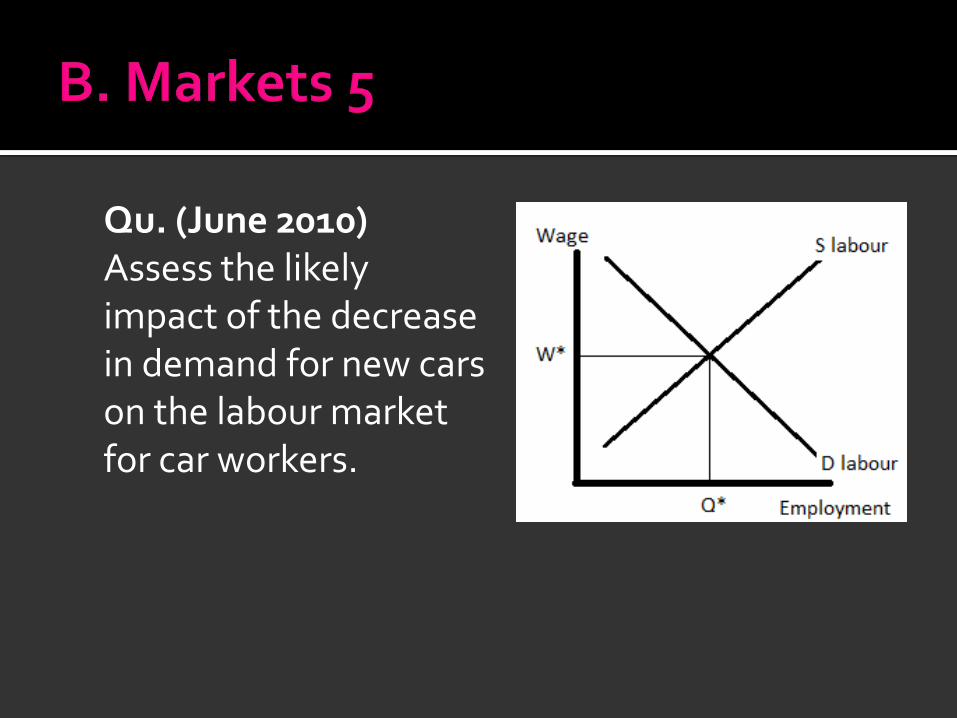
Qu. (June 2010)Assess the likely impact of the decrease in demand for new cars on the labour market for car workers.

Evaluation:
Magnitude – extract says 21.8% fall in 1st quarter Extent to which wages can fall – NMW & TUs Impact of occupational and geographical
mobility of labour Time – short-run sabbaticals? Impact on related markets – mechanics, jobs in
second hand car market


Price elasticity of demand:
You should know: Definition Diagrams Determinants Relationship with revenue Relevance to business

Price elasticity of demand is the responsiveness of quantity demanded to a change in price
PeD = % in Qd% in P
PeD is always negative – a demand curve slopes downwards!
PeD becomes more inelastic as you move down a demand curve
Inelastic: a change in price leads to a proportionally smaller change in quantity demanded.
Elastic: a change in price leads to a proportionally larger change in quantity demanded.

10,000 jar of jam are demanded per day at a price of £2 per jar. If the PeD for these jars is -2 and the price is raised by 20%, the number of jars demanded will fall to
A 6,000
B 7,000
C 8,000
D 9,000

DETERMINANTS
OF PED
Habit-forming
Number of substitutes
Proportion of income
Time
Luxury or
necessity
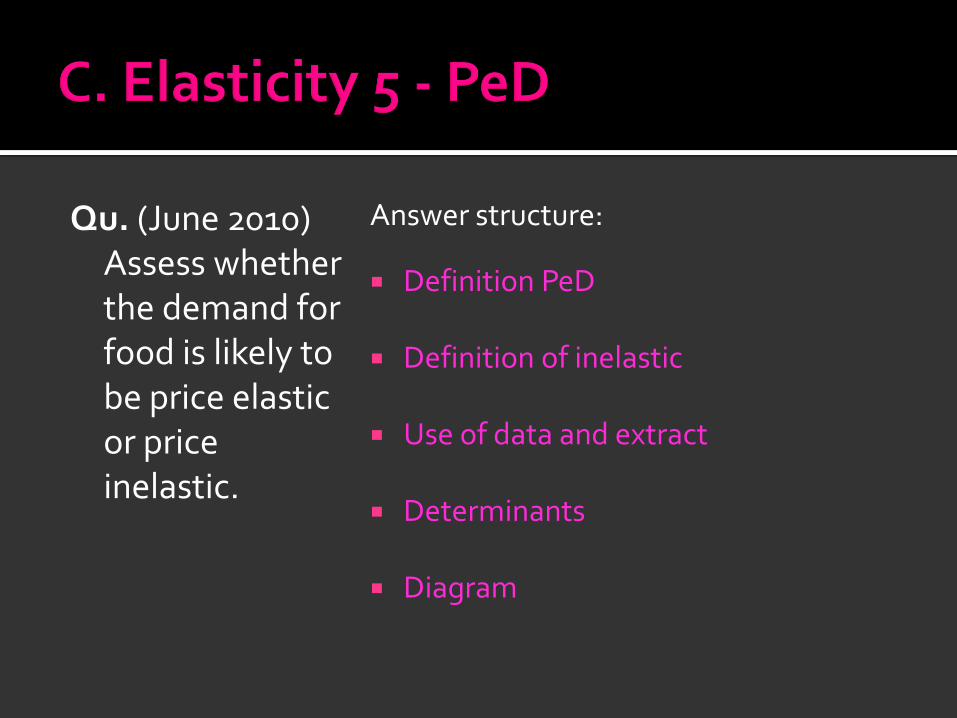
Qu. (June 2010) Assess whether the demand for food is likely to be price elastic or price inelastic.
Answer structure:
Definition PeD
Definition of inelastic
Use of data and extract
Determinants
Diagram
Evaluation:
Types of food
Differences between different income groups
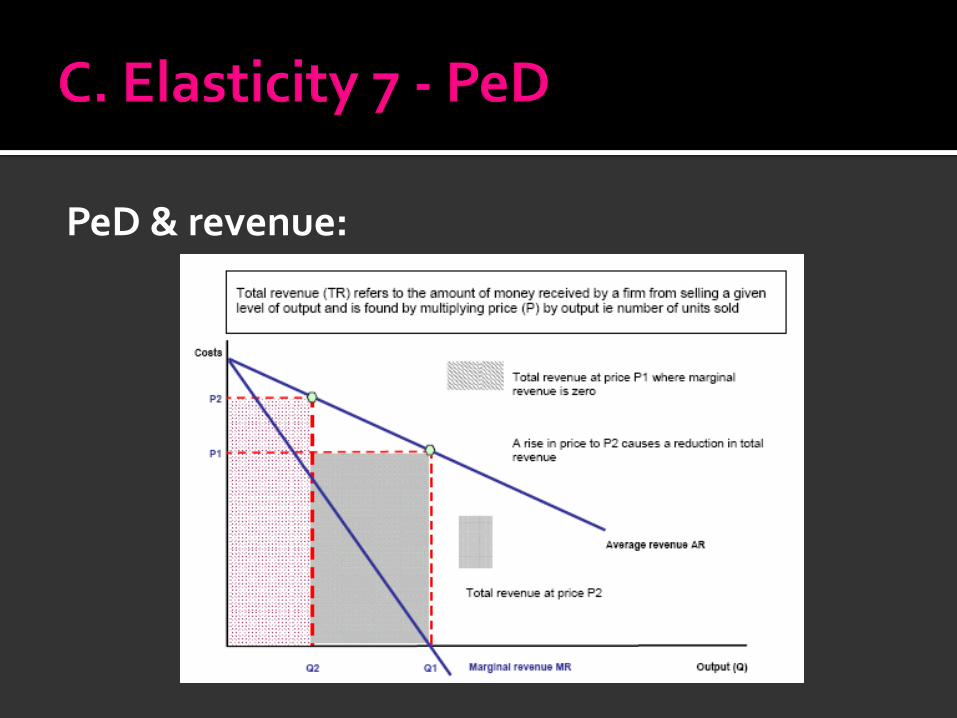
PeD & revenue:

Summary:
Revenue will rise Revenue will fall
If PeD is inelastic: an increase in price
If PeD is inelastic: a decrease in price
If PeD is elastic: a decrease in price
If PeD is elastic: an increase in price
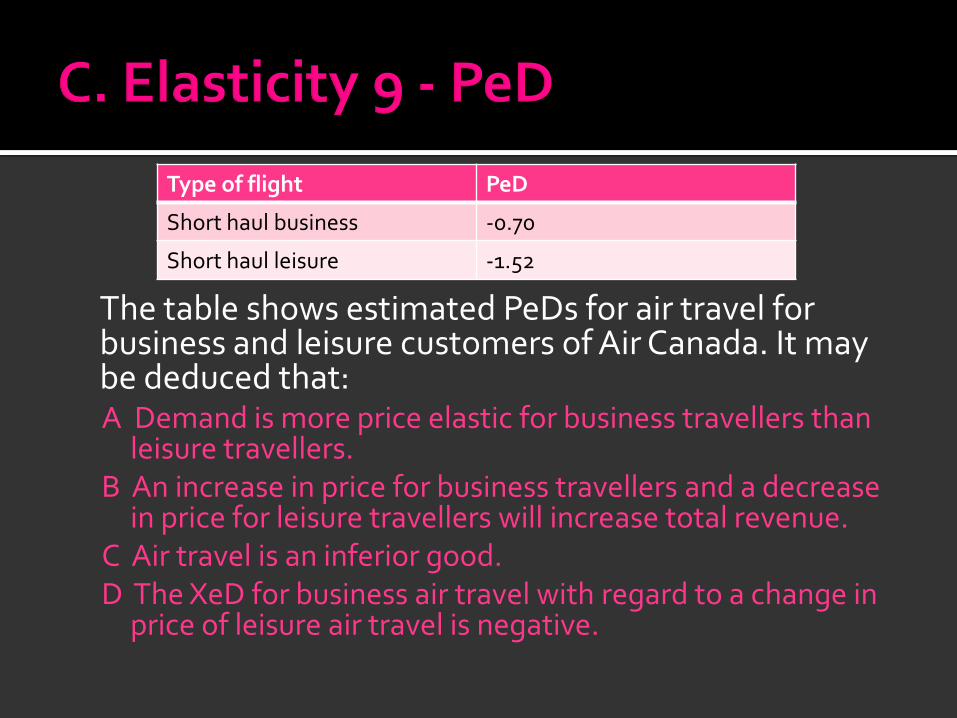
The table shows estimated PeDs for air travel for business and leisure customers of Air Canada. It may be deduced that:A Demand is more price elastic for business travellers than
leisure travellers.B An increase in price for business travellers and a decrease
in price for leisure travellers will increase total revenue.C Air travel is an inferior good.D The XeD for business air travel with regard to a change in
price of leisure air travel is negative.
Type of flight PeD
Short haul business -0.70
Short haul leisure -1.52

Income elasticity of demand is the responsiveness of quantity demanded to a change in income
YeD = % in Qd% in Y
YeD can be negative and positive.
Positive YeD: an increase in income leads to an increase in quantity demanded = Normal good
Negative YeD: an increase in income leads to a decrease in quantity demanded = Inferior good
Qu. (Jan 2011) Discuss whether chocolate and other confectionary is likely to be normal or inferior goods. 10 marks
Answer structure:
Definition YeD
Definition of normal & inferior goods
Use of data and extract
Diagram
Evaluation:
Different types of chocolate/confectionary
Ceteris paribus – other factors may have caused the change in demand
Different income groups
Cross price elasticity of demand is the responsiveness of the quantity demanded of good A to a change in price in good B
XeD = % in Qd Good A
% in P Good B
XeD can be negative and positive.
Positive XeD: an increase in the price of good A leads to an increase in quantity demanded for good B = Subsititute good
Negative XeD: an increase in the price of good A leads to a fall in quantity demanded for good B = Complementary good
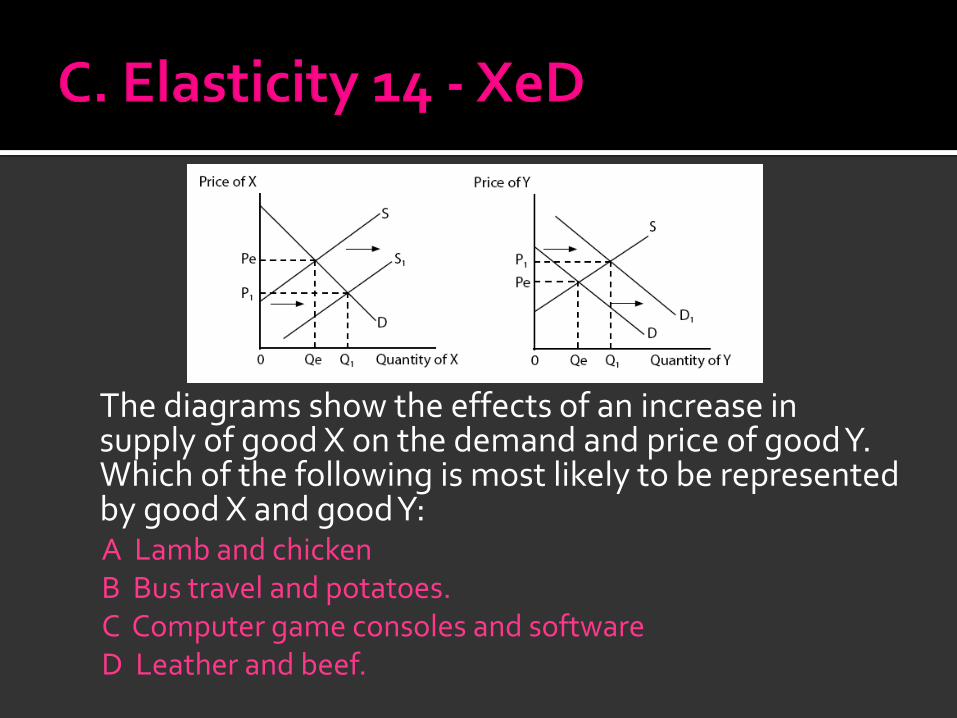
The diagrams show the effects of an increase in supply of good X on the demand and price of good Y. Which of the following is most likely to be represented by good X and good Y:A Lamb and chickenB Bus travel and potatoes.C Computer game consoles and softwareD Leather and beef.
Price elasticity of supply is the responsiveness of quantity supplied to a change in price
PeS = % in Qs% in P
PeS is always positive – a supply curve slopes upwards!
Inelastic: a change in price leads to a proportionally smaller change in quantity supplied.
Elastic: a change in price leads to a proportionally larger change in quantity supplied.

DETERMINANTS
OF PES
Levels of stocks
Ease of storage
Ease of industry
entryTime
Spare capacity

Qu. (Jan 2010)Discuss how the PeS of oil might differ in the short and long run.
Answer structure:
Definition PeS
Definition of short & long-run
Use of data and extract
Short-run:
Long-run:

Evaluation:
Price volatility Different PeS from different regions Availability of stocks eg. OPEC Finite resource so very inelastic in LR Ceteris paribus – impact of possible new
discoveries or extractive technologies


Definitions:
Direct taxA tax levied directly on an individual or organisation.
Indirect taxA tax on expenditure collected by the producer on behalf of the government.
Pigouvian taxA tax is set on a good so that it equals the marginal negative externality – this internalises the external cost : the polluter pays principle.
Specific taxAn indirect tax which is charged as a fixed amount per unit of that good, causing a parallel shift in the supply curve to the left.
Ad Valorem taxAn indirect tax which is charged as a percentage of the price of the good, causing a pivotal rotation of the supply curve to the left.

The diagram shows the impact of a specific tax placed on air travel. Which of the following is correct?A Total tax revenue is
PeP1YXB Producer surplus
increasesC The price of air tickets
rises from Pe to P2
D Consumer surplus decreases
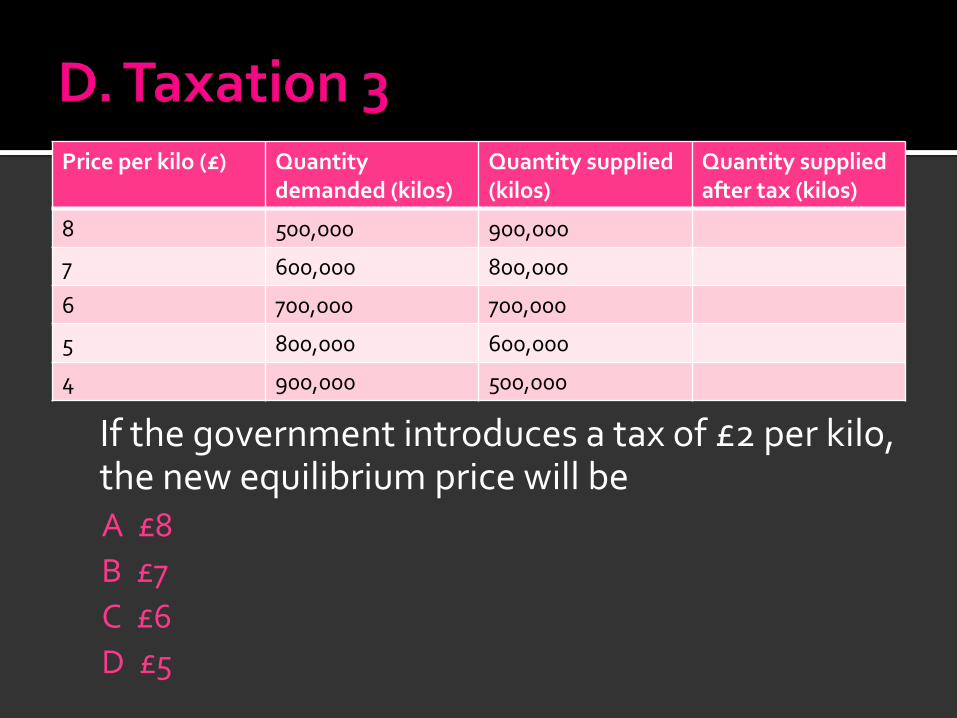
If the government introduces a tax of £2 per kilo, the new equilibrium price will beA £8
B £7
C £6
D £5
Price per kilo (£) Quantitydemanded (kilos)
Quantity supplied (kilos)
Quantity supplied after tax (kilos)
8 500,000 900,000
7 600,000 800,000
6 700,000 700,000
5 800,000 600,000
4 900,000 500,000
Qu. (June 2010) Evaluate the possible economic effects of a decrease in fuel taxes. Use an appropriate diagram in your answer.
Answer structure:
Definition indirect tax
Diagram (next slide)
XeD – cars are complements
XeD – public transport as substitute
Other impacts:
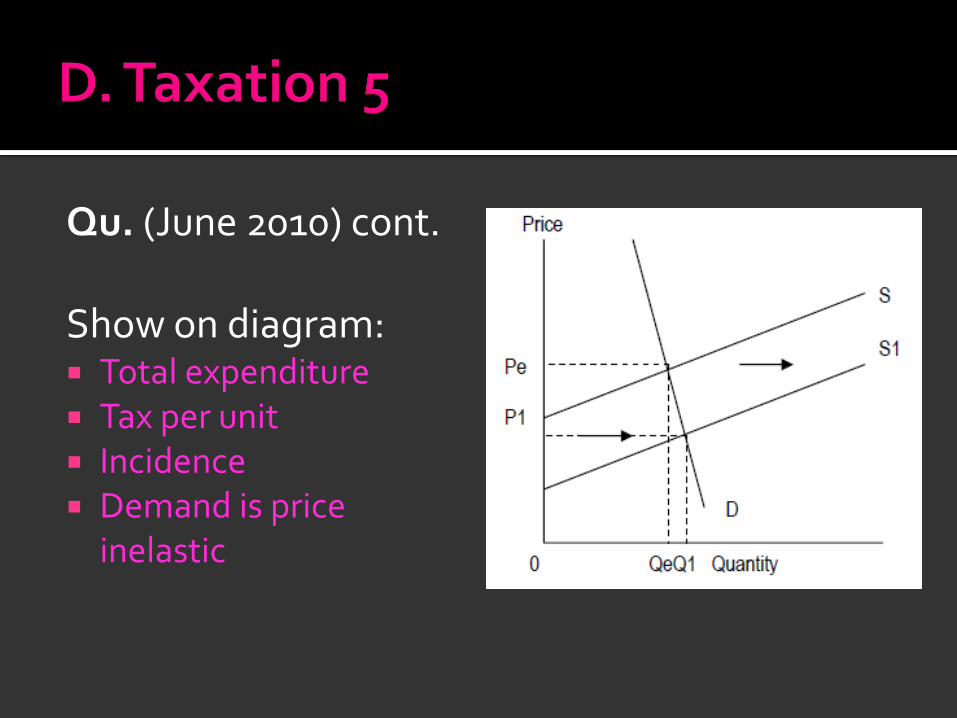
Qu. (June 2010) cont.
Show on diagram: Total expenditure Tax per unit Incidence Demand is price
inelastic
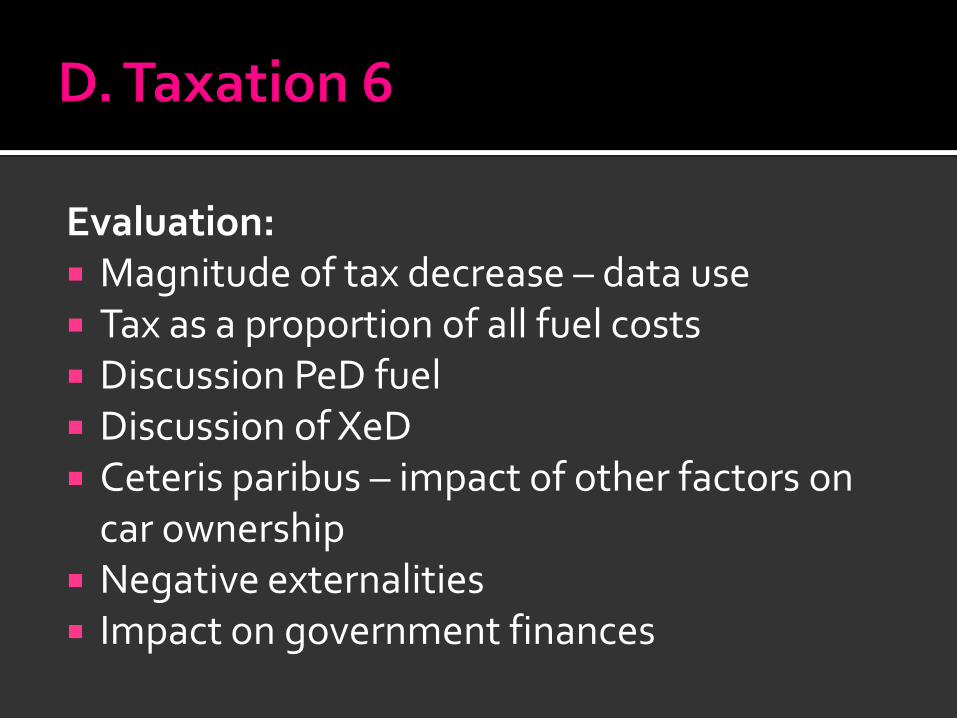
Evaluation: Magnitude of tax decrease – data use Tax as a proportion of all fuel costs Discussion PeD fuel Discussion of XeD Ceteris paribus – impact of other factors on
car ownership Negative externalities Impact on government finances

Evaluation to consider:Argue the opposite view.How contestable is the market?Is there evidence that competition can increase?How do incumbents respond? Price wars or aggressive advertising etc.

Definition subsidy
Government grant to firms in order to lower their production costs and so increase supply & lower prices.
Incidence:
Price inelastic demand – large fall in price
Price elastic demand – smaller fall in price
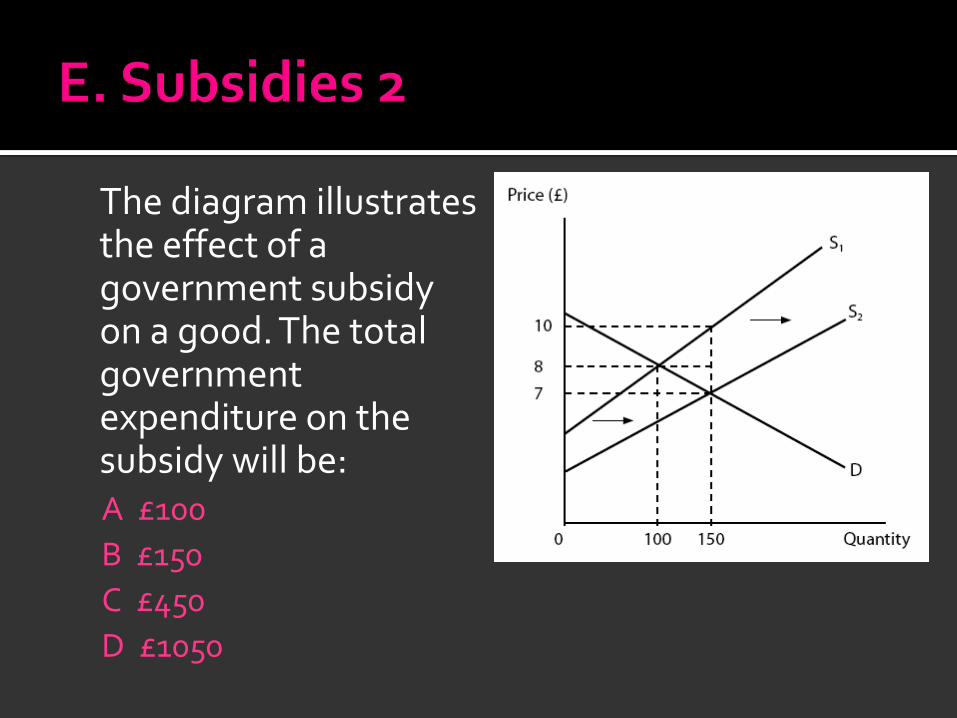
The diagram illustrates the effect of a government subsidy on a good. The total government expenditure on the subsidy will be:A £100
B £150
C £450
D £1050

If the government introduces a subsidy of £4 per unit, the new equilibrium price will beA £8
B £10
C £12
D £14
Price per unit (£) Quantitydemanded (units)
Quantity supplied (units)
Quantity supplied after subsidy (units)
16 2000 2800
14 2200 2600
12 2400 2400
10 2600 2200
8 2800 2000
Qu. (Jan 2010) Evaluate the likely economic benefits of an increased subsidy for bus and rail travel. Use an appropriate diagram in your answer.
Answer structure:
Definition subsidy
Diagram (next slide)
Impact on consumer surplus
Impact on producer surplus
Impact on negative externalities
Other benefits:
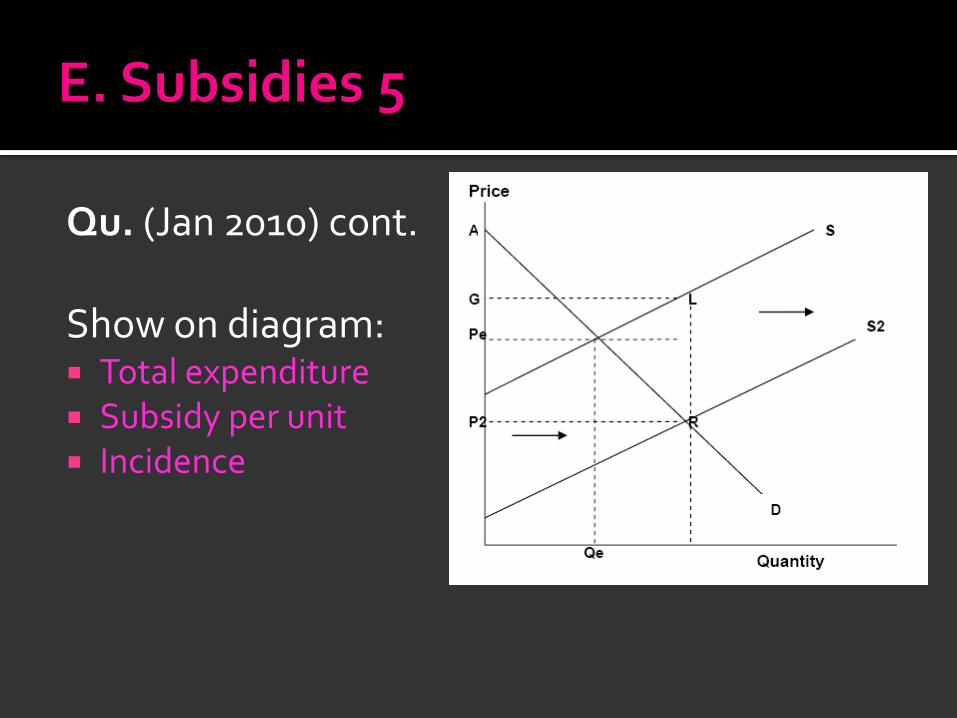
Qu. (Jan 2010) cont.
Show on diagram: Total expenditure Subsidy per unit Incidence
Evaluation Magnitude of subsidy Duration of subsidy XeD of public transport with respect to
private transport PeD and consumer incidence Government failure - promotion inefficiency
& dependency in public transport Impact on public finances – opportunity costs
& changes to tax