UniSystems Information Technology Systems SA · UniSystems Information Technology Systems SA...
70
UniSystems Information Technology Systems SA Consolidated and Separate Financial Statements for financial year 2016 (from 1 s t January to 31 s t December 2016) in accordance with International Financial Reporting Standards UNISYSTEMS S.A. G.E.MI. (General Electronic Commercial Registry) No - 121831201000 former Société Anonyme Registration No 1447/01ΝΤ/Β/86/331(08) Al. Padou 19-23, Kallithea Kallithea March 2017
Transcript of UniSystems Information Technology Systems SA · UniSystems Information Technology Systems SA...

UniSystems Information Technology Systems SA
Consolidated and Separate Financial Statements for financial year 2016
(from 1s t January to 31s t December 2016) in accordance with International Financial Reporting Standards
UNISYSTEMS S.A.
G.E.MI. (General Electronic Commercial Registry) No - 121831201000 former Société Anonyme Registration No 1447/01ΝΤ/Β/86/331(08)
Al. Padou 19-23, Kallithea
Kallithea March 2017
Contents
Statement of Financial Position 3
Income Statement 4
Statement of Comprehensive Income 5
Statement of Changes in Equity 6
Statement of cash flows 8
1. General Information 9
2. Summary of significant accounting policies 10
3. Financial risk management 26
4. Critical accounting estimates and judgements made by management 31
5. Segment information 33
6. Property, plant and equipment 34
7. Intangible assets 37
8. Investment property 39
9. Investments in subsidiaries and associates 40
10. Receivables from finance lease 41
11. Available-for-sale financial assets 42
12. Financial assets at fair value through profit or loss 44
13. Deferred income tax 44
14. Inventories 47
15. Trade and other receivables 48
16. Cash and cash equivalents 49
17 Non-current assets held for sale and discontinued operations 50
18. Equity 51
19. Other reserves and retained earnings 51
20. Retirement benefit obligations 52
21.Trade and other payables 55
22. Borrowings 55
23. Expenses by category 58
24. Employee benefits 58
25. Other income/(expenses) - Other gains/(losses) 59
26. Finance income/(expenses) 59
27. Income tax 60
28. Cash flows from operating activities 61
29. Earnings per share 62
30 Commitments 62
31. Contingent liabilities and assets 63
32. Encumbrances 64
33. Transactions with related parties 64
34. Construction contracts 66
35. Unaudited tax years 66
36. Events after the balance sheet date of issuance 68

Financial Statements for the year ended 31st
December 2016
(from 1st
January to 31st
December 2016)
(amounts in '000 EUR, unless otherwise stated)
1
Independent Auditor’s Report
To the Shareholders of “Unisystems Information Technology Systems SA”
Report on the Audit of the Separate and Consolidated Financial Statements
We have audited the accompanying separate and consolidated financial statements of Unisystems Information
Technology Systems SA which comprise the separate and consolidated statement of financial position as of 31
December 2016 and the separate and consolidated statement of income statement and statement of
comprehensive income, statement of changes in equity and cash flow statement for the year then ended and a
summary of significant accounting policies and other explanatory information.
Management’s Responsibility for the Separate and Consolidated Financial Statements
Management is responsible for the preparation and fair presentation of these separate and consolidated
financial statements in accordance with International Financial Reporting Standards, as adopted by the European
Union, and for such internal control as management determines is necessary to enable the preparation of
separate and consolidated financial statements that are free from material misstatement, whether due to fraud
or error.
Auditor’s Responsibility
Our responsibility is to express an opinion on these separate and consolidated financial statements based on our
audit. We conducted our audit in accordance with International Standards on Auditing which have been
transposed into Greek Law (GG/B’/2848/23.10.2012). Those standards require that we comply with ethical
requirements and plan and perform the audit to obtain reasonable assurance about whether the separate and
consolidated financial statements are free from material misstatement.
An audit involves performing procedures to obtain audit evidence about the amounts and disclosures in the
separate and consolidated financial statements. The procedures selected depend on the auditor's judgment,
including the assessment of the risks of material misstatement of the separate and consolidated financial
statements, whether due to fraud or error. In making those risk assessments, the auditor considers internal
control relevant to the entity's preparation and fair presentation of the separate and consolidated financial
statements in order to design audit procedures that are appropriate in the circumstances, but not for the
purpose of expressing an opinion on the effectiveness of the entity's internal control. An audit also includes
evaluating the appropriateness of accounting policies used and the reasonableness of accounting estimates
made by management, as well as evaluating the overall presentation of the separate and consolidated financial
statements.

Financial Statements for the year ended 31st
December 2016
(from 1st
January to 31st
December 2016)
(amounts in '000 EUR, unless otherwise stated)
2
We believe that the audit evidence we have obtained is sufficient and appropriate to provide a basis for our audit
opinion.
Opinion
In our opinion, the separate and consolidated financial statements present fairly, in all material respects, the
financial position of the Company and its subsidiaries as of December 31, 2016, and their financial performance
and cash flows for the year then ended in accordance with International Financial Reporting Standards, as
adopted by the European Union.
Report on Other Legal and Regulatory Requirements
Taking into consideration, that management is responsible for the preparation of the Board of Directors’ report according to provisions of paragraph 5 article 2 of Law 4336/2015 (part B), we note the following:
a) In our opinion, the Board of Directors’ report has been prepared in accordance with the legal requirements
of articles 43a and 107 of the Codified Law 2190/1920 and the content of the Board of Directors’ report is consistent with the accompanying financial statements for the year ended 31 December 2016.
b) Based on the knowledge we obtained from our audit for the Company “Unisystems Information Technology Systems SA” and its environment, we have not identified any material misstatement to the Board of Directors report.
Pricewaterhouse Coopers S.A Athens 31 May 2017
268 Kifissias Avenue
152 32 Halandri Dimtrios Sourbis
SOEL Reg. No. 113 Institute of CPA Reg. No. 16891

Financial Statements for the year ended 31st
December 2016
(from 1st
January to 31st
December 2016)
(amounts in '000 EUR, unless otherwise stated)
3
Statement of Financial Position Amounts in '000 EUR
The GROUP
The COMPANY
Note 31.12.2016 31.12.2015 31.12.2016 31.12.2015
ASSETS
Non-current assets
Property, plant and equipment 6 9.229 9.064 9.227 9.061
Intangible assets 7 1.139 1.720 1.139 1.720
Investment property 8 2.845 4.855 2.845 4.855
Investments in subsidiaries and associates 9 - - 345 460
Available-for-sale financial assets 11 - 142 - 142
Receivables from finance leases 10 - - - -
Deferred tax assets 13 4.272 3.678 4.272 3.678
Other long-term receivables 15 1.160 239 1.160 239
18.645 19.698 18.988 20.155
Current assets
Inventories 14 1.977 3.634 1.977 3.634
Trade and other receivables 15 52.473 50.842 52.087 50.528
Receivables from finance leases 10 - 229 - 229
Available-for-sale financial assets 11 4.539 - 4.539 -
Cash and cash equivalents 16 11.756 21.594 11.162 21.283
70.745 76.299 69.765 75.674
Non-current assets held for sale and discontinued
operations 17 - 1.649
-
1.649
Total assets 89.390 97.646 88.753 97.478
EQUITY
Attributable to the Company's shareholders
Share capital 18 10.080 10.080 10.080 10.080
Share premium 18 9.329 9.329 9.329 9.329
Other reserves 19 3.500 3.562 3.645 3.645
Retained earnings 13.574 15.242 13.217 15.197
36.483 38.213 36.271 38.251
Non-controlling interests - 41 - -
Total equity 36.483 38.254 36.271 38.251
LIABILITIES
Non-current liabilities
Borrowings 22 - 525
-
525
Retirement benefit obligations 20 3.017 2.820 3.017 2.820
Trade and other payables 21 52 50 52 50
3.069 3.395 3.069 3.395
Current liabilities
Trade and other payables 21 48.640 32.290 48.205 32.122
Current income tax liabilities 410 2.182 420 2.185
Borrowings 22 788 21.525 788 21.525
49.838 55.997 49.413 55.832
Total liabilities 52.907 59.392 52.482 59.227
Total equity and liabilities 89.390 97.646 88.753 97.478
The notes on pages 10 to 68 are an integral part of these financial statements.

Financial Statements for the year ended 31st
December 2016
(from 1st
January to 31st
December 2016)
(amounts in '000 EUR, unless otherwise stated)
4
Income Statement
Amounts in '000 EUR
The GROUP The COMPANY
From 1st
January to From 1st
January to
Note
31.12.2016 31.12.2015 31.12.2016 31.12.2015
Sales 5 82.534 69.776 81.439 69.069
Cost of sales 23 (69.517) (58.386) (68.683) (58.076)
Gross profit 13.017 11.390 12.756 10.993
Distribution costs 23 (6.423) (6.195) (5.958) (5.688)
Administrative expenses 23 (4.237) (4.878) (4.208) (4.854)
Other operating income/(expenses)
– net
25 266 228 264 223
Other gains/(losses) - net 25 (2.182) 939 (2.667) 939
Profit/(loss) before tax, interest &
investing activities
441 1.484 187 1.613
Finance income 26 320 179 305 161
Finance (expenses) 26 (384) (474) (389) (480)
Finance expenses - net 26 (64) (295) (84) (319)
Profit/(loss) before tax 377 1.189 103 1.294
Income tax 27 (2.024) (620) (2.024) (620)
Profit/(loss) for the year (1.647) 569 (1.921) 674
Attributable to:
Shareholders of the parent
company (1.647) 596 (1.921) 674
Non-controlling interests - (27) - -
(1.647) 569 (1.921) 674
Earnings per share attributable to the
shareholders of the parent company
(amounts in € per share)
Basic and diluted 29 (0,07843) 0,02711 (0,09148) 0,03210
The notes on pages 10 to 68 are an integral part of these financial statements.

Financial Statements for the year ended 31st
December 2016
(from 1st
January to 31st
December 2016)
(amounts in '000 EUR, unless otherwise stated)
5
Statement of Comprehensive Income
Amounts in '000 EUR
The GROUP The COMPANY
From 1st
January to From 1st
January to
31.12.2016 31.12.2015 31.12.2016 31.12.2015
Profit/(loss) for the year (1.647) 569 (1.921) 674
Items that will not be reclassified to
profit or loss:
Actuarial gains/(losses) (56) (8) (56) (8)
Total comprehensive income for
the year after tax (1.703) 561 (1.977) 666
Attributable to:
Shareholders of the parent company (1.703) 588 (1.977) 666
Non-controlling interests - (27) - -
(1.703) 561 (1.977) 666
The notes on pages 10 to 68 are an integral part of these financial statements.

Financial Statements for the year ended 31st
December 2016
(from 1st
January to 31st
December 2016)
(amounts in '000 EUR, unless otherwise stated)
6
Statement of Changes in Equity
The notes on pages 10 to 68 are an integral part of these financial statements.
The GROUP
Amounts in '000 EUR
Attributable to the shareholders of the
parent company
Share
capital &
Share
premium
Other
reserves
Retained
earnings
Total Non
controlling
interests
Total Equity
Balance at 1st
January 2015
Note
19.409
3.594
14.853
37.856
76
37.932
Total income/(loss) for the year
after tax
- - 588 588 (27) 561
Statutory reserve - - - - - -
Foreign currency translation
differences from foreign operations
-
(32) - (32) (8) (40)
Share capital increase (reserve
capitalization and mother company
contribution)
- - - - - -
Share capital reduction 18 - - - - - -
Divident payout to QH - - (147) (147) - (147)
Other - - (52) (52) - (52)
Balance at 31st
December 2015
19.409
3.562
15.242
38.213
41
38.254
Total comprehensive income for
the year after tax
- - (2.188) (2.188) - (2.188)
Statutory reserve - - - - - -
Foreign currency translation
differences from foreign operations
-
-
-
-
(41)
(41)
Share capital increase (reserve
capitalization and mother company
contribution)
- - - - - -
Share capital reduction 18 - - - - - -
Divident payout to QH - - - - - -
Other 618 (549) 389 458 - 458
Balance at 31st
December 2016 20.027 3.013 13.443 36.483 - 36.483

Financial Statements for the year ended 31st
December 2016
(from 1st
January to 31st
December 2016)
(amounts in '000 EUR, unless otherwise stated)
7
The notes on pages 10 to 68 are an integral part of these financial statements.
The COMPANY
Amounts in '000 EUR
Share capital & share
Other
Retained
Total equity
premium reserve reserves earnings
Balance at 1st
January 2015 Note 19.409 3.645 14.672 37.726
Total comprehensive incomefor the
year after tax - - 666 666
Statutory reserve - - - -
Foreign currency translation
differences from foreign operations - - - -
Share capital increase (reserve
capitalization and mother company
contribution) - - - -
Absorption/(merge) of company 18 - - - -
Divident payout to QH - - (147) (147)
Other - - 6 6
Balance at 31st
December 2015
19.409 3.645 15.197
38.251
Total comprehensive income for
the year after tax
- - (1.977) (1.977)
Statutory reserve - - - -
Foreign currency translation
differences from foreign operations - - - -
Share capital increase (reserve
capitalization and mother company
contribution) - - - -
Share capital reduction 18 - - - -
Divident payout to QH - - - -
Other - - (3) (3)
Balance at 31st
December 2016 19.409 3.645 13.217 36.271

Financial Statements for the year ended 31st
December 2016
(from 1st
January to 31st
December 2016)
(amounts in '000 EUR, unless otherwise stated)
8
Statement of cash flows
Amounts in '000 EUR
The GROUP The COMPANY
From 1st January to From 1st January to
Note 31.12.2016 31.12.2015 31.12.2016 31.12.2015
Cash flows from operating activities
Cash flows from operating activities 28 16.774 (5.567) 16.739 (5.556)
Interest paid (486) (637) (394) (623)
Income tax paid (1.723) (544) (1.722) (544)
Net cash flows from operating activities 14.565 (6.748) 14.623 (6.723)
Cash flows from investing activities
Purchases of tangible assets 6 (688) (412) (688) (410)
Purchase of intangible assets 7 (45) (29) (45) (29)
Cash of merged company - 2.499 - 2.499
Proceeds from disposal of other investments - 184 - 184
Sales of tangible and intangible fixed assets 6 1 6 1
Contribution in kind to the parent company 1.649 - 1.649 -
Dividends received 22 9 - 9 -
Acquisition of subsidiaries, associates, joint
ventures and other investments or change
in the interest held (4.539) - (4.909) -
Interest received 26 530 605 497 592
Net cash flows from investing activities (3.078) 2.848 (3.481) 2.837
Cash flows from financing activities
Proceeds from non-controlling interests due to share capital increase/liquidation - (147) - (147)
Share capital reduction 18 - - - -
Repayments of borrowings 22 (21.263) (525) (21.263) (525)
Proceeds from borrowings 22 - 21.000 - 21.000
Net cash flows from financing activities (21.263) 20.328 (21.263) 20.328
Net increase/(decrease) in cash and cash equivalents (9.776) 16.428 (10.121) 16.442
Cash and cash equivalents at beginning of year 16 21.594 5.198 21.283 4.841
Exchange gains/(losses) on cash and cash equivalents (62) (32) - -
Cash and cash equivalents at end of year 16 11.756 21.594 11.162 21.283
The notes on pages 10 to 68 are an integral part of these financial statements.

Financial Statements for the year ended 31st
December 2016
(from 1st
January to 31st
December 2016)
(amounts in '000 EUR, unless otherwise stated)
9
Notes to the Financial Statements
1. General Information
Unisystems Information Systems SA (The "Company") was founded on December 31st
, 1970 (as a transformation of the 1964
founded limited liability company with the trade name " Electronic Explorers Doxiadis - Research and Computing Center -
Limited Liability Company Limited Liability Company").
The Unisystems Group operates in the IT industry providing, integrated IT and network services and solutions covering
hardware and software and the implementation of large scale projects.
The Group operates in Greece, Belgium, Luxembourg, Turkey, Bulgaria and Romania, and in other countries abroad.
The Company's registered offices are in Kallithea at 19-23 Padou Street, and its website is www.unisystems.com.
Financial statements comprise the separate financial statements of UniSystems Information Technology Systems SA (the
"Company") and the consolidated financial statements of the Company and its subsidiaries (the "Group") as of 31st
December
2016, in accordance with the International Financial Reporting Standards (IFRS). The names of these subsidiary companies
are listed in Note 2.2.
The financial statements of UniSystems Information Technology Systems SA are consolidated using the full consolidation
method by Quest Holdings SA, a company established in Kallithea, Athens, which at 31.12.2016 held 100% of the Company.
In summary, the basic information for the Company is as follows:
Board of Directors Composition
Ioannis K. Loumakis Chairman Supervisory authority
Region of Attica
G.E.MI. (General Electronic Commercial Registry)
No - 121831201000
former Société Anonyme Registration
No 1447/01ΝΤ/Β/86/331(08)
Tax Registration Number
094029552
Apostolos M.Georgantzis Vice-Chairman
Eytuxia S. Koutsoureli Member
Theodoros D. Fessas Member
Markos G. Bitsakos Member
The term of office in the Board of Directors expires on 30/09/2019. The Board of Directors of the Company approved the annual financial statements of the Group and the Company for the 46
th
financial year ended on 31st
December 2016, at the meeting held on 31/03/2017.
Financial Statements for the year ended 31st
December 2016
(from 1st
January to 31st
December 2016)
(amounts in '000 EUR, unless otherwise stated)
10
2. Summary of significant accounting policies
The principal accounting policies adopted in the preparation of these consolidated financial statements are presented below. These accounting policies have been consistently applied to all the years presented, unless otherwise stated .
2.1 Preparation framework of the financial information Present financial statements include the financial statements of Unisystems Information Systems SA (The "Company") and the consolidated financial statements of the Company and its subsidiaries (the "Group") dated 31st December 2016, in accordance with the International Financial Reporting Standards ("IFRS"), as adopted by the European Union.
The separate and consolidated financial statements of UniSystems Information Technology Systems SA as at 31st December 2016, for the 46th financial year from 1st January to 31 st December 2016, have been prepared by the Management under the historical cost convention, as modified by any adjustments made to certain assets and liabilities at fair value through profit or loss and financial assets at fair value.
The accounting policies applied for the preparation and presentation of the Company and Group financial statements for the
year ended on 31st
December 2016 are consistent with the accounting policies applied in the previous financial year (2015).
The preparation of financial statements in accordance with International Financial Reporting Standards (IFRS) requires the
use of certain critical accounting estimates and judgements by management in the application of accounting principles.
Moreover, the use of estimates and assumptions is required, which affect the reported amounts of assets and liabilities, the
disclosure of contingent assets and liabilities at the date of preparation of financial statements and the reported income and
expense amounts during the reporting period. Although these estimates are based on the best possible knowledge of
management with respect to the current conditions and activities, the actual results might eventually differ from these
estimates.
The areas requiring extensive use of judgement from the Management and are of high significance for the financial
statements are presented in note 4.
Business Continuity The Group and the Company fulfill their needs for working capital through cash flows generated, including bank lending.
Current economic conditions continue to limit the demand for the Group's and Company’s products, as well as their liquidity
for the foreseeable future.
The Group and the Company, taking into account possible changes in their business performance, create a reasonable
expectation that the Company and the Group have adequate resources to seamlessly continue their business operations in
the near future.
Therefore, the Group and the Company continue to adopt the "principle of business continuity of their activities" during the
preparation of the separate and consolidated financial statements for the year ended December 31, 2016.
New standards, amendments to standards and interpretations: Certain new standards, amendments to standards and
interpretations have been issued that are mandatory for periods beginning during the current financial year and subsequent
years. The Group’s evaluation of the effect of these new standards, amendments to standards and interpretations is as follows:
Standards and Interpretations effective for the current financial year
New standards, amendments to standards and interpretations: Certain new standards, amendments to standards and interpretations have been issued that are mandatory for periods beginning during the current financial year and subsequent years. The Group’s evaluation of the effect of these new standards, amendments to standards and interpretations is as follows:

Financial Statements for the year ended 31st
December 2016
(from 1st
January to 31st
December 2016)
(amounts in '000 EUR, unless otherwise stated)
11
Standards and Interpretations effective for the current financial year
IAS 19R (Amendment) “Employee Benefits”
These narrow scope amendments apply to contributions from employees or third parties to defined benefit plans and simplify the accounting for contributions that are independent of the number of years of employee service, for example, employee contributions that are calculated according to a fixed percentage of salary.
IFRS 11 (Amendment) “Joint Arrangements”
This amendment requires an investor to apply the principles of business combination accounting when it acquires an interest in a joint operation that constitutes a ‘business’.
IAS 16 and IAS 38 (Amendments) “Clarification of Acceptable Methods of Depreciation and Amortisation
This amendment clarifies that the use of revenue-based methods to calculate the depreciation of an asset is not appropriate and it also clarifies that revenue is generally presumed to be an inappropriate basis for measuring the consumption of the economic benefits embodied in an intangible asset.
IAS 16 and IAS 41 (Amendments) “Agriculture: Bearer plants”
These amendments change the financial reporting for bearer plants, such as grape vines and fruit trees. The bearer plants should be accounted for in the same way as self-constructed items of property, plant and equipment. Consequently, the amendments include them within the scope of IAS 16, instead of IAS 41. The produce growing on bearer plants will remain within the scope of IAS 41.
IAS 27 (Amendment) “Separate financial statements”
This amendment allows entities to use the equity method to account for investments in subsidiaries, joint ventures and associates in their separate financial statements and clarifies the definition of separate financial statements.
IAS 1 (Amendments) “Disclosure initiative”
These amendments clarify guidance in IAS 1 on materiality and aggregation, the presentation of subtotals, the structure of financial statements and the disclosure of accounting policies.
IFRS 10, IFRS 12 and IAS 28 (Amendments) “Investment entities: Applying the consolidation exception”
These amendments clarify the application of the consolidation exception for investment entities and their subsidiaries.
Annual Improvements to IFRSs 2012
The amendments set out below describe the key changes to certain IFRSs following the publication of the results of the IASB’s 2010-12 cycle of the annual improvements project.
IFRS 2 “Share-based payment”
The amendment clarifies the definition of a ‘vesting condition’ and separately defines ‘performance condition’ and ‘service condition’.
IFRS 3 “Business combinations”
The amendment clarifies that an obligation to pay contingent consideration which meets the definition of a financial instrument is classified as a financial liability or as equity, on the basis of the definitions in IAS 32 “Financial instruments:

Financial Statements for the year ended 31st
December 2016
(from 1st
January to 31st
December 2016)
(amounts in '000 EUR, unless otherwise stated)
12
Presentation”. It also clarifies that all non-equity contingent consideration, both financial and non-financial, is measured at fair value through profit or loss.
IFRS 8 “Operating segments”
The amendment requires disclosure of the judgements made by management in aggregating operating segments.
IFRS 13 “Fair value measurement”
The amendment clarifies that the standard does not remove the ability to measure short-term receivables and payables at invoice amounts in cases where the impact of not discounting is immaterial.
IAS 16 “Property, plant and equipment” and IAS 38 “Intangible assets”
Both standards are amended to clarify how the gross carrying amount and the accumulated depreciation are treated where an entity uses the revaluation model.
IAS 24 “Related party disclosures”
The standard is amended to include, as a related party, an entity that provides key management personnel services to the reporting entity or to the parent of the reporting entity.
Annual Improvements to IFRSs 2014
The amendments set out below describe the key changes to four IFRSs.
IFRS 5 “Non-current assets held for sale and discontinued operations”
The amendment clarifies that, when an asset (or disposal group) is reclassified from ‘held for sale’ to ‘held for distribution’, or vice versa, this does not constitute a change to a plan of sale or distribution, and does not have to be accounted for as such.
IFRS 7 “Financial instruments: Disclosures”
The amendment adds specific guidance to help management determine whether the terms of an arrangement to service a financial asset which has been transferred constitute continuing involvement and clarifies that the additional disclosure required by the amendments to IFRS 7, ‘Disclosure – Offsetting financial assets and financial liabilities’ is not specifically required for all interim periods, unless required by IAS 34.
IAS 19 “Employee benefits”
The amendment clarifies that, when determining the discount rate for post-employment benefit obligations, it is the currency that the liabilities are denominated in that is important, and not the country where they arise.
IAS 34 “Interim financial reporting”
The amendment clarifies what is meant by the reference in the standard to ‘information disclosed elsewhere in the interim financial report’.
Financial Statements for the year ended 31st
December 2016
(from 1st
January to 31st
December 2016)
(amounts in '000 EUR, unless otherwise stated)
13
Standards and Interpretations effective for subsequent periods
IFRS 9 “Financial Instruments” and subsequent amendments to IFRS 9 and IFRS 7 (effective for annual periods beginning on or after 1 January 2018)
IFRS 9 replaces the guidance in IAS 39 which deals with the classification and measurement of financial assets and financial liabilities and it also includes an expected credit losses model that replaces the incurred loss impairment model used today. IFRS 9 establishes a more principles-based approach to hedge accounting and addresses inconsistencies and weaknesses in the current model in IAS 39. The Group is currently investigating the impact of IFRS 9 on its financial statements.
IFRS 15 “Revenue from Contracts with Customers” (effective for annual periods beginning on or after 1 January 2018)
IFRS 15 has been issued in May 2014. The objective of the standard is to provide a single, comprehensive revenue recognition model for all contracts with customers to improve comparability within industries, across industries, and across capital markets. It contains principles that an entity will apply to determine the measurement of revenue and timing of when it is recognised. The underlying principle is that an entity will recognise revenue to depict the transfer of goods or services to customers at an amount that the entity expects to be entitled to in exchange for those goods or services. The Group is currently investigating the impact of IFRS 15 on its financial statements.
IFRS 16 “Leases” (effective for annual periods beginning on or after 1 January 2019)
IFRS 16 has been issued in January 2016 and supersedes IAS 17. The objective of the standard is to ensure the lessees and lessors provide relevant information in a manner that faithfully represents those transactions. IFRS 16 introduces a single lessee accounting model and requires a lessee to recognise assets and liabilities for all leases with a term of more than 12 months, unless the underlying asset is of low value. IFRS 16 substantially carries forward the lessor accounting requirements in IAS 17. Accordingly, a lessor continues to classify its leases as operating leases or finance leases, and to account for those two types of leases differently. The Group is currently investigating the impact of IFRS 16 on its financial statements. The standard has not yet been endorsed by the EU.
IAS 12 (Amendments) “Recognition of Deferred Tax Assets for Unrealised Losses” (effective for annual periods beginning on or after 1 January 2017)
These amendments clarify the accounting for deferred tax assets for unrealised losses on debt instruments measured at fair value. The amendments have not yet been endorsed by the EU.
IAS 7 (Amendments) “Disclosure initiative” (effective for annual periods beginning on or after 1 January 2017)
These amendments require entities to provide disclosures that enable users of financial statements to evaluate changes in liabilities arising from financing activities. The amendments have not yet been endorsed by the EU.
IFRS 2 (Amendments) “Classification and measurement of Shared-based Payment transactions” (effective for annual periods beginning on or after 1 January 2018)
The amendment clarifies the measurement basis for cash-settled, share-based payments and the accounting for modifications that change an award from cash-settled to equity-settled. It also introduces an exception to the principles in IFRS 2 that will require an award to be treated as if it was wholly equity-settled, where an employer is obliged to withhold an amount for the employee’s tax obligation associated with a share-based payment and pay that amount to the tax authority. The amendments have not yet been endorsed by the EU.
IFRS 4 (Amendments) “Applying IFRS 9 Financial instruments with IFRS 4 Insurance contracts” (effective for annual periods beginning on or after 1 January 2018)
The amendments introduce two approaches. The amended standard will: a) give all companies that issue insurance contracts the option to recognise in other comprehensive income, rather than profit or loss, the volatility that could arise when IFRS 9 is applied before the new insurance contracts standard is issued; and b) give companies whose activities are predominantly connected with insurance an optional temporary exemption from applying IFRS 9 until 2021. The entities that defer the

Financial Statements for the year ended 31st
December 2016
(from 1st
January to 31st
December 2016)
(amounts in '000 EUR, unless otherwise stated)
14
application of IFRS 9 will continue to apply the existing financial instruments standard—IAS 39. The amendments have not yet been endorsed by the EU.
IAS 40 (Amendments) “Transfers of Investment Property” (effective for annual periods beginning on or after 1 January 2018)
The amendments clarified that to transfer to, or from, investment properties there must be a change in use. To conclude if a property has changed use there should be an assessment of whether the property meets the definition and the change must be supported by evidence. The amendments have not yet been endorsed by the EU.
IFRIC 22 “Foreign currency transactions and advance consideration” (effective for annual periods beginning on or after 1 January 2018)
The interpretation provides guidance on how to determine the date of the transaction when applying the standard on foreign currency transactions, IAS 21. The Interpretation applies where an entity either pays or receives consideration in advance for foreign currency-denominated contracts. The interpretation has not yet been endorsed by the EU.
Annual Improvements to IFRSs 2014 (2014 – 2016 Cycle) (effective for annual periods beginning on or after 1 January 2017)
The amendments set out below describe the key changes to two IFRSs. The amendments have not yet been endorsed by the EU.
IFRS 12 “Disclosures of Interests in Other Entities”
The amendement clarified that the disclosures requirement of IFRS 12 are applicable to interest in entities classified as held for sale except for summarised financial information.
IAS 28 “Investments in associates and Joint ventures”
The amendements clarified that when venture capital organisations, mutual funds, unit trusts and similar entities use the election to measure their investments in associates or joint ventures at fair value through profit or loss (FVTPL), this election should be made separately for each associate or joint venture at initial recognition.
2.2 Consolidation (a) Subsidiaries
Subsidiaries are all entities in which the Group has the power to govern the financial and operating policies. Subsidiaries are
fully consolidated from the date on which control is transferred to the Group and are no longer consolidated from the date
that control ceases.
The Group applies the acquisition method to account for business combinations. The consideration transferred for the
acquisition of a subsidiary is the fair values of the assets transferred, the shares issued and the liabilities incurred on the
acquisition date, plus any costs directly attributable to the acquisition. Identifiable assets acquired and liabilities and
contingent liabilities assumed in a business combination are measured initially at acquisition at fair value regardless of
shareholding percentage. The excess of the cost of acquisition over the fair value of the net assets of the subsidiary acquired
is recorded as goodwill. If the cost of acquisition is less than the Group's share in the fair value of the identifiable assets
acquired, the difference is recognized directly in profit or loss.

Financial Statements for the year ended 31st
December 2016
(from 1st
January to 31st
December 2016)
(amounts in '000 EUR, unless otherwise stated)
15
Transactions, balances and unrealised gains from transactions between Group companies are eliminated. Unrealised losses
are also eliminated unless cost cannot be recovered. Accounting policies of subsidiaries have been changed where necessary
to ensure consistency with the policies adopted by the Group.
The Company accounts for investments in associates in its separate financial statements at cost less impairment.
The subsidiaries consolidated by the Group are the following: a) Unisystems Cyprus S.A., which consolidates the financial
statements of its subsidiary: Unisystems Information Technology Systems SRL and b) Unisystems Netherlands B.V., which
consolidates the financial statements of its subsidiary Unisystems Turkish Information Technologies Inc.
(b) Joint ventures Under the provisions of IFRS 11, investments in joint agreements are classified as either joint operations or as joint ventures
and the classification depends on the contractual rights and obligations of each investor. The Group has evaluated the
nature of the joint investment agreements and decided that these are joint ventures.
As at 31.12.2016 the Company held interests in the following joint ventures: 1. J/V "UniSystems Information Technology Systems SA - SingularLogic S.A.", Athens, for the project "Computerisation of
the Criminal Record Central Service of the Ministry of Justice". 2. J/V "UniSystems Information Technology Systems SA - SingularLogic S.A.", Athens, for the project "Computerisation of
the Criminal Record Service of the Public Prosecutor’s Office of the Court of First Instance of six cities". 3. J/V of Integrated Information Technology Projects ALTEC-INFO QUEST-INTRACOM ΙΤ SERVICES-PC
SYSTEMS with the distinctive title "K.O.E.P. "(J/V Information Technology Olympic Projects) for the project
Computerisation of Athens 2004. 4. J/V "Info Quest - ALGOSYSTEMS S.A." for the project "Provision, Installation and Support of Electronic Equipment and
Software for (10) Cadastre Offices and for National Cadastre & Mapping Agency S.A." and 5. J/V "UniSystems Information Technology Systems SA - SPACE HELLAS " for the project "Provision of System Hardware
and Software for the Development of the Cadastral Survey Information Technology System of National Cadastre &
Mapping Agency S.A."
It is noted that the aforementioned Joint Ventures: a) Have been established, in accordance with the applicable legislation, for tax purposes and there is no equity relationship
between the Company and these Joint Ventures. b) They have all the characteristics of jointly controlled operations, as defined in IAS 11. c) The Company, based on the relevant pricing, has recognised in its financial statements its proportionate share of the net
fee (proportionate income less expenses) received for the above projects carried out by Joint Ventures as of 31.12.2016. For all the aforementioned reasons, these Joint Ventures have not been included in the consolidation. (c) Associates
Associates are entities over which the Group generally has between 20% and 50% of the voting rights, or over which the
Group has significant influence, but which it does not control. Investments in associates are accounted for by the equity
method of accounting and are initially recognised at cost. The Group’s investment in associates includes goodwill (net of any
cumulative impairments losses) identified in acquisition.

Financial Statements for the year ended 31st
December 2016
(from 1st
January to 31st
December 2016)
(amounts in '000 EUR, unless otherwise stated)
16
Under this method the Group’s share of the post-acquisition profits or losses of associates is recognised in the income
statement and its share of post-acquisition movements in reserves is recognised in reserves. The cumulative changes affect
the carrying amount of the investments in associates. When the Group’s share in the losses of an associate is equal or greater
than the carrying amount of the investment, the Group does not recognize any further losses, unless it has assumed further
obligations or made payments on behalf of the associate.
At each reporting date the Group evaluates whether there is a significant indication that investment in associates are
impaired. When an indication arises, the Group calculates the amount of the impairment as the difference between the
recoverable value of investment in associates and the book value and recognizes the amount in the profit & loss account.
Unrealized profits from transactions between the Group and its associates are eliminated according to the Group’s interest
held in the associates. The accounting policies of associates have been adjusted in order to ensure consistency to the ones
adopted by the Group.
2.3 Foreign currency translation (a) Functional and presentation currency Items included in the financial statements of each of the Group’s entities are measured using the currency of the primary
economic environment in which the entity operates ("the functional currency"). The separate and consolidated financial
statements are presented in thousand euros, which is the parent Company's as well as the Group companies' functional and
reporting currency.
(b) Transactions and balances Foreign currency transactions are translated into the functional currency using the exchange rates prevailing at the dates of
the transactions. Foreign exchange gains and losses resulting from the settlement of such transactions and from the
translation at year-end exchange rates of monetary assets and liabilities denominated in foreign currencies are recognised in
the income statement. Foreign currency translation differences from non-monetary items that are valued at their fair value
are considered as part of the fair value of the latter and, as a result, are recorded as fair value differences.
(c) Group Companies
The conversion of the financial statements of the Group entities that have a functional currency different from the
presentation currency is as follows:
Assets and liabilities for each financial statement are converted using the closing rate of the date of the financial position date
Revenue and expenses are converted using the average exchange rate of each financial period and
Exchange differences are recognized in other comprehensive income statement
Goodwill and fair value adjustments resulting from the acquisition of a foreign entity are treated as assets and liabilities and
are converted using the exchange rate of the reporting date. Exchange differences are recognized in other comprehensive
income statement.
2.4 Property, plant and equipment Intangible assets are recognised at acquisition cost less accumulated amortisation and impairment loss. Acquisition cost
includes all expenditure directly associated with the acquisition of items of property, plan and equipment. Subsequent costs
are included in the asset’s carrying amount or recognised as a separate asset, as appropriate, only when it is probable that
future economic benefits associated with the item will flow to the Group that are greater than the benefits initially expected
according to the item's initial performance and on condition that the cost of the item can be measured reliably. The carrying

Financial Statements for the year ended 31st
December 2016
(from 1st
January to 31st
December 2016)
(amounts in '000 EUR, unless otherwise stated)
17
amount of the replaced part is derecognised. All other repairs and maintenance are charged to the income statement during
the financial period in which they are incurred.
Land is not depreciated. Depreciation on other assets is calculated using the straight-line method to allocate their cost or
revalued amounts to their residual values over their estimated useful lives.
The estimated useful life of items of property, plant and equipment are as follows:
Buildings 50 Years
Machinery - technical installations and 1-7 Years
other mechanical equipment
Vehicles 5-8 Years
Furniture & equipment 1-7 Years
The assets’ residual values and useful lives are reviewed, and adjusted if appropriate, at the end of each reporting period. An
asset’s carrying amount is written down immediately to its recoverable amount if the asset’s carrying amount is greater than
its estimated recoverable amount and the difference is immediately recognised as expense in the income statement.
Upon the sale of PPE, any difference between the consideration received and the asset's carrying amount is recorded as gain
or loss in the income statement. Assets classified as "Investment Property" are measured at cost.
2.5 Intangible assets (a) Goodwill Goodwill represents the difference between acquisition cost and the fair value of the subsidiary’s/associate's equity share as
at the date of acquisition. Goodwill arising from acquisitions of subsidiaries is recognized in intangible assets. Goodwill arising
from acquisition of associates is recognised in investments in associates. Goodwill is reviewed annually for impairment and is
recognised at cost less impairment, which is charged in the income statement when it is incurred and is not subsequently
reversed. Profit and losses from the disposal of an enterprise include the book value of the goodwill of the enterprise sold.
For the purpose of impairment testing, goodwill acquired in a business combination is allocated to cash generating units.
Impairment loss is recognised when the recoverable value is less than the net book value. Profit or loss resulting from the
disposal of an enterprise include the goodwill of the enterprise sold. Any impairment is recognised immediately as an
expense and is not subsequently reversed.
(b) Concessions and industrial property rights
Concessions and industrial property rights are measured at acquisition cost less amortisation and impairment loss.
Depreciation is calculated using the straight line method over the estimated useful lives of the assets ranging from 3-5 years.
(c) Software Software licenses are measured at acquisition cost less accumulated amortisation, less accumulated impairment loss.
Amortisation is calculated using the straight line method over the estimated useful lives of the assets which is 4 years. Costs that are directly attributable to software development, whereby the results of research are applied to programs or the
design of new or significantly improved products and procedures, are recognised as intangible assets on condition that it is
technically and financially feasible to complete the product or procedure and the Company has adequate resources to
complete the development. Directly attributable costs that are capitalised as part of the software product include the cost of

Financial Statements for the year ended 31st
December 2016
(from 1st
January to 31st
December 2016)
(amounts in '000 EUR, unless otherwise stated)
18
materials, the software development employee costs and an appropriate portion of relevant overheads. Other development
expenditures are recognised as an expense as incurred. Capitalised development costs are recognised at cost less
accumulated amortisation and impairment loss. Amortisation is calculated using the straight line method over the estimated
useful lives of the assets ranging from 3-5 years.
2.6 Impairment of financial assets Assets that have an indefinite useful life, such as goodwill, are not subject to amortisation and are tested annually for
impairment. Assets that are amortized are subject to impairment testing when circumstances or indications exist that their
book value is not recoverable. The recoverable amount is the higher of an asset’s net realisable value less costs of disposal
and value in use. For the purposes of assessing impairment, assets are grouped at the lowest levels for which there are
separately identifiable cash flows (cash-generating units). Impairment losses are recognised as an expense in the income
statement in the period in which they are incurred. Prior impairments of assets (other than goodwill) are reviewed for
possible reversal at each reporting date.
2.7 Non-current Assets Held for Sale and Discontinued Operations
Non-current assets are classified as held for sale when their book value will be recovered through sale and the sale is
considered highly probable. These are valued at the lowest between book value and fair value less sale cost.
2.8 Financial assets
The financial assets of the Group have been classified in the following categories based on the purpose for which each
investment was undertaken. Management determines the classification of its financial assets at initial recognition and
reviews this classification at each reporting date.
(a) Loans These include non-derivative financial assets with fixed or predefined payments which are not traded in an active markets.
They are included in current assets, except for those with maturity greater than 12 months after the balance sheet date
which are classified in non-current assets. The Group’s loans and receivables comprise ‘Other long-term receivables’, ‘Trade
and other receivables’, and ‘Cash and cash equivalents’ in the balance sheet.
(b) Available-for-sale financial assets Available-for-sale financial assets are non-derivatives that are either designated in this category or not classified in any of the
other categories as they are not held for trading, are not issued by the Company and are not held to maturity. They are
included in non-current assets unless management intends to dispose of the investment within 12 months from the end of
the reporting period.
Recognition and measurement
Purchases and sales of financial assets are recognised on the trade-date – the date on which the Group commits to purchase
or sell the asset. Investments are initially recognised at fair value plus transaction costs. Financial assets are derecognised
when the rights to receive cash flows from the investments have expired or have been transferred and the Group has
transferred substantially all risks and rewards of ownership.
Unrealised gains or losses arising from changes in the fair value of the ‘financial assets at fair value through profit or loss’
category are recognised in the investment valuation reserves. When assets classified as available for sale are sold or
impaired, the accumulated fair value adjustments are transferred to the income statement.

Financial Statements for the year ended 31st
December 2016
(from 1st
January to 31st
December 2016)
(amounts in '000 EUR, unless otherwise stated)
19
Impairment of financial assets
The Group assesses at the end of each reporting period whether there is objective evidence that a financial asset or group of
financial assets is impaired. In the case of equity investments classified as available for sale, a significant or prolonged decline
in the fair value of the security below its cost is also evidence that the assets are impaired. If any such evidence exists, the
cumulative loss (measured as the difference between the acquisition cost and the current fair value, less any impairment loss
on that financial asset previously recognised in profit or loss) is removed from equity and recognised in profit or loss under
investment valuation reserve. Impairment losses of equity instruments recognized in the income statement are not reversed
through the income statement. Impairment test for loans and receivables is described in note 2.10.
The following table analyses available-for-sale financial assets:
COMPANY COUNTRY INTEREST
HELD (%)
1. ITEC S.A. GREECE 34%
2. CREATIVE MARKETING S.A. GREECE 40%
3. ACROPOLIS TECHNOLOGICAL PARK S.A. GREECE 4.43%
4. PROBANK S.A. GREECE 0.1%
5. EPIRUS SCIENCE AND TECHNOLOGY PARK (Ε.ΤΕ.P.I.) GREECE 2.47%
6. Briq Properties R.E.I.C. GREECE 13,61%
2.9 Financial Instruments
Derivative financial instruments include forward currency agreements. Derivatives are initially recognized in the balance
sheet at fair value on the date of the agreement, and then evaluated at fair value.
Derivatives are included in assets when the fair value is positive, but if the fair value is negative they are included in liabilities.
Derivative financial instruments are used by the Group for management of risk associated with its business activities.If
derivative financial instruments do not meet the hedge accounting criteria, differences in fair value are recognized in the
Income Statement.
The profit or loss resulting from the use of derivative financial instruments is recorded in profit or loss under "Other gains /
losses".
The Group has no open position in derivative financial instruments on December 31st
, 2016.
2.10 Inventories Inventories are measured at the lower of acquisition cost and net realizable value. Net realisable value is the estimated
selling price in the ordinary course of business, less applicable variable selling expenses.

Financial Statements for the year ended 31st
December 2016
(from 1st
January to 31st
December 2016)
(amounts in '000 EUR, unless otherwise stated)
20
The acquisition cost of inventories is calculated using the weighted average method. Financial expenses are not included in
the acquisition cost of inventories.
2.11 Trade receivables
Trade receivables are recognised initially at fair value and subsequently measured at amortised cost using the effective
interest method, less provision for impairment. A provision for impairment of trade receivables is established when there is
objective evidence that the Group will not be able to collect all amounts due according to the original terms of receivables.
The amount of provision is the difference between the asset’s carrying amount and the present value of the estimated future
cash flows, discounted at the effective interest rate. The amount of provision is recognised as an expense in the income
statement under distribution expenses. Any trade receivables that are not considered to be recoverable are written off
against the above provisions. The subsequent collection of previously written-off receivables is recognised in profit or loss as
a reduction of distribution costs.
2.12 Cash and cash equivalents Cash and cash equivalents include cash, sight deposits, bank overdrafts and short-term investments of up to three months,
with high liquidity and low risk. Bank overdrafts are included in short-term borrowings.Bank overdrafts are included in the
loans account of current liabilities account.
2.13 Share Capital
Ordinary shares are classified as equity. Incremental costs directly attributable to issue of shares, after deducting the tax, are reflected as a reduction of the
proceeds. Incremental costs directly attributable to the issue of new shares for the acquisition of other entities are included
in the cost of acquisition of the new company. Where any group company purchases the company’s equity share capital (treasury shares), the consideration paid is
deducted from the Company's equity until the shares are sold, cancelled or reissued. Any gain or loss from the sale of
treasury shares, net of any directly attributable transaction costs and income tax is presented as a reserve in equity.
2.14 Trade Liabilities
Trade liabilities include payment obligations for acquired products and services during the ordinary activities of the group.
Trade payables are recognized as current liabilities when payment must be settled within the next year. If payment can be
settled beyond the year, then they are recorded in non-current liabilities.
Trade payables are recognized initially at fair value and, subsequently,they are evaluated according to the unamortized cost
method using the effective interest rate.
2.15 Borrowings Borrowings are recognised initially at fair value, net of transaction costs incurred. Borrowings are subsequently carried at
amortised cost using the effective interest rate method. Any difference between the proceeds (net of transaction costs) and
the redemption value is recognized in the income statement over the period of the borrowings using the effective interest
rate method. Borrowings are classified as current liabilities unless the Group has the right to defer the settlement of the obligation for at
least 12 months from the balance sheet date.

Financial Statements for the year ended 31st
December 2016
(from 1st
January to 31st
December 2016)
(amounts in '000 EUR, unless otherwise stated)
21
2.16 Borrowing Costs
The overall borrowing costs and borrowing costs undertaken specifically for the acquisition, construction or production of an
asset that meets the conditions, are capitalized as part of the cost of that asset, for the period required by the specific asset
to it is ready for use or sale. Asset that meets the requirements is an asset subject to an extended period of time in order to
be ready for the use for which it is determined or sale.
All other borrowing costs are recognized in profit or loss as incurred. 2.17 Current and deferred income tax The tax expense for the period comprises current and deferred tax, that is tax charges and concessions related to the
economic benefits arising in the reporting period but have already been or will be imposed by tax authorities in different
reporting periods. Current income taxes comprise tax liabilities towards tax authorities, including taxes charged on the taxable income for the
year and any additional taxes concerning previous reporting periods.
Income tax on profit is calculated using the applicable tax rates in accordance with the tax legislation effective in each
reporting period, based on the taxable profit for the period.
Deferred income tax is determined using the liability method on temporary differences arising between the tax bases of
assets and liabilities and their carrying amounts. The deferred income tax is not accounted for if it arises from initial
recognition of an asset or liability in a transaction, other than a business combination, that at the time of the transaction
affects neither the accounting nor the taxable gains or losses.
Deferred income tax is determined using tax rates (and laws) that have been enacted or substantively enacted by the balance
sheet date and are expected to apply when the related deferred income tax asset is realised or the deferred income tax
liability is settled. If the Group cannot determine the exact timing of the reversal of the temporary differences the tax rate
effective in the subsequent reporting period is used.
Deferred income tax assets are recognised to the extent that it is probable that future taxable profit will be available against
which the temporary differences can be utilised.
Deferred income tax is also provided on temporary differences arising on investments in subsidiaries, joint ventures and
associates, except where the timing of the reversal of the temporary difference is controlled by the Group and it is probable
that the temporary difference will not reverse in the foreseeable future.
Deferred income tax is recognised in the income statement if the transactions and events related to the tax charge are also
recognised in the income statement. Deferred income tax is recognised directly in equity if the transactions and events
related to the tax charge are also recognised in equity.
Income tax assets and liabilities (both current and deferred) are offset when there is a legally enforceable right to offset
current tax assets against current tax liabilities and when the income tax assets and liabilities relate to income taxes levied by
the same taxation authority.
2.18 Employee benefits
(a) Short-term benefits
Short-term employee benefits (other than employment termination benefits) both in cash and in kind are recognised as an
expense when they are accrued. Any outstanding payment is recognised as a liability and if the amount already paid exceeds
the amount of benefits, the company can recognise the excess as an asset (prepaid expense) only to the extent that the

Financial Statements for the year ended 31st
December 2016
(from 1st
January to 31st
December 2016)
(amounts in '000 EUR, unless otherwise stated)
22
prepayment will result in the reduction of future payments or a cash refund.
(b) Post-employment benefits The Group contributes to both defined benefit and defined contribution plans.
Defined contribution plan
In a defined contribution plan the company's (legal) obligation is limited to the amount it has agreed to pay to the insurance
fund managing the contributions and providing the benefits (pensions, healthcare services etc.). As a result, the Group has no
obligations to pay further contributions if the public insurance fund does not hold sufficient assets to pay all employees the
benefits relating to employee service in the current and prior periods.
The accrued cost of defined contribution programs is recognized as expense during the relevant period.
Defined benefit plan
The liability recognised in the balance sheet in respect of defined benefit pension plans is the present value of the defined
benefit obligation less the fair value of plan assets. The defined benefit obligation is calculated by independent actuaries
using the projected unit credit method. The present value of the defined benefit obligation is determined by discounting the
estimated future cash outflows using interest rates of high-quality corporate bonds that are denominated in the currency in
which the benefits will be paid, and that have terms to maturity approximating to the terms of the related pension
obligation.
Actuarial gains and losses arising from experience adjustments and changes in actuarial assumptions are transferred to
equity being charged or credited to other comprehensive income in the period in which they arise.
Current service cost is directly recognized in the income statement. (c) Employment termination benefits Termination benefits are payable when employment is terminated before the normal retirement date, or when an employee
accepts voluntary redundancy in exchange for these benefits. The Group recognizes termination benefits when it is
demonstrably committed to either: terminating the employment of current employees according to a detailed formal plan
without possibility of withdrawal; or providing termination benefits as a result of an offer made to encourage voluntary
redundancy. Benefits falling due more than 12 months after the end of the reporting period are discounted to their present
value. In case of employment termination where the number of employees to use such benefits cannot be determined, the
benefits are disclosed as contingent liability, but are not accounted for.
2.19 Grants Government grants are recognized at their fair value where it is virtually certain that the grant will be received and the Group
will comply with all stipulated conditions. Government grants that were received in order to cover expenses, are recognised
in profit or loss and are matched to these expensed. Government grants relating to property, plant and equipment are
included in non-current liabilities as deferred government grants and are credited to the income statement on a straight- line
basis over the expected lives of the related assets.
2.20 Provisions
Provisions are recognised when:
i. There is a present legal or constructive obligation as a result of past events.
Financial Statements for the year ended 31st
December 2016
(from 1st
January to 31st
December 2016)
(amounts in '000 EUR, unless otherwise stated)
23
ii. It is probable that an outflow of resources will be required to settle the obligation.
iii. The amount can be reliably estimated.
Provisions are measured at the discounted value of the future cash outflows needed to settle the current liability, based on
the management's estimates, as of the balance sheet date. The discount interest rate used to calculate the present value
reflects current market assessments of the time value of money and any risks related to the specific liability.
2.21 Revenue recognition
Revenue consists of the fair value of the consideration received or receivable for goods and services supplied by the
Company in its ordinary course of business, stated net of discounts, returns and value added taxes. Intragroup sales are not
recognised in the consolidated financial statements.
Revenue is recognised only when it is probable that future economic benefits, related to the transaction, will flow to the
entity.
The Company's and the Group's revenue are generated from software development contracts as well as from computer
hardware and application sales and maintenance agreements.
The specific revenue recognition criteria used are the following:
(a) Revenue from software development contracts: The Group uses the stage-of-completion method to estimate the
appropriate amount of revenue and expense to be recognized for a certain period. The stage of completion is calculated
based on the expenses which have been incurred up to the balance sheet date compared to the total estimated expenses for
each contract. If it is probable that the total cost of the contract will exceed total income, then the estimated loss is directly
recognized in profit and loss as an expense.
The total incurred cost and recognized profit/loss for each contract is compared with cumulative invoices till the end of the
year.
Whereby the realized expenses plus the net profit (less loss) recognized exceed the sequential invoices, the resulting
difference is presented as “Amounts receivable from software development contract” under the account “Trade and other
receivables”. When the cumulative invoices exceed the incurred expenses plus the net profit (less loss) recognized, the
balance is presented as a “Amounts payables for software development contract” under the account “Trade and other
payables”.
(b) Provision of computer hardware and application maintenance services: Revenue from provision of services are
recognised in the period in which they are rendered.
(c) Sales of goods: Sales of goods are recognized when the Group has delivered the products to the customers, the
customers have accepted the products and the collection of the amounts due is reasonably certain. If there is a refund
guarantee for sales of goods, the amounts of refund are recognised at each reporting date as a reduction of revenue, based
on statistics.
(d) Interest income: Interest income is recognised pro rata temporis using the effective interest rate. In case of impairment
of receivables, their carrying amounts are reduced to their recoverable amounts which are equal to the present value of the
expected future cash flows discounted at the initial effective interest rate. Subsequently, interest is calculated using the same

Financial Statements for the year ended 31st
December 2016
(from 1st
January to 31st
December 2016)
(amounts in '000 EUR, unless otherwise stated)
24
interest rate on the reduced (new carrying) value.
(e) Dividends: Dividends are accounted for as income upon their collection.
2.22 Leases
As lessor:
Granted rights of use of leased equipment and information technology systems, whereby the Company transfers
substantially all risks and rewards of ownership to its customers, are classified as finance leases. Finance leases are initially
recognised as receivables at the lease’s commencement at the lower of the fair value of the car and the present value of the
minimum lease receivables. The difference between the gross receivable and the present value of the receivable is
recognised as unearned finance income. Lease income is recognised in profit or loss over the term of the lease using the net
investment method, which provides a constant periodic rate of return.
Receivables from finance leases refer to long-term leases which are included in “Trade and other receivables” in the balance
sheet. These receivables are recognised at amortised cost using the effective interest rate less impairment loss. A provision
for impairment of trade receivables is established when there is objective evidence that the Company will not be able to
collect all amounts due according to the original terms of receivables. Impairment loss provision is based on the historical
data held by the Company and the risks inherent to its portfolio.
As lessee:
Leases of fixed assets whereby all the risks and rewards of ownership are maintained by the Group are classified as finance
leases. Finance leases are capitalised at the inception of the leases at the lower of the fair value of the leased property and
the present value of the minimum lease payments. The corresponding rental obligations, net of finance charges, are included
in other long-term payables. The part of the finance charge relating to finance leases is recognized in the income statement
over the term of lease. The property, plant and equipment acquired under finance leases is depreciated over the shorter of
the useful life of the asset and the lease term.
The Company and the Group do not have any finance leases as lessees.
Leases in which the risks and rewards of ownership remain with the lessor are classified as operating leases. Payments made
under operating leases (net of any incentives received from the lessor) are charged to the income statement on a straight-
line basis over the period of the lease.
2.23 Dividends distribution
Dividends of ordinary shares are recognised as a liability in the period in which the dividends are announced and approved by
the company’s General Meeting of Shareholders.
2.24 Earnings per share
Basic earnings per share are calculated by dividing the profit attributable to equity holders of the Parent Company by the
weighted average number of ordinary shares in issue during the year excluding ordinary shares purchased by the Company
and held as treasury shares. Diluted earnings per share are calculated by dividing the profit attributable to equity holders of
the Parent Company by the weighted average number of ordinary shares in issue during the year (adjusted with the effect of
share options).
Financial Statements for the year ended 31st
December 2016
(from 1st
January to 31st
December 2016)
(amounts in '000 EUR, unless otherwise stated)
25
2.25 Comparative information and roundings
The financial statement information of the period ended on 31.12.2016 were used as comparative information for the
presentation of the financial statements for the period ended on 31.12.2015.
In order for the financial statements for the year ended December 31, 2016 to be comparable to those of the current year, reclassifications have been made that have no impact on the Company's and the Group's equity or results.

Financial Statements for the year ended 31st
December 2016
(from 1st
January to 31st
December 2016)
(amounts in '000 EUR, unless otherwise stated)
26
3. Financial risk management
3.1. Financial risk factors The Group is exposed to financial risks, such as market risks (foreign exchange risk, interest rate risk, price risk), credit risk
and liquidity risk. The overall risk management plan of the Group focuses on the unpredictability of financial markets and
aims to minimise their potential negative impact on the financial performance of the Group. The Group uses derivative
financial instruments to hedge its exposure to certain risks.
Risk managements is carried out by the central treasury department of the Group, which operates under specific rules
approved by the Company's Board of Directors. The board provides written principles and guidance for overall risk
management, as well as written policies covering specific areas, such as foreign exchange risk, interest rate risk and credit
risk.
(a) Market Risk
(i) Foreign exchange risk The Group operates in Europe and as a result the majority of the Group's transactions are denominated in Euro. The Group
purchases some products in foreign currencies, mainly in US dollars. The timely payment of suppliers reduces significantly the
foreign exchange risk. The Group, in order to address foreign exchange risk, takes long positions in foreign currency futures
with third parties.
The Group's and the Company's exposure to foreign exchange risk as at 31.12.2016 and 31.12.2015 is analysed as follows:
The GROUP
31.12.2016
Bulgarian Turkish Romanian
Receivables in US $ CHF Lev Lira RON Total
foreign currency 25 - - 15 737 777
Payables in
foreign currency 44 - - 50 723 817
Total 69 - - 65 1.460 1.594
31.12.2015
UK Bulgarian Turkish Romanian
Receivables in US $ Pounds Lev Lira RON Total
foreign currency 34 - - 234 306 574
Payables in
foreign currency 335 7 - 195 199 736
Total 369 7 - 429 505 1.310
Financial Statements for the year ended 31st
December 2016
(from 1st
January to 31st
December 2016)
(amounts in '000 EUR, unless otherwise stated)
27
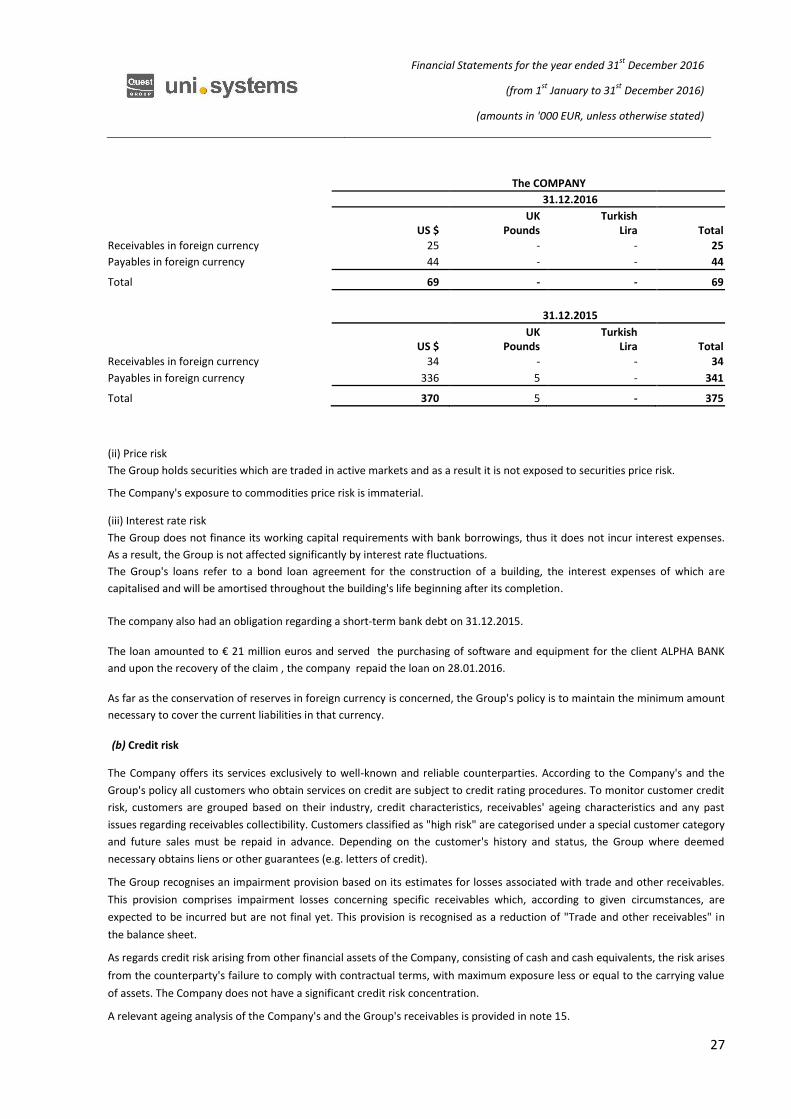
The COMPANY
31.12.2016
UK Turkish
US $ Pounds Lira Total
Receivables in foreign currency 25 - - 25
Payables in foreign currency 44 - - 44
Total 69 - - 69
31.12.2015
UK Turkish
US $ Pounds Lira Total
Receivables in foreign currency 34 - - 34
Payables in foreign currency 336 5 - 341
Total 370 5 - 375
(ii) Price risk The Group holds securities which are traded in active markets and as a result it is not exposed to securities price risk. The Company's exposure to commodities price risk is immaterial. (iii) Interest rate risk The Group does not finance its working capital requirements with bank borrowings, thus it does not incur interest expenses.
As a result, the Group is not affected significantly by interest rate fluctuations. The Group's loans refer to a bond loan agreement for the construction of a building, the interest expenses of which are
capitalised and will be amortised throughout the building's life beginning after its completion.
The company also had an obligation regarding a short-term bank debt on 31.12.2015.
The loan amounted to € 21 million euros and served the purchasing of software and equipment for the client ALPHA BANK
and upon the recovery of the claim , the company repaid the loan on 28.01.2016.
As far as the conservation of reserves in foreign currency is concerned, the Group's policy is to maintain the minimum amount
necessary to cover the current liabilities in that currency.
(b) Credit risk The Company offers its services exclusively to well-known and reliable counterparties. According to the Company's and the
Group's policy all customers who obtain services on credit are subject to credit rating procedures. To monitor customer credit
risk, customers are grouped based on their industry, credit characteristics, receivables' ageing characteristics and any past
issues regarding receivables collectibility. Customers classified as "high risk" are categorised under a special customer category
and future sales must be repaid in advance. Depending on the customer's history and status, the Group where deemed
necessary obtains liens or other guarantees (e.g. letters of credit). The Group recognises an impairment provision based on its estimates for losses associated with trade and other receivables.
This provision comprises impairment losses concerning specific receivables which, according to given circumstances, are
expected to be incurred but are not final yet. This provision is recognised as a reduction of "Trade and other receivables" in
the balance sheet. As regards credit risk arising from other financial assets of the Company, consisting of cash and cash equivalents, the risk arises
from the counterparty's failure to comply with contractual terms, with maximum exposure less or equal to the carrying value
of assets. The Company does not have a significant credit risk concentration. A relevant ageing analysis of the Company's and the Group's receivables is provided in note 15.

Financial Statements for the year ended 31st
December 2016
(from 1st
January to 31st
December 2016)
(amounts in '000 EUR, unless otherwise stated)
28
(c) Liquidity risk
Each Group company prepares financial reporting statements and submits them to Unisystems Information Systems S.A on a
quarterly basis to draw up cash flow plans and to secure effective monitoring of liquidity at Group level.
The Group's policy regarding liquidity management is to maintain sufficient cash as well as credit limits from banks. The
existing available unused approved bank credits to the Group are sufficient to deal with any possible shortage of cash
reserves.
More specifically, the Group's and the Company's financial liabilities are analysed based on their maturity as follows:
The GROUP
1-2 3-5 Over
31.12.2016 <1 year years years 5 years Total
Borrowings 788 - - - 788
Trade and other payables 48.640 52 - - 48.692
49.428 52 - - 49.480
1-2 3-5 Over
31.12.2015 <1 year years years 5 years Total
Borrowings 21.525 525 - - 22.050
Trade and other payables 32.290 50 - - 32.340
53.815 575 - - 54.390
The COMPANY
1-2 3-5 Over 31.12.2016 <1 year years years 5 years Total
Borrowings 788 - - - 788
Trade and other payables 48.206 52 - - 48.258
48.994 52 - - 49.046
1-2 3-5 Over
31.12.2015 <1 year years years 5 years Total
Borrowings 21.525 525 - - 22.050
Trade and other payables 32.122 50 - - 32.172
53.647 575 - - 54.222

Financial Statements for the year ended 31st
December 2016
(from 1st
January to 31st
December 2016)
(amounts in '000 EUR, unless otherwise stated)
29
(d) Risk of economic incident – Macroeconomic business environment in Greece
The evolutions during 2016 and the discussions at national and international level about the re-appraisal of the terms of the
Greek financing program, render the macroeconomic and the financial environment in the country, volatile. Turning to
economic stability, depends, to a great extent, on the decisions & actions of the local and international institutions. However,
taking into account the nature of the business and the financial state of the Company and the Group, any negative
advancement is not expected to affect significantly its normal operation, provided that such an advancement will prevail for a
short period of time. Nevertheless, the Management continuously accesses the situation and its possible consequences, in
order to ensure that all feasible measures are diligently taken, so as to minimize any negative implication on the business of
the Company and the Group.
In specific, the Group assessed and confirms to have adequacy with reference to:
Its capability to pay off or re-finance the current debt, since on the one hand there are sufficient cash reserves, whereas
on the other, the Group is not exposed to significant short term loan
Its capability to claim back any trade debts, given the strict credit policy applied and the credit insurance provided on
occasional basis
Its capability to retain a high sales turnover due to the diversity of its activities
Its capability to recover the value of all tangible and intangible assets possessed, due to the yearly revaluation of their
worth being performed, according to their plausible value.
3.2 Capital risk management
The Group’s objectives when managing capital are to safeguard the Group’s ability to continue as a going concern in order to
provide returns for shareholders and to maintain an optimal capital structure to reduce the cost of capital.
In order to maintain or adjust the capital structure, the Group may adjust the amount of dividends paid to shareholders,
return capital to shareholders, issue new shares or sell assets to reduce debt.
The Group monitors capital risk on the basis of the gearing ratio. This ratio is calculated as net debt divided by total capital
(equity and borrowed capital). Net debt is calculated as total borrowings (including current and non-current borrowings) less
cash and cash equivalents.
The gearing ratios at 31
st December 2016 and 2015 were as follows:
31.12.2016 31.12.2015
Total debt (Note 21) 788 22.050
Less: Cash and cash equivalents (Note 16) (11.756) (21.594)
Net debt (10.968) 456
Total equity 36.483 38.254
Total capital 25.515 38.710
Gearing ratio -42,99% 1.18%
The change from 1,18% on 31.12.2015 to -42,99% of the gearing ratio on 31.12.2016 is due to the higher level of cash
reserves against borrowing.

Financial Statements for the year ended 31st
December 2016
(from 1st
January to 31st
December 2016)
(amounts in '000 EUR, unless otherwise stated)
30
The borrowed amount of € 21.000K served the software and equipment purchased for the ALPHA BANK and by the recovery
of the claim by the client, the company repaid the loan on 28.01.2016.
3.3 Fair value estimation
The group provides the required disclosures regarding fair value measurements using a three-level hierarchy:
Financial assets traded in active markets, the fair value of which is determined according to the published market
prices on the reporting date for similar assets and liabilities ("Level 1").
Financial assets not traded in active markets, the fair value of which is determined using valuation techniques and
assumptions that are either directly or indirectly based on market conditions on the reporting date ( "Level 2").
Financial assets not traded in active markets, the fair value of which is determined using valuation techniques and
assumptions that are mainly not based on market data ( "Level 3").
Fair value levels are defined as follows:
Amounts in € The GROUP
31.12.2016 31.12.2015
Note Level 1 Level 2 Level 3 Total Level 1 Level 2 Level 3 Total
Available-for-sale financial assets 11 - 4.539 - 4.539 - 142 - 142 Financial assets at fair value through profit or loss - - - - - - - -
Derivative financial assets - - - - - - - -
- 4.539 - 4.539 - 142 - 142
Derivative financial liabilities - - - - - - - -
- - - - - - - -
Amounts in € COMPANY
31.12.2016 31.12.2015
Note Level 1 Level 2 Level 3 Total Level 1 Level 2 Level 3 Total
Available-for-sale financial assets 11 - 4.539 - 4.539 - 142 - 142 Financial assets at fair value through profit or loss - - - - - - - -
Derivative financial assets - - - - - - - -
- 4.539 - 4.539 - 142 - 142
Derivative financial liabilities - - - - - - - -
- - - - - - - -
There were no transfers between levels 1 and 2 during the year.

Financial Statements for the year ended 31st
December 2016
(from 1st
January to 31st
December 2016)
(amounts in '000 EUR, unless otherwise stated)
31
4. Critical accounting estimates and judgements made by management
Estimates and judgements made by management are continuously reviewed and are based on historic data and expectations
for future events which are considered reasonable under the current circumstances.
4.1 Critical accounting estimates and assumptions
The Group and the Company make estimates and assumptions concerning the future. These estimates and assumptions,
which involve a significant risk of causing material adjustments to the carrying amounts of assets and liabilities within the next
12 months, refer to: (a) Revenue from software development contracts: In accordance with IAS 11 the Group uses the method of percentage of completion for the recognition of revenue from construction contracts and services.By this method the percentage of completion is cumulatively calculated up to each balance sheet date, based on the percentage derived by adjusting invoiced revenue in relation to the total revised contract price.Any possible revisions of the total contractual cost and price, are taken into consideration during the period when such revisions take place,in which case the relevant cost and revenue sums are settled. (b) Income tax The Group operates through its subsidiaries in various countries, and the subsidiaries are subjected to income tax in relation to the tax regime of each country. For income tax determination and provision a management judgment required to be exercised. There are many transactions and calculations for which the ultimate tax determination is uncertain. If the final result of the tax clearance or tax matters is different from the provision initially recognized, such differences will impact the income tax and deferred tax provisions of the period. (c) Property, plant and equipment depreciation rate:
Property, plant and equipment of the Company are depreciated based on their estimated useful lives. These useful lives are
periodically reassessed to determine whether they continue to be appropriate. The actual useful lives of fixed assets may be
differentiated by factors such as maintenance costs. (d) Provision for slow-moving and obsolete inventories
The Management of the Group reviews the adequacy of the provision for slow-moving and obsolete inventories on a periodic
basis. The provision recognised for three to four years non-moving inventory, other than those held by the Group according to
project agreements, is calculated based on inventory ageing and past experience. For non-moving inventories for more than
four years, a relevant provision is established equal to 100% of the inventories' acquisition cost. (e) Impairment of receivables
The Management of the Company periodically evaluates the adequacy of receivables impairment provision considering the
Company’s normal credit terms and taking into account the data held by the Group's Legal Department, which arise from
processing historical data and recent developments of the cases handled by the Legal Department.

Financial Statements for the year ended 31st
December 2016
(from 1st
January to 31st
December 2016)
(amounts in '000 EUR, unless otherwise stated)
32
(f) Employee benefits
The present value of employee benefits obligations depend on a number of factors that are determined on an actuarial basis
using a number of assumptions. The assumptions used in determining the net cost of employee benefits include the discount
rate, future salary increases and inflation. Any changes in these assumptions will impact the carrying amount of employee
benefits obligations.
The Group and the Company determine the suitable discount rate at the end of each period. This is defined as the interest that
should have been used in order to determine the present value of future cash flow expected to be needed in order to cover
the obligations of pension schemes. In order to determine the suitable discount rate, the interest of high quality company
bonds is used. The bonds will be converted into the currency that will be used to pay the obligation and whose expiry date is
near the relevant pension obligations.
The assumptions used are further analysed in note 20.
(g) Impairment of investments in subsidiaries and associates
Investments in subsidiaries and associates are subject to impairment testing when certain events or changes in the
circumstances suggest that their carrying value may not be recoverable. The impairment loss from investments is recognised
in the statement of comprehensive income. Impairment loss on investments is incurred when the acquisition cost of the
investment exceeds its carrying value.
(h) Impairment of investment property
The company registers its fixed assets in “Investments in real estate” based on the provisions of IAS 40 “Investments in real
property”. Taking into consideration the conditions in the real estate market the company proceeds to the depreciation of the
value of the above mentioned investment when the current value is less than the acquisition value of the real property. For
this reason the company uses reports by certified property evaluators.
In case there is reason for depreciation, the expense is registered under “Other profits/ (losses)” in the Profit and Loss
Statement.
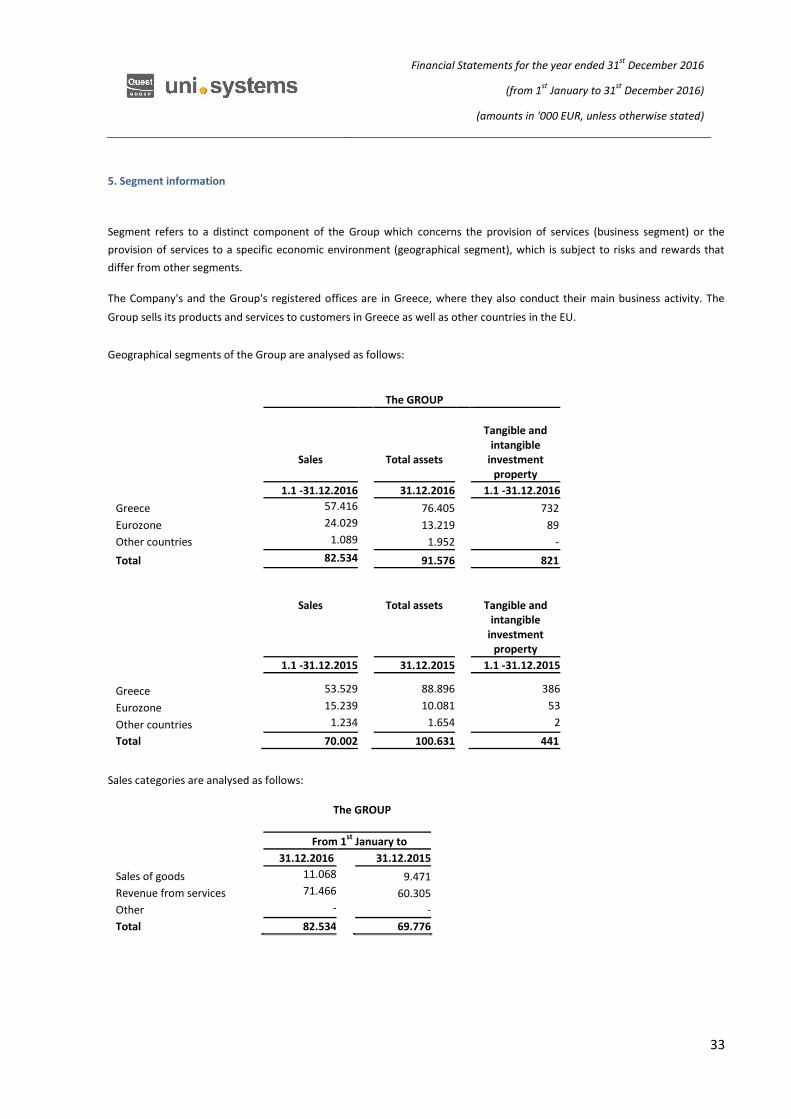
Financial Statements for the year ended 31st
December 2016
(from 1st
January to 31st
December 2016)
(amounts in '000 EUR, unless otherwise stated)
33
5. Segment information
Segment refers to a distinct component of the Group which concerns the provision of services (business segment) or the
provision of services to a specific economic environment (geographical segment), which is subject to risks and rewards that
differ from other segments.
The Company's and the Group's registered offices are in Greece, where they also conduct their main business activity. The
Group sells its products and services to customers in Greece as well as other countries in the EU.
Geographical segments of the Group are analysed as follows:
The GROUP
Total assets
Tangible and
intangible investment
property
Sales
1.1 -31.12.2016 31.12.2016 1.1 -31.12.2016
Greece 57.416 76.405 732
Eurozone 24.029 13.219 89
Other countries 1.089 1.952 -
Total 82.534 91.576 821
Sales
Total assets
Tangible and intangible
investment property
1.1 -31.12.2015 31.12.2015 1.1 -31.12.2015
Greece 53.529 88.896 386
Eurozone 15.239 10.081 53
Other countries 1.234 1.654 2
Total 70.002 100.631 441
Sales categories are analysed as follows:
The GROUP
From 1st
January to
Sales of goods
31.12.2016 31.12.2015
11.068 9.471
Revenue from services 71.466 60.305
Other - -
Total 82.534 69.776

Financial Statements for the year ended 31st
December 2016
(from 1st
January to 31st
December 2016)
(amounts in '000 EUR, unless otherwise stated)
34
6. Property, plant and equipment
The property, plant and equipment of the Group and the Company are analysed as follows:
The GROUP
Land Vehicles & Furniture PPE under
& Buildings machinery & fittings construction Total
Cost
1st January 2015 6.167 192 6.045 5.621 18.025
First Consolidation of subsidiary - - - - -
Additions 5 321 85 411
Absorption of subsidiary - - - - -
Disposals/write-offs - (18) (225) - (243)
Reclassifications (Note 17) (3.840) - - - (3.840)
31st December 2015 2.332 174 6.141 5.706 14.353
Accumulated depreciation
1st January 2015 (1.676) (163) (4.762) - (6.601)
First Consolidation of subsidiary - - - - -
Depreciation for the year (21) (5) (501) - (527)
Absorption of subsidiary - - - - -
Disposals/write-offs - 18 224 - 242
Reclassifications 1.597 - - - 1.597
31st December 2015 (100) (150) (5.039) - (5.289)
1st January 2016 2.332 174 6.141 5.706 14.353
Additions 115 577 - 692
Absorption of subsidiary - - - - -
Disposals/write-offs - (28) (210) - (238)
Reclassifications (Note 17) - - - - -
31st December 2016 2.447 146 6.508 5.706 14.807
Accumulated depreciation
1st January 2016 (100) (150) (5.039) - (5.289)
Depreciation for the year (28) (4) (484) - (516)
Absorption of subsidiary - - - - -
Disposals/write-offs - 21 206 - 227
Reclassifications - - - - -
31st December 2016 (128) (133) (5.317) - (5.578)
Net book value
at 31st December 2016
2.232 24 1.102 5.621 9.064
Net book value
at 31st December 2015 2.319 13 1.191 5.706 9.229

Financial Statements for the year ended 31st
December 2016
(from 1st
January to 31st
December 2016)
(amounts in '000 EUR, unless otherwise stated)
35
The COMPANY
Land
& Buildings
Vehicles &
machinery
Furniture &
fittings
PPE under
construction Total
Cost
1st January 2015 6.166 190 5.960 5.623 17.939
Additions 5 - 319 85 409
Absorption of subsidiary - - - - -
Disposals/write-offs - (18) (225) - (243)
Reclassifications (3.840) - - - (3.840)
31st December 2015 2.331 172 6.054 5.708 14.265
Accumulated depreciation
1st January 2015 (1.676) (161) (4.680) - (6.517)
Depreciation for the year (20) (5) (500) - (525)
Absorption of subsidiary - - - - -
Disposals/write-offs - 18 224 - 242
Reclassifications 1.596 - - - 1.596
31st December 2015 (100) (148) (4.956) - (5.204)
1st January 2016 2.331 172 6.054 5.708 14.265
Additions 115 - 577 - 692
Absorption of subsidiary - - - - -
Disposals/write-offs - (28) (210) - (238)
Reclassifications - - - - -
31st December 2016 2.446 144 6.421 5.708 14.719
Accumulated depreciation
1st January 2016 (100) (148) (4.956) - (5.204)
Depreciation for the year (28) (5) (483) - (515)
Absorption of subsidiary - - - - -
Disposals/write-offs - 21 207 - 228
Reclassifications - - - - -
31st December 2016 (128) (132) (5.232) - (5.491)
Net book value
at 31st December 2016
2.231 24 1.099 5.708 9.061
Net book value
at 31st December 2015 2.318 12 1.189 5.708 9.227
In FY2015, the sum of 3,840 thousand euro in acquisition cost and 1,596 thousand euro in accrued depreciations refers to the
Reclassification of plot of land and property in Menidi under “Available for sale assets” as they are going to be contributed to
the under establishment real estate investment company (R.E.I.C.). The nature of the pending transaction and the analysis of
the assets to be contributed is presented in detail in note 17. (Non-current assets available for sale and discontinued
operations).

Financial Statements for the year ended 31st
December 2016
(from 1st
January to 31st
December 2016)
(amounts in '000 EUR, unless otherwise stated)
36
The additions in PPE of the Group for FY2016 amounting to EUR 692 th. mainly refer to the purchase of new H/W equipment
for the Company, while the disposals/write-offs amounting to EUR 238 th. refer to the destruction and disposal of fully
depreciated and obsolete computers. To finance the investment associated with the construction of the building in Kallithea, at 1 Kosmeridi-Kanakidi Street, which
began in 2008, the Company issued a bond loan in 2012 amounting to EUR 2.100.000. At 31.12.2016 the investment
amounted to EUR 5.695.116. This amount, which was not covered by the bond loan, was financed by other short-term
borrowings.
THE Group
THE Company
Property, plant and equipment
Property, plant and equipment
The allocation of depreciation of tangible assets by function is
as follows
The allocation of depreciation of tangible assets by function
is as follows
Cost of sales 404
Cost of sales 404
Distribution costs 60
Distribution costs 60
Administrative expenses 52
Administrative expenses 51
516
515

Financial Statements for the year ended 31st
December 2016
(from 1st
January to 31st
December 2016)
(amounts in '000 EUR, unless otherwise stated)
37
7. Intangible assets
The GROUP
Industrial
Property Rights Software
Other Total
Cost
1st
January 2015 1.139 2.202
2.493 5.834
Additions - 29 - 29
Reclassifications - - - -
Impairment - (265) - (265)
31st
December 2015 1.139 1.966 2.493 5.598
Accumulated depreciation
1st
January 2015 (1.139) (1.771)
(512) (3.422)
Depreciation for the year - (260) (460) (720)
Impairment - 264 - 264
31st
December 2015 (1.139) (1.767) (972) (3.878)
1st
January 2016 1.139 1.966
2.493 5.598
Additions - 129 - 129
Reclassifications - - - -
Impairment - (84) - (84)
31st
December 2016 1.139 2.011 2.493 5.643
Accumulated depreciation
1st
January 2016 (1.139) (1.767) (972) (3.878)
Depreciation for the year - (180) (460) (640)
Impairment - 14 - 14
31st
December 2016 (1.139) (1.933) (1.432) (4.504)
Net book value
at 31st
December 2015 - 199
1.521 1.720
Net book value
at 31st
December 2016 - 78
1.061 1.139

Financial Statements for the year ended 31st
December 2016
(from 1st
January to 31st
December 2016)
(amounts in '000 EUR, unless otherwise stated)
38
The COMPANY
Industrial
Property Rights Software
Other Total
Cost
1st
January 2015 1.139 2.201
2.493 5.833
Additions - 29 - 29
Reclassifications - - - -
Impairment - (265) - (265)
31st
December 2015 1.139 1.965 2.493 5.597
Accumulated depreciation
1st
January 2015 (1.139) (1.769) (513) (3.421)
Depreciation for the year - (260) (460)
(720)
Absorption of subsidiary - - - -
Impairment - 264 - 264
31st
December 2015 (1.139) (1.765)
(973) (3.877)
1st
January 2016 1.139 1.965
2.493 5.597
Additions - 129 - 129
Reclassifications - - - -
Impairment - (84) - (84)
31st
December 2016 1.139 2.010 2.493 5.642
Accumulated depreciation
1st
January 2016 (1.139) (1.765) (973) (3.877)
Depreciation for the year - (180) (460) (640)
Absorption of subsidiary - - - -
Impairment - 14 - 14
31st
December 2016 (1.139) (1.931)
(1.433) (4.503)
Net book value
at 31st
December 2015 - 200
1.520 1.720
Net book value
at 31st
December 2016 - 79
1.060 1.139

Financial Statements for the year ended 31st
December 2016
(from 1st
January to 31st
December 2016)
(amounts in '000 EUR, unless otherwise stated)
39
The reductions in the intangible assets of the Group in FY2016 amounting to EUR 14K is mainly due to the
write-off of the impaired and amotized S/W of the company at 31.12.2016.
The GROUP
The COMPANY
Intangible assets
Intangible assets
The allocation of depreciation of tangible assets by
function is as follows
The allocation of depreciation of tangible assets by
function is as follows
Cost of sales 498
Cost of sales 498
Distribution costs 77
Distribution costs 77
Administrative expenses 51
Administrative expenses 51
626
626
8. Investment property
The movement in the investment property of the Group and the Company is as follows:
The GROUP The COMPANY
Amounts in ,000 EUR 31.12.2016 31.12.2015 31.12.2016 31.12.2015
Cost
Opening balance 6.144 6.144 6.144 6.144
At year end 6.144 6.144 6.144 6.144
Accumulated depreciation
Balance at the beginning of
the year (1.289) (1.279) (1.289) (1.279)
Depreciation for the period (10) (10) (10) (10)
Impairment of investment (2.000) - (2.000) -
Balance at the end of year (3.299) (1.289) (3.299) (1.289)
Net book value at the end of
year 2.845 4.855 2.845 4.855
The above mentioned amount of EUR 2.845 th. refers to the fair value of the property in Athinon Avenue. The
Group has adopted the revised valuation reports and due to the new conditions in the real estate market,
decided on the partial impairment (adjustment to fair value) of the investment value, through profit & loss,
amounting to 2.000 thousand euros.The Group bought the above plot in fiscal year 2006 with a view to ercting a
building for the relocation of its offices.In fiscal year 2007 it was decided that no building will be built in the
aforementioned plot.Therefore, given that the plot is owned for long term increase in value rather than short
term sale and based on the provisions of IAS 40 “Investments in Property”, it was recorded under investments in
property.The depreciation of 10 thousand euros involve small-scale installations associated with the above plot.
According to IFRS 13 (Fair Value Measurement), the Company's Management believes that the value of
investment property approximates the fair valur and did not reveal additional important indications for possible
impairment in this Financial Report.
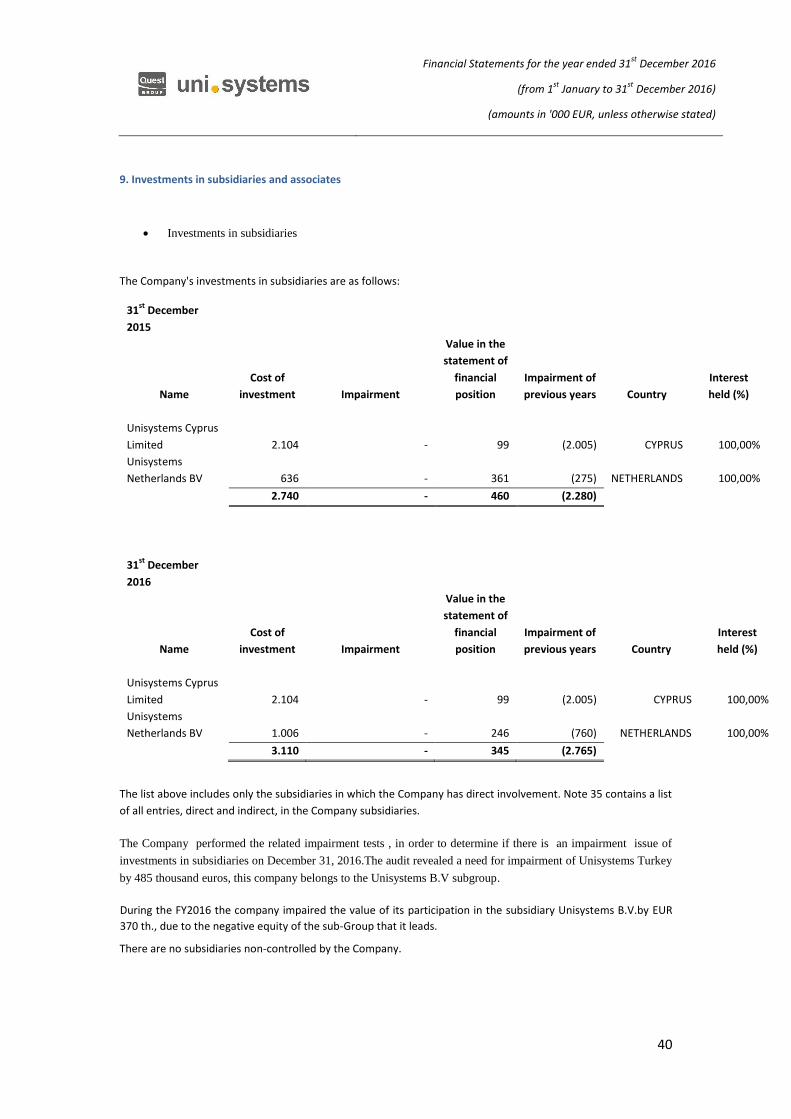
Financial Statements for the year ended 31st
December 2016
(from 1st
January to 31st
December 2016)
(amounts in '000 EUR, unless otherwise stated)
40
9. Investments in subsidiaries and associates
Investments in subsidiaries
The Company's investments in subsidiaries are as follows:
31st
December
2015
Name
Cost of
investment Impairment
Value in the
statement of
financial
position
Impairment of
previous years Country
Interest
held (%)
Unisystems Cyprus
Limited 2.104 - 99 (2.005) CYPRUS 100,00%
Unisystems
Netherlands BV 636 - 361 (275) NETHERLANDS 100,00%
2.740 - 460 (2.280)
31st
December
2016
Name
Cost of
investment Impairment
Value in the
statement of
financial
position
Impairment of
previous years Country
Interest
held (%)
Unisystems Cyprus
Limited 2.104 - 99 (2.005) CYPRUS 100,00%
Unisystems
Netherlands BV 1.006 - 246 (760) NETHERLANDS 100,00%
3.110 - 345 (2.765)
The list above includes only the subsidiaries in which the Company has direct involvement. Note 35 contains a list
of all entries, direct and indirect, in the Company subsidiaries.
The Company performed the related impairment tests , in order to determine if there is an impairment issue of
investments in subsidiaries on December 31, 2016.The audit revealed a need for impairment of Unisystems Turkey
by 485 thousand euros, this company belongs to the Unisystems B.V subgroup.
During the FY2016 the company impaired the value of its participation in the subsidiary Unisystems B.V.by EUR
370 th., due to the negative equity of the sub-Group that it leads.
There are no subsidiaries non-controlled by the Company.

Financial Statements for the year ended 31st
December 2016
(from 1st
January to 31st
December 2016)
(amounts in '000 EUR, unless otherwise stated)
41
Investments in associates
The GROUP The COMPANY
31.12.2016 31.12.2015 31.12.2016 31.12.2015
Balance at the beginning of the year
- - 460 460
Additions - - 370 -
Disposals/write-offs - - - -
Impairment - - (485) -
Balance at the end of year - - 345 460
The Company holds the 40% of the share capital of ParkMobile Hellas S.A which was founded in 2006. The
participation cost on December 31, 2016 amounted to € 1.284.000,00 and it is fully impaired. The information
relating the associate company is as follows:
31st
December 2016 Interest
Name Assets Liabilities Sales Loss held (%) Country
PARKMOBILE HELLAS SA 419 739 - 11 40% Greece
419 739 - 11
31st
December 2015 Interest
Name Assets Liabilities Sales Loss held (%) Country
PARKMOBILE HELLAS SA 406 736 - (7) 40% Greece
406 736 - (7)
10. Receivables from finance lease
GROUP & COMPANY
31.12.2016 31.12.2015
Gross receivables from finance leases
No later than 1 year - 248
From 1 to 5 years - -
Over 5 years - -
Total - 248
Less: Unearned finance income - 19
Net investments from leases - 229

Financial Statements for the year ended 31st
December 2016
(from 1st
January to 31st
December 2016)
(amounts in '000 EUR, unless otherwise stated)
42
11. Available-for-sale financial assets
The GROUP The COMPANY
Amounts in '000 EUR
31.12.2016 31.12.2015 31.12.2016 31.12.2015
Balance at 1st
January 142 2.642 142 2.642
Additions 4.539 2.000 4.539 2.000
Disposals/write-offs - (4.499) - (4.499)
Impairment (142) (1) (142) (1)
Balance at the end of the year 4.539 142 4.539 142
Less: Available for sale financial assets (non-current assets) -
142
-
142
Financial assets at fair value (Current Assets) 4.539
-
4.539
-
The GROUP The COMPANY
Non-listed securities:
31.12.2016 31.12.2015 31.12.2016 31.12.2015
- Shares in Greece 4.539 142 4.539 142
Bonds
- Low risk bonds of E,U, countries - - - -
4.539 142 4.539 142
The GROUP The COMPANY
Available-for-sale financial assets are
31.12.2015 31/12/2014 31.12.2015 31/12/2014
analysed in the following currencies:
Euro
4.539 142 4.539 142

Financial Statements for the year ended 31st
December 2016
(from 1st
January to 31st
December 2016)
(amounts in '000 EUR, unless otherwise stated)
43
Available for sale financial assets include low risk unlisted shares and mutual funds of European Union countries.
Investments in unllisted shares is shown at cost less impairment. Available-for-sale financial assets mainly consist
of listed securities.
The fair value of non-listed securities is determined by using valuation techniques and assumptions based on
observable market data as of the reporting date. The fair value of listed securities is determined based on the
current bid prices as of the reporting date.
The value of available-for-sale financial assets of the Company refers to investments in which the Company holds
no more than 40% of the share capital. Nevertheless, the Company is not in position to exercise significant
influence on them, as they are controlled by other shareholders either individually or collectively according to
relevant agreements. For this reason, the Company classifies ACROPOLIS TECHNOLOGICAL PARK S.A., PRO BANK
(under liquidation), ITEC SA and CREATIVE MARKETING SA in available-for-sale financial assets.
In the closing financial year the amount of € 4,539 thousand in the sum of additions refers to the participation of
the company in the BriQ Properties R. E. I. C. company.
BRIQ R.E.I.C was established according to the Notarial Act of Recommendation under No. 33100 / 07.10.2016, as
amended by the Notarial Act No. 33141 / 21.10.2016 (Announcement of the companies Registry GEMI under No.
56308 / 21.10.2016).
For the Company, the above contribution at the establishment of "BriQ Properties REIC" consisted of: a) a
contribution in kind, i.e. the land and a warehouse building of a total surface area of 3,989 sq. m. on Loutrou 65
str., in Menidi Attica, worth € 1,649 thousand and b) a cash contribution amounted to € 2,880 thousand.
Together with the valuation of this participation at 30.11.2016 and the increase of the value by € 10 thousands
which has been registered in Unisystems' books; the value is now amounted to € 4.539 thousands.
Then, the resolution of the General Assembly of the Company shareholders was taken on December 23rd 2016
according to which a reduction in the share capital of the Company was decided (General Commercial Registry
(GEMI) Announcement 741113/5.01.2017) with the return in kind of the shares of BriQ Properties R. E. I. C. that it
possessed (1,944,285 shares) valued at 4,539 thousand and additional cash (€ 1,130,872).
The amount of € 142 thousand in the provision for the previous year, relates to the partial write-off through P&L for the Company and the Group of the value of the Company's participation in the "Technological Park of
Acropolis" and "Technological Park of Epirus".

Financial Statements for the year ended 31st
December 2016
(from 1st
January to 31st
December 2016)
(amounts in '000 EUR, unless otherwise stated)
44
12. Financial assets at fair value through profit or loss
The Financial assets at fair value are as follows :
The GROUP The COMPANY
31.12.2016 31.12.2015 31.12.2016 31.12.2015
Balance at the beginning of the year - - - -
Additions - 1.660 - 1.660
Disposals/write-offs - (1.844) - (1.844)
Adjustments to fair value - 184 - 184
Balance at the end of the period - - - -
In FY2016 there are no financial assets at fair value.
13. Deferred income tax Deferred tax assets and liabilities are offset when there is an applicable legal right to offset the current tax assets
against the current tax liabilities and when the deferred income taxes concern the same tax authority. The
amounts offset are as follows:
The GROUP The COMPANY
Deferred tax liabilities: To be settled after more than 12 months
31.12.2016 31.12.2015 31.12.2016 31.12.2015
4.939 4.345 4.939 4.345
Deferred tax liabilities:
Payable after 12 months (667) (667) (667) (667)
4.272 3.678 4.272 3.678
The gross movement on the deferred income tax account is as follows:
The GROUP The COMPANY
31.12.2016 31.12.2015 31.12.2016 31.12.2015
Opening balance 3.678 1.224 3.678 1.224
Recognised in the
income statement (Note 27) 571 2.433 571 2.433
Acquisition of subsidiary - - - - plus Taxes directly to movements in net position 23 21 23 21
Balance at the end of the year 4.272 3.678 4.272 3.678

Financial Statements for the year ended 31st
December 2016
(from 1st
January to 31st
December 2016)
(amounts in '000 EUR, unless otherwise stated)
45
The GROUP
Deferred tax liabilities:
Accelerated tax
depreciation
Revenue recognition Other Total
1st
January 2015 - 101 514 615
Charged/(credited) in the income statement -
- 52 52
31st
December 2015 - 101 566 667
1st
January 2016 - 101 566 667
Charged/(credited) in the
-
-
income statement - -
31st
December 2016 - 101 566 667
Deferred tax assets:
Provision for
receivables
Write-off of
intangible
assets Tax losses
Revenue
recognition Other Total
1st
January 2015 549 (230) - - 1.520 1.839
Charged/(credited) in Equity - - - - 21 21
Charged/(credited) in the
income statement 109 87 - 3.087 (798)
2.485
31st
December 2015 658 (143) - 3.087 743 4.345
1st
January 2016 658 (143) - 3.087 743
4.345
Charged/(credited) in Equity - - - - 23 23
Charged/(credited) in the
income statement (38) 68 - 4.889 (4.348) 571
31st
December 2016 620 (75) - 7.976 (3.582) 4.939

Financial Statements for the year ended 31st
December 2016
(from 1st
January to 31st
December 2016)
(amounts in '000 EUR, unless otherwise stated)
46
The COMPANY
Deferred tax liabilities:
Accelerated tax
depreciation
Revenue
recognition Other Total
1st
January 2015 - 101 514 615
Charged/(credited) in the income
statement - - 52 52
Acquisition of subsidiary - - - -
31st
December 2015 - 101 566 667
1st
January 2016 - 101 566 667
Charged/(credited) in the income
statement - - - -
Acquisition of subsidiary - - - -
31st
December 2016 - 101 566 667
Deferred tax assets:
Provision for receivables
Write-off of
intangible
assets Tax losses
Revenue
recognition Other Total
1st
January 2015 432 (229) - - 1.636 1.839
Charged/(credited) in Equity - - - - 21 21
Charged/(credited) in the income
statement 109 87 - 3.087 (798) 2.485
31st
December 2015 541 (142) - 3.087 859 4.345
1st
January 2016 541 (142) - 3.087 859 4.345
Charged/(credited) in Equity - - - - 23 23
Charged/(credited) in the income
statement (38) 68 - 4.889
(4.348) 571
31st
December 2015 503 (74) - 7.976 (3.466) 4.939

Financial Statements for the year ended 31st
December 2016
(from 1st
January to 31st
December 2016)
(amounts in '000 EUR, unless otherwise stated)
47
The accumulated provision for future tax liabilities of the Company and the Group regarding tax unaudited years
as of 31 December 2016 and 31 December 2015 were as follows:
The GROUP The COMPANY
31.12.2016 31.12.2015 31.12.2016 31.12.2015
Provision for unaudited tax years 383 383 383 383
For the calculation of the deferred income tax, the Group and the Company used the tax rate effective in 2016 (29%).
The Group does not recognize a deferred tax asset on tax losses.
14. Inventories
The GROUP The COMPANY
Amounts in '000 EUR
31.12.2016 31.12.2015 31.12.2016 31.12.2015
Merchandise 4.552 5.653 4.552 5.653
Other 313 361 313 361
Total 4.865 6.014 4.865 6.014
Less: Provision for slow-moving
inventory:
Merchandise 2.888 2.380 2.888 2.380
Net realisable value
2.888 2.380 2.888 2.380
1.977 3.634 1.977 3.634
The GROUP The COMPANY
Amounts in '000 EUR
31.12.2016 31.12.2015 31.12.2016 31.12.2015
Provision analysis
At beginning of year 2.380 2.579 2.380 2.579
Provision formed during the year 671 226 671 226
Amount of provision used during the year (163) (425) (163) (425)
At year end 2.888 2.380 2.888 2.380
The amount of provision EUR 163 th. and 425 th. was used as the Company in FY2016 and FY2015,respectively,
destroyed inventories of equal amount.

Financial Statements for the year ended 31st
December 2016
(from 1st
January to 31st
December 2016)
(amounts in '000 EUR, unless otherwise stated)
48
15. Trade and other receivables
The GROUP
The COMPANY
Amounts in '000 EUR 31.12.2016 31.12. 2015 31.12.2016 31.12.2015
Trade receivables 14.678 16.228 13.990 15.717
Less: Provision for impairment of receivables (2.469) (2.599) (2.469) (2.599)
Trade Receivables – Net 12.209 13.629 11.521 13.118
Prepayments 30 21 30 21
Deferred expenses 29.053 29.020 29.016 28.996
Accrued expenses 8.021 6.334 7.999 6.334
Receivables from software development
contracts - - - -
Other receivables 2.664 1.902 2.659 1.897
Guarantees - - - -
Receivables from related parties (Note 30) 1.656 175 2.022 401
Total 53.633 51.081 53.247 50.767
Non-current assets 1.160 239 1.160 239
Current assets 52.473 50.842 52.087 50.528
Total 53.633 51.081 53.247 50.767
The ageing analysis of the Group's and the Company's receivables from third parties as well as related parties is
as follows:
The GROUP The COMPANY
Amounts in '000 EUR 31.12.2016 31.12.2015 31.12.2016 31.12.2015
Not past due and not impaired 9.951 11.504 9.635 11.222
Impaired trade receivables: 2.469 2.599 2.469 2.599
Provision made for the following
amount: (2.469) (2.599) (2.469) (2.599)
Total - - - -

Financial Statements for the year ended 31st
December 2016
(from 1st
January to 31st
December 2016)
(amounts in '000 EUR, unless otherwise stated)
49
Past due and not impaired trade receivables:
Between 3 and 6 months 211 751 211 751
Between 6 and 12 months 334 946 334 946
More than 12 months 2.394 600 2.388 600
Total 2.939 2.297 2.933 2.297
12.890 13.804 12.568 13.519
The movement in the provision for impairment of receivables is as follows:
The GROUP The COMPANY
31.12.2016 31.12.2015 31.12.2016 31.12.2015
Balance at the beginning of the year 2.599 2.676 2.599 2.676
Provision for impairment of receivables 21 54 21 54
Write-off of receivables - - - -
Unused provisions (151) (131) (151) (131)
Balance at the end of year 2.469 2.599 2.469 2.599
The provision for bad debts for the year was recorded in the cost of sales. Trade and other receivables are denominated in the following currencies:
The GROUP The COMPANY
31.12.2016 31.12.2015 31.12.2016 31.12.2015
Euro (€) 52.856 50.507 53.222 50.733
USD ($) 25 34 25 34
Other (RON, LEV,TL) 752 540 - -
Total 53.633 51.081 53.247 50.767
16. Cash and cash equivalents
The GROUP The COMPANY
Amounts in '000 EUR 31.12.2016 31.12.2015 31.12.2016 31.12.2015
Cash in hand 50 114 35 52
Short-term bank deposits 11.706 21.480 11.127 21.231
Total 11.756 21.594 11.162 21.283
Short-term bank borrowings comprise sight and time deposits in Greece and abroad. Effective interest rates are
determined by floating interest rates and are negotiated as appropriate.

Financial Statements for the year ended 31st
December 2016
(from 1st
January to 31st
December 2016)
(amounts in '000 EUR, unless otherwise stated)
50
Cash and cash equivalents are denominated in the following currencies:
The GROUP The COMPANY
Amounts in '000 EUR 31.12.2016 31.12.2015 31.12.2016 31.12.2015
Euro (€) 11.143 21.216 11.087 21.157
USD ($) 152 126 75 126
Other (RON, LEV,TL) 461 252 - -
Total 11.756 21.594 11.162 21.283
17 Non-current assets held for sale and discontinued operations
The Company and the mother company “Quest Holdings S.A.” founded the company with the trade name “BriQ
Properties Real Estate Investment Company” and the distinctive title “BriQ Properties R. E. I. C.” under the
notarial deed number 33100/07.10.2016 as it was amended with the number 33141/21.10.2016 notarial deed
(General Commercial Registry (GEMI) Announcement number 56308/21.10.2016), having received the relevant
operation license by the Greek Exchange Commission, in accordance with the provisions of Law 2778/99 and
paragraph 1 of Article 5 of Law 4209/2013, the share capital of which amounted to 27,777 thousand comprises
11,921,531 common shares of nominal value € 2.33 each. For the company, the above contribution to the
founding of “BriQ Properties R.E.I.C.” consists of: a) contribution in kind, that is the piece of land and the
warehouse building covering a total area of 3,989 square meters on 65, Loutrou street in Menidi, Attica valued at
1,649 thousand, and b) contribution in cash of the amount of € 2,880 thousand.
Then, the resolution of the General Assembly of the Company shareholders was taken on December 23rd
2016
according to which a reduction in the share capital of the Company was decided (General Commercial Registry
(GEMI) Announcement 741113/5.01.2017) with the return in kind of the shares of BriQ Properties R. E. I. C. that it
possessed (1,944,285 shares) valued at 4,539 thousand and additional cash (€ 1,130,872).
In the current financial year, the sum appears in the current assets (see note 11) due to the pending return of
share capital to the mother company Quest Holdings.
The Value in use as well as the fair value of the under contribution assets, according to the relevant valuation
reports made by the competent valuators, considering them as a property group are shown below :
Non-current assets held for sale
The GROUP The COMPANY
Amounts in '000 EUR 31.12.2016 31.12.2015 31.12.2016 31.12.2015
Tangible Assets 1.649 2.244 1.649 2.244
Intangible Assets - - - -
Return capital to QH (1.649) - (1.649) -
Impairment - (595) - (595)
Total - 1.649 - 1.649
The establishment of the REIC and the contribution of these assets was completed on 21/10/2016.

Financial Statements for the year ended 31st
December 2016
(from 1st
January to 31st
December 2016)
(amounts in '000 EUR, unless otherwise stated)
51
18. Equity
Share capital and share premium
Share capital is analysed as follows:
Number of
shares
Ordinary
shares
Share
premium
Treasury
shares Total
1st
January 2015 21.000 10.080 9.329 - 19.409
Share capital reduction - - - - -
Share capital increase - - - - -
31st
December 2015 21.000 10.080 9.329 - 19.409
1st
January 2016 21.000 10.080 9.329 - 19.409
Share capital reduction - - - - -
Share capital increase - - - - -
31st
December 2016 21.000 10.080 9.329 - 19.409
The share capital of the Company on 31st December 2015 and on 31st December 2016, consists of 21.000.000
ordinary shares and their nominal value is EUR 0,48 each.
19. Other reserves and retained earnings
Other reserves and retained earnings are analysed as follows:
The GROUP
Statutory
reserve
Other
reserves
Total
Balance at 1st
January 2015 3.645 (51) 3.594
Changes during the year -
-
-
Absorption/(merge) of company -
(32)
(32)
Balance at 31st
December 2015 3.645 (83) 3.562
Changes during the year -
(550)
(550)
Balance at 31st
December 2016 3.645 (633) 3.012

Financial Statements for the year ended 31st
December 2016
(from 1st
January to 31st
December 2016)
(amounts in '000 EUR, unless otherwise stated)
52
The COMPANY
Statutory
reserve
Other
reserves
Total
Balance at 1st
January 2015 3.645 - 3.645
Changes during the year - - -
Absorption/(merge) of company - - -
Balance at 31st
December 2015 3.645 - 3.645
Changes during the year - -
Balance at 31st
December 2016 3.645 - 3.645
Statutory Reserve
The statutory reserve is formed according to the provisions of c. L. 2190/1920, by retaining 5% of net profit after tax and before the distribution of dividends. The Company intends to establish a statutory reserve until such reserve equals 1/3 of the paid share capital and this reserve may not be used for any other purpose but to cover losses. In FY2016 and FY2015 a statutory reserve was not formed as the already existing covers 1/3 of the paid share capital.
Untaxed Reserves
Retained earnings of the Group and the Company consist of tax free reserves, reserves from development laws
and untaxable income subject to special tax treatment. If they are distributed they will be taxed with the tax
rate effective in the reporting period. The Group does not intend to distribute or capitalize these specific
reserves, thus it has not prepared an assessment of the amount of income tax that would be charged in that
case.
20. Retirement benefit obligations
According to the applicable legislation, employees are entitled to compensation in case of redundancy or
retirement, the amount of which depends on the salary, the years of service and the reason for the termination
of employment.
The GROUP
The COMPANY
31.12.2016 31.12.2015 31.12.2016 31.12.2015
Balance sheet obligations for:
Retirement benefits 3.017 2.820 3.017 2.820
Total 3.017 2.820 3.017 2.820
The GROUP The COMPANY
From 1st
January to From 1st
January to
31.12.2016 31.12.2015 31.12.2016 31.12.2015

Financial Statements for the year ended 31st
December 2016
(from 1st
January to 31st
December 2016)
(amounts in '000 EUR, unless otherwise stated)
53
Charged/(credited) to the
income statement:
Retirement benefits 117 300 117 300
Total 117 300 117 300
The GROUP
The COMPANY
31.12.2016 31.12.2015 31.12.2016 31.12.2015
Charged/(credited) to other
income statement:
Retirement benefits 79 29 79 29
Total 79 29 79 29
The charge to the income statement is as follows:
Cost of sales 55
Distribution costs 42
Administrative expenses 20
117
The amounts recognised in the Balance Sheet are as follows:
The GROUP The COMPANY
Amounts in '000 EUR 31.12.2016 31.12.2015 31.12.2016 31.12.2015
Present value of unfunded obligations
3.017
2.820
3.017
2.820
Liability on the balance sheet 3.017 2.820 3.017 2.820
The amounts recognized in the Income Statement are as follows:
The GROUP The COMPANY
From 1st
January to From 1st
January to
31.12.2016 31.12.2015 31.12.2016 31.12.2015
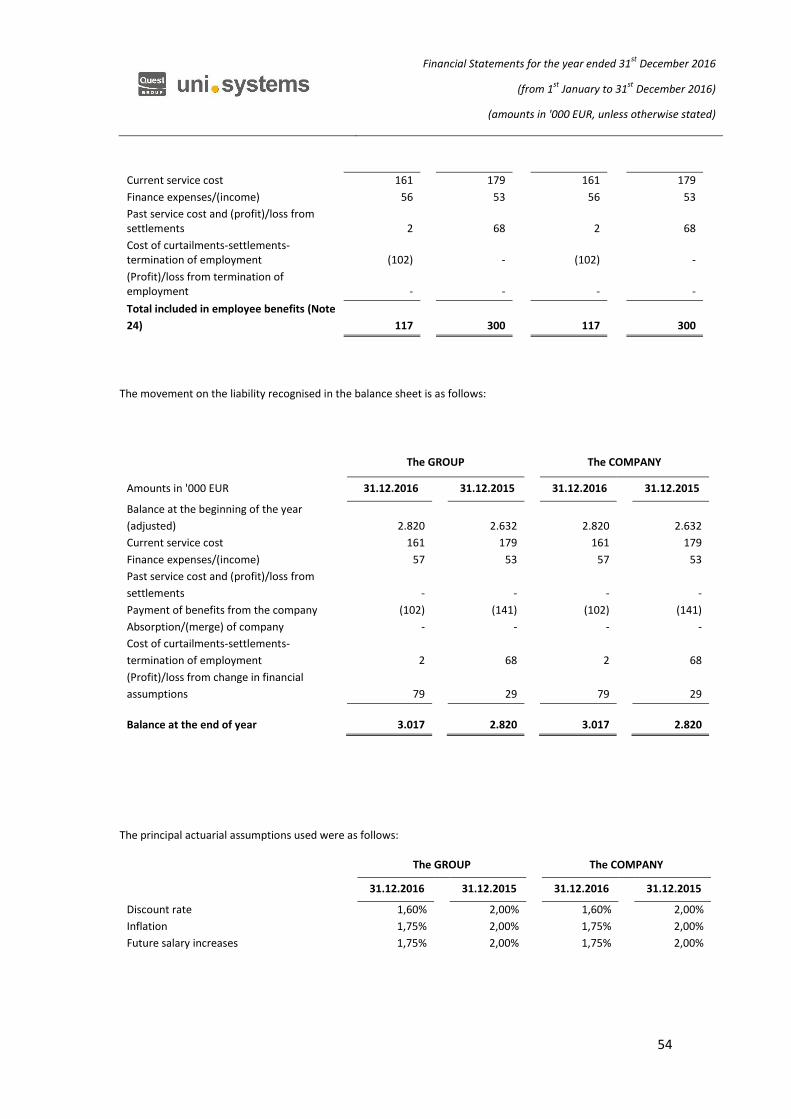
Financial Statements for the year ended 31st
December 2016
(from 1st
January to 31st
December 2016)
(amounts in '000 EUR, unless otherwise stated)
54
Current service cost 161 179 161 179
Finance expenses/(income) 56 53 56 53
Past service cost and (profit)/loss from settlements 2 68 2 68
Cost of curtailments-settlements- termination of employment (102) - (102) -
(Profit)/loss from termination of employment - - - -
Total included in employee benefits (Note
24) 117 300 117 300
The movement on the liability recognised in the balance sheet is as follows:
The GROUP The COMPANY
Amounts in '000 EUR 31.12.2016 31.12.2015 31.12.2016 31.12.2015
Balance at the beginning of the year
(adjusted) 2.820 2.632 2.820 2.632
Current service cost 161 179 161 179
Finance expenses/(income) 57 53 57 53
Past service cost and (profit)/loss from
settlements - - - -
Payment of benefits from the company (102) (141) (102) (141)
Absorption/(merge) of company - - - -
Cost of curtailments-settlements-
termination of employment 2 68 2 68
(Profit)/loss from change in financial
assumptions 79 29 79 29
Balance at the end of year 3.017 2.820 3.017 2.820
The principal actuarial assumptions used were as follows:
The GROUP The COMPANY
31.12.2016 31.12.2015 31.12.2016 31.12.2015
Discount rate 1,60% 2,00% 1,60% 2,00%
Inflation 1,75% 2,00% 1,75% 2,00%
Future salary increases 1,75% 2,00% 1,75% 2,00%

Financial Statements for the year ended 31st
December 2016
(from 1st
January to 31st
December 2016)
(amounts in '000 EUR, unless otherwise stated)
55
21.Trade and other payables
The GROUP The COMPANY
31.12.2016 31.12.2015 31.12.2016 31.12.2015
Trade payables 5.341 7.504 5.038 7.490
Amounts payable to related parties (Note
30) 561 63 560 63
Accrued expenses 4.068 3.495 4.066 3.492
Payables from software development
contracts 34.816 16.643 34.766 16.584
Social insurance and other taxes - charges 2.314 2.776 2.236 2.697
Other liabilities 1.592 1.859 1.591 1.846
Total 48.692 32.340 48.257 32.172
Payables are analysed as follows:
31.12.2015 31.12.2014 31.12.2015 31.12.2014
Non-current 52 50 52 50
Non-current 48.640 32.290 48.205 32.122
Total 48.692 32.340 48.257 32.172
The credit provided to the Group is determined by the payment terms specified in the event in any contract with
a supplier.
22. Borrowings
Borrowings are analysed as follows:
The GROUP The COMPANY
Amounts in '000 EUR 31.12.2016 31.12.2015 31.12.2016 31.12.2015
Long-term borrowings
Bond loan - 525 - 525
Total long-term borrowings - 525 - 525
Short-term borrowings
Bank borrowings - 21.000 - 21.000
Bond loan 788 525 788 525
Total short-term borrowings 788 21.525 788 21.525

Financial Statements for the year ended 31st
December 2016
(from 1st
January to 31st
December 2016)
(amounts in '000 EUR, unless otherwise stated)
56
Total borrowings 788 22.050 788 22.050
Total cash 11.756 21.594 11.162 21.283
Net debt (10.968) 456 (10.374) 767
The maturities of borrowings are as follows:
6 months or less 6-12 months 1-5 years Total
31.12.2016
Total borrowings 525 263 - 788
525 263 - 788
31.12.2015
Total borrowings 21.262 263 525 22.050
21.262 263 525 22.050
The total debt of the Group amounts to EUR 0,8 mil. and the approved credit limits from banks amount to EUR
36 mil.
On July 1st
2011, the Company signed an agreement for a bond loan amounting to EUR 6 mil. with the National
Bank of Greece in order to construct a building in Kallithea (as described in note 6). On February 23rd
2012, the
first instalment of the loan was received amounting to EUR 2.1 mil., which will be repaid in 8 biannual
instalments, starting from 30th
June 2014 with the final payment on 31st
December 2017. The interest rate of
the loan is floating and consists of the spread, which equals 4.5% plus 3-month Euribor.
According to the above agreement, a Mortgage Series A must be raised equal to 130% of the amount of loan,
that is seven million eight hundred thousand euros (€7,800,000) on the amount of Investment.
On 17th
February 2012, a Mortgage was raised of EUR 2.8 mil. on the property of the Company at 114 Athinon
Avenue for the National Bank of Greece.
The notarial deed for the “elimination of mortgage” under number 10.132, dated 3/12/2015, of the notary
public, Urania Mikrou, has been signed by the National Bank of Greece. Following to this, the existing mortgages
on properties (real estate) owned by the Company amount to 7.8 million euros, pursuant to the certificate under
no. 1954/18.07.2013 issued by the Land Registration Authority of Kallithea Attika.
Financial instruments
GROUP
31.12.2016
Liabilities < 1 year 1-5 years
Borrowings 788 -
Trade and other payables 48.640 52
Total 49.428 52

Financial Statements for the year ended 31st
December 2016
(from 1st
January to 31st
December 2016)
(amounts in '000 EUR, unless otherwise stated)
57
31.12.2015
Liabilities < 1 year 1-5 years
Borrowings 21.263 787
Trade and other payables 32.290 50
Total 53.553 837
COMPANY
31.12.2016
Liabilities < 1 year 1-5 years
Borrowings 788 -
Trade and other payables 48.250 52
Total 49.038 52
31.12.2015
Liabilities < 1 year 1-5 years
Borrowings 21.263 787
Trade and other payables 32.122 50
Total 53.385 837
Borrowing amounts are analysed as follows:
31.12.2016 31.12.2015
Euro 788 22.050
US Dollar 0 0
JPY Γιεν Ιαπ. 0 0
HUF 0 0
CHF 0 0
SKK 0 0
Cyprus Pound 0 0
Romanian RON 0 0
Bulgarian LEV 0 0
Croatian KUNA 0 0
Other currency 0 0
Other 0 0
788 22.050

Financial Statements for the year ended 31st
December 2016
(from 1st
January to 31st
December 2016)
(amounts in '000 EUR, unless otherwise stated)
58
23. Expenses by category
The GROUP The COMPANY
From 1st
January to From 1st
January to
31.12.2016 31.12.2015
31.12.2016 31.12.2015
Employee benefits (Note 23) 22.992 21.811 22.673 21.467
Inventory cost recognised in cost of goods
sold 14.579 14.229 13.746 13.918
Impairment-Destroyed Inventories 672 226 672 226
Impairment for doubtful requirments (129) (77) (129) (77)
Operating lease payments 1.349 1.280 1.314 1.255
Depreciation of PPE 526 537 525 535
Amortisation of intangible assets 640 720 640 720
Advertising expenses 360 356 340 325
PPP repair and maintenance expenses 18 14 18 14
Third-party fees and expenses 35.750 27.408 35.701 27.359
Other 3.420 2.955 3.349 2.876
Total 80.177 69.459 78.849 68.618
The GROUP The COMPANY
From 1st
January to From 1st
January to
Split by function: 31.12.2016 31.12.2015
31.12.2016 31.12.2015
Cost of sales 69.517 58.386 68.683 58.076
Distribution costs 6.423 6.195 5.958 5.688
Administrative expenses 4.237 4.878 4.208 4.854
80.177 69.459 78.849 68.618
24. Employee benefits The GROUP The COMPANY
From 1st
January to From 1st
January to
Amounts in '000 EUR 31.12.2016 31.12.2015 31.12.2016 31.12.2015
Salaries and wages 17.585 16.759 17.310 16.450
Social security expenses 3.984 3.776 3.939 3.742 Cost of defined benefit plans (Note 20) 219 300 219 300
Payment of benefits (102) (141) (102) (141)
Other employee benefits 1.306 1.117 1.306 1.116
Total 22.992 21.811 22.672 21.467
The numbers of employees on 31st
December 2016 were as follows: Group 531, Company 524 (31st
December 2015: Group 465, Company 458).

Financial Statements for the year ended 31st
December 2016
(from 1st
January to 31st
December 2016)
(amounts in '000 EUR, unless otherwise stated)
59
25. Other income/(expenses) - Other gains/(losses)
Other gains/(losses) results are analysed as follows: The GROUP The COMPANY
From 1st
January to From 1st
January to
31.12.2016 31.12.2015 31.12.2016 31.12.2015
Dividend income - - - -
Grants covering costs 161 178 161 178
Grants covering costs - - - -
Loss from the disposal & write-off of PPE 33 - 32 -
Impairment loss on investments in related
parties and associates (Note 9) - - - -
Impairment of investment property
(Note 8) - - - -
Non- current Assets impairment Held for Sale(Note
17) (2.142) (596) (2.627) (596)
Sales profit of non-current Assets held for sale 9 184 9 184
Gains on foreign exchange forward transactions 109 1.384 109 1.384
Other (86) 17 (87) 12
Total 1.916 1.167 2.403 1.162
26. Finance income/(expenses)
The financial results are analysed as follows:
The GROUP The COMPANY
From 1st
January to From 1st
January to
31.12.2016 31.12.2015 31.12.2016 31.12.2015
Interest expenses
- Bank loans (126) (33) (126) (33)
- Interest on customer advances (23) (112) (19) (109)
- Finance leasing (91) (72) (91) (72)
- Commissions paid for letters of
guarantee (153) (266) (153) (266)
- Foreign currency translation losses 10 9 - -
- Bank expenses & other charges - - - -
(383) (474) (389) (480)
Interest income from bank deposits 231 179 217 161
Foreign currency translation gains 88 - 88 -
319 179 305 161
(64) (295) (84) (319)

Financial Statements for the year ended 31st
December 2016
(from 1st
January to 31st
December 2016)
(amounts in '000 EUR, unless otherwise stated)
60
27. Income tax
The GROUP The COMPANY
From 1st
January to From 1st
January to
Amounts in '000 EUR 31.12.2016 31.12.2015 31.12.2016 31.12.2015
Current tax (2.595) (3.053) (2.595) (3.053)
Deferred income tax (note 13) 571 2.433 571 2.433
Total (2.024) (620) (2.024) (620)
The current income tax was calculated using the tax rate effective in FY2016, that is 29% (2015, 29%), for both the parent company and domestic subsidiaries. As regards the foreign subsidiaries of the Company, the local applicable tax rates were used for the calculation of their current income tax charge: Luxembourg 21%, Cyprus 12.50%, Bulgaria 10%, Romania 16%, Belgium 33,99%, Holland 25%, Turkey 20%.
Tax on profit before tax of the Company is different from the theoretical amount that would arise if we used the
applicable tax rate, as follows:
The GROUP The COMPANY
Από 1η Ιανουαρίου έως Από 1
η Ιανουαρίου έως
Amounts in '000 EUR 31.12.2016 31.12.2015 31.12.2016 31.12.2015
Profit before tax 377 1.189 103 1.294
Tax calculated at domestic tax
rates applicable to profits (116) (414) (96) (400)
Expenses not deductible for tax
purposes (1.598) (1.071) (1.598) (1.071)
Income not subject to tax 895 784 875 770
Tax losses for which no
deferred income tax asset was
recognised - - - -
Differences in tax rates - (180) - (180)
Use of previously unrecognized
losses (561) 331 (561) 331
Other taxes/other tax
adjustments (644) (70) (644) (70)
Total (2.024) (620) (2.024) (620)
The fiscal years for which the Company and the Subidiaries have not been audited and therefore their tax
liabilitites fot these fiscal years have not been finalized are presented in Note 35.

Financial Statements for the year ended 31st
December 2016
(from 1st
January to 31st
December 2016)
(amounts in '000 EUR, unless otherwise stated)
61
28. Cash flows from operating activities
The GROUP The COMPANY
From 1st
January to From 1st
January to
Amounts in '000 EUR Note 31.12.2016 31.12.2015 31.12.2016 31.12.2015
Profit for the year (1.647) 569 (1.921) 674
Adjustments for:
Income tax 24 2.024 620 2.024 620
Depreciation of PPE 6,8 526 537 525 535
Impairment of investment
property 8 2000 595 2.000 595
Amortisation of intangible assets 7 626 720 626 720
Loss/(Profit) on sale of PPE and
other investments 25 1 1 1 1
Interest income 26 (530) (601) (497) (588)
Interest expenses 26 420 571 407 557
Dividend income 25 133 (5) 618 (5)
Foreign exchange losses/(gains) (1) (3) - -
Loss/(Profit) of equity
transactions
-
(58) - -
Impairment of related parties 25 - - - -
3.552 2.946 3.783 3.109
Working capital adjustments
related to operating activities:
(Increase)/decrease in
inventories 1.148 (389) 1.148 (389)
(Increase)/decrease in
receivables (2.034) (15.096) 608 (15.328)
(Increase)/decrease in
receivables (21.059) (14.341) (23.967) (14.266)
Increase/(decrease) in provisions 34.970 21.125 34.970 21.130
Increase/(decrease) in provisions
benefit obligations 197 188 197 188
13.222 (8.513) 12.956 (8.665)
Cash flows from operating
activities: 16.774 (5.567) 16.739 (5.556)

Financial Statements for the year ended 31st
December 2016
(from 1st
January to 31st
December 2016)
(amounts in '000 EUR, unless otherwise stated)
62
29. Earnings per share
Basic and diluted
Basic and diluted earnings per share are calculated by dividing the profit/(loss) attributable to the shareholders of
the parent company by the weighted average number of ordinary shares in issue during the year excluding any
ordinary shares purchased by the Company.
Ordinary share that are issued within the scope of a business combination are included in the weighted average
number of ordinary shares beginning from the acquisition date. That is because the acquirer consolidates the
profits and losses of the acquiree in the income statement from that date onwards.
amounts in €
The GROUP The COMPANY
31.12.2016 31.12.2015
31.12.2016 31.12.2015
Profit after tax (1.646.961) 569.350 (1.920.982) 674.117
Profit attributable to
equity holders of the
parent company (1.646.961) 596.450 (1.920.982) 674.117
Weighted average number of ordinary shares in issue 21.000.000 21.000.000 21.000.000 21.000.000
Basic and diluted earnings/(losses) per share (€ per share) (0,0784) 0, 0271 (0,0914) 0,0321
30 Commitments
Capital commitments At the end of the reporting period there is no significant capital expenditure contracted for but not yet incurred.
Finance lease commitments The Company has not signed any finance lease agreements.
Operating lease commitments The future aggregate minimum lease payments according to the signed operating lease agreements are as follows:
The GROUP The COMPANY
Amounts in '000 EUR 31.12.2016 31.12.2015 31.12.2016 31.12.2015
Up to 1 year 1.029 1.237 1.029 1.237
From 1 to 5 years 4.127 4.158 4.127 4.158
Over 5 years 5.368 - 5.368 -
10.524 5.395 10.524 5.395

Financial Statements for the year ended 31st
December 2016
(from 1st
January to 31st
December 2016)
(amounts in '000 EUR, unless otherwise stated)
63
31. Contingent liabilities and assets
The Group and the Company have contingent liabilities and assets associated with banks and other guarantees
and other matters arising in the ordinary course of business from which no additional charges are expected to
arise.
Contingent liabilities are analysed as follows:
The GROUP The COMPANY
31.12.2016 31.12.2015 31.12.2016 31.12.2015
Guarantees for advances received 1.298 2.395 1.298 2.395
Guarantees for good performance 4.916 6.654 4.916 6.654
Guarantees for participation in
tenders 1.732 2.100 1.732 2.100
Mortgages on land 7.800 7.800 7.800 7.800
Guarantees to banks for associates - - - -
15.746 18.949 15.746 18.949
Contingent assets are analysed as follows:
The GROUP The COMPANY
31.12.2016 31.12.2015 31.12.2016 31.12.2015
Guarantees for securing trade
receivables 50 50 50 50
Third party guarantees to suppliers - - - -
Third party pledges (cheques) 0 0 0 0
50 50 50 50
The tax obligations of the Company and the Group are not final as there are still unaudited tax years (Note 35). In addition, there are outstanding legal cases for Group companies from which according to the Management no further significant liabilities will arise.

Financial Statements for the year ended 31st
December 2016
(from 1st
January to 31st
December 2016)
(amounts in '000 EUR, unless otherwise stated)
64
32. Encumbrances
There are no guarantees to banks for subsidiaries and associates of the Group, however in case a need for a loan
arises this will be guaranteed by the Company (Note 31). There are no further mortgages and underwritings on
land and buildings of the Company and the Group other than the one presented in note 22 and 31.
33. Transactions with related parties
Quest Holdings SA, based in Kallithea in Athens, is the parent company of UniSystems Information Technology
Systems SA by 100%.
The consolidated financial statements of UniSystems Information Technology Systems SA are fully consolidated in
the consolidated financial statements of Quest Holdings SA.
For information on the subsidiaries of UniSystems Information Technology Systems SA refer to Note 35.
Transactions with related parties are as follows:
The GROUP The COMPANY
From 1st
January to From 1st
January to
31.12.2016 31.12.2015 31.12.2016 31.12.2015
i) Sales of goods and services
Sales of goods 453 26 453 26
to the parent 5 - 5 -
to subsidiaries - - - -
to associates - - - -
to other related parties 448 26 448 26
Provision of services 848 528 1.305 854
to the parent 31 31 31 31
to subsidiaries - - 457 325
to associates - - - -
to other related parties 817 498 817 498
1.301 554 1.758 880
ii) Purchases of goods and services
Purchases of goods 1.696
2.199
1.696
2.199
from the parent 137 - 137 -
from subsidiaries - - - 0
from other related parties 1.559 2.199
1.559
2.199
Purchases of services 2.178 2.829 2.185 2.766
from the parent 1.149 1.272 1.149 1.272
from subsidiaries - - 7 4
from associates - - - -
from other related parties 1.029 1.490 1.029 1.490
3.874 4.961 3.881 4.965
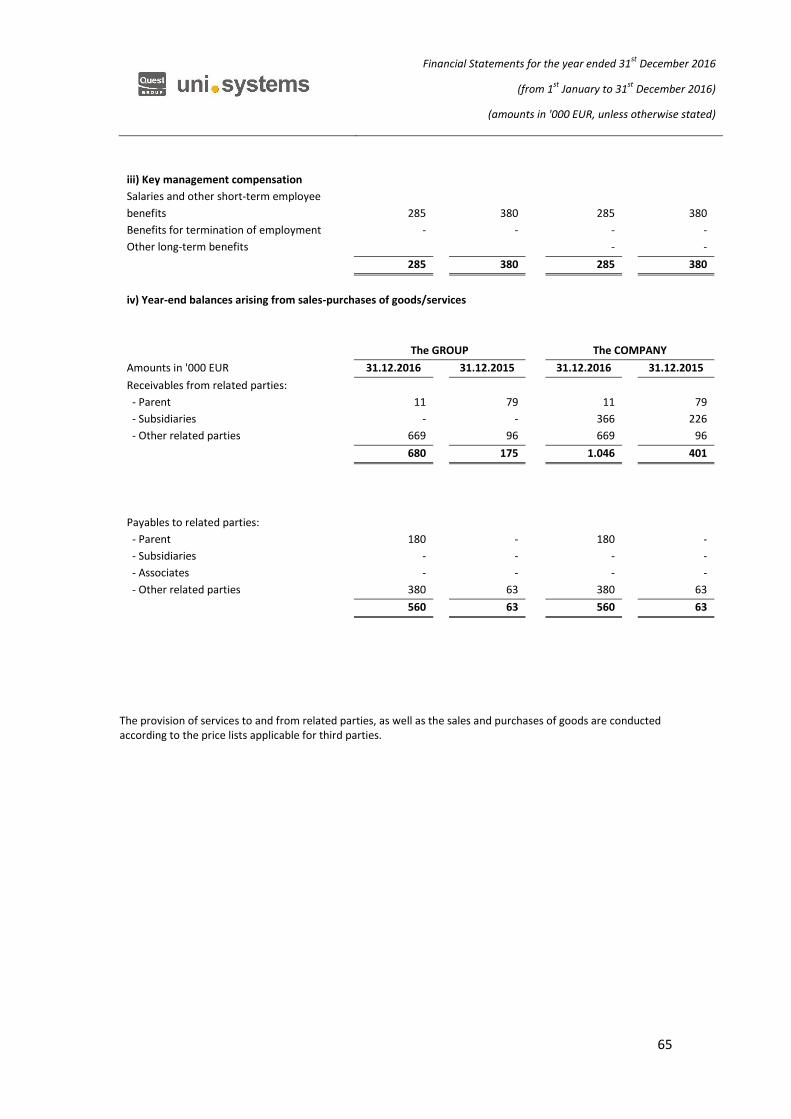
Financial Statements for the year ended 31st
December 2016
(from 1st
January to 31st
December 2016)
(amounts in '000 EUR, unless otherwise stated)
65
iii) Key management compensation
Salaries and other short-term employee
benefits 285 380 285 380
Benefits for termination of employment - - - -
Other long-term benefits - -
285 380 285 380
iv) Year-end balances arising from sales-purchases of goods/services
The GROUP The COMPANY
Amounts in '000 EUR 31.12.2016 31.12.2015 31.12.2016 31.12.2015
Receivables from related parties:
- Parent 11 79 11 79
- Subsidiaries - - 366 226
- Other related parties 669 96 669 96
680 175 1.046 401
Payables to related parties:
- Parent 180 - 180 -
- Subsidiaries - - - -
- Associates - - - -
- Other related parties 380 63 380 63
560 63 560 63
The provision of services to and from related parties, as well as the sales and purchases of goods are conducted according to the price lists applicable for third parties.

Financial Statements for the year ended 31st
December 2016
(from 1st
January to 31st
December 2016)
(amounts in '000 EUR, unless otherwise stated)
66
34. Construction contracts
According to IAS 11, construction contracts are analysed as follows:
Amounts in €
The GROUP
Consolitade income statement ( extracts)
Note 2016 2015
Contract revenue 23.576.341 18.092.699
Contract costs 17.076.341 13.049.407
Gross profit 6.500.000 5.043.291
Selling and marketing costs 1.991.570 1.663.877
Administrative expenses 1.475.621 1.154.763
Construction contracts
2016 2015
The aggregate costs incurred and recognised profits (less recognsed losses) to date 162.652.057 139.072.767
Less :
Net balance sheet position for ongoing contracts 192.649.039 151.988.120
Total -29.996.982 -12.915.353
35. Unaudited tax years
The Company has not been tax audited by the competent tax authorities for the financial year 2010.
The cumulative provision for the unaudited tax years for the Group amounted to € 383 thousand .
As regards subsidiaries and associates, these companies have not been tax audited by the tax authorities for the
following years and, as a result, their tax liabilities are not considered final yet. The companies of the Group have not been tax audited for the following years:

Financial Statements for the year ended 31st
December 2016
(from 1st
January to 31st
December 2016)
(amounts in '000 EUR, unless otherwise stated)
67
Group companies Country Interest Held (%)
Consolidation method
Unaudited tax years
1. UniSystems Information Technology Systems SA GREECE - - 2010
1.a Unisystems Belgium SA (branch) BELGIUM - Full Consolidation 2014-2016
2. Unisystems Cyprus Ltd CYPRUS 100% Full Consolidation 2011-2016
3. Unisystems Information Technology Systems SRL ROMANIA 100% Full Consolidation -
4. Unisystems Bulgaria Ltd BULGARIA 100% Full Consolidation -
5. Unisystmes BV HOLLAND 100% Full Consolidation 2014-2016
6. UNISYSTEMS TURK BİLGİ TEKNOLOJİLERİ AS TURKEY 80% Full Consolidation 2014-2016
7. Uni-Nortel Communication Technologies (Hellas) SA GREECE - Acquired in 2010 2010
8. FAST HELLAS SA GREECE - Acquired in 2011 2010-2011

Financial Statements for the year ended 31st
December 2016
(from 1st
January to 31st
December 2016)
(amounts in '000 EUR, unless otherwise stated)
68
36. Events after the balance sheet date of issuance
The General Assembly held on the 23/12/2016 decided the decrease of the Company’s share capital and return to the shareholder of the amount of five million six hundred seventy thousand euro (€ 5,670,000.00) and, following to this, the amendment of the Company’s Articles of Association. The afore mentioned share capital decrease has been made through: (i) increase in the nominal value of each share with a simultaneous reduction of the total number of the total number of shares consisting the share capital from twenty one millions to ten million five hundred thousand shares, together with a compound on a ratio of two (2) old shares to one (1) new share (reverse split) and (ii) a decrease of the nominal value of each new (deriving from the reverse split) share by € 0.54 and, additionally, return to the shareholder in kind the shares of the company "BriQ Properties Real Estate Investment Company" that had been held by the Company, namely one million nine hundred and forty four thousand two hundred and eighty five (1.944.285) shares, which had been valued by an independent auditor company to the total amount of four million five hundred and thirty nine thousand one hundred and twenty-eight euros (€ 4,539,128) and a cash return to the shareholder amounted to one million one hundred thirty thousand eight hundred seventy two euro (€ 1,130,872). Thus the share capital amounts to four million four hundred and ten thousand euro (€ 4,410,000) and is divided into 10,500,000 ordinary registered shares of a nominal value of forty two cents (€ 0.42) each. The aforementioned decision was registered and, thus, effected on 05/01/2017, date of the announcement by GEMH of the relevant registration under number 883228 / 29-12-2016, decision of the Attica Region (No. 22065 / 29-12-2016 ) concerning the approval of the Articles of Association of the Company amendment.
No further significant events occurred after the balance sheet date stated below.
The Chairman of the Board of Directors and Managing Director The Vice-President
The Member of the Board
of Directors
The Accounting
Department Manager
Ioannis K.Loumakis Apostolos M.Georgantzis Markos G. Bitsakos Nikolaos D. Charisis
ID No AK 082270 ID No F 090096 ID No ΑΑ 079768 ID No ΑΗ 101374
E.C.G. Licence No.
0008340/A' Class