Unique - AnnualReports.com · Unique by Design Annual Report ... Natural gas midstream results from...
118
Unique by Design Annual Report 2005 Penn Virginia Corporation
Transcript of Unique - AnnualReports.com · Unique by Design Annual Report ... Natural gas midstream results from...
Penn Virginia Corporation
Three Radnor Corporate Center Suite 300100 Matsonford RoadRadnor, PA 19087(610) 687-8900 phone(610) 687-3688 faxwww.pennvirginia.com
Uniqueby Design
Annual Report 2005
Penn Virginia CorporationPEN
N VIRGIN
IA CORPO
RATION
Annual Report 2005
PVA_AR05_CoverRls.crw2 1PVA_AR05_CoverRls.crw2 1 3/23/06 1:35:03 PM3/23/06 1:35:03 PM

Penn Virginia Corporation (NYSE:PVA) is an energy company engaged in the exploration, acquisition, development and production of crude oil and natural gas. PVA is also the general partner and the largest unit holder in Penn Virginia Resource Partners, L.P. (NYSE:PVR), which manages coal properties and related assets and operates a midstream natural gas gathering and processing business. PVA is headquartered in Radnor, PA. For more information about PVA, visit the Company’s website at www.pennvirginia.com.
Uniquein Energy
(1) Member of the Nominating and Governance Committee
(2) Member of the Compensation and Benefi ts Committee
(3) Member of the Audit Committee(4) Member of the Oil & Gas Committee
Corporate Information
Financial HighlightsIn millions except per share data 20052005 2004 2003 2002 2001
Financial DataNet Revenues(1) $ 370.0370.0 $ 228.4 $ 181.3 $ 111.0 $ 96.6Operating Income(2) 162.0162.0 80.8 62.1 30.8 1.6Net Income(3) 62.162.1 33.4 28.5 12.1 34.3Net Cash Flows Provided by Operating Activities 231.4231.4 146.4 109.7 65.8 44.2
Common Share Data(4)
Net Income, Basic ($/share) $ 3.353.35 $ 1.82 $ 1.59 $ 0.68 $ 1.96Net Income, Diluted ($/share) 3.313.31 1.81 1.58 0.67 1.93Dividends Paid ($/share) 0.450.45 0.45 0.45 0.45 0.45Average Shares Outstanding, Diluted 18.718.7 18.5 18.1 17.9 17.8
CapitalizationNet Long-term Debt(5) $ 325.8325.8 $ 188.9 $ 154.3 $ 106.9 $ 3.5Minority Interest in Penn Virginia Resource Partners 313.5313.5 182.9 190.5 192.8 144.0Shareholder’s Equity 310.6310.6 252.9 211.6 188.0 185.5Total Capitalization 949.9949.9 624.7 556.4 487.7 333.0Percent of Net Long-term Debt to Total Capitalization 34.3%34.3% 30.2% 27.7% 21.9% 1.1%
Production DataOil and Condensate (MBbl) 302302 396 625 349 164Natural Gas (Bcf) 25.625.6 22.1 20.1 18.7 13.1Total Oil and Gas Production (Bcfe) 27.427.4 24.5 23.8 20.8 14.1Daily Production (MMcfe) 74.974.9 66.8 65.2 57.0 38.6Coal Produced by Lessees (Millions of tons) 30.230.2 31.2 26.5 14.3 15.3Daily Plant Inlet Volumes (MMcf)(6) 127127 — — — —
Realized Prices and MarginsOil and Condensate ($/Bbl) $ 45.6745.67 $ 33.75 26.91 $ 23.63 $ 22.94Natural Gas ($/Mcf) 8.318.31 6.27 5.31 3.35 4.06Coal Royalties ($/Ton) 2.742.74 2.23 1.90 2.20 2.11Midstream Processing Margin ($/Mcf) 1.151.15 — — — —
Estimated ReservesTotal Proved Oil and Gas Reserves (Bcfe) 376.6376.6 354.1 322.9 273.4 252.8Coal (Millions of Recoverable Tons) 689.1689.1 558.1 588.2 614.8 492.8
(1) 2005 revenues are shown net of cost of gas purchased.(2) Operating income in 2004 included $7.5 million of loss on assets held for sale.(3) Net income in 2001 included a $54.7 million ($35.6 million after tax) gain on the sale of Norfolk Southern Corporation common stock.(4) Amounts per common share in 2001 through 2003 have been adjusted for the effect of a two-for-one stock split effective on June 3, 2004. (5) Net of $43.4 million cash equivalents held as collateral for the debt as of December 31, 2001.(6) Natural gas midstream results from date of Cantera acquisition effective March 3, 2005.
DirectorsRobert Garrett(1,2)
Chairman of the Board of the Company and Founder and Managing Director of AdMedia Partners, Inc.
Joe N. Averett, Jr.(4)
Former President, CEO and Director, Crystal Gas Storage, Inc.
Edward B. Cloues, II(2,3)
Chairman and Chief Executive Officerof K-Tron International, Inc. and Director of Penn Virginia Resource GP, LLC, general partner of Penn Virginia Resource Partners, L.P.
A. James DearlovePresident and Chief Executive Officerof the Company and Chairman andChief Executive Officer of Penn Virginia Resource GP, LLC, general partner of Penn Virginia Resource Partners, L.P.
Keith D. HortonExecutive Vice President of the Company and President and Chief Operating Officer of Penn Virginia Resource GP, LLC, general partner of Penn Virginia Resource Partners, L.P.
Steven W. Krablin(1,3)
Former Senior Vice President and Chief Financial Officer, National Oilwell, Inc.
Philippe van Marcke de LummenAdvisor to Cheniere Energy, Inc. and former President and Chief Executive Officer of Tractebel LNG Ltd.
Merrill A. Miller, Jr.President and Chief Executive Officer of National Oilwell Varco, Inc.
Marsha Reines Perelman(1,3,4)
Chief Executive Officer ofWoodforde Management, Inc. and Director of Penn Virginia Resource GP, LLC, general partner of Penn Virginia Resource Partners, L.P.
Gary K. Wright(2,3,4)
Former President, LNB Energy Advisors, former Southwest Managing Director
for Chase Manhattan Bank Global Oil and Gas Group and former Manager of Chemical Bank Worldwide Energy Group
ManagementA. James DearlovePresident and Chief Executive Officer
Frank A. PiciExecutive Vice President andChief Financial Officer
H. Baird WhiteheadExecutive Vice President
Keith D. HortonExecutive Vice President
Nancy M. SnyderSenior Vice President, GeneralCounsel and Corporate Secretary
Ronald K. PageVice President
Forrest W. McNairVice President and Controller
Major SubsidiariesPenn Virginia Oil and Gas CorporationPenn Virginia Resource GP, LLC
Annual MeetingPenn Virginia Corporation’sAnnual Meeting will be held10 a.m. May 2, 2006Marriott Philadelphia West111 Crawford AvenueWest Conshohocken, PA 19428(610) 941-5600 phone(610) 941-1060 fax
Transfer Agent and RegistrarAmerican Stock Transferand Trust CompanyMailing Address:59 Maiden LaneNew York, NY 10038(800) 937-5449 phone(718) 236-2641 fax
Certifi cationsIn 2005, we submitted our Section 303A.12(a) chief executive offi cer certifi cation to the New York Stock Exchange. We have also fi led with the Securities and Exchange Commission, as an exhibit to our most recently fi led Annual Report on Form 10-K, the Sarbanes-Oxlely Act Section 302 certifi cations.
Des
ign:
Cre
ativ
e St
rate
gy G
roup
csg
-des
ign.
com
PVA_AR05_CoverRls.crw2 2PVA_AR05_CoverRls.crw2 2 3/23/06 1:35:15 PM3/23/06 1:35:15 PM

Penn Virginia Corporation expanded its oil and gas and coal businesses during 2005, and entered the natural gas midstream sector through PVR’s purchase of Cantera Resources Holdings LLC, which now operates as PVR Midstream LLC.
Penn Virginia Corporate Structure
(1) GP includes incentive distribution rights(2) Includes 4.0 million subordinated units and 3.8 million common units
GENERAL PARTNER1 OF PVRAND PVR LP UNITS2
OIL AND GAS EXPLORATION & PRODUCTION
PENN VIRGINIA RESOURCE PARTNERS, LP (NYSE:PVR)
COAL NATURAL GAS MIDSTREAM
PENN VIRGINIA CORPORATION(NYSE:PVA)
SAN JUAN BASINCOAL RESERVES (PVR Coal)
MIDCONTINENT NATURAL GAS MIDSTREAM OPERATIONS (PVR Midstream)
WILLISTON BASIN OIL & GAS EXPLORATION
APPALACHIAN BASIN COAL RESERVES & INFRASTRUCTURE (PVR Coal)
GULF COAST AND EAST TEXASOIL & GAS PRODUCTION
MISSISSIPPI OIL & GAS PRODUCTION
ILLINOIS BASIN COAL RESERVES (PVR Coal)
APPALACHIAN BASIN OIL & GAS PRODUCTION
Penn Virginia Oil and GasAppalachia Conventional and CBM production; Proved reserves 164 Bcfe.
Mississippi Selma Chalk production;Proved reserves 98 Bcfe.
East Texas Cotton Valley production;Proved reserves 68 Bcfe.
Gulf Coast South Texas/South Louisiana production; Proved reserves 47 Bcfe.
PVR Coal Land Management689 Million tons of coal reserves and coal-related services and infrastructure in Appalachia, Illinois and San Juan basins.
PVR Midstream LLC3,450 miles of gathering lines and three natural gas processing plants in Texas and Oklahoma.
PENN
VIRGINIA CO
RPORATIO
NAnnual Report 2005
1
AbbreviationsBbl: BarrelBcf: Billion Cubic FeetBcfe: Billion Cubic Feet EquivalentCBM: Coalbed Methane
HCBM: Horizontal CBMMBbl: Thousand BarrelsMMBbl: Million BarrelsMcf: Thousand Cubic Feet
Mcfe: Thousand Cubic Feet EquivalentMMcf: Million Cubic FeetMMcfe: Million Cubic Feet EquivalentMMbtu: Million British Thermal Units
PVA_AR05_Rls_sngls.crw2 1PVA_AR05_Rls_sngls.crw2 1 3/23/06 10:44:19 AM3/23/06 10:44:19 AM

01 05040302
Net Revenues(Dollars in millions)
97 111
181228
370
01 05040302
Net Income(Dollars in millions)
34 33
62
12
28
01 05040302
Cash FlowFrom Operations(Dollars in millions)
228
4466
110
146
• Net cash provided by operating activities was up 58 percent over 2004 to a record $231.4 million;
• Oil and natural gas production increased 12 percent to a record 27.4 Bcfe; and
• Proved oil and gas reserves were up six percent to a record 376.6 Bcfe, with reserve replacement of 281 percent, almost all coming through the drill bit.
During 2005, PVA’s stock price increased 41 percent. We benefi ted from strong performance and high commodity prices in our oil and gas business, which provides the majority of our operating income, net income, and cash fl ow. We also
benefi ted from our 39 percent ownership in and control of Penn Virginia Resource Partners, LP (NYSE:PVR), which owns and manages coal reserves and related infrastructure and operates a midstream natural gas processing business. PVR’s unitholders received a 20 percent increase in cash distributions per unit during 2005, and unit prices were up seven percent for the year. We also realized increased cash fl ows from the incentive distribution rights (IDRs) we own as the general partner of PVR. Over time, the IDRs have the potential to create signifi cant value for our shareholders.
Dear Fellow Shareholder:We are pleased to report that by any measure, 2005 was another excellent year for Penn Virginia Corporation (PVA). We set new company records in a number of categories:
• Revenues, net of the cost of purchased gas in our natural gas midstream segment, were up 62 percent over 2004 to a record $370.0 million;
• Operating income increased 100 percent over 2004 to a record $162.0 million;
• Net income increased to a record $62.1 million, an increase of 86 percent over 2004;
Uniquein Strategy
Our strategy includes growing all three of our natural resource-based businesses: oil and gas exploration and production, coal land management and natural gas midstream.
Robert GarrettChairman
A. James DearlovePresident and Chief Executive Officer
PEN
N V
IRGI
NIA
CO
RPO
RATI
ON
Annu
al R
epor
t 20
05
2
PVA_AR05_Rls_sngls.crw2 2PVA_AR05_Rls_sngls.crw2 2 3/23/06 10:44:23 AM3/23/06 10:44:23 AM
fi nding new unconventional development plays in other basins to increase our inventory of low-risk development projects.
We will also continue to expand PVR. The coal business expects to spend $16 to $18 million primarily to complete a new coal preparation and handling plant in central Appalachia. PVR Midstream has budgeted capital spending of $8 to $10 million, principally for gathering system expansion and new well tie-ins. While acquisitions are not budgeted, PVR’s coal and midstream businesses have active business development groups that continue to look for acquisition opportunities.
Governance ChangesSince our last annual report, Penn Virginia has added two new directors to its Board, both of whom have valuable experience in the energy industry. In December of 2005, Mr. Phillippe van Marcke de Lummen was elected to the Board. In 2005, Mr. van Marcke became an advisor to Cheniere Energy, Inc. (AMEX:LNG), a Houston-based energy company engaged primarily in the construction and operation of LNG terminals located along the Gulf Coast and oil and gas exploration and development in the Gulf of Mexico. Previously, Mr. van Marcke served in several capacities with members of the SUEZ (NYSE:SZE) Group, including as Chairman of Tractebel LNG Trading S.A. and President and CEO of Tractebel LNG Ltd.
In February of 2006, Mr. Merrill A. Miller, Jr. was elected to the Board. Mr. Miller is currently the Chairman, President, and Chief Executive Offi cer of National Oilwell Varco, Inc. (NYSE:NOV), a worldwide provider of equipment and services used in the upstream oil and gas industry. From 1997 until National Oilwell’s merger with Varco International in March 2005, Mr. Miller served in several executive positions with National Oilwell, including as Chairman of the Board, President, and Chief Executive Offi cer. Previously, he held senior management positions with Anadarko Drilling Company and Helmerich & Payne International Drilling Company.
OutlookDuring 2005, natural gas and crude oil prices reached levels that far surpassed both our own and the industry’s expectations. The price rise refl ects tightening supply that was exacerbated by hurricanes Katrina and Rita. However, worldwide demand for fossil fuel-based energy is increasing, which will require increased production of coal, oil, and natural gas at a time when supply has become less certain. Therefore, while energy prices — particularly for natural gas — may not remain at 2005 levels, we believe they will remain high by historical measures, which should benefi t each of our business segments.
As evidenced by our increased 2006 oil and gas capital expenditures budget, we intend to continue to take advantage of the strong commodity price environment. Our focus is on relatively low-risk projects and on targeting new potential unconventional growth areas. While no acquisitions are budgeted, and rising commodity prices may make acquisition valuations more diffi cult to justify, accretive opportunities are continuously being evaluated.
With a strong balance sheet, two establishedgrowth platforms, and a seasoned, proven management team, PVR is also well positioned for the future. There should be numerous additional opportunities to add to the Partnership’s coal and midstream oil and gas segments. PVR’s approach during 2006 will include stimulating organic growth, “bolt on” acquisitions, and establishing new core areas.
PVA’s Board and management are committed to building on the progress made in 2005. We will remain “Unique by Design.” As always, we greatly appreciate the hard work and dedication of Penn Virginia’s employees and the continued loyalty and support of our shareholders.
Robert GarrettChairman
A. James DearlovePresident and Chief Executive Officer
Unique in Energy — By DesignOur strategy of being exposed to more than one part of the energy sector is the reason we refer to Penn Virginia as being “Unique in Energy.” We believe that, in addition to being well positioned to grow our upstream oil and gas business, our long history of coal land management — which is now conducted through PVR — provides a complementary, stable cash fl ow source with inherent growth potential. PVR’s relatively new natural gas midstream business provides yet another source of income and cash fl ow in a sector that is likely to see signifi cant expansion.
During 2005, we spent almost $500 million to expand these businesses. Of that, we spent approximately $170 million in our oil and gas upstream business, primarily to expand our low-risk unconventional development projects in Appalachian coalbed methane, the Cotton Valley in east Texas, and the Selma Chalk in Mississippi. As part of our long-term strategy, we continue to add prospects targeting low-risk, unconventional natural gas based resources.
PVR expanded its coal reserves inventory during 2005, spending approximately $101 million to acquire 162 million tons of coal and to construct new coal-related infrastructure. PVR also completed a $191 million purchase ($199 million after closing adjustments and net of cash) of a natural gas midstream business in Texas and Oklahoma, which now operates as PVR Midstream.
Going forward, we expect to continue to grow all of these businesses. Our focus in the oil and gas business will be to continue to capitalize on our expertise in unconventional plays. Our 2006 oil and gas business capital budget is $208 million, a 22 percent increase over 2005. Approximately 75 percent of this amount is earmarked to develop reserves in our three core areas of Appalachia, east Texas, and Mississippi. Exploration spending will focus on our south Louisiana prospect areas, which provide the potential for meaningful reserve and production additions and on
Approximately 75 percent of oil and gas business’ $208 million capital budget for 2006 is to develop reserves in our core areas in Appalachia, east Texas and Mississippi.
PENN
VIRGINIA CO
RPORATIO
NAnnual Report 2005
3
PVA_AR05_Rls_sngls.crw2 3PVA_AR05_Rls_sngls.crw2 3 3/23/06 10:44:27 AM3/23/06 10:44:27 AM
Oil and GasAt Penn Virginia Oil & Gas, our goal is to use our knowledge and experience to build a portfolio of assets with sustainability and growth potential, even at much lower commodity prices than we experienced in 2005. Supporting that goal is a strategy of focusing on relatively low risk, unconventional natural gas-oriented resource plays, such as the horizontal coalbed methane (HCBM) in Appalachia; the Cotton Valley play in east Texas; and the Selma Chalk in Mississippi. We are also assessing the potential of low risk organic shale plays in other basins. A complementary part of our strategy is to generate and drill exploratory prospects which could make a meaningful difference to our production and reserve profi le, primarily in south Texas and south Louisiana. We made signifi cant progress in all of these areas during 2005.
Our increased operating income and cash fl ows in 2005 were the direct result of both our record oil and natural gas production levels and price realizations.
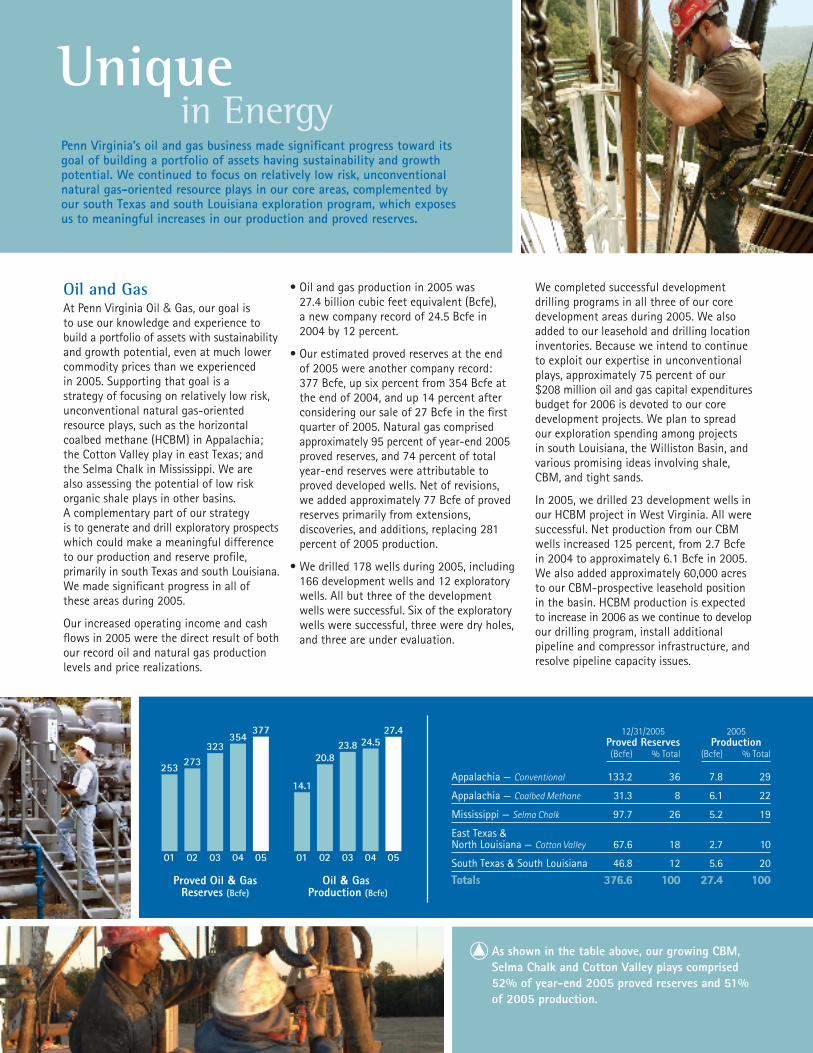
• Oil and gas production in 2005 was 27.4 billion cubic feet equivalent (Bcfe), a new company record of 24.5 Bcfe in 2004 by 12 percent.
• Our estimated proved reserves at the end of 2005 were another company record:377 Bcfe, up six percent from 354 Bcfe at the end of 2004, and up 14 percent after considering our sale of 27 Bcfe in the fi rst quarter of 2005. Natural gas comprised approximately 95 percent of year-end 2005 proved reserves, and 74 percent of total year-end reserves were attributable to proved developed wells. Net of revisions, we added approximately 77 Bcfe of proved reserves primarily from extensions, discoveries, and additions, replacing 281 percent of 2005 production.
• We drilled 178 wells during 2005, including 166 development wells and 12 exploratory wells. All but three of the development wells were successful. Six of the exploratory wells were successful, three were dry holes, and three are under evaluation.
We completed successful development drilling programs in all three of our core development areas during 2005. We also added to our leasehold and drilling location inventories. Because we intend to continue to exploit our expertise in unconventional plays, approximately 75 percent of our $208 million oil and gas capital expenditures budget for 2006 is devoted to our core development projects. We plan to spread our exploration spending among projects in south Louisiana, the Williston Basin, and various promising ideas involving shale, CBM, and tight sands.
In 2005, we drilled 23 development wells in our HCBM project in West Virginia. All were successful. Net production from our CBM wells increased 125 percent, from 2.7 Bcfe in 2004 to approximately 6.1 Bcfe in 2005. We also added approximately 60,000 acres to our CBM-prospective leasehold position in the basin. HCBM production is expected to increase in 2006 as we continue to develop our drilling program, install additional pipeline and compressor infrastructure, and resolve pipeline capacity issues.
Proved Oil & GasReserves (Bcfe)
Oil & Gas Production (Bcfe)
01 05040302
377
01 05040302
253
354323
273
14.1
20.823.8 24.5
27.4 12/31/2005 2005 Proved Reserves Production (Bcfe) % Total (Bcfe) % Total
Appalachia — Conventional 133.2 36 7.8 29
Appalachia — Coalbed Methane 31.3 8 6.1 22
Mississippi — Selma Chalk 97.7 26 5.2 19
East Texas & North Louisiana — Cotton Valley 67.6 18 2.7 10
South Texas & South Louisiana 46.8 12 5.6 20
TotTotalals 376.676.6 100100 27.427.4 100100
Uniquein Energy
Penn Virginia’s oil and gas business made signifi cant progress toward its goal of building a portfolio of assets having sustainability and growth potential. We continued to focus on relatively low risk, unconventional natural gas-oriented resource plays in our core areas, complemented by our south Texas and south Louisiana exploration program, which exposes us to meaningful increases in our production and proved reserves.
As shown in the table above, our growing CBM, Selma Chalk and Cotton Valley plays comprised 52% of year-end 2005 proved reserves and 51% of 2005 production.
PVA_AR05_Rls_sngls.crw2 4PVA_AR05_Rls_sngls.crw2 4 3/23/06 10:44:30 AM3/23/06 10:44:30 AM

We drilled 27 development wells in our Cotton Valley project in east Texas and north Louisiana. Again, all were successful. Most of these wells were in the North Carthage fi eld, which is part of our Bethany development drilling joint venture with GMX Resources Inc. (NASDAQ: GMXR). As a direct result of our successful and growing development drilling program in the play, net production in the Cotton Valley project area increased to 2.7 Bcfe in 2005 from 1.1 Bcfe in 2004.
In 2006, we expect production from our Cotton Valley play to grow due to increased drilling in both the Bethany joint venture and our 100 percent working interest areas, and because of the installation of new pipeline and compressor facilities. There are currently three drilling rigs in use in our Cotton Valley project; we expect to add a fourth in the third quarter of 2006.
We drilled 83 successful development wells in our Selma Chalk project in Mississippi during 2005. Production in our Mississippi fi elds in 2005 was 5.2 Bcfe, compared to 4.9 Bcfe in 2004. This increase was
primarily a result of new production in the Baxterville and Maxie fi elds, offset in part by normal fi eld declines and disruptions due to Hurricane Katrina. We expect production to continue to increase during 2006 as a result of our ongoing drilling program. We are also evaluating the use of horizontal drilling techniques in the Selma Chalk.
In south Texas and south Louisiana, we drilled fi ve exploratory wells with three successes and four development wells, three of which were successful, including a Lower Frio exploratory well and follow-on development well drilled in our Estill prospect in the Rugeley fi eld in Matagorda County, Texas. The prospect was generated by Penn Virginia, which retains 50 percent working interest. We expect to drill additional development wells in the Rugeley fi eld in 2006. Another notable successful exploratory well was drilled in the Hackberry formation on our Fannett prospect in Jefferson County, Texas, in which we have a 60 percent working interest. We expect to drill development wells in the Fannett
area during 2006 as well. We plan to focus most of our exploratory drilling in 2006 on several prospects in south Louisiana, where we have obtained partners and drilling rig commitments.
During 2005, we also began evaluating several new potential development plays. In the Williston Basin, we drilled an exploratory well as part of our agreement with Bill Barrett Corporation (NYSE:BBG) for a 50 percent working interest in a 20,000 net acre Bakken Dolomite horizontal oil well prospect. If the test well results are encouraging, we expect to move forward with a development drilling program based on 640 acre spacing. We also drilled two 100 percent working interest exploratory wells in the New Albany Shale in the Illinois Basin during the fourth quarter. Reservoir analysis is currently in progress, with completion and testing expected over the remainder of 2006. Additional drilling is expected in 2006 to test this and other unconventional shale play types.
During 2005, Penn Virginia continued to invest in pipeline and related infrastructure to ensure adequate “takeaway” capacity for growing production from its resource plays in Appalachia and east Texas.
H. Baird WhiteheadPresident, Penn Virginia Oil & Gas Corporation
PENN
VIRGINIA CO
RPORATIO
NAnnual Report 2005
Penn Virginia compares favorably to its peers using two key indicators: proved reserve life and drilling inventory. The Company has approximately 14 years of proved reserve life and 1,000 drilling locations in inventory.
5
PVA_AR05_Rls_sngls.crw2 5PVA_AR05_Rls_sngls.crw2 5 3/23/06 10:44:35 AM3/23/06 10:44:35 AM
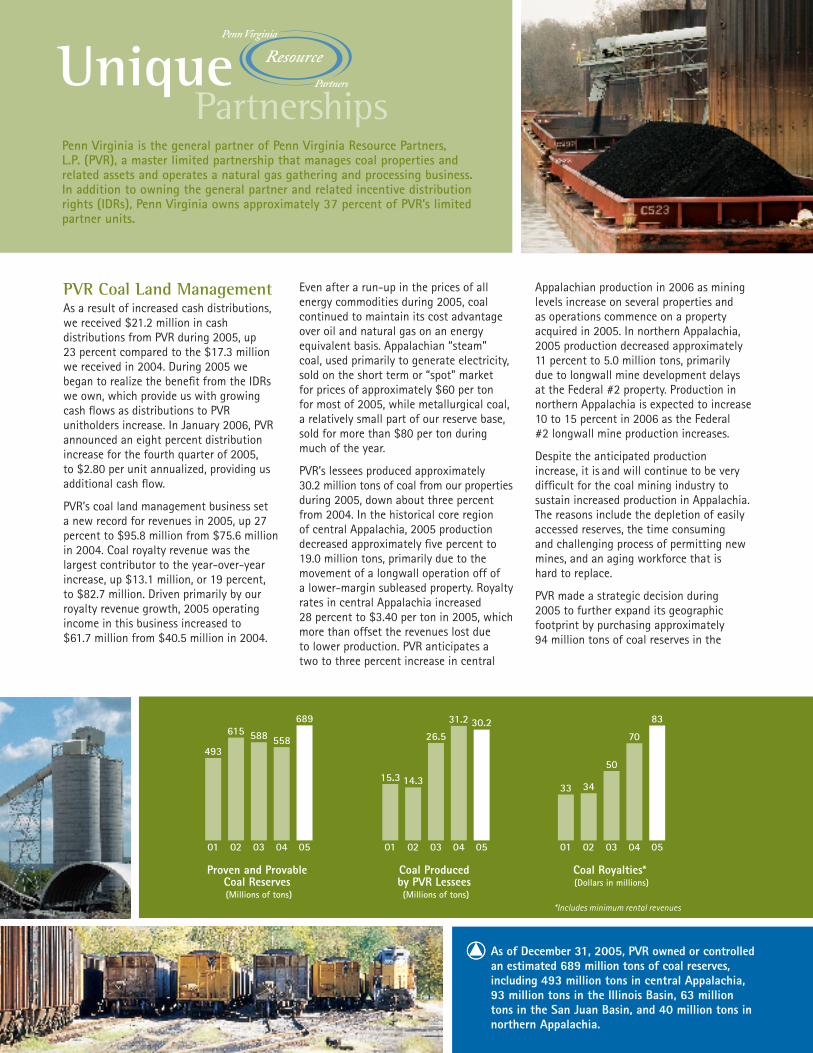
UniquePartnerships
PVR Coal Land ManagementAs a result of increased cash distributions, we received $21.2 million in cash distributions from PVR during 2005, up 23 percent compared to the $17.3 million we received in 2004. During 2005 we began to realize the benefi t from the IDRs we own, which provide us with growing cash fl ows as distributions to PVR unitholders increase. In January 2006, PVR announced an eight percent distribution increase for the fourth quarter of 2005, to $2.80 per unit annualized, providing us additional cash fl ow.
PVR’s coal land management business set a new record for revenues in 2005, up 27 percent to $95.8 million from $75.6 million in 2004. Coal royalty revenue was the largest contributor to the year-over-year increase, up $13.1 million, or 19 percent, to $82.7 million. Driven primarily by our royalty revenue growth, 2005 operating income in this business increased to $61.7 million from $40.5 million in 2004.
Even after a run-up in the prices of all energy commodities during 2005, coal continued to maintain its cost advantage over oil and natural gas on an energy equivalent basis. Appalachian “steam” coal, used primarily to generate electricity, sold on the short term or “spot” market for prices of approximately $60 per ton for most of 2005, while metallurgical coal, a relatively small part of our reserve base, sold for more than $80 per ton during much of the year.
PVR’s lessees produced approximately 30.2 million tons of coal from our properties during 2005, down about three percent from 2004. In the historical core region of central Appalachia, 2005 production decreased approximately fi ve percent to 19.0 million tons, primarily due to the movement of a longwall operation off of a lower-margin subleased property. Royalty rates in central Appalachia increased 28 percent to $3.40 per ton in 2005, which more than offset the revenues lost due to lower production. PVR anticipates a two to three percent increase in central
Appalachian production in 2006 as mining levels increase on several properties and as operations commence on a property acquired in 2005. In northern Appalachia, 2005 production decreased approximately 11 percent to 5.0 million tons, primarily due to longwall mine development delays at the Federal #2 property. Production in northern Appalachia is expected to increase 10 to 15 percent in 2006 as the Federal #2 longwall mine production increases.
Despite the anticipated production increase, it is and will continue to be very diffi cult for the coal mining industry to sustain increased production in Appalachia. The reasons include the depletion of easily accessed reserves, the time consuming and challenging process of permitting new mines, and an aging workforce that is hard to replace.
PVR made a strategic decision during 2005 to further expand its geographic footprint by purchasing approximately 94 million tons of coal reserves in the
As of December 31, 2005, PVR owned or controlled an estimated 689 million tons of coal reserves, including 493 million tons in central Appalachia, 93 million tons in the Illinois Basin, 63 million tons in the San Juan Basin, and 40 million tons in northern Appalachia.
Penn Virginia is the general partner of Penn Virginia Resource Partners, L.P. (PVR), a master limited partnership that manages coal properties and related assets and operates a natural gas gathering and processing business. In addition to owning the general partner and related incentive distribution rights (IDRs), Penn Virginia owns approximately 37 percent of PVR’s limited partner units.
01 05040302
Coal Royalties* (Dollars in millions)
*Includes minimum rental revenues
83
01 05040302
Proven and Provable Coal Reserves (Millions of tons)
01 05040302
Coal Produced by PVR Lessees (Millions of tons)
15.3 14.3
26.5
31.2 30.2
493
615 588 558
689
33 34
50
70
PVA_AR05_Rls_sngls.crw2 6PVA_AR05_Rls_sngls.crw2 6 3/23/06 10:44:38 AM3/23/06 10:44:38 AM
western Kentucky portion of the Illinois Basin. Production from the Illinois Basin is expected to grow as environmental regulations become more stringent and technological advances make it environmentally acceptable to use the basin’s high sulfur coal. As a result, PVR plans to increase its position in the basin over time.
PVR has also continued to grow its coal services and infrastructure business, expanding its fl eet of coal processing and loading facilities by constructing a new facility that is expected to begin service in the fi rst half of 2006. During 2005, PVR also benefi ted from a full year of operations at Coal Handling Solutions, its joint venture with Massey Energy Company [NYSE:MEE], which provides coal handling facilities and services for industrial end users. PVR is working to expand that venture as well.
PVR Midstream LLCPVR entered the natural gas midstream business in March of 2005, when it acquired a natural gas gathering and processing business with assets in Oklahoma and Texas from Cantera Resource Holdings LLC (Cantera). The $199 million purchase price (after closing adjustments) was funded with a combination of bank loans and new public units issued. The acquisition enabled PVR to achieve a long-stated objective of entering the midstream natural gas business, a sector that includes several growth MLPs and offers a number of growth opportunities.
The Cantera assets (which operates as PVR Midstream — PVRM) include approximately 3,450 miles of gas gathering pipelines that supply three natural gas processing plants with a capacity of approximately 160 million cubic feet per day. Revenues primarily come from sharing sales proceeds of natural gas and natural gas liquids under contracts with natural gas producers, from fees charged to gather and treat natural gas, and other related services.
The strong pricing environment for oil and natural gas during 2005 accelerated drilling activity around our gathering systems and plants. That, in turn, led to gathering and processing volumes that exceeded the estimates in our acquisition economics. Through 2005, PVRM added 27 miles of new gathering lines connecting 92 new wells to its systems.
After closing the Cantera acquisition, PVRM focused on building the necessary accounting systems and back offi ce support for its commercial platform. PVRM is now pursuing its strategy of identifying and acquiring additional gathering, processing, and related midstream assets. Another aspect of PVRM’s strategy is analyzing ways to achieve operating synergies with our oil and gas exploration and production business. For example, during 2005 PVRM began marketing our natural gas production in Texas and Louisiana, replacing a third party marketing company and allowing us to realize higher prices for oil and natural gas sold in that region. We will continue to explore ways to exploit our natural link to PVR in mutually benefi cial ways.
In addition to acquisitions of midstream assets from third parties, PVRM continues to analyze ways to achieve operating synergies with Penn Viriginia Oil & Gas.
PVRM’s gathering and processing volumes and related margins exceeded acquisition economics in 2005 due to the strong pricing environment for oil and natural gas.
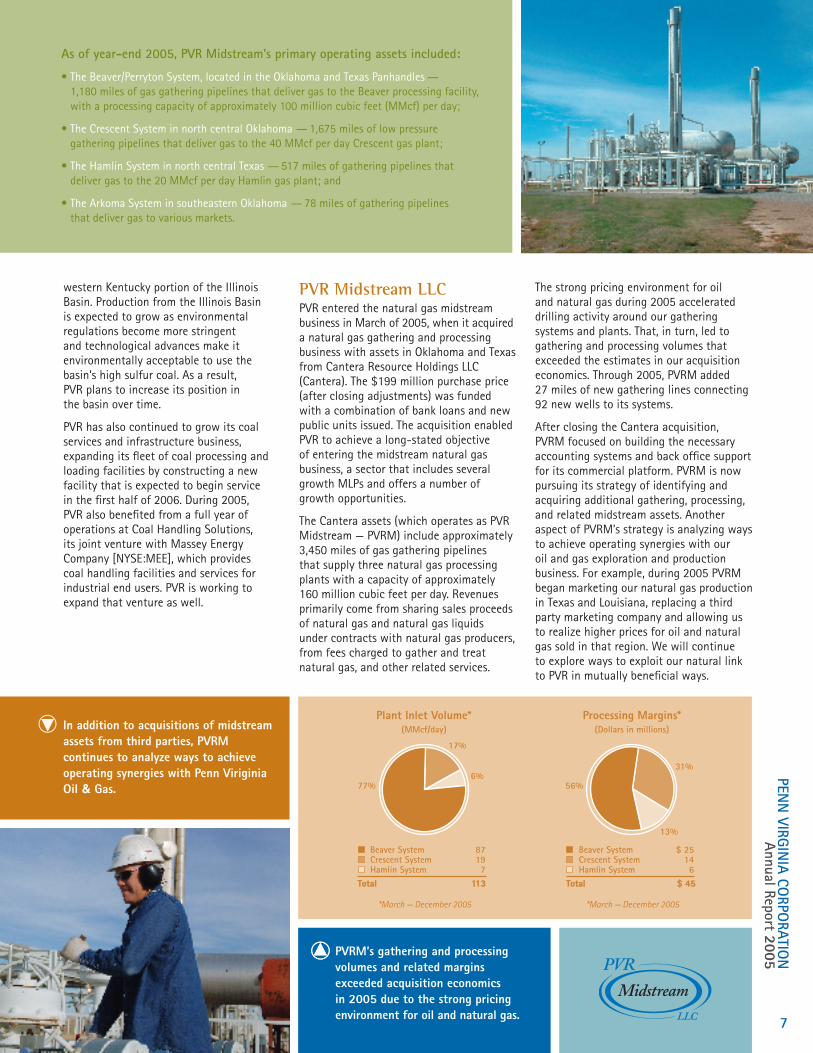
As of year-end 2005, PVR Midstream’s primary operating assets included:
• The Beaver/Perryton System, located in the Oklahoma and Texas Panhandles — 1,180 miles of gas gathering pipelines that deliver gas to the Beaver processing facility, with a processing capacity of approximately 100 million cubic feet (MMcf) per day;
• The Crescent System in north central Oklahoma — 1,675 miles of low pressure gathering pipelines that deliver gas to the 40 MMcf per day Crescent gas plant;
• The Hamlin System in north central Texas — 517 miles of gathering pipelines that deliver gas to the 20 MMcf per day Hamlin gas plant; and
• The Arkoma System in southeastern Oklahoma — 78 miles of gathering pipelines that deliver gas to various markets.
PENN
VIRGINIA CO
RPORATIO
NAnnual Report 2005
7
PVA_AR05_Rls_sngls.crw2 7PVA_AR05_Rls_sngls.crw2 7 3/23/06 10:44:42 AM3/23/06 10:44:42 AM

UniqueSolutions
Q & A
Q You say that Penn Virginia is “Unique by Design.” What do you mean by that?
A Simply put, we have very deliberately built a combination of exposures to multiple commodities that is unique among our peers, giving us several ways to achieve superior returns for our shareholders. We have been in the oil and gas exploration and production business since 1980. Our original coal land management business dates back to 1882, and now resides in Penn Virginia Resource Partners, a master limited partnership owned 39 percent by PVA. During 2005, PVR also purchased a natural gas midstream processing business. So, in addition to our oil and gas E&P business, we are exposed to the coal royalty and natural gas midstream businesses. The result: a unique combination of exposures carefully designed to maximize the potential for returns.
Q PVA has consistently paid a dividend for more than 100 years, a very unusual feat these days. Why do you pay a dividend?
A Aside from maintaining a century of tradition, we believe that many of our shareholders enjoy receiving the dividend, and that returning a portion of the cash fl ow generated from PVR to PVA shareholders is good fi nancial discipline.
Q Where will PVA’s reserve and production growth come from?
A As we have discussed elsewhere in this report, we have three major development areas where we are focusing our efforts in 2006: the Cotton Valley play in east Texas, the horizontal CBM play in Appalachia, and the Selma Chalk play in Mississippi. Each of those areas has at least three years of drilling inventory remaining as of year-end 2005. We are also targeting other areas, such as the Williston Basin’s Bakken Dolomite play and several shale plays, including the New Albany Shale in Indiana and Illinois, the Woodford Shale in Oklahoma, and the Devonian Shale in Appalachia.
Q What is the role of your exploration program?
A Our exploration program has two roles. First, we are using it to identify future development plays in several new areas, such as those described above. Second, we are using it along the onshore Texas and Louisiana Gulf Coast to target 5 to 50 Bcfe reserve accumulations that generate economically viable reserve additions and production growth with moderate risk to the capital employed. To date, our exploration program’s performance in both of those roles has been very good.
Q A key indicator of an oil & gas company’s sustainability over the long term is its proved reserve life, coupled with its inventory of drilling locations. How does PVA stack up?
A Using year-end 2005 numbers, PVA’s reserve life is approximately 14 years, which is longer than for most oil and gas companies. We also have approximately 1,000 drilling locations in our inventory with the majority being in our core areas of Appalachia, east Texas and Mississippi.
Q As of year-end 2005, PVA owned 39 percent of PVR, including full ownership of PVR’s general partner. What value does that ownership bring to Penn Virginia Corporation?
A It is very important for a shareholder of Penn Virginia Corporation to understand that PVA’s ownership in PVR generates value in the form of increasing cash fl ow, in two ways.
First, PVA owned 7.8 million limited partner units in PVR as of year-end 2005, from which it received cash distributions of $19.3 million in 2005.
Second, PVA’s ownership of PVR’s general partner entitles PVA to incentive distribution rights, the right to receive an increasing share of PVR’s incremental cash fl ow as distributions to the limited partners increase. During 2005, PVA received $1.9 million from its ownership of the general partner and the IDRs.
The chart at left illustrates that, as PVR increases its distribution levels above the current $2.80 per unit, PVA will be entitled to receive a much greater percentage of the incremental cash distributed. PVA continues to review ways to optimize the amount and visibility of this value-creating right to cash.
Jim Dearlove, President and Chief Executive Offi cer, discusses issues impacting Penn Virginia Corporation.
Distribution on PVA-Held LP Units General Partner 2% Interest GP Incentive Distribution
$2.20 $2.40 $2.60 $2.80 $3.00 $3.20 $3.40 $3.60 $3.80 $4.00$0
$10
$20
$30
$40
$50
$60
LP Distribution per Unit
As General Partner of PVR, cash flows from PVR increase at greater rate than LP Distribution increases*
Annu
al C
ash
Flow
to
PVA
(In m
illio
ns)
Q1/06Distribution(Annualized)
*Assumes constant number of LP units
PEN
N V
IRGI
NIA
CO
RPO
RATI
ON
Annu
al R
epor
t 20
05
8
PVA_AR05_Rls_sngls.crw2 8PVA_AR05_Rls_sngls.crw2 8 3/23/06 10:44:46 AM3/23/06 10:44:46 AM

UNITED STATES SECURITIES AND EXCHANGE COMMISSION
Washington, D.C. 20549
FORM 10-K
ANNUAL REPORT PURSUANT TO SECTION 13 OR 15(d) OF THE SECURITIES EXCHANGE ACT OF 1934
For the fiscal year ended December 31, 2005
Commission File Number: 0-753
Penn Virginia Corporation (Exact name of registrant as specified in its charter)
Virginia 23-1184320 (State or Other Jurisdiction of Incorporation or Organization)
(I.R.S. Employer Identification Number)
Three Radnor Corporate Center, Suite 300
100 Matsonford Road Radnor, Pennsylvania 19087
(Address of principal executive offices)
Registrant’s telephone number, including area code: (610) 687-8900
Securities registered pursuant to Section 12(b) of the Act: None
Securities registered pursuant to Section 12(g) of the Act:
Title of each class
Name of exchange on which registered
Common Stock, $0.01 Par Value New York Stock Exchange
Indicate by check mark if the registrant is a well known seasoned issuer, as defined in Rule 405 of the Securities Act of 1933. Yes ⌧ No
Indicate by check mark if the registrant is not required to file reports pursuant to Section 13 or Section 15(d) of the Securities Exchange Act of 1934. Yes No ⌧
Indicate by check mark whether the registrant (1) has filed all reports required to be filed by Section 13 or 15(d) of the Exchange Act during the preceding 12 months (or for such shorter period that the registrant was required to file such reports), and (2) has been subject to such filing requirements for the past 90 days. Yes ⌧ No
Indicate by check mark if disclosure of delinquent filers pursuant to Item 405 of Regulation S-K is not contained herein, and will not be contained, to the best of registrant’s knowledge, in definitive proxy or information statements incorporated by reference in Part III of this Form 10-K or any amendment to this Form 10-K. ⌧
Indicate by check mark whether the registrant is a large accelerated filer, an accelerated filer, or a non-accelerated filer. See definition of “accelerated filer and large accelerated filer” in Rule 12b-2 of the Exchange Act. (Check One) Large accelerated filer ⌧ Accelerated filer Non-accelerated filer
Indicate by check mark whether the Registrant is a shell company (as defined in Rule 12b-2 of the Exchange Act). Yes No ⌧
The aggregate market value of common stock held by non-affiliates of the registrant was $818,538,083 as of June 30, 2005 (the last business day of its most recently completed second fiscal quarter), based on the last sale price of such stock as quoted on the New York Stock Exchange. For purposes of making this calculation only, the registrant has defined affiliates as including all directors and all executive officers, but excluding any institutional shareholders. This determination is not necessarily a conclusive determination for other purposes.
As of March 8, 2006, 18,644,728 shares of common stock of the registrant were issued and outstanding.
DOCUMENTS INCORPORATED BY REFERENCE:
Part Into Which Incorporated
(1) Proxy Statement for Annual Meeting of Shareholders on May 2, 2006 Part III
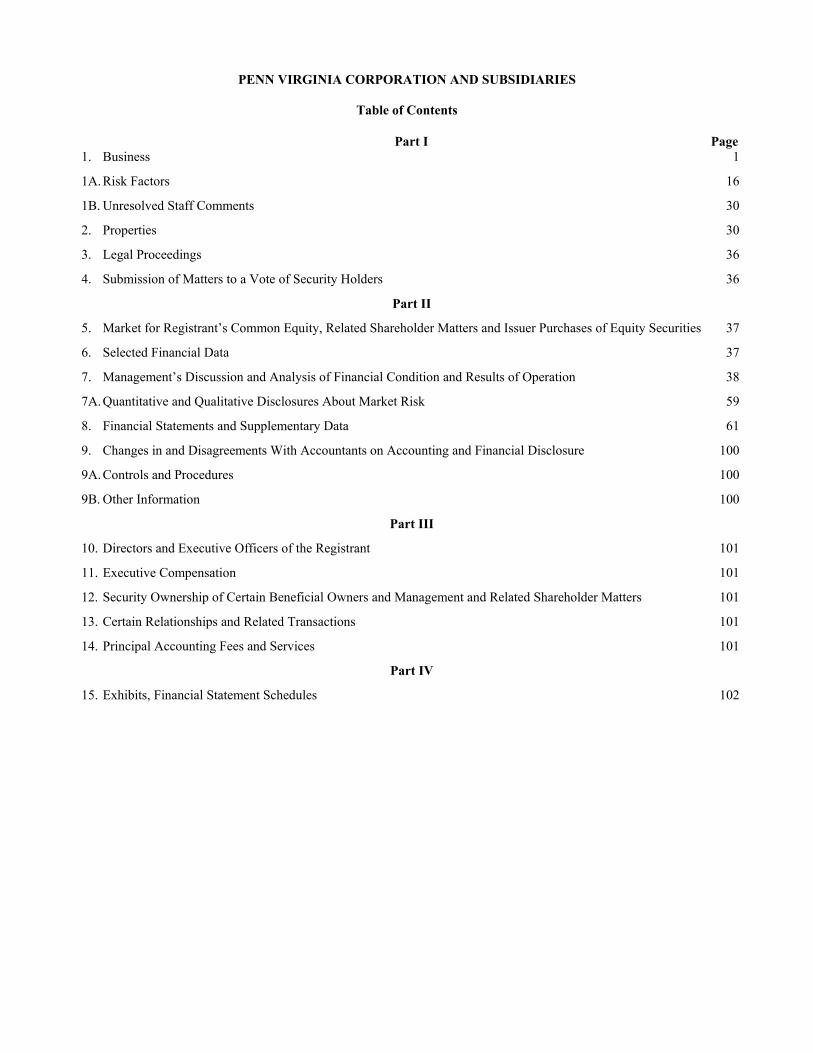
PENN VIRGINIA CORPORATION AND SUBSIDIARIES
Table of Contents
Part I Page1. Business 1
1A. Risk Factors 16
1B. Unresolved Staff Comments 30
2. Properties 30
3. Legal Proceedings 36
4. Submission of Matters to a Vote of Security Holders 36
Part II
5. Market for Registrant’s Common Equity, Related Shareholder Matters and Issuer Purchases of Equity Securities 37
6. Selected Financial Data 37
7. Management’s Discussion and Analysis of Financial Condition and Results of Operation 38
7A. Quantitative and Qualitative Disclosures About Market Risk 59
8. Financial Statements and Supplementary Data 61
9. Changes in and Disagreements With Accountants on Accounting and Financial Disclosure 100
9A. Controls and Procedures 100
9B. Other Information 100
Part III
10. Directors and Executive Officers of the Registrant 101
11. Executive Compensation 101
12. Security Ownership of Certain Beneficial Owners and Management and Related Shareholder Matters 101
13. Certain Relationships and Related Transactions 101
14. Principal Accounting Fees and Services 101
Part IV
15. Exhibits, Financial Statement Schedules 102

1
PART I Item 1 Business General
Penn Virginia Corporation (“Penn Virginia,” the “Company,” “we,” “us” or “our”) is a Virginia corporation founded in 1882 whose common stock is traded on the New York Stock Exchange under the symbol “PVA.” We are engaged in the exploration, development and production of crude oil and natural gas primarily in the Appalachian, Mississippi, east Texas and Gulf Coast onshore areas of the United States. We also collect royalties on various oil and gas properties in which we own a mineral fee interest. At December 31, 2005, we had proved reserves of approximately 2.9 million barrels of oil and condensate and 359 billion cubic feet (“Bcf”) of natural gas, or 377 billion cubic feet equivalent (“Bcfe”).
We are also indirectly involved in the businesses engaged in by Penn Virginia Resource Partners, L.P. (the “Partnership”
or “PVR”), a Delaware limited partnership whose common units are traded on the New York Stock Exchange under the symbol “PVR.” Our wholly owned subsidiary, Penn Virginia Resource GP, LLC, a Delaware limited liability company, serves as the general partner of the Partnership. As of December 31, 2005, we owned approximately 39 percent of the Partnership, consisting of a two percent general partner interest and a 37 percent limited partner interest. As part of our ownership of PVR’s general partner, we also own the rights, referred to as “incentive distribution rights,” to receive an increasing percentage of the Partnership’s quarterly distributions of available cash from operating surplus after certain levels of cash distributions have been achieved. See Item 1, “Business—Partnership Distributions,” for more information on incentive distribution rights.
PVR conducts operations in two business segments: coal and natural gas midstream. The Partnership does not operate
any coal mines, but rather leases its coal reserves to various mining operators in exchange for royalty payments. Additionally, the Partnership provides fee-based coal preparation and loading facilities to some of its lessees and to other third party industrial end-users. On March 3, 2005, the Partnership acquired a midstream gas gathering and processing business with primary locations in the mid-continent area of Oklahoma and the Texas panhandle from Cantera Natural Gas, LLC. For a further discussion of this acquisition, see Item 7, “Management’s Discussion and Analysis of Financial Condition and Results of Operations—Acquisitions and Investments.” Financial Information and Segments
We operate in three primary business segments. We are in the crude oil and natural gas exploration and production business and, through our interests in PVR, we are in the coal and natural gas midstream businesses. For financial statement purposes, the assets, liabilities and earnings of PVR are included in our consolidated financial statements, with the public unitholders’ ownership interest reflected as a minority interest. In 2005, approximately 59 percent of our operating income was attributable to our oil and gas segment, 38 percent was attributable to our coal segment and 10 percent was attributable to our natural gas midstream segment, less a seven percent operating loss related to corporate and other functions. See Note 21 in the Notes to Consolidated Financial Statements for financial information concerning our business segments. Oil and Gas Segment Overview
General In our oil and gas segment, our goal is to use our knowledge and experience to build a portfolio of assets with
sustainability and growth potential, even at much lower commodity prices than we experienced in 2005. We focus on relatively low risk, unconventional natural gas-oriented resource plays, such as our horizontal coal bed methane (“HCBM”) project in Appalachia, our Cotton Valley play in east Texas and north Louisiana and our Selma Chalk project in Mississippi. We are also assessing the potential of organic shale plays in the Appalachian and Illinois Basins and new unconventional plays in the Williston Basin. We also generate and drill exploratory prospects which could make a meaningful difference to our production and reserve profile, primarily in south Texas and south Louisiana.
Our increased oil and gas segment operating income and cash flows in 2005 were the direct result of both our record oil
and natural gas production levels and price realizations. Highlights of our oil and gas segment’s performance in 2005 are as follows:

2
• Oil and gas production in 2005 was 27.4 Bcfe, a Company record. This production increase, which surpassed the previous record of 24.5 Bcfe in 2004 by 12 percent, was primarily due to the continued success of our development projects in Appalachia, east Texas and Mississippi.
• Our estimated proved reserves at the end of 2005 were a Company record 377 Bcfe, up six percent from 354 Bcfe at the end of 2004, and up 14 percent after considering our sale of 27 Bcfe in the first quarter of 2005. Natural gas comprised approximately 93 percent of year-end 2005 proved reserves, and 74 percent of total year-end reserves were attributable to proved developed wells. Net of revisions, we added approximately 77 Bcfe of proved reserves primarily from extensions, discoveries and additions, replacing 281 percent of 2005 production.
• We drilled 178 wells during 2005, including 166 development wells and 12 exploratory wells. All but three of the development wells were successful. Six of the exploratory wells were successful, three were dry holes, and three are under evaluation.
In 2005, we drilled 23 development wells in our HCBM project in West Virginia. All were successful. Net production
from our HCBM wells increased 125 percent, from 2.7 Bcfe in 2004 to approximately 6.1 Bcfe in 2005. We also added approximately 60,000 acres to our CBM-prospective leasehold position in the Appalachian Basin and modified our agreement with CDX Gas, LLC (“CDX”) to obligate CDX to commit three horizontal drilling rigs and associated crews to drill full-time within our area of mutual interest with CDX, which covers most of central Appalachia.
We drilled 28 development wells in our Cotton Valley project in east Texas and north Louisiana. Again, all were
successful. Most of these wells were in the North Carthage field, which is part of our Bethany development drilling joint venture with GMX Resources Inc. (NASDAQ: GMXR). As a direct result of our successful and growing development drilling program in the play, net production in the Cotton Valley project area increased to 2.7 Bcfe in 2005 from 1.1 Bcfe in 2004.
We drilled 85 successful development wells in our Selma Chalk project in Mississippi during 2005. Production in our
Mississippi fields in 2005 was 5.4 Bcfe, compared to 4.9 Bcfe in 2004. This increase was primarily a result of new production in the Baxterville and Maxie fields, offset in part by normal field declines and disruptions due to Hurricane Katrina.
In south Texas and south Louisiana, we drilled five exploratory wells with three successes and four development wells,
three of which were successful, including a successful Lower Frio exploratory well and follow-on development well drilled in our Estill prospect in the Rugeley field in Matagorda County, Texas. The prospect was generated by us, with a 50 percent working interest, and is operated by Brigham Exploration Company (NASDAQ: BEXP). Another successful exploratory well was drilled in the Hackberry formation on our Fannett prospect in Jefferson County, Texas, in which we have a 60 percent working interest.
During 2005, we also began evaluating several new potential development plays. In the Williston Basin, we drilled an
exploratory well as part of our agreement with Bill Barrett Corporation (NYSE: BBG) for a 50 percent working interest in a 20,000 net acre Bakken Dolomite horizontal oil well prospect. We also drilled two 100 percent working interest exploratory wells in the New Albany Shale in the Illinois Basin during the fourth quarter. Reservoir analysis is currently in progress, with completion and testing expected over the remainder of 2006.
Transportation The majority of our natural gas production is transported to market on four major pipeline or transmission systems.
NiSource Inc., Crosstex Energy Services L.P., Gulf South Pipeline Company, LP, and Dominion Transmission, Inc., transported 31 percent, 19 percent, 14 percent and 12 percent of our 2005 natural gas production. The remainder of our natural gas production was transported by several pipeline companies in Texas, Louisiana and West Virginia. In almost all cases, our natural gas is sold at interconnects with transmission pipelines.
We have entered into contracts which provide firm transportation capacity rights for specified volumes per day on a pipeline system for terms ranging from one to 10 years. The contracts require us to pay transportation demand charges regardless of the amount of pipeline capacity we use. We may sell excess capacity to third parties at our discretion.

3
Marketing and Hedging
We generally sell our natural gas using spot market and short-term fixed price physical contracts. For the year ended
December 31, 2005, two customers of the oil and gas segment, Dominion Field Services and Crosstex Gulfcoast Marketing, accounted for approximately 29 percent and 25 percent of our natural gas and oil and condensate revenues of $226.2 million.
From time to time, we enter into commodity derivative contracts or fixed price physical contracts to mitigate the risk associated with the volatility of natural gas and crude oil prices. Recently, we have utilized swaps and costless collars in connection with our hedging activities. Gains and losses from hedging activities are included in revenues when the hedged production is sold. We recognized losses on settled hedging activities of $14.9 million, $5.9 million and $6.1 million in 2005, 2004 and 2003. In 2005, we hedged approximately 42 percent of our natural gas production using costless collars at an average floor price of $ 5.61 per MMbtu and an average ceiling price of $8.10 per MMbtu. We also hedged approximately 31 percent of our crude oil production using a fixed price swap in January 2005 and a costless collar beginning in March 2005 and continuing for the remainder of the year. The swap price was $30.59 per barrel, and the costless collar had a floor price of $42.00 per barrel and a ceiling price of $47.75 per barrel. See Note 11 in the Notes to Consolidated Financial Statements for information about our price risk management positions for future periods. Coal Segment Overview
In our coal segment, PVR owned or controlled approximately 689 million tons of coal as of December 31, 2005. PVR enters into long-term leases with experienced, third-party mine operators providing them the right to mine PVR’s coal reserves in exchange for royalty payments. PVR does not operate any mines. In 2005, PVR’s lessees produced 30.2 million tons of coal from its properties and paid PVR coal royalty revenues of $82.7 million, for an average gross coal royalty per ton of $2.74. Approximately 83 percent of coal royalty revenues in 2005 and 79 percent of coal royalty revenues in 2004 were derived from coal mined on PVR’s properties under leases containing royalty rates based on the higher of a fixed base price or a percentage of the gross sales price. The balance of coal royalty revenues for the respective periods was derived from coal mined on PVR’s properties under leases containing fixed royalty rates which escalate annually. Substantially all of PVR’s leases require the lessee to pay minimum rental payments in monthly or annual installments. PVR actively works with its lessees to develop efficient methods to exploit coal reserves and to maximize production from PVR’s properties. PVR earns revenues from providing fee-based coal preparation and transportation services to PVR’s lessees, which enhance their production levels and generate additional coal royalty revenues, and from industrial third party coal end-users by owning and operating coal handling facilities through PVR’s joint venture with Massey Energy Company (“Massey”). PVR also earns revenues from oil and gas royalty interests, coal transportation (“wheelage”) rights and the sale of standing timber on PVR’s properties.
PVR’s management continues to focus on acquisitions which increase and diversify PVR’s sources of cash flow. PVR
completed four coal reserve acquisitions in 2005, spending approximately $101 million to add approximately 162 million tons of coal reserves, including 94 million tons of coal reserves in the Illinois Basin, a new area for PVR. PVR’s 2005 acquisitions also included oil and natural gas well royalty interests and wheelage rights. For a more detailed discussion of PVR’s acquisitions, see Item 7, “Managements’ Discussion and Analysis of Financial Condition and Results of Operations—Acquisitions and Investments.” Natural Gas Midstream Segment Overview
On March 3, 2005, PVR completed the acquisition of Cantera Gas Resources, LLC (“Cantera”), a midstream gas
gathering and processing company with primary locations in the mid-continent area of Oklahoma and the panhandle of Texas (the “Cantera Acquisition”). As a result of the Cantera Acquisition, PVR owns and operates a significant set of midstream assets that include approximately 3,450 miles of gas gathering pipelines and three natural gas processing facilities, which have 160 million cubic feet per day (MMcfd) of total capacity. PVR’s midstream business derives revenues primarily from gas processing contracts with natural gas producers and from fees charged for gathering natural gas volumes and providing other related services. The Cantera Acquisition also included a natural gas marketing business, which aggregates third-party volumes and sells those volumes into intrastate pipeline systems and at market hubs accessed by various interstate pipelines. PVR believes that the Cantera Acquisition established a platform for future growth in the natural gas midstream sector and diversified its cash flows into another long-lived asset base. Since acquiring this business, PVR has focused on integrating the accounting and commercial systems necessary to prudently operating a natural gas midstream business, and has expanded its natural gas midstream business by adding 27 miles of new gathering lines which connect 92 new wells to PVR’s gathering and processing systems.

4
For the ten months ended December 31, 2005, PVR’s midstream operations generated a gross processing margin of $44.7 million, consisting of midstream revenues minus the cost of gas purchased. Inlet volumes at PVR’s gas processing plants and gathering systems were 38.9 Bcf, or approximately 127 MMcfd, for the same ten-month period, with a gross processing margin of $1.15 per thousand cubic feet (Mcf). Two of PVR’s natural gas midstream customers, BP Canada Energy Marketing Corp. and ConocoPhillips Company, accounted for 12 percent and 11 percent of our consolidated revenues in 2005.
PVR continually seeks new supplies of natural gas to both offset the natural declines in production from the wells currently connected to its systems and to increase throughput volume. New natural gas supplies are obtained for all of PVR’s systems by contracting for production from new wells, connecting new wells drilled on dedicated acreage and by contracting for natural gas that has been released from competitors’ systems.
Business Strategy
Our principal business strategies for the oil and gas segment, the coal segment, the natural gas midstream segment and the Company in general are:
• Oil and gas segment
- Focus on relatively low risk, unconventional natural gas-oriented resource plays, such as the HCBM play in Appalachia, the Cotton Valley play in east Texas and north Louisiana and the Selma Chalk in Mississippi. In addition to our established core areas, we are assessing the potential to establish new sustainable growth in organic shale and other unconventional plays in new areas, such as the Williston and Illinois Basins. We work with established industry partners in several of these core and potential new areas.
- Generate and drill exploratory prospects, primarily in south Texas and south Louisiana, which could result in an increase in our proved reserves and production. These prospects tend to have relatively higher risk profiles and higher returns when successful, and we work with industry partners to better manage costs and risks.
• Coal segment (PVR Coal) - Continue to acquire coal reserves, including in PVR’s Appalachian core area and new areas. For example,
PVR’s 2005 acquisition of 94 million tons of Illinois Basin coal reserves was made because PVR views the Illinois Basin as a growth area, both because of its proximity to power plants and because it expects future environmental regulations will require scrubbing of most coals, including lower sulfur coals from other basins.
- Expand PVR’s coal services and infrastructure business on PVR’s properties and PVR’s joint venture with Massey, which provides coal handling facilities and services to industrial end users.
• Natural gas midstream segment (PVR Midstream) - Expand PVR Midstream, both organically, by adding new natural gas production to PVR’s existing gathering
and processing systems, and through acquisitions of new stand-alone midstream assets or those which can be assimilated into PVR’s existing systems.
- Explore ways for PVR to provide services to our oil and gas exploration and production business. • Company
- Maintain financial discipline and flexibility. The Company and PVR operate with separate, independent capital structures. We intend to continue to be fiscally conservative in both entities and to manage our capital structure for the long term, which means that we will continue to be cautious regarding debt levels and dividend or distribution increases.
Partnership Distributions
Cash Distributions The Partnership paid cash distributions of $2.4825 per common and subordinated unit during the year ended December
31, 2005. In the first quarter of 2006, the Partnership paid a quarterly distribution of $0.70 ($2.80 annualized) per unit with respect to the fourth quarter of 2005. For the remainder of 2006, the Partnership expects to pay quarterly distributions of $0.70 ($2.80 annualized) or more per common and subordinated unit.
We are entitled, through our wholly owned subsidiaries, to receive certain cash distributions payable with respect to the subordinated and common units of PVR held by such subsidiaries, as well as certain cash distributions payable with respect to the two percent general partner interest and the incentive distribution rights held by our general partner subsidiary. We received total distributions from PVR of $21.2 million and $17.3 million in 2005 and 2004, as shown in the following table (in thousands):

5
2005 2004
Limited partner units $ 19,281 $ 16,511General partner interest (2%) 1,021 788Incentive distribution rights 910 —Total $ 21,212 $ 17,299
Incentive Distribution Rights
Our wholly owned subsidiary is the general partner of PVR and, as such, holds certain incentive distribution rights
which represent the right to receive an increasing percentage of quarterly distributions of available cash from operating surplus after the Partnership has paid minimum quarterly distributions and certain target distribution levels have been achieved. The minimum quarterly distribution is $0.50 per unit ($2.00 annualized). Our general partner subsidiary currently holds 100 percent of the incentive distribution rights, but may transfer these rights separately from its general partner interest to an affiliate (other than an individual) or to another entity as part of the merger or consolidation of the general partner with or into such entity or the transfer of all or substantially all of the general partner’s assets to another entity without the prior approval of PVR’s unitholders if the transferee agrees to be bound by the provisions of PVR’s partnership agreement. Prior to September 30, 2011, other transfers of incentive distribution rights will require the affirmative vote of holders of a majority of PVR’s outstanding common units and subordinated units, voting as separate classes. On or after September 30, 2011, the incentive distribution rights will be freely transferable. The incentive distributions rights are payable as follows:
If for any quarter:
• PVR has distributed available cash from operating surplus to its common and subordinated unitholders in an amount equal to the minimum quarterly distribution; and
• PVR has distributed available cash from operating surplus on outstanding common units in an amount necessary to eliminate any cumulative arrearages in payment of the minimum quarterly distribution;
then, PVR will distribute any additional available cash from operating surplus for that quarter among the unitholders and our general partner subsidiary in the following manner:
• First, 98 percent to all unitholders, and two percent to the general partner, until each unitholder has received a total of $0.55 per unit for that quarter;
• Second, 85 percent to all unitholders, and 15 percent to the general partner, until each unitholder has received a total of $0.65 per unit for that quarter;
• Third, 75 percent to all unitholders, and 25 percent to the general partner, until each unitholder has received a total of $0.75 per unit for that quarter; and
• Thereafter, 50 percent to all unitholders and 50 percent to the general partner.
Subordination Period During the subordination period, which we describe below, PVR’s common units have the right to receive distributions
of available cash from operating surplus in an amount equal to the minimum quarterly distribution, plus arrearages in the payment of any minimum quarterly distribution from prior quarters, before any distributions of available cash from operating surplus can be made on the subordinated units. Our wholly owned subsidiaries currently own an aggregate 3,824,940 subordinated units. These subordinated units will convert to common units after the events described below have occurred.
The subordination period began on October 30, 2001, and will continue until the first day of the first quarter beginning after September 30, 2006, on which each of the following events has occurred:
• distributions of available cash from operating surplus on each of the common units and the subordinated units equaled or exceeded the minimum quarterly distribution for each of the three consecutive, non-overlapping four-quarter periods immediately preceding that date;
• the adjusted operating surplus generated during each of the three immediately preceding, non-overlapping four-quarter periods equaled or exceeded the sum of the minimum quarterly distributions on all of the outstanding common units and subordinated units during those periods on a fully diluted basis and the related distribution on the two percent general partner interest during those periods; and
• there are no arrearages in payment of the minimum quarterly distribution on the common units.

6
Competition
Oil and Gas The oil and natural gas industry is very competitive, and we compete with a substantial number of other companies that
are large, well-established and have greater financial and operational resources than we do, which may adversely affect our ability to compete or grow our business. Many such companies not only engage in the acquisition, exploration, development and production of oil and natural gas reserves, but also carry on refining operations, electricity generation and the marketing of refined products. Competition is particularly intense in the acquisition of prospective oil and natural gas properties and oil and gas reserves. Our competitive position depends on our geological, geophysical and engineering expertise, our financial resources, our ability to develop properties and our ability to select, acquire and develop proved reserves. We compete with other oil and natural gas companies in attempting to secure drilling rigs and other equipment necessary for drilling and completion of wells and recruiting and retaining qualified personnel, including geologists, geo-physicists, engineers and other specialists. Such equipment and labor may be in short supply from time to time. Shortages of equipment, labor or materials may result in increased costs or the inability to obtain such resources as needed. We also compete with major and independent oil and gas companies in the marketing and sale of oil and natural gas, and the oil and natural gas industry in general competes with other industries supplying energy and fuel to industrial, commercial and individual consumers.
Coal
The coal industry is intensely competitive primarily as a result of the existence of numerous producers. PVR’s lessees
compete with coal producers in various regions of the United States for domestic sales. The industry has undergone significant consolidation which has led to some of the competitors of PVR’s lessees having significantly larger financial and operating resources than most of PVR’s lessees. PVR’s lessees primarily compete with both large and small producers in Appalachia as well as in the western United States. PVR’s lessees compete on the basis of coal price at the mine, coal quality (including sulfur content), transportation cost from the mine to the customer and the reliability of supply. Continued demand for PVR’s coal and the prices that PVR’s lessees obtain are also affected by demand for electricity, demand for metallurgical coal, access to transportation, environmental and government regulations, technological developments and the availability and price of alternative fuel supplies, including nuclear, natural gas, oil and hydroelectric power. Demand for PVR’s low sulfur coal and the prices PVR’s lessees will be able to obtain for it will also be affected by the price and availability of high sulfur coal, which can be marketed in tandem with emissions allowances which permit the high sulfur coal to meet federal Clean Air Act requirements.
Natural Gas Midstream The ability to offer natural gas producers competitive gathering and processing arrangements and subsequent reliable
service is fundamental to obtaining and keeping gas supplies for PVR’s gathering systems. The primary concerns of the producer are:
• the pressure maintained on the system at the point of receipt; • the relative volumes of gas consumed as fuel and lost; • the gathering/processing fees charged; • the timeliness of well connects; • the customer service orientation of the gatherer/processor; and • the reliability of the field services provided.
PVR experiences competition in all of its midstream markets. PVR’s competitors include major integrated oil
companies, interstate and intrastate pipelines and companies that gather, compress, process, transport and market natural gas. Many of PVR’s competitors have greater financial resources and access to larger natural gas supplies than PVR does.
7
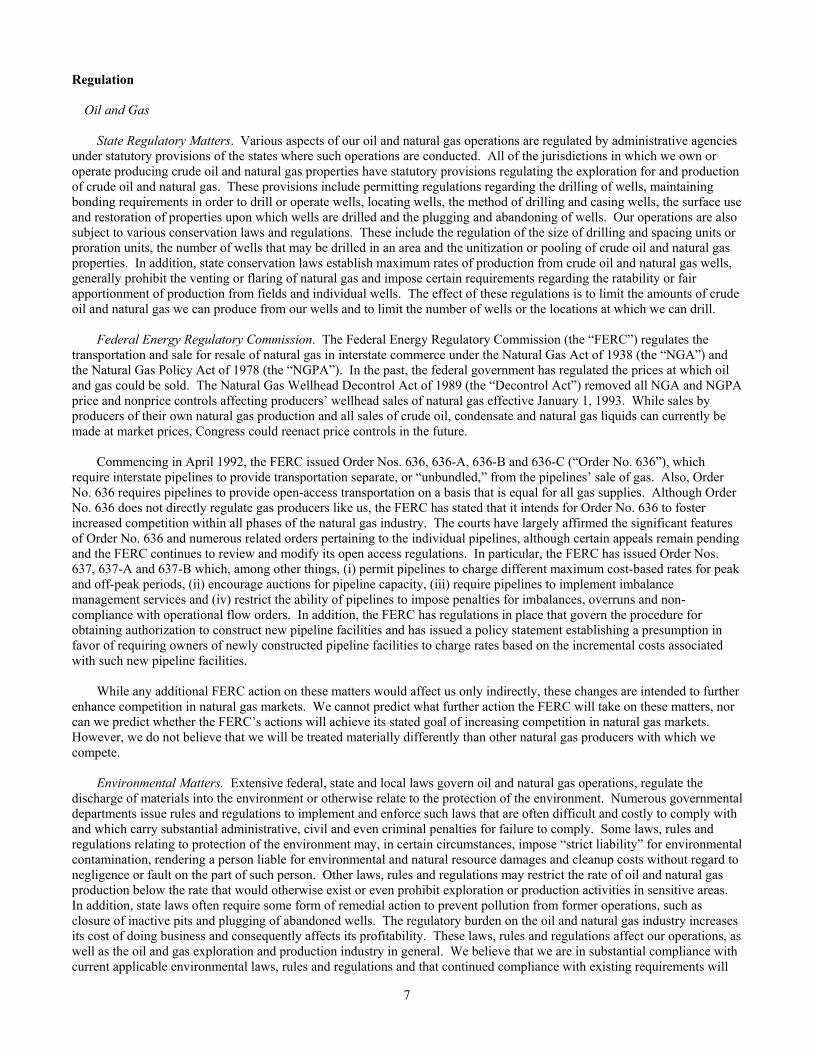
Regulation
Oil and Gas
State Regulatory Matters. Various aspects of our oil and natural gas operations are regulated by administrative agencies under statutory provisions of the states where such operations are conducted. All of the jurisdictions in which we own or operate producing crude oil and natural gas properties have statutory provisions regulating the exploration for and production of crude oil and natural gas. These provisions include permitting regulations regarding the drilling of wells, maintaining bonding requirements in order to drill or operate wells, locating wells, the method of drilling and casing wells, the surface use and restoration of properties upon which wells are drilled and the plugging and abandoning of wells. Our operations are also subject to various conservation laws and regulations. These include the regulation of the size of drilling and spacing units or proration units, the number of wells that may be drilled in an area and the unitization or pooling of crude oil and natural gas properties. In addition, state conservation laws establish maximum rates of production from crude oil and natural gas wells, generally prohibit the venting or flaring of natural gas and impose certain requirements regarding the ratability or fair apportionment of production from fields and individual wells. The effect of these regulations is to limit the amounts of crude oil and natural gas we can produce from our wells and to limit the number of wells or the locations at which we can drill.
Federal Energy Regulatory Commission. The Federal Energy Regulatory Commission (the “FERC”) regulates the transportation and sale for resale of natural gas in interstate commerce under the Natural Gas Act of 1938 (the “NGA”) and the Natural Gas Policy Act of 1978 (the “NGPA”). In the past, the federal government has regulated the prices at which oil and gas could be sold. The Natural Gas Wellhead Decontrol Act of 1989 (the “Decontrol Act”) removed all NGA and NGPA price and nonprice controls affecting producers’ wellhead sales of natural gas effective January 1, 1993. While sales by producers of their own natural gas production and all sales of crude oil, condensate and natural gas liquids can currently be made at market prices, Congress could reenact price controls in the future.
Commencing in April 1992, the FERC issued Order Nos. 636, 636-A, 636-B and 636-C (“Order No. 636”), which require interstate pipelines to provide transportation separate, or “unbundled,” from the pipelines’ sale of gas. Also, Order No. 636 requires pipelines to provide open-access transportation on a basis that is equal for all gas supplies. Although Order No. 636 does not directly regulate gas producers like us, the FERC has stated that it intends for Order No. 636 to foster increased competition within all phases of the natural gas industry. The courts have largely affirmed the significant features of Order No. 636 and numerous related orders pertaining to the individual pipelines, although certain appeals remain pending and the FERC continues to review and modify its open access regulations. In particular, the FERC has issued Order Nos. 637, 637-A and 637-B which, among other things, (i) permit pipelines to charge different maximum cost-based rates for peak and off-peak periods, (ii) encourage auctions for pipeline capacity, (iii) require pipelines to implement imbalance management services and (iv) restrict the ability of pipelines to impose penalties for imbalances, overruns and non-compliance with operational flow orders. In addition, the FERC has regulations in place that govern the procedure for obtaining authorization to construct new pipeline facilities and has issued a policy statement establishing a presumption in favor of requiring owners of newly constructed pipeline facilities to charge rates based on the incremental costs associated with such new pipeline facilities.
While any additional FERC action on these matters would affect us only indirectly, these changes are intended to further enhance competition in natural gas markets. We cannot predict what further action the FERC will take on these matters, nor can we predict whether the FERC’s actions will achieve its stated goal of increasing competition in natural gas markets. However, we do not believe that we will be treated materially differently than other natural gas producers with which we compete.
Environmental Matters. Extensive federal, state and local laws govern oil and natural gas operations, regulate the discharge of materials into the environment or otherwise relate to the protection of the environment. Numerous governmental departments issue rules and regulations to implement and enforce such laws that are often difficult and costly to comply with and which carry substantial administrative, civil and even criminal penalties for failure to comply. Some laws, rules and regulations relating to protection of the environment may, in certain circumstances, impose “strict liability” for environmental contamination, rendering a person liable for environmental and natural resource damages and cleanup costs without regard to negligence or fault on the part of such person. Other laws, rules and regulations may restrict the rate of oil and natural gas production below the rate that would otherwise exist or even prohibit exploration or production activities in sensitive areas. In addition, state laws often require some form of remedial action to prevent pollution from former operations, such as closure of inactive pits and plugging of abandoned wells. The regulatory burden on the oil and natural gas industry increases its cost of doing business and consequently affects its profitability. These laws, rules and regulations affect our operations, as well as the oil and gas exploration and production industry in general. We believe that we are in substantial compliance with current applicable environmental laws, rules and regulations and that continued compliance with existing requirements will

8
not have a material adverse impact on us. Nevertheless, changes in existing environmental laws or the adoption of new environmental laws have the potential to adversely affect our operations.
OSHA. We are subject to the requirements of the Occupational Safety and Health Act (“OSHA”) and comparable state laws that regulate the protection of the health and safety of workers. In addition, the OSHA hazard communication standard requires that information be maintained about hazardous materials used or produced in our operations and that this information be provided to employees, state and local government authorities and citizens
Coal
General Regulation Applicable to Coal Lessees. PVR’s lessees are obligated to conduct mining operations in compliance with all applicable federal, state and local laws and regulations. These laws and regulations include matters involving the discharge of materials into the environment, employee health and safety, mine permits and other licensing requirements, reclamation and restoration of mining properties after mining is completed, management of materials generated by mining operations, surface subsidence from underground mining, water pollution, legislatively mandated benefits for current and retired coal miners, air quality standards, protection of wetlands, plant and wildlife protection, limitations on land use, storage of petroleum products and substances which are regarded as hazardous under applicable laws and management of electrical equipment containing polychlorinated biphenyls (“PCBs”). Because of extensive and comprehensive regulatory requirements, violations during mining operations are not unusual in the industry and, notwithstanding compliance efforts, we do not believe violations by PVR’s lessees can be eliminated completely. However, none of the violations to date, or the monetary penalties assessed, have been material to us, PVR or, to our knowledge, to PVR’s lessees. PVR does not currently expect that future compliance will have a material adverse effect on PVR.
While it is not possible to quantify the costs of compliance by PVR’s lessees with all applicable federal, state and local laws and regulations, those costs have been and are expected to continue to be significant. The lessees post performance bonds pursuant to federal and state mining laws and regulations for the estimated costs of reclamation and mine closing, including the cost of treating mine water discharge when necessary. We do not accrue for such costs because PVR’s lessees are contractually liable for all costs relating to their mining operations, including the costs of reclamation and mine closure. However, PVR does require some smaller lessees to deposit into escrow certain funds for reclamation and mine closure costs or post performance bonds for these costs. Although the lessees typically accrue adequate amounts for these costs, their future operating results would be adversely affected if they later determined these accruals to be insufficient. Compliance with these laws and regulations has substantially increased the cost of coal mining for all domestic coal producers.
In addition, the utility industry, which is the most significant end-user of coal, is subject to extensive regulation regarding the environmental impact of its power generation activities which could affect demand for coal mined by PVR’s lessees. The possibility exists that new legislation or regulations may be adopted which have a significant impact on the mining operations of PVR’s lessees or their customers’ ability to use coal and may require PVR, its lessees or their customers to change operations significantly or incur substantial costs.
Air Emissions. The federal Clean Air Act and corresponding state and local laws and regulations affect all aspects of PVR’s business. The Clean Air Act directly impacts PVR’s lessees’ coal mining and processing operations by imposing permitting requirements and, in some cases, requirements to install certain emissions control equipment, on sources that emit various hazardous and non-hazardous air pollutants. The Clean Air Act also indirectly affects coal mining operations by extensively regulating the air emissions of coal-fired electric power generating plants. There have been a series of recent federal rulemakings that are focused on emissions from coal-fired electric generating facilities. Installation of additional emissions control technology and additional measures required under U.S. Environmental Protection Agency (“EPA”) laws and regulations will make it more costly to operate coal-fired power plants and, depending on the requirements of individual state implementation plans, could make coal a less attractive fuel alternative in the planning and building of power plants in the future. Any reduction in coal’s share of power generating capacity could negatively impact PVR’s lessees’ ability to sell coal, which could have a material effect on PVR’s coal royalty revenues.
The EPA’s Acid Rain Program, provided in Title IV of the Clean Air Act, regulates emissions of sulfur dioxide from electric generating facilities. Sulfur dioxide is a by-product of coal combustion. Affected facilities purchase or are otherwise allocated sulfur dioxide emissions allowances, which must be surrendered annually in an amount equal to a facility’s sulfur dioxide emissions in that year. Affected facilities may sell or trade excess allowances to other facilities that require additional allowances to offset their sulfur dioxide emissions. In addition to purchasing or trading for additional sulfur dioxide allowances, affected power facilities can satisfy the requirements of the EPA’s Acid Rain Program by switching to lower sulfur fuels, installing pollution control devices such as flue gas desulfurization systems, or “scrubbers,” or by reducing electricity generating levels.

9
The EPA has promulgated rules, referred to as the “NOx SIP Call,” that require coal-fired power plants and other large
stationary sources in 21 eastern states and Washington D.C. to make substantial reductions in nitrogen oxide emissions in an effort to reduce the impacts of ozone transport between states. Additionally, in March 2005, the EPA issued the final Clean Air Interstate Rule (“CAIR”), which will permanently cap nitrogen oxide and sulfur dioxide emissions in 28 eastern states and Washington, D.C beginning in 2009 and 2010, respectively. CAIR requires these states to achieve the required emission reductions by requiring power plants to either participate in an EPA-administered “cap-and-trade” program that caps emission in two phases, or by meeting an individual state emissions budget through measures established by the state.
In March 2005, the EPA finalized the Clean Air Mercury Rule (“CAMR”), which establishes a two-part, nationwide cap
on mercury emissions from coal-fired power plants beginning in 2010. While currently the subject of extensive controversy and litigation, if fully implemented, CAMR would permit states to implement their own mercury control regulations or participate in an interstate cap-and-trade program for mercury emission allowances.
The EPA has adopted new, more stringent national air quality standards for ozone and fine particulate matter. As a
result, some states will be required to amend their existing state implementation plans to attain and maintain compliance with the new air quality standards. For example, in December 2004, the EPA designated specific areas in the United States as in “non-attainment” with the new national ambient air quality standard for fine particulate matter. In November 2005, the EPA published proposed rules addressing how states would implement plans to bring applicable non-attainment regions into compliance with the new air quality standard. Under the EPA’s proposed rulemaking, states would have until April 2008 to submit their implementation plans to the EPA for approval. Because coal mining operations and coal-fired electric generating facilities emit particulate matter, PVR’s lessees’ mining operations and their customers could be affected when the new standards are implemented by the applicable states.
In June 2005, the EPA announced final amendments to its regional haze program originally developed in 1999 to
improve visibility in national parks and wilderness areas. As part of the new rules, affected states must develop implementation plans by December 2007 that, among other things, identify facilities that will have to reduce emissions and comply with stricter emission limitations. This program may restrict construction of new coal-fired power plants where emissions are projected to reduce visibility in protected areas. In addition, this program may require certain existing coal-fired power plants to install emissions control equipment to reduce haze-causing emissions such as sulfur dioxide, nitrogen oxide and particulate matter.
The U.S. Department of Justice, on behalf of the EPA, has filed lawsuits against a number of coal-fired electric
generating facilities alleging violations of the new source review provisions of the Clean Air Act. The EPA has alleged that certain modifications have been made to these facilities without first obtaining certain permits issued under the new source review program. Several of these lawsuits have settled, but others remain pending. Depending on the ultimate resolution of these cases, demand for PVR’s coal could be affected, which could have an adverse effect on PVR’s coal royalty revenues.
Carbon Dioxide Emissions. The Kyoto Protocol to the United Nations Framework Convention on Climate Change calls
for developed nations to reduce their emissions of greenhouse gases to five percent below 1990 levels by 2012. Carbon dioxide, which is a major byproduct of the combustion of coal and other fossil fuels, is subject to the Kyoto Protocol. The Kyoto Protocol went into effect on February 16, 2005 for those nations that ratified the treaty.
In 2002, the United States withdrew its support for the Kyoto Protocol. As the Kyoto Protocol becomes effective, there
will likely be increasing international pressure on the United States to adopt mandatory restrictions on carbon dioxide emissions. The United States Congress has considered bills in the past that would regulate domestic carbon dioxide emissions, but such bills have not yet received sufficient Congressional support for passage into law. Several states have also either passed legislation or announced initiatives focused on decreasing or stabilizing carbon dioxide emissions associated with the combustion of fossil fuels, and many of these measures have focused on emissions from coal-fired electric generating facilities. For example, in December 2005, seven northeastern states agreed to implement a regional cap-and-trade program to stabilize carbon dioxide emissions from regional power plants beginning in 2009.
It is possible that future federal and state initiatives to control carbon dioxide emissions could result in increased costs
associated with coal consumption, such as costs to install additional controls to reduce carbon dioxide emissions or costs to purchase emissions reduction credits to comply with future emissions trading programs. Such increased costs for coal consumption could result in some customers switching to alternative sources of fuel, which could negatively impact PVR’s lessees’ coal sales, and thereby have an adverse affect on PVR’s coal royalty revenues.

10
Surface Mining Control and Reclamation Act of 1977. The Surface Mining Control and Reclamation Act of 1977 (“SMCRA”) and similar state statutes impose on mine operators the responsibility of restoring the land to its original state and compensating the landowner for types of damages occurring as a result of mining operations, and require mine operators to post performance bonds to ensure compliance with any reclamation obligations. Regulatory authorities may attempt to assign the liabilities of PVR’s coal lessees to it if any of those lessees are not financially capable of fulfilling those obligations. In conjunction with mining the property, PVR’s coal lessees are contractually obligated under the terms of their leases to comply with all state and local laws, including SMCRA, with obligations including the reclamation and restoration of the mined areas by grading, shaping and reseeding the soil. Upon completion of the mining, reclamation generally is completed by seeding with grasses or planting trees for use as pasture or timberland, as specified in the approved reclamation plan.
Hazardous Materials and Wastes. The Federal Comprehensive Environmental Response, Compensation and Liability
Act (“CERCLA” or the “Superfund” law), and analogous state laws, impose liability, without regard to fault or the legality of the original conduct, on certain classes of persons that are considered to have contributed to the release of a “hazardous substance” into the environment. These persons include the owner or operator of the site where the release occurred and companies that disposed or arranged for the disposal of the hazardous substances found at the site. Persons who are or were responsible for releases of hazardous substances under CERCLA may be subject to joint and several liability for the costs of cleaning up the hazardous substances that have been released into the environment and for damages to natural resources.
Some products used by coal companies in operations generate waste containing hazardous substances. PVR could
become liable under federal and state Superfund and waste management statutes if PVR’s lessees are unable to pay environmental cleanup costs. CERCLA authorizes the EPA and, in some cases, third parties, to take actions in response to threats to the public health or the environment and to seek recovery from the responsible classes of persons the costs they incurred in connection with such response. It is not uncommon for neighboring landowners and other third parties to file claims for personal injury and property damage allegedly caused by hazardous substances or other wastes released into the environment.
Water Discharges. PVR’s coal lessees’ operations can result in discharges of pollutants into waters. The Clean Water
Act and analogous state laws and regulations impose restrictions and strict controls regarding the discharge of pollutants into waters of the United States or state waters. The unpermitted discharge of pollutants such as from spill or leak incidents is prohibited. The Clean Water Act and regulations implemented thereunder also prohibit discharges of fill material and certain other activities in wetlands unless authorized by an appropriately issued permit.
PVR’s lessees’ mining operations are strictly regulated by the Clean Water Act, particularly with respect to the discharge
of overburden and fill material into jurisdictional waters, including wetlands. Recent federal district court decisions in West Virginia, and related litigation filed in federal district court in Kentucky, have created uncertainty regarding the future ability to obtain certain general permits authorizing the construction of valley fills for the disposal of overburden from mining operations. A July 2004 decision by the Southern District of West Virginia in Ohio Valley Environmental Coalition v. Bulen enjoined the Huntington District of the U.S. Army Corps of Engineers from issuing further permits pursuant to Nationwide Permit 21, which is a general permit issued by the U.S. Army Corps of Engineers to streamline the process for obtaining permits under Section 404 of the Clean Water Act. While the decision was vacated by the Fourth Circuit Court of Appeals in November 2005, a similar lawsuit has been filed in federal district court in Kentucky that seeks to enjoin the issuance of permits pursuant to Nationwide Permit 21 by the Louisville District of the U.S. Army Corps of Engineers. In the event similar lawsuits prove to be successful in adjoining jurisdictions, PVR’s lessees may be required to apply for individual discharge permits pursuant to Section 404 of the Clean Water Act in areas where they would have otherwise utilized Nationwide Permit 21. Such a change could result in delays in PVR’s lessees obtaining the required mining permits to conduct their operations, which could in turn have an adverse effect on PVR’s coal royalty revenues.
The Clean Water Act also requires states to develop anti-degradation policies to ensure non-impaired waterbodies in the
state do not fall below applicable water quality standards. These and other regulatory developments may restrict PVR’s lessees’ ability to develop new mines or could require its lessees to modify existing operations, which could have an adverse effect on PVR’s coal business.
The Federal Safe Drinking Water Act (“SDWA”) and its state equivalents affect coal mining operations by imposing
requirements on the underground injection of fine coal slurries, fly ash and flue gas scrubber sludge, and by requiring permits to conduct such underground injection activities. In addition to establishing the underground injection control program, the SDWA also imposes regulatory requirements on owners and operators of “public water systems.” This regulatory program could impact PVR’s lessees’ reclamation operations where subsidence or other mining-related problems require the provision of drinking water to affected adjacent homeowners.

11
Mine Health and Safety Laws. The operations of PVR’s lessees are subject to stringent health and safety standards that
have been imposed by federal legislation since the adoption of the Mine Health and Safety Act of 1969. The Mine Health and Safety Act of 1969 resulted in increased operating costs and reduced productivity. The Mine Safety and Health Act of 1977, which significantly expanded the enforcement of health and safety standards of the Mine Health and Safety Act of 1969, imposes comprehensive health and safety standards on all mining operations. In addition, as part of the Mine Health and Safety Acts of 1969 and 1977, the Black Lung Acts require payments of benefits by all businesses conducting current mining operations to coal miners with black lung or pneumoconiosis and to some beneficiaries of miners who have died from this disease.
Recent mining accidents in West Virginia and Kentucky have received national attention and instigated responses at the
state and national level that are likely to result in increased scrutiny of current safety practices and procedures at all mining operations, particularly underground mining operations. These recent events could also potentially result in the promulgation of more stringent mine safety laws and regulations, or amendments to existing mine safety laws, including increased sanctions for non-compliance. These potential future mine safety laws and regulations, or amendments to existing mine safety laws, and the cost of compliance with such, could adversely affect PVR’s lessees’ coal production, which could have an adverse affect on PVR’s coal royalty revenues.
Mining Permits and Approvals. Numerous governmental permits or approvals are required for mining operations. In connection with obtaining these permits and approvals, PVR’s lessees may be required to prepare and present to federal, state or local authorities data pertaining to the effect or impact that any proposed production of coal may have upon the environment. The requirements imposed by any of these authorities may be costly and time consuming and may delay commencement or continuation of mining operations.
In order to obtain mining permits and approvals from state regulatory authorities, mine operators, including PVR’s lessees, must submit a reclamation plan for restoring, upon the completion of mining operations, the mined property to its prior condition, productive use or other permitted condition. Typically, PVR’s lessees submit the necessary permit applications between 12 and 24 months before they plan to begin mining a new area. In PVR’s experience, permits generally are approved within 12 months after a completed application is submitted. In the past, PVR’s lessees have generally obtained their mining permits without significant delay. PVR’s lessees have obtained or applied for permits to mine a majority of the reserves that are currently planned to be mined over the next five years. PVR’s lessees are also in the planning phase for obtaining permits for the additional reserves planned to be mined over the following five years. However, there are no assurances that they will not experience difficulty in obtaining mining permits in the future. See Item 1, “Business—Regulation—Coal—Water Discharges.”
OSHA. PVR’s lessees and its own business are subject to OSHA. See Item 1, “Business—Regulation—Oil and Gas—
OSHA.”
Natural Gas Midstream
General Regulation. The Partnership’s natural gas gathering facilities generally are exempt from the FERC’s jurisdiction under the NGA, but FERC regulation nevertheless could significantly affect its gathering business and the market for its services. In recent years, the FERC has pursued pro-competitive policies in its regulation of interstate natural gas pipelines into which the Partnership’s gathering pipelines deliver. However, we cannot assure you that the FERC will continue this approach as it considers matters such as pipeline rates and rules and policies that may affect rights of access to natural gas transportation capacity.
In Texas, the Partnership’s gathering facilities are subject to regulation by the Texas Railroad Commission, which has the authority to ensure that rates, terms and conditions of gas utilities, including certain gathering facilities, are just and reasonable and not discriminatory. The Partnership’s operations in Oklahoma are regulated by the Oklahoma Corporation Commission, which prohibits it from charging any unduly discriminatory fees for its gathering services. We cannot predict whether the Partnership’s gathering rates will be found to be unjust, unreasonable or unduly discriminatory.
The Partnership is subject to ratable take and common purchaser statutes in Texas and Oklahoma. Ratable take statutes
generally require gatherers to take, without undue discrimination, natural gas production that may be tendered to the gatherer for handling. Similarly, common purchaser statutes generally require gatherers to purchase without undue discrimination as to source of supply or producer. These statutes have the effect of restricting the Partnership’s right as an owner of gathering facilities to decide with whom it contracts to purchase or transport natural gas. Federal law leaves any economic regulation of natural gas gathering to the states, and Texas and Oklahoma have adopted complaint-based regulation that generally allows

12
natural gas producers and shippers to file complaints with state regulators in an effort to resolve grievances relating to natural gas gathering rates and access. We cannot assure you that federal and state authorities will retain their current regulatory policies in the future.
Texas and Oklahoma administer federal pipeline safety standards under the NGPSA, which requires certain pipelines to
comply with safety standards in constructing and operating the pipelines, and subjects pipelines to regular inspections. In response to recent pipeline accidents, Congress and the U.S. Department of Transportation have recently instituted heightened pipeline safety requirements. Certain of the Partnership’s gathering facilities are exempt from these federal pipeline safety requirements under the rural gathering exemption. We cannot assure you that the rural gathering exemption will be retained in its current form in the future.
Failure to comply with applicable regulations under the NGA, the NGPSA and certain state laws can result in the
imposition of administrative, civil and criminal remedies.
Air Emissions. PVR’s midstream operations are subject to the Clean Air Act and comparable state laws and regulations. See Item 1, “Business—Regulation—Coal—Air Emissions.” These laws and regulations govern emissions of pollutants into the air resulting from the activities of PVR’s processing plants and compressor stations and also impose procedural requirements on how PVR conducts its midstream operations. Such laws and regulations may include requirements that PVR obtain pre-approval for the construction or modification of certain projects or facilities expected to produce air emissions, strictly comply with the emissions and operational limitations of air emissions permits PVR is required to obtain or utilize specific equipment or technologies to control emissions. PVR’s failure to comply with these requirements could subject PVR to monetary penalties, injunctions, conditions or restrictions on operations, and potentially criminal enforcement actions. PVR will be required to incur certain capital expenditures in the future for air pollution control equipment in connection with obtaining and maintaining operating permits and approvals for air emissions.
Hazardous Materials and Wastes. PVR’s midstream operations could incur liability under CERCLA and comparable
state laws resulting from the disposal or other release of hazardous substances or wastes originating from properties PVR owns or operates, regardless of whether such disposal or release occurred during or prior to PVR’s acquisition of such properties. See Item 1, “Business—Regulation—Coal—Hazardous Materials and Waste.” Although petroleum, including natural gas and NGLs are generally excluded from CERCLA’s definition of “hazardous substance,” PVR’s midstream operations do generate wastes in the course of ordinary operations that may fall within the definition of a “hazardous substance.”
PVR’s midstream operations generate wastes, including some hazardous wastes, that are subject to the Resource
Conservation and Recovery Act (“RCRA”) and comparable state laws. However, RCRA currently exempts many natural gas gathering and field processing wastes from classification as hazardous waste. Specifically, RCRA excludes from the definition of hazardous waste produced waters and other wastes associated with the exploration, development or production of crude oil, natural gas or geothermal energy. Unrecovered petroleum product wastes, however, may still be regulated under RCRA as solid waste. Moreover, ordinary industrial wastes such as paint wastes, waste solvents, laboratory wastes and waste compressor oils may be regulated as hazardous waste. The transportation of natural gas and NGLs in pipelines may also generate some hazardous wastes. Although we believe it is unlikely that the RCRA exemption will be repealed in the near future, repeal would increase costs for waste disposal and environmental remediation at PVR’s facilities.
PVR currently owns or leases numerous properties that for many years have been used for the measurement, gathering,
field compression and processing of natural gas and NGLs. Although we believe that the operators of such properties used operating and disposal practices that were standard in the industry at the time, hydrocarbons or wastes may have been disposed of or released on or under such properties or on or under other locations where such wastes have been taken for disposal. These properties and the substances disposed or released on them may be subject to CERCLA, RCRA and analogous state laws. Under such laws, PVR could be required to remove or remediate previously disposed wastes (including waste disposed of or released by prior owners or operators) or property contamination (including groundwater contamination, whether from prior owners or operators or other historic activities or spills) or to perform remedial plugging or pit closure operations to prevent future contamination. PVR has ongoing remediation projects underway at several sites, but it does not believe that the costs associated with such cleanups will have a material adverse impact on PVR’s operations or revenues.
Water Discharges. PVR’s midstream operations are subject to the Clean Water Act. See Item 1, “Business—
Regulation—Coal—Water Discharges.” Any unpermitted release of pollutants, including NGLs or condensates, from PVR’s systems or facilities could result in fines or penalties as well as significant remedial obligations.
OSHA. PVR Midstream’s operations are subject to OSHA. See Item 1, “Business—Regulation—Coal—OSHA.”
13
Employees and Labor Relations
We and our subsidiaries had a total of 229 employees at December 31, 2005, including 111 employees who directly provide services for PVR through its general partner. We consider our current employee relations to be favorable. Available Information
The Company’s Internet address is www.pennvirginia.com. We make available free of charge on or through our Internet website our Corporate Governance Principles, Code of Business Conduct and Ethics, Executive and Financial Officer Code of Ethics and the charters of each of our Audit Committee, Nominating and Governance Committee, Compensation and Benefits Committee and Oil and Gas Committee, and we will provide copies of such documents to any shareholder who so requests. We also make available free of charge on or through our Internet website our Annual Report on Form 10-K, Quarterly Reports on Form 10-Q, Current Reports on Form 8-K and amendments to those reports filed or furnished pursuant to Section 13(a) or 15(d) of the Securities Exchange Act of 1934 (the “Exchange Act”) as soon as reasonably practicable after we electronically file such material with, or furnish it to, the Securities and Exchange Commission (the “SEC”). Executive Officers of the Company
The following table sets forth information concerning our executive officers. Each officer is elected annually by the Board of Directors and serves at the pleasure of the Board of Directors.
Name
Age
Position with the Company
A. James Dearlove 58 President and Chief Executive Officer Keith D. Horton 52 Executive Vice President Ronald K. Page 55 Vice President Frank A. Pici 50 Executive Vice President and Chief Financial Officer Nancy M. Snyder 53 Senior Vice President, General Counsel and Corporate Secretary H. Baird Whitehead 55 Executive Vice President
A. James Dearlove has served in various capacities with the Company since 1977, including as President and Chief Executive Officer since May 1996 and as a director since February 1996, as President and Chief Operating Officer from 1994 to May 1996, as Senior Vice President from 1992 to 1994 and as Vice President from 1986 to 1992. Mr. Dearlove has also served as Chief Executive Officer and Chairman of the Board of Penn Virginia Resource GP, LLC, the general partner of Penn Virginia Resource Partners, L.P. since July 2001 and December 2002. Mr. Dearlove also serves as a director of the National Council of Coal Lessors.
Keith D. Horton has served in various capacities with the Company since 1981, including as Executive Vice President
and director since December 2000, as Vice President—Eastern Operations from February 1999 to December 2000, as Vice President from February 1996 to February 1999, as President of Penn Virginia Coal Company from February 1996 to October 2001, as Vice President of Penn Virginia Coal Company from March 1994 to February 1996, as Vice President of Penn Virginia Resources Corporation from January 1990 to December 1998 and as Manager, Coal Operations of Penn Virginia Resources Corporation from July 1982 to December 1989. Mr. Horton has also served as President and Chief Operating Officer of Penn Virginia Resource GP, LLC since July 2001. Mr. Horton serves as a director of the Virginia Mining Association, the Powell River Project and the Eastern Coal Council.
Ronald K. Page has served in various capacities with the Company since July 2001, including as Vice President since May 2005 and as Vice President, Corporate Development from July 2003 to May 2005. Mr. Page has also served as Vice President, Corporate Development of Penn Virginia Resource GP, LLC since July 2003 and President of PVR Midstream LLC since January 2005. From January 1998 to May 2003, Mr. Page served in various positions with El Paso Field Services Company, including as Vice President of Commercial Operations—Texas Pipelines and Processing, Vice President of Business Development and Director of Business Development. From October 1995 through December 1997, Mr. Page served as Vice President of Business Development of TPC Corporation (formerly Texas Power Corporation). For 17 years prior to 1995, Mr. Page served in various positions at Seagull Energy Corporation, including as Vice President of Operations at Seagull’s Enstar Natural Gas Company, Vice President of Pipelines and Marketing and Manager of Engineering.
Frank A. Pici has served as Executive Vice President and Chief Financial Officer of the Company since September 2001. Mr. Pici has also served as Vice President and Chief Financial Officer and as a director of Penn Virginia Resource GP, LLC since September 2001 and October 2002. From 1996 to 2001, Mr. Pici served as Vice President—Finance and Chief

14
Financial Officer of Mariner Energy, Inc. (“Mariner”), an oil and gas exploration and production company, where he managed all financial aspects of Mariner, including accounting, tax, finance, banking, investor relations, planning and budgeting and information technology. Prior to 1996, Mr. Pici served in various capacities with Cabot Oil & Gas Corporation (“Cabot”), including Corporate Controller from 1994 to 1996, Director, Internal Audit from 1992 to 1994 and Region Accounting Manager from 1989 to 1992. Mr. Pici served as Controller for Doran Associates, Inc., an oil and gas exploration and production company, from 1984 to 1989.
Nancy M. Snyder has served in various capacities with the Company since 1997, including as Senior Vice President since February 2003, as Vice President from December 2000 to February 2003 and as General Counsel and Corporate Secretary since 1997. Ms. Snyder has also served as Vice President and General Counsel and as a director of Penn Virginia Resource GP, LLC since July 2001. From 1993 to 1997, Ms. Snyder was a solo practitioner representing clients generally in connection with mergers and acquisitions and general corporate matters. From 1990 to 1993, Ms. Snyder served as general counsel to Nan Duskin, Inc. and its affiliated companies, which were in the businesses of women’s retail fashion and real estate. From 1983 to 1989, Ms. Snyder was an associate at the law firm of Duane Morris LLP, where she practiced securities, banking and general corporate law.
H. Baird Whitehead has served as Executive Vice President of the Company since January 2001 and as President of
Penn Virginia Oil & Gas Corporation since January 2001. Prior to joining Penn Virginia, Mr. Whitehead served in various positions with Cabot. From 1998 to 2001, Mr. Whitehead served as Senior Vice President during which time he oversaw Cabot’s drilling, production and exploration activity in the Appalachia, Rocky Mountains, Mid-Continent and Texas and Louisiana Gulf Coast areas. From 1992 to 1998, Mr. Whitehead served as Vice President and Regional Manager of Cabot’s Appalachian business unit. From 1989 to 1992, Mr. Whitehead served as Vice President and Regional Manager of Cabot’s Anadarko business unit. From 1987 to 1989, Mr. Whitehead served as Vice President of Engineering for Cabot. From 1972 to 1987, Mr. Whitehead held various engineering and supervisory positions with Texaco, Columbia Gas Transmission and Cabot.
Common Abbreviations and Definitions
The following terms have the meanings indicated below when used in this Annual Report on Form 10-K.
Bbl— a standard barrel of 42 U.S. gallons liquid volume
Bcf— one billion cubic feet
Bcfe— one billion cubic feet equivalent with one barrel of oil or condensate converted to six thousand cubic feet of natural gas based on the estimated relative energy content
CBM— coalbed methane
Developed acreage— lease acreage that is allocated or assignable to producing wells or wells capable of production
Development well— a well drilled within the proved area of an oil or gas reservoir to the depth of a stratigraphic horizon known to be productive
Dry hole— a well found to be incapable of producing either oil or gas in sufficient quantities to justify completion of the well
Exploratory or exploration well— a well drilled to find and produce oil or gas in an unproved area, to find a new reservoir in a field previously found to be productive of oil or gas in another reservoir, or to extend a known reservoir
Gross acre or well— an acre or well in which a working interest is owned
Mbbl— one thousand barrels
Mbf— one thousand board feet
Mcf— one thousand cubic feet
Mcfe— one thousand cubic feet equivalent
MMbbl— one million barrels
MMbf— one million board feet
15
MMbtu— one million British thermal units
MMcf— one million cubic feet
MMcfe— one million cubic feet equivalent
Net acre or well— gross acres or wells multiplied by the owned working interest in those gross acres or wells
NGL— natural gas liquid
NYMEX— New York Mercantile Exchange
Present value of proved reserves— the present value (discounted at 10%) of estimated future cash flows from proved oil and natural gas reserves, as estimated by our independent engineers, reduced by additional estimated future operating expenses, development expenditures and abandonment costs (net of salvage value) associated therewith (before income taxes)
Probable coal reserves— those reserves for which quantity and grade and/or quality are computed from information similar to that used for proven reserves, but the sites for inspection, sampling and measurement are farther apart or are otherwise less adequately spaced. The degree of assurance, although lower than that for proven reserves, is high enough to assume continuity between points of observation
Productive wells— wells that are producing oil or gas or that are capable of production
Proved developed reserves— reserves that can be expected to be recovered through existing wells with existing equipment and operating methods
Proved reserves— those estimated quantities of crude oil, condensate and natural gas that geological and engineering data demonstrate with reasonable certainty to be recoverable in future years from known oil and gas reservoirs under existing economic and operating conditions at the end of the respective years
Proved undeveloped reserves— reserves that are expected to be recovered from new wells on undrilled acreage, or from existing wells where a relatively major expenditure is required for recompletion
Proven coal reserves— those reserves for which: (a) quantity is computed from dimensions revealed in outcrops, trenches, workings or drill holes; grade and/or quality are computed from the results of detailed sampling; and (b) the sites for inspection, sampling and measurement are spaced so closely, and the geologic character is so well defined, that the size, shape, depth and mineral content of reserves are well-established
Standardized measure— present value of proved reserves further reduced by the present value (discounted at 10%) of estimated future income taxes on cash flows using prices in effect at December 31, 2004, and estimated future costs as of December 31, 2004. Prices are held constant throughout the life of the properties except where SEC guidelines permit alternate treatment, including the use of fixed and determinable contractual price escalations.
Undeveloped acreage— lease acreage on which wells have not been drilled or completed to a point that would permit the production of commercial quantities of oil or gas, regardless of whether such acreage contains estimated net proved reserves
Working interest— a cost-bearing interest under an oil and gas lease that gives the holder the right to develop and produce the minerals under the lease

16
Item 1A Risk Factors
Our business and operations are subject to a number of risks and uncertainties as described below. However, the risks and uncertainties described below are not the only ones we face. Additional risks and uncertainties that we are unaware of, or that we may currently deem immaterial, may become important factors that harm our business, financial condition or results of operations. If any of the following risks actually occur, our business, financial condition or results of operations could suffer. Risks Related to our Oil and Gas Business
Competition within our industry may adversely affect our operations.
The oil and natural gas industry is very competitive, and we compete with a substantial number of other companies that are large, well-established and have greater financial and operational resources than we do, which may adversely affect our ability to compete or grow our business. Many such companies not only engage in the acquisition, exploration, development and production of oil and natural gas reserves, but also carry on refining operations, electricity generation and the marketing of refined products. Competition is particularly intense in the acquisition of prospective oil and natural gas properties and oil and gas reserves. Our competitive position depends on our geological, geophysical and engineering expertise, our financial resources, our ability to develop properties and our ability to select, acquire and develop proved reserves. We compete with other oil and natural gas companies in attempting to secure drilling rigs and other equipment necessary for drilling and completion of wells and recruiting and retaining qualified personnel, including geologists, geo-physicists, engineers and other specialists. Such equipment and labor may be in short supply from time to time. Shortages of equipment, labor or materials may result in increased costs or the inability to obtain such resources as needed. We also compete with major and independent oil and gas companies in the marketing and sale of oil and natural gas, and the oil and natural gas industry in general competes with other industries supplying energy and fuel to industrial, commercial and individual consumers.
Natural gas and crude oil prices are volatile, and a substantial or extended decline in prices would hurt our profitability and financial condition.
Our revenues, operating results, cash flow, profitability, future rate of growth and the carrying value of our oil and gas
properties depend heavily on prevailing market prices for natural gas and crude oil. Historically, natural gas and crude oil prices have been volatile, and they are likely to continue to be volatile. Wide fluctuations in natural gas and crude oil prices may result from relatively minor changes in the supply of and demand for oil and gas, market uncertainty and other factors that are beyond our control, including:
• domestic and foreign supplies of oil and natural gas; • political and economic conditions in oil or gas producing regions; • overall domestic and foreign economic conditions; • prices and availability of alternative fuels; • the availability of transportation facilities; • weather conditions; and • domestic and foreign governmental regulation.
Some of our projections and estimates are based on assumptions as to the future prices of natural gas and crude oil.
These price assumptions are used for planning purposes. We expect our assumptions will change over time and that actual prices in the future will likely differ from our estimates. Any substantial or extended decline in the actual prices of natural gas or crude oil would have a material adverse effect on our financial position and results of operations (including reduced cash flow and borrowing capacity), the quantities of natural gas and crude oil reserves that we can economically produce, the quantity of estimated proved reserves that may be attributed to our properties and our ability to fund our capital program.
Our future performance depends on our ability to find or acquire additional oil and gas reserves that are economically recoverable.
Unless we successfully replace the reserves that we produce, our reserves will decline, eventually resulting in a decrease
in oil and gas production and lower revenues and cash flows from operations. We have historically succeeded in substantially replacing reserves through acquisitions, exploration and development. We have conducted such activities on our existing oil and gas properties as well as on newly acquired properties. We may not be able to continue to replace reserves from such activities at acceptable costs. Lower oil and gas prices may further limit the types of reserves that can be developed at acceptable costs. Lower prices also decrease our cash flows and may cause us to reduce capital expenditures.

17
The business of exploring for, developing or acquiring reserves is capital intensive. We may not be able to make the necessary capital investments to maintain or expand our oil and gas reserves if cash flows from operations are reduced and external sources of capital become limited or unavailable. In addition, exploration and development activities involve numerous risks that may result in dry holes, the failure to produce oil and gas in commercial quantities and the inability to fully produce discovered reserves.
We are continually identifying and evaluating acquisition opportunities, including acquisitions that would be significantly larger than those we have consummated to date. However, competition for producing oil and gas properties is intense and many of our competitors have financial and other resources substantially greater than those available to us. We cannot ensure that we will successfully consummate any acquisition, that we will be able to acquire producing oil and gas properties that contain economically recoverable reserves or that any acquisition will be profitably integrated into our operations.
We may not be able to fund our planned capital expenditures.
We make, and will continue to make, substantial capital expenditures to find, acquire, develop, exploit and produce oil and natural gas reserves. Our capital expenditures for oil and gas properties were $170 million for 2005, and we have budgeted total capital expenditures of $208 million in 2006. If oil and gas prices decrease or we encounter operating difficulties that result in our cash flow from operations being less than expected, we may have to reduce the capital we can spend unless we raise additional funds through debt or equity financing. Debt or equity financing, cash generated by operations or borrowing capacity may not be available to us in sufficient amounts or on acceptable terms to meet these requirements.
Future cash flows and the availability of financing will be subject to a number of variables, such as:
• our success in locating and producing new reserves; • the level of production from existing wells; and • prices of oil and natural gas. Issuing equity securities to satisfy our financing requirements could cause substantial dilution to existing shareholders.
Debt financing could lead to us being more vulnerable to competitive pressures and economic downturns. If our revenues were to decrease due to lower oil and natural gas prices, decreased production or other reasons, and if we
could not obtain capital through our credit facility or otherwise, our ability to execute our development plans, replace our reserves or maintain production levels could be greatly limited.
Exploration and development drilling may not result in commercially productive reserves.
Oil and gas drilling and production activities are subject to numerous risks, including the risk that no commercially
productive natural gas or oil reserves will be found. The costs of drilling, completing and operating wells are often uncertain, and drilling operations may be curtailed, delayed or canceled as a result of a variety of factors, many of which are beyond our control. These factors include:
• unexpected drilling conditions; • pressure or irregularities in formations; • equipment failures or accidents; • shortages or delays in the availability of drilling rigs and the delivery of equipment; • shortages in experienced labor; • failure to secure necessary regulatory approvals and permits; • fires, explosions, blow-outs and surface cratering; and • adverse weather conditions.
The prevailing prices of oil and gas also affect the cost of and the demand for drilling rigs, production equipment and
related services. The availability of drilling rigs can vary significantly from region to region at any particular time. Although land drilling rigs can be moved from one region to another in response to changes in levels of demand, an undersupply of rigs in any region may result in drilling delays and higher drilling costs for the rigs that are available in that region.
Another significant risk inherent in our drilling plans is the need to obtain drilling permits from state, local and other
governmental authorities. Delays in obtaining regulatory approvals and drilling permits, including delays which jeopardize
18
our ability to realize the potential benefits from leased properties within the applicable lease periods, the failure to obtain a drilling permit for a well or the receipt of a permit with unreasonable conditions or costs could have a material adverse effect on our ability to explore on or develop our properties.
The wells we drill may not be productive and we may not recover all or any portion of our investment in such wells. The seismic data and other technologies we use do not allow us to know conclusively prior to drilling a well that natural gas or oil is present or may be produced economically. The cost of drilling, completing and operating a well is often uncertain, and cost factors can adversely affect the economics of a project. Drilling activities can result in dry wells or wells that are productive but do not produce sufficient net revenues after operating and other costs to cover initial drilling costs.
Our future drilling activities may not be successful, nor can we be sure that our overall drilling success rate or our
drilling success rate for activity within a particular area will not decline. Unsuccessful drilling activities could have a material adverse effect on our results of operations and financial condition. Also, we may not be able to obtain any options or lease rights in potential drilling locations that we identify. Although we have identified numerous potential drilling locations, we may not be able to economically produce oil or natural gas from all of them.
Our business involves many operating risks that may result in substantial losses for which insurance may be unavailable or inadequate.
Our operations are subject to all of the risks and hazards typically associated with the exploitation, development and
exploration for, and the production and transportation of oil and natural gas. These operating risks include:
• fires, explosions, blowouts, cratering and casing collapses; • formations with abnormal pressures; • pipeline ruptures or spills; • uncontrollable flows of oil, natural gas or well fluids; • environmental hazards such as natural gas leaks, oil spills and discharges of toxic gases; and • natural disasters.
Any of these risks could result in substantial losses resulting from injury or loss of life, damage to or destruction of
property, natural resources and equipment, pollution and other environmental damages, clean-up responsibilities, regulatory investigations and penalties and suspension of operations. In addition, under certain circumstances, we may be liable for environmental damage caused by previous owners or operators of properties that we own, lease or operate. As a result, we may incur substantial liabilities to third parties or governmental entities, which could reduce or eliminate funds available for exploration, development or acquisitions or cause us to incur losses.
In accordance with industry practice, we maintain insurance against some, but not all, of the risks described above. We cannot assure you that our insurance will be adequate to cover losses or liabilities. Also, we cannot predict the continued availability of insurance at premium levels that justify its purchase. No assurance can be given that we will be able to maintain insurance in the future at rates we consider reasonable. The occurrence of a significant event, not fully insured or indemnified against, could have a material adverse affect on our financial condition and operations.
Our business depends on transportation facilities owned by others.
We deliver substantially all of our oil and natural gas production through pipelines that we do not own. The marketability of our production depends upon the availability, proximity and capacity of these pipelines as well as gathering systems and processing facilities. The unavailability of or lack of available capacity on these systems and facilities could result in the shut-in of producing wells or the delay or discontinuance of development plans for properties. Federal, state and local regulation of oil and natural gas production and transportation, tax and energy policies, changes in supply and demand, pipeline pressures, damage to or destruction of pipelines and general economic conditions could adversely affect our ability to produce, gather and market our oil and natural gas.
Competition for experienced, technical personnel may negatively impact our operations.
Our exploratory and development drilling success will depend, in part, on our ability to attract and retain experienced professional personnel. The loss of any key executives or other key personnel could have a material adverse effect on our operations. Our future profitability will depend, at least in part, on our ability to attract and retain qualified personnel, particularly individuals with a strong background in geology, geophysics, engineering and operations.
19
Estimates of oil and natural gas reserves are not precise.
This Form 10-K contains estimates of our proved oil and gas reserves and the estimated future net cash flows from such reserves. These estimates are based upon various assumptions, including assumptions required by the SEC relating to oil and natural gas prices, drilling and operating expenses, capital expenditures, taxes and availability of funds. The process of estimating oil and natural gas reserves is complex. This process requires significant decisions and assumptions in the evaluation of available geological, geophysical, engineering and economic data for each reservoir. These estimates are dependent on many variables and, therefore, changes often occur as these variables evolve and commodity prices fluctuate.
Actual future production, oil and gas prices, revenues, taxes, development expenditures, operating expenses and
quantities of recoverable oil and gas reserves will most likely vary from those estimated. Any significant variance could materially affect the estimated quantities and present value of reserves disclosed by us. In addition, we may adjust estimates of proved reserves to reflect production history, results of exploration and development, prevailing oil and gas prices and other factors, many of which are beyond our control.
At December 31, 2005, approximately 26 percent of our estimated proved reserves were proved undeveloped.
Estimation of proved undeveloped reserves and proved developed non-producing reserves is based on volumetric calculations and adjacent reserve performance data. Recovery of proved undeveloped reserves requires significant capital expenditures and successful drilling operations. Production revenues from proved developed non-producing reserves will not be realized until some time in the future. The reserve data assumes that we will make significant capital expenditures to develop our reserves. Although we have prepared estimates of our reserves and the costs associated with these reserves in accordance with industry standards, these estimated costs may not be accurate, development may not occur as scheduled and actual results may not occur as estimated.
You should not assume that the present value of estimated future net cash flow referred to herein is the current fair value
of our estimated oil and gas reserves. In accordance with SEC requirements, we base the estimated discounted future net cash flows from our proved reserves on prices and costs on the date of the estimate. Actual current and future prices and costs may be materially higher or lower than the prices and costs as of the date of the estimate. As a result, net present value estimates using actual prices and costs may be significantly less than the SEC estimate that is provided herein. In addition, the 10 percent discount factor, which is required by the SEC to be used in calculating discounted future net cash flows for reporting purposes, is not necessarily the most accurate discount factor for us.
We have limited control over the activities on properties we do not operate.
Other companies operate a portion of our net production. In 2005, other companies operated approximately 30 percent of our net production. Our success in properties operated by others will depend upon a number of factors outside of our control, including timing and amount of capital expenditures, the operator’s expertise and financial resources, approval of other participants in drilling wells, selection of technology and maintenance of safety and environmental standards. We have limited ability to influence or control the operation or future development of these non-operated properties or the amount of capital expenditures that we are required to fund for their operation. Our dependence on the operator and other working interest owners for these projects and our limited ability to influence or control the operation and future development of these properties could have a material adverse effect on the realization of our targeted returns or lead to unexpected future costs.
Our producing property acquisitions carry significant risks.
Acquisition of producing oil and gas properties is a key element of maintaining and growing reserves and production. Competition for these assets has been and will continue to be intense. The success of any acquisition will depend on a number of factors, many of which are beyond our control. These factors include the purchase price, future oil and gas prices, the ability to reasonably estimate or assess the recoverable volumes of reserves, rates of future production and future net revenues attainable from reserves, future operating and capital costs, results of future exploration, exploitation and development activities on the acquired properties and future abandonment and possible future environmental or other liabilities. There are numerous uncertainties inherent in estimating quantities of proved oil and gas reserves, actual future production rates and associated costs and potential liabilities with respect to prospective acquisition targets. Actual results may vary substantially from those assumed in the estimates. A customary review of subject properties will not necessarily reveal all existing or potential problems.
Additionally, significant acquisitions can change the nature of our operations and business depending upon the character
of the acquired properties if they have substantially different operating and geological characteristics or are in different

20
geographic locations than our existing properties. To the extent that acquired properties are substantially different than our existing properties, our ability to efficiently realize the expected economic benefits of such transactions may be limited.
Integrating acquired businesses and properties involves a number of special risks. These risks include the possibility that
management may be distracted from regular business concerns by the need to integrate operations and systems and that unforeseen difficulties can arise in integrating operations and systems and in retaining and assimilating employees. Any of these or other similar risks could lead to potential adverse short-term or long-term effects on our operating results, and may cause us to not be able to realize any or all of the anticipated benefits of the acquisitions.
Responses to recent coal mining accidents could have an adverse effect on our operations.
Our conventional and CBM drilling operations in Appalachia take place in close proximity to coal mining operations. Recent coal mining disasters in West Virginia and Kentucky have received state and national attention that is resulting in increased scrutiny of current safety practices and procedures at and around coal mining operations. This scrutiny could result in the promulgation of more stringent regulations for the permitting of oil and gas wells in close proximity to coal mining operations, which could make it more difficult, time consuming and costly for us to obtain such permits and could adversely affect our natural gas production and reduce our oil and natural gas revenues.
Hedging transactions may limit our potential gains and involve other risks.
In order to manage our exposure to price risks in the marketing of our oil and natural gas, we periodically enter into oil
and gas price hedging arrangements with respect to a portion of our expected production. Our hedges are limited in duration, usually for periods of two years or less. While intended to reduce the effects of volatile oil and natural gas prices, such transactions may limit our potential gains if oil or natural gas prices were to rise over the price established by the hedging arrangements. In trying to maintain an appropriate balance, we may end up hedging too much or too little, depending upon how oil or natural gas prices fluctuate in the future. We cannot assure you that our hedging transactions will reduce the risk or minimize the effect of any decline in oil or natural gas prices.
In addition, hedging transactions may expose us to the risk of financial loss in certain circumstances, including instances
in which:
• our production is less than expected; • there is a widening of price basis differentials between delivery points for our production and the delivery point
assumed in the hedge arrangement; • the counterparties to our futures contracts fail to perform under the contracts; or • a sudden, unexpected event materially impacts oil or natural gas prices.
We account for our derivative transactions pursuant to Statement of Financial Accounting Standards (“SFAS”) No. 133,
Accounting for Derivative Instruments and Hedging Activities, which requires us to record each hedging transaction as an asset or liability measured at its fair value. We must also measure the effectiveness of our hedging position in relation to the underlying commodity being hedged, and we will be required to record the ineffective portion of the hedge in our net income for that period. This accounting treatment could result in significant fluctuations in net income and shareholders’ equity from period to period.
In addition, hedging transactions using derivative instruments involve basis risk. Basis risk in a hedging contract occurs
when the index upon which the contract is based is more or less variable than the index upon which the hedged asset is based, thereby making the hedge less effective. For example, a NYMEX index used for hedging certain volumes of production may have more or less variability than the regional price index used for the sale of that production.
We are subject to complex laws and regulations that can adversely affect the cost, manner or feasibility of doing business.
Exploration, development, production and sale of oil and gas are subject to extensive federal, state and local laws and regulations, including complex environmental laws. Future laws or regulations, any adverse changes in the interpretation of existing laws and regulations, inability to obtain necessary regulatory approvals or a failure to comply with existing legal requirements may harm our business, results of operations and financial condition. We may be required to make large expenditures to comply with environmental and other governmental regulations. Failure to comply with these laws and regulations may result in the suspension or termination of operations and subject us to administrative, civil and criminal penalties. Matters subject to regulation include discharge permits for drilling operations, drilling bonds, spacing of wells, unitization and pooling of properties, environmental protection and taxation. Our operations create the risk of environmental

21
liabilities to the government or third parties for any unlawful discharge of oil, gas or other pollutants into the air, soil or water. In the event of environmental violations, we may be charged with remedial costs. Laws and regulations protecting the environment have become more stringent in recent years, and may, in some circumstances, result in liability for environmental damage regardless of negligence or fault. In addition, pollution and similar environmental risks generally are not fully insurable. These liabilities and costs could have a material adverse effect on our financial condition and results of operations. See Item 1, “Business—Regulation—Oil and Gas—Environmental Matters.” Risks Related to our Ownership in PVR
We rely upon distributions from the Partnership, and the amount of cash that the Partnership will be able to distribute to its unitholders principally depends upon the amount of cash it can generate from its coal and natural gas midstream businesses.
We received $21.2 million of distributions from the Partnership in 2005. A significant decline in the Partnership’s
earnings or cash distributions would have a negative impact on us. The amount of cash that the Partnership will be able to distribute each quarter to its unitholders, including us, principally depends upon the amount of cash it can generate from its coal and midstream businesses. The amount of cash that the Partnership will generate will fluctuate from quarter to quarter based on, among other things:
• the amount of coal its lessees are able to produce; • the price at which its lessees are able to sell the coal; • the lessees’ timely receipt of payment from their customers; • the amount of natural gas transported in its gathering systems; • the amount of throughput in its processing plants; • the price of natural gas; • the price of NGLs; • the relationship between natural gas and NGL prices; • the fees it charges and the margins it realizes for its midstream services; and • its hedging activities.
In addition, the actual amount of cash that the Partnership will have available for distribution will depend on other
factors, some of which are beyond its control, including:
• the level of capital expenditures it makes; • the cost of acquisitions, if any; • its debt service requirements; • fluctuations in its working capital needs; • restrictions on distributions contained in its debt agreements; • prevailing economic conditions; and • the amount of cash reserves established by its general partner in its sole discretion for the proper conduct of its
business.
Because of these factors, the Partnership may not have sufficient available cash each quarter to pay its current declared quarterly distribution of $0.70 per unit or any other amount. You should also be aware that the amount of cash that the Partnership will have available for distribution depends primarily upon its cash flow, including cash flow from financial reserves and working capital borrowings, and is not solely a function of profitability, which will be affected by non-cash items. As a result, the Partnership may make cash distributions during periods when it records losses and may not make cash distributions during periods when it records profits.
Risks Related to PVR’s Coal Business
If the Partnership’s lessees do not manage their operations well, their production volumes and the Partnership’s coal royalty revenues could decrease.
The Partnership depends on its lessees to effectively manage their operations on its properties. The Partnership’s lessees
make their own business decisions with respect to their operations, including decisions relating to:
• the method of mining; • credit review of their customers;
22
• marketing of the coal mined; • coal transportation arrangements; • negotiations with unions; • employee wages; • permitting; • surety bonding; and • mine closure and reclamation.
If the Partnership’s lessees do not manage their operations well, their production could be reduced, which would result in
lower coal royalty revenues to the Partnership and could adversely affect its ability to make its quarterly distributions.
Coal mining operations are subject to numerous operational risks that could result in lower coal royalty revenues.
The Partnership’s coal royalty revenues are largely dependent on the level of production from its coal reserves achieved by its lessees. The level of its lessees’ production is subject to operating conditions or events beyond their or its control, including:
• the inability to acquire necessary permits; • changes or variations in geologic conditions, such as the thickness of the coal deposits and the amount of rock
embedded in or overlying the coal deposit; • changes in governmental regulation of the coal industry; • mining and processing equipment failures and unexpected maintenance problems; • adverse claims to title or existing defects of title; • interruptions due to power outages; • adverse weather and natural disasters, such as heavy rains and flooding; • labor-related interruptions; • employee injuries or fatalities; and • fires and explosions.
These conditions may increase the Partnership’s lessees’ cost of mining and delay or halt production at particular mines
for varying lengths of time. Any interruptions to the production of coal from the Partnership’s reserves could reduce its coal royalty revenues and adversely affect its ability to make its quarterly distributions.
In addition, the Partnership’s coal royalty revenues are based upon sales of coal by its lessees to their customers. If its lessees do not receive payments for delivered coal on a timely basis from their customers, their cash flow would be adversely affected, which could cause the Partnership’s cash flow to be adversely affected and could adversely affect the Partnership’s ability to make its quarterly distributions.
A substantial or extended decline in coal prices could reduce the Partnership’s coal royalty revenues and the value of its coal reserves.
A substantial or extended decline in coal prices from recent levels could have a material adverse effect on the
Partnership’s lessees’ operations and on the quantities of coal that may be economically produced from the Partnership’s properties. This, in turn, could reduce the Partnership’s coal royalty revenues, its coal services revenues and the value of its coal reserves. Additionally, volatility in coal prices could make it difficult to estimate with precision the value of the Partnership’s coal reserves and any coal reserves that the Partnership may consider for acquisition.
The Partnership depends on a limited number of primary operators for a significant portion of its coal royalty revenues and the loss of or reduction in production from any of its major lessees could reduce its coal royalty revenues.
The Partnership depends on a limited number of primary operators for a significant portion of its coal royalty revenues.
During 2005, five primary operators, each with multiple leases, accounted for 78 percent of its coal royalty revenues. If any of these operators enters bankruptcy or decide to cease operations or significantly reduce its production, the Partnership’s coal royalty revenues could be reduced.
A failure on the part of the Partnership’s lessees to make coal royalty payments could give the Partnership the right to terminate the lease, repossess the property or obtain liquidation damages and/or enforce payment obligations under the lease. If the Partnership repossessed any of its properties, it would seek to find a replacement lessee. It may not be able to find a replacement lessee and, if it finds a replacement lessee, it may not be able to enter into a new lease on favorable terms within
23
a reasonable period of time. In addition, the outgoing lessee could be subject to bankruptcy proceedings that could further delay the execution of a new lease or the assignment of the existing lease to another operator. If the Partnership enters into a new lease, the replacement operator might not achieve the same levels of production or sell coal at the same price as the lessee it replaced. In addition, it may be difficult for the Partnership to secure new or replacement lessees for small or isolated coal reserves, since industry trends toward consolidation favor larger-scale, higher technology mining operations to increase productivity rates.
The Partnership’s coal business will be adversely affected if it is unable to replace or increase its reserves through acquisitions.
Because its reserves decline as its lessees mine its coal, the Partnership’s future success and growth depends, in part,
upon its ability to acquire additional coal reserves that are economically recoverable. If the Partnership is unable to negotiate purchase contracts to replace or increase its coal reserves on acceptable terms, its coal royalty revenues will decline as its coal reserves are depleted. In addition, if the Partnership is unable to successfully integrate the companies, businesses or properties it is able to acquire, its coal royalty revenues may decline and the Partnership could, therefore, experience a material adverse effect on its business, financial condition or results of operations. If the Partnership acquires additional coal reserves, there is a possibility that any acquisition could be dilutive to earnings and reduce its ability to make distributions to unitholders, including us, or to pay interest on, or the principal of, its debt obligations. Any debt the Partnership incurs to finance an acquisition may similarly affect its ability to make distributions to unitholders, including us, or to pay interest on, or the principal of, its debt obligations. The Partnership’s ability to make acquisitions in the future also could be limited by restrictions under its existing or future debt agreements, competition from other coal companies for attractive properties or the lack of suitable acquisition candidates.
Lessees could satisfy obligations to their customers with coal from properties other than the Partnership’s, depriving it of the ability to receive amounts in excess of the minimum royalty payments.
The Partnership does not control its lessees’ business operations. Its lessees’ customer supply contracts do not generally
require its lessees to satisfy their obligations to their customers with coal mined from the Partnership’s reserves. Several factors may influence a lessee’s decision to supply its customers with coal mined from properties the Partnership does not own or lease, including the royalty rates under the lessee’s lease with the Partnership, mining conditions, transportation costs and availability and customer coal specifications. If a lessee satisfies its obligations to its customers with coal from properties the Partnership does not own or lease, production under its lease will decrease, and it will receive lower coal royalty revenues.
Competition within the coal industry may adversely affect the ability of the Partnership’s lessees to sell coal at high prices, which could reduce its coal royalty revenues.
The coal industry is intensely competitive primarily as a result of the existence of numerous producers. The
Partnership’s lessees compete with coal producers in various regions of the United States for domestic sales. The industry has undergone significant consolidation which has led to some of the competitors of the Partnership’s lessees having significantly larger financial and operating resources than most of its lessees. The Partnership’s lessees compete on the basis of coal price at the mine, coal quality (including sulfur content), transportation cost from the mine to the customer and the reliability of supply. Continued demand for the Partnership’s coal and the prices that its lessees obtain are also affected by demand for electricity, demand for metallurgical coal, access to transportation, environmental and government regulations, technological developments and the availability and price of alternative fuel supplies, including nuclear, natural gas, oil and hydroelectric power. Demand for the Partnership’s low sulfur coal and the prices its lessees will be able to obtain for it will also be affected by the price and availability of high sulfur coal, which can be marketed in tandem with emissions allowances which permit the high sulfur coal to meet federal Clean Air Act requirements. Competition among coal producers could result in excess production capacity in the industry, resulting in downward pressure on prices. Declining prices reduce the Partnership’s coal royalty revenues and adversely affect its ability to make distributions to unitholders, including us, and to service its debt obligations.
Fluctuations in transportation costs and the availability or reliability of transportation could reduce the production of coal mined from the Partnership’s properties.
Transportation costs represent a significant portion of the total cost of coal for the customers of the Partnership’s lessees.
Increases in transportation costs could make coal a less competitive source of energy or could make coal produced by some or all of the Partnership’s lessees less competitive than coal produced from other sources. On the other hand, significant
24
decreases in transportation costs could result in increased competition for the Partnership’s lessees from coal producers in other parts of the country.
The Partnership’s lessees depend upon rail, barge, trucking, overland conveyor and other systems to deliver coal to their
customers. Disruption of these transportation services due to weather-related problems, strikes, lockouts, bottlenecks and other events could temporarily impair the ability of the Partnership’s lessees to supply coal to their customers. The Partnership’s lessees’ transportation providers may face difficulties in the future and impair the ability of its lessees to supply coal to their customers, thereby resulting in decreased coal royalty revenues to the Partnership.
The Partnership’s lessees could experience labor disruptions, and its lessees’ workforces could become increasingly unionized in the future.
Two of the Partnership’s lessees each have one mine operated by unionized employees. One of these mines was the
Partnership’s second largest mine on the basis of coal reserves as of December 31, 2005. All of the Partnership’s lessees could become increasingly unionized in the future. If some or all of the Partnership’s lessees’ non-unionized operations were to become unionized, it could adversely affect their productivity and increase the risk of work stoppages. In addition, the Partnership’s lessees’ operations may be adversely affected by work stoppages at unionized companies, particularly if union workers were to orchestrate boycotts against its lessees’ operations. Any further unionization of the Partnership’s lessees’ employees could adversely affect the stability of production from its reserves and reduce its coal royalty revenues.
The Partnership’s reserve estimates depend on many assumptions that may be inaccurate, which could materially adversely affect the quantities and value of its reserves.
The Partnership’s estimates of its reserves may vary substantially from the actual amounts of coal its lessees may be able
to economically recover. There are numerous uncertainties inherent in estimating quantities of reserves, including many factors beyond the Partnership’s control. Estimates of coal reserves necessarily depend upon a number of variables and assumptions, any one of which may, if incorrect, result in an estimate that varies considerably from actual results. These factors and assumptions relate to:
geological and mining conditions, which may not be fully identified by available exploration data or which differ from the Partnership’s experiences in areas where its lessees currently mine;
the amount of ultimately recoverable coal in the ground; the effects of regulation by governmental agencies; and future coal prices, operating costs, capital expenditures, severance and excise taxes and development and
reclamation costs.
Actual production, revenues and expenditures with respect to the Partnership’s reserves will likely vary from estimates, and these variations may be material. As a result, you should not place undue reliance on the coal reserve data provided herein.
Any change in fuel consumption patterns by electric power generators away from the use of coal could affect the ability of the Partnership’s lessees to sell the coal they produce and thereby reduce its coal royalty revenues.
According to the U.S. Department of Energy, domestic electric power generation accounts for approximately 90 percent
of domestic coal consumption. The amount of coal consumed for domestic electric power generation is affected primarily by the overall demand for electricity, the price and availability of competing fuels for power plants such as nuclear, natural gas, fuel oil and hydroelectric power and environmental and other governmental regulations. The Partnership believes that most new power plants will be built to produce electricity during peak periods of demand. Many of these new power plants will likely be fired by natural gas because of lower construction costs compared to coal-fired plants and because natural gas is a cleaner burning fuel. The increasingly stringent requirements of the Clean Air Act may result in more electric power generators shifting from coal to natural gas-fired power plants. See Item 1, “Business—Regulation—Coal—Air Emissions.”
Extensive environmental laws and regulations affecting electric power generators could have corresponding effects on the ability of the Partnership’s lessees to sell the coal they produce and thereby reduce its coal royalty revenues.
Federal, state and local laws and regulations extensively regulate the amount of sulfur dioxide, particulate matter,
nitrogen oxides, mercury and other compounds emitted into the air from electric power plants, which are the ultimate consumers of the coal the Partnership’s lessees produce. These laws and regulations can require significant emission control expenditures for many coal-fired power plants, and various new and proposed laws and regulations may require further

25
emission reductions and associated emission control expenditures. There is also continuing pressure on state and federal regulators to impose limits on carbon dioxide emissions from electric power plants, particularly coal-fired power plants. As a result of these current and proposed laws, regulations and trends, electricity generators may elect to switch to other fuels that generate less of these emissions, possibly further reducing demand for the coal that the Partnership’s lessees produce and thereby reducing its coal royalty revenues. See Item 1, “Business—Regulation—Coal—Air Emissions.”
Delays in the Partnership’s lessees obtaining mining permits and approvals, or the inability to obtain required permits and approvals, could have an adverse effect on its coal royalty revenues.
Mine operators, including the Partnership’s lessees, must obtain numerous permits and approvals that impose strict
conditions and obligations relating to various environmental and safety matters in connection with coal mining. The permitting rules are complex and can change over time. The public has the right to comment on permit applications and otherwise participate in the permitting process, including through court intervention. Accordingly, permits required by the Partnership’s lessees to conduct operations may not be issued, maintained or renewed, or may not be issued or renewed in a timely fashion, or may involve requirements that restrict its lessees’ ability to economically conduct their mining operations. Limitations on the Partnership’s lessees’ ability to conduct their mining operations due to the inability to obtain or renew necessary permits could have an adverse effect on its coal royalty revenues. See Item 1, “Business—Regulation—Coal—Mining Permits and Approvals.”
The Partnership’s lessees’ mining operations are subject to extensive and costly laws and regulations, and such current and future laws and regulations could increase operating costs and limit its lessees’ ability to produce coal, which could have an adverse effect on its coal royalty revenues.
The Partnership’s lessees are subject to numerous and detailed federal, state and local laws and regulations affecting coal
mining operations, including laws and regulations pertaining to employee health and safety, permitting and licensing requirements, air quality standards, water pollution, plant and wildlife protection, reclamation and restoration of mining properties after mining is completed, the discharge of materials into the environment, surface subsidence from underground mining and the effects that mining has on groundwater quality and availability. Numerous governmental permits and approvals are required for mining operations. The Partnership’s lessees are required to prepare and present to federal, state or local authorities data pertaining to the effect or impact that any proposed exploration for or production of coal may have upon the environment. The costs, liabilities and requirements associated with these regulations may be significant and time-consuming and may delay commencement or continuation of exploration or production operations. The possibility exists that new laws or regulations (or judicial interpretations of existing laws and regulations) may be adopted in the future that could materially affect the Partnership’s lessees’ mining operations, either through direct impacts such as new requirements impacting its lessees’ existing mining operations, or indirect impacts such as new laws and regulations that discourage or limit coal consumers’ use of coal. Any of these direct or indirect impacts could have an adverse effect on the Partnership’s coal royalty revenues. See Item 1, “Business—Regulation.”
Because of extensive and comprehensive regulatory requirements, violations during mining operations are not unusual in the industry and, notwithstanding compliance efforts, the Partnership does not believe violations by its lessees can be eliminated completely. Failure to comply with these laws and regulations may result in the assessment of administrative, civil and criminal penalties, the imposition of cleanup and site restoration costs and liens and, to a lesser extent, the issuance of injunctions to limit or cease operations. The Partnership’s lessees may also incur costs and liabilities resulting from claims for damages to property or injury to persons arising from their operations. If the Partnership’s lessees are required to pay these costs and liabilities and if their financial viability is affected by doing so, then their mining operations and, as a result, the Partnership’s coal royalty revenues and its ability to make distributions, could be adversely affected.
Recent mining accidents in West Virginia and Kentucky have received national attention and instigated responses at the state and national level that are likely to result in increased scrutiny of current safety practices and procedures at all mining operations, particularly underground mining operations. These recent events could also potentially result in the promulgation of more stringent mine safety laws and regulations, or amendments to existing mine safety laws, including increased sanctions for non-compliance. These potential future mine safety laws and regulations or amendments to existing mine safety laws and regulations, and the cost of compliance with such, could adversely affect the Partnership’s lessees’ coal production which could have an adverse affect on its coal royalty revenues and its ability to make distributions.

26
Risks Related to PVR’s Midstream Business
The success of the Partnership’s midstream business depends upon its ability to find and contract for new sources of natural gas supply.
In order to maintain or increase throughput levels on the Partnership’s gathering systems and asset utilization rates at its
processing plants, the Partnership must contract for new natural gas supplies. The primary factors affecting its ability to connect new supplies of natural gas to its gathering systems include its success in contracting for existing natural gas supplies that are not committed to other systems and the level of drilling activity creating new gas supply near its gathering systems. The Partnership may not be able to obtain additional contracts for natural gas supplies.
Fluctuations in energy prices can greatly affect production rates and investments by third parties in the development of
new oil and natural gas reserves. Drilling activity generally decreases as oil and natural gas prices decrease. The Partnership has no control over the level of drilling activity in its areas of operations, the amount of reserves underlying the wells and the rate at which production from a well will decline. In addition, the Partnership has no control over producers or their production decisions, which are affected by, among other things, prevailing and projected energy prices, demand for hydrocarbons, the level of reserves, geological considerations, governmental regulation and the availability and cost of capital.
A substantial portion of the Partnership’s midstream assets, including its gathering systems and processing plants, are
connected to natural gas reserves and wells for which the production will naturally decline over time. The Partnership’s cash flows associated with these systems will decline unless it is able to access new supplies of natural gas by connecting additional production to these systems. A material decrease in natural gas production in its areas of operation, as a result of depressed commodity prices or otherwise, would result in a decline in the volume of natural gas the Partnership handles, which would reduce its revenues and operating income. In addition, the Partnership’s future growth will depend, in part, upon whether it can contract for additional supplies at a greater rate than the rate of natural decline in its currently connected supplies.
The Partnership may not be able to retain existing customers or acquire new customers, which would reduce its revenues and limit its future profitability.
The renewal or replacement of existing contracts with the Partnership’s customers at rates sufficient to maintain current
revenues and cash flows depends on a number of factors beyond its control, including competition from other pipelines, and the price of, and demand for, natural gas in the markets the Partnership serves.
The profitability of the Partnership’s midstream business is dependent upon prices and market demand for natural gas and NGLs, which are beyond its control and have been volatile.
The Partnership is subject to significant risks due to fluctuations in commodity prices. During 2005, it generated a
majority of its gross margin from two types of contractual arrangements under which its margin is exposed to increases and decreases in the price of natural gas and NGLs—percentage-of-proceeds and keep-whole arrangements.
Virtually all of the natural gas gathered on the Crescent System and the Hamlin System is contracted under percentage-
of-proceeds arrangements. The natural gas gathered on the Beaver System is contracted primarily under either percentage-of proceeds or gas purchase/keep-whole arrangements. Under both types of arrangements, the Partnership provides gathering and processing services for natural gas received. Under percentage-of-proceeds arrangements, the Partnership generally sells the NGLs produced from the processing operations and the remaining residue gas at market prices and remits to the producers an agreed upon percentage of the proceeds based upon an index price for the gas and the price received for the NGLs. Under these percentage-of-proceeds arrangements, revenues and gross margins decline when natural gas prices and NGL prices decrease. Accordingly, a decrease in the price of natural gas or NGLs could have a material adverse effect on the Partnership’s results of operations. Under gas purchase/keep-whole arrangements, the Partnership generally buys natural gas from producers based upon an index price and then sells the NGLs and the remaining residue gas to third parties at market prices. Because the extraction of the NGLs from the natural gas during processing reduces the volume of natural gas available for sale, profitability is dependent on the value of those NGLs being higher than the value of the volume of gas reduction or “shrink.” Under these arrangements, revenues and gross margins decrease when the price of natural gas increases relative to the price of NGLs. Accordingly, a change in the relationship between the price of natural gas and the price of NGLs could have a material adverse effect on the Partnership’s results of operations.
27
In the past, the prices of natural gas and NGLs have been extremely volatile, and the Partnership expects this volatility to continue. The markets and prices for residue gas and NGLs depend upon factors beyond the Partnership’s control. These factors include demand for oil, natural gas and NGLs, which fluctuates with changes in market and economic conditions, and other factors, including:
• the impact of weather on the demand for oil and natural gas; • the level of domestic oil and natural gas production; • the availability of imported oil and natural gas; • actions taken by foreign oil and gas producing nations; • the availability of local, intrastate and interstate transportation systems; • the availability and marketing of competitive fuels; • the impact of energy conservation efforts; and • the extent of governmental regulation and taxation.
The Partnership encounters competition from other midstream companies.
The Partnership experiences competition in all of its midstream markets. Competition is based on many factors,
including geographic proximity to production, costs of connection, available capacity, rates and access to markets. The Partnership’s competitors include major integrated oil companies, interstate and intrastate pipelines and companies that gather, compress, process, transport and market natural gas. Many of the Partnership’s competitors have greater financial resources and access to larger natural gas supplies than it does.
Expanding the Partnership’s midstream business by constructing new gathering systems, pipelines and processing facilities subjects it to construction risks.
One of the ways the Partnership may grow its midstream business is through the construction of additions to existing
gathering, compression and processing systems. The construction of a new gathering system or pipeline or the expansion of an existing pipeline, by adding additional horsepower or pump stations or by adding a second pipeline within an existing right of way, and the construction of new processing facilities, involve numerous regulatory, environmental, political and legal uncertainties beyond the Partnership’s control and require the expenditure of significant amounts of capital. If the Partnership undertakes these projects, they may not be completed on schedule, or at all, or at the budgeted cost. Moreover, the Partnership’s revenues may not increase immediately upon the expenditure of funds on a particular project. For example, the construction of gathering facilities requires the expenditure of significant amounts of capital, which may exceed the Partnership’s estimates. Generally, the Partnership may have only limited natural gas supplies committed to these facilities prior to their construction. Moreover, the Partnership may construct facilities to capture anticipated future growth in production in a region in which anticipated production growth does not materialize. As a result, there is the risk that new facilities may not be able to attract enough natural gas to achieve the Partnership’s expected investment return, which could adversely affect its financial position or results of operations.
If the Partnership is unable to obtain new rights-of-way or the cost of renewing existing rights-of-way increases, then it may be unable to fully execute its growth strategy and its cash flows could be reduced.
The construction of additions to the Partnership’s existing gathering assets may require it to obtain new rights-of-way
before constructing new pipelines. The Partnership may be unable to obtain rights-of-way to connect new natural gas supplies to its existing gathering lines or capitalize on other attractive expansion opportunities. Additionally, it may become more expensive for the Partnership to obtain new rights-of-way or to renew existing rights-of-way. If the cost of obtaining new rights-of-way or renewing existing rights-of-way increases, then the Partnership’s cash flows could be reduced.
The Partnership is exposed to the credit risk of its midstream customers, and nonpayment or nonperformance by its customers could reduce its cash flows.
The Partnership is subject to risk of loss resulting from nonpayment or nonperformance by its customers. The
Partnership depends on a limited number of customers for a significant portion of its midstream revenue. For 2005, two customers represented 46 percent of total natural gas midstream revenues and 23 percent of our total consolidated revenues. Any nonpayment or nonperformance by our customers could reduce our cash flows.

28
Any reduction in the capacity of, or the allocations to, the Partnership in interconnecting third-party pipelines could cause a reduction of volumes processed, which would adversely affect its revenues and cash flow.
The Partnership is dependent upon connections to third-party pipelines to receive and deliver residue gas and NGLs.
Any reduction of capacities of these interconnecting pipelines due to testing, line repair, reduced operating pressures or other causes could result in reduced volumes gathered and processed in its midstream facilities. Similarly, if additional shippers begin transporting volumes of residue gas and NGLs on interconnecting pipelines, the Partnership’s allocations in these pipelines would be reduced. Any reduction in volumes gathered and processed in the Partnership’s facilities would adversely affect its revenues and cash flow.
Hedging transactions may limit the Partnership’s potential gains and involve other risks.
In order to manage its exposure to price risks in the marketing of its natural gas and NGLs, the Partnership periodically
enters into natural gas and NGL price hedging arrangements with respect to a portion of its expected production. Its hedges are limited in duration, usually for periods of two years or less. However, in connection with acquisitions, sometimes its hedges are for longer periods. While intended to reduce the effects of volatile natural gas and NGL prices, such transactions may limit the Partnership’s potential gains if natural gas or NGL prices were to rise over the price established by the hedging arrangements. In trying to maintain an appropriate balance, the Partnership may end up hedging too much or too little, depending upon how natural gas or NGL prices fluctuate in the future. We cannot assure you that the Partnership’s hedging transactions will reduce the risk or minimize the effect of any decline in natural gas or NGL prices.
In addition, hedging transactions may expose the Partnership to the risk of financial loss in certain circumstances, including instances in which:
• its production is less than expected; • there is a widening of price basis differentials between delivery points for its production and the delivery point
assumed in the hedge arrangement; • the counterparties to its futures contracts fail to perform under the contracts; or • a sudden, unexpected event materially impacts natural gas or NGL prices.
The Partnership accounts for its derivative transactions pursuant to SFAS No. 133, which requires it to record each
hedging transaction as an asset or liability measured at its fair value. The Partnership must also measure the effectiveness of its hedging position in relation to the underlying commodity being hedged, and the Partnership will be required to record the ineffective portion of the hedge in its net income for that period. This accounting treatment could result in significant fluctuations in our net income and shareholders’ equity from period to period.
In addition, hedging transactions using derivative instruments involve basis risk. Basis risk in a hedging contract occurs when the index upon which the contract is based is more or less variable than the index upon which the hedged asset is based, thereby making the hedge less effective. For example, a NYMEX index used for hedging certain volumes of production may have more or less variability than the regional price index used for the sale of that production.
The Partnership’s midstream business involves many hazards and operational risks, some of which may not be fully covered by insurance.
The Partnership’s midstream operations are subject to the many hazards inherent in the gathering, compression, treating,
processing and transportation of natural gas and NGLs, including:
• damage to pipelines, related equipment and surrounding properties caused by hurricanes, tornadoes, floods, fires and other natural disasters and acts of terrorism;
• inadvertent damage from construction and farm equipment; • leaks of natural gas, NGLs and other hydrocarbons; and • fires and explosions.
These risks could result in substantial losses due to personal injury or loss of life, severe damage to and destruction of
property and equipment and pollution or other environmental damage and may result in curtailment or suspension of the Partnership’s related operations. The Partnership’s midstream operations are concentrated in Texas and Oklahoma, and a natural disaster or other hazard affecting these areas could have a material adverse effect on its operations. The Partnership is not fully insured against all risks incident to its midstream business. The Partnership does not have property insurance on all of its underground pipeline systems that would cover damage to the pipelines. The Partnership is not insured against all
29
environmental accidents that might occur, other than those considered to be sudden and accidental. If a significant accident or event occurs that is not fully insured, it could adversely affect the Partnership’s operations and financial condition.
Federal, state or local regulatory measures could adversely affect the Partnership’s midstream business.
Cantera Gas Company (“CGC”), a wholly owned subsidiary of PVR Midstream LLC, owns and operates an 11-mile interstate natural gas pipeline which, pursuant to the NGA, is subject to the jurisdiction of the FERC. The FERC has granted CGC waivers of various requirements otherwise applicable to conventional FERC-jurisdictional pipelines, including the obligation to file a tariff governing rates, terms and conditions of open access transportation service. The FERC has determined that CGC will have to comply with the filing requirements if the natural gas company ever desires to apply for blanket transportation authority to transport third-party gas on the 11-mile pipeline. We cannot assure you that the FERC will maintain these waivers.
The Partnership’s natural gas gathering facilities generally are exempt from the FERC’s jurisdiction under the NGA, but
FERC regulation nevertheless could significantly affect its gathering business and the market for its services. In recent years, the FERC has pursued pro-competitive policies in its regulation of interstate natural gas pipelines into which the Partnership’s gathering pipelines deliver. However, we cannot assure you that the FERC will continue this approach as it considers matters such as pipeline rates and rules and policies that may affect rights of access to natural gas transportation capacity.
In Texas, the Partnership’s gathering facilities are subject to regulation by the Texas Railroad Commission, which has the authority to ensure that rates, terms and conditions of gas utilities, including certain gathering facilities, are just and reasonable and not discriminatory. The Partnership’s operations in Oklahoma are regulated by the Oklahoma Corporation Commission, which prohibits it from charging any unduly discriminatory fees for its gathering services. We cannot predict whether the Partnership’s gathering rates will be found to be unjust, unreasonable or unduly discriminatory.
The Partnership is subject to ratable take and common purchaser statutes in Texas and Oklahoma. Ratable take statutes
generally require gatherers to take, without undue discrimination, natural gas production that may be tendered to the gatherer for handling. Similarly, common purchaser statutes generally require gatherers to purchase without undue discrimination as to source of supply or producer. These statutes have the effect of restricting the Partnership’s right as an owner of gathering facilities to decide with whom it contracts to purchase or transport natural gas. Federal law leaves any economic regulation of natural gas gathering to the states, and Texas and Oklahoma have adopted complaint-based regulation that generally allows natural gas producers and shippers to file complaints with state regulators in an effort to resolve grievances relating to natural gas gathering rates and access. We cannot assure you that federal and state authorities will retain their current regulatory policies in the future.
Texas and Oklahoma administer federal pipeline safety standards under the NGPSA, which requires certain pipelines to
comply with safety standards in constructing and operating the pipelines, and subjects pipelines to regular inspections. In response to recent pipeline accidents, Congress and the U.S. Department of Transportation have recently instituted heightened pipeline safety requirements. Certain of the Partnership’s gathering facilities are exempt from these federal pipeline safety requirements under the rural gathering exemption. We cannot assure you that the rural gathering exemption will be retained in its current form in the future.
Failure to comply with applicable regulations under the NGA, the NGPSA and certain state laws can result in the
imposition of administrative, civil and criminal remedies.
The Partnership’s midstream business is subject to extensive environmental regulation.
Many of the operations and activities of the Partnership’s gathering systems, plants and other facilities are subject to significant federal, state and local environmental laws and regulations. These include, for example, laws and regulations that impose obligations related to air emissions and discharge of wastes from the Partnership’s facilities and the cleanup of hazardous substances that may have been released at properties currently or previously owned or operated by Cantera or locations to which it has sent wastes for disposal. These laws and regulations can restrict or impact the Partnership’s business activities in many ways, including restricting the manner in which it disposes of substances, requiring pre-approval for the construction or modification of certain projects or facilities expected to produce air emissions, requiring remedial action to remove or mitigate contamination, and requiring capital expenditures to comply with control requirements. Failure to comply with these laws and regulations may trigger a variety of administrative, civil and criminal enforcement measures, including the assessment of monetary penalties, the imposition of remedial requirements and the issuance of orders enjoining future operations. Certain environmental statutes impose strict, joint and several liability for costs required to clean up and
30
restore sites where substances and wastes have been disposed or otherwise released. Moreover, it is not uncommon for neighboring landowners and other third parties to file claims for personal injury and property damage allegedly caused by the release of substances or wastes into the environment.
There is inherent risk of the incurrence of environmental costs and liabilities in the Partnership’s midstream business due to its handling of natural gas and other petroleum products, air emissions related to its midstream operations, historical industry operations, waste disposal practices and Cantera’s prior use of natural gas flow meters containing mercury. For example, an accidental release from one of the Partnership’s pipelines or processing facilities could subject it to substantial liabilities arising from environmental cleanup, restoration costs and natural resource damages, claims made by neighboring landowners and other third parties for personal injury and property damage, and fines or penalties for related violations of environmental laws or regulations. Moreover, the possibility exists that stricter laws, regulations or enforcement policies could significantly increase the Partnership’s compliance costs and the cost of any remediation that may become necessary. The Partnership may incur material environmental costs and liabilities. Insurance may not provide sufficient coverage in the event an environmental claim is made. Item 1B Unresolved Staff Comments
We received no written comments from the SEC staff regarding our periodic or current reports under the Exchange Act within 180 days before the end of our fiscal year ended December 31, 2005. Item 2 Properties Facilities
We are headquartered in Radnor, Pennsylvania, with additional offices in Tennessee, Texas and West Virginia. All of our office facilities are leased, except for PVR’s West Virginia office, which it owns. We believe that our properties are adequate for our current needs.

31
Title to Properties
The following map shows the general locations of our oil and gas production and exploration, PVR’s coal reserves, PVR’s coal services and infrastructure investments and PVR’s natural gas gathering and processing systems:
We believe that we have satisfactory title to all of our properties and the associated oil, gas and coal reserves in accordance with standards generally accepted in the oil and natural gas, coal and natural gas midstream industries.
As is customary in the oil and gas industry, we make only a cursory review of title to farmout acreage and to
undeveloped oil and gas leases upon execution of any contracts. Prior to the commencement of drilling operations, a thorough title examination is conducted and curative work is performed with respect to significant defects. To the extent title opinions or other investigations reflect defects, we cure such title defects. If we were unable to remedy or cure any title defect of a nature such that it would not be prudent to commence drilling operations on a property, we could suffer a loss of our investment in the property. Prior to completing an acquisition of producing oil and gas assets, we obtain title opinions on all material leases. Our oil and gas properties are subject to customary royalty interests, liens for current taxes and other burdens that we believe do not materially interfere with the use or materially affect the value of such properties.
Of the 689 million tons of proven and probable coal reserves to which the Partnership had rights as of December 31, 2005, PVR owned the mineral interests and the majority of related surface rights to 609 million tons, or 88 percent, and leased the remaining 80 million tons, or 12 percent, from unaffiliated third parties.
PVR’s natural gas midstream assets are primarily located in the mid-continent area of Oklahoma and the panhandle of
Texas. The Partnership owns and operates a significant set of midstream assets that include approximately 3,450 miles of gas gathering pipelines and three natural gas processing facilities, which have 160 MMcfd of total capacity. PVR owns, leases or has rights-of-way to the properties where the majority of its midstream facilities are located. PVR believes it has sufficient rights-of-way to accommodate its gathering systems and pipelines.

32
Information Regarding Oil and Gas Properties
Production and Pricing
The following table sets forth production, average sales prices and production costs with respect to our oil and gas properties for the years ended December 31, 2005, 2004 and 2003:
2005
2004
2003
Production:
Oil and condensate (MBbls) 302 396 625 Natural gas (MMcf) 25,550 22,079 20,094 Total production (MMcfe) 27,362 24,455 23,844
Average sales prices:
Natural gas ($/Mcf)
Actual price received for production $ 8.86 $ 6.44 $ 5.59 Effect of derivative hedging activities (0.55) (0.17) (0.28)
Average realized price $ 8.31 $ 6.27 $ 5.31
Crude oil ($/Bbl)
Actual price received for production $ 48.51 $ 39.09 $ 27.77 Effect of derivative hedging activities (2.84) (5.34) (0.86)
Average realized price $ 45.67 $ 33.75 $ 26.91
Production expenses ($/Mcfe):
Lease operating $ 0.63 $ 0.57 $ 0.51 Taxes other than income 0.48 0.38 0.40 General and administrative 0.34 0.34 0.33
Total production expenses $ 1.45 $ 1.29 $ 1.24
Proved Reserves
The following table presents certain information regarding our proved reserves as of December 31, 2005, 2004 and
2003. The proved reserve estimates presented below were prepared by Wright and Company, Inc., independent petroleum engineers. For additional information regarding estimates of proved reserves, the preparation of such estimates by Wright and Company, Inc. and other information about our oil and gas reserves, see Note 24 in the Notes to Consolidated Financial Statements. Our estimates of proved reserves in the table below are consistent with those filed by us with other federal agencies.
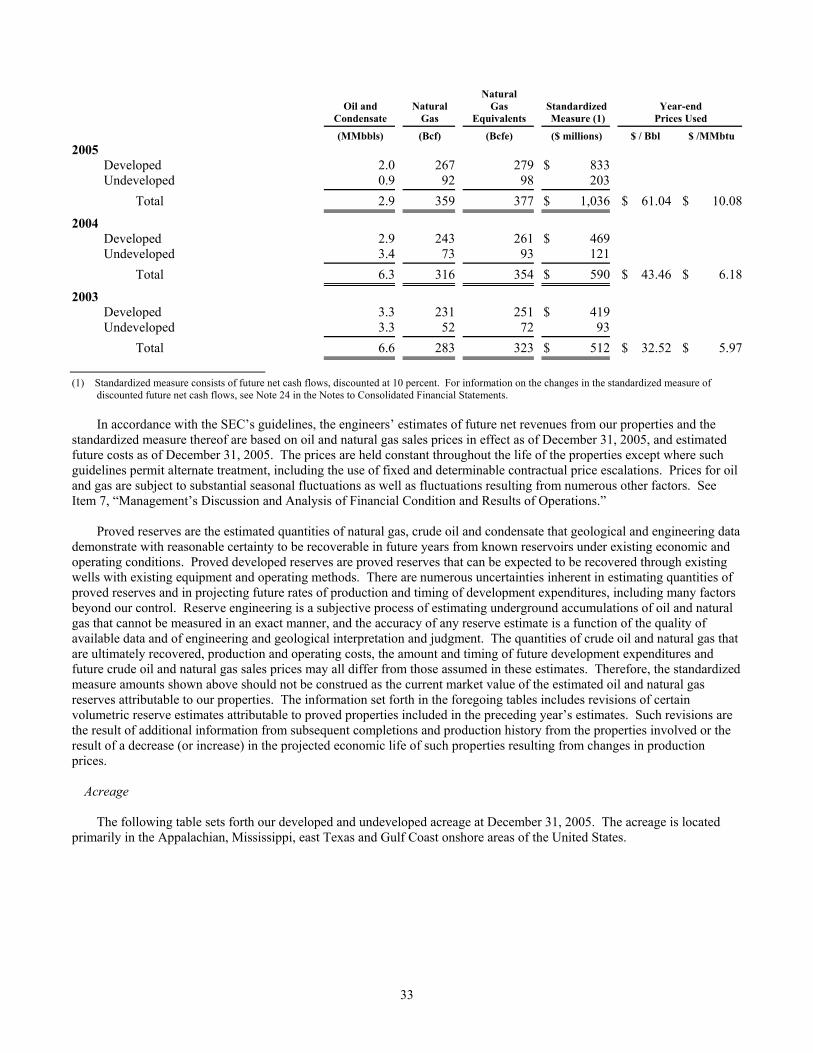
33
Oil and Condensate
NaturalGas
Natural Gas
Equivalents
Standardized Measure (1)
Year-end Prices Used
(MMbbls) (Bcf) (Bcfe) ($ millions) $ / Bbl $ /MMbtu2005
Developed 2.0 267 279 $ 833
Undeveloped 0.9 92 98 203
Total 2.9 359 377 $ 1,036 $ 61.04 $ 10.08
2004
Developed 2.9 243 261 $ 469
Undeveloped 3.4 73 93 121
Total 6.3 316 354 $ 590 $ 43.46 $ 6.18
2003
Developed 3.3 231 251 $ 419
Undeveloped 3.3 52 72 93
Total 6.6 283 323 $ 512 $ 32.52 $ 5.97
(1) Standardized measure consists of future net cash flows, discounted at 10 percent. For information on the changes in the standardized measure of discounted future net cash flows, see Note 24 in the Notes to Consolidated Financial Statements.
In accordance with the SEC’s guidelines, the engineers’ estimates of future net revenues from our properties and the
standardized measure thereof are based on oil and natural gas sales prices in effect as of December 31, 2005, and estimated future costs as of December 31, 2005. The prices are held constant throughout the life of the properties except where such guidelines permit alternate treatment, including the use of fixed and determinable contractual price escalations. Prices for oil and gas are subject to substantial seasonal fluctuations as well as fluctuations resulting from numerous other factors. See Item 7, “Management’s Discussion and Analysis of Financial Condition and Results of Operations.”
Proved reserves are the estimated quantities of natural gas, crude oil and condensate that geological and engineering data
demonstrate with reasonable certainty to be recoverable in future years from known reservoirs under existing economic and operating conditions. Proved developed reserves are proved reserves that can be expected to be recovered through existing wells with existing equipment and operating methods. There are numerous uncertainties inherent in estimating quantities of proved reserves and in projecting future rates of production and timing of development expenditures, including many factors beyond our control. Reserve engineering is a subjective process of estimating underground accumulations of oil and natural gas that cannot be measured in an exact manner, and the accuracy of any reserve estimate is a function of the quality of available data and of engineering and geological interpretation and judgment. The quantities of crude oil and natural gas that are ultimately recovered, production and operating costs, the amount and timing of future development expenditures and future crude oil and natural gas sales prices may all differ from those assumed in these estimates. Therefore, the standardized measure amounts shown above should not be construed as the current market value of the estimated oil and natural gas reserves attributable to our properties. The information set forth in the foregoing tables includes revisions of certain volumetric reserve estimates attributable to proved properties included in the preceding year’s estimates. Such revisions are the result of additional information from subsequent completions and production history from the properties involved or the result of a decrease (or increase) in the projected economic life of such properties resulting from changes in production prices.
Acreage
The following table sets forth our developed and undeveloped acreage at December 31, 2005. The acreage is located primarily in the Appalachian, Mississippi, east Texas and Gulf Coast onshore areas of the United States.

34
Gross Acreage
Net Acreage
(in thousands) Developed 637 511 Undeveloped 719 482
Total 1,356 993
Wells Drilled
The following table sets forth the gross and net numbers of exploratory and development wells drilled during the last three years. The number of wells drilled refers to the number of wells reaching total depth at any time during the respective year. Net wells equal the number of gross wells multiplied by our working interest in each of the gross wells. Productive wells represent either wells which were producing or which were capable of commercial production.
2005
2004
2003
Gross
Net
Gross
Net
Gross
Net
Development
Productive 163 130.8 134 89.7 161 117.0 Non-productive 3 3.0 1 0.3 1 1.0
Total development 166 133.8 135 90.0 162 118.0
Exploratory
Productive 6 2.9 7 1.5 5 1.2 Non-productive 3 3.0 7 4.4 3 2.9 Under evaluation 3 2.5 3 2.6 10 10.0
Total exploratory 12 8.4 17 8.5 18 14.1
Total 178 142.2 152 98.5 180 132.1
The three exploratory wells under evaluation at the end of 2005 included two New Albany Shale wells in Ilinois and a
Bakken Dolomite horizontal oil well in Montana. We expect to determine the commercial viability of these wells during 2006. At December 31, 2005, we had capitalized costs of $1.7 million related to these wells.
The three exploratory wells under evaluation at the end of 2004 included a horizontal Devonian shale well in West
Virginia, a CBM well in Mississippi and an HCBM well in Virginia. In 2005, we determined that these wells were not commercially viable, resulting in a $3.3 million write-off.
The 10 exploratory wells under evaluation at the end of 2003 were CBM wells drilled and completed in the Cherokee
Basin in Chase and Greenwood Counties, Kansas. In 2004, we determined that these wells were not commercially viable, resulting in a $4.4 million write-off.
Productive Wells
The number of productive oil and gas wells in which we had a working interest at December 31, 2005, is set forth below. Productive wells are producing wells or wells capable of commercial production.
Operated Wells
Non-Operated Wells
Total
Gross
Net
Gross
Net
Gross
Net
938 892.0 563 93.6 1,501 985.6
In addition to the above working interest wells, we own royalty interests in 1,882 gross wells. Information Regarding Coal Properties
At December 31, 2005, the Partnership’s coal reserves were located on approximately 336,000 acres, including fee and leased acreage, in Kentucky, New Mexico, Virginia and West Virginia. The coal reserves are in various surface and
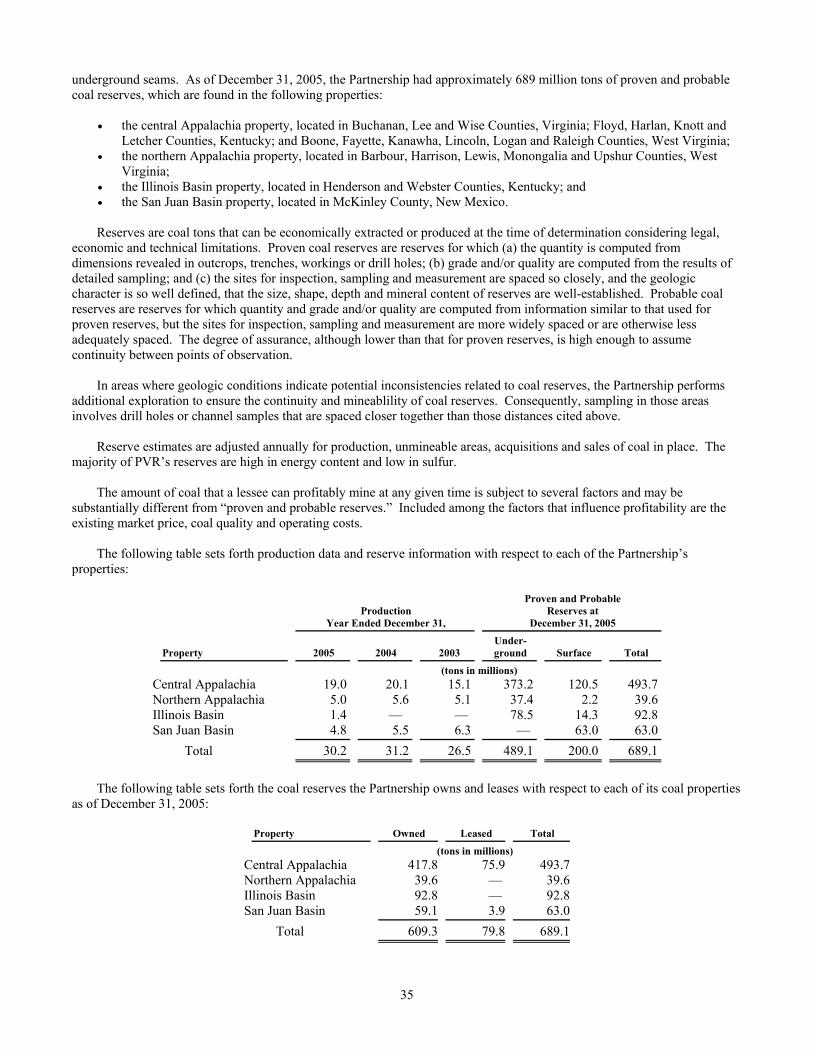
35
underground seams. As of December 31, 2005, the Partnership had approximately 689 million tons of proven and probable coal reserves, which are found in the following properties:
• the central Appalachia property, located in Buchanan, Lee and Wise Counties, Virginia; Floyd, Harlan, Knott and
Letcher Counties, Kentucky; and Boone, Fayette, Kanawha, Lincoln, Logan and Raleigh Counties, West Virginia; • the northern Appalachia property, located in Barbour, Harrison, Lewis, Monongalia and Upshur Counties, West
Virginia; • the Illinois Basin property, located in Henderson and Webster Counties, Kentucky; and • the San Juan Basin property, located in McKinley County, New Mexico.
Reserves are coal tons that can be economically extracted or produced at the time of determination considering legal,
economic and technical limitations. Proven coal reserves are reserves for which (a) the quantity is computed from dimensions revealed in outcrops, trenches, workings or drill holes; (b) grade and/or quality are computed from the results of detailed sampling; and (c) the sites for inspection, sampling and measurement are spaced so closely, and the geologic character is so well defined, that the size, shape, depth and mineral content of reserves are well-established. Probable coal reserves are reserves for which quantity and grade and/or quality are computed from information similar to that used for proven reserves, but the sites for inspection, sampling and measurement are more widely spaced or are otherwise less adequately spaced. The degree of assurance, although lower than that for proven reserves, is high enough to assume continuity between points of observation.
In areas where geologic conditions indicate potential inconsistencies related to coal reserves, the Partnership performs
additional exploration to ensure the continuity and mineablility of coal reserves. Consequently, sampling in those areas involves drill holes or channel samples that are spaced closer together than those distances cited above.
Reserve estimates are adjusted annually for production, unmineable areas, acquisitions and sales of coal in place. The
majority of PVR’s reserves are high in energy content and low in sulfur. The amount of coal that a lessee can profitably mine at any given time is subject to several factors and may be
substantially different from “proven and probable reserves.” Included among the factors that influence profitability are the existing market price, coal quality and operating costs.
The following table sets forth production data and reserve information with respect to each of the Partnership’s
properties:
Production Year Ended December 31,
Proven and Probable Reserves at
December 31, 2005
Property
2005
2004
2003
Under- ground
Surface
Total
(tons in millions) Central Appalachia 19.0 20.1 15.1 373.2 120.5 493.7 Northern Appalachia 5.0 5.6 5.1 37.4 2.2 39.6 Illinois Basin 1.4 — — 78.5 14.3 92.8 San Juan Basin 4.8 5.5 6.3 — 63.0 63.0
Total 30.2 31.2 26.5 489.1 200.0 689.1
The following table sets forth the coal reserves the Partnership owns and leases with respect to each of its coal properties
as of December 31, 2005:
Property
Owned
Leased
Total
(tons in millions) Central Appalachia 417.8 75.9 493.7Northern Appalachia 39.6 — 39.6Illinois Basin 92.8 — 92.8San Juan Basin 59.1 3.9 63.0
Total 609.3 79.8 689.1
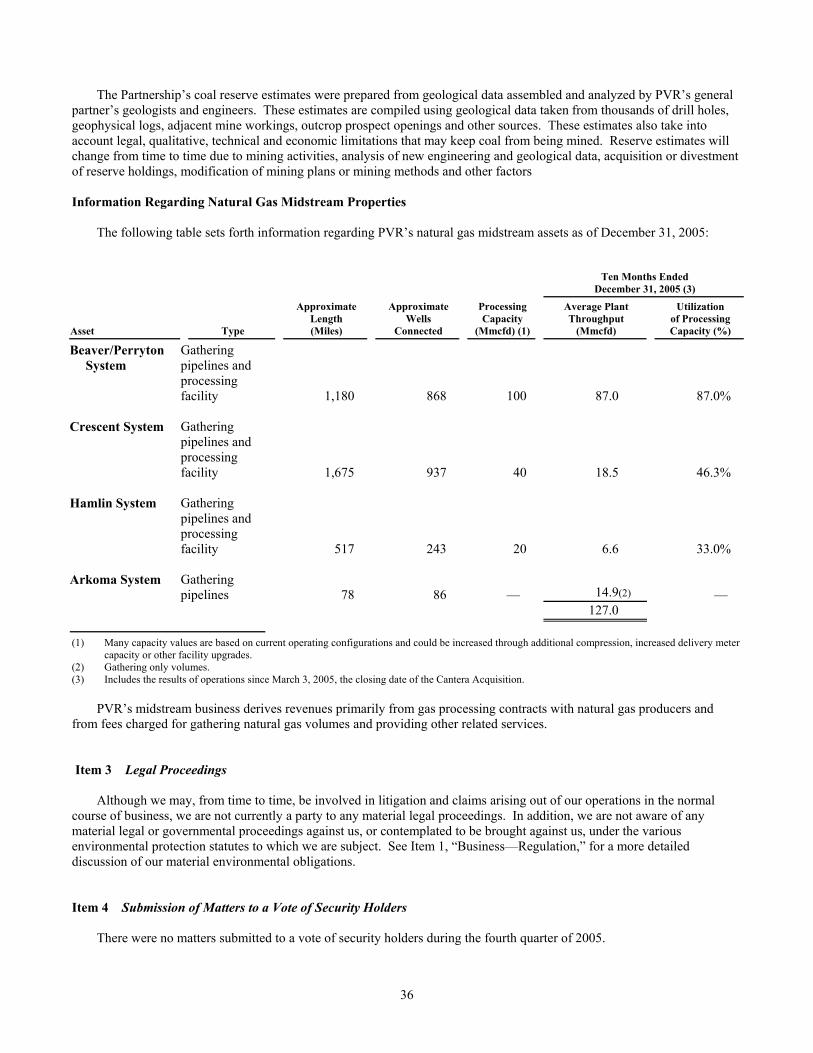
36
The Partnership’s coal reserve estimates were prepared from geological data assembled and analyzed by PVR’s general
partner’s geologists and engineers. These estimates are compiled using geological data taken from thousands of drill holes, geophysical logs, adjacent mine workings, outcrop prospect openings and other sources. These estimates also take into account legal, qualitative, technical and economic limitations that may keep coal from being mined. Reserve estimates will change from time to time due to mining activities, analysis of new engineering and geological data, acquisition or divestment of reserve holdings, modification of mining plans or mining methods and other factors Information Regarding Natural Gas Midstream Properties
The following table sets forth information regarding PVR’s natural gas midstream assets as of December 31, 2005:
Ten Months Ended December 31, 2005 (3)
Asset
Type
Approximate Length (Miles)
Approximate Wells
Connected
Processing Capacity
(Mmcfd) (1)
Average Plant Throughput
(Mmcfd)
Utilization of Processing Capacity (%)
Beaver/Perryton
System Gathering pipelines and processing facility 1,180 868 100 87.0 87.0%
Crescent System Gathering
pipelines and processing facility 1,675 937 40 18.5 46.3%
Hamlin System Gathering
pipelines and processing facility 517 243 20 6.6 33.0%
Arkoma System Gathering
pipelines 78 86 — 14.9(2) — 127.0
(1) Many capacity values are based on current operating configurations and could be increased through additional compression, increased delivery meter capacity or other facility upgrades.
(2) Gathering only volumes. (3) Includes the results of operations since March 3, 2005, the closing date of the Cantera Acquisition.
PVR’s midstream business derives revenues primarily from gas processing contracts with natural gas producers and from fees charged for gathering natural gas volumes and providing other related services. Item 3 Legal Proceedings
Although we may, from time to time, be involved in litigation and claims arising out of our operations in the normal course of business, we are not currently a party to any material legal proceedings. In addition, we are not aware of any material legal or governmental proceedings against us, or contemplated to be brought against us, under the various environmental protection statutes to which we are subject. See Item 1, “Business—Regulation,” for a more detailed discussion of our material environmental obligations. Item 4 Submission of Matters to a Vote of Security Holders
There were no matters submitted to a vote of security holders during the fourth quarter of 2005.

37
PART II Item 5 Market for the Registrant’s Common Equity and Related Shareholder Matters and Issuer Purchases of Equity
Securities Market Information
Our common stock is traded on the New York Stock Exchange under the symbol “PVA.” The high and low sales prices (composite transactions) and dividends paid for each fiscal quarter in 2005 and 2004 were as follows:
Sales Price
Quarter Ended
High
Low
Cash DividendsDeclared
December 31, 2005 $ 62.76 $ 51.15 $ 0.1125September 30, 2005 $ 58.40 $ 44.59 $ 0.1125June 30, 2005 $ 49.32 $ 38.05 $ 0.1125March 31, 2005 $ 50.52 $ 37.55 $ 0.1125
December 31, 2004 $ 45.34 $ 35.23 $ 0.1125September 30, 2004 $ 40.85 $ 33.02 $ 0.1125June 30, 2004 $ 37.07 $ 30.19 $ 0.1125March 31, 2004 (1) $ 30.58 $ 26.39 $ 0.1125
(1) For comparative purposes, sales prices and dividends declared have been adjusted for the effect of a two-for-one stock split on June 10, 2004. See Note 7 in the Notes to Consolidated Financial Statements.
Equity Holders
As of March 8, 2006, there were approximately 595 record holders and approximately 6,500 beneficial owners (held in street name) of our common stock. Item 6 Selected Financial Data
Year Ended December 31,
2005 (1)
2004
2003
2002
2001
(in thousands except share data) Revenues $ 673,864 $ 228,425 $ 181,284 $ 110,957 $ 96,571Operating income (2) $ 162,017 $ 80,796 $ 62,101 $ 30,791 $ 1,563Net income (3) $ 62,088 $ 33,355 $ 28,522 $ 12,104 $ 34,337Per common share: (4)
Net income, basic $ 3.35 $ 1.82 $ 1.59 $ 0.68 $ 1.96Net income, diluted $ 3.31 $ 1.81 $ 1.58 $ 0.67 $ 1.93Dividends paid $ 0.45 $ 0.45 $ 0.45 $ 0.45 $ 0.45
Cash flows provided by operating activities (5) $ 231,407 $ 146,365 $ 109,704 $ 65,788 $ 44,191Total assets (6) $ 1,251,546 $ 783,335 $ 683,733 $ 586,292 $ 457,102Long-term debt, net of current portion $ 325,846 $ 188,926 $ 154,286 $ 106,887 $ 46,887Minority interest in PVR $ 313,524 $ 182,891 $ 190,508 $ 192,770 $ 144,039Shareholders’ equity $ 310,560 $ 252,860 $ 211,648 $ 187,956 $ 185,454
(1) The 2005 column includes the results of operations of the natural gas midstream segment since March 3, 2005, the closing date of the Cantera Acquisition.
(2) Operating income in 2004 included a $7.5 million loss on assets held for sale. Operating income in 2005, 2004, 2003, 2002 and 2001 included a $4.8 million, $0.7 million, $0.4 million, $0.8 million and $33.6 million impairment of oil and gas properties.
(3) Net income in 2001 included a $54.7 million ($35.6 million after tax) gain on the sale of Norfolk Southern Corporation common stock. (4) For comparative purposes, amounts per common share in 2001 through 2003 have been adjusted for the effect of a two-for-one stock split on June
10, 2004. See Note 7 in the Notes to Consolidated Financial Statements. (5) Certain reclassifications have been made to conform to the current year presentation. (6) Total assets in 2005 reflect the Cantera Acquisition.

38
Item 7 Management’s Discussion and Analysis of Financial Condition and Results of Operations
The following analysis of financial condition and results of operations of Penn Virginia Corporation and its subsidiaries should be read in conjunction with our consolidated financial statements and the accompanying notes in Item 8, “Financial Statements and Supplementary Data.” Our discussion and analysis include the following items:
• Overview of Business • Overview of 2005 Performance • Acquisitions and Investments • Critical Accounting Policies and Estimates • Liquidity and Capital Resources • Contractual Obligations • Off-Balance Sheet Arrangements • Results of Operations • Environmental • Recent Accounting Pronouncements • Forward-Looking Statements
Overview of Business
We are an independent energy company that is engaged in three primary business segments. Our oil and gas segment explores for, develops, produces and sells crude oil, condensate and natural gas primarily in the eastern and Gulf Coast onshore areas of the United States. Our coal and natural gas midstream segments operate through our 39 percent ownership in PVR. Penn Virginia and PVR are publicly traded on the New York Stock Exchange under the symbols “PVA” and “PVR.” Due to our control of the general partner of PVR, the financial results of the Partnership are included in our consolidated financial statements. However, PVR functions with a capital structure that is independent of ours, consisting of its own debt instruments and publicly traded common units. The following diagram depicts our ownership of PVR as of December 31, 2005:
As a result of our ownership in the Partnership, we receive cash payments from PVR in the form of quarterly cash distributions. We received approximately $21.2 million of cash distributions from PVR during 2005. As part of our ownership of PVR’s general partner, we also own the rights, referred to as incentive distribution rights, to receive an increasing percentage of quarterly distributions of available cash from operating surplus after certain levels of cash

39
distributions have been achieved. See Item 1, “Business—Partnership Distributions—Incentive Distribution Rights.” The cash payments we received from PVR in 2005 and 2004 were as follows (in thousands):
Year Ended December 31,
2005 2004
Limited partner units $ 19,281 $ 16,511General partner interest (2%) 1,021 788Incentive distribution rights 910 —Total $ 21,212 $ 17,299
In November 2004, 25 percent of PVR’s subordinated units converted to common units because the Partnership met
certain requirements to qualify for early conversion. In November 2005, another 25 percent converted to common units. The remaining 50 percent of PVR’s subordinated units are expected to convert to common units in November 2006, provided minimum quarterly distributions are paid and other conditions are met. See Item 1, “Business—Partnership Distributions,” for more information on incentive distribution rights and subordinated units. Overview of 2005 Performance
Operating income for 2005 was $162.0 million. The oil and gas segment, combined with the operating results of corporate, contributed $83.9 million to operating income, and PVR’s coal and natural gas midstream segments, of which we own a 39 percent interest, contributed $78.1 million, before the deduction of the 61 percent interest that we do not own. A description of each of our reportable segments follows:
• Oil and Gas – crude oil and natural gas exploration, development and production. • Coal – the leasing of mineral interests and subsequent collection of royalties, the providing of fee-based coal
handling, transportation and processing infrastructure facilities and the development and harvesting of timber. • Natural Gas Midstream – gas processing, gathering and other related services. • Corporate and Other – primarily represents corporate functions.
Oil and Gas Segment Our oil and gas strategy has been to increase our presence in CBM and unconventional natural gas to build a significant
inventory of predictable, low risk development prospects and to selectively drill higher risk exploration opportunities which could make a meaningful difference to our production and reserve profile. During 2005, we made progress in each area as our oil and gas production increased by 12 percent to 27.4 Bcfe. Commodity prices also contributed significantly to our financial results in 2005. Price volatility in the natural gas market has been high in the last few years, with the NYMEX futures market trading at record price levels for natural gas. Our realized natural gas price in 2005 was $8.31 per Mcf, an increase of 33 percent from $6.27 per Mcf in 2004. As part of our risk management strategy, we use financial instruments to hedge natural gas and, to a lesser extent, oil prices. The use of this risk management strategy has resulted in lower price realizations compared to physical sale prices in the last several years.
Our total oil and gas reserves at the end of 2005 were 376 Bcfe, an increase of six percent over the end of 2004. Approximately 95 percent of our reserves at year-end 2005 were natural gas. Net of revisions, we added approximately 77 Bcfe of proved reserves, primarily from extensions, discoveries and additions. We drilled a total of 178 gross (142.2 net) wells during 2005, including 166 gross (133.8 net) development wells and 12 gross (8.4 net) exploratory wells. Three development wells (3.0 net) and three gross (3.0 net) exploratory wells were not successful and three gross (2.5 net) exploratory wells were under evaluation at December 31, 2005.
Early in 2004, we entered into a joint venture with GMX Resources, Inc. (NASDAQ: GMXR) to drill development wells in the North Carthage Field in east Texas. Through the end of 2005, 37 gross (26.4 net) wells were drilled on this acreage, and we estimate that a total of 80 to 100 wells could ultimately be drilled.
During 2005, we continued to expand our CBM production and reserve base in central Appalachia through leasehold
acquisitions and the use of a proprietary horizontal drilling technology.

40
Coal Segment
Coal prices, especially in central Appalachia where the majority of PVR’s production is located, have increased
significantly since the beginning of 2003. The price increase stems from several causes including increased electricity demand and decreasing coal production in central Appalachia. PVR’s coal royalty revenues increased 19 percent from $69.6 million in 2004 to $82.7 million in 2005. This increase was a result of a 23 percent increase in average gross royalties per ton from $2.23 in 2004 to $2.74 in 2005.
PVR also earns coal services revenues related to its ownership of coal preparation plants, coal loading facilities and its
50 percent interest in a coal handling joint venture with Massey. Coal services revenues increased to $5.2 million in 2005 from $3.8 million in 2004. PVR believes that these types of fee-based infrastructure assets provide good investment and cash flow opportunities for the Partnership, and it continues to look for additional investments of this type as well as other primarily fee-based assets.
Natural Gas Midstream Segment
As a result of the Cantera Acquisition in March 2005, PVR owns and operates a set of midstream assets primarily located in the mid-continent area of Oklahoma and the panhandle of Texas that include approximately 3,450 miles of gas gathering pipelines and three natural gas processing facilities, which have 160 MMcfd of total capacity. PVR’s natural gas midstream business derives revenues primarily from gas processing contracts with natural gas producers and from fees charged for gathering natural gas volumes and providing other related services. The Cantera Acquisition also included a natural gas marketing business, which aggregates third-party volumes and sells those volumes into intrastate pipeline systems and at market hubs accessed by various interstate pipelines. We believe that the Cantera Acquisition established a platform for future growth in the natural gas midstream sector and diversified PVR’s cash flows into another long-lived asset base.
For the ten months ended December 31, 2005, PVR’s midstream operations generated a gross processing margin of
$44.7 million, consisting of midstream revenues minus the cost of gas purchased. Inlet volumes at PVR’s gas processing plants and gathering systems were 38.9 Bcf, or approximately 127 MMcfd, for the same ten-month period, with a gross processing margin of $1.15 per Mcf.
Acquisitions and Investments
Oil and Gas Segment
Panther Acquisition. In June 2005, we acquired approximately 60,000 acres of prospective CBM leasehold rights in Wyoming County, West Virginia, from Panther Energy Company, LLC, for $13.3 million in cash (the “Panther Acquisition”). The leasehold acreage is within an area of mutual interest between Penn Virginia and CDX and is contiguous to acreage which has been successfully developed. The purchase agreement included an option for CDX to purchase a 50 percent interest in the leasehold acreage. In August 2005, CDX exercised that option and acquired its 50 percent interest for $6.6 million in cash. We began drilling on the new leasehold position in the fourth quarter of 2005.
Coal Segment
Coal River Acquisition. In March 2005, PVR acquired lease rights to approximately 36 million tons of undeveloped coal reserves and royalty interests in 73 producing oil and natural gas wells for $9.3 million in cash (the “Coal River Acquisition”). The coal reserves are located in the central Appalachia region of West Virginia. The oil and gas wells are located in eastern Kentucky and southwestern Virginia. The Coal River Acquisition was funded with long-term debt under PVR’s revolving credit facility. The coal reserves are predominantly low sulfur and high BTU content, and development will occur in conjunction with PVR’s adjacent reserves and a related loadout facility that was placed into service in 2004. The oil and gas property contains approximately 2.8 Bcfe of net proved oil and gas reserves with current net production of approximately 0.2 Bcfe on an annualized basis.
Alloy Acquisition. In April 2005, PVR acquired fee ownership of approximately 16 million tons of coal reserves for $15.0 million in cash (the “Alloy Acquisition”). The reserves, located on approximately 8,300 acres in the central Appalachia region of West Virginia, will be produced from deep and surface mines. Production started in late 2005. Revenues were earned initially from wheelage fees on coal mined from an adjacent property, followed by royalty revenues as the mines on PVR’s property commenced production. The seller remained on the property as the lessee and operator. The Alloy Acquisition was funded with long-term debt under PVR’s revolving credit facility.

41
Wayland Acquisition. In July 2005, PVR acquired a combination of fee ownership and lease rights to approximately 16
million tons of coal reserves for $14.5 million (the “Wayland Acquisition”). The reserves are located in the eastern Kentucky portion of central Appalachia. The Wayland Acquisition was funded with $4 million of cash and the issuance by PVR to the seller of approximately 209,000 common units. In addition, PVR assumed $0.7 million of liabilities related to the acquired property. During the third quarter of 2005, PVR began constructing a new preparation plant and unit train coal loading facility on the property, which it expects to complete during 2006 at an estimated total capital expenditure of $12.5 million. The reserves have been leased to an operator who will commence the mining of raw coal on a very limited basis during construction of the loading facility. After completion of the facility, PVR expects the operator’s production from the property to increase to approximately one million tons of coal per year in 2007. PVR also expects to earn fees from third party operators for coal processed from adjacent properties.
Green River Acquisition. In July 2005, PVR acquired fee ownership of approximately 94 million tons of coal reserves in the western Kentucky portion of the Illinois Basin for $62.4 million in cash (the “Green River Acquisition”), and PVR assumed $3.3 million of deferred income. This coal reserve acquisition is PVR’s first in the Illinois Basin and was funded with long-term debt under PVR’s revolving credit facility. Currently, approximately 45 million tons of these coal reserves are leased to affiliates of Peabody Energy Corporation (NYSE: BTU) (“Peabody”). PVR expects the remaining coal reserves to be leased over the next several years, with a gradual increase in coal production and related cash flow from the property.
Coal Handling Joint Venture . In July 2004, the Partnership acquired from affiliates of Massey a 50 percent interest in a joint venture formed to own and operate end-user coal handling facilities. The purchase price was $28.4 million and was funded with long-term debt under the Partnership’s revolving credit facility. The joint venture owns coal handling facilities which unload shipments and store and transfer coal for three industrial coal consumers in the chemical, paper and lime production industries located in Tennessee, Virginia and Kentucky. A combination of fixed monthly fees and per ton throughput fees is paid by those consumers under long-term leases expiring between 2007 and 2019. PVR recognized equity earnings of $1.1 million in 2005 and $0.4 million in 2004 related to its ownership in the joint venture. The Partnership received joint venture distributions of approximately $2.3 million in 2005 and $1.0 million in 2004.
Natural Gas Midstream Segment
Cantera Acquisition. On March 3, 2005, PVR completed its acquisition of Cantera, a midstream gas gathering and
processing company with primary locations in the mid-continent area of Oklahoma and the panhandle of Texas. Cash paid in connection with the Cantera Acquisition was $199.2 million, net of cash received and including capitalized acquisition costs, which PVR funded with a $110 million term loan and with long-term debt under its revolving credit facility. PVR used the proceeds from its sale of common units in a subsequent public offering in March 2005 to repay the term loan in full and to reduce outstanding indebtedness under its revolving credit facility. See Note 4 in the Notes to Consolidated Financial Statements for pro forma financial information. Critical Accounting Policies and Estimates
The process of preparing financial statements in accordance with accounting principles generally accepted in the United States of America requires our management to make estimates and judgments regarding certain items and transactions. It is possible that materially different amounts could be recorded if these estimates and judgments change or if the actual results differ from these estimates and judgments. We consider the following to be the most critical accounting policies which involve the judgment of our management.
Reserves
The estimates of oil and gas reserves are the single most critical estimate included in our financial statements. There are many uncertainties inherent in estimating crude oil and natural gas reserve quantities, including projecting the total quantities in place, future production rates and the timing of future development expenditures. In addition, reserve estimates of new discoveries are less precise than those of producing properties due to the lack of a production history. Accordingly, these estimates are subject to change as additional information becomes available.
Proved reserves are the estimated quantities of crude oil, condensate and natural gas that geological and engineering data
demonstrate with reasonable certainty to be recoverable in future years from known reservoirs under existing economic and operating conditions at the end of the respective years. Proved developed reserves are those reserves expected to be recovered through existing wells with existing equipment and operating methods. Proved undeveloped reserves are those quantities that require additional capital investment through drilling or well recompletion techniques.

42
Reserve estimates become the basis for determining depletive write-off rates, recoverability of historical cost
investments, and the fair value of properties subject to potential impairments. There are several factors which could change our estimates of oil and gas reserves. Significant rises or declines in
product prices could lead to changes in the amount of reserves as production activities become more or less economical. An additional factor that could result in a change of recorded reserves is the reservoir decline rates differing from those assumed when the reserves were initially recorded. Estimation of future production and development costs is also subject to change partially due to factors beyond our control, such as energy costs and inflation or deflation of oil field service costs. Additionally, we perform impairment tests pursuant to SFAS No. 144, Accounting for the Impairment or Disposal of Long-Lived Assets, when significant events occur, such as a market move to a lower price environment or a material revision to our reserve estimates.
Depreciation and depletion of oil and gas producing properties is determined by the units-of-production method and
could change with revisions to estimated proved recoverable reserves. Coal properties are depleted on an area-by-area basis at a rate based on the cost of the mineral properties and the number
of tons of estimated proven and probable coal reserves contained therein. The Partnership’s estimates of coal reserves are updated periodically and may result in adjustments to coal reserves and depletion rates that are recognized prospectively.
Oil and Gas Revenues
Revenues associated with sales of natural gas, crude oil, condensate and natural gas liquids are recorded when title passes to the customer. Natural gas sales revenues from properties in which we have an interest with other producers are recognized on the basis of our net working interest (“entitlement” method of accounting). Natural gas imbalances occur when we sell more or less than our entitled ownership percentage of total natural gas production. Any amount received in excess of our share is treated as deferred revenues. If we take less than we are entitled to take, the under-delivery is recorded as a receivable. As a result of the numerous requirements necessary to gather information from purchasers or various measurement locations, calculate volumes produced, perform field and wellhead allocations and distribute and disburse funds to various working interest partners and royalty owners, the collection of revenues from oil and gas production may take up to 60 days following the month of production. Therefore, accruals for revenues and accounts receivable are made based on estimates of our share of production, particularly from properties that are operated by our partners. Since the settlement process may take 30 to 60 days following the month of actual production, our financial results include estimates of production and revenues for the related time period. Any differences, which we do not expect to be significant, between the actual amounts ultimately received and the original estimates are recorded in the period they become finalized. Approximately 54 percent of natural gas and oil and condensate revenues in 2005 related to two customers.
Natural Gas Midstream Revenues
Revenue from the sale of NGLs and residue gas is recognized when the NGLs and residue gas produced at PVR’s gas
processing plants are sold. Gathering and transportation revenue is recognized based upon actual volumes delivered. Due to the time needed to gather information from various purchasers and measurement locations and then calculate volumes delivered, the collection of natural gas midstream revenues may take up to 30 days following the month of production. Therefore, accruals for revenues and accounts receivable and the related cost of gas purchased and accounts payable are made based on estimates of natural gas purchased and NGLs and natural gas sold, and our financial results include estimates of production and revenues for the period of actual production. Any differences, which we do not expect to be significant, between the actual amounts ultimately received or paid and the original estimates are recorded in the period they become finalized. Approximately 46 percent of natural gas midstream revenues in 2005 related to two customers.
Coal Royalty Revenues
Coal royalty revenues are recognized on the basis of tons of coal sold by the Partnership’s lessees and the corresponding revenues from those sales. Since PVR does not operate any mines, it does not have access to actual production and revenue information until approximately 30 days following the month of production. Therefore, the financial results of the Partnership include estimated revenues and accounts receivable for this 30-day period. Any differences, which we do not expect to be significant, between the actual amounts ultimately received and the original estimates are recorded in the period they become finalized.
43
Hedging Activities
We and PVR enter into derivative financial instruments that qualify for hedge accounting under SFAS No. 133. Hedge
accounting affects the timing of revenue recognition in our statements of income, as a majority of the gain or loss from a contract qualifying as a cash flow hedge is deferred until realized. The position reflected in the statement of income is based on the actual settlements with the counterparty. We include this gain or loss in oil and gas revenues, natural gas midstream revenues or cost of gas purchased, depending on the hedged commodity. If our derivatives did not qualify for hedge accounting or we chose not to use hedge accounting, we could experience significant changes in the estimate of non-cash derivative gain or loss recognized in revenue due to swings in the value of these contracts. These fluctuations could be significant in a volatile pricing environment.
Oil and Gas Properties
We use the successful efforts method to account for our oil and gas properties. Under this method, costs of acquiring properties, costs of drilling successful exploration wells and development costs are capitalized. Geological and geophysical costs, delay rentals and costs to drill exploratory wells that do not find proved reserves are expensed as oil and gas exploration. We will carry the costs of an exploratory well as an asset if the well found a sufficient quantity of reserves to justify its capitalization as a producing well and as long as we are making sufficient progress assessing the reserves and the economic and operating viability of the project. For certain projects, it may take us more than one year to evaluate the future potential of the exploratory well and make a determination of its economic viability. Our ability to move forward on a project may be dependent on gaining access to transportation or processing facilities or obtaining permits and government or partner approval, the timing of which is beyond our control. In such cases, exploratory well costs remain suspended as long as we are actively pursuing access to necessary facilities and access to such permits and approvals and believe they will be obtained. We assess the status of suspended exploratory well costs on a quarterly basis.
A portion of the carrying value of our oil and gas properties is attributable to unproved properties. At December 31,
2005, the costs attributable to unproved properties were approximately $66.7 million. We regularly assess on a property-by-property basis the impairment of individual unproved properties whose acquisition costs are relatively significant. Unproved properties whose acquisition costs are not relatively significant are amortized in the aggregate over the lesser of five years or the average remaining lease term. As exploration work progresses and the reserves on relatively significant properties are proven, capitalized costs of these properties will be subject to depreciation and depletion. If the exploration work is unsuccessful, the capitalized costs of the properties related to the unsuccessful work will be expensed. The timing of any writedowns of these unproven properties, if warranted, depends upon the nature, timing and extent of future exploration and development activities and their results.
Asset Retirement Obligations
In accordance with SFAS No. 143, Accounting for Asset Retirement Obligations, we make estimates of the timing and future costs of plugging and abandoning wells. Estimated abandonment dates will be revised in the future based on changes to related economic lives, which vary with product prices and production costs. Estimated plugging costs may also be adjusted to reflect changing industry experience. Our cash flows would not be affected until plugging and abandoning wells actually occurs. Liquidity and Capital Resources
Although results are consolidated for financial reporting, the Company and PVR operate with independent capital structures. The Company and PVR have separate credit facilities, and neither entity guarantees the debt of the other. Since PVR’s inception in 2001, with the exception of cash distributions paid to us by PVR, the cash needs of each entity have been met independently with a combination of operating cash flows, credit facility borrowings and issuance of new Partnership units. We expect that our cash needs and the cash needs of PVR will continue to be met independently of each other with a combination of these funding sources. Summarized cash flow statements for 2005 and 2004 consolidating our combined segments are set forth below.

44
For the year ended December 31, 2005 (in thousands)
Oil and Gas and Corporate
PVR Coal and PVR Midstream
Consolidated
Cash flows from operating activities:
Net income contribution $ 49,536 $ 12,552 $ 62,088 Adjustments to reconcile net income to net cash provided by
operating activities (summarized) 101,770 78,045 179,815 Net change in operating assets and liabilities (13,611) 3,115 (10,496)
Net cash provided by operating activities 137,695 93,712 231,407
Cash flows from investing activities:
Additions to property and equipment (171,651) (12,735) (184,386)Acquisitions — (290,938) (290,938)Other 17,333 52 17,385
Net cash used in investing activities (154,318) (303,621) (457,939)
Cash flows from financing activities:
PVA dividends paid (8,358) — (8,358)PVR distributions received (paid) 21,212 (51,949) (30,737)Proceeds received from (paid for) issuance of partners’ capital (2,783) 129,239 126,456 PVA debt proceeds, net of repayments 3,000 — 3,000 PVR debt proceeds, net of repayments — 137,200 137,200 Other 1,798 (2,385) (587)
Net cash provided by (used in) financing activities 14,869 212,105 226,974
Net increase, (decrease) in cash and cash equivalents (1,754) 2,196 442 Cash and cash equivalents—beginning of year 4,474 20,997 25,471
Cash and cash equivalents—end of year $ 2,720 $ 23,193 $ 25,913
For the year ended December 31, 2004 (in thousands)
Oil and Gas and Corporate
PVR Coal
Consolidated
Cash flows from operating activities:
Net income contribution $ 24,115 $ 9,240 $ 33,355 Adjustments to reconcile net income to net cash provided by
operating activities (summarized) 82,974 39,661 122,635 Net change in operating assets and liabilities (15,506) 5,881 (9,625)
Net cash provided by operating activities 91,583 54,782 146,365
Cash flows from investing activities:
Additions to property and equipment (124,153) (1,088) (125,241)Acquisitions — (28,442) (28,442)Other 1,222 1,104 2,326
Net cash used in investing activities (122,931) (28,426) (151,357)
Cash flows from financing activities:
PVA dividends paid (8,248) — (8,248)PVR distributions received/(paid) 17,299 (39,191) (21,892)PVA debt proceeds, net of repayments 12,000 — 12,000 PVR debt proceeds, net of repayments — 26,000 26,000 Other 5,829 (1,234) 4,595
Net cash provided by (used in) financing activities 26,880 (14,425) 12,455
Net increase, (decrease) in cash and cash equivalents (4,468) 11,931 7,463 Cash and cash equivalents—beginning of year 8,942 9,066 18,008
Cash and cash equivalents—end of year $ 4,474 $ 20,997 $ 25,471

45
Cash Flows
Except where noted, the following discussion of cash flows and contractual obligations relates to our consolidated
results. From 2004 to 2005, the oil and gas and corporate segments’ net cash provided by operations increased primarily due to
increased natural gas production and increased prices received for natural gas and crude oil. We used cash from operating activities during both years to help fund capital expenditures. Cash provided by operations of the coal and natural gas midstream segments increased primarily due to the natural gas midstream business acquired in March 2005 and an increase in average royalties per ton resulting from higher coal sales prices. PVR’s acquisition of its natural gas midstream segment was accretive to operating cash flows during 2005.
During 2004 and 2003, we used cash primarily for capital expenditures for oil and gas development and exploration
activities and acquisitions of oil and gas properties. During 2004, PVR acquired an interest in the Massey coal handling joint venture for $28.4 million.
Capital expenditures totaled $489.2 million in 2005, compared with $165.9 million in 2004 and $144.0 million in 2003.
The following table sets forth capital expenditures by segment made during the periods indicated:
Year ended December 31,
2005
2004
2003
(in thousands) Oil and gas
Development drilling $ 107,744 $ 77,033 $ 59,551Exploration drilling 18,562 16,411 11,931Seismic 7,836 10,018 9,470Lease acquisition and other (1) 30,297 13,046 44,152Pipeline, gathering, facilities 5,138 18,669 7,770
Total 169,577 135,177 132,874
Coal
Coal reserve and lease acquisitions (2) (3) 106,489 1,293 6,330Acquisition of coal handling joint venture interest — 28,442 — Support equipment and facilities (4) 6,008 855 4,128
Total 112,497 30,590 10,458
Natural gas midstream Acquisitions, net of cash acquired 199,223 — — Other property and equipment expenditures 7,588 — —
Total 206,811 — —
Other 350 176 621
Total capital expenditures $ 489,235 $ 165,943 $ 143,953
(1) Amount in 2003 includes $33.5 million to acquire proved oil and gas properties in south Texas. (2) Amount in 2005 includes noncash expenditure of $11.1 million to acquire coal reserves in Kentucky in the Wayland Acquisition in exchange for $10.4
million of equity issued in the form of Partnership common units and $0.7 million of liabilities assumed. Amount in 2005 also includes the noncash portion of the Green River Acquisition, in which PVR assumed $3.3 million of deferred income. Amounts in 2004 and 2003 include noncash expenditures of $1.1 million and $5.2 million to acquire additional reserves on PVR’s northern Appalachia properties in exchange for equity issued in the form of Partnership common and Class B units.
(3) Amount in 2005 includes $0.4 million of noncash expenditures due to the timing of payment of invoices. (4) Amount in 2005 includes $0.8 million of noncash expenditures due to the timing of payment of invoices.
We are committed to expanding our oil and gas operations over the next several years through a combination of exploration, development and acquisition of new properties. We have a portfolio of assets which balances relatively low risk, moderate return development projects in Appalachia, Mississippi and the Cotton Valley in east Texas and north Louisiana with relatively moderate risk, potentially higher return development projects and exploration prospects in south Texas and south Louisiana.
46
We have budgeted approximately $208 million for oil and gas segment capital expenditures in 2006. We continually
review drilling and other capital expenditure plans and may change the amount we spend in any area based on industry conditions and the availability of capital. We believe our cash flow from operations and sources of debt financing are sufficient to fund our 2006 planned oil and gas capital expenditures program.
During 2005, PVR made aggregate capital expenditures of $291.3 million for the Cantera Acquisition and four coal
reserve acquisitions. To finance its 2005 acquisitions, PVR borrowed $137.2 million, net of repayments, received proceeds of $126.4 million from the sale of its common units in a public offering and received a $2.6 million contribution from its general partner, which is a wholly owned subsidiary of the Company. To finance its equity investment in the Massey coal handling joint venture in 2004, PVR borrowed $26.0 million, net of repayments. In 2003, PVR received $90.0 million in proceeds from a private placement of senior unsecured notes, which it used to repay a $43.4 million term loan and to repay most of the outstanding debt on its revolving credit facility at the time.
We borrowed under our revolving credit facility, net of repayments, $3.0 million in 2005, $12.0 million in 2004 and $47.9 million in 2003. We also received cash distributions from PVR of $21.2 million in 2005, $17.3 million in 2004 and $16.8 million in 2003. Funds from both of these sources were primarily used for capital expenditures.
Long-Term Debt
Revolving Credit Facility. In December 2003, we entered into a revolving credit facility (the “Revolver”) with a syndicate of financial institutions led by JP Morgan Chase Bank N.A. The Revolver is secured by a portion of our proved oil and gas reserves. In December 2005, we amended and restated the Revolver to increase the commitment from $150 million to $200 million, increase the borrowing base from $200 million to $300 million, extend the maturity date from December 2007 to December 2010 and attain a more favorable interest rate. We paid loan issue costs of $0.5 million related to the amendment, which were capitalized in other assets and will be amortized over the remaining term of the Revolver. We had $79 million outstanding under the Revolver as of December 31, 2005, giving us approximately $121 million of available borrowing capacity. The Revolver is governed by a borrowing base calculation and is redetermined semi-annually. We have the option to elect interest at (i) the London Interbank Offering Rate (“LIBOR”) plus a Eurodollar margin ranging from 1.00 to 1.75 percent, based on the percentage of the borrowing base outstanding or (ii) the greater of the prime rate or federal funds rate plus a margin up to 0.50 percent. The weighted average interest rate on borrowings incurred during the year ended December 31, 2005, was approximately 4.99 percent. In 2005, we incurred commitment fees of $0.3 million on the unused portion of the Revolver. We capitalized $3.5 million of interest cost incurred in 2005. The Revolver allows for the issuance of up to $20 million of letters of credit, of which $0.3 million were issued as of December 31, 2005.
The financial covenants under the Revolver require us to maintain levels of debt-to-earnings and impose dividend
limitation restrictions. The Revolver contains various other covenants that limit, among other things, our ability to incur indebtedness, grant liens, make certain loans, acquisitions and investments, make any material change to the nature of our business, acquire another company or enter into a merger or sale of assets, including the sale or transfer of interests in our subsidiaries. As of December 31, 2005, we were in compliance with all of our covenants under the Revolver.
Line of Credit. We have a $5.0 million line of credit with a financial institution, which had no borrowings against it as
of December 31, 2005. The line of credit is effective through June 2006 and is renewable annually. We have an option to elect either a fixed rate LIBOR loan, a floating rate LIBOR loan or a base rate (as determined by the financial institution) loan.

47
PVR Revolving Credit Facility. Concurrent with the closing of the Cantera Acquisition in March 2005, PVR entered
into a new unsecured $260 million, five-year credit agreement with a syndicate of financial institutions led by PNC Bank, National Association. The new agreement consisted of a $150 million revolving credit facility (the “PVR Revolver”) that matures in March 2010 and a $110 million term loan. As of December 31, 2005, PVR had $172.0 million outstanding under the PVR Revolver. A portion of the PVR Revolver and the term loan were used to fund the Cantera Acquisition and to repay borrowings under PVR’s previous credit facility. Proceeds of $126.4 million received from a subsequent public offering of 2.5 million of PVR’s common units in March 2005 and a $2.6 million contribution from its general partner were used to repay the $110 million term loan and a portion of the amount outstanding under the PVR Revolver. In the fourth quarter of 2004, PVR paid loan issue costs of approximately $1.2 million related to the term loan, which were recorded as interest expense in 2004. The term loan cannot be re-borrowed. The PVR Revolver is available for general Partnership purposes, including working capital, capital expenditures and acquisitions, and includes a $10 million sublimit for the issuance of letters of credit. PVR had outstanding letters of credit of $1.6 million as of December 31, 2005. In 2005, PVR incurred commitment fees of $0.4 million on the unused portion of the PVR Revolver.
In July 2005, PVR amended its credit agreement to increase the size of the commitment under the PVR Revolver from
$150 million to $300 million and to increase its one-time option (upon receipt by the credit facility’s administrative agent of commitments from one or more lenders) to expand the PVR Revolver from $100 million to $150 million. The amendment also updated certain debt covenant definitions. The interest rate under the credit agreement remained unchanged and will fluctuate based on PVR’s ratio of total indebtedness to EBITDA. Interest is payable at a base rate plus an applicable margin of up to 1.00 percent if PVR selects the base rate borrowing option under the credit agreement or at a rate derived from LIBOR plus an applicable margin ranging from 1.00 percent to 2.00 percent if PVR selects the LIBOR-based borrowing option. The other terms of the credit agreement remained unchanged.
The financial covenants under the PVR Revolver require PVR to maintain specified levels of debt to consolidated
EBITDA and consolidated EBITDA to interest. The financial covenants restricted PVR’s borrowing capacity under the PVR Revolver to approximately $106.5 million as of December 31, 2005. The PVR Revolver prohibits PVR from making distributions to its unitholders (including us) and distributions in excess of available cash if any potential default or event of default, as defined in the PVR Revolver, occurs or would result from the distribution. In addition, the PVR Revolver contains various covenants that limit, among other things, PVR’s ability to incur indebtedness, grant liens, make certain loans, acquisitions and investments, make any material change to the nature of its business, acquire another company or enter into a merger or sale of assets, including the sale or transfer of interests in its subsidiaries. As of December 31, 2005, PVR was in compliance with all of its covenants in the PVR Revolver.
PVR Senior Unsecured Notes. As of December 31, 2005, PVR owed $83.0 million under its senior unsecured notes (the
“PVR Notes”). The PVR Notes initially bore interest at a fixed rate of 5.77 percent and mature over a ten-year period ending in March 2013, with semi-annual principal and interest payments. The PVR Notes contain various covenants similar to those contained in the PVR Revolver. The PVR Notes have an equal priority of payment as all other unsecured indebtedness of PVR, including the PVR Revolver. As of December 31, 2005, PVR was in compliance with all of its covenants under the PVR Notes.
In conjunction with the closing of the Cantera Acquisition, PVR amended the PVR Notes to allow PVR to enter the
natural gas midstream business and to increase certain covenant coverage ratios, including the debt to EBITDA test. In exchange for this amendment, PVR agreed to a 0.25 percent increase in the fixed interest rate on the PVR Notes, from 5.77 percent to 6.02 percent. The amendment to the PVR Notes also requires that the Partnership obtain an annual confirmation of its credit rating, with a 1.00 percent increase in the interest rate payable on the PVR Notes in the event its credit rating falls below investment grade. On March 15, 2005, PVR’s investment grade credit rating was confirmed by Dominion Bond Rating Services.
Interest Rate Swaps. In September 2005, PVR entered into two interest rate swap agreements with notional amounts
totaling $60 million to establish a fixed rate on the LIBOR-based portion of the outstanding balance of the PVR Revolver until March 2010 (the “PVR Revolver Swaps”). PVR pays a fixed rate of 4.22 percent on the notional amount, and the counterparties pay a variable rate equal to the three-month LIBOR. Settlements on the PVR Revolver Swaps are recorded as interest expense. The PVR Revolver Swap agreements were designated as cash flow hedges. Accordingly, the effective portion of the change in the fair value of the swap transactions is recorded each period in other comprehensive income. The ineffective portion of the change in fair value, if any, is recorded to current period earnings in interest expense. After considering the applicable margin of 1.25 percent in effect as of December 31, 2005, the total interest rate on the $60 million portion of the PVR Revolver borrowings covered by the PVR Revolver Swaps was 5.47 percent at December 31, 2005.

48
In March 2003, PVR entered into an interest rate swap agreement with an original notional amount of $30 million to
hedge a portion of the fair value of the PVR Notes (the “PVR Senior Notes Swap”). The PVR Senior Notes Swap agreement was settled on June 30, 2005, for $0.8 million. The settlement was paid in cash by PVR to the counterparty in July 2005. The $0.8 million negative fair value adjustment of the carrying amount of long-term debt will be amortized as interest expense over the remaining term of the PVR Notes using the effective interest rate method.
Future Capital Needs and Commitments
We are committed to increasing value to our shareholders by conducting a balanced program of investment in all three of
our business segments. In the oil and gas segment, we expect to continue to execute a program combining relatively low risk, moderate return development drilling in Appalachia, Mississippi, east Texas and north Louisiana with higher risk, higher return exploration and development drilling in the onshore Gulf Coast, supplemented periodically with acquisitions. In addition to our continuing conventional development program, we have continued to expand our presence in unconventional plays by developing CBM gas reserves in Appalachia. By employing horizontal drilling techniques, we expect to continue to increase the value from the CBM-prospective properties we own. We are committed to expanding our oil and gas reserves and production primarily by using our ability to generate exploratory prospects and development drilling programs internally.
Part of PVR’s strategy is to make acquisitions which increase cash available for distribution to its unitholders. Long-
term cash requirements for asset acquisitions are expected to be funded by several sources, including cash flows from operating activities, borrowings under credit facilities and the issuance of additional equity and debt securities. PVR’s ability to make these acquisitions in the future will depend in part on the availability of debt financing and on its ability to periodically use equity financing through the issuance of new common units, which will depend on various factors, including prevailing market conditions, interest rates and its financial condition and credit rating at the time.
In 2006, we anticipate making total capital expenditures, excluding acquisitions, of approximately $241 million. All of
these expenditures are expected to be funded primarily by operating cash flow. Additional funding will be provided as needed from our Revolver, under which we had $121 million of borrowing capacity as of December 31, 2005, or from the PVR Revolver, under which PVR had $128 million of borrowing capacity as of December 31, 2005.
Budgeted capital expenditures for 2006 are $208 million in the oil and gas segment and $3.4 million for corporate
building and software improvements. The Partnership anticipates making capital expenditures, excluding acquisitions, in 2006 of $16 to $18 million for coal services projects and other property and equipment and $8 to $10 million for natural gas midstream system expansion projects. The Partnership believes that cash flow provided by operating activities will be sufficient to fund these capital expenditures.
Contractual Obligations
Our contractual cash obligations as of December 31, 2005, were as follows:
Payments Due by Period
Total
Less Than1 Year
1-3 Years
4-5 Years
Thereafter
(in thousands) Revolving credit facility $ 79,000 $ — $ 79,000 $ — $ — PVR revolving credit facility 172,000 — — 172,000 — PVR senior unsecured notes 83,700 8,300 23,700 27,500 24,200Rental commitments (1) 9,566 4,412 3,953 1,201 — Firm transportation agreements 10,854 1,769 2,690 2,162 4,233
Total contractual cash obligations $ 355,120 $ 14,481 $ 109,343 $ 202,863 $ 28,433
(1) Rental commitments primarily relate to equipment and building leases. Also included are PVR’s rental commitments, which primarily relate to reserve-based properties which are, or are intended to be, subleased by the Partnership to third parties. The obligation expires when the property has been mined to exhaustion or the lease has been canceled. The timing of mining by third party operators is difficult to estimate due to numerous factors. We believe the obligation after five years cannot be reasonably estimated; however, based on current knowledge, we believe PVR will incur approximately $0.6 million in rental commitments in perpetuity until the reserves have been exhausted.
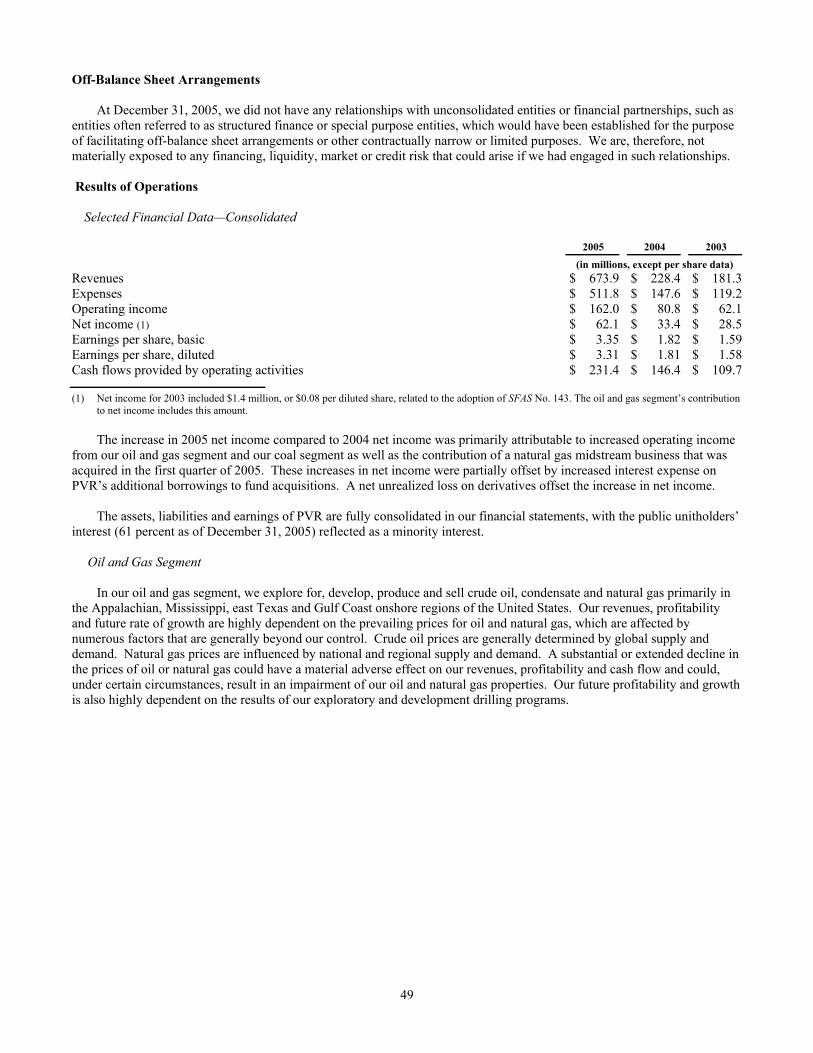
49
Off-Balance Sheet Arrangements
At December 31, 2005, we did not have any relationships with unconsolidated entities or financial partnerships, such as entities often referred to as structured finance or special purpose entities, which would have been established for the purpose of facilitating off-balance sheet arrangements or other contractually narrow or limited purposes. We are, therefore, not materially exposed to any financing, liquidity, market or credit risk that could arise if we had engaged in such relationships. Results of Operations
Selected Financial Data—Consolidated
2005
2004
2003
(in millions, except per share data) Revenues $ 673.9 $ 228.4 $ 181.3Expenses $ 511.8 $ 147.6 $ 119.2Operating income $ 162.0 $ 80.8 $ 62.1Net income (1) $ 62.1 $ 33.4 $ 28.5Earnings per share, basic $ 3.35 $ 1.82 $ 1.59Earnings per share, diluted $ 3.31 $ 1.81 $ 1.58Cash flows provided by operating activities $ 231.4 $ 146.4 $ 109.7
(1) Net income for 2003 included $1.4 million, or $0.08 per diluted share, related to the adoption of SFAS No. 143. The oil and gas segment’s contribution to net income includes this amount.
The increase in 2005 net income compared to 2004 net income was primarily attributable to increased operating income
from our oil and gas segment and our coal segment as well as the contribution of a natural gas midstream business that was acquired in the first quarter of 2005. These increases in net income were partially offset by increased interest expense on PVR’s additional borrowings to fund acquisitions. A net unrealized loss on derivatives offset the increase in net income.
The assets, liabilities and earnings of PVR are fully consolidated in our financial statements, with the public unitholders’
interest (61 percent as of December 31, 2005) reflected as a minority interest.
Oil and Gas Segment
In our oil and gas segment, we explore for, develop, produce and sell crude oil, condensate and natural gas primarily in the Appalachian, Mississippi, east Texas and Gulf Coast onshore regions of the United States. Our revenues, profitability and future rate of growth are highly dependent on the prevailing prices for oil and natural gas, which are affected by numerous factors that are generally beyond our control. Crude oil prices are generally determined by global supply and demand. Natural gas prices are influenced by national and regional supply and demand. A substantial or extended decline in the prices of oil or natural gas could have a material adverse effect on our revenues, profitability and cash flow and could, under certain circumstances, result in an impairment of our oil and natural gas properties. Our future profitability and growth is also highly dependent on the results of our exploratory and development drilling programs.

50
Operations and Financial Summary—Oil and Gas Segment
Year Ended December 31, 2005, Compared to Year Ended December 31, 2004
2005
2004
% Change
2005
2004
(in thousands, except as noted) (per MMcfe)* Production
Natural gas (MMcf) 25,550 22,079 16%
Oil and condensate (MBbls) 302 396 (24)%
Total production (MMcfe) 27,362 24,455 12%
Revenues
Natural gas
Revenue received for production $ 226,476 $ 142,192 59% $ 8.86 $ 6.44 Effect of hedging activities (14,049) (3,770) 273% (0.55) (0.17)
Net revenue realized 212,427 138,422 53% 8.31 6.27
Oil and condensate
Revenue received for production 14,649 15,480 (5)% 48.51 39.09 Effect of hedging activities (857) (2,116) (59)% (2.84) (5.34)
Net revenue realized 13,792 13,364 3% 45.67 33.75 Other income 600 (114) (626)%
Total revenues 226,819 151,672 50% 8.29 6.20
Expenses
Operating 17,300 13,949 24% 0.63 0.57 Taxes other than income 13,188 9,325 41% 0.48 0.38 General and administrative 9,264 8,336 11% 0.34 0.34
Production costs 39,752 31,610 26% 1.45 1.29 Exploration 40,917 26,058 57% 1.50 1.07 Depreciation, depletion and
amortization 45,885 35,886 28% 1.68 1.47 Loss on assets held for sale — 7,541 — — 0.31 Impairment of properties 4,785 655 631% 0.17 0.03
Total expenses 131,339 101,750 29% 4.80 4.17
Operating income $ 95,480 $ 49,922 91% $ 3.49 $ 2.03
* Natural gas revenues are shown per Mcf, oil and condensate revenues are shown per Bbl, and all other amounts are shown per Mcfe.
Production. The increase in production was primarily due to new production from increased drilling, including the
HCBM play in Appalachia, the Selma Chalk development play in Mississippi and the Cotton Valley play in east Texas and north Louisiana. Production increases were partially offset by the first quarter 2005 sale of oil and gas properties in west Texas, production shut-ins along the Gulf Coast as a result of hurricanes Katrina and Rita and normal field declines.
Revenues. Approximately 93 percent and 90 percent of production in 2005 and 2004 was natural gas. Increased natural
gas production accounted for approximately $21.8 million, or 29 percent, of the increase in natural gas revenues. Increased realized prices for natural gas accounted for approximately $52.2 million, or 71 percent, of the increase in natural gas revenues. The average realized price received for natural gas during 2005 was $8.31 per Mcf compared with $6.27 per Mcf in 2004, a 33 percent increase. The average realized oil price received was $45.67 per barrel in 2005, up 35 percent from $33.75 per barrel in 2004. This price increase for crude oil was offset by a decline in oil production compared to 2004 due to the January 2005 sale of oil and gas properties in West Texas, production shut-ins along the Gulf Coast as a result of hurricanes Katrina and Rita and normal field declines.
Due to the volatility of crude oil and natural gas prices, we hedge the price received for certain sales volumes through
the use of swaps and costless collars in accordance with our hedging policy. Gains and losses from hedging activities are included in revenues when the hedged production occurs. In 2005, approximately 42 percent of our natural gas was hedged

51
using costless collars at an average floor price of $5.61 per MMbtu and an average ceiling price of $8.10 per MMbtu. We also hedged approximately 31 percent of our crude oil production using a fixed price swap in January 2005 and a costless collar beginning in March 2005 and continuing for the remainder of the year. The swap price was $30.59 per barrel, and the costless collar had a floor price of $42.00 per barrel and a ceiling price of $47.75 per barrel. We recognized a loss on settled derivative contracts accounted for as cash flow hedges of $14.9 million in 2005, compared with a loss of $5.9 million in 2004.
Expenses. The oil and gas segment’s aggregate operating costs and expenses in 2005 increased primarily due to increases in operating expenses, exploration expenses, taxes other than income, general and administrative expenses, impairments and depreciation, depletion and amortization (“DD&A”) expenses. These increases were partially offset by the absence in 2005 of a loss on assets held for sale.
Operating expenses increased primarily due to additional compressor rentals at fields with increased production,
downhole maintenance charges associated with HCBM wells in Appalachia and Selma Chalk wells in Mississippi and increased water disposal costs.
Exploration expenses for the years ended December 31, 2005 and 2004, consisted of the following (in thousands):
2005
2004
Dry hole costs $ 11,379 $ 10,284Seismic 7,739 9,225Unproved leasehold write-offs 17,761 5,726Other 4,038 823
Total $ 40,917 $ 26,058
Exploration expenses increased primarily due to higher unproved leasehold write-offs and dry hole costs for an
unsuccessful exploratory well in south Texas. The balance of the increase in exploration expenses was primarily due to unproved leasehold write-offs relating to expired lease options and increased delay rentals on certain leaseholds in south Louisiana.
Taxes other than income increased due to higher severance taxes as a result of increased production and higher gas
prices. General and administrative expenses increased primarily due to increased payroll costs as a result of wage increases and new personnel. Impairment charges in 2005 related to changes in estimates of reserve bases of certain fields in Texas.
Oil and gas DD&A expenses increased due to the 12 percent increase in equivalent production and as a result of higher
average depletion rates. The average depletion rate increased from $1.47 per Mcfe in 2004 to $1.67 per Mcfe in 2005 as a result of a greater percentage of production coming from relatively higher cost. HCBM and Cotton Valley wells and general price inflation for equipment, services and tubulars used for drilling and development, combined with depreciation on new pipeline infrastructure placed in service during the fourth quarter of 2004.
A loss of $7.5 million was recognized in 2004 for the write-down to realizable value of a group of non-core properties in
west Texas that were sold in January 2005.

52
Year Ended December 31, 2004, Compared to Year Ended December 31, 2003
2004
2003
% Change
2004
2003
(in thousands, except as noted) (per MMcfe)* Production
Natural gas (MMcf) 22,079 20,094 10%
Oil and condensate (MBbls) 396 625 (37)%
Total production (MMcfe) 24,455 23,844 3%
Revenues
Natural gas
Revenue received for production $ 142,192 $ 112,193 27% $ 6.44 $ 5.59 Effect of hedging activities (3,770) (5,578) (32)% (0.17) (0.28)
Net revenue realized 138,422 106,615 30% 6.27 5.31
Oil and condensate
Revenue received for production 15,480 17,355 (11)% 39.09 27.77 Effect of hedging activities (2,116) (539) 293% (5.34) (0.86)
Net revenue realized 13,364 16,816 (21)% 33.75 26.91 Other income (114) 1,391
Total revenues 151,672 124,822 22% 6.20 5.23
Expenses
Lease operating 13,949 12,115 15% 0.57 0.51 Taxes other than income 9,325 9,515 (2)% 0.38 0.40 General and administrative 8,336 7,804 7% 0.34 0.33
Production costs 31,610 29,434 7% 1.29 1.24 Exploration 26,058 15,503 68% 1.07 0.65 Depreciation, depletion and
amortization 35,886 33,164 8% 1.47 1.39 Loss on assets held for sale 7,541 — — 0.31 — Impairment of properties 655 406 61% 0.03 0.02
Total expenses 101,750 78,507 30% 4.17 3.30
Income before income taxes $ 49,922 $ 46,315 8% $ 2.03 $ 1.93
* Natural gas revenues are shown per Mcf, oil and condensate revenues are shown per Bbl, and all other amounts are shown per Mcfe.
Production. The increase in production was primarily due to production from successful exploratory drilling projects in
south Louisiana, the Cotton Valley play in east Texas and north Louisiana, increased drilling in our Selma Chalk fields in Mississippi and our HCBM drilling project in Appalachia, offset primarily by production declines in several south Texas fields and a pipeline curtailment in Appalachia.
Revenues. Increased realized prices for natural gas and crude oil accounted for approximately $24.0 million, or 89
percent, of the increase in total oil and gas revenues from 2003 to 2004. Approximately 90 percent of our 2004 production was natural gas, for which the average realized price received was $6.27 per Mcf compared with $5.31 per Mcf in 2003, an 18 percent increase. The average realized oil price received was $33.75 per barrel for 2004, up 25 percent from $26.91 per barrel in 2003.
Due to the volatility of crude oil and natural gas prices, we hedge the price received for certain sales volumes through
the use of swaps and costless collars in accordance with our hedging policy. Gains and losses from hedging activities are included in revenues when the hedged production occurs. In 2004, approximately 36 percent of our natural gas was hedged, primarily using costless collars, at an average floor price of $3.93 per MMbtu and ceiling price of $5.99 per MMbtu. We also hedged approximately 45 percent of our crude oil production using fixed price swaps with an average price of $29.78 per barrel. We recognized a loss on settled hedging activities of $5.9 million in 2004, compared with a loss of $6.1 million in 2003.

53
Operating expenses. The oil and gas segment’s aggregate operating costs and expenses in 2004 increased primarily due
to higher exploration expenses, higher DD&A and a loss on assets held for sale.
Exploration expenses for the years ended December 31, 2004 and 2003, consisted of the following (in thousands):
2004
2003
Dry hole costs $ 10,284 $ 5,186 Seismic 9,225 8,713 Unproved leasehold write-offs 5,726 802 Other 823 802
Total $ 26,058 $ 15,503
Exploration expenses increased primarily due to increased unproved leasehold write-offs related to expiring lease
options in south Texas, unproved leasehold write-offs and dry hole costs related to our CBM pilot drilling program in Kansas and higher dry hole costs resulting from drilling seven unsuccessful exploratory wells in 2004 compared to three unsuccessful exploratory attempts in 2003.
As a percentage of revenues, taxes other than income decreased from 7.6 percent in 2003 to 6.1 percent in 2004. The
decrease was primarily due to a severance tax refund received in the fourth quarter of 2004 related to the south Texas properties acquired in 2003.
Oil and gas DD&A increased primarily due to higher production as discussed previously, and the weighted average
DD&A rate increased from $1.39 per Mcfe in 2003 to $1.49 per Mcfe in 2004. The increase in the weighted average DD&A rate was the result of a greater percentage of production coming from relatively higher cost HCBM and Gulf Coast wells and the new pipeline infrastructure placed in service during the fourth quarter of 2004.
A loss of $7.5 million loss on assets held for sale resulted from the write-down to realizable value of a group of non-core
properties in west Texas which were sold in January 2005.
Coal Segment
The coal segment includes coal reserves, coal services, timber and other land assets. The Partnership enters into leases with various third-party operators for the right to mine coal reserves on the Partnership’s properties in exchange for royalty payments. The Partnership does not operate any mines. Approximately 83 percent of coal royalty revenues in 2005 and 79 percent of coal royalty revenues in 2004 were derived from coal mined on PVR’s properties under leases containing royalty rates based on the higher of a fixed base price or a percentage of the gross sales price. The balance of coal royalty revenues for the respective periods was derived from coal mined on PVR’s properties under leases containing fixed royalty rates which escalate annually. In addition to coal royalty revenues, the Partnership generates coal services revenues from fees charged to lessees for the use of its coal preparation and loading facilities and from equity earnings from the Massey joint venture. The Partnership also generates revenues from the sale of standing timber on its properties, the collection of wheelage fees and oil and natural gas well royalties.
Coal royalties are impacted by several factors that PVR generally cannot control. The number of tons mined annually is
determined by an operator’s mining efficiency, labor availability, geologic conditions, access to capital, ability to market coal and ability to arrange reliable transportation to the end-user. The possibility exists that new legislation or regulations may be adopted which may have a significant impact on the mining operations of the Partnership’s lessees or their customers’ ability to use coal and may require PVR, its lessees or its lessees’ customers to change operations significantly or incur substantial costs.
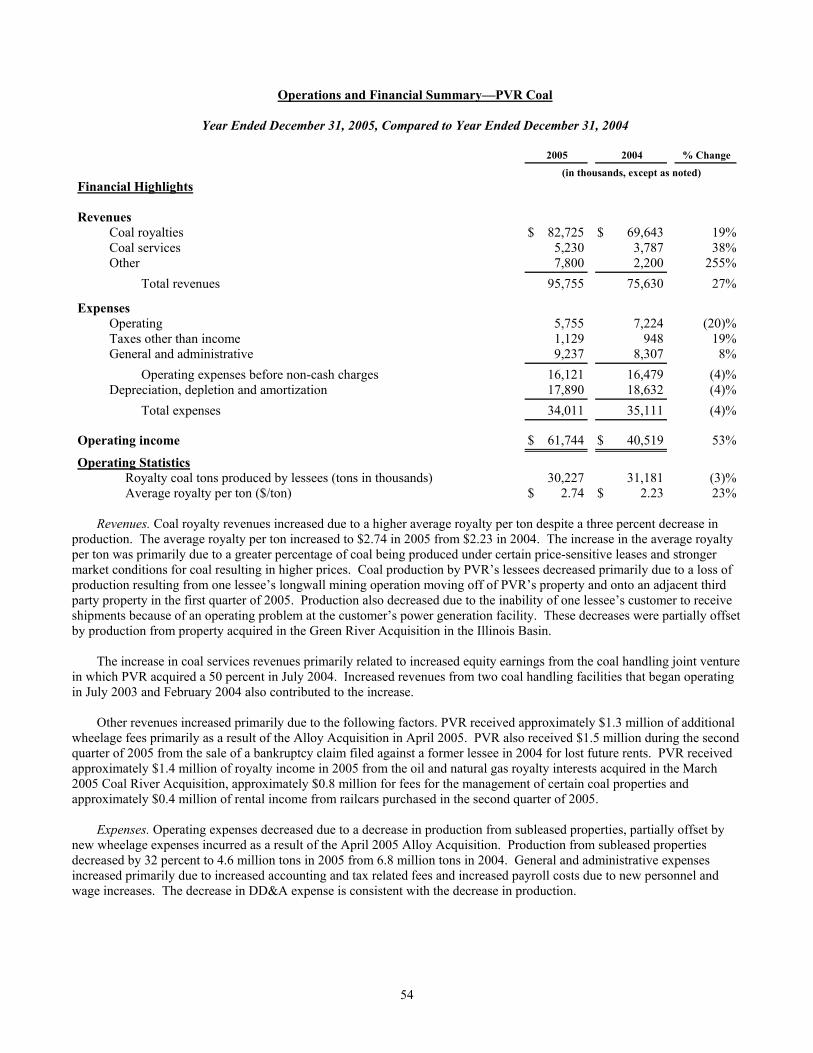
54
Operations and Financial Summary—PVR Coal
Year Ended December 31, 2005, Compared to Year Ended December 31, 2004
2005
2004
% Change
(in thousands, except as noted) Financial Highlights
Revenues
Coal royalties $ 82,725 $ 69,643 19%Coal services 5,230 3,787 38%Other 7,800 2,200 255%
Total revenues 95,755 75,630 27%
Expenses
Operating 5,755 7,224 (20)%Taxes other than income 1,129 948 19%General and administrative 9,237 8,307 8%
Operating expenses before non-cash charges 16,121 16,479 (4)%Depreciation, depletion and amortization 17,890 18,632 (4)%
Total expenses 34,011 35,111 (4)%
Operating income $ 61,744 $ 40,519 53%
Operating Statistics
Royalty coal tons produced by lessees (tons in thousands) 30,227 31,181 (3)%Average royalty per ton ($/ton) $ 2.74 $ 2.23 23%
Revenues. Coal royalty revenues increased due to a higher average royalty per ton despite a three percent decrease in
production. The average royalty per ton increased to $2.74 in 2005 from $2.23 in 2004. The increase in the average royalty per ton was primarily due to a greater percentage of coal being produced under certain price-sensitive leases and stronger market conditions for coal resulting in higher prices. Coal production by PVR’s lessees decreased primarily due to a loss of production resulting from one lessee’s longwall mining operation moving off of PVR’s property and onto an adjacent third party property in the first quarter of 2005. Production also decreased due to the inability of one lessee’s customer to receive shipments because of an operating problem at the customer’s power generation facility. These decreases were partially offset by production from property acquired in the Green River Acquisition in the Illinois Basin.
The increase in coal services revenues primarily related to increased equity earnings from the coal handling joint venture
in which PVR acquired a 50 percent in July 2004. Increased revenues from two coal handling facilities that began operating in July 2003 and February 2004 also contributed to the increase.
Other revenues increased primarily due to the following factors. PVR received approximately $1.3 million of additional wheelage fees primarily as a result of the Alloy Acquisition in April 2005. PVR also received $1.5 million during the second quarter of 2005 from the sale of a bankruptcy claim filed against a former lessee in 2004 for lost future rents. PVR received approximately $1.4 million of royalty income in 2005 from the oil and natural gas royalty interests acquired in the March 2005 Coal River Acquisition, approximately $0.8 million for fees for the management of certain coal properties and approximately $0.4 million of rental income from railcars purchased in the second quarter of 2005.
Expenses. Operating expenses decreased due to a decrease in production from subleased properties, partially offset by
new wheelage expenses incurred as a result of the April 2005 Alloy Acquisition. Production from subleased properties decreased by 32 percent to 4.6 million tons in 2005 from 6.8 million tons in 2004. General and administrative expenses increased primarily due to increased accounting and tax related fees and increased payroll costs due to new personnel and wage increases. The decrease in DD&A expense is consistent with the decrease in production.
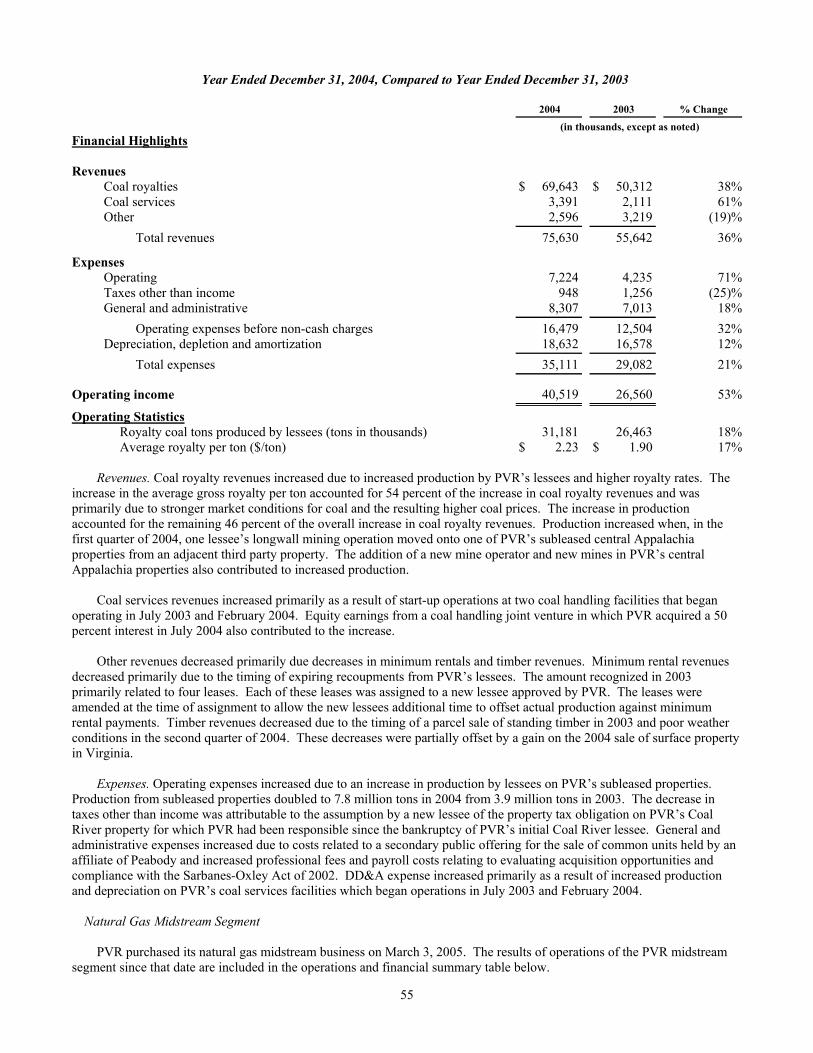
55
Year Ended December 31, 2004, Compared to Year Ended December 31, 2003
2004
2003
% Change
(in thousands, except as noted) Financial Highlights
Revenues
Coal royalties $ 69,643 $ 50,312 38%Coal services 3,391 2,111 61%Other 2,596 3,219 (19)%
Total revenues 75,630 55,642 36%
Expenses
Operating 7,224 4,235 71%Taxes other than income 948 1,256 (25)%General and administrative 8,307 7,013 18%
Operating expenses before non-cash charges 16,479 12,504 32%Depreciation, depletion and amortization 18,632 16,578 12%
Total expenses 35,111 29,082 21%
Operating income 40,519 26,560 53%
Operating Statistics
Royalty coal tons produced by lessees (tons in thousands) 31,181 26,463 18%Average royalty per ton ($/ton) $ 2.23 $ 1.90 17%
Revenues. Coal royalty revenues increased due to increased production by PVR’s lessees and higher royalty rates. The
increase in the average gross royalty per ton accounted for 54 percent of the increase in coal royalty revenues and was primarily due to stronger market conditions for coal and the resulting higher coal prices. The increase in production accounted for the remaining 46 percent of the overall increase in coal royalty revenues. Production increased when, in the first quarter of 2004, one lessee’s longwall mining operation moved onto one of PVR’s subleased central Appalachia properties from an adjacent third party property. The addition of a new mine operator and new mines in PVR’s central Appalachia properties also contributed to increased production.
Coal services revenues increased primarily as a result of start-up operations at two coal handling facilities that began operating in July 2003 and February 2004. Equity earnings from a coal handling joint venture in which PVR acquired a 50 percent interest in July 2004 also contributed to the increase.
Other revenues decreased primarily due decreases in minimum rentals and timber revenues. Minimum rental revenues
decreased primarily due to the timing of expiring recoupments from PVR’s lessees. The amount recognized in 2003 primarily related to four leases. Each of these leases was assigned to a new lessee approved by PVR. The leases were amended at the time of assignment to allow the new lessees additional time to offset actual production against minimum rental payments. Timber revenues decreased due to the timing of a parcel sale of standing timber in 2003 and poor weather conditions in the second quarter of 2004. These decreases were partially offset by a gain on the 2004 sale of surface property in Virginia.
Expenses. Operating expenses increased due to an increase in production by lessees on PVR’s subleased properties.
Production from subleased properties doubled to 7.8 million tons in 2004 from 3.9 million tons in 2003. The decrease in taxes other than income was attributable to the assumption by a new lessee of the property tax obligation on PVR’s Coal River property for which PVR had been responsible since the bankruptcy of PVR’s initial Coal River lessee. General and administrative expenses increased due to costs related to a secondary public offering for the sale of common units held by an affiliate of Peabody and increased professional fees and payroll costs relating to evaluating acquisition opportunities and compliance with the Sarbanes-Oxley Act of 2002. DD&A expense increased primarily as a result of increased production and depreciation on PVR’s coal services facilities which began operations in July 2003 and February 2004.
Natural Gas Midstream Segment
PVR purchased its natural gas midstream business on March 3, 2005. The results of operations of the PVR midstream segment since that date are included in the operations and financial summary table below.
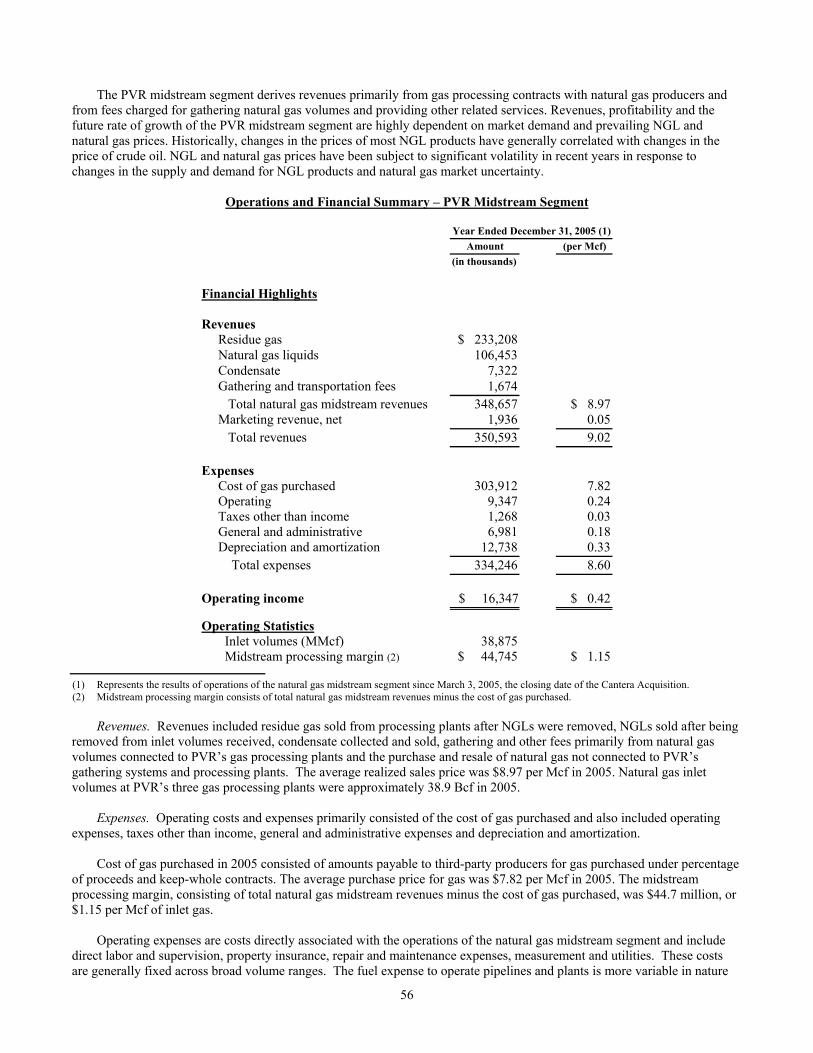
56
The PVR midstream segment derives revenues primarily from gas processing contracts with natural gas producers and
from fees charged for gathering natural gas volumes and providing other related services. Revenues, profitability and the future rate of growth of the PVR midstream segment are highly dependent on market demand and prevailing NGL and natural gas prices. Historically, changes in the prices of most NGL products have generally correlated with changes in the price of crude oil. NGL and natural gas prices have been subject to significant volatility in recent years in response to changes in the supply and demand for NGL products and natural gas market uncertainty.
Operations and Financial Summary – PVR Midstream Segment
Year Ended December 31, 2005 (1)
Amount (per Mcf)
(in thousands)
Financial Highlights Revenues Residue gas $ 233,208 Natural gas liquids 106,453 Condensate 7,322 Gathering and transportation fees 1,674 Total natural gas midstream revenues 348,657 $ 8.97 Marketing revenue, net 1,936 0.05 Total revenues 350,593 9.02 Expenses Cost of gas purchased 303,912 7.82 Operating 9,347 0.24 Taxes other than income 1,268 0.03 General and administrative 6,981 0.18 Depreciation and amortization 12,738 0.33 Total expenses 334,246 8.60 Operating income $ 16,347 $ 0.42
Operating Statistics
Inlet volumes (MMcf) 38,875 Midstream processing margin (2) $ 44,745 $ 1.15
(1) Represents the results of operations of the natural gas midstream segment since March 3, 2005, the closing date of the Cantera Acquisition. (2) Midstream processing margin consists of total natural gas midstream revenues minus the cost of gas purchased.
Revenues. Revenues included residue gas sold from processing plants after NGLs were removed, NGLs sold after being removed from inlet volumes received, condensate collected and sold, gathering and other fees primarily from natural gas volumes connected to PVR’s gas processing plants and the purchase and resale of natural gas not connected to PVR’s gathering systems and processing plants. The average realized sales price was $8.97 per Mcf in 2005. Natural gas inlet volumes at PVR’s three gas processing plants were approximately 38.9 Bcf in 2005.
Expenses. Operating costs and expenses primarily consisted of the cost of gas purchased and also included operating expenses, taxes other than income, general and administrative expenses and depreciation and amortization.
Cost of gas purchased in 2005 consisted of amounts payable to third-party producers for gas purchased under percentage
of proceeds and keep-whole contracts. The average purchase price for gas was $7.82 per Mcf in 2005. The midstream processing margin, consisting of total natural gas midstream revenues minus the cost of gas purchased, was $44.7 million, or $1.15 per Mcf of inlet gas.
Operating expenses are costs directly associated with the operations of the natural gas midstream segment and include
direct labor and supervision, property insurance, repair and maintenance expenses, measurement and utilities. These costs are generally fixed across broad volume ranges. The fuel expense to operate pipelines and plants is more variable in nature

57
and is sensitive to changes in volume and commodity prices; however, a large portion of the fuel cost is generally borne by PVR’s producers.
General and administrative expenses consisted of costs to manage the midstream assets as well as integration costs. Depreciation and amortization expenses for 2005 included $4.1 million in amortization of intangibles recognized in
connection with the Cantera Acquisition and $8.6 million of depreciation on property, plant and equipment.
Corporate and Other
Corporate and other results primarily consist of oversight and administrative functions.
Operations and Financial Summary—Corporate and Other
2005
2004
2003
(in thousands, except as noted) Revenues
Other $ 697 $ 1,123 $ 820
Total revenues 697 1,123 820
Expenses
Operating 283 600 600 Taxes other than income 420 207 551 General and administrative 11,123 9,527 10,076
Operating expenses before noncash charges 11,826 10,334 11,227 Depreciation, depletion and amortization 424 434 367
Total expenses 12,250 10,768 11,594
Operating loss $ (11,553) $ (9,645) $ (10,774)
Year Ended December 31, 2005, Compared to Year Ended December 31, 2004
Other revenues and operating expenses decreased due to the elimination of intercompany rail rental revenues and
expenses. In June 2005, a PVR subsidiary purchased railcars that one of our subsidiaries had previously leased from a third party. After the purchase, our subsidiary began leasing the railcars from the PVR subsidiary. Intercompany revenues and operating expense of $0.4 million, representing railcar rental for the last half of 2005, were eliminated upon consolidation. The corporate and other results table above includes both sides of this elimination.
General and administrative expenses increased primarily due to changes in director compensation and increased payroll
costs as a result of wage increases and new personnel.
Year Ended December 31, 2004, Compared to Year Ended December 31, 2003
Other revenues increased due to increased rail rental income. Taxes other than income decreased due to a franchise tax adjustment in the first quarter of 2004. General and administrative expenses decreased primarily due to the absence in 2004 of consulting and advisory fees
incurred in 2003 related to the consideration of various shareholder proposals, offset in part by increased payroll costs for new personnel, higher insurance premiums and expenses related to compliance with the Sarbanes-Oxley Act of 2002.
Interest Expense. Interest expense increased from $7.7 million in 2004 to $15.3 million in 2005 primarily due to interest incurred on additional borrowings on the PVR Revolver and a new term loan to finance acquisitions. Seventy-eight percent and 93 percent of our direct Revolver interest costs were capitalized in 2005 and 2004 because the borrowings funded the preparation of unproved properties for their intended use. All direct credit facility interest costs were capitalized during 2003. We capitalized interest costs of $3.5 million, $2.0 million and $2.0 million in 2005, 2004 and 2003.
Unrealized Loss on Derivatives. In 2005, we had a noncash unrealized loss on derivatives of $14.9 million which included a $13.9 million noncash unrealized loss for mark-to-market adjustments on certain derivative agreements, a $0.7

58
million noncash unrealized loss for mark-to-market adjustments on a natural gas basis swap for which we have elected not to use hedge accounting and a $0.3 million noncash net unrealized loss for changes in effectiveness of open commodity price hedges related to the natural gas midstream segment and the oil and gas segment. The $13.9 million unrealized loss primarily represented the change in the market value of derivative agreements between the time PVR entered into the agreements in January 2005 and the time they qualified for hedge accounting after closing the Cantera Acquisition in March 2005. When PVR agreed to acquire Cantera, management wanted to ensure an acceptable return on the investment. PVR achieved this objective by entering into pre-closing commodity price derivative agreements covering approximately 75 percent of the net volume of NGLs expected to be sold from April 2005 through December 2006. Rising commodity prices resulted in a significant change in the market value of those derivative agreements before they qualified for hedge accounting. This change in market value resulted in a noncash charge to earnings for the unrealized loss on derivatives. Upon qualifying for hedge accounting, changes in the derivative agreements’ market value are accounted for as other comprehensive income or loss to the extent they are effective rather than having a direct effect on net income. Cash settlements with the counterparties related to the derivative agreements will occur monthly in the future over the remaining life of the agreements, and PVR will receive a correspondingly higher or lower amount for the physical sale of the commodity over the same period. Environmental Matters
Extensive federal, state and local laws govern oil and natural gas operations, regulate the discharge of materials into the
environment or otherwise relate to the protection of the environment. Numerous governmental departments issue rules and regulations to implement and enforce such laws that are often difficult and costly to comply with and which carry substantial administrative, civil and even criminal penalties for failure to comply. Some laws, rules and regulations relating to protection of the environment may, in certain circumstances, impose “strict liability” for environmental contamination, rendering a person liable for environmental and natural resource damages and cleanup costs without regard to negligence or fault on the part of such person. Other laws, rules and regulations may restrict the rate of oil and natural gas production below the rate that would otherwise exist or even prohibit exploration or production activities in sensitive areas. In addition, state laws often require some form of remedial action to prevent pollution from former operations, such as closure of inactive pits and plugging of abandoned wells. The regulatory burden on the oil and natural gas industry increases its cost of doing business and consequently affects its profitability. These laws, rules and regulations affect our operations, as well as the oil and gas exploration and production industry in general. We believe that we are in substantial compliance with current applicable environmental laws, rules and regulations and that continued compliance with existing requirements will not have a material adverse impact on us. Nevertheless, changes in existing environmental laws or the adoption of new environmental laws have the potential to adversely affect our operations.
The operations of the Partnership’s coal lessees and natural gas midstream segment are subject to environmental laws and regulations adopted by various governmental authorities in the jurisdictions in which these operations are conducted. The terms of the Partnership’s coal property leases impose liability for all environmental and reclamation liabilities arising under those laws and regulations on the relevant lessees. The lessees are bonded and have indemnified the Partnership against any and all future environmental liabilities. The Partnership regularly visits coal properties under lease to monitor lessee compliance with environmental laws and regulations and to review mining activities. Management believes that the operations of the Partnership’s coal lessees and natural gas midstream segment will comply with existing regulations and does not expect any material impact on its financial condition or results of operations.
As of December 31, 2005 and 2004, the Partnership’s environmental liabilities included $2.5 million and $1.5 million, which represents PVR’s best estimate of the liabilities as of those dates related to the coal and natural gas midstream businesses. The Partnership has reclamation bonding requirements with respect to certain unleased and inactive properties. Given the uncertainty of when the reclamation area will meet regulatory standards, a change in this estimate could occur in the future.
See Item 1, “Business—Regulation” for a more detailed discussion of environmental laws and regulations affecting our business. Recent Accounting Pronouncements
See Note 3 in the Notes to Consolidated Financial Statements for a description of recent accounting pronouncements.
Forward-Looking Statements
Certain statements contained herein that are not descriptions of historical facts are “forward-looking” statements within the meaning of Section 27A of the Securities Act of 1933, as amended, and Section 21E of the Securities Exchange Act of

59
1934, as amended. Because such statements include risks, uncertainties and contingencies, actual results may differ materially from those expressed or implied by such forward-looking statements. These risks, uncertainties and contingencies include, but are not limited to, the risks set forth in Item 1A, “Risk Factors.”
Additional information concerning these and other factors can be found in our press releases and public periodic filings
with the SEC. Many of the factors that will determine our future results are beyond the ability of management to control or predict. Readers should not place undue reliance on forward-looking statements, which reflect management’s views only as of the date hereof. We undertake no obligation to revise or update any forward-looking statements, or to make any other forward-looking statements, whether as a result of new information, future events or otherwise. Item 7A Quantitative and Qualitative Disclosures About Market Risk Interest Rate Risk
As of December 31, 2005, we had $79 million of long-term debt outstanding under the Revolver. The Revolver matures
in December 2007 and is governed by a borrowing base calculation that is re-determined semi-annually. We have the option to elect interest at (i) LIBOR plus a Eurodollar margin ranging from 1.00 percent to 1.75 percent, based on the percentage of the borrowing base outstanding or (ii) the greater of the prime rate or federal funds rate plus a margin up to 0.50 percent. As a result, our 2006 interest costs will fluctuate based on short-term interest rates relating to our Revolver.
As of December 31, 2005, PVR’s $83.0 million of outstanding indebtedness under the Notes carried a fixed interest rate
throughout its term. PVR executed an interest rate derivative transaction in March 2003 to effectively convert the interest rate on one-third of the amount outstanding under the Notes from a fixed rate of 5.77 percent to a floating rate of LIBOR plus 2.36 percent. The interest rate swap was accounted for as a fair value hedge in compliance with SFAS No. 133, as amended by SFAS No. 137 and SFAS No. 138. The interest rate swap was settled on June 30, 2005, for $0.8 million. The settlement was paid in cash by PVR to the counterparty in July 2005.
As of December 31, 2005, PVR’s $172.0 million of outstanding indebtedness under the PVR Revolver carried a variable
interest rate throughout its term. PVR executed interest rate derivative transactions in September 2005 to effectively convert the interest rate on $60 million of the amount outstanding under the PVR Revolver from a LIBOR-based floating rate to a fixed rate of 4.22 percent plus the applicable margin. The interest rate swaps are accounted for as cash flow hedges in accordance with SFAS No. 133.
Price Risk Management
Our price risk management program permits the utilization of derivative financial instruments (such as futures, forwards,
option contracts and swaps) to seek to mitigate the price risks associated with fluctuations in natural gas and crude oil prices as they relate to our anticipated production. These financial instruments are generally designated as cash flow hedges and accounted for in accordance with SFAS No. 133, as amended by SFAS No. 137, SFAS No. 138 and SFAS No. 139. The derivative financial instruments are placed with major financial institutions that we believe are of minimum credit risk. The fair value of our price risk management assets are significantly affected by energy price fluctuations. See the discussion and table in Note 11 in the Notes to Consolidated Financial Statements for a description of our hedging program and a listing of open derivative agreements and their fair value as of December 31, 2005.
When PVR agreed to acquire Cantera, management wanted to ensure an acceptable return on the investment. This
objective was supported by entering into pre-closing commodity price derivative agreements covering approximately 75 percent of the net volume of NGLs expected to be sold from April 2005 through December 2006. Rising commodity prices resulted in an increase in the market value of those derivative agreements before they qualified for hedge accounting. This change in market value resulted in a $13.9 million noncash charge to earnings for the unrealized loss on these derivatives. Subsequent to the Cantera Acquisition, PVR evaluated the effectiveness of the derivative agreements in relation to the underlying commodities and designated the agreements as cash flow hedges in accordance with SFAS No. 133. Upon qualifying for hedge accounting, changes in the market value of the derivative agreements are accounted for as other comprehensive income or loss to the extent they are effective, rather than as a direct impact on net income. SFAS No. 133 requires the Partnership to continue to measure the effectiveness of the derivative agreements in relation to the underlying commodity being hedged, and it will be required to record the ineffective portion of the agreements in net income for the respective period. For 2005, PVR reported a $0.6 million net unrealized gain on derivatives for the ineffective portion of the agreements as of December 31, 2005. Cash settlements with the counterparties to the derivative agreements will occur monthly over the life of the agreements, and PVR will receive a correspondingly higher or lower amount for the physical sale

60
of the commodity over the same period. In addition, PVR entered into derivative agreements for NGLs and natural gas to further protect its margins subsequent to the Cantera Acquisition. These derivative agreements have been designated as cash flow hedges. See Note 11 in the Notes to Consolidated Financial Statements for a description of PVR’s hedging program and a listing of open derivative agreements and their fair value.

61
Item 8 Financial Statements and Supplementary Data
PENN VIRGINIA CORPORATION AND SUBSIDIARIES
INDEX TO FINANCIAL SECTION Page Report of Independent Registered Public Accounting Firm on the Financial Statements 62 Report of Independent Registered Public Accounting Firm on Internal Control over Financial Reporting 63 Financial Statements and Supplementary Data 65

62
REPORT OF INDEPENDENT REGISTERED PUBLIC ACCOUNTING FIRM
The Board of Directors and Shareholders Penn Virginia Corporation:
We have audited the accompanying consolidated balance sheets of Penn Virginia Corporation, a Virginia corporation, and subsidiaries (the “Company”) as of December 31, 2005 and 2004, and the related consolidated statements of income, shareholders’ equity and comprehensive income, and cash flows for each of the years in the three-year period ended December 31, 2005. These consolidated financial statements are the responsibility of the Company’s management. Our responsibility is to express an opinion on these consolidated financial statements based on our audits.
We conducted our audits in accordance with the standards of the Public Company Accounting Oversight Board (United
States). Those standards require that we plan and perform the audit to obtain reasonable assurance about whether the financial statements are free of material misstatement. An audit includes examining, on a test basis, evidence supporting the amounts and disclosures in the financial statements. An audit also includes assessing the accounting principles used and significant estimates made by management, as well as evaluating the overall financial statement presentation. We believe that our audits provide a reasonable basis for our opinion.
In our opinion, the consolidated financial statements referred to above present fairly, in all material respects, the
financial position of Penn Virginia Corporation and subsidiaries as of December 31, 2005 and 2004, and the results of their operations and their cash flows for each of the years in the three-year period ended December 31, 2005, in conformity with U.S. generally accepted accounting principles.
As discussed in Note 3 to the consolidated financial statements, effective January 1, 2003, the Company changed its
method of accounting for asset retirement obligations. We also have audited, in accordance with the standards of the Public Company Accounting Oversight Board (United
States), the effectiveness of the Company’s internal control over financial reporting as of December 31, 2005, based on criteria established in Internal Control—Integrated Framework issued by the Committee of Sponsoring Organizations of the Treadway Commission, and our report dated March 14, 2006, expressed an unqualified opinion on management’s assessment of, and the effective operation of, internal control over financial reporting.
KPMG LLP Houston, Texas March 14, 2006

63
REPORT OF INDEPENDENT REGISTERED PUBLIC ACCOUNTING FIRM
The Board of Directors and Shareholders Penn Virginia Corporation:
We have audited management’s assessment, included in the accompanying Management’s Annual Report on Internal Control Over Financial Reporting (Item 9A(b)), that Penn Virginia Corporation, a Virginia corporation, and its subsidiaries (the “Company”) maintained effective internal control over financial reporting as of December 31, 2005, based on criteria established in Internal Control—Integrated Framework issued by the Committee of Sponsoring Organizations of the Treadway Commission (COSO). The Company’s management is responsible for maintaining effective internal control over financial reporting and for its assessment of the effectiveness of internal control over financial reporting. Our responsibility is to express an opinion on management’s assessment and an opinion on the effectiveness of the Company’s internal control over financial reporting based on our audit.
We conducted our audit in accordance with the standards of the Public Company Accounting Oversight Board (United
States). Those standards require that we plan and perform the audit to obtain reasonable assurance about whether effective internal control over financial reporting was maintained in all material respects. Our audit included obtaining an understanding of internal control over financial reporting, evaluating management’s assessment, testing and evaluating the design and operating effectiveness of internal control, and performing such other procedures as we considered necessary in the circumstances. We believe that our audit provides a reasonable basis for our opinion.
A company’s internal control over financial reporting is a process designed to provide reasonable assurance regarding
the reliability of financial reporting and the preparation of financial statements for external purposes in accordance with generally accepted accounting principles. A company’s internal control over financial reporting includes those policies and procedures that (1) pertain to the maintenance of records that, in reasonable detail, accurately and fairly reflect the transactions and dispositions of the assets of the company; (2) provide reasonable assurance that transactions are recorded as necessary to permit preparation of financial statements in accordance with generally accepted accounting principles, and that receipts and expenditures of the company are being made only in accordance with authorizations of management and directors of the company; and (3) provide reasonable assurance regarding prevention or timely detection of unauthorized acquisition, use, or disposition of the company’s assets that could have a material effect on the financial statements.
Because of its inherent limitations, internal control over financial reporting may not prevent or detect misstatements.
Also, projections of any evaluation of effectiveness to future periods are subject to the risk that controls may become inadequate because of changes in conditions, or that the degree of compliance with the policies or procedures may deteriorate.
In our opinion, management’s assessment that the Company maintained effective internal control over financial
reporting as of December 31, 2005, is fairly stated, in all material respects, based on criteria established in Internal Control—Integrated Framework issued by the Committee of Sponsoring Organizations of the Treadway Commission (COSO). Also, in our opinion, the Company maintained, in all material respects, effective internal control over financial reporting as of December 31, 2005, based on criteria established in Internal Control—Integrated Framework issued by the Committee of Sponsoring Organizations of the Treadway Commission (COSO).
In conducting management’s assessment of the effectiveness of the Company’s internal control over financial reporting
as of December 31, 2005, management has excluded its natural gas midstream business, which was acquired on March 3, 2005 and which now operates as PVR Midstream LLC, as permitted by the Securities and Exchange Commission. PVR Midstream LLC’s total assets were $241.9 million, or approximately 19 percent of the Company’s total assets, as of December 31, 2005, and PVR Midstream LLC’s total revenues were $350.6 million, or approximately 52 percent of the Company’s total revenues, for the year ended December 31, 2005. Our audit of internal control over financial reporting of the Company also excluded an evaluation of the internal control over financial reporting of PVR Midstream LLC.

64
We also have audited, in accordance with the standards of the Public Company Accounting Oversight Board (United
States), the consolidated balance sheets of the Company as of December 31, 2005 and 2004, and the related consolidated statements of income, shareholders’ equity and comprehensive income, and cash flows for each of the years in the three-year period ended December 31, 2005, and our report dated March 14, 2006 expressed an unqualified opinion on those consolidated financial statements.
KPMG LLP Houston, Texas March 14, 2006

65
PENN VIRGINIA CORPORATION AND SUBSIDIARIES
CONSOLIDATED STATEMENTS OF INCOME (in thousands, except share data)
Year Ended December 31,
2005
2004
2003
Revenues
Natural gas $ 212,427 $ 138,422 $ 106,615Oil and condensate 13,792 13,364 16,816 Natural gas midstream 348,657 — — Coal royalties 82,725 69,643 50,312 Other 16,263 6,996 7,541
673,864 228,425 181,284 Expenses
Cost of gas purchased 303,912 — — Operating 32,685 21,773 16,864 Exploration 40,917 26,058 15,589 Taxes other than income 16,005 10,480 11,322 General and administrative 36,606 26,170 24,893 Depreciation, depletion and amortization 76,937 54,952 50,109 Loss on assets held for sale — 7,541 — Impairment of oil and gas properties 4,785 655 406
511,847 147,629 119,183
Operating Income 162,017 80,796 62,101 Other income (expense)
Interest expense (15,318) (7,672) (5,304)Interest income and other 1,332 1,101 1,238 Unrealized loss on derivatives (14,885) — —
Income from operations before minority interest, income taxes and cumulative effect of change in accounting principle 133,146 74,225 58,035
Minority interest 30,389 19,023 12,510 Income tax expense 40,669 21,847 18,366
Income from operations before cumulative effect of change in accounting principle 62,088 33,355 27,159
Cumulative effect of change in accounting principle, net of taxes of $734 — — 1,363
Net Income $ 62,088 $ 33,355 $ 28,522
Income from operations before cumulative effect of change in accounting principle per share, basic $ 3.35 $ 1.82 $ 1.51
Cumulative effect of change in accounting principle per share, basic — — 0.08
Net income per share, basic $ 3.35 $ 1.82 $ 1.59
Income from operations before cumulative effect of change in accounting principle per share, diluted $ 3.31 $ 1.81 $ 1.50
Cumulative effect of change in accounting principle per share, diluted — — 0.08
Net income per share, diluted $ 3.31 $ 1.81 $ 1.58
Weighted average shares outstanding, basic 18,546 18,306 17,976 Weighted average shares outstanding, diluted 18,732 18,467 18,112
See accompanying notes to consolidated financial statements.
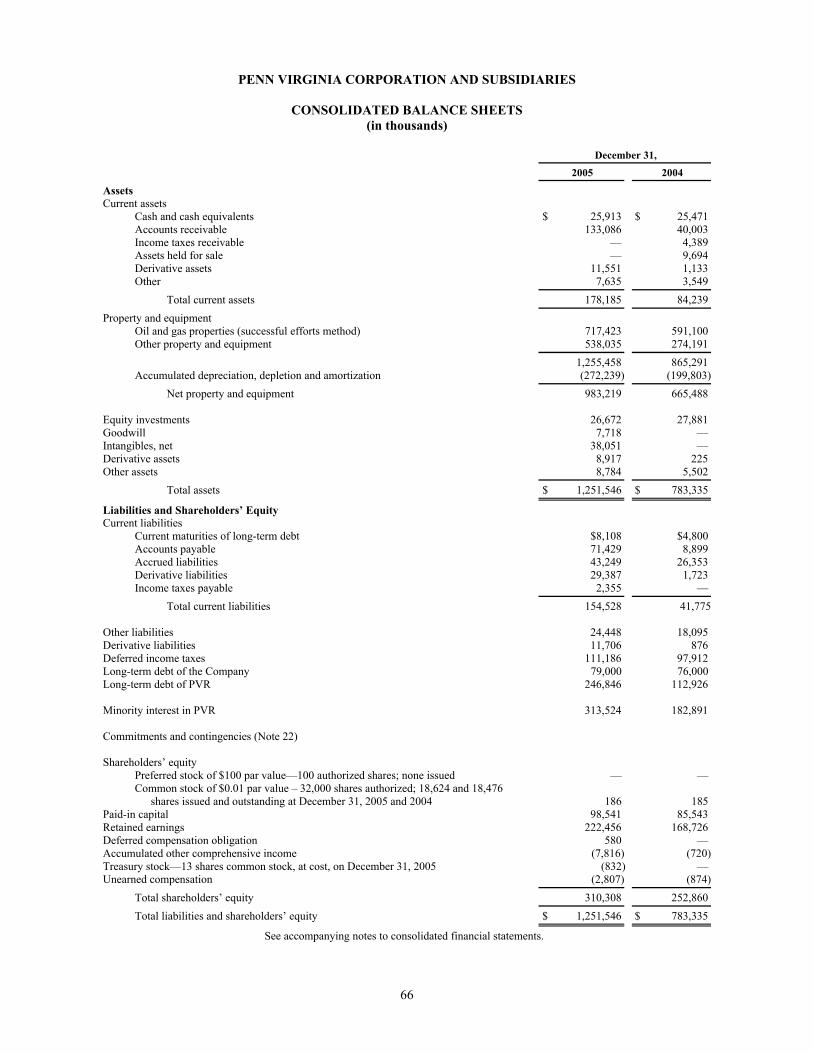
66
PENN VIRGINIA CORPORATION AND SUBSIDIARIES
CONSOLIDATED BALANCE SHEETS (in thousands)
December 31,
2005
2004
Assets Current assets
Cash and cash equivalents $ 25,913 $ 25,471 Accounts receivable 133,086 40,003 Income taxes receivable — 4,389 Assets held for sale — 9,694 Derivative assets 11,551 1,133 Other 7,635 3,549
Total current assets 178,185 84,239
Property and equipment
Oil and gas properties (successful efforts method) 717,423 591,100 Other property and equipment 538,035 274,191
1,255,458 865,291
Accumulated depreciation, depletion and amortization (272,239) (199,803)
Net property and equipment 983,219 665,488 Equity investments 26,672 27,881 Goodwill 7,718 — Intangibles, net 38,051 — Derivative assets 8,917 225 Other assets 8,784 5,502
Total assets $ 1,251,546 $ 783,335
Liabilities and Shareholders’ Equity Current liabilities
Current maturities of long-term debt $8,108 $4,800 Accounts payable 71,429 8,899 Accrued liabilities 43,249 26,353 Derivative liabilities 29,387 1,723 Income taxes payable 2,355 —
Total current liabilities 154,528 41,775
Other liabilities 24,448 18,095 Derivative liabilities 11,706 876 Deferred income taxes 111,186 97,912 Long-term debt of the Company 79,000 76,000 Long-term debt of PVR 246,846 112,926 Minority interest in PVR 313,524 182,891 Commitments and contingencies (Note 22) Shareholders’ equity
Preferred stock of $100 par value—100 authorized shares; none issued — — Common stock of $0.01 par value – 32,000 shares authorized; 18,624 and 18,476
shares issued and outstanding at December 31, 2005 and 2004 186 185 Paid-in capital 98,541 85,543 Retained earnings 222,456 168,726 Deferred compensation obligation 580 — Accumulated other comprehensive income (7,816) (720)Treasury stock—13 shares common stock, at cost, on December 31, 2005 (832) — Unearned compensation (2,807) (874)
Total shareholders’ equity 310,308 252,860
Total liabilities and shareholders’ equity $ 1,251,546 $ 783,335
See accompanying notes to consolidated financial statements.

67
PENN VIRGINIA CORPORATION AND SUBSIDIARIES
CONSOLIDATED STATEMENTS OF SHAREHOLDERS’ EQUITY AND COMPREHENSIVE INCOME (in thousands)
Shares
OutstandingCommon
Stock Paid-inCapital
RetainedEarnings
Deferred Compensation
Obligation
Accumulated Other
Comprehensive Income
Treasury Stock
Unearned Compensation
and ESOP
Total Shareholders’
Equity Comprehensive Income (Loss)
Balance at December 31, 2002 17,893 $ 55,915 $ 11,436 $ 123,189 $ — $ (1,661) $ — $ (923) $ 187,956 Dividends paid ($0.45 per share) — — — (8,092) — — — — (8,092) Stock issued as compensation 14 42 229 — — — — — 271 PVR units issued as compensation, net — — 172 — — — — (71) 101 Exercise of stock options 198 619 2,364 — — — — — 2,983 Allocation of ESOP shares — — 296 — — — — 200 496 Net income — — — 28,522 — — — — 28,522 $ 28,522 Other comprehensive loss, net of tax — — — — — (589) — — (589) (589) Balance at December 31, 2003 18,105 56,576 14,497 143,619 — (2,250) — (794) 211,648 $ 27,933 Dividends paid ($0.45 per share) — — — (8,248) — — — — (8,248) Recognition of gain on conversion of
subordinated PVR units to common — — 6,393 — — — — — 6,393 Stock issued as compensation 7 — 239 — — — — — 239 PVR units issued as compensation, net — — 440 — — — — (139) 301 Vesting of restricted units — — (354) — — — — — (354) Exercise of stock options 364 4 7,814 — — — — — 7,818 Allocation of ESOP shares — — 119 — — — — 59 178 Change in par value — (56,395) 56,395 — — — — — — Net income — — — 33,355 — — — — 33,355 $ 33,355 Other comprehensive gain, net of tax — — — — — 1,530 — — 1,530 1,530 Balance at December 31, 2004 18,476 185 85,543 168,726 — (720) — (874) 252,860 $ 34,885 Dividends paid ($0.45 per share) — — — (8,358) — — — — (8,358)Recognition of gain on conversion of
subordinated PVR units to common — — 6,393 — — — — — 6,393 Stock issued as compensation 29 — 1,656 — — — — (1,507) 149 PVR units issued as compensation, net — — 1,123 — — — — (426) 697 Vesting of restricted units — — (315) — — — — — (315) Exercise of stock options 119 1 3,561 — — — — — 3,562 Issuance of 24 thousand shares to
deferred compensation plans — — 580 — 580 — (832) — 328 Net income — — — 62,088 — — — — 62,088 $ 62,088 Other comprehensive loss, net of tax — — — — — (7,096) — — (7,096) (7,096) Balance at December 31, 2005 18,624 $ 186 $ 98,541 $ 222,456 $ 580 $ (7,816) $ (832) $ (2,807) $ 310,308 $ 54,992
See accompanying notes to consolidated financial statements
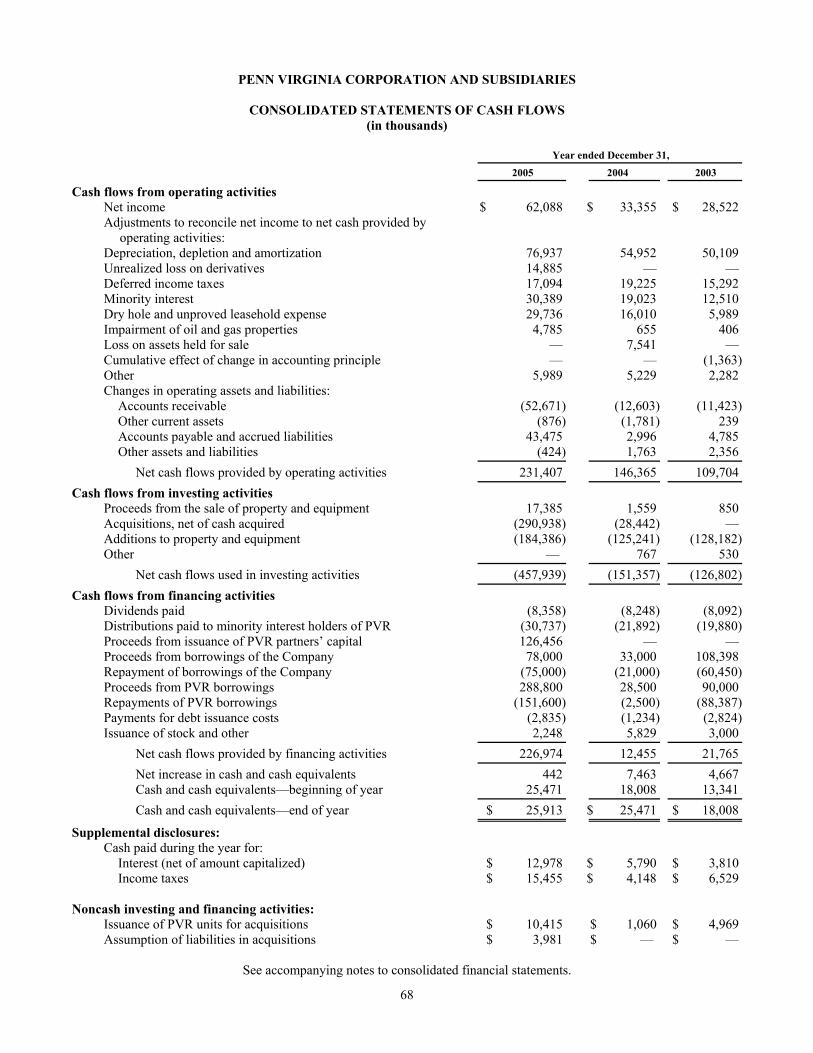
68
PENN VIRGINIA CORPORATION AND SUBSIDIARIES
CONSOLIDATED STATEMENTS OF CASH FLOWS (in thousands)
Year ended December 31,
2005
2004
2003
Cash flows from operating activities
Net income $ 62,088 $ 33,355 $ 28,522 Adjustments to reconcile net income to net cash provided by
operating activities:
Depreciation, depletion and amortization 76,937 54,952 50,109 Unrealized loss on derivatives 14,885 — — Deferred income taxes 17,094 19,225 15,292 Minority interest 30,389 19,023 12,510 Dry hole and unproved leasehold expense 29,736 16,010 5,989 Impairment of oil and gas properties 4,785 655 406 Loss on assets held for sale — 7,541 — Cumulative effect of change in accounting principle — — (1,363)Other 5,989 5,229 2,282 Changes in operating assets and liabilities:
Accounts receivable (52,671) (12,603) (11,423)Other current assets (876) (1,781) 239 Accounts payable and accrued liabilities 43,475 2,996 4,785 Other assets and liabilities (424) 1,763 2,356
Net cash flows provided by operating activities 231,407 146,365 109,704
Cash flows from investing activities
Proceeds from the sale of property and equipment 17,385 1,559 850 Acquisitions, net of cash acquired (290,938) (28,442) — Additions to property and equipment (184,386) (125,241) (128,182)Other — 767 530
Net cash flows used in investing activities (457,939) (151,357) (126,802)
Cash flows from financing activities
Dividends paid (8,358) (8,248) (8,092)Distributions paid to minority interest holders of PVR (30,737) (21,892) (19,880)Proceeds from issuance of PVR partners’ capital 126,456 — — Proceeds from borrowings of the Company 78,000 33,000 108,398 Repayment of borrowings of the Company (75,000) (21,000) (60,450)Proceeds from PVR borrowings 288,800 28,500 90,000 Repayments of PVR borrowings (151,600) (2,500) (88,387)Payments for debt issuance costs (2,835) (1,234) (2,824)Issuance of stock and other 2,248 5,829 3,000
Net cash flows provided by financing activities 226,974 12,455 21,765
Net increase in cash and cash equivalents 442 7,463 4,667 Cash and cash equivalents—beginning of year 25,471 18,008 13,341
Cash and cash equivalents—end of year $ 25,913 $ 25,471 $ 18,008
Supplemental disclosures:
Cash paid during the year for:
Interest (net of amount capitalized) $ 12,978 $ 5,790 $ 3,810 Income taxes $ 15,455 $ 4,148 $ 6,529
Noncash investing and financing activities:
Issuance of PVR units for acquisitions $ 10,415 $ 1,060 $ 4,969 Assumption of liabilities in acquisitions $ 3,981 $ — $ —
See accompanying notes to consolidated financial statements.

69
PENN VIRGINIA CORPORATION AND SUBSIDIARIES
NOTES TO CONSOLIDATED FINANCIAL STATEMENTS 1. Nature of Operations
Penn Virginia Corporation (“Penn Virginia,” the “Company,” “we,” “us” or “our”) is an independent energy company that is engaged in three primary business segments. Our oil and gas segment explores for, develops, produces and sells crude oil, condensate and natural gas primarily in the eastern and Gulf Coast onshore areas of the United States. Our coal segment and natural gas midstream segment operate through our 39 percent ownership in Penn Virginia Resource Partners, L.P. (the “Partnership” or “PVR”). Due to our control of the general partner of PVR, the financial results of the Partnership are included in our consolidated financial statements. However, PVR functions with a capital structure that is independent of the Company, consisting of its own debt instruments and publicly traded common units.
In the coal segment, PVR does not operate any mines. Instead, PVR enters into leases with various third-party operators which give those operators the right to mine coal reserves on PVR’s land in exchange for royalty payments. PVR also provides fee-based infrastructure facilities to some of its lessees and third parties to generate coal services revenues. These facilities include coal loading facilities, preparation plants and coal handling facilities located at end-user industrial plants. PVR also sells timber growing on its land.
PVR purchased its midstream business on March 3, 2005, through the acquisition of Cantera Gas Resources, LLC (see
Note 4). As a result of this acquisition, PVR owns and operates a significant set of midstream assets. PVR’s midstream business derives revenues primarily from gas processing contracts with natural gas producers and from fees charged for gathering natural gas volumes and providing other related services. 2. Penn Virginia Resource Partners, L.P.
Penn Virginia Resource Partners, L.P. is a Delaware limited partnership formed by Penn Virginia in July 2001 primarily to engage in the business of managing coal properties in the United States. The Partnership completed an initial public offering (the “IPO”) in October 2001. Effective with the closing of the IPO, Penn Virginia, through its wholly owned subsidiaries, received common and subordinated units and a two percent general partnership interest in the ownership of the Partnership. The general partner of the Partnership is Penn Virginia Resource, GP, LLC, a wholly owned subsidiary of Penn Virginia.
The common units have preferences over the subordinated units with respect to cash distributions; accordingly, we
accounted for the sale of the Partnership IPO units as a sale of a minority interest. At the time of the IPO, we computed a gain of $25.6 million under SEC Staff Accounting Bulletin Topic 5-H, Accounting for Sales of Stock by a Subsidiary, which is included in minority interest. As our subordinated units convert to common units, we recognize the gain calculated at the time of the IPO as paid-in capital. All subordinated units will convert to common units after September 30, 2006, if certain criteria are met. In November 2004, 25 percent of the subordinated units converted to common units, and another 25 percent converted in November 2005, as the Partnership met certain requirements to qualify for early conversion. In each of the years 2005 and 2004, $6.4 million of the $25.6 million gain were reclassified from minority interest to paid-in capital upon the conversion of the subordinated units, for a cumulative reclassification of $12.8 million as of December 31, 2005.
In March 2005, PVR issued 2.5 million common units in a public offering, which constitutes a sale of a minority interest
from our perspective. We also issued common units in connection with an acquisition in 2005 (see Note 4). We will recognize an additional gain resulting from the March 2005 public offering and issuance of units in the acquisition when the final tranche of subordinated units converts to common units. At that time, the gain will be reclassified from minority interest to paid-in capital. 3. Summary of Significant Accounting Policies
Principles of Consolidation
The consolidated financial statements include the accounts of Penn Virginia, all wholly-owned subsidiaries of the Company and the Partnership, of which we indirectly owned the sole two percent general partner interest and an approximately 37 percent limited partner interest as of December 31, 2005. Penn Virginia Resource GP, LLC, a wholly-owned subsidiary of Penn Virginia, serves as the Partnership’s general partner and controls the Partnership. We own and operate our undivided oil and gas reserves through our wholly-owned subsidiaries. We account for our undivided interest in

70
oil and gas properties using the proportionate consolidation method, whereby our share of assets, liabilities, revenues and expenses is included in the appropriate classification in the financial statements. Intercompany balances and transactions have been eliminated in consolidation. In the opinion of management, all adjustments have been reflected that are necessary for a fair presentation of the consolidated financial statements. Certain amounts have been reclassified to conform to the current year’s presentation.
Use of Estimates
Preparation of the accompanying consolidated financial statements in conformity with accounting principles generally accepted in the United States of America requires management to make estimates and assumptions that affect the reported amounts of assets and liabilities in the consolidated financial statements and the reported amounts of revenues and expenses during the reporting period. Actual results could differ from those estimates.
Cash and Cash Equivalents
We consider all highly liquid investments purchased with an original maturity of three months or less to be cash equivalents.
Oil and Gas Properties
We use the successful efforts method to account for our oil and gas properties. Under this method, costs of acquiring properties, costs of drilling successful exploration wells and development costs are capitalized. Geological and geophysical costs, delay rentals and costs to drill exploratory wells that do not find proved reserves are expensed as oil and gas exploration. We will carry the costs of an exploratory well as an asset if the well found a sufficient quantity of reserves to justify its capitalization as a producing well and as long as we are making sufficient progress assessing the reserves and the economic and operating viability of the project. For certain projects, it may take us more than one year to evaluate the future potential of the exploratory well and make a determination of its economic viability. Our ability to move forward on a project may be dependent on gaining access to transportation or processing facilities or obtaining permits and government or partner approval, the timing of which is beyond our control. In such cases, exploratory well costs remain suspended as long as we are actively pursuing access to necessary facilities and access to such permits and approvals and believe they will be obtained. We assess the status of suspended exploratory well costs on a quarterly basis. As of December 31, 2005, we had capitalized $1.7 million of exploratory drilling costs related to three exploratory wells which reached total depth in 2005 but were under evaluation for commercial viability.
The following table describes the changes in capitalized exploratory drilling costs that are pending the determination of
proved reserves (in thousands, except wells):
2005 2004 2003
# Wells Cost # Wells Cost # Wells Cost
Balance at beginning of period 3 $ 3,079 10 $ 3,785 — $ — Additions pending determination of proved reserves 3 1,670 3 3,079 10 3,785 Reclassifications to wells, equipment and facilities based on
the determination of proved reserves — — — — — — Charged to expense (3) (3,079) (10) (3,785) — —
Balance at end of period 3 $ 1,670 3 $ 3,079 10 $ 3,785
We had no capitalized exploratory drilling costs that had been under evaluation for a period greater than one year as of
December 31, 2005, 2004 or 2003. The costs of unproved leaseholds, including associated interest costs for the period activities were in progress to bring
projects to their intended use, are capitalized pending the results of exploration efforts. Interest costs associated with non-producing leases were capitalized in the amounts of $3.5 million, $2.0 million and $2.0 million in 2005, 2004 and 2003. We regularly assess on a property-by-property basis the impairment of individual unproved properties whose acquisition costs are significant. Unproved properties whose acquisition costs are not significant are amortized in the aggregate over the lesser of five years or the average remaining lease term. As exploration work progresses and the reserves on significant properties are proven, capitalized costs of these properties will be subject to depreciation and depletion. If the exploration work is unsuccessful, the capitalized costs of the properties related to the unsuccessful work will be expensed. The timing of any writedowns of these unproven properties, if warranted, depends upon the nature, timing and extent of future exploration and
71
development activities and their results. As of December 31, 2005 and 2004, unproved leasehold costs amounted to $66.7 million and $61.0 million.
Asset Retirement Obligations
In accordance with Statement of Financial Accounting Standards (“SFAS”) No. 143, Accounting for Asset Retirement Obligations, we recognize the fair value of a liability for an asset retirement obligation (an “ARO”) in the period in which it is incurred. The associated asset retirement costs are capitalized as part of the carrying cost of the asset. See Note 13, “Asset Retirement Obligations.” The amount of an ARO and the costs capitalized equal the estimated future cost to satisfy the abandonment obligation using current prices that are escalated by an assumed inflation factor after discounting the future cost back to the date that the abandonment obligation was incurred using an assumed cost of funds for us. After recording these amounts, the ARO is accreted to its future estimated value using the same assumed cost of funds, and the additional capitalized costs will be depreciated over the productive life of the assets. Both the accretion and the depreciation are included in depreciation, depletion and amortization on our consolidated statements of income.
We identified all required asset retirement obligations and determined the fair value of these obligations on January 1,
2003, the date of adoption. The determination of fair value was based upon regional market and specific well or mine type information. In conjunction with the initial application of SFAS No. 143, we recorded a cumulative effect of change in accounting principle, net of taxes, of approximately $1.4 million as an increase to income in 2003. We recorded an additional liability of $0.6 million as of December 31, 2005, upon adoption of Financial Accounting Standards Board Interpretation No. 47, Accounting for Conditional Asset Retirement Obligations, relating to our natural gas midstream segment.
Other Property and Equipment
Other property and equipment consist of PVR’s ownership in coal fee mineral interests, PVR’s royalty interest in oil and natural gas wells, processing facilities, gathering systems, compressor stations and related equipment. Property and equipment are carried at cost and include expenditures for additions and improvements, such as roads and land improvements, which increase the productive lives of existing assets. Maintenance and repair costs are expensed as incurred. Renewals and betterments, which extend the useful life of the properties, are capitalized. We compute depreciation and amortization of property and equipment using the straight-line or declining balance method over the estimated useful life of each asset as follows:
Useful Life
Gathering systems 15 years Compressor stations 5-15 years Processing plants 15 years Other property and equipment 3-20 years
We deplete coal properties on an area-by-area basis at a rate based upon the cost of the mineral properties and estimated
proven and probable tonnage therein. From time to time, PVR carries out core-hole drilling activities on coal properties in order to ascertain the quality and quantity of the coal contained in those properties. These core-drilling activities are expensed as incurred. When we retire or sell an asset, we remove its cost and related accumulated depreciation and amortization from the balance sheet. We record the difference between the net book value (net of any related asset retirement obligation) and proceeds from disposition as gain or loss.
Impairment of Long-Lived Assets
We review long-lived assets to be held and used whenever events or circumstances indicate that the carrying value of those assets may not be recoverable. We recognize an impairment loss when the carrying amount of an asset exceeds the sum of the undiscounted estimated future cash flows. In this circumstance, we recognize an impairment loss equal to the difference between the carrying value and the fair value of the asset. Fair value is estimated to be the present value of future net cash flows from proved reserves, discounted utilizing a rate commensurate with the risk and remaining lives for the respective oil and gas properties.

72
Equity Investments
We use the equity method of accounting to account for the Partnership’s investment in a coal handling joint venture,
recording the initial investment at cost. Subsequently, the carrying amount of the investment is increased to reflect the Partnership’s share of income of the investee and is reduced to reflect the Partnership’s share of losses of the investee or distributions received from the investee as the joint venture reports them. The Partnership’s share of earnings or losses from the investment is included in other revenues on the consolidated statements of income. Other revenues also include amortization of the amount of PVR’s equity investment that exceeds its portion of the underlying equity in net assets. PVR records amortization over the life of coal services contracts in place at the time of the Partnership’s initial investment.
Goodwill
We had approximately $7.7 million of goodwill at December 31, 2005, based on the preliminary purchase price allocation for the Cantera Acquisition (as defined in Note 4). This amount may change based on the final purchase price allocation. The goodwill has been allocated to the midstream segment. In accordance with SFAS No. 142, Goodwill and Other Intangible Assets, goodwill will be assessed at least annually for impairment. We tested goodwill for impairment during the fourth quarter of 2005 and determined that no impairment charge was necessary.
Intangibles
Intangible assets at December 31, 2005, included $37.7 million for customer contracts and relationships acquired in the Cantera Acquisition (see Note 4) and the Alloy Acquisition (see Note 5) and $4.6 million for rights-of-way acquired in the Cantera Acquisition (see Note 4). These amounts may change based on the final Cantera Acquisition purchase price allocation as described in Note 4. Customer contracts and relationships are amortized on a straight-line basis over the expected useful lives of the individual contracts and relationships, up to 15 years. Rights-of-way are amortized on a straight-line basis over a period of 15 years. Aggregate amortization expense was $4.2 million in 2005, and there were no intangible assets or related amortization in 2004 or 2003. As of December 31, 2005, accumulated amortization of intangible assets was $4.2 million.
The following table summarizes our estimated aggregate amortization expense for the next five years (in thousands):
2006 $ 5,006 2007 4,106 2008 3,485 2009 3,219 2010 3,006 Thereafter 19,229 Total $ 38,051
Concentration of Credit Risk
Approximately 43 percent of consolidated accounts receivable at December 31, 2005, resulted from oil and gas sales and
joint interest billings to third party companies in the oil and gas industry. Approximately 48 percent resulted from natural gas midstream customers, and the remaining nine percent resulted from accrued revenues from the Partnership’s lessee production. This concentration of customers, joint interest owners and lessees may impact our overall credit risk, either positively or negatively, in that these entities may be similarly affected by changes in economic or other conditions. In determining whether or not to require collateral from a customer, joint interest owner or lessee, we analyze the entity’s net worth, cash flows, earnings and credit ratings to the extent information is available. Receivables are generally not collateralized. Historical credit losses incurred on receivables have not been significant.
Fair Value of Financial Instruments
Our financial instruments consist of cash and cash equivalents, accounts receivable, accounts payable, derivative instruments and long-term debt. The carrying values of all of these financial instruments, except for PVR’s fixed rate long-term debt, approximate fair value. The fair value of PVR’s fixed rate long-term debt at December 31, 2005 and 2004, was $81.2 million and $86.2 million.
73
Revenues
Oil and Gas Revenues. Revenues associated with sales of natural gas, crude oil, condensate and natural gas liquids are
recorded when title passes to the customer. Natural gas sales revenues from properties in which we have an interest with other producers are recognized on the basis of our net working interest (“entitlement” method of accounting). Natural gas imbalances occur when we sell more or less than our entitled ownership percentage of total natural gas production. Any amount received in excess of our share is treated as deferred revenues. If we take less than we are entitled to take, the under-delivery is recorded as a receivable. As a result of the numerous requirements necessary to gather information from purchasers or various measurement locations, calculate volumes produced, perform field and wellhead allocations and distribute and disburse funds to various working interest partners and royalty owners, the collection of revenues from oil and gas production may take up to 60 days following the month of production. Therefore, accruals for revenues and accounts receivable are made based on estimates of our share of production, particularly from properties that are operated by our partners. Since the settlement process may take 30 to 60 days following the month of actual production, our financial results include estimates of production and revenues for the related time period. Any differences, which we do not expect to be significant, between the actual amounts ultimately received and the original estimates are recorded in the period they become finalized.
Natural Gas Midstream Revenues. Revenues from the sale of natural gas liquids (“NGLs”) and residue gas are recognized when PVR sells the NGLs and residue gas produced at its gas processing plants. We recognize gathering and transportation revenues based upon actual volumes delivered. Due to the time needed to gather information from various purchasers and measurement locations and then calculate volumes delivered, the collection of natural gas midstream revenues may take up to 30 days following the month of production. Therefore, we make accruals for revenues and accounts receivable and the related cost of gas purchased and accounts payable based on estimates of natural gas purchased and NGLs and residue gas sold, and our financial results include estimates of production and revenues for the period of actual production. We record any differences, which have not historically been significant, between the actual amounts ultimately received or paid and the original estimates in the period they become finalized.
Coal Royalties. Coal royalty revenues are recognized on the basis of tons of coal sold by the Partnership’s lessees and
the corresponding revenues from those sales. Most of the Partnership’s coal leases are based on minimum monthly or annual rental payments, a minimum dollar royalty per ton and/or a percentage of the gross sales price. The remainder of PVR’s coal royalty revenues was derived from fixed royalty rate leases, which escalate annually, with pre-established minimum monthly payments. Coal royalty revenues are accrued on a monthly basis, based on PVR’s best estimates of coal mined on its properties.
Coal Services. Coal services revenues are recognized when lessees use the Partnership’s facilities for the processing,
loading and/or transportation of coal. Coal services revenues consist of fees collected from the Partnership’s lessees for the use of the Partnership’s loadout facility, coal preparation plants and dock loading facility. Coal services revenues are included in other revenues on the consolidated statements of income.
Equity Earnings. The Partnership recognizes its share of income or losses from its investment in a coal handling joint
venture as the joint venture reports them to the Partnership. Equity earnings are included in other revenues. Minimum Rentals. Most of the Partnership’s lessees are required to make minimum monthly or annual payments that are
generally recoupable over certain time periods. These minimum payments are recorded as deferred income. If the lessee recoups a minimum payment through production, the deferred income attributable to the minimum payment is recognized as coal royalty revenues. If a lessee fails to meet its minimum production for certain pre-determined time periods, the deferred income attributable to the minimum payment is recognized as minimum rental revenues and is included in other revenues.
Hedging Activities
From time to time, we enter into derivative financial instruments to mitigate our exposure to natural gas, crude oil and NGL price volatility. The derivative financial instruments, which are placed with major financial institutions that we believe are minimum credit risks, take the form of costless collars and swaps. All derivative financial instruments are recognized in the financial statements at fair value in accordance with SFAS No. 133, Accounting for Derivative Instruments and Hedging Activities, as amended by SFAS No. 137, SFAS No. 138 and SFAS No. 149 and related interpretations.
All derivative instruments are recorded on the balance sheet at fair value. The fair values of our hedging instruments are
determined based on third party forward price quotes. If the derivative does not qualify as a hedge or is not designated as a

74
hedge, the gain or loss on the derivative is recognized currently in earnings. To qualify for hedge accounting, the derivative must qualify either as a fair value hedge, cash flow hedge or foreign currency hedge. Currently, we utilize only cash flow hedges, and the remaining discussion relates exclusively to this type of derivative instrument. All hedge transactions are subject to our risk management policy, which has been reviewed and approved by our Board of Directors.
We formally document all relationships between hedging instruments and hedged items, as well as the risk-management
objective and strategy for undertaking various hedge transactions. This process includes linking all derivatives that are designated as cash flow hedges to forecasted transactions. We also formally assess, both at inception of the hedge and on an ongoing basis, whether the derivatives that are used in hedging transactions are highly effective in offsetting changes in cash flows of hedged transactions. We measure hedge effectiveness on a periodic basis. If we were to determine that a derivative were not highly effective as a hedge, or that it had ceased to be highly effective, then we would discontinue hedge accounting prospectively.
If hedge accounting is discontinued and the derivative remains outstanding, we will carry the derivative at its fair value on our consolidated balance sheet and recognize all subsequent changes in fair value on our consolidated statement of income for the period in which the change occurs. Gains and losses deferred in other comprehensive income related to cash flow hedges for which hedge accounting has been discontinued remain in other comprehensive income until the related product has been delivered. If it is probable that a hedged forecasted transaction will not occur, deferred gains or losses on the hedging instrument are recognized in earnings immediately.
Gains and losses on hedging instruments when settled are included in natural gas revenues, oil and condensate revenues,
natural gas midstream revenues or cost of gas purchased in the period that the related production is delivered.
Income Tax
We account for income taxes in accordance with the provisions of SFAS No. 109, Accounting for Income Taxes, which requires a company to recognize deferred tax liabilities and assets for the expected future tax consequences of events that have been recognized in a company’s financial statements or tax returns. Using this method, deferred tax liabilities and assets are determined based on the difference between the financial statement carrying amounts and tax bases of assets and liabilities using enacted tax rates.
Stock-Based Compensation
We have stock compensation plans that allow, among other grants, incentive and nonqualified stock options to be granted to key employees and officers and nonqualified stock options to be granted to directors (see Note 19). We account for those plans under the recognition and measurement principles of Accounting Principles Board Opinion No. 25, Accounting for Stock Issued to Employees, and related Interpretations. No stock-based employee compensation cost related to stock options is reflected in net income, as all options granted under those plans had an exercise price equal to the market value of the underlying common stock on the date of grant. The following table illustrates the effect on net income and earnings per share as if we had applied the fair value recognition provision of SFAS No. 123, Accounting for Stock-Based Compensation, to stock-based employee options (in thousands, except per share data).
Year ended December 31,
2005
2004
2003
Net income, as reported $ 62,088 $ 33,355 $ 28,522Add: Stock-based employee compensation expense included in reported net
income related to restricted units and director compensation, net of related tax effects 1,008 435 332
Less: Total stock-based employee compensation expense determined under fair value based method for all awards, net of related tax effects (1,751) (1,022) (1,119)
Pro forma net income $ 61,345 $ 32,768 $ 27,735
Earnings per share
Basic—as reported $ 3.35 $ 1.82 $ 1.59 Basic—pro forma $ 3.31 $ 1.79 $ 1.55 Diluted—as reported $ 3.31 $ 1.81 $ 1.58 Diluted—pro forma $ 3.27 $ 1.77 $ 1.53

75
New Accounting Standards
In December 2004, the Financial Accounting Standards Board (the “FASB”) issued the final revised version of SFAS
No. 123R, Share-Based Payment, which requires companies to recognize in the income statement the grant-date fair value of stock options and other equity-based compensation issued to employees. In March 2005, the SEC issued Staff Accounting Bulletin (“SAB”) No. 107, Share-Based Payment, regarding the interaction between SFAS No. 123R and certain SEC rules and regulations. We will adopt SFAS No. 123R and SAB No. 107 effective January 1, 2006. At that time, we will begin to recognize compensation expense for new grants as well as the unvested portion of then outstanding options. Expense will be recognized over the requisite vesting period. We expect that stock option grants will continue to be a significant part of employee compensation, and therefore, SFAS No. 123R will have a significant impact on our financial statements with the prospective adoption of this accounting method in January 2006. Although we have not determined the impact of SFAS No. 123R, compensation expense relating to stock options will increase.
In March 2005, the FASB released Interpretation No. 47, Accounting for Conditional Asset Retirement Obligations (“FIN 47”), which provides guidance for applying SFAS No. 143. FIN 47 became effective as of December 31, 2005, and we recorded an additional liability of $0.6 million as a result of implementing FIN 47, relating to our natural gas midstream segment. The cumulative effect of change in accounting principle of $0.1 million was not material and was included in depreciation, depletion and amortization expense in the statement of income.
In April 2005, the FASB issued FASB Staff Position No. FAS 19-1 (the “FSP”) to amend the guidance for suspended
well costs in SFAS No. 19, Financial Accounting and Reporting by Oil and Gas Producing Companies. The FSP addresses circumstances that permit the continued capitalization of exploratory well costs beyond one year. Essentially, exploratory drilling costs may continue to be capitalized beyond one year if the well has found a sufficient quantity of reserves to justify its completion as a producing well and the company is making sufficient progress assessing the reserves and the economic and operating viability of the project. We adopted the FSP on July 1, 2005. The adoption of the FSP has not had a material effect on our consolidated results of operations or financial position.
In June 2005, the FASB issued SFAS No. 154, Accounting Changes and Error Corrections – a replacement of APB
Opinion No. 20 and FASB Statement No. 3, which replaces Accounting Principles Board Opinion No. 20, Accounting Changes, and SFAS No. 3, Reporting Accounting Changes in Interim Financial Statements, and changes the requirements for the accounting for and reporting of a change in accounting principle. SFAS No. 154 requires retrospective application for voluntary changes in accounting principle unless it is impracticable to do so, and it applies to all voluntary changes in accounting principle. It also applies to changes required by an accounting pronouncement in the unusual instance that the pronouncement does not include specific transition provisions. When a pronouncement includes specific transition provisions, those provisions should be followed. SFAS No. 154 is effective for accounting changes and corrections of errors made in fiscal years beginning after December 15, 2005. Consequently, we will adopt the provisions of SFAS 154 for our fiscal year beginning January 1, 2006. We expect that adoption of the provisions of SFAS No. 154 will not have a material impact on our consolidated financial statements.
In June 2005, the EITF reached a consensus on EITF Issue No. 04-5, Determining Whether a General Partner, or the General Partners as a Group, Controls a Limited Partnership or Similar Entity When the Limited Partners Have Certain Rights. This consensus applies to voting right entities not within the scope of FASB Interpretation No. 46(R), Consolidation of Variable Interest Entities, in which the investor is the general partner in a limited partnership or functional equivalent. The EITF consensus is that the general partner in a limited partnership is presumed to control that limited partnership regardless of the extent of the general partner’s ownership interest and, therefore, should include the limited partnership in its consolidated financial statements. The general partner may overcome this presumption of control and not consolidate the entity if the limited partners have either: (a) the substantive ability to dissolve (liquidate) the limited partnership or otherwise remove the general partner through substantive kick-out rights that can be exercised without having to show cause; or (b) substantive participating rights in managing the partnership. This guidance became immediately effective upon ratification by the FASB on June 29, 2005, for all newly formed limited partnerships and for existing limited partnerships for which the partnership agreements have been modified. For general partners in all other limited partnerships, the guidance is effective no later than the beginning of the first reporting period in fiscal years beginning after December 15, 2005. We currently consolidate PVR, and the adoption of EITF Issue No. 04-5 will not change our consolidation method with respect to PVR. 4. Acquisition of Natural Gas Midstream Business
On March 3, 2005, PVR completed the acquisition (the “Cantera Acquisition”) of Cantera Gas Resources, LLC (“Cantera”), a midstream gas gathering and processing company with primary locations in Oklahoma and Texas. The

76
midstream business operates as PVR Midstream LLC, a subsidiary of Penn Virginia Operating Co., LLC, which is a wholly owned subsidiary of the Partnership. As a result of the Cantera Acquisition, PVR owns and operates a significant set of midstream assets including gas gathering pipelines and three natural gas processing facilities. The midstream business derives revenues primarily from gas processing contracts with natural gas producers and from fees charged for gathering natural gas volumes and providing other related services. The results of operations of PVR Midstream LLC since March 3, 2005, the closing date of the Cantera Acquisition, are included in the accompanying consolidated statements of income.
Cash paid in connection with the Cantera Acquisition was $199.2 million, net of cash received and including capitalized acquisition costs, which PVR funded with a $110 million term loan and with borrowings under the Partnership’s revolving credit facility. The purchase price allocation for the Cantera Acquisition has been finalized except for the settlement of certain post-closing adjustments with the seller. PVR used proceeds of $126.4 million from PVR’s sale of common units in a subsequent public offering in March 2005 and a $2.6 million contribution from the general partner to repay the term loan in full and to reduce outstanding indebtedness under its revolving credit facility. The total purchase price was allocated to the assets purchased and the liabilities assumed in the Cantera Acquisition based upon preliminary fair values on the date of acquisition as follows (in thousands):
Cash consideration paid for Cantera $ 201,326 Plus: Acquisition costs 3,275 Total purchase price 204,601 Less: Cash acquired (5,378) Total purchase price, net of cash acquired $ 199,223 Current assets acquired $ 43,697 Property and equipment acquired 145,448 Other assets acquired 645 Liabilities assumed (38,337) Intangible assets 40,052 Goodwill 7,718 Total purchase price, net of cash acquired $ 199,223
The preliminary purchase price allocation includes approximately $7.7 million of goodwill. The significant factors that
contributed to the recognition of goodwill include PVR’s entry into the natural gas midstream business and PVR’s ability to acquire an established business with an assembled workforce.
Under SFAS No. 141, Business Combinations, and SFAS No. 142, Goodwill and Other Intangible Assets, goodwill
recorded in connection with a business combination is not amortized, but rather is tested for impairment at least annually. Accordingly, the unaudited pro forma financial information presented below does not include amortization of the goodwill recorded in the Cantera Acquisition. The preliminary purchase price allocation also includes $40.1 million of intangible assets that are primarily associated with assumed customer contracts, customer relationships and rights of way. These intangible assets are being amortized over periods of up to 15 years, the period in which benefits are derived from the contracts, relationships and rights-of-way assumed, and are reviewed for impairment under SFAS No. 144, Accounting for the Impairment or Disposal of Long-Lived Assets.
The following unaudited pro forma financial information reflects our consolidated results of operations as if the Cantera
Acquisition and related debt and equity financings had occurred on January 1 of the reported period. The pro forma information includes adjustments primarily for depreciation of acquired property and equipment, amortization of intangibles and interest expense for acquisition debt. The pro forma financial information is not necessarily indicative of the results of operations as it would have been had these transactions been effected on the assumed date (in thousands, except share data).

77
Year Ended December 31,
2005 2004
Revenues $ 692,228 $ 299,950 Net income $ 62,179 $ 36,177 Net income per share, basic $ 3.35 $ 1.98 Net income per share, diluted $ 3.32 $ 1.96
5. Other Acquisitions
In the following paragraphs, all references to coal, oil and natural gas reserves and acreage acquired are unaudited.
Oil and Gas Segment
In June 2005, we acquired approximately 60,000 acres of prospective CBM leasehold rights in Wyoming County, West Virginia from Panther Energy Company, LLC for $13.3 million in cash (the “Panther Acquisition”). The leasehold acreage is within an area of mutual interest between Penn Virginia and CDX Gas, LLC (“CDX”) and is contiguous to acreage which has been successfully developed. The purchase agreement included an option for CDX to purchase a 50 percent interest in the leasehold acreage. In August 2005, CDX exercised that option and acquired its 50 percent interest for $6.6 million in cash. We began drilling on the new leasehold position in the fourth quarter of 2005.
PVR Coal Segment
In March 2005, PVR acquired lease rights to approximately 36 million tons of undeveloped coal reserves and royalty
interests in 73 producing oil and natural gas wells for $9.3 million in cash (the “Coal River Acquisition”). The coal reserves are located in the central Appalachia region of southern West Virginia. The oil and gas wells are located in eastern Kentucky and southwestern Virginia. The Coal River Acquisition was funded with long-term debt under PVR’s revolving credit facility. The coal reserves are predominantly low sulfur and high BTU content, and development will occur in conjunction with PVR’s adjacent reserves and a related loadout facility that was placed into service in 2004. The oil and gas property contains approximately 2.8 billion cubic feet equivalent (“Bcfe”) of net proved oil and gas reserves.
In April 2005, PVR acquired fee ownership of approximately 16 million tons of coal reserves for $15.0 million in cash
(the “Alloy Acquisition”). The reserves, located on approximately 8,300 acres in the central Appalachia region of West Virginia, will be produced from deep and surface mines. Production started in late 2005. Revenues were earned initially from transportation-related fees on coal mined from an adjacent property, followed by royalty revenues as the mines on PVR’s property commenced production. The seller remained on the property as the lessee and operator. The Alloy Acquisition was funded with long-term debt under PVR’s revolving credit facility.
In July 2005, PVR acquired a combination of fee ownership and lease rights to approximately 16 million tons of coal
reserves for $14.5 million (the “Wayland Acquisition”). The reserves are located in the eastern Kentucky portion of central Appalachia. The Wayland Acquisition was funded with $4 million of cash and the issuance by PVR to the seller of approximately 209,000 PVR common units. In addition, PVR assumed $0.7 million of liabilities related to the acquired property.
In July 2005, PVR also acquired fee ownership of approximately 94 million tons of coal reserves in the western
Kentucky portion of the Illinois Basin for $62.4 million in cash (the “Green River Acquisition”), and PVR assumed $3.3 million of deferred income. This coal reserve acquisition is PVR’s first in the Illinois Basin and was funded with long-term debt under PVR’s revolving credit facility. Currently, approximately 43 million tons of these coal reserves are leased to affiliates of Peabody Energy Corporation (NYSE: BTU) (“Peabody”).

78
In July 2004, the Partnership acquired from affiliates of Massey Energy Company a 50 percent interest in a joint venture
formed to own and operate end-user coal handling facilities. The purchase price was $28.4 million and was funded with long-term debt under the Partnership’s revolving credit facility. The joint venture owns coal handling facilities which unload coal shipments and store and transfer coal for three industrial coal consumers in the chemical, paper and lime production industries located in Tennessee, Virginia and Kentucky. A combination of fixed monthly fees and per ton throughput fees is paid by those consumers under long-term leases expiring between 2007 and 2019.
In December 2002, the Partnership acquired two properties containing approximately 120 million tons of coal reserves from affiliates of Peabody for 1,522,325 million common units, 1,240,833 million Class B common units (a combined common unit value of $57.0 million) and $72.5 million in cash plus closing costs (the “Peabody Acquisition”). In July 2003, all of the class B common units were converted to common units, in accordance with their terms, upon the approval of the Partnership’s common unitholders. All of the coal reserves we purchased from Peabody are being leased back to Peabody for fixed royalty rates which escalate annually over the life of production. The acquired coal reserves had existing productive operations that have been included in the Partnership’s statements of income since the closing date of the Peabody Acquisition.
The factors used to determine the fair market value of acquisitions include, but are not limited to, discounted future net
cash flows on a risked-adjusted basis, geographic location, quality of resources, potential marketability and financial condition of lessees. 6. Sale of Texas Properties
On January 24, 2005, we completed the sale of certain oil and gas properties in Texas for cash proceeds of $9.7 million. These properties were classified as assets held for sale on the consolidated balance sheet as of December 31, 2004. As part of the sale agreement, we will receive a 20 percent net profits interest in one of the properties beginning January 1, 2006. In addition, the buyer has agreed to perform a waterflood technique on this property. If the buyer fails to complete the waterflood technique within specified deadlines, then under certain conditions the buyer would be liable to pay us additional proceeds of $0.5 million. 7. Stock Split and Change in Par Value
On May 4, 2004, the Board of Directors approved a two-for-one split of the Company’s common stock in the form of a 100 percent stock dividend payable on June 10, 2004, to shareholders of record on June 3, 2004. Shareholders received one additional share of common stock for each share held on the record date. All common shares and per share data have been retroactively adjusted to reflect the stock split. Also effective June 10, 2004, the Company changed the par value of its common stock from $6.25 to $0.01 per share.

79
8. Property and Equipment
Property and equipment includes (in thousands):
December 31,
2005
2004
Oil and gas properties
Proved $ 650,696 $ 530,087 Unproved 66,727 61,013
Total oil and gas properties 717,423 591,100 Other property and equipment:
Coal properties 340,439 251,244 Midstream property and equipment 151,154 — Other property and equipment 35,767 21,150 Land 10,675 1,797
Total property and equipment 1,255,458 865,291 Accumulated depreciation, depletion and amortization (272,239) (199,803)
Net property and equipment $ 983,219 $ 665,488
9. Impairment of Oil and Gas Properties
In accordance with SFAS No. 144, we review oil and gas properties for impairment when events and circumstances indicate a decline in the recoverability of the carrying value of such properties, such as a downward revision of the reserve estimates or lower commodity prices. We estimate the future cash flows expected in connection with the properties and compare such future cash flows to the carrying amounts of the properties to determine if the carrying amounts are recoverable. When we find that the carrying amounts of the properties exceed their estimated undiscounted future cash flows, we adjust the carrying amounts of the properties to their fair value as determined by discounting their estimated future cash flows. The factors used to determine fair value include, but are not limited to, estimates of proved reserves, future commodity prices, the timing of future production and capital expenditures and a discount rate commensurate with the risk reflective of the lives remaining for the respective oil and gas properties.
For the year ended December 31, 2005, we recognized a pretax charge of $4.8 million related to the impairment of
certain properties in Texas. This impairment was a result of downward reserve revisions on the properties. For the year ended December 31, 2004, we recognized a pretax charge of $0.7 million related to the impairment of
certain West Virginia horizontal coalbed methane (“CBM”) properties. This impairment was associated with a CBM well completed in 2004 in northern West Virginia that had insufficient natural gas reserves to support the historical cost basis of the property.
For the year ended December 31, 2003, we recognized a pretax charge of $0.4 million related to the impairment of
certain south Texas properties. These impairments were a result of downward reserve revisions on these properties caused by the poor performance of these wells near the end of their productive lives. 10. Equity Investments
As described in Note 5, “Other Acquisitions,” the Partnership acquired a 50 percent interest in Coal Handling Solutions, LLC, a joint venture formed to own and operate end-user coal handling facilities. The Partnership accounts for the investment under the equity method of accounting. In 2004, the original cash investment of $28.4 million was capitalized. At December 31, 2005, the Partnership’s equity investment totaled $26.6 million, which exceeded its portion of the underlying equity in net assets by $10.7 million. The difference is being amortized to equity earnings over the life of coal services contracts in place at the time of the acquisition. In accordance with the equity method, the Partnership recognized equity earnings of $1.1 million in 2005 and $0.4 million in 2004 with a corresponding increase in the investment. The joint venture generally pays to PVR quarterly distributions of PVR’s portion of the joint venture’s cash flows. PVR received cash distributions of approximately $2.3 million and $1.0 million in 2005 and 2004. Equity earnings are included in other revenues on the consolidated statements of income.

80
11. Hedging Activities
Commodity Cash Flow Hedges
Oil and Gas Segment. The fair values of our oil and gas derivative contracts are determined based on third party forward price quotes for NYMEX Henry Hub gas and West Texas Intermediate crude oil closing prices as of December 31, 2005. The following table sets forth our positions as of December 31, 2005:
Average Weighted Average Price Estimated Volume Collars Fair Value Per Day Floor Ceiling (in thousands)
Natural Gas Costless Collars (in Mmbtus) (per Mmbtu) First Quarter 2006 36,344 $ 7.12 $ 12.07 $ (3,961)Second Quarter 2006 28,330 $ 6.94 $ 11.81 (1,437)Third Quarter 2006 22,000 $ 7.82 $ 12.25 (1,100)Fourth Quarter 2006 20,011 $ 8.23 $ 15.32 (637)First Quarter 2007 15,000 $ 9.00 $ 19.20 381 Second Quarter 2007 10,000 $ 7.00 $ 12.65 (164)Third Quarter 2007 10,000 $ 7.00 $ 12.65 (204)Fourth Quarter 2007 (October only) 10,000 $ 7.00 $ 12.65 (93) Crude Oil Costless Collars (in Bbls) (per Bbl) First Quarter 2006 (January and
February only)
200 $ 42.00 $ 47.75 (236)Total $ (7,451)
Based upon our assessment of our derivative agreements designated as cash flow hedges at December 31, 2005, we
reported (i) a net derivative liability of approximately $7.5 million, (ii) a loss in accumulated other comprehensive income of $4.2 million, net of a related income tax benefit of $2.3 million and (iii) an unrealized loss on derivatives for hedge ineffectiveness of $0.9 million related to cash flow hedges in the oil and gas segment. In connection with monthly settlements, we recognized net hedging losses in natural gas and oil revenues of $14.9 million for the year ended December 31, 2005. Based upon future oil and natural gas prices as of December 31, 2005, we expect to realize $7.4 million of hedging losses within the next 12 months. The amounts that we ultimately realize will vary due to changes in the fair value of the open derivative agreements prior to settlement. We recognized net hedging losses of $5.9 million and $6.1 million for each of the years ended December 31, 2004 and 2003.
In January 2006, we entered into an additional crude oil costless collar for 200 barrels per day, effective March 2006 through December 2007, at a floor price of $60.00 per barrel and a ceiling price of $72.20 per barrel.
Natural Gas Midstream Segment. When PVR agreed to acquire Cantera, management wanted to ensure an acceptable
return on the investment. This objective was supported by entering into pre-closing commodity price derivative agreements covering approximately 75 percent of the net volume of NGLs expected to be sold from April 2005 through December 2006. Rising commodity prices resulted in a significant change in the market value of those derivative agreements before they qualified for hedge accounting. This change in market value resulted in a $13.9 million noncash charge to earnings during the first quarter of 2005 for the unrealized loss on derivatives. Subsequent to the Cantera Acquisition, PVR formally designated the agreements as cash flow hedges in accordance with SFAS No. 133. Upon qualifying for hedge accounting, changes in the derivative agreements’ market value are accounted for as other comprehensive income or loss to the extent they are effective, rather than as a direct impact on net income. SFAS No. 133 requires the Partnership to continue to measure the effectiveness of the derivative agreements in relation to the underlying commodity being hedged, and it is required to record the ineffective portion of the agreements in net income for the respective period. Cash settlements with the counterparties related to the derivative agreements will occur monthly over the life of the agreements, and PVR will receive a correspondingly higher or lower amount for the physical sale of the commodity over the same period. In addition, PVR entered into derivative agreements for NGLs and natural gas to further protect its margins subsequent to the Cantera Acquisition. These derivative agreements have been designated as cash flow hedges.

81
The fair values of PVR’s derivative agreements are determined based on forward price quotes for the respective commodities as of December 31, 2005. The following table sets forth PVR’s positions as of December 31, 2005, for commodities related to natural gas midstream revenues (ethane, propane and crude oil) and cost of gas purchased (natural gas):
Average Weighted Estimated Volume Average Fair Value Per Day Price (in thousands) Ethane Swaps (in gallons) (per gallon) First Quarter 2006 through Fourth Quarter 2006 68,880 $ 0.4770 $ (6,269) First Quarter 2007 through Fourth Quarter 2007 34,440 $ 0.5050 (1,839) First Quarter 2008 through Fourth Quarter 2008 34,440 $ 0.4700 (1,442) Propane Swaps (in gallons) (per gallon) First Quarter 2006 through Fourth Quarter 2006 52,080 $ 0.7060 (5,918) First Quarter 2007 through Fourth Quarter 2007 26,040 $ 0.7550 (1,679) First Quarter 2008 through Fourth Quarter 2008 26,040 $ 0.7175 (1,471) Crude Oil Swaps (in Bbls) (per Bbl) First Quarter 2006 through Fourth Quarter 2006 1,100 $ 44.45 (7,834) First Quarter 2007 through Fourth Quarter 2007 560 $ 50.80 (2,501) First Quarter 2008 through Fourth Quarter 2008 560 $ 49.27 (2,313) Natural Gas Swaps (in MMbtu) (per MMbtu) First Quarter 2006 through Fourth Quarter 2006 7,500 $ 7.05 9,940 First Quarter 2007 through Fourth Quarter 2007 4,000 $ 6.97 4,474 First Quarter 2008 through Fourth Quarter 2008 4,000 $ 6.97 3,126 $ (13,726)
Based upon the assessment of derivative agreements designated as cash flow hedges at December 31, 2005, PVR
reported (i) a net derivative liability related to the natural gas midstream segment of $13.7 million, (ii) a loss in accumulated other comprehensive income of $4.0 million, net of a related income tax benefit of $2.1 million and (iii) a net unrealized gain on derivatives for hedge ineffectiveness of $0.6 million for the year ended December 31, 2005 related to cash flow hedges in the natural gas midstream segment. In connection with monthly settlements, PVR recognized net hedging losses in natural gas midstream revenues of $3.9 million for the year ended December 31, 2005, and net hedging gains in cost of gas purchased of $4.9 million for the year ended December 31, 2005. Based upon future commodity prices as of December 31, 2005, PVR expects to realize $10.1 million of hedging losses within the next 12 months. The amounts that PVR will ultimately realize will vary due to changes in the fair value of the open derivative agreements prior to settlement. Because all hedged volumes relate to periods beginning after March 31, 2005, PVR had no monthly settlements and recognized no net hedging losses in natural gas midstream revenues in 2004.
In November 2005, PVR entered into a basis swap for the period January 2006 through July 2006. The basis swap relates to purchases of natural gas in the Texas/Oklahoma Basin region. We have chosen not to designate this derivative as a hedge pursuant to SFAS No. 133, as amended. Therefore, changes in market value of the derivative instrument are charged to earnings. At December 31, 2005, PVR reported (i) a derivative liability of approximately $0.7 million and (ii) an unrealized loss on derivatives of $0.7 million related to the basis swap.
Interest Rate Swaps
In connection with the issuance of its senior unsecured notes (see Note 14) in March 2003, PVR entered into an interest rate swap agreement with an original notional amount of $30 million to hedge a portion of the fair value of those notes (the “Senior Notes Swap”). The Senior Notes Swap agreement was settled on June 30, 2005, for $0.8 million. The settlement was paid in cash by PVR to the counterparty in July 2005. Upon settlement of the PVR Senior Notes Swap agreement, the $0.8 million negative fair value adjustment of the carrying amount of long-term debt will be amortized as interest expense over the remaining term of the PVR Notes (as defined in Note 15) using the effective interest rate method.
In September 2005, PVR entered into interest rate swap agreements to establish fixed rates on $60 million of the
LIBOR-based portion of the outstanding balance on PVR’s revolving credit facility (see Note 15) until March 2010 (the

82
“Revolver Swaps”). PVR pays a weighted average fixed rate of 4.22 percent on the notional amount plus the applicable margin, and the counterparties pay a variable rate equal to the three-month LIBOR. Settlements on the Revolver Swaps are recorded as interest expense. The Revolver Swap agreements were designated as cash flow hedges. Accordingly, the effective portion of the change in the fair value of the swap transactions is recorded each period in other comprehensive income. The ineffective portion of the change in fair value, if any, is recorded to current period earnings as interest expense. At December 31, 2005, PVR reported (i) a derivative asset of approximately $1.2 million and (ii) a gain in accumulated other comprehensive income of $0.8 million, net of related income tax expense of $0.4 million related to the interest rate swap. In connection with periodic settlements, PVR recognized $0.1 million in net hedging losses in interest expense for the year ended December 31, 2005. Based upon future interest rate curves at December 31, 2005, PVR expects to realize $0.3 million of hedging gains within the next 12 months. The amounts that PVR ultimately realizes will vary due to changes in the fair value of open derivative agreements prior to settlement. 12. Accrued Liabilities
Accrued liabilities are summarized as follows (in thousands):
December 31,
2005
2004
Drilling costs $ 7,720 $ 7,516Royalties 7,785 6,618Production and franchise taxes 9,188 4,422Compensation 5,418 3,111Deferred income 5,073 1,207Pipeline imbalance – PVR Midstream 2,504 —Interest 1,960 1,600Other 3,601 1,879
Total $ 43,249 $ 26,353
13. Asset Retirement Obligations
The table below reconciles the beginning and ending aggregate carrying amount of our asset retirement obligations, which are included in other liabilities, or accrued liabilities for the current portion, on the consolidated balance sheets (in thousands):
Year ended December 31,
2005
2004
Balance at beginning of period $ 3,635 $ 3,389Liabilities incurred 389 319Adoption of FIN 47 635 — Liabilities settled (280) (274)Accretion expense 297 322
4,676 3,756Current portion — (121)
Balance at end of period $ 4,676 $ 3,635

83
14. Other Liabilities
Other liabilities are summarized in the following table (in thousands):
December 31,
2005
2004
Deferred income – PVR Coal $ 10,194 $ 8,726Asset retirement obligation 4,676 3,635Pension 2,093 2,205Post-retirement health care 2,064 2,075Environmental liabilities 2,293 1,306Other 626 148
Total $ 21,946 $ 18,095
15. Long-Term Debt
Long-term debt as of December 31, 2005 and 2004, consisted of the following (in thousands):
December 31,
2005
2004
Penn Virginia revolving credit facility, variable rate of 5.4 percent at December 31, 2005 $ 79,000 $ 76,000
PVR revolving credit facility, variable rate of 5.7 percent at December 31, 2005 172,000 30,000 PVR senior unsecured notes (1) 82,954 87,726
333,954 193,726 Less: Current maturities (8,108) (4,800)
Total long-term debt $ 325,846 $ 188,926
(1) Includes negative fair value adjustments of $0.7 million and $0.8 million as of December 31, 2005 and 2004, related to the Senior Notes Swap designated as a fair value hedge. The Senior Notes Swap agreement was settled in June 2005 (see Note 10).
Penn Virginia Revolving Credit Facility
In December 2003, we entered into a revolving credit facility (the “Revolver”) with a syndicate of financial institutions
led by JP Morgan Chase Bank N.A. The Revolver is secured by a portion of our proved oil and gas reserves. In December 2005, we amended and restated the Revolver to increase the commitment from $150 million to $200 million, increase the borrowing base from $200 million to $300 million, extend the maturity date from December 2007 to December 2010 and attain a more favorable interest rate. We paid loan issue costs of $0.5 million related to the amendment, which were capitalized in other assets and will be amortized over the remaining term of the Revolver.
The Revolver is governed by a borrowing base calculation and is redetermined semi-annually. We have the option to elect interest at (i) LIBOR plus a Eurodollar margin ranging from 1.00 to 1.75 percent, based on the percentage of the borrowing base outstanding or (ii) the greater of the prime rate or federal funds rate plus a margin up to 0.50 percent. The weighted average interest rate on borrowings incurred during the year ended December 31, 2005, was approximately 4.99 percent. In 2005, we incurred commitment fees of $0.3 million on the unused portion of the Revolver. We capitalized $3.5 million, $2.0 million and $2.0 million of interest cost incurred in 2005, 2004 and 2003. The Revolver allows for the issuance of up to $20 million of letters of credit, of which $0.3 million were issued as of December 31, 2005. The financial covenants under the Revolver require us to maintain levels of debt-to-earnings and impose dividend limitation restrictions. As of December 31, 2005, we were in compliance with all of our covenants under the Revolver.
PVR Revolving Credit Facility
Concurrent with the closing of the Cantera Acquisition in March 2005, Penn Virginia Operating Co., LLC, the parent of PVR Midstream LLC and a subsidiary of the Partnership, entered into a new unsecured $260 million, five-year credit agreement with a syndicate of financial institutions led by PNC Bank, National Association (“PNC”). The new agreement consisted of a $150 million revolving credit facility (the “PVR Revolver”) that matures in March 2010 and a $110 million term loan. As of December 31, 2005, PVR had $172.0 million of outstanding borrowings under the PVR Revolver. A

84
portion of the PVR Revolver and the term loan were used to fund the Cantera Acquisition and to repay borrowings under PVR’s previous credit facility. Proceeds of $126.4 million received from a subsequent public offering of 2.5 million of PVR’s common units in March 2005 and a $2.6 million contribution from its general partner (our subsidiary) were used to repay the $110 million term loan and a portion of the amount outstanding under the PVR Revolver. In the fourth quarter of 2004, PVR paid loan issue costs of approximately $1.2 million related to the term loan, which were recorded as interest expense in 2004. The term loan cannot be re-borrowed. The PVR Revolver is available for general Partnership purposes, including working capital, capital expenditures and acquisitions, and includes a $10 million sublimit for the issuance of letters of credit. PVR had outstanding letters of credit of $1.6 million as of December 31, 2005. In 2005, PVR incurred commitment fees of $0.4 million on the unused portion of the PVR Revolver.
In July 2005, PVR amended its credit agreement to increase the size of the commitment under the PVR Revolver from
$150 million to $300 million and to increase its one-time option (upon receipt by the credit facility’s administrative agent of commitments from one or more lenders) to expand the facility from $100 million to $150 million. The amendment also updated certain debt covenant definitions. The interest rate under the credit agreement remained unchanged and will fluctuate based on the Partnership’s ratio of total indebtedness to EBITDA. Interest is payable at a base rate plus an applicable margin of up to 1.00 percent if PVR selects the LIBOR-based borrowing option under the credit agreement or at a rate derived from LIBOR plus an applicable margin ranging from 1.00 percent to 2.00 percent if PVR selects the LIBOR-based borrowing option. The other terms of the credit agreement remained unchanged. The financial covenants under the PVR Revolver require PVR to maintain specified levels of debt to consolidated EBITDA and consolidated EBITDA to interest. The financial covenants restricted PVR’s borrowing capacity under the PVR Revolver to approximately $106.5 million as of December 31, 2005. As of December 31, 2005, the Partnership was in compliance with all of its covenants under the PVR Revolver.
In September 2005, PVR entered into two Revolver Swap agreements to establish a fixed interest rate on $60 million of the LIBOR-based portion of the outstanding balance of the PVR Revolver, which effectively fixed the interest rate at 4.22 percent plus the applicable margin, which was 1.25 percent as of December 31, 2005 (see Note 11).
Prior to the Cantera Acquisition, the Partnership had a $100 million unsecured revolving credit facility that was set to
expire in October 2006. The revolving credit facility was with a syndicate of financial institutions led by PNC as its agent. The revolving credit facility was available for general Partnership purposes, including working capital, capital expenditures and acquisitions, and included a $5 million sublimit that was available for working capital needs and distributions and a $5 million sublimit for the issuance of letters of credit.
At the Partnership’s option, indebtedness under the revolving credit facility bore interest at either (i) the Eurodollar rate
plus an applicable margin which ranged from 1.25 percent to 2.25 percent based on the ratio of consolidated indebtedness to consolidated EBITDA (as defined by the credit agreement) for the four most recently completed fiscal quarters, or (ii) the higher of the federal funds rate plus 0.50 percent or the prime rate as announced by PNC. The Partnership paid commitment fees on the unused portion of the revolving credit facility.
PVR Senior Unsecured Notes
In March 2003, the Partnership closed a private placement of $90 million of senior unsecured notes (the “PVR Notes”). The PVR Notes bore interest at a fixed rate of 5.77 percent and mature over a ten-year period ending in March 2013, with semi-annual principal and interest payments. The PVR Notes contain various covenants similar to those contained in the PVR Revolver. The PVR Notes have an equal priority of payment as all other unsecured indebtedness of PVR, including the PVR Revolver. As of December 31, 2005, the Partnership was in compliance with all of the covenants.
In conjunction with the closing of the Cantera Acquisition, PVR amended the PVR Notes to allow PVR to enter the
natural gas midstream business and to increase certain covenant coverage ratios, including the debt to EBITDA test. In exchange for this amendment, PVR agreed to a 0.25 percent increase in the fixed interest rate on the PVR Notes, from 5.77 percent to 6.02 percent. The amendment to the PVR Notes also requires that the Partnership obtain an annual confirmation of its credit rating, with a 1.00 percent increase in the interest rate payable on the PVR Notes in the event the Partnership’s credit rating falls below investment grade. On March 15, 2005, PVR’s investment grade credit rating was confirmed by Dominion Bond Rating Services.
Upon settlement of the Senior Notes Swap agreement (see Note 11), the $0.7 million negative fair value adjustment of the carrying amount of long-term debt will be amortized as interest expense over the remaining term of the PVR Notes using the interest rate method.

85
Line of Credit
We have a $5 million line of credit with a financial institution effective through June 2006, renewable annually. We have an option to elect a fixed rate LIBOR loan, floating rate LIBOR loan or base rate (as determined by the financial institution) loan. At December 31, 2005 and 2004, we had no outstanding borrowings against the line of credit.
Debt Maturities
Aggregate maturities of the principal amounts of long-term debt for the next five years and thereafter are as follows (in thousands):
2006 $ 8,300 2007 11,000 2008 12,700 2009 14,100 2010 264,400 Thereafter 24,200
$ 334,700 Terminated interest rate swap (746)
Total debt, including current maturities $ 333,954
16. Income Taxes
The provision for income taxes from continuing operations is comprised of the following (in thousands):
Year ended December 31,
2005
2004
2003
Current income taxes
Federal $ 21,708 $ 2,619 $ 2,067State 1,867 3 1,007
Total current 23,575 2,622 3,074
Deferred income taxes
Federal 12,007 15,247 12,090State 5,087 3,978 3,202
Total deferred 17,094 19,225 15,292
Total income tax expense $ 40,669 $ 21,847 $ 18,366
The difference between the taxes computed by applying the statutory tax rate to income from operations before income
taxes and our reported income tax expense is as follows (in thousands):
Year ended December 31,
2005
2004
2003
Computed at federal statutory tax rate $ 35,966 35.0% $ 19,320 35.0% $ 15,933 35.0 %State income taxes, net of federal income tax benefit 4,341 4.2% 2,486 4.5% 2,611 5.7 %Other, net 362 0.4% 41 0.1% (178) (0.4)%
Total income tax expense $ 40,669 39.6% $ 21,847 39.6% $ 18,366 40.3 %

86
The principal components of our net deferred income tax liability are as follows (in thousands):
December 31,
2005
2004
Deferred tax liabilities:
Oil and gas properties $ 123,757 $ 97,267 Other 7,638 8,890
Total deferred tax liabilities 131,395 106,157
Deferred tax assets:
Fair value of derivative instrument 8,023 163 Deferred income—coal properties 5,939 3,112 Pension and post-retirement benefits 1,734 1,603 Net operating loss carryforwards — 1,810 Other 4,513 1,557
Total deferred tax assets 20,209 8,245
Net deferred tax liability $ 111,186 $ 97,912
As of December 31, 2005, we estimate that all our net operating loss carryforwards (“NOLs”) for state tax purposes were
utilized in 2005. 17. Employee Benefit Plans
401(k) Plan
We sponsor a defined contribution pension plan (the “401(k) Plan”) that is subject to the Employee Retirement Income Security Act of 1974. The 401(k) Plan allows eligible employees to contribute up to 50 percent of their base salaries. After the employee meets certain service requirements, we match each employee’s contributions up to six percent of the employee’s base salary. Our matching contributions to the 401(k) Plan were approximately $0.6 million, $0.4 million and $0.3 million for the years ended December 31, 2005, 2004 and 2003. Beginning in 2005, we had the option to make additional contributions at our discretion. We made no discretionary contributions in 2005.
Pension Plans and Other Post-retirement Benefits
We provide post-separation (“pension”) payments to certain eligible employees. Benefits are typically based on the employee’s average annual compensation and service.
We also offer post-retirement healthcare benefits to employees hired prior to January 1, 1991, who retire from active
service. The benefits include medical and prescription drug coverage for the retirees and dependents and life insurance for the retirees. The medical coverage is noncontributory for retirees who retired on or before December 31, 1990, and may be contributory for retirees who retired on or after January 1, 1991.
We use a December 31 measurement date for these plans. In July 2004, we adopted FASB Staff Position (“FSP”) SFAS 106-2, Accounting and Disclosure Requirements Related
to the Medicare Prescription Drug, Improvement and Modernization Act of 2003. The FSP requires employers that qualify for a prescription-drug subsidy under Medicare legislation enacted in December 2003 to recognize the reduction in costs as employees provide services in future years. FSP SFAS 106-2 did not have a significant impact on our financial statements because we do not qualify for the subsidy.
A reconciliation of the changes in the benefit obligations and fair value of assets for the years ended December 31, 2005 and 2004, and a statement of the funded status at December 31, 2005 and 2004, is as follows (in thousands):

87
Pension
Post-retirement Healthcare
2005
2004
2005
2004
Reconciliation of benefit obligation:
Obligation—beginning of year $ 2,348 $ 2,382 $ 4,404 $ 4,490 Service cost — — 29 28 Interest cost 129 141 241 261 Benefits paid (241) (265) (461) (478)Actuarial loss 6 90 358 103
Obligation—end of year 2,242 2,348 4,571 4,404
Reconciliation of fair value of plan assets:
Fair value—beginning of year — — — — Employer contributions 241 265 438 455 Participant contributions — — 23 23 Benefit payments (241) (265) (461) (478)
Fair value—end of year — — — —
Funded status:
Funded status—end of year (2,242) (2,348) (4,571) (4,404)Unrecognized transition obligation 6 10 — — Unrecognized prior service cost 18 24 847 935 Unrecognized gain 617 642 1,506 1,237
Net amount recognized $ (1,601) $ (1,672) $ (2,218) $ (2,232)
Because the benefit obligation exceeds the fair value of plan assets, we have recognized a liability in the statements of
financial position. The following table provides the components of the benefit obligation recognized in the statements of financial position at December 31, 2005 and 2004 (in thousands):
Pension
Post-retirement Healthcare
2005
2004
2005
2004
Accrued benefit liability $ (2,242) $ (2,348) $ (2,218) $ (2,232)Other long-term assets 24 34 — — Accumulated other comprehensive income 617 642 — —
Obligation—end of year $ (1,601) $ (1,672) $ (2,218) $ (2,232)
The following table provides the components of net periodic benefit cost for the plans for the years ended December 31,
2005 and 2004 (in thousands):
Pension
Post-retirement Healthcare
2005
2004
2005
2004
Service cost $ — $ — $ 29 $ 28Interest cost 129 141 241 261Amortization of prior service cost 6 6 88 88Amortization of transitional obligation 3 3 — —Recognized actuarial loss 31 25 66 52
Net periodic benefit cost $ 169 $ 175 $ 424 $ 429
We used an assumed discount rate of 5.75 percent in 2005 and 2004 for the measurement of our pension and post-
retirement healthcare benefit obligations. We base the discount rate on the published Moody’s Aa corporate bond yield as of the measurement date. We choose to use the Moody’s Aa corporate bond yield because it is a widely available rate and its portfolio approximates the characteristics of our plans.

88
For measurement purposes, a 10.0 percent annual rate increase in the per capita cost of covered health care benefits was assumed for 2005. The rate is assumed to decrease gradually to five percent for 2013 and remain at that level thereafter.
Assumed health care cost trend rates have a significant effect on the amounts reported for post-retirement benefits. A one percent change in assumed health care cost trend rates would have the following effects for 2005 (in thousands):
One PercentIncrease
One Percent Decrease
Effect on total of service and interest cost components $ 12 $ (12) Effect on post-retirement benefit obligation 208 (199)
We expect to contribute $0.2 million to the pension plan and $0.4 million to the post-retirement healthcare plan in 2006. The following benefit payments, which reflect expected future service, as appropriate, are expected to be paid (in
thousands):
Pension
Post- retirementHealthcare
2006 $ 213 $ 4382007 222 4392008 218 4422009 214 4382010 203 4362011-2015 800 1,961
18. Earnings per Share
The following is a reconciliation of the numerators and denominators used in the calculation of basic and diluted earnings per share (“EPS”) for the last three years (in thousands, except per share data).
2005
2004
2003
Income from operations before cumulative effect of change in accounting principle $ 62,088 $ 33,355 $ 27,159Cumulative effect of change in accounting principle — — 1,363
Net income $ 62,088 $ 33,355 $ 28,522
Weighted average shares, basic 18,546 18,306 17,976Effect of dilutive securities:
Stock options 186 161 136
Weighted average shares, diluted 18,732 18,467 18,112
Income from operations before cumulative effect of change in accounting principle per share, basic $ 3.35 $ 1.82 $ 1.51
Cumulative effect of change in accounting principle per share, basic — — 0.08
Net income per share, basic $ 3.35 $ 1.82 $ 1.59
Income from operations before cumulative effect of change in accounting principle per share, diluted $ 3.31 $ 1.81 $ 1.50
Cumulative effect of change in accounting principle per share, diluted — — 0.08
Net income per share, diluted $ 3.31 $ 1.81 $ 1.58
Options with an exercise price exceeding the average price of the underlying securities are not considered to be dilutive
and are not included in calculation of the denominator for diluted earnings per share for the years ended December 31, 2005 and 2003. All options outstanding at December 31, 2004, had exercise prices exceeding the average price of the underlying securities.

89
19. Stock Compensation and Stock Ownership Plans
Stock Compensation Plans We have several stock compensation plans (collectively, the “Stock Compensation Plans”) that allow incentive and
nonqualified stock options and restricted stock to be granted to key employees and officers and nonqualified stock options and deferred common stock units to be granted to directors. At December 31, 2005, there were approximately 215,000 and 420,000 shares available for issuance to directors and employees pursuant to the Stock Compensation Plans. In 2005, we recognized $0.7 million of compensation expense related to the Stock Compensation Plans. Compensation expense related to the Stock Compensation Plans was not significant in 2004 and 2003.
Stock Options. The exercise price of all options granted under the Stock Compensation Plans is at the fair market value
of our common stock on the date of the grant. Options may be exercised at any time after vesting and prior to 10 years following the grant. Options vest upon terms established by the compensation and benefits committee. In addition, all options will vest upon a change of control of the Company. In the case of employees, if a grantee’s employment terminates (i) for cause, all of the grantee’s options, whether vested or unvested, will be automatically forfeited, (ii) by reason of death, disability or retirement, the grantee’s options will automatically vest and (iii) for any other reason, the grantee’s unvested options will be automatically forfeited. In the case of directors, if a grantee’s membership on our Board of Directors terminates for any reason, the grantee’s unvested options will be automatically forfeited.
Options granted on or before January 2, 2004, under the Stock Compensation Plans vested on the first anniversary of the
date of grant. Options granted after January 2, 2004, vest ratably over a three-year period so that one-third is exercisable after one year, another third is exercisable after two years and the remaining third is exercisable after three years.
The following table summarizes information with respect to the common stock options awarded under the Stock Option
Plans and grants described above.
2005
2004
2003
Shares Under
Options
WeightedAvg.
ExercisePrice
Shares Under
Options
Weighted Avg.
Exercise Price
Shares Under
Options
WeightedAvg.
ExercisePrice
Outstanding at beginning of year 635,900 $ 21.10 801,900 $ 16.46 807,700 $ 14.70Granted 117,200 $ 49.18 210,000 $ 28.52 206,000 $ 18.71Exercised (119,254) $ 18.37 (364,400) $ 14.43 (209,800) $ 11.85Cancelled / forfeited (12,215) $ 33.08 (11,600) $ 28.09 (2,000) $ 18.30
Outstanding at end of year 621,631 $ 26.68 635,900 $ 21.10 801,900 $ 16.46
Exercisable at end of year 388,694 $ 19.50 436,300 $ 17.71 597,900 $ 15.69
Weighted average of fair value of options granted during the year $ 12.28 $ 6.20 $ 5.26
The fair value of the options granted is estimated on the date of grant using the Black-Scholes option-pricing model with
the following assumptions for each grant year:
2005 2004 2003
Dividend yield 0.81% to 1.10% 1.56% to 1.60% 1.98% to 2.59% Expected volatility 26.4% 27.7% 27.9% Risk-free interest rate 3.88% to 4.04% 2.47% 3.70% Expected life 4 years 4 years 8 years

90
The following table summarizes certain information regarding stock options outstanding at December 31, 2005:
Options Outstanding
Options Exercisable
Range of Exercise Price
Number Outstanding at
12/31/05
Weighted Avg. Remaining
Contractual Life
Weighted Avg.Exercise
Price/share
Number Exercisable at
12/31/05
Weighted Avg.Exercise
Price/share
$13.53 to $19.99 320,950 5.8 years $ 17.75 320,950 $ 17.75$20.00 to $39.99 186,031 7.9 years $ 28.22 67,744 $ 27.79$40.00 to $55.25 114,650 9.4 years $ 49.18 — $ —
Restricted Common Stock. Restricted stock vests upon terms established by the compensation and benefits committee.
In addition, all restricted stock will vest upon a change of control of the Company. If a grantee’s employment terminates for any reason other than death, disability or retirement, the grantee’s restricted stock will be automatically forfeited. If a grantee’s employment terminates by reason of death, disability or retirement, the grantee’s restricted stock will automatically vest unless otherwise determined by the compensation and benefits committee. Except as specified by the compensation and benefits committee, a grantee shall be entitled to receive any dividends declared on our common stock.
We granted 27,576 shares of restricted common stock at a weighted average grant-date fair value of $58.58 per share to
officers and employees in 2005. The restricted stock granted in 2005 vests over a three-year period, with either one-third vesting in each year or 25 percent vesting after the first year, 25 percent vesting after the second year and 50 percent vesting after the third year. We recognize compensation expense on a straight-line basis over the vesting period. No restricted stock was granted prior to January 1, 2005.
Deferred Common Stock Units. A portion of compensation to non-employee members of our Board of Directors is paid
in deferred common stock units. Each deferred common stock unit represents one share of common stock, which vests immediately upon issuance and is available to the holder upon termination or retirement from the Board of Directors. Deferred common stock units awarded to directors receive all cash or other dividends we pay on shares of common stock.
We granted 12,824 deferred common stock units to our directors in 2005 at a weighted average grant-date fair value of
$45.23 per unit. In accordance with EITF Issue No. 97-14, Accounting for Deferred Compensation Arrangements Where Amounts Earned Are Held in a Rabbi Trust and Invested, we recorded a $0.6 million deferred compensation obligation in shareholders’ equity and a corresponding amount for treasury stock. No deferred common stock units were granted prior to January 1, 2005.
Employees’ Stock Ownership Plan
In July 2004, the Employees’ Stock Ownership Plan (“ESOP”) was merged with and into the 401(k) Plan.
Shareholder Rights Plan
In February 1998, the Board of Directors adopted a Shareholder Rights Plan (the “Plan”) designed to prevent an acquirer
from gaining control of the Company without offering a fair price to all shareholders. The Plan was amended in March 2002. Each common share outstanding has one right, and each right entitles the holder to purchase from us one one-thousandth of a share of Series A Junior Participating Preferred Stock, $100 par value, at a price of $100 subject to adjustment. The rights are not exercisable or transferable apart from the common stock until after a person or affiliated group has acquired or obtained the right to acquire fifteen percent or more (or 10 percent or more if such person or group has been deemed to be an “adverse person” as defined in the Plan) of our common stock. Each right will entitle the holder, under certain circumstances, to acquire at half the value, either (i) common stock of the Company, (ii) a combination of cash, other property, or common stock or other securities of the Company, or (iii) common stock of an acquiring person. Any such event would also result in any rights owned beneficially by the acquiring person or its affiliates becoming null and void. The rights expire in February 2008 and are redeemable under certain circumstances.
PVR Long-Term Incentive Plan
The general partner of the Partnership has a long-term incentive plan that permits the grant of awards covering an aggregate of 300,000 common units to employees and directors of the general partner and employees of the general partner’s affiliates who perform services for the Partnership. Awards under the long-term incentive plan can be in the form of common units, restricted units, unit options, phantom units and deferred common units. The long-term incentive plan is administered by the compensation and benefits committee of the board of directors of the general partner. Compensation

91
expense related to the long term incentive plan totaled $1.4 million, $0.4 million and $0.2 million for the years ended December 31, 2005, 2004 and 2003.
Common Units. The general partner of the Partnership granted 438 common units at a weighted average grant-date fair
value of $50.71 per unit to non-employee directors in 2005. The general partner granted 4,961 common units at a weighted average grant-date fair value of $34.83 per unit to non-employee directors in 2004. The general partner granted 3,000 common units at a weighted average grant-date fair value of $20.95 per unit to non-employee directors in 2003.
Restricted Units. Restricted units vest upon terms established by the compensation and benefits committee, but in no
case earlier than the conversion to common units of PVR’s outstanding subordinated units. In addition, all restricted units will vest upon a change of control of the general partner or us. If a grantee’s employment with, or membership on the board of directors of, the general partner terminates for any reason, the grantee’s unvested restricted units will be automatically forfeited unless, and to the extent, that the compensation and benefits committee provides otherwise. Distributions payable with respect to restricted units may, in the compensation and benefits committee’s discretion, be paid directly to the grantee or held by the general partner and made subject to a risk of forfeiture during the applicable restriction period.
The general partner of the Partnership granted 25,488 restricted units at a weighted average grant-date fair value of
$50.76 per unit to officers and employees of the general partner in 2005. The general partner granted 16,400 restricted units at a weighted average grant-date fair value of $34.66 per unit to officers and employees of the general partner in 2004. The general partner granted 12,950 restricted units at a weighted average grant-date fair value of $23.97 per unit to directors, officers and employees of the general partner in 2003. The restricted units granted in 2005 vest over a three-year period, with one-third vesting in each year. The restricted units granted in 2004 and 2003 vested on the first anniversary of the date of grant.
Deferred Common Units. A portion of compensation to non-employee directors of the general partner of PVR is paid in
deferred common units. Each deferred common unit represents one common unit, which vests immediately upon issuance and is available to the holder upon termination or retirement from the board of directors of the general partner. Common units delivered in connection with deferred common units may be common units acquired by the general partner in the open market, common units already owned by the general partner, common units acquired by the general partner directly from PVR or any other person, or any combination of the foregoing. The general partner is entitled to reimbursement by PVR for the cost incurred in acquiring common units. Deferred common units awarded to directors receive all cash or other distributions paid by PVR on account of common units. The general partner of the Partnership granted 8,855 deferred common units at a weighted average grant-date fair value of $50.54 per unit to non-employee directors in 2005. No deferred common units were granted prior to January 1, 2005.
20. Other Comprehensive Income
Comprehensive income represents certain changes in equity during the reporting period, including net income and charges directly to equity which are excluded from net income. For the three years ended December 31, 2005, 2004 and 2003, the components of other comprehensive income were as follows (in thousands):
92
Cash Flow
Hedges
Minimum Pension Liability
Total
Hedging unrealized loss, net of tax of $8,726 $(16,206) $ — $(16,206)Hedging reclassification adjustment, net of tax of $4,897 9,094 — 9,094 Pension plan adjustment, net of tax of $9 — 16 16
Other comprehensive income for the year ended December 31, 2005 $ (7,112) $ 16 $ (7,096)
Hedging unrealized loss, net of tax of $1,214 $ (2,254) $ — $ (2,254)Hedging reclassification adjustment, net of tax of $2,060 3,826 — 3,826 Pension plan adjustment, net of tax of $23 — (42) (42)
Other comprehensive income for the year ended December 31, 2004 $ 1,572 $ (42) $ 1,530 Hedging unrealized loss, net of tax of $2,428 $ (4,509) $ — $ (4,509)Hedging reclassification adjustment, net of tax of $2,141 3,976 — 3,976 Pension plan adjustment, net of tax of $30 — (56) (56)
Other comprehensive income for the year ended December 31, 2003 $ (533) $ (56) $ (589) 21. Segment Information
Segment information has been prepared in accordance with SFAS No. 131, Disclosure about Segments of an Enterprise and Related Information. Under SFAS No. 131, operating segments are defined as components of an enterprise about which separate financial information is available and is evaluated regularly by the chief operating decision maker, or decision-making group, in assessing performance. Our chief operating decision-making group consists of our Chief Executive Officer and other senior officials. This group routinely reviews and makes operating and resource allocation decisions among our oil and gas operations, PVR’s coal operations and PVR’s natural gas midstream operations. Accordingly, our reportable segments are as follows:
• Oil and Gas – crude oil and natural gas exploration, development and production. • Coal (the “PVR Coal” segment) – the leasing of mineral interests and subsequent collection of royalties, the
providing of fee-based coal handling, transportation and processing infrastructure facilities, and the development and harvesting of timber.
• Natural Gas Midstream (the “PVR Midstream” segment) – gas processing, gathering and other related services.
In 2004, we reported two operating segments – 1) oil and gas and 2) coal. As a result of the Cantera Acquisition, we added the natural gas midstream segment. The following segment information for the years ended December 31, 2004 and 2003, has been restated to conform to the current period’s presentation. The following is a summary of certain financial information relating to our segments (in thousands):
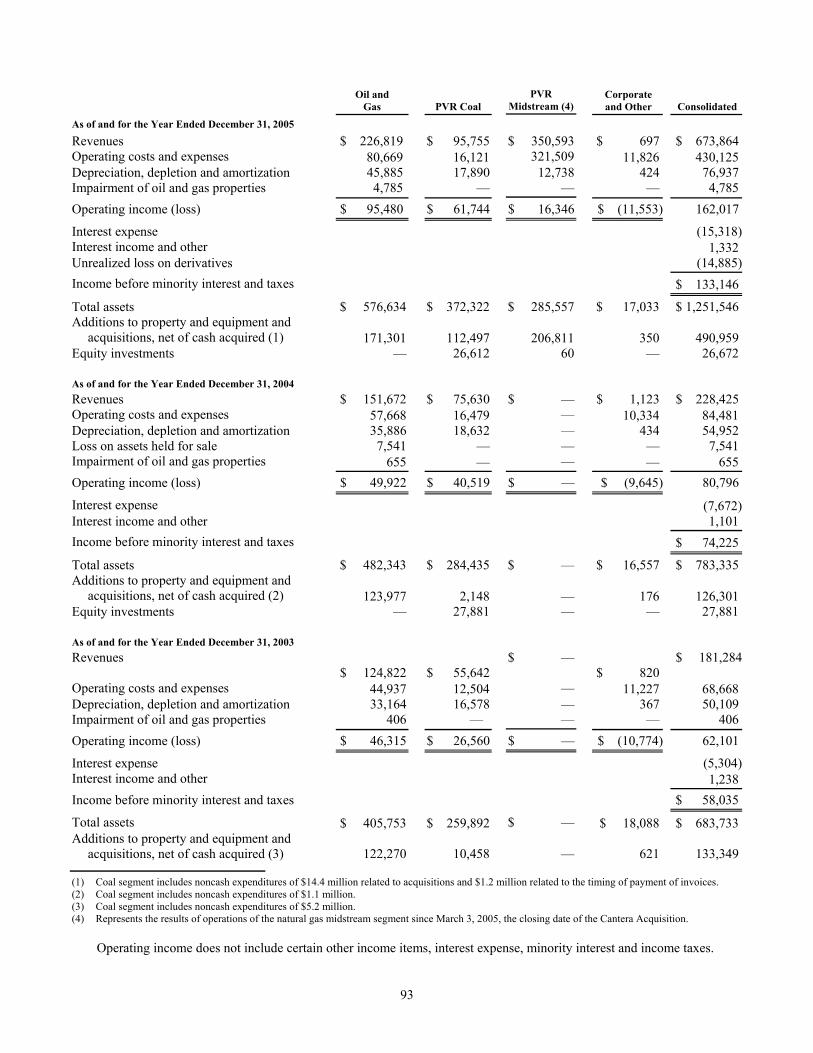
93
Oil and Gas
PVR Coal
PVR Midstream (4)
Corporate and Other
Consolidated
As of and for the Year Ended December 31, 2005 Revenues $ 226,819 $ 95,755 $ 350,593 $ 697 $ 673,864 Operating costs and expenses 80,669 16,121 321,509 11,826 430,125 Depreciation, depletion and amortization 45,885 17,890 12,738 424 76,937 Impairment of oil and gas properties 4,785 — — — 4,785 Operating income (loss) $ 95,480 $ 61,744 $ 16,346 $ (11,553) 162,017 Interest expense
(15,318)
Interest income and other 1,332 Unrealized loss on derivatives (14,885) Income before minority interest and taxes
$ 133,146
Total assets $ 576,634 $ 372,322 $ 285,557 $ 17,033 $ 1,251,546 Additions to property and equipment and
acquisitions, net of cash acquired (1) 171,301 112,497 206,811 350 490,959 Equity investments — 26,612 60 — 26,672 As of and for the Year Ended December 31, 2004 Revenues $ 151,672 $ 75,630 $ — $ 1,123 $ 228,425 Operating costs and expenses 57,668 16,479 — 10,334 84,481 Depreciation, depletion and amortization 35,886 18,632 — 434 54,952 Loss on assets held for sale 7,541 — — — 7,541 Impairment of oil and gas properties 655 — — — 655 Operating income (loss) $ 49,922 $ 40,519 $ — $ (9,645) 80,796 Interest expense
(7,672)
Interest income and other
1,101 Income before minority interest and taxes
$ 74,225
Total assets $ 482,343 $ 284,435 $ — $ 16,557 $ 783,335 Additions to property and equipment and
acquisitions, net of cash acquired (2) 123,977 2,148 — 176 126,301 Equity investments — 27,881 — — 27,881 As of and for the Year Ended December 31, 2003 Revenues
$ 124,822 $ 55,642 $ —
$ 820 $ 181,284
Operating costs and expenses 44,937 12,504 — 11,227 68,668 Depreciation, depletion and amortization 33,164 16,578 — 367 50,109 Impairment of oil and gas properties 406 — — — 406 Operating income (loss) $ 46,315 $ 26,560 $ — $ (10,774) 62,101 Interest expense
(5,304)
Interest income and other
1,238 Income before minority interest and taxes
$ 58,035
Total assets $ 405,753 $ 259,892 $ — $ 18,088 $ 683,733 Additions to property and equipment and
acquisitions, net of cash acquired (3) 122,270 10,458 — 621 133,349
(1) Coal segment includes noncash expenditures of $14.4 million related to acquisitions and $1.2 million related to the timing of payment of invoices. (2) Coal segment includes noncash expenditures of $1.1 million. (3) Coal segment includes noncash expenditures of $5.2 million. (4) Represents the results of operations of the natural gas midstream segment since March 3, 2005, the closing date of the Cantera Acquisition.
Operating income does not include certain other income items, interest expense, minority interest and income taxes.

94
For the year ended December 31, 2005, two customers of the natural gas midstream segment accounted for
approximately $81.9 million and $77.1 million, or 12 percent and 11 percent, of consolidated net revenues. In June 2005, one of our subsidiaries began leasing railcars from a subsidiary of PVR. Railcar rental revenues were $0.4 million in 2005 and are included in the PVR Coal segment. The offsetting railcar rental expense and the elimination of the revenue and expense are included in the corporate and other column of the preceding table.
For the year ended December 31, 2004, two customers of the oil and gas segment accounted for approximately $32.3
million and $28.2 million, or 14 percent and 12 percent, of our consolidated net revenues. For the year ended December 31, 2003, three customers of the oil and gas segment accounted for approximately $34.8
million, $24.2 million and $21.9 million, or 19 percent, 13 percent and 12 percent, of our consolidated net revenues. 22. Commitments and Contingencies
Rental Commitments
Operating lease rental expense in the years ended December 31, 2005, 2004 and 2003, was $5.8 million, $4.2 million and $3.1 million. Minimum rental commitments for the next five years under all non-cancelable operating leases in effect at December 31, 2005, were as follows (in thousands):
For the Year Ending December 31, 2006 $ 4,4122007 2,7602008 1,1932009 6112010 590
Total minimum payments $ 9,566
Rental commitments primarily relate to equipment, car, building and land leases. Also included are the Partnership’s
rental commitments, which primarily relate to coal reserve-based properties which the Partnership subleases, or intends to sublease, to third parties. The obligation expires when the property has been mined to exhaustion or the lease has been canceled. The timing of mining by third party operators is difficult to estimate due to numerous factors. We believe the future rental commitments cannot be estimated with certainty; however, based on current knowledge, we believe the Partnership will incur approximately $0.6 million in rental commitments annually until the reserves have been exhausted.
Drilling Commitments
In June 2005, we entered into an agreement to purchase oil and gas well drilling services from a third party for two
years. The agreement includes early termination provisions that would require us to pay a penalty if we terminate the agreement prior to the original two-year term. The amount of the penalty is based on the number of days remaining in the two-year term and declines as time passes. As of December 31, 2005, the penalty amount would have been $4.2 million if we had terminated the agreement on that date. Management intends to utilize drilling services under this agreement for the full two-year term and has no plans to terminate the agreement early.
In January 2006, we entered into another agreement to purchase oil and gas drilling services from a different third party
for three years. The agreement includes early termination provisions that would require us to pay a penalty if we terminate the agreement prior to the original three-year term. The amount of the penalty is based on the number of days remaining in the three-year term and declines as time passes. Management intends to utilize drilling services under this agreement for the full three-year term and has no plans to terminate the agreement early.
Firm Transportation Commitments
In 2004, we entered into contracts which provide firm transportation capacity rights for specified volumes per day on a pipeline system for terms ranging from one to 10 years. The contracts require us to pay transportation demand charges regardless of the amount of pipeline capacity we use. We may sell excess capacity to third parties at our discretion. Our obligation for firm transportation commitments in effect at December 31, 2005, for the next five years and thereafter is as follows (in thousands):
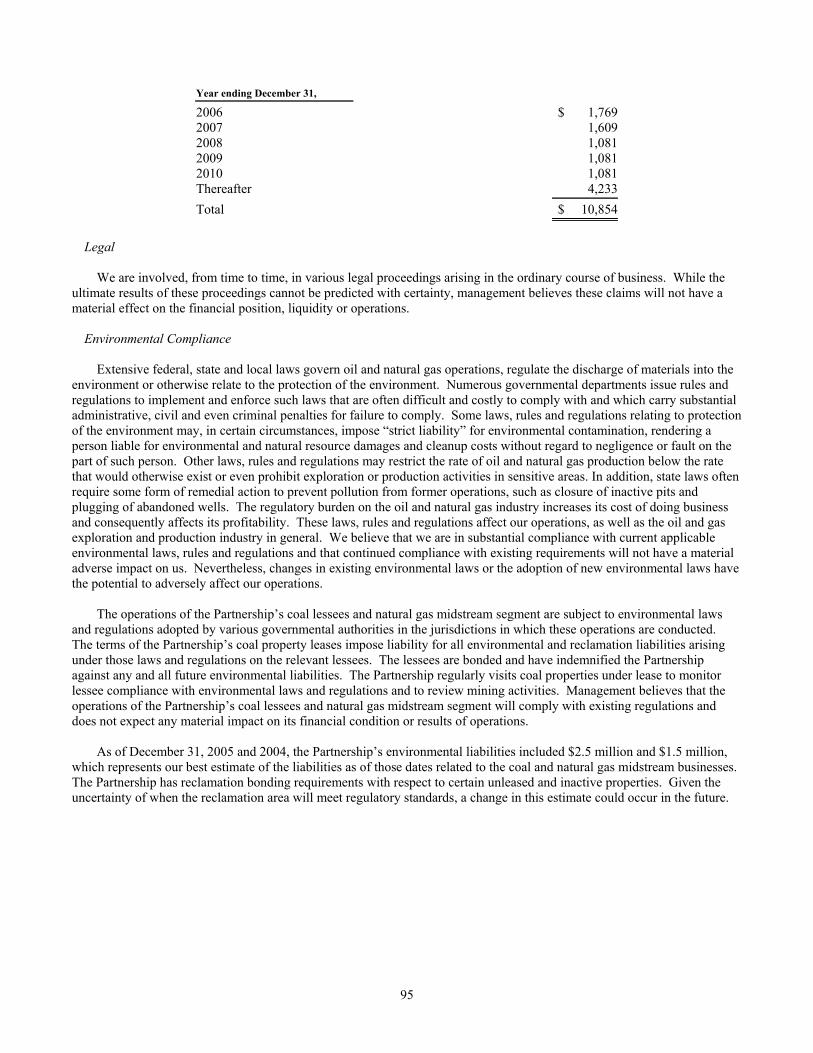
95
Year ending December 31,
2006 $ 1,769 2007 1,609 2008 1,081 2009 1,081 2010 1,081 Thereafter 4,233
Total $ 10,854
Legal
We are involved, from time to time, in various legal proceedings arising in the ordinary course of business. While the
ultimate results of these proceedings cannot be predicted with certainty, management believes these claims will not have a material effect on the financial position, liquidity or operations.
Environmental Compliance
Extensive federal, state and local laws govern oil and natural gas operations, regulate the discharge of materials into the environment or otherwise relate to the protection of the environment. Numerous governmental departments issue rules and regulations to implement and enforce such laws that are often difficult and costly to comply with and which carry substantial administrative, civil and even criminal penalties for failure to comply. Some laws, rules and regulations relating to protection of the environment may, in certain circumstances, impose “strict liability” for environmental contamination, rendering a person liable for environmental and natural resource damages and cleanup costs without regard to negligence or fault on the part of such person. Other laws, rules and regulations may restrict the rate of oil and natural gas production below the rate that would otherwise exist or even prohibit exploration or production activities in sensitive areas. In addition, state laws often require some form of remedial action to prevent pollution from former operations, such as closure of inactive pits and plugging of abandoned wells. The regulatory burden on the oil and natural gas industry increases its cost of doing business and consequently affects its profitability. These laws, rules and regulations affect our operations, as well as the oil and gas exploration and production industry in general. We believe that we are in substantial compliance with current applicable environmental laws, rules and regulations and that continued compliance with existing requirements will not have a material adverse impact on us. Nevertheless, changes in existing environmental laws or the adoption of new environmental laws have the potential to adversely affect our operations.
The operations of the Partnership’s coal lessees and natural gas midstream segment are subject to environmental laws and regulations adopted by various governmental authorities in the jurisdictions in which these operations are conducted. The terms of the Partnership’s coal property leases impose liability for all environmental and reclamation liabilities arising under those laws and regulations on the relevant lessees. The lessees are bonded and have indemnified the Partnership against any and all future environmental liabilities. The Partnership regularly visits coal properties under lease to monitor lessee compliance with environmental laws and regulations and to review mining activities. Management believes that the operations of the Partnership’s coal lessees and natural gas midstream segment will comply with existing regulations and does not expect any material impact on its financial condition or results of operations.
As of December 31, 2005 and 2004, the Partnership’s environmental liabilities included $2.5 million and $1.5 million, which represents our best estimate of the liabilities as of those dates related to the coal and natural gas midstream businesses. The Partnership has reclamation bonding requirements with respect to certain unleased and inactive properties. Given the uncertainty of when the reclamation area will meet regulatory standards, a change in this estimate could occur in the future.

96
23. Quarterly Financial Information (Unaudited)
Summarized Quarterly Financial Data
2004 Quarters Ended
2005 Quarters Ended (1)
(in thousands, except share data)
Mar. 31
June 30
Sept. 30
Dec. 31
Mar. 31
June 30
Sept. 30
Dec. 31
Revenues $ 55,626 $ 54,569 $ 52,741 $ 65,489 $ 88,210 $ 157,965 $ 186,393 $ 241,296Operating income $ 22,354 $ 25,665 $ 17,493 $ 15,284 $ 27,704 $ 26,417 $ 46,808 $ 61,088Net income $ 10,142 $ 12,080 $ 6,434 $ 4,699 $ 7,040 $ 7,647 $ 19,990 $ 27,411Net income per share (2):
Basic $ 0.56 $ 0.66 $ 0.35 $ 0.26 $ 0.38 $ 0.41 $ 1.08 $ 1.47Diluted $ 0.55 $ 0.65 $ 0.35 $ 0.25 $ 0.38 $ 0.41 $ 1.07 $ 1.46
Weighted average shares outstanding:
Basic 18,168 18,293 18,357 18,414 18,490 18,517 18,560 18,613Diluted 18,352 18,479 18,574 18,610 18,694 18,719 18,760 18,818
(1) Includes the results of operations from the natural gas midstream segment since March 3, 2005, the closing date of the Cantera Acquisition. (2) The sum of the quarters may not equal the total of the respective year’s net income per share due to changes in the weighted average shares outstanding
throughout the year. 24. Supplemental Information on Oil and Gas Producing Activities (Unaudited)
The following supplemental information regarding the oil and gas producing activities is presented in accordance with the requirements of the Securities and Exchange Commission (“SEC”) and SFAS No. 69, Disclosures about Oil and Gas Producing Activities. The amounts shown include our net working and royalty interest in all of our oil and gas operations.
Capitalized Costs Relating to Oil and Gas Producing Activities
December 31,
2005
2004
2003
(in thousands)
Proved properties $ 126,286 $ 120,742 $ 123,302 Unproved properties 66,727 61,013 60,042 Wells, equipment and facilities 502,877 392,230 316,257 Support equipment 4,088 3,461 3,689
699,978 577,446 503,290 Accumulated depreciation and depletion (191,860) (148,212) (116,998)
Net capitalized costs (1) $ 508,118 $ 429,234 $ 386,292
(1) Net capitalized costs of $16.4 million at December 31, 2005, and $13.7 million at December 31, 2004, relating to a transmission pipeline and compression in the Appalachian Basin placed into service during 2005 and 2004 were excluded from net capitalized costs.
In accordance with SFAS No. 143, as of January 1, 2003, the cost basis of oil and gas wells were increased by
approximately $1.0 million. During 2005, 2004 and 2003, an additional $0.4 million, $0.3 million and $0.4 million was added to the cost basis of oil and gas wells for wells drilled.

97
Costs Incurred in Certain Oil and Gas Activities
Year Ended December 31,
2005
2004
2003
(in thousands) Proved property acquisition costs $ — $ — $ 35,131Unproved property acquisition costs 26,360 13,046 9,021Exploration costs 30,335 26,429 21,401Development costs and other (1) 109,066 82,048 67,783
Total costs incurred $ 165,761 $ 121,523 $ 133,336
(1) Development costs of $3.8 million in 2005 and $13.7 million in 2004 relating to a transmission pipeline and compression in the Appalachian Basin placed into service during 2005 and 2004 were excluded from 2005 and 2004 costs incurred.
Results of Operations for Oil and Gas Producing Activities
The following schedule includes results solely from the production and sale of oil and gas and a non-cash charge for
property impairments. It excludes corporate related general and administrative expenses and gains or losses on property dispositions. The income tax expense is calculated by applying the statutory tax rates to the revenues after deducting costs, which include depletion allowances and giving effect to oil and gas related permanent differences and tax credits.
Year Ended December 31,
2005
2004
2003
(in thousands) Revenues $ 226,219 $ 151,786 $ 123,431 Production expenses 30,940 23,728 21,928 Exploration expenses 40,917 26,058 15,503 Depreciation and depletion expense(1) 44,865 35,772 33,164 Impairment of oil and gas properties 4,785 655 406
104,712 65,573 52,430 Income tax expense 41,466 25,967 21,338
Results of operations $ 63,246 $ 39,606 $ 31,092
(1) Depreciation expense of $0.9 million in 2005 and $0.1 million in 2004 relating to a transmission pipeline and compression in the Appalachian Basin placed into service during 2005 and 2004 were excluded from 2005 and 2004 depreciation and depletion expense.
In accordance with SFAS No. 143, the combined depletion and accretion expense related to asset retirement obligations
that were recognized during 2005, 2004 and 2003 in depreciation, depletion and amortization expense was approximately $0.2 million, $0.5 million and $0.2 million.
Oil and Gas Reserves
The following schedule presents the estimated oil and gas reserves owned by us. This information includes our royalty and net working interest share of the reserves in oil and gas properties. Net proved oil and gas reserves for the three years ended December 31, 2005, were estimated by Wright and Company, Inc. All reserves are located in the United States.
There are many uncertainties inherent in estimating proved reserve quantities, and projecting future production rates and
the timing of future development expenditures. In addition, reserve estimates of new discoveries are more imprecise than those of properties with a production history. Accordingly, these estimates are subject to change as additional information becomes available. Proved oil and gas reserves are the estimated quantities of crude oil, condensate and natural gas that geological and engineering data demonstrate with reasonable certainty to be recoverable in future years from known reservoirs under existing economic and operating conditions at the end of the respective years. Proved developed oil and gas reserves are those reserves expected to be recovered through existing wells with equipment and operating methods.
Net quantities of proved reserves and proved developed reserves during the periods indicated are set forth in the tables below:

98
Proved Developed and Undeveloped Reserves
Oil and Condensate
(MBbls)
Natural Gas
(MMcf)
Total Equivalents
(MMcfe)
December 31, 2002 5,361 241,255 273,421 Revisions of previous estimates 101 (5,302) (4,696)Extensions, discoveries and other additions 232 53,088 54,480 Production (625) (20,094) (23,844)Purchase of reserves 1,567 14,354 23,756 Sale of reserves in place (2) (232) (244)
December 31, 2003 6,634 283,069 322,873 Revisions of previous estimates (418) (13,669) (16,177)Extensions, discoveries and other additions 532 70,010 73,202 Production (396) (22,079) (24,455)Purchase of reserves — — —Sale of reserves in place (9) (1,279) (1,333)
December 31, 2004 6,343 316,052 354,110 Revisions of previous estimates (35) (13,859) (14,071)Extensions, discoveries and other additions 554 87,860 91,184 Production (306) (25,676) (27,515)Purchase of reserves — — —Sale of reserves in place (3,659) (5,196) (27,148)
December 31, 2005 2,897 359,181 376,560
Proved Developed Reserves:
December 31, 2003 3,346 230,958 251,034
December 31, 2004 2,895 243,480 260,850
December 31, 2005 2,017 266,970 279,070
The following table sets forth the standardized measure of the discounted future net cash flows attributable to our proved
oil and gas reserves. Future cash inflows were computed by applying year-end prices of oil and gas to the estimated future production of proved oil and gas reserves. Natural gas prices were escalated only where existing contracts contained fixed and determinable escalation clauses. Contractually provided natural gas prices in excess of estimated market clearing prices were used in computing the future cash inflows only if we expect to continue to receive higher prices under legally enforceable contract terms. Future prices actually received may materially differ from current prices or the prices used in the standardized measure.
Future production and development costs represent the estimated future expenditures (based on current costs) to be
incurred in developing and producing the proved reserves, assuming continuation of existing economic conditions. Future income tax expenses were computed by applying statutory income tax rates to the difference between pre-tax net cash flows relating to our proved oil and gas reserves and the tax basis of proved oil and gas properties. In addition, the effects of statutory depletion in excess of tax basis, available net operating loss carryforwards and alternative minimum tax credits were used in computing future income tax expense. The resulting annual net cash inflows were then discounted using a 10 percent annual rate.
Year ended December 31,
2005
2004
2003
(in thousands) Future cash inflows $ 3,902,546 $ 2,310,163 $ 1,965,224 Future production costs (637,907) (460,729) (392,193)Future development costs (192,938) (123,928) (70,105)
Future net cash flows before income tax 3,071,701 1,725,506 1,502,926 Future income tax expense (834,774) (455,328) (407,411)
Future net cash flows 2,236,927 1,270,178 1,095,515 10% annual discount for estimated timing of cash flows (1,200,481) (680,525) (583,823)
Standardized measure of discounted future net cash flows $ 1,036,446 $ 589,653 $ 511,692
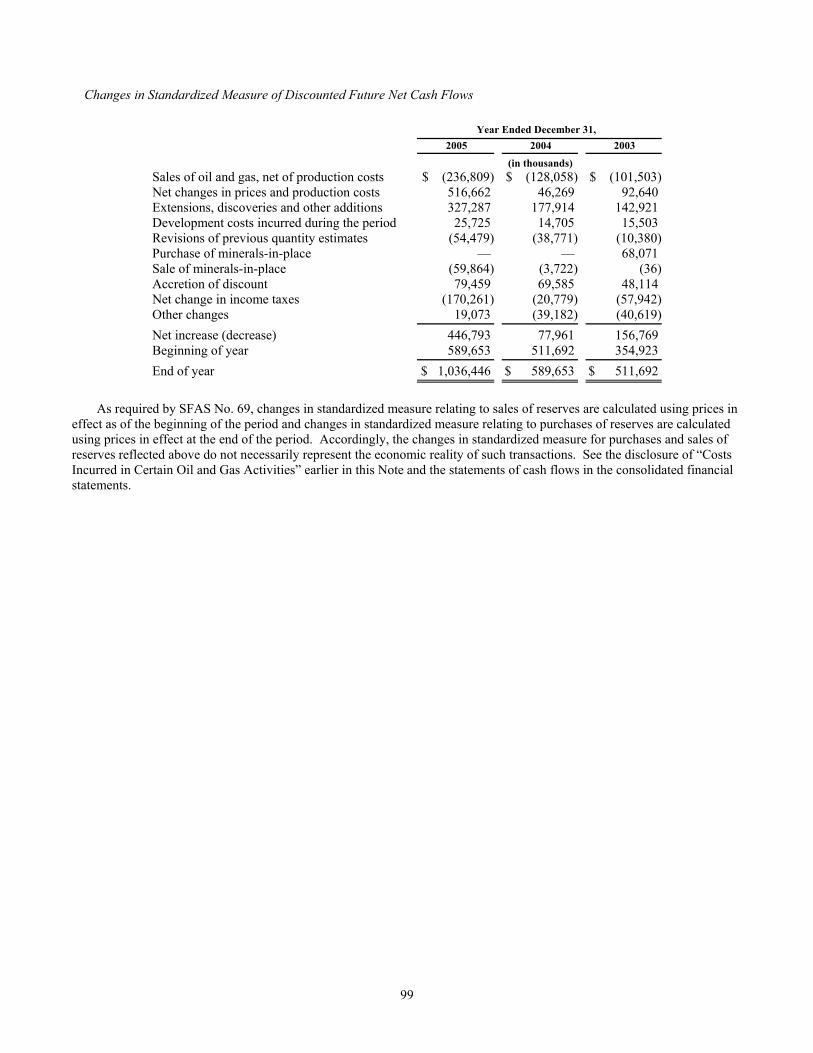
99
Changes in Standardized Measure of Discounted Future Net Cash Flows
Year Ended December 31,
2005
2004
2003
(in thousands) Sales of oil and gas, net of production costs $ (236,809) $ (128,058) $ (101,503)Net changes in prices and production costs 516,662 46,269 92,640 Extensions, discoveries and other additions 327,287 177,914 142,921 Development costs incurred during the period 25,725 14,705 15,503 Revisions of previous quantity estimates (54,479) (38,771) (10,380)Purchase of minerals-in-place — — 68,071 Sale of minerals-in-place (59,864) (3,722) (36)Accretion of discount 79,459 69,585 48,114 Net change in income taxes (170,261) (20,779) (57,942)Other changes 19,073 (39,182) (40,619)
Net increase (decrease) 446,793 77,961 156,769 Beginning of year 589,653 511,692 354,923
End of year $ 1,036,446 $ 589,653 $ 511,692
As required by SFAS No. 69, changes in standardized measure relating to sales of reserves are calculated using prices in
effect as of the beginning of the period and changes in standardized measure relating to purchases of reserves are calculated using prices in effect at the end of the period. Accordingly, the changes in standardized measure for purchases and sales of reserves reflected above do not necessarily represent the economic reality of such transactions. See the disclosure of “Costs Incurred in Certain Oil and Gas Activities” earlier in this Note and the statements of cash flows in the consolidated financial statements.

100
Item 9 Changes in and Disagreements with Accountants on Accounting and Financial Disclosure
None. Item 9A Controls and Procedures
(a) Disclosure Controls and Procedures Under the supervision and with the participation of our management, including our Chief Executive Officer and our
Chief Financial Officer, we performed an evaluation of the design and operation of our disclosure controls and procedures (as defined in Rule 13a-15(e) of the Exchange Act) as of December 31, 2005. Our disclosure controls and procedures are designed to ensure that information required to be disclosed by us in the reports we file or submit under the Exchange Act is recorded, processed, summarized and reported accurately and on a timely basis. Based on that evaluation, our Chief Executive Officer and our Chief Financial Officer concluded that, as of December 31, 2005, such disclosure controls and procedures were effective.
(b) Management’s Annual Report on Internal Control Over Financial Reporting Our management, including our Chief Executive Officer and our Chief Financial Officer, is responsible for establishing
and maintaining adequate internal control over our financial reporting. Our management assessed the effectiveness of our internal control over financial reporting as of December 31, 2005. This evaluation was completed based on the framework established in Internal Control—Integrated Framework issued by the Committee of Sponsoring Organizations of the Treadway Commission.
In conducting management’s evaluation of the effectiveness of our internal control over financial reporting as of
December 31, 2005, we have excluded our natural gas midstream business, which was acquired on March 3, 2005 and which now operates as PVR Midstream LLC, as permitted by the SEC. PVR Midstream LLC’s total assets were $241.9 million, or approximately 19 percent of our total assets as of December 31, 2005, and PVR Midstream LLC’s total revenues were $350.6 million, or approximately 52 percent of our total revenues, for the year ended December 31, 2005.
Our management has concluded that, as of December 31, 2005, our internal control over financial reporting was
effective. KPMG LLP, an independent registered public accounting firm, has issued an attestation report on our management’s assessment of the effectiveness of our internal control over financial reporting as of December 31, 2005, which is included in Item 8 of this Form 10-K.
(c) Changes in Internal Control Over Financial Reporting No changes were made in our internal control over financial reporting that occurred during our last fiscal quarter that
have materially affected, or are reasonably likely to materially affect, our internal control over financial reporting. Item 9B Other Information
There was no information that was required to be disclosed by us on a Current Report on Form 8-K during the fourth quarter of 2005 which we did not disclose.
101
PART III Item 10 Directors and Executive Officers of the Registrant
Except for information concerning our executive officers included Item 1 hereof, in accordance with General Instruction G(3), reference is hereby made to the Company’s definitive proxy statement to be filed within 120 days after the end of the fiscal year covered by this report. Item 11 Executive Compensation
In accordance with General Instruction G(3), reference is hereby made to the Company’s definitive proxy statement to be filed within 120 days after the end of the fiscal year covered by this Annual Report on Form 10-K.
Item 12 Security Ownership of Certain Beneficial Owners and Management and Related Shareholder Matters
In accordance with General Instruction G(3), reference is hereby made to the Company’s definitive proxy statement to be filed within 120 days after the end of the fiscal year covered by this Annual Report on Form 10-K. Item 13 Certain Relationships and Related Transactions
In accordance with General Instruction G(3), reference is hereby made to the Company’s definitive proxy statement to be filed within 120 days after the end of the fiscal year covered by this Annual Report on Form 10-K. Item 14 Principal Accounting Fees and Services
In accordance with General Instruction G(3), reference is hereby made to the Company’s definitive proxy statement to be filed within 120 days after the end of the fiscal year covered by this Annual Report on Form 10-K.

102
PART IV Item 15 Exhibits, Financial Statement Schedules
The following documents are filed as exhibits to this Annual Report on Form 10-K.
(1) Financial Statements—The financial statements filed herewith are listed in the Index to Financial Statements on page 51 of this Annual Report on Form 10-K.
(2) All schedules are omitted because they are not required, inapplicable or the information is included in the consolidated financial statements or the notes thereto
(3) Exhibits (3.1) Articles of Incorporation of Penn Virginia Corporation (incorporated by reference to Exhibit 3.1 to Registrant’s
Annual Report on Form 10-K for the year ended December 31, 1999). (3.2) Articles of Amendment of Articles of Incorporation of Penn Virginia Corporation (incorporated by reference to
Exhibit 3.2 to Registrant’s Annual Report on Form 10-K for the year ended December 31, 1999). (3.3) Articles of Amendment of Articles of Incorporation of Penn Virginia Corporation (incorporated by reference to
Exhibit 3 to Registrant’s Quarterly Report on Form 10-Q for the quarterly period ended June 30, 2004). (3.4) Amended and Restated Bylaws of Registrant (incorporated by reference to Exhibit 3(ii) to Registrant’s Report
on Form 8-K filed on December 2, 2004). (4.1) Rights Agreement dated as of February 11, 1998 between Penn Virginia Corporation and American Stock
Transfer & Trust Company (incorporated by reference to Exhibit 1.1 to Registrant’s Registration Statement on Form 8-A filed on February 20, 1998).
(4.2) Amendment No. 1 to Rights Agreement dated as of March 27, 2002 by and between Penn Virginia Corporation and American Stock Transfer & Trust Company (incorporated by reference to Exhibit 4.1 to Registrant’s Report on Form 8-K filed on March 28, 2002).
(10.1) Amended and Restated Credit Agreement dated as of December 4, 2003 among Penn Virginia Corporation, the lenders party thereto, Bank One, NA, as Administrative Agent, Wachovia Bank, National Association, as Syndication Agent, Royal Bank of Canada, BNP Paribas and Fleet National Bank, as Documentation Agents, and Banc One Capital Markets, Inc. and Wachovia Capital Markets, LLC, as Co-Lead Arrangers and Joint Book Runners (incorporated by reference to Exhibit 10.1 to Registrant’s Annual Report on Form 10-K for the year ended December 31, 2003).
(10.2) First Amendment to Amended and Restated Credit Agreement dated as of December 29, 2004 among Penn Virginia Corporation, the lenders party thereto and JPMorgan Chase Bank, N.A.
(10.3) Second Amendment to Amended and Restated Credit Agreement dated as of December 15, 2005 among Penn Virginia Corporation, the lenders party thereto and JPMorgan Chase Bank, N.A.
(10.4) Omnibus Agreement dated October 30, 2001 among Penn Virginia Corporation, Penn Virginia Resource GP, LLC, Penn Virginia Operating Co., LLC and Penn Virginia Resource Partners, L.P. (incorporated by reference to Exhibit 10.2 to Registrant’s Report on Form 8-K filed on November 14, 2001).
(10.5) Amendment No. 1 to Omnibus Agreement dated December 19, 2002 among the Penn Virginia Corporation, Penn Virginia Resource GP, LLC, Penn Virginia Operating Co., LLC and Penn Virginia Resource Partners, L.P. (incorporated by reference to Exhibit 10.9 to Registrant’s Annual Report on Form 10-K for the year ended December 31, 2002).
(10.6) Penn Virginia Corporation and Affiliated Companies’ Employees’ 401(k) Plan, as amended (incorporated by reference to Exhibit 10.3 to Registrant’s Annual Report on Form 10-K for the year ended December 31, 2001).*
(10.7) Penn Virginia Corporation Supplemental Employees Retirement Plan, as amended.* (10.8) Penn Virginia Corporation Non-Employee Directors Deferred Compensation Plan.* (10.9) Penn Virginia Corporation 1994 Stock Option Plan, as amended (incorporated by reference to Exhibit 10.5 to
Registrant’s Annual Report on Form 10-K for the year ended December 31, 1999).* (10.10) Penn Virginia Corporation 1995 Fourth Amended and Restated Directors’ Stock Compensation Plan
(incorporated by reference to Exhibit 10.3 to Registrant’s Annual Report on Form 10-K for the year ended December 31, 2004).*
(10.11) Penn Virginia Corporation Second Amended and Restated 1999 Employee Stock Incentive Plan (incorporated by reference to Exhibit 10.1 to Registrant’s Current Report on Form 8-K filed on February 27, 2006).
(10.12) Form of restricted stock award agreement (incorporated by reference to Exhibit 10.13 to Registrant’s Annual Report on Form 10-K for the year ended December 31, 2004).*
(10.13) Form of deferred common stock award agreement (incorporated by reference to Exhibit 10.14 to Registrant’s Annual Report on Form 10-K for the year ended December 31, 2004).*
(10.14) Executive Change of Control Severance Agreement dated February 28, 2006 between Penn Virginia Corporation and A. James Dearlove (incorporated by reference to Exhibit 10.1 to Registrant’s Current Report on Form 8-K

103
filed on March 2, 2006).* (10.15) Executive Change of Control Severance Agreement dated February 28, 2006 between Penn Virginia Corporation
and Frank A. Pici (incorporated by reference to Exhibit 10.2 to Registrant’s Current Report on Form 8-K filed on March 2, 2006).
(10.16) Executive Change of Control Severance Agreement dated February 28, 2006 between Penn Virginia Corporation and Nancy M. Snyder (incorporated by reference to Exhibit 10.3 to Registrant’s Current Report on Form 8-K filed on March 2, 2006).*
(10.17) Executive Change of Control Severance Agreement dated February 28, 2006 between Penn Virginia Corporation and H. Baird Whitehead (incorporated by reference to Exhibit 10.4 to Registrant’s Current Report on Form 10-Q filed on March 2, 2006).*
(10.18) Executive Change of Control Severance Agreement dated March 9, 2006 between Penn Virginia Resource GP, LLC and Keith D. Horton (incorporated by reference to Exhibit 10.1 to Registrant’s Current Report on Form 8-K filed on March 14, 2006).*
(10.19) Executive Change of Control Severance Agreement dated March 9, 2006 between Penn Virginia Resource GP, LLC and Ronald K. Page (incorporated by reference to Exhibit 10.2 to Registrant’s Current Report on Form 8-K filed on March 14, 2006).*
(12.1) Statement of Computation of Ratio of Earnings to Fixed Charges Calculation. (21.1) Subsidiaries of Registrant (incorporated by reference to Exhibit 21 to Registrant’s Annual Report on Form 10-K
for the year ended December 31, 2004). (23.1) Consent of KPMG LLP. (23.2) Consent of Wright & Company, Inc. (31.1) Certification Pursuant to 18 U.S.C. Section 1350, as Adopted Pursuant to Section 302 of the Sarbanes-Oxley Act
of 2002. (31.2) Certification Pursuant to 18 U.S.C. Section 1350, as Adopted Pursuant to Section 302 of the Sarbanes-Oxley Act
of 2002. (32.1) Certification Pursuant to 18 U.S.C. Section 1350, as Adopted Pursuant to Section 906 of the Sarbanes-Oxley Act
of 2002. (32.2) Certification Pursuant to 18 U.S.C. Section 1350, as Adopted Pursuant to Section 906 of the Sarbanes-Oxley Act
of 2002. * Management contract or compensatory plan or arrangement.

104
SIGNATURES
Pursuant to the requirements of Section 13 or 15(d) of the Securities Exchange Act of 1934, the Registrant has duly caused this report to be signed on its behalf by the undersigned, thereunto duly authorized.
PENN VIRGINIA CORPORATION
By: /s/ FRANK A. PICI
March 16, 2006
Frank A. Pici Executive Vice President and Chief Financial Officer
By: /s/ FORREST W. MCNAIR
March 16, 2006
Forrest W. McNair Vice President and Controller
Pursuant to the requirements of the Securities Exchange Act of 1934, this report has been signed below by the following
persons on behalf of the Registrant and in the capacities and on the dates indicated.
/S/ ROBERT GARRETT
(Robert Garrett) Chairman of the Board and Director March 16, 2006
/S/ JOE N. AVERETT, JR.
(Joe N. Averett, Jr.) Director March 16, 2006
/S/ EDWARD B. CLOUES, II
(Edward B. Cloues, II) Director March 16, 2006
/S/ A. JAMES DEARLOVE
(A. James Dearlove) Director and President and Chief Executive Officer March 16, 2006
/S/ KEITH D. HORTON
(Keith D. Horton) Director and Executive Vice President March 16, 2006
/S/ STEVEN W. KRABLIN
(Steven W. Krablin) Director March 16, 2006
/S/ MERRILL A. MILLER, JR.
(Merrill A. Miller, Jr.) Director March 16, 2006
/S/ MARSHA R. PERELMAN
(Marsha R. Perelman) Director March 16, 2006
/S/ PHILIPPE VAN MARCKE DE LUMMEN
(Philippe van Marcke de Lummen) Director March 16, 2006
/S/ GARY K. WRIGHT
(Gary K. Wright) Director March 16, 2006

Penn Virginia Corporation (NYSE:PVA) is an energy company engaged in the exploration, acquisition, development and production of crude oil and natural gas. PVA is also the general partner and the largest unit holder in Penn Virginia Resource Partners, L.P. (NYSE:PVR), which manages coal properties and related assets and operates a midstream natural gas gathering and processing business. PVA is headquartered in Radnor, PA. For more information about PVA, visit the Company’s website at www.pennvirginia.com.
Uniquein Energy
(1) Member of the Nominating and Governance Committee
(2) Member of the Compensation and Benefi ts Committee
(3) Member of the Audit Committee(4) Member of the Oil & Gas Committee
Corporate Information
Financial HighlightsIn millions except per share data 20052005 2004 2003 2002 2001
Financial DataNet Revenues(1) $ 370.0370.0 $ 228.4 $ 181.3 $ 111.0 $ 96.6Operating Income(2) 162.0162.0 80.8 62.1 30.8 1.6Net Income(3) 62.162.1 33.4 28.5 12.1 34.3Net Cash Flows Provided by Operating Activities 231.4231.4 146.4 109.7 65.8 44.2
Common Share Data(4)
Net Income, Basic ($/share) $ 3.353.35 $ 1.82 $ 1.59 $ 0.68 $ 1.96Net Income, Diluted ($/share) 3.313.31 1.81 1.58 0.67 1.93Dividends Paid ($/share) 0.450.45 0.45 0.45 0.45 0.45Average Shares Outstanding, Diluted 18.718.7 18.5 18.1 17.9 17.8
CapitalizationNet Long-term Debt(5) $ 325.8325.8 $ 188.9 $ 154.3 $ 106.9 $ 3.5Minority Interest in Penn Virginia Resource Partners 313.5313.5 182.9 190.5 192.8 144.0Shareholder’s Equity 310.6310.6 252.9 211.6 188.0 185.5Total Capitalization 949.9949.9 624.7 556.4 487.7 333.0Percent of Net Long-term Debt to Total Capitalization 34.3%34.3% 30.2% 27.7% 21.9% 1.1%
Production DataOil and Condensate (MBbl) 302302 396 625 349 164Natural Gas (Bcf) 25.625.6 22.1 20.1 18.7 13.1Total Oil and Gas Production (Bcfe) 27.427.4 24.5 23.8 20.8 14.1Daily Production (MMcfe) 74.974.9 66.8 65.2 57.0 38.6Coal Produced by Lessees (Millions of tons) 30.230.2 31.2 26.5 14.3 15.3Daily Plant Inlet Volumes (MMcf)(6) 127127 — — — —
Realized Prices and MarginsOil and Condensate ($/Bbl) $ 45.6745.67 $ 33.75 26.91 $ 23.63 $ 22.94Natural Gas ($/Mcf) 8.318.31 6.27 5.31 3.35 4.06Coal Royalties ($/Ton) 2.742.74 2.23 1.90 2.20 2.11Midstream Processing Margin ($/Mcf) 1.151.15 — — — —
Estimated ReservesTotal Proved Oil and Gas Reserves (Bcfe) 376.6376.6 354.1 322.9 273.4 252.8Coal (Millions of Recoverable Tons) 689.1689.1 558.1 588.2 614.8 492.8
(1) 2005 revenues are shown net of cost of gas purchased.(2) Operating income in 2004 included $7.5 million of loss on assets held for sale.(3) Net income in 2001 included a $54.7 million ($35.6 million after tax) gain on the sale of Norfolk Southern Corporation common stock.(4) Amounts per common share in 2001 through 2003 have been adjusted for the effect of a two-for-one stock split effective on June 3, 2004. (5) Net of $43.4 million cash equivalents held as collateral for the debt as of December 31, 2001.(6) Natural gas midstream results from date of Cantera acquisition effective March 3, 2005.
DirectorsRobert Garrett(1,2)
Chairman of the Board of the Company and Founder and Managing Director of AdMedia Partners, Inc.
Joe N. Averett, Jr.(4)
Former President, CEO and Director, Crystal Gas Storage, Inc.
Edward B. Cloues, II(2,3)
Chairman and Chief Executive Officerof K-Tron International, Inc. and Director of Penn Virginia Resource GP, LLC, general partner of Penn Virginia Resource Partners, L.P.
A. James DearlovePresident and Chief Executive Officerof the Company and Chairman andChief Executive Officer of Penn Virginia Resource GP, LLC, general partner of Penn Virginia Resource Partners, L.P.
Keith D. HortonExecutive Vice President of the Company and President and Chief Operating Officer of Penn Virginia Resource GP, LLC, general partner of Penn Virginia Resource Partners, L.P.
Steven W. Krablin(1,3)
Former Senior Vice President and Chief Financial Officer, National Oilwell, Inc.
Philippe van Marcke de LummenAdvisor to Cheniere Energy, Inc. and former President and Chief Executive Officer of Tractebel LNG Ltd.
Merrill A. Miller, Jr.President and Chief Executive Officer of National Oilwell Varco, Inc.
Marsha Reines Perelman(1,3,4)
Chief Executive Officer ofWoodforde Management, Inc. and Director of Penn Virginia Resource GP, LLC, general partner of Penn Virginia Resource Partners, L.P.
Gary K. Wright(2,3,4)
Former President, LNB Energy Advisors, former Southwest Managing Director
for Chase Manhattan Bank Global Oil and Gas Group and former Manager of Chemical Bank Worldwide Energy Group
ManagementA. James DearlovePresident and Chief Executive Officer
Frank A. PiciExecutive Vice President andChief Financial Officer
H. Baird WhiteheadExecutive Vice President
Keith D. HortonExecutive Vice President
Nancy M. SnyderSenior Vice President, GeneralCounsel and Corporate Secretary
Ronald K. PageVice President
Forrest W. McNairVice President and Controller
Major SubsidiariesPenn Virginia Oil and Gas CorporationPenn Virginia Resource GP, LLC
Annual MeetingPenn Virginia Corporation’sAnnual Meeting will be held10 a.m. May 2, 2006Marriott Philadelphia West111 Crawford AvenueWest Conshohocken, PA 19428(610) 941-5600 phone(610) 941-1060 fax
Transfer Agent and RegistrarAmerican Stock Transferand Trust CompanyMailing Address:59 Maiden LaneNew York, NY 10038(800) 937-5449 phone(718) 236-2641 fax
Certifi cationsIn 2005, we submitted our Section 303A.12(a) chief executive offi cer certifi cation to the New York Stock Exchange. We have also fi led with the Securities and Exchange Commission, as an exhibit to our most recently fi led Annual Report on Form 10-K, the Sarbanes-Oxlely Act Section 302 certifi cations.
Des
ign:
Cre
ativ
e St
rate
gy G
roup
csg
-des
ign.
com
PVA_AR05_CoverRls.crw2 2PVA_AR05_CoverRls.crw2 2 3/23/06 1:35:15 PM3/23/06 1:35:15 PM

Penn Virginia Corporation
Three Radnor Corporate Center Suite 300100 Matsonford RoadRadnor, PA 19087(610) 687-8900 phone(610) 687-3688 faxwww.pennvirginia.com
Uniqueby Design
Annual Report 2005
Penn Virginia Corporation
PENN
VIRGINIA CO
RPORATIO
N Annual Report 2005
PVA_AR05_CoverRls.crw2 1PVA_AR05_CoverRls.crw2 1 3/23/06 1:35:03 PM3/23/06 1:35:03 PM