Union learning adding value - An evaluation of unionlearn and the union learning fund
Upload
unionlearnCategory
view
225download
0description

1
Union Learning Survey Produced by Marchmont Observatory University of Exeter
May 2015

2
Report Authors
Ben Neild and Hilary Stevens
Acknowledgements
A great many people supported the conduct of the survey, the analytical process and
development of this report.
In particular we would like to thank:
Dave Eva, Julia Jones, Pauline Murphy and Helen Gagliasso of Unionlearn for their
tireless support and helpful input, particularly around the background and aims of the
Union Learning Fund (ULF).
The ULF project managers and workers listed below for their financial support, for
helping us to focus and refine the survey, reach respondents, and for their helpful
comments on the findings: Paul Dovey from CWU; Piotr Plonka, Phil Caiels, Lynn
Ferguson and Agnieszka Zamonski from the GMB; Karen Foster and Anthony Ristic
from PCS; Davinder Sandhu from Unison; Emily Spencer from the Royal College of
Nursing; Kenny Barron and Jim Richie from Unite the Union; Steve Craig from
UCATT; Anne Murphy from USDAW; John Vickers from BFAWU and Anne Hansen
from Unison North – Links to Learning.
Simon McKee, Head of the Economics and Modelling Team at the Department for
Business Innovation and Skills for reviewing and commenting on the impact model.
The many Union Learning Representatives and project workers who cascaded out
the questionnaire to learners across the country.
BMG Research for their input on the questionnaire and for managing delivery of the
survey with great professionalism and efficiency.
The views expressed in this report are the authors’ and do not necessarily represent those of
Unionlearn, the TUC, the unions or ULF projects.
Ben Neild
Marchmont Observatory
University of Exeter
3
Contents Report Authors ................................................................................................................. 2
Acknowledgements .......................................................................................................... 2
Introduction ........................................................................................................................... 5
Executive Summary .............................................................................................................. 6
Background ...................................................................................................................... 6
Profile of courses .............................................................................................................. 7
Profile of learners ............................................................................................................. 7
Patterns of learning .............................................................................................................. 8
Skills gained ..................................................................................................................... 9
Application of skills to work ................................................................................................. 10
Outcomes gained ........................................................................................................... 10
Hard Outcomes .................................................................................................................. 10
Soft outcomes .................................................................................................................... 11
The importance of union support .................................................................................... 12
Benchmarking outcomes ................................................................................................ 12
The impact of learning .................................................................................................... 12
Economic impact estimates ............................................................................................ 13
Background ......................................................................................................................... 14
Unions and learning ........................................................................................................ 14
The Union Learning Fund ............................................................................................... 15
ULF Priorities & Objectives ............................................................................................. 16
Union Learning Representatives..................................................................................... 18
The current policy context ............................................................................................... 19
Participating Projects .......................................................................................................... 21
Methodology ....................................................................................................................... 24
Profile of courses ................................................................................................................ 26
Type of union learning .................................................................................................... 26
Frequency of learning ..................................................................................................... 27
Attainment of qualifications ............................................................................................. 29
Reasons for taking part in union learning ........................................................................ 32
Profile of learners ................................................................................................................ 35
Employment and education characteristics ..................................................................... 37
Patterns of learning ............................................................................................................. 39
Age ................................................................................................................................. 40
Ethnicity .......................................................................................................................... 42
First language ................................................................................................................. 44
Disability ......................................................................................................................... 46
Economic status ............................................................................................................. 48

4
Type of employment contract ......................................................................................... 50
Receipt of income-related state benefits or tax credits .................................................... 52
Highest qualification ....................................................................................................... 53
Learner characteristics by learning type. ........................................................................ 55
Skills gained & their use ...................................................................................................... 59
Skills development.......................................................................................................... 59
The application of skills to learners’ current jobs ............................................................. 64
Skills for new job or change into a different type of work ................................................ 65
Outcomes of learning .......................................................................................................... 69
Hard outcomes ............................................................................................................... 69
Soft outcomes ................................................................................................................ 83
The importance of union support ......................................................................................... 89
Benchmarking outcomes ..................................................................................................... 91
The impact of learning ......................................................................................................... 93
Social benefits of learning............................................................................................... 93
Benefits to Individuals ..................................................................................................... 94
Benefits to organisations ................................................................................................ 95
Benefits to the Economy ................................................................................................. 95
Economic & Fiscal Impact ................................................................................................... 96
Estimated total impact .................................................................................................... 97
Return on investment ..................................................................................................... 97
Return by type of provision ............................................................................................. 97
Returns to the Exchequer ............................................................................................... 98
Annex 1 – Overview of project outputs .............................................................................. 100
Annex 2 - Impact estimate Methodology ........................................................................... 101
Earnings and employment premia ................................................................................ 101
Application of earning and employment premia ............................................................ 104
Estimating added value ................................................................................................ 105
Return on investment ................................................................................................... 105
Returns to the Exchequer ............................................................................................. 108
Reliability checks .......................................................................................................... 109
Sensitivity analysis ....................................................................................................... 109
Annex 3 – Union Learning Survey Questionnaire .............................................................. 113
BibliogRaphy ..................................................................................................................... 122

5
INTRODUCTION
This report contains the findings of a large scale survey of people who took part in learning
as a result of support provided through Round 15 of the Union Learning Fund (ULF).
The main focus of the report is an analysis of quantitative data gathered via the survey. This
is supplemented by external benchmarking against the findings of the Community Learning
Learner Survey (BIS, 2013) and the use of a model to generate an estimate of the economic
impact and the return generated by public investment ULF Round 15.
To illuminate points arising in the analysis, comments made by survey respondents about
their experience of union learning have also been included.
The objectives of the study are :
1. To review the characteristics of participants in union learning;
2. To review the outcomes of union learning and impact of participation on learners’
lives;
3. To identify factors that appear to predict or to be positively correlated with positive
outcomes of learning; and
4. To assess the impact and value added by the ULF.

6
EXECUTIVE SUMMARY
Background
Trades Unions have a long history of involvement in learning. In recent years union
involvement in training has come to be seen as having a strategic significance and as
offering a basis for a co-operative partnership between unions and employers. This resulted
in the establishment of the Union Learning Fund (ULF) in 1998.
This report sets out the results of a survey of people who were supported into learning
through the activities of projects supported by Round 15 of the ULF. In total, £14.15m was
awarded to 41 projects, of which eleven participated in the survey. Although they made up
just 27% of ULF Round 15 projects, the eleven that participated in the survey accounted for
50% of the funding and 59% of the opportunities generated through ULF Round 15.
Together, they delivered:
1,200 training opportunities for Union Learning Representatives
11,800 opportunities for people to improve their English, Maths & Functional skills
20,000 opportunities for people to gain ICT skills at a variety of levels
6,350 opportunities for people to gain vocational qualifications at Level 2 and Level 3
15,000 Continuing Professional Development Opportunities
18,000 opportunities for people to progress to Further Education
400 opportunities for people to progress into Higher Education
4,700 Apprenticeship opportunities.
They also referred 19,700 people into Informal Adult & Community Learning, provided
advice via ULRs to 90,000 people and referred another 12,000 people to advice, guidance
and support delivered by external organisations.
Compared to all ULF Round 15 projects, the projects taking part in the survey delivered a
higher proportion of the following forms of learning than we would expect: training for ULRs
(82%); functional skills (70%); FE (82%); Apprenticeships (73%); and information, advice
and guidance provided via ULRs (75%).
The Union Learning Survey (ULS) was conducted through an online survey and a paper /
postal questionnaire, both of which were cascaded to learners through their unions. A total of
2,519 responses were received. The number of responses from participating projects ranged
from 66 from the CWU to 439 from USDAW. Random sampling was not possible and, as
occurs with all postal and online surveys, individuals participated on a self-selecting basis.

7
Profile of courses
The most common types of learning undertaken by respondents were: short courses or
events to gain skills and knowledge related to learners’ work or professional development;
training to be a Union Learning Representative; ICT courses; informal learning; functional
skills; and vocational courses.
The majority (62%) of respondents had taken part in more than one episode of learning and
31% had taken part four times or more. Roughly half of respondents (48%) had participated
in more than one type of learning. Three quarters (74%) had participated in union learning
within the last 12 months.
Over half (56%) of respondents gained a qualification as a result of their learning, with equal
numbers gaining a qualification at a level higher than their existing qualifications and gaining
a qualification at the same or lower level. Five percent of all respondents gained a
qualification, but were unsure of its level, relative to the qualifications they already held.
Learners undertaking vocational courses (82%) and higher education or training (71%) were
most likely and those taking part in informal learning for leisure, pleasure and personal
development (12%) were least likely to have achieved a qualification as a result of union
learning. The likelihood of attaining qualifications is heavily influenced by the number of
courses undertaken by learners.
The most common principal motivation for respondents’ participation in union learning was to
perform better in their current job or to advance their career, gain promotion or a pay rise
(37% of learners). Other common motivations were to support people in their community or
workplace (24%) or to gain skills that would be useful in their everyday life (23%).
The proportion of respondents gaining qualifications was highest among learners motivated
by a desire to advance their career, gain promotion or a pay rise (67%) and lowest among
those learning for fun or to meet new people (23%).
Profile of learners
The majority (83%) of respondents were aged 25 to 64 years old, of peak working age.
Compared to the general population, a slightly higher proportion of union learners were from
minority communities or had English as a second language (ESOL). The gender balance
was slightly biased towards women, while the proportion of learners with a disability was
below that for the general population. The vast majority of union learners (88%) were
employed with permanent contracts of employment. However a sizeable minority were
agency workers, on fixed term or temporary contracts (16%) or were receiving income-
related benefits (8%). While union learners were more likely than the general population to
hold any qualification, they were less likely to hold qualifications at degree level or above. A
sizeable minority held low level qualifications or qualifications from abroad.
8
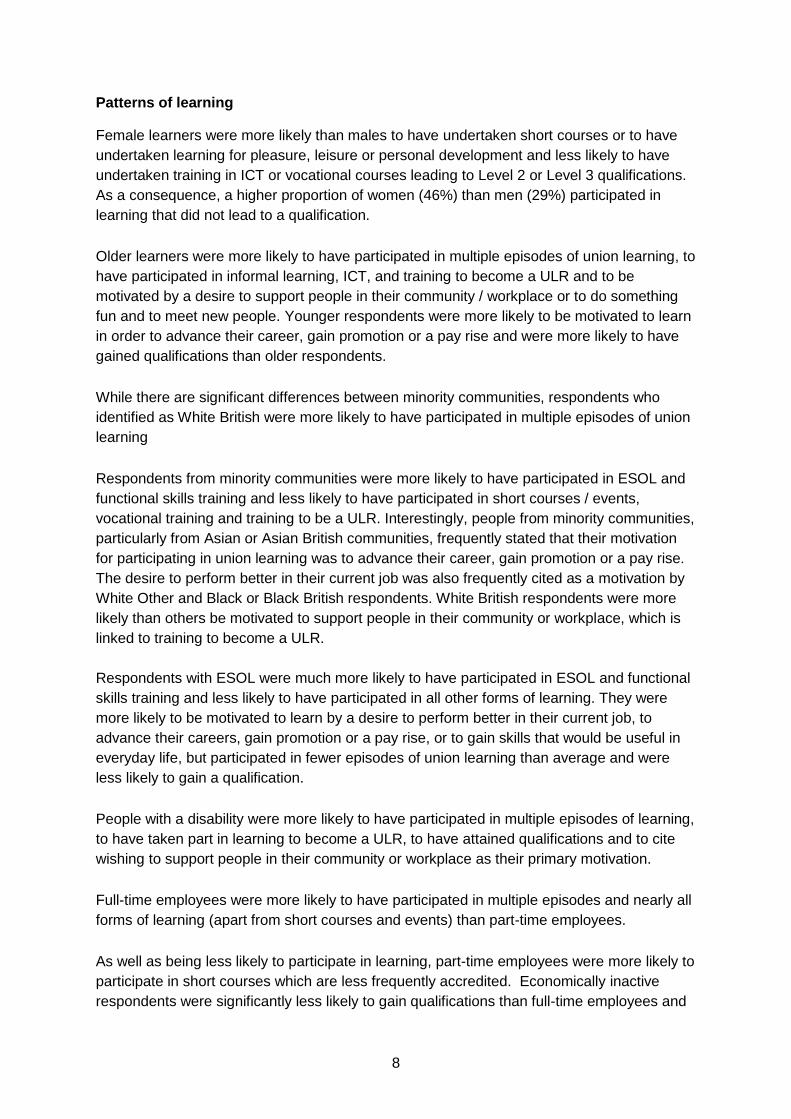
Patterns of learning
Female learners were more likely than males to have undertaken short courses or to have
undertaken learning for pleasure, leisure or personal development and less likely to have
undertaken training in ICT or vocational courses leading to Level 2 or Level 3 qualifications.
As a consequence, a higher proportion of women (46%) than men (29%) participated in
learning that did not lead to a qualification.
Older learners were more likely to have participated in multiple episodes of union learning, to
have participated in informal learning, ICT, and training to become a ULR and to be
motivated by a desire to support people in their community / workplace or to do something
fun and to meet new people. Younger respondents were more likely to be motivated to learn
in order to advance their career, gain promotion or a pay rise and were more likely to have
gained qualifications than older respondents.
While there are significant differences between minority communities, respondents who
identified as White British were more likely to have participated in multiple episodes of union
learning
Respondents from minority communities were more likely to have participated in ESOL and
functional skills training and less likely to have participated in short courses / events,
vocational training and training to be a ULR. Interestingly, people from minority communities,
particularly from Asian or Asian British communities, frequently stated that their motivation
for participating in union learning was to advance their career, gain promotion or a pay rise.
The desire to perform better in their current job was also frequently cited as a motivation by
White Other and Black or Black British respondents. White British respondents were more
likely than others be motivated to support people in their community or workplace, which is
linked to training to become a ULR.
Respondents with ESOL were much more likely to have participated in ESOL and functional
skills training and less likely to have participated in all other forms of learning. They were
more likely to be motivated to learn by a desire to perform better in their current job, to
advance their careers, gain promotion or a pay rise, or to gain skills that would be useful in
everyday life, but participated in fewer episodes of union learning than average and were
less likely to gain a qualification.
People with a disability were more likely to have participated in multiple episodes of learning,
to have taken part in learning to become a ULR, to have attained qualifications and to cite
wishing to support people in their community or workplace as their primary motivation.
Full-time employees were more likely to have participated in multiple episodes and nearly all
forms of learning (apart from short courses and events) than part-time employees.
As well as being less likely to participate in learning, part-time employees were more likely to
participate in short courses which are less frequently accredited. Economically inactive
respondents were significantly less likely to gain qualifications than full-time employees and

9
more likely to be motivated by a desire to support people in their community or workplace or
to do something fun or meet new people.
Conversely, union learning appears to have been highly effective in addressing the skills
needs of workers on fixed-term or temporary contacts and those employed through an
agency. Motivated by the desire to perform better in their job or to advance their career or
gain a pay rise, this group was more likely to have participated in multiple episodes of
learning, to have participated in ESOL and to have gained qualifications at a higher level
than the qualifications they already held.
Those in receipt of benefits (including in-work benefits) were less likely to have engaged in
multiple episodes of learning; more likely to have undertaken training in functional skills, ICT
and ESOL and, unsurprisingly, more likely to cite a desire to advance their career, gain
promotion or a pay rise.
Unsurprisingly, respondents with low levels of qualifications were likely to participate in
learning focused on the acquisition of functional skills and ESOL, while respondents with
higher levels of qualifications were more likely to have participated in higher education, short
courses and events and training to become a ULR. Those with higher qualifications were
much more likely to have engaged in multiple episodes of learning, a finding which suggests
that union learning is taken up by enthusiastic learners and, over time, results in the
attainment of higher level qualifications.
Skills gained
Overall, 92% of respondents identified at least one skill that had improved as a result of their
involvement in union learning. The skills most commonly gained were: self-
confidence/sense of what I can achieve (gained by 49% of respondents);
vocational/practical/professional development (37%); and planning and organising skills
(32%).
Learners who gained qualifications were more likely to report that they had developed skills
than those who hadn’t. Learners who gained qualifications at a higher level than those they
already held identified gaining an average of 3.9 different skills as a result of their
participation in union learning, compared to 1.7 skills for those who had not gained a
qualification.
Skills such as ESOL, ICT, Literacy and Numeracy, which are often the focus of specific
training programmes, are particularly likely to be gained by learners attaining qualifications.
The impact on self-confidence and, interestingly, the acquisition of
vocational/practical/professional skills is less influenced by accreditation, probably due to the
vocational relevance of unaccredited short courses and events.
Learners who completed their courses attained an average of 1.9 skills each, compared to
1.2 for early leavers. Course completion was particularly important for developing self-
confidence, vocational and practical and professional skills.

10
Unsurprisingly, the type of skills developed was closely linked to the type of learning
undertaken. Some skills, such as self-confidence, were acquired by all learners, while types
of learning focused on specific skillsets (such as ICT) produced more concentrated skills
outcomes. An analysis of skills outcomes for respondents who participated in one type of
learning shows that vocational courses were associated with the acquisition of a particularly
wide variety of skills, while informal learning was least likely to be associated with skills
acquisition.
Learners who participated in multiple episodes of learning acquired a much greater range of
skills than single episode learners, a finding which supports maintaining a focus on fostering
cultures of learning.
Application of skills to work
Nearly three quarters of respondents (74%) felt that union learning had given them new skills
that they might use in their current job and two thirds (60%) felt they had gained new skills
they could use to get a job or to change into a different type of work. Respondents who had
taken part in union learning to advance their career or to gain promotion or a pay rise were
most likely to report gaining new skills that they might use to get a new job or to change into
a different type of work. The proportion of respondents gaining skills that they might use in
their current job and / or to get a new job / change career increases steadily with the
number of learning episodes they have engaged in. This, again, points to the value of
supporting multiple learning episodes.
Functional skills, ICT, ESOL, vocational courses and higher education were seen as
particularly likely to help respondents in their current work or to achieve career aspirations.
Outcomes gained
Hard Outcomes
On the basis of a “yes’ / ‘no” response, the most common hard outcome, i.e. occurrence that
“actually happened” as a result of participation in union learning, was that participants were
able to do their existing job better, cited by 40% of respondents. Large numbers of learners
were also more confident about progressing in their career (35%), more involved in their
union (32%), more confident about funding a job in future (24%) or became a ULR (19%).
The existence of significant gaps between a) the proportion of respondents who felt they
were performing better at work and the proportion who gained a pay rise and b) the
proportion who felt they had gained skills that would help them gain promotion / change job
and those who had actually attained these outcomes, suggests that a significant proportion
of the benefit of union learning accrues to employers, at least in the short-term.
Unsurprisingly, respondents’ motivations for taking part in learning influenced the outcomes
they experienced. For example, those most motivated to support people in their workplace or
community were most likely to have become more involved in their union or had become a

11
ULR. Interestingly, however, feeling able to do their job better and more confident about
progressing in their career were reported outcomes for large numbers of respondents,
regardless of their motivation for learning.
The type of learning undertaken had a significant impact on the attainment of hard
outcomes. Respondents who had participated in vocational courses were more likely than
others to report outcomes relating to employment progression, i.e. that they had gained
promotion or greater responsibility in their job; that they felt more confident about
progressing in their career; and more confident about finding a job in the future. Those who
trained to become a ULR reported being much more involved in their union. Participants in
HE reported a wide range of outcomes, while those who participated in informal learning
were less likely to report they had attained any of the specified outcomes than others.
Caution is required, as this may be a function of the duration these different forms of
learning. However, interestingly and impressively, respondents who participated in ESOL
were significantly more likely than average to report a wide range of outcomes, including that
they got a new job or changed to a different kind of work; were able to do their job better;
stayed in a job they might otherwise have lost; felt more confident about progressing in their
career; and felt more confident about finding a job in the future.
Learners who engaged in multiple episodes and types of learning attributed a much larger
number of hard outcomes to their learning than single episode learners. Multiple participation
was particularly closely linked to gaining a new job, promotion, a pay rise, becoming a ULR
and becoming more involved in the union. Once again, this appears to support a policy of
encouraging people to engage in multiple episodes of learning.
Soft outcomes
On the basis of a scale, from “completely agree” to “completely disagree”, more than two
thirds of respondents agreed that union learning resulted in them: becoming more confident
in their abilities (82%); more likely to undertake further learning and training (79%); more
enthusiastic about learning (74%); and better able to organise, mentor and support other
people (66%). Over half of all learners agree or completely agree that union learning has
improved their quality of life and well-being (51%) and has resulted in them getting a better
idea about what they want to do in their life (53%).
Again, outcomes were influenced by the type of learning undertaken. Functional Skills
learners were more likely than average to agree that they were more enthusiastic about
learning; had improved their quality of life / well-being; and had become a more capable
parent. Those on vocational courses were more likely to agree that they had a better idea
about what they wanted to do with their lives and were most likely to agree that they had
become more confident in their abilities, while those training to become a ULR were more
likely to agree that they were better able to organise, mentor and support other people.
The proportion of ICT training, informal learning and short course participants who
experienced these outcomes was lower than average, for every outcome, which may be a
function of the duration and depth of these types of learning. However, set against this, it is
impressive that ESOL learners were more likely than average to have experienced every

12
single outcome and were most likely to agree that they had become more enthusiastic about
learning; had a better idea about what they wanted to do in their lives; improved their quality
of life; were more likely to undertake further learning and training; had become a more
capable parent; felt more confident about progressing in their career; and were more
confident about finding a job in the future.
The importance of union support
Nearly three out of four (72%) of respondents felt that their union was either extremely
important (39%) or very important (33%) in supporting their learning. Only 13% thought it
was only slightly (6%) or was not at all (7%) important. It is interesting to note that
respondents in many minority or disadvantaged groups attributed a higher level of
importance to the support received from their union than others.
Benchmarking outcomes
To help us to consider the extent to which these outcomes are ‘good’, we benchmarked the
findings of this Union Learning Survey (ULS) against those for the Community Learning
Learner Survey (CLLS).
Perhaps reassuringly, this exercise shows that very similar proportions of respondents to
each survey agreed that they: had become more enthusiastic about learning; had a better
idea about what they wanted to do in their lives; were more confident in their abilities; and
were more likely to undertake further learning and training.
A higher proportion of CLLS respondents (71%) than ULS respondents (51%) agreed that
learning had improved their quality of life. This is not unexpected, given that community
learning includes much of learning for leisure, pleasure, cultural enrichment and intellectual
or creative stimulation. When we look at employment-related outcomes, the opposite pattern
emerges. A higher proportion of ULS respondents (42%) than employed CLLS respondents
(33%) felt able to do their job; had gained promotion, greater responsibility or got a pay rise
(11% v 6%); or stated that their learning had given them new skills that they might use in
their job (82% v 61% ). Less expected is that a higher proportion of CLLS than ULS
respondents stated that they were more confident in progressing in their career (42% v 36%)
or stayed in a job that they might have lost (5% v 3%) as a result of their learning. It is not
clear why this should be the case.
The impact of learning
Investing in skills and learning has benefits for:
Society through a healthier population, greater civic participation and less crime;
Individuals by raising their likelihood of being in employment, improved wages,
economic resilience and life-satisfaction;
Employers who gain a more productive and innovative workforce; and

13
The economy by increasing productivity and employment rates (Campbell et al,
2010).
These impacts are inter-related. Raising skill levels raises salaries and employment levels,
which reduces poverty, which in turn reduces illness, disease and unhealthy behaviours. The
complexity and diversity of these relationships is such that building a model of the overall
impact of any single investment in skills is impossible. Nevertheless, it is possible to combine
the survey results with previous research to reach a rough estimate of the economic impact
of Round 15 of the ULF.
Economic impact estimates
Based on estimates of the increased earnings that individuals experience a) from higher
wages and b) from the greater likelihood of being employed as a result of gaining
qualifications, we estimate that the overall impact of investment in ULF Round 15 extension
is around £916million. The total benefits to individuals are estimated to be £580 million,
made up of £470 million from higher wages and £110 million as a result of being more likely
to be in employment. The net benefit to employers resulting from the greater productivity of
a better skilled workforce (less output lost as a result of working time taken to engage in
learning) is estimated at £336 million.
Taking into account the cost of delivering learning (by FE colleges and others) brokered via
Union learning, we estimate that each £1 invested in the ULF generates a total economic
return of £9.15, of which £5.75 accrues to individuals and £3.40 to employers.
Our estimate of return on investment varies significantly by the type of learning provided,
with Apprenticeships, accredited FE and vocational programmes showing the highest level
of net return on investment. The return on ICT and English, Maths and functional skills are
also substantial, while the net return on higher education and informal learning are
calculated to be negative. This is due to the fact that most informal learning is unaccredited
(and therefore being assumed not to confer a benefit) and because the collective cost of
tuition fees, earnings and productivity foregone is higher than the significant (c. 11%) uplift in
annual earnings that results from higher education, particularly for older learners who have
less time left in the labour market during which the benefits will be felt.
A limited model, focused on tax receipts, suggests that the fiscal return to the Exchequer
from learning generated by ULF Round 15 amounts to £250m or, taking delivery costs into
account, generates an estimated return of £2.50 for each £1 of public funding invested in
ULF Round 15.

14
BACKGROUND
Unions and learning
Trades Unions have a long history of involvement in learning. Although often associated with
a focus on pay and jobs, unions have always been concerned to equip their members with
the education and skills they need to progress in work; to contribute to the betterment of their
workplace and society; and to become active, self-fulfilled citizens. According to John Fisher,
if one includes the work of the Workers Education Association (WEA) and Labour colleges,
Trade Union Education has been “the most important mass adult education programme
carried out specifically for working class people during last century” (Fisher, 2005).
While members’ personal development has been a longstanding concern for unions, in
recent years their involvement in training and learning has come to be seen as having a
strategic significance and as offering a basis for a more co-operative partnership between
unions and employers (Wallis et al, 2005). The “New” Labour government, elected in 1997,
was particularly keen to support the role of trade unions in skills formation, seeing learning
as “a natural issue for partnership in the workplace between employers, employees and their
trade union”, and as offering scope for “partnership on practical issues such as time off for
learning, employer support for individual learning accounts, and training plans for staff”
(DfEE, 1998; Stewart, 2011). Reforms were put in place to enable unions to support the
government’s ambition of bringing about a “Learning Age”, including the introduction of the
ULF and a statutory right to paid time off for Union Learning Representatives (ULRs) to
enable them to negotiate access to workplace learning opportunities. Although built on
previous small-scale demonstration projects1, this new state-promoted role marked the end
of a period during which unions were almost excluded from the institutional apparatus of
state training policy.
The Coalition has reaffirmed the Government’s commitment to union learning. Six months
after election, it published Skills for Sustainable Growth (BIS, 2010), setting out its long-term
vision for reform of the FE and Skills system. This document applauds the “impressive track
record” and “major role” that Unionlearn and ULRs play “in promoting formal and informal
learning in workplaces and wider communities, especially in reaching out to those who
are poorly qualified and most in need of support” and expressing the wish to see unions
promoting the benefits of Apprenticeships to disadvantaged groups and helping
individuals in the workplace to access careers information and advice.
Comments left by survey participants point to:
a firm belief in the rationale for partnership around union learning and a confidence
in the benefits it brings to employers, unions and the wider community,
Union Learning is a vital part of what both employers and unions can offer their staff or members. It
affects the lowest educated of our society in a positive and inclusive way, creates a good work
1 Such as Bargaining for Skills.

15
atmosphere, and helps the employer with more confident, more capable staff who can enjoy Union
Learning as a benefit. In addition it forges links with the community, and has long lasting and
penetrating benefit upon all involved - the learners, the employer, the union and the local community.
personal experiences of these benefits;
I was stuck in a rut. My employer's training programme became centred around my role and more
often than not, badly delivered… With union learning, the opposite occurred. With a wide range of
courses available, encouragement to take that first step and the variety of delivery styles, learning
became fun, interesting and addictive. My confidence increased and my skills improved.
as well as the existence of a lingering debate about the pitfalls of aligning union
education with the government’s skills agenda.
Union learning should be focused entirely on meeting the needs and expectations of individual learners
and not directly in meeting government skills agendas. Skills acquisition is a by-product of workers
becoming empowered through learning and education, and as such is centred on their needs, not
those of government. Unions are in danger of making the mistake of becoming an arm of government
by directing workers into areas of skills deficiency thereby meeting the aims of the Leitch report.
Producing skilled workers, without the jobs, wastes time and resources and raises expectations which
cannot be met.
The Union Learning Fund
The Union Learning Fund (ULF) was established in 1998. Although the focus of the fund has
varied in subtle ways over the years in line with Government policy, the over-arching
objective has remained the same: developing the capacity of trade unions and ULRs to work
with employers, employees and training providers to encourage greater take up of learning
in the workplace.
The majority of ULF funding is funnelled to union-led projects. At the start, these were often
small and based in specific workplaces or localities2. Over the years projects have grown
and nowadays tend to focus on capacity-building and engaging of a wide range of
employers across whole sectors or union footprints.
In 1998, the first year of its operation, the government grant to the ULF was just over £1m.
Since then, as Table 1 shows, the scale of the grant has grown. Determining annual values
is complicated by the fact that awards are made to projects lasting more than a single year.
However, allowing for these fluctuations, annualised funding has recently been cut back,
from £18.7 million in 2013/14 to £15.3m in 2014/15 and £14.15m in 2015/16.
2 The largest single award in Round One was just £79,000.

16
Table 1: Union Learning Fund Values and Projects supported, 1998 to 2012/13
Source: Unionlearn
The declining budget and growth in project size have combined to result in a fall in the cost
per learner supported. In Years 1 to 3 the average cost per learner was £580. By 2013/14
(the last year for which full performance data is currently available) this had fallen to £85.373,
with values ranging from £10 to £250 per learner, depending on the focus of individual
projects. Projects focused on large-scale brokerage and guidance have much lower unit
costs than those delivering programmes of learning. Targets for 2015/16 have been set in
the expectation of the unit cost falling further, to £80 per learner4.
ULF Priorities & Objectives
Priorities for each ULF funding round are agreed with the Department for Business,
Innovation and Skills (BIS) and tend to reflect Departmental / Government concerns such as
the importance of addressing youth unemployment; using public funding to support access
and progression for disadvantaged people; promoting employer ownership of skills; creating
progression opportunities from Traineeships to higher level skills; increasing responsiveness
to local needs; and fostering industrial partnership (BIS, 2011; Richard, 2012; Heseltine,
2012; BIS, 2013).
The priorities for projects funded under Round 15 of the ULF, which is the focus of this
evaluation, are as follows.
3 The 2013/14 budget of £18.7m was used to support 219,091 learners.
4 The 2015/16 budget of £14.15m includes a target of 174,102 learners supported.
Funding Round Year Projects
supported
Funding
provided
Year 1 1998 28 1,022,634
Year 2 1999 68 2,781,705
Year 3 2000 93 4,734,927
Year 4 2001 103 6,487,001
Year 5 2002 62 9,155,618
Year 6 2003 44 10,339,047
Year 7 2004 44 13,863,756
Year 8 2005 30 7,690,843
Year 9 2006 24 19,394,028
Year 10 2007 17 5,388,288
Year 11 2008/9 31 21,549,569
Year 12 2009/10 10 2,420,891
Year 13 2010/11 41 27,531,739
Year 14 2011/12 7 917,739
Year 15 2012/13 43 26,828,745

17
Priority 1 Greater employer ownership of the skills system - including fostering
industrial partnerships, bringing employers & stakeholders (such as colleges)
closer together, reaching out to employers not engaged in employer ownership
(such as SMEs) and using Learning Centres and other incentives to build
investment, interest and ownership of skills.
Priority 2 More sustainable employment for young people - including working with
employers to promote more and better quality Apprenticeships and Traineeship
programmes, promoting the benefits of Apprenticeships and Traineeships to
young people, promoting work experience and outreach within communities
and youth groups that helps young people gain the skills and confidence
needed to enter work.
Priority 3 Build a High Skills Workforce – including supporting the acquisition of
English, Maths and functional skills; supporting vulnerable and disadvantaged
union members and wider networks to engage in learning via informal routes;
working with employers to develop learning agreements, training and
development strategies for staff-wide communities; developing skills and
progression routes; developing and enabling ULRs to make this happen.
Priority 4 Drive up standards and quality of skills provision – including facilitating
closer working between employers and providers, promoting industrial
partnerships and driving up standards of skills provision through joint learning
committees and union learning centres and through work on equality and
diversity, e.g. ESOL, digital inclusion and reaching out to vulnerable and hard
to reach learners etc.
These annual priorities sit within a framework of long-term ULF objectives, shown in the box
below.

18
It is important to note that ULF projects do not normally involve the direct delivery of training
and skills. The focus is on: fostering cultures of learning and creating opportunities to learn in
the workplace; working with external training providers and bringing them into the workplace
to deliver programmes that meet employer and employee needs; and encouraging
employees to take up the opportunities created. The emphasis is on brokerage, mentoring
and guidance.
Union Learning Representatives
In order to properly understand the impact of the ULF, we need to consider the work of the
30,000 Union Learning Representatives (ULRs) who have been trained over the years
(Union Learning Fund Business Plan 2013/14).
Since the 2002 Employment Act, ULRs have had the right to take reasonable paid time off
work to perform their duties. Originally conceived as learning mentors providing information,
advice and guidance to colleagues, today these duties cover:
Union Learning Fund Objectives
Build union capacity to sustain and embed work on learning and skills so that this
becomes a core activity for all trade unions.
Develop the key role of Union Learning Representatives (ULRs) and learning
champions in raising demand for learning, especially among workers with low skill
levels and disadvantaged groups in the workplace.
Maximise the union contribution to the development and delivery of the
Government's strategy to improve the skills of the workforce and the performance
of the economy and engagement in learning.
Help unions and ULRs develop a framework to provide high quality information,
advice and guidance to stimulate the take up of learning and promote progression.
Help unions to engage with the established network of union-led learning centres in
the workplace, union offices, non-unionised workplaces and union learning centres
to offer a growing range of learning opportunities.
Help unions to form active partnerships with employers and develop learning
agreements to tackle both organisational and individual skills needs.
Help unions to form effective partnerships with learning providers to ensure
learning opportunities are customised, quality assured, relevant and delivered
effectively with appropriate support given to learners.
Develop union capacity to engage in effective partnership working with regional and
national skills organisations.

19
analysing learning or training needs;
arranging and supporting learning and training;
consulting the employer about carrying out such activities;
preparing to carry out the above activities.
The work can also extend to accessing funds to support learning activities; establishing
partnerships with external training providers; developing workplace learning resources, such
as learning centres (Cowen et al., 2000: 2, Wallis et al, 2005); and negotiating learning
agreements with single or groups of employers. Previous research on the impact of ULRs
(Stuart, 2011) has shown that where learning agreements are in place, employers are
significantly more likely to engage in a wide range of staff development practices. For
example:
91% of employers with learning agreements were involved in addressing basic skills
gaps, compared to 63% of employers without learning agreements
86% were involved in introducing qualifications, compared to 55%
69% were involved in developing a learning centre, compared to 36%
56% were involved in funding non work-related courses, compared to 34%
52% were involved in Apprenticeships, compared to 34%
The ULF provides funding both to train ULRs5 and to enable them to deliver these functions.
Some 29% of survey respondents had taken part in training to become a ULR. As the quote
below shows, these are frequently individuals who have been inspired to take up the role as
a result of their own experience of union learning.
Union learning has completely changed my career. I had a degree and worked in an administrative job.
Becoming involved in union learning and becoming a ULR has allowed me to get two promotions that
my previous experience and qualifications would not have been applicable to. I now encourage
members to participate in union learning for personal and professional development as it really can
change their career, outlook and lives.
The current policy context
Although cuts to public expenditure have resulted in a reduction in its size, the ULF
continues to be seen by BIS as making an important contribution to the Government’s skills,
growth and inclusion ambitions.
5 The ULF supports the delivery of a range of programmes for ULRs including accredited courses such as the ULR Stage 1 and
ULR Stage 2 Awards as well as unaccredited programmes to support ongoing professional development of ULRs, such as Developing Workplace Learning or Apprenticeship Mentoring.

20
The underlying principles of the Coalition’s skills strategy - fairness, responsibility and
freedom – emphasise the responsibility that employers and individuals have for identifying
and meeting their own skills needs. Government recognises that these responsibilities are
accompanied by market failures: individuals may not appreciate the benefits that accrue
from investments in learning; financial returns to acquiring lower-level qualifications,
essential for progression, can be low; and corporate investment in skills confer benefits
beyond the organisation making the investment, e.g. when employees change jobs taking
their skills with them.
As a consequence, national skills policy focuses on activities such as helping individuals to
make informed choices; creating clear opportunities for progression; ensuring that funding is
focused on those most in need of public support (i.e. where market failures are greatest);
and on qualifications / provision that deliver greatest value for money.
Although not as strongly emphasised as it was during Labour’s “Learning Age”, the
Government continues to recognise that investments in learning yield a wide range of
benefits to the state and society, such as better health, lower crime, increased civic
participation, greater productivity, lower unemployment and so on. Flowing from this,
alongside the ULF, Government has maintained a commitment to supporting community
learning, focused on people on low incomes, with low skill levels, who are least likely to
learn. The objectives for community learning have much in common with those of the ULF,
being to:
improve confidence and willingness to engage in learning
support the acquisition of skills to prepare people for training, employment or self-
employment
improve digital and financial literacy and/or communication skills
enable parents/carers to support and encourage their children’s learning
improve / maintain health and/or social well-being. (BIS 2011).
While there are significant differences in the objectives of the two funds - with the ULF being
more workplace, employment and growth focused – the similarities between these two
strands of policy create scope for benchmarking and comparison.

21
PARTICIPATING PROJECTS
Round 15 of the ULF supported 41 projects. A total of £14.06m was disbursed to these
projects for the financial year 2013/14, through grants ranging from £2.1m for a large-scale
national project delivered by Unite to £52,000 for a project delivered by Unity, formerly the
Ceramic and Allied Trades Union and the National Society of Pottery Workers. Together
these projects leveraged an additional £5m of employer contributions, in the form of staff
time, learning centre facilities and other resources.
Eleven of these 41 projects opted to take part in the Union Learning Survey, a decision
which was based on both perceived benefits and resource availability. The eleven
participating projects were larger than average, accounting for 27% of all Round 15 ULF
projects and 50% of Round 15 funding.
Data from the final submissions of these 11 projects6 shows that they created nearly
122,000 learning opportunities, equivalent to 59% of all the opportunities created under
Round 15 of the ULF.
Table 2 provides a breakdown of the opportunities created by type of learning. It shows that
the 11 participating projects generated around:
1,200 training opportunities for Union Learning Representatives
11,800 opportunities for people to improve their Functional Skills, English, Maths &
Functional skills
20,000 opportunities for people to gain ICT skills at a variety of levels
6,350 opportunities for people to gain vocational qualifications at Level 2 and Level 3
15,000 Continuing Professional Development Opportunities
18,000 opportunities for people to progress to Further Education
400 opportunities for people to progress into Higher Education; and
4,700 Apprenticeship opportunities.
In addition, they referred 19,700 people into Informal Adult & Community Learning, provided
advice via ULRs to 90,000 people and referred another 12,000 people to advice, guidance
and support delivered by external organisations.
6 Made in April 2015

22
Table 2: Learning opportunities created by ULF projects
Source: ULF Round 15 final submission data provided via Unionlearn
Table 2 also shows that although projects participating in the survey received 50% of Round
15 ULF funding, they expected to generate:
59% of all opportunities via the ‘Union Learning Route’ (the asterisked items in the
table, which lead to full or part-qualifications);
59% of all opportunities including delivery of unaccredited adult & community
learning and apprenticeships (but not guidance activities); and
63% of total opportunities, including all guidance and external brokerage activities.
It also shows that participating projects delivered a higher proportion of the learning
delivered than we might expect in the following areas: training for ULRs (82%); functional
11
x P
roje
cts
in s
urv
ey
All
15
ULF
Ro
un
d 1
5
Pro
ject
s
% o
f To
tal
New ULRs completing Stage 1* 673 876 77%
ULRs completing Stage 2* 541 608 89%
Total 1,214 1,484 82%
English* 6,639 9,073 73%
Maths* 5,151 7,872 65%
Total 11,790 16,945 70%
Level 1* 2,953 3,608 82%
Level 2* 1,289 2,530 51%
Level 3* 206 374 55%
Online basics* 4,644 6,148 76%
Other ICT Courses* 10,947 18,598 59%
Total 20,039 31,258 64%
Level 2* 5,225 13,601 38%
Level 3* 1,131 2,239 51%
Total 6,356 15,840 40%
IACL 19,691 35,431 56%
CPD* 14,982 35,812 42%
FE* 18,301 22,189 82%
HE* 399 799 50%
Apprenticeships 4,711 6,473 73%
Total 58,084 100,704 58%
Individuals given advice by ULRs 90,134 120,936 75%
Referrals to other organisations 11,942 24,134 49%
Total 102,076 145,070 70%
Total - Union Learning Route (* asterisked) 97,483 166,231 59%
Total Learning Inc. IACL & Apprenticeships 121,885 208,135 59%
Total Learning & IAG 223,961 353,205 63%
Total Learing
ICT
Other Learning
Opportunities
Functional Skills
Vocational Qualifications
Information Advice &
Guidance
Union learning
Representatives

23
skills (70%); FE (82%); Apprenticeships (73%); and information, advice and guidance
provided via ULRs (75%).
It is important to note that these output targets relate to learning opportunities, not individual
learners and, as the survey shows, many union learners take up more than one learning
opportunity.
Table 3 shows that differences in the balance of provision offered by projects are reflected in
their unit cost per learner. The average cost per learner participating in the substantive
learning opportunities7 (via the ‘Union Learning Route’) was £71 for projects taking part in
the survey and £85 for all Round 15 projects.
Table 3: Cost per learner, ULF Round 15 Projects
Source: ULF Round 15 Applications & administrative data via Unionlearn
A detailed breakdown of the learning opportunities generated by each project taking part in
the survey is given at Annex 1.
In summary, although there are some differences, the general balance and cost of provision
of the support delivered by participating projects can be considered broadly representative of
Round 15 ULF projects as a whole.
7 Excluding Adult & Community Learning, Apprenticeships and Information, Advice & Guidance.
Union / Project Total value of bid
Cost per Learner
(Union Learning
Route)
Cost per Learner
inc IAG via ULRs
and Referrals
BFAWU £378,382 £219 £69
CWU £380,421 £63 £40
GMB (Y&D) £298,990 £25 £25
GMB (South) £620,522 £313 £139
PCS £912,996 £346 £120
RCN £205,738 £60 £32
UCATT £217,743 £31 £12
UNISON - Bridges to Learning £421,324 £145 £47
UNISON - Inclusive Learning £660,011 £80 £14
UNITE £2,136,488 £52 £35
USDAW £711,985 £69 £38
All projects / unions participating in Survey £6,944,600 £71 £35
All Round 15 projects £14,060,789 £85 £45

24
METHODOLOGY
Although all Round 15 ULF projects had the opportunity to opt-in to the survey, the decision
to participate was largely governed by resource availability, as a contribution to the cost of
the survey was provided by each participating project. As stated, our analysis suggests that
participating projects were broadly representative of ULF Round 15 and that extrapolating to
generate an estimate of the economic impact of ULF Round 15 as a whole is not
substantially compromised by the data being drawn from a sample of the overall cohort of
projects.
The survey questionnaire was designed by the University of Exeter in consultation with
Unionlearn and representatives of participating projects. In developing the questionnaire we
referred to previous similar surveys, notably the Community Learning Learner Survey
(Harding et al 2013) with a view to replicating questions to allow for comparison and
benchmarking of results.
ULF funded projects are required to keep information on all learners, including those receiving advice and guidance. These records are kept by projects and at present there is no requirement to pass detailed information on to Unionlearn. The absence of a central database combined with sensitivities and legal concerns relating to the release of the learner records8 meant that it was not possible to randomly select survey respondents. The survey questionnaire was therefore cascaded to learners through central and regional project offices and ULRs. To maximise the response rate, learners were given the opportunity to complete the survey either online or via a paper / postal questionnaire9. Each union was asked to ensure that 1,000 learners were invited to participate. 5,300 paper questionnaires were printed, with the number distributed ranging from 1,000 by a project adopting an entirely postal approach to 300 by a project seeking to generate predominantly online response. The use of a cascaded email invitation means that we cannot know exactly how many learners were invited to participate and, as a result, we cannot compute a precise response rate. However, we do now that we received 2,519 responses, 1,751 (70%) of which were online and 768 (30%) received through the post. On the basis that each of the eleven projects reached 1,000 learners, the response rate would have been 23%. This is likely to be an over-estimation. On the basis that each postal questionnaire reached a learner, the response rate for postal questionnaires would have been 14.5%. This is likely to be an under-estimation.
Table 4 shows that the number of responses received varied between projects, from 66 from
CWU (Communications Workers Union) supported learners to 439 from USDAW (Union of
Shop, Distributive and Allied Workers). This is partly a reflection of project size. Larger
projects, such as those delivered by Unite, Unison and USDAW tended to contribute a
higher volume of responses. It is also partly down to the effectiveness of the approach used
to contact and engage learners by each project, as well as other factors10.
8 Notably relating to data protection, as unions had not previously secured permission to forward learners’ contact
details to third parties.
9 Paper questionnaires were distributed within freepost envelopes which were returned to BMG Research, who
handled the online survey portal and scanning of postal returns.
10 The survey was conducted during December 2014 and January 2015. This is an extremely busy time for postal
and retail workers, which is likely to have depressed the response rate from these sectors. One union also
offered an i-pad as an incentive for participation.

25
As a result, random sampling was not possible and, as is the case with all postal and online
surveys, individuals participated on a self-selecting basis.
Table 4: Number of responses by union / union project
BFAWU 316 UNISON - Bridges to Learning 387
CWU 66 UNISON - Inclusive Learning 171
GMB - Southern 115 Unite 262
GMB - Yorks & N. Derbyshire 76 USDAW 439
Merseylearn 4 Other 101
PCS 237 Unsure / prefer not to say 115
RCN 104 Not provided 13
UCATT 113 Total 2519

26
PROFILE OF COURSES
The survey explored the kind(s) of learning that respondents (“union learners”) had
undertaken, how often they had taken part and when they had last participated. It also
examined their main motivation for engaging in union learning and whether their learning
had resulted in a qualification.
Type of union learning
The responses show that short courses or events to gain skills and knowledge related to
learners’ work or professional development was the most common form of learning. More
than two-fifths (42%) of respondents indicated that they had undertaken this type of learning.
A slightly lower proportion of union learners had participated in:
Training to be a Union Learning Representative (29%)
ICT/Digital/ Computing Skills (28%)
Informal learning for pleasure, leisure or personal development (26%)
Functional skills – English and Maths (23%)
Vocational course at a college or training provider that resulted in a qualification at
Level 2 or Level 3 (22%).
Other kinds of learning such as learning ESOL (5%) or Higher education and training at a
university or college (6%) were undertaken by a minority of respondents. 5% of learners
taking part in the survey participated in other forms of learning not identified above.

27
Figure 1: What kind(s) of union learning have you taken part in?
Base: 2,519. Multiple responses
People who participate in union learning frequently take part in more than one episode of
learning (see below). They combine different types of learning and may, on occasion,
undertake more than one episode of the same type of learning. This makes it impossible
directly to compare the data in Figure 1, showing the types learning undertaken by individual
respondents, with Table 2, showing the types of learning opportunities offered by ULF
projects. However, a very broad assessment of the two would suggest that people who took
part in training to become a ULR, Higher Education and Short Courses / CPD are over-
represented in the sample while ESOL and functional skills learners are under-represented.
Frequency of learning
Table 5 shows that roughly two-fifths (38%) of respondents had taken part in just one
episode of union learning. Those taking part in union learning more than once, are split
between those that have taken part between two or three episodes of union learning (31%)
and those that have taken part four times or more (31%).
While 38% of respondents had participated in a single episode of learning, 52% had
participated in a single type of learning. This means that 14% of respondents took part in
more than one episode of the same type of learning; nearly half (48%) were multiple episode
learners who had combined different types of learning, among whom 21% had combined two
types of learning, 11% three types, 6% four types and 6% five or more types.
Most respondents had taken part in union learning relatively recently with 56% taking part
within the last 6 months and three-quarters (74%) taking part within the last 12 months.
5
29
6
22
42
26
5
28
23
0 5 10 15 20 25 30 35 40 45
None of the above
Training to be a union learning representative
Higher education and training at Level 4 or above at a university or college
Vocational course at a college or training provider resulting in a qualification (either full or part) at Level 2 or 3
Short course or event to gain skills and knowledge related to your work or professional development
Informal learning for pleasure, leisure or personal development
ESOL - English as a Second or Other Language
ICT/ Digital/ Computing Skills
Functional Skills - English & Maths
Per cent

28
Table 5: Frequency of Union Learning
Times taken part in union learning …
When last took part … Once Twice Three times
Four to six
times
More than six
times All Base
Within last month 11 4 3 3 7 29 720
Between 1 and 6 months ago 10 5 3 3 6 27 679
Between 7 and 12 months ago 6 4 3 2 3 18 440
Between 13 and 24 months ago 5 3 2 2 3 14 355
Over 24 months ago 5 2 1 1 2 12 291
All 38 18 13 11 20 100 -
Base 931 458 324 274 497 - 2485
The role that union learning plays in enabling participants to experience a wide range of
opportunities and encouraging them to become “lifelong learners” was evident from
respondents’ comments.
In the 10 years I have been learning skills for life I have gained 5 qualifications. Literacy, Maths,
CLAIT, ECDL and ITQ which is not bad considering I could not spell and speak well. So I would say
thank you and you are never too old to learn. So if anybody is thinking about it “go for it”.
Bridges to learning helped me gain confidence. I never thought I would enrol onto a learning course but
after enrolling on an informal learning course I went on to do Maths, English and ICT and now have
proper qualifications thanks to (name of ULR withheld).

29
Attainment of qualifications
Over half (56%) of respondents had gained a qualification or part of a qualification as a
result of their learning. Those who were sure about the level of their qualification, were
evenly split between those gaining a qualification at a level higher than other qualifications
they already held (26%) and those gaining qualifications at the same or lower level than their
existing qualifications (25%). A further 5% gained a qualification but were unsure of its level.
Over a third of learners (37%) did not gain a qualification while 8% were unsure whether
they had achieved a qualification or not.
Figure 2: Qualifications gained as a result of union learning
Base: 2,476 [Note: recoded Q5 and Q6]
26%25%
5%
8%
37%
0%
5%
10%
15%
20%
25%
30%
35%
40%
HigherQualif ication
LowerQualif ication
Gained QualNot sure of level
Not sure if gained aqualification or not
No Qualification
30
35%
28%
23%
4%
9%
39%
35%
11%
14%
5%
21%
7%
15%
36%
29%
38%
7%
5%
7%
7%
6%
4%
16%
16%
13%
6%
7%
8%
12%
13%
29%
46%
37%
82%
68%
11%
18%
35%
0% 10% 20% 30% 40% 50% 60% 70% 80% 90% 100%
Functional Skills(140)
ESOL (57)
ICT/ Digital/Computing Skills (200)
Informal learning (184)
Short course / CPD (414)
Vocational course (124)
Higher education (17)
Training to be a ULR (142)
Higher qualification Same or lower qualification Gained qual, unsure of level
Not sure if gained qual. No qualification
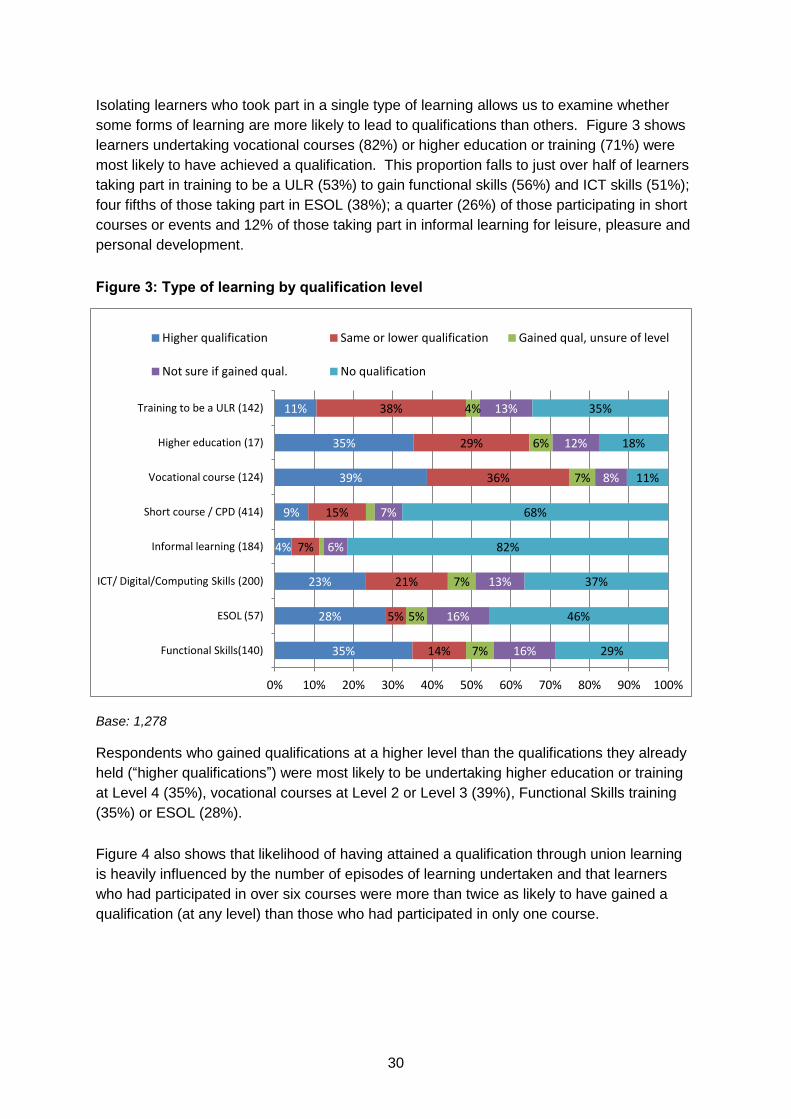
Isolating learners who took part in a single type of learning allows us to examine whether
some forms of learning are more likely to lead to qualifications than others. Figure 3 shows
learners undertaking vocational courses (82%) or higher education or training (71%) were
most likely to have achieved a qualification. This proportion falls to just over half of learners
taking part in training to be a ULR (53%) to gain functional skills (56%) and ICT skills (51%);
four fifths of those taking part in ESOL (38%); a quarter (26%) of those participating in short
courses or events and 12% of those taking part in informal learning for leisure, pleasure and
personal development.
Figure 3: Type of learning by qualification level
Base: 1,278
Respondents who gained qualifications at a higher level than the qualifications they already
held (“higher qualifications”) were most likely to be undertaking higher education or training
at Level 4 (35%), vocational courses at Level 2 or Level 3 (39%), Functional Skills training
(35%) or ESOL (28%).
Figure 4 also shows that likelihood of having attained a qualification through union learning
is heavily influenced by the number of episodes of learning undertaken and that learners
who had participated in over six courses were more than twice as likely to have gained a
qualification (at any level) than those who had participated in only one course.

31
Figure 4: Attainment of qualifications by number of episodes of learning
Base: 2,466
The comments below illustrate the value that union learners place on gaining qualifications,
the impact these qualifications can have on learners’ lives as well as the disappointment that
can be generated when things go wrong.
They have been really supportive and giving me the opportunity to get qualifications which I did not
have on being redundant - as in a piece of paper to prove those abilities - has really helped.
Union learning changed my life. I left school with no qualifications and was in a dead end job with few
prospects. Through the union I have become a professionally qualified person with a career and a
future. I attended Ruskin College and did a degree at Lancaster University. Yet at school I was the
dunce and teachers had written me off. The union has been like a supportive family always in my
corner cheering me on, celebrating my success and supporting me through the challenges. As a
humble care worker I would never have been able to afford or have the confidence to do this on my
own. Union education gave me the confidence to get out of an abusive marriage and to make a
success of my life.
My place of work [name] tried to organise a computer course but only 10 people signed up and only 3
completed the course in full due to lack of organisation and effort by [name]. This was only the first
level and the union didn't really have any info when problems arose. Myself personally passed first and
am still waiting for a certificate to acknowledge the fact I passed.
36%
54% 55%
63% 64%
80%
0%
10%
20%
30%
40%
50%
60%
70%
80%
90%
Once Twice All Three times Four to sixtimes
More than sixtimes

32
Reasons for taking part in union learning
Most learners fall into one of three groups in terms of their principal motivation to learn.
1) An employment orientated group, which is the largest of the three, accounting for
37% of learners. It encompasses:
those that aspire to perform better in their current job (25% of learners);
those that want to advance their career, gain promotion or a pay rise (12% of
learners).
2) Those motivated by a desire to support people in their community or workplace,
which accounts for 24% of learners.
3) Those motivated to gain skills that would be useful in their everyday life, which
accounts for 23% of learners.
Figure 5: What was your main motivation for taking part in union learning?
Although only a few learners cited a desire to do something fun or meet new people as their
main motivation (3%), the pleasure derived from participating in union learning was clear
from respondents’ comments. The comments also demonstrate that many learners had
more than one motivation for participating in learning.
5
8
3
24
23
12
25
0 5 10 15 20 25 30
Not provided
Other
Do something fun/meet new people
Support people in my community or workplace
Gain skills that would be useful in my everyday or home life
Advance my career, gain promotion or a pay rise
Perform better in my current job
Per cent

33
It is fun, it give us the opportunity to meet other people from different departments and backgrounds. It
enhances our skills, gain more confidence. Explore hidden skills and gain knowledge that can be applied
in everyday life.
I look forward to Tuesdays to meet friends and learn computers.
Motivation by type of learning
Table 6 examines the extent to which learners undertake particular kinds of learning in order
to achieve particular outcomes. It suggests that:
The desire to perform better in their current job or to advance their career, gain
promotion or a pay rise was the main motivation for all forms of learning apart from
informal learning, learning for leisure, pleasure or personal development and training
to become a ULR. These employment-oriented objectives were cited by three
quarters of those participating in higher education and around half those participating
in Functional skills, ICT, ESOL, Short courses and Vocational training.
The desire to gain skills useful in every-day and home life was a common motivation
for those participating in Functional skills (38%), ICT (42%) ESOL (34%) and those
involved in informal learning (26%); and
The desire to support people in their community or workplace was the dominant
motivation for those training to become a ULR (70%).
Table 6: Type of learning by main motivation for undertaking union learning
Type of learning Perform
better in my current job
Advance my career,
gain promotion or a pay
rise
Gain skills that would
be useful in my every-
day or home life
Support people in
my community
to workplace
Do something fun or meet new people
Other Base
Functional skills 33 19 38 5 2 4 134
ICT/digital/computing 34 15 42 7 1 4 200
ESOL 50 5 34 7 0 4 56
Informal learning 13 14 26 10 18 20 185
Short course 47 7 20 19 2 5 409
Vocational course at Level 2 or 3
23 26 16 17 2 16 122
Higher education at Level 4 or above
35 35 6 12 0 12 17

34
Union learning representative
14 1 6 70 0 9 140
Motivations by achievement of qualifications
The proportion of respondents gaining qualifications was highest among learners whose
prime motivation for participating in learning was to advance their career, gain promotion or
a pay rise (67%) or to support people in their community or workplace (61%). The latter is a
slightly surprising and is probably explained by high levels of participation in qualification
bearing courses for ULRs. Just over two fifths of those motivated to perform better in their
current job (42%) and those motivated to gain skills in their everyday life (45%) gained
qualifications. The group least likely to gain qualifications were those learning for fun or to
meet new people (23%).
It is notable that learners who were seeking to advance their career, gain promotion or a pay
rise were significantly more likely to gain qualifications at a higher level than learners with
other motivations.
Figure 6: Qualification gained by main motivation for undertaking union learning
Base: 2,476
13
12
24
23
42
22
16
11
37
22
25
20
12
5
13
16
10
12
59
72
26
39
23
46
0% 20% 40% 60% 80% 100%
Other (196)
Do something fun or meet new people
Support people in my community or workplace
Gain skills that would be useful to my every-day or home life
Advance my career, gain promotion or a pay rise
Perform better in my current job
Higher qualification Same or lower qualification Not sure No qualification

35
PROFILE OF LEARNERS
This section looks at the profile of union learners, comparing them to community learners
and the general adult population. The data for community learners is taken from the
“Community Learning Learner Survey” (CLLS) report (BIS 2013). The data for the general
population is from the Annual Population Survey for the period October 2013 to September
201411.
The main characteristics of union learners (
11
Accessed via NOMIS.

36
Table 7) are as follows.
The gender profile of union learners is broadly balanced, with a slight bias towards
women. This mirrors the general population but contrasts with the CLLS population
which is heavily skewed towards female learners (76%).
93% of union learners are aged between 25 to 64 years old. Younger and older
people, who are less likely to be employed, account for a smaller share of union
learners than community learners or the general population.
The ethnic profile of union learners is broadly comparable to that of general
population, with 85% describing themselves as White, compared to 88% of the
general population and 81% of the CLLS population. Looking in more detail, 77%
described themselves as ‘White British’ and 8% as ‘White Other’. This compares to
6% of the general population identifying as ‘White Other’ in Census 2011.
English was not the first language of 10% of union learners. This is a lower
proportion than the CLLS population (17%) but a higher proportion than the general
population of England (8%).
15% of union learners said that they had a disability. This is a lower than the CLLS
(23%) or the general population (18%). It is likely to be due to differences in the ages
of these populations (13% of the working age population has a disability). The fact
that union learners are likely to be in employment (and large numbers of people in
the general population with a disability are not in employment) will also account for
the difference.

37
Table 7: Demographic profile of union learners compared to community learners
and the general population
Characteristic Union learning Community learning
12
General population
13
Gender
Male 46% 24% 49%
Female 53% 76% 51%
Prefer not to say 1% - -
Age
16 to 24 4% 12% (under 29) 14%
25 to 49 53% 40% (30 to 49) 43%
50 to 64 40% 36% (50 to 69) 22%
65 or over 2% 12% (70 or over) 21%
Prefer not to say 1% - -
Ethnic Origin
White 85% 81% 88%
Ethnic minority 14% 17% 12%
Prefer not to say 2% - -
English first language
Yes 89% 83% 92%14
No 10% 17% -
Prefer not to say 1% - -
Disability
Have a disability 15% 23%15
18%16
Do not have a disability 83% 76% 81%
Prefer not to say 2% 1% -
Employment and education characteristics
Union learning survey respondents differ markedly from CLLS respondents and the
general population in terms of their economic status. 89% of union learners are
employed, either full or part-time, compared to 59% of the general population and
just 38% of CLLS respondents. Very few union learners were self-employed.
12
https://www.gov.uk/government/uploads/system/uploads/attachment_data/file/128775/13-691-community-
learning-learner-survey-march-2013.pdf.
13 Annual Population Survey, 16 and over. (Oct 2013-Sep 2014).
14 Census data on proportion of population with English as their ‘main’ language.
15 Longstanding health condition or illness.
16 Long-term health problem or disability.

38
Most union learners have permanent contracts of employment (82%). However, a
sizeable minority are agency workers or work on fixed term or temporary contracts
(16%) or are receiving income-related benefits (8%).
While union learners were slightly more likely than community learners or the general
population to hold any qualification, they were less likely to hold qualifications at
degree level or above. A sizeable minority of union learner respondents held low
level qualifications or qualifications from abroad.
Table 8: Employment and educational characteristics
Characteristic Union learning Community
learning General
population
Economic status (n=2,514)
Employed full time 71% 17% 43%2
Employed part time 17% 14% 16%2
Self-employed 1% 7% 9%
Unemployed 1% 10% 4%
Other (mainly economically inactive) 3% 53% 37%
Prefer not to say 2% - -
Contract type (n=2,372)
Fixed term or temporary contract 13% - -
Agency worker 3% - -
Permanent job 82% - -
Prefer not to say 1% - -
Income-related benefits/tax credits (n=2,490)
Yes 8% 20% -
No 86% 76% -
Not sure/ prefer not to say 6% 4% -
Highest qualification
Degree or higher 26% 37% 35%1
Lower than degree 68% 50% 56%1
No qualification 7% 9% 9%1
1 Population aged 16 to 64.
2 Includes self-employed.
Base: 2,491

39
PATTERNS OF LEARNING
This section explores the extent to which factors such as gender, age or employment status
impact on the type of learning undertaken; motivations for learning and attainment of
qualifications.
Table 9 suggests that:
Frequency of learning - Gender does not have a significant impact on the
frequency of learning.
Type of learning - Almost half of women had undertaken short courses or attended
an event17; women were more likely to have undertaken learning for pleasure,
leisure or personal development; and less likely to have undertaken most other
forms of learning. In particular, they were less likely than men to have undertaken
training in ICT or vocational courses leading to Level 2 or Level 3 qualifications.
Qualification - As a consequence of the nature of the learning undertaken, a higher
proportion of women (45%) than men (29%) participated in learning that did not lead
to a qualification. A lower proportion of women (22%) than men (30%) also gained a
qualification at a higher level than the qualifications they already held.
Motivation – The proportion of men and women who cited a desire to advance their
career, gain promotion or a pay rise or to gain skills that would be useful in every-
day life was very similar. A higher proportion of women (32%) than men (21%) cited
the desire to perform better in their current job as their primary motivation, while a
greater proportion of men (30%) than women (22%) cited the desire to support
people in their community or workplace18.
Table 9: Patterns of learning by gender
Male Female ALL
Frequency of learning
Once 37 38 37
Twice 17 20 18
Three times 11 14 13
Four to six times 11 11 11
More than six times 24 17 20
17
The high level of female participation in short courses and events may be partly a product of the gender balance of the project delivered by the Royal College of Nursing, which has a particular CPD focus. However, as this project accounts for only 4% of all responses, this cannot be the sole reason. 18
This may be partly explained by the fact that a higher proportion of male (32%) than female (26%) respondents had undertaken training to be a Union Learning Representative.

40
Base 1,128 1307 2,459
Type of learning
Functional skills – English & Maths 26 20 23
ICT/Digital/Computing skills 34 23 28
ESOL – English as a Second or Other Language 6 4 5
Informal learning 24 27 26
Short course or event 37 47 43
Vocational course at a college or training provider 26 19 22
Higher education and training at Level 4 6 6 6
Training to be a union learning representative 32 26 29
None of the above 5 5 5
Base 1,136 1,314 2,474
Qualification level of last learning
Higher qualification 30 22 25
Same or lower qualification 26 23 24
Not sure 15 11 13
No qualification 29 45 37
Base 1,122 1,296 2,441
Motivation for learning
Perform better in my current job 21 32 26
Advance my career, gain promotion or pay rise 14 12 13
Gain skills that would be useful in my every-day life 25 24 24
Support people in my community or work place 30 22 25
Do something fun or meet people 2 4 3
Other 9 7 8
Base 1,077 1,251 2,351
Age
Table 10 suggests that:
Frequency of learning – The older learners are, the greater number of episodes of
union learning they are likely to have taken part in.
Type of learning – Older people are more likely to have participated in informal
learning; ICT/Digital/Computing skills training; and training to become a Union

41
Learning Representative. Younger people are more likely to have taken part training
in ESOL, while those aged 25 to 49 are slightly more likely than older or younger
learners to have participated in functional skills training. The proportion of people
participating in vocational courses and higher education does not appear to be
significantly influenced by age.
Qualification – The proportion of 25 to 49 year olds and of 50 to 64 year olds
gaining qualifications as a result of their participation in learning is similar. The
differences occur at each end of the spectrum. The proportion of young people aged
16 to 24 gaining higher qualifications (36%) was significantly larger than that that for
older people aged 65 and over (22%). Conversely, the proportion of older learners
aged 65 and over who did not gain qualifications as a result of their learning (46%) is
higher than that found for younger learners aged 16 to 24 (30%).
Motivation – Younger people are significantly more likely to be learning in order to
advance their career, gain promotion or a pay rise and slightly more likely to be
participating in learning in order to perform better in their current job than older
people. Older learners are more likely to be participating in union learning in order to
support people in their community or workplace, while learners aged 65+ are also
significantly more likely to be participating in learning in order to do something fun
and to meet new people.
Table 10: Patterns of learning by age
16-24 25-49 50-64 65+
Prefer not to say
ALL
Frequency of learning
Once 57 41 32 25 54 37
Twice 23 19 17 21 14 18
Three times 11 14 13 11 14 13
Four to six times 3 10 13 11 9 11
More than six times 6 17 26 32 9 20
Base 88 1,314 1,003 53 35 2,493
Type of Learning
Functional skills – English & Maths 20 25 22 19 9 23
ICT/Digital/Computing skills 18 25 32 40 9 28
ESOL – English as a Second or Other Language 11 7 3 6 3 5
Informal learning 19 25 27 32 17 26
Short course or event 35 39 47 43 29 42
Vocational course at a college or training provider
19 24 21 23 9 22

42
Higher education and training at Level 4 3 6 7 6 3 6
Training to be a union learning representative 9 25 35 30 23 29
None of the above 3 4 5 11 26 5
Base 94 1,321 1,012 53 35 2,515
Qualification level of last learning
Higher qualification 36 26 26 22 9 26
Same or lower qualification 14 25 25 22 18 24
Not sure 21 14 10 10 15 13
No qualification 30 36 39 46 59 37
Base 88 1302 999 50 34 2,473
Motivation for learning
Perform better in my current job 33 27 26 12 9 26
Advance my career, gain promotion or pay rise 26 16 9 0 0 13
Gain skills that would be useful in my every-day life
21 25 24 22 20 24
Support people in my community of work place 8 20 32 43 23 25
Do something fun or meet people 4 3 3 14 17 3
Other 8 9 7 8 31 8
Base 76 1,242 976 49 35 2,378
Ethnicity
Table 11 suggests that:
Frequency of learning – Respondents who identified as Black / Black British and
White British were slightly more likely to have participated in union learning on three
or more occasions. There are significant differences in the frequency of learning
across different minority ethnic communities. 26% of respondents identifying as
being Black or Black British participated in learning more than six times, compared
to 10% of respondents identifying as being Asian or Asian British. People identifying
as Asian or Asian British were significantly more likely (56%) than average (38%) to
have only participated in one episode of union learning.
Type of learning – Respondents from minority ethnic communities were less likely
to have participated in short courses / events, vocational training and training to be a
ULR than respondents who described themselves as White British. They were more
likely to have participated in functional skills training and ESOL.
There are, again, significant differences between minority ethnic communities.
People identifying as Asian or Asian British had particularly low rates of participation

43
in ICT skills training, higher education and training to be a ULR, but higher than
average rates of participation in vocational training. Respondents identifying as
White Other were significantly more likely to participate in ESOL provision and
higher education, while those identifying as Black or Black British were more likely to
have participated in functional skills training.
Qualification – Ethnicity appears to have some impact on the likelihood of gaining a
qualification. Respondents identifying as Black or Black British and as White Other
were more likely to have gained a qualification and more likely to have gained a
qualification at a higher level than the qualifications they already held. The opposite
is true for learners identifying as Asian or Asian British.
Motivation – People from minority ethnic communities, particularly those identifying
as Asian or Asian British, more frequently stated that their motivation for participating
in union learning was to advance their career, gain promotion or a pay rise. The
desire to perform better in their current job was also more frequently cited as a White
Other and Black or Black British respondents. People identifying as White British
were more likely than others to state that their primary motivation was to support
people in their community or workplace.
Table 11: Ethnicity by type of learning
Asian or
Asian British
Black or
Black British
White British
White Other
Other Prefer not to say
ALL
Frequency of learning
Once 56 34 36 42 43 45 38
Twice 18 18 18 16 27 21 18
Three times 9 12 14 14 9 14 13
Four to six times 7 10 12 7 6 7 11
More than six times 10 26 21 21 16 13 20
Base 116 125 1,911 196 89 56 2,493
Type of Learning
Functional skills – English & Maths 25 32 21 29 28 18 23
ICT/Digital/Computing skills 16 34 29 22 25 14 28
ESOL – English as a Second or Other Language
11 7 2 25 28 5 5
Informal learning 31 28 26 21 27 23 26
Short course or event 26 35 45 30 33 30 43
Vocational course at a college or training provider
27 20 24 17 10 11 22
Higher education and training at Level 4 2 4 6 10 3 5 6
Training to be a union learning representative
17 25 31 27 13 27 29

44
None of the above 4 2 5 6 4 21 5
Base 116 125 1,911 196 89 56 2,493
Qualification level of last learning
Higher qualification 21 33 25 33 29 13 26
Same or lower qualification 21 26 26 18 15 20 25
Not sure 15 9 12 17 19 18 13
No qualification 42 32 37 32 37 50 37
Base 117 121 1,899 190 89 56 2,472
Motivation for learning
Perform better in my current job 21 28 26 32 29 11 26
Advance my career, gain promotion or pay rise
23 16 12 13 15 2 13
Gain skills that would be useful in my every-day life
25 31 24 20 29 22 24
Support people in my community or work place
16 19 27 25 12 28 25
Do something fun or meet people 2 3 3 2 7 9 3
Other 14 4 8 8 7 28 8
Base 110 111 1,835 186 82 54 2,378
First language
Unsurprisingly, many of data patterns found in the ethnicity-related analysis (above) are also
found in the data for participation by first language. Table 12 shows that:
Frequency of learning – Nearly half (47%) of respondents with English as a first
language had taken part in three or more union learn courses, compared to a
quarter (26%) of those who did not have English as a first language.
Type of learning – Respondents who did not have English as a first language were
more likely to have participated in ESOL (31% v 2%) and functional skills (31% v
22%) training and less likely to have participated in all other forms of learning.
Qualification – A higher proportion of respondents who did not have English as a
first language (42%) took part in learning that did not lead to a qualification than
learners with English as a first language (37%). This may be a function of the
frequency of learning, in that the more courses that are attended the greater the
likelihood is that at least one of these will be accredited.
Motivation – Respondents who did not have English as a first language were more
likely to be motivated to learn by a desire to perform better in their current job, to
advance their careers, gain promotion or a pay rise, or to gain skills that would be
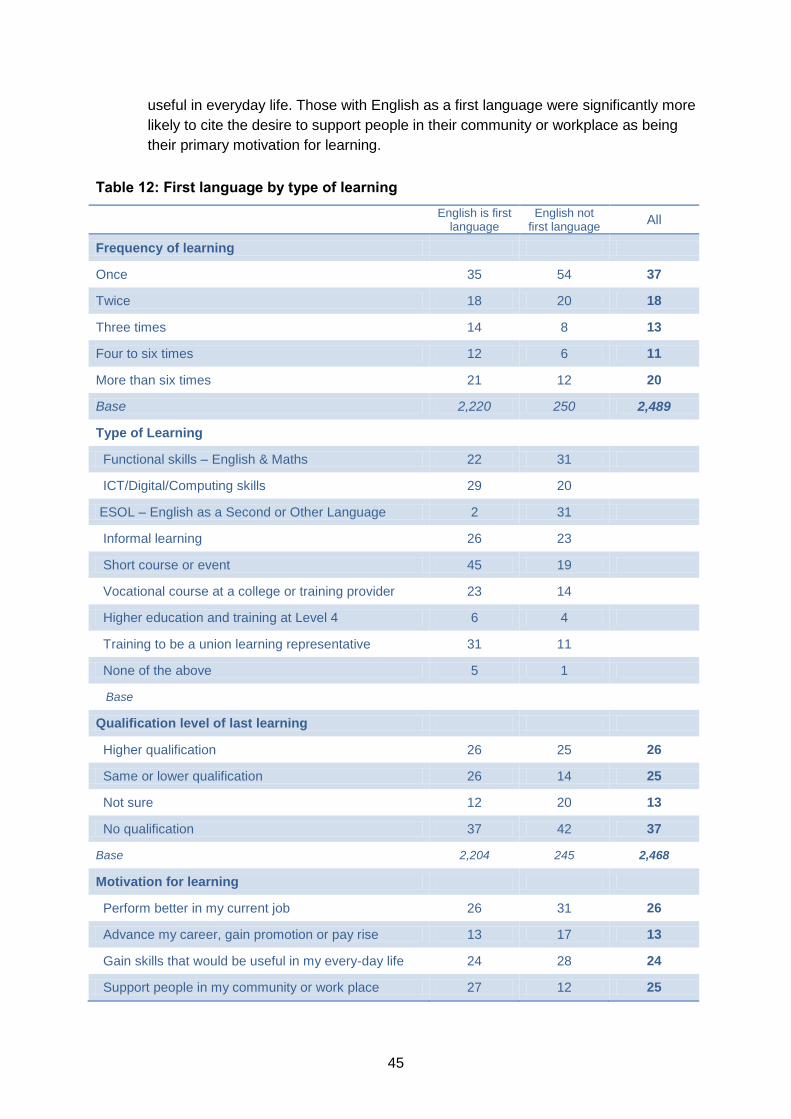
45
useful in everyday life. Those with English as a first language were significantly more
likely to cite the desire to support people in their community or workplace as being
their primary motivation for learning.
Table 12: First language by type of learning
English is first
language English not
first language All
Frequency of learning
Once 35 54 37
Twice 18 20 18
Three times 14 8 13
Four to six times 12 6 11
More than six times 21 12 20
Base 2,220 250 2,489
Type of Learning
Functional skills – English & Maths 22 31
ICT/Digital/Computing skills 29 20
ESOL – English as a Second or Other Language 2 31
Informal learning 26 23
Short course or event 45 19
Vocational course at a college or training provider 23 14
Higher education and training at Level 4 6 4
Training to be a union learning representative 31 11
None of the above 5 1
Base
Qualification level of last learning
Higher qualification 26 25 26
Same or lower qualification 26 14 25
Not sure 12 20 13
No qualification 37 42 37
Base 2,204 245 2,468
Motivation for learning
Perform better in my current job 26 31 26
Advance my career, gain promotion or pay rise 13 17 13
Gain skills that would be useful in my every-day life 24 28 24
Support people in my community or work place 27 12 25
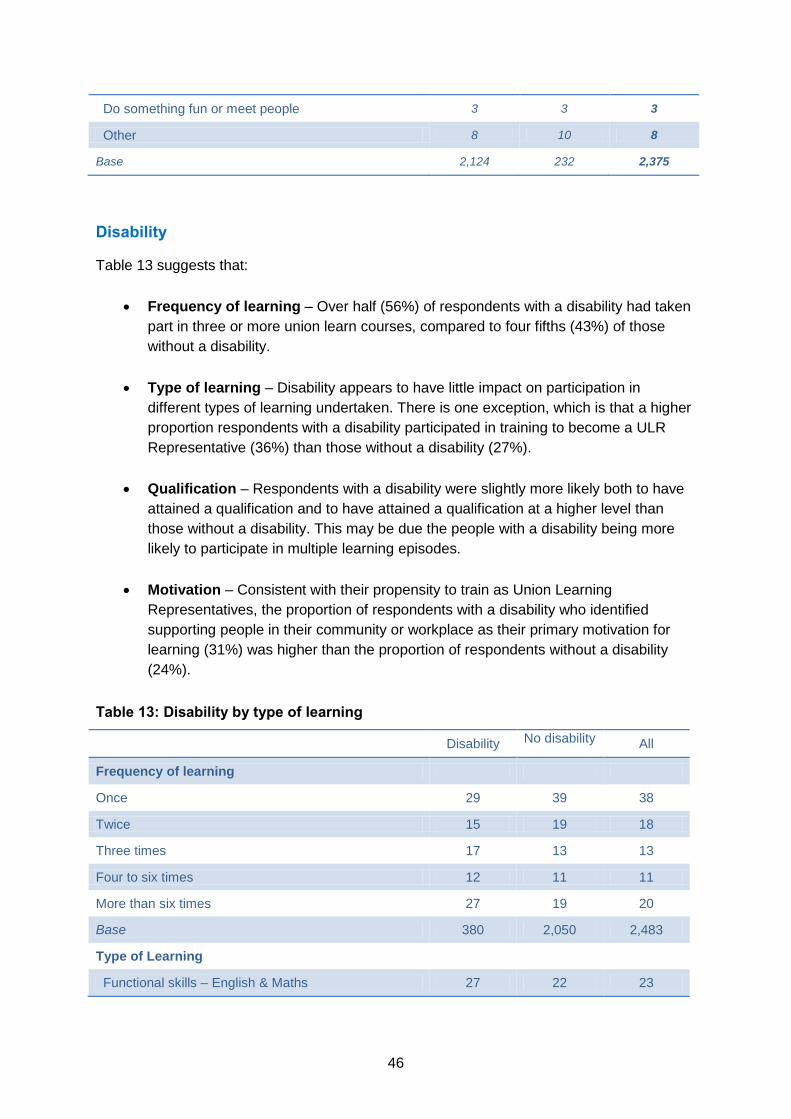
46
Do something fun or meet people 3 3 3
Other 8 10 8
Base 2,124 232 2,375
Disability
Table 13 suggests that:
Frequency of learning – Over half (56%) of respondents with a disability had taken
part in three or more union learn courses, compared to four fifths (43%) of those
without a disability.
Type of learning – Disability appears to have little impact on participation in
different types of learning undertaken. There is one exception, which is that a higher
proportion respondents with a disability participated in training to become a ULR
Representative (36%) than those without a disability (27%).
Qualification – Respondents with a disability were slightly more likely both to have
attained a qualification and to have attained a qualification at a higher level than
those without a disability. This may be due the people with a disability being more
likely to participate in multiple learning episodes.
Motivation – Consistent with their propensity to train as Union Learning
Representatives, the proportion of respondents with a disability who identified
supporting people in their community or workplace as their primary motivation for
learning (31%) was higher than the proportion of respondents without a disability
(24%).
Table 13: Disability by type of learning
Disability No disability All
Frequency of learning
Once 29 39 38
Twice 15 19 18
Three times 17 13 13
Four to six times 12 11 11
More than six times 27 19 20
Base 380 2,050 2,483
Type of Learning
Functional skills – English & Maths 27 22 23

47
ICT/Digital/Computing skills 28 28 28
ESOL – English as a Second or Other Language 7 5 5
Informal learning 28 25 26
Short course or event 41 43 42
Vocational course at a college or training provider 22 22 22
Higher education and training at Level 4 9 6 6
Training to be a union learning representative 36 27 29
None of the above 5 5 5
Base 386 2066 2,505
Qualification level of last learning
Higher qualification 29 25 26
Same or lower qualification 24 25 25
Not sure 16 12 13
No qualification 31 38 37
Base 377 2,034 2,463
Motivation for learning
Perform better in my current job 25 27 26
Advance my career, gain promotion or pay rise 9 14 13
Gain skills that would be useful in my every-day life 23 25 24
Support people in my community or work place 31 24 25
Do something fun or meet people 3 3 3
Other 10 8 8
Base 355 1,960 2,368

48
Economic status
The vast majority of union learners are employed, either full-time or part-time. The limited
volume of data on other economically active respondents19 and economically inactive
respondents20 makes it difficult to draw conclusions for these groups. Nonetheless, Table 14
suggests that:
Frequency of learning - Nearly half (47%) of full-time employees had taken part in
three or more union learn courses, compared to one third (35%) of part-time
employees.
Type of learning – Consistent with their higher frequency of learning, full-time
employees were more likely than part-time employees to have participated in most
types of learning, notably functional skills, ICT, Vocational Courses, Higher
education and training to be a Union Learning Representative. Part-time employees
showed high levels of participation in short courses and events. Economically
inactive respondents (likely to be people who have retired or who may have a long-
term health condition that keeps them out of the labour market) had a higher than
average propensity to participate in ICT training and informal learning.
Qualification – The proportion of part-time employees (43%), other economically
active (45%) and economically inactive (54%) learners who did not gain a
qualification as a result of union learning was significantly higher than the proportion
of full-time employees (34%). Full-time employees were also more likely to gain
qualifications at a higher level than the qualifications they already held.
Motivation – The differences in motivations for learning between full-time and part-
time employees were not great. Economically inactive respondents were much more
likely to participate in learning in order to support people in their community or
workplace or to do something fun or meet new people.
Data from the Annual Population Survey suggests that around 24% of part-time employees
have undertaken job-related training in the last 13 weeks, compared to 27% of full-time
employees. The analysis above suggests that, alongside this lower than average propensity
to participate in learning, part-time employees who participate in union learning may learn
less frequently and participate in shorter courses which are less frequently accredited. Union
learners who were self-employed, unemployed or economically inactive were also less likely
to acquire qualifications.
Table 14: Economic status by type of learning
Employed Full time
Employed part time
Other economically active
Economically
inactive
ALL
Frequency of learning
19
Includes those who are self-employed and those who are not employed and looking for work. 20
Includes those who are retired and those who are not employed and not looking for work.

49
Once 35 46 32 29 37
Twice 18 19 19 18 18
Three times 14 11 12 16 13
Four to six times 12 8 12 8 11
More than six times 21 16 25 29 20
Base 1897 428 57 49 2492
Type of Learning
Functional skills – English & Maths 25 17 5 12 23
ICT/Digital/Computing skills 30 19 19 47 28
ESOL – English as a Second or Other Language
5 4 7 6 5
Informal learning 26 25 17 39 26
Short course or event 41 46 48 43 42
Vocational course at a college or training provider
23 18 35 18 22
Higher education and training at Level 4 7 4 2 6 6
Training to be a union learning representative
31 21 21 35 29
None of the above 5 5 2 10 5
Base 1,912 434 58 49 2,514
Qualification level of last learning
Higher qualification 27 21 20 19 26
Same or lower qualification 25 24 34 19 25
Not sure 14 12 2 8 13
No qualification 34 43 45 54 37
Base 1,883 423 56 48 2,471
Motivation for learning
Perform better in my current job 27 31 21 10 26
Advance my career, gain promotion or pay rise
13 12 18 0 13
Gain skills that would be useful in my every-day life
24 25 19 17 24
Support people in my community or work place
26 21 23 48 25
Do something fun or meet people 2 4 7 13 3
Other 8 7 12 13 30
Base 1,810 402 57 48 2,378

50
Type of employment contract
Table 15 suggests that:
Frequency of learning – Respondents in permanent jobs were more likely to have
engaged in multiple episodes of union learning than respondents on fixed-term or
temporary contacts or those employed through an agency.
Type of learning – There was not a great deal of difference in the types of learning
undertaken between respondents in permanent jobs and those on fixed or temporary
contracts, although respondents on fixed and temporary contracts were more likely
to have participated in higher education and training to Level 4. Respondents
employed through an agency were less likely to have participated in all forms of
training apart from Functional skills and ESOL. Almost a quarter (23%) of agency
workers had participated in ESOL, compared to just 4% of respondents who were in
a permanent job.
Qualification – Interestingly, a lower proportion of respondents on fixed-term or
temporary contracts did not gain a qualification than those with other types of
employment contract, and a greater proportion gained qualifications at a higher level
than those they already held. It is not clear why this should be the case.
Motivation – The proportion of respondents who were employed through an agency
whose primary motivation for learning was either to perform better in their current job
(38%) or to advance their career, gain promotion or a pay rise (22%) was higher
than the averages for all respondents (27% and 13%, respectively).
Although the data suggest that those in permanent employment were more likely to have
taken part in union learning, there is evidence that union learning has been highly effective
in addressing the skills needs of workers on fixed-term or temporary contacts and those
employed through an agency. More often motivated by the desire to perform better in their
job or to advance their career or gain a pay rise, this group was more likely to have
participated in multiple episodes of learning, to have participated in ESOL and to have
gained qualifications at a higher level than those they already held.
Table 15: Type of employment contract by type of learning
Fixed term or
temporary contract
Employed through an
Agency
In permanent job
All
Frequency of learning
Once 43 48 36 36
Twice 18 22 18 18
Three times 10 11 14 13

51
Four to six times 9 5 12 11
More than six times 21 14 21 20
Base 313 64 1,926 2,351
Type of Learning
Functional skills – English & Maths 26 33 23 24
ICT/Digital/Computing skills 28 22 28 28
ESOL – English as a Second or Other Language
10 23 4 5
Informal learning 27 22 26 26
Short course or event 45 23 43 42
Vocational course at a college or training provider
28 16 21 22
Higher education and training at Level 4 11 6 6 6
Training to be a union learning representative
29 9 30 29
None of the above 3 3 5 5
Base 318 64 1,941 2,372
Qualification level of last learning
Higher qualification 40 29 24 26
Same or lower qualification 22 8 26 25
Not sure 10 23 13 13
No qualification 28 40 37 36
Base 308 62 1,916 2,331
Motivation for learning
Perform better in my current job 29 38 27 27
Advance my career, gain promotion or pay rise
14 22 13 13
Gain skills that would be useful in my every-day life
27 15 24 24
Support people in my community or work place
22 13 26 25
Do something fun or meet people 2 2 3 3
Other 5 10 8 8
Base 283 60 1,858 2,238

52
Receipt of income-related state benefits or tax credits
The limited number of responses from learners who were in receipt of income-related
benefits or tax credits makes analysis for this variable difficult. Nonetheless, Table 16
suggests that:
Frequency of learning – A greater proportion of respondents who were in receipt of
benefits (and those who prefer not to say) had only engaged in one episode of
learning.
Type of learning – Respondents who were in receipt of benefits were more likely to
have undertaken learning in functional skills, ICT and ESOL and less likely to have
undertaken training to become a Union Learning Representative.
Qualification – There was little difference in the likelihood of achieving a
qualification or a higher qualification between those receiving and not receiving state
benefits.
Motivation – Those in receipt of state benefits were slightly more likely to cite a
desire to advance their career, gain promotion or a pay rise and slightly less likely to
cite supporting people in their community or workplace as their main motivation.
Table 16: Receipt of income-related state benefits or tax credits by type of learning
Receiving benefits
Not receiving benefits
Not sure/ prefer not
to say All
Frequency of learning
Once 43 35 66 37
Twice 18 19 16 19
Three times 18 13 8 13
Four to six times 9 12 5 11
More than six times 12 22 6 20
Base 197 2,132 142 2,471
Type of Learning
Functional skills – English & Maths 28 22 20 23
ICT/Digital/Computing skills 33 28 19 28
ESOL – English as a Second or Other Language 9 5 7 5
Informal learning 22 25 41 26
Short course or event 36 44 20 42
Vocational course at a college or training provider 22 23 12 22
Higher education and training at Level 4 5 6 2 6

53
Training to be a union learning representative 19 31 8 29
None of the above 4 5 4 5
Base 197 2,150 143 2,490
Qualification level of last learning
Higher qualification 28 26 16 26
Same or lower qualification 23 26 11 24
Not sure 16 12 13 13
No qualification 33 36 60 37
Base 193 2,116 142 2,451
Motivation for learning
Perform better in my current job 26 27 24 26
Advance my career, gain promotion or pay rise 17 12 20 13
Gain skills that would be useful in my every-day life 24 24 23 24
Support people in my community or work place 20 27 7 25
Do something fun or meet people 5 3 6 3
Other 8 8 21 8
Base 186 2,034 140 2,360
Highest qualification
As might be expected, the highest level of qualification held by respondents has a significant
impact on both the nature of their learning and their motivation for learning.
Table 17 suggests that:
Frequency of learning – Respondents with higher level qualifications were more
likely to have engaged in multiple episodes of learning. For example, 72% of
respondents with no qualifications and 53% of respondents with Entry or Level 1
qualifications had only taken part in one union learning course, compared to 26% of
respondents with a Level 4 and 29% of respondents with a Level 5 qualification. This
finding is open to interpretation. On the one hand, it could be taken to imply that
union learning, like other forms of learning, tends to be taken up by individuals who
are already enthusiastic learners. On the other hand, it could be interpreted as a
success, in that multiple episode learners may have attained higher level
qualifications as a result of their union learning.
Type of learning – Unsurprisingly, respondents with low level qualifications were
more likely to participate in learning focused on the acquisition of functional skills
and ESOL; and were less likely to have participated in vocational courses at a
college or training provider. Respondents with higher levels of qualifications were

54
more likely to have participated in higher education, short courses and events and
training to become a ULR. The proportion of respondents who had participated in
ICT and informal learning was similar across all qualification groups.
Qualification – The proportion of respondents who did not gain a qualification as
result of union learning was higher among learners with either very low or very high
levels of qualification. Respondents with no qualifications are, by definition, unlikely
to have gained a qualification through union learning, while those with Level 5 are
more likely to have taken part in short courses and may be discounting elements of
qualifications gained through union learning.
Motivation – The proportion of learners stating that their primary motivation was to
perform better in their current job or to advance their career, gain promotion or a pay
rise is not clearly affected by the level of learners’ qualifications. A higher proportion
of learners with low levels of qualifications are motivated by desire to gain skills that
would be useful in their everyday life, while those with higher levels of qualifications
are more often motivated by the desire to support people in their community or work
place.
Table 17: Highest qualification by type of learning
None Other
Entry &
Level 1
Level 2
Level 3
Level 4
Level 5
ALL
Frequency of learning
Once 72 26 53 36 34 26 29 37
Twice 17 22 20 21 17 13 16 18
Three times 5 12 12 16 13 15 13 13
Four to six times 2 12 6 11 13 16 12 11
More than six times 5 19 9 17 23 30 30 20
Base 170 435 203 540 492 220 410 2,470
Type of Learning
Functional skills – English & Maths 14 9 53 33 23 23 11 23
ICT/Digital/Computing skills 25 20 28 37 28 32 22 28
ESOL – English as a Second or Other Language
13 7 16 3 3 2 2 5
Informal learning 32 22 20 24 25 30 32 26
Short course or event 14 48 18 37 47 54 55 42
Vocational course at a college or training provider
5 15 12 26 32 32 20 22
Higher education and training at Level 4 0 5 0 1 3 19 15 6
Training to be a union learning representative
8 27 12 28 29 43 40 29

55
None of the above 8 8 2 2 5 6 5 5
Base 170 436 207 551 494 222 411 2,491
Qualifications gained
Higher qualification 14 9 43 39 31 33 12 26
Same or lower qualification 3 24 10 19 30 33 37 25
Not sure 14 15 17 17 11 7 5 13
No qualification 69 52 30 25 28 27 46 37
Base 168 435 195 540 490 217 408 2,453
Motivation for learning
Perform better in my current job 19 29 34 24 24 28 28 26
Advance my career, gain promotion or pay rise
16 9 14 13 15 16 11 13
Gain skills that would be useful in my every-day life
32 20 27 30 23 22 18 24
Support people in my community or work place
8 29 12 25 28 27 31 25
Do something fun or meet people 6 4 4 3 3 2 3 3
Other 19 10 8 6 7 5 9 8
Base 165 428 186 496 474 213 402 2,364
Learner characteristics by learning type.
Table 18 and
Table 19 provide a profile of the demographic, employment and educational characteristics
of respondents undertaking different types of learning. The analysis focuses on learners
undertaking a single type of learning. Isolating, ‘sole type’ learners in this way, accentuates
the differences between the groups. A number of interesting findings emerge from the data,
although in general there are few surprises.
Functional skills learners are more likely to be male (60%), from minority ethnic
groups and with a first language other than English. They are likely to be employed
full-time and to have low levels of existing qualifications.
ESOL learners tend to be younger. The vast majority have a first language other than
English, describe their ethnic origin as non-White British and have low levels of
qualifications or qualifications from abroad.
ICT learners tend to be older, are more likely to be male (58%) and slightly more
likely to describe themselves as White British.
Learners taking part in short courses and events are predominantly female (75%).
They are older than average, more likely to identify themselves as being ‘White

56
British’, to have English as a first language, to be employed part-time and are
generally highly qualified.
Learners taking part in accredited vocational courses at college or training providers
are slightly younger than average, are less likely to be employed full-time and are
more likely to hold intermediate level (Level 2 or Level 3) qualifications, potentially
gained as a result of union learning.
Learners taking part in higher education are more likely to be female (65%). They
tend to be younger and are more likely to be employed part-time. A large proportion
(65%) hold qualifications at Level 4 or Level 5, though it is not clear if these were
gained prior to or as a result of union learning. People who identify as ‘White Other’
are particularly likely to participate in higher education.
Learners training to be a union learning representative tend to be older, more likely to
describe themselves as White British, to have higher level qualifications and to be
employed full-time.
Table 18: Learner characteristics by type of learning undertaken
Functio
na
l
ICT
ES
OL
Info
rmal
Learn
ing
Short
cours
e
Vocation
al
cours
e
Hig
her
education
Unio
n
learn
ing
rep.
All
Gender
Male 60 58 53 42 25 53 35 54 44
Female 40 42 47 56 75 46 65 45 56
Prefer not to say 1 0 0 2 1 2 0 1 1
Age
16 to 24 5 4 8 4 4 8 6 1 4
25 to 49 66 49 82 55 51 62 71 55 56
50 to 64 28 45 10 37 42 27 24 40 37
65 and over 1 1 0 1 1 2 0 1 1
Prefer not to say 1 2 0 3 1 2 0 3 2
Ethnic group
Asian or Asian British 8 3 10 13 3 11 0 4 6
Black or Black British 9 8 6 6 2 2 0 4 5
White British 57 83 10 69 87 78 71 84 76
White Other 18 3 52 4 3 6 24 3 8
Other 5 3 22 5 3 2 0 2 4
Prefer not to say 3 1 0 3 2 1 6 4 2

57
English first language
Yes 72 92 27 81 96 89 77 94 86
No 28 8 73 18 3 10 18 4 13
Prefer not to say 0 <1 0 1 1 2 6 1 1
Disability
Yes 15 13 23 10 11 14 18 14 13
No 83 85 77 88 88 83 82 83 85
Prefer not to say 2 2 0 2 2 3 0 3 2
Base 145 202 63 186 416 125 17 142 1,325
Table 19: Employment & educational characteristics by type of learning
Functio
na
l
ICT
ES
OL
Info
rmal
Learn
ing
Short
cours
e
Vocation
al
cours
e
Hig
her
education
Unio
n
learn
ing
rep.
All
Economic status
Employed full time 85 80 76 66 66 62 65 81 72
Employed part time 12 13 14 23 26 24 35 16 20
Other economically active 0 4 5 2 3 8 0 1 3
Economically inactive 0 2 2 2 1 0 0 2 1
Prefer not to say 4 1 3 9 3 6 0 1 4
Highest qualification
None 10 16 26 23 3 2 0 5 10
Other/overseas 7 16 31 16 26 11 29 26 20
Entry & Level 1 40 9 30 7 2 7 0 4 10
Level 2 27 29 3 21 15 31 0 18 21
Level 3 8 17 7 17 22 29 6 17 18
Level 4 2 6 2 4 9 7 24 6 7
Level 5 5 9 2 13 22 13 41 24 15
Base 145 202 63 183 416 125 17 142 1,325
Some of the complexity and nature of the relationships that exist between the learners’
demographic characteristics and their learning choices, motivations and aspirations can be
seen from the comments below, from older learners, female learners and learners whose
first language is not English.

58
Older Learners
I'm 61 and all I wanted was to know how to use a computer. I can and have booked holidays, shop
safely on line, email friends, family and anyone else I have to. I know how to protect my credit card
details when shopping... I now get to see where I'm staying before I go and sometimes even take a
peek of the area through google maps. I have to say thank to the learning people. I had a lap top and
couldn’t even switch it on. I can contact them and they help me whenever I want to learn something
new. I am currently filing all my old photos on an external hard drive that I bought in the sales.
I will be 65 in March 2015 and am currently doing a level 3 Award in Education and Training with our
local college so that I can help those who are entering the Trainee Programme to understand and apply
basic numeracy. It's not just about me but more about what I can pass on.
Female / Male Learners
Gave me confidence returning to work after having children. Enabled me to network & gain experience.
I completed the Womens’ Lives course in 2009 and it empowered, motivated me to continue to learn in
various short and longer courses. Education has given me the opportunity to see that anything is
possible if you believe and commit and practise. Education is the pathway that will give people
knowledge, power, wisdom and choice and control over their lives.
I am very happy that somebody can give me chance to learn at workplace. I am a full time employee
and father of two. I would not effort to pay my own money to do some courses as I am limited by the
moneys (cannot effort expensive courses) and time (family life and job), but Usdaw is making big
chance to change it. I am looking forward to get some courses to improve myself and in the same time
improve family live as I am absolutely aware that knowledge and qualifications I will get are extremely
important! So people like me who are willing to learn to achieve something in life and be much more
satisfied this enormously fantastic and just to want to say BIG THANK YOU for it !!! Kind regards
Learners with ESOL
It give me a chance to learn of language, change jobs - a fair contract and consequently, on the
resignation of benefits, and protection from exploitation and dishonesty. I have this hope.
I heard of union funding to contribute financially to my learning in higher education in the language
school at Cardiff University (evening classes) through a Unite union rep… Recently I received my
Diploma of Higher Education of which I am very proud. Without that support I would have found it
difficult to pursue. Thanks to the Wulf (Wales Union Learning Fund project) I have continued with my
studies and I am determined to continue with my education and I will strive to do so. My studies have
become an important factor in my life with which I share with my wife children, friends, family and work
colleagues alike. I am aware as an example it has inspired my work colleagues to take up college
courses. I cannot thank the Wulf project and Unite union enough for their help.

59
SKILLS GAINED & THEIR USE
This section looks at the skills gained by union learners and the uses to which these skills
are put.
Skills development
Overall, 92% of respondents identified at least one skill that had improved as a result of their
involvement in union learning. The skills most commonly gained were: self-
confidence/sense of what I can achieve (mentioned by 49% of respondents);
vocational/practical/professional development (37%); and planning and organising skills
(32%).
Figure 7: Union learning has helped me to develop the following skills…
Base:2,492
Learners who gained a full or part qualification were more likely to report that they had
developed skills than those who had not gained a qualification. This was particularly the
case for learners who gained qualifications at a higher level than those they already held.
These learners identified gaining an average of 3.9 different skills as a result of their
participation in union learning, compared to 2.9 skills for those gaining qualifications at the
same or at a lower level, 2.5 skills for those who were “not sure” if they had gained a
qualification and 1.7 skills for those who had not gained a qualification.
8
22
13
37
27
5
32
26
49
10
18
24
0 10 20 30 40 50 60
None of the above
Other skills
Creative skills
Vocational/ Practical skills/ Professional development
ICT/Digital/Computing Skills
Budget/Money management skills
Planning and organising skills
Coaching/mentoring skills
Self-confidence/ a sense of what I can achieve
English language skills/ESOL
Numeracy/Maths skills
Literacy/Reading or writing skills
Per cent

60
Figure 8 shows the types of skills gained by respondents who gained qualifications at a
higher level, the same level or a lower level than the qualifications they already held. It
shows a complex relationship. The over-riding message, however, is that skills - such as
ESOL, ICT, Literacy, Numeracy and Budgeting & Money Management skills21 - which are
often the focus of specific programme training, are much more likely to be acquired by
learners who gained a higher level of qualification than those who do not gain qualifications.
This is not to say that those who do not gain qualifications are not gaining skills. They are
just as likely as those gaining higher qualifications to gain “other skills” and not much less
likely than others to gain vocational/practical/professional skills. This is likely to be due to
large numbers of participants seeing value in unaccredited short courses and events.
Figure 8: Skills gained by qualifications acquired (% of learners)
21
Often a focus of numeracy skills training.
0
10
20
30
40
50
60
70
Higher
Same or lower
Not sure
None

61
Learners who completed courses were significantly more likely to have attained a range of
skills than learners who left their programme of learning before it ended. On average, they
identified having developed 1.9 skills each, compared to 1.2 for early leavers22.
Table 20 suggests that course completion was particularly important for developing self-
confidence, vocational and practical and professional skills. Interestingly, the proportion of
learners who felt they had acquired literacy / reading or writing skills; numeracy / maths,
ESOL and ICT skills was not greatly affected by course completion, although it may be
reasonable to assume that those who completed courses may have gained these skills in
greater depth.
Table 20: Skills developed by course completion
Yes, completed the course
No, I left before it ended
Not applicable,
the programme
lasted for one day or less
All
Literacy/ Reading or writing skills 20 18 8 17
Numeracy/Maths skills 11 11 2 9
English language skills/ESOL 10 7 5 9
Self-confidence 38 16 24 34
Coaching/mentoring skills 14 4 3 11
Planning and organising skills 18 11 6 15
Budgeting/Money management skills 3 6 1 2
ICT/Digital/Computing skills 23 18 13 20
Vocational/Practical skills/Professional 23 7 28 23
Creative Skills 8 6 8 7
Other skills 18 16 15 17
None of the above 10 36 30 16
Base 657 55 205 917
Unsurprisingly, the type of skills developed was closely linked to the type of learning
undertaken. For example, respondents undertaking functional skills training either solely or
in combination with other learning were more likely than others to report that they had
developed their literacy/reading or writing skills.
Table 21 shows that certain skills, such as self-confidence, were acquired by a significant
proportion of learners participating in all forms of learning. Vocational, practical or
22
This data is for learners who took part in a single type of learning and is not comparable to the data cited on the previous page.

62
professional skills were most commonly developed by participants in higher education (59%
of whom developed these skills), short courses (51%) and vocational courses (42%).
Table 21: Skills developed by type of learning
Functio
na
l
ICT
ES
OL
Info
rmal
Learn
ing
Short
co
urs
e
Vocation
al
cours
e
Hig
her
education
Unio
n
learn
ing r
ep.
All
Literacy/ Reading or writing skills 68 8 41 6 5 14 12 5 15
Numeracy/Maths skills 48 4 5 2 2 11 0 4 8
English language skills/ESOL 22 2 78 3 2 7 0 1 8
Self-confidence 35 28 24 36 35 54 41 47 36
Coaching/mentoring skills 10 7 3 5 14 23 18 30 13
Planning and organising skills 13 11 3 11 20 33 18 41 19
Budgeting/Money management skills 3 2 2 2 1 5 6 1 2
ICT/Digital/Computing skills 3 88 3 3 5 10 6 4 17
Vocational/Practical skills/Professional 8 6 5 23 51 42 59 20 28
Creative Skills 6 7 2 16 6 7 6 8 7
Other skills 8 7 5 29 22 22 12 24 19
None of the above 3 6 5 20 10 9 12 18 13
Base 145 202 63 186 416 125 17 142 1422
As we would expect, those types of learning that are focused on the acquisition of a specific
skillset tend to produce concentrated skills outcomes. For example, of learners who only
took part in ICT training 88% reported an improvement in their ICT/Digital/Computing skills,
28% a rise in self-confidence, but fewer than 10% reported the development of any other
skill23.
By contrast, participation in vocational courses leading to qualifications at level 2 or 3 is
associated with the acquisition of a wide variety of skills, probably as a result of their having
a greater breadth of focus.
Such differences in course specificity means that it is wrong to consider the volume of
different skills acquired by learners participating in different types of learning as on outcome
measure on its own. However, if there are types of learning that do not lead to the
development of a particular skillset; which are less frequently identified as resulting in the
acquisition of a variety of skills; and which are more often identified as leading to the
23
It is notable that the skills developed by participants of Functional Skills, ICT and ESOL training are rarely regarded by learners as being vocational/practical/professional.

63
acquisition of none of the skills listed in Table 2124, questions may be raised about their
impact relative to other forms of training.
Table 22 shows, for each type of training:
Whether the frequency with which respondents identify that they have developed any
skill from their participation is higher or lower than the average (+/-10%) (frequency);
Whether the two skills most frequently developed account for a higher or lower
proportion of the all skills outcomes across all forms of training (+/-10%) (specificity);
Whether the proportion of respondents who had developed none of the skills listed
above is higher or lower than the average (+/-30%) for all forms of training.
On the basis of this analysis, Informal Learning would be flagged as being less clearly
associated with skills acquisition than other forms of learning.
Table 22: Skills developed by type of learning, combined assessment
Frequency Specificity None
Functional High Ave Low
ICT Ave High Low
ESOL Ave High Low
Informal Learning Low Low High
Short course Ave Ave Ave
Vocational course High Low Ave
Higher education Ave Ave Ave
Union learning rep. Ave Low High
This analysis is, however, somewhat simplistic. It is also based on responses by learners
who had only participated in a single type of learning, while union learners frequently engage
in multiple episodes of different types of learning.
Table 23 compares the skills gained by those who took part in a single learning episode to
the skills gained by all respondents. It shows that learners who participate in multiple
episodes of learning acquire a much greater range of skills than single episode learners. For
example, while 15% of respondents who had participated in a single learning episode had
developed their Literacy skills, 24% of all learners had improved these skills. This is likely to
be due to learners combining different forms of learning.
Again, the data would appear to support an emphasis on fostering cultures of learning and to
justify supporting multiple episodes of learning.
Table 23: Skills developed, single learning episodes v all learners
24
The list includes an “Other” skills category.

64
Sin
gle
learn
ing
ep
iso
des
All le
arn
ers
Literacy/ Reading or writing skills 15 24
Numeracy/Maths skills 8 18
English language skills/ESOL 8 10
Self-confidence 36 49
Coaching/mentoring skills 13 26
Planning and organising skills 19 32
Budgeting/Money management skills 2 5
ICT/Digital/Computing skills 17 27
Vocational/Practical skills/Professional 28 37
Creative Skills 7 13
Other skills 19 22
None of the above 13 8
The application of skills to learners’ current jobs
Nearly three quarters of respondents (74%) felt that union learning had given them new skills
that they might use in their current job.
Figure 9 shows that, when matched against reason for undertaking learning, learners who
had taken part in learning: to perform better in their current job (80%); to advance their
career, gain promotion or a pay rise (77%); and, interestingly, to support people in their
community or workplace (82%) were particularly likely to report that they had developed new
skills they might use in their current job.

65
Figure 9: Motivation for training by has union learning given you any new skills that
you might use in your current job?
Base: 2375
Skills for new job or change into a different type of work
Almost two fifths of respondents (59%) felt that union learning had given them new skills that
they might use to get a job or to change into a different type of work.
Unsurprisingly, respondents who had taken part in union learning to advance their career or
to gain promotion or a pay rise were most likely to report that they had gained new skills that
they might use to get a new job or to change into a different type of work. However, it is
notable that almost 60% of learners who whose main motivation for taking part in learning
was to perform better in their current job, to gain skills useful in their every-day and home life
or to support people in their workplace or community, also stated that they had acquired
skills that they might use to gain an new job or change into a different type of work.
73
39
33
82
73
77
80
17
40
44
13
17
12
12
10
21
23
6
10
11
9
0% 20% 40% 60% 80% 100%
All
Other
Do something fun or meet new people
Support people in my community or workplace
Gain skills that would be useful to my every-day or home life
Advance my career, gain promotion or a pay rise
Perform better in my current job
Yes No Not sure

66
Figure 10: Acquisition of new skills to get a job or to change into a different type of
work by motivation for learning
Base: 2,371
Table 24 shows that although one episode of learning provides large number of respondents
with skills that they might use in their current job and / or to get a new job or to change into a
different career, the proportion of learners who report these outcome increases steadily with
the number of learning episodes they have engaged in. This, again, points to the value of
supporting multiple learning episodes.
Table 24: Use of skills by frequency of learning (%)
Union learning given new
skills you might use in your current job
Union learning given new skills you might use to get a new job or to change into a
different career
Base
Once 61 48 930
Twice 76 60 457
Three times 81 60 325
Four to six times 80 65 275
More than six times 89 79 496
All 74 60 2,483
59
39
33
62
58
75
58
25
37
45
25
25
10
26
17
25
22
14
17
15
16
0% 20% 40% 60% 80% 100%
All
Other
Do something fun or meet new people
Support people in my community or workplace
Gain skills that would be useful to my every-day or home life
Advance my career, gain promotion or a pay rise
Perform better in my current job
Yes No Not sure

67
A wide variety of different types of learning were identified as having provided respondents
with skills of use in their current jobs or for getting new jobs / changing careers. Functional
skills, ICT, ESOL, vocational courses and higher education were particularly highly rated in
these regards.
Interestingly, 70% of respondents taking part in short courses and events identified this
learning as having provided skills they might use in their current job but a much smaller
proportion (40%) identified these skills as being of use to get a new job or change career.
The inference is that short courses and events are focused on immediate learning / skills
needs and not generating portable qualifications. Training to be a Union Learning
Representative was likewise identified as frequently providing skills for use in respondents’
current jobs but less frequently providing skills that would help learners change or get new
jobs.
Informal learning for leisure, pleasure or personal development is, unsurprisingly, least
frequently identified with providing skills of use to respondents’ current or future employment.
This type of learning may, however, act as an entry point for vocational training and it is
important to bear in mind that this data relates only to respondents who participated in a
single type of learning.
Table 25: Use of skills by type of learning (%)
Union learning given new
skills you might use in your current job
Union learning given new skills you might use to get a new job or to change into a
different career
Base
Functional skills – English & Maths 72 62 143
ICT/Digital/Computing skills 77 64 201
ESOL 85 76 61
Informal learning 32 30 184
Short course or event 70 40 415
Vocational course at a college or training provider
70 75 123
Higher education and training at Level 4 88 94 17
Training to be a union learning representative
64 44 142
None of the above 48 39 126
Single type of training only 64 50 1414
The comments below illustrate ways in which union learning has helped respondents to
progress in their work and to change jobs and careers.
Union learning helped me move into a completely new career after 25 years working on the tools as a
joiner on a construction site. It has changed my life.

68
I was facing redundancy and Unison were very supportive and helped me gain experience and
confidence in new subjects I was interested in, this helped me find my current job in the NHS.
I’m very impressed with the courses available. Without a representative making me aware of available
learning I wouldn’t have completed my distance learning. As a result of my course, I feel, I have been
offered a new job working within the field of my course. This has given me full time employment and
taken me to the next banding level. Thanks so much. This service is invaluable and I am
recommending it to all my colleagues.
I was able to gain a permanent contract after being an agency worker.

69
OUTCOMES OF LEARNING
In this section we look at the outcomes that result from union learning, distinguishing
between:
changes in circumstances that respondents identify as having “actually happened” on
the basis of a binary “yes’ / ‘no” response, referred to as “hard outcomes”; and
changes in the capacity or disposition that respondents identify as having occurred to
a greater or lesser extent using a sliding scale, from “completely agree” to
“completely disagree”, referred to as “soft outcomes”.
Hard outcomes
The most common hard outcome of participation in union learning is that participants are
able to do their existing job better, cited by 40% of respondents. Large numbers of learners
also felt more confident about progressing in their career (35%), became more involved in
their union (32%), became more confident about funding a job in future (24%) and became a
Union Learning Representative (19%).
Fewer respondents were able to identify that they had become more involved in voluntary or
community based activities (14%), had got a new job or changed to a different type of work
(10%), had gained promotion or greater responsibility in their job (9%) or gained a pay rise
(4%) as a result of their union learning.
The significant gap between a) the proportion of respondents who felt they were performing
better at work and the proportion who gained a pay rise and b) the proportion who felt more
confident about progressing in their careers and the proportion who actually changed job or
gained promotion, is interesting. This may be due to the amount of time that some outcomes
take to come about. However, it seems also to suggest that a significant proportion of the
benefit derived from union learning accrues to employers, at least in the short term.

70
Figure 11: Hard outcomes of union learning - Have any of the following things actually
happened as a result of you participating in union learning?
Base = 2,434
The comments below are illustrative of these outcomes and how they impact on the lives of
union learners.
I was able to do my job better…
I really enjoyed the day and my main motivation had been to “connect” with my professional colleagues
to get a sense of how things were in the other NHS Trusts as I am currently going through major
changes in my Trust. I felt reassured that there are still Trusts where good practice and core OT
values/roles are protected but it was also useful to know that others shared similar experiences. The
information on how to gain clinical evidence in day to day practice was inspiring.
I found the minute taking session very beneficial which has given me more confidence within my work.
I really enjoyed it. As an employee with limited access to learning and development I found it really
helpful. Thank you. :-)
I have found it extremely beneficial in improving the way I work and increasing my knowledge and
understanding. It is difficult to get employers to agree to people attending training. However, as there is
no direct cost in attending the Unison - Bridges to Learning events my employer has been supportive in
me attending.
0 5 10 15 20 25 30 35 40 45
Got a new job or changed to a different type of work
Got a pay rise
Gained promotion or greater responsibility in job
Able to do job better
Stayed in a job, which otherwise might have lost
Feel more confident about progressing career
Feel more confident about finding a job in the future
More involved in union
Became a Union Learning Representative
More involved in voluntary or community based activities
None of the above

71
I got a new job or changed to a different type of work…
Union learning helped me move into a completely new career after 25 years working on the tools as a
joiner on a construction site. It has changed my life.
I have gained employment after 4 years of being unemployed. It has changed my life and that of my
daughter. She finally is going to get to go on an aeroplane on holiday.
I absolutely believe that I wouldn't have had the confidence to apply for jobs. Through gaining this and
qualifications I now have a permanent full-time job. The first in 3 years.
Getting involved in union learning changed my life. From being a ULR I went on to become a Project
worker for the area. I built an award winning learning centre in the workplace. My self-esteem "went
through the roof". I left school with very few qualifications yet I have gained several in past 5 years
thanks to union learning. I lost my job in May this year but, using the skills I'd learnt as a ULR and with
a good portfolio of qualifications I got a job as a relief library assistant in September. I am now thinking
about starting a uni course next year. Union learning has given me the confidence and motivation to
reach for goals I thought were unobtainable.
I got Promotion…
I’m very impressed with the courses available. Without a representative making me aware of available
learning I wouldn’t have completed my distance learning. As a result of my course, I feel, I have been
offered a new job working within the field of my course. This has given me full time employment and
taken me to the next banding level. Thanks so much. This service is invaluable and I am
recommending it to all my colleagues.
Union learning has completely changed my career. I had a degree and worked in an administrative job.
Becoming involved in union learning and becoming a ULR has allowed me to get two promotions that
my previous experience and qualifications would not have been applicable to. I now encourage
members to participate in union learning for personal and professional development as it really can
change their career, outlook and lives.
I would not be in the position I am now without it.
Over the past 21 years - I have been encouraged to apply and complete courses, including Return to
Learn, Women, Work and Society and 1/2 day and full day on site courses. Without Unison, I really do
think I would not have progressed in my job.
I became more involved in voluntary or community based activities…
Union learning is vital for those who received little or no qualifications at school. It has greatly built my

72
confidence and sense of self-worth. Union learning means that I now have an appetite to learn more. It
has also helped me to play a greater role in serving my community e.g. Residents Association.
Unison training has given me confidence to support and manage members during grievances. I have
now become a school convenor and have played a major role in setting up a school support network
group.
I became more confident in finding a job in the future…
I feel more confident with looking for work. The help I was given with my CV was very useful and I now
feel I have more direction.
The union have supported me through my redundancy and have shown me several ways of gaining
future employment and training qualifications thus giving me a better understanding of my abilities and
the union’s willingness to help where and how they can.
I think it’s brilliant, great opportunity to improve your skills, train for a better job and provides so many
more opportunities.
I stayed in a job that I might have lost…
Fantastic help when I was under the threat of redundancy
I became more confident in progressing my career…
It has given me confidence and transferable skills enhancing my work prospects.
It has helped change my life also give me the confidence to go after my dream job.
I became more involved in my union…
Union learning has given me the confidence to become more politically active and able to encourage
others to do so. I believe that unions, the ULF and unionlearn are extremely important conduits for
working class people to become more educated and hopefully will continue to do so.
Bridges helped me to gain the confidence, qualifications and skills to support, encourage and promote
learning opportunities to others. The learning opportunities it has provided from informal learning to
vocational qualifications has helped learners to progress in their work roles as well as their personal

73
and social lives.
Thank you for raising staff learners’ awareness of their right to secure work, holiday pay and other
benefits. Thank you for raising awareness of how income inequality can be erased between
uneducated, aggressive men and educated professional women. Thank you for helping those women
facing discrimination… with professional development to learn skills that will help them to secure work
to provide for their family Thank you for stopping bullying and unfair, illegal practices at work, learning
at home through education and union representation and action to right wrongs.
Hard outcomes by motivation for learning
Unsurprisingly, respondents’ motivations for taking part in learning influence the outcomes
they experience. Respondents whose main motivation was to:
advance their career, gain promotion or a pay rise were most likely to state that
they felt more confident about progressing in their career, finding a job in future or
had gained a pay rise.
support people in their workplace or community were most likely to state that
they had become more involved in their union or had become a union learning
representative.
do something fun or to meet new people were most likely to have become
involved in voluntary or community based activities.
perform better in their job were most likely to state that union learning had enabled
them to do their job better.
While some outcomes (e.g. becoming more involved in my union) were closely related to a
particular motivation (the desire to support people in their workplace or community), other
outcomes were experienced by learners with a wide variety of motivations. Being able to do
their job better and feeling more confident about progressing in their career were reported as
positive outcomes by large numbers of respondents whatever their motivation.

74
Table 26: Outcomes by motivation for participation
Perf
orm
bett
er
in m
y
curr
ent jo
b
Advance c
are
er,
gain
pro
motio
n o
r p
ay r
ise
Gain
skill
s th
at w
ould
be
usefu
l in
every
-day o
r
hom
e life
Sup
port
peop
le in m
y
com
mu
nity o
r w
ork
pla
ce
Do s
om
eth
ing f
un/m
ee
t
new
peop
le
Oth
er
All
Got a new job or changed to a different type of work
8 17 7 12 3 8 10
Got a pay rise 3 8 2 5 1 2 4
Gained promotion or greater responsibility in job 7 16 5 13 4 3 9
Able to do job better 55 35 35 42 13 16 40
Stayed in a job, which otherwise might have lost 4 2 3 4 0 1 3
Feel more confident about progressing career 33 51 33 37 26 16 35
Feel more confident about finding a job in the future
18 40 26 23 9 18 24
More involved in union 19 26 22 62 17 26 32
Became a Union Learning Representative 7 15 16 42 12 10 19
More involved in voluntary or community based activities
4 10 12 27 29 7 14
None of the above 20 18 27 9 40 45 21
Base 628 307 574 600 76 197 2382
Hard outcomes by type of learning
Table 27

75
shows the proportion of respondents reporting different outcomes by the type of learning
undertaken. It is important to note that, in order to disaggregate the data, this table only
relates to data for the 1,422 respondents who had taken part in a single episode of learning
and, as previously stated, those who participated in multiple episodes and types of learning
pointed to a much wider range of benefits as having resulted from their participation.
The table shows that respondents who took part in:
Functional Skills learning, were more likely to feel confident about:
o progressing in their career (38% citing this outcome, compared to 26% of all
single episode learners); and
o being able to do their job better (38%, compared to 31% of all learners).
ICT, reported a wide range of outcomes. They were more likely than all learners to
report feeling more confident about finding a job in the future (22% against 19%) and
being able to do their job better (34% against 31%), but not by a large margin.
ESOL, were significantly more likely to report that they had attained a wide range of
outcomes than the average for all learners, including that they:
o got a new job or changed to a different kind of work (21% citing this outcome,
compared to 6% of all ‘single episode’ learners);
o were able to do their job better (38%, compared to 31% of all learners);
o stayed in a job that they might otherwise have lost (14%, compared to 2% of
all learners);
o felt more confident about progressing in their career (37%, compared to 26%
of all learners); and
o felt more confident about finding a job in the future (38%, compared to 19% of
all learners).
Informal learning, were less likely to report that they had attained any of the specified
outcomes, apart from becoming more involved in community-based or voluntary
activities (14% citing this outcome, compared to 7% of all learners). They were also
significantly more likely to report that they had experienced none of the outcomes
listed (53%, compared to 31%).
Short courses, were:
o the group of single episode learners most likely to report being able to do their
job better (41%, compared to 31% of all learners); and
o less likely than average to report any other single outcome.
Vocational courses, were more likely than others to report outcomes relating to
employment progression, such as that they:
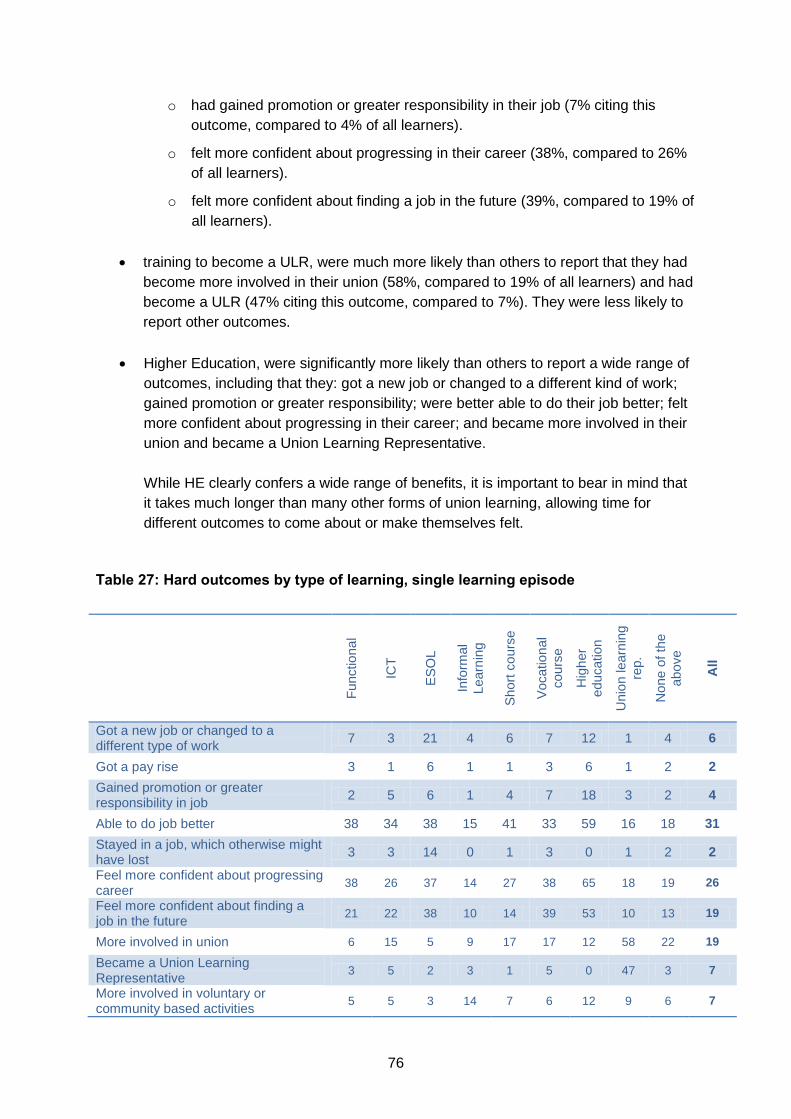
76
o had gained promotion or greater responsibility in their job (7% citing this
outcome, compared to 4% of all learners).
o felt more confident about progressing in their career (38%, compared to 26%
of all learners).
o felt more confident about finding a job in the future (39%, compared to 19% of
all learners).
training to become a ULR, were much more likely than others to report that they had
become more involved in their union (58%, compared to 19% of all learners) and had
become a ULR (47% citing this outcome, compared to 7%). They were less likely to
report other outcomes.
Higher Education, were significantly more likely than others to report a wide range of
outcomes, including that they: got a new job or changed to a different kind of work;
gained promotion or greater responsibility; were better able to do their job better; felt
more confident about progressing in their career; and became more involved in their
union and became a Union Learning Representative.
While HE clearly confers a wide range of benefits, it is important to bear in mind that
it takes much longer than many other forms of union learning, allowing time for
different outcomes to come about or make themselves felt.
Table 27: Hard outcomes by type of learning, single learning episode
Functio
na
l
ICT
ES
OL
Info
rmal
Learn
ing
Short
co
urs
e
Vocation
al
cours
e
Hig
her
education
Unio
n learn
ing
rep.
None o
f th
e
above
All
Got a new job or changed to a different type of work
7 3 21 4 6 7 12 1 4 6
Got a pay rise 3 1 6 1 1 3 6 1 2 2
Gained promotion or greater responsibility in job
2 5 6 1 4 7 18 3 2 4
Able to do job better 38 34 38 15 41 33 59 16 18 31
Stayed in a job, which otherwise might have lost
3 3 14 0 1 3 0 1 2 2
Feel more confident about progressing career
38 26 37 14 27 38 65 18 19 26
Feel more confident about finding a job in the future
21 22 38 10 14 39 53 10 13 19
More involved in union 6 15 5 9 17 17 12 58 22 19
Became a Union Learning Representative
3 5 2 3 1 5 0 47 3 7
More involved in voluntary or community based activities
5 5 3 14 7 6 12 9 6 7
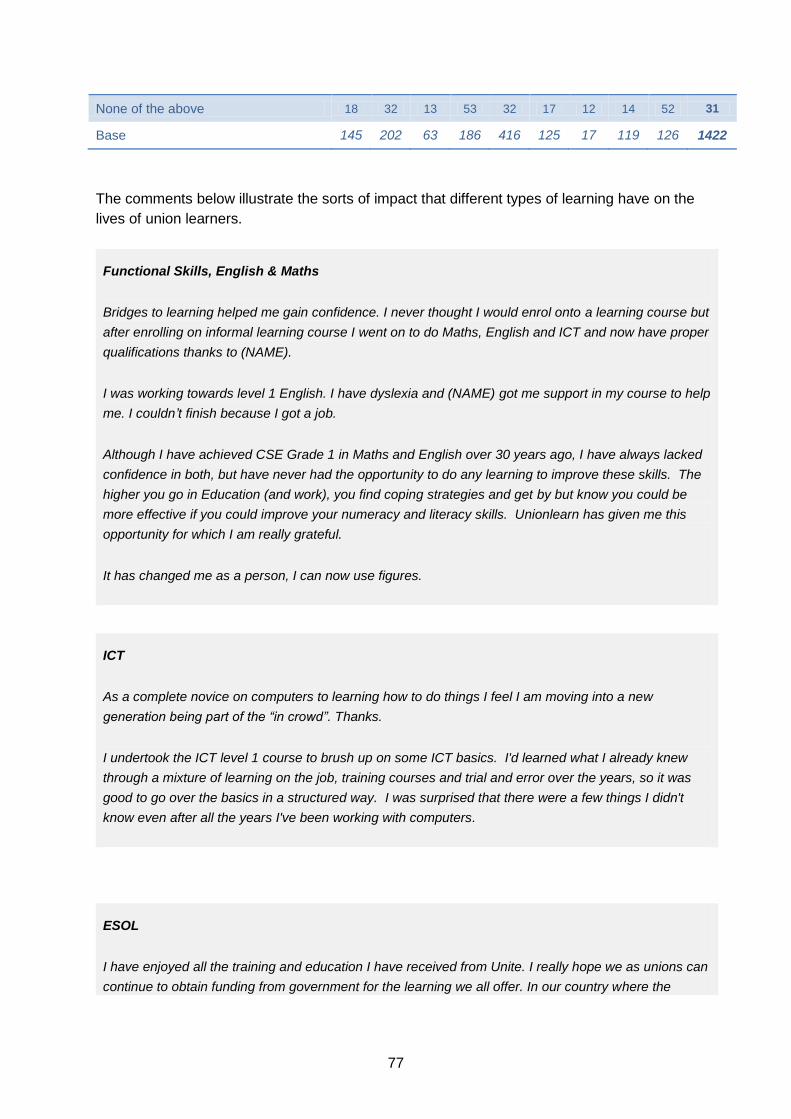
77
None of the above 18 32 13 53 32 17 12 14 52 31
Base 145 202 63 186 416 125 17 119 126 1422
The comments below illustrate the sorts of impact that different types of learning have on the
lives of union learners.
Functional Skills, English & Maths
Bridges to learning helped me gain confidence. I never thought I would enrol onto a learning course but
after enrolling on informal learning course I went on to do Maths, English and ICT and now have proper
qualifications thanks to (NAME).
I was working towards level 1 English. I have dyslexia and (NAME) got me support in my course to help
me. I couldn’t finish because I got a job.
Although I have achieved CSE Grade 1 in Maths and English over 30 years ago, I have always lacked
confidence in both, but have never had the opportunity to do any learning to improve these skills. The
higher you go in Education (and work), you find coping strategies and get by but know you could be
more effective if you could improve your numeracy and literacy skills. Unionlearn has given me this
opportunity for which I am really grateful.
It has changed me as a person, I can now use figures.
ICT
As a complete novice on computers to learning how to do things I feel I am moving into a new
generation being part of the “in crowd”. Thanks.
I undertook the ICT level 1 course to brush up on some ICT basics. I'd learned what I already knew
through a mixture of learning on the job, training courses and trial and error over the years, so it was
good to go over the basics in a structured way. I was surprised that there were a few things I didn't
know even after all the years I've been working with computers.
ESOL
I have enjoyed all the training and education I have received from Unite. I really hope we as unions can
continue to obtain funding from government for the learning we all offer. In our country where the

78
English speaking courses are so important to aid people to integrate into our society.
It give me a chance to learn of language, change jobs - a fair contract and consequently, on the
resignation of benefits, and protection from exploitation and dishonesty. I have this hope.
Informal learning
I did a short course on getting my car winter-ready. It was great fun and gives me practical skills being
a single parent.
I really enjoy union learning, It gives me the opportunity to meet up with colleagues from other working
areas. I enjoy the topics discussed which are always in a relaxed environment. I like being able to put
my opinions across when discussing the topic of the day as the groups are always small and interact
with each other well.
Short Courses
Very inspirational short courses that enhance my ability to perform my work well. Speakers always of
an excellent calibre. Very intensive learning but both lectures and workshops well-structured and
stimulate further study.
The amount of funding available to the employer [for training – ed.] has greatly reduced… this means
that employers will select what education will be available with mandatory requirements met first, then
only learning strictly necessary under the duty of care and to evidence practitioners’ safe practice. RCN
learning events cover subjects that are vital to nursing but not accessible through the employer. Topics
recognised and needed by nurses, like NMC revalidation, emotional resilience, raising concerns safely,
accountability/delegation, team working and leadership, alongside the clinical workshops of diabetes,
parkinsons disease etc etc. Without the sponsorship and efforts of the RCN putting on these
workshops there would be a very real deficit in learning support in the workplace.
I'm very grateful our union rep (NAME) organised our Autism training as it has given me greater
knowledge of the condition which has enabled me to understand and support our pupils with much
greater understanding and effectiveness.
Vocational Courses
Having completed The Apprenticeship in Team Leading has made me more confident to take up a
Supervisor / Team Leader role.
Helped me as an apprentice

79
I think that union learning is a valuable resource to allow people to develop skills and progress their
career. I certainly have gained lots of useful knowledge about SEN which I use on a daily basis at
work as an LSA in a secondary school.
ULR
It has been very helpful in my career to help others and also made me more confident with speaking to
big groups of people
Since becoming A Union Learning Rep, I have achieved things that I previously never thought I was
capable of doing. I have the confidence to do whatever I want to do now.
Higher Education
Because of the help from the Union learning, I am now at University and doing quite well. They have
installed confidence in me in that I can achieve my goals.
I would never have gone to University without Trade Union Education.
Union learning opened a new chapter in my life eventually giving me the confidence to undertake a
degree, which I previously thought was way beyond my capabilities. I am extremely proud to say that I
graduated with a 2:1 in September 2014. If it hadn't been for Union learning and the courses I was
able to undertake in the run up to the degree I wouldn't be the confident person I am today.

80
Figure 12 shows that the average number of outcomes identified as having occurred as a
result of learning varies by the type of learning undertaken. Respondents who participated
in higher education attributed a larger number of outcomes to their learning than those who
participated in short courses or informal learning. This might be expected, given the
differences in the intensity and duration of these interventions.
The high volume of positive outcomes attributed to ESOL (1.7 per learner) and
comparatively low volume attributed to informal learning (0.7 outcomes per learner) is
notable. However, this data relates to the 38% of survey respondents who had participated
in a type episode of learning and, as previously noted, some forms of learning may act as a
gateway to others.
Figure 12: Ave number of outcomes per learner by type of learning
Learners participating in only one type of learning only
Hard outcomes by frequency of learning
Learners who engage in multiple episodes and types of learning attributed a much
larger number of hard outcomes to their learning than single episode learners.
Figure 13 shows that, on average, learners who took part in three episodes identified twice
as many outcomes as those who participated in one episode, while those who participated in
seven or more episodes of learning identified three times as many.
2.4
1.7 1.6 1.6
1.3 1.2 1.2 1.2
0.9
0.7
0.0
0.5
1.0
1.5
2.0
2.5

81
Figure 13: Number of outcomes by number of episodes of learning
1.1
1.71.9
2.22.4
3.3
0.0
0.5
1.0
1.5
2.0
2.5
3.0
3.5
4.0
1 2 All 3 4 to 6 7+

82
Table 28 shows how the proportion of learners citing each outcome is influenced by the
number of learning episodes undertaken. It shows that, compared to respondents who had
taken part in one episode of learning, those who had taken part in seven or more episodes
were roughly:
Four times as likely to report that they
o got a new job or changed to a different type of job;
o got a pay rise; or
o gained promotion or greater responsibility in their current job.
Twice as likely to report that they
o were able to do their job better;
o stayed in a job that they might otherwise have lost;
o felt more confident about progressing in their career; and
o felt more confident about finding a job in the future.
Five to six times as likely to report that they
o were more involved in their union;
o had become a ULR;
o were more involved in voluntary or community based activities.

83
Table 28: Individual outcomes by episodes of learning
1 2 3 4-6 7+ All
Got a new job or changed to a different type of work
5 6 11 10 21 10
Got a pay rise 2 3 5 4 9 4
Gained promotion or greater responsibility in job 4 7 12 12 19 9
Able to do job better 28 36 45 49 61 41
Stayed in a job, which otherwise might have lost 3 4 3 3 6 3
Feel more confident about progressing career 25 38 37 40 50 36
Feel more confident about finding a job in the future
18 27 25 27 33 25
More involved in union 12 26 38 47 64 32
Became a Union Learning Representative 6 13 23 29 42 19
More involved in voluntary or community based activities
6 9 16 17 29 14
None of the above 35 20 12 11 6 21
Base 935 459 326 276 501 2,497
There may be a number of interpretations of this data.
Many people who become ULRs are inspired to take on the role as a result of their own
positive experience of learning. We might therefore expect those who become ULRs and
more involved in their union to have participated in multiple episodes of union learning.
Perhaps more interesting and impressive is the strong link between multiple episodes of
learning and the likelihood of having gained promotion, greater responsibility in a job, a new
or different type of job or a pay rise. While learners who engage in more episodes of learning
are likely to have been in learning for longer, thereby allowing more time for these outcomes
to occur, this does not in any way invalidate the result or the key conclusion to be drawn
from the data, which is that the strong correlation between engagement in multiple episodes
of learning and these outcomes appears to support a policy of encouraging people to
engage in multiple episodes of learning.
Soft outcomes
Figure 14 shows the extent to which respondents agreed or disagreed that a range of soft
outcomes have occurred as a result of their participation in union learning.
It shows that three quarter or more of all learners agreed or completely agreed that union
learning has resulted in them becoming more confident in their abilities (82%); more likely to
undertake further learning and training (79%) and more enthusiastic about learning (74%).

84
Two thirds (66%) agreed or completely agreed that they were better able to organise, mentor
and support other people and half agreed or completely agreed that union learning had
improved their quality of life and well-being (51%).
Figure 14: % of respondents who attained specified outcomes
Table 29 looks at the proportion of participants in each type of learning who agreed that
these outcomes applied to them. It shows that those who took part in:
Functional Skills learning, were more likely than average to agree that they:
o became more enthusiastic about learning (79% citing this outcome, compared
to 75% of all respondents);
o improved their quality of life / well-being (59%, compared to 51% of all
learners);
o became a more capable parent (47%, compared to 29%).
ESOL, were more likely to agree that they had attained every single outcome. They
were also the group most likely to agree that they:
o became more enthusiastic about learning (89%, compared to 75%);
o had a better idea about what they wanted to do in their lives (64%, compared
to 53%);
o improved their quality of life (79%, compared to 51%);
o were more likely to undertake further learning and training (87%, compared to
79%); and
24
11
34
16
28
18
32
42
18
45
35
54
35
42
27
51
17
39
15
38
22
5
10
2
7
2
7
2
3
10
2
3
2
2
2
0% 20% 40% 60% 80% 100%
Become better able to organise, mentor and support other people
Become more capable parent
Become more likely to undertake further learning and training
Improved your quality of life/ well-being
Become more confident in your abilities
Got a better idea about what you want to do in your life
Become more enthusiatic about learning
Completely agree Agree Neither agree nor disagree Disagree Completely disagree

85
o had become a more capable parent (66%, compared to 29%)
o felt more confident about progressing in their career (37%, compared to 26%
of all learners); and
o felt more confident about finding a job in the future (38%, compared to 19% of
all learners).
Vocational courses, were more likely to agree that they had a better idea about what
they wanted to do with their lives (62%, compared to 53%); and most likely to agree
that they had become more confident in their abilities (86%, compared to 82% of all
learners).
Higher Education, were more likely to agree that they had a better idea about what
they wanted to do with their lives (59%, compared to 53%). They were also most
likely to agree were better able to organise, mentor and support other people (88%,
compared to 66% of all learners).
Training to become a ULR were also more likely to agree that they were better able
to organise, mentor and support other people (78%, compared to 66% of all
learners).
The proportion of respondents who participated in ICT training, informal learning and short
courses who agreed that they had experienced these outcomes was lower than the average
for all forms of learning, for every outcome. This may be a function of the duration / quantity
of these types of training. Nonetheless, by comparison, the proportion of respondents
reporting positive outcomes as a result of training in ESOL is impressive.
Table 29: Soft outcomes by type of learning (% who agree that outcomes have
occurred)
Fu
nctio
na
l
ICT
ES
OL
Info
rma
l
Le
arn
ing
Sh
ort
co
urs
e
Vo
ca
tio
nal
co
urs
e
Hig
he
r
ed
uca
tion
Unio
n
lea
rnin
g
rep
.
All
Become more enthusiastic about learning 79 74 89 55 59 79 59 68 75
Got a better idea about what you want to do in your life
55 41 64 49 35 62 59 44 53
Become more confident in your abilities 83 81 83 66 73 86 77 74 82
Improved your quality of life/well-being 59 38 79 37 36 50 47 34 51
Become more likely to undertake further learning and training
81 75 87 55 72 77 82 74 79
Become a more capable parent 47 29 66 17 14 29 29 14 29
Become better able to organise, mentor and support other people
53 48 71 37 54 69 88 78 66
Base 141 199 58 185 414 122 17 140 2465

86
The comments below are illustrative of these outcomes and how they impact on the lives of
learners.
I became more enthusiastic about learning…
I don't think I would have got back into learning without the union
A very personal experience with excellent supportive tutors in an informal environment. Completely
changed my mind about learning. Finally I now have had a positive experience and outlook towards
adult education. Thank you.
I have had a very positive experience of union learning. I have gained in confidence and am now not
so afraid of learning.
I got a better idea about what want to do with my life…
Union learning opportunities has changed the direction of (my) future career. I have gained and
developed essential skills, confidence and highly improved my understanding of what I want to achieve
in my career and my personal life. I am definitely a better and more productive employee than I was
before I started learning with Union learn.
They have helped me build a new me.
I became more confident in my abilities…
I met people on the course who knew and understood the problems one faces when lacking confidence
and how we allow others to make us feel so bad about ourselves that we doubt our own actions, how
body language is read. I learned that I can be more assertive that there is more than one way to say
no.
Because of the help from the Union learning, I am now at University and doing quite well. They have
installed confidence in me in that I can achieve my goals.
A fantastic initiative that has enabled me and some of my colleagues to gain more confidence in our
daily work. Hopefully the days of being confined to the scrap heap at age 16 are over. I would
recommend union learn to everyone, at any level.
For me the most important part of union learning (as someone who did not reach their full potential at
school through sheer terror and lack of self-confidence) is the secure and safe environment in which
the learning takes place...
Union learning has helped my self-esteem & confidence & improved my skills in ways I never thought

87
possible.
Improved quality of life / well being…
Absolutely beneficial to my job and home-life. Without my ULR visiting the store I probably wouldn't
have done anything.
Education through the Trade Union movement has fundamentally changed my life for the better. I feel
indebted to the Union and those who came before me.
I can't stress enough how much the union learning does to better my life. I have learnt so much, and
am a happier and more confident person because of it.
Union learn has enabled me to turn my working life around. Thank you for being there with your
support and knowledge
It helped to boost my morale during a period of unemployment.
I became a more capable parent…
The GMB learning has totally changed my life from learning to read and write to help my children, then
supported to progress from EL3 to L4.
I enjoyed doing all my classes as it helps me with my children's homework and keep up to date with an
ever-changing world.
I became better able to organise, mentor and support other people…
Bridges helped me to gain the confidence, qualifications and skills to support, encourage and promote
learning opportunities to others.
I have gained the confidence to start a community project in my area which is supported by the bakers
union learning services which as at least 20 folk attending non accredited computer courses on a
weekly basis. This has been achieved by us getting the support from union learning. I would like to take
the opportunity to say a big thank you. Union learning changes people’s lives.
It has helped me in my employment role also to recognise the training needs of other staff members

88
and to encourage others to learn more.
It's really rewarding being a ULR in my workplace. I have helped colleagues gain nearly 200
qualifications to date. It's inspiring to see people learn and mentor them through the process.

89
THE IMPORTANCE OF UNION SUPPORT
While respondents clearly experience a wide range of positive outcomes as a result of
participating in union learning, how important do they consider their union to have been in
supporting their learning? Would it have taken place anyway, without their union’s
involvement? This question of attribution is an important one, which needs to be taken into
account when assessing the impact of the government’s investment in the ULF.
Figure 15 shows that 72% of respondents felt that their union was either extremely important
or very important in supporting their learning and that 13% thought it was only slightly or was
not at all important to supporting their learning.
Figure 15: Importance of union in supporting respondents’ learning
Base = 2,459
It is interesting to note that respondents in many minority or disadvantaged groups attributed
a higher level of importance to the support received from their union than others.
The proportion of respondents who described their union as having been either extremely or
very important to their learning was higher among people who:
Identified as Asian or Asian British (82%), Black or Black British (85%), other ethnic
minority (84%) and White Other (75%) than those who identified as White British
(71%);
Had English as a second or other language (83%) than those with English as a first
language (71%);
39%
33%
14%
6% 7%
0%
5%
10%
15%
20%
25%
30%
35%
40%
45%
Extremelyimportant
Very important Moderatelyimportant
Slightly important Not at allimportant

90
Had a disability (78%) than those who did not have a disability (72%);
Had no qualifications (79%), qualifications at Entry level or Level 1 (83%) or at Level
2 (80%) than those with qualifications at Level 4 (72%) or Level 5 (63%);
Were economically inactive (76%) than employed, either full-time (74%) or part-time
(66%);
Were claiming state benefits (78%) than those who were not (71%);
Were male (78%) than female (68%).
This suggests that unions involved in the delivery of ULF have been successful in supporting
people who often face disadvantages in the labour market or that the support they offer has
been particularly appreciated by people in these groups.
The comments below are illustrative of the role that unions played in supporting
respondents’ learning.
Union learning has been the key which has helped people to regain those skills in literacy and
numeracy which they have not used since they left school decades ago.
I wouldn't have taken any courses without the support of the Learning services.
For me the most important part of union learning (as someone who did not reach their full potential at
school through sheer terror and lack of self confidence) is the secure and safe environment in which
the learning takes place…
Union learning opened a new chapter in my life eventually giving me the confidence to undertake a
degree, which I previously thought was way beyond my capabilities... If it hadn't been for Union
learning and the courses I was able to undertake in the run up to the degree I wouldn't be the confident
person I am today.
Our learning rep, (NAME), is fantastic. She has helped so many of us, her passion, motivation &
support - amazing!
UCATT has helped me gain the necessary skills through their training and courses… They have helped
my own education develop immensely and I cannot thank them enough for their support and help.
Without the union my days of further education would be over

91
BENCHMARKING OUTCOMES
To help us to consider the extent to which the outcomes of union learning might be
considered “good”, or at least in line with expectations, we included a number of questions
previously asked by the Community Learning Learner Survey (CLLS) (BIS 2013), an
evaluation of programmes supported through the £210m BIS Community Learning budget.
Although such benchmarking is useful, it needs to be treated with caution. Differences in the
questions asked25, the context in which questions are asked26 and the ways in which the
surveys are conducted, all affect the results. The CLLS was a telephone survey with a
randomised sample. The Union Learning Survey (ULS) was both postal and online, with self-
selecting respondents. It could be argued that self-selection may pick up more engaged
learners and those more likely to report positive experiences. Conversely, it could also be
argued that respondents participating in an online / postal survey may feel freer to give
honest / negative responses than those dealing with another person over the phone. The
direction or extent of any possible bias arising from differences in approach is unclear.
It is, therefore, somewhat reassuring to find that the results of the two surveys are similar or
that they differ in ways that might be expected, given the differences in the focus of learning
under review.
Table 30 contains data on the proportion of ULS and CLLS respondents who felt that their
learning had resulted in a variety of soft outcomes27. It shows that a nearly identical
proportion of respondents agreed that they:
had become more enthusiastic about learning (75% for the ULS, compared to 76%
for the CLLS);
had a better idea about what they wanted to do in their lives (53%, compared to
51%);
were more confident in their abilities (82% for both surveys); and
were more likely to undertake further learning and training (79%, compared to 81%).
The one significant difference is that a higher proportion of CLLS respondents (71%) than
ULS respondents (51%) agreed that their participation in learning had improved their quality
of life. This is likely to be the result of union learning being work-related and primarily
undertaken by those who are employed, while community learning is mainly undertaken by
people who are economically inactive and includes a greater proportion of learning for
leisure, pleasure, cultural enrichment and intellectual or creative stimulation.
25
Community Learning Learner Survey respondents were asked to think about a specific course when answering questions, while Union Learning Survey respondents were asked to think about their union learning in general. 26
Responses may be affected in subtle ways by preceding questions. 27
The Union Learning Survey asked whether these outcomes had “actually happened as a result of you participating in union learning”, while the Community Learning Learner Survey asked whether they had “actually happened as a result of you doing the course”. Community Learning Learner Survey respondents are more likely therefore be attributing outcomes to a single recent episode of learning, while Union Learners are more likely to be attributing outcomes to all episodes of union learning.

92
Table 30: Benchmarked outcomes, life directions, Union Learning Survey v.
Community Learning Survey
Union
Learning Survey
Community Learning Learner Survey
More enthusiastic about learning 75 76
Better idea about what you want to do in your life 53 51
More confident about your abilities 82 82
Improved your quality of life 51 71
More likely to undertake further learning and training 79 81
Turning to employment-related outcomes, shown in Table 31, the opposite pattern tends to
emerge, with:
a higher proportion of ULS respondents (42%) than employed28 CLLS respondents
(33%) stating that they were able to do their job better as a result of their learning;
a higher proportion of employed ULS respondents (11%) than employed CLLS
respondents (6%) stating that they had gained promotion, greater responsibility or
got a pay rise.
The proportion of economically active ULS respondents who stated that their learning had
given them new skills that they might use in their current job (82%) was also higher than the
proportion of economically active CLLS respondents (61%) who stated that their learning
gave them new skills they might use in a job, current or future. This is not unexpected as it
reflects the vocational focus of union learning.
What is less expected is that a slightly higher proportion of CLLS than ULS respondents
stated that they were more confident in progressing in their career (42% v 36%) or stayed in
a job that they might have lost (5% v 3%) as a result of their learning.
Table 31: Benchmarked outcomes, work and employability, Union Learning Survey v.
Community Learning Survey
Union
Learning Survey
Community Learning Learner Survey
Feel more confident in progressing in your career 36 42
Able to do your job better 42 33
Got a new job or changed to a different type of work 10 12
Stayed in a job which you might have lost 3 5
You got a pay rise, promotion or greater responsibility in your job 11 6
28
CLLS respondents who were economically inactive or unemployed were not asked to answer these question

93
THE IMPACT OF LEARNING
There is a significant body of research that shows that investing in skills and learning has
benefits for:
Society through higher employment, a healthier population, greater civic participation
and less crime;
Individuals by raising their likelihood of being in employment, leading to improved
wages, economic resilience and by contributing to their life-satisfaction;
Employers who gain a more productive and innovative workforce and are better able
to adapt to changing economic conditions; and
The economy by increasing the productivity of the workforce and increasing
employment rates (Campbell et al, 2010).
These impacts are inter-related. Raising skill levels raises salaries and employment levels.
This reduces poverty, which in turn reduces illness, disease and unhealthy behaviours. The
complexity and diversity of these relationships is such that building a holistic model of the
impact of any single investment in skills is impossible. For this reason, our estimate of the
impact of ULF Round 15, set out in the following section of this report, focuses solely on
productivity, wages and employment. However, to come to any comprehensive assessment
of the programme’s impact, it remains important to consider and take some account of these
broader impacts. This section therefore reviews the findings of a range of studies looking at
the wider benefits of increasing participation in learning.
Social benefits of learning
One of the clearest benefits of education is health. People with higher levels of educational
attainment have healthier habits and lifestyles (Healy et al, 2001). Holding higher levels of
qualifications is associated with greater happiness, self-esteem, optimism, self-efficacy and
a reduced risk of depression (Sabates et al, 2008; Government Office for Science, 2008).
Participation in non-accredited learning as an adult is also positively correlated with taking
exercise; with reductions in obesity (Feinstein, 2002 i) and is estimated to increase the
chances of giving up smoking by age 42 by 14% (NIACE, 2010).
Adult learning also, in the words of David Cameron “has a really important role to play in
encouraging active citizenship”29. It is linked to raised racial tolerance (Feinstein et al, 2008);
increased involvement in social, voluntary/community activities and political participation;
and a greater likelihood of voting (NIACE, 2010). There is evidence of a relationship
between learning and identification with social norms that inhibit criminal behaviour
(Schuller, 2009) as well as with decreased risky behaviours, decreased teenage fertility and
happier marriages (Oreopoulos & Salvares, 2011).
29
Rt. Hon. David Cameron MP, quoted in Adult Learning, volume 20, number 9, May 2010.

94
Benefits to Individuals
UKCES has found “a wealth of evidence on the financial benefits of skills to individuals” and
that “the possession and acquisition of skills and their quality has a direct relationship with
an individual’s earning prospects, their likelihood of gaining employment, their job tenure and
their propensity for future learning which helps to create the virtuous circle of learning and
earning” (UKCES, 2010).
The economic impact of learning on individual earnings and employment has been the
subject of a number of studies. These have looked at a variety of issues, such as how these
impacts are affected by the type of qualifications gained (vocational / academic /
apprenticeships); the level of qualification gained, the level of qualifications already held by
learners; learners’ age, gender, ethnicity and so on.
A recent BIS study reviewed of this body of research (BIS / CE / IER, 2013) highlighting
findings such as that:
Individuals obtaining an NVQ2 as their new highest qualification earn around 4%
more than individuals with no qualifications (McIntosh, 2009);
An individual with an NVQ Level 2 held as a highest qualification and obtained
through workplace learning earns approximately 10% more than an individual with no
or lower level qualifications (ibid);
At Level 3, all vocational qualifications are associated with positive returns when
held as highest qualifications compared with a Level 2 qualification: ranging from
11% for an NVQ Level 3 up to 25% for an ONC/OND (ibid); and that
Apprenticeships have particularly high levels of return, with those completing a
Level 3 Apprenticeship earning a wage premium of 22% for men and 14% for
women, relative to a comparison group with Level 2 qualifications (ibid);
The highest employment returns are found for NVQ Level 3 (a 15% increase in
probability of being employed) and NVQ Level 2 (11.8% increase compared to
less than Level 2) (BIS / London Economics, 2011);
Apprenticeships have the highest overall wage and employment returns at Level
3 (22% and 14%, respectively), although Level 2 apprenticeships also give rise to
significant positive wage and employment returns (12% and 10%, respectively)
(ibid);
that higher levels of attainment are normally associated with higher returns, in terms
of both wages and employment, although, conversely, lower level qualifications,
including Level 1, are associated in relatively greater reductions in benefit usage (BIS
/ London Economics (2011ii).
Alongside these tangible impacts, education and training also benefits individuals in many
subtle ways being associated, example, with patience, independence, long-term thinking,
occupational prestige, self-accomplishment and inter-social interaction (Oreopoulos &
Salvares, 2011). A recent study, which tried to quantify the value of these less tangible

95
impacts, found that adult part-time learning had a positive effect on people's life
satisfaction that is equivalent to £1,584 of income per year and that, as adult learners
undertake an average of two courses per year, the average life satisfaction “value” of a
part-time course was therefore £754 (BIS, 2012).
Benefits to organisations
There is good evidence to show that learning not only benefits individuals and that, provided
individuals’ skills are effectively used, there are considerable benefits to employers.
It has been computed that raising the proportion of workers who are trained by 1 percentage
point (from 10% to 11% for example) is associated with an increase in value added per
worker of 0.6 %, and an increase in wages of about 0.3%. The inference is that the benefits
of training accrue relatively equally to both employees and their employers (Dearden et al,
2005). This finding, that the total productivity gain from training is roughly double the wage
gain experienced by individuals, is an important finding which is factored into our impact
estimate in the next section.
Moreover, it is not only individual firms that benefit. Enterprises in areas of high skills and
highly skilled employment benefit each other. Research by UKCES has suggested that a
manufacturing firm located in an area where 40% of the population holds a Level 4
qualification can be nearly 14% more productive than one in an area where 30% hold a
Level 4 qualification, due to taking on more efficient ways of working through informal
learning, interactions and exchanges of information with peers (UKCES, 2010).
Benefits to the Economy
Research also suggests that lower workforce skills levels are a key factor of the productivity
gap that exists between firms in the UK and their competitors in Europe and the U.S. and
that countries with high levels of education and adult skills tend to become wealthier
(UKCES, 2010).
It has been calculated, for example, that an extra year of education can lead to an average
increase in steady-state output per capita by 4% to 7% (OECD, 2001) and that, in the
European Union, an increase in the level of education across the existing labour force of one
year could lead to an increase in productivity of 7% to 10% in the short term and 11% to
15% in the long term (UKCES, 2010).

96
ECONOMIC & FISCAL IMPACT
While it is important to bear the full range of social, health and other benefits of learning in
mind, this section focuses on estimating the economic and fiscal impact of the ULF, derived
from the effect of learning on individual wages, employment levels and productivity.
The methodology adopted to estimate the economic and fiscal impact of union learning is
described in Annex 2. It has been reviewed by staff in BIS responsible for statistical
modelling and is consistent with Treasury Green Book protocols.
In brief, it is based on research that demonstrates the extent to which raising individuals’
skills and qualifications improves:
individuals’ earning;
individuals’ likelihood of being in work;
employers’ productivity.
Data on the returns to learning were applied to union learners who completed their courses
and gained a qualification as a result of their learning. No benefit was assumed for early
leavers or those taking part in unaccredited learning. No benefit was also assumed to flow
from information, advice, guidance and referrals.
Earnings and employment premia30 were applied to average wage estimates for people
learning at different levels, over the expected duration of their working lives. This benefit was
discounted at a rate of 3.5% per annum, to take account of the fact that the benefits of
learning diminish with time, in line with Treasury Green Book guidance.
We have also estimated the deadweight (i.e. the proportion of learners who would have
entered learning without ULF support) in order to isolate the value added by ULF Round 15.
This was done by taking in account survey respondents’ views on how important their union
was in supporting their learning. And we have discounted the negative impact on productivity
that results from taking time out of work to take part in learning.
30
A percentage by which wages or the chances of being in employment are shown to rise as a result of gaining different types of qualifications when acquired as either a higher level of qualification than those already held or at the same or a lower level than qualifications already held by learners.

97
Estimated total impact
Based on this approach, we estimate that the overall impact of ULF Round 15 amounts to
around £916 million.
The total benefits to individuals are estimated to be £580 million, comprised of £470 million
from higher wages and £110 million of improved earning as a result of being more likely to
be in employment.
The net benefit to employers resulting from the increased improved productivity of a better
skilled workforce less output lost as a result of working time lost to engage in learning is
estimated at £336 million.
Return on investment
As the ULF primarily funds brokerage activities, it is important to add the cost of delivering
the learning to the £14.15m ULF investment when estimating return on investment.
The application of these unit costs to the cohort of ULF results in an overall delivery cost of
£100 million, made up of £86 million in training costs and £14.15m of brokerage / ULF costs.
Information on how delivery costs are calculated is provided in Annex 2.
On this basis, we estimate that £1 invested in the Union Learning Fund generates a total
economic return of £9.15, of which £5.75 accrues to individuals and £3.40 to employers.
Return by type of provision
The data we have also allows us to estimate the return on investment (RoI) generated by
different types of learning. However, considerable caution is needed in interpreting these
results for a number of reasons, particularly because a) RoI is assumed to flow solely from
the acquisition of qualifications and b) the proportion of learners gaining qualifications is
derived from data for learners who have undertaken one episode learning. Those types of
provision that are largely unaccredited (such as informal learning, short courses and events)
or which are accredited through multiple episodes (such as CPD events) appear to generate
low levels of return on investment. In reality, as we have previously noted, the majority of
union learners take part in multiple episodes of learning, combining different forms of
provision.
Nonetheless, in broad terms, the data suggests that participation in Apprenticeships,
accredited FE programmes and the acquisition of vocational qualifications at work show a
high level of return on investment. The returns on ICT and English, Maths and functional
skills are also substantial, but not as high as those shown for vocational skills. This is
consistent with wider research findings, which show returns to the acquisition of vocational
skills, particularly at Level 3 and above, exceeding those for foundation learning.

98
It is interesting to note that the costs of investment in higher education and informal learning
are shown to be negative. The reasons for this vary. Informal learning is rarely accredited
and therefore, within the model, largely attributed a ‘nil’ economic value, which may be
unfair. For higher education, the collective cost of tuition fees, lost earnings and productivity
foregone are estimated to be higher than the nonetheless significant (c. 11%) uplift in
earnings generated through the acquisition of graduate level qualifications. Such a finding
might be a surprise. However, it is important to bear in mind that the average age of union
learners taking part in higher education is estimated to be 41, which significantly reduces the
period over which the benefits of increased wages are felt31.
Table 32: Return on investment (£) by type of learning
Type of Learning Estimated
RoI (£)
Apprenticeships 16
FE Programmes & Vocational Quals 13
ICT 12
Functional Skills, English & Maths 8
Training to be a ULR 3
Short Courses & CPD 1
Higher Education -0.8
Informal Learning -0.9
Returns to the Exchequer
The Exchequer benefits from learning in many ways, including through the positive impacts
on health, reduced crime and increased civic participation explored in the previous chapter.
It also benefits from reduced welfare payments, due to individuals being more likely to be in
employment, and from reduced dependency on in-work benefits, as a result of increased
wages. While these benefits are clearly important, they are impossible to model with any
reliability and are therefore discounted from our calculations.
These focus on the following estimable benefits:
1. Income Tax on increased individual earnings;
2. National Insurance contributions on increased individual earnings;
3. Increased VAT receipts on consumption resulting from raised incomes;
4. Higher employer National Insurance contributions on employee wages.
A limited model, focused solely on increases in these tax receipts suggests that the fiscal
return to the Exchequer from learning generated by ULF Round 15 amounts to £250m.
31
Returns to individuals’ investment in higher education (in the form of loans) may be positive (and particularly positive for younger people), as this calculation includes an estimation of lost earnings and productivity foregone.

99
Taking into account the both the cost of ULF Round 15 and the cost to partners of delivering
ULF generated learning (£100m), the estimated return to the Exchequer is £2.50 for each £1
spent. Clearly this comfortably exceeds the scale of the initial Exchequer investment.

100
ANNEX 1 – OVERVIEW OF PROJECT OUTPUTS
English Maths Level 2 Level 3 IACL CPD FE HEApprentice-
ships
IAG via
ULRs
Learner
Support
Referrals
BFAWU 0 160 82 331 39 7 394 666 1 1 48 2,052 1,706
CWU 22 202 238 1,641 190 0 3,058 375 212 7 98 3,277 169
GMB (Y&D) 24 758 270 7,399 482 115 1,794 49 874 0 118 226 37
GMB (South) 20 207 65 770 125 53 185 123 327 6 99 2,164 312
PCS 29 208 233 538 173 155 808 93 32 18 352 4,730 265
RCN 127 0 0 90 0 0 0 3,074 0 2 153 2,931 0
UCATT 10 332 397 572 315 58 1,637 579 2,367 18 660 8,987 2,138
UNISON (North) 27 128 172 78 427 196 524 1,166 0 121 63 5,542 615
UNISON (nat) 308 219 160 518 289 1 3,221 762 2,248 22 468 38,148 244
UNITE 414 2,917 2,544 5,773 2,740 521 5,994 7,346 10,838 184 2,070 15,632 4,638
USDAW 233 1,508 990 2,329 445 25 2,076 749 1,402 20 582 6,445 1,818
Participating projects 1,214 6,639 5,151 20,039 5,225 1,131 19,691 14,982 18,301 399 4,711 90,134 11,942
Supporting LearnersFunctional Skills Vocational Quals Other Learning Opportunities
ICTTraining
for ULRs

101
ANNEX 2 - IMPACT ESTIMATE METHODOLOGY
Earnings and employment premia
The impact estimates presented in this report are based on a model developed in 2011 for
BIS by Cambridge Econometrics (CE) and the Institute for Employment Research (IER)
(Beaven et al, 2011) as a basis for estimating the impact of the Further Education. This work
in turn draws on research (including research cited in the previous section, such as
McIntosh, 2010; BIS / London Economics, 2011i; BIS / London Economics, 2011i; and
Dearden et al, 2005) to generate estimates for the uplift in earnings that individuals
experience a) from higher wages and b) from the increased likelihood of being in
employment resulting from the acquisition of qualifications; and the impact of raised skills
levels on productivity.
The model created by Beaven et al provides estimates of the wage and employment premia for different levels of qualifications, acquired through different types of learning, by learners acquiring qualifications at a higher level and at the same or a lower level than the qualifications they already hold. These are shown in Table 33 and

102
Table 34.
Table 33: Wage premia adopted in the model (%)
Source: Cambridge Econometrics / Institute of Employment Research in Beaven et al, BIS 2011
* Includes qualifications below Level 2, excluding basic skills.
Provision Type None L1 L2 L3 L4 & L5
Apprenticeship L2 16 16 16 4 4
Work Based NVQ L2 9 9 4.5 2.25 2.25
Provider Based NVQ L2 4 2 1 0.5 0.5
Apprenticeship L3 18 18 18 9 4.5
Work Based NVQ L3 15 15 15 7.5 3.75
Provider Based NVQ L3 11 11 11 5.5 2.75
Basic Skills 3 5 5 5 5
Developmental Learning* 3 5 5 1.25 1.25
Previous Highest Qualification

103
Table 34: Employment premia adopted in the model (%)
Source: Cambridge Econometrics / Institute of Employment Research in Beaven et al, BIS 2011
Before deciding to use the premia shown above, we reviewed subsequent research on the
Returns to Intermediate & Low Level Qualifications (Conlon et al, 2011), which is used as a
basis for the Treasury approved Unit Costs Database developed by New Economy in
partnership with the What Works centre for Local Economic Growth. Our decision to use
these was based on the fact the subsequent work did not include premia for Basic Skills or
Developmental learning, an important focus for the ULF. Nor did they differentiate between
the premia for those acquiring qualifications at a higher level than the qualifications they
already held and those acquiring qualifications at the same or a lower level.
Comparison between the two studies suggests we have may have used the more
conservative estimates, though this will depend on the precise type of Level 2 and Level 3
qualifications being gained, which is examined by Conlon et al. For example:
Conlon et al estimate the earnings uplift generated by the acquisition of Level 2
qualifications at 12% for a BTEC L2, 7% for a C&G Level 2, 4.5% for a provider
based L2 and 3% for a work based L2. Our model is based on the assumption of an
uplift of 4.5% for those gaining qualifications at a higher level than those held and
2.25% for those acquiring qualification at the same or at a lower level.
Conlon et al estimate the earning uplift estimates generated by the acquisition of
Level 3 qualifications at 20% for a BTEC L3, 15% for a C&G Level 3 and 10% for an
NVQ. Our model is based on the assumption of a 15% for those gaining
qualifications at a higher level than those already held and 7.5% for those gaining
qualifications at the same or a lower level.
Data on the proportion of union learners gaining qualifications at a higher level or at the
same / a lower level than the qualifications they already held was drawn from our survey.
Learners who gained a qualification but were unsure of its level were attributed equally to
those attaining qualifications at a higher level and at the same or lower level than the
qualifications they already held.
Provision Type L1 & below L2 L3 & above
Apprenticeship L2 2.7 0.7 0.7
Work Based NVQ L2 2.7 0.7 0.7
Provider Based NVQ L2 5.4 1.4 1.4
Apprenticeship L3 3.8 1.05 0.3
Work Based NVQ L3 3.8 1.05 0.3
Provider Based NVQ L3 7.7 2.1 0.5
Basic Skills 1.4 0.3 0.3
Developmental Learning 1.4 0.3 0.3
Previous Highest Qualification

104
Application of earning and employment premia
In our model, we only applied these premia to:
ULF learners who completed their programme of learning. This ranged from 90% of
those undertaking vocational learning in FE to 60% of those on CPD programmes.
ULF learners who gained qualifications as a result of participating in learning. The
proportion of learners gaining qualifications was calculated by isolating learners who
took part in a single episode of each type of union learning, which ranged from 80%
of learners undertaking vocational learning to just 9% of those engaged in informal
learning for pleasure, leisure and personal development.
Although they clearly derive some benefit, those who did not complete their course or who
did not gain a qualification as a result of their learning were discounted from the impact
model.
To create the model, it was necessary to match data on the actual number of ULF learners
who undertook each type of learning, taken from projects final submissions in April 2015, to
the categories used in the model developed by Beaven et al. For some forms of union
learning32 this was unproblematic. For others, assumptions needed to be made. For
example, in the absence of information about the qualifications being pursued by union
learners participating in “FE Programmes”33, we attributed these to Level 1, Level 2 or Level
3 learning in line with the national distribution of all FE learning across these levels.
Similarly, ULF brokered Apprenticeships were attributed to Level 2 (Intermediate) and Level
3 (Advanced) Apprenticeships in line with the proportion of all Apprenticeships delivered at
these levels nationally.
Although we already exclude those who do not gain qualifications, we were conscious that
union learners participating in CPD and informal learning may only acquire a small number
of units or credits towards qualifications. Although other models do not differentiate between
the sizes of qualifications gained by learners (i.e. whether these were Awards, Certificates
and Diplomas), to err on the side of caution we have assumed that qualifications acquired
through these two forms of learning confers only 20% of the benefit and premia set out in
Beaven et al.
In line with Green Book methodology, we have allowed for the fact that benefits of learning
diminish over time by discounting all premia at a rate of 3.5% per annum34 for the duration
that learners remain in the labour market. The average age of learners was calculated from
data generated by our survey. For the purposes of the model, we have assumed that all
learners (male and female) remain in the labour market until the age of 65.
32
Matching Maths, English, Functional Skills, ICT courses at Levels 1, 2 and 3; Vocational Qualifications at Level
2 & Level 3 was straightforward.
33 These were also assumed to be provider based, while ‘Vocational Qualifications’ at Level 2 and 3 were
assumed to be workplace based.
34 This approach is in line with Green Book methodology, which applies a discount rate of 3.5% p.a. for the first
thirty years.

105
Average salary data for each group of learners (ranging from £14,590 for Functional Skills,
English and Maths learners to £20,738 for those on HE programmes) was taken from ONS
data on the median salary for UK workers holding different levels of qualification.
Estimating added value
As ULF is primarily a brokerage activity, focused on encouraging people to take up learning
opportunities, it was important to recognise that some of this learning would have taken
place without ULF/ULR support. To derive an estimate of the value added through the ULF
and the counter-factual (i.e. the proportion of learners who would have participated in
learning without the support of their union), we used the scale shown in Table 35, working on
the assumption that 80% of learners who said that their union had been ‘Slightly important’
to their learning would have participated in learning without union support, compared to just
20% of those who said that their union had been ‘Extremely important’. This approach
results in an estimate that 64% of the English, Maths and Functional skills learning was
attributable to the ULF support, compared to 49% of Higher Education and 46% of CPD.
Table 35: Proportion of learners who would have participated in learning without
support from their ULF project.
As these assumptions about the value added have a considerable impact on the overall
estimate of the economic impact of ULF, they are subjected to a sensitivity analysis,
described below.
Return on investment
In order to estimate the Return on ULF investment, we calculated the cost of delivering the
learning that results from ULF funded brokerage activities to the £14.15m investment in the
ULF.
The following methods / sources were used to estimate the cost to government of delivering
each type of learning.
Functional Skills, Level 2, Level 3 vocational qualifications & FE Programmes
In the absence of data on the proportion of union learners studying for Awards (1 to
12 credits), Certificates (13 to 36 credits) or Diplomas (37 to 370), we assumed that
this would be in line with the overall proportion of adults studying for each of these
How important has your union been in
supporting your learning?
Probablity of learning without
ULF Support
Extremely important 20%
Very important 40%
Moderately important 60%
Slightly important 80%
Not at all important 100%

106
sized qualifications. Data on this was drawn from the Skills Funding Agency (SFA)
data cube. An average cost for an Award, Certificate and Diploma was then
calculated using data drawn from SFA Simplified Funding Rates database for
2014/15. As funding rates vary from sector to sector, we derived an average cost per
qualification at each level and size and used this as a basis for producing a weighted
average cost (adjusted for the proportion of learners likely to be studying for Awards,
Diplomas and Certificates) for each level of qualification.
ICT Learning
We used a similar approach to that described, although this was simplified by the fact
that there is no variation in funding rate by sector. As the focus is on ICT User
qualifications (as opposed to ICT for professionals) an assumption was made that
those studying at Level 1 were divided equally between those studying for an Award
and a Certificate, while all those studying at Level 2 or Level 3 are studying for
Certificates. The specific SFA funding rate for Online Basics was used for that
course.
Training to be a ULR
SFA funding rates are available for ULR training. The cost of Stage 1 ULR Training is
based on the SFA Funding values for the Certificate for Trade Union
Representatives. Stage 2 is based on average values of a range of Certificates and
Diplomas, e.g. in employment law, organising and recruiting etc.
Apprenticeships
BIS Research Paper No. 77 Evaluation of Apprenticeships (BIS, 2012ii) provides a
schedule of costs per Apprenticeship delivered at Intermediate and Advanced level
by Sector Subject area. As we do not have data on the sectors in which ULF
supported Apprentices are working, we have used 2013/14 data from the Statistical
First Release35 on the number of learners nationally starting Intermediate and
Advanced Apprenticeship in each sector. This allows us to produce a weighted
average cost per Apprenticeship. Discussions with the SFA confirm that the
Apprenticeship funding methodology has not changed substantially since 2012, when
BIS RP No. 77 was published. An assumed rate of inflation of 5% has however been
added to the cost per Apprenticeship.
Developmental / informal Learning
The average cost is derived from the SFA Funding Statement for 2013 – 2016. This
provides an annual budget for Community Learning and a target for the number of
learners to be supported annually. As courses tend to be completed within the year
and following discussions with the SFA, a unit cost per course has been derived from
this data.
35
This is the last year for which full data is available.

107
Higher Education
The cost to the exchequer is based on data for the annual average tuition fee
charged by Higher Education Institutions (£8,170), reduced to take account of the
proportion that is likely to be funded by Government. Latest estimates suggest that
50% of student loans for higher education will not be repaid36.
Short Courses and continuing professional development
The cost of delivering short courses and CPD has been based on values for
vocational qualifications factored down to 20% of the overall cost, to account for the
small qualification size and lower inferred benefit.
The total cost of delivering ULF instigated training (of all the forms listed above) is estimated
to be £86m.
Productivity Foregone
When estimating the economic impact of learning and return on investment, it is important to
include an estimation of productivity foregone due to employees taking time out of work to
take part in learning.
We have calculated productivity foregone on the basis of the average number of guided
learning hours required to acquire qualifications at different levels (mainly taken from the
SFA Funding Rates Database) multiplied by the average hourly wage of people with different
qualification levels. In the absence of precise data, the number of learning hours per
qualification type is based on the average number of credits for all Awards, Certificates and
Diplomas at each (NVQ) level, weighted by the proportion of all learners nationally working
towards each size of qualification. It is important, however, to note a considerable proportion
of union learning takes place outside working hours, in the evenings, lunch-breaks and
community learning centres. Therefore, in the absence of precise information, we have
estimated that 50% of union learning requires staff to take time out of their normal working
duties, and factored down the outcome for productivity foregone by this amount.
Returns to employers
Research suggests that raising the proportion of workers who are trained by 1 percentage
point (from 10% to 11% for example) is associated with an increase in value added per
worker of 0.6 %, and an increase in wages of about 0.3% (Dearden et al, 2005). The
inference is that the benefits of training accrue relatively equally to employers and their
employees. This finding, that the total productivity gain from training is roughly double the
growth in earnings experienced by individuals is factored into the impact model, by including
a net productivity benefit to employers equal to the wage premia experienced by individuals.
However, as productivity foregone is a cost that falls upon employers, employee wages lost
while in training are subtracted before arriving at a final estimate of the return to employers.
36
In 2014, The Guardian was reporting that the ‘Resource and Accounting Budgeting Charge’ on HE Loans had risen to 48.6%. A 50% figure is used for simplicity. http://www.theguardian.com/education/2014/mar/21/student-fees-policy-costing-more .

108
Returns to the Exchequer
The exchequer benefits from learning in many ways, including through the positive impacts
on health, reduced crime and increased civic participation explored in the previous chapter.
While these benefits are important, they are impossible to model with any reliability and are
therefore discounted from the impact model.
There are, however, estimable benefits to the Exchequer, in the form of higher:
1. Income Tax receipts on increased individual earnings above £10,600 threshold, at a
rate of 20%. Within our model we have deflated this to 15%, on the basis that 25% of
union learners will continue to earn below £10,600 per annum37.
2. National Insurance contributions on increased individual earnings at 12% on earnings
of £153 to £815 per week.
3. VAT receipts, estimated at a rate of 9.7%, due to the exclusion of non-VAT’able
items such as food, on the marginal propensity to consume due to increased income,
which is calculated at 64% in line with the methodology outlined in BIS 2011ii.
4. Employer National Insurance contributions on increased individual wages at 13.8%
on earnings above £156.
The Exchequer also profits from reduced benefit and welfare payments, resulting from
people with higher skills being more likely to be in employment and from reduced
dependency on in-work benefits as a result of increased wages. Unfortunately these factors
are too complex for straight-forward modelling and are therefore discounted from our
estimate.
Normally, estimations of the returns to the Exchequer from learning would include an
estimation of tax forgone due to learners being out of the labour market during learning.
However, as very few union learners leave employment when taking up learning
opportunities we have discounted this cost to the Exchequer.
On this basis of this simple model, the return on to the exchequer generated by ULF Round
15 is £2.40 per £1.00 invested, as shown in Table 36 below.
Table 36: Estimate of return to the exchequer
37
Data from the Annual Survey on Hours and Earnings suggests that around 16% of people earn less than £10,000 per annum. We have increased this to 25% to take account of the fact that Union Learning supports people who tend to be less well paid than average. The proportion of union learners working part-time, who are more likely not to pay income tax, is broadly in line with the average for all UK workers.
Increase in
individual
earnings
% to
Exchequer
Benefit to
Exchequer
Income Tax on raised individual earnings £580,000,000 15% £87,000,000
National Insurance on raised individual earnings £580,000,000 12% £69,600,000
VAT receipts on raised individual earnings (post tax) £371,200,000 9.7% £36,000,000
Employer N.I. contributions on raised individual earnings £429,000,000 13.8% £59,200,000
Return to Exchequer £251,800,000
Rate of Return £2.5
Gross Return / Investment 2.5

109
Reliability checks
Given the uncertainties inherent within these estimates, we have checked our results by
running a secondary analysis, using CE / IER’s calculation of the net present value (NPV) of
attaining qualifications at different levels. NPV is the net benefit derived from raising
qualification levels, to all parties, less the costs associated with undertaking the
qualification38. NPV can be estimated on the basis of “learner starts”, allowing us to produce
an estimate of impact that does not rely on survey evidence, apart from the data on the
proportion gaining higher levels or lower / the same levels of qualifications and our
calculation of the counter-factual. Using this approach, the estimated impact of ULF Round
15 activity is £1.18bn. This figure is around 45% above the result of our impact model.
One reason for this difference will be that the NPV values are calculated on the basis of a
much younger cohort of learners. On the basis of our survey results, we have estimated the
average age of union learners to be 44. The maturity of learners allows less time for the
benefits to accrue, even when discounted over time.
A further check of our estimates was also carried out using the findings set out in BIS
Research Paper No. 53 examining the Returns to Intermediate and Low Level Vocational
Qualifications (Conlon et al)39. This report provides estimates of the earnings and
employment impacts of gaining Level 2 and Level 3 qualifications, with premia provided for
different types of qualifications at these levels (BTEC, City & Guilds & NVQs). Although we
do not have information on the proportion of Union Learners who achieved BTECs, City &
Guilds or NVQs at Level 2 or Level 3, we can use this data to create high and low end
values that can be used as a basis for a further check.
Using the data in Conlon et al, the combined wage and employment impact of ULF
supported learning for Level 2 and 3 qualifications might be expected to be between £342
million and £687 million. However, when we isolate Level 2 and Level 3 learning and look
solely at the wage and employment impact of ULF Round 15 (not productivity) our model
generates an estimate at £288 million, a figure around 16% below the bottom end of the
range. Given the older than average age of union learners, this result was not unexpected
and is consistent with the previous suggestion, that our estimates err on the side of caution.
Sensitivity analysis
As a further check, we conducted a sensitivity analysis to assess the impact that a 20%
change (positive and negative) in our calculation of the value added by ULF Round 15 would
have on our estimates of both impact and return on investment.
Currently the value added by ULF Round 15 (i.e. the proportion of learning presumed to
have taken place only as a result of the intervention) ranges from 64% for functional skills
learning to 49% for CPD.
38
NPV ranges from £112,000 per attainment of a Level 2 Apprenticeship to £25,000 for developmental learning.
39 The values in this report are those set out within New Economy Unit Costs Database, which is being promoted by the What
Works Centre for Local Economic Development as a basis for impact estimation.

110
As would be expected, adjusting the “deadweight” estimate40 has a large impact on our
overall economic impact estimate, but only a marginal impact on our estimate of the return
on investment. This is because the investment only includes the delivery costs of learning
that is triggered as a result of ULF Round 15 activities. This variable cost, which dwarfs the
fixed cost of investment in ULF Round 15, rises and falls within the sensitivity analysis in line
with the return. The effect of adjusting both the cost and the benefit means that the rate of
return on ULF investment remains relatively static, despite the overall economic impact
changing significantly, as shown in Table 37.
Table 37: Sensitivity analysis – added value
-20% No change +20%
Economic Impact £795 million £1,025 million £1,260 million
Return on investment (per £1) £9.60 £10.25 £10.70
40
The proportion of learning that would have happened without union support

111
Calculation Source
Number of ULF Learners a ULF Round 15 Final Claims
% completing course b Union Learning Survey
Number completing coursec =
(a x b)Calculated
% Gaining a Higher qual d Union Learning Survey
% Gaining Same or Lower qual e Union Learning Survey
Number of learners gaining Higher qualificationsf =
(c x d)Calculated
Number of learners gaining the same or lower qualificationsg =
(c x e)Calculated
Number of years learners remain in Labour market h Union Learning Survey
Wage Premia for those gaining higher qualifications (%) iCE/IER in BIS Research Report
No. 38
Wage premia for those gaining same or lower Level
qualifications (%)j
CE/IER in BIS Research Report
No. 38
Proportion of qualification gained k Estimated
Average wage for learners studying each qualification type l ONS / ASHE
Wage Premia per learner (£) - per annum - Learners gaining
higher qualifications
m =
(i x k x l)Calculated
Wage Premia per learner (£) - per annum - Learners gaining
same or lower qualifications
n =
(j x k x l)Calculated
Wage Premia per learner (£) - working life - Learners gaining
higher qualifications
o =
(h x m)Calculated
Wage Premia (£) - working life - Learners gaining same or
lower qualifications
p =
(h x n)Calculated
Wage Premia - all learners - working life - those gaining higher
quals
q =
(f x o)Calculated
Wage Premia - all learners - working life - those gaining same
or lower quals
r =
(g x p)Calculated
% of learning resulting from ULF intervention (i.e. adjustment
for counter-factual)s Union Learning Survey
Total impact of learning due to wage premiat =
(q + r) x sCalculated
Method used to estimate ULF Round 15 Wage Impact

112
Method used to estimate ULF Round 15 Employment Impact
Wage Impact and Employment Impact are then added. From this total, the delivery costs
(ULF Round 15 plus course delivery costs) and productivity foregone (Guided learning hours
x average wage) are subtracted, to generate an overall estimate of economic impact.
Calculation Source
Employment Premia for those gaining Higher Qualications uCE/IER in BIS Research Report
No. 38
Employment Premia for those gaining Same / Lower
Qualificationsv
CE/IER in BIS Research Report
No. 38
Average annual wage for learners studying each qualification
typew ONS / ASHE
Wage Premia per learner (£) - per annum - Learners gaining
higher qualifications
x =
(u x w) Calculated
Wage Premia per learner (£) -per annum - Learners gaining
same or lower qualifications
y =
(v x w) Calculated
Wage Premia per learner (£) - working life - Learners gaining
higher qualifications
z =
(h x x) Calculated
Wage Premia (£) - working life - Learners gaining same or
lower qualifications
aa =
(h x y) Calculated
Wage Premia - all learners - working life - those gaining higher
quals
ab =
(f x z) Calculated
Wage Premia - all learners - working life - those gaining same
or lower quals
ac =
(g x aa) Calculated
% progressing into learning due to ULF (i.e. taking counter-
factual into account)ad Union Learning Survey
Total impact of learning due to Employment premiaae =
(ab + ac) x adCalculated

113
ANNEX 3 – UNION LEARNING SURVEY QUESTIONNAIRE
Dear Learner,
Encouraging learning is an important activity for trades unions. In 2013, unions enabled
220,000 people to take part in a wide variety of learning programmes.
The University of Exeter has been commissioned by nine unions to conduct a survey
exploring the impact that union learning has on the lives of union members.
To do this we need your help.
We need you to take five minutes to tell us about your union learning and to reflect on your
motivations for learning, the skills you gained and the impact that acquiring these skills has
had on your life.
Please be reassured that your responses will be treated in strict confidence: all data will be
reported in summary form and it will not be possible to attribute your responses to you
personally.
If you have any questions about the survey or need help in completing it please contact
[email protected] at the University of Exeter.
Thank you for your help. Your response is important to us.
Ben Neild
University of Exeter

114
Union Learning Survey
Questionnaire
Part 1 - Your experience of learning
Q1. How many times have you taken part in union learning? Please put a cross (x) in one box only.
Once…………………………………………………………………… ☐
Twice…………………………………………………………………… ☐
Three times……………………………………………………………. ☐
Four to six times………………………………………………………. ☐
More than six times………………………………………................. ☐
Q2. What kind(s) of union learning have you taken part in? Please put a cross (x) in the box for each category of learning that you have taken part in.
Functional Skills – English & Maths……………….................................... ☐
ICT / Digital / Computing skills………………………………………………. ☐
ESOL – English as a Second or Other Language………………………. ☐
Informal learning for pleasure, leisure or personal development……… ☐
Short course or event to gain skills and knowledge related to your work
or professional development…………………………………..…………… ☐
Vocational course at a college or training provider that resulted in you
gaining a qualification (full or part) at Level 2 or Level 3…………….…... ☐
Higher education and training at Level 4 or above
at a university or college ……………………………….………………….. ☐
Training to be a union learning representative………………………… ☐
None of the above ………………………………………………………… ☐
Q3. When did you last take part in union learning? If you are currently on a course, please tick ‘Within the last month’. Tick one.
Within the last month………………………………………………… ☐
Between 1 and 6 months……………………………………………. ☐
Between 7 and 12 months ago……………………………………… ☐
Between 13 and 24 months ago……………………………………. ☐
Over 24 months ago…………………………………………………. ☐

115
Q4. What was your main motivation for taking part in union learning? ‘I wanted to...’ Please put a cross (x) in one box only.
perform better in my current job……………………………................ ☐
advance my career, gain promotion or a pay rise……….................. ☐
gain skills that would be useful in my every day or home life………. ☐
support people in my community or workplace………………………. ☐
do something fun / meet new people………………………………….. ☐
other………………………………………………………………………. ☐
Q5. Have you gained a qualification or part of a qualification as a result of taking part in union learning? Please put a cross (x) in one box only.
Yes (go to Q6) ………………………………………………………… ☐
No (go to Q7).……………………………………………………………. ☐
Not sure (go to Q7)……………………………………………………… ☐
Q6. If ‘Yes’, was this qualification at a higher level than other qualifications you already held before you first took part in union learning? Please put a cross (x) in one box only.
Yes………………………………………………………………………… ☐
No………………………………………………………………………….. ☐
Not sure…………………………………………………………………… ☐
Q7. Did you complete your most recent union learning course? Please put a cross (x) in one box only.
Yes, I completed the course…………………………………………. ☐
No, I left before it ended……………………………………………… ☐
Not applicable, the programme lasted one day or less…………… ☐
Q8. How likely is it that you will undertake any further learning in the next 2 years? Please put a cross (x) in one box only.
Very likely………………………………………………………………. ☐
Quite likely……………………………………………………………… ☐
Neither likely or unlikely………………………………………………. ☐
Not very likely…………………………………………………………. ☐
Not at all likely…………………………………………………………. ☐
Don’t know……………………………………………………………… ☐

116
Q9. How important has your union been in supporting your learning for example by providing support through a union learning representative or a learning centre or by setting up a learning agreement with an employer? Please put a cross (x) in one box only.
Extremely important…………………………………………………… ☐
Very important……………………………………………………..…. ☐
Moderately important………………………………………………… ☐
Slightly important……………………………………………………… ☐
Not at all important…………………………………………………… ☐
Part 2 – The impact of your learning
Q10. Would you say that union learning has helped you to develop any of the following? Please put a cross (x) in all boxes that apply.
Literacy / Reading or writing skills………………………………....... ☐
Numeracy / Maths skills………………………………………………. ☐
English language skills / ESOL………………………………………. ☐
Self-confidence / a sense of what I can achieve…………………… ☐
Coaching / mentoring skills…………………………………………… ☐
Planning and organising skills……………………………………….. ☐
Budgeting / Money management skills……………………………… ☐
ICT / Digital / Computing skills……………………………………….. ☐
Vocational / Practical skills / Professional development…………... ☐
Creative Skills………………………………………………………….. ☐
Other Skills……………………………………………………………... ☐
Q11. Has union learning given you any new skills that you might use in your current job? Please put a cross (x) in one box only.
Yes………………………………………………………………………. ☐
No……………………………………………………………………….. ☐
Not sure………………………………………………………………… ☐
Q12. Has union learning given you any new skills you might use to get a new job or to change into a different type of work? Please put a cross (x) in one box only.
Yes………………………………………………………………………. ☐
No………………………………………………………………………… ☐
Not sure…………………………………………………………………. ☐

117
Q13. Have any of the following things actually happened as a result of you participating in union learning? Please put a cross (x) in all boxes that apply.
You got a new job or changed to a different type of work……… ☐
You got a pay rise…………………………………………………… ☐
You gained promotion or greater responsibility in your job……… ☐
You were able to do your job better……………………………… ☐
You stayed in a job, which you might have lost………………… ☐
You feel more confident in progressing in your career………… ☐
You feel more confident about finding a job in the future……… ☐
You are more involved in your union……………………………… ☐
You became a Union Learning Representative………………… ☐
You are more involved in voluntary or community based activities ☐
None of the above……………………………………………………… ☐
Q14. To what extent do you agree or disagree that as a result of union learning you have… Please put a cross (x) in one box for each of the following
Neither Completely agree nor Completely agree Agree disagree Disagree disagree
Become more enthusiastic about learning
☐ ☐ ☐ ☐ ☐
Got a better idea about what you want to do in your life
☐ ☐ ☐ ☐ ☐
Become more confident in your abilities
☐ ☐ ☐ ☐ ☐
Improved your quality of life / well being
☐ ☐ ☐ ☐ ☐
Become more likely to undertake further learning and training
☐ ☐ ☐ ☐ ☐
Become a more capable parent e.g. better able to help my children with school work
☐ ☐ ☐ ☐ ☐
Become better able to organise, mentor and support other people
☐ ☐ ☐ ☐ ☐

118
Section 3 – About you
Q15. What is the name of your union? Please put a cross (x) in one box only.
BFAWU……………………………………………………………………. ☐
CWU………………………………………………………………………. ☐
GMB – Southern…………………………………………………………. ☐
GMB – Yorkshire and North Derbyshire………………………………. ☐
PCS……………………………………………………………………….. ☐
RCN……………………………………………………………………….. ☐
UCATT……………………………………………………………………. ☐
UNISON – Bridges to Learning………………………………………… ☐
UNISON – Inclusive Learning………………………………………….. ☐
Unite………………………………………………………………………. ☐
USDAW…………………………………………………………………… ☐
Other………………………………………………………………………. ☐
Unsure / prefer not to say……………………………………………….. ☐
Q16. Gender Please put a cross (x) in one box only.
Male……………………………………………………………………….. ☐
Female……………………………………………………………………. ☐
Prefer not to say…………………………………………………………. ☐
Q17. How old were you on your last birthday? Please put a cross (x) in one box only.
16 to 24…………………………………………………………………. ☐
25 to 49…………………………………………………………………. ☐
50 to 64…………………………………………………………………. ☐
65 or over………………………………………………………………. ☐
Prefer not to say……………………………………………………….. ☐
Q18. How would you describe your ethnic origin? Please put a cross (x) in one box only.
Asian or Asian British……………………………………………………. ☐
Black or Black British……………………………………………………. ☐
Chinese…………………………………………………………………… ☐
Mixed race……………………………………………………………… ☐
White British……………………………………………………………. ☐
White – Other…………………………………………………………….. ☐
Other (please specify)…………………………………………………… ☐
Prefer not to say……………………………………………………….. ☐

119
Q19. Is English your first language? Please put a cross (x) in one box only.
Yes…………………………………………………………………………. ☐
No………………………………………………………………………….. ☐
Prefer not to say………………………………………………………….. ☐
Q20. Do you consider yourself to have a disability? Please put a cross (x) in one box only.
Yes………………………………………………………………………… ☐
No………………………………………………………………………….. ☐
Prefer not to say……………………………………………………….. ☐
Q21. Which of the following best describes the main thing you are doing now? Please put a cross (x) in one box only.
Employed full-time……………………………………………………….. ☐
Employed part-time……………………………………………………… ☐
Self-employed……………………………………………………………. ☐
Not employed and looking for work……………………………………. ☐
Not employed and not looking for work……………………………….. ☐
Retired……………………………………………………………………. ☐
Q22. If you are employed are you… Please put a cross (x) in all boxes that apply.
Employed on a fixed term or temporary contract………………….. ☐
Employed through an agency……………………………………….. ☐
In a permanent job…………..……………………………………….. ☐
Prefer not to say……………………………………………………….. ☐
Q23. Are you currently claiming any income-related state benefits or tax credits? Please put a cross (x) in one box only.
Yes………………………………………………………………………… ☐
No…………………………………………………………………………. ☐
Not sure / prefer not to say……………………………………………… ☐

120
Q24. What is the highest level of qualification that you hold? Please put a cross (x) in all boxes that apply.
Entry and Level 1 qualifications, NVQ Level 1, Pre-Apprenticeship (Level 1),
BTEC Level 1, Functional skills, English or Maths at Level 1………………….... ☐
Level 2, GCSEs A-C, BTEC diploma, NVQ Level 2, Intermediate
Apprenticeship, Functional skills, English or Maths at Level 2…………………… ☐
Level 3, A/AS Levels, BTEC National, NVQ Level 3…………………………….… ☐
Level 4, Degree Year 1, BTEC higher National Certificate, NVQ Level 4,
Higher Apprenticeship……………………………………………….…………..…… ☐
Level 5, Degree Year 2, BTEC Higher National Diploma, NVQ Level 5……….. ☐
Other qualifications / overseas qualifications……………..………………………. ☐
None…………………………………………………………………..…………………
. ☐
Q25. Is there anything else that you would like to say about your union learning? Please write in the box below.
Would you be happy for your response to the previous question to be used anonymously in the report describing the findings of this survey and future publications? a) This survey?
Yes……………………………………………………………………....... ☐ No…………………………………………………………………………. ☐
b) Future Publications?
Yes……………………………………………………………………....... ☐ No…………………………………………………………………………. ☐

121
Would you be happy for the University of Exeter to contact you to discuss your responses
to this survey in more detail? For this purpose they would have access to your individual
responses to all of the questions in the survey and also the details you provide below, so
they can ask further questions to understand the reasons behind your responses. Please
put a cross (x) in one box only.
Yes………………………………………………………………………… ☐ No…………………………………………………………………………. ☐ If ‘yes’, please provide your contact details below. Name: …………………………………………………….…………………………..….…..
Address:………………………………………………………………………………………
………………………………………………………………………………………………….
………………………………………………………………………………………………….
Email:..........................................................................................................................
Telephone:..................................................................................................................
Thank you for taking the time to complete the survey. Please return in the envelope
provided as soon as possible or by Monday 15th December 2014 to BMG Research, Holt
Court, Heneage Street West, Birmingham Science Park Aston, B7 4AX. As a market
research agency BMG Research complies with the Market Research Society’s Code of
Conduct. This ensures that your replies will be treated confidentially. If you want to check
BMG Research is a genuine market research agency please call the Market Research
Society’s Freephone number – 0500 396 999 – Office hours only.

122
BIBLIOGRAPHY
Beaven, R., May-Gillings, M., Wilson, R., Bosworth, D., Joshi, S. Nitsch, S., (2011)
Measuring the Economic Impact of Further Education, BIS Research Paper Number 38,
March 2011.
BIS (2010), Skills for Sustainable Growth - Strategy Document, Full Report
https://www.gov.uk/government/uploads/system/uploads/attachment_data/file/32368/10-
1274-skills-for-sustainable-growth-strategy.pdf.
BIS (2011i) New Challenges, New Chances Further Education and Skills System Reform
Plan: building a World Class Skills System, Department for Business, Innovation & Skills,
2011.
https://www.gov.uk/government/consultations/new-challenges-new-chances-next-steps-in-
implementing-the-further-education-reform-programme.
BIS (2012), Valuing adult learning: comparing wellbeing valuation and contingent valuation,
Department for Business, Innovation & Skills, November 2012
https://www.gov.uk/government/publications/valuing-adult-learning-comparing-wellbeing-
valuation-and-contingent-valuation.
BIS (2012ii), Evaluation of Apprenticeships: Employers Department for Business, Innovation
& Skills, May 2012
https://www.gov.uk/government/uploads/system/uploads/attachment_data/file/32305/12-813-
evaluation-of-apprenticeships-employers.pdf.
BIS (2013) Community Learning Learner Survey Report, BIS Research Paper Number 108,
March 2013.
https://www.gov.uk/government/publications/community-learning-learner-survey-report-
march-2013 .
BIS / CE / IER (2013) Review of the Economic Benefits of Training and Qualifications, as shown by Research based on Cross-Sectional and Administrative Data, Cambridge Econometrics & Warwick Institute for Employment Research, BIS Research Paper No. 105, February 2013.
BIS / DfE (2013), Rigour and Responsiveness in Skills
https://www.gov.uk/government/uploads/system/uploads/attachment_data/file/186830/13-
960-rigour-and-responsiveness-in-skills-amended.pdf.
BIS / London Economics (2011i), Returns to Intermediate and Low Level Vocational
Qualifications, BIS Research Paper No. 53.

123
BIS / London Economics (2011ii),The Long Term Effect of Vocational Qualifications on Labour Market Outcomes, BIS Research Paper No. 47.
BIS / SFA (2014), Skills Funding Statement 2013 – 2016
https://www.gov.uk/government/uploads/system/uploads/attachment_data/file/278529/bis-
14-p172a-skills-funding-statement-2013-2016.pdf.
Campbell, M., Garrett, R., & Mason, G. (2010) The Value of Skills: An Evidence Review,
UKCES, July 2010.
Conlon, G. Patrignani, P and Chapman, J. (2011) Returns to Intermediate and Low Level
Vocational Qualifications, BIS Research Paper Number 53, September 2011.
Cowen, G., Clements, M. and Cutter, J. (2000) Union Learning Representatives Survey,
TUC / Adapt / Ufi Learning Services Evaluation Report (1). Leeds: York Consulting.
Dearden, L. et al (2005),The impact of Training on Productivity and Wages: Evidence from
British Panel Data, Centre for Economic Performance, Discussion paper 674.
DfEE (1998), The Learning Age: a renaissance for a new Britain
http://dera.ioe.ac.uk/15191/6/9780101379021_Redacted.pdf.
DfEE (2001) Consultation on the Impact of Statutory Recognition for Union Learning
Representatives; URL (consulted 14 May 2004).
Dundon, T., Eva, D. (1998) “Trade unions and bargaining for skills”, Employee Relations,
Vol. 20 Iss: 1, pp.57 – 72.
Feinstein, L. (2002 i) Quantitative Estimates of the social benefits of learning: Health
(Depression and Obesity), Centre for Research on the Wider Benefits of Learning, 2002.
Feinstein, L. (2002 ii). Quantitative Estimates of the Social Benefits of Learning: Crime,
Centre for Research on the Wider Benefits of Learning, Research Report No. 5, 2002.
Feinstein, L. et al (2008) The social and personal benefits of learning: A summary of key
research findings, Institute of Education: London, 2008.
Fisher, J. (2005) Bread on the Waters: A History of TGWU education 1922-2000, Lawrence
& Wishart.
Government Office for Science (2008), Mental Capital and Wellbeing: Making the most of
ourselves in the 21st century
https://www.gov.uk/government/uploads/system/uploads/attachment_data/file/292450/menta
l-capital-wellbeing-report.pdf.

124
Harding, C., Simone, A., Evans, L., Joyce, L., Stockley, R., Peters, M. (2013) Community
Learning Learner Survey Report, BIS, March 2013.
Healy, T., Côté, S., (2001) Wellbeing of Nations, OECD 2001.
Heseltine, M. (2012) No stone unturned in pursuit of growth
https://www.gov.uk/government/uploads/system/uploads/attachment_data/file/34648/12-
1213-no-stone-unturned-in-pursuit-of-growth.pdf.
Keeley, B. (2007) Human Capital: How what you know shapes your life, OECD Insights
February 2007.
McIntosh, S., (2009), The economic value of intermediate vocational education and
qualifications, UK Commission for Employment and Skills Evidence Report 11, December
2009.
McIntosh, S. (2010) The Value of Skills: An evidence review submitted to the UK
Commission for Employment and Skill, UKCES.
Miller, L., Stuart, M., Higgins, T., Cook, H., Broughton, A (2012) Evaluation of the Union
Learning Fund: learners, workplace cases and extension to the non-union sector, Institute
for Employment Studies and Leeds University Business School for the Department for
Business, Innovation and Skills.
NIACE (2010) Lifelong Learning: Contributing to wellbeing and prosperity, Spending Review
Briefing 2010, National Institute of Adult Continuing Education, 2010.
OECD (2001), The Well-being of Nations: The role of Human and Social Capital, Education
and Skills, Organisation for Economic Co-operation and Development, 2001
http://www.oecd.org/site/worldforum/33703702.pdf.
ONS (2011), Poorest Households Spending More on VATable Items than in 1986
http://www.ons.gov.uk/ons/dcp171776_239565.pdf.
Oreopoulos, P. and K. Salvanes (2011) Priceless: The Nonpecuniary Benefits of
Schooling, Journal of Economics Perspectives, 25,1, 159-184.
Rainbird, H. (2005) ‘Assessing Partnership Approaches to Lifelong Learning: “A New and
Modern Role for the Trade Unions?", in M. Stuart and M. Martinez Lucio (eds) Partnership
and Modernisation in Employment Relations, pp. 46–62. London: Routledge.
Richard, D. (2012) The Richard Review of Apprenticeships
https://www.gov.uk/government/uploads/system/uploads/attachment_data/file/34708/richard-
review-full.pdf.

125
Sabates, R., Hammond, C., (2008) The Impact of Lifelong Learning on Happiness and
Well-being, Inquiry into the Future of Lifelong Learning, NIACE, January 2008.
Schuller, T., (2009) Crime and Lifelong Learning, Inquiry into the Future of Lifelong
Learning, Schuller, NIACE.
Stewart, I. (2011) Trade Unions – The Ghost in the UK Lifelong Learning System
http://www.strongerunions.org/wp-content/uploads/2011/06/trade-unions-ghost-in-lifelong-
learning-system.pdf.
Stuart, M. (2011) The context, content and impact of union learning agreements, Research
Paper CERIC / Unionlearn.
Stuart, M., Cook, H., Cutter, J., Winterton, J. (2010) Assessing the impact of union
learning and the Union Learning Fund: union and employer perspectives.
TUC (1992), Bargaining for Skills: A Call to Action, Trades Union Congress, September
1992.
UKCES (2010), The Value of Skills: An Evidence Review, Evidence Report 22, UK
Commission for Employment and Skills, July 2010.
Unionlearn (2012) Union Learning: Adding Value – An Evaluation of the Union Learning
Fund and Union Learn.
Wallis, A., Stuart, M., Greenwood, I. (2005) “Learners of the workplace unite!”: an empirical
examination of the UK trade union learning representative initiative Work Employment
Society 2005; 19; 283.
Wolf, A. (2011) Review of Vocational Education – The Wolf Report
https://www.gov.uk/government/uploads/system/uploads/attachment_data/file/180504/DFE-
00031-2011.pdf.