Uninterrupted Flow Reading Assignment: Chapter 5 … files/Uninterrupted Flow.pdf · Uninterrupted...
17
CIVL 3161 – Transportation Systems Engineering 1 Uninterrupted Flow Reading Assignment: Chapter 5 (sections 5.1-5.3) We are going to be discussing models of traffic flow and queuing for uninterrupted flow. 2 classifications of flow: Interrupted: Uninterrupted: Definitions : Flow (Q) – Volume (V) – Capacity (Q cap ) – Time mean speed - u = spot speed (arithmetic mean)
Transcript of Uninterrupted Flow Reading Assignment: Chapter 5 … files/Uninterrupted Flow.pdf · Uninterrupted...

CIVL 3161 – Transportation Systems Engineering 1
Uninterrupted Flow
Reading Assignment: Chapter 5 (sections 5.1-5.3) We are going to be discussing models of traffic flow and queuing for uninterrupted flow. 2 classifications of flow: Interrupted: Uninterrupted: Definitions: Flow (Q) – Volume (V) – Capacity (Qcap) – Time mean speed -
u = spot speed
(arithmetic mean)
CIVL 3161 – Transportation Systems Engineering 2
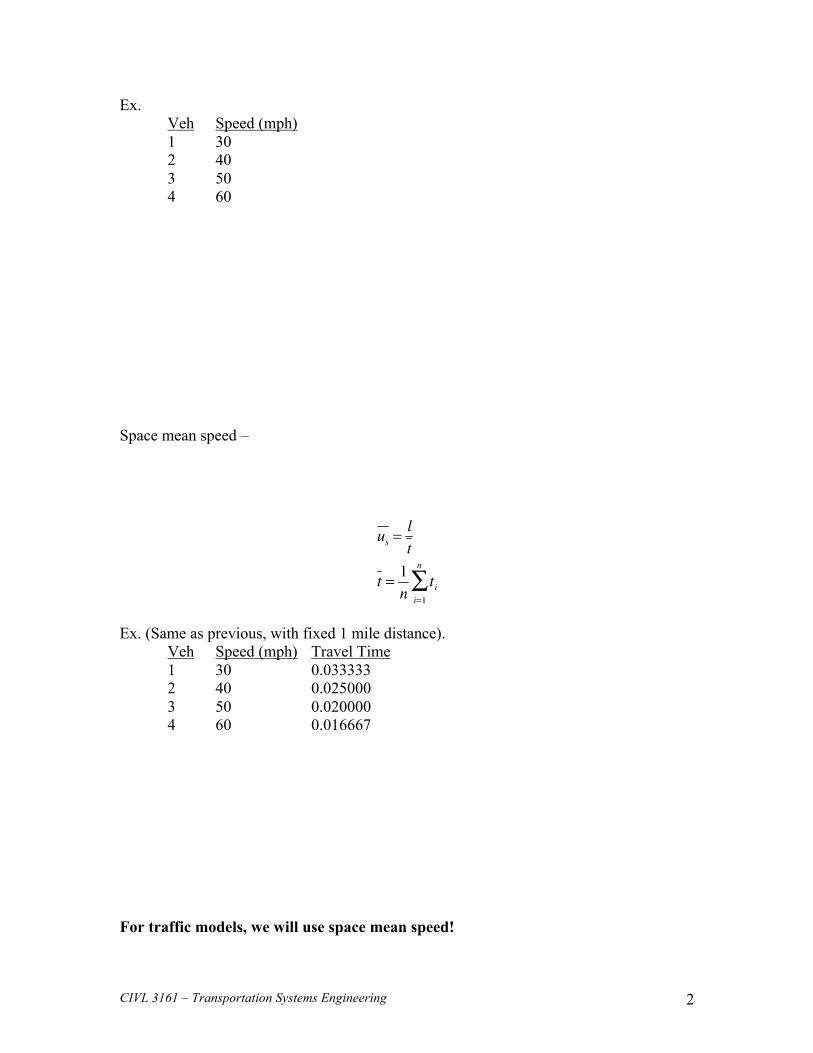
Ex. Veh Speed (mph) 1 30 2 40 3 50 4 60
Space mean speed –
Ex. (Same as previous, with fixed 1 mile distance). Veh Speed (mph) Travel Time 1 30 0.033333 2 40 0.025000 3 50 0.020000 4 60 0.016667 For traffic models, we will use space mean speed!

CIVL 3161 – Transportation Systems Engineering 3
Free speed (Uf) - Headway (h) – Space headway (s) – density (K) - If there are P vehicles in a section of roadway with length miles, then
veh/mi
jam density (Kj) - Basic Relationships:
****Make sure UNITS on Q and K match!!! (vph or vph/lane)
CIVL 3161 – Transportation Systems Engineering 4
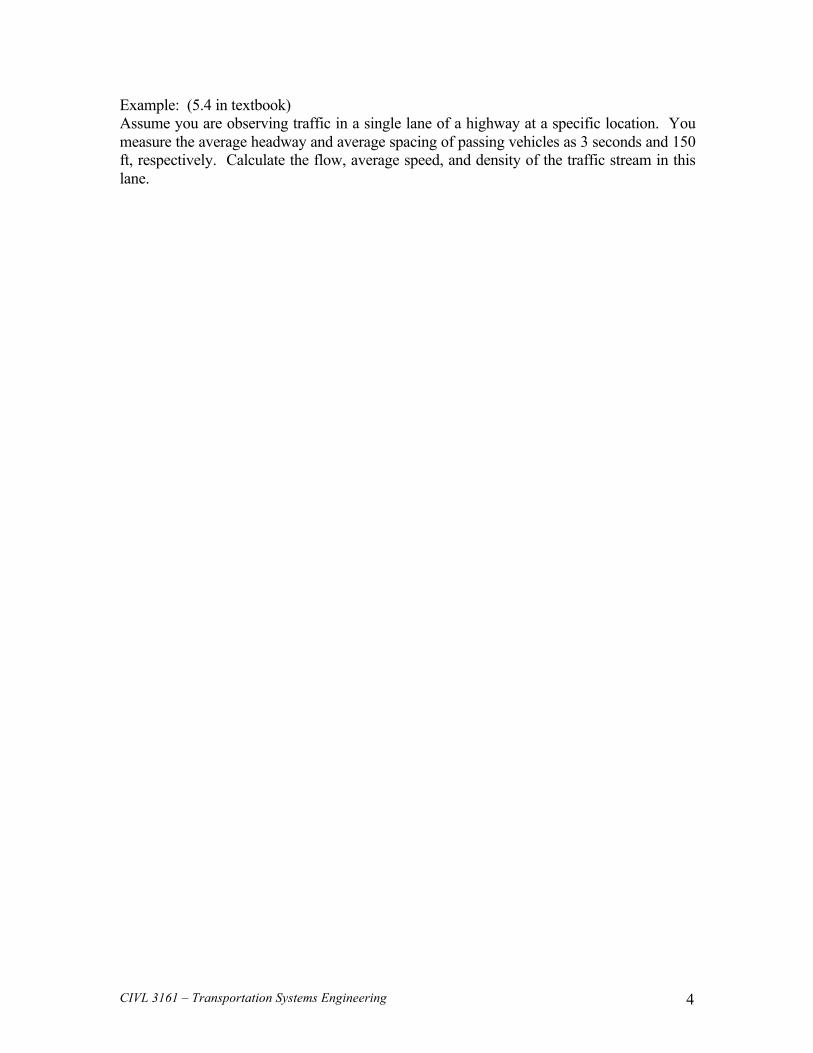
Example: (5.4 in textbook) Assume you are observing traffic in a single lane of a highway at a specific location. You measure the average headway and average spacing of passing vehicles as 3 seconds and 150 ft, respectively. Calculate the flow, average speed, and density of the traffic stream in this lane.

CIVL 3161 – Transportation Systems Engineering 5
Example: (5.2 in textbook) A section of highway has a speed-flow relationship of the form . It is known that at capacity (which is 2900 veh/h) the space-mean speed of traffic is 30 mph. Determine the speed when the flow is 1400 veh/h and the free-flow speed.
CIVL 3161 – Transportation Systems Engineering 6
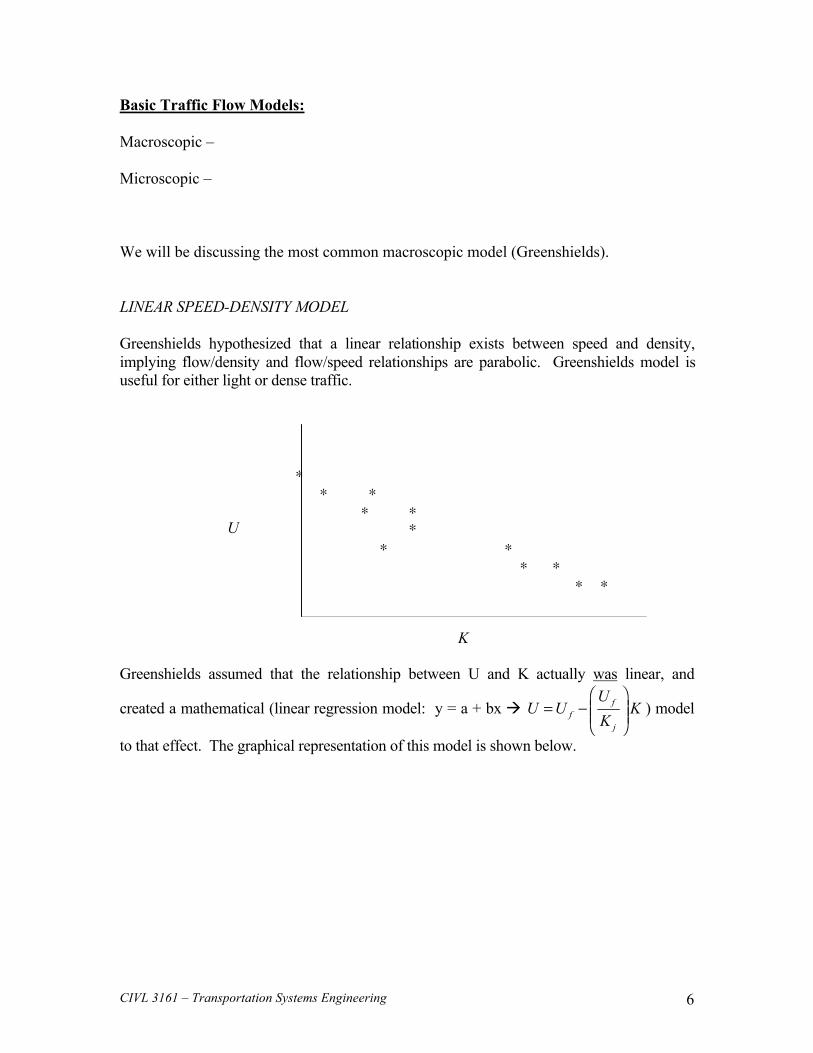
Basic Traffic Flow Models: Macroscopic – Microscopic – We will be discussing the most common macroscopic model (Greenshields). LINEAR SPEED-DENSITY MODEL Greenshields hypothesized that a linear relationship exists between speed and density, implying flow/density and flow/speed relationships are parabolic. Greenshields model is useful for either light or dense traffic. Greenshields assumed that the relationship between U and K actually was linear, and
created a mathematical (linear regression model: y = a + bx ) model
to that effect. The graphical representation of this model is shown below.

CIVL 3161 – Transportation Systems Engineering 7
Linear Speed-Density Model
The endpoints of this curve are determined by Uf and Kj.
This is the basic equation of the linear model. We can get another useful relationship out of this if we multiply both sides of the equation by K.
Since :
Divide the last equation by Uf.
Multiply both sides of this by Kj.
CIVL 3161 – Transportation Systems Engineering 8
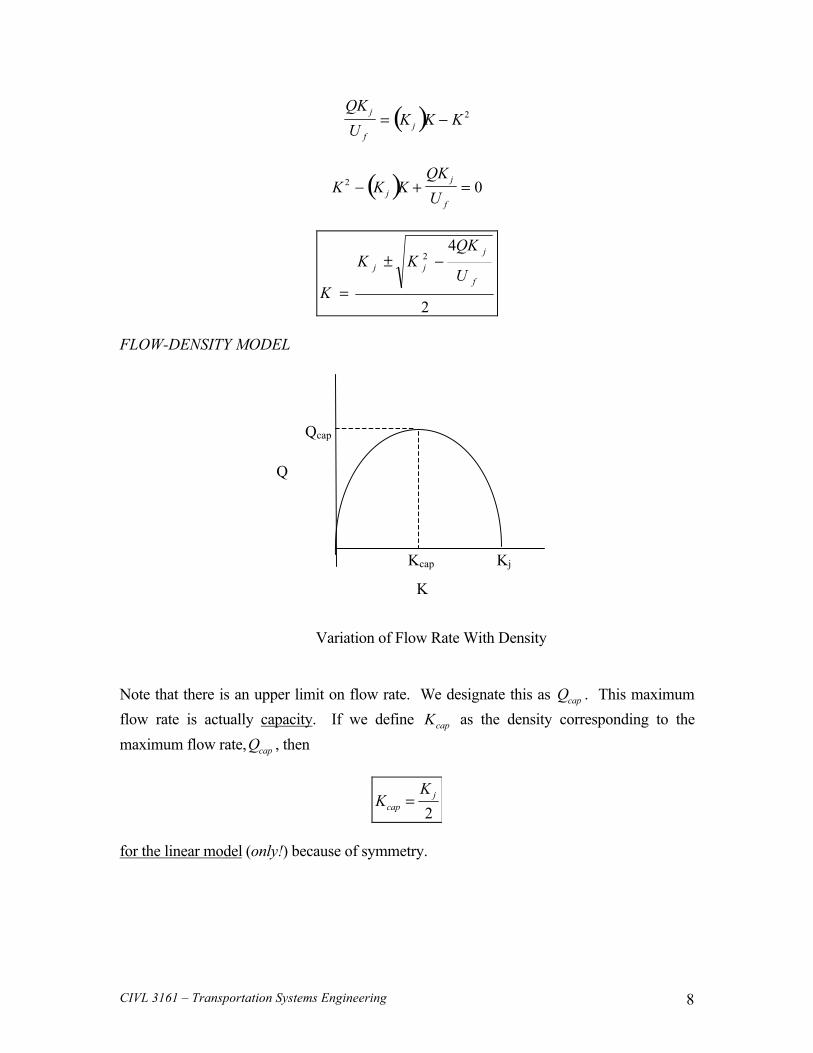
FLOW-DENSITY MODEL
Variation of Flow Rate With Density Note that there is an upper limit on flow rate. We designate this as . This maximum flow rate is actually capacity. If we define as the density corresponding to the maximum flow rate, , then
for the linear model (only!) because of symmetry.
K
Q
Kj
Qcap
Kcap

CIVL 3161 – Transportation Systems Engineering 9
SPEED-FLOW MODEL Just as we developed a quadratic equation for writing density as a function of , we can also develop one for space mean speed as a function of . It is as follows:
This, too, will be parabolic when plotted.
Variation of Speed With Flow Rate We note the existence of on this plot also. Defining to be the space mean speed at which capacity occurs, we see that
because of symmetry.
Q
U
Uf
Ucap
Qcap

CIVL 3161 – Transportation Systems Engineering 10
Making use of the expressions for and , we can use the relationship to get a simple equation for capacity, .
This can be shortened to:
Keep in mind that with the exception of , all of these equations are good for the linear speed-density model only! Example: Given the data set of speeds and densities attached, determine the linear regression model for the data set. Determine values of Uf, Kj, Qcap, Ucap, Kcap. How well does this model fit the data?
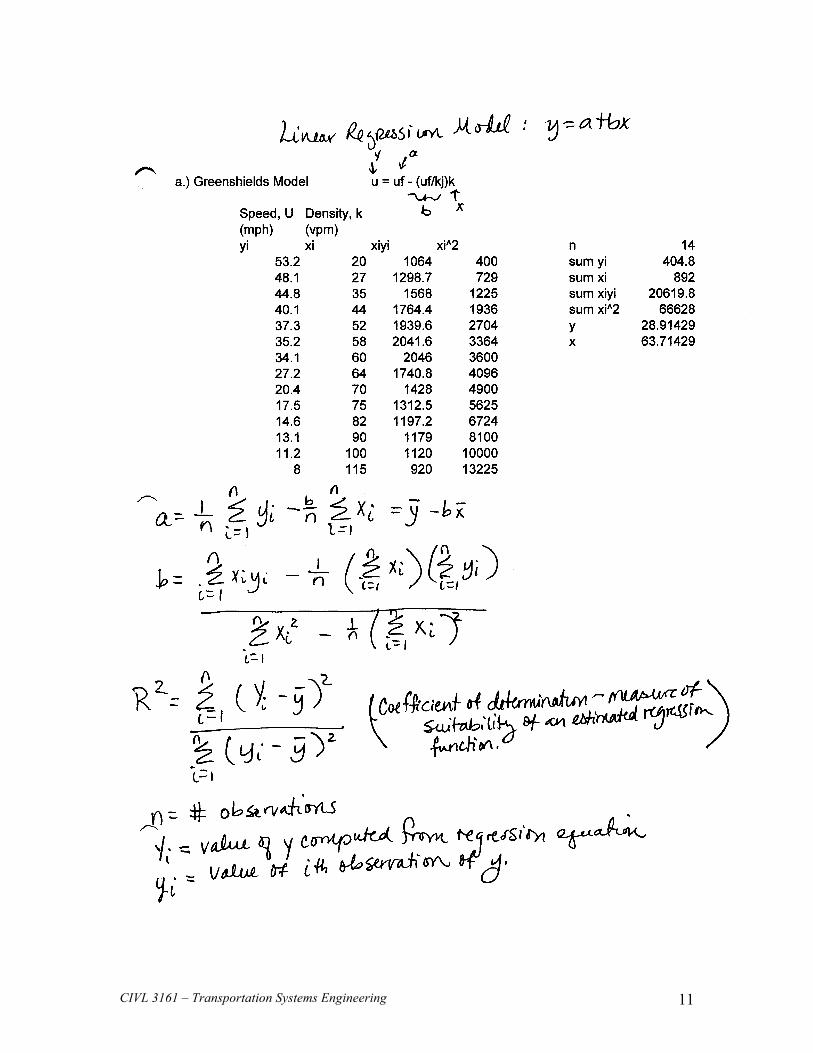
CIVL 3161 – Transportation Systems Engineering 11

CIVL 3161 – Transportation Systems Engineering 12

CIVL 3161 – Transportation Systems Engineering 13
Recap of Greenshields Formuals:
*Remember- these equations are valid for linear speed-density model only!!! Q = KU ***always true- basic equation of traffic flow. *The only time you use the (+) sign on density (and thus (–) on space mean speed) is when DEMAND EXCEEDS CAPACITY AND THE LOCATION IS IMMEDIATELY UPSTREAM OF A BOTTLENECK. The majority of the time we will use (-) for density and therefore (+) for space mean speed.
CIVL 3161 – Transportation Systems Engineering 14
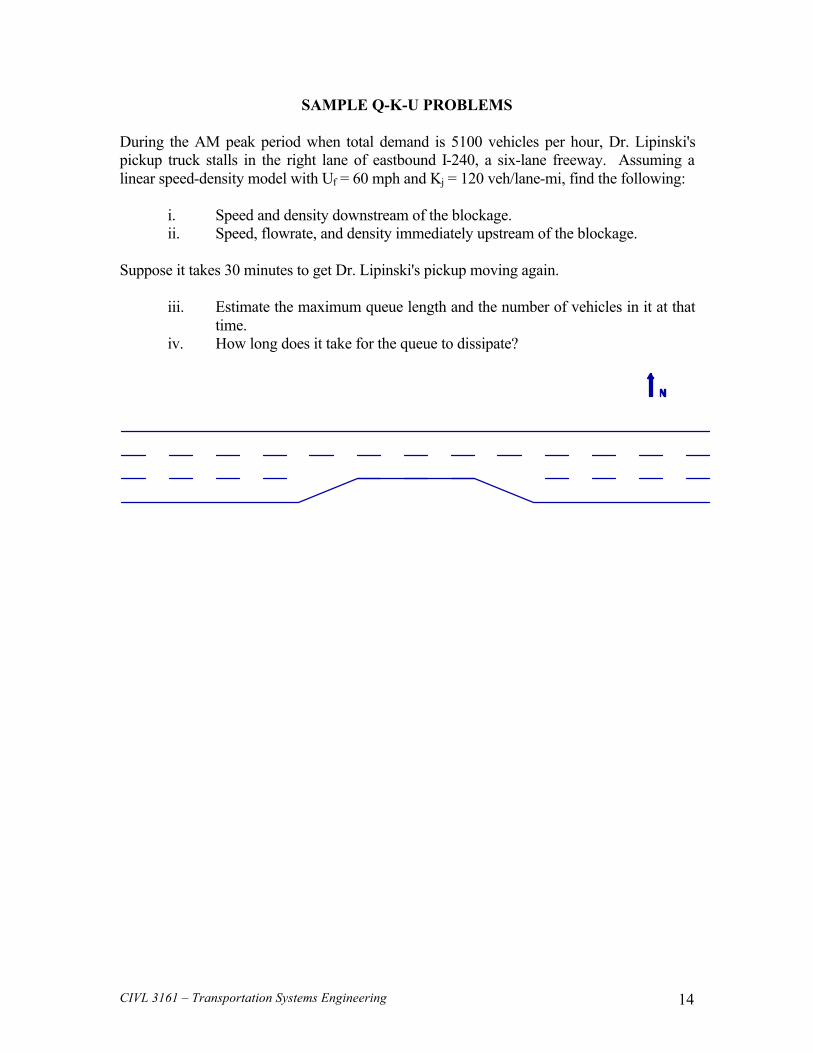
SAMPLE Q-K-U PROBLEMS During the AM peak period when total demand is 5100 vehicles per hour, Dr. Lipinski's pickup truck stalls in the right lane of eastbound I-240, a six-lane freeway. Assuming a linear speed-density model with Uf = 60 mph and Kj = 120 veh/lane-mi, find the following: i. Speed and density downstream of the blockage. ii. Speed, flowrate, and density immediately upstream of the blockage. Suppose it takes 30 minutes to get Dr. Lipinski's pickup moving again. iii. Estimate the maximum queue length and the number of vehicles in it at that
time. iv. How long does it take for the queue to dissipate?
CIVL 3161 – Transportation Systems Engineering 15

CIVL 3161 – Transportation Systems Engineering 16
Given: Uf = 60 mph Kj = 120 veh/mi-lane Total eastbound demand = 1200 vph (off peak), then: = 2500 vph (for 30 min. in peak), then:
= 1200 after peak a. Is this model realistic? b. What are the speeds upstream, at, and downstream of the lane reduction in the off-peak? c. What are the speeds a "long way" upstream, immediately upstream, at, and downstream of the lane reduction during the peak? d. If there is a queue at the end of the peak, how long is it? e. If there is a queue at the end of the peak, how long does it take for it to dissolve? f. How many vehicles experienced queueing?

CIVL 3161 – Transportation Systems Engineering 17