Unintentional Childhood Injuries in Kansas - KDHE · Kansas Injury Prevention and Disability...
74
Unintentional Childhood Injuries in Kansas August 2017
Transcript of Unintentional Childhood Injuries in Kansas - KDHE · Kansas Injury Prevention and Disability...
Unintentional Childhood Injuries in Kansas
August 2017

1
Report Preparation
Meagan Stabler, Ph.D., CHES
Advanced Epidemiologist
Kansas Injury Prevention and Disability Program
Bureau of Health Promotion, KDHE
Report Supervision
Ghazala Perveen, M.B.B.S, Ph.D., M.P.H
Director of Science and Surveillance/Health Officer II
Bureau of Health Promotion, KDHE
Lori Haskett
Director of Injury Prevention and Disability Program
Bureau of Health Promotion, KDHE
Contact Information
For additional information please contact:
Cherie Sage
Director of Safe Kids Kansas
Bureau of Health Promotion, KDHE
Daina Zolck
Program Coordinator KsVDRS
Bureau of Health Promotion, KDHE
Kansas Department of Health and Environment
1000 SW Jackson
STE 230
Topeka, KS 66612
Phone: (785) 291-3742
Safe Kids Worldwide website: https://www.safekids.org/
Safe Kids Kansas website: http://www.safekidskansas.org/
Project Funding
This report was supported by the cooperative agreement NB01OT009173-01-00,
funded by the Centers for Disease Control and Prevention. Its contents are solely the
responsibility of the authors and do not necessarily represent the official views of the
Centers for Disease Control and Prevention or the Department of Health and Human
Services.
Created August 2017

2
Table of Contents Executive Summary ........................................................................................................ 3
Introduction ..................................................................................................................... 6
Demographic Data .......................................................................................................... 7
Geographic Analysis .................................................................................................... 7
Race and Ethnicity ..................................................................................................... 11
Economic Makeup ..................................................................................................... 12
Mortality Data Summary ................................................................................................ 13
Hospital Discharge Data Summary ............................................................................... 15
Emergency Department Data Summary ........................................................................ 18
Childhood Unintentional Injury ...................................................................................... 21
Summary by Cause ....................................................................................................... 21
Suffocation ................................................................................................................. 22
Drowning Injury .......................................................................................................... 24
Falls Injury .................................................................................................................. 28
Fire and Burns ........................................................................................................... 32
Motor Vehicle Crash .................................................................................................. 36
Pedestrian injury ..................................................................................................... 41
Cycling Injury .......................................................................................................... 45
Poisoning injury .......................................................................................................... 50
Traumatic Brain Injury (TBI) ....................................................................................... 54
Appendix .......................................................................................................................... i
Analysis Notes .............................................................................................................. i
External Cause of Injury Matrix ....................................................................................vi
External Cause of Death Mortality Matrix .................................................................... vii
Detailed Causes: Morbidity ........................................................................................ viii
Detailed Causes: Death ............................................................................................... x
Database Information ...................................................................................................xi

3
Executive Summary The overarching purpose of this report is to reduce the burden of childhood injuries in
Kansas. This report provides information that can guide stakeholders and public health
professionals to keep kids safe from preventable injuries via targeted interventions.
This document contains an overview and brief summary of unintentional injuries among
Kansas children 0 to 19 years old. The three data sets used in this document are
Kansas Vital Statistics (mortality data), Kansas Hospital Discharge Database and the
Kansas Hospital Emergency Department Database*.
These databases vary with respect to injury severity. Cases captured in the Kansas
Vital Statistics database are considered the most severe, as they reflect fatal injuries.
The Kansas hospital discharge dataset is less severe because it contains information
on children that were admitted to the hospital for at least 24 hours. The emergency
department visit dataset is considered the least severe of the three databases because
it includes information on patients admitted to the emergency department that stayed for
less than 24 hours.
This report contains information on unintentional injuries among Kansas children 0 to 19
years old.
Key Findings:
Between 2010 and 2014, among Kansas children 0 to 19 years old, there were:
o 490 unintentional injury deaths,
o 5,077 unintentional injury hospital discharges and
o 306,473 unintentional injury emergency department visits.
Boys had higher unintentional injury rates for mortality, hospital discharge, and
emergency department visits compare to girls. This is true for all injuries with the
exception of motor vehicle crashes. Girls had significantly higher emergency
department visit rates due to motor vehicle crashes compared to boys (497.8 per
100,000 children (95% CI: 488.0-507.8) vs 380.8 per 100,000 children (95% CI:
372.5-389.3)). This was because boys sustained more severe injuries from motor
vehicle crashes and thus greatly outnumbered the girls in the hospital discharge and
death databases.
* Note: Federal and specialty hospitals in Kansas do not report their discharges and emergency department visits to
the Kansas Hospital Association. Not all nonfederal, short stay community or general hospitals in Kansas report their
emergency department visits or hospital discharge data to Kansas Hospital Association; therefore, these databases
do not include 100% of emergency department visits and hospital discharges in Kansas.

4
Kansas childhood unintentional injury rates were the highest in the following Kansas
Trauma Regions:
o Mortality: Southwest and Northwest
o Hospital discharge: Southeast and Southcentral
o Emergency department visit: Northcentral and Northwest
The top four causes of unintentional injury are:
o Deaths: 1) Motor vehicle crashes, 2) Suffocation, 3) Drowning and 4)
Poisoning
o Hospital discharges: 1) Motor vehicle crashes, 2) Falls, 3) Poisoning and 4)
Struck by or Against
o Emergency department visits: 1) Falls, 2) Struck by or Against, 3)
Natural/Environmental and 4) Cut or pierce
Childhood unintentional injury summary by cause:
o Suffocation: The highest rate of emergency department visits (EDV) due to
suffocation were among 1 to 4 year olds. This rate significantly decreased from
2010 to 2014.
o Drowning: The highest rate of EDV due to drowning were among 1 to 4 year
olds. This rate significantly increased from 2013 to 2014.
o Falls: The highest rate of hospital discharge (HD) due to falls were among
infants <1 year old and the highest rate of EDV due to falls were among 1 to 4
year olds. The EDV rate significantly decreased between 2010 and 2014.
o Fire/burn: The highest rate of HD and EDV due to fire or burns were among 1
to 4 year olds. The HD and EDV rate due to fire or burns did not significantly
change between 2010 and 2014.
o Motor vehicle crashes (MVC): The highest rate of death, HD and EDV due to
MVC were among 15 to 19 year olds. Rates from all three data bases
significantly decreased over time.
o *Pedestrian injuries: The highest rate of HD due to pedestrian injuries were
among 1 to 4 year olds and the highest rate of EDV due to pedestrian injuries
were among 15 to 19 year olds. This EDV rate significantly decreased from
2013 to 2014.
o *Cycling injuries: The highest rate of HD and EDV due to cycling injuries were
among 10 to 14 year olds. This EDV rate significantly decreased from 2010 to
2014.
o Poisoning: The highest rate of HD and EDV due to poisoning injuries were
among 1 to 4 year olds. Both of these rates significantly decreased between
2010 and 2014.
* Pedestrian and cycling injuries included those resulting from motor vehicle crashes as well as those not resulting from motor vehicle crashes. See Appendix viii and x for more details.

5
o Traumatic brain injuries (TBI): The highest rate of death due to TBI was among
15 to 19 year olds; most of these injuries were caused by MVC. The highest
rates of HD due to TBI were among infants <1 year old, because of falls, and
15 to 19 year olds because of MVC. The highest rate of EDV due to TBI were
among infants <1 year old and most of these injuries were due to falls.
Between 2010 and 2014 HD TBI rates significantly decreased while EDV rates
significantly increased.

6
Introduction Childhood unintentional injury remains the leading cause of death among Kansas
children 1 to 19 years old.1 It results in the highest years of potential life lost before the
age of 65 and fatal childhood unintentional injuries cost the state an estimated
$130,076,000 in 2014 alone.2 3
Unlike most cancers or other chronic diseases, injuries are predictable and preventable.
For example, wearing a helmet while biking can prevent a traumatic brain injury (TBI)
and possibly death. A correctly used car seat or seatbelt can keep a child from being
ejected during a car crash. Simple injury prevention strategies have the potential to
save children’s lives. Safe Kids Kansas is a network of partners and local coalitions
across the state that work to prevent childhood injury by implementing simple injury
prevention strategies. The lead agency for Safe Kids Kansas is the Kansas Department
of Health and Environment (KDHE). In the map below, counties with a current Safe Kids
Coalitions are highlighted in blue.
2017 Safe Kids Kansas Coalition map
1 CDC- Fatal Injury Reports- WISQARS (2016, December 21). Retrieved January 6, 2017, from https://webappa.cdc.gov/cgi-bin/broker.exe 2 CDC- Years of Potential Life Lost- WISQARS (2015, January 24). Retrieved January 6, 2017, from https://webappa.cdc.gov/sasweb/ncipc/ypll10.html 3 CDC- Cost of Injury Report- WISQARS (2014, September 18). Retrieved January 6, 2017, from
https://wisqars.cdc.gov:8443/costT/ProcessPart1SetupServlet

7
Demographic Data:
Geographic Analysis The population of children in Kansas is broken down by trauma regions in Table 1.
These regions as defined by the Kansas Trauma Program include Northcentral,
Northeast, Northwest, Southcentral, Southeast, and Southwest. The risk of unintentional
injury is known to be more common among younger populations. Therefore it is
important to know where the majority of children in Kansas live to help identify
populations who could most benefit from unintentional childhood injury prevention
efforts. This information is also foundational to understand how cause of unintentional
injury are related to a child’s location.
Table 1. Population of Kansas children by trauma region, Kansas 2015
Trauma Region Children 0-19 years old
Percent of children 0-19
years old
Northcentral 32,906 4.1%
Northeast 407,152 50.9%
Northwest 23,530 2.9%
Southcentral 240,557 30.0%
Southeast 47,708 6.0%
Southwest 48,757 6.1%
Total 800,610 100.0%
Source: 2015 Unbridged Vintage U.S. Census Bureau Data
Most children in Kansas 0 to 19 years old in 2015 resided in the Northeast and
Southcentral Trauma Regions. These regions contain a greater population of children,
as they contain larger cities and have a greater number of urban communities. The
Northeast Trauma Region encompasses Topeka, Lawrence, Kansas City, and Overland
Park and the Southcentral Trauma Region contains Wichita. Combined, these two
regions account for over 80% of Kansas children population 0 to 19 years old.

8
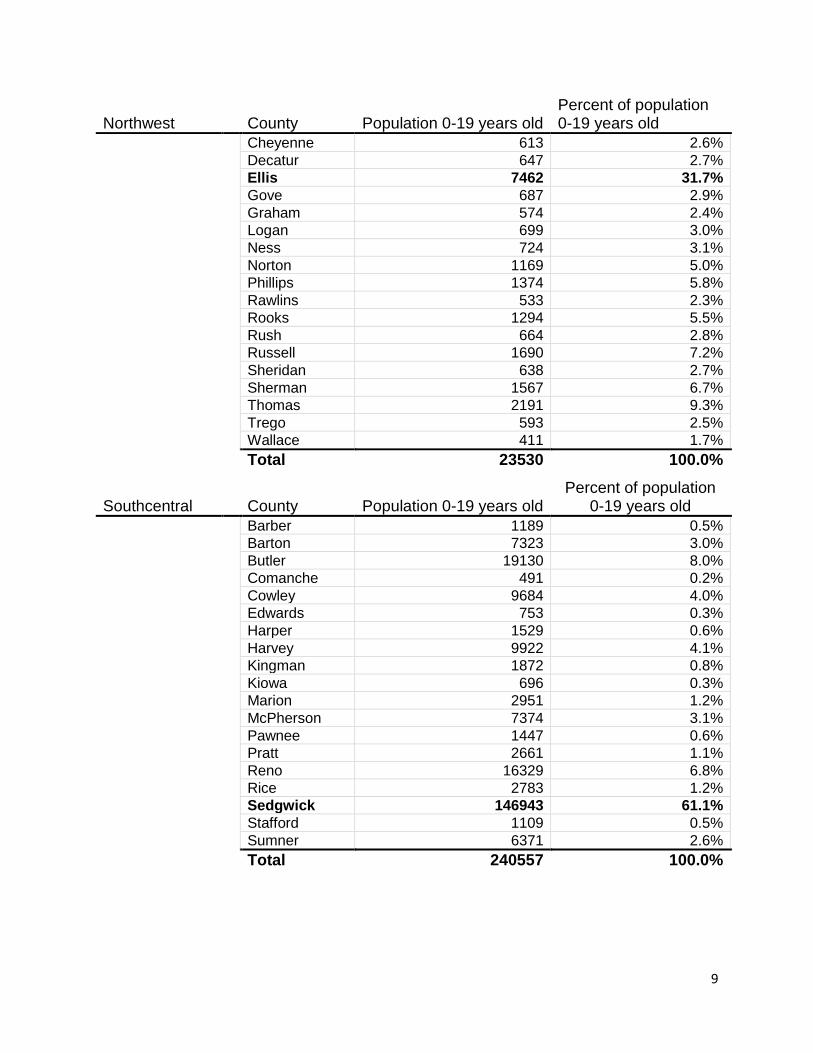
Table 2. Population of children 0-19 years old in Kansas by county and trauma region, Kansas 2015 Trauma Region
Northcentral County Population 0-19 years old Percent of population
0-19 years old
Clay 2143 6.5%
Cloud 2382 7.2%
Dickinson 5071 15.4%
Ellsworth 1254 3.8%
Jewell 619 1.9%
Lincoln 779 2.4%
Mitchell 1635 5.0%
Osborne 829 2.5%
Ottawa 1558 4.7%
Republic 1020 3.1%
Saline 14829 45.1%
Smith 787 2.4%
Total 32906 100.0%
Northeast County Population 0-19 years old Percent of population
0-19 years old
Anderson 2096 0.5%
Atchison 4630 1.1%
Brown 2669 0.7%
Chase 627 0.2%
Coffey 2060 0.5%
Doniphan 2079 0.5%
Douglas 29353 7.2%
Franklin 7027 1.7%
Geary 11942 2.9%
Jackson 3685 0.9%
Jefferson 4863 1.2%
Johnson 158360 38.9%
Leavenworth 20761 5.1%
Linn 2389 0.6%
Lyon 8798 2.2%
Marshall 2507 0.6%
Miami 8924 2.2%
Morris 1274 0.3%
Nemaha 2893 0.7%
Osage 4065 1.0%
Pottawatomie 7376 1.8%
Riley 18411 4.5%
Shawnee 47475 11.7%
Wabaunsee 1882 0.5%
Washington 1380 0.3%
Wyandotte 49626 12.2%
Total 407152 100.0%
9
Northwest County Population 0-19 years old Percent of population 0-19 years old
Cheyenne 613 2.6%
Decatur 647 2.7%
Ellis 7462 31.7%
Gove 687 2.9%
Graham 574 2.4%
Logan 699 3.0%
Ness 724 3.1%
Norton 1169 5.0%
Phillips 1374 5.8%
Rawlins 533 2.3%
Rooks 1294 5.5%
Rush 664 2.8%
Russell 1690 7.2%
Sheridan 638 2.7%
Sherman 1567 6.7%
Thomas 2191 9.3%
Trego 593 2.5%
Wallace 411 1.7%
Total 23530 100.0%
Southcentral County Population 0-19 years old Percent of population
0-19 years old
Barber 1189 0.5%
Barton 7323 3.0%
Butler 19130 8.0%
Comanche 491 0.2%
Cowley 9684 4.0%
Edwards 753 0.3%
Harper 1529 0.6%
Harvey 9922 4.1%
Kingman 1872 0.8%
Kiowa 696 0.3%
Marion 2951 1.2%
McPherson 7374 3.1%
Pawnee 1447 0.6%
Pratt 2661 1.1%
Reno 16329 6.8%
Rice 2783 1.2%
Sedgwick 146943 61.1%
Stafford 1109 0.5%
Sumner 6371 2.6%
Total 240557 100.0%

10
Southeast County Population 0-19 years old Percent of population
0-19 years old
Allen 3297 6.9%
Bourbon 4196 8.8%
Chautauqua 757 1.6%
Cherokee 5397 11.3%
Crawford 10236 21.5%
Elk 595 1.2%
Greenwood 1428 3.0%
Labette 5328 11.2%
Montgomery 8966 18.8%
Neosho 4515 9.5%
Wilson 2279 4.8%
Woodson 714 1.5%
Total 47708 100.0%
Southwest County Population 0-19 years old Percent of population
0-19 years old
Clark 579 1.2%
Finney 12731 26.1%
Ford 11403 23.4%
Grant 2711 5.6%
Gray 1967 4.0%
Greeley 366 0.8%
Hamilton 782 1.6%
Haskell 1307 2.7%
Hodgeman 453 0.9%
Kearny 1282 2.6%
Lane 406 0.8%
Meade 1285 2.6%
Morton 856 1.8%
Scott 1391 2.9%
Seward 8016 16.4%
Stanton 629 1.3%
Stevens 1958 4.0%
Wichita 635 1.3%
Total 48757 100.0%
Source: 2015 Unbridged Vintage U.S. Census Bureau Data
11
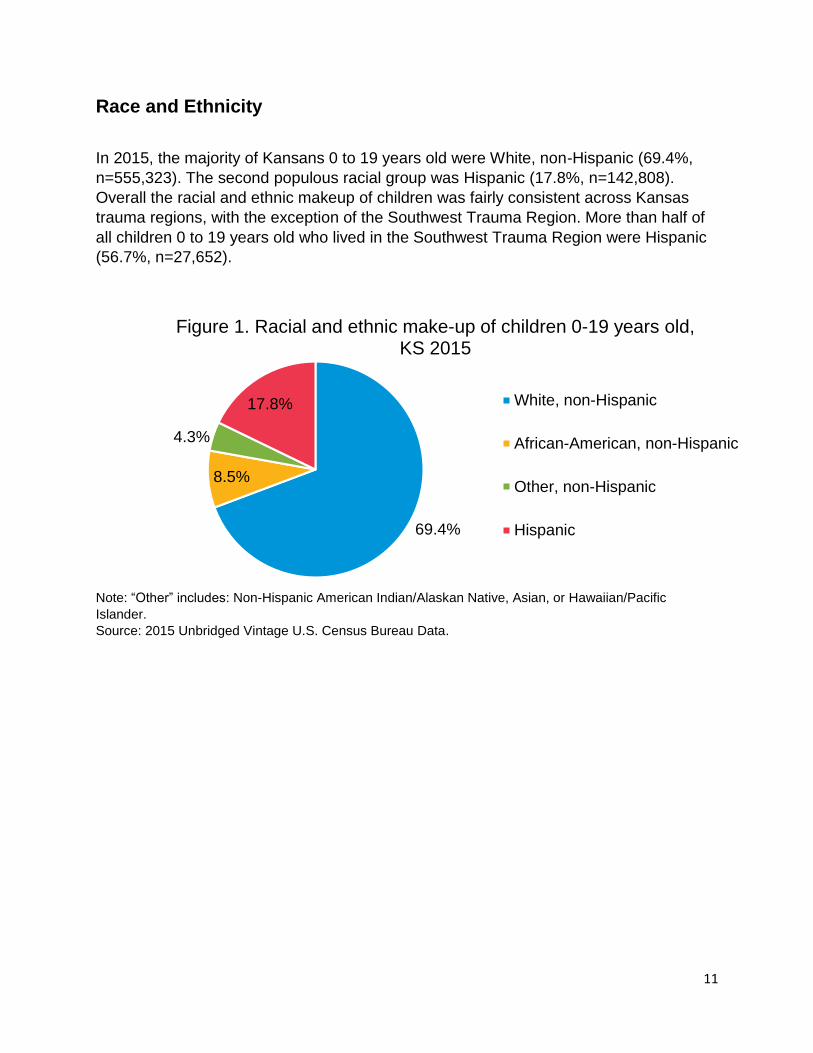
Race and Ethnicity
In 2015, the majority of Kansans 0 to 19 years old were White, non-Hispanic (69.4%,
n=555,323). The second populous racial group was Hispanic (17.8%, n=142,808).
Overall the racial and ethnic makeup of children was fairly consistent across Kansas
trauma regions, with the exception of the Southwest Trauma Region. More than half of
all children 0 to 19 years old who lived in the Southwest Trauma Region were Hispanic
(56.7%, n=27,652).
Note: “Other” includes: Non-Hispanic American Indian/Alaskan Native, Asian, or Hawaiian/Pacific
Islander.
Source: 2015 Unbridged Vintage U.S. Census Bureau Data.
69.4%
8.5%
4.3%
17.8%
Figure 1. Racial and ethnic make-up of children 0-19 years old, KS 2015
White, non-Hispanic
African-American, non-Hispanic
Other, non-Hispanic
Hispanic

12
Note: “Other” includes: Non-Hispanic American Indian/Alaskan Native, Asian, or Hawaiian/Pacific
Islander.
Source: 2015 Unbridged Vintage U.S. Census Bureau Data.
Economic Makeup
Trauma Region Percent Living in Poverty 0-17 years old
Northcentral 17.5%
Northeast 15.7%
Northwest 15.6%
Southcentral 19.0%
Southeast 26.0%
Southwest 20.4%
Kansas Overall 17.6% Source: U.S. Census Bureau, Small Area Income and Poverty Estimates.
In 2014, 17.6% of all children in Kansas 0 to 17 years old were living in poverty. Overall,
the Southern Trauma Regions of Kansas had a higher childhood poverty rate (26.0%)
compared to the Northern regions. Northwest and Northeast Trauma Regions had the
lowest percent of children living in poverty (15.6% and 15.7%).
0% 20% 40% 60% 80% 100%
Northcentral
Northeast
Northwest
Southcentral
Southeast
Southwest
Tra
um
a R
egio
ns
Figure 2. Racial make-up of children 0-19 years old in Kansas by trauma region, KS 2015
White, non-Hispanic African-American, non-Hispanic
Other, non-Hispanic Hispanic

13
Mortality Data Summary
Figure 3. Age-specific unintentional injury death rates by trauma regions
among children 0-19 years old, KS 2005-2014
Kansas Trauma Regions Northwest Northcentral Northeast Southwest Southcentral Southeast
Note: Unintentional injury death rate per 100,000 Kansas children 0 to 19 years old. N= The number of
unintentional injury deaths.
Source: 2005-2014 Kansas Vital Statistics, Bureau of Epidemiology and Public Health Informatics, KDHE.
2005-2014 U.S. Census Bureau.
24.97 per
100,000
(N=59)
25.98 per
100,000
(N=128)
12.49 per
100,000
(N=303)
21.02 per
100,000
(N=106)
16.72 per
100,000
(N=57)
10.99 per
100,000
(N=442)
14
From 2005 to 2014, the Southwest Trauma Region had the highest age-specific
unintentional injury death rate (26.0 per 100,000 children, 95% CI: 21.7-30.9) among
children 0 to 19 years old. The Southcentral (12.5 per 100,000 children, 95% CI: 11.1-
14.0), Northeast (11.0 per 100,000 children, 95% CI: 10.0-12.1), and Northcentral (16.7
per 100,000 children, 95% CI: 12.7-21.7) Trauma Regions had significantly lower age-
specific unintentional injury death rates compared to the Southwest Trauma Region.
Rates among the Northwest and Southwest Trauma Regions were over twice as high
as rates among the Northeast and Southcentral Trauma Regions.
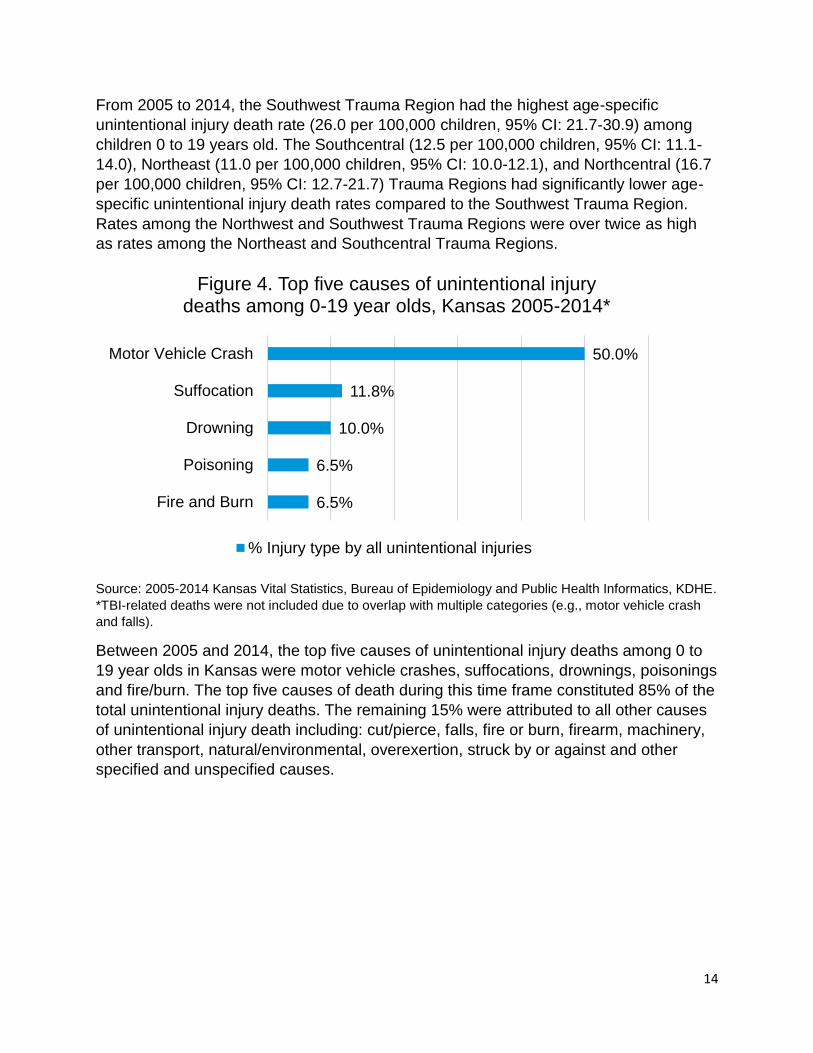
Source: 2005-2014 Kansas Vital Statistics, Bureau of Epidemiology and Public Health Informatics, KDHE.
*TBI-related deaths were not included due to overlap with multiple categories (e.g., motor vehicle crash
and falls).
Between 2005 and 2014, the top five causes of unintentional injury deaths among 0 to
19 year olds in Kansas were motor vehicle crashes, suffocations, drownings, poisonings
and fire/burn. The top five causes of death during this time frame constituted 85% of the
total unintentional injury deaths. The remaining 15% were attributed to all other causes
of unintentional injury death including: cut/pierce, falls, fire or burn, firearm, machinery,
other transport, natural/environmental, overexertion, struck by or against and other
specified and unspecified causes.
6.5%
6.5%
10.0%
11.8%
50.0%
Fire and Burn
Poisoning
Drowning
Suffocation
Motor Vehicle Crash
Figure 4. Top five causes of unintentional injury deaths among 0-19 year olds, Kansas 2005-2014*
% Injury type by all unintentional injuries

15
Hospital Discharge Data Summary
Figure 5. Age-specific unintentional injury hospital discharge rates by
trauma regions among children 0-19 years old, KS 2005-2014
Kansas Trauma Regions Northwest Northcentral Northeast Southwest Southcentral Southeast
Note: Unintentional injury hospital discharge rate per 100,000 Kansas children 0 to 19 years old. N= The
number of unintentional injury hospital discharges.
Source: 2005-2014 Hospital Discharge Database, Kansas Hospital Association. 2005-2014 U.S. Census
Bureau.
162.54 per
100,000
(N=384)
207.62 per
100,000
(N=1,047)
155.17 per
100,000
(N=529)
135.73 per
100,000
(N=5,461)
163.38 per
100,000
(N=805)
174.72 per
100,000
(N=4,237)
16
Between 2005 and 2014, the Southeast Trauma Region had the highest age-specific
unintentional injury hospital discharge rate (207.6 per 100,000 children, 95% CI: 195.1-
220.6) among children 0 to 19 years old. This rate was significantly higher than all other
Kansas trauma regions during this time period. The Southcentral region had the second
highest age-specific unintentional injury death hospital discharge rate (174.7 per
100,000 children, 95% CI: 169.5-180.1), which was significantly higher than
Northcentral (155.2 per 100,000 children, 95% CI: 142.2-169.0) and Northeast (135.7
per 100,000 children, 95% CI: 132.2-139.4) Kansas trauma regions.
Source: 2010-2014 Hospital Discharge Database, Kansas Hospital Association.
*TBI-related injuries were not included due to overlap with multiple categories (e.g., motor vehicle crash
and falls).
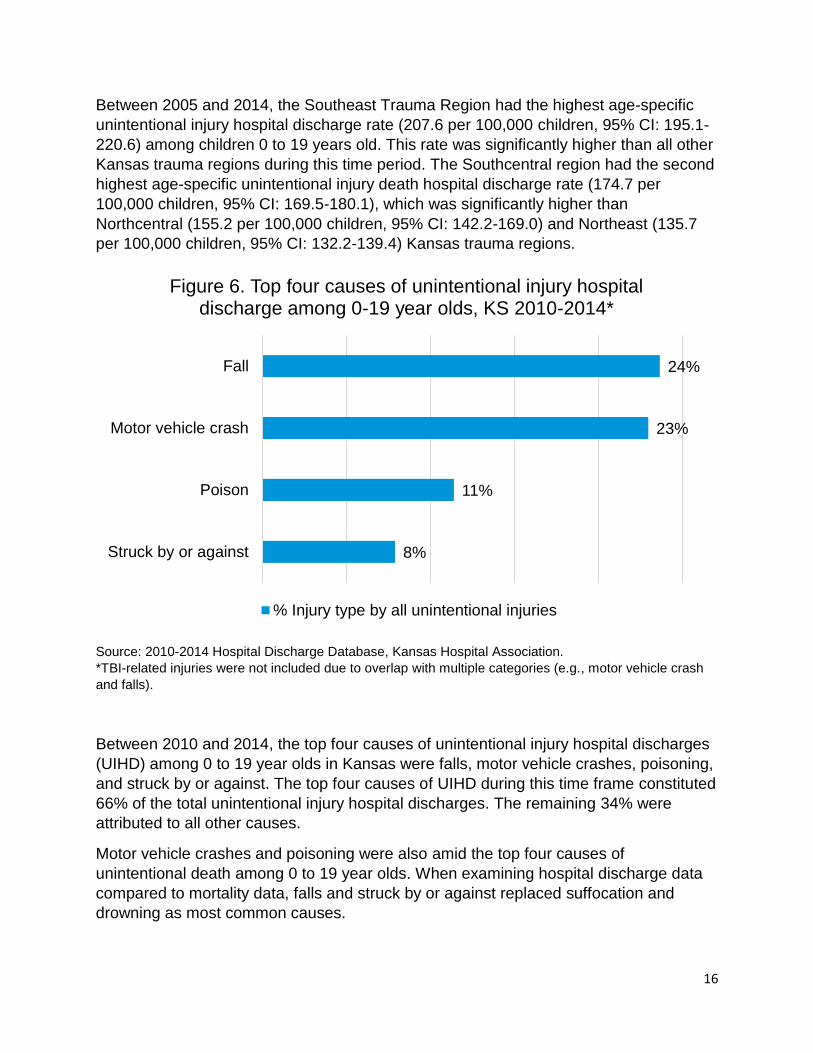
Between 2010 and 2014, the top four causes of unintentional injury hospital discharges
(UIHD) among 0 to 19 year olds in Kansas were falls, motor vehicle crashes, poisoning,
and struck by or against. The top four causes of UIHD during this time frame constituted
66% of the total unintentional injury hospital discharges. The remaining 34% were
attributed to all other causes.
Motor vehicle crashes and poisoning were also amid the top four causes of
unintentional death among 0 to 19 year olds. When examining hospital discharge data
compared to mortality data, falls and struck by or against replaced suffocation and
drowning as most common causes.
8%
11%
23%
24%
Struck by or against
Poison
Motor vehicle crash
Fall
Figure 6. Top four causes of unintentional injury hospital discharge among 0-19 year olds, KS 2010-2014*
% Injury type by all unintentional injuries

17
Note: Unintentional injury hospital discharge rate per 100,000 Kansas children 0 to 19 years old.
Source: 2005-2014 Hospital Discharge Database, Kansas Hospital Association.
*TBI-related injuries were not included due to overlap with multiple categories (e.g., motor vehicle crash
and falls).
To depict trends during 2005-2014, Figure 7 displays the top four unintentional injury
hospital discharge (UIHD) rates among children 0 to 19 years old. The UIHD rates have
all significantly decreased during this time frame. Motor vehicle crashes and falls
decreased the most but these UIHD rates are still significantly higher compared to
poison and struck by or against rates. Although the incidence of unintentional injury
hospitalizations for motor vehicle crashes and falls has decreased, the absolute
numbers are still high and therefore continued public health efforts are needed to
prevent these frequently occurring injuries. Unintentional poisoning and struck
by/against injuries have not declined over the observed ten year span. Therefore, public
health interventions to reduce these injuries among children 0 to 19 years old are
warranted. In 2014, struck by or against rates were significantly lower than motor
vehicle crashes, falls, and poison.
0
10
20
30
40
50
60
70
Rate
pe
r 1
00
,00
0 c
hild
ren
Year
Figure 7. Unintentional injury hospital discharge rates among children 0-19 years olds, KS 2005-2014*
Motor Vehicle Crash
Fall
Poison
Struck by or Against
18
Emergency Department Data Summary
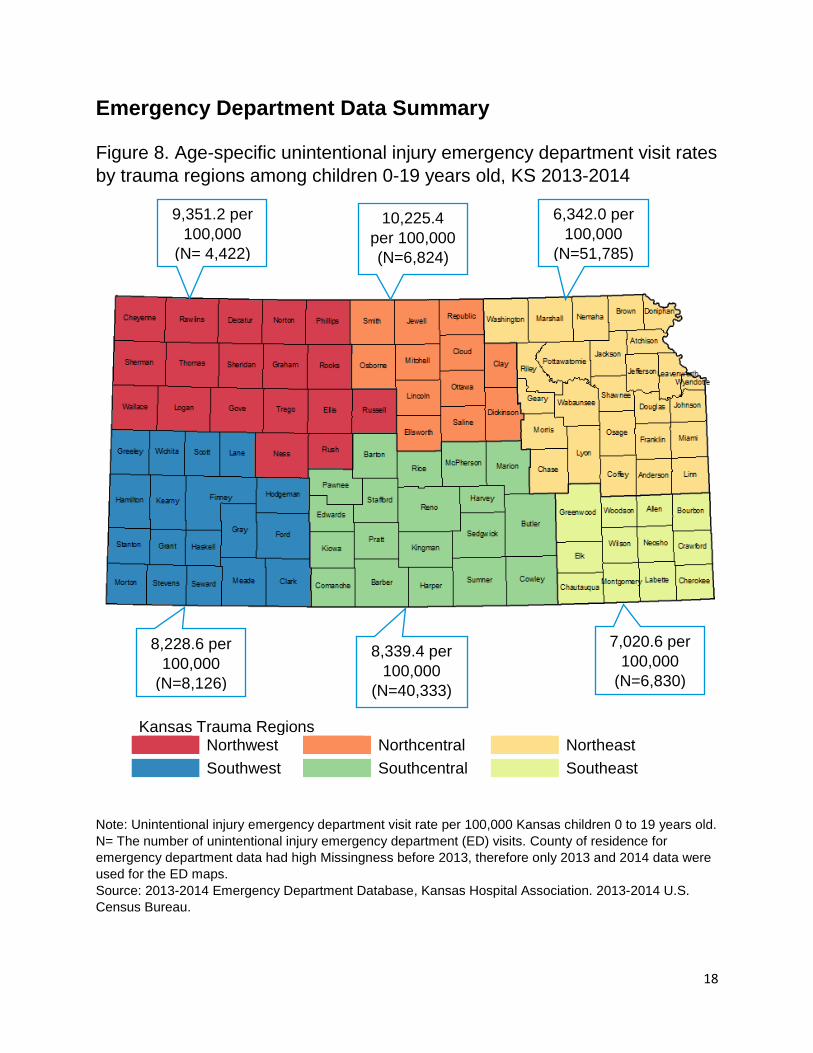
Figure 8. Age-specific unintentional injury emergency department visit rates
by trauma regions among children 0-19 years old, KS 2013-2014
Kansas Trauma Regions Northwest Northcentral Northeast Southwest Southcentral Southeast
Note: Unintentional injury emergency department visit rate per 100,000 Kansas children 0 to 19 years old.
N= The number of unintentional injury emergency department (ED) visits. County of residence for
emergency department data had high Missingness before 2013, therefore only 2013 and 2014 data were
used for the ED maps.
Source: 2013-2014 Emergency Department Database, Kansas Hospital Association. 2013-2014 U.S.
Census Bureau.
9,351.2 per
100,000
(N= 4,422)
8,228.6 per
100,000
(N=8,126)
8,339.4 per
100,000
(N=40,333)
7,020.6 per
100,000
(N=6,830)
10,225.4
per 100,000
(N=6,824)
6,342.0 per
100,000
(N=51,785)

19
From 2013 to 2014, the Northcentral Trauma Region had the highest age-specific
unintentional injury emergency department visit (UIEDV) rate among children 0 to 19
years old (10,225.4 per 100,000 children, 95% CI: 9,984.2-10,470.9). The other five
Kansas trauma regions had significantly lower UIEDV rates compared to the
Northcentral Trauma Region. The Northeast Trauma Region had the lowest age-
specific UIEDV rate which was significantly lower than the other five regions. (6,342.0
per 100,000 children, 95% CI: 6,287.5-6,396.8).
Source: 2010-2014 Emergency Department Database, Kansas Hospital Association.
*TBI-related injuries were not included due to overlap with multiple categories (e.g., motor vehicle crash
and falls).
Between 2010 and 2014, the top four causes of unintentional injury emergency
department visits (UIEDV) among 0 to 19 year olds in Kansas were falls, struck by or
against, natural/environmental and cut or pierce. The top four causes of visits during
this time frame constituted 66.7% of the total UIEDV. The remaining 33.3% were
attributed to all other causes. Falls and struck by or against were also among the top
four causes of unintentional injury hospital discharges.
7.2%
7.5%
20.8%
31.2%
Cut or Pierce
Natural/Environmental
Struck by/Against
Falling
Figure 9. Top four causes of unintentional injury emergency department visits among 0-19 year olds, KS
2010-2014
% Injury type by all unintentional injuries

20
Note: Unintentional injury emergency department visit rate per 100,000 Kansas children 0 to 19 years old.
Source: 2010-2014 Emergency Department Database, Kansas Hospital Association.
*TBI-related injuries were not included due to overlap with multiple categories (e.g., motor vehicle crash
and falls).
The five year period trends for the top four unintentional injury emergency department
visit (UIEDV) rates among children 0 to 19 years old are presented in Figure 10. The
UIEDV rate caused by a natural/environmental injury significantly increased from 2010
to 2014. The UIEDV rates caused by falls, struck by or against and cut/pierce
significantly decreased from 2010 to 2014.
UIEDV rates caused by falls and struck by or against injuries have decreased the most
during this time period. However, these rates were still significantly higher than the
UIEDV due to natural/environmental and cut or pierce injuries.
0
500
1000
1500
2000
2500
2010 2011 2012 2013 2014Rate
pe
r 1
00
,00
0 c
hild
ren
Year
Figure 10. Unintentional injury emergency department visit rates among children 0-19 years old, Kansas 2010-2014
Fall
Struck by/Against
Natural/Environmental
Cut or Pierce

21
Childhood Unintentional Injury
Summary by Cause
The Safe Kids Kansas Coalition, established in 1993, is a nonprofit coalition of more
than 70 statewide and regional organizations, agencies and businesses, 25 local
coalitions, covering 75 percent of Kansas children 0 to 19 years old. In addition to CDC
funding through the Preventative Health Block Grant, Safe Kids also receives funding
from private sources to support work in the primary prevention of injury.

22
Suffocation
The Problem
Suffocation is the condition when
one does not get enough air to
breathe. Nationally, suffocation is the
leading cause of unintentional injury
deaths for children under age one
and the fourth leading cause of
unintentional injury deaths for
children one to four years old.4 Most
infant suffocation deaths occur in the
home and are a result of unsafe
sleeping environments. In children
aged 1 to 4 years old most of these
incidents involve food or toys.
Note: Unintentional injury emergency department visit rate per 100,000 Kansas children 0 to 19 years old.
*The 15 to 19 year old age-specific rate was suppressed due to small counts.
Source: 2010-2014 Emergency Department Database, Kansas Hospital Association.
4 Borse NN, Gilchrist J, Dellinger AM, Rudd RA, Ballesteros MF, Sleet DA. CDC Childhood Injury Report: Patterns of Unintentional Injuries among 0 -19 Year Olds in the United States, 2000-2006. Atlanta (GA): Centers for Disease Control and Prevention, National Center for Injury Prevention and Control; 2008
0
10
20
30
40
50
60
70
< 1 1 to 4 5 to 9 10 to 14 15 to 19
Age
-sp
ecific
rate
pe
r 1
00
,00
0
ch
ildre
n
Age group
Figure 11. Emergency department visits due to unintentional suffocation by age gorup, KS 2010-2014

23
Note: Unintentional injury emergency department visit rate per 100,000 Kansas children 0 to 19 years old. Source: 2010-2014 Emergency Department Database, Kansas Hospital Association.
Key Findings
From 2010 to 2014, Kansas children aged 1 to 4 years old had the highest
emergency department visit (EDV) rate for unintentional suffocation.
Between 2010 and 2014 EDV rates of unintentional suffocation significantly
decreased. In 2010 the age-specific EDV rate of unintentional suffocation was 22.9
per 100,000 children (95% CI: 19.7-26.5) and in 2014 this rate dropped to 15.4 per
100,000 children (95% CI: 12.8-18.4).
Although EDV rates of unintentional suffocation significantly decreased from 2010 to
2014, mortality rates due to unintentional suffocation remained stable during this
time period. When comparing 2005-2009 to 2010-2014, there were 56 and 58
suffocation deaths among 0 to 19 year olds, respectively.
Strategies for Prevention
Teach all caregivers the ABCs of safe sleep. Infants should be placed to sleep
alone, on their back, in a clutter-free crib.
Encourage families to dress baby in a wearable blanket rather than putting blankets
in the crib.
Keep cords and string, including those attached to window blinds, out of our child’s
reach.
Increase awareness of foods that are common choking hazards for young children
such as popcorn, hot dogs and grapes.
22.9
19.0
12.613.9
15.4
0
5
10
15
20
25
30
2010 2011 2012 2013 2014
Rate
pe
r 1
00
,00
0 c
hild
ren
Year
Figure 12. Emergency department visits due to unintentional suffocation, ages 0-19, KS 2010-2014

24
Educate families about the dangers of toys with small parts, magnets, button
batteries and products that grow when you add water. Keep these items away from
young children to prevent choking and other injuries.
Publicize emergency contacts and promote community resources for training the
public in infant and child CPR and choking first aid.
Work with the Consumer Product Safety Commission and manufacturers to improve
the design of baby furniture and other juvenile products as well as enforcing warning
label requirements on toys.
Drowning Injury
The Problem
Drowning is the fifth leading cause
of unintentional injury deaths in
the United States.5 About 20% of
people who die from drowning are
children 14 years old or younger
and for every child who dies from
drowning another five receive
emergency department care for
their nonfatal injuries.5 Most of the
ED drowning injuries result in
prolonged hospitalizations. In
addition, non-fatal drowning can
result in severe brain damage,
long-term cognitive disabilities,
and loss of basic functioning.
5 Centers for Disease Control and Prevention, National Center for Injury Prevention and Control, Division of Unintentional Injury Prevention. (2016, April 28). Unintentional Drowning: Get the Facts. Retrieved May 8, 2017 from https://www.cdc.gov/homeandrecreationalsafety/water-safety/waterinjuries-factsheet.html.

25

26
Note: Unintentional injury emergency department visit rate per 100,000 Kansas children 0 to 19 years old.
*Due to small counts, age-specific rates were suppressed for the < 1 and 15 -19 year old age groups.
Source: 2010-2014 Emergency Department Database, Kansas Hospital Association.
Note: Unintentional injury emergency department visit rate per 100,000 Kansas children 0 to 19 years old.
Source: 2010-2014 Emergency Department Database, Kansas Hospital Association.
0
2
4
6
8
10
12
14
16
< 1 1 to 4 5 to 9 10 to 14 15 to 19
Age
-sp
ecific
rate
pe
r 1
00
,00
0
ch
ildre
n
Age group
Figure 13. Emergency department visits due to near drowning by age group, KS 2010-2014
4.13.5
4.8
2.7
7.1
0
2
4
6
8
10
2010 2011 2012 2013 2014
Rate
pe
r 1
00
,00
0 c
hild
ren
Year
Figure 14. Emergency department visits due to near drowning ages 0-19, KS 2010-2014

27
Key Findings
From 2010 to 2014, Kansas children aged 1 to 4 years old had the highest
emergency department visit (EDV) rate for unintentional drowning.
Kansas childhood EDV rates of unintentional drowning fluctuated between 2010 and
2014. Between 2010 and 2012 there were no significant differences in EDV rates of
unintentional drowning, but from 2013 to 2014 these rates significantly increased
(i.e., from 2.7 per 100,000 children; 95% CI: 1.7-4.1 to 7.1 per 100,000 children;
95% CI: 5.4-9.2).
Unintentional drowning death and EDV rates remained stable between 2010 and
2014. When comparing years 2005-2009 to 2010-2014, there were 48 and 49
unintentional drowning deaths among 0 to 19 year olds, respectively.
Strategies for Prevention
Educate adults to never leave children unsupervised around water, even for a
minute. This applies to pools, backyard ponds, bathtubs, kiddie pools 5-gallon
buckets of water and anywhere water may collect. Empty tubs, buckets, containers
and kiddie pools immediately after use and store upside down so they don’t collect
water.
Inform caregivers to close toilet lids and use toilet seat locks to prevent drowning.
Keep doors to bathrooms and laundry rooms closed.
Promote teaching children how to swim. Consider their age, development and how
often they are around water. But remind parents not to mistakenly believe that kids
who know how to swim are drown-proof.
Promote ordinances requiring owners to install 4-sided fences with self-closing and
self-latching gates around home pools.
Promote and encourage enforcement of the state law requiring youth ages 14 years
and under to wear a lifejacket when on boats or in open bodies of water.
28
Falls Injury
The Problem
Falls are the leading cause of non-fatal injuries among children aged 0 to 19 years old.6
This equates to about 3 million children being treated in the United States emergency
rooms each year for fall-realted injuries.6 There are empirical-based strategies to reduce
falls and prevent serious fall-related injuries, such as tramatic brain injuries.
6 Centers for Disease Control and Prevention, National Center for Injury Prevention and Control, Division of
Unintentional Injury Prevention. (2016, April 28). Fall Prevention. Retrieved May 22, 2017 from https://www.cdc.gov/safechild/falls/index.html.

29
Note: Unintentional injury hospital discharge rate per 100,000 Kansas children 0 to 19 years old.
Source: 2010-2014 Hospital Discharge Database, Kansas Hospital Association.
Note: Unintentional injury emergency department visit rate per 100,000 Kansas children 0 to 19 years old.
Source: 2010-2014 Emergency Department Database, Kansas Hospital Association.
0
10
20
30
40
50
60
70
< 1 1 to 4 5 to 9 10 to 14 15 to 19
Age
-sp
ecific
rate
pe
r 1
00
,00
0
ch
idlre
n
Age Group
Figure 15. Hospital discharges due to unintentional falls by age group, KS 2010-2014
0
500
1000
1500
2000
2500
3000
3500
4000
4500
< 1 1 to 4 5 to 9 10 to 14 15 to 19
Age
-sp
ecific
rate
pe
r 1
00
,00
0 c
hild
ren
Age group
Figure 16. Emergency department visits due to unintentional falls by age group, KS 2010-2014

30
Note: Unintentional injury hospital discharge rate per 100,000 Kansas children 0 to 19 years old.
Source: 2010-2014 Hospital Discharge Database, Kansas Hospital Association.
Note Unintentional injury emergency department visit rate per 100,000 Kansas children 0 to 19 years old. Source: 2010-2014 Emergency Department Database, Kansas Hospital Association.
32.64 30.58 30.12 27.27 28.00
0
5
10
15
20
25
30
35
40
2010 2011 2012 2013 2014Rate
pe
r 1
00
,00
0 c
hild
ren
Year
Figure 17. Hospital discharges due to unintentional falls, ages 0-19, KS 2010-2014
2457.7
2397.4
2351.4
2423.2
2207.2
1950
2100
2250
2400
2550
2010 2011 2012 2013 2014
Ra
te p
er
10
0,0
00
ch
ildre
n
Year
Figure 18. Emergency department visits due to unintentional falls, ages, 0-19, KS 2010-2014

31
Key Findings
From 2010 to 2014, the hospital discharge (HD) rate for unintentional falls was the
highest among Kansans less than one year of age.
During the same time period, the emergency department visit (EDV) rate for
unintentional falls was the highest among Kansans 1 to 4 years old.
Between 2010 and 2014, the overall EDV rate for unintentional falls significantly
decreased among Kansans 0 to 19 year olds. This rate fluctuated from 2010 to 2013
and then significantly dropped from 2013 (2,423 per 100,000 children; 95% CI:
2,389-2,457) to 2014 (2,207 per 100,000 children; 2,175-2,240).
Although there was a decline in EDV rates, no significant decline was seen in the
HD rates for unintentional falls during this time period.
Strategies for Prevention
Keep children’s furniture away from windows. Install window stops or guards with an
emergency release in case of fire. Remind adults that screens are for keeping bugs
out, not children in.
Use safety gates at the tops and bottoms of stairs.
Secure TVs and furniture to the walls using mounts, brackets, braces, anchors or
wall straps.
Playgrounds where children play should have surfaces with shock-absorbing
materials such as rubber, synthetic turf, sand, pea gravel, wood chips or mulch.
Increase public awareness of the Consumer Product Safety Commission’s
playground safety guidelines.
Keep babies and young children strapped in when using high chairs, infant carriers,
swings, strollers and shopping carts. Discourage use of mobile baby walkers and
encourage the use of stationary alternatives.
When placing your baby into a carrier, place the carrier on the floor and not on top of
a table or furniture.

32
Fire and Burns
The problem
Fire and burns are a leading cause of unintentional childhood injuries. Nationwide over
300 children aged 0 to 19 years old are treated in the emergency room for burns and
two children die from burns every day.7 Older children are more likely to be injuried from
direct contact with fire while younger children are more likely to sustain scald burns from
hot liquids or steam.7
7 Centers for Disease Control and Prevention, National Center for Injury Prevention and Control, Division of Unintentional Injury Prevention. (2016, April 28). Burn Prevention. Retrieved May 22, 2017 from https://www.cdc.gov/safechild/burns/index.html.

33
Note: Unintentional injury hospital discharge rate per 100,000 Kansas children 0 to 19 years old.
Source: 2010-2014 Hospital Discharge Database, Kansas Hospital Association.
Note: Unintentional injury emergency department visit rate per 100,000 Kansas children 0 to 19 years old.
Source: 2010-2014 Emergency Department Database, Kansas Hospital Association.
0
5
10
15
20
25
30
< 1 1 to 4 5 to 9 10 to 14 15 to 19
Age
-sp
ecific
rate
pe
r 1
00
,00
0
ch
ildre
n
Age Group
Figure 19. Hospital discharges due to unintentional fire and burn by age group, KS 2010-2014
0
50
100
150
200
250
300
350
< 1 1 to 4 5 to 9 10 to 14 15 to 19Age
-sp
ecific
rate
pe
r 1
00
,00
0 c
hild
ren
Age group
Figure 20. Emergency department visits due to unintentional fire and burn by age group, KS 2010-2014

34
Note: Unintentional injury hospital discharge rate per 100,000 Kansas children 0 to 19 years old. Source: 2010-2014 Hospital Discharge Database, Kansas Hospital Association.
Note: Unintentional injury emergency department visit rate per 100,000 Kansas children 0 to 19 years old. Source: 2010-2014 Emergency Department Database, Kansas Hospital Association.
8.389.62
8.15 8.319.71
0
2
4
6
8
10
12
14
2010 2011 2012 2013 2014
Rate
pe
r 1
00
,00
0 c
hild
ren
Year
Figure 21. Hospital discharges due to unintentional fire and burn, ages 0-19, KS 2010-2014
135.8133.1
137.4
128.8 126.8
100
110
120
130
140
150
160
2010 2011 2012 2013 2014
Rate
pe
r 1
00
,00
0 c
hild
ren
Year
Figure 22. Emergency department visits due to unintentional fire and burn, ages 0-19, KS 2010-2014

35
Key Findings
Between 2010 and 2014, Kansas children aged 1 to 4 years old had the highest
hospital discharge (HD) and emergency department visit (EDV) rates for
unintentional fire and burn injuries.
From 2010 to 2014, Kansas HD rates for unintentional fire and burn injuries
remained stable with no significant variations.
During this time period, the EDV rate among Kansas children 0 to 19 years old was
stable from 2010 to 2014.
Strategies for Prevention
Educate families to have working smoke alarms on every level of your home and in
every sleeping area. Test and replace batteries according to manufacturer
recommendations. Remind them to practice family escape plans with children.
Work with partners to inform adults to set hot water heaters to 120 degrees
Fahreneit or the manufacturer’s recommended setting to prevent scald burns.
Educate families to cook on the back burners of your stove and turn pot handles
away from the edge. Keep hot foods away from the edge of counters.
Don’t hold a child while cooking on the stove or carrying hot food or beverages.
Remind families to place matches, gasoline and lighters in a safe place, out of
children’s reach. Avoid novelty lighters that look like toys.
Don’t leave candles burning
unattended. Encourage use of
battery-powered candles.
Tell parents to leave fireworks to
adults, or better yet, professionals.
Instead of sparklers consider giving
young children glow sticks.
Inform Kansans about the Kansas
Smoke Detector Law.
Support efforts to prevent juvenile
fire-setting.
Educate children on how to properly
use the 9-1-1 emergency number in
their area, including knowing their
home address.
36
Motor Vehicle Crash
The Problem
Motor vehicle crash is the leading cause of unintentional injury deaths among children.8
Each hour, nearly 150 children aged 0 to 19 years old are treated in emergency
departments for motor vehicle crash related injuries in the United States.8 Use of age-
and weight-appropriate child restraints and seat belts can prevent or mitigate injuries in
the occurance of a motor vehicle crash.
8 Centers for Disease Control and Prevention, National Center for Injury Prevention and Control, Division of Unintentional Injury Prevention. (2016, April 28). Road Traffic Safety. Retrieved May 22, 2017 from https://www.cdc.gov/safechild/road_traffic_injuries/index.html.

37
Note: Unintentional injury death rate per 100,000 Kansas children 0 to 19 years old. *The <1 year old
age-specific rate was suppressed due to small counts.
Source: 2005-2014 Kansas Vital Statistics, Bureau of Epidemiology and Public Health Informatics, KDHE
Note: Unintentional injury hospital discharge rate per 100,000 Kansas children 0 to 19 years old. *The <1
year old age-specific rate was suppressed due to small counts.
Source: 2010-2014 Hospital Discharge Database, Kansas Hospital Association.
0
5
10
15
20
25
<1 1 to 4 5 to 9 10 to 14 15 to 19
Age
-sp
ecific
rate
pe
r 1
00
,00
0
ch
ildre
n
Age group
Figure 23. Mortality due to unintentional motor vehicle crash by age group, KS 2005-2014
0102030405060708090
< 1 1 to 4 5 to 9 10 to 14 15 to 19
Age
-sp
ecific
rate
pe
r 1
00
,00
0
ch
ildre
n
Age Group
Figure 24. Hospital discharges due to unintentional motor vehicle crash by age group, KS 2010-2014

38
Note Unintentional injury emergency department visit rate per 100,000 Kansas children 0 to 19 years old.
Source: 2010-2014 Emergency Department Database, Kansas Hospital Association.
Note: Unintentional injury death rate per 100,000 Kansas children 0 to 19 years old.
Source: 2005-2014 Kansas Vital Statistics, Bureau of Epidemiology and Public Health Informatics, KDHE
0
200
400
600
800
1000
1200
< 1 1 to 4 5 to 9 10 to 14 15 to 19
Age
-sp
ecific
rate
pe
r 1
00
,00
0
ch
ildre
n
Age group
Figure 25. Emergency department visits due to unintentional motor vehicle crash by age group, KS
2010-2014
11.02
8.119.06
7.38 7.198.75
4.936.54
4.59 5.23
0
2
4
6
8
10
12
14
16
Rate
pe
r 1
00
,00
0 c
hild
ren
Year
Figure 26. Mortality due to unintentional motor vehicle crashes, ages 0-19, KS 2005-2014

39
Note: Unintentional injury hospital discharge rate per 100,000 Kansas children 0 to 19 years old.
Source: 2010-2014 Hospital Discharge Database, Kansas Hospital Association.
Note: Unintentional injury emergency department visit rate per 100,000 Kansas children 0 to 19 years old. Source: 2010-2014 Emergency Department Database, Kansas Hospital Association.
34.12
27.9930.74
26.03 25.38
0
10
20
30
40
50
2010 2011 2012 2013 2014
Rate
pe
r 1
00
,00
0 c
hild
ren
Year
Figure 27. Hospital discharges due to unintentional motor vehicle crash, ages 0-19, KS 2010-2014
473.6
429.0
452.2433.9
400.6
350
400
450
500
550
2010 2011 2012 2013 2014
Rate
pe
r 1
00
,00
0 c
hild
ren
Year
Figure 28. Emergency department visits due to unintentional motor vehicle crashes, ages 0-19, KS 2010-2014

40
Key Findings
Between 2010 and 2014, Kansas children aged 15 to 19 years old had the highest
hospital discharge (HD) and the emergency department visit (EDV) rates for
unintentional motor vehicle crashes (UMVC).
Kansas childhood mortality rates due to UMVC declined from 2005 to 2014.
Compared to 2005, mortality rates due to UMVC significantly declined in 2008-2009
and 2010-2014.
Between 2010 and 2014, the HD rate of UMVC decreased among 0 to 19 year olds.
In 2010 the HD rate of UMVC was 34.1 per 100,000 children (95% CI: 30.2-38.4),
which significantly decreased to 25.4 per 100,000 children in 2014 (95% CI: 22.0-
29.1).
Between 2010 and 2014, the EDV rate of UMVC decreased among 0 to 19 year
olds. In 2010 the EDV rate of UMVC was 473.7 per 100,000 children (95% CI:
458.8-488.9), which significantly decreased to 400.6 per 100,000 children (95% CI:
386.8-414.6) in 2014.
Strategies for Prevention
Support legislation that mirrors best practices in the field of Child Passenger Safety.
Inform families how to have their child’s car seat checked by a certified Child
Passenger Safety Technician.
Provide child safety seats or incentives for purchasing child safety seats, including
special needs car seats, to low-income and disadvantaged families.
Promote the Safe Kids Worldwide Ultimate Car Seat Guide website (i.e.,
UltimateCarSeatGuide.org) to help parents choose and use appropriate car seats for
their specific child. This website is especially helpful in communities that lack a car
seat technician or program.
Tell parents to register their new or currently used car seat to ensure prompt
notification about future recalls. To register, go to safercar.gov or mail in the
registration card that comes with new seats.
Don’t purchase a used car seat unless you know its full crash history from a trusted
source. This means buying from someone you know and not a thrift store, garage
sale, or the internet. Once a seat has been in a crash or is expired it needs to be
replaced.
41
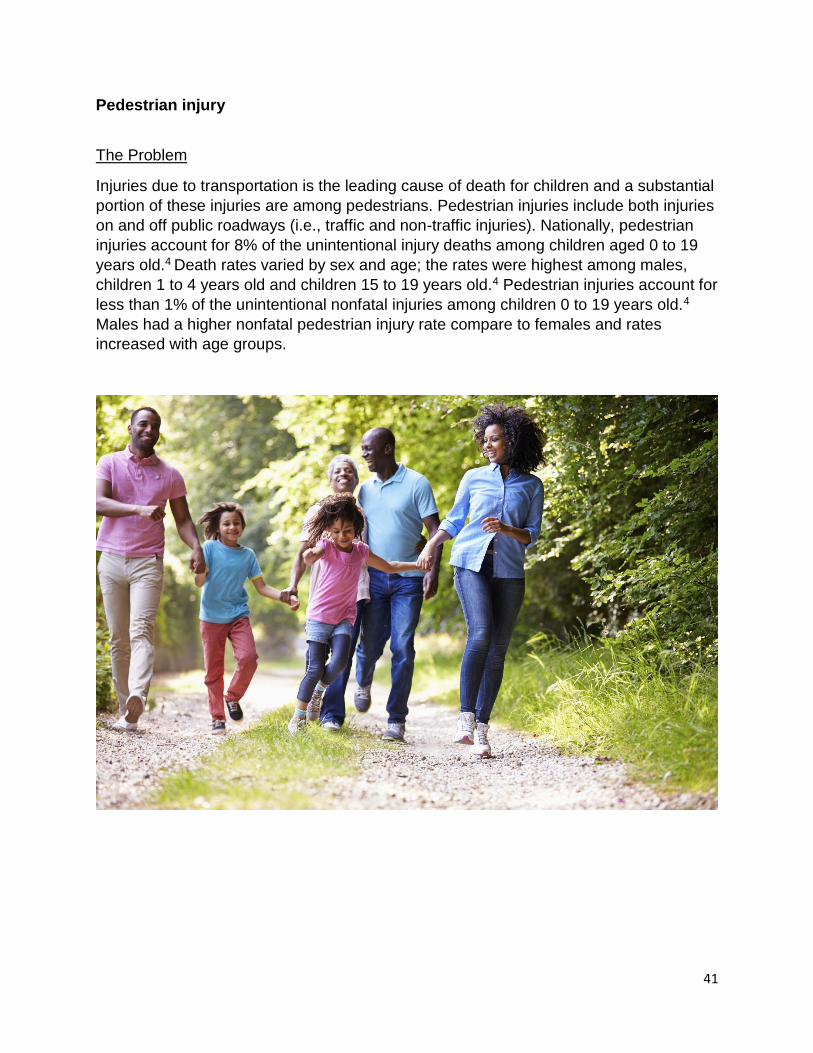
Pedestrian injury
The Problem
Injuries due to transportation is the leading cause of death for children and a substantial
portion of these injuries are among pedestrians. Pedestrian injuries include both injuries
on and off public roadways (i.e., traffic and non-traffic injuries). Nationally, pedestrian
injuries account for 8% of the unintentional injury deaths among children aged 0 to 19
years old.4 Death rates varied by sex and age; the rates were highest among males,
children 1 to 4 years old and children 15 to 19 years old.4 Pedestrian injuries account for
less than 1% of the unintentional nonfatal injuries among children 0 to 19 years old.4
Males had a higher nonfatal pedestrian injury rate compare to females and rates
increased with age groups.

42
Note: Unintentional injury hospital discharge rate per 100,000 Kansas children 0 to 19 years old. *Due to
small counts, <1 and 10-14 year old age-specific rates were suppressed.
Source: 2010-2014 Hospital Discharge Database, Kansas Hospital Association.
Note: Unintentional injury emergency department visit rate per 100,000 Kansas children 0 to 19 years old.
*The <1 year old age-specific rate was suppressed due to small counts.
Source: 2010-2014 Emergency Department Database, Kansas Hospital Association.
0
2
4
6
8
10
< 1 1 to 4 5 to 9 10 to 14 15 to 19Age
-sp
ecific
rate
pe
r 1
00
,00
0
ch
ildre
n
Age Group
Figure 29. Hospital discharges due to unintentional pedestrian injury by age group, KS 2010-2014
0
10
20
30
40
50
< 1 1 to 4 5 to 9 10 to 14 15 to 19
Age
-sp
ecific
rate
pe
r 1
00
,00
0 c
hild
ren
Age group
Figure 30. Emergency department visits due to unintentional pedestrian injury by age group, KS 2010-2014

43
Note Unintentional injury hospital discharge rate per 100,000 Kansas children 0 to 19 years old.
Source: 2010-2014 Hospital Discharge Database, Kansas Hospital Association.
Note: Unintentional injury emergency department visit rate per 100,000 Kansas children 0 to 19 years old.
Source: 2010-2014 Emergency Department Database, Kansas Hospital Association.
2.96
4.56
3.704.09
3.36
0
1
2
3
4
5
6
7
8
9
10
2010 2011 2012 2013 2014
Rate
pe
r 1
00
,00
0 c
hild
ren
Year
Figure 31. Hospital discharges due to unintentional pedestrian injury, ages 0-19, KS 2010-2014
25.3
27.4 28.3 28.5
20.0
10
15
20
25
30
35
40
2010 2011 2012 2013 2014
Rate
pe
r 1
00
,00
0 c
hild
ren
Year
Figure 32. Emergency department visits due to unintentional pedestrian injury, ages 0-19, KS 2010-2014

44
Key Findings
From 2010 to 2014, Kansas children aged 1 to 4 years old had the highest hospital
discharge (HD) rate for unintentional pedestrian injury.
During the same time period, Kansas children aged 15 to 19 years old had the
highest emergency department visit (EDV) rate for unintentional pedestrian injury.
Between 2010 and 2014 there were no significant differences in HD rates for
unintentional pedestrian injury.
From 2011 to 2014 the EDV rate of unintentional pedestrian injury among children 0
to 19 years old significantly decreased. In 2011 the EDV rate of unintentional
pedestrian injury was 25.3 per 100,000 children (95% CI: 23.9-31.2) and in 2014 this
rate significantly decreased to 20.0 per 100,000 children (95% CI: 17.1-23.4). The
2014 EDV rate of unintentional pedestrian injury was not significantly lower than the
2010 EDV rate.
Strategies for Prevention
Teach children how to be safe pedestrians, looking left, right and left again before
crossing the street. Children should cross streets with an adult until approximately
age 10.
Increase public awareness to, whenever possible, walk on sidewalk or paths and
cross at street corners using traffic signals and crosswalks. If there is no sidewalk,
walk facing traffic as far to the left as possible.
Teach kids to put phones, headphones and devices down when crossing the street.
This is particularly important to reinforce the message with teenagers.
Remind parents, older siblings and other caregivers to be a good role model and set
a safe example by putting your phone, headphones and devices down when walking
around cars.
Complete walkability assessments of communities to identify dangerous areas and
ways to improve pedestrian access and safety.

45
Cycling Injury
The Problem
Injuries due to transportation is the leading cause of death for children and a substantial
portion of these injuries are among pedal cyclists. Pedal cyclist injuries include both
injuries on and off public roadways (i.e., traffic and non-traffic injuries). Nationally, pedal
cyclist injuries account for 2% of the unintentional injury deaths among children aged 0
to 19 years old.4 The childhood mortality rate due to cycling injuries is nearly four times
higher among males compared to females and the highest death rates are among
children aged 10 to 14 years old.4 Pedal cyclist injuries account for 4% of nonfatal
injuries among children 0 to 19 years old.4 The nonfatal injury rate for pedal cyclists
increases with children’s age up to 14 years old.

46
Note: Unintentional injury hospital discharge rate per 100,000 Kansas children 0 to 19 years old. *Due to
small counts, <1 and 1 to 4 year old age-specific rates were suppressed.
Source: 2010-2014 Hospital Discharge Database, Kansas Hospital Association.
Note: Unintentional injury emergency department visit rate per 100,000 Kansas children 0 to 19 years old.
*The <1 year old age-specific rate was suppressed due to small counts.
Source: 2010-2014 Emergency Department Database, Kansas Hospital Association.
0
2
4
6
8
10
< 1 1 to 4 5 to 9 10 to 14 15 to 19Age
-sp
ecific
rate
pe
r 1
00
,00
0
ch
ildre
n
Age Groups
Figure 33. Hospital discharges due to unintentional cycling injury by age group, KS 2010-2014
0
50
100
150
200
250
300
350
< 1 1 to 4 5 to 9 10 to 14 15 to 19
Age
-sp
ecific
rate
pe
r 1
00
,00
0 c
hild
ren
Age group
Figure 34. Emergency department visits due to unintentional cycling injury by age group, KS 2010-2014

47
Note: Unintentional injury hospital discharge rate per 100,000 Kansas children 0 to 19 years old.
Source: 2010-2014 Hospital Discharge Database, Kansas Hospital Association.
Note: Unintentional injury emergency department visit rate per 100,000 Kansas children 0 to 19 years old.
Source: 2010-2014 Emergency Department Database, Kansas Hospital Association.
4.93
2.96
4.69
2.85
3.98
0
1
2
3
4
5
6
7
8
2010 2011 2012 2013 2014
Rate
pe
r 1
00
,00
0 c
hid
lre
n
Year
Figure 35. Hospital discharges due to unintentional cycling injury, ages 0-19, KS 2010-2014
183.5197.0
183.6180.3
157.7
100
150
200
250
300
2010 2011 2012 2013 2014
Rate
pe
r 1
00
,00
0 c
hild
ren
Year
Figure 36. Emergency department visits due to unintentional cycling injury, ages 0-19, KS 2010-2014

48

49
Key Findings
From 2010 to 2014, Kansas children aged 10 to 14 years old had the highest
hospital discharge (HD) and emergency department visit (EDV) rates for
unintentional cycling injuries.
Although the HD rate for unintentional cycling injuries fluctuated between 2010 and
2014, the variation in the trend was not statistically significant.
The Kansas EDV rate of unintentional cycling injuries significantly decreased among
0 to 19 year olds between 2010 and 2014. In 2010 the EDV rate of unintentional
cycling injury was 183.6 per 100,000 children (95% CI: 174.3-193.1) and in 2014 this
rate significantly decreased to 157.7 per 100,000 children (95% CI: 149.1-166.6).
Strategies for Prevention
Increase helmet usage rate for all children participating in wheeled sports. Distribute
free or discounted helmets in communities. Encourage adults and children to wear a
properly-fitted helmet to prevent head injuries and death.
Support efforts to enact comprehensive and enforceable local bike helmet use
ordinances.
Remind families to ride on the sidewalk or in bike lanes whenever possible. If not,
ride in the same direction as traffic on the right-hand side if possible.
Teach proper hand signals and rules of the road.
Educate families to wear bright colors and use lights, especially when riding at night
and in the morning. Reflectors on clothes and bikes will help you be seen.

50
Poisoning injury
The Problem
Poisoning is a leading cause of childhood morbidity and mortality in the United States.
Every day, over 300 children aged 0 to 19 years old are treated in the emergency
department and two children die as a results of poisoning.9 In addition to legal
prescriptions and illlegal drugs, everday items in your home can be poisonous (e.g.,
household cleaners and over the counter medications). It’s important to keep medicines
and toxic products away from children, surpervise ingestion of medication and carefully
measure medication dosing, as these are common ways that children are poisoned.
9 Centers for Disease Control and Prevention, National Center for Injury Prevention and Control, Division of
Unintentional Injury Prevention. (2016, April 28). Poisoning Prevention. Retrieved May 22, 2017 from https://www.cdc.gov/safechild/poisoning/index.html.
51
Note Unintentional injury hospital discharge rate per 100,000 Kansas children 0 to 19 years old.
Source: 2010-2014 Hospital Discharge Database, Kansas Hospital Association.
Note: Unintentional injury emergency department visit rate per 100,000 Kansas children 0 to 19 years old.
Source: 2010-2014 Emergency Department Database, Kansas Hospital Association.
0
10
20
30
40
50
< 1 1 to 4 5 to 9 10 to 14 15 to 19
Age
-sp
ecific
rate
pe
r 1
00
,00
0
ch
ildre
n
Age Group
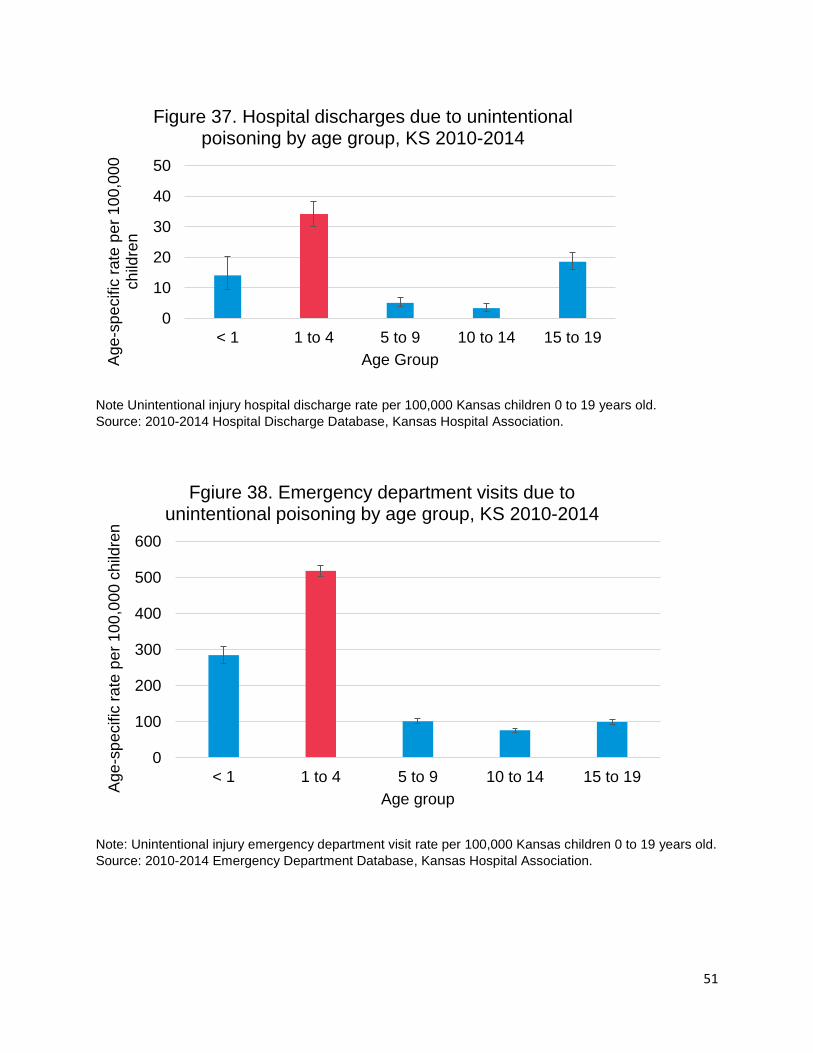
Figure 37. Hospital discharges due to unintentional poisoning by age group, KS 2010-2014
0
100
200
300
400
500
600
< 1 1 to 4 5 to 9 10 to 14 15 to 19
Age
-sp
ecific
rate
pe
r 1
00
,00
0 c
hild
ren
Age group
Fgiure 38. Emergency department visits due to unintentional poisoning by age group, KS 2010-2014

52
Note: Unintentional injury hospital discharge rate per 100,000 Kansas children 0 to 19 years old.
Source: 2010-2014 Hospital Discharge Database, Kansas Hospital Association.
Note: Unintentional injury emergency department visit rate per 100,000 Kansas children 0 to 19 years old.
Source: 2010-2014 Emergency Department Database, Kansas Hospital Association.
18.1114.79 14.32
12.8911.45
0
5
10
15
20
25
2010 2011 2012 2013 2014Rate
pe
r 1
00
,00
0 c
hild
ren
Year
Figure 39. Hospital discharges due to unintentional poisoning, ages 0-19, KS 2010-2014
226.5
185.9 180.6169.0 175.0
100
150
200
250
300
2010 2011 2012 2013 2014
Ra
te p
er
10
0,0
00
ch
ildre
n
Year
Figure 40. Emergency department visits due to unintentional poisoning, ages 0-19, KS 2010-2014

53
Key Findings
From 2010 to 2014, Kansas children aged 1 to 4 years old had the highest hospital
discharge (HD) and emergency department visit (EDV) rates for unintentional
poisoning.
Both HD and EDV unintentional poisoning rates decreased between 2010 and 2014
among Kansans 0 to 19 years old.
In 2010 the HD rate of unintentional poisoning was 18.1 per 100,000 children (95%
CI: 15.3-21.3) and in 2014 this rate significantly decreased to 11.5 per 100,000
children (95% CI: 9.2-14.0).
In 2010 the EDV rate of unintentional poisoning was 226.5 per 100,000 children
(95% CI: 216.3-237.1) and in 2014 this rate significantly decreased to 175.0 per
100,000 children (95% CI: 165.9-184.3).
Strategies for Prevention
Promote programming the toll-free Poison Control Hotline number (800-222-1222)
into home and cell phones. Have families post it near phones in the home or on
refrigerators for babysitters and guests.
Have homeowners check for lead-based paint, especially if your home was built
before 1978.
Remind adults to make sure all medications, including vitamins, are stored out of
reach and out of sight of children. Teach children if you don’t know what it is, stay
away.
Increase awareness of products that can be hazardous to kids, such as makeup,
personal care products, plants, pesticides, lead, art supplies, alcohol and carbon
monoxide.
Provide low-cost or free safety devices such as cabinet-latches and carbon
monoxide detectors to low-income families. Remind them to store cleaning products
and other poisonous items out of reach or use safety locks on cabints. This includes
items like laundry and dishwasher detergent packets.
Support efforts to enact local ordinances requiring carbon monoxide detectors in all
residential dwellings that rely on the combustion of fossil fuel for heat, ventilation, or
hot water.

54
Traumatic Brain Injury (TBI)
The problem
A traumatic brain injury (TBI) is “a disruption in the normal function of the brain that can
be caused by a bump, blow, or jolt to the head, or penetrating head injury”.10 TBI is a
leading cause of childhood death and disability in the United States.10 Unintentional
childhood injuries that result in a TBI are often age-dependent (i.e., fall-realted injuries
among toddlers, sports-related injuries among youth and motor vehicle crashes in older
children). With respect to severity, TBIs vary greatly but many non-fatal injuries result in
long-term physical, sensory, cognitive, social and/or behavioral issues. Therefore efforts
to mitigate and prevent TBIs is of great public health importance.
Figure 41. Percentage of unintentional TBI deaths by external cause
among children 0-19 years old, KS 2010-2014
Note: “Other unintentional injury” category include falls, struck by or against, machinery,
natural/environemntal and pedestrian only cause of death codes. In accordance with the Centers for
Disease Control and Prevention External Cause-of-Injury Matrix grouping “Other or unspecified” includes
classifiable, not elsewhere classifiable and unspecified causes.
Source: 2005-2014 Kansas Vital Statistics, Bureau of Epidemiology and Public Health Informatics, KDHE.
10 Centers for Disease Control and Prevention, National Center for Injury Prevention and Control, Division of
Unintentional Injury Prevention. (2017, March 28). Traumatic Brain Injury & Concussion. Retrieved May 22, 2017 from https://www.cdc.gov/traumaticbraininjury/.
74.8%
10.4%
5.2%
5.2%4.4%
Deaths
Motor vehicle crash
Other unintentional injury
Other or unspecified
Other land transport
Firearm
55
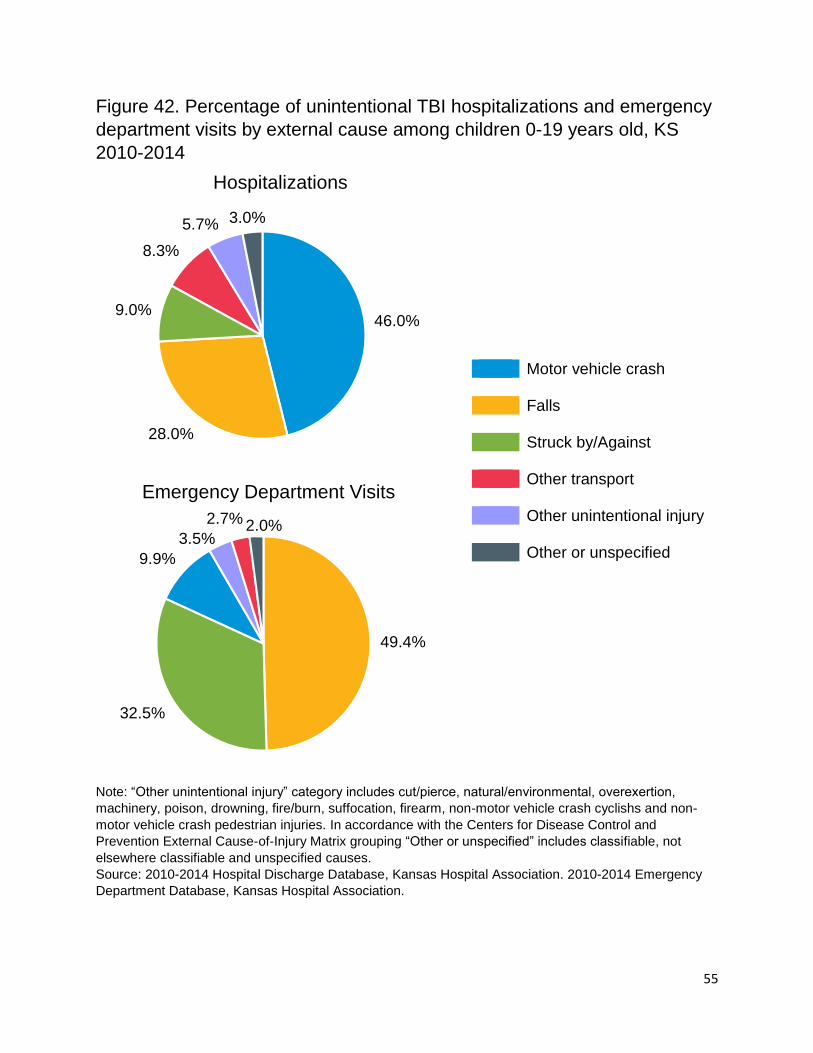
Figure 42. Percentage of unintentional TBI hospitalizations and emergency
department visits by external cause among children 0-19 years old, KS
2010-2014
Note: “Other unintentional injury” category includes cut/pierce, natural/environmental, overexertion,
machinery, poison, drowning, fire/burn, suffocation, firearm, non-motor vehicle crash cyclishs and non-
motor vehicle crash pedestrian injuries. In accordance with the Centers for Disease Control and
Prevention External Cause-of-Injury Matrix grouping “Other or unspecified” includes classifiable, not
elsewhere classifiable and unspecified causes.
Source: 2010-2014 Hospital Discharge Database, Kansas Hospital Association. 2010-2014 Emergency
Department Database, Kansas Hospital Association.
46.0%
28.0%
9.0%
8.3%
5.7% 3.0%
Hospitalizations
49.4%
32.5%
9.9%
3.5%
2.7% 2.0%
Emergency Department Visits
Motor vehicle crash Falls Struck by/Against Other transport Other unintentional injury Other or unspecified

56
Note: Unintentional injury death rate per 100,000 Kansas children 0 to 19 years old.
Source: 2005-2014 Kansas Vital Statistics, Bureau of Epidemiology and Public Health Informatics, KDHE
0
2
4
6
8
10
12
14
<1 1 to 4 5 to 9 10 to 14 15 to 19
Age
-sp
ecific
ra
te p
er
10
0,0
00
ch
ildre
n
Age group
Figure 43. Mortality due to unintentional TBI by age group, KS 2005-2014

57
Note: Unintentional injury hospital discharge rate per 100,000 Kansas children 0 to 19 years old.
Source: 2010-2014 Hospital Discharge Database, Kansas Hospital Association.
Note: In accordance with the Centers for Disease Control and Prevention External Cause-of-Injury Matrix
grouping “Other or unspecified” includes classifiable, not elsewhere classifiable and unspecified causes.
Source: 2010-2014 Hospital Discharge Database, Kansas Hospital Association.
0
10
20
30
40
50
60
70
80
< 1 1 to 4 5 to 9 10 to 14 15 to 19
Age
-sp
ecific
rate
pe
r 1
00
,00
0
ch
ildre
n
Age Group
Figure 44. Hospital discharges due to unintentional TBI by age group, KS 2010-2014
74.1%
13.0%
7.4%5.5%
Figure 45. Percentage of TBI hospitalizations by external cause among infants <1 year old, KS 2010-2014
Fall
Other or unspecified
Motor vehical crash
Other unintentional injury

58
Note: In accordance with the Centers for Disease Control and Prevention External Cause-of-Injury Matrix
grouping “Other or unspecified” includes classifiable, not elsewhere classifiable and unspecified causes.
Source: 2010-2014 Hospital Discharge Database, Kansas Hospital Association.
Note: Unintentional injury emergency department visit rate per 100,000 Kansas children 0 to 19 years old.
Source: 2010-2014 Emergency Department Database, Kansas Hospital Association.
65.5%
13.2%
8.2%
7.1%
3.9% 2.1%
Figure 46. Percent of TBI hospitalizations by external cause among 15-19 year olds, KS 2010-2014
Motor vehical crash
Fall
Other transport
Struck by/against
Other unintentional injury
Other or unspecified
0
200
400
600
800
1000
1200
1400
< 1 1 to 4 5 to 9 10 to 14 15 to 19Age
-sp
ecific
rate
pe
r 1
00
,00
0 c
hild
ren
Age group
Figure 47. Emergency department visits due to unintentional TBI by age group, Kansas 2010-2014

59
Note: In accordance with the Centers for Disease Control and Prevention External Cause-of-Injury Matrix
grouping “Other or unspecified” includes classifiable, not elsewhere classifiable and unspecified causes.
Source: 2010-2014 Emergency Department Database, Kansas Hospital Association.
Note: Unintentional injury hospital discharge rate per 100,000 Kansas children 0 to 19 years old.
Source: 2010-2014 Hospital Discharge Database, Kansas Hospital Association.
83.7%
12.5%
2.4% 1.4%
Figure 48. Percent of TBI Emergency Department Vists among infants <1 year old, KS 2010-2014
Fall
Struck by/against
Other or unspecified
Other unintentional injury
41.8
33.8 35.8
27.8 28.5
0
10
20
30
40
50
60
2010 2011 2012 2013 2014
Rate
pe
r 1
00
,00
0 c
hild
ren
Year
Figure 49. Hospital discharges due to unintentional TBI, ages 0-19, KS 2010-2014

60
Note: Unintentional injury emergency department visit rate per 100,000 Kansas children 0 to 19 years old.
Source: 2010-2014 Emergency Department Database, Kansas Hospital Association.
Key Findings
Between 2010 and 2014, motor vehicle crashes were the leading cause of injury
(74.8%) among 0 to 19 year olds who died where unintentional TBI was reported as
a cause of death on the death certificate.
Motor vehicle crashes (46%) were the leading cause of injury with unintentional TBI-
related hospitalizations. Most of the unintentional TBI emergency department visits
were due to fall-related injuries (49.4%) followed by struck by or against injuries
(32.5%).
Figure 41 and 42 highlights the distribution of injuries that lead to a TBI among three
different datasets. Typically, more serious injuries that cause TBI (e.g., motor vehicle
crashes) result in a death compared to less serious injuries (e.g., falls) that result in
an emergency department visits (EDV).
Between 2005 and 2014, Kansas children 15 to 19 years old had the highest death
rate due to an unintentional TBI.
Between 2010 and 2014, Kansas children 15 to 19 years old and infants less than
one year of age had the highest hospital discharge (HD) rates due to an
unintentional TBI.
The majority of HD rates due to TBI among patients less than one year of age
occurred because of a fall injury (74.1%).
The majority of HD rates due to TBI among patients 15 to 19 years old occurred
because of motor vehicle crashes (65.5%).
652.5
689.4 676.5
848.4
813.1
550
600
650
700
750
800
850
900
2010 2011 2012 2013 2014
Rate
pe
r 1
00
,00
0 c
hild
ren
Year
Figure 50. Emergency department visits due to unintentional TBI, ages 0-19, KS 2010-2014

61
The majority of EDV rates due to TBI among patients less than a year old were
admitted to the hospital because of a fall injury (83.7%) followed by a struck by or
against injury (12.5%).
Between 2010 and 2014, the HD rate due to TBI significantly decreased among
Kansans 0 to 19 years old. In 2010 this rate was 41.8 per 100,000 children (95% CI:
37.4-46.5) and in 2014 this rate significantly dropped to 28.5 per 100,000 children
(95% CI: 24.9-32.4).
Between 2010 and 2014, the EDV rate due to TBI increased among Kansans 0 to 19
years old. In 2010 this rate was 652.5 per 100,000 children (95% CI: 635.1-670.3)
and in 2014 this rate significantly increased to 813.1 per 100,000 children (95% CI:
793.5-833.0).
Strategies for Prevention
Buckle your child in the car using a child safety seat, booster seat, or seat
belt (according to the child's height, weight and age).
Wear a seat belt every time you drive or ride in a motor vehicle.
Never drive while under the influence of alcohol or drugs.
Wear a helmet and make sure your children wear helmets when riding bikes, motor
vehicles, playing a contact sport, using in-line skates or riding a skateboard, riding a
horse, or skiing or snowboarding.
Install window guards to keep young children from falling out of open windows.
Use safety gates at the top and bottom of stairs when young children are around.
Make sure the surface on your child's playground is made of shock-absorbing
material, such as hardwood mulch or sand.11
11 Mack MG, Sacks JJ, Thompson D. Testing the impact attenuation of loose fill playground surfaces. Injury Prevention 2000;6:141–144.

A p p e n d i x | i
i
Appendix
Analysis Notes
Throughout this report you will find various statistical measures. The following are short
descriptions of each type of measure. All data were analyzed using SAS 9.4.
Databases:
The three databases used in this document are the hospital discharge database, the
emergency department database and the mortality database.* Federal and specialty
hospitals in Kansas do not report their discharges and emergency department visits to
the Kansas Hospital Association. Not all nonfederal, short stay community or general
hospitals in Kansas report their emergency department visits or hospital discharge data
to Kansas Hospital Association; therefore, these databases do not include 100% of
emergency department visits and hospital discharges in Kansas. Please see appendix
xi for detailed information.
Counts:
Counts are the actual number of events that occur. Counts can give you an idea of the
size and scope of an issue. Larger communities will have much larger counts than small
communities because of the larger population size. To compare groups (communities or
age groups) it is best to use rates. Not all rates are provided; rates with counts less than
20 are suppressed (i.e., not given) for confidentiality and protection of individual identity.
Percentages:
Percentages are used in this report to describe the proportion of certain characteristics
of an injury such as age, cause, and traumatic brain injuries.
Rates:
Age-specific rates are calculated by dividing the number of events (i.e., counts) by the
population in the corresponding age group. By using rates, two differently sized
communities/regions can be compared to each other. Note that rates in which the
number of events is below 20 were not calculated for this report. Rates with less than 20
counts are deemed scientifically unreliable estimates.
Age-specific rates are calculated by dividing counts by the population of Kansas
children aged 0 to 19 years old or by the Kansas subpopulation of interest. Population
denominators are taken from estimates produced by the U.S. Census Bureau called the
* Database references:
1) Mortality: 2014 Kansas Vital Statistics, Bureau of Epidemiology and Public Health Informatics, KDHE
2) HD Data: 2014 Kansas Hospital Discharge Database, Kansas Hospital Association
3) EDV Data: 2013 Kansas Hospital Emergency Department Database, Kansas Hospital Association.

A p p e n d i x | ii
ii
Bridged-race Population Estimates. To be consistent with other KDHE publications,
2005-2014 midyear population estimates produced for each year are used, rather than
using the most recent estimate. For example, a 2005 rate will be based on the Kansas
population estimate published in 2005 (2005 vintage), rather than using the most recent
2005 population estimate (2015 vintage). The one exception is the 2010 population
estimates. Bridged-race population estimates for 2010 are based on the April 1, 2010
actual census counts. Information on the Bridged Race estimates can be found at
http://www.cdc.gov/nchs/about/major/dvs/popbridge/datadoc.htm. The Census Bureau
methodology for creating the population estimates can be found at
http://www.census.gov/popest/topics/methodology/.
Cause Coding:
Causes are determined by using an injury matrix that is recommended by Safe States
Alliance. This is a system that uses the diagnosis code (hospital discharge and
emergency department databases) and underlying cause (mortality database) to give a
cause and intent to an injury. This report only uses unintentional injury deaths among
children 0 to 19 years old. Further information on the coding matrix can be found in
appendix vi and vii.
Data are selected and coded for hospital discharges according to the Consensus
Recommendations for Using Hospital Discharge Data for Injury Surveillance from the
Safe States Alliance. This method codes injuries based on e-code using the injury
matrix provided by the CDC (appendix vi). Data for emergency department is similar to
hospital discharge but closely follows the selection method from State Injury Indicators:
Instructions for Preparing 2014 Data from the Centers for Disease Control and
Prevention. Mortality Data is coded using the ICD-10 injury matrix provided by the CDC
(appendix vii). This is similar to the method described in Instructions for Preparing 2014
Data but uses a different coding scheme.
Possible Explanations for Low Rates:
Low rates in Geary and Riley County may be due to the fact that there are a very high
number of military families living in this area. Military families are more likely to use
military hospitals (federal) for care than community hospitals thus excluding these cases
form our analysis and potentially decreasing the injury rates in these areas.
Another possible consideration of this data is proximity of Northeast counties to
Children’s Mercy Hospital in Kansas City, Missouri. Due to its location, many children
who reside in the Northeast Kansas counties may receive care from this hospital and
are not recorded in the Kansas hospital discharge database. Children’s Mercy is a
leading caregiver for children in the Midwest. Children from Kansas, Nebraska,
Missouri, and Iowa receive care there. This affects all children in Kansas but we believe
especially children in the Northeast Trauma Region.

A p p e n d i x | iii
iii
Confidence Intervals:
Confidence intervals are a range around an estimate that shows how precise a
measurement is. By comparing confidence intervals you can make a quick statistical
comparison of two estimates. Confidence intervals around rates are calculated using
the methods described in the Technical Appendix from Vital Statistics of United States
1999 Mortality from National Center for Health Statistics (NCHS). This method uses a
normal distribution for confidence intervals of events of 100 or more and poisson
distribution for events below 100. The method used to calculate confidence intervals for
death rates is used for calculation of confidence intervals for hospital discharge and
emergency department visits rates.
Interpreting Confidence Intervals:
In public health we try to make comparisons between two groups such as, was Group A
healthier than Group B. These groups can be defined by numerous characteristics such
as counties, states, races, gender and age groups. Confidence intervals are one of the
tools we can use to tell if two groups are actually different.
In this report many numbers and rates are provided. They serve as estimates of the true
numbers and rates in a community. In a perfect world we would be able to obtain true
values for a question like “how many children went to the emergency department due to
snake bites last year?” but many things can happen that make this impossible such as
missing information, lost records, and miscoding. These things add random error to an
estimate. Although these numbers are the most accurate we can provide, there is room
for random error in any estimate.
We must account for random error before we can say that two groups are statistically
different. One way to measure random error is to estimate a confidence interval and use
that interval to determine if estimates are actually different from a comparison.
What is a confidence Interval?
A 95% confidence interval is a range (interval) around our estimate that says this range
has a 95% probability of containing the true value. The size of a confidence interval can
be affected by two things; the size of the sample and the variance (the variability of a
sample). If the variance is unchanging by increasing the size of a sample it makes the
confidence interval narrower. Therefore if two samples have the same variance the
sample with the larger size will always have a narrower confidence interval. A sample
refers to whatever groups you are comparing. In this report our samples are age
groups, years, counties, and Kansas Trauma Regions.

A p p e n d i x | iv
iv
How do I interpret a confidence interval?
Two scenarios are provided as examples using the chart on the next page. This chart
Ex1) shows the rate of unintentional injury deaths of population density groups and the
confidence interval of those rates. The line at the top of the blue bar is the visual
representation of the confidence interval, the top of the line is the highest value of the
confidence interval (upper limit) and the bottom of the line is the lowest value of the
confidence interval (lower limit).
Sample size affects the size of the confidence interval. Frontier communities which have
a smaller population have a wide confidence interval and urban communities which
have a larger population and a narrower confidence interval.
When confidence intervals around estimates of rates for two groups overlap that means
that there is a chance both groups have the same exact value of the rate. If this is true
then we say that they are not statistically different. When two confidence intervals
around estimates of rates for two groups do not overlap, they do not share the same
true value and thus are statistically different.
2014 estimates:
Motor Vehicle Falls Poison Struck by/Against
Lower 95% CI 22.0 24.5 9.2 5.9
Rate 25.4 28.0 11.4 7.7
Upper 95% CI 29.1 31.9 14.0 9.9
0
10
20
30
40
50
60
70
UIH
D Rate
per 1
00
,0
00
children
Year
Ex1. Trend of Top Causes of Unintentional Injury Hospital
Discharge (UIHD) Rates Among Children 0-19 Years Old,
Kansas 2005-2014
Motor Vehicle Crash
Falls
Poison
Struck by/Against
A p p e n d i x | v
v
Scenario 1
In 2014, was the rate of unintentional injury hospital discharges caused by falls higher
than injuries caused by motor vehicle crashes?
We can compare these groups by chart or table. Looking at the chart you can see that
the confidence intervals are around the motor vehicle and falls UIHD rates overlap. The
Motor vehicle interval is 22.0-29.1 per 100,000 children and the falls interval is 24.5-
31.9 per 100,000 children. Because the confidence intervals around the UIHD rate for
motor vehicle crash and falls causes overlap we can say that there is no statistically
significant difference among UIHD rates. These rates are similar as one cause is not
significantly higher than the other.
Scenario 2
In 2014, was the rate of unintentional injury hospital discharges caused by poisonings
higher than injuries caused by motor vehicle crashes?
Again, we can compare these cause of injury groups by chart or table. Looking at the
chart you can see that the confidence intervals are around the motor vehicle and
poisoning UIHD rates do not overlap. The Motor vehicle interval is 22.0-29.1 per
100,000 children and the falls interval is 9.2-14.0 per 100,000 children. Because the
confidence intervals around the UIHD rate for motor vehicle crash and poisoning causes
do not overlap we can say that there is a statistically significant difference between
causes of UIHD groups. In 2014, motor vehicle crashes account for a higher UIHD rate
compared to poisonings.
A word of caution:
The confidence interval is a good measure of statistical significance but not the same as
a statistical test. Sometimes two groups will have overlapping confidence intervals but
have a statistically significant difference nonetheless. In most situations this statistical
test is not necessary but extra analysis can be done if requested or needed.
Information for interpreting confidence intervals was adapted from:
Aschengrau, A., & Seage III, G. (2008). Essentials of epidemiology in public health. (2
ed., pp. 307-341). Sudbury, Massachusetts: Jones and Bartlett Publishers.
Washing State Department of Health. Guidelines for using confidence intervals for
public health assessment. (2012, July 13). Retrieved from
http://www.doh.wa.gov/Portals/1/Documents/5500/ConfIntGuide.pdf

A p p e n d i x | vi
vi
External Cause of Injury Matrix
External Cause of Injury Matrix for ICD-9-CM Adapted from CDC Table
Unintentional Cause ICD-9 E-Code
All injury E800-E869, E880-E929
Cut/pierce E920.0-.9
Drowning/submersion E830.0-.9, E832.0-.9, E910.0-.9
Fall E880.0-E886.9, E888
Fire/burn E890.0-E899, E924.0-.9
Firearm E922.0-.3,.8, .9
Machinery E919 (.0-.9)
Motor vehicle traffic E810-E819 (.0-.9)
Pedal cyclist* E800-E807 (.3), E810-E819 (.6), E820-E825 (.6), E826.1,.9, E827-E829(.1)
Pedestrian* E800-807(.2), E810-E819 (.7), E820-E825(.7), E826-E829(.0)
Transport, other
E800-E807 (.0,.1,.8,.9), E820-E825 (.0-.5,.8,.9), E826.2-.8, E827-E829 (.2-.9), E831.0-.9, E833.0-E845.9
Natural/environmental* E900.0-E909, E928.0-.2
Overexertion E927.0-.4,.8-.9
Poisoning E850.0-E869.9
Struck by, against E916-E917.9
Suffocation E911-E913.9
Other specified or unspecified
Other specified and classifiable
E846-E848, E914-E915, E918, E921.0-.9, E922.4,.5, E923.0-.9, E925.0-E926.9, E928(.3-.7), E929.0-.5
Other specified, not elsewhere classifiable E928.8, E929.8
Unspecified E887, E928.9, E929.9
* For the purpose of this document, pedal cyclist and pedestrian unintentional injury causes include motor vehicle traffic and other cyclist/pedestrian-related injuries. Natural/environmental injuries include bites and stings.

A p p e n d i x | vii
vii
External Cause of Death Mortality Matrix
External Cause of Death Mortality Matrix for ICD-10 Adapted from CDC Table
Unintentional Mechanism ICD-10 Codes
All Unintentional Injury V01-X59, Y85-Y86
Cut/Pierce W25-W29, W45, W46
Drowning/Submersion W65-W74
Fall W00-W19
Fire/Burn X00-X19
Firearm W32-W34
Machinery W24, W30-W31
Motor Vehicle, Traffic
[V02–V04](.1,.9), V09.2, [V12–V14](.3–.9), V19(.4–.6), [V20–V28](.3–.9), [V29–V79](.4–.9), V80(.3–.5), V81.1, V82.1, [V83–V86](.0–.3), V87(.0–.8), V89.2
Pedal cyclist* V10–V18, V19(.0–.6,.8,.9)
Pedestrian* V01–V06, V09(.0–.3,.9)
Other Land Transport
[V20–V28](.0–.2), [V29–V79](.0–.3), V80(.0–.2,.6–.9), [V81–V82](.0,.2–.9), [V83–V86](.4–.9), V87.9, V88(.0–.9), V89(.0,.1,.3,.9)
Other Transport V90–V99
Natural/Environmental* W42–W43, W53–W64, W92–W99, X20–X39, X51–X57
Overexertion X50
Poisoning X40-X49
Struck by or Against W20-W22, W50-W52
Suffocation W75-W84
Other Specified or Unspecified Other Specified, classifiable W23, W35–W41, W44, W49, W85–W91, Y85
Other Specified, NEC X58,Y86
Unspecified X59
* For the purpose of this document, pedal cyclist and pedestrian unintentional injury causes include motor vehicle traffic and other cyclist/pedestrian-related injuries. Natural/environmental injuries include bites and stings.

A p p e n d i x | viii
viii
Detailed Causes: Morbidity
ICD-9-CM Detailed Causes: (Emergency Department Visits and Hospital Discharges)
ICD-9-CM Causes Selected Exact Mechanisms
Cut / Pierce ⋅ Accident caused by other specified cutting and piercing instrument or object
⋅ Accident caused by knives, swords, and daggers
⋅ Accident caused by unspecified cutting and piercing instrument or object
⋅ Accident caused by other hand tools or implements
⋅ Accident caused by powered household appliances and implements
Falls ⋅ Other accidental fall from one level to another
⋅ Accidental fall from playground equipment
⋅ Fall from other slipping, tripping, or stumbling
⋅ Unspecified fall
⋅ Accidental fall from bed
Fire/Burn ⋅ Accident caused by hot liquids and vapors including steam
⋅ Accident caused by other hot substance or object
⋅ Accident caused by hot (boiling) tap water
⋅ Ignition of highly inflammable material
⋅ Accident caused by controlled fire not in building or structure
Motor Vehicle Crash All crashes occurred in traffic (roads)
⋅ Other Motor Vehicle (MV) crash with unmoving motor vehicle injuring driver of motor vehicle other than motorcyclist
⋅ MV crash due to loss of control, without collision on the highway injuring the passenger in the motor vehicle other than a motorcyclist
⋅ MV traffic accident with non-motor transport vehicle injuring the pedal cyclist
⋅ MV crash with pedestrian injuring the pedestrian
Natural/Environmental ⋅ Dog bite
⋅ Other specified injury caused by animal
⋅ Bite of venomous arthropod (spider)
⋅ Accident due to abandonment or neglect of infant and helpless person
⋅ Bite of non-venomous arthropod (spider)
Poisoning ⋅ Accidental poisoning by agents primarily affecting cardiovascular system (heart, blood, and blood vessels)
⋅ Accidental poisoning by other specified tranquilizers
⋅ Accidental poisoning by antidepressants
⋅ Accidental poisoning by anticonvulsant and anti-Parkinsonism drugs
Pedal Cyclist ⋅ Pedal cyclist accident injuring the pedal cyclist

A p p e n d i x | ix
ix
⋅ MV traffic accident with non-motor transport vehicle injuring the pedal cyclist
Pedestrian ⋅ Other motor vehicle non-traffic accident of other and unspecified nature injuring the other specified person
⋅ CO poisoning, jumping/falling/pushed by a car, hit by object thrown from a car
⋅ MV crash with pedestrian injuring the pedestrian
Other Transport ⋅ Non-traffic accidents involving other off-road motor vehicle (i.e. All-Terrain Vehicle) injuring the driver other than a motorcycle
⋅ Accident involving animal being ridden injuring the rider of the animal
⋅ Non-traffic accident involving other off-road motor vehicle injuring the motorcyclist
⋅ Non-traffic accident involving other off-road motor vehicle injuring the passenger in the motor vehicle other than a motorcycle
⋅ Non traffic accident involving other off-road motor vehicle injuring a unspecified person
Note: Other transport injuries are made up of accidents that occur off of a public highway. All-terrain vehicles (ATVs) make up a significant proportion of these injuries. From 2005-2009 there was 545 other transport unintentional hospital discharges among those 0-14 years old. Using methodology from the West Virginia University it is predicted that 47% (n=545) of all other transport injuries were ATV accidents. 20% of these injuries (n=106) were due to an animal being ridden.
Struck By/Against
⋅ Foreign body accidentally entering other orifice (ear, urinary system, reproductive organs, and stomach and intestine)
⋅ Caught accidentally between objects
⋅ Accident caused by air gun
⋅ Accident caused by fireworks
⋅ Accidents involving other vehicles, not elsewhere classifiable
Other Specified
⋅ Other accident caused by striking against or being struck by accidentally by objects or persons
⋅ Striking against or struck accidentally by objects or persons in sports
⋅ Struck by falling object
⋅ Strike against or struck accidentally by other object in sports with subsequent fall
⋅ Strike against or struck accidentally by other stationary object without subsequent fall

A p p e n d i x | x
x
Detailed Causes: Death
ICD-10 Detailed Causes: (Deaths)
ICD-10 Causes Selected Exact Mechanisms
Falls ⋅ Unspecified fall
Fire/Burn ⋅ Exposure to uncontrolled fire in building or structure
Motor Vehicle Crash Other Motor Vehicle (MV) crash with unmoving motor vehicle injuring driver of motor vehicle other
⋅ Car occupant injured in collision with car, pick-up truck or van, injuring passenger
⋅ Car occupant injured in non-collision transport accident, injuring passenger
⋅ Pedestrian injured in collision with car, pick-up truck or van in a traffic accident
⋅ Car occupant injured in collision with fixed or stationary object, injuring passenger
⋅ Car occupant injured in collision with heavy transport vehicle or bus, injuring passenger
Suffocation ⋅ Accidental suffocation and strangulation in bed
⋅ Other accidental hanging and strangulation
⋅ Inhalation and ingestion of other objects causing obstruction of respiratory tract
Drowning ⋅ Drowning and submersion while in swimming pool
⋅ Unspecified drowning and submersion
⋅ Drowning and submersion while in bathtub
⋅ Drowning and submersion while in natural water
Pedestrian ⋅ Pedestrian injured in collision with car, pick-up truck or van, non-traffic
Other Land Transport ⋅ Driver of all-terrain or other off-road vehicle injured in non-traffic accident
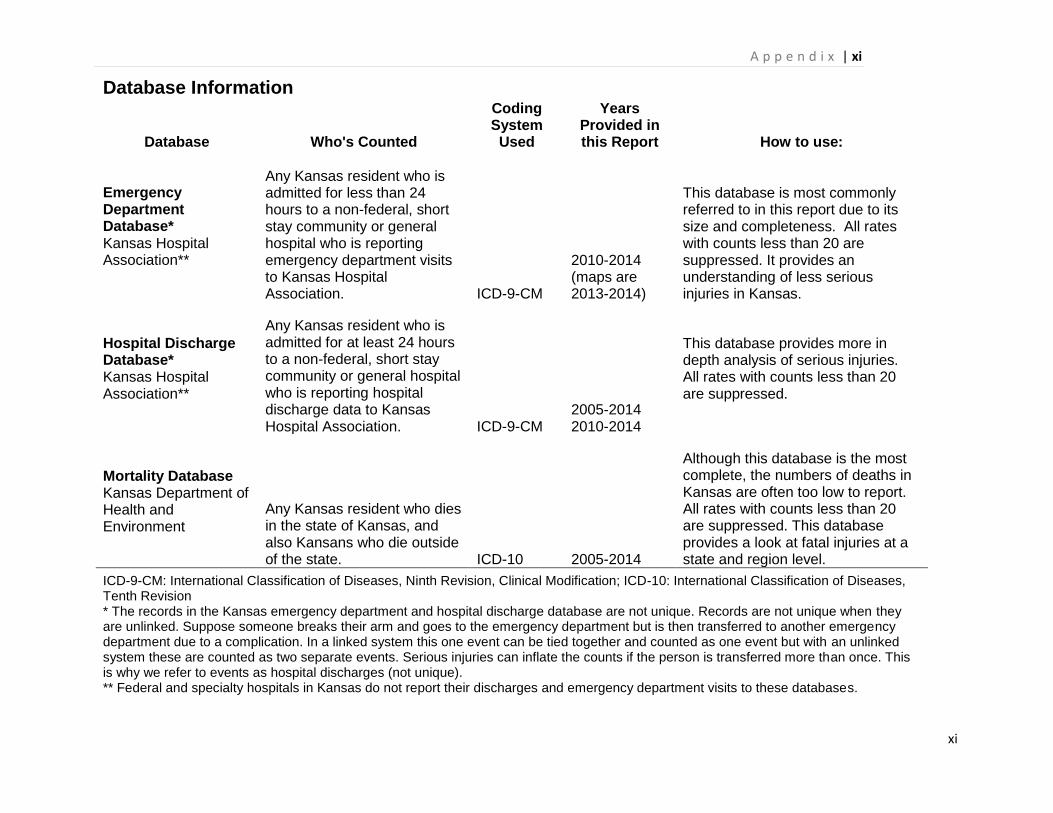
A p p e n d i x | xi
xi
Database Information
Database Who's Counted
Coding System Used
Years Provided in this Report How to use:
Emergency Department Database* Kansas Hospital Association**
Any Kansas resident who is admitted for less than 24 hours to a non-federal, short stay community or general hospital who is reporting emergency department visits to Kansas Hospital Association. ICD-9-CM
2010-2014 (maps are 2013-2014)
This database is most commonly referred to in this report due to its size and completeness. All rates with counts less than 20 are suppressed. It provides an understanding of less serious injuries in Kansas.
Hospital Discharge Database* Kansas Hospital Association**
Any Kansas resident who is admitted for at least 24 hours to a non-federal, short stay community or general hospital who is reporting hospital discharge data to Kansas Hospital Association. ICD-9-CM
2005-2014 2010-2014
This database provides more in depth analysis of serious injuries. All rates with counts less than 20 are suppressed.
Mortality Database Kansas Department of Health and Environment
Any Kansas resident who dies in the state of Kansas, and also Kansans who die outside of the state. ICD-10 2005-2014
Although this database is the most complete, the numbers of deaths in Kansas are often too low to report. All rates with counts less than 20 are suppressed. This database provides a look at fatal injuries at a state and region level.
ICD-9-CM: International Classification of Diseases, Ninth Revision, Clinical Modification; ICD-10: International Classification of Diseases, Tenth Revision * The records in the Kansas emergency department and hospital discharge database are not unique. Records are not unique when they are unlinked. Suppose someone breaks their arm and goes to the emergency department but is then transferred to another emergency department due to a complication. In a linked system this one event can be tied together and counted as one event but with an unlinked system these are counted as two separate events. Serious injuries can inflate the counts if the person is transferred more than once. This is why we refer to events as hospital discharges (not unique). ** Federal and specialty hospitals in Kansas do not report their discharges and emergency department visits to these databases.

A p p e n d i x | xii
xii