Unified Soil Classification System Training Part B - USCS using Laboratory Data.
41
Unified Soil Classification Unified Soil Classification System Training System Training Part B - USCS using Part B - USCS using Laboratory Data Laboratory Data
-
Upload
ronald-osborne -
Category
Documents
-
view
222 -
download
0
Transcript of Unified Soil Classification System Training Part B - USCS using Laboratory Data.

Unified Soil Classification Unified Soil Classification System TrainingSystem Training
Part B - USCS using Laboratory DataPart B - USCS using Laboratory Data

Comparison of Particle Size Comparison of Particle Size DefinitionsDefinitions USDA
cobblessandclay gravel
3”2 .05 mm # 4
silt
USCS
cobblessandfines gravel
.074 mm # 4 3”
# 200

ASTM StandardsASTM Standards
Lab Data Classification is byLab Data Classification is by
ASTM D2487 ASTM D2487
Classification of Peat Samples, see Classification of Peat Samples, see
ASTM D 4427ASTM D 4427
Field Classification is by D2488Field Classification is by D2488

Comparison of Particle Size Comparison of Particle Size DefinitionsDefinitions

Activity 2Activity 2 - Particle Size Comparisons - Particle Size Comparisons

USCS Flow Chart - Activity 3USCS Flow Chart - Activity 3

Flow Chart OverviewFlow Chart Overview
Two Broad CategoriesTwo Broad Categories– Fine-Grained - 50% or more finer than the Fine-Grained - 50% or more finer than the
# 200 sieve# 200 sieve
– Coarse-Grained - Less than 50% finer than Coarse-Grained - Less than 50% finer than the # 200 sievethe # 200 sieve

USCS OverviewUSCS Overview
F in e -G ra in ed
S o ils
5 0 % or M o rep a sse s the# 2 00 sie ve
C o a rse-G ra in ed
S o ils
L e ss tha n 5 0 %is f ine r th an
th e # 2 0 0 s ie ve
M e a su re %F in e r th an
# 20 0 S ie ve

Flow Chart OverviewFlow Chart Overview
Fine-Grained SoilsFine-Grained Soils– Organic ( LL ratio < 0.75 )Organic ( LL ratio < 0.75 )
– Inorganic (no odor and LL ratio not < 0.75)Inorganic (no odor and LL ratio not < 0.75)
– Classify by LL, PIClassify by LL, PI
– Modifiers are H or L for LL value, C or M Modifiers are H or L for LL value, C or M for plasticity and O for organicfor plasticity and O for organic

USCS OverviewUSCS Overview
O L
A ir-d ry LLis < 50
O H
A ir-D ry L Lis = o r > 50
O rg a n icS o ils
R a tio o f O ve n -d ryto A ir-d ryL L V a lu esis < 0 .75
C la ss ify b yP lo tt in g L L &
P I o n P la s tic ityC h a rt
In o rga n icS o ils
R a tio o f O ve n -d ryto A ir-d ryL L V a lu esis > 0 .75
D e te rm ineW h eth erO rg a n icO r n o t

Activity 4 - Organic Soil Activity 4 - Organic Soil
Solve 4 samplesSolve 4 samples

Abbreviations Fine-GrainedAbbreviations Fine-Grained
H - High LL ( H - High LL ( >> 50 ) 50 ) L - Low LL ( < 50 ) L - Low LL ( < 50 ) C - Plastic FinesC - Plastic Fines M - Nonplastic or slightly plastic M - Nonplastic or slightly plastic
finesfines O - OrganicO - Organic Pt - PeatPt - Peat

Activity 5 - Plasticity ChartActivity 5 - Plasticity ChartUnified Soil Classification System Plasticity Chart
0
10
20
30
40
50
60
0 10 20 30 40 50 60 70 80 90 100
LIQUID LIMIT
PL
AS
TIC
ITY
IND
EX CH
CL
ML
MH
CL-ML

Activity 5 - Plasticity Chart Activity 5 - Plasticity Chart
Solve 4 samplesSolve 4 samples

Activity 7 - Classify Fine-Activity 7 - Classify Fine-Grained Samples Grained Samples
Assume 6 samples are Assume 6 samples are not not
organicorganic and classify by USCS and classify by USCS

Flow Chart OverviewFlow Chart Overview
Coarse-Grained Soils - 3 GroupsCoarse-Grained Soils - 3 Groups
– Clean - Less than 5 % FinesClean - Less than 5 % Fines
– Dirty - More than 12 % FinesDirty - More than 12 % Fines
– Dual - From 5% to 12% Fines, Dual - From 5% to 12% Fines,
inclusiveinclusive

Coarse-grained SoilsCoarse-grained Soils
C le anC o a rse-G ra in ed
L e ss tha n 5 %fin er th an
# 2 00 sie ve
D u a lC o a rse-G ra in ed
F ro m 5 % to 1 2 %(in c lu s ive )f in e r th an
# 2 00 sie ve
D irt yC o a rse-G ra in ed
M o re tha n 1 2 %fin er th an
# 2 00 sie ve
L e ss tha n 5 0 %is f ine r th an# 2 00 sie ve

Abbreviations Sands and GravelsAbbreviations Sands and Gravels
G - GravelG - Gravel
S - SandS - Sand
P - Poorly GradedP - Poorly Graded
W - Well GradedW - Well Graded

Sieve AnalysesSieve Analyses
% fines = % finer than # 200 sieve
% sand = % finer # 4 minus % finer # 200
% gravel = % finer 3”minus % finer # 4

Percent Particle CategoriesPercent Particle Categories
To compute % Gravel subtract % finer To compute % Gravel subtract % finer
than # 4 from % finer than 3”than # 4 from % finer than 3”
To compute % Sand subtract % finer To compute % Sand subtract % finer
than # 200 from % finer than # 4than # 200 from % finer than # 4
Percent Fines is % finer than # 200Percent Fines is % finer than # 200

Activity 8Activity 8
For 7 samples, fill out ActivityFor 7 samples, fill out Activity
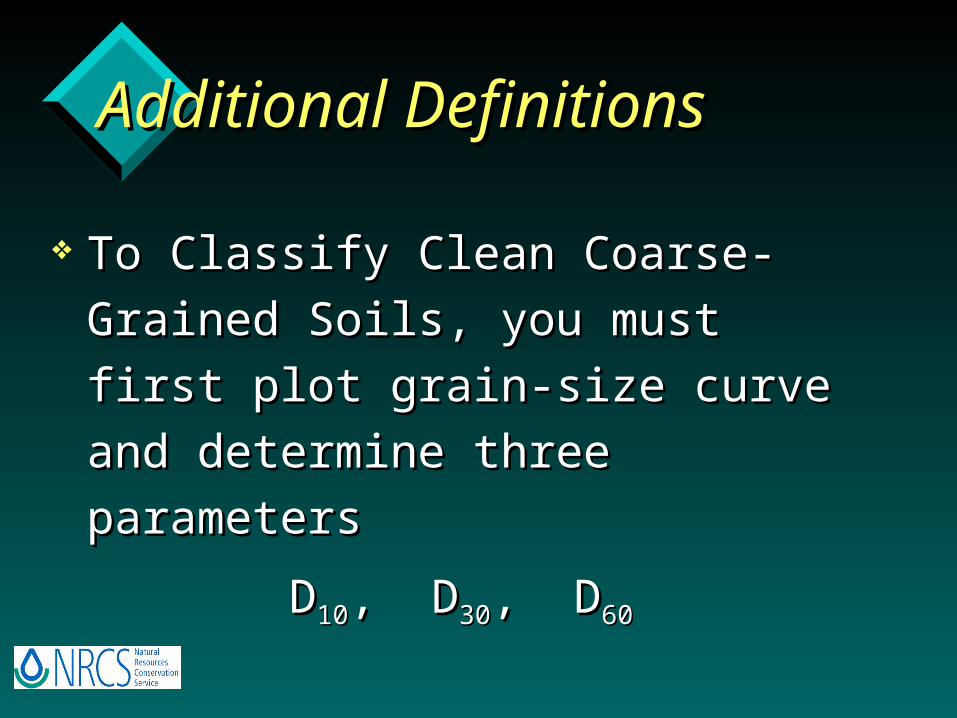
Additional DefinitionsAdditional Definitions
To Classify Clean Coarse-Grained Soils, To Classify Clean Coarse-Grained Soils,
you must first plot grain-size curve and you must first plot grain-size curve and
determine three parametersdetermine three parameters
DD1010, D, D3030, D, D6060

Determining DDetermining D1010, D, D3030, and D, and D6060
D10, millimeters
10
% f
iner
D30, millimeters
30
D60, millimeters
60

Computing CU and CCComputing CU and CC
10
60
D
DCU
6010
230
DD
DCC
Coefficient of Uniformity
Coefficient of Curvature
High Values Indicate Well-Graded Soil
Values Between 1-3 Indicate Well-Graded Soil

Activity 9Activity 9
Plot Curve from Data, compute Plot Curve from Data, compute
CU ValueCU Value

Activity 10Activity 10
Plot Curve from Data, compute Plot Curve from Data, compute
CC ValueCC Value

CCharacterizing Clean haracterizing Clean Sands and GravelsSands and Gravels
Particle SizeParticle Size
% F
iner
% F
iner Well gradedWell graded
Clean Well Graded Sands and Gravels have Clean Well Graded Sands and Gravels have less than 5 % fines and a wide range of less than 5 % fines and a wide range of particle sizes that are equally distributedparticle sizes that are equally distributed

Poorly GradedPoorly Graded Sands and GravelsSands and Gravels
Poorly gradedPoorly graded
% F
iner
% F
iner
Particle SizeParticle Size
Either Mostly One-Size Particle
Gap gradedGap graded
Particle SizeParticle Size
% F
iner
% F
iner
Or Gap-
Graded

Clean, Well/Poorly Graded Clean, Well/Poorly Graded DefinitionsDefinitions
SandsSands– less than 5 % less than 5 %
finesfines
– CU > 6CU > 6
– CC = 1-3CC = 1-3
GravelsGravels– less than 5 % less than 5 %
fines fines
– CU > 4CU > 4
– CC = 1-3CC = 1-3

Activity 11 - ProblemsActivity 11 - Problems
1. Verify % Fines - Coarse-Grained/Clean1. Verify % Fines - Coarse-Grained/Clean
2. Compute % Gravel and % Sand2. Compute % Gravel and % Sand
3. Note which predominates3. Note which predominates
4. Using provided CU and CC, Determine 4. Using provided CU and CC, Determine whether poorly or well gradedwhether poorly or well graded
5. Determine Correct USCS classification5. Determine Correct USCS classification

Activity 12Activity 12
Review Example SoilReview Example Soil

Activity 13Activity 13
Use Flow Chart, Classify SoilUse Flow Chart, Classify Soil

Activity 14 Summary of Classifications of Activity 14 Summary of Classifications of Coarse-Grained SoilsCoarse-Grained Soils
Clean Sands and Gravels (< 5% fines)Clean Sands and Gravels (< 5% fines)– Clean Poorly Graded Gravels GPClean Poorly Graded Gravels GP
– Clean Well Graded Gravels GWClean Well Graded Gravels GW
– Clean Poorly Graded Sands SPClean Poorly Graded Sands SP
– Clean Well Graded Sands SWClean Well Graded Sands SW

Dirty Coarse-Grained SoilsDirty Coarse-Grained Soils
If a sample has less than 50 % FinesIf a sample has less than 50 % Fines
And it has more than 12 % Fines, it is a And it has more than 12 % Fines, it is a
Dirty Coarse-Grained SoilDirty Coarse-Grained Soil
To Classify, follow the flow chart and To Classify, follow the flow chart and
the following stepsthe following steps
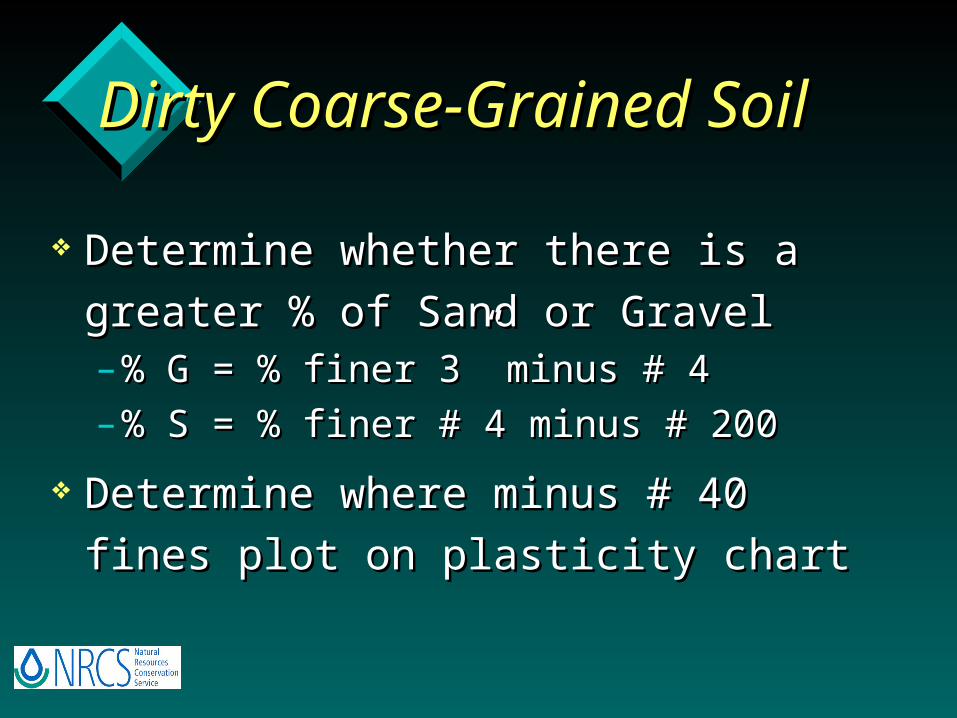
Dirty Coarse-Grained SoilDirty Coarse-Grained Soil
Determine whether there is a greater % Determine whether there is a greater %
of Sand or Gravelof Sand or Gravel– % G = % finer 3” minus # 4% G = % finer 3” minus # 4
– % S = % finer # 4 minus # 200% S = % finer # 4 minus # 200
Determine where minus # 40 fines plot Determine where minus # 40 fines plot
on plasticity charton plasticity chart

Dirty Sands and GravelsDirty Sands and Gravels
SC - Fines Plot Above A-LineSC - Fines Plot Above A-Line SM - Fines Plot Below A-LineSM - Fines Plot Below A-Line SC-SM - Fines Plot in Hatched ZoneSC-SM - Fines Plot in Hatched Zone
GC - Fines Plot Above A-LineGC - Fines Plot Above A-Line GM - Fines Plot Below A-LineGM - Fines Plot Below A-Line GC-GM - Fines Plot in Hatched ZoneGC-GM - Fines Plot in Hatched Zone
Sands
Gravels

Activity 16 - ProblemsActivity 16 - Problems

Activity 17 - Example of Activity 17 - Example of Classifying Dual-Classification Classifying Dual-Classification Coarse-Grained SoilCoarse-Grained Soil

Activity 18 - ProblemActivity 18 - Problem

Activity 20 - Review QuestionsActivity 20 - Review Questions
Activity 21 - Comprehensive Activity 21 - Comprehensive ProblemsProblems