UNICEF: Zambézia Equity Priority Districts Baseline Survey ... · Zambézia Equity Priority...
25
BASELINE SURVEY REPORT August 18, 2015 UNICEF: Zambézia Equity Priority Districts Baseline Survey Report Report Authors: Moon TD, Blevins M, Green AF, González-Calvo L This report was made possible through support provided by UNICEF to Friends in Global Health and Vanderbilt University Institute for Global Health. i
Transcript of UNICEF: Zambézia Equity Priority Districts Baseline Survey ... · Zambézia Equity Priority...

BASELINE SURVEY REPORT August 18, 2015
UNICEF:
Zambézia Equity Priority Districts Baseline Survey Report
Report Authors: Moon TD, Blevins M, Green AF, González-Calvo L
This report was made possible through support provided by UNICEF to Friends in Global Health and Vanderbilt University Institute for Global Health.
i

This document is available in printed and online versions. Online documents can be located at https://starbrite.vanderbilt.edu/rocket/index.php?doc_id=11219 Additional information can be obtained from:
Vanderbilt Institute for Global Health 2525 West End Avenue, Suite 750
Nashville, Tennessee, USA Phone: (615) 343 -8264
ii

Table of Contents Introduction 1 Methods 2 Results 7
1 - Data Collection and Survey Response 7 2 - Vaccine Coverage 10 3 - Acute respiratory Illness 13 4 – Health Care Access and Satisfaction 14 5 – Household Dietary Access 15 6 – Demographics and Potential Barriers/Facilitators to Child Vaccination 16 7 – Determinants of Full Vaccination 20
Limitations 22
iii

INTRODUCTION UNICEF Mozambique (UNICEF-M) is leading an initiative to support Mozambique efforts to increase equity in access to immunization services through a UNICEF Global Alliance for Vaccines and Immunization agreement (GAVI). Together with Mozambican Ministry of Health (MoH), UNICEF-M is conducting a country equity analysis of integrated vaccination strategies in 2 select districts of the province of Zambézia. The analysis of intervention effectiveness in these districts will inform the MoH’s country plan to scale up the integrated vaccine strategy in order to decrease immunization inequities and increase vaccine coverage in the country.
UNICEF-M’s preliminary analysis of immunization in Mozambique revealed that inequities are mostly geographically determined and that Zambézia Province is home to the most deprived populations, have the lowest coverage rates of high impact interventions, and is home to most of the “unreached” in terms of immunization coverage. Economically, the province is the most disadvantaged in terms of allocation of resources and health infrastructure.
In December 2013, UNICEF Mozambique supported a review meeting in Zambézia Province. Further analysis of data showed that five districts are most disadvantaged. Two of these districts, Milange and Gurùé, were chosen with the Ministry of Health (MoH) and the Provincial Health Directorate (DPS, Direcção Provincial de Saúde) to start intensified support as a proof of concept of the REC approach towards immunization coverage combined with district planning.
In Zambézia Province, an immunization survey conducted by the DPS and supported by the WHO in 2012 revealed that the quality and regular availability of services were a crucial determinant of access to immunization. The major obstacles identified include:
• Distance from health facilities: 58.8%; • Waiting time: 8.8% • Non availability of vaccinators: 5.5% • Non availability of vaccines: 11.3%
During Q1 of 2013, Tools for Health Facility (HF) micro-planning based on the Reach Every District / Reach Every Child (RED/REC) guidelines were revised in consultation with WHO, MoH, and DPS Zambézia.
In March 2014, micro-planning workshops were conducted in Zambézia’s two pilot districts (Milange and Gurùé), involving provincial managers and supervisors, district level managers, Health Facilities workers and Community Health workers. Plans for the implementation of outreach activities at HF level were developed, validated and embedded in district plans. The workshop also served to field test and fine tune the national adapted tools, renamed to Reach Every Community (REC). Adaptations and modifications were finalized by UNICEF, WHO, and MoH and were proposed to MoH for final endorsement at the end of the quarter.
The MoH invested in the REC approach through Health Systems Strengthening (HSS) funds available from GAVI, which entailed full scale-up in 4 priority provinces (including Zambézia) starting from Q4 2014. The approach will be then expanded to the remaining 6 provinces of the country in the second and third year of HSS implementation.
1

In addition to UNICEF-M’s preliminary analyses, reliable baseline and endline data from the two selected districts is crucial for final analysis of the strategy.
For this, UNICEF and the Vanderbilt Institute for Global Health (VIGH) have collaborated to conduct a baseline survey in Gurùé and Milange districts (in Zambézia province) to measure the impact of the Mozambican adapted REC strategy. Data collected in these districts through the UNICEF-VIGH collaboration will complement results recently gathered from a VIGH implemented population-based household survey in Zambézia Province as part of the USAID funded Strengthening Communities through Integrated Programming (SCIP), known locally as the Ogumaniha program.
In 2009, World Vision was awarded by USAID–Mozambique a five-year multi-sector grant called “SCIP - OGUMANIHA” to improve the health and livelihoods of children, women and families in the Province of Zambezia, Republic of Mozambique. The Ogumaniha program has been implemented under the leadership of World Vision (as primary recipient of the funds) with the Government of Mozambique, through a consortium which includes: Vanderbilt Institute for Global Health (VIGH) and Vanderbilt’s affiliate, Friends in Global Health (FGH), Adventist Development and Relief Agency (ADRA), Johns Hopkins University Center for Communication Programs (JHU/CCP), International Relief and Development (IRD) and Red Cross Mozambique/Cruz Vermelha Mozambicana (CVM).
VIGH and its local affiliate Friends in Global Health (FGH) conducted a baseline survey (Ref 233/CBNS/10) in 2010 and the above mentioned final survey in June 2014. Data collected in these survey initiatives will provide insight into the multidimensional indicators of capabilities and determinants of health among residents of Zambézia Province. This evaluation framework offers a holistic view of the overall impact of intervention efforts, and it provides an empirical basis for modeling intervention strategies that would have a wider applicability beyond this project. The survey was designed to obtain population-based data for all the indicators selected for the OGUMANIHA project and to evaluate the impact of this health and community-strengthening project. Specifically, information was collected on demographics, health events and health care seeking behavior, nutrition, agricultural practices, education, housing, income and consumption, social barriers, individual empowerment, and mental health.
METHODOLOGY
A population-based survey was conducted in the districts of Milange and Gurùé in the Province of Zambézia. The unit of analysis is the household (HH) level. Women are more knowledgeable of children's health events, which represent a major focus of this survey. For this reason and because men are more likely to be out of the house during the day time which could lead to non-response bias, we will limit the interviews to women >15 years old who head the household. The female head of household is defined as the woman who is the main partner of the male head of that particular household. Interviews will be conducted by one interviewer with the female head of household in each household selected in the sample.
Sampling Frame:
2

The sampling frame for the baseline survey relied on the 2007 Mozambique Population and Housing Census. A list of Enumeration Areas (EA) were made available, with basic housing and population information and cartographic materials. There are an estimated 918,025 households in Zambézia, which is divided into 9,073 EA. There are 155,202 urban HH (1,458 EA) and 762,823 rural HH (7,615 EA).
The National Institute of Statistics (INE) for the Republic of Mozambique is charged with collecting census information of residents. In recent Province of Zambézia census 2007 results, there are 3,848,276 residents of which 548,466 (14%) reside in urban areas. The Province of Zambézia is divided into 17 districts: Cidade de Quelimane (193,343), Alto Molocue (271,650), Chinde (119,898), Gile (169,285), Gurue (297,935), Ile (289,542), Inhassunge (91,196), Lugela (135,485), Maganja da Costa (276,881), Milange (498,635), Mocuba (300,628 ), Mopeia (115,291), Morrumbala (358,915), Namacurra (186,410), Namarroi (125,999), Nicoadala (231,850), and Pebane (185,333).
We collected representative samples which allowed for general, district-wide estimates.
Sample Size:
The required number of EA selected and the number of HH interviewed in each EA was contingent on the desired precision within the survey budget1. The number of HH interviewed is a function of the cost ratio and intra-cluster correlation (ICC). Cost ratio represents the cost of interviewing a new EA compared to the cost of interviewing an additional HH, C1/C2. ICC measures the similarity of the HH on one survey characteristic within an EA.
Table 1 gives sample size estimates for surveys of 2 strata. The proportion of interest is conservatively set at p = 0.5. Based on average intra-cluster correlations for selected indicators averaged over 48 different DHS surveys, we set ICC=0.15.
Based on preliminary calculations performed by VIGH statisticians and the Mozambican National Institutes of Statistics (INE), survey´s were collected in 16 households in one hundred ten (110) EA´s across the two districts amounting to 1,760 surveys.
Table 1: Census information for cluster survey population
Districts Population Households Enumeration Areas
Gurùé 297,935 69,060 755
Milange 498,635 120,980 1,030
Total 796,570 190,040 1,785
3

Table 2: Sample size for cluster survey
District EA sampled Households
sampled per EA§
Total Households§ Precision1
Precision of difference2
Gurùé 50 16 800 8.2% 9.7% Milange 60 16 960 7.5% 8.8%
Total 110 - 1760 5.5% 6.5% EA=enumeration area; ICC=intra cluster correlation is equal to 0.29. 1Precision of baseline proportion estimates. 2Precision of difference in endline minus baseline proportion estimates. §Only households with at least one child aged 12-23 months will be eligible for this survey. Survey Instrument
The survey instrument included standard socio-economic and health metrics. Such measurements will be placed in the framework of multidimensional capabilities. The survey instrument was designed based on current literature relevant to the specific area of measurement, using a multidisciplinary team of experts at Vanderbilt University with input from the SCIP consortium partners in Mozambique. Experts in the areas of public health, community nursing, nutrition, education and community development, water and sanitation, social anthropology and economic development.
The survey tool was extensively field tested during the SCIP program, under the supervision of key staff from the Latin American Public Opinion Project (LAPOP) at Vanderbilt. LAPOP specializes in conducting public opinion surveys throughout Latin America and the Caribbean. They have extensive expertise in questionnaire design, field testing of survey instruments, and training of field interviewers. Input was also obtained from Mozambican anthropologists from the University Eduardo Mondlane, to ensure that questions are appropriately worded and translated to the appropriate local languages in Zambézia.
As in the SCIP-Ogumaniha project, the survey was administered using a mobile data collection system and cell phone technology described below. Final field testing of the mobile version of the survey tool and training of interviewers was conducted by Dimagi-Mozambique, a software and database management organization operating out of Maputo.
Participant Interview and Data Collection
Household selection followed the same four-quadrant method used for SCIP-Ogumaniha, whereby the following steps were taken by surveyors: Divide the randomly selected EA into quadrants; Choose a central point within each quadrant of the EA; Spin a bottle (or ink pen) to select a direction in which to proceed; Choose the first household in this direction to serve as the starting point and then select the four nearest households. Use of this method is due to failed attempts at utilizing satellite maps with HH selection during the baseline survey. Constraints in the field required this altered approach for HH selection.
Interviews were conducted in the local language at randomly sampled HH within each EA. Participants listened to a scripted explanation of the purpose of the survey and were told that
4

survey responses are confidential and there are no tangible benefits from participating. Interviewees were given the opportunity to ask any questions and were asked to provide consent if they wanted to participate. Only those households with at least one child aged 12-23 months were eligible to proceed with the interview. The length of interview was anticipated to be less than ninety minutes.
Survey teams of five people each conducted survey implementation in each of the two target districts (Total 4 teams). Indicators of interest are the following:
• Immunization coverage of BCG (12-23 months)
• Immunization coverage of polio 3 (12-23 months)
• Percentage of infants aged 12-23 months who received three doses of DPT
• Immunization coverage (measles) (12-23 months)
• Full immunization coverage (disaggregated by: children who have received all vaccines in the program during their first year of life and children fully immunized up until 23m).
Survey Administration
Interviewers were contracted locally from among residents in or near the selected EA. Central training allowed for the most talented individuals to be identified naturally to serve in the role of team leads for each district. Survey materials, such as EA maps, were provided to interview teams. Interviewers were given a daily stipend which covered salary, food, accommodation and travel.
Electronic Data Capture
The complete data capture solution consists of a server component that runs on an office-based computer and a client application that runs on a mobile phone. The office-based computer was connected to the Internet through conventional broadband subscription (Digital Subscriber Line -- DSL) available in the FGH office. The data capture software was managed by a data manager who was responsible for quality control of the collected data and sending messages to each of the program mobile phones. The mobile phones were able to access the Internet through cellular data services. We employed a pre-paid data plan for each phone to purchase the communication bandwidth. Survey forms were loaded on the phone from the server through a managed single-click select-and-retrieve mechanism.
For each survey subject the field worker begins a new data entry form. All questions to answers are coded (no free text is used) and questions were enhanced with meta-data to allow data validation at the point of data entry. Validation logic for all numerical and date type data was used, and skip logic was used to omit questions that do not apply to the subject.
Statistical Analysis
This baseline report contains descriptive statistics for the UNICEF baseline evaluation. Descriptive analyses are displayed as tables with columns summarizing the two focal districts -
5
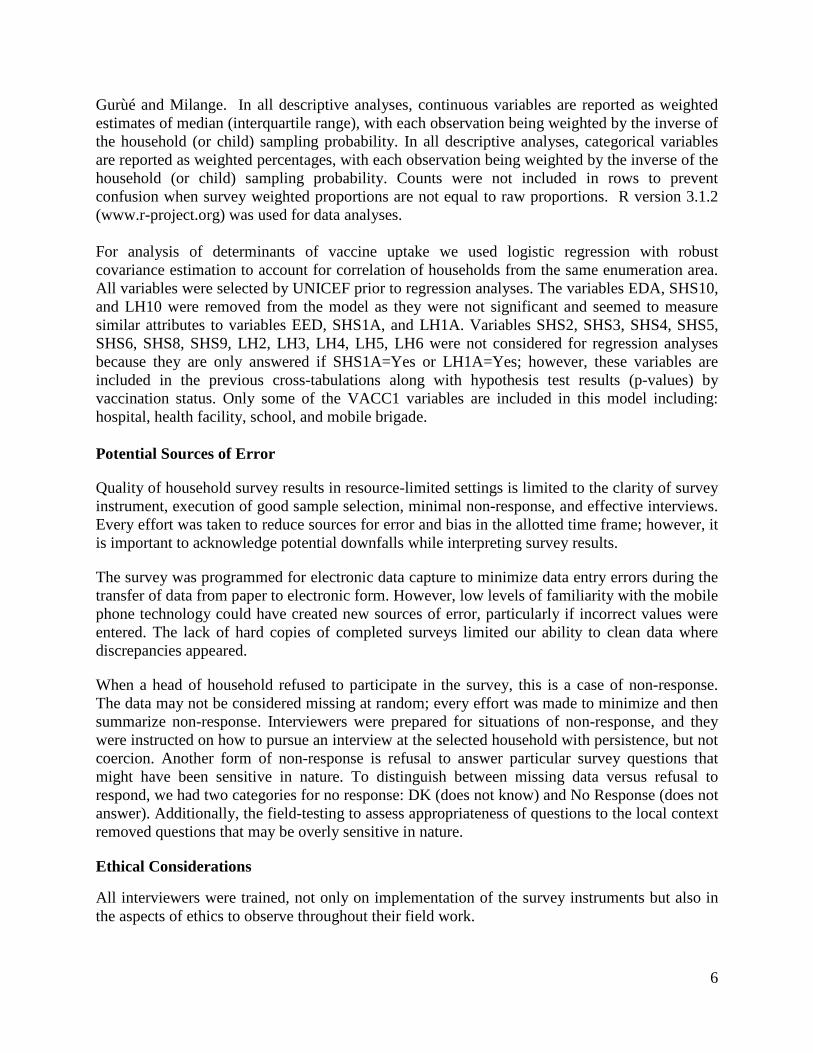
Gurùé and Milange. In all descriptive analyses, continuous variables are reported as weighted estimates of median (interquartile range), with each observation being weighted by the inverse of the household (or child) sampling probability. In all descriptive analyses, categorical variables are reported as weighted percentages, with each observation being weighted by the inverse of the household (or child) sampling probability. Counts were not included in rows to prevent confusion when survey weighted proportions are not equal to raw proportions. R version 3.1.2 (www.r-project.org) was used for data analyses. For analysis of determinants of vaccine uptake we used logistic regression with robust covariance estimation to account for correlation of households from the same enumeration area. All variables were selected by UNICEF prior to regression analyses. The variables EDA, SHS10, and LH10 were removed from the model as they were not significant and seemed to measure similar attributes to variables EED, SHS1A, and LH1A. Variables SHS2, SHS3, SHS4, SHS5, SHS6, SHS8, SHS9, LH2, LH3, LH4, LH5, LH6 were not considered for regression analyses because they are only answered if SHS1A=Yes or LH1A=Yes; however, these variables are included in the previous cross-tabulations along with hypothesis test results (p-values) by vaccination status. Only some of the VACC1 variables are included in this model including: hospital, health facility, school, and mobile brigade. Potential Sources of Error
Quality of household survey results in resource-limited settings is limited to the clarity of survey instrument, execution of good sample selection, minimal non-response, and effective interviews. Every effort was taken to reduce sources for error and bias in the allotted time frame; however, it is important to acknowledge potential downfalls while interpreting survey results.
The survey was programmed for electronic data capture to minimize data entry errors during the transfer of data from paper to electronic form. However, low levels of familiarity with the mobile phone technology could have created new sources of error, particularly if incorrect values were entered. The lack of hard copies of completed surveys limited our ability to clean data where discrepancies appeared.
When a head of household refused to participate in the survey, this is a case of non-response. The data may not be considered missing at random; every effort was made to minimize and then summarize non-response. Interviewers were prepared for situations of non-response, and they were instructed on how to pursue an interview at the selected household with persistence, but not coercion. Another form of non-response is refusal to answer particular survey questions that might have been sensitive in nature. To distinguish between missing data versus refusal to respond, we had two categories for no response: DK (does not know) and No Response (does not answer). Additionally, the field-testing to assess appropriateness of questions to the local context removed questions that may be overly sensitive in nature.
Ethical Considerations
All interviewers were trained, not only on implementation of the survey instruments but also in the aspects of ethics to observe throughout their field work.
6

Participation of each household was strictly voluntary. For each, verbal and written informed consent was requested of the female head of household at the moment of the visit for administration of the questionnaire.
Information about the consent, whether obtained or not, was registered in the database for statistical reasons. Participants in this study were informed of the strict confidentiality observed by the teams involved in this study. Databases were also maintained, guaranteeing confidentiality, and their access will be restricted only to authorized investigators with passwords incorporated in the electronic database.
Participation in this study was conditioned on adequate community involvement. As such, and to guarantee this involvement, community leaders were informed of the study and their approval was solicited to conduct the study in areas under their supervision.
The protocol for the survey was submitted for review and approval by the Zambézian Provincial Bioethics Committee in Quelimane, Mozambique and the Vanderbilt Institutional Review Board.
RESULTS
1. Data Collection and Survey Response
UNICEF data collection was carried out between 24 November and 17 December 2014. This time period represents the initiation of the rainy season in Zambézia Province, Mozambique, which typically spans a 4 month period from November to February. This period is typically when one would expect to see a high amount of respiratory, febrile, and diarrheal illnesses in children < 5 years of age. There were 1,650 surveys of households with children aged 12-23 months completed in 110 enumeration areas across Gurùé and Milange priority districts in Zambézia Province. Figure 1 displays the locations of 60 EA in Milange and 50 EA in Gurue along with the number of households recorded in the EA during the last national census. The overall response rate was good (98%), and non-response reasons were recorded (Table 3). Another 46 household surveys were administered that were excluded from this analysis, because the household did not have a child of eligible age.
7

Figure 1: Map of enumeration areas surveyed, UNICEF baseline survey 2014
Table 3: Survey Response, UNICEF baseline survey 2014
Gurùé Milange Combined (n=754) (n=896) (n=1650) Survey Collection Status, n(%) Participant quit 0 (0.0%) 21 (2.3%) 21 (1.3%) Spouse/partner ended interview 0 (0.0%) 8 (0.9%) 8 (0.5%) Safety concern 0 (0.0%) 2 (0.2%) 2 (0.1%) Technical error or problem with phone 0 (0.0%) 1 (0.1%) 1 (0.1%) Survey Complete 754 (100.0%) 864 (96.4%) 1618 (98.1%)
Table 4 contains summaries of basic household demographics. In order to proceed with the survey, female heads of household were required to confirm that they had at least one child of eligible age (12-23 months). Thus, the median age of female head of household respondents was young (25-26 years) with over 75% of women under age 30. A majority of survey respondents were married or in a common-law marriage (>85%). Many more respondents reported some Portuguese language understanding in Gurùé (58%) compared with Milange (18%). In Gurùé, 99% of respondents identified with the Elomwe ethnic group. In Milange, 20% of respondents identified with Elomwe ethnic group and 82% identified with Cinyanja (respondents may select more than one group). In Gurùé, 73% of respondents were Catholic; whereas, respondents from Milange reported a number of different religious affiliations. In Milange, 93.6% of respondents lived in a rural geographic area compared to 60% in Gurùé. Household electricity remains fairly uncommon with only 13.3% of households in Milange and 8.8% in Gurùé reporting. However
0

roughly 45% of respondents in both districts report owning a radio and 25.5% of respondents in Milange vs. 16.9% in Gurùé report owning a mobile phone.
Table 4: Basic Demographics: Female Head of Household, UNICEF baseline survey 2014
Gurùé Milange
(n=754) (n=896) Age of respondent (years) 26 (22 - 31) 25 (21 - 30) Marital Status Single 3.0% 8.3% Married/Common Law 91.4% 86.2% Widowed 2.7% 2.7% Divorced/Separated 2.8% 2.9% Education category None (0 years) 41.3% 39.2% Some primary (1-6 years) 46.1% 51.7% Primary completed (7 years) 4.8% 3.9% Some secondary (8-11 years) 5.0% 4.9% Secondary completed (12 years) 2.4% 0.3% Superior ( > 12 years) 0.4% 0.1% Household size 4 (4 - 5) 4 (3 - 5) Children under 5 1 (1 - 2) 1 (1 - 2) Any child under age 5 99.7% 98.9% Respondent understands Portuguese 57.7% 17.6% Primary language of household Chinyanja/Chichewua 0.0% 83.3% Echuabo 0.2% 0.4% Elomwe 89.8% 12.7% Other 0.0% 0.5% Portuguese 10.0% 3.1% Ethnic group identityd: Elomwe 99.1% 20.4% Echuabo 0.7% 0.3% Cisena 0.6% 0.0% Cinyanja 0.0% 82.2% Emakhuwa 0.1% 0.9% Religion Catholic 73.1% 37.1% Protestant 11.8% 28.9% Evangelical and Pentecostal 7.4% 20.9% Other Christian 2.1% 8.1%
1

Muslim 4.0% 1.7% Non-Christian Eastern 0.0% 0.6% Other 1.6% 2.7% Length of residency (years) 6 (5 - 10) 6 (4 - 10) Urban/rural Rural 60.0% 93.6% Urban 40.0% 6.4% Household has orphans 3.6% 2.7% Household with orphans receive assistance 4.9% 16.8% Household has electricity 8.8% 13.3% Household has radio 46.5% 48.1% Household has television 8.1% 5.3% Household has DVD, CD or cassette player 5.8% 6.0% Respondent has mobile phone 16.9% 25.5%
a Continuous variables are reported as weighted estimates of median (interquartile range). b Categorical variables are reported as weighted percentages. c ‘Other Christian’ includes LDS Mormon and Jehovah's Witness. ‘Other’ includes Spiritual, Traditional Religions, and Agnostic or Atheist. d Percentages may not sum to 100%.
2. Vaccination Coverage For this project, we were interested in immunization status of children aged 12-23 months. We collected immunization data from 1,675 children across Gurùé and Milange (Table 5). Over half of respondents (63.4% in Gurùé and 55% Milange) had immunization cards that were presented to the interviewer for the child in question. Among children in which an immunization card was presented, full immunization with BCG+Polio+DPT+HepB+HIB+PCV+Measles was 49.7% in Gurùé and 48% in Milange. Among children without immunization cards, full immunization (respondent-reported) was very low at 1.5% in Gurùé and 4.2% in Milange. If we combine the estimates across all children, then the rate of immunization was not optimal (32% in Gurùé and 28.3% Milange). In many cases of respondent-reported immunization coverage (without an immunization card), the female head of household could not identify by name the immunizations received. As such estimates may represent an under estimation of true immunization coverage.
2

Table 5: Immunization of Children Aged 12 to 23 Months, UNICEF baseline survey 2014
Gurùé Milange
(n=761) (n=914) Head of household presents an immunization card 63.4% 55.0%
Children with immunization cards (n=485) (n=498) BCG immunization record Dose 1 97.5% 99.0% Polio immunization record Dose 1 97.2% 97.0% Dose 2 94.0% 91.7% Dose 3 92.1% 89.7% Dose 4 91.4% 83.8% DPT+HepB immunization record Dose 1 91.9% 83.5% Dose 2 89.2% 80.5% Dose 3 85.3% 78.2% Measles immunization record Dose 1 87.0% 74.7% PCV10 immunization record Dose 1 66.8% 71.4% Dose 2 66.0% 68.1% Dose 3 63.1% 66.0% HIB immunization record Dose 1 59.9% 61.3% Dose 2 58.1% 57.9% Dose 3 56.2% 57.5% Fully immunized from card (BCG+Polio+DPT+HepB+HIB+PCV+Measles) 49.7% 48.0% Vitamin A Dose (from card) 99.4% 99.1%
Children with no immunization card (n=276) (n=416) Reported vaccination (no card) BCG 7.8% 15.7% Polio 8.6% 14.3% DPT+HepB 7.0% 11.5% Measles 7.1% 10.0% PCV10 3.1% 6.4% Haemophilus influenza (HIB) 2.1% 4.4% Estimate of fully immunized without card (BCG+Polio+DPT+HepB+HIB+ PCV+Measles) 1.5% 4.2%
All Children (n=761) (n=914) Combined estimate of fully immunized (with and without card) 32.0% 28.3% Vaccination Status Fully vaccinated (from card) 31.5% 26.4% Fully vaccinated (no card) 0.5% 1.9% Not fully vaccinated (from card) 31.9% 28.6% Not fully vaccinated (no card) 36.1% 43.1%
3

Combined estimate of BCG coverage (with and without card) 64.6% 61.6% BCG coverage Fully vaccinated (from card) 61.8% 54.5% Fully vaccinated (no card) 2.9% 7.1% Not fully vaccinated (from card) 1.6% 0.5% Not fully vaccinated (no card) 33.8% 37.9% Combined estimate of Polio coverage (with and without card) 61.1% 52.5% Polio coverage Fully vaccinated (from card) 57.9% 46.1% Fully vaccinated (no card) 3.1% 6.4% Not fully vaccinated (from card) 5.4% 8.9% Not fully vaccinated (no card) 33.5% 38.6%
[a]Categorical variables are reported as weighted percentages. For this age group (12-23 months), full dosages of BCG, Polio, DPT, Hepatitis B, HIB, PCV and Measles vaccinations were required in order to count a child as fully immunized.
Table 6 shows results related to basic household knowledge of location for receiving vaccinations and reasons for vaccinating ones children. In both districts, the vast majority of respondents correctly identified either a hospital or health facility as a location for obtaining vaccination, followed next by mobile brigades. A respondent could choose more than one answer. In Gurùé, 60.1% of respondents correctly answered that vaccinations protect against disease compared to 33.7% in Milange. Nonetheless in both districts, respondents were able to answer that vaccinations had a benefit for helping their child grow healthy (27% in Gurùé vs. 43% in Milange). In both districts greater than 70% of respondents stated that health care decisions for the child were made jointly between both mother and father.
Table 6: Knowledge of Location and Reason for Vaccination in Households with Children Aged 12-23 Months
Gurùé Milange
(n=751) (n=886) Locations identified to obtain vaccination, if needed: Hospital 77.7% 86.6% Health facility 21.3% 47.1% School 6.2% 14.1% Mobile brigade 49.7% 35.4% Church 0.5% 0.2% Traditional Healer 0.1% 0.7% Outreach sites 0.0% 0.8% Other 0.4% 0.0% Reason for vaccinating children Missing, n(%) 20 (2.7%) 71 (8.0%)
4
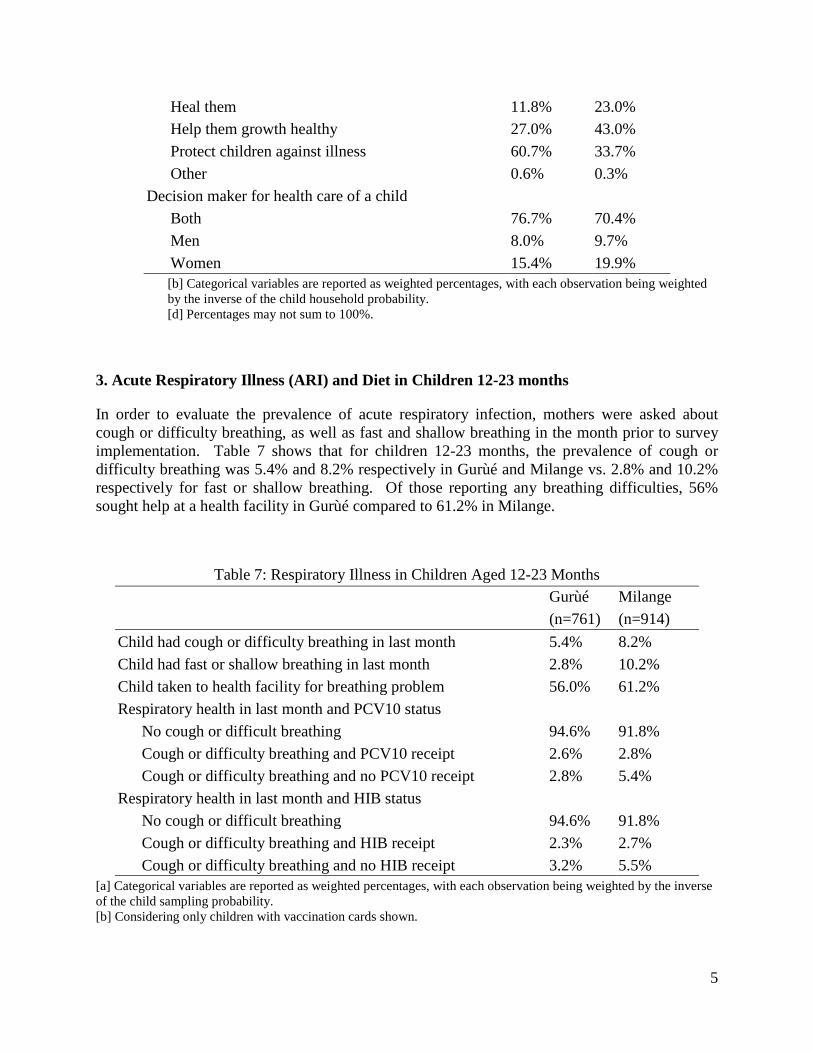
Heal them 11.8% 23.0% Help them growth healthy 27.0% 43.0% Protect children against illness 60.7% 33.7% Other 0.6% 0.3% Decision maker for health care of a child Both 76.7% 70.4% Men 8.0% 9.7% Women 15.4% 19.9%
[b] Categorical variables are reported as weighted percentages, with each observation being weighted by the inverse of the child household probability. [d] Percentages may not sum to 100%.
3. Acute Respiratory Illness (ARI) and Diet in Children 12-23 months
In order to evaluate the prevalence of acute respiratory infection, mothers were asked about cough or difficulty breathing, as well as fast and shallow breathing in the month prior to survey implementation. Table 7 shows that for children 12-23 months, the prevalence of cough or difficulty breathing was 5.4% and 8.2% respectively in Gurùé and Milange vs. 2.8% and 10.2% respectively for fast or shallow breathing. Of those reporting any breathing difficulties, 56% sought help at a health facility in Gurùé compared to 61.2% in Milange.
Table 7: Respiratory Illness in Children Aged 12-23 Months
Gurùé Milange
(n=761) (n=914) Child had cough or difficulty breathing in last month 5.4% 8.2% Child had fast or shallow breathing in last month 2.8% 10.2% Child taken to health facility for breathing problem 56.0% 61.2% Respiratory health in last month and PCV10 status No cough or difficult breathing 94.6% 91.8% Cough or difficulty breathing and PCV10 receipt 2.6% 2.8% Cough or difficulty breathing and no PCV10 receipt 2.8% 5.4% Respiratory health in last month and HIB status No cough or difficult breathing 94.6% 91.8% Cough or difficulty breathing and HIB receipt 2.3% 2.7% Cough or difficulty breathing and no HIB receipt 3.2% 5.5%
[a] Categorical variables are reported as weighted percentages, with each observation being weighted by the inverse of the child sampling probability. [b] Considering only children with vaccination cards shown.
5

4. Health Care Access and Satisfaction Roughly 2/3 of households reported that they had ever visited a government health facility and greater than 90% of respondents stated they had positive experiences when they visited those facilities (Table 8). When asked about challenges in reaching a health facility or hospital, greater than 80% in both districts reported distance as a problem. The average time in minutes reported to reach a health facility was 64.3 minutes in Milange vs. 120 minutes in Gurùé. In Milange, additional challenges reported include cost (47.8%), poor roads (24.5%) and stigma (16.6%). These challenges were also reported in Gurùé but at much less frequent rates, cost (15.6%), poor roads (5.7%), and stigma (2.3%). In both districts, the most common mode of transport for getting to the health facility was on foot (68.7% and 61.1%), followed by bicycle (25.1% and 36.9%). Less than 5% in both districts reported using either a car or motorcycle for transport to the health facility.
Table 8: Health Care Access and Satisfaction
Gurue Milange
(n=754) (n=896) Ever visited a government health facility for health problem 66.4% 67.6% Among those who have ever visited a government health facility: Treated well by staff 96.9% 91.9% Satisfied with care received 97.2% 91.9% Medical problem improved 97.9% 90.6% Satisfied with condition of health facility 97.5% 91.3% Health facility was clean 96.6% 93.7% Would return to health facility 97.4% 90.1% Problems or difficulties in reaching the health center or hospital Cost 15.6% 47.8% Distance 82.4% 81.2% Stigma (shame) 2.3% 16.6% Poor roads 5.7% 24.5% Bad transportation 4.4% 12.8% Other 3.4% 1.3% Ever visited a traditional healer for health problem 45.6% 40.9% Time to get to health facility (minutes) 120 (30 - 150) 64.3 (6 - 190) Mode of transport to health facility Missing, n (%) 7 (0.9%) 96 (10.7%) Bicycle 25.1% 36.9% Car 2.5% 0.7% Motorcycle 3.7% 1.3% On foot 68.7% 61.1%
[a] Continuous variables are reported as weighted estimates of median (interquartile range), with each observation being weighted by the inverse of the household sampling probability. [b] Categorical variables are reported as weighted percentages, with each observation being weighted by the inverse of the household sampling probability.
6

5. Household Dietary Access
Hunger is a complex and multifaceted phenomenon that is not completely understood through analysis of malnourishment prevalence alone (see Child Anthropometrics above). Food security is defined as a state in which “all people at all times have both physical and economic access to sufficient food to meet their dietary needs for a productive and healthy life” (USAID, 1992). As such, we have adapted the Household Food Insecurity Access Scale (HFIAS) to look at changes in access to food over time and constructed a Household dietary diversity score (HDDS) calculated by summing the number of food groups consumed in the household over a 7 day recall period (Food and Agricultural Organization (FAO) of the United Nations). For the household dietary diversity score, 12 food groups are summed:
1. Maize or Cereals [survey items 1 and 2] 2. Roots and Tubers [3] 3. Vegetables [4 and 8] 4. Sugar or sugar products [5] 5. Beans [6] 6. Nuts [7] 7. Fruits [9] 8. Meat [10] 9. Poultry and Eggs [11] 10. Fish [12] 11. Oils and fats [13] 12. Milk and milk products [14]
The FAO defines “low” dietary diversity as a Household Dietary Diversity score of < 4. In both districts dietary diversity spanned the range of different HDDS scores, though only 7.5% in Milange and 3.4% in Gurùé are classified as “low” dietary diversity based on the FAO scale (Table 9). Despite a relatively consistent diversity in diet, roughly 1/3 of respondents reported having smaller meals due to inadequate food in the 4 weeks prior to survey implementation, though the intensity of inadequate food seems to be worse in Milange with 75.3% reporting this occurring sometimes or often compared to only 28% of similar reports in Gurùé. With regards to their children´s diets, greater than 94% in both districts reported their children eating at least 2 meals in the day prior to survey implementation.
7

Table 9: Food and Nutrition
Gurùé Milange
(n=754) (n=896) Household Dietary Diversity Score (HDDS) 7 (5 - 10) 8 (6 - 10) HDDS categorized HDDS 0 - 3 3.4% 7.5% HDDS 4 - 6 42.9% 23.8% HDDS 7 - 9 28.3% 39.9% HDDS 10 - 12 25.4% 28.8% In the past four weeks, had smaller meal than needed because of inadequate food 33.5% 35.2%
How often did this happen? Often 8.5% 5.8% Sometimes 19.6% 69.5% Rarely 71.9% 24.7% Number of meals child fed yesterday
None 0.2% 2.2% 1 1.2% 3.3% 2 25.8% 26.2% 3 54.9% 65.3% 4 or more 18.0% 3.0%
[a] Continuous variables are reported as weighted estimates of median (interquartile range), with each observation being weighted by the inverse of the household sampling probability. [b] Categorical variables are reported as weighted percentages, with each observation being weighted by the inverse of the household sampling probability. [b] Categorical variables are reported as weighted percentages, with each observation being weighted by the inverse of the household sampling probability.
6. Demographics and Potential Barriers/Facilitators to Child Vaccination by Vaccination Status
When we analyze basic demographics of the female head of household by whether or not their child was fully immunized (from card + self-report), both education level and knowledge of Portuguese language show statistically significant differences. For years of education, female heads of households had a median of 3 years among respondents with a fully immunized child, compared to a median of 2 years of education for those with children not fully immunized. When disaggregated by education category, 43.4% of female heads with children not fully immunized had reported no education vs. only 30.9% for those fully immunized. A higher proportion of children were fully immunized if their female head of household reported understanding Portuguese (36.5% vs. 25.5%). In relation to household goods, a statistically significant greater proportion of fully immunized children came from households with electricity (17% vs 9.9%), radio (54.7% vs. 44.7%), television (10.9% vs. 4.1%), and a mobile phone
8

(30.8% vs. 19.9%). No difference was seen for marital status, household size, ethnic group, religion, or urban vs. rural residence (Table 10).
Table 10: Basic Demographics: Female Head of Household by Vaccination Status
Not fully vaccinated Full vaccination P-value
(n=1168) (n=482) Age of respondent 26 (22 - 30) 25 (21 - 30) 0.048 Age category 0.023 Missing, n(%) 133 (11.4%) 24 (5.0%) 15-19 years 9.4% 15.0% 20-24 years 31.0% 31.2% 25-29 years 30.0% 27.5% 30-34 years 14.4% 16.3% 35-39 years 13.6% 7.3% 40-44 years 1.3% 1.7% > 44 years 0.3% 1.0% Marital Status 0.33 Single 6.2% 8.4% Married/Common Law 88.0% 86.7% Widowed 2.8% 2.5% Divorced/Separated 3.1% 2.3% Years of Education 2 (0 - 4) 3 (0 - 5) < 0.001 Education category < 0.001 None (0 years) 43.4% 30.9% Some primary (1-6 years) 49.4% 51.9% Primary completed (7 years) 3.4% 5.9% Some secondary (8-11 years) 2.9% 9.9% Secondary completed (12 years) 0.8% 1.1% Superior ( > 12 years) 0.1% 0.4% Household size 4 (3 - 5) 4 (3 - 5) 0.79 Respondent understands Portuguese 25.5% 36.5% < 0.001 Primary language of household < 0.001 Chinyanja/Chichewua 60.5% 60.4% Echuabo 0.4% 0.0% Elomwe 34.8% 31.7% Other 0.4% 0.2% Portuguese 3.9% 7.7% Ethnic group identity: Elomwe 43.0% 39.7% 0.67 Echuabo 0.3% 0.8% 0.97 Cisena 0.1% 0.3% 0.88
9

Cinyanja 59.6% 59.5% 0.32 Emakhuwa 0.9% 0.2% 0.22 Religion 0.033 Catholic 45.9% 49.4% Protestant 23.2% 26.7% Evangelical and Pentecostal 18.8% 13.3% Other Christian 7.1% 5.0% Muslim 1.6% 4.0% Non-Christian Eastern 0.5% 0.2% Other 2.8% 1.4% Urban/rural 0.11 Rural 86.3% 79.7% Urban 13.7% 20.3% Household has electricity 9.9% 17.0% 0.004 Household has radio 44.7% 54.7% < 0.001 Household has television 4.1% 10.9% < 0.001 Household has DVD, CD or cassette player 4.1% 10.2% < 0.001 Respondent has mobile phone 19.9% 30.8% 0.001
[a] Continuous variables are reported as weighted estimates of median (interquartile range), with each observation being weighted by the inverse of the household sampling probability. [b] Categorical variables are reported as weighted percentages, with each observation being weighted by the inverse of the household sampling probability. [c] `Other Christian' includes LDS Mormon and Jehovah's Witness. `Other' includes Spiritual, Traditional Religions, and Agnostic or Atheist. [d] Percentages may not sum to 100%. Table 11 shows that rates of both cough and difficulty breathing and fast or shallow breathing were fairly similar for those children either fully or not fully immunized. However, a statistically significant greater proportion of children who were fully immunized were more likely to both seek advice for their breathing problem as well as be taken to a health facility.
Table 11: Respiratory Illness in Children Aged 12-23 Months by Vaccination Status
Not fully vaccinated
Full vaccination P-value
(n=1184) (n=491) Child had cough or difficulty breathing in last month 7.1% 8.3% 0.99 Child had fast or shallow breathing in last month 8.9% 6.7% 0.083 Sought advice for breathing problem 44.3% 61.5% 0.016 Child taken to health facility for breathing problem 54.3% 78.0% < 0.001
[b] Categorical variables are reported as weighted percentages, with each observation being weighted by the inverse of the child sampling probability. [d] Considering only children with vaccination cards shown.
10

Table 12 reflects the differences of fully and not fully immunized children related to health care access and satisfaction with care at a health facility. Fully immunized children showed a statistically significant greater proportion who reported having ever visited a health facility. Both cost and stigma were significantly greater for those children not fully immunized (43.2% and 17.4% respectively) compared to those fully immunized (31% and 3.4% respectively). For children who visited a health facility, overall satisfaction with the care received was equal whether the children were fully immunized or not.
Table 12: Health Care Access and Satisfaction by Vaccination Status
Not fully vaccinated
Full vaccination P-value
(n=1168) (n=482) Ever visited a government health facility for health problem 63.8% 75.6% < 0.001
Among those who have ever visited a government health facility:
Treated well by staff 92.0% 95.7% 0.065 Satisfied with care received 91.8% 96.5% 0.013 Medical problem improved 91.3% 95.1% 0.068 Satisfied with condition of health facility 91.3% 96.3% 0.007 Health facility was clean 95.3% 92.8% 0.65 Would return to health facility 90.5% 95.1% 0.012 Problems or difficulties in reaching the health center or hospital
Cost 43.2% 31.0% < 0.001 Distance 83.8% 76.9% 0.12 Stigma (shame) 17.4% 3.4% < 0.001 Poor roads 20.7% 16.9% 0.25 Bad transportation 12.6% 6.3% 0.083 Other 1.8% 1.9% 0.67 Ever visited a traditional healer for health problem 43.4% 39.0% 0.92
[a] Continuous variables are reported as weighted estimates of median (interquartile range), with each observation being weighted by the inverse of the household sampling probability. [b] Categorical variables are reported as weighted percentages, with each observation being weighted by the inverse of the household sampling probability.
11
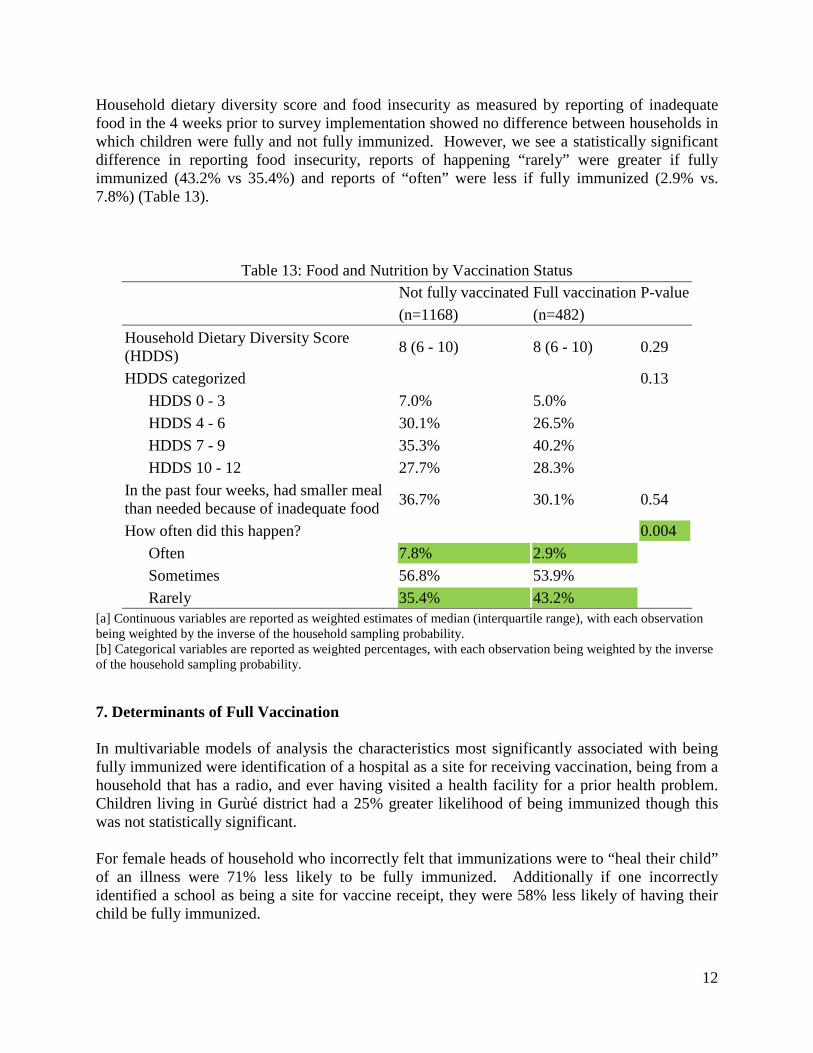
Household dietary diversity score and food insecurity as measured by reporting of inadequate food in the 4 weeks prior to survey implementation showed no difference between households in which children were fully and not fully immunized. However, we see a statistically significant difference in reporting food insecurity, reports of happening “rarely” were greater if fully immunized (43.2% vs 35.4%) and reports of “often” were less if fully immunized (2.9% vs. 7.8%) (Table 13).
Table 13: Food and Nutrition by Vaccination Status
Not fully vaccinated Full vaccination P-value
(n=1168) (n=482) Household Dietary Diversity Score (HDDS) 8 (6 - 10) 8 (6 - 10) 0.29
HDDS categorized 0.13 HDDS 0 - 3 7.0% 5.0% HDDS 4 - 6 30.1% 26.5% HDDS 7 - 9 35.3% 40.2% HDDS 10 - 12 27.7% 28.3% In the past four weeks, had smaller meal than needed because of inadequate food 36.7% 30.1% 0.54
How often did this happen? 0.004 Often 7.8% 2.9% Sometimes 56.8% 53.9% Rarely 35.4% 43.2%
[a] Continuous variables are reported as weighted estimates of median (interquartile range), with each observation being weighted by the inverse of the household sampling probability. [b] Categorical variables are reported as weighted percentages, with each observation being weighted by the inverse of the household sampling probability. 7. Determinants of Full Vaccination In multivariable models of analysis the characteristics most significantly associated with being fully immunized were identification of a hospital as a site for receiving vaccination, being from a household that has a radio, and ever having visited a health facility for a prior health problem. Children living in Gurùé district had a 25% greater likelihood of being immunized though this was not statistically significant. For female heads of household who incorrectly felt that immunizations were to “heal their child” of an illness were 71% less likely to be fully immunized. Additionally if one incorrectly identified a school as being a site for vaccine receipt, they were 58% less likely of having their child be fully immunized.
12

Compared to families in which joint decision making is done related to issues of child health, those households in which the man alone was responsible for decision making had a 17% lower odds of their children being fully immunized and a 47% lower odds when the woman alone made the child health decision. Interestingly, households that reported ever visiting a traditional healer for a health problem had a 31% lower odds of their child being fully immunized.
Table 14: Determinants of Full Vaccination using multivariable logistic regression
Odds Ratio (95% CI) P-value District 0.24 Milange (ref) 1 Gurùé 1.25 (0.86, 1.81) Reason for vaccinating children < 0.001 Protect children against illness (ref) 1 Heal them 0.29 (0.18, 0.47) Help them growth healthy 1.28 (0.98, 1.66) Hospital identified as location for vaccination 2.91 (1.78, 4.75) < 0.001 Health facility identified as location for vaccination 0.72 (0.51, 1.02) 0.066 School identified as location for vaccination 0.42 (0.24, 0.74) 0.003 Mobile brigade identified as location for vaccination 0.93 (0.67, 1.28) 0.64 Household has radio 1.41 (1.10, 1.79) 0.006 Decision maker for health care of a child 0.002 Both (ref) 1 Men 0.83 (0.48, 1.43) Women 0.53 (0.37, 0.75) Travel time to nearest health facility (per 60 minutes) 0.95 (0.76, 1.20) 0.68 Mode of travel to nearest health facility 0.35 On foot (ref) 1 Bicycle 0.90 (0.67, 1.20) Car 1.93 (0.84, 4.40) Motorcycle 0.89 (0.38, 2.09) Ever visited a government health facility for health problem 1.46 (1.04, 2.05) 0.027 Ever visited a traditional healer for health problem 0.69 (0.50, 0.96) 0.027
[a] There are 1650 households included in this model. Households with multiple children must have both children documented as vaccinated to be classified as fully vaccinated. [b] Missing values of baseline predictors were accounted for using multiple imputation. [c] Because there was evidence (p < 0.10) that the relationship with log-odds of vaccination is non-linear, time to cooking water source was fit using restricted cubic splines.
13

LIMITATIONS
Despite every effort to adapt questions to the local context during the piloting phase of previous studies, certain questions were still difficult to obtain reliable, valuable information. Social desirability bias, or the interest in survey participants to provide the answers they believe surveyors wish to hear rather than the ones that reflect their actual knowledge, attitudes, beliefs and access to services, likely led to the over-reporting of satisfaction with services and underreporting of problems at health facilities. For example, survey teams reported that participants were reluctant to provide negative information about health service provision for fear of potential repercussions the next time they attend a health facility. Also, teams reported that participants were reticent in providing information on the availability of income, fearing that it might negatively impact their access to external support.
Interviewers reported that in many cases the women did not know the exact age of their children. Where possible, age of children from 12- 23 months of age was determined using vaccination cards. In other cases, ages were estimated based on information provided by the women interviewed, such as “the child was born at the time of the bean crop".
Questions on sources of advice sought for a child displaying febrile, diarrheal, and respiratory symptoms showed a very high proportion seeking advice from hospitals and health centers. Upon investigation, survey teams reported that individuals in the community with ties to health facilities, such as volunteers and APEs (basic polyvalent agents), were frequently reported as sources of information but were not a response option and therefore coded as either hospital or health facility. The information on sources of advice therefore overestimates the proportion seeking advice at health facilities. Response categories for certain questions related to households did not sufficiently capture response possibilities.
14


![A BASELINE SURVEY OF MINORITY …1].pdfA BASELINE SURVEY OF MINORITY CONCENTRATION DISTRICTS OF INDIA SIRSA (Haryana) Sponsored by Ministry of Minority Affairs Government of India](https://static.fdocuments.net/doc/165x107/5aaa8d647f8b9a7c188e3cb2/a-baseline-survey-of-minority-1pdfa-baseline-survey-of-minority-concentration.jpg)

![A BASELINE SURVEY OF MINORITY CONCENTRATION DISTRICTS …1].pdf · Nidhi Sharma Sindhu Joshi. RANCHI Principal Author of the Report HARISHWAR DAYAL Regional Director Institute for](https://static.fdocuments.net/doc/165x107/5fb8e1fa6d003d50b06583bc/a-baseline-survey-of-minority-concentration-districts-1pdf-nidhi-sharma-sindhu.jpg)


![A BASELINE SURVEY OF MINORITY … final[1].pdfA BASELINE SURVEY OF MINORITY CONCENTRATION DISTRICTS OF INDIA WASHIM (Maharashtra) Sponsored by Ministry of Minority Affairs Government](https://static.fdocuments.net/doc/165x107/5ae3a8fe7f8b9a0d7d8ded39/a-baseline-survey-of-minority-final1pdfa-baseline-survey-of-minority-concentration.jpg)