Unhappy Working with Men? Workplace Gender Diversity …ftp.iza.org/dp4077.pdf · Unhappy Working...
38
IZA DP No. 4077 Unhappy Working with Men? Workplace Gender Diversity and Employee Job-Related Well-Being in Britain: A WERS2004 Based Analysis Getinet Haile DISCUSSION PAPER SERIES Forschungsinstitut zur Zukunft der Arbeit Institute for the Study of Labor March 2009
-
Upload
nguyenphuc -
Category
Documents
-
view
213 -
download
0
Transcript of Unhappy Working with Men? Workplace Gender Diversity …ftp.iza.org/dp4077.pdf · Unhappy Working...
IZA DP No. 4077
Unhappy Working with Men?Workplace Gender Diversity and Employee Job-RelatedWell-Being in Britain: A WERS2004 Based Analysis
Getinet Haile
DI
SC
US
SI
ON
PA
PE
R S
ER
IE
S
Forschungsinstitutzur Zukunft der ArbeitInstitute for the Studyof Labor
March 2009
Unhappy Working with Men?
Workplace Gender Diversity and Employee Job-Related Well-Being in Britain:
A WERS2004 Based Analysis
Getinet Haile Policy Studies Institute,
University of Mannheim and IZA
Discussion Paper No. 4077 March 2009
IZA
P.O. Box 7240 53072 Bonn
Germany
Phone: +49-228-3894-0 Fax: +49-228-3894-180
E-mail: [email protected]
Any opinions expressed here are those of the author(s) and not those of IZA. Research published in this series may include views on policy, but the institute itself takes no institutional policy positions. The Institute for the Study of Labor (IZA) in Bonn is a local and virtual international research center and a place of communication between science, politics and business. IZA is an independent nonprofit organization supported by Deutsche Post Foundation. The center is associated with the University of Bonn and offers a stimulating research environment through its international network, workshops and conferences, data service, project support, research visits and doctoral program. IZA engages in (i) original and internationally competitive research in all fields of labor economics, (ii) development of policy concepts, and (iii) dissemination of research results and concepts to the interested public. IZA Discussion Papers often represent preliminary work and are circulated to encourage discussion. Citation of such a paper should account for its provisional character. A revised version may be available directly from the author.
IZA Discussion Paper No. 4077 March 2009
ABSTRACT
Unhappy Working with Men? Workplace Gender Diversity and Employee Job-Related
Well-Being in Britain: A WERS2004 Based Analysis*
This paper attempts to establish empirically the link between workplace gender diversity and employee job-related well-being. Using nationally representative linked employer-employee data for Britain, I employ econometric techniques that account for unobserved workplace heterogeneity. I find that gender diversity is associated with lower employee well-being among women in several of the equations estimated. The magnitudes of the estimated effects also tend to increase with (women’s) group size. Workplace equality policies do not appear to ameliorate these effects. JEL Classification: J16, J82, J7, I31 Keywords: gender diversity, job-related well-being, linked employer-employee data, Britain Corresponding author: Getinet Haile University of Mannheim Faculty VWL L7, 3-5 68131 Mannheim Germany E-mail: [email protected]
* The author is grateful to the Economic and Social Research Council for the research grant RES-000-22-2465. The author also acknowledges the Department of Trade and Industry, the Economic and Social Research Council, the Advisory, Conciliation and Arbitration Service and the Policy Studies Institute as the originators of the 2004 Workplace Employment Relations Survey data, and the Data Archive at the University of Essex as the distributor of the data. The National Centre for Social Research was commissioned to conduct the survey fieldwork on behalf of the sponsors. None of these organisations bears any responsibility for the author’s analysis and interpretations of the data. The paper benefited from feedback by Michael White, Alex Bryson and Helen Bewley on an earlier draft and excellent research assistance by Hirut Mengistu. Early findings were presented at the 2008 WERS-WPEG meeting in Sheffield, the 2008 SOLE conference as well as seminars at PSI, DWP, WBS, Cardiff and Mannheim. The author would like to thank participants at these events for useful comments. The usual disclaimer applies.
1. Introduction
The labour market participation of women has increased significantly in the industrialised
world in recent years. In Britain, women’s participation stood at 37.1 % in 1971 but this
has increased to 45.8% in 2005 (ONS 2006). Inevitably, this has led to increase in
workplace gender diversity. The increase in workplace gender diversity has been
attributed to some important developments including demographic changes, tight labour
market conditions, and regulatory measures. Despite the considerable change in
workplace gender diversity and the growing prominence of equality and diversity related
discourses, there is a dearth of empirical literature on the links between workplace gender
diversity and employee job-related well-being. Intriguingly, the increasing diversity and
interventions aimed at promoting diversity in Britain are taking place despite evidence of
widespread discrimination at workplaces on the grounds of demographic characteristics
including gender (Berthoud and Blekesaune 2007, Peccei and Lee 2005, Jones et al. 2003,
Pudney and Shields 2000a b, Wright and Ermisch 1991). If discrimination is as
widespread as the existing evidence suggests, the growing emphasis on diversity could
well have adverse effect on employees’ job-related well-being. This may particularly be
the case if diversity is driven by labour cost considerations rather than by active equality
policies supplementing anti-discrimination legislations. Job-related well-being is what
people feel about themselves in relation to their job and it forms an integral part of
overall well-being. Both forms of well-being are linked to the concept of mental health
(Warr 1999, Rode 2004).
This paper attempts to establish empirically the link between gender diversity
and employee job-related well-being. It also explores whether workplace HRM practices
and policies have any bearing on the gender-wellbeing link. Firmly establishing the link
between workplace gender diversity and employee job-related well-being is crucial for
two important reasons. First, the growing (policy) importance attached to workplace
diversity is not matched by rigorous research on diversity. Secondly, there is conflicting
evidence regarding links between workplace gender composition and employee job-
related well-being. For example, in a recent management study, Peccei and Lee (2005)
imply that gender diversity has a negative relationship with job satisfaction (particularly
for men). On the other hand, Fields and Blum (1997), also looking at the relationship
between workgroup gender composition and job satisfaction, find both men and women
working in gender-balanced groups to have higher levels of job satisfaction vis-à-vis their
2
counterparts working in homogeneous groups.1 The conflicting evidence may be due to,
among others, the way workplace composition is defined, the particular measure(s) of
job-related well-being considered and the empirical methodology employed. Establishing
firmly whether there is a link between workplace gender diversity and employee job-
related well-being will be informative from the viewpoint of addressing issues of
employee well-being. For example, Kochan et al. (2003) reported adverse effects of racial
diversity on team processes being mitigated through training and development-focused
initiatives.
This paper aims to fill gaps in the existing literature and has several strengths.
First, it uses the WERS2004 data, nationally representative linked employer-employee
data, with large number of demographically varied workplaces located across Britain. The
linked data also have extensive information on workplaces, employees, and human
resource management practices related measures. This enables controlling for observable
influences on well-being much more comprehensively than has been done to date.
Secondly, the data have extensive sets of measures on employee job-related well-being that
include eight measures of facets of job satisfaction and six measures of affective well-
being. This will allow investigating links between diversity and aspects of well-being
hitherto unexplored. Third, gender diversity is measured as an index which allows
accounting for nonlinearities existing studies in Britain fail to address. As recent U.S.
based studies have demonstrated, using proportions of workers does not allow capturing
nonlinear effects.2 Fourth, the paper exploits the nested structure of the WERS2004 data
to control for unobserved workplace heterogeneity, something that previous studies
ignore. One important lesson that research in labour economics, particularly where there
is a matched employer-employee data, underscores is the importance of unobserved
factors in determining labour market outcomes (see, for example, Abowd et al. 1999). In
the workplaces setting considered in this study, there may well be unmeasured aspects of
workplaces that influence employee job-related well-being, which are accounted for in
this study. The paper also employs alternative econometric models and, in each case,
estimate models with several specifications as a robustness check.
1 Other (sociological) studies of similar nature, for example Wharton and Baron (1987), find men in mixed work settings to have lower job-related satisfaction and self-esteem and more job-related depression than men in either male- or female-dominated work settings and attribute this to the decline in quantity and quality of inter-group relations as groups become more balanced. 2 A (fully) gender diverse workplace should have men and women with a 50:50 proportion. An increase in the proportions of women beyond 50 per cent means the workplace becomes less diverse, although a workplace with higher proportions of women might be regarded as diverse on the supposition that such a workplace has given more space for the traditionally disadvantaged gender group.
3
The focus on gender diversity in this paper is for two important reasons. First,
the conflicting evidence mentioned earlier is specific to workforce gender composition,
which this study specifically wants to address. Secondly, gender mix in the data is much
more balanced than other measures of demographic compositions such as age
(particularly, over-50), disability and ethnicity that are, as would be expected,
proportionately small in the WERS2004 data. Focusing on gender diversity thus allows
richer analysis of the relationship between gender diversity and job-related well-being.3
The remainder of the paper is organised as follows. Section 2, makes a brief review of
relevant theories and existing literature. In section 3, a description of the data and
variables used in the empirical analyses will be made. Section 4 sets out the empirical
models used in the estimation. Section 5 discusses the empirical results obtained while
the final section concludes the paper.
2. Related theory and research
2.1. Theoretical background
There are alternative theoretical explanations across the different streams of
social sciences that can provide a framework for analysing links between workplace
gender diversity and employee job-related well-being. In the economics context, the
relevant theoretical explanations largely relate to theories of discrimination. In this
regard, the leading explanations are those that relate discrimination to either preference
(Becker 1957; Arrow 1972, 1973; Phelps 1972) or information (Aigner and Cain 1977).
The former stipulates that discrimination occurs when people behave as if they refuse to
change their stereotypes about the capabilities of discriminated individuals or groups. It
is to do with preference and may not change in the face of favourable information about
the group. The information explanation, on the other hand, states that (employer)
discrimination is the result of asymmetric information regarding (productivity of) the
discriminated individual and such stereotypes alter with information.4
Akerlof and Kranton (2000) formalised the earlier “taste” based discrimination
explanations by incorporating identity into a model of behaviour and showing how
identity influences economic outcomes. Their formulation is based on social identity
theory that posits that an individual’s social identity depends on all of the identifications
3 In contrast, the sub-samples of ethnic minorities (non-whites), the disabled and the over-50s in the data are relatively smaller in size and may not permit equally rich analysis. 4 Other, theories of relevance include language (difference) based discrimination (Lang 1986) and Lazear (1999)’s communication costs explanation of (racial) diversity.
4
the person uses in construing her/his views of the self. According to these explanations,
a person experiences anxiety when the person’s internalised rules of personality (or
identity or ego or self) are violated somehow. In the context of work, they show how
identity could be related to occupation arguing “occupations are associated with the
social categories ‘man’ and ‘woman,’ and individual payoffs from different types of work
reflect these gender associations” (Akerlof and Kranton, 2000, p. 732). A worker’s
identity could therefore be linked to occupation-based social categories and how people
in them view each other. Limits on a person’s identity or violations of their internalised
rules, for example a woman/man joining an occupation with a man/woman social
category, may lead to a reduction in the person’s well-being. Alesina and La Ferrara
(2000, 2005) also note how diversity may affect economic choices by directly entering
individual behaviour/preferences. Their formalization of the social identity theory based
on group participation predicts that individual utility from joining a group depends
positively on the share of group members of one’s own type and negatively on the share
of different types. Unlike the earlier (taste-based discrimination) explanation, which is
primarily aimed at explaining racial discrimination, this formalisation enables addressing
gender discrimination considering that
Based on Becker (1957) and Akerlof & Kranton (2000), and building on Ragan
and Tremblay (1988), I formulate a simple framework to study how workplace gender
diversity may influence employee job-related well-being. Suppose that there are two
groups of workers M, males, and F, females in a workplace. Consider also that M
workers are ‘dominant’, in terms of group size and/or position in the employment
hierarchy, rendering the workplace a ‘man’ social category. Simple social category based
explanation would, in this case, suggest a reduction in male workers’ well-being as a
result of the presence of female co-workers. Nonetheless, it is more realistic to imagine
women getting ‘vexed’ by their male co-workers, who dominate the workplace.5 If so, it
makes more sense to construct the theoretical framework that follows in terms of a
reduction in the well-being of women workers.
Two types of predictions could be made regarding the link between workplace
gender diversity and job-related well-being. First, assume the diversity-wellbeing link
being independent of the level of gender mix at the workplace so that;
5 This line of thinking also goes in line with the wider literature on gender discrimination and evidence therein.
5
(1) (1 )F Mw di= − w
where w stands for job-related well-being; 0<d<1 and i = 1 if the workforce
has at least one female employee and 0 otherwise. Secondly, assume the diversity-
wellbeing link varies with the level of gender mix at the workplace. In this case, one
could assume the job-related well-being of F workers as a negative function of the
proportion of the M workers, i.e.
(2) ( )F Mw f e e= T
where 0<′f and eT is the sum of male and female workers.6 If Alesina and La
Ferrara (2000, 20055)’s social identity theory based prediction holds, I should also
expect . 0>′′f
Based on this theoretical framework, I put forward the following hypotheses,
which will be tested in the empirical analysis undertaken:
Hypothesis 1: gender diversity and employee job-related well-being are negatively
related
This hypothesis will be tested on the basis of the coefficient of the main gender
diversity correlate in each of the job-related well-being equations estimated.
Hypothesis 2: the negative relationship between gender diversity and employee
job related well-being is associated with the ‘traditionally’ disadvantage group, in this case
women.
The ‘social category’ argument needs to be viewed in conjunction with the
gender composition of the general workforce. With the exception of few occupations
such as nursing, secretarial work and primary school teaching, most occupations could be
regarded as having a ‘man’ social category traditionally. If this is so, one could then argue
that the recent increase in the labour market participation of women might put a limit in
perceived identity of men which may in turn lead to a less than favourable reaction by 6 As explained in the methodology section, simple proportions fail to capture the full extent of workforce diversity. I use an index of gender diversity, instead of gender proportions.
6
men towards their female co-workers, including gender based discrimination. This may
reduce the job-related well-being of women. The hypothesis will be tested on the basis of
sub-group based empirical analysis.
Hypothesis 3: the size of each gender group in the workplace will have some
influence on the well-being of members of each group. However, it may not be possible
to hypothesise which group the size effect may be associated with straightforwardly.
Thus;
Hypothesis 3a: Alesina and La Ferrara (2000, 2005)’s social identity theory based
stipulation that individual utility from joining a group being dependent on the share of
group members of one’s own type means that I expect women’s well-being to increase
with gender diversity.
Hypothesis 3b: on the other hand, if balanced or near balanced workforce
composition leads to more rivalry and possible confrontation (Wharton and Baron 1987),
this may lead to tension and a reduction in job-related well-being. Such well-being
reduction could be more relevant to women given the ‘inferior’ position they occupy in
the workplace hierarchy.
Hypothesis 3 could be tested based on discrete measures of diversity that
reflect varying degrees of gender diversity at the workplace. For example, if coefficients
of the discrete measures that reflect higher level of gender diversity at the workplace are
positive then this lends support to the first hypothesis (Hypothesis 3a).
Hypothesis 4: The type of HR policy and practice in place at the workplace could
have some influence on the diversity-wellbeing link at the workplace. I hypothesise that
workplace policies and practices have either of the following two outcomes;
Hypothesis 4a: workplaces with committed equality/diversity policy and practice,
including staff training aimed at fostering gender equality would ameliorate the adverse
well-being effect of gender diversity
Hypothesis 4b: workplaces with a policy and practice that only pays lip-service to
gender diversity would fail to ameliorate the adverse effects of gender diversity.
7
This hypothesis could be tested for in two ways. First, I include summary
measures/scores of workplace practice and policy in the empirical models estimated.
Secondly, I interact the summary measure of workplace equality policy and practice with
the gender diversity measure. The inclusion of the summary measures is expected to
eliminate negative association/coefficient, if any, between the measures of job-related
well-being and the gender diversity measure. Alternatively, I should be getting positive
(and significant) coefficient on the interaction term
2.2. Review of the literature7
The literature on workplace gender diversity is fairly limited and quite recent.
Moreover, it has an almost exclusive focus on the USA and relates to the relationship
between diversity and such economic outcomes as firm performance (Kurtulus 2008,
Leonard & Levine 2006), turnover (Leonard & Levine 2006, Giuliano et al. 2006) and
promotions (Blau & DeVaro 2007, Giuliano et al. 2006). Kurtulus (2008) examines the
effect of grouping workers into heterogeneous divisions on worker and division
performance using panel data from a large US firm and finds some evidence that gender
heterogeneity is associated with higher worker performance. Leonard and Levine (2006)
study the effect of gender diversity on turnover among sales workers in retail branches of
a large U.S. firm and find that gender diversity leads to higher quite rates among women.
They also find that a male worker is more likely to quit the greater the proportion of
workers in his branch belonging to a different race and gender group. Using the same
data from the large US retail firm, Giuliano et al. (2006) study gender differences between
managers and workers and find some evidence on worker quit rates. None of the three
studies focus on the well-being effect of gender diversity as such. However, the well
established link between job satisfaction and quite behaviour (for e.g. Akerlof et al. 1988,
Freeman 1978) may mean that the latter two studies imply adverse relationship between
subjective well-being and gender diversity. Fields and Blum (1997) look at the
relationship between workgroup gender composition and job satisfaction using US data
and find both men and women working in gender-balanced groups to have higher levels
of job satisfaction vis-à-vis their counterparts working in homogeneous groups. In a
recent UK focused study that uses the WERS1998 data, Peccei and Lee (2005) find that
7 It is essential to note that existing studies on diversity refer to the relationships between measures of diversity and various outcomes of interest as ‘effects’ and/or ‘impacts’ although they do not establish causation between the two. This section reports the review of existing literature as it is without making ‘amendments’.
8
gender similarity has a positive relationship with job satisfaction, particularly for men.
Rose (2005) finds some evidence of disparity in trends of job satisfaction in Britain with
heavy gendered despondency.
There are several psychological and sociological studies that attempt to explain
how differences between workgroup members along gender and other dimensions
influence the attitude and subjective well-being of group members. However, most of
these studies neither account for confounding influences nor use large and representative
data (Knippenberg and Schippers 2007, Maume and Sebastian 2007, Jackson et al. 2003,
Fields and Blum 1997). Jackson et al. (2003) also report that in their review of 63 studies
for the period 1997-2002 they found very little focus on affective outcomes. Peccei and
Lee (2005) found eight US studies assessing the relation of gender proportions to
satisfaction, but similarly noted the paucity of control information in these studies.
The review in the preceding paragraph shows that there is conflicting evidence
regarding the link between workplace gender diversity and employee well-being. This
could be due to several reasons including: the nature of the data used, whether
confounding factors are accounted for sufficiently, the nature of the well-being measure
used, the way workplace gender diversity is measured and the type of empirical
methodology employed. On data, Leonard and Levine (2006) state that an ideal diversity
study would (i) have a large number of demographically varied workplaces, (ii) control
for location to capture differences in the local labour market condition, (iii) minimize
confounding variations across workplaces in management practices and workplace and
job characteristics, and (iv) assign randomly different demographic mixed to each
workplace. This paper uses data that addresses nearly all of these data related concerns
including HR policies and practices in place at workplaces. It is essential that one
differentiates between genuinely committed and strategic diversity policy from cases
where employers pay lip-service to diversity and equal opportunities, which this paper
attempts to accomplish.
Controlling for as many observable workplace and employee influences as
possible has also been emphasised in previous studies. For example, Peccei and Lee
(2005) stress this point in their study of workplace demographic composition and job
satisfaction. Maume and Sebastian (2007) also reinforce this point. They find job
satisfaction of whites being negatively related to the proportion of minority workers in
the absence of controls, but the effect disappears when job characteristics are controlled
for. Kochan et al. (2003) also report adverse effects of racial diversity on team processes
9
being mitigated through training and development-focused initiatives. This paper uses
rich data that allow controlling for a range of employee, workplace, HR practice and
policy, and geographic influences much more comprehensively than in any previous
study.
The paper analyses the link between gender diversity and extensive set of job-
relate well-being measures than in any previous research. Although there are few studies
that dwell on single item measures of job satisfaction to study the effects of workgroup
demographic composition, the use in this paper of eight different facets of job
satisfaction provides the richness one would need to address possible sensitivities
stemming from the way well-being is defined. Crucially, this study also uses measures of
affective well-being that have not been used in previous studies investigating workplace
diversity and job-related well-being. Psychological studies have emphasised the need for
broader definition of work-related psychological well-being (than just job satisfaction).
The general consensus, in this respect, is that affective well-being measures are amongst
the most important, if not the most important, measures of psychological well-being
(Warr 1994, Daniels 2000). Affective well-being measures are also less expectation driven
than measures of job satisfaction.
That this paper employs alternative econometric models and accounts for
unobserved heterogeneity in all cases are further strengths of the paper. With few
exceptions (for example, Leonard and Levine 2006, Kurtulus 2008), most of the studies
investigating the issue of diversity do not account for unobserved heterogeneity. Also, in
most of the existing literature gender diversity is measured as the proportion of women
at the workplace. As detailed in the next section, such a measure does not fully capture
workplace diversity.
3. Data and variables
3.1 Overview of the Data
The data used in this paper come from the 2004 British Workplace
Employment Relations Survey (WERS2004), which is one of the most authoritative
sources of information on employment relations in Great Britain. It offers linked
employer-employee data representative of all workplaces with five or more employees
(Kersley et al. 2006). The survey covers a whole host of issues relating to both employers
and employees, allowing the inclusion of an array of individual and workplace level
attributes into the empirical analysis undertake. The estimation sub-sample used in this
10
paper comprises of 18064 employees in 1506 workplaces. This is from the initial
matched sample of 22451 employees in 1733 workplaces. The final sample is the result of
excluding those with: (i) missing values in any of the job-related well-being measures
used, (ii) missing values in any of the employee and workplace covariates including the
disability diversity measure and (iii) keeping only workplaces with at least two responding
employees.
3.2 Definition of variables
3.2.1. Outcome (job-related well-being) variables
The first important set of variables relates to WERS2004 survey questions that
monitor employee job-related well-being. These come from two different sources. First, the
employee survey monitored how satisfied employees are with eight different aspects of
their job. The survey asked employees to rate – on a five-point scale from ‘very satisfied’
to ‘very dissatisfied’ – how satisfied they were on: (i) the sense of achievement they get
from their work; (ii) the scope for using their own initiative; (iii) the amount of influence
they have over their job; (iv) the training they receive; (v) the amount of pay they receive;
(vi) their job security; (vii) their work itself and (viii) their involvement in decision making.
Secondly, the employee survey also monitored affective well-being measures. There are six
questions that probe – on a five-point scale from ‘all of the time’ to ‘Never’ – how much
of the time over the past few weeks employees felt (i) tense; (ii) calm; (iii) relaxed; (iv)
worried; (v) uneasy, and (vi) content.8 Each of these 14 variables is used as job-related
well-being outcome measure. The appendix Tables A1 and A2 report descriptive
statistics and correlation matrix of each of these 14 outcome variables.
3.2.2. Diversity and other control variables
The gender diversity variable of interest to this paper is constructed based on the
proportion of female/male employees at each workplace, which is monitored in the
WERS2004 establishment survey. As detailed in the methodology section of the paper,
gender diversity is defined as one minus the sum of squared proportions of female and
male workers at workplaces. Other control variables used relate to employee
demographic and human capital characteristics, employee occupation, skills (mis)match,
industry of employment, geographic area and travel-to-work area unemployment and
8 The order of responses signifying negative affects have been modified so that the six affective well-being measures become (i) NOT tense, (ii) calm, (iii) relaxed, (iv) NOT worried, (v) NOT uneasy and (vi) content.
11
vacancy rates. Table A3 in the appendix provides descriptive statistics on all variables
used in the empirical analysis.
3.2.3. Workplace practice and policy summary variables
Differentiating between a genuinely committed and strategic diversity policy
fostering gender diversity/equality and cases where employers pay lip-service to diversity
and equal opportunities but lack systematic action could be important. The WERS2004
data have extensive information on workplace management practice and policy. Some
method of reducing this vast data is essential if arbitrary choices of items are to be
avoided. To this end two approaches have been used in this paper. First, a sub-set of
workforce management and policy variables that are thought to reflect genuine
commitment, as opposed to paying lip-service, towards employees have been carefully
selected. In particular, aspects of workplace management practices and policies that
demonstrate commitment towards (i) equality, (ii) training and development of
employees and (iii) provisions of flexibility have been chosen. Secondly, factor analysis has
been used to construct three different summary measures reflecting equality, training and
flexibility.9 The scores generated in this way are then used in the empirical analyses
conduct forming one specification of the models estimated. The idea behind using these
summary scores is to explore whether genuine employer commitment has any bearing
regarding the links between workplace gender diversity and employee well-being.
Appendix Tables A4 - A6 provide the list of workplace practice and policy variables used
and Factor analysis related statistics.
4. Empirical methodology
There are important methodological considerations to be made in modelling
subjective well-being measures. In this regard, two of the key issues are to do with the
assumptions imposed on the meaning of satisfaction questions and the influence of
unobservables (Ferreri-i-Carbonell and Frijters 2004). This paper follows the empirical
economics tradition and assumes that responses to subjective well-being questions are
comparable only ordinally. In other words, employees that give identical responses to a
subjective well-being question will be assumed to derive similar levels of satisfaction on
the particular aspect of their job. 10 I therefore estimate ordinal probability models. The
9 The factor scores have been generated using SPSS 10 It is important to stress the role played by employee expectation in determining responses to subjective well-being questions.
12
non-experimental nature of the study makes it essential that unobserved heterogeneity is
accounted for. The level of workplace gender diversity observed or the particular
workforce management practice and policy therein are less likely to represent random
phenomena, given possible employer and employee selection. To the extent that there is
such selection, addressing the issue of non-randomness becomes crucial to avoid the
potentially biasing selection effects. This paper attempts to account for such potential
biases by estimating random effects ordered logit models, which allow controlling for
workplace-level unobserved heterogeneity.11
As stated in the data related discussion, the WERS2004 data is a linked data
with some employees selected from the same workplace. This means some shared
observed and unobserved attributes pertinent to the workplace. This violates the
independence assumption that (ordinal) regression models assume (Hedeker and
Gibbons 1994). This paper exploits the nested structure of the WERS2004 data to
overcome violation of the independence assumption and employs the multilevel
modelling framework.12 Estimating (workplace) fixed effects regression could have been
an option. However, the cluster (or workplace) dummy variables would be correlated
with important workplace characteristics including the gender diversity measure.
Moreover, previous research has shown that attempts to estimate FE models with the
cluster effects treated as dummy variables gives rise to inconsistent estimates of the
ordinal and regression coefficients, in addition to possible incidental parameter problem
(Crouchley, 1995).
To estimate the random-effects ordered logit models I convert the original five-
scale responses into three-scale responses. The five-scale responses for the facets of job
satisfaction are ‘very satisfied’, ‘satisfied’, ‘neither satisfied nor dissatisfied’, ‘dissatisfied’ and ‘very
dissatisfied’, which I convert into the three-scales of satisfied, neither and dissatisfied by
collapsing the first and the last two responses. Likewise, the five-scale responses for the
affective well-being measures are ‘all of the time’, ‘most of the time’, ‘some of the time’,
‘occasionally’ and ‘never’, which are converted into the three-scales of occasionally/never,
sometimes and always/mostly. Converting the original responses in this way avoids data
11 Since I use cross-section data, I am only able to explicitly account for workplace level unobserved heterogeneity however. 12 The simplest way of addressing this would have been to use cluster option in a regression. However, this would not allow estimating a parameter measuring (shared) unobserved attributes. Neither would it allow testing the significance of such an influence.
13
thinning in the extreme scales, which makes convergence difficult, particularly for
random-effects ordered logit models.13
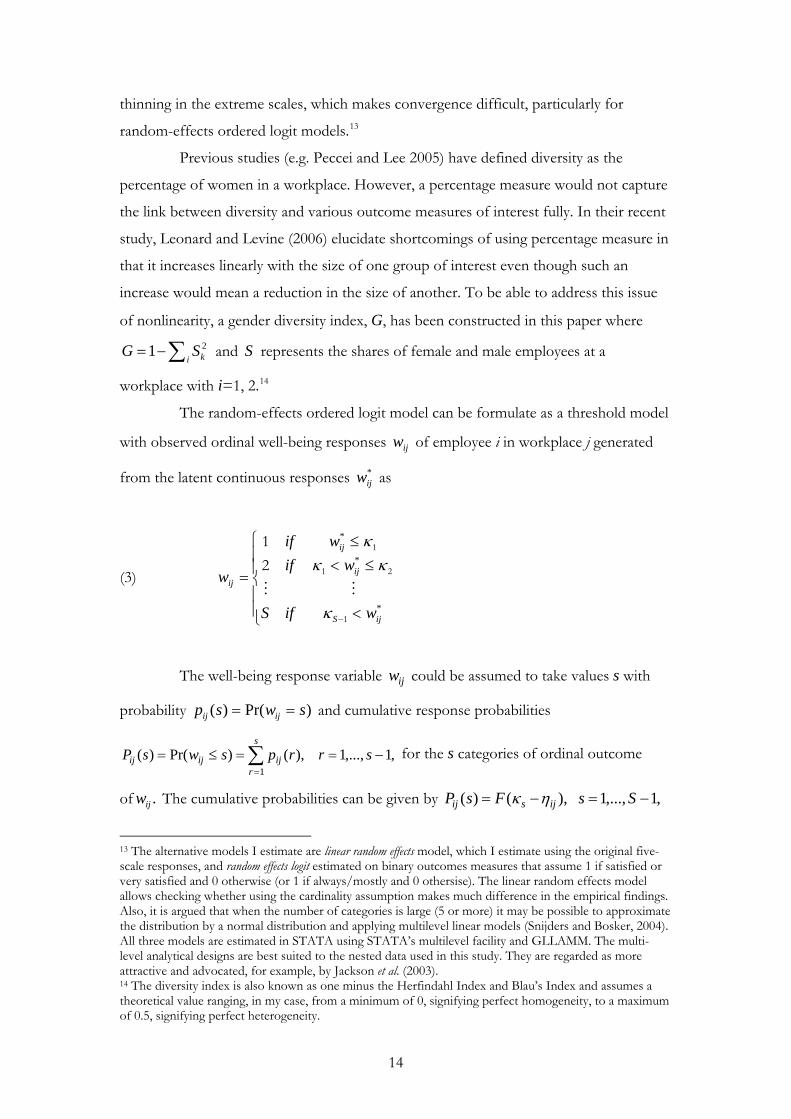
Previous studies (e.g. Peccei and Lee 2005) have defined diversity as the
percentage of women in a workplace. However, a percentage measure would not capture
the link between diversity and various outcome measures of interest fully. In their recent
study, Leonard and Levine (2006) elucidate shortcomings of using percentage measure in
that it increases linearly with the size of one group of interest even though such an
increase would mean a reduction in the size of another. To be able to address this issue
of nonlinearity, a gender diversity index, G, has been constructed in this paper where
and represents the shares of female and male employees at a
workplace with i=1, 2.
21 kiG S= −∑ S
14
The random-effects ordered logit model can be formulate as a threshold model
with observed ordinal well-being responses of employee i in workplace j generated
from the latent continuous responses as
ijw
*ijw
(3)
⎪⎪⎩
⎪⎪⎨
⎧
<
≤<≤
=
−*
*
*
ijS
ij
ij
ij
wifS
wifwif
w
1
21
1
21
κ
κκκ
The well-being response variable could be assumed to take values s with
probability and cumulative response probabilities
for the s categories of ordinal outcome
of The cumulative probabilities can be given by
ijw
,1
)Pr()( swsp ijij ==
),()1∑=
=≤s
rijij rpsw ,...,1Pr()( −==ij srsP
.ijw ,1,...,1),()( −=−= SsFsP ijsij ηκ
13 The alternative models I estimate are linear random effects model, which I estimate using the original five-scale responses, and random effects logit estimated on binary outcomes measures that assume 1 if satisfied or very satisfied and 0 otherwise (or 1 if always/mostly and 0 othersise). The linear random effects model allows checking whether using the cardinality assumption makes much difference in the empirical findings. Also, it is argued that when the number of categories is large (5 or more) it may be possible to approximate the distribution by a normal distribution and applying multilevel linear models (Snijders and Bosker, 2004). All three models are estimated in STATA using STATA’s multilevel facility and GLLAMM. The multi-level analytical designs are best suited to the nested data used in this study. They are regarded as more attractive and advocated, for example, by Jackson et al. (2003). 14 The diversity index is also known as one minus the Herfindahl Index and Blau’s Index and assumes a theoretical value ranging, in my case, from a minimum of 0, signifying perfect homogeneity, to a maximum of 0.5, signifying perfect heterogeneity.
14
where F is the cumulative density function of the model residuals, ijε that can also be
expressed as ,1,...,1,)]([)( −=−== SssPRsP ijsijij ηκ where 1−= FR is the link
function. Assuming the distribution of the model residuals for the latent well-being
response, to be logistic, the cumulative probabilities can be given by ,*ijw
(4a) )(1
()Pr()(
s
ijsijsijij exp
expsP
ηκ)
ij
ηκηκε
−+
−=−≤=
or, alternatively as
(4b) 1)(
)(−−=
⎥⎥⎦
⎤
⎢⎢⎣
⎡
≤−
≤=
⎥⎥⎦
⎤
⎢⎢⎣
⎡
−S
swPr1swPr
log(s)P1
(s)Plog ijs
ij
ij
ij
ij ηκ ,..., 1=s
where cκ is the threshold parameter for categories 1,...,1 −= Ss and
The general model can thus be given by .= ojij ββη1∑=
+L
llijlj X
(5) ⎟⎟⎠
⎞⎜⎜⎝
⎛+−=
⎥⎥⎦
⎤
⎢⎢⎣
⎡
≤−
≤∑=
L
llijljojs
ij
ij XswPr
swPrlog
1)(1)(
ββκ
The vector X represents L covariates that include the diversity index as well as
the whole array of covariates relating to employees, their workplaces and geographic
location. Since the regression coefficients in equation (5) do not carry the subscript s,
they do not vary across the ordinal categories. The intercept term βoj in equation (5) has a
workplace random component so that β0j = β00+ ξ0j, where β00 is the mean intercept and
ξ0j is the deviation of the establishment specific intercept β0j from the mean. I make
several assumptions in this set up including: (i) independence across the j workplaces
(level-2 units), (ii) normally distributed employee error terms (εij|xij~N(0,θ)), (iii) no
correlation between error terms associated with any two employees within a workplace,
i.e. (Cov(εij,εi’j)=0 for i≠i’) and workplace level variations that are distributed normally and
uncorrelated with individual/employee error terms, i.e. ξ0j|xij~N(0,ψ) and Cov(ξ0j,εij)=0,
wihere θ≡Var(εij) and ψ≡Var(ξ0j) (Rabe-Hesketh and Skrondal 2008, Hedeker and
Gibbons 1994, Crouchley 1995, Snijders and Bosker 2004,)
15
5. Empirical results and discussion
Estimation results from the random-effects logit models are reported in Tables 1
through 21. Tables 1 to 14 report estimation results from full sample and gender based
sub-group analysis. These are based on gender diversity measured continuously. Tables
15 to 21 report selected estimation results for the full sample and gender based sub-
groups using discrete measures of diversity. The latter set of results is specific to the well-
being equations that were found to indicate robust and statistically significant link
between gender diversity and job-related well-being. They allow testing whether there is
group size related effects.15 As stated earlier, I estimate three different specifications of
the well-being equations in each case as a robustness check. The first specification
(Model 1) seeks to establish the link between the main gender diversity variable and
employee job-related well-being, controlling only for employee-level characteristics. The
second specification (Model 2) makes a further control for establishment-level
characteristics, including labour market characteristics in the establishment’s locality. The
final specification (Model 3) controls for influences relating to workplace policy and
practice by incorporating summary scores generated from Factor Analysis.
A descriptive statistics of the fourteen job-related well-being outcomes and a
correlation matrix depicting the correlation structure among them are reported in
Appendix Tables A1 and A2, respectively. The correlation matrix shows that affective
well-being measures are positively correlated with all the facet satisfaction measures. The
correlation is stronger among the affective well-being measures themselves, but there are
also noticeably strong correlations between affective well-being measures and the facet
satisfaction measures relating to the ‘work itself’, ‘sense of achievement’, ‘amount of
influence on the job’ and ‘scope for using own initiative’ in particular. Of the facet
satisfaction measures, satisfaction with “the work itself” has the strongest of correlations
with all the other well-being measures, including affective well-being measures. This is in
line with previous findings where satisfaction with the nature of work undertaken is
found to be particularly closely associated with other facet-specific satisfaction and with
overall job satisfaction (Warr 1999).
15 What I report are coefficients specific to the variable of interest – gender diversity. Full model outputs from the random effects logit models as well as those from linear random effects and random effects logit models are available on request. The estimated coefficients are un-weighted but my results are consistent with findings (on age, gender, education, union membership, and other controls I use) in the literature. Estimation conducted using GLLAMM.
16
Figure A1 in the Appendix depicts a plot of the workplace gender diversity
index computed. It shows that nearly all workplaces have non-zero gender diversity, with
a distribution skewed towards full diversity. The large spike at 0.5 suggests that nearly 15
percent of the workplaces in the final sample have full diversity comprising a 50-50 split
between men and women. There are also some single-sex workplaces as the spike at 0
indicates. Appendix Table A3 reports descriptive statistics on the regressors used in the
modelling. These include both employee and workplace characteristics. Accordingly,
women constitute slightly more than 50 per cent of employees in the estimation sample
while those that are 50 or over make up a quarter. Some 68 per cent of employees are
married and only 5 per cent are non-white. Employees with disability constitute nearly 12
per cent of employees in the final sample. Nearly 60 per cent of employees report that
their skills do not match the skills requirements of their job. Most employees (92%) are
on permanent contract and 79 per cent of employees are employed full-time. Some 35
per cent of employees in the sample are trade union members. In terms of workplace
characteristics, some 70 per cent of workplaces are private establishments. The
proportion of workplaces that are sole establishments stands at 21 per cent, indicating
that most workplaces are part of a multi-establishment setup. Also, most workplaces
(82%) are establishments based in urban areas.
The reported descriptive statistics also includes the three summary measures of
workplace HRM practice and policy representing provisions of equality, training and
flexibility at the workplace. As stated in the data section, careful selection of variables
that are likely to demonstrate employers’ commitment towards employees has been
made. The idea here is that if the employer is committed to these aspects of employee
development and hence scoring high on the summary measures, then this may remove
the potentially negative association between gender diversity and employee job-related
well-being. Appendix Tables A4 to A6 report some outputs from Factor Analysis that
generated the summary scores. Table A4 in the Appendix shows the Kaiser-Meyer-Olkin
(KMO) measure of sampling adequacy and Bartlett’s test of sphericity. The KMO
statistic of 0.91 suggests that patterns of correlations among the variables selected are
relatively compact and that factor analysis is highly likely to yield distinct and reliable
factors. The Bartlett’s test statistic means that the null hypothesis that the original
correlation matrix is an identity matrix is rejected decisively.
The estimation results reported in Tables 1 – 14 show that the direction of the
relationship between gender diversity and the fourteen measures of job-related well-being
17
is negative in all cases except ‘satisfaction with pay’. In terms of statistical significance,
only five of the well-being equations that indicate negative relationship are found to be
statistically significant across the three specifications. These relate to ‘satisfaction with the
sense of achievement from work’, ‘satisfaction with job training received’, ‘satisfaction
with the work itself’, ‘satisfaction with involvement in decision-making’ and the affective
well-being measure of ‘feeling content’. Three more facet satisfaction measures that
indicate negative relationship are also found to be statistically significant but these are not
found to be robust. In contrast, the positive relationship between gender diversity and
‘satisfaction with pay’ is found to be only marginally significant in two of the three
specifications. These findings suggest that five of the equations estimated support our
first hypothesis that gender diversity is negatively associated with employee job-related
well-being.
Tables 1 – 14 also report sub-group based estimation results relating to women
and men. The estimation results indicate that for women, all eight of the facet
satisfaction measures except ‘satisfaction with pay’ are negative and six of these are
found to be statistically significant. In contrast, for men all eight facets of satisfaction
except ‘satisfaction with involvement in decision making’ are found to be positive. None
of these are found to be statistically significant for men, however. The sub-group analysis
involving the affective well-being measures shows some systematic differences between
men and women. Accordingly, for women it is found that gender diversity is associated
positively with negative affects and negatively with positive affects. However, only the
negative effects (relating to positive affects) are found to be statistically significant. For
men, the results are the opposite in that gender diversity is associated positively with
positive affects and negatively with negative affects. Only two of the positive effects are
found to be statistically significant for men, however.16 The sub-group based estimation
results therefore lend support to the second hypothesis suggesting that the negative well-
being effect of gender diversity is associated with women.
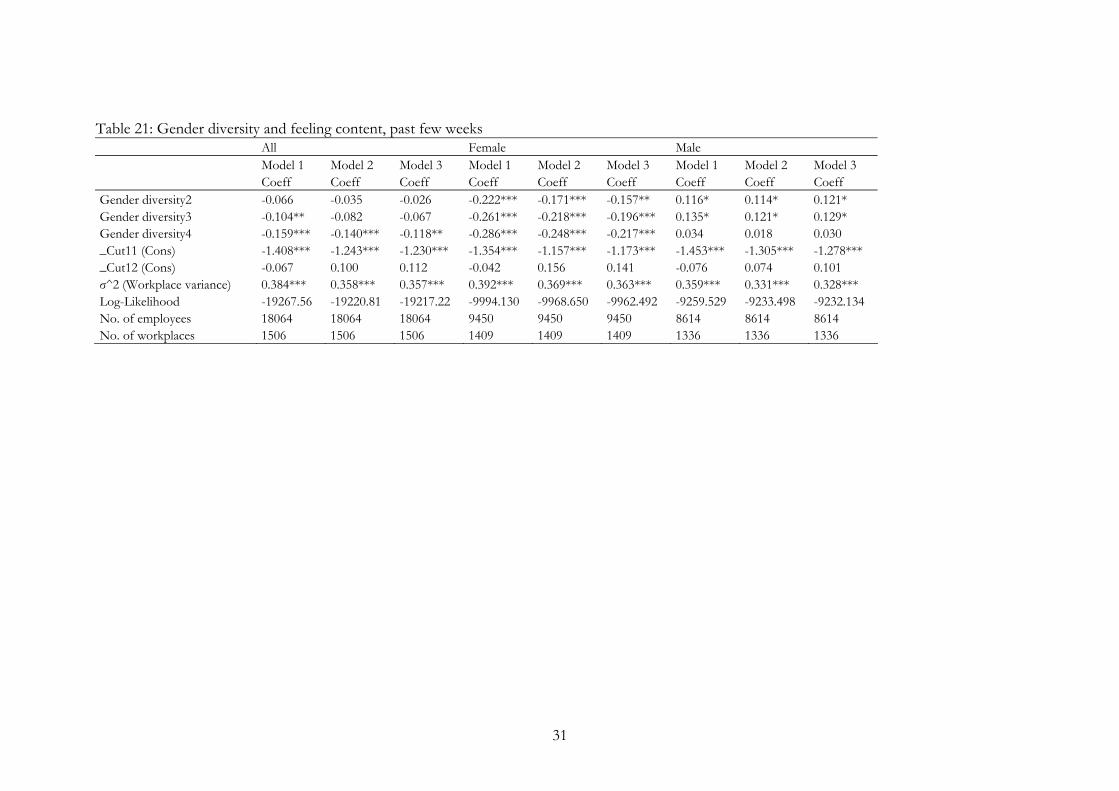
To test the third hypothesis, I undertook further empirical analysis using
discrete measures of gender diversity that assume four different values. The first discrete
measure assumes a value of 1 if gender diversity in a workplace is at most the 25th
percentile of gender diversity for all workplaces and 0 otherwise. The second discrete
measure assumes a value of 1 if diversity at the workplace is greater than the 25th
16 As explained in Section 3 (3.2.1), the negative affects have been converted into positive. This means that the positive coefficients associated with ‘not tense’, ‘not worried’ and ‘not uneasy’ would have been negative if these measures were not converted, i.e. ‘tense’, ‘worried’ and ‘uneasy’.
18
percentile and at most the 50th percentile of diversity for all workplaces and 0 otherwise.
The third discrete measure assumes a value of 1 if gender diversity at the workplace is
above the 50th percentile and at most the 75th percentile of gender diversity across all
workplaces while the last discrete measure assumes a value of 1 if gender diversity at the
workplace is greater than the 75th percentile of gender diversity for all workplaces. As
explained earlier, if there are systematic variations in the direction and significance of
estimated effects across the discrete measures of gender diversity, this will allow us to
test the third hypothesis. Tables 15 to 21 report estimation results based on these discrete
measures of gender diversity for the well-being equations the previous analysis suggested
robust and statistically significant link. The results indicate that the reduction in women’s
job-related well-being increases with the level of workplace gender diversity. Thus,
compared with workplaces with gender diversity at most the 25th percentile of gender
diversity for all workplaces, higher levels of workplace gender diversity are associated
with more reduction in the well-being of women. This finding lends support to
hypothesis 3b I sat up in Section 2 of the paper.
Test for hypothesis 4 come from two sources. Firstly, the third specification in
each of the models estimated includes summary measures of workplace HRM practice
and policy. However, the inclusion of such policy and practice variables does not appear
to change the negative well-being effects the first two specifications find. This lends
some support to hypothesis 4b that workplace policies and practices do not go far
enough and may only be paying lip-service to gender equality and diversity. Though
results are not included in this paper, a further test of hypothesis 4 involving the
inclusion of an interaction of the gender diversity variable and the measure of workplace
equality policy did not give positive and significant effect for the interaction term.
As can be seen from Tables 1 – 21, what I report are estimated coefficients
specific to the variable of interest – gender diversity – and other parameters associated
with the models estimated. One important finding worth noting is the parameter
capturing unobserved workplace heterogeneity, which is found to be highly significant in
all cases. This suggests the importance of accounting for unobserved workplace
heterogeneity. Each of the specifications estimated include a range of employee and
employer related characteristics summarised in Appendix Table 3A. Findings specific to
these characteristics are very much consistent with findings in the literature.
6. Summary and Conclusion
19
20
This paper attempted to establish empirically the relationship between
workplace gender diversity and job-related well-being using the WERS2004 data. It uses
an index of workplace gender diversity and fourteen different measures of employee job-
related well-being. The well-being measures include eight measures of facet satisfaction
and six measures of affective well-being. The paper made extensive review of the
relevant theoretical literature and sat up four testable hypotheses regarding: (i) the link
between workplace gender diversity and each of the job-related well-being measures, (ii)
whether there are differences between men and women regarding this link, (iii) if the link
between gender diversity and well-being changes with the extent of workplace gender
diversity and (iv) whether workplace HRM policy and practice have any bearing on the
link between workplace gender diversity and employee job-related well-being. The paper
assumed responses to subjective well-being measures to be comparable ordinally and
employed random-effects ordered logit model. By doing so, it is able to account for
unobserved workplace heterogeneity, something previous UK studies on gender
composition ignore. This is achieved by exploiting the nested structure of the
WERS2004 data. It also employed alternative specifications of the well-being equations,
which confirm robustness.
Empirical findings based on the full sample confirm the first hypothesis
regarding the relationship between workplace gender diversity and employee job-related
well-being. Accordingly, workplace gender diversity and employee job-related well-being
have negative and statistically significant relationship for a number of the equations I
estimated. Sub-group based findings clearly indicate that the negative well-being effects
of gender diversity are all associated with women, lending support to the second
hypothesis I sat up. Estimation results based on discrete measures of workplace gender
diversity indicate that higher levels of gender diversity are associated with more negative
well-being effects for women. This is in line with findings in the literature that suggest a
decline in the quantity and quality of inter-group relationships as groups become more
balanced. The paper finds that workplace HRM policy and practice do not ameliorate the
adverse well-being effects of gender diversity on women. This may be suggestive of
ineffective workplace policies and practices. Improving the effectiveness of workplace
policies and practices may hold the key to overcoming adverse well-being effects
associated with workplace gender diversity.
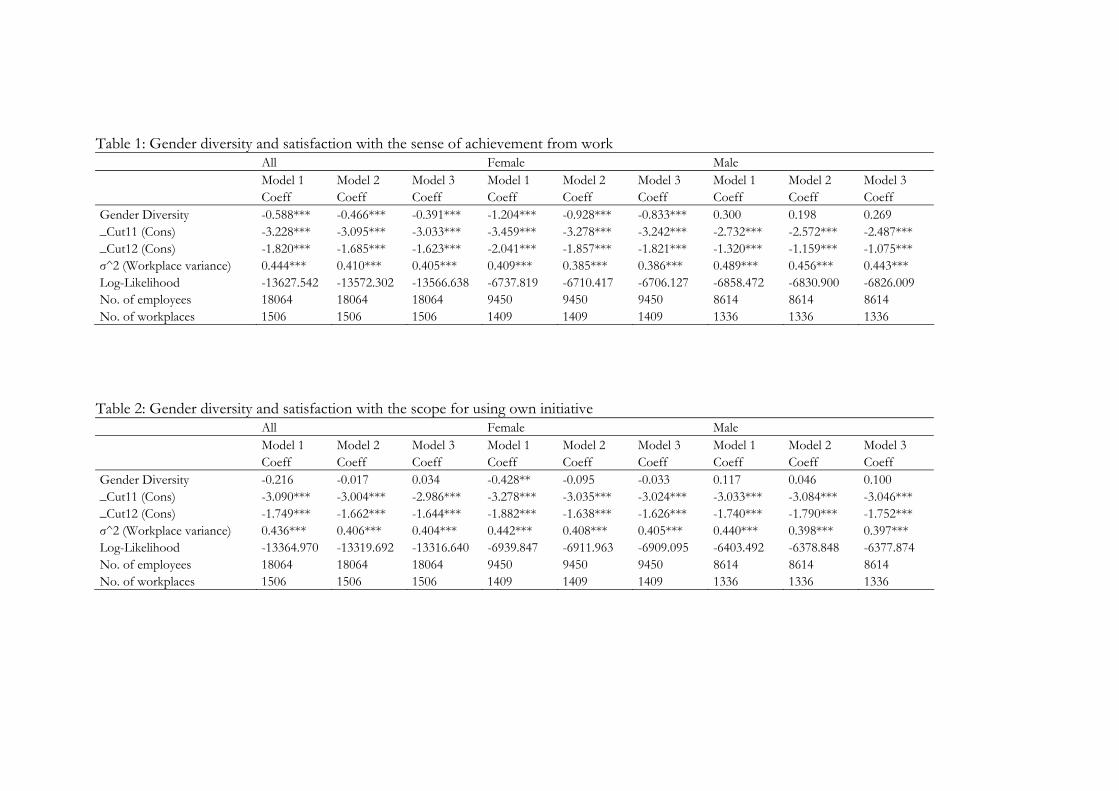
Table 1: Gender diversity and satisfaction with the sense of achievement from work All Female Male Model 1 Model 2 Model 3 Model 1 Model 2 Model 3 Model 1 Model 2 Model 3 Coeff Coeff Coeff Coeff Coeff Coeff Coeff Coeff Coeff Gender Diversity -0.588*** -0.466*** -0.391*** -1.204*** -0.928*** -0.833*** 0.300 0.198 0.269 _Cut11 (Cons) -3.228*** -3.095*** -3.033*** -3.459*** -3.278*** -3.242*** -2.732*** -2.572*** -2.487*** _Cut12 (Cons) -1.820*** -1.685*** -1.623*** -2.041*** -1.857*** -1.821*** -1.320*** -1.159*** -1.075*** σ^2 (Workplace variance) 0.444*** 0.410*** 0.405*** 0.409*** 0.385*** 0.386*** 0.489*** 0.456*** 0.443*** Log-Likelihood -13627.542 -13572.302 -13566.638 -6737.819 -6710.417 -6706.127 -6858.472 -6830.900 -6826.009 No. of employees 18064 18064 18064 9450 9450 9450 8614 8614 8614 No. of workplaces 1506 1506 1506 1409 1409 1409 1336 1336 1336
Table 2: Gender diversity and satisfaction with the scope for using own initiative All Female Male Model 1 Model 2 Model 3 Model 1 Model 2 Model 3 Model 1 Model 2 Model 3 Coeff Coeff Coeff Coeff Coeff Coeff Coeff Coeff Coeff Gender Diversity -0.216 -0.017 0.034 -0.428** -0.095 -0.033 0.117 0.046 0.100 _Cut11 (Cons) -3.090*** -3.004*** -2.986*** -3.278*** -3.035*** -3.024*** -3.033*** -3.084*** -3.046*** _Cut12 (Cons) -1.749*** -1.662*** -1.644*** -1.882*** -1.638*** -1.626*** -1.740*** -1.790*** -1.752*** σ^2 (Workplace variance) 0.436*** 0.406*** 0.404*** 0.442*** 0.408*** 0.405*** 0.440*** 0.398*** 0.397*** Log-Likelihood -13364.970 -13319.692 -13316.640 -6939.847 -6911.963 -6909.095 -6403.492 -6378.848 -6377.874 No. of employees 18064 18064 18064 9450 9450 9450 8614 8614 8614 No. of workplaces 1506 1506 1506 1409 1409 1409 1336 1336 1336
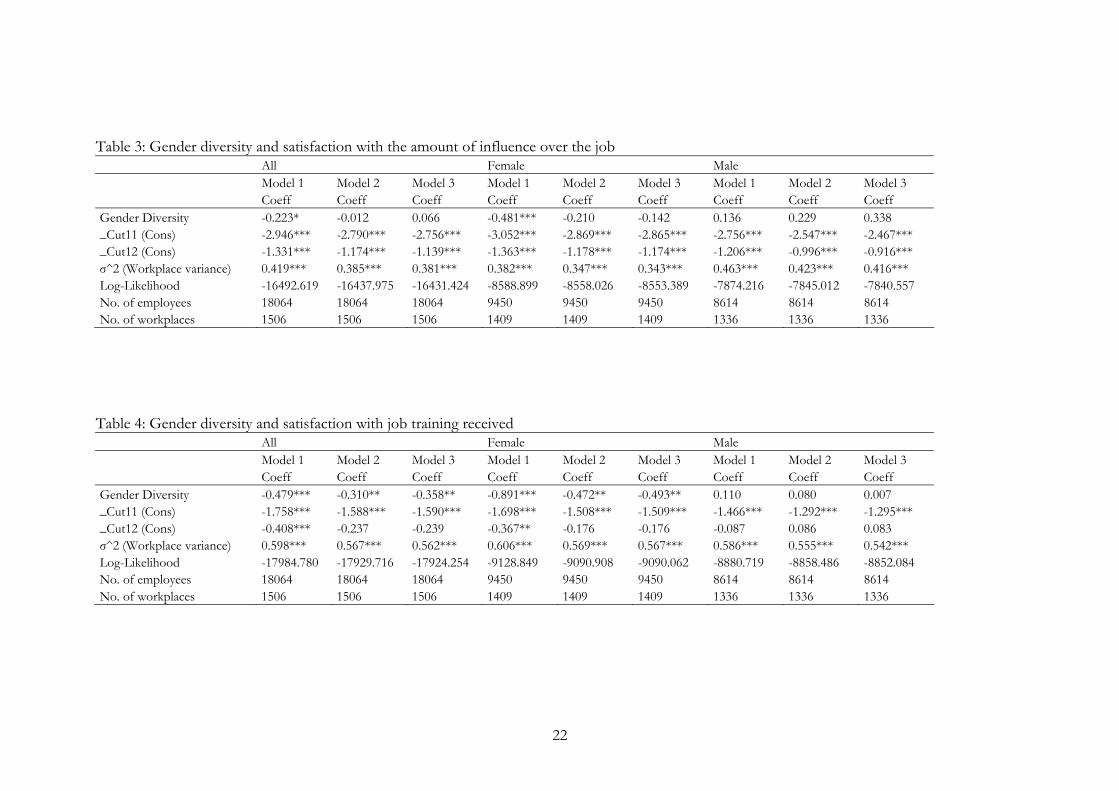
Table 3: Gender diversity and satisfaction with the amount of influence over the job All Female Male Model 1 Model 2 Model 3 Model 1 Model 2 Model 3 Model 1 Model 2 Model 3 Coeff Coeff Coeff Coeff Coeff Coeff Coeff Coeff Coeff Gender Diversity -0.223* -0.012 0.066 -0.481*** -0.210 -0.142 0.136 0.229 0.338 _Cut11 (Cons) -2.946*** -2.790*** -2.756*** -3.052*** -2.869*** -2.865*** -2.756*** -2.547*** -2.467*** _Cut12 (Cons) -1.331*** -1.174*** -1.139*** -1.363*** -1.178*** -1.174*** -1.206*** -0.996*** -0.916*** σ^2 (Workplace variance) 0.419*** 0.385*** 0.381*** 0.382*** 0.347*** 0.343*** 0.463*** 0.423*** 0.416*** Log-Likelihood -16492.619 -16437.975 -16431.424 -8588.899 -8558.026 -8553.389 -7874.216 -7845.012 -7840.557 No. of employees 18064 18064 18064 9450 9450 9450 8614 8614 8614 No. of workplaces 1506 1506 1506 1409 1409 1409 1336 1336 1336
Table 4: Gender diversity and satisfaction with job training received All Female Male Model 1 Model 2 Model 3 Model 1 Model 2 Model 3 Model 1 Model 2 Model 3 Coeff Coeff Coeff Coeff Coeff Coeff Coeff Coeff Coeff Gender Diversity -0.479*** -0.310** -0.358** -0.891*** -0.472** -0.493** 0.110 0.080 0.007 _Cut11 (Cons) -1.758*** -1.588*** -1.590*** -1.698*** -1.508*** -1.509*** -1.466*** -1.292*** -1.295*** _Cut12 (Cons) -0.408*** -0.237 -0.239 -0.367** -0.176 -0.176 -0.087 0.086 0.083 σ^2 (Workplace variance) 0.598*** 0.567*** 0.562*** 0.606*** 0.569*** 0.567*** 0.586*** 0.555*** 0.542*** Log-Likelihood -17984.780 -17929.716 -17924.254 -9128.849 -9090.908 -9090.062 -8880.719 -8858.486 -8852.084 No. of employees 18064 18064 18064 9450 9450 9450 8614 8614 8614 No. of workplaces 1506 1506 1506 1409 1409 1409 1336 1336 1336
22
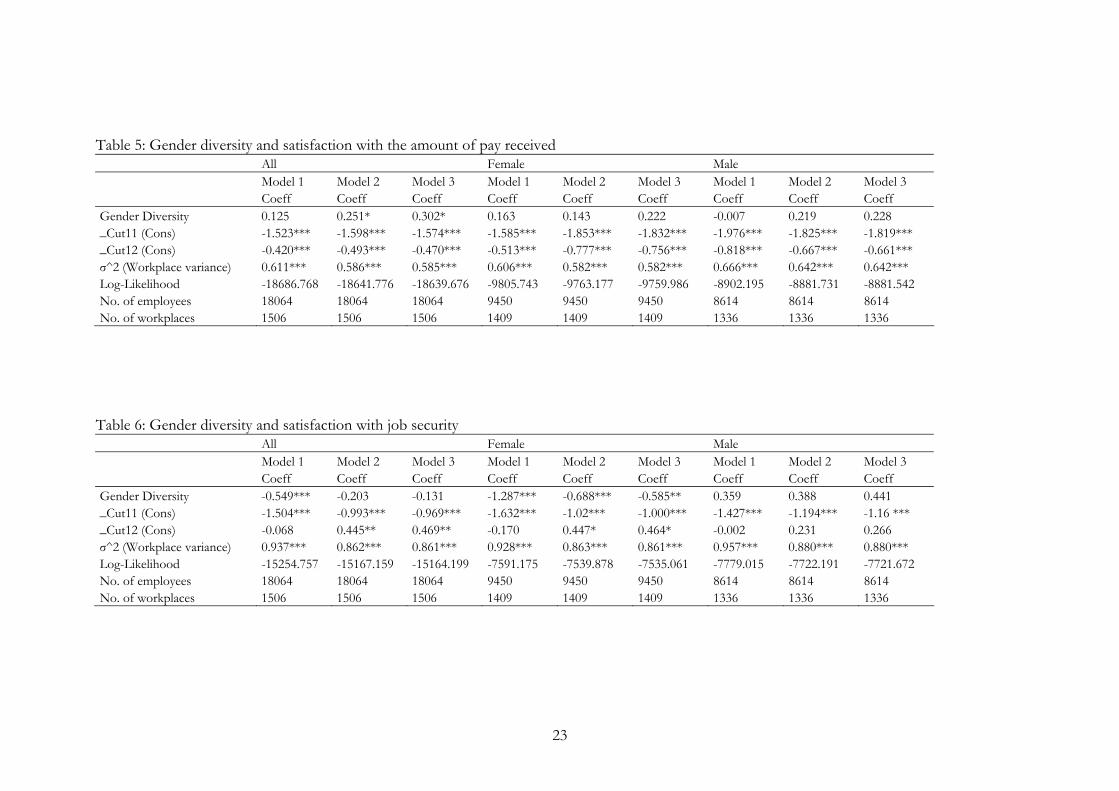
Table 5: Gender diversity and satisfaction with the amount of pay received All Female Male Model 1 Model 2 Model 3 Model 1 Model 2 Model 3 Model 1 Model 2 Model 3 Coeff Coeff Coeff Coeff Coeff Coeff Coeff Coeff Coeff Gender Diversity 0.125 0.251* 0.302* 0.163 0.143 0.222 -0.007 0.219 0.228 _Cut11 (Cons) -1.523*** -1.598*** -1.574*** -1.585*** -1.853*** -1.832*** -1.976*** -1.825*** -1.819*** _Cut12 (Cons) -0.420*** -0.493*** -0.470*** -0.513*** -0.777*** -0.756*** -0.818*** -0.667*** -0.661*** σ^2 (Workplace variance) 0.611*** 0.586*** 0.585*** 0.606*** 0.582*** 0.582*** 0.666*** 0.642*** 0.642*** Log-Likelihood -18686.768 -18641.776 -18639.676 -9805.743 -9763.177 -9759.986 -8902.195 -8881.731 -8881.542 No. of employees 18064 18064 18064 9450 9450 9450 8614 8614 8614 No. of workplaces 1506 1506 1506 1409 1409 1409 1336 1336 1336
Table 6: Gender diversity and satisfaction with job security All Female Male Model 1 Model 2 Model 3 Model 1 Model 2 Model 3 Model 1 Model 2 Model 3 Coeff Coeff Coeff Coeff Coeff Coeff Coeff Coeff Coeff Gender Diversity -0.549*** -0.203 -0.131 -1.287*** -0.688*** -0.585** 0.359 0.388 0.441 _Cut11 (Cons) -1.504*** -0.993*** -0.969*** -1.632*** -1.02*** -1.000*** -1.427*** -1.194*** -1.16 *** _Cut12 (Cons) -0.068 0.445** 0.469** -0.170 0.447* 0.464* -0.002 0.231 0.266 σ^2 (Workplace variance) 0.937*** 0.862*** 0.861*** 0.928*** 0.863*** 0.861*** 0.957*** 0.880*** 0.880*** Log-Likelihood -15254.757 -15167.159 -15164.199 -7591.175 -7539.878 -7535.061 -7779.015 -7722.191 -7721.672 No. of employees 18064 18064 18064 9450 9450 9450 8614 8614 8614 No. of workplaces 1506 1506 1506 1409 1409 1409 1336 1336 1336
23
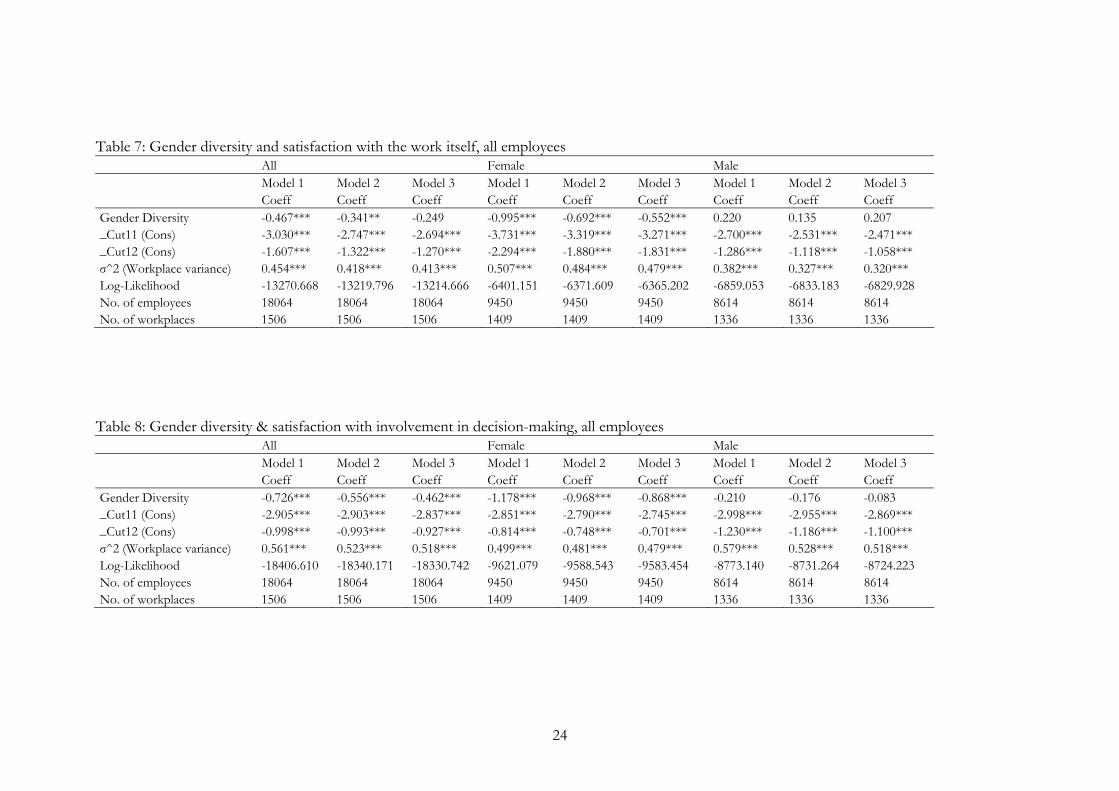
Table 7: Gender diversity and satisfaction with the work itself, all employees All Female Male Model 1 Model 2 Model 3 Model 1 Model 2 Model 3 Model 1 Model 2 Model 3 Coeff Coeff Coeff Coeff Coeff Coeff Coeff Coeff Coeff Gender Diversity -0.467*** -0.341** -0.249 -0.995*** -0.692*** -0.552*** 0.220 0.135 0.207 _Cut11 (Cons) -3.030*** -2.747*** -2.694*** -3.731*** -3.319*** -3.271*** -2.700*** -2.531*** -2.471*** _Cut12 (Cons) -1.607*** -1.322*** -1.270*** -2.294*** -1.880*** -1.831*** -1.286*** -1.118*** -1.058*** σ^2 (Workplace variance) 0.454*** 0.418*** 0.413*** 0.507*** 0.484*** 0.479*** 0.382*** 0.327*** 0.320*** Log-Likelihood -13270.668 -13219.796 -13214.666 -6401.151 -6371.609 -6365.202 -6859.053 -6833.183 -6829.928 No. of employees 18064 18064 18064 9450 9450 9450 8614 8614 8614 No. of workplaces 1506 1506 1506 1409 1409 1409 1336 1336 1336
Table 8: Gender diversity & satisfaction with involvement in decision-making, all employees All Female Male Model 1 Model 2 Model 3 Model 1 Model 2 Model 3 Model 1 Model 2 Model 3 Coeff Coeff Coeff Coeff Coeff Coeff Coeff Coeff Coeff Gender Diversity -0.726*** -0.556*** -0.462*** -1.178*** -0.968*** -0.868*** -0.210 -0.176 -0.083 _Cut11 (Cons) -2.905*** -2.903*** -2.837*** -2.851*** -2.790*** -2.745*** -2.998*** -2.955*** -2.869*** _Cut12 (Cons) -0.998*** -0.993*** -0.927*** -0.814*** -0.748*** -0.701*** -1.230*** -1.186*** -1.100*** σ^2 (Workplace variance) 0.561*** 0.523*** 0.518*** 0.499*** 0.481*** 0.479*** 0.579*** 0.528*** 0.518*** Log-Likelihood -18406.610 -18340.171 -18330.742 -9621.079 -9588.543 -9583.454 -8773.140 -8731.264 -8724.223 No. of employees 18064 18064 18064 9450 9450 9450 8614 8614 8614 No. of workplaces 1506 1506 1506 1409 1409 1409 1336 1336 1336
24
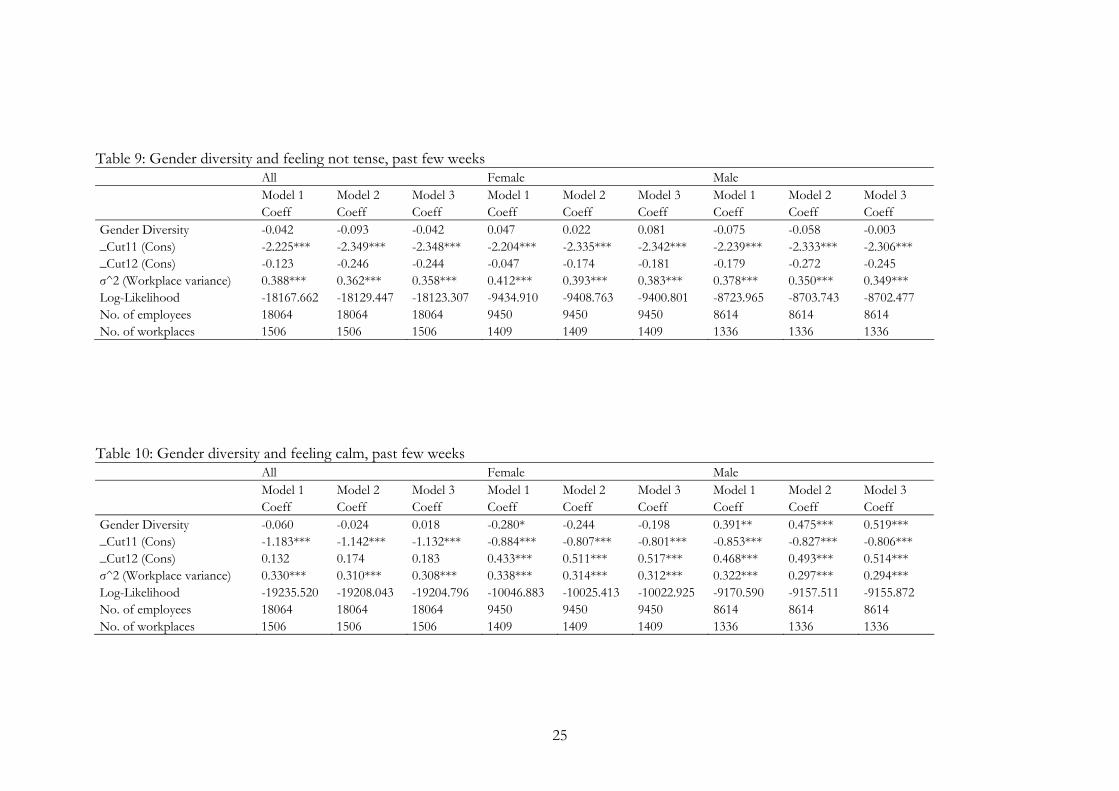
Table 9: Gender diversity and feeling not tense, past few weeks All Female Male Model 1 Model 2 Model 3 Model 1 Model 2 Model 3 Model 1 Model 2 Model 3 Coeff Coeff Coeff Coeff Coeff Coeff Coeff Coeff Coeff Gender Diversity -0.042 -0.093 -0.042 0.047 0.022 0.081 -0.075 -0.058 -0.003 _Cut11 (Cons) -2.225*** -2.349*** -2.348*** -2.204*** -2.335*** -2.342*** -2.239*** -2.333*** -2.306*** _Cut12 (Cons) -0.123 -0.246 -0.244 -0.047 -0.174 -0.181 -0.179 -0.272 -0.245 σ^2 (Workplace variance) 0.388*** 0.362*** 0.358*** 0.412*** 0.393*** 0.383*** 0.378*** 0.350*** 0.349*** Log-Likelihood -18167.662 -18129.447 -18123.307 -9434.910 -9408.763 -9400.801 -8723.965 -8703.743 -8702.477 No. of employees 18064 18064 18064 9450 9450 9450 8614 8614 8614 No. of workplaces 1506 1506 1506 1409 1409 1409 1336 1336 1336
Table 10: Gender diversity and feeling calm, past few weeks All Female Male Model 1 Model 2 Model 3 Model 1 Model 2 Model 3 Model 1 Model 2 Model 3 Coeff Coeff Coeff Coeff Coeff Coeff Coeff Coeff Coeff Gender Diversity -0.060 -0.024 0.018 -0.280* -0.244 -0.198 0.391** 0.475*** 0.519*** _Cut11 (Cons) -1.183*** -1.142*** -1.132*** -0.884*** -0.807*** -0.801*** -0.853*** -0.827*** -0.806*** _Cut12 (Cons) 0.132 0.174 0.183 0.433*** 0.511*** 0.517*** 0.468*** 0.493*** 0.514*** σ^2 (Workplace variance) 0.330*** 0.310*** 0.308*** 0.338*** 0.314*** 0.312*** 0.322*** 0.297*** 0.294*** Log-Likelihood -19235.520 -19208.043 -19204.796 -10046.883 -10025.413 -10022.925 -9170.590 -9157.511 -9155.872 No. of employees 18064 18064 18064 9450 9450 9450 8614 8614 8614 No. of workplaces 1506 1506 1506 1409 1409 1409 1336 1336 1336
25
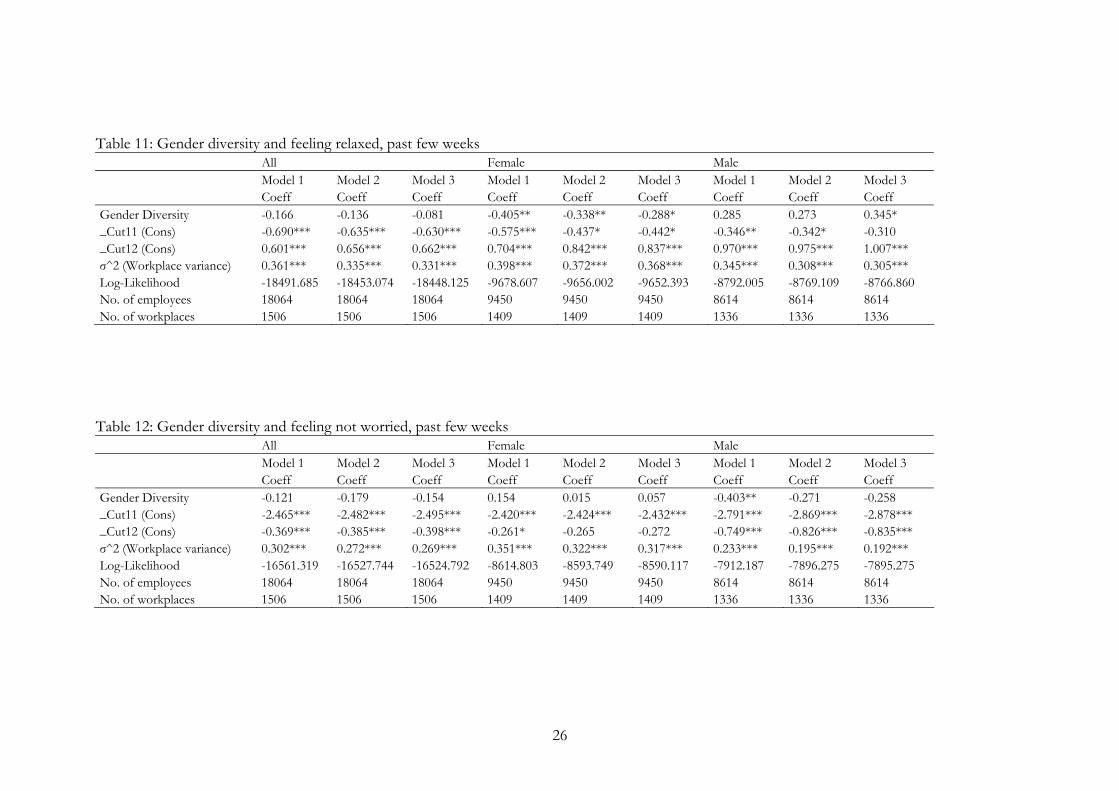
Table 11: Gender diversity and feeling relaxed, past few weeks All Female Male Model 1 Model 2 Model 3 Model 1 Model 2 Model 3 Model 1 Model 2 Model 3 Coeff Coeff Coeff Coeff Coeff Coeff Coeff Coeff Coeff Gender Diversity -0.166 -0.136 -0.081 -0.405** -0.338** -0.288* 0.285 0.273 0.345* _Cut11 (Cons) -0.690*** -0.635*** -0.630*** -0.575*** -0.437* -0.442* -0.346** -0.342* -0.310 _Cut12 (Cons) 0.601*** 0.656*** 0.662*** 0.704*** 0.842*** 0.837*** 0.970*** 0.975*** 1.007*** σ^2 (Workplace variance) 0.361*** 0.335*** 0.331*** 0.398*** 0.372*** 0.368*** 0.345*** 0.308*** 0.305*** Log-Likelihood -18491.685 -18453.074 -18448.125 -9678.607 -9656.002 -9652.393 -8792.005 -8769.109 -8766.860 No. of employees 18064 18064 18064 9450 9450 9450 8614 8614 8614 No. of workplaces 1506 1506 1506 1409 1409 1409 1336 1336 1336 Table 12: Gender diversity and feeling not worried, past few weeks All Female Male Model 1 Model 2 Model 3 Model 1 Model 2 Model 3 Model 1 Model 2 Model 3 Coeff Coeff Coeff Coeff Coeff Coeff Coeff Coeff Coeff Gender Diversity -0.121 -0.179 -0.154 0.154 0.015 0.057 -0.403** -0.271 -0.258 _Cut11 (Cons) -2.465*** -2.482*** -2.495*** -2.420*** -2.424*** -2.432*** -2.791*** -2.869*** -2.878*** _Cut12 (Cons) -0.369*** -0.385*** -0.398*** -0.261* -0.265 -0.272 -0.749*** -0.826*** -0.835*** σ^2 (Workplace variance) 0.302*** 0.272*** 0.269*** 0.351*** 0.322*** 0.317*** 0.233*** 0.195*** 0.192*** Log-Likelihood -16561.319 -16527.744 -16524.792 -8614.803 -8593.749 -8590.117 -7912.187 -7896.275 -7895.275 No. of employees 18064 18064 18064 9450 9450 9450 8614 8614 8614 No. of workplaces 1506 1506 1506 1409 1409 1409 1336 1336 1336
26
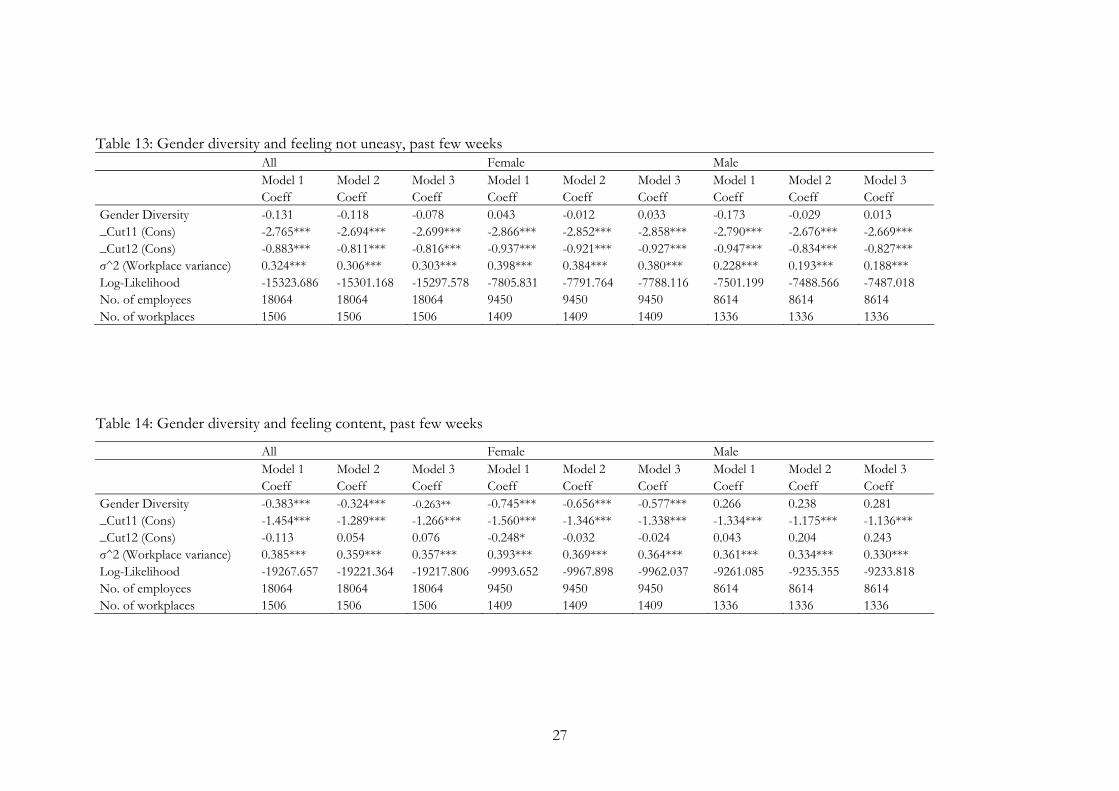
Table 13: Gender diversity and feeling not uneasy, past few weeks All Female Male Model 1 Model 2 Model 3 Model 1 Model 2 Model 3 Model 1 Model 2 Model 3 Coeff Coeff Coeff Coeff Coeff Coeff Coeff Coeff Coeff Gender Diversity -0.131 -0.118 -0.078 0.043 -0.012 0.033 -0.173 -0.029 0.013 _Cut11 (Cons) -2.765*** -2.694*** -2.699*** -2.866*** -2.852*** -2.858*** -2.790*** -2.676*** -2.669*** _Cut12 (Cons) -0.883*** -0.811*** -0.816*** -0.937*** -0.921*** -0.927*** -0.947*** -0.834*** -0.827*** σ^2 (Workplace variance) 0.324*** 0.306*** 0.303*** 0.398*** 0.384*** 0.380*** 0.228*** 0.193*** 0.188*** Log-Likelihood -15323.686 -15301.168 -15297.578 -7805.831 -7791.764 -7788.116 -7501.199 -7488.566 -7487.018 No. of employees 18064 18064 18064 9450 9450 9450 8614 8614 8614 No. of workplaces 1506 1506 1506 1409 1409 1409 1336 1336 1336
Table 14: Gender diversity and feeling content, past few weeks
All Female Male Model 1 Model 2 Model 3 Model 1 Model 2 Model 3 Model 1 Model 2 Model 3 Coeff Coeff Coeff Coeff Coeff Coeff Coeff Coeff Coeff Gender Diversity -0.383*** -0.324*** -0.263** -0.745*** -0.656*** -0.577*** 0.266 0.238 0.281 _Cut11 (Cons) -1.454*** -1.289*** -1.266*** -1.560*** -1.346*** -1.338*** -1.334*** -1.175*** -1.136*** _Cut12 (Cons) -0.113 0.054 0.076 -0.248* -0.032 -0.024 0.043 0.204 0.243 σ^2 (Workplace variance) 0.385*** 0.359*** 0.357*** 0.393*** 0.369*** 0.364*** 0.361*** 0.334*** 0.330*** Log-Likelihood -19267.657 -19221.364 -19217.806 -9993.652 -9967.898 -9962.037 -9261.085 -9235.355 -9233.818 No. of employees 18064 18064 18064 9450 9450 9450 8614 8614 8614 No. of workplaces 1506 1506 1506 1409 1409 1409 1336 1336 1336
27
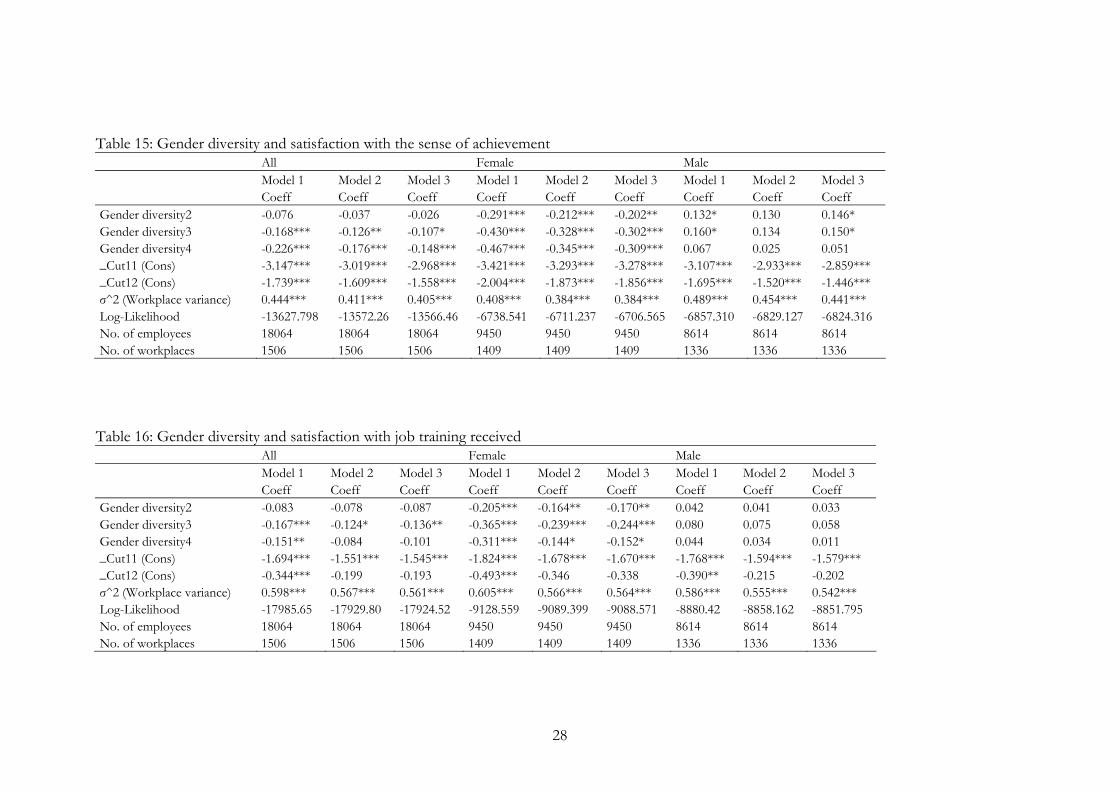
Table 15: Gender diversity and satisfaction with the sense of achievement All Female Male Model 1 Model 2 Model 3 Model 1 Model 2 Model 3 Model 1 Model 2 Model 3 Coeff Coeff Coeff Coeff Coeff Coeff Coeff Coeff Coeff Gender diversity2 -0.076 -0.037 -0.026 -0.291*** -0.212*** -0.202** 0.132* 0.130 0.146* Gender diversity3 -0.168*** -0.126** -0.107* -0.430*** -0.328*** -0.302*** 0.160* 0.134 0.150* Gender diversity4 -0.226*** -0.176*** -0.148*** -0.467*** -0.345*** -0.309*** 0.067 0.025 0.051 _Cut11 (Cons) -3.147*** -3.019*** -2.968*** -3.421*** -3.293*** -3.278*** -3.107*** -2.933*** -2.859*** _Cut12 (Cons) -1.739*** -1.609*** -1.558*** -2.004*** -1.873*** -1.856*** -1.695*** -1.520*** -1.446*** σ^2 (Workplace variance) 0.444*** 0.411*** 0.405*** 0.408*** 0.384*** 0.384*** 0.489*** 0.454*** 0.441*** Log-Likelihood -13627.798 -13572.26 -13566.46 -6738.541 -6711.237 -6706.565 -6857.310 -6829.127 -6824.316 No. of employees 18064 18064 18064 9450 9450 9450 8614 8614 8614 No. of workplaces 1506 1506 1506 1409 1409 1409 1336 1336 1336
Table 16: Gender diversity and satisfaction with job training received All Female Male Model 1 Model 2 Model 3 Model 1 Model 2 Model 3 Model 1 Model 2 Model 3 Coeff Coeff Coeff Coeff Coeff Coeff Coeff Coeff Coeff Gender diversity2 -0.083 -0.078 -0.087 -0.205*** -0.164** -0.170** 0.042 0.041 0.033 Gender diversity3 -0.167*** -0.124* -0.136** -0.365*** -0.239*** -0.244*** 0.080 0.075 0.058 Gender diversity4 -0.151** -0.084 -0.101 -0.311*** -0.144* -0.152* 0.044 0.034 0.011 _Cut11 (Cons) -1.694*** -1.551*** -1.545*** -1.824*** -1.678*** -1.670*** -1.768*** -1.594*** -1.579*** _Cut12 (Cons) -0.344*** -0.199 -0.193 -0.493*** -0.346 -0.338 -0.390** -0.215 -0.202 σ^2 (Workplace variance) 0.598*** 0.567*** 0.561*** 0.605*** 0.566*** 0.564*** 0.586*** 0.555*** 0.542*** Log-Likelihood -17985.65 -17929.80 -17924.52 -9128.559 -9089.399 -9088.571 -8880.42 -8858.162 -8851.795 No. of employees 18064 18064 18064 9450 9450 9450 8614 8614 8614 No. of workplaces 1506 1506 1506 1409 1409 1409 1336 1336 1336
28
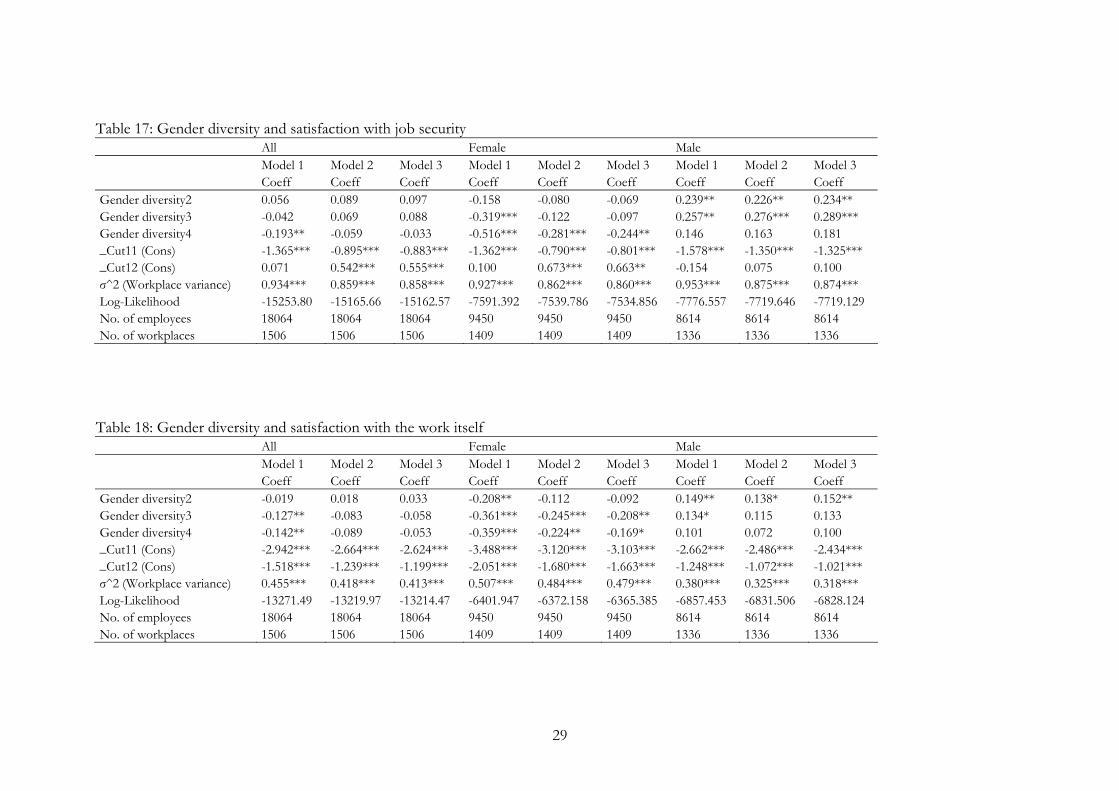
Table 17: Gender diversity and satisfaction with job security All Female Male Model 1 Model 2 Model 3 Model 1 Model 2 Model 3 Model 1 Model 2 Model 3 Coeff Coeff Coeff Coeff Coeff Coeff Coeff Coeff Coeff Gender diversity2 0.056 0.089 0.097 -0.158 -0.080 -0.069 0.239** 0.226** 0.234** Gender diversity3 -0.042 0.069 0.088 -0.319*** -0.122 -0.097 0.257** 0.276*** 0.289*** Gender diversity4 -0.193** -0.059 -0.033 -0.516*** -0.281*** -0.244** 0.146 0.163 0.181 _Cut11 (Cons) -1.365*** -0.895*** -0.883*** -1.362*** -0.790*** -0.801*** -1.578*** -1.350*** -1.325*** _Cut12 (Cons) 0.071 0.542*** 0.555*** 0.100 0.673*** 0.663** -0.154 0.075 0.100 σ^2 (Workplace variance) 0.934*** 0.859*** 0.858*** 0.927*** 0.862*** 0.860*** 0.953*** 0.875*** 0.874*** Log-Likelihood -15253.80 -15165.66 -15162.57 -7591.392 -7539.786 -7534.856 -7776.557 -7719.646 -7719.129 No. of employees 18064 18064 18064 9450 9450 9450 8614 8614 8614 No. of workplaces 1506 1506 1506 1409 1409 1409 1336 1336 1336
Table 18: Gender diversity and satisfaction with the work itself All Female Male Model 1 Model 2 Model 3 Model 1 Model 2 Model 3 Model 1 Model 2 Model 3 Coeff Coeff Coeff Coeff Coeff Coeff Coeff Coeff Coeff Gender diversity2 -0.019 0.018 0.033 -0.208** -0.112 -0.092 0.149** 0.138* 0.152** Gender diversity3 -0.127** -0.083 -0.058 -0.361*** -0.245*** -0.208** 0.134* 0.115 0.133 Gender diversity4 -0.142** -0.089 -0.053 -0.359*** -0.224** -0.169* 0.101 0.072 0.100 _Cut11 (Cons) -2.942*** -2.664*** -2.624*** -3.488*** -3.120*** -3.103*** -2.662*** -2.486*** -2.434*** _Cut12 (Cons) -1.518*** -1.239*** -1.199*** -2.051*** -1.680*** -1.663*** -1.248*** -1.072*** -1.021*** σ^2 (Workplace variance) 0.455*** 0.418*** 0.413*** 0.507*** 0.484*** 0.479*** 0.380*** 0.325*** 0.318*** Log-Likelihood -13271.49 -13219.97 -13214.47 -6401.947 -6372.158 -6365.385 -6857.453 -6831.506 -6828.124 No. of employees 18064 18064 18064 9450 9450 9450 8614 8614 8614 No. of workplaces 1506 1506 1506 1409 1409 1409 1336 1336 1336
29
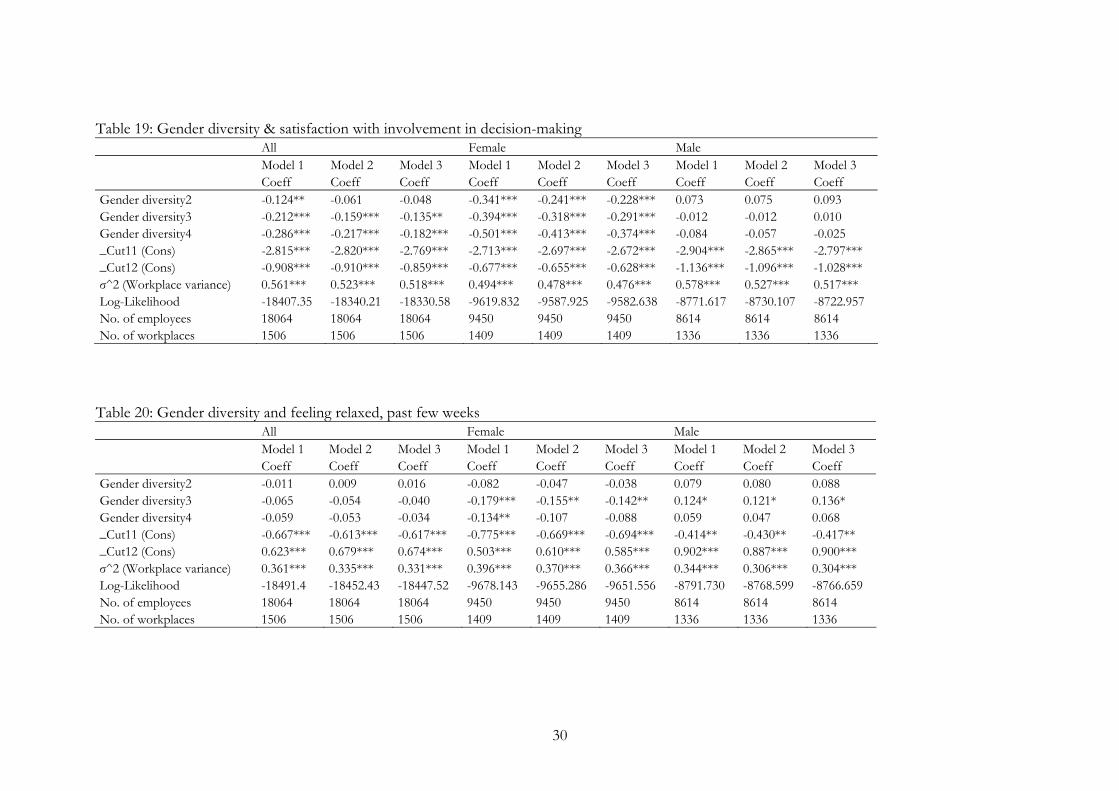
Table 19: Gender diversity & satisfaction with involvement in decision-making All Female Male Model 1 Model 2 Model 3 Model 1 Model 2 Model 3 Model 1 Model 2 Model 3 Coeff Coeff Coeff Coeff Coeff Coeff Coeff Coeff Coeff Gender diversity2 -0.124** -0.061 -0.048 -0.341*** -0.241*** -0.228*** 0.073 0.075 0.093 Gender diversity3 -0.212*** -0.159*** -0.135** -0.394*** -0.318*** -0.291*** -0.012 -0.012 0.010 Gender diversity4 -0.286*** -0.217*** -0.182*** -0.501*** -0.413*** -0.374*** -0.084 -0.057 -0.025 _Cut11 (Cons) -2.815*** -2.820*** -2.769*** -2.713*** -2.697*** -2.672*** -2.904*** -2.865*** -2.797*** _Cut12 (Cons) -0.908*** -0.910*** -0.859*** -0.677*** -0.655*** -0.628*** -1.136*** -1.096*** -1.028*** σ^2 (Workplace variance) 0.561*** 0.523*** 0.518*** 0.494*** 0.478*** 0.476*** 0.578*** 0.527*** 0.517*** Log-Likelihood -18407.35 -18340.21 -18330.58 -9619.832 -9587.925 -9582.638 -8771.617 -8730.107 -8722.957 No. of employees 18064 18064 18064 9450 9450 9450 8614 8614 8614 No. of workplaces 1506 1506 1506 1409 1409 1409 1336 1336 1336
Table 20: Gender diversity and feeling relaxed, past few weeks All Female Male Model 1 Model 2 Model 3 Model 1 Model 2 Model 3 Model 1 Model 2 Model 3 Coeff Coeff Coeff Coeff Coeff Coeff Coeff Coeff Coeff Gender diversity2 -0.011 0.009 0.016 -0.082 -0.047 -0.038 0.079 0.080 0.088 Gender diversity3 -0.065 -0.054 -0.040 -0.179*** -0.155** -0.142** 0.124* 0.121* 0.136* Gender diversity4 -0.059 -0.053 -0.034 -0.134** -0.107 -0.088 0.059 0.047 0.068 _Cut11 (Cons) -0.667*** -0.613*** -0.617*** -0.775*** -0.669*** -0.694*** -0.414** -0.430** -0.417** _Cut12 (Cons) 0.623*** 0.679*** 0.674*** 0.503*** 0.610*** 0.585*** 0.902*** 0.887*** 0.900*** σ^2 (Workplace variance) 0.361*** 0.335*** 0.331*** 0.396*** 0.370*** 0.366*** 0.344*** 0.306*** 0.304*** Log-Likelihood -18491.4 -18452.43 -18447.52 -9678.143 -9655.286 -9651.556 -8791.730 -8768.599 -8766.659 No. of employees 18064 18064 18064 9450 9450 9450 8614 8614 8614 No. of workplaces 1506 1506 1506 1409 1409 1409 1336 1336 1336
30
31
Table 21: Gender diversity and feeling content, past few weeks All Female Male Model 1 Model 2 Model 3 Model 1 Model 2 Model 3 Model 1 Model 2 Model 3 Coeff Coeff Coeff Coeff Coeff Coeff Coeff Coeff Coeff Gender diversity2 -0.066 -0.035 -0.026 -0.222*** -0.171*** -0.157** 0.116* 0.114* 0.121* Gender diversity3 -0.104** -0.082 -0.067 -0.261*** -0.218*** -0.196*** 0.135* 0.121* 0.129* Gender diversity4 -0.159*** -0.140*** -0.118** -0.286*** -0.248*** -0.217*** 0.034 0.018 0.030 _Cut11 (Cons) -1.408*** -1.243*** -1.230*** -1.354*** -1.157*** -1.173*** -1.453*** -1.305*** -1.278*** _Cut12 (Cons) -0.067 0.100 0.112 -0.042 0.156 0.141 -0.076 0.074 0.101 σ^2 (Workplace variance) 0.384*** 0.358*** 0.357*** 0.392*** 0.369*** 0.363*** 0.359*** 0.331*** 0.328*** Log-Likelihood -19267.56 -19220.81 -19217.22 -9994.130 -9968.650 -9962.492 -9259.529 -9233.498 -9232.134 No. of employees 18064 18064 18064 9450 9450 9450 8614 8614 8614 No. of workplaces 1506 1506 1506 1409 1409 1409 1336 1336 1336
References
Abowd, J., Kramarz, F. and Margolis, D.(1999) High wage workers and high wage firms, Econometrica, 67 (2), 251-333.
Aigner, D. and Cain, G. (1977) Statistical Theories of Discrimination in Labour Markets, Industrial and Labour Relations Review, 30 (2), 175-187.
Akerlof, G. A. and Kranton, R. E. (2000) Economics and Identity, The Quarterly Journal of Economics, 115 (3), 715-753.
Akrelof, GA, Rose, AK and Yellen JL (1988), Job Switching and job satisfaction in the US labour market. Brooking Papers on Economic Activity, 2, 495-582.
Alesina, A. and La Ferrara, E. (2000), Participation in Heterogeneous Communities. Quarterly Journal of Economics, 115(3), 847–904.
Alesina, A. and La Ferrara, E. (2005) Ethnic Diversity and Economic Performance, Journal of Economic Literature, 43, 762-800
Arrow, K. (1972) Models of Job Discrimination. In Pascal, A (ed.) Racial Discrimination in Economic Life, Lexington, Massachusetts: D. C. Heath and Co.
Arrow, K. (1973) The theory of Discrimination. In Ashenfelter & Rees (eds.) Discrimination in Labor Markets, Princeton: Princeton University Press.
Becker, G. (1971) The Economics of Discrimination, University of Chicago Press. Berthoud R and Blekesaune M (2007) Persistent employment disadvantage, Department
for Work and Pensions Research Report No. 416. Blau, F. and DeVaro, J. (2007) New evidence on gender differences in promotion rates:
an empirical analysis of a sample of new hires, Industrial Relations, 46 (3), 511-550.
Crouchley, R. (1995) A Random-Effects Model for Ordered Categorical Data, Journal of the American Statistical Association, 90 (430), 489-498.
Daniels, K (2000), Measures of five aspects of affective well-being at work, Human Relations, 53 (2), 275 – 294.
Ferrer-i-Carbonell, A. and Frijters, P., (2004) How important is methodology for the estimates of the determinants of happiness, The Economic Journal, 114, 641-659.
Fields, D. L. and Blum, T. C. (1997) Employee satisfaction in work groups with different gender composition. Journal of Organizational Behavior, 18, 181-196
Giuliano, L., Leonard, J. and Levine, D. (2006) Do race, gender and age differences affect manager-employee relations? An analysis of quits, dismissals and promotions at a large retail firm, Institute for Research on Labor and Employment.
Hedeker, D. and Gibbons, R. (1994) A Random-Effects Ordinal Regression Model for Multilevel Analysis, Biometrics, 50, 933-944.
Jackson, S.E., Joshi, A., and Erhardt, N.L. (2003) Recent research on team and organizational diversity: SWOT analysis and implications, Journal of Management, 29(6), 801-830.
Jones, M. K., Latreille, P. L. and Sloane, P. J. (2003) Disability, Gender and the Labour Market, IZA Discussion Paper No. 936.
Kersley, B., Alpin, C., Forth, J., Bryson, A., Bewley, H., Dix, G. and Oxenbridge, S. (2006). Inside the Workplace: Findings from the 2004 Workplace Employment Relations Survey, Routledge, London.
Knippenberg, D. and Schippers, M. (2007), Work Group Diversity, Annual Review of Psychology, 58: 515 – 541.
Kochan T, Bezrukova K, Ely R, Jackson S, Joshi A, Jehn K, Leonard J, Levine D and Thomas D (2003) The Effects of Diversity on Business Performance: Report of the Diversity Research Work. Human Resource Management, 42 (1), 3-21.
Kurtulus, F. (2008) The Effect of heterogeneity on the performance of employees and organizational divisions of the firm, Department of Economics, University of Massachusetts Amherst.
Lang, K. (1986) A Language Theory of Discrimination, The Quarterly Journal of Economics, May 1986, 101 (2), 363-382.
Lazear, E. (1999) Globalisation and the market for team-mates, The Economic Journal, 109, C15-C40.
Leonard, J.S. and Levine, D.I. (2006), The Effect of Diversity on Turnover: A Large Case Study. Industrial & Labor Relations Review, 59 (4), 547-572.
Madden, D. (2004) Labour market discrimination on the basis of health: an application to UK data, Applied Economics, 36, 421-442.
Maume, D. J. and Sebastian, R. (2007) Racial Composition of Workgroups and Job Satisfaction among Whites, The ANNALS of the American Academy of Political and Social Sciences, 609, 85-103.
Office for National Statistics (2006) Projections of the UK Labour Force 2006 – 2020. Peccei, R. and Lee, H. (2005) The Impact of Gender Similarity on Employee Satisfaction
at Work: A Review and Re-evaluation. Journal of Management Studies, 42(8)1571–1592.
Phelps, E. S. (1972), The statistical theory of racism and sexism, American Economic Review, 62, 659-661.
Pudney, S. and Shields, M. (2000a) Gender, race, pay and promotion in the British nursing profession: estimation of a generalised ordered probit model, Journal of Applied Econometrics, 15, 367-399.
Pudney, S. and Shields, M. (2000b) Gender and racial differentials in pay and promotion for NHS nurses. Oxford Bulletin of Economics and Statistics, 62, 01-833.
Rabe-Hesketh, S. and Skrondal, A. (2008) Multilevel and Longitudinal Modelling Using Stata. StataCorp LP, College Station, Texas.
Ragan, J. F. and Tremblay, C. H. (1988) Testing for Employee Discrimination by Race and Sex. The Journal of Human Resources, 23 (1), 123-137.
Rode, J. (2004) Job Satisfaction and life satisfaction revisited: a longitudinal test of an integrated model. Human Relations, 57 (9), 1205 – 1230.
Rose, M. (2005) Job Satisfaction in Britain: Coping with Complexity. British Journal of Industrial Relations, 43 (3), 55–467.
Snijders, T. and Bosker, R. (2004) Multilevel Analysis: An introduction to basic and advanced multilevel modelling, Sage Publications Ltd, London
Tannen, Deborah. 1990. You just don’t understand: Women and men in conversation. New York: William Morrow
Warr, P. (1994), Conceptual framework for the study of work and mental health, Work and Stress, 8, 84 – 97.
Warr, P. (1999), Well-being and the Workplace, in Kahneman, D., Diener, E. and Schwarz, N. (eds.), Well-being: the foundations of hedonic psychology, Russell Sage Foundation, New York.
Wharton, A. and Baron, J. (1987) So happy together? The impact of gender segregation on men at work, American Sociological Review, 52, 574-587.
Wooldridge, J. M. (2002) Econometric Analysis of Cross Section and Panel Data, Massachusetts Institute of Technology.
Wright, R. E. and Ermisch, J. F. (1991) Gender Discrimination in the British Labour Market: A Reassessment. The Economic Journal, 101, 508-522.
33
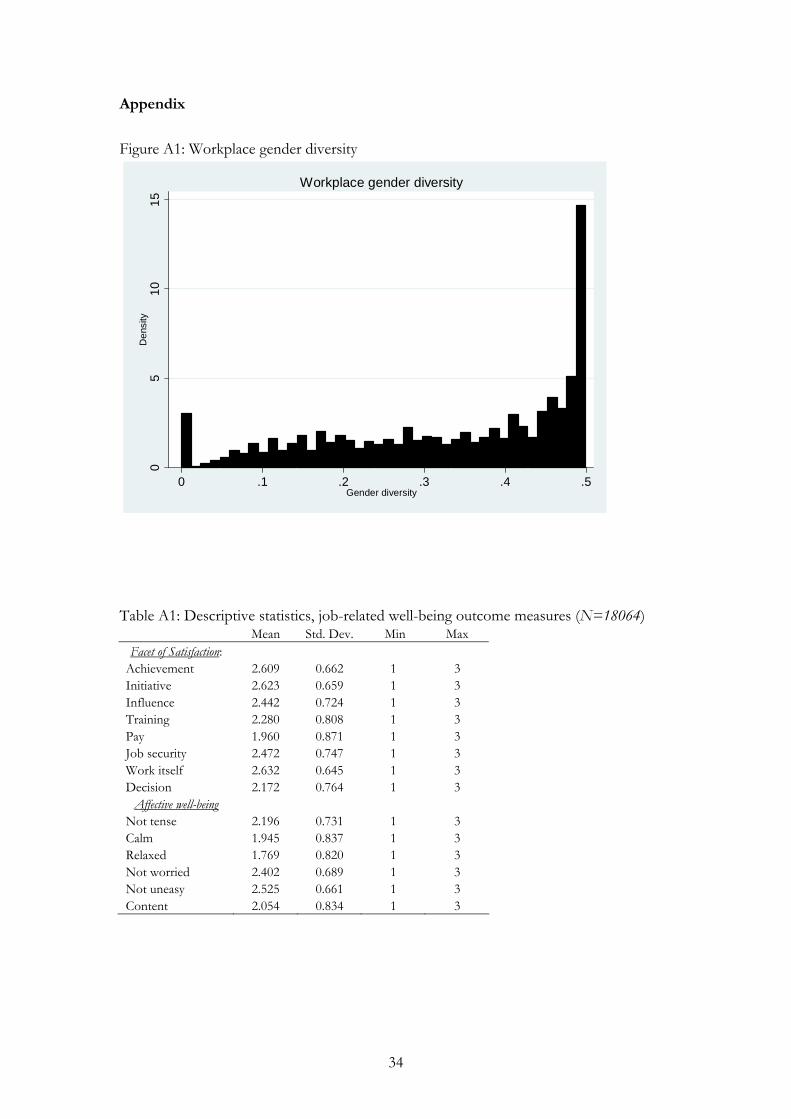
Appendix
Figure A1: Workplace gender diversity
05
1015
Den
sity
0 .1 .2 .3 .4 .5Gender diversity
Workplace gender diversity
Table A1: Descriptive statistics, job-related well-being outcome measures (N=18064)
Mean Std. Dev. Min Max Facet of Satisfaction:
Achievement 2.609 0.662 1 3 Initiative 2.623 0.659 1 3 Influence 2.442 0.724 1 3 Training 2.280 0.808 1 3 Pay 1.960 0.871 1 3 Job security 2.472 0.747 1 3 Work itself 2.632 0.645 1 3 Decision 2.172 0.764 1 3
Affective well-being
Not tense 2.196 0.731 1 3 Calm 1.945 0.837 1 3 Relaxed 1.769 0.820 1 3 Not worried 2.402 0.689 1 3 Not uneasy 2.525 0.661 1 3 Content 2.054 0.834 1 3
34
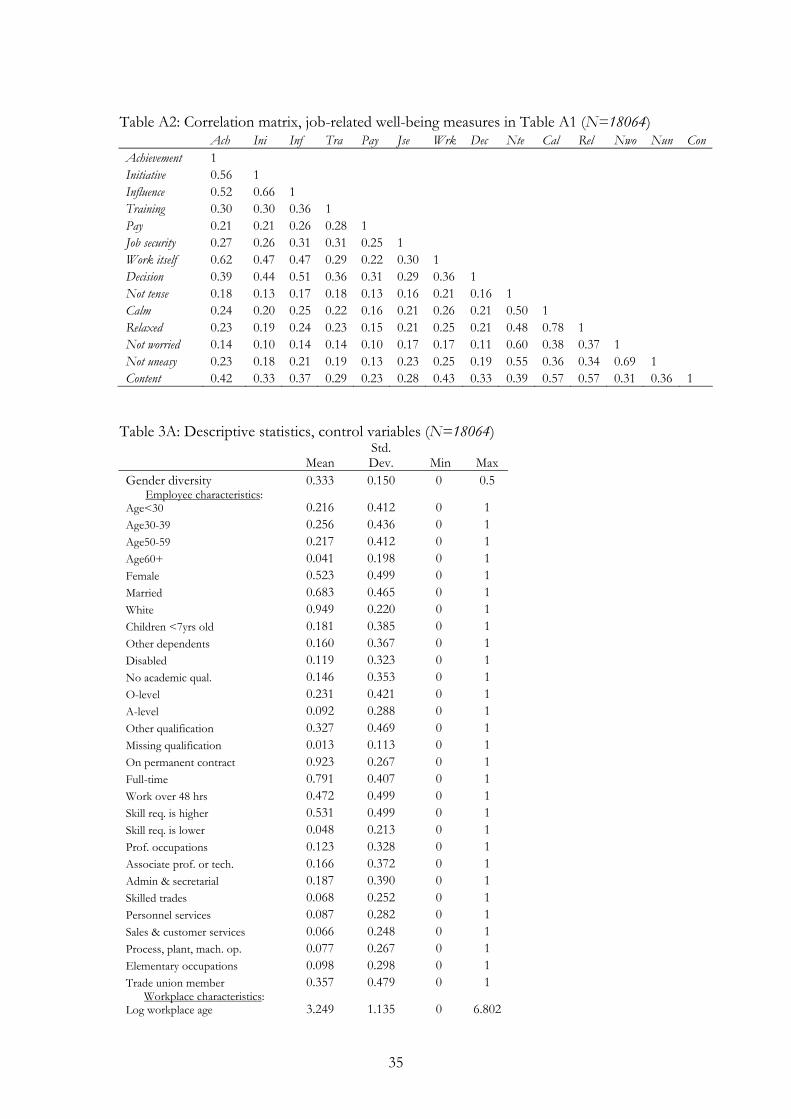
Table A2: Correlation matrix, job-related well-being measures in Table A1 (N=18064) Ach Ini Inf Tra Pay Jse Wrk Dec Nte Cal Rel Nwo Nun ConAchievement 1 Initiative 0.56 1 Influence 0.52 0.66 1 Training 0.30 0.30 0.36 1 Pay 0.21 0.21 0.26 0.28 1 Job security 0.27 0.26 0.31 0.31 0.25 1 Work itself 0.62 0.47 0.47 0.29 0.22 0.30 1 Decision 0.39 0.44 0.51 0.36 0.31 0.29 0.36 1 Not tense 0.18 0.13 0.17 0.18 0.13 0.16 0.21 0.16 1 Calm 0.24 0.20 0.25 0.22 0.16 0.21 0.26 0.21 0.50 1 Relaxed 0.23 0.19 0.24 0.23 0.15 0.21 0.25 0.21 0.48 0.78 1 Not worried 0.14 0.10 0.14 0.14 0.10 0.17 0.17 0.11 0.60 0.38 0.37 1 Not uneasy 0.23 0.18 0.21 0.19 0.13 0.23 0.25 0.19 0.55 0.36 0.34 0.69 1 Content 0.42 0.33 0.37 0.29 0.23 0.28 0.43 0.33 0.39 0.57 0.57 0.31 0.36 1
Table 3A: Descriptive statistics, control variables (N=18064)
Mean Std. Dev. Min Max
Gender diversity 0.333 0.150 0 0.5 Employee characteristics:
Age<30 0.216 0.412 0 1 Age30-39 0.256 0.436 0 1 Age50-59 0.217 0.412 0 1 Age60+ 0.041 0.198 0 1 Female 0.523 0.499 0 1 Married 0.683 0.465 0 1 White 0.949 0.220 0 1 Children <7yrs old 0.181 0.385 0 1 Other dependents 0.160 0.367 0 1 Disabled 0.119 0.323 0 1 No academic qual. 0.146 0.353 0 1 O-level 0.231 0.421 0 1 A-level 0.092 0.288 0 1 Other qualification 0.327 0.469 0 1 Missing qualification 0.013 0.113 0 1 On permanent contract 0.923 0.267 0 1 Full-time 0.791 0.407 0 1 Work over 48 hrs 0.472 0.499 0 1 Skill req. is higher 0.531 0.499 0 1 Skill req. is lower 0.048 0.213 0 1 Prof. occupations 0.123 0.328 0 1 Associate prof. or tech. 0.166 0.372 0 1 Admin & secretarial 0.187 0.390 0 1 Skilled trades 0.068 0.252 0 1 Personnel services 0.087 0.282 0 1 Sales & customer services 0.066 0.248 0 1 Process, plant, mach. op. 0.077 0.267 0 1 Elementary occupations 0.098 0.298 0 1 Trade union member 0.357 0.479 0 1
Workplace characteristics: Log workplace age 3.249 1.135 0 6.802
35

36
Private establishment 0.698 0.459 0 1 Sole establishment 0.209 0.407 0 1 No. of employees 378.684 791.369 5 7740Manufacturing 0.157 0.364 0 1 Construction 0.051 0.221 0 1 Whole sale & retail Trade 0.093 0.290 0 1 Hotel, rest & transport 0.092 0.289 0 1 Public & comm. services 0.158 0.364 0 1 Education 0.120 0.325 0 1 Health 0.151 0.358 0 1 Prop. (22+) on min. wage 0.014 0.083 0 1 Prop. in customer service 0.107 0.234 0 1 Urban area 0.823 0.382 0 1 Unemployment to vacancy ratio 3.393 2.401 0 10 Hpws (equality) 0.133 0.923 -2.498 1.191Hpws (training) 0.067 0.984 -1.599 2.462Hpws (flexibility) 0.037 0.982 -2.352 2.276
Table A4: KMO and Bartlett's Test
Kaiser-Meyer-Olkin Measure of Sampling Adequacy. .910
Approx. Chi-Square 32488.533df 276
Bartlett's Test of Sphericity
Sig. .000
Table A5: Rotated Component Matrix(a) Workplace policy and practice variables: Components
1 2 3 Equality variables: 1. Explicit mention of racial equality .938 2. Explicit mention of gender equality .938 3. Explicit mention of disability equality .928 4. Explicit mention of belief/religion equality .914 5. Explicit mention of sexual equality .827 6. Explicit mention of age equality .784 7. Explicit mention of marital-status equality .766 8. Whether workplace has formal EO/Diversity policy .757 Training variables: 1. Training covered team working .755 2. Training covered communication .750 3. Training covered leadership skills .672 4. Training covered problem solving methods .640 5. Training covered reliability & working to deadlines .577 6. Training covered customer service/liaison .539 7. Training covered computer training .523 8. Training covered quality control procedures Flexible work arrangement variables: 1. Employee has the ability to change shift patterns .703 2. Employee able to increase work hours .697 3. Employee can work night shift .655 4. Employee able to reduce work hours .642 5. Employee can work compressed hours .588 6. Workplace has schemes for working from home
Extraction Method: Principal Component Analysis. Rotation Method: Varimax with Kaiser Normalization. a Rotation converged in 5 iterations.