New Budget: An Attempt to Deal With Debt-Forgiveness for Students

1
Unfair deal: The effects of the 2015 summer budget on students: Full report
John Thompson
September, 2015
Disclaimer: All opinions herein are those of the author and do not necessarily
represent the views of the Sutton Trust
2
Abbreviations
BIS Department for Business, Innovation & Skills
HEFCE Higher Education Funding Council for England
HEIPR Higher Education Initial Participation Rate
HESA Higher Education Statistics Agency
HMT Her Majesty’s Treasury
IFS Institute for Fiscal Studies
OBR Office for Budget Responsibility
OECD Organisation for Economic Cooperation and Development
OFFA Office for Fair Access
RAB Resource Accounting and Budgeting
THE Times Higher Education
UUK Universities UK

3
The 2015 Summer Budget higher education fix - its impact on social mobility
Introduction
The changes to higher education introduced in 2012 promised much. They would
ensure universities had adequate resources while making savings in public
expenditure. There would be no up-front costs for students from low income
backgrounds, and their money to spend while at university would be increased
through a combination of bursaries, grants and loans. Though debts would be
greater, the repayment terms ensured that former students on lower incomes would
have lower repayment rates than under the previous arrangements.
These features were achieved through increased student debts and very long
repayment periods, resulting in great uncertainty as to how much would actually be
repaid. Critics of the scheme argued that the estimates of future earnings were
optimistic, and that the fee levels, and hence loan levels, would be higher than had
been assumed, which together meant that the costs to government would be higher
than anticipated. Eventually official unit cost estimates increased. In addition,
government is removing controls on student numbers, and has given private
providers more opportunities to recruit students with government subsidised loans,
both of which will increase uncertainty and total costs.
Further, government now emphasises the impact of policies on the national debt
(Public Sector Net Debt) in the relatively short to medium term, rather than the costs
to government after taking into account expected repayments over future decades.
This is the background which has led to the changes set out in the 2015 Summer
Budget. Two of those changes, the scrapping of maintenance grants and the
proposed changes to the terms for student loans, have a particular relevance to
social mobility and will be discussed in some detail, but first the other changes
announced in the Summer Budget are described as they need to be understood as
part of the total higher education package.
Selling income contingent student loans
‘Pre-Browne’ income contingent student loans, that is loans taken out by students
starting between 1998 and 2011, are to be sold off in tranches starting in the current
financial year (2015-16) through to 2020 (HMT, 2015, page 29, paragraph 1.101).
This follows previous announcements and confirms government’s preference for
early contributions to reducing the national debt, even if this means increased net
costs in the longer term (McGettigan, 2015a).
So far it has seemed unlikely that sales of the loans provided to students starting
from 2012 and later could meet the tests for value for money. However, if the sales of
pre-2012 loans become an established national debt reduction stream, then this
would provide an incentive to find ways of selling the loans to students starting from
2012, which in turn would provide an incentive to change the loan terms and

4
conditions. It is the present loan terms that make these unattractive to potential
purchasers.
Increasing the maximum tuition fees
From 2017 institutions will be allowed to increase tuition fees above £9000 in line
with inflation (HMT, 2015, page 59, paragraph 1.266), subject to showing they offer
high-quality teaching2. This is unlikely to provide a long term fix. Salaries make up a
large part of universities’ costs, which probably explains why OBR increase fees by
average earnings rather than inflation for their long term projections (OBR, 2015,
page 56, table 3.1). And UUK have argued that even universities’ non-pay costs
have increased faster than inflation (UUK, 2015a, page 43).
It is likely that student loans for fees will increase in line with inflation from 2017, and,
if fees are going to be the main source of universities income for tuition, loans will
have to increase by more than this in the long term.
Reviewing the discount rate
The discount rate1 which is used to calculate the current value of future student loan
repayments is to be reviewed. Whatever the outcome of this review, it will not change
the amount or timing of the repayments, and will therefore have no impact on the
national debt. If the rate were decreased there would be a cosmetic decrease in the
budget deficit, but this would not, of itself, lead to an increase in the resources
available (see McGettigan, 2015b).
Maintenance grants
Means tested maintenance grants, made to students from the lowest income
backgrounds, are to be replaced by an increase in the means tested loans, which
will add up to an increase of £550 pa income at university for those students who
meet the criteria (IFS, 2015). This proposal is due to be introduced in 2016-17, and is
not subject to consultation. The Chancellor, George Osborne, argues that there is a
‘basic unfairness’ in ‘asking taxpayers to fund the grants of people who are likely to
earn a lot more than them’2.
Grants were introduced in the belief that students from low income households were
more likely to be discouraged by high levels of debt. In answer to this point, the
following claim was made in the Summer Budget Report:
1 The discount rate used currently is composed of the RPI and 2.2 per cent. If the RPI
were 3.0 per cent a £100 repayment in 30 years time would be currently valued at 100/(1.030x1.022)
30= £21.45.
2 www.gov.uk/government/speeches/chancellor-george-osbornes-summer-budget-2015-speech

5
‘There is evidence that students are more concerned about the level of support
they receive while studying than the long-term repayment of their income
contingent loans.’ (HMT, 2015, page 59, paragraph1.264).
The UUK Student Funding Panel report is cited as the source. In fact the conclusion
from this report was somewhat more nuanced:
‘current students are more worried about the level of maintenance costs than
about long-term debt from student loans, and would like options for increasing
funding to meet living costs to be explored. However, this finding needs to be
treated with some caution, given the tendency for individuals to give greater
weight to losses (and gains) in the present than the future. It is unclear whether
current students would be more concerned with loan repayments if they were
asked the same question in 10 years’ time, and what impact increased levels of
overall debt may have on graduate behaviour in the future.’ (UUK, 2015a, page
18)
The point about the longer term effects of policies is well made. However, even this
conditional conclusion is somewhat misleading about students’ concerns. Two
questions from the Panel’s survey of current home undergraduates show the extent
of concerns about support at university and the repayment of student loans. The
responses are shown in table 1.
Table 1: Concerns about living costs and student loan repayments
Unconcerned Concerned
How concerned are you about meeting the costs
of living during your course?
20.6% 79.4%
How concerned are you about your ability to repay
your student loan after your course?
37.3% 62.6%
Notes: From figures 17 and 21 of UUK (2015b). Four responses (Very
concerned, quite concerned, quite unconcerned and very unconcerned)
collapsed to two responses. Concern about loans is the average for first, second
and third year students.
While concerns about living costs are more prevalent, most students are concerned
about repaying student loans. Note that these figures refer to all students, not just
those in receipt of maintenance grants. A recent survey of 16 to 18 year-olds also
showed that the majority of these students (58%) are either fairly concerned or very
concerned about repaying student loans after they finish studying (ComRes, 2015).3
The evidence from the UUK survey also shows that while students’ understanding of
many features of the loan scheme is weak, most do understand the significance of
3 ComRes interviewed 1,017 young adults in the UK aged 16-18 online between May 25
and June 5, 2015. Data were weighted to be representative of all young adults by age, sex and region. Full data tables can be found at: http://comres.co.uk/.

6
the income threshold for repayments, below which repayments need not be made.
We cannot assume that students’ concerns about repaying student loans would be
the same, were the terms of those loans to change, especially if this led them to
expect further changes before they had fully repaid or had their debt written off.
Arguments have been made both for and against scrapping grants, but we would
expect that even those who are quite sanguine about this change would be less
sanguine if government had announced that students who started in 2012 will have
their grants nullified and the total received added to their student loan debt. Yet one
of the measures that government is proposing is not very different from this.
Changing the terms of student loans
Scrapping maintenance grants has received much attention, but, though it would
result in very high headline debts, in excess of £50,000, the impact on students and
government finances without other changes is not as great as might be expected. It
has been estimated that with the current repayment criteria, 65 per cent of those
eligible for a full maintenance grant would have no increase in repayments with the
change from grants to loans, and the overall long-run costs to government would be
reduced by just three per cent, while an increase in the up-front student support
would lead to a short term increase in government debt by £340 million per annum
(IFS, 2015). The proposal to scrap grants can only be understood in the context of
proposals to change the terms of student loans.
Reassurance from government - Extracts from ‘Student finance myth buster’
“Q - I’m worried that I’m going to be saddled with a lifetime of debt as a result of the
changes
A – A graduate earning £25,000 per year would repay their loan at a rate of £6.92 per week. If
earnings fall, then the repayments will fall as well. Graduates won’t have to pay back anything
until they are earning more than £21,000 a year.
The £21,000 earning threshold will be uprated annually in line with earnings from April 2016.
Any outstanding payments will be written off after 30 years. If you are in lower paid work or
unpaid work (which may include time bringing up a family) you won’t be asked to make a
contribution.”
“Q - Paying back higher fees means I’ll never get a footing on the property ladder
A - The Council for Mortgage Lenders advise that a student loan is very unlikely to affect your
ability to get a mortgage. Mortgage lenders usually take account of your monthly net income.
Under the new scheme, graduates will have a higher monthly income because the increase in
the repayment threshold means that they will be making lower monthly repayments on their
student loans.”

7
The loan repayment conditions for entrants since 2012 include an income
threshold, set at £21,000, to be uprated annually in line with average earnings. It
was this feature that enabled government to reassure potential students and to
explain why they should not worry about their headline debt total. The ‘Student
finance myth buster’4 is a good example of this advice.
In order to reduce the cost to government of the loan, and to speed the rate of
repayments, subject to consultation, government is proposing to freeze the threshold
at £21,000 for five years, rather than maintaining its value relative to average
earnings as promised. There are two options (BIS, 2015b):
Option 1, government’s preferred option, is to freeze the threshold at £21,000
for five years from 2016. This change would apply to all students starting from
2012 onwards;
Option 2 is to uprate the threshold by average earnings until 2020, after which
it will be frozen for five years. This change would only apply to students
starting from 2016 onwards.
There are no definite proposals for the end of the five year freeze. For both options
the threshold will then be reviewed. The repayment terms also include a maximum
interest threshold5, set at £41,000 pa in 2016, currently to also be uprated by
average earnings. When asked, BIS have refused to clarify whether it is planned to
freeze this threshold as well, or even what assumption was made in producing the
illustrative statistics presented in the consultation6.
The justification7 for freezing the repayment threshold is that,
‘the proportion of borrowers liable to repay when the £21,000 threshold takes
effect in April 2016 is lower than was expected when the policy was initially
introduced’, (BIS, 2015, page 3, paragraph 3.)
However, the loan terms announced in 2010 which reassured potential students and
led to Parliament giving its approval8, were firm proposals, not an indication of what
they had in mind, or contingent on the accuracy of OBR’s projections.
4 http://webarchive.nationalarchives.gov.uk/+/http://www.bis.gov.uk/policies/higher-education/students/student-finance/myth-buster
5 The interest rate increases linearly from (RPI+0) per cent at £21,000 pa (in 2016) to
(RPI+3) per cent at £41,000 pa (in 2016). 6 The refusal to clarify this and other assumptions that must have been made in
preparing the consultation statistics was justified by arguing that it ‘would be inequitable to share further information with some respondents and not all.’ A FOI request has been submitted. 7 The low growth in earnings is not the only reason for the increase in costs from what
government had expected. For example, it was thought that the £9,000 fee would only be charged in ‘exceptional circumstances’.

8
Freezing the threshold may seem like a minor technical adjustment, and that may be
why it has received much less attention than the scrapping of grants, but it would
lead to significant increases in the repayments borrowers would have to make.
Table 2 shows the extra repayments expected from introducing a five year freeze of
the repayment threshold at £21,000 from 2016, with the maximum interest threshold
(£41,000 in 2016) continuing to be uprated by average earnings. It is also assumed
that after five years the annual uprating of the repayment threshold by average
earnings is resumed.
Table 2 – Average repayments for students starting in 2014 with and without five
year payment threshold freeze (£, 2016 prices)
2018-27 2028-37 2038-47 2018-47
No freeze of repayment
threshold
Men 10,300 15,500 9,100 34,900
Women 6,700 10,400 9,300 26,400
All 8,300 12,700 9,200 30,200
Five year freeze of
repayment threshold
Men 11,800 16,500 8,800 37,100
Women 8,100 12,000 9,600 29,700
All 9,800 14,100 9,300 33,100
Extra repayments from five
year repayment threshold
freeze
Men 1,500 1,000 -200 2,300
Women 1,400 1,600 300 3,300
All 1,400 1,300 100 2,800
Notes: 2014 starters for 3 year course with loans of £12,000 per year. All values
shown to nearest £100. Calculated using the simplified student loan repayment
model (BIS, 2015a), with default parameters except for the ‘threshold lower’ (Sheet
RABcalc) modified for threshold freeze. The nominal repayments were taken from
sheet Database, and converted to 2016 prices with RPI.
The repayments are shown in 2016 prices, calculated using the RPI measure of
inflation. No further discounting has been used as there is no one right way of
determining the value of future pounds for different individuals. The repayments are
shown in three ten year periods, so an ‘eyeball’ discounting may be made.
8 The main features of the loan terms were presented to the House of Commons on 3
November 2010. The frequency of threshold uprating was announced later in a Ministerial Written Statement by Vince Cable on 2 December 2010.

9
The repayments relate to a borrower on a three year course with total loans of
£36,000. This is a typical set of conditions, giving an indication of the pattern of
repayments, but it does not represent all students. These students started in 2014
and they will start to repay in 2018, so that, were the five year repayment threshold to
be introduced, they would not see the full impact until their third year of repayments,
in 2020.
The increase in repayments for any individual will depend on the particular pattern of
earnings, the size of the loan, and the way future repayments are valued. In general,
we would expect those on low lifetime earnings, who repay through the whole 30
years, to see bigger increases than those who earn enough to repay their loan,
though, of course, somebody whose income was below the threshold throughout the
repayment period, even after the threshold freeze, would not be required to make
any repayments. The smaller increases, or even decreases, for those on higher
incomes are illustrated by the examples shown in the consultation (BIS, 2015b,
paragraph 42). Using more realistic data the analysis commissioned by UUK shows
similar results (UUK, 2015a).
The results shown in table 2 are consistent with this tendency for those on higher
incomes to see smaller increases in repayments as a result of a threshold freeze. On
average women’s earnings are lower than men’s, which results in lower average
repayments. Over the first ten years, while their proportional increase in extra
payments is greater than for men, in absolute terms it is slightly smaller. However,
thereafter, and overall, women’s repayment increases are greater.
Apart from the case of men in the final ten years, the increases in repayments can be
seen well beyond 2020, the last year of the threshold freeze. This is because the
threshold values after 2020 are still lower than they would have been, even though
under this option the annual uprating by average earnings has been reintroduced. It
is possible that the review could restore the threshold to what it would have been
without the freeze, but that seems most unlikely.
10
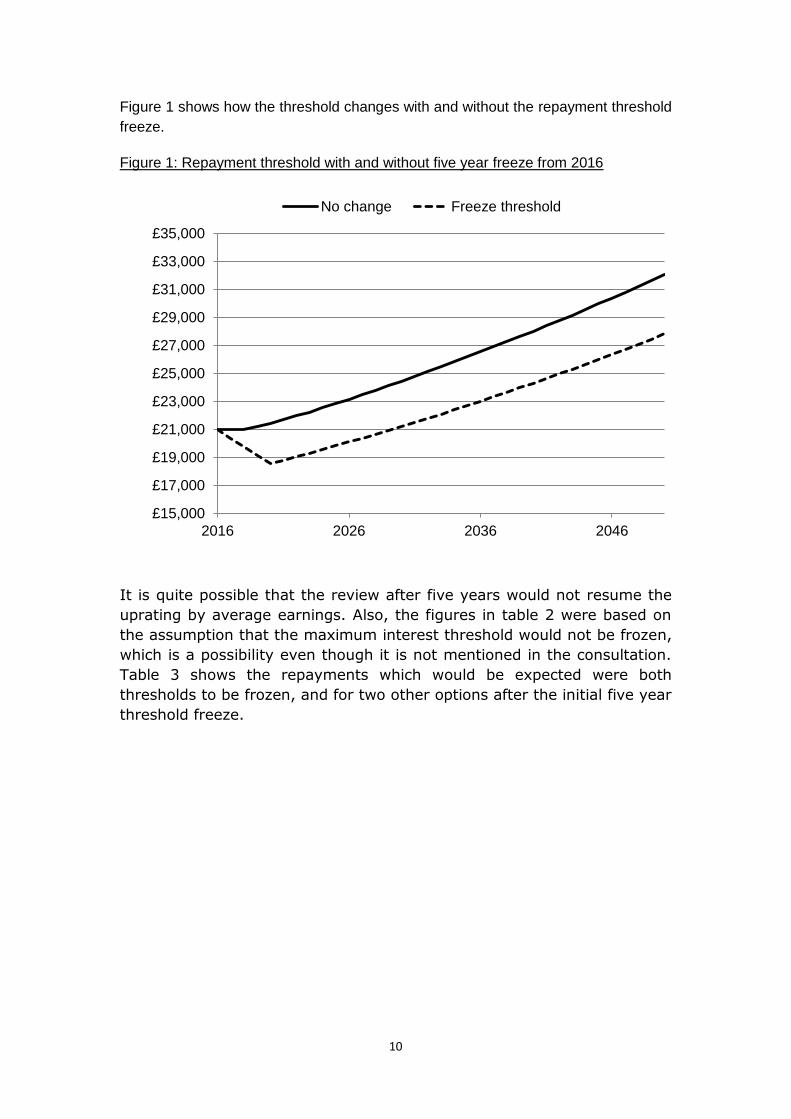
Figure 1 shows how the threshold changes with and without the repayment threshold
freeze.
Figure 1: Repayment threshold with and without five year freeze from 2016
It is quite possible that the review after five years would not resume the
uprating by average earnings. Also, the figures in table 2 were based on
the assumption that the maximum interest threshold would not be frozen,
which is a possibility even though it is not mentioned in the consultation.
Table 3 shows the repayments which would be expected were both
thresholds to be frozen, and for two other options after the initial five year
threshold freeze.
£15,000
£17,000
£19,000
£21,000
£23,000
£25,000
£27,000
£29,000
£31,000
£33,000
£35,000
2016 2026 2036 2046
No change Freeze threshold
11
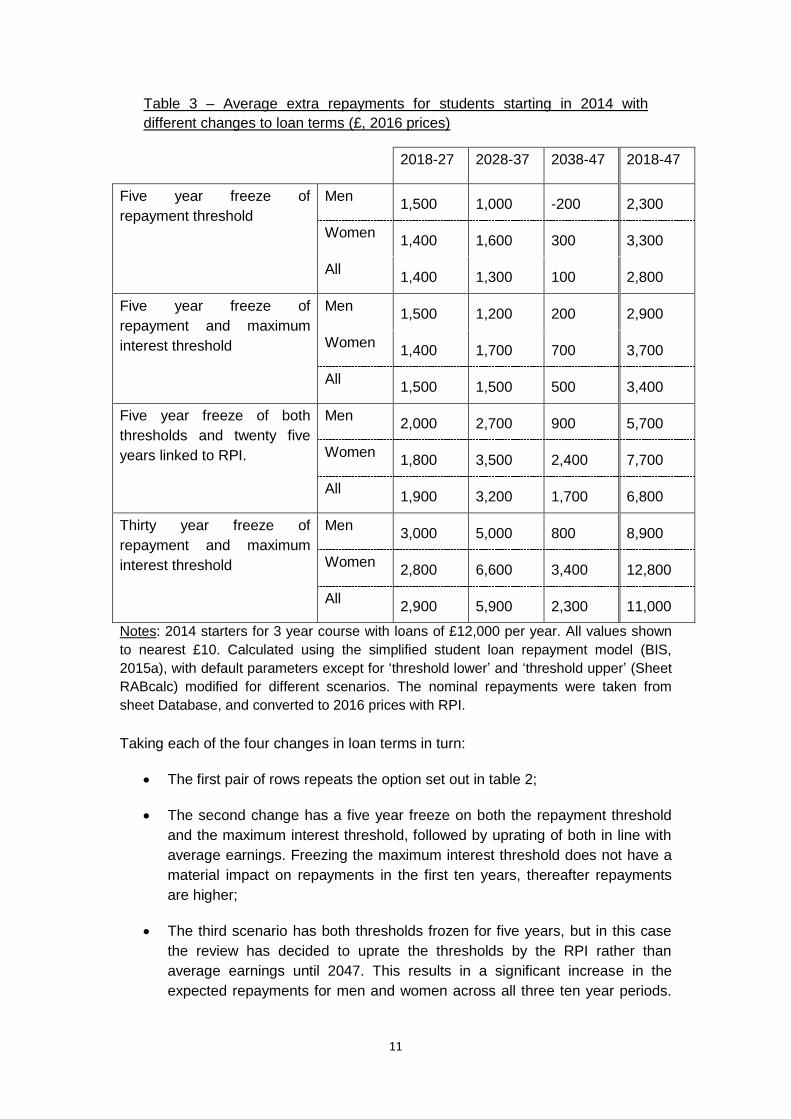
Table 3 – Average extra repayments for students starting in 2014 with
different changes to loan terms (£, 2016 prices)
2018-27 2028-37 2038-47 2018-47
Five year freeze of
repayment threshold
Men 1,500 1,000 -200 2,300
Women 1,400 1,600 300 3,300
All 1,400 1,300 100 2,800
Five year freeze of
repayment and maximum
interest threshold
Men 1,500 1,200 200 2,900
Women 1,400 1,700 700 3,700
All 1,500 1,500 500 3,400
Five year freeze of both
thresholds and twenty five
years linked to RPI.
Men 2,000 2,700 900 5,700
Women 1,800 3,500 2,400 7,700
All 1,900 3,200 1,700 6,800
Thirty year freeze of
repayment and maximum
interest threshold
Men 3,000 5,000 800 8,900
Women 2,800 6,600 3,400 12,800
All 2,900 5,900 2,300 11,000
Notes: 2014 starters for 3 year course with loans of £12,000 per year. All values shown
to nearest £10. Calculated using the simplified student loan repayment model (BIS,
2015a), with default parameters except for ‘threshold lower’ and ‘threshold upper’ (Sheet
RABcalc) modified for different scenarios. The nominal repayments were taken from
sheet Database, and converted to 2016 prices with RPI.
Taking each of the four changes in loan terms in turn:
The first pair of rows repeats the option set out in table 2;
The second change has a five year freeze on both the repayment threshold
and the maximum interest threshold, followed by uprating of both in line with
average earnings. Freezing the maximum interest threshold does not have a
material impact on repayments in the first ten years, thereafter repayments
are higher;
The third scenario has both thresholds frozen for five years, but in this case
the review has decided to uprate the thresholds by the RPI rather than
average earnings until 2047. This results in a significant increase in the
expected repayments for men and women across all three ten year periods.

12
This shows how significant the review might be, and how concerning it is that
there is no indication of what it might recommend;
Finally, this is a more extreme review decision, where the freeze on both
thresholds continues through to 2047. Further large increases in the extra
repayments are expected.
These estimates are based on a subset of borrowers using a simplified calculation.
The earnings, and hence repayment, estimates are uncertain. Nevertheless, the
results show that far from a small technical change, the proposals represent a
significant increase on average in the cost of going to university. They also show how
uncertain these increases are, given that the terms in future are subject to review.
Loss of grant with change of loan terms
As already noted, IFS have estimated that with the current loan terms, 65 per cent of
those who were eligible for full maintenance grants would have no increase in
repayments with a change from grants to loans. The remaining 35 per cent would
contribute an average of £9,000 net present value in increased repayments, giving
an overall average of about £3,000 for all those students who would have had full
grants. With a threshold freeze this £3,000 average increases to £7,000 (McGettigan,
2015c). (NB these figures cannot be compared with those in tables 2 and 3, as they
are discounted by RPI and 2.2 per cent.)
Changing the loan terms for existing borrowers
The terms and conditions for students’ loans include the following:
‘When you take out a loan, you will sign a declaration form which will be a
contract. This states that you have read and understood the Terms and
Conditions. You must agree to repay your loan in line with the regulations that
apply at the time the repayments are due and as they are amended. The
regulations may be replaced by later regulations.’ (2012 entrant version, BIS,
2011)
Few student advisors pointed out and explained the potential consequences of this
‘get out’ clause; for example the government’s own ‘Myth Buster’ does not mention it.
Government ministers went out of their way to emphasise the ‘generous’ repayment
terms without any reference to the fact that they could be changed.
By 2012, concerns that government was under-estimating the costs of the loans
were growing, and the Business, Innovation and Skills Committee asked the then
Minister for Universities and Science, David Willetts, whether students knew what
they were signing up for far into the future. He replied that, ‘under successive
governments, in the letter that every student gets there are some words to the effect
that governments reserve the right to change the terms of the loans’. He went on to
say that there were no plans to change the terms from what had been set out.
Furthermore, while acknowledging that the cost of the loans was not known for
13
certain, he said that government’s view was that costs would be about the same as
originally estimated, and that their estimates had been checked by the OBR9.
More recently, during the 2015 election, following rumours that a retrospective
change in loan terms was being considered, David Willetts’ successor, Greg Clark,
was asked whether his party was committed to protecting borrowers’ conditions. This
was his reply10:
‘The strength of our system is that it is robustly sustainable – as the OECD has
confirmed – without any changes in terms being needed.’
Most students who had taken out these loans would not have an inkling that
government would soon be proposing to change the terms even before their
repayments had started. If changes are made retrospectively, then government,
universities, schools, journalists and other student advisors will have been
responsible for mis-selling on a huge scale; mis-selling mostly to young people aged
17 and younger. One of those advisors, Martin Lewis, founder and editor of the
Money Saving Expert web site, was recruited by David Willetts to head the
Independent Taskforce on Student Finance Information. He now feels betrayed. He
argues that a retrospective change ‘would be terrible news for confidence in higher
education’11. He has pledged to do all he can to protest against the change.
Since student loans were first introduced in 1990 this would be the first time changes
have been proposed that would disadvantage existing borrowers. The threshold for
maintenance loans taken out from 1998 was increased from £10,000 to £15,000 in
2005 and then line with inflation from 2012. But these changes merely gave
borrowers the option to make smaller repayments; systems were in place to enable
borrowers to top up these new minimum payments if that is what they preferred. No
change was imposed.
Would the proposed retrospective changes, which are clearly unfavourable to the
borrowers, be lawful? Initial advice indicates that this is uncertain, but that
retrospective changes, even with the ‘get out’ clause, could prove unlawful and the
higher repayments unenforceable if challenged. For the discussion here it will be
assumed that the ‘get out’ clause is sufficient to allow the changes to be made, and
will consider the costs and savings that would result.
9 BIS Committee, 12 June 2012, questions 27 and 28. www.publications.parliament.uk/pa/cm201213/cmselect/cmbis/uc274-i/uc27401.htm 10 THE ‘Question Time: THE election panel grill the politicians’.23 April 2014. www.timeshighereducation.co.uk/features/question-time-the-election-panel-grill-the-politicians/2019742.article?page=0%2C1 11 ‘Warning: Govt may retrospectively hike student loan costs – if it does I pledge to
organise protest’, http://blog.moneysavingexpert.com/2015/01/09/a-deliberate-threat-to-the-government-u-turn-on-the-21000-student-loan-repayment-threshold-i-will-organise-mass-protest/

14
Costs of changing the loan terms for existing borrowers
If government’s preferred retrospective option were implemented, students who took
out loans believing they knew the repayment terms would be faced with an increase
in repayments from 2017, a review of the terms for 2021, and, what else? A
precedent would have been set and future governments, facing further shortfalls, or
just taking an opportunity to increase revenue, would feel free to make any changes
they liked, and not only the threshold levels.
Just by proposing retrospective change government will have reduced trust, and if
the proposal is implemented it will be far worse. Four cohorts are affected, over a
million students. Most of them will see higher repayment rates, and their repayments
in the longer term are uncertain, and potentially much higher, depending on the
decisions of future governments. Their available income for their first mortgage could
be significantly reduced. The loss of trust is likely to be reinforced rather than
forgotten. What is the cost of this loss? Firstly, their experiences would inform the
decisions of later cohorts of prospective students, undermining their confidence in
taking out loans. But the cost is more general that this. It is difficult to attach a figure
to it, though it is widely accepted that trust in general, and trust in government in
particular, is important:
‘Trust in government represents the confidence of citizens and businesses in the
actions of government to do what is right and perceived as fair. It is one of the
most important foundations upon which the legitimacy and sustainability of
political systems are built. Trust in government is essential for social cohesion
and well-being as it affects the government's ability to govern and enables
government to act without coercion.’ (OECD, 2013)
Savings from changing the loan terms for existing borrowers
There would be a one off saving for government from freezing the threshold for all
students (option 1) compared with keeping the original terms for the four cohorts
starting from 2012 to 2015 (option 2). The consultation reports a net present value
estimate of these savings at £3.2 billion (BIS, 2015b, page 17, paragraph 56). The
increased repayments would be made over about thirty years, with the maximum for
any one year less than £200 million12.
It is hard to estimate what long term differences between the two options would be.
Under option 2, starters in 2016 would have a higher initial threshold than with option
1 in 2020, but the relative impact of a freeze over the next five years would depend
on the increase in average earnings, relative to the increase under option 1 freeze.
The figures produced by BIS suggest option 2 would produce bigger long term
12
Estimated from the chart at BIS, 2015b, page 17, paragraph 58.
15
savings than option 113. Under both options the actual savings would also depend on
what was decided at the five year review. There is nothing to stop government from
ensuring that the long term ongoing savings for option 2 are the same or higher than
they would have been for option 1.
These savings are less relevant now that government’s priority is to reduce the
national debt as a percentage of the GDP rather than reducing the budget deficit.
The debt, unlike the deficit, does not take account of future student loan repayments.
This means that option 2 ‘would not contribute to the government’s fiscal objective of
bringing down debt in this Parliament’ (BIS, 2015b, page 15, paragraph 47). The
contribution by option 1 is about £420 million or less than 0.03 per cent of the
national debt14. Is this a price worth paying for the loss of trust?
Student loan terms over the long term
Though option 2 avoids the retrospective element of option 1, both make a
fundamental change to the terms and conditions. Previously, though there was a ‘get
out clause’, it was generally assumed that the terms would not be changed over the
repayment period in a way that was unfavourable to the borrowers. Martin Lewis, one
of the few advisors to even acknowledge the possibility of such a change, thought
that, though there was no 100 per cent guarantee, it was unlikely that borrowers
would see an unfavourable change, and that it was therefore best to work on the
assumption that the loan terms in place when they took out their loans would
continue throughout their repayments15.
The new proposals completely change the rules of the game. Even with option 2,
there can be no assumption that the terms and conditions will be not be changed for
2016 and subsequent starters; the expectation must be that they will be changed.
For both options we are given no guarantee about the terms after the threshold
freeze, only that there will be a review, with no steer as to what will be the scope of
that review other than it will look at the threshold, nor what will determine its
outcome.
We can get an idea of what government thinking is on the long term arrangements by
looking at what those who were at the centre of decision making have written since
13
Option 1 is estimated to result in an additional £0.9 billion repayments per £15 billion loans, option 2 £1 billion (BIS, 2015b, page 17, paragraph 57) 14 NPV of repayments taken from the chart at (BIS, 2015b, page 17, paragraph 58). The
discounting by 2.2 per cent was reversed to give the real value of the repayments in 2016 prices. National debt taken as £1505.3 billion from www.ons.gov.uk/ons/rel/psa/public-sector-finances/index.html 15
Student Loans Mythbusting – tip 24. www.moneysavingexpert.com/students/student-loans-tuition-fees-changes

16
leaving. In January 2015, shortly after leaving his post as Director of Higher
Education, Matthew Hilton wrote that,
‘the government could reduce the RAB charge [a measure of government loan
subsidy – JT] to whatever it wanted at a stroke . . . If interest rates, repayment
levels etc. were able to flex in line with the macro-economic context, the RAB
issue would go away. But the politics doesn’t allow for that. The requirements
that matter are not those of rational economic behaviour, but of the need to
manage all the angles in a way that keeps the politics on track’ (Hilton, 2015).
Shortly before the Summer Budget policies were published, former Minister for
Universities and Science, David Willetts, wrote an article that anticipated the official
announcements in the Summer Budget. He also proposed regular five year reviews
to ‘allow adjustments to the parameters of the system in order to keep it flexible and
sustainable’ (Willetts, 2015). Everything points16 to a system where the terms are
changed at regular intervals through the repayment period, shifting the risks inherent
in the loan scheme from government to borrowers. Students would be required to
write an ‘open cheque’.
If ‘the politics’ is the only thing that prevents this vision being set out, we can expect it
to be introduced by stealth. Once varying terms were established there would be a
risk that future governments would go further, and use student loans as an easy way
to raise revenue, a government cash cow, by increasing interest rates, introducing
early payment charges, or extending the repayment period, and so on. If the terms
could be made sufficiently unfavourable to students then selling the post 2012 loan
book might become possible.
The ‘get out’ clause which allows government to change any of the student loans
terms and conditions over thirty or more years has been seen, if it has been noticed
at all, as representing no more than a theoretical risk to borrowers from previous
legislation. But now it is looking like a key component for making higher education
finances ‘sustainable’. Denning in his famous ‘red hand rule’ of contract law said,
‘the more unreasonable a clause is, the greater the notice which must be given
of it. Some clauses which I have seen would need to be printed in red ink on
the face of the document with a red hand pointing to it before the notice could
be held to be sufficient’.
Being able to change any loan conditions at any time would seem to be pretty high
on an unreasonableness scale, so what kind of a health warning would be
16
There is some indirect evidence that this is what Government is preparing for. The consultation includes a discussion of the potential increase in administrative burden arising from option 2 compared to option 1 for those employers of former students who assist with student loan repayments. If no further reviews were anticipated, the difference between three schemes (option 1) and four schemes (option 2), seems unlikely to be an issue. But frequent reviews through the repayment periods which gave students guaranteed terms could lead to many more schemes.

17
appropriate for those advising prospective students about taking out a student loan?
Something like the following:
☞
To advise students to borrow without such a warning would be misleading. Would
such a warning discourage students from taking out loans? Social Mobility
The White Paper, ‘Higher Education: Students at the Heart of the System’,
introducing the 2012 changes, identified increasing social mobility as one of the key
policy aims. The 2015 Summer Budget claims to be consistent with this aim by
providing the resources to remove the cap on student numbers, and by increasing
the money available to students from low income households while at university
through an increase in maintenance loans replacing maintenance grants. These
changes will increase the size of the debt for students from low income families from
about £40,500 to £53,000 for a three year course (IFS, 2015). In anticipation of any
concern that this might deter students it is pointed out that, despite the large increase
in debt following the fee increases in 2012:
‘Since 2010 student participation has increased and there is now a higher
proportion of students from disadvantaged backgrounds applying to and
entering higher education than ever before.’ (HMT, 2015, page 59, 1.264)
In addition, research commissioned by UUK was cited as showing that students are
more concerned about the level of support they receive while studying than the long-
term repayment of their income contingent loans. As already shown in table 1, this is
a somewhat misleading take on the research findings; a substantial majority of
students are concerned about the repayments they will have to make, even with
current terms and conditions.
Participation
When the 2012 proposals were first announced it was suggested that, because the
penalties for not going to university could be large and that the loan terms were
generous, the disincentive from the higher fees could be less than some feared. The
conclusion was that the impact of the fees would depend to a large extent on
perceptions and how the arrangements were described and ‘sold’ (Thompson et al,
2010).
It seems that the selling was successful, at least for young entrants. They were not
put off by the large headline figures of debt, and the young participation rate
‘Government may change these loan terms at any time. These
terms are based on current Government long term cost estimates
which are highly uncertain. Should these estimates prove
inaccurate, or if it be decided that the loans subsidy should be
reduced, it is likely that the terms will be changed and the
repayments due may be significantly higher than shown.’

18
continued to rise through the increase in fees. The apparent dip in young applicant
rates in 2012 was due to some students electing to apply in 2011, aged 18, rather
than 2012, aged 1917. The evidence for mature students is more complicated.
Estimating mature application and entry rates is not straightforward and it is not yet
clear to what extent full-time demand by mature students has been affected by the
increase in fees. However, entry rates for 2013-14 were still lower than in 201018.
The decline in part-time study (most part-timers are mature students) has been
spectacular, though the reasons for this are complex, with the rise in fees only being
part of the story19.
As already shown, surveys show most students (young and mature) are concerned
about their student loan debt (see table 1). What is more, when there is an
opportunity to reduce costs, without significantly compromising the expected value of
their higher education experience, many students take it. For example, of those who
ordinarily would be expected to apply aged 19 in 2012, many applied aged 18 in
2011 instead20. The Welsh Assembly has provided a series of natural experiments
with effective fee levels for study in England sometimes being higher than in Wales,
sometimes not. The application rates show that differences in costs result in
significant numbers of students who would have been expected to study in England,
studying in Wales instead21. Students’ behaviour, as well as responses to surveys,
shows that they are aware and concerned about long term costs.
It would therefore be unwise to conclude that high loans will never deter school
leavers, even though, to the extent that employers are using degrees to signal the
abilities of job applicants, the cost of not going to university could remain high. The
terms of the loan, and potential students’ perception of those terms, remain
important.
17
See Thompson et al, 2013, pages 28-35. For more recent UCAS analysis see UCAS, 2014 Using data from the BIS Higher Education Initial Participation tables (HEIPR) (BIS, 2015c) reconfigured to give entry at 19 and younger age cohort rates, there is no dip in entry rates for those who were 18 in 2012. 18
BIS supplied the data used to calculate the HEIPR (BIS, 2015c), with entrant rates counts split by mode. These data showed that the full time initial entry rates for 2013-14 were lower than in 2010-11 for those aged: 20-24, 25-39 and 40-60. See also the application rates at Thompson et al, 2013, page 38, fig 11A. 19
See Thompson et al, 2013; HEFCE, 2014b; HEFCE, 2015b, pages 8 and 9. Also HEIPR based data (see 17 above) showed part time participation rates continuing to decline in 2013-14. 20
Thompson, at el, 2013, paragraphs 74 to 79. 21
Thompson, at el, 2012, paragraphs 14 and 17

19
Where and what to study
Overall participation rates do not capture all that we should be concerned
about. There is the question of where and what students study.
Potentially, concerns about levels of debt could affect students’ choice of
course, with students from disadvantaged backgrounds most at risk. The
gap in participation rates between advantaged and disadvantaged groups
at more selective institutions is large (OFFA, 2014) and, though much
reduced when prior qualifications are taken into account, still remains22.
The more selective universities are more likely to charge the maximum
fee, so fear of debt could deter applications. Living at home can be a
positive choice, but often it is a means to reduce costs23, so reducing
choice. Disadvantaged students are more likely to live at home (HEFCE,
2009b), even after taking into account their prior qualifications and other
factors. In the decade from 1990, which saw the gradual replacement of
maintenance grants with loans, while participation increased dramatically
the proportion of young students living at home increased from 8 per cent
to over 20 per cent (HEFCE 2009b).
Such was the basis for concerns about how the 2012 changes with the big
increases students’ debt might affect students’ choice of course. In the
event the evidence suggests these changes did not have a significant
effect. UCAS looked closely at the 2012 applications and they found no
substantial move away from courses charging higher fees and no move
towards living at home. Looking specifically at applicants from
disadvantaged backgrounds, UCAS again found no move away from
courses charging higher fees24, nor did they find a move away from more
selective universities25.
22
See Chowdry et al, 2013. Also HEFCE unpublished data shows that when table 31 (HEFCE, 2015a, page 59) was restricted to institutions with high average tariff scores the participation rate differences between POLAR3 quintile 1 (disadvantaged) and POLAR3 quintile 5 (advantages) is large. For example ABB (quintile 1) 50 per cent, AAB (quintile 5) 63 per cent. 23
A survey of prospective students found that 32 per cent were going to or were thinking about living at home while at university because of the cost. The percentage was higher (43 per cent) for those whose parents were in NS-SEC lower occupations (Callender et al, 2008, page 415, table 2). 24
The range of fees was not large, from £6000, mostly charged by further education colleges, to £9000 for even the most selective universities. Also, disadvantaged students were likely to receive a more generous bursary at the high fee selective universities. 25
See UCAS, 2012. Consistent with UCAS findings unpublished results from HEFCE shows no increase in proportion of entrants living at home through to 2013-14, and OFFA (OFFA, 2014) found that entry to more selective universities by students from disadvantaged backgrounds has been maintained over the same period.
20
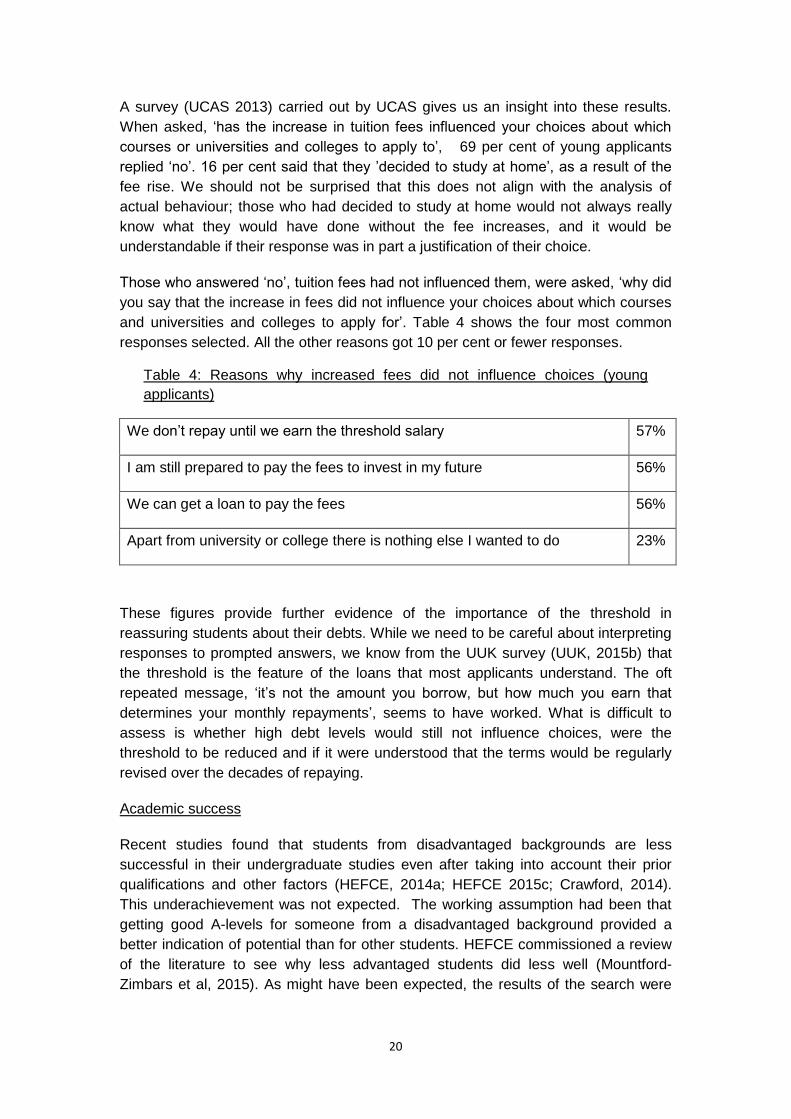
A survey (UCAS 2013) carried out by UCAS gives us an insight into these results.
When asked, ‘has the increase in tuition fees influenced your choices about which
courses or universities and colleges to apply to’, 69 per cent of young applicants
replied ‘no’. 16 per cent said that they ’decided to study at home’, as a result of the
fee rise. We should not be surprised that this does not align with the analysis of
actual behaviour; those who had decided to study at home would not always really
know what they would have done without the fee increases, and it would be
understandable if their response was in part a justification of their choice.
Those who answered ‘no’, tuition fees had not influenced them, were asked, ‘why did
you say that the increase in fees did not influence your choices about which courses
and universities and colleges to apply for’. Table 4 shows the four most common
responses selected. All the other reasons got 10 per cent or fewer responses.
Table 4: Reasons why increased fees did not influence choices (young
applicants)
We don’t repay until we earn the threshold salary 57%
I am still prepared to pay the fees to invest in my future 56%
We can get a loan to pay the fees 56%
Apart from university or college there is nothing else I wanted to do 23%
These figures provide further evidence of the importance of the threshold in
reassuring students about their debts. While we need to be careful about interpreting
responses to prompted answers, we know from the UUK survey (UUK, 2015b) that
the threshold is the feature of the loans that most applicants understand. The oft
repeated message, ‘it’s not the amount you borrow, but how much you earn that
determines your monthly repayments’, seems to have worked. What is difficult to
assess is whether high debt levels would still not influence choices, were the
threshold to be reduced and if it were understood that the terms would be regularly
revised over the decades of repaying.
Academic success
Recent studies found that students from disadvantaged backgrounds are less
successful in their undergraduate studies even after taking into account their prior
qualifications and other factors (HEFCE, 2014a; HEFCE 2015c; Crawford, 2014).
This underachievement was not expected. The working assumption had been that
getting good A-levels for someone from a disadvantaged background provided a
better indication of potential than for other students. HEFCE commissioned a review
of the literature to see why less advantaged students did less well (Mountford-
Zimbars et al, 2015). As might have been expected, the results of the search were
21
not conclusive, but there is one explanation that needs to be considered in the
context of student loan debts, that is the effect of excessive term-time working.
Like living at home, term-time working has greatly increased since the first
introduction of student loans, from very few full-time students to more than half
working during term-time ten years later. Since then the proportion working during
term-time has stabilised26. In a major study using data from seven institutions
(Callender, 2008; Van Dyke et al, 2005), it was found that,
‘Term-time working and higher education achievement (as measured by end-
of-year marks, and final degree outcomes) are negatively associated, even
after taking into account other factors’.
To give an idea of the size of the effect, if we had two students who were similar in all
respects except that one did not work during term-time whilst the other worked for 16
hours a week, if the non-working student’s chance of getting a good degree was 50
per cent, the working student’s chance would be 37.5 per cent27 . There was also a
wealth of evidence consistent with term-time working being the cause of the reduced
achievement, rather than, say, both term-time working and lower achievement being
common attributes of those students less committed to their studies. It was also
found that those from ’routine and manual households’ were more likely to work
during term-time than those from professional households.
This study looked at students who qualified in 2002, when fee levels and student
loans were a lot smaller and maintenance funds were less generous. No further
research on this scale or detail has been completed since28. The UUK study29
showed that 54.5 per cent were meeting some of their living costs by working
alongside their studies, and of those 69.2 per cent indicated that their earnings from
working were essential to meet their living costs. No doubt the small increase in
26
See Callender, 2008, page 360, and references therein. The most recent Student Income and Expenditure (2011/12) found that 52 per cent of full-time students worked during term-time. 27
In the report this illustration was presented in terms of odd ratios, with the odds of the working student getting a good degree equal to 60 per cent of the non-working student, with 95 per cent confidence interval of 40 to 90 per cent. The wide confidence interval reflects the complexity of the modelling required relative to the sample size (Van Dyke et al, 2005, page 115). 28
An earlier study (Purcell et al, 2005) based on a large representative sample of students who graduated in 1999 also found that students who worked during term-time had lower academic achievement after controlling for other factors. There have been studies based on individual institutions, for example the University of Swansea (Jones et al, 2005) and the University of Reading (Jewell, 2014) who have found the same effect for students working for long hours during term-time, again after controlling for other factors. 29
UUK, 2015b, fig 18.

22
‘cash in hand’ for those from low income households, may reduce the pressure to
work during term-time, but the effects of scrapping grants and the increase in loans,
coupled with uncertainty about the future loan terms, risks increasing term-time
working. Any change in the proportion of students who work long hours, say 15 or 20
hours a week, rather than the proportion who work at all during term-time, will be
more important in determining whether students are disadvantaged at university. As
yet we do not have any evidence as to whether the 2012 changes have led to an
increase in excessive term-time working.
What will the Summer Budget changes do?
The freezing of loan thresholds will significantly increase the average cost of higher
education. Students from low income backgrounds will see the big increases in costs
through the combined effect of scrapping grants and changing loan terms. Yet, large
as these increased costs are, it is not the increased repayments as such which
create the biggest risk, rather it is the uncertainty that has been created by the way it
is proposed the changes are to be made.
The student loan scheme is often described as being like income tax, in that the
amount paid can depend on the borrowers’ income rather than their total debts. In
other respects it is like an insurance policy. The decision to go to university is made
with the expectation that it will lead to a better, higher paid job. But there is no
certainty in this outcome - maybe she will drop out or fail her final examinations30,
with, evidence suggests, worse prospects than if she had got a job after A-levels31.
Even if she graduates, there is no guarantee of a good job; the average ‘graduate
premium’ hides a wide range of outcomes. But the student loan terms create a safety
net. If the worst comes to the worst, and she ends up earning below the repayment
threshold, her financial loss will be the loss of earnings whilst studying, and no more.
Knowing, as students thought they did, exactly what they were committing
themselves to, is what gave them confidence to take out student loans to cover the
costs of their preferred course.
We cannot say for certain what would happen if government went ahead with
removing any expectation that loan conditions would apply throughout the repayment
term, combined with the higher debts from the scrapping of grants. The policies have
30
Not all student loan borrowers are graduates. 14.6 cent of UK domiciled full-time entrants to degree courses at UK HEIs are projected not to graduate, and of these 10.7 percentage points are projected to gain no HE award (HESA, 2015). Non-completion rates for part-time study are much higher (HEFCE, 2009a). 31
Identifying non-completers within the Labour Force Survey is difficult, but it can be done (Walker et al, 2013), and response rates for this group in other surveys are always low, though they can provide some information (McCulloch, 2014). The evidence shows non-completers do, at best, fair no better than those who never entered higher education and it is more likely that they do worse. In future student data linked to HMRC data should provide a clearer picture.

23
been announced without any research findings to assess students’ possible
responses. The possible penalty of not going to university, along with the removal of
controls on student numbers, may mean that participation rates continue to rise, but
with some students electing to study part-time or intermittently so that they can work
and reduce debt, perhaps choosing their second or third best course if it has lower
fees or allows them to live at home.
There is a risk that less favourable and changeable loan terms would result in a
move towards something like higher education in the USA, where participation is
high, but where the conditions of study are more unequal, with most students taking
longer, with lower chance of success32. Failure to complete, reduced academic
achievement, delay in graduating or graduation from a less prestigious university,
and reduced time to take part in extra-curricular activities, may all impact social
mobility by adding to the difficulties students from disadvantaged backgrounds find in
accessing graduate jobs and the elite professions33.
What should be done?
There is a debate to be had about how much public funding should be spent on
higher education, and how that money should be spent. Here, however, it will be
taken as a given that government’s plans for a reduction in expenditure, compared to
what is expected with current arrangements, will be introduced, and that this will be
achieved by increasing the repayments that borrowers will have to pay. Given these
assumptions, how can this policy be implemented with the least damage to public
trust, and the least impact on social mobility? How can we ensure that young people
are not discouraged from entering higher education and that their decisions as to
what, where and how to study are not distorted by concerns about costs?
No retrospective changes
Until recently, nobody seriously thought that the ‘get out’ clause in the terms and
conditions would be evoked in any circumstances other than some unforeseen
32
In the USA even young students (starting aged 20 or younger) are most likely to study part-time, either exclusively (2.9 per cent) or a mixture of full and part-time (54.2 per cent). Taking the young mixed mode students, after six years 44.8 per cent had completed, 25.1 per cent were still studying, and 30.1 per cent had not completed and were not studying. Using age unspecific statistics for an earlier cohort the young mixed mode group can be estimated to have 53.1 per cent completed, 12.8 per cent still studying, and 34.0 per cent not completed nor studying after eight years. (Shapiro et al, 2014). 33
The cost of dropping out when entering the labour market has already been pointed out (footnote 30) and the value of a ‘good’ degree has been shown in numerous studies. The value of attending a selective institute is very difficult to separate from individual student attributes, but this has been done (Broecke, 2012). Purcell found that extra-curricular activities gave students an advantage, in particular students who were office holders or student representatives while in HE have more success in securing a graduate job. She also found that young students assumed to be living with their parents were particularly unsuccessful (Purcell et al, 2012).

24
national emergency. Past sales of the student loan book have included a guarantee
of the loan terms, so that, as things stand, we have the odd situation where
borrowers whose debt has been sold can be sure of how their future repayments will
be calculated, whereas those whose debts have not been sold cannot be sure of
anything - thresholds, interest rates, the write-off period, and so on. Protecting
existing students involves a one-off cost of £3.2 billion, with this cost spread over
three decades. It is difficult to put a financial cost on the loss of trust from making a
retrospective change, but it is likely to be long lasting and very difficult to reverse. No
changes to existing students’ loan terms should therefore be made.
Restoring trust
Even if no retrospective changes are made the act of proposing retrospective
changes has undermined confidence. To regain trust it is necessary to remove the
‘get out’ clause and legislate to guarantee the loan terms and conditions. Of course,
future governments could always pass a law reversing this, but such a commitment
would give students more confidence in taking out a student loan.
Terms for future students
£21,000 is higher, in real terms and relative to average earnings, than was intended
when the policy was announced in 2010. This problem was of government’s own
making. Had they announced the threshold as a percentage of average earnings, as
was and is the case for loans before 1998, the uncertainty created by estimating
inflation and future earnings would have been avoided. It seems likely that they
chose a nominal figure to make the terms seem better than they were34.
This history provides a justification for lowering the threshold to bring it in line with
what was intended, but it is that high threshold figure that reassured students to take
on very large ‘headline’ debts. If ensuring that students are not put off were a priority,
other ways could be found to increase and bring forward repayments. For example,
the minimum repayment could be increased from 9 per cent for incomes over the
upper threshold.
If the repayment threshold is to be lowered, how should that be done? Freezing the
threshold for five years would be to repeat the mistake made in 2010; this time by
trying to disguise the real reduction in the threshold resulting from the freeze, last
time by setting the threshold in nominal terms and flattering it by comparing with the
34
‘One of the most progressive features of these proposals is the fact that the repayment threshold, which is currently £15,000 will increase to £21,000’. Minister for Universities and Science, David Willetts, House of Commons, 3 November 2010.

25
nominal threshold six years earlier35. If retrospective changes are avoided, this would
mean that the effect of the freeze will depend on forecasts of inflation and real
earnings up to 2025. This is introducing an unnecessary level of uncertainty for both
government and prospective students. The proposals cover the risks for government
by proposing a review at the end of the freeze, which means that students would
have no idea as to how their repayments would be calculated with up to 25 years of
repaying to go.
The new borrowers should be given definite terms, which should apply for the whole
repayment period. To reduce the uncertainty the threshold levels, both for repayment
and maximum interest, could be set in terms of a percentage of average earnings.
The longer term uncertainties, mainly due to the difficulty in estimating borrowers’
earnings relative to average earnings over a long period, should be borne by
government. The sales pitch for student loans confidently predicts a large and
continuing ‘graduate premium’; if this is accurate then the risks to public finances are
not great. Students are less well placed as each individual student cannot be sure of
being amongst those successful graduates who go on to get a well paid job.
35
The UUK Panel (UUK, 2015a, page 68) favoured the freezing of the repayment and maximum interest thresholds. They argued that this option ‘retained the strongly progressive features of the current system’. This is somewhat curious given the same report pointed out that the absolute and relative increase in annual repayments from freezing the thresholds is largest for lower earners (page 56). They give no justification for the stealth rather than explicit approach to reducing the thresholds.

26
References
BIS (2011), ‘Student Loans – A guide to the terms and conditions 2012/13’, page 8.
Published with the Student Loans Company and studentfinanceengland.
http://webarchive.nationalarchives.gov.uk/20121015000000/http:/www.direct.gov.uk/prod_consum_dg/groups/dg_digi
talassets/@dg/@en/@educ/documents/digitalasset/dg_200469.pdf
BIS (2015a), ‘Simplified student loan repayment model’ Department of Business,
Innovation and Skills, June 2015. www.gov.uk/government/publications/simplified-student-loan-
repayment-model
BIS (2015b), ‘Freezing the student loan repayment threshold’, Department of
Business, Innovation and Skills, 22 July 2015. https://bisgovuk.citizenspace.com/he-
strategy/consultation-on-freezing-the-student-loan-repaymen
BIS (2015c), ‘Participation rates in higher education 2006 to 2014’, 2 September
2015.
www.gov.uk/government/statistics/participation-rates-in-higher-education-2006-to-2014
Broecke S, (2012), ‘University selectivity and earnings: Evidence from UK data on
applications and admissions to university’, Economics of Education Review, 31,
pages 96-107.
ComRes (2015), ‘The Sutton Trust – Apprenticeships and Higher Education: Survey
of 16-18 year olds’, pages 72 – 73, 20 July 2015
http://comres.co.uk/wp-content/uploads/2015/07/Sutton-Trust_HEI-and-Apprenticeships-Survey.pdf
Callender C (2008), ‘The impact of term‐time employment on higher education
students’ academic attainment and achievement’, Journal of Education Policy, 23:4,
pages 359-377
Callender C and Jackson J (2008), ‘ Does the fear of debt constrain choice of
university and subject of study?’, Studies in Higher Education, 33(4), pages 405 to
429
Chowdry H, Crawford C, Dearden L, Goodman A and Vignoles A (2013), ‘Widening
participation in higher education: analysis using linked administrative data’, Journal of
the Royal Statistical Society: Series A (Statistics in Society), 176 (2), pages 431–
457. http://onlinelibrary.wiley.com/doi/10.1111/j.1467-985X.2012.01043.x/abstract
Crawford C, ‘Socio-economic differences in university outcomes in the UK: drop-out,
degree completion and degree class’, IFS Working Paper W14/31.
www.ifs.org.uk/uploads/publications/wps/WP201431.pdf

27
HEFCE (2009a), ‘Part-time first degree study – Entry and completion’, HEFCE
Report 2009/18.
http://webarchive.nationalarchives.gov.uk/20100202100434/http://www.hefce.ac.uk/pubs/year/2009/200918/
HEFCE (2009b),’ Patterns in higher education: living at home’ HEFCE Report
2009/20. www.hefce.ac.uk/data/Year/2009/Patterns,in,higher,education,living,at,home,/Title,93195,en.html
HEFCE (2013), ‘Trends in young participation in higher education’, HEFCE Report
2013/28. www.hefce.ac.uk/media/hefce/content/pubs/2013/201328/HEFCE_2013_28.pdf
HEFCE (2014a), ‘Differences in degree outcomes’, HEFCE Report 2014/3
www.hefce.ac.uk/pubs/year/2014/201403/
HEFCE (2014b), ‘Pressure from all sides: Economic and policy influences on part-
time higher education’, HEFCE Report 2014/08d, April 2014.
http://www.hefce.ac.uk/pubs/year/2014/201408d/
HEFCE (2015a), ‘Young participation in higher education: A-levels and similar
qualifications’ HEFCE Report 2015/03. www.hefce.ac.uk/pubs/year/2015/201503/
HEFCE (2015b), ‘Higher education in England 2015 – Key facts’
www.hefce.ac.uk/analysis/HEENG/
HEFCE (2015c), ‘Differences in degree outcomes: The effect of subject and student
characteristics’, HEFCE Report 2015/20), September 2015.
HESA (2015), ‘Table SN6 - Sector projected learning outcomes: UK domiciled full-
time students starting first degree courses by academic year’ (2012/13),
www.hesa.ac.uk/pis/09/10/noncon
Hilton M (2015), ‘Politicians: please don’t screw it up’, Wonkhe 16 January 2015.
www.wonkhe.com/blogs/politicians-please-dont-screw-it-up/
HMT (2015), ‘Summer Budget 2015’, HM Treasury, July 2015
www.gov.uk/government/topical-events/budget-july-2015
IFS (2015), (Britton J, Crawford C and Dearden L), ‘Analysis of the higher education
funding reforms announced in Summer Budget 2015’, IFS Briefing Note BN174, July
2015. www.ifs.org.uk/publications/7904
Jewell S (2014), ‘The Impact of Working While Studying on Educational and Labour
Market Outcomes’ . Business and Economics Journal 5(3): 110.
www.omicsonline.com/open-access/business-and-economics-journal-2151-6219.1000110.php?aid=31717
Jones J and Sloane P (2005) ’Students and term-time employment, A report for the
Economic Research Unit, Welsh Assembly Government.’ University of Wales,
Swansea, UK. www.arsyllfadysgu.com/uploads/publications/773.pdf

28
McCulloch A (2014), ‘Learning from Futuretrack: Dropout from higher education’, BIS
Research Paper number 168.
www.hecsu.ac.uk/assets/assets/documents/Futuretrack_BIS_Learning_from_futuretrack_dropout.pdf
McGettigan A (2015a), ‘Cash Today’, London Review of Books 37(5) pages, 24 to
28, 5 March 2015. www.lrb.co.uk/v37/n05/andrew-mcgettigan/cash-today
McGettigan A (2015b), ‘The accounting and Budgeting of student loans’, HEPI
Report 75, 21 May 2015. H
www.hepi.ac.uk/2015/05/21/accounting-budgeting-student-loans/
McGettigan A (2015c), ‘IFS provide revised figures for HE financial changes’, Critical
Education, July 22 2015
http://andrewmcgettigan.org/2015/07/22/ifs-provide-revised-figures-for-he-financial-changes/
Mountford-Zimdars A, Sabri D, Moore J, Sanders J, Jones S, and Higham L (2015),
‘Causes of differences in student outcomes’ Report to HEFCE, July 2015.
www.hefce.ac.uk/pubs/rereports/Year/2015/diffout/Title,104725,en.html
OBR (2015), ‘Fiscal sustainability report’, June 2015
http://cdn.budgetresponsibility.independent.gov.uk/49753_OBR-Fiscal-Report-Web-Accessible.pdf
OECD (2013), ‘Trust in government’, in OECD, Government at a Glance 2013,
OECD Publishing, Paris. http://dx.doi.org/10.1787/gov_glance-2013-7-en
OFFA (2014), ‘Trends in young participation by student background and selectivity of
institution’, OFFA Report 2014/01
www.offa.org.uk/wp-content/uploads/2006/07/OFFA-2014.01.pdf
Purcell K, Elias P, Davies R, and Wilton N (2005), ‘The class of ’99 – A study of the
early labour market experiences of recent graduates’. DfES Research Report No.
691. www.hecsu.ac.uk/assets/assets/documents/Class_99_Full.pdf
Purcell K, Elias P and Wilton N, (2006), ‘Looking Through the glass ceiling: a detailed
investigation of the factors that contribute to gendered career inequalities’
www2.warwick.ac.uk/fac/soc/ier/research/completed/ltgc/esfreportfinal.pdf
Purcell K, Elias P, Atfield G, Behle H and Ellison R, (2012) ‘Futuretrack Stage 4:
transitions into employment, further study and other outcomes’, Manchester: Higher
Education Careers Services Unit.
www.hecsu.ac.uk/assets/assets/documents/Futuretrack_Stage_4_Final_report_6th_Nov_2012.pdf
Shapiro D, Dundar A, Yuan X, Harrel A and Wakhungu P K (2014), ‘Completing
College: A National View of Student Attainment Rates – Fall 2008 Cohort (Signature
Report No. 8)’. Herndon, VA: National Student Clearinghouse Research Center.
http://nscresearchcenter.org/wp-content/uploads/SignatureReport8.pdf

29
Thompson J and Bekhradnia B, (2010), ‘The government's proposals for higher
education funding and student finance – an analysis’, HEPI Report 50.
www.hepi.ac.uk/2010/11/11/the-governments-proposals-for-higher-education-funding-and-student-finance-an-
analysis/
Thompson J and Bekhradnia B, (2012), ‘The impact on demand of the Government's
reforms of higher education’, HEPI Report 59.
www.hepi.ac.uk/2012/11/08/the-impact-on-demand-of-the-governments-reforms-of-higher-education-2/
Thompson J and Bekhradnia B, (2013), ‘The impact on demand of the government's
reforms of higher education’, HEPI Report 62.
www.hepi.ac.uk/2013/10/03/the-impact-on-demand-of-the-governments-reforms-of-higher-education/
UCAS (2012), ‘How have applications for full-time undergraduate higher education in
the UK changed in 2012?’, July 2012.
www.ucas.com/sites/default/files/ucas_how_have_applications_changed_in_2012.pdf
UCAS (2013), ‘Highlights from applicant surveys conducted in 2012’
www.ucas.com/sites/default/files/applicant-survey-report-2012.pdf
UCAS (2014), ‘End of cycle report 2014’, December 2014. www.ucas.com/corporate/data-and-
analysis/analysis-reports
UUK(2015a), ‘Student Funding Panel: An analysis of the design, impact and options
for reform of the student fees and loans system in England’, Universities UK, June
2015 www.universitiesuk.ac.uk/highereducation/Pages/StudentFundingPanel.aspx
UUK(2015b), ‘Findings Student Funding Panel survey of students and student focus
groups’, Student Funding Panel report annexe.
www.universitiesuk.ac.uk/highereducation/Pages/StudentFundingPanel.aspx
Van Dyke R, Little B and Callender C (2005), ‘Survey of higher education students’
attitudes to debt and term-time working and their impact on attainment’, A report to
Universities UK and HEFCE by the Centre for Higher Education Research and
Information (CHERI) and London South Bank University’
www.universitiesuk.ac.uk/highereducation/Documents/2005/TermTimeWork.pdf
Walker I and Zhu Y, (2013), ‘The impact of university degrees on the lifecycle of
earnings: some further analysis’, BIS Research Paper number 112.
www.gov.uk/government/uploads/system/uploads/attachment_data/file/229498/bis-13-899-the-impact-of-university-
degrees-on-the-lifecycle-of-earnings-further-analysis.pdf
Willetts D (2015), ‘Sustainable university funding: David Willetts on the next steps’,
Times Higher Education, 18/06/15.
www.timeshighereducation.co.uk/features/sustainable-university-funding-david-willetts-next-steps